december unemployment and jobs report by county and metropolitan areas december 2014
TRANSCRIPT

8/13/2019 December Unemployment and Jobs report by County and Metropolitan areas December 2014
http://slidepdf.com/reader/full/december-unemployment-and-jobs-report-by-county-and-metropolitan-areas-december 1/14
This information may be accessed on the DES World Wide Web page, at http://www.ncesc.com
N e w s R e l e a s e
North Carolina Department of Commerce - Labor and Economic Analysis Division
For More Information, Contact: For Immediate Release
Larry Parker/919.707.1010 February 5, 2014
North Carolina’s December County and
Area Employment Figures Released
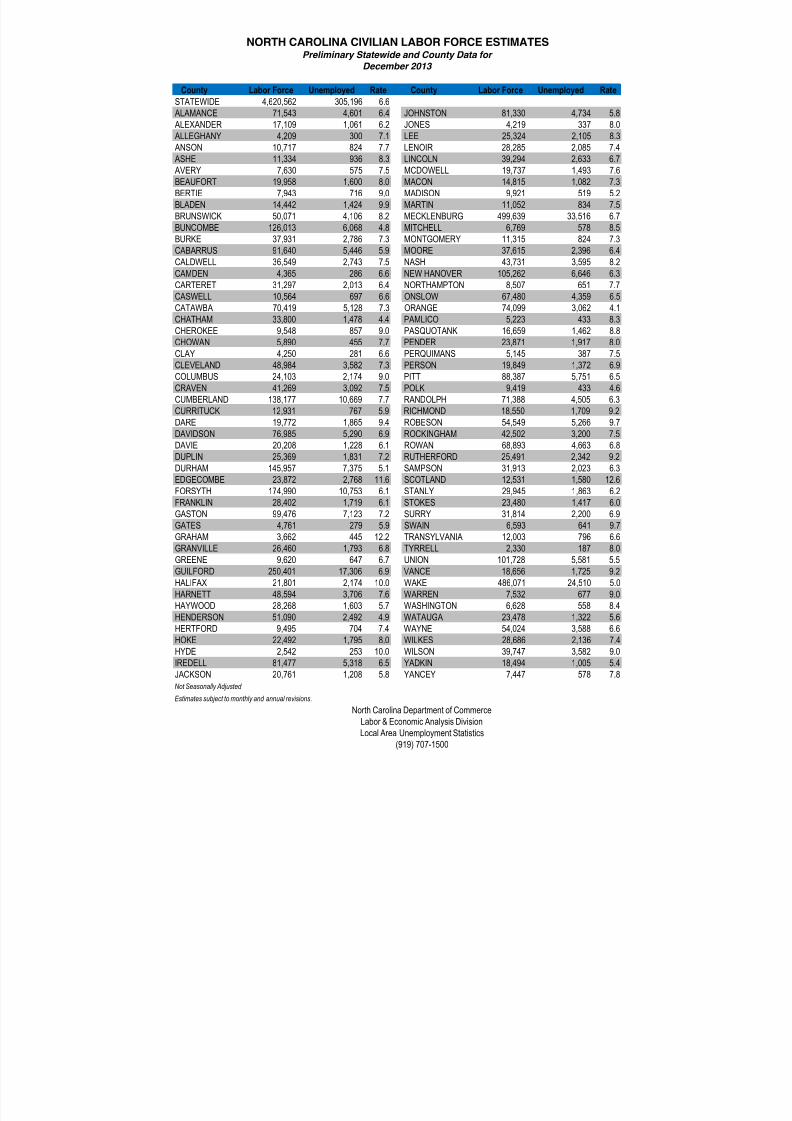
RALEIGH — Unemployment rates (not seasonally adjusted) decreased in 86 of North Carolina’s counties in De-
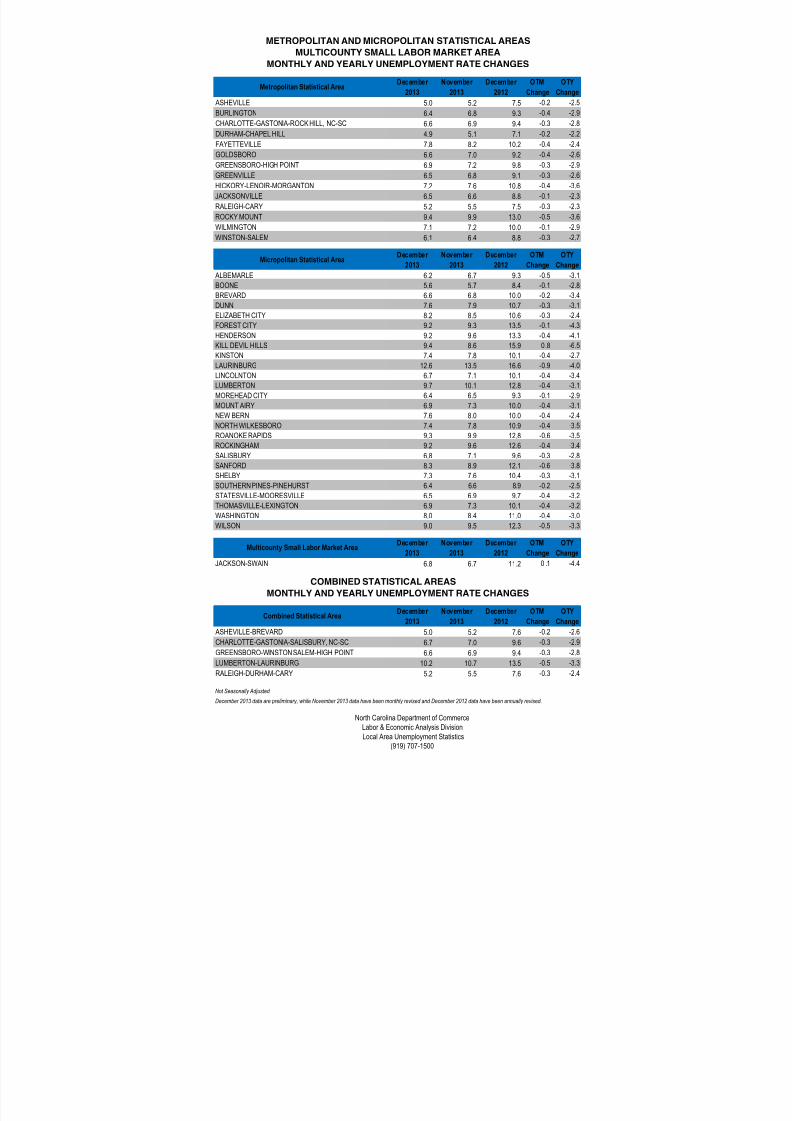
cember, increased in 11 and remained the same in three. All 14 of the State’s metro areas experienced rate decreases
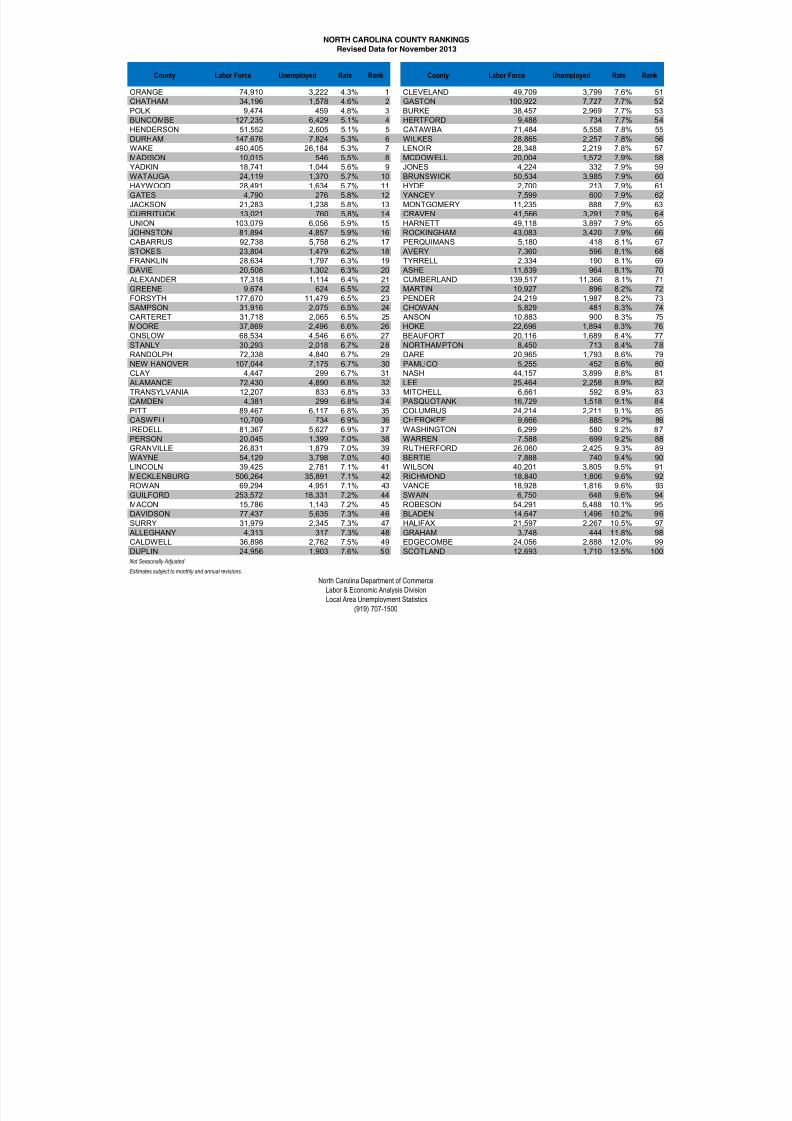
Scotland County had the highest unemployment rate at 12.6 percent while Orange County had the lowest at 4.1
percent. Among the Metro areas, Rocky Mount at 9.4 percent experienced the highest rate and Durham-Chape
Hill at 4.9 percent had the lowest. The December not seasonally adjusted statewide rate was 6.6 percent.
When compared to the same month last year, not seasonally adjusted unemployment rates decreased in all 100
counties. All 14 metro areas experienced rate decreases over the year.
The number of workers employed statewide (not seasonally adjusted) decreased in December by 32,140 to 4,315,366
while those unemployed decreased 17,561 to 305,196. Since December 2012, the number of workers employed
statewide increased 29,050, while those unemployed decreased 140,214.
It is important to note that employment estimates are subject to large seasonal patterns; therefore, it is advisable
to focus on over-the-year changes in the not seasonally adjusted estimates.
The next unemployment update is scheduled for Monday, March 17, 2014 when the state unemployment rate for
January 2014 will be released.
— More —
December 6 89 5
November (Revised) 3 91 6
Counties With Rates
5% Or Below
Counties With Rates
Between 5% & 10%
Counties With Rates
10% Or Above
8/13/2019 December Unemployment and Jobs report by County and Metropolitan areas December 2014
http://slidepdf.com/reader/full/december-unemployment-and-jobs-report-by-county-and-metropolitan-areas-december 2/14
County Labor Force Unemployed Rate County Labor Force Unemployed Rate
STATEWIDE 4,620,562 305,196 6.6
ALAMANCE 71,543 4,601 6.4 JOHNSTON 81,330 4,734 5.8
ALEXANDER 17,109 1,061 6.2 JONES 4,219 337 8.0
ALLEGHANY 4,209 300 7.1 LEE 25,324 2,105 8.3
ANSON 10,717 824 7.7 LENOIR 28,285 2,085 7.4 ASHE 11,334 936 8.3 LINCOLN 39,294 2,633 6.7
AVERY 7,630 575 7.5 MCDOWELL 19,737 1,493 7.6
BEAUFORT 19,958 1,600 8.0 MACON 14,815 1,082 7.3
BERTIE 7,943 716 9.0 MADISON 9,921 519 5.2
BLADEN 14,442 1,424 9.9 MARTIN 11,052 834 7.5
BRUNSWICK 50,071 4,106 8.2 MECKLENBURG 499,639 33,516 6.7
BUNCOMBE 126,013 6,068 4.8 MITCHELL 6,769 578 8.5
BURKE 37,931 2,786 7.3 MONTGOMERY 11,315 824 7.3
CABARRUS 91,640 5,446 5.9 MOORE 37,615 2,396 6.4
CALDWELL 36,549 2,743 7.5 NASH 43,731 3,595 8.2
CAMDEN 4,365 286 6.6 NEW HANOVER 105,262 6,646 6.3
CARTERET 31,297 2,013 6.4 NORTHAMPTON 8,507 651 7.7
CASWELL 10,564 697 6.6 ONSLOW 67,480 4,359 6.5
CATAWBA 70,419 5,128 7.3 ORANGE 74,099 3,062 4.1
CHATHAM 33,800 1,478 4.4 PAMLICO 5,223 433 8.3
CHEROKEE 9,548 857 9.0 PASQUOTANK 16,659 1,462 8.8
CHOWAN 5,890 455 7.7 PENDER 23,871 1,917 8.0
CLAY 4,250 281 6.6 PERQUIMANS 5,145 387 7.5
CLEVELAND 48,984 3,582 7.3 PERSON 19,849 1,372 6.9
COLUMBUS 24,103 2,174 9.0 PITT 88,387 5,751 6.5
CRAVEN 41,269 3,092 7.5 POLK 9,419 433 4.6
CUMBERLAND 138,177 10,669 7.7 RANDOLPH 71,388 4,505 6.3
CURRITUCK 12,931 767 5.9 RICHMOND 18,550 1,709 9.2
DARE 19,772 1,865 9.4 ROBESON 54,549 5,266 9.7
DAVIDSON 76,985 5,290 6.9 ROCKINGHAM 42,502 3,200 7.5
DAVIE 20,208 1,228 6.1 ROWAN 68,893 4,663 6.8
DUPLIN 25,369 1,831 7.2 RUTHERFORD 25,491 2,342 9.2DURHAM 145,957 7,375 5.1 SAMPSON 31,913 2,023 6.3
EDGECOMBE 23,872 2,768 11.6 SCOTLAND 12,531 1,580 12.6
FORSYTH 174,990 10,753 6.1 STANLY 29,945 1,863 6.2
FRANKLIN 28,402 1,719 6.1 STOKES 23,480 1,417 6.0
GASTON 99,476 7,123 7.2 SURRY 31,814 2,200 6.9
GATES 4,761 279 5.9 SWAIN 6,593 641 9.7
GRAHAM 3,662 445 12.2 TRANSYLVANIA 12,003 796 6.6
GRANVILLE 26,460 1,793 6.8 TYRRELL 2,330 187 8.0
GREENE 9,620 647 6.7 UNION 101,728 5,581 5.5
GUILFORD 250,401 17,306 6.9 VANCE 18,656 1,725 9.2
HALIFAX 21,801 2,174 10.0 WAKE 486,071 24,510 5.0
HARNETT 48,594 3,706 7.6 WARREN 7,532 677 9.0
HAYWOOD 28,268 1,603 5.7 WASHINGTON 6,628 558 8.4HENDERSON 51,090 2,492 4.9 WATAUGA 23,478 1,322 5.6
HERTFORD 9,495 704 7.4 WAYNE 54,024 3,588 6.6
HOKE 22,492 1,795 8.0 WILKES 28,686 2,136 7.4
HYDE 2,542 253 10.0 WILSON 39,747 3,582 9.0
IREDELL 81,477 5,318 6.5 YADKIN 18,494 1,005 5.4
JACKSON 20,761 1,208 5.8 YANCEY 7,447 578 7.8
Not Seasonally Adjusted
Estimates subject to monthly and annual revisions.
Labor & Economic Analysis Division
Local Area Unemployment Statistics
(919) 707-1500
NORTH CAROLINA CIVILIAN LABOR FORCE ESTIMATES
Preliminary Statewide and County Data for
December 2013
North Carolina Department of Commerce

8/13/2019 December Unemployment and Jobs report by County and Metropolitan areas December 2014
http://slidepdf.com/reader/full/december-unemployment-and-jobs-report-by-county-and-metropolitan-areas-december 3/14
December November December OTM OTY December November December OTM OTY
2013 2013 2012 Change Change 2013 2013 2012 Change Change
STATEWIDE 6.6 6.9 9.4 -0.3 -2.8
ALAMANCE 6.4 6.8 9.3 -0.4 -2.9 JOHNSTON 5.8 5.9 8.3 -0.1 -2.5
ALEXANDER 6.2 6.4 9.8 -0.2 -3.6 JONES 8.0 7.9 9.1 0.1 -1.1
ALLEGHANY 7.1 7.3 10.7 -0.2 -3.6 LEE 8.3 8.9 12.1 -0.6 -3.8
ANSON 7.7 8.3 11.9 -0.6 -4.2 LENOIR 7.4 7.8 10.1 -0.4 -2.7
ASHE 8.3 8.1 11.7 0.2 -3.4 LINCOLN 6.7 7.1 10.1 -0.4 -3.4 AVERY 7.5 8.1 12.2 -0.6 -4.7 MCDOWELL 7.6 7.9 11.0 -0.3 -3.4
BEAUFORT 8.0 8.4 11.0 -0.4 -3.0 MACON 7.3 7.2 11.0 0.1 -3.7
BERTIE 9.0 9.4 12.3 -0.4 -3.3 MADISON 5.2 5.5 8.5 -0.3 -3.3
BLADEN 9.9 10.2 12.6 -0.3 -2.7 MARTIN 7.5 8.2 11.2 -0.7 -3.7
BRUNSWICK 8.2 7.9 11.0 0.3 -2.8 MECKLENBURG 6.7 7.1 9.2 -0.4 -2.5
BUNCOMBE 4.8 5.1 7.2 -0.3 -2.4 MITCHELL 8.5 8.9 13.4 -0.4 -4.9
BURKE 7.3 7.7 11.0 -0.4 -3.7 MONTGOMERY 7.3 7.9 10.5 -0.6 -3.2
CABARRUS 5.9 6.2 8.6 -0.3 -2.7 MOORE 6.4 6.6 8.9 -0.2 -2.5
CALDWELL 7.5 7.5 11.0 0.0 -3.5 NASH 8.2 8.8 11.5 -0.6 -3.3
CAMDEN 6.6 6.8 8.5 -0.2 -1.9 NEW HANOVER 6.3 6.7 9.4 -0.4 -3.1
CARTERET 6.4 6.5 9.3 -0.1 -2.9 NORTHAMPTON 7.7 8.4 10.7 -0.7 -3.0
CASWELL 6.6 6.9 9.6 -0.3 -3.0 ONSLOW 6.5 6.6 8.8 -0.1 -2.3
CATAWBA 7.3 7.8 10.8 -0.5 -3.5 ORANGE 4.1 4.3 5.9 -0.2 -1.8
CHATHAM 4.4 4.6 7.3 -0.2 -2.9 PAMLICO 8.3 8.6 10.4 -0.3 -2.1
CHEROKEE 9.0 9.2 12.7 -0.2 -3.7 PASQUOTANK 8.8 9.1 11.3 -0.3 -2.5
CHOWAN 7.7 8.3 10.4 -0.6 -2.7 PENDER 8.0 8.2 10.6 -0.2 -2.6
CLAY 6.6 6.7 9.5 -0.1 -2.9 PERQUIMANS 7.5 8.1 9.9 -0.6 -2.4
CLEVELAND 7.3 7.6 10.4 -0.3 -3.1 PERSON 6.9 7.0 9.2 -0.1 -2.3
COLUMBUS 9.0 9.1 12.6 -0.1 -3.6 PITT 6.5 6.8 9.0 -0.3 -2.5
CRAVEN 7.5 7.9 10.0 -0.4 -2.5 POLK 4.6 4.8 7.7 -0.2 -3.1
CUMBERLAND 7.7 8.1 10.4 -0.4 -2.7 RANDOLPH 6.3 6.7 9.6 -0.4 -3.3
CURRITUCK 5.9 5.8 9.7 0.1 -3.8 RICHMOND 9.2 9.6 12.6 -0.4 -3.4
DARE 9.4 8.6 15.9 0.8 -6.5 ROBESON 9.7 10.1 12.8 -0.4 -3.1
DAVIDSON 6.9 7.3 10.1 -0.4 -3.2 ROCKINGHAM 7.5 7.9 10.8 -0.4 -3.3
DAVIE 6.1 6.3 8.3 -0.2 -2.2 ROWAN 6.8 7.1 9.6 -0.3 -2.8
DUPLIN 7.2 7.6 10.0 -0.4 -2.8 RUTHERFORD 9.2 9.3 13.5 -0.1 -4.3
DURHAM 5.1 5.3 7.4 -0.2 -2.3 SAMPSON 6.3 6.5 8.8 -0.2 -2.5EDGECOMBE 11.6 12.0 15.5 -0.4 -3.9 SCOTLAND 12.6 13.5 16.6 -0.9 -4.0
FORSYTH 6.1 6.5 8.8 -0.4 -2.7 STANLY 6.2 6.7 9.3 -0.5 -3.1
FRANKLIN 6.1 6.3 8.9 -0.2 -2.8 STOKES 6.0 6.2 8.4 -0.2 -2.4
GASTON 7.2 7.7 10.4 -0.5 -3.2 SURRY 6.9 7.3 10.0 -0.4 -3.1
GATES 5.9 5.8 7.7 0.1 -1.8 SWAIN 9.7 9.6 16.4 0.1 -6.7
GRAHAM 12.2 11.8 18.5 0.4 -6.3 TRANSYLVANIA 6.6 6.8 10.0 -0.2 -3.4
GRANVILLE 6.8 7.0 9.6 -0.2 -2.8 TYRRELL 8.0 8.1 11.9 -0.1 -3.9
GREENE 6.7 6.5 9.2 0.2 -2.5 UNION 5.5 5.9 8.0 -0.4 -2.5
GUILFORD 6.9 7.2 9.6 -0.3 -2.7 VANCE 9.2 9.6 13.3 -0.4 -4.1
HALIFAX 10.0 10.5 13.6 -0.5 -3.6 WAKE 5.0 5.3 7.3 -0.3 -2.3
HARNETT 7.6 7.9 10.7 -0.3 -3.1 WARREN 9.0 9.2 12.1 -0.2 -3.1
HAYWOOD 5.7 5.7 9.2 0.0 -3.5 WASHINGTON 8.4 9.2 12.5 -0.8 -4.1
HENDERSON 4.9 5.1 7.1 -0.2 -2.2 WATAUGA 5.6 5.7 8.4 -0.1 -2.8
HERTFORD 7.4 7.7 10.4 -0.3 -3.0 WAYNE 6.6 7.0 9.2 -0.4 -2.6
HOKE 8.0 8.3 8.9 -0.3 -0.9 WILKES 7.4 7.8 10.9 -0.4 -3.5
HYDE 10.0 7.9 15.4 2.1 -5.4 WILSON 9.0 9.5 12.3 -0.5 -3.3
IREDELL 6.5 6.9 9.7 -0.4 -3.2 YADKIN 5.4 5.6 8.9 -0.2 -3.5
JACKSON 5.8 5.8 9.5 0.0 -3.7 YANCEY 7.8 7.9 12.2 -0.1 -4.4
Not Seasonally Adjusted
December 2013 data are preliminary, while November 2013 data have been monthly revised and December 2012 data have been annually revised.
Labor & Economic Analysis Division
Local Area Unemployment Statistics
(919) 707-1500
NORTH CAROLINA COUNTY MONTHLY AND YEARLY UNEMPLOYMENT RATE CHANGES
County County
North Carolina Department of Commerce
8/13/2019 December Unemployment and Jobs report by County and Metropolitan areas December 2014
http://slidepdf.com/reader/full/december-unemployment-and-jobs-report-by-county-and-metropolitan-areas-december 4/14
December November December OTM OTY
2013 2013 2012 Change Change
ASHEVILLE 5.0 5.2 7.5 -0.2 -2.5
BURLINGTON 6.4 6.8 9.3 -0.4 -2.9
CHARLOTTE-GASTONIA-ROCK HILL, NC-SC 6.6 6.9 9.4 -0.3 -2.8
DURHAM-CHAPEL HILL 4.9 5.1 7.1 -0.2 -2.2
FAYETTEVILLE 7.8 8.2 10.2 -0.4 -2.4
GOLDSBORO 6.6 7.0 9.2 -0.4 -2.6
GREENSBORO-HIGH POINT 6.9 7.2 9.8 -0.3 -2.9
GREENVILLE 6.5 6.8 9.1 -0.3 -2.6
HICKORY-LENOIR-MORGANTON 7.2 7.6 10.8 -0.4 -3.6
JACKSONVILLE 6.5 6.6 8.8 -0.1 -2.3
RALEIGH-CARY 5.2 5.5 7.5 -0.3 -2.3
ROCKY MOUNT 9.4 9.9 13.0 -0.5 -3.6
WILMINGTON 7.1 7.2 10.0 -0.1 -2.9
WINSTON-SALEM 6.1 6.4 8.8 -0.3 -2.7
December November December OTM OTY
2013 2013 2012 Change Change
ALBEMARLE 6.2 6.7 9.3 -0.5 -3.1
BOONE 5.6 5.7 8.4 -0.1 -2.8
BREVARD 6.6 6.8 10.0 -0.2 -3.4
DUNN 7.6 7.9 10.7 -0.3 -3.1
ELIZABETH CITY 8.2 8.5 10.6 -0.3 -2.4
FOREST CITY 9.2 9.3 13.5 -0.1 -4.3
HENDERSON 9.2 9.6 13.3 -0.4 -4.1
KILL DEVIL HILLS 9.4 8.6 15.9 0.8 -6.5
KINSTON 7.4 7.8 10.1 -0.4 -2.7
LAURINBURG 12.6 13.5 16.6 -0.9 -4.0
LINCOLNTON 6.7 7.1 10.1 -0.4 -3.4
LUMBERTON 9.7 10.1 12.8 -0.4 -3.1
MOREHEAD CITY 6.4 6.5 9.3 -0.1 -2.9
MOUNT AIRY 6.9 7.3 10.0 -0.4 -3.1
NEW BERN 7.6 8.0 10.0 -0.4 -2.4
NORTH WILKESBORO 7.4 7.8 10.9 -0.4 -3.5
ROANOKE RAPIDS 9.3 9.9 12.8 -0.6 -3.5
ROCKINGHAM 9.2 9.6 12.6 -0.4 -3.4
SALISBURY 6.8 7.1 9.6 -0.3 -2.8SANFORD 8.3 8.9 12.1 -0.6 -3.8
SHELBY 7.3 7.6 10.4 -0.3 -3.1
SOUTHERN PINES-PINEHURST 6.4 6.6 8.9 -0.2 -2.5
STATESVILLE-MOORESVILLE 6.5 6.9 9.7 -0.4 -3.2
THOMASVILLE-LEXINGTON 6.9 7.3 10.1 -0.4 -3.2
WASHINGTON 8.0 8.4 11.0 -0.4 -3.0
WILSON 9.0 9.5 12.3 -0.5 -3.3
December November December OTM OTY
2013 2013 2012 Change Change
JACKSON-SWAIN 6.8 6.7 11.2 0 .1 -4.4
COMBINED STATISTICAL AREAS
December November December OTM OTY
2013 2013 2012 Change Change
ASHEVILLE-BREVARD 5.0 5.2 7.6 -0.2 -2.6
CHARLOTTE-GASTONIA-SALISBURY, NC-SC 6.7 7.0 9.6 -0.3 -2.9
GREENSBORO-WINSTON SALEM-HIGH POINT 6.6 6.9 9.4 -0.3 -2.8
LUMBERTON-LAURINBURG 10.2 10.7 13.5 -0.5 -3.3
RALEIGH-DURHAM-CARY 5.2 5.5 7.6 -0.3 -2.4
Not Seasonally Adjusted
December 2013 data are preliminary, while November 2013 data have been monthly revised and December 2012 data have been annually revised.
North Carolina Department of Commerce
Labor & Economic Analysis Division
Local Area Unemployment Statistics
(919) 707-1500
MULTICOUNTY SMALL LABOR MARKET AREA
METROPOLITAN AND MICROPOLITAN STATISTICAL AREAS
MONTHLY AND YEARLY UNEMPLOYMENT RATE CHANGES
Combined Statistical Area
MONTHLY AND YEARLY UNEMPLOYMENT RATE CHANGES
Metropolitan Statistical Area
Micropolitan Statistical Area
Multicounty Small Labor Market Area

8/13/2019 December Unemployment and Jobs report by County and Metropolitan areas December 2014
http://slidepdf.com/reader/full/december-unemployment-and-jobs-report-by-county-and-metropolitan-areas-december 5/14
County Labor Force Unemployed Rate Rank County Labor Force Unemployed Rate Rank
ORANGE 74,099 3,062 4.1% 1 MONTGOMERY 11,315 824 7.3% 51
CHATHAM 33,800 1,478 4.4% 2 MACON 14,815 1,082 7.3% 52
POLK 9,419 433 4.6% 3 CLEVELAND 48,984 3,582 7.3% 53
BUNCOMBE 126,013 6,068 4.8% 4 BURKE 37,931 2,786 7.3% 54
HENDERSON 51,090 2,492 4.9% 5 LENOIR 28,285 2,085 7.4% 55
WAKE 486,071 24,510 5.0% 6 HERTFORD 9,495 704 7.4% 56
DURHAM 145,957 7,375 5.1% 7 WILKES 28,686 2,136 7.4% 57MADISON 9,921 519 5.2% 8 CRAVEN 41,269 3,092 7.5% 58
YADKIN 18,494 1,005 5.4% 9 CALDWELL 36,549 2,743 7.5% 59
UNION 101,728 5,581 5.5% 10 PERQUIMANS 5,145 387 7.5% 60
WATAUGA 23,478 1,322 5.6% 11 ROCKINGHAM 42,502 3,200 7.5% 61
HAYWOOD 28,268 1,603 5.7% 12 AVERY 7,630 575 7.5% 62
JACKSON 20,761 1,208 5.8% 13 MARTIN 11,052 834 7.5% 63
JOHNSTON 81,330 4,734 5.8% 14 MCDOWELL 19,737 1,493 7.6% 64
GATES 4,761 279 5.9% 15 HARNETT 48,594 3,706 7.6% 65
CURRITUCK 12,931 767 5.9% 16 NORTHAMPTON 8,507 651 7.7% 66
CABARRUS 91,640 5,446 5.9% 17 ANSON 10,717 824 7.7% 67
STOKES 23,480 1,417 6.0% 18 CUMBERLAND 138,177 10,669 7.7% 68
FRANKLIN 28,402 1,719 6.1% 19 CHOWAN 5,890 455 7.7% 69
DAVIE 20,208 1,228 6.1% 20 YANCEY 7,447 578 7.8% 70
FORSYTH 174,990 10,753 6.1% 21 HOKE 22,492 1,795 8.0% 71
ALEXANDER 17,109 1,061 6.2% 22 JONES 4,219 337 8.0% 72
STANLY 29,945 1,863 6.2% 23 BEAUFORT 19,958 1,600 8.0% 73RANDOLPH 71,388 4,505 6.3% 24 TYRRELL 2,330 187 8.0% 74
NEW HANOVER 105,262 6,646 6.3% 25 PENDER 23,871 1,917 8.0% 75
SAMPSON 31,913 2,023 6.3% 26 BRUNSWICK 50,071 4,106 8.2% 76
MOORE 37,615 2,396 6.4% 27 NASH 43,731 3,595 8.2% 77
ALAMANCE 71,543 4,601 6.4% 28 ASHE 11,334 936 8.3% 78
CARTERET 31,297 2,013 6.4% 29 PAMLICO 5,223 433 8.3% 79
ONSLOW 67,480 4,359 6.5% 30 LEE 25,324 2,105 8.3% 80
PITT 88,387 5,751 6.5% 31 WASHINGTON 6,628 558 8.4% 81
IREDELL 81,477 5,318 6.5% 32 MITCHELL 6,769 578 8.5% 82
CAMDEN 4,365 286 6.6% 33 PASQUOTANK 16,659 1,462 8.8% 83
CASWELL 10,564 697 6.6% 34 CHEROKEE 9,548 857 9.0% 84
CLAY 4,250 281 6.6% 35 WARREN 7,532 677 9.0% 85
TRANSYLVANIA 12,003 796 6.6% 36 WILSON 39,747 3,582 9.0% 86
WAYNE 54,024 3,588 6.6% 37 BERTIE 7,943 716 9.0% 87
LINCOLN 39,294 2,633 6.7% 38 COLUMBUS 24,103 2,174 9.0% 88
MECKLENBURG 499,639 33,516 6.7% 39 RUTHERFORD 25,491 2,342 9.2% 89GREENE 9,620 647 6.7% 40 RICHMOND 18,550 1,709 9.2% 90
ROWAN 68,893 4,663 6.8% 41 VANCE 18,656 1,725 9.2% 91
GRANVILLE 26,460 1,793 6.8% 42 DARE 19,772 1,865 9.4% 92
DAVIDSON 76,985 5,290 6.9% 43 ROBESON 54,549 5,266 9.7% 93
GUILFORD 250,401 17,306 6.9% 44 SWAIN 6,593 641 9.7% 94
PERSON 19,849 1,372 6.9% 45 BLADEN 14,442 1,424 9.9% 95
SURRY 31,814 2,200 6.9% 46 HYDE 2,542 253 10.0% 96
ALLEGHANY 4,209 300 7.1% 47 HALIFAX 21,801 2,174 10.0% 97
GASTON 99,476 7,123 7.2% 48 EDGECOMBE 23,872 2,768 11.6% 98
DUPLIN 25,369 1,831 7.2% 49 GRAHAM 3,662 445 12.2% 99
CATAWBA 70,419 5,128 7.3% 50 SCOTLAND 12,531 1,580 12.6% 100
Not Seasonally Adjusted
Estimates subject to monthly and annual revisions.
North Carolina Department of Commerce
Labor & Economic Analysis Division
Local Area Unemployment Statistics(919) 707-1500
Preliminary Data for December 2013
NORTH CAROLINA COUNTY RANKINGS
8/13/2019 December Unemployment and Jobs report by County and Metropolitan areas December 2014
http://slidepdf.com/reader/full/december-unemployment-and-jobs-report-by-county-and-metropolitan-areas-december 6/14
County Labor Force Unemployed Rate Rank County Labor Force Unemployed Rate Rank
ORANGE 74,910 3,222 4.3% 1 CLEVELAND 49,709 3,799 7.6% 51
CHATHAM 34,196 1,578 4.6% 2 GASTON 100,922 7,727 7.7% 52
POLK 9,474 459 4.8% 3 BURKE 38,457 2,969 7.7% 53
BUNCOMBE 127,235 6,429 5.1% 4 HERTFORD 9,488 734 7.7% 54
HENDERSON 51,552 2,605 5.1% 5 CATAWBA 71,484 5,558 7.8% 55
DURHAM 147,676 7,824 5.3% 6 WILKES 28,865 2,257 7.8% 56
WAKE 490,405 26,184 5.3% 7 LENOIR 28,348 2,219 7.8% 57MADISON 10,015 546 5.5% 8 MCDOWELL 20,004 1,572 7.9% 58
YADKIN 18,741 1,044 5.6% 9 JONES 4,224 332 7.9% 59
WATAUGA 24,119 1,370 5.7% 10 BRUNSWICK 50,534 3,985 7.9% 60
HAYWOOD 28,491 1,634 5.7% 11 HYDE 2,700 213 7.9% 61
GATES 4,790 276 5.8% 12 YANCEY 7,599 600 7.9% 62
JACKSON 21,283 1,238 5.8% 13 MONTGOMERY 11,235 888 7.9% 63
CURRITUCK 13,021 760 5.8% 14 CRAVEN 41,566 3,291 7.9% 64
UNION 103,079 6,056 5.9% 15 HARNETT 49,118 3,897 7.9% 65
JOHNSTON 81,894 4,857 5.9% 16 ROCKINGHAM 43,083 3,420 7.9% 66
CABARRUS 92,738 5,758 6.2% 17 PERQUIMANS 5,180 418 8.1% 67
STOKES 23,804 1,479 6.2% 18 AVERY 7,360 596 8.1% 68
FRANKLIN 28,634 1,797 6.3% 19 TYRRELL 2,334 190 8.1% 69
DAVIE 20,508 1,302 6.3% 20 ASHE 11,839 964 8.1% 70
ALEXANDER 17,318 1,114 6.4% 21 CUMBERLAND 139,517 11,366 8.1% 71
GREENE 9,674 624 6.5% 22 MARTIN 10,927 896 8.2% 72
FORSYTH 177,670 11,479 6.5% 23 PENDER 24,219 1,987 8.2% 73
SAMPSON 31,916 2,075 6.5% 24 CHOWAN 5,829 481 8.3% 74
CARTERET 31,718 2,065 6.5% 25 ANSON 10,883 900 8.3% 75
MOORE 37,869 2,496 6.6% 26 HOKE 22,696 1,894 8.3% 76
ONSLOW 68,534 4,546 6.6% 27 BEAUFORT 20,116 1,689 8.4% 77
STANLY 30,293 2,018 6.7% 28 NORTHAMPTON 8,450 713 8.4% 78
RANDOLPH 72,338 4,840 6.7% 29 DARE 20,965 1,793 8.6% 79
NEW HANOVER 107,044 7,175 6.7% 30 PAMLICO 5,255 452 8.6% 80
CLAY 4,447 299 6.7% 31 NASH 44,157 3,899 8.8% 81
ALAMANCE 72,430 4,890 6.8% 32 LEE 25,464 2,258 8.9% 82
TRANSYLVANIA 12,207 833 6.8% 33 MITCHELL 6,661 592 8.9% 83
CAMDEN 4,381 299 6.8% 34 PASQUOTANK 16,729 1,518 9.1% 84
PITT 89,467 6,117 6.8% 35 COLUMBUS 24,214 2,211 9.1% 85
CASWELL 10,709 734 6.9% 36 CHEROKEE 9,666 885 9.2% 86
IREDELL 81,367 5,627 6.9% 37 WASHINGTON 6,299 580 9.2% 87
PERSON 20,045 1,399 7.0% 38 WARREN 7,588 699 9.2% 88
GRANVILLE 26,831 1,879 7.0% 39 RUTHERFORD 26,060 2,425 9.3% 89
WAYNE 54,129 3,798 7.0% 40 BERTIE 7,888 740 9.4% 90
LINCOLN 39,425 2,781 7.1% 41 WILSON 40,201 3,805 9.5% 91
MECKLENBURG 506,264 35,891 7.1% 42 RICHMOND 18,840 1,806 9.6% 92
ROWAN 69,294 4,951 7.1% 43 VANCE 18,928 1,816 9.6% 93
GUILFORD 253,572 18,331 7.2% 44 SWAIN 6,750 648 9.6% 94
MACON 15,786 1,143 7.2% 45 ROBESON 54,291 5,488 10.1% 95
DAVIDSON 77,437 5,635 7.3% 46 BLADEN 14,647 1,496 10.2% 96
SURRY 31,979 2,345 7.3% 47 HALIFAX 21,597 2,267 10.5% 97
ALLEGHANY 4,313 317 7.3% 48 GRAHAM 3,748 444 11.8% 98
CALDWELL 36,898 2,762 7.5% 49 EDGECOMBE 24,056 2,888 12.0% 99
DUPLIN 24,956 1,903 7.6% 50 SCOTLAND 12,693 1,710 13.5% 100
Not Seasonally Adjusted
Estimates subject to monthly and annual revisions.
North Carolina Department of Commerce
Labor & Economic Analysis Division
Local Area Unemployment Statistics
(919) 707-1500
Revised Data for November 2013
NORTH CAROLINA COUNTY RANKINGS
8/13/2019 December Unemployment and Jobs report by County and Metropolitan areas December 2014
http://slidepdf.com/reader/full/december-unemployment-and-jobs-report-by-county-and-metropolitan-areas-december 7/14L a b o r & E c o n o m i c A n a l y s i s D i v i s i o n | N o r t h C a r o l i n a D e p a r t m e n t o f C o m m e r c e | 1 o f 6
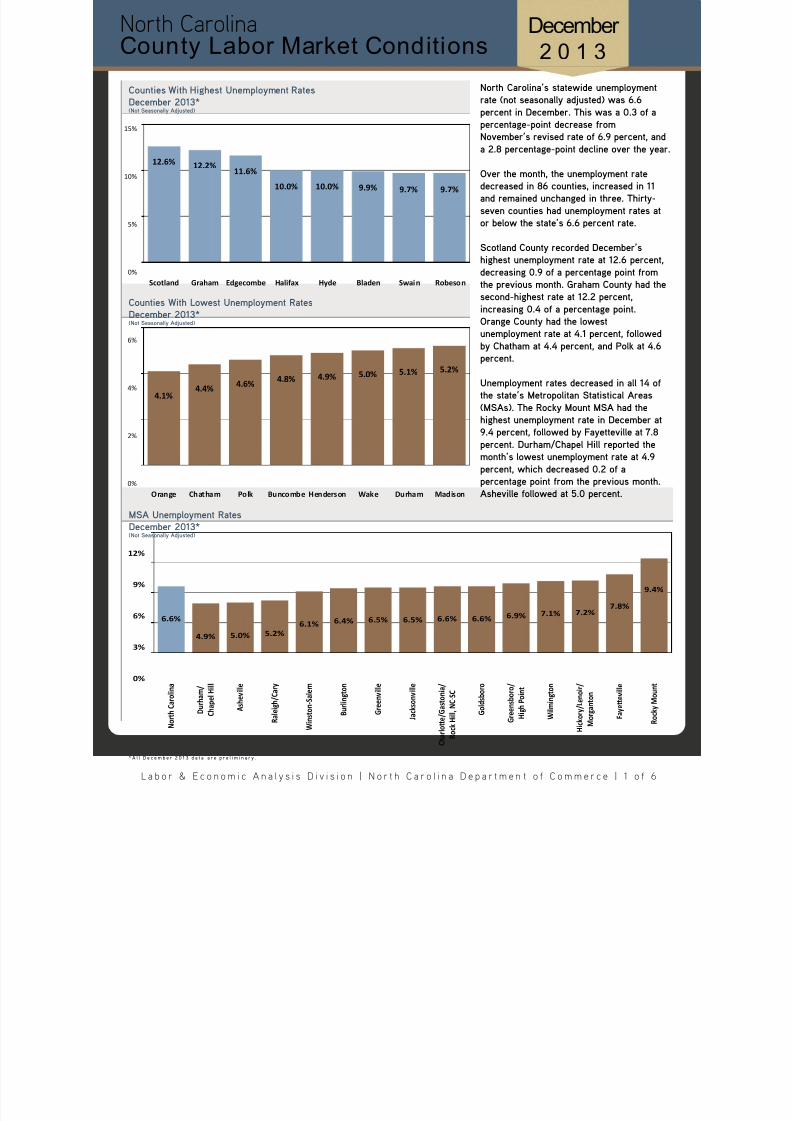
North Carolina’s statewide unemploymentrate (not seasonally adjusted) was 6.6percent in December. This was a 0.3 of apercentage-point decrease fromNovember’s revised rate of 6.9 percent, an
a 2.8 percentage-point decline over the yea
Over the month, the unemployment ratedecreased in 86 counties, increased in 11and remained unchanged in three. Thirty-seven counties had unemployment rates ator below the state’s 6.6 percent rate.
Scotland County recorded December’shighest unemployment rate at 12.6 percentdecreasing 0.9 of a percentage point fromthe previous month. Graham County had thsecond-highest rate at 12.2 percent,increasing 0.4 of a percentage point.Orange County had the lowestunemployment rate at 4.1 percent, followedby Chatham at 4.4 percent, and Polk at 4.6percent.
Unemployment rates decreased in all 14 ofthe state’s Metropolitan Statistical Areas(MSAs). The Rocky Mount MSA had thehighest unemployment rate in December at9.4 percent, followed by Fayetteville at 7.8percent. Durham/Chapel Hill reported the
month’s lowest unemployment rate at 4.9percent, which decreased 0.2 of apercentage point from the previous month.Asheville followed at 5.0 percent.
MSA Unemployment RatesDecember 2013*(Not Seasonally Adjusted)
Counties With Highest Unemployment RatesDecember 2013*(Not Seasonally Adjusted)
Counties With Lowest Unemployment RatesDecember 2013*(Not Seasonally Adjusted)
County Labor Market ConditionsNorth Carolina
4.1%4.4%
4.6% 4.8% 4.9% 5.0% 5.1% 5.2%
0%
2%
4%
6%
Orange Chatham Polk Buncombe Henderson Wake Durham Madison
12.6% 12.2%11.6%
10.0% 10.0% 9.9% 9.7% 9.7%
0%
5%
10%
15%
Scotland Graham Edgecombe Halifax Hyde Bladen Swain Robeson
6.6%
4.9% 5.0% 5.2%
6.1% 6.4% 6.5% 6.5% 6.6% 6.6% 6.9% 7.1% 7.2% 7.8%
9.4%
0%
3%
6%
9%
12%
N o r t h C a r o l i n a
D u r h a m /
C h a p e l H i l l
A s h e v i l l e
R a l e i g h / C a r y
W i n s t o n - S a l e m
B u r l i n g t o n
G r e e n v i l l e
J a c k s o n v i l l e
C h a r l o e / G a s t o n i a /
R o c k H i l l , N C - S C
G o l d s b o r o
G r e e n s b o r o /
H i g h P o i n t
W i l m i n g t o n
H i c k o r y / L e n o i r /
M o r g a n t o n
F a y e e v i l l e
R o c k y M o u n t
* A l l D e c e m b e r 2 0 1 3 d a t a a r e p r e l i m i n a r y .
December
2 0 1 3

8/13/2019 December Unemployment and Jobs report by County and Metropolitan areas December 2014
http://slidepdf.com/reader/full/december-unemployment-and-jobs-report-by-county-and-metropolitan-areas-december 8/14L a b o r & E c o n o m i c A n a l y s i s D i v i s i o n | N o r t h C a r o l i n a D e p a r t m e n t o f C o m m e r c e | 2 o f 6
In December 2013, there were 33,157 RegularUnemployment Insurance (UI) Initial Claims filedNorth Carolina. Counties with the largest numbeof claims filed and benefits received are shown the graphs.
Total Regular Initial Claims are based on the
number of transactions; demographic data arecounts of individuals. Not all race/ethnicity and abreakouts are presented, but are available uponrequest.
New Regular Initial Claims, totaling 25,588 for thmonth ending December 2013, increased 4,385from the prior month. Attached New Initial Claimtotaled 143, or 0.6 percent. During the same pera year ago, New Claims totaled 35,697, of whichpercent were Attached. For the month endingDecember 2011, New Claims totaled 39,445, of
which 33 percent were Attached Claims.
Regular Initial UI ClaimsDecember 2013
Counties Receiving Most Regular UI BenefitsDecember 2013
Regular Initial UI Claims by Separating Industry (SIC)*December 2013
North Carolina County Labor Market Conditions
County
Transactions Individuals
InitialClaims
FemaleAfrican-
AmericanWhite
45 OrOlder
Mecklenburg 3,079 1,494 1,811 913 1,094
Wake 2,066 972 936 880 817
Guilford 1,889 925 1,164 552 781
Forsyth 1,029 503 522 394 398
Cumberland 1,024 470 586 286 363
$6,744,028
$5,023,537
$3,153,980
$1,776,763 $1,752,881
$0
$2,000,000
$4,000,000
$6,000,000
$8,000,000
Mecklenburg Wake Guilford Forsyth Cumberland
3,090
1,591
999 933 900
0
500
1,000
1,500
2,000
2,500
3,000
3,500
Business
Services
Eang & Drinking
Places
Construcon-Special
Trade Contractors
Miscellaneous Services Heavy Construcon
Other Than Building
* M a n y i n i t i a l c l a i m s w e r e n o n c l a s s i f i e d b y s e p a r a t i n g i n d u s t r y . I n i t i a l c l a i m s r e f e r t o r e g u l a r U I P r o g r a m .

8/13/2019 December Unemployment and Jobs report by County and Metropolitan areas December 2014
http://slidepdf.com/reader/full/december-unemployment-and-jobs-report-by-county-and-metropolitan-areas-december 9/14L a b o r & E c o n o m i c A n a l y s i s D i v i s i o n | N o r t h C a r o l i n a D e p a r t m e n t o f C o m m e r c e | 3 o f 6
North Carolina County Labor Market Conditions
Asheville MSA | Total Nonfarm Employment | December 2013
Over-the-Month Employment Change
Industry Change
Mining, Logging & Construction -100 -1.5%
Manufacturing 0 0.0%
Trade, Transportation & Utilities 300 0.9%
Information 0 0.0%Financial Activities 0 0.0%
Professional & Business Services 200 1.2%
Education & Health Services -100 -0.3%
Leisure & Hospitality 200 0.8%
Other Services 0 0.0%
Government -100 -0.4%
Over-the-Year Employment Change
Industry Change
Mining, Logging & Construction -300 -4
Manufacturing -100 -0
Trade, Transportation & Utilities 1,000 2
Information 0 0Financial Activities 200 3
Professional & Business Services 300 1
Education & Health Services 1,200 3
Leisure & Hospitality 1,500 6
Other Services 100 1
Government -700 -2
Burlington MSA | Total Nonfarm Employment | December 2013
Over-the-Month Employment Change
Industry Change
Mining, Logging & Construction -100 -3.8%
Manufacturing 0 0.0%Trade, Transportation & Utilities 200 1.7%
Information 0 0.0%
Financial Activities 0 0.0%
Professional & Business Services -100 -1.4%
Education & Health Services 0 0.0%
Leisure & Hospitality 0 0.0%
Other Services 0 0.0%
Government 0 0.0%
Over-the-Year Employment Change
Industry Change
Mining, Logging & Construction 0 0
Manufacturing -100 -1Trade, Transportation & Utilities 200 1
Information 0 0
Financial Activities -100 -5
Professional & Business Services 100 1
Education & Health Services 0 0
Leisure & Hospitality 300 4
Other Services 0 0
Government 0 0
Charlotte/Gastonia/Rock Hill, NC-SC MSA | Total Nonfarm Employment | December 2013
Durham/Chapel Hill MSA | Total Nonfarm Employment | December 2013
Over-the-Month Employment Change
Industry ChangeMining, Logging & Construction -800 -1.8%
Manufacturing 600 0.9%
Trade, Transportation & Utilities 1,800 1.0%
Information 0 0.0%
Financial Activities -400 -0.5%
Professional & Business Services -500 -0.3%
Education & Health Services -400 -0.5%
Leisure & Hospitality -700 -0.7%
Other Services 400 1.4%
Government -200 -0.2%
Over-the-Year Employment Change
Industry ChangeMining, Logging & Construction 3,100 7
Manufacturing 100 0
Trade, Transportation & Utilities 6,600 3
Information 500 2
Financial Activities 900 1
Professional & Business Services 8,600 6
Education & Health Services -1,600 -1
Leisure & Hospitality 4,600 4
Other Services 900 3
Government -1,100 -0
Over-the-Month Employment Change
Industry Change
Mining, Logging & Construction -200 -3.0%
Manufacturing 0 0.0%
Trade, Transportation & Utilities 700 2.0%
Information 0 0.0%
Financial Activities 0 0.0%
Professional & Business Services 200 0.5%
Education & Health Services 100 0.2%
Leisure & Hospitality -100 -0.4%
Other Services 100 1.0%
Government -900 -1.3%
Over-the-Year Employment Change
Industry Change
Mining, Logging & Construction -100 -1
Manufacturing -700 -2
Trade, Transportation & Utilities -500 -1
Information 100 2
Financial Activities 300 2
Professional & Business Services 800 2
Education & Health Services 1,000 1
Leisure & Hospitality 2,500 11
Other Services 100 1
Government 3,200 5
UN Rate| 6.6%
Total Nonfarm | 892,800Monthly Change | -200 (>-0.1%)
Yearly Change | 22,600 (2.6%)
N o t e : A l l d a t a a r e N o t S e a s o n a l l y A d j u s t e d . A l l D e c e m b e r 2 0 1 3 d a t a a r e p r e l i m i n a r y .
UN Rate | 6.4%
Total Nonfarm | 59,600Monthly Change | 0 (0.0%)
Yearly Change | 400 (0.7%)
UN Rate| 5.0%
Total Nonfarm | 178,000Monthly Change | 400 (0.2%)
Yearly Change | 3,200 (1.8%)
UN Rate | 4.9%
Total Nonfarm | 295,500Monthly Change | -100 (>-0.1%)
Yearly Change | 6,700 (2.3%)

8/13/2019 December Unemployment and Jobs report by County and Metropolitan areas December 2014
http://slidepdf.com/reader/full/december-unemployment-and-jobs-report-by-county-and-metropolitan-areas-december 10/14L a b o r & E c o n o m i c A n a l y s i s D i v i s i o n | N o r t h C a r o l i n a D e p a r t m e n t o f C o m m e r c e | 4 o f 6
North Carolina County Labor Market Conditions
Fayetteville MSA | Total Nonfarm Employment | December 2013
Goldsboro MSA | Total Nonfarm Employment | December 2013
Greensboro/High Point MSA | Total Nonfarm Employment | December 2013
Greenville MSA | Total Nonfarm Employment | December 2013
Over-the-Month Employment Change
Industry Change
Mining, Logging & Construction 0 0.0%
Manufacturing 100 1.1%
Trade, Transportation & Utilities 300 1.3%
Information -100 -7.1%Financial Activities 0 0.0%
Professional & Business Services 100 0.8%
Education & Health Services 0 0.0%
Leisure & Hospitality -100 -0.7%
Other Services 100 2.0%
Government -100 -0.2%
Over-the-Year Employment Change
Industry Change
Mining, Logging & Construction 200 3
Manufacturing -100 -
Trade, Transportation & Utilities 900 3
Information -100 -7Financial Activities -100 -2
Professional & Business Services -300 -2
Education & Health Services 300 2
Leisure & Hospitality 200 1
Other Services 200 4
Government -800 -2
Over-the-Month Employment Change
Industry Change
Mining, Logging & Construction *
Manufacturing *Trade, Transportation & Utilities *
Information *
Financial Activities *
Professional & Business Services *
Education & Health Services *
Leisure & Hospitality *
Other Services *
Government 0 0.0%
Over-the-Year Employment Change
Industry Change
Mining, Logging & Construction *
Manufacturing *Trade, Transportation & Utilities *
Information *
Financial Activities *
Professional & Business Services *
Education & Health Services *
Leisure & Hospitality *
Other Services *
Government -100 -1
Over-the-Month Employment Change
Industry ChangeMining, Logging & Construction -600 -4.5%
Manufacturing 0 0.0%
Trade, Transportation & Utilities 1,000 1.4%
Information 100 1.9%
Financial Activities 100 0.6%
Professional & Business Services -100 -0.2%
Education & Health Services 100 0.2%
Leisure & Hospitality -400 -1.2%
Other Services 0 0.0%
Government -200 -0.4%
Over-the-Year Employment Change
Industry ChangeMining, Logging & Construction -100 -0
Manufacturing -800 -1
Trade, Transportation & Utilities 2,000 2
Information 100 1
Financial Activities -400 -2
Professional & Business Services 3,300 7
Education & Health Services -200 -0
Leisure & Hospitality 700 2
Other Services -100 -0
Government 1,000 2
Over-the-Month Employment Change
Industry Change
Mining, Logging & Construction 0 0.0%
Manufacturing -100 -1.2%
Trade, Transportation & Utilities 100 0.8%
Information 0 0.0%
Financial Activities 100 3.6%
Professional & Business Services 0 0.0%
Education & Health Services -100 -1.0%
Leisure & Hospitality -100 -1.1%
Other Services -100 -4.5%
Government 0 0.0%
Over-the-Year Employment Change
Industry Change
Mining, Logging & Construction -100 -3
Manufacturing 400 5
Trade, Transportation & Utilities 400 3
Information 100 1
Financial Activities 100 3
Professional & Business Services 300 4
Education & Health Services -800 -7
Leisure & Hospitality 800 9
Other Services -100 -4
Government 200 0
* D a t a n o t c o l l e c t e d f o r t h e s e i n d u s t r i a l s e c t o r s . N o t e : A l l d a t a a r e N o t S e a s o n a l l y A d j u s t e d . A l l D e c e m b e r 2 0 1 3 d a t a a r e p r e l i m i n a r y .
UN Rate | 7.8%
Total Nonfarm | 131,400Monthly Change | 300 (0.2%)
Yearly Change | 400 (0.3%)
UN Rate | 6.6%
Total Nonfarm | 43,600Monthly Change | 0 (0.0%)
Yearly Change | 500 (1.2%)
UN Rate | 6.9%
Total Nonfarm | 351,800Monthly Change | 0 (0.0%)
Yearly Change | 5,500 (1.6%)
UN Rate | 6.5%
Total Nonfarm | 83,700Monthly Change | -200 (-0.2%)
Yearly Change | 1,300 (1.6%)

8/13/2019 December Unemployment and Jobs report by County and Metropolitan areas December 2014
http://slidepdf.com/reader/full/december-unemployment-and-jobs-report-by-county-and-metropolitan-areas-december 11/14L a b o r & E c o n o m i c A n a l y s i s D i v i s i o n | N o r t h C a r o l i n a D e p a r t m e n t o f C o m m e r c e | 5 o f 6
North Carolina County Labor Market Conditions
Hickory/Lenoir/Morganton MSA | Total Nonfarm Employment | December 2013
Jacksonville MSA | Total Nonfarm Employment | December 2013
Raleigh/Cary MSA | Total Nonfarm Employment | December 2013
Rocky Mount MSA | Total Nonfarm Employment | December 2013
Over-the-Month Employment Change
Industry Change
Mining, Logging & Construction -100 -2.9%
Manufacturing 0 0.0%
Trade, Transportation & Utilities 100 0.4%
Information 0 0.0%Financial Activities 0 0.0%
Professional & Business Services -100 -0.7%
Education & Health Services -100 -0.5%
Leisure & Hospitality -100 -0.8%
Other Services 100 2.3%
Government -100 -0.4%
Over-the-Year Employment Change
Industry Change
Mining, Logging & Construction 0 0
Manufacturing -600 -1
Trade, Transportation & Utilities 700 2
Information 0 0Financial Activities 100 3
Professional & Business Services 500 3
Education & Health Services 0 0
Leisure & Hospitality 0 0
Other Services 0 0
Government 100 0
Over-the-Month Employment Change
Industry Change
Mining, Logging & Construction *
Manufacturing *Trade, Transportation & Utilities *
Information *
Financial Activities *
Professional & Business Services *
Education & Health Services *
Leisure & Hospitality *
Other Services *
Government -300 -1.9%
Over-the-Year Employment Change
Industry Change
Mining, Logging & Construction *
Manufacturing *Trade, Transportation & Utilities *
Information *
Financial Activities *
Professional & Business Services *
Education & Health Services *
Leisure & Hospitality *
Other Services *
Government 600 3
Over-the-Month Employment Change
Industry ChangeMining, Logging & Construction 100 0.4%
Manufacturing -400 -1.4%
Trade, Transportation & Utilities 1,000 1.0%
Information 100 0.5%
Financial Activities 100 0.4%
Professional & Business Services 900 0.9%
Education & Health Services -300 -0.4%
Leisure & Hospitality 1,400 2.5%
Other Services 0 0.0%
Government -500 -0.5%
Over-the-Year Employment Change
Industry ChangeMining, Logging & Construction -2,500 -8
Manufacturing 400 1
Trade, Transportation & Utilities 2,200 2
Information 800 4
Financial Activities 600 2
Professional & Business Services 6,300 6
Education & Health Services 1,600 2
Leisure & Hospitality 600
Other Services 800 3
Government 2,200 2
Over-the-Month Employment Change
Industry Change
Mining, Logging & Construction -100 -4.2%
Manufacturing 100 1.0%
Trade, Transportation & Utilities 300 2.6%
Information *
Financial Activities *
Professional & Business Services 0 0.0%
Education & Health Services 0 0.0%
Leisure & Hospitality -100 -1.8%
Other Services *
Government -300 -2.8%
Over-the-Year Employment Change
Industry Change
Mining, Logging & Construction -100 -4
Manufacturing -200 -2
Trade, Transportation & Utilities 400 3
Information *
Financial Activities *
Professional & Business Services 300 5
Education & Health Services 0 0
Leisure & Hospitality 100 1
Other Services *
Government -600 -5
* D a t a n o t c o l l e c t e d f o r t h e s e i n d u s t r i a l s e c t o r s . N o t e : A l l d a t a a r e N o t S e a s o n a l l y A d j u s t e d . A l l D e c e m b e r 2 0 1 3 d a t a a r e p r e l i m i n a r y .
UN Rate | 7.2%Total Nonfarm| 144,500
Monthly Change | -300 (-0.2%)Yearly Change | 800 (0.6%)
UN Rate| 6.5%
Total Nonfarm | 49,500Monthly Change | -400 (-0.8%)
Yearly Change | 400 (0.8%)
UN Rate| 5.2%Total Nonfarm | 542,100
Monthly Change | 2,400 (0.4%)Yearly Change | 13,000 (2.5%)
UN Rate | 9.4%Total Nonfarm | 57,500
Monthly Change | -100 (-0.2%)Yearly Change | -800 (-1.4%)

8/13/2019 December Unemployment and Jobs report by County and Metropolitan areas December 2014
http://slidepdf.com/reader/full/december-unemployment-and-jobs-report-by-county-and-metropolitan-areas-december 12/14L a b o r & E c o n o m i c A n a l y s i s D i v i s i o n | N o r t h C a r o l i n a D e p a r t m e n t o f C o m m e r c e | 6 o f 6
North Carolina County Labor Market Conditions
Over the month, net industry employment decreased in eight of 14 MSAs. The Winston-Salem MSA had the largest net employ-ment decrease with 700, followed by Jacksonville with 400. Jacksonville experienced the greatest percentage decrease at 0.8percent. It is important to note that employment estimates are subject to large seasonal patterns; therefore, it is advisable to
focus on over-the-year changes in the not seasonally adjusted series. Over the year, employment rose in 13 MSAs. TheCharlotte/Gastonia/Rock Hill MSA had the largest net employment increase with 22,600, followed by Raleigh/Cary with 13,000and Durham/Chapel Hill, 6,700. Charlotte/Gastonia/Rock Hill NC-SC had the greatest percentage increase at 2.6 percent. RockMount reported a net decrease of 800.
Wilmington MSA | Total Nonfarm Employment | December 2013
Winston-Salem MSA | Total Nonfarm Employment | December 2013
Over-the-Month Employment Change
Industry Change
Mining, Logging & Construction -100 -1.4%
Manufacturing 0 0.0%
Trade, Transportation & Utilities 400 1.4%
Information 0 0.0%Financial Activities 100 1.6%
Professional & Business Services 0 0.0%
Education & Health Services 0 0.0%
Leisure & Hospitality -600 -2.6%
Other Services 0 0.0%
Government -100 -0.4%
Over-the-Year Employment Change
Industry Change
Mining, Logging & Construction -400 -5
Manufacturing 100 1
Trade, Transportation & Utilities 500 1
Information 100 3Financial Activities 100 1
Professional & Business Services 300 2
Education & Health Services 400 2
Leisure & Hospitality 1,500 7
Other Services 100 2
Government -200 -0
Over-the-Month Employment Change
Industry Change
Mining, Logging & Construction -200 -2.8%
Manufacturing -100 -0.5%Trade, Transportation & Utilities 100 0.3%
Information 0 0.0%
Financial Activities 100 0.9%
Professional & Business Services 300 1.1%
Education & Health Services 0 0.0%
Leisure & Hospitality -700 -3.2%
Other Services 0 0.0%
Government -200 -0.7%
Over-the-Year Employment Change
Industry Change
Mining, Logging & Construction -200 -2
Manufacturing -500 -2Trade, Transportation & Utilities 200 0
Information 100 5
Financial Activities -100 -0
Professional & Business Services -1,400 -4
Education & Health Services 1,400 3
Leisure & Hospitality 1,300 6
Other Services -100 -1
Government 900 3
2.6%
2.5%
2.3%
1.8%
1.8%
1.6%
1.6%
1.2%
0.8%
0.8%
0.7%
0.6%
0.3%
-1.4%
-2.0% -1.0% 0.0% 1.0% 2.0% 3
Char/Gast/Rock Hill
Raleigh/Cary
Durham/Chapel Hill
Wilmington
Asheville
Greenville
Greensboro/High Pt
Goldsboro
Winston-Salem
Jacksonville
Burlington
Hick/Len/Morg
Fayeeville
Rocky Mount
MSA Over-the-Month Employment Percent ChangeNovember 2013-December 2013(Not Seasonally Adjusted)
MSA Over-the-Year Employment Percent ChangeDecember 2012-December 2013(Not Seasonally Adjusted)
0.4%
0.2%
0.2%
0.0%
0.0%
0.0%
>-0.1%
>-0.1%
-0.2%
-0.2%
-0.2%
-0.2%
-0.3%
-0.8%
-1.0% 0.0% 1.0%
Raleigh/Cary
Fayeeville
Asheville
Greensboro/High Pt
Goldsboro
Burlington
Durham/Chapel Hill
Char/Gast/Rock Hill
Greenville
Rocky Mount
Hick/Len/Morg
Wilmington
Winston-Salem
Jacksonville
N o t e : A l l d a t a a r e N o t S e a s o n a l l y A d j u s t e d . A l l D e c e m b e r 2 0 1 3 d a t a a r e p r e l i m i n a r y .
UN Rate | 7.1%
Total Nonfarm| 141,500Monthly Change | -300 (-0.2%)
Yearly Change | 2,500 (1.8%)
UN Rate | 6.1%
Total Nonfarm | 209,800Monthly Change| -700 (-0.3%)
Yearly Change | 1,600 (0.8%)

8/13/2019 December Unemployment and Jobs report by County and Metropolitan areas December 2014
http://slidepdf.com/reader/full/december-unemployment-and-jobs-report-by-county-and-metropolitan-areas-december 13/14
New
Hanover
Wake
Duplin
Bladen
Pender
W ilk es
Moore
Union
Halif
Robeson
Nash
Surry
Sampson
Ir edell
Columbus
Sw ain
Burk e
Johnston
Ashe
Guilford
Anson
Randolph
Harnett Wayne
Brunswick
Chatham
Macon
Rowan
Hoke
Lee
Stokes
Stanly
L
Franklin
Warren
Buncombe
Granville
Davidson
Jack son
Haywood
Person
Caldwell
Wilson
Forsyth
Caswell
Polk
Orange
Cumberland
Madison
Rutherford
Yadkin
Gaston
Clay
Cherok ee
Richmond
Cleveland
Catawba
Davie
Rockingham
McDowell
Vance
Alamance
Avery
Lincoln
Y anceyE
MecklenburgMontgomery
Cabarrus
Durham
Graham
Scotland
G
W atauga
Henderson
Transylvania
Mitchell
Alexander
Alleghany
9.0
9.7
6.3
8.2
9.9
8.0
5.0
7.2
5.8
6.3
7.4
4.4
6.4
4.8
7.7
6.9
5.5
7.6
6.5
7.5
6.9
9.2 6.6
5.7
6.7
8.2
9.7
6.9
7.7
6.8
6.8
1
7.3
7.3
7.3
5.8
6.1
9.2
7.5
7.3
9.0
6.0
5.2
7.6
9.0
6.4
6.6
8.3
7.3
6.1
6.2
6.9
4.1
8.0
6.6
4.9
9.0
5.97.2
5.4
7.8
6.7
5.1
9.2
6.16.2
8.3
7.5
4.6
12.6
8.5
6.6
12.2
5.6
7.1
6.3
North Carolina Unemployment Rates by
December 2013
Note: December 2013 data are preliminary.
Prepared by Labor & Economic Analysis Div
No
N
11 Counties Higher Than Previous Month
86 Counties Lower Than Previous Month
3 Counties Same as Previous Month
̂ ^
=
December 2013
4.1% to 5.5%
5.6% to 6.5%
6.6% to 7.5%
7.6% to 9.0%
9.1% to 12.6%
8/13/2019 December Unemployment and Jobs report by County and Metropolitan areas December 2014
http://slidepdf.com/reader/full/december-unemployment-and-jobs-report-by-county-and-metropolitan-areas-december 14/14
— Technical Notes —
This release presents labor force and unemployment estimates from the Local Area Unemployment Statistics (LAUS) pro
gram. The LAUS program is a federal-state cooperative endeavor.
Labor force and unemployment--from the LAUS program
Denitions. The labor force and unemployment estimates are based on the same concepts and denitions as those used for
the ofcial national estimates obtained from the Current Population Survey (CPS), a sample survey of households that is
conducted for the Bureau of Labor Statistics (BLS) by the U.S. Census Bureau. The LAUS program measures employment
and unemployment on a place-of-residence basis. The universe for each is the civilian noninstitutional population 16 years of
age and over. Employed persons are those who did any work at all for pay or prot in the reference week (the week including
the 12th of the month) or worked 15 hours or more without pay in a family business or farm, plus those not working who
had a job from which they were temporarily absent, whether or not paid, for such reasons as bad weather, labor-managemen
dispute, illness, or vacation. Unemployed persons are those who were not employed during the reference week (based on
the denition above), had actively looked for a job sometime in the 4-week period ending with the reference week, and were
currently available for work; persons on lay-off expecting recall need not be looking for work to be counted as unemployed
The labor force is the sum of employed and unemployed persons. The unemployment rate is the number of unemployed as
a percent of the labor force.
Method of estimation. Statewide estimates are produced using an estimation algorithm administered by the BLS. This method
which underwent substantial enhancement at the beginning of 2005, utilizes data from several sources, including the CPS
Current Employment Statistics (CES), and state unemployment insurance (UI) programs. Substate estimates are produced
using the “LAUS Handbook Method”, which is also based on data from several sources. Each month, census division es
timates are controlled to national totals, and state estimates are then controlled to their respective division totals. Substate
estimates are controlled to their respective state totals. For more information about LAUS estimation procedures, see the
BLS website at www.bls.gov/lau/laumthd.htm
Revisions. Labor force and unemployment data for the previous month reect adjustments made in each subsequent month
while data for prior years reect adjustments made at the end of each year. The monthly revisions incorporate updated mode
inputs, while the annually revised estimates reect updated population data from the U.S. Census Bureau, any revisions in
the other data sources, and model reestimation. In most years, historical data for the most recent ve years (both seasonally
adjusted and not seasonally adjusted) are revised near the beginning of each calendar year, prior to the release of January
estimates.
Area denitions. The substate area data published in this release reect the standards and denitions established by the U.S
Ofce of Management and Budget on December 1, 2009. A detailed list of the geographic denitions is available online at
www.bls.gov/lau/lausmsa.htm.
Reliability of the estimates
The estimates presented in this release are based on sample surveys, administrative data, and modeling and, thus, are subjec
to sampling and other types of errors. Sampling error is a measure of sampling variability--that is, variation that occurs by
chance because a sample rather than the entire population is surveyed. Survey data also are subject to nonsampling errors
such as those which can be introduced into the data collection and processing operations. Estimates not directly derived from
sample surveys are subject to additional errors resulting from the specic estimation processes used.
Model-based error measures for seasonally adjusted and not seasonally adjusted data and for over-the-month and over-the
year changes to LAUS statewide estimates are available online at www.bls.gov/lau/lastderr.htm.
Release Dates
The next unemployment update is scheduled for Monday, March 17, 2014 when the state unemployment rate for
January 2014 will be released.
The complete 2014 data release schedule can be accessed at:
http://www.nccommerce.com/Portals/47/Documents/2014_NC_Release_Dates.pdf