december 31, 2019 - ohio national life insurance company ·...
TRANSCRIPT

December 31, 2019

Presidents’ Message . . . . . . . . . . . . . . . . . . . . . . . . . . . . . . . . . . . . . . . . . . . . . . . . . . . . . . . . . . . . . . . . . . . . . . . . . . . . . . . . . . . . 1
The following pages contain Performance, Comments from Adviser/Sub-Adviser, Change in Value of $10,000 Investment,Portfolio Composition, Top Holdings (all of which are unaudited), and Schedule of Investments (audited) for each of theFund’s Portfolios:
ON Bond Portfolio . . . . . . . . . . . . . . . . . . . . . . . . . . . . . . . . . . . . . . . . . . . . . . . . . . . . . . . . . . . . . . . . . . . . . . . . . . . . . . . . . . . . 3
ON BlackRock Balanced Allocation Portfolio (formerly the ON Omni Portfolio) . . . . . . . . . . . . . . . . . . . . . . . . . . . . . . . . . . . . . 9
ON International Equity Portfolio . . . . . . . . . . . . . . . . . . . . . . . . . . . . . . . . . . . . . . . . . . . . . . . . . . . . . . . . . . . . . . . . . . . . . . . . . 21
ON Foreign Portfolio . . . . . . . . . . . . . . . . . . . . . . . . . . . . . . . . . . . . . . . . . . . . . . . . . . . . . . . . . . . . . . . . . . . . . . . . . . . . . . . . . . . 28
ON Janus Henderson Forty Portfolio . . . . . . . . . . . . . . . . . . . . . . . . . . . . . . . . . . . . . . . . . . . . . . . . . . . . . . . . . . . . . . . . . . . . . . 35
ON Janus Henderson Venture Portfolio . . . . . . . . . . . . . . . . . . . . . . . . . . . . . . . . . . . . . . . . . . . . . . . . . . . . . . . . . . . . . . . . . . . . 38
ON Janus Henderson Enterprise Portfolio . . . . . . . . . . . . . . . . . . . . . . . . . . . . . . . . . . . . . . . . . . . . . . . . . . . . . . . . . . . . . . . . . . 42
ON S&P 500® Index Portfolio . . . . . . . . . . . . . . . . . . . . . . . . . . . . . . . . . . . . . . . . . . . . . . . . . . . . . . . . . . . . . . . . . . . . . . . . . . . . 46
ON BlackRock Advantage Large Cap Value Portfolio (formerly the ON Federated Strategic Value Dividend Portfolio) . . . . . . . 54
ON Federated High Income Bond Portfolio . . . . . . . . . . . . . . . . . . . . . . . . . . . . . . . . . . . . . . . . . . . . . . . . . . . . . . . . . . . . . . . . . 61
ON Nasdaq-100® Index Portfolio . . . . . . . . . . . . . . . . . . . . . . . . . . . . . . . . . . . . . . . . . . . . . . . . . . . . . . . . . . . . . . . . . . . . . . . . . 70
ON BlackRock Advantage Large Cap Core Portfolio (formerly the ON Bristol Portfolio) . . . . . . . . . . . . . . . . . . . . . . . . . . . . . . . 74
ON BlackRock Advantage Small Cap Growth Portfolio (formerly the ON Bryton Growth Portfolio) . . . . . . . . . . . . . . . . . . . . . . 81
ON S&P MidCap 400® Index Portfolio . . . . . . . . . . . . . . . . . . . . . . . . . . . . . . . . . . . . . . . . . . . . . . . . . . . . . . . . . . . . . . . . . . . . . 89
ON BlackRock Advantage Large Cap Growth Portfolio (formerly the ON Bristol Growth Portfolio) . . . . . . . . . . . . . . . . . . . . . . 96
ON Risk Managed Balanced Portfolio . . . . . . . . . . . . . . . . . . . . . . . . . . . . . . . . . . . . . . . . . . . . . . . . . . . . . . . . . . . . . . . . . . . . . 102
ON Conservative Model Portfolio . . . . . . . . . . . . . . . . . . . . . . . . . . . . . . . . . . . . . . . . . . . . . . . . . . . . . . . . . . . . . . . . . . . . . . . . . 116
ON Moderately Conservative Model Portfolio . . . . . . . . . . . . . . . . . . . . . . . . . . . . . . . . . . . . . . . . . . . . . . . . . . . . . . . . . . . . . . . 119
ON Balanced Model Portfolio . . . . . . . . . . . . . . . . . . . . . . . . . . . . . . . . . . . . . . . . . . . . . . . . . . . . . . . . . . . . . . . . . . . . . . . . . . . 122
ON Moderate Growth Model Portfolio . . . . . . . . . . . . . . . . . . . . . . . . . . . . . . . . . . . . . . . . . . . . . . . . . . . . . . . . . . . . . . . . . . . . . 125
ON Growth Model Portfolio . . . . . . . . . . . . . . . . . . . . . . . . . . . . . . . . . . . . . . . . . . . . . . . . . . . . . . . . . . . . . . . . . . . . . . . . . . . . . 128
Statements of Assets and Liabilities . . . . . . . . . . . . . . . . . . . . . . . . . . . . . . . . . . . . . . . . . . . . . . . . . . . . . . . . . . . . . . . . . . . . . . . . . 131
Statements of Operations . . . . . . . . . . . . . . . . . . . . . . . . . . . . . . . . . . . . . . . . . . . . . . . . . . . . . . . . . . . . . . . . . . . . . . . . . . . . . . . . . 134
Statements of Changes in Net Assets. . . . . . . . . . . . . . . . . . . . . . . . . . . . . . . . . . . . . . . . . . . . . . . . . . . . . . . . . . . . . . . . . . . . . . . . 137
Financial Highlights. . . . . . . . . . . . . . . . . . . . . . . . . . . . . . . . . . . . . . . . . . . . . . . . . . . . . . . . . . . . . . . . . . . . . . . . . . . . . . . . . . . . . . 142
Notes to Financial Statements . . . . . . . . . . . . . . . . . . . . . . . . . . . . . . . . . . . . . . . . . . . . . . . . . . . . . . . . . . . . . . . . . . . . . . . . . . . . . 147
Report of Independent Registered Public Accounting Firm . . . . . . . . . . . . . . . . . . . . . . . . . . . . . . . . . . . . . . . . . . . . . . . . . . . . . . . 172
Additional Information (Unaudited). . . . . . . . . . . . . . . . . . . . . . . . . . . . . . . . . . . . . . . . . . . . . . . . . . . . . . . . . . . . . . . . . . . . . . . . . . 173
Information about Directors and Officers (Unaudited) . . . . . . . . . . . . . . . . . . . . . . . . . . . . . . . . . . . . . . . . . . . . . . . . . . . . . . . . . . . 187
TABLE OF CONTENTS

Dear Investor:
2019 was an outstanding year for financial assetperformance. Major domestic stock market indices postedreturns in excess of 25%, while major domestic fixedincome indices posted high-single digit returns. Majorforeign stock market indices also posted strong positivereturns, although not as large as domestic stock marketindices.
Entering the year, market participants had two primaryconcerns. Firstly, that the Federal Reserve would continueto increase the Federal Funds rate and choke economicexpansion. This concern was alleviated as the FederalReserve reversed course and reduced the Fed Funds ratethree times in 2019, for a total cut of 0.75%. Meanwhile,central banks around the world indicated their willingnessto continue a more accommodative monetary policy, giventhe prospect of slower global growth. Equity and fixedincome markets reacted favorably to this stance, as equitymarkets rose, and interest rates declined. Secondly,market participants were concerned about an escalationof the trade war between the U.S. and China, and itsimpact on global growth. While trade issues have notbeen fully resolved, the U.S. and China signed a phase Itrade deal, which in essence is a temporary truce. Marketparticipants were generally pleased that the prospect ofan all-out trade war with China, and a resulting globalrecession, is less likely. Equity markets reacted favorablyagain, driving major domestic stock market indices toall-time highs.
The U.S. economy slowed during 2019, but Gross DomesticProduct (“GDP”) growth remains roughly 2%. Theunemployment rate is 3.5%, which represents a fifty yearlow. The rate of inflation is relatively low at 2.3%, andinterest rates declined materially in 2019. Lastly, corporateprofits are near all-time highs, although corporate profitgrowth slowed during 2019.
Equity Markets
Equity markets provided strong positive returns in 2019.Domestic indices outperformed international andemerging market indices by a wide margin. Within thedomestic equity market, the S&P 500®(large cap),S&P MidCap 400® and Russell 2000®(small cap) indices allposted strong positive returns, ranging from 25.5% to31.5%. Large cap indices outperformed both mid cap andsmall cap indices for the year. Growth stocks continued tooutperform value stocks during the period. The Russell1000® Growth Index provided a return of 36.4%, while theRussell 1000® Value Index provided a return of 26.5%.Within the foreign equity markets, international indices ofdeveloped countries outperformed emerging marketindices. Slowing global growth disproportionally impactedemerging market indices.
A summary of returns for key equity benchmarks ispresented below:
Index
2019 U.S. Dollar TotalReturn
(price and dividend)
S&P 500® 31.5%Russell 1000® Growth 36.4%Russell 1000® Value 26.5%S&P MidCap 400® 26.2%Russell 2000® Small Cap 25.5%MSCI All Country World Ex-USA(Net – USD) 21.5%MSCI Emerging Market 18.4%
Fixed Income Markets
Fixed income markets also provided strong positivereturns in 2019. The Federal Reserve changed courseduring the year, going from a restrictive stance to an
Presidents’Message
Michael J. DeWeirdt, CFA, FRMPresident, Ohio National Fund, Inc.
Gary R. Rodmaker, CFA, FLMIPresident, Ohio National Investments, Inc.
1

accommodative stance. The Federal Reserve cut theFederal Funds rate by 0.75% during the year, and indicatedthat they will likely hold the Federal Funds rate at itscurrent level for an extended period of time.
Long-term interest rates declined across the curve duringthe year, in response to the Federal Reserve’s policychange and the prospect of slowing global growth. The10-year U.S. Treasury rate, for example, declined 0.77%during the year, ending at 1.92%. In addition, creditspreads tightened, producing higher total returns forcorporate bonds, but lower current yields.
The Bloomberg Barclays US Aggregate Bond Indexposted a total return of 8.7% in 2019. Lower quality indices,like the Bloomberg Barclays Corporate Index and theBloomberg Barclays US Corporate High Yield Index,provided higher total returns of 14.5% and 14.3%,respectively. Other higher quality indices, such as theBloomberg Barclays US Treasury Index and theBloomberg Barclays US Securitized Index, provided lowertotal returns of 6.9% and 6.4%, respectively. The tablebelow illustrates the returns of the various indices.
Index
2019 U.S. Dollar TotalReturn
(price and interest)
Bloomberg Barclays US Aggregate 8.7%Bloomberg Barclays US Treasury 6.9%Bloomberg Barclays Securitized 6.4%Bloomberg Barclays Corporate 14.5%Bloomberg Barclays US CorporateHigh Yield 14.3%
The Ohio National Fund, Inc.
In 2019, the Ohio National Fund, Inc. portfolios turned instrong performance, with 15 of 18 actively managed fundsbeating their peers. In addition, the returns of the threeindex portfolios, before expenses, performed in line withtheir respective indices. The fund family continues to offera wide array of investment options that can be used tobuild a diversified portfolio.
Looking Ahead
The consensus view is for the U.S. economy to grow atroughly 2% in 2020. The unemployment rate is expected to
stay below 4%, and the inflation rate is expected to beabout 2%, as measured by the Consumer Price Index(CPI). Wage growth is expected to be slightly higher thanthe rate of inflation, which should keep the U.S. consumerhealthy. Corporate profits are expected to moderate, butremain strong. Lastly, the Federal Reserve is expected toremain accommodative, and leave the Federal Funds rateat its current level for an extended period of time in 2020.In short, the domestic economic backdrop remainsfavorable in the near term.
The global economic outlook has improved slightly inrecent months. While global growth slowed in 2019, thesigning of the phase I trade deal between the U.S. andChina has provided some reason for optimism. Centralbanks around the world continue to embraceaccommodative monetary policies, driving interest ratesbelow zero in many cases, in an effort to spur growth.Geopolitical risks continue, including the impact of Brexit,and strained relationships with countries like Iran, NorthKorea, and Russia. Also, as of this writing, concerns overa possible pandemic from the Coronavirus and the impactof actions to contain it are emerging. These actions couldslow world growth, temper stocks and push down yieldson bonds.
Equity markets around the world have started the yearmixed, currently focused on the impact of the Coronavirus.Valuations appear to be fairly high domestically, so thereis little room for error, or a negative exogenous event. Thatsaid, the domestic economic backdrop remainssupportive. The outlook for interest rates is for stability inthe Federal Funds rate, and accommodative central bankpolicies around the world in the near term. In thisenvironment, we believe that staying the course in awell-diversified portfolio will serve one well over the longterm.
Thank you for entrusting your assets to the Ohio NationalFund, Inc. We look forward to continuing to serve yourfinancial needs.
2

Objective/Strategy
The ON Bond Portfolio seeks to obtain a high level of income andopportunity for capital appreciation consistent with the preservation ofcapital by investing, under normal circumstances, at least 80% of its netassets in corporate debt securities.
Performance as of December 31, 2019
Average Annual returnsOne year 14.73%Five years 4.53%Ten years 4.77%
Past performance does not guarantee future results. The performance dataquoted represents past performance and current returns may be lower or higher.Total return figures include change in share price and reinvestment of dividendsand capital gains. The investment return and principal value will fluctuate so thatan investor’s shares, when redeemed, may be worth more or less than the originalcost. To obtain performance information up to the most recent month end, calltoll-free 1-877-781-6392.
The Portfolio is not open to direct retail investment. Beneficial interest in shares isobtained solely by purchase of variable life insurance policies and variable annuitycontracts. Actual performance results for variable annuity and variable universallife contracts will be lower due to contract charges. Consult your contract forapplicable charges.
Total expense ratio is 0.59% per the Fund’s prospectus dated November 22, 2019.Additional information pertaining to the Portfolio’s expense ratio as ofDecember 31, 2019 can be found in the Portfolio’s Financial Highlights.
Comments from Adviser
Q. How did the Portfolio perform in comparison to its benchmark duringthe reporting period?
A. For the year ended December 31, 2019, the Portfolio returned 14.73%versus 14.23% for its benchmark, the ICE BofA Merrill LynchU.S. Corporate Master Index.
Q. Were there specific market conditions, investment strategies, ortechniques that materially affected the Portfolio’s benchmark-relativeperformance during the reporting period?
A. Interest rates declined across the curve, as the Federal Reservereduced the Federal Funds rate 75 basis points during the year. In thisenvironment, longer duration bonds generally outperformed shorterduration bonds. Corporate credit spreads tightened during the year, withlower quality bonds generally outperforming higher quality bonds. Froman investment strategy perspective, the Portfolio was positioned with anoverweight to lower credit quality and shorter duration bonds versus thebenchmark throughout the year. The Portfolio’s lower credit qualitycontributed to relative performance, while its shorter duration detractedslightly from relative performance. (1)
Q. How did sector allocation and security selection each impact thePortfolio’s performance relative to its benchmark? For sector allocation,were there any factors that impacted the benchmark’s performancemore significantly than the Portfolio’s performance? For securityselection, was there anything specific regarding the Portfolio’s strategythat caused deviation from the benchmark?
A. Security selection was the largest driver of the Portfolio’soutperformance. Security selection in the Consumer Staples, Financials,Materials and Energy sectors was especially beneficial. Sectorallocation in the Communication Services and Consumer Discretionarysectors detracted slightly from relative performance. Other sectorweightings did not materially affect performance versus thebenchmark. (1)
Q. Which holdings contributed the most to, and detracted the most from,the Portfolio’s benchmark-relative performance?
A. The top three contributors to the Portfolio’s performance relative tothe benchmark were Bayer U.S. Finance II LLC 4.875% due 2048,Anheuser-Busch InBev Worldwide, Inc. 4.600% due 2048, and MarathonPetroleum Corp. 4.750% due 2044. Each of these bonds is a longerduration bond and experienced spread tightening during the year. Thetop three detractors to the Portfolio’s performance relative to thebenchmark were U.S. Treasury Note 2.375% due 2049, AEP TransmissionCo. LLC 3.750% due 2047, and U.S. Treasury Note 1.500% due 2024. Thesebonds were held for a short period of time during the year, whichcontributed to their lower performance versus the benchmark. (1)
(1) The Portfolio’s composition is subject to change. Holdings and weightings areas of December 31, 2019.
Change in Value of $10,000 Investment
ON Bond Portfolio (A)ICE BofA Merrill Lynch U.S. Corporate Master Index (B)
8,000
10,000
12,000
14,000
16,000
$18,000
6/1
012
/10 6
/1112
/11 6
/1212
/12 6
/1312
/13 6
/1412
/14 6
/1512
/15 6
/1612
/16 6
/1712
/17 6
/1812
/18 6
/19
12/3
1/09
12/1
9
$17,236 (B)
$15,940 (A)
Hypothetical illustration based on past performance. Future performance will vary.The Portfolio’s returns reflect reinvested dividends. The Portfolio’s holdings maydiffer significantly from the securities in the index. The index is unmanaged andtherefore does not reflect the cost of portfolio management and accounting.
The ICE BofA Merrill Lynch U.S. Corporate Master Index tracks the performance ofall U.S. dollar-denominated, investment grade corporate public debt issued in theU.S. domestic bond market. Qualifying bonds must have an investment grade rating(based on an average of Moody’s, S&P, and Fitch). In addition, qualifying securitiesmust have at least one year remaining term to maturity, a fixed coupon schedule,and a minimum amount outstanding of $250 million.
Past performance is no guarantee of future results. Redemption of fund sharescould have tax implications unique to each shareholder.
Ohio National Fund, Inc. ON Bond Portfolio (Unaudited)
3 (continued)

Portfolio Composition as of December 31, 2019 (1)
% of Net AssetsCorporate Bonds (4) 89.4U.S. Treasury Obligations 3.8Asset-Backed Securities (4) 2.7Sovereign Issues 1.1Money Market Funds and
Other Net Assets 3.0100.0
Top 10 Portfolio Holdings as of December 31, 2019 (1) (2) (3)
% of Net Assets1. U.S. Treasury Note
1.625%, 11/15/20223.1
2. Campbell Soup Co.4.150%, 03/15/2028
1.5
3. Aircastle Ltd.4.125%, 05/01/2024
1.5
4. Lear Corp.3.800%, 09/15/2027
1.4
5. B.A.T. Capital Corp.3.215%, 09/06/2026
1.4
6. UnitedHealth Group, Inc.3.875%, 12/15/2028
1.1
7. Expedia Group, Inc.5.000%, 02/15/2026
1.1
8. CVS Health Corp.4.100%, 03/25/2025
1.1
9. AbbVie, Inc.4.250%, 11/21/2049
1.1
10. Kinross Gold Corp.4.500%, 07/15/2027
1.1
(1) Composition of Portfolio subject to change.(2) Short-term investments have been excluded from the list of Top 10 Portfolio Holdings.(3) Top 10 Portfolio Holdings is presented at an individual security level. Total investment exposure by issuer may be higher.(4) Sectors (Corporate Bonds, Asset-Backed Securities):
% of Net AssetsFinancials 25.4Industrials 10.6Materials 9.3Energy 9.0Consumer Staples 7.2Utilities 6.7Health Care 6.6Consumer Discretionary 5.5Communication Services 5.5Real Estate 4.6Information Technology 1.7
92.1
Ohio National Fund, Inc. ON Bond Portfolio (Unaudited) (Continued)
4

Corporate Bonds – 89.4% Rate Maturity Face Amount Value
COMMUNICATION SERVICES – 5.5%AT&T, Inc. (Diversified Telecom. Svs.) . . . . . . . . . . . . . . . . . . . . . . . . . . . . . . . . . . . . . . . . QL + 118 06/12/2024 $2,000,000 $ 2,034,703AT&T, Inc. (Diversified Telecom. Svs.) . . . . . . . . . . . . . . . . . . . . . . . . . . . . . . . . . . . . . . . . 3.400% 05/15/2025 1,000,000 1,047,427AT&T, Inc. (Diversified Telecom. Svs.) . . . . . . . . . . . . . . . . . . . . . . . . . . . . . . . . . . . . . . . . 4.900% 08/15/2037 1,000,000 1,148,836Comcast Corp. (Media) . . . . . . . . . . . . . . . . . . . . . . . . . . . . . . . . . . . . . . . . . . . . . . . . . 3.250% 11/01/2039 3,000,000 3,039,409Discovery Communications LLC (Media) . . . . . . . . . . . . . . . . . . . . . . . . . . . . . . . . . . . . . . 3.950% 03/20/2028 900,000 959,598Lamar Media Corp. (Media) . . . . . . . . . . . . . . . . . . . . . . . . . . . . . . . . . . . . . . . . . . . . . . 5.750% 02/01/2026 500,000 529,950Rogers Communications, Inc. (Wireless Telecom. Svs.) . . . . . . . . . . . . . . . . . . . . . . . . . . . . . 3.700% 11/15/2049 2,100,000 2,112,840Sirius XM Radio, Inc. (Media) . . . . . . . . . . . . . . . . . . . . . . . . . . . . . . . . . . . . . . . . . . . . . (a) 5.375% 04/15/2025 1,000,000 1,033,280Time Warner Cable LLC (Media) . . . . . . . . . . . . . . . . . . . . . . . . . . . . . . . . . . . . . . . . . . . . 6.550% 05/01/2037 850,000 1,040,569Verizon Communications, Inc. (Diversified Telecom. Svs.) . . . . . . . . . . . . . . . . . . . . . . . . . . . . 4.500% 08/10/2033 1,000,000 1,166,849Verizon Communications, Inc. (Diversified Telecom. Svs.) . . . . . . . . . . . . . . . . . . . . . . . . . . . . 4.400% 11/01/2034 1,500,000 1,735,509
15,848,970
CONSUMER DISCRETIONARY – 5.5%Amazon.com, Inc. (Internet & Direct Marketing Retail). . . . . . . . . . . . . . . . . . . . . . . . . . . . . . 3.875% 08/22/2037 1,000,000 1,133,848Aptiv PLC (Auto Components) . . . . . . . . . . . . . . . . . . . . . . . . . . . . . . . . . . . . . . . . . . . . . 4.350% 03/15/2029 1,000,000 1,083,719Dollar General Corp. (Multiline Retail) . . . . . . . . . . . . . . . . . . . . . . . . . . . . . . . . . . . . . . . . 4.125% 05/01/2028 2,000,000 2,181,776Expedia Group, Inc. (Internet & Direct Marketing Retail). . . . . . . . . . . . . . . . . . . . . . . . . . . . . 5.000% 02/15/2026 3,000,000 3,306,693Hasbro, Inc. (Leisure Products) . . . . . . . . . . . . . . . . . . . . . . . . . . . . . . . . . . . . . . . . . . . . 3.900% 11/19/2029 3,000,000 3,017,984KB Home (Household Durables) . . . . . . . . . . . . . . . . . . . . . . . . . . . . . . . . . . . . . . . . . . . . 4.800% 11/15/2029 300,000 306,000Lear Corp. (Auto Components) . . . . . . . . . . . . . . . . . . . . . . . . . . . . . . . . . . . . . . . . . . . . . 3.800% 09/15/2027 4,000,000 4,035,769Magna International, Inc. (Auto Components) . . . . . . . . . . . . . . . . . . . . . . . . . . . . . . . . . . . 3.625% 06/15/2024 1,000,000 1,051,545
16,117,334
CONSUMER STAPLES – 7.2%Anheuser-Busch Cos. LLC / Anheuser-Busch InBev Worldwide, Inc. (Beverages) . . . . . . . . . . . . . 4.700% 02/01/2036 2,000,000 2,306,703Anheuser-Busch Cos. LLC / Anheuser-Busch InBev Worldwide, Inc. (Beverages) . . . . . . . . . . . . . 4.900% 02/01/2046 1,000,000 1,182,638Anheuser-Busch InBev Worldwide, Inc. (Beverages) . . . . . . . . . . . . . . . . . . . . . . . . . . . . . . 4.600% 04/15/2048 2,000,000 2,275,473B.A.T. Capital Corp. (Tobacco) . . . . . . . . . . . . . . . . . . . . . . . . . . . . . . . . . . . . . . . . . . . . . 3.215% 09/06/2026 4,000,000 4,026,234Campbell Soup Co. (Food Products) . . . . . . . . . . . . . . . . . . . . . . . . . . . . . . . . . . . . . . . . . 4.150% 03/15/2028 4,000,000 4,337,565Keurig Dr Pepper, Inc. (Beverages) . . . . . . . . . . . . . . . . . . . . . . . . . . . . . . . . . . . . . . . . . . 3.430% 06/15/2027 3,000,000 3,122,571Mead Johnson Nutrition Co. (Food Products) . . . . . . . . . . . . . . . . . . . . . . . . . . . . . . . . . . . 3.000% 11/15/2020 900,000 907,858Philip Morris International, Inc. (Tobacco) . . . . . . . . . . . . . . . . . . . . . . . . . . . . . . . . . . . . . 3.375% 08/15/2029 2,500,000 2,621,597
20,780,639
ENERGY – 9.0%Apache Corp. (Oil, Gas & Consumable Fuels) . . . . . . . . . . . . . . . . . . . . . . . . . . . . . . . . . . . . 4.375% 10/15/2028 2,000,000 2,088,018Baker Hughes, a GE Co. LLC / Baker Hughes Co-Obligor, Inc. (Energy Equip. & Svs.) . . . . . . . . . . . 4.080% 12/15/2047 2,000,000 2,044,782BP Capital Markets America, Inc. (Oil, Gas & Consumable Fuels) . . . . . . . . . . . . . . . . . . . . . . . 3.017% 01/16/2027 1,000,000 1,034,986Chevron Corp. (Oil, Gas & Consumable Fuels) . . . . . . . . . . . . . . . . . . . . . . . . . . . . . . . . . . . 2.895% 03/03/2024 900,000 932,190Concho Resources, Inc. (Oil, Gas & Consumable Fuels) . . . . . . . . . . . . . . . . . . . . . . . . . . . . . 3.750% 10/01/2027 2,000,000 2,101,001Energy Transfer Operating LP (Oil, Gas & Consumable Fuels). . . . . . . . . . . . . . . . . . . . . . . . . . 4.950% 06/15/2028 2,000,000 2,188,981EQM Midstream Partners LP (Oil, Gas & Consumable Fuels) . . . . . . . . . . . . . . . . . . . . . . . . . . 4.750% 07/15/2023 900,000 902,281Exxon Mobil Corp. (Oil, Gas & Consumable Fuels) . . . . . . . . . . . . . . . . . . . . . . . . . . . . . . . . . 4.114% 03/01/2046 900,000 1,054,291Halliburton Co. (Energy Equip. & Svs.) . . . . . . . . . . . . . . . . . . . . . . . . . . . . . . . . . . . . . . . . 4.850% 11/15/2035 900,000 1,016,193Kinder Morgan, Inc. (Oil, Gas & Consumable Fuels). . . . . . . . . . . . . . . . . . . . . . . . . . . . . . . . 5.300% 12/01/2034 1,000,000 1,175,934Marathon Oil Corp. (Oil, Gas & Consumable Fuels) . . . . . . . . . . . . . . . . . . . . . . . . . . . . . . . . 3.850% 06/01/2025 850,000 899,319Marathon Petroleum Corp. (Oil, Gas & Consumable Fuels) . . . . . . . . . . . . . . . . . . . . . . . . . . . 4.750% 09/15/2044 1,000,000 1,096,320ONEOK, Inc. (Oil, Gas & Consumable Fuels). . . . . . . . . . . . . . . . . . . . . . . . . . . . . . . . . . . . . 6.000% 06/15/2035 1,000,000 1,198,161Peabody Energy Corp. (Oil, Gas & Consumable Fuels) . . . . . . . . . . . . . . . . . . . . . . . . . . . . . . (a) 6.000% 03/31/2022 1,800,000 1,755,000Shell International Finance BV (Oil, Gas & Consumable Fuels) . . . . . . . . . . . . . . . . . . . . . . . . . 4.000% 05/10/2046 1,000,000 1,137,784Texas Eastern Transmission LP (Oil, Gas & Consumable Fuels) . . . . . . . . . . . . . . . . . . . . . . . . . (a) 4.150% 01/15/2048 1,000,000 1,060,278Transocean Pontus Ltd. (Energy Equip. & Svs.). . . . . . . . . . . . . . . . . . . . . . . . . . . . . . . . . . . (a) 6.125% 08/01/2025 1,112,500 1,140,312Williams Cos., Inc. / The (Oil, Gas & Consumable Fuels) . . . . . . . . . . . . . . . . . . . . . . . . . . . . . 3.350% 08/15/2022 1,000,000 1,024,110Williams Cos., Inc. / The (Oil, Gas & Consumable Fuels) . . . . . . . . . . . . . . . . . . . . . . . . . . . . . 3.750% 06/15/2027 1,000,000 1,041,889Williams Cos., Inc. / The (Oil, Gas & Consumable Fuels) . . . . . . . . . . . . . . . . . . . . . . . . . . . . . 5.400% 03/04/2044 1,000,000 1,124,344
26,016,174
FINANCIALS – 25.4%AerCap Ireland Capital DAC / AerCap Global Aviation Trust (Diversified Financial Svs.) . . . . . . . . . 3.300% 01/23/2023 3,000,000 3,073,395American Express Co. (Consumer Finance) . . . . . . . . . . . . . . . . . . . . . . . . . . . . . . . . . . . . . QL + 75 08/03/2023 1,000,000 1,008,415American International Group, Inc. (Insurance) . . . . . . . . . . . . . . . . . . . . . . . . . . . . . . . . . . 3.875% 01/15/2035 2,500,000 2,649,002Bank of America Corp. (Banks) . . . . . . . . . . . . . . . . . . . . . . . . . . . . . . . . . . . . . . . . . . . . 3.875% 08/01/2025 1,000,000 1,073,851Bank of America Corp. (Rate is fixed until 01/23/2025, at which point, the rate becomes QL + 81)
(Banks) . . . . . . . . . . . . . . . . . . . . . . . . . . . . . . . . . . . . . . . . . . . . . . . . . . . . . . . . . (b) 3.366% 01/23/2026 2,000,000 2,090,958Bank of America Corp. (Rate is fixed until 04/24/2037, at which point, the rate becomes QL + 181)
(Banks) . . . . . . . . . . . . . . . . . . . . . . . . . . . . . . . . . . . . . . . . . . . . . . . . . . . . . . . . . (b) 4.244% 04/24/2038 1,000,000 1,150,364Bank of Montreal (Rate is fixed until 12/15/2027, at which point, the rate becomes USSW5 + 143)
(Banks) . . . . . . . . . . . . . . . . . . . . . . . . . . . . . . . . . . . . . . . . . . . . . . . . . . . . . . . . . (b) 3.803% 12/15/2032 2,800,000 2,920,260Berkshire Hathaway, Inc. (Diversified Financial Svs.). . . . . . . . . . . . . . . . . . . . . . . . . . . . . . . 3.125% 03/15/2026 900,000 947,691
Ohio National Fund, Inc. ON Bond Portfolio
Schedule of Investments December 31, 2019
5 (continued)

Corporate Bonds (Continued) Rate Maturity Face Amount Value
FINANCIALS (continued)Citigroup, Inc. (Banks) . . . . . . . . . . . . . . . . . . . . . . . . . . . . . . . . . . . . . . . . . . . . . . . . . . 4.400% 06/10/2025 $2,000,000 $ 2,172,049Citigroup, Inc. (Banks) . . . . . . . . . . . . . . . . . . . . . . . . . . . . . . . . . . . . . . . . . . . . . . . . . . 3.700% 01/12/2026 1,000,000 1,065,456Citigroup, Inc. (Banks) . . . . . . . . . . . . . . . . . . . . . . . . . . . . . . . . . . . . . . . . . . . . . . . . . . 4.450% 09/29/2027 2,000,000 2,200,946Deutsche Bank AG (Capital Markets) . . . . . . . . . . . . . . . . . . . . . . . . . . . . . . . . . . . . . . . . 2.700% 07/13/2020 2,000,000 2,001,377Discover Bank (Rate is fixed until 08/09/2023, at which point, the rate becomes USSW5 + 173)
(Banks) . . . . . . . . . . . . . . . . . . . . . . . . . . . . . . . . . . . . . . . . . . . . . . . . . . . . . . . . . (b) 4.682% 08/09/2028 2,000,000 2,090,000E*TRADE Financial Corp. (Capital Markets) . . . . . . . . . . . . . . . . . . . . . . . . . . . . . . . . . . . . . 2.950% 08/24/2022 1,800,000 1,832,871Ford Motor Credit Co. LLC (Consumer Finance) . . . . . . . . . . . . . . . . . . . . . . . . . . . . . . . . . . 3.157% 08/04/2020 1,400,000 1,405,532Ford Motor Credit Co. LLC (Consumer Finance) . . . . . . . . . . . . . . . . . . . . . . . . . . . . . . . . . . QL + 88 10/12/2021 2,000,000 1,982,839General Motors Financial Co., Inc. (Consumer Finance) . . . . . . . . . . . . . . . . . . . . . . . . . . . . . 3.200% 07/06/2021 2,000,000 2,027,156General Motors Financial Co., Inc. (Consumer Finance) . . . . . . . . . . . . . . . . . . . . . . . . . . . . . QL + 99 01/05/2023 2,000,000 1,988,041General Motors Financial Co., Inc. (Consumer Finance) . . . . . . . . . . . . . . . . . . . . . . . . . . . . . 4.350% 01/17/2027 1,000,000 1,050,180Goldman Sachs Group, Inc. / The (Capital Markets). . . . . . . . . . . . . . . . . . . . . . . . . . . . . . . . 3.750% 05/22/2025 2,000,000 2,121,043Goldman Sachs Group, Inc. / The (Rate is fixed until 04/23/2028, at which point, the rate becomes QL
+ 116) (Capital Markets) . . . . . . . . . . . . . . . . . . . . . . . . . . . . . . . . . . . . . . . . . . . . . . . (b) 3.814% 04/23/2029 2,000,000 2,142,285Intercontinental Exchange, Inc. (Capital Markets). . . . . . . . . . . . . . . . . . . . . . . . . . . . . . . . . 3.750% 12/01/2025 1,000,000 1,076,298Jefferies Group LLC / Jefferies Group Capital Finance, Inc. (Diversified Financial Svs.). . . . . . . . . . 4.850% 01/15/2027 1,800,000 1,986,021JPMorgan Chase & Co. (Banks) . . . . . . . . . . . . . . . . . . . . . . . . . . . . . . . . . . . . . . . . . . . . 3.900% 07/15/2025 2,023,000 2,183,083JPMorgan Chase & Co. (Banks) . . . . . . . . . . . . . . . . . . . . . . . . . . . . . . . . . . . . . . . . . . . . 3.625% 12/01/2027 2,000,000 2,110,754Marsh & McLennan Cos., Inc. (Insurance) . . . . . . . . . . . . . . . . . . . . . . . . . . . . . . . . . . . . . 3.500% 06/03/2024 1,400,000 1,469,606Morgan Stanley (Capital Markets) . . . . . . . . . . . . . . . . . . . . . . . . . . . . . . . . . . . . . . . . . . QL + 140 10/24/2023 1,260,000 1,287,198Morgan Stanley (Capital Markets) . . . . . . . . . . . . . . . . . . . . . . . . . . . . . . . . . . . . . . . . . . 3.950% 04/23/2027 1,000,000 1,071,730Morgan Stanley (Rate is fixed until 01/23/2029, at which point, the rate becomes QL + 163)
(Capital Markets) . . . . . . . . . . . . . . . . . . . . . . . . . . . . . . . . . . . . . . . . . . . . . . . . . . . (b) 4.431% 01/23/2030 2,000,000 2,259,106Nasdaq, Inc. (Capital Markets) . . . . . . . . . . . . . . . . . . . . . . . . . . . . . . . . . . . . . . . . . . . . 3.850% 06/30/2026 2,000,000 2,140,822PNC Bank NA (Banks) . . . . . . . . . . . . . . . . . . . . . . . . . . . . . . . . . . . . . . . . . . . . . . . . . . 2.700% 10/22/2029 2,500,000 2,494,889Progressive Corp. / The (Insurance) . . . . . . . . . . . . . . . . . . . . . . . . . . . . . . . . . . . . . . . . . 2.450% 01/15/2027 900,000 902,770Royal Bank of Scotland Group PLC (Rate is fixed until 11/01/2024, at which point, the rate becomes
H15T5Y + 210) (Banks) . . . . . . . . . . . . . . . . . . . . . . . . . . . . . . . . . . . . . . . . . . . . . . . . (b) 3.754% 11/01/2029 1,200,000 1,224,473Synchrony Financial (Consumer Finance) . . . . . . . . . . . . . . . . . . . . . . . . . . . . . . . . . . . . . . 4.250% 08/15/2024 1,000,000 1,066,463Synchrony Financial (Consumer Finance) . . . . . . . . . . . . . . . . . . . . . . . . . . . . . . . . . . . . . . 5.150% 03/19/2029 2,000,000 2,272,823TD Ameritrade Holding Corp. (Capital Markets) . . . . . . . . . . . . . . . . . . . . . . . . . . . . . . . . . . 3.300% 04/01/2027 2,000,000 2,092,741Teachers Insurance & Annuity Association of America (Insurance) . . . . . . . . . . . . . . . . . . . . . (a) 4.270% 05/15/2047 900,000 1,020,499Truist Bank (Banks). . . . . . . . . . . . . . . . . . . . . . . . . . . . . . . . . . . . . . . . . . . . . . . . . . . . 3.625% 09/16/2025 1,000,000 1,064,791Wells Fargo & Co. (Banks) . . . . . . . . . . . . . . . . . . . . . . . . . . . . . . . . . . . . . . . . . . . . . . . 3.000% 04/22/2026 1,000,000 1,027,230Wells Fargo & Co. (Rate is fixed until 10/30/2029, at which point, the rate becomes QL + 117) (Banks) . (b) 2.879% 10/30/2030 2,000,000 2,010,848Wells Fargo & Co. (Banks) . . . . . . . . . . . . . . . . . . . . . . . . . . . . . . . . . . . . . . . . . . . . . . . 4.650% 11/04/2044 1,000,000 1,172,711Westpac Banking Corp. (Banks). . . . . . . . . . . . . . . . . . . . . . . . . . . . . . . . . . . . . . . . . . . . QL + 57 01/11/2023 1,000,000 1,002,421Westpac Banking Corp. (Rate is fixed until 11/23/2026, at which point, the rate becomes USISDA05 +
224) (Banks). . . . . . . . . . . . . . . . . . . . . . . . . . . . . . . . . . . . . . . . . . . . . . . . . . . . . . . (b) 4.322% 11/23/2031 1,800,000 1,904,07973,835,067
HEALTH CARE – 6.6%AbbVie, Inc. (Biotechnology) . . . . . . . . . . . . . . . . . . . . . . . . . . . . . . . . . . . . . . . . . . . . . . (a) 3.200% 11/21/2029 1,000,000 1,016,674AbbVie, Inc. (Biotechnology) . . . . . . . . . . . . . . . . . . . . . . . . . . . . . . . . . . . . . . . . . . . . . . (a) 4.250% 11/21/2049 3,000,000 3,157,330Bayer U.S. Finance II LLC (Pharmaceuticals) . . . . . . . . . . . . . . . . . . . . . . . . . . . . . . . . . . . . (a) 4.875% 06/25/2048 2,000,000 2,286,198Bristol-Myers Squibb Co. (Pharmaceuticals) . . . . . . . . . . . . . . . . . . . . . . . . . . . . . . . . . . . . (a) 3.875% 08/15/2025 2,000,000 2,162,029CVS Health Corp. (Health Care Providers & Svs.) . . . . . . . . . . . . . . . . . . . . . . . . . . . . . . . . . 4.100% 03/25/2025 3,000,000 3,217,926HCA, Inc. (Health Care Providers & Svs.) . . . . . . . . . . . . . . . . . . . . . . . . . . . . . . . . . . . . . . 5.250% 06/15/2026 1,000,000 1,119,302Quest Diagnostics, Inc. (Health Care Providers & Svs.) . . . . . . . . . . . . . . . . . . . . . . . . . . . . . 2.950% 06/30/2030 3,000,000 3,002,112UnitedHealth Group, Inc. (Health Care Providers & Svs.) . . . . . . . . . . . . . . . . . . . . . . . . . . . . 3.875% 12/15/2028 3,000,000 3,317,191
19,278,762
INDUSTRIALS – 7.9%Air Lease Corp. (Trading Companies & Distributors) . . . . . . . . . . . . . . . . . . . . . . . . . . . . . . . 2.250% 01/15/2023 2,000,000 2,000,519Aircastle Ltd. (Trading Companies & Distributors) . . . . . . . . . . . . . . . . . . . . . . . . . . . . . . . . . 4.125% 05/01/2024 4,000,000 4,199,576Boeing Co. / The (Aerospace & Defense) . . . . . . . . . . . . . . . . . . . . . . . . . . . . . . . . . . . . . . 3.200% 03/01/2029 3,000,000 3,124,445Burlington Northern Santa Fe LLC (Road & Rail) . . . . . . . . . . . . . . . . . . . . . . . . . . . . . . . . . . 4.550% 09/01/2044 900,000 1,069,962FedEx Corp. (Air Freight & Logistics) . . . . . . . . . . . . . . . . . . . . . . . . . . . . . . . . . . . . . . . . . 4.900% 01/15/2034 2,000,000 2,279,743Lockheed Martin Corp. (Aerospace & Defense) . . . . . . . . . . . . . . . . . . . . . . . . . . . . . . . . . . 3.600% 03/01/2035 1,000,000 1,091,375Northrop Grumman Corp. (Aerospace & Defense) . . . . . . . . . . . . . . . . . . . . . . . . . . . . . . . . 2.930% 01/15/2025 2,500,000 2,575,575Parker-Hannifin Corp. (Machinery) . . . . . . . . . . . . . . . . . . . . . . . . . . . . . . . . . . . . . . . . . . 4.200% 11/21/2034 1,400,000 1,547,152Union Pacific Corp. (Road & Rail) . . . . . . . . . . . . . . . . . . . . . . . . . . . . . . . . . . . . . . . . . . . 3.250% 08/15/2025 1,000,000 1,053,245United Rentals North America, Inc. (Trading Companies & Distributors) . . . . . . . . . . . . . . . . . . . 5.250% 01/15/2030 2,000,000 2,152,600Waste Connections, Inc. (Commercial Svs. & Supplies) . . . . . . . . . . . . . . . . . . . . . . . . . . . . . 4.250% 12/01/2028 1,800,000 2,004,748
23,098,940
INFORMATION TECHNOLOGY – 1.7%Apple, Inc. (Tech. Hardware, Storage & Periph.). . . . . . . . . . . . . . . . . . . . . . . . . . . . . . . . . . 2.200% 09/11/2029 1,000,000 979,713Hewlett Packard Enterprise Co. (Tech. Hardware, Storage & Periph.) . . . . . . . . . . . . . . . . . . . . 4.900% 10/15/2025 850,000 943,855
Ohio National Fund, Inc. ON Bond Portfolio (Continued)
Schedule of Investments December 31, 2019
6 (continued)

Corporate Bonds (Continued) Rate Maturity Face Amount Value
INFORMATION TECHNOLOGY (continued)Microsoft Corp. (Software) . . . . . . . . . . . . . . . . . . . . . . . . . . . . . . . . . . . . . . . . . . . . . . . 4.100% 02/06/2037 $ 900,000 $ 1,061,708Microsoft Corp. (Software) . . . . . . . . . . . . . . . . . . . . . . . . . . . . . . . . . . . . . . . . . . . . . . . 4.450% 11/03/2045 900,000 1,123,522Seagate HDD Cayman (Tech. Hardware, Storage & Periph.) . . . . . . . . . . . . . . . . . . . . . . . . . . 4.875% 03/01/2024 900,000 958,876
5,067,674
MATERIALS – 9.3%Anglo American Capital PLC (Metals & Mining) . . . . . . . . . . . . . . . . . . . . . . . . . . . . . . . . . . (a) 4.750% 04/10/2027 1,000,000 1,092,675Anglo American Capital PLC (Metals & Mining) . . . . . . . . . . . . . . . . . . . . . . . . . . . . . . . . . . (a) 4.000% 09/11/2027 900,000 942,041Cemex S.A.B de C.V. (Construction Materials) . . . . . . . . . . . . . . . . . . . . . . . . . . . . . . . . . . . (a) 5.450% 11/19/2029 600,000 627,000Dow Chemical Co. / The (Chemicals) . . . . . . . . . . . . . . . . . . . . . . . . . . . . . . . . . . . . . . . . . 4.250% 10/01/2034 2,000,000 2,188,298Kinross Gold Corp. (Metals & Mining) . . . . . . . . . . . . . . . . . . . . . . . . . . . . . . . . . . . . . . . . 4.500% 07/15/2027 3,000,000 3,142,500Martin Marietta Materials, Inc. (Construction Materials) . . . . . . . . . . . . . . . . . . . . . . . . . . . . 3.500% 12/15/2027 3,000,000 3,111,409Mosaic Co. / The (Chemicals) . . . . . . . . . . . . . . . . . . . . . . . . . . . . . . . . . . . . . . . . . . . . . 4.050% 11/15/2027 3,000,000 3,111,841Nutrien Ltd. (Chemicals). . . . . . . . . . . . . . . . . . . . . . . . . . . . . . . . . . . . . . . . . . . . . . . . . 4.200% 04/01/2029 1,900,000 2,092,562Packaging Corp. of America (Containers & Packaging) . . . . . . . . . . . . . . . . . . . . . . . . . . . . . 3.400% 12/15/2027 2,000,000 2,091,540RPM International, Inc. (Chemicals) . . . . . . . . . . . . . . . . . . . . . . . . . . . . . . . . . . . . . . . . . 4.250% 01/15/2048 3,000,000 2,936,969Steel Dynamics, Inc. (Metals & Mining) . . . . . . . . . . . . . . . . . . . . . . . . . . . . . . . . . . . . . . . 2.800% 12/15/2024 2,000,000 2,010,932Syngenta Finance N.V. (Chemicals). . . . . . . . . . . . . . . . . . . . . . . . . . . . . . . . . . . . . . . . . . (a) 5.182% 04/24/2028 1,000,000 1,076,569Yamana Gold, Inc. (Metals & Mining). . . . . . . . . . . . . . . . . . . . . . . . . . . . . . . . . . . . . . . . . 4.625% 12/15/2027 2,381,000 2,488,192
26,912,528
REAL ESTATE – 4.6%Alexandria Real Estate Equities, Inc. (Equity REIT) . . . . . . . . . . . . . . . . . . . . . . . . . . . . . . . . 3.950% 01/15/2028 1,000,000 1,073,214Crown Castle International Corp. (Equity REIT) . . . . . . . . . . . . . . . . . . . . . . . . . . . . . . . . . . . 4.000% 03/01/2027 1,800,000 1,941,562Federal Realty Investment Trust (Equity REIT) . . . . . . . . . . . . . . . . . . . . . . . . . . . . . . . . . . . 3.250% 07/15/2027 2,000,000 2,071,332Healthcare Realty Trust, Inc. (Equity REIT) . . . . . . . . . . . . . . . . . . . . . . . . . . . . . . . . . . . . . 3.875% 05/01/2025 1,400,000 1,472,116Healthcare Realty Trust, Inc. (Equity REIT) . . . . . . . . . . . . . . . . . . . . . . . . . . . . . . . . . . . . . 3.625% 01/15/2028 1,000,000 1,035,561Healthpeak Properties, Inc. (Equity REIT) . . . . . . . . . . . . . . . . . . . . . . . . . . . . . . . . . . . . . . 4.000% 06/01/2025 1,500,000 1,611,269Highwoods Realty LP (Equity REIT) . . . . . . . . . . . . . . . . . . . . . . . . . . . . . . . . . . . . . . . . . . 4.200% 04/15/2029 2,000,000 2,148,605Welltower, Inc. (Equity REIT) . . . . . . . . . . . . . . . . . . . . . . . . . . . . . . . . . . . . . . . . . . . . . . 4.250% 04/01/2026 1,000,000 1,087,923Welltower, Inc. (Equity REIT) . . . . . . . . . . . . . . . . . . . . . . . . . . . . . . . . . . . . . . . . . . . . . . 2.700% 02/15/2027 1,000,000 1,003,101
13,444,683
UTILITIES – 6.7%AEP Transmission Co. LLC (Electric Utilities) . . . . . . . . . . . . . . . . . . . . . . . . . . . . . . . . . . . . 4.000% 12/01/2046 1,000,000 1,109,783AEP Transmission Co. LLC (Electric Utilities) . . . . . . . . . . . . . . . . . . . . . . . . . . . . . . . . . . . . 3.750% 12/01/2047 1,351,000 1,449,487American Water Capital Corp. (Water Utilities) . . . . . . . . . . . . . . . . . . . . . . . . . . . . . . . . . . 4.300% 12/01/2042 1,400,000 1,559,641Berkshire Hathaway Energy Co. (Multi-Utilities) . . . . . . . . . . . . . . . . . . . . . . . . . . . . . . . . . . 3.250% 04/15/2028 1,900,000 2,006,357Commonwealth Edison Co. (Electric Utilities) . . . . . . . . . . . . . . . . . . . . . . . . . . . . . . . . . . . . 4.350% 11/15/2045 2,000,000 2,339,996Connecticut Light & Power Co. / The (Electric Utilities) . . . . . . . . . . . . . . . . . . . . . . . . . . . . . 4.000% 04/01/2048 1,000,000 1,144,696Duke Energy Corp. (Electric Utilities) . . . . . . . . . . . . . . . . . . . . . . . . . . . . . . . . . . . . . . . . . 3.750% 09/01/2046 1,000,000 1,031,191Eversource Energy (Electric Utilities). . . . . . . . . . . . . . . . . . . . . . . . . . . . . . . . . . . . . . . . . 3.300% 01/15/2028 1,000,000 1,029,343FirstEnergy Transmission LLC (Electric Utilities) . . . . . . . . . . . . . . . . . . . . . . . . . . . . . . . . . . (a) 4.550% 04/01/2049 1,800,000 2,057,045Florida Power & Light Co. (Electric Utilities) . . . . . . . . . . . . . . . . . . . . . . . . . . . . . . . . . . . . 3.150% 10/01/2049 2,000,000 2,015,793Jersey Central Power & Light Co. (Electric Utilities) . . . . . . . . . . . . . . . . . . . . . . . . . . . . . . . (a) 4.300% 01/15/2026 900,000 979,085Public Service Electric & Gas Co. (Multi-Utilities) . . . . . . . . . . . . . . . . . . . . . . . . . . . . . . . . . 3.600% 12/01/2047 1,500,000 1,621,001Southwest Gas Corp. (Gas Utilities). . . . . . . . . . . . . . . . . . . . . . . . . . . . . . . . . . . . . . . . . . 3.875% 04/01/2022 1,000,000 1,031,994
19,375,412Total Corporate Bonds (Cost $246,383,085) . . . . . . . . . . . . . . . . . . . . . . . . . . . . . . . . . . . . . $259,776,183
U.S. Treasury Obligations – 3.8% Rate Maturity Face Amount Value
U.S. Treasury Note . . . . . . . . . . . . . . . . . . . . . . . . . . . . . . . . . . . . . . . . . . . . . . . . . . . . 1.625% 11/15/2022 $9,000,000 $ 9,001,686U.S. Treasury Note . . . . . . . . . . . . . . . . . . . . . . . . . . . . . . . . . . . . . . . . . . . . . . . . . . . . 2.375% 11/15/2049 2,000,000 1,991,012Total U.S. Treasury Obligations (Cost $11,094,278) . . . . . . . . . . . . . . . . . . . . . . . . . . . . . . . . $ 10,992,698
Asset-Backed Securities – 2.7% Rate Maturity Face Amount Value
INDUSTRIALS – 2.7%Air Canada 2017-1 Class B Pass Through Trust . . . . . . . . . . . . . . . . . . . . . . . . . . . . . . . . . . (a) 3.700% 01/15/2026 $2,255,291 $ 2,248,333American Airlines 2015-1 Class B Pass Through Trust . . . . . . . . . . . . . . . . . . . . . . . . . . . . . . 3.700% 05/01/2023 2,869,559 2,888,774United Airlines 2016-1 Class B Pass Through Trust . . . . . . . . . . . . . . . . . . . . . . . . . . . . . . . . 3.650% 01/07/2026 1,568,750 1,592,861United Airlines 2019-2 Class AA Pass Through Trust . . . . . . . . . . . . . . . . . . . . . . . . . . . . . . . 2.700% 05/01/2032 1,000,000 1,002,873Total Asset-Backed Securities (Cost $7,696,045) . . . . . . . . . . . . . . . . . . . . . . . . . . . . . . . . . $ 7,732,841
Sovereign Issues – 1.1% Rate Maturity Face Amount Value
Mexico Government International Bond . . . . . . . . . . . . . . . . . . . . . . . . . . . . . . . . . . . . . . 3.750% 01/11/2028 $3,000,000 $ 3,117,000Total Sovereign Issues (Cost $2,989,301) . . . . . . . . . . . . . . . . . . . . . . . . . . . . . . . . . . . . . . $ 3,117,000
Ohio National Fund, Inc. ON Bond Portfolio (Continued)
Schedule of Investments December 31, 2019
7 (continued)

Money Market Funds – 1.1% Shares Value
State Street Institutional Liquid Reserves Fund Institutional Class, 1.734% . . . . . . . . . . . . . . . . . . . . . . . . . . . . . . . . . . . . . . . . (c) 3,249,260 $ 3,249,584Total Money Market Funds (Cost $3,249,584) . . . . . . . . . . . . . . . . . . . . . . . . . . . . . . . . . . . . . . . . . . . . . . . . . . . . . . . . . . . . . $ 3,249,584Total Investments – 98.1% (Cost $271,412,293) . . . . . . . . . . . . . . . . . . . . . . . . . . . . . . . . . . . . . . . . . . . . . . . . . . . . . . . . . . . . . . (d) $284,868,306Other Assets in Excess of Liabilities – 1.9% . . . . . . . . . . . . . . . . . . . . . . . . . . . . . . . . . . . . . . . . . . . . . . . . . . . . . . . . . . . . . . 5,596,563Net Assets – 100.0% $290,464,869
Percentages are stated as a percent of net assets.Abbreviations:
H15T5Y: U.S. Treasury Yield Curve Rate T-Note Constant Maturity 5 Year, 1.690% at 12/31/2019QL: Quarterly U.S. LIBOR Rate, 1.908% at 12/31/2019USISDA05: USD ICE Swap Rate 11:00am NY 5 Year, 1.690% at 12/31/2019USSW5: USD Swap Semi 30/360 5 Year, 1.729% at 12/31/2019
Footnotes:(a) Security exempt from registration under Regulation D of the Securities Act of 1933. These securities may be resold in transactions exempt from registration,
normally to qualified buyers under Rule 144A. At December 31, 2019, the value of these securities totaled $23,654,348, or 8.1% of the Portfolio’s net assets.(b) Security is a fixed-then-variable rate instrument in which the coupon or dividend rate is fixed until a later specified date, then is adjusted periodically. Rates
stated, including interest rate caps and floors, if any, are those in effect at December 31, 2019.(c) Rate represents the seven-day yield at December 31, 2019.(d) Represents cost for financial reporting purposes, which may differ from cost basis for federal income tax purposes. See also Note 8 of the Notes to Financial
Statements.
The accompanying notes are an integral part of these financial statements.
Ohio National Fund, Inc. ON Bond Portfolio (Continued)
Schedule of Investments December 31, 2019
8

Objective/Strategy
The ON BlackRock Balanced Allocation Portfolio (formerly the ON OmniPortfolio) seeks a high level of long-term total return consistent withpreservation of capital by investing in stocks, bonds, and money marketinstruments.
Performance as of December 31, 2019
Average Annual returnsOne year 29.29%Five years 8.53%Ten years 10.36%
Past performance does not guarantee future results. The performance dataquoted represents past performance and current returns may be lower or higher.Total return figures include change in share price and reinvestment of dividendsand capital gains. The investment return and principal value will fluctuate so thatan investor’s shares, when redeemed, may be worth more or less than the originalcost. To obtain performance information up to the most recent month end, calltoll-free 1-877-781-6392.
The Portfolio is not open to direct retail investment. Beneficial interest in shares isobtained solely by purchase of variable life insurance policies and variable annuitycontracts. Actual performance results for variable annuity and variable universallife contracts will be lower due to contract charges. Consult your contract forapplicable charges.
Total expense ratio is 0.53% per the Fund’s prospectus dated November 22, 2019.Additional information pertaining to the Portfolio’s expense ratio as ofDecember 31, 2019 can be found in the Portfolio’s Financial Highlights.
Comments from Sub-Adviser/Adviser
Q. How did the Portfolio perform in comparison to its benchmark duringthe reporting period?
A. For the year ended December 31, 2019, the Portfolio returned 29.29%versus 31.49% for its benchmark, the S&P 500 Index. The Portfolio’ssecondary benchmark, which is comprised of 70% S&P 500 Index and30% ICE BofA Merrill Lynch U.S. Corporate Master Index, returned26.30% for the year-ended December 31, 2019.
Effective February 1, 2019, BlackRock Investment Management, LLC(“BlackRock”) replaced the Portfolio’s previous sub-adviser, SuffolkCapital Management, LLC (“Suffolk”). In conjunction with the change insub-adviser, the name of the Portfolio was changed from ON OmniPortfolio to ON BlackRock Balanced Allocation Portfolio. The Portfolio’sprimary and secondary benchmarks were unchanged. The fixed incomesleeve of the Portfolio was managed throughout the year by the Fund’sadviser, Ohio National Investments, Inc. (�ONI�).
For the period from January 1, 2019 to January 31, 2019 (the “firstone-month period”), the Portfolio returned 10.84% versus 8.01% for theS&P 500 Index and 6.24% for the secondary benchmark, respectively.
For the period from February 1, 2019 to December 31, 2019 (the “lattereleven-month period”), the Portfolio returned 16.65% versus 21.73% forthe S&P 500 Index and 18.88% for the secondary benchmark,respectively.
Q. Were there specific market conditions, investment strategies, ortechniques that materially affected the Portfolio’s benchmark-relativeperformance during the reporting period?
A. Suffolk/ONI: For the first one-month period, there were no marketconditions, investment strategies, or techniques that materially affectedthe Portfolio’s benchmark-relative performance.
A. BlackRock/ONI: After outperforming its benchmark during the firstfew months of the latter eleven-month period, the Portfolio waschallenged through the remainder of the year, underperforming thebenchmark in each of the last three quarters. Despite driving theoutperformance earlier in the year, the Portfolio’s trend- and sentiment-based insights struggled considerably during the latter half of the yearand were responsible for the bulk of the Portfolio’s underperformance. Aseries of inflection points, largely motivated by shifts in global tradeconversations and central bank policy, created a difficult environmentfor the Portfolio’s trend-based insights. Similarly, these sharp,macro-driven inflection points often resulted in a disconnect betweenstock returns and company-specific sentiment, creating a challengingenvironment for the Portfolio’s sentiment insights. Cross-marketsentiment insights struggled in particular, specifically those seeking tocapture the sentiment of informed bond and credit default swapinvestors.
Investment insights designed to evaluate company fundamentalshindered relative returns considerably through the end of the thirdquarter. Most specifically, insights seeking to identify relative valueopportunities were challenged early in the year, as investors sought outspeculative growth opportunities at the expense of companyfundamentals. In the final months of the year, investor mentality shiftedas they began to seek out pockets of relative value, leading to a slightperformance improvement for this group of signals. Despite the modestrebound in performance late in the year, in aggregate, the Portfolio’srelative value insights were significant detractors from relative returnsfor the latter eleven-month period. Also evaluating companyfundamentals, the Portfolio’s quality insights were mixed throughout theperiod. Though this group of insights detracted modestly in aggregate,struggling somewhat in the final months of the year, select signals addedmeaningfully to relative returns and provided ballast to performanceamong fundamental signals. Stronger performance among many of thePortfolio’s quality insights was unsurprising, given investor preferencefor sustainable, high-quality businesses, amidst increased marketuncertainty.
As it relates to the fixed income sleeve, the Portfolio benefited fromdeclining interest rates and tighter corporate bond spreads during theperiod. The Portfolio’s exposure to lower quality corporate bondsbenefited performance versus the fixed income portion of thebenchmark. (1)
Q. How did sector allocation and security selection each impact thePortfolio’s performance relative to its benchmark? For sector allocation,were there any factors that impacted the benchmark’s performancemore significantly than the Portfolio’s performance? For securityselection, was there anything specific regarding the Portfolio’s strategythat caused deviation from the benchmark?
A. Suffolk/ONI: For the first one-month period, both sector allocationand security selection contributed to relative outperformance during theperiod. Stock selection in Health Care and Consumer Discretionarycontributed to relative outperformance, while stock selection inCommunication Services detracted from relative performance. For thefixed income portion of the Portfolio, the Information Technology, Utilitiesand Energy sectors had positive contributions to performance, while theConsumer Discretionary sector detracted from performance. Securityselection in the Energy, Information Technology and Financials sectorsalso contributed to performance.
A. BlackRock/ONI: The portfolio management team targets a relativelysector-neutral approach and seeks to derive the majority of its alphafrom security selection. That being said, modest underweights to theEnergy and Real Estate sectors throughout much of the lattereleven-month period contributed to relative performance, as bothsectors underperformed the broader market. On the other hand, modestoverweights to the Health Care and Industrials sectors detracted from
Ohio National Fund, Inc. ON BlackRock Balanced Allocation Portfolio (Unaudited)
9 (continued)

performance, given the weaker performance of these areas. The majorityof relative performance was driven by security selection decisions.Stock selection was additive in the Health Care sector, especially amongpharmaceutical and biotechnology companies. In contrast, selectionwithin the Financials sector, in particular the capital markets industry,was a notable detractor from relative performance. Stock selection in theCommunication Services and Industrials sectors, especially among roadand rail companies, also hindered relative returns. (1)
For the fixed income portion of the Portfolio, the Consumer Staples,Financial, Materials, and Energy sectors had positive contributions toperformance, while the Communication Services and ConsumerDiscretionary sectors detracted from performance relative to the fixedincome benchmark. Security selection in each of these sectorscontributed to the relative performance. The fixed income portion of thePortfolio underperformed the S&P 500 Index for all performanceperiods. (1)
Q. Which holdings contributed the most to, and detracted the most from,the Portfolio’s benchmark-relative performance?
A. Suffolk/ONI: Top equity contributors for the first one-month periodincluded Sage Therapeutics, Inc., as it announced positive results for aPhase 3 trial in postpartum depression. Celgene Corp. contributed, as itwas acquired by Bristol-Myers Squibb Co. Aerie Pharmaceuticals, Inc.,another top contributor, expects to achieve its revenue target forRhopressa, its new glaucoma drug, and announced positive pilot studyresults for Rhopressa in Japan, a significant new market opportunity. Topcontributors for the fixed income portion of the Portfolio for the firstone-month period included Canadian Natural Resources Ltd. 4.950% due2047, The Williams Cos., Inc. 5.400% due 2044, and Synchrony Financial4.250% due 2024.
Alphabet, Inc. Class C detracted most from relative performance for thefirst one-month period, as there were concerns Google would lose itsshare in online advertising to Amazon.com, Inc. (“Amazon”) and mightwithdraw its news service in Europe if a “snippet” tax were implemented.A position in Apple, Inc., underweight due to expected phone pricingcuts, was another relative detractor. A third relative detractor wasAmazon, as the Portfolio was underweight due to concerns of weakerU.S. e-commerce market share gain and belief that increased regulationof e-commerce in India would negatively impact growth. For the fixedincome portion of the Portfolio, the largest detractors for the firstone-month period were Charter Communications Operating LLC / CharterCommunications Operating Capital Corp. 5.050% due 2029,Intercontinental Exchange, Inc. 2.750% due 2020, and KLA-Tencor Corp.3.375% due 2019.
A. BlackRock/ONI: An underweighted Pfizer, Inc. position was thelargest contributor to relative performance for the latter eleven-monthperiod, as the pharmaceuticals company struggled during much of 2019.Pfizer’s stock price declined on increasing concerns around the potentialof restrictive drug pricing legislation. Additionally, the stock pricedropped when the company announced in late July that it would becombining parts of its business with Mylan N.V. The Portfolio’spositioning in Biogen, Inc. was also beneficial to results. An underweightto the stock early in the year was additive, as the share price plummetedon news that its experimental Alzheimer’s drug was unlikely to beeffective, and that research on the drug was being stopped. Moving theposition to an overweight towards the end of the year further bolsteredresults, as Biogen’s shares spiked on news that there were new,promising results from research on the Alzheimer’s drug. News that thecompany was requesting approval from the Federal Drug Administration(“FDA”) on the experimental therapy led to renewed hope amonginvestors and a resulting surge in the stock price. The Portfolio’spositioning in Medtronic PLC (“Medtronic”) further supported relativeperformance. An overweight position in the middle of the year wasparticularly beneficial, as Medtronic’s stock price climbed towards the
end of second quarter and into the third. Encouraging forward guidancefrom the company, along with positive earnings announcements,supported the company’s share price. Several promising researchprojects, including one project to develop memory chips enablingimprovement in human memory, helped support investor sentiment onthe future of the company as well. Top contributors on the fixed incomeportion of the Portfolio included American International Group, Inc.3.875% due 2035, Anheuser-Busch Cos. LLC / Anheuser-Busch InBevWorldwide, Inc. 4.700% due 2036, and Kinross Gold Corp. 4.500% due2027. (1)
In contrast, the Portfolio’s positioning in ConocoPhillips was the topindividual detractor for the latter eleven-month period. Maintaining anoverweight to the company through the end of the second quarter andmuch of the third was a drag on relative returns, as downward pressureon oil prices created concerns around the future profitability of thecompany. An unsuccessful exploration-drilling project in Louisiana wasan additional hit to the company, as the expensive operation did not yieldviable oil reserves, and the company was forced to sell the acreage. In asimilar vein, the Portfolio’s overweight to Halliburton Co. during the firsthalf of the year further dampened relative returns, as there wassignificant downward pricing pressure on oilfield servicing and frackingdue to depressed oil prices and exploration and production activity. Thispricing pressure and reduced activity caused share prices to slump.Lastly, the Portfolio’s overweight position in The Charles Schwab Corp.was a persistent drag on results throughout the period. The companystruggled amidst increased pricing pressure that some analysts believecould act as a headwind and stifle company revenue growth goingforward. For the fixed income portion of the Portfolio, the largestdetractors were AEP Transmission Co. LLC 3.750% due 2047, ExpediaGroup, Inc. 3.250% due 2030, and Public Service Electric & Gas Co.3.600% due 2047. (1)
Q. How did the Portfolio’s use of derivative instruments and initialpublic offerings (IPOs), if any, impact performance?
A. Suffolk/ONI: The Portfolio did not hold any derivatives or participatein any IPOs during the first one-month period.
A. BlackRock/ONI: Pursuant to the Portfolio’s investment strategy,futures contracts were used in the latter eleven-month period to equitizecash and prevent a cash drag on performance. The futures did notmeaningfully impact relative performance, however, due to their indexcharacteristics and size in relation to the Portfolio’s net assets. ThePortfolio participated in two IPOs during the latter eleven-month period,which detracted 11 basis points relative to the benchmark. (1)
(1) The Portfolio’s composition is subject to change. Holdings and weightings areas of December 31, 2019.
Ohio National Fund, Inc. ON BlackRock Balanced Allocation Portfolio (Unaudited) (Continued)
10 (continued)

Change in Value of $10,000 Investment
ON BlackRock Balanced Allocation Portfolio (A)S&P 500 Index (B)70% S&P 500 Index/30% ICE BofA Merrill Lynch U.S. CorporateMaster Index (C)
5,000
10,000
15,000
20,000
25,000
30,000
35,000
$40,000
6/1
012
/10 6
/1112
/11 6
/1212
/12 6
/1312
/13 6
/1412
/14 6
/1512
/15 6
/1612
/16 6
/1712
/17 6
/1812
/18 6
/19
12/3
1/09
12/1
9
$35,666 (B)
$29,167 (C)$26,795 (A)
Hypothetical illustration based on past performance. Future performance will vary.The Portfolio’s returns reflect reinvested dividends. The Portfolio’s holdings maydiffer significantly from the securities in the index. The index is unmanaged andtherefore does not reflect the cost of portfolio management and accounting.
The S&P 500 Index is a capitalization-weighted index designed to measureperformance of the broad domestic market through changes in the aggregatemarket value of 500 stocks representing all major industries. The index presentedincludes the effects of reinvested dividends.
The ICE BofA Merrill Lynch U.S. Corporate Master Index tracks the performance ofall U.S. dollar-denominated, investment grade corporate public debt issued in theU.S. domestic bond market. Qualifying bonds must have an investment grade rating(based on an average of Moody’s, S&P, and Fitch). In addition, qualifying securitiesmust have at least one year remaining term to maturity, a fixed coupon schedule,and a minimum amount outstanding of $250 million.
Past performance is no guarantee of future results. Redemption of fund sharescould have tax implications unique to each shareholder.
Portfolio Composition as of December 31, 2019 (1)
% of Net AssetsCommon Stocks (4) 72.6Corporate Bonds (4) 25.9Asset-Backed Securities (4) 0.2Rights (4) 0.0Money Market Funds and
Other Net Assets 1.3100.0
Top 10 Portfolio Holdings as of December 31, 2019 (1) (2) (3)
% of Net Assets1. Microsoft Corp. 3.72. Apple, Inc. 3.43. Amazon.com, Inc. 2.44. Mastercard, Inc. Class A 1.55. Facebook, Inc. Class A 1.56. Johnson & Johnson 1.47. Exxon Mobil Corp. 1.48. Berkshire Hathaway, Inc. Class B 1.49. Alphabet, Inc. Class C 1.1
10. Alphabet, Inc. Class A 1.1
(1) Composition of Portfolio subject to change.(2) Short-term investments have been excluded from the list of Top 10 Portfolio Holdings.(3) Top 10 Portfolio Holdings is presented at an individual security level. Total investment exposure by issuer may be higher.(4) Sectors (Common Stocks, Corporate Bonds, Asset-Backed Securities, Rights):
% of Net AssetsInformation Technology 17.8Financials 16.7Health Care 13.2Communication Services 9.3Industrials 8.6Consumer Discretionary 8.5Consumer Staples 7.0Utilities 6.3Energy 5.6Real Estate 2.9Materials 2.8
98.7
Ohio National Fund, Inc. ON BlackRock Balanced Allocation Portfolio (Unaudited) (Continued)
11

Common Stocks – 72.6% Shares Value
COMMUNICATION SERVICES – 7.8%Activision Blizzard, Inc. (Entertainment) . . . . . . . . . . . . . . . . . . . . . . . . . . . . . . . . . . . . . . . . . . . . . . . . . . . . . . . . . . . . 1,189 $ 70,650Alphabet, Inc. Class A (Interactive Media & Svs.) . . . . . . . . . . . . . . . . . . . . . . . . . . . . . . . . . . . . . . . . . . . . . . . . . . . . . . (a) 4,278 5,729,910Alphabet, Inc. Class C (Interactive Media & Svs.) . . . . . . . . . . . . . . . . . . . . . . . . . . . . . . . . . . . . . . . . . . . . . . . . . . . . . . (a) 4,468 5,973,805AMC Networks, Inc. Class A (Media) . . . . . . . . . . . . . . . . . . . . . . . . . . . . . . . . . . . . . . . . . . . . . . . . . . . . . . . . . . . . . (a) 16,166 638,557AT&T, Inc. (Diversified Telecom. Svs.) . . . . . . . . . . . . . . . . . . . . . . . . . . . . . . . . . . . . . . . . . . . . . . . . . . . . . . . . . . . . . 78,801 3,079,543CenturyLink, Inc. (Diversified Telecom. Svs.) . . . . . . . . . . . . . . . . . . . . . . . . . . . . . . . . . . . . . . . . . . . . . . . . . . . . . . . . . 19,885 262,681Cinemark Holdings, Inc. (Entertainment) . . . . . . . . . . . . . . . . . . . . . . . . . . . . . . . . . . . . . . . . . . . . . . . . . . . . . . . . . . . 5,609 189,865Comcast Corp. Class A (Media) . . . . . . . . . . . . . . . . . . . . . . . . . . . . . . . . . . . . . . . . . . . . . . . . . . . . . . . . . . . . . . . . . 42,398 1,906,638Discovery, Inc. Class A (Media) . . . . . . . . . . . . . . . . . . . . . . . . . . . . . . . . . . . . . . . . . . . . . . . . . . . . . . . . . . . . . . . . . (a) 25,553 836,605Electronic Arts, Inc. (Entertainment) . . . . . . . . . . . . . . . . . . . . . . . . . . . . . . . . . . . . . . . . . . . . . . . . . . . . . . . . . . . . . . (a) 4,957 532,927Facebook, Inc. Class A (Interactive Media & Svs.) . . . . . . . . . . . . . . . . . . . . . . . . . . . . . . . . . . . . . . . . . . . . . . . . . . . . . (a) 39,089 8,023,017Interpublic Group of Cos., Inc. / The (Media) . . . . . . . . . . . . . . . . . . . . . . . . . . . . . . . . . . . . . . . . . . . . . . . . . . . . . . . . . 77,221 1,783,805Live Nation Entertainment, Inc. (Entertainment) . . . . . . . . . . . . . . . . . . . . . . . . . . . . . . . . . . . . . . . . . . . . . . . . . . . . . . . (a) 3,009 215,053Netflix, Inc. (Entertainment) . . . . . . . . . . . . . . . . . . . . . . . . . . . . . . . . . . . . . . . . . . . . . . . . . . . . . . . . . . . . . . . . . . . (a) 1,090 352,691Pinterest, Inc. Class A (Interactive Media & Svs.) . . . . . . . . . . . . . . . . . . . . . . . . . . . . . . . . . . . . . . . . . . . . . . . . . . . . . . (a) 8,621 160,696Sirius XM Holdings, Inc. (Media) . . . . . . . . . . . . . . . . . . . . . . . . . . . . . . . . . . . . . . . . . . . . . . . . . . . . . . . . . . . . . . . . 258,574 1,848,804Take-Two Interactive Software, Inc. (Entertainment) . . . . . . . . . . . . . . . . . . . . . . . . . . . . . . . . . . . . . . . . . . . . . . . . . . . . (a) 4,912 601,376Telephone & Data Systems, Inc. (Wireless Telecom. Svs.) . . . . . . . . . . . . . . . . . . . . . . . . . . . . . . . . . . . . . . . . . . . . . . . . 29,185 742,175TripAdvisor, Inc. (Interactive Media & Svs.) . . . . . . . . . . . . . . . . . . . . . . . . . . . . . . . . . . . . . . . . . . . . . . . . . . . . . . . . . 7,332 222,746Twitter, Inc. (Interactive Media & Svs.) . . . . . . . . . . . . . . . . . . . . . . . . . . . . . . . . . . . . . . . . . . . . . . . . . . . . . . . . . . . . (a) 9,434 302,360United States Cellular Corp. (Wireless Telecom. Svs.) . . . . . . . . . . . . . . . . . . . . . . . . . . . . . . . . . . . . . . . . . . . . . . . . . . . (a) 14,743 534,139Verizon Communications, Inc. (Diversified Telecom. Svs.) . . . . . . . . . . . . . . . . . . . . . . . . . . . . . . . . . . . . . . . . . . . . . . . . . 75,440 4,632,016ViacomCBS, Inc. Class A (Media) . . . . . . . . . . . . . . . . . . . . . . . . . . . . . . . . . . . . . . . . . . . . . . . . . . . . . . . . . . . . . . . . 2,342 105,086ViacomCBS, Inc. Class B (Media) . . . . . . . . . . . . . . . . . . . . . . . . . . . . . . . . . . . . . . . . . . . . . . . . . . . . . . . . . . . . . . . . 20,941 878,894Walt Disney Co. / The (Entertainment) . . . . . . . . . . . . . . . . . . . . . . . . . . . . . . . . . . . . . . . . . . . . . . . . . . . . . . . . . . . . . 14,850 2,147,756Yelp, Inc. (Interactive Media & Svs.) . . . . . . . . . . . . . . . . . . . . . . . . . . . . . . . . . . . . . . . . . . . . . . . . . . . . . . . . . . . . . . (a) 7,888 274,739Zynga, Inc. Class A (Entertainment) . . . . . . . . . . . . . . . . . . . . . . . . . . . . . . . . . . . . . . . . . . . . . . . . . . . . . . . . . . . . . . (a) 71,634 438,400
42,484,934
CONSUMER DISCRETIONARY – 7.0%Alibaba Group Holding Ltd. – ADR (Internet & Direct Marketing Retail) . . . . . . . . . . . . . . . . . . . . . . . . . . . . . . . . . . . . . . . . (a) 950 201,495Amazon.com, Inc. (Internet & Direct Marketing Retail) . . . . . . . . . . . . . . . . . . . . . . . . . . . . . . . . . . . . . . . . . . . . . . . . . . (a) 7,119 13,154,773AutoNation, Inc. (Specialty Retail) . . . . . . . . . . . . . . . . . . . . . . . . . . . . . . . . . . . . . . . . . . . . . . . . . . . . . . . . . . . . . . . (a) 1,318 64,094Booking Holdings, Inc. (Internet & Direct Marketing Retail). . . . . . . . . . . . . . . . . . . . . . . . . . . . . . . . . . . . . . . . . . . . . . . . (a) 38 78,042Boyd Gaming Corp. (Hotels, Restaurants & Leisure) . . . . . . . . . . . . . . . . . . . . . . . . . . . . . . . . . . . . . . . . . . . . . . . . . . . . 12,985 388,771Carnival Corp. (Hotels, Restaurants & Leisure). . . . . . . . . . . . . . . . . . . . . . . . . . . . . . . . . . . . . . . . . . . . . . . . . . . . . . . . 17,676 898,471Choice Hotels International, Inc. (Hotels, Restaurants & Leisure) . . . . . . . . . . . . . . . . . . . . . . . . . . . . . . . . . . . . . . . . . . . . 15,103 1,562,103D.R. Horton, Inc. (Household Durables) . . . . . . . . . . . . . . . . . . . . . . . . . . . . . . . . . . . . . . . . . . . . . . . . . . . . . . . . . . . . 16,858 889,259Darden Restaurants, Inc. (Hotels, Restaurants & Leisure). . . . . . . . . . . . . . . . . . . . . . . . . . . . . . . . . . . . . . . . . . . . . . . . . 17,286 1,884,347Dollar General Corp. (Multiline Retail) . . . . . . . . . . . . . . . . . . . . . . . . . . . . . . . . . . . . . . . . . . . . . . . . . . . . . . . . . . . . . 12,435 1,939,611Dunkin’ Brands Group, Inc. (Hotels, Restaurants & Leisure) . . . . . . . . . . . . . . . . . . . . . . . . . . . . . . . . . . . . . . . . . . . . . . . 493 37,241Extended Stay America, Inc. (Hotels, Restaurants & Leisure) . . . . . . . . . . . . . . . . . . . . . . . . . . . . . . . . . . . . . . . . . . . . . . 8,367 124,334Ford Motor Co. (Automobiles) . . . . . . . . . . . . . . . . . . . . . . . . . . . . . . . . . . . . . . . . . . . . . . . . . . . . . . . . . . . . . . . . . . 102,907 957,035General Motors Co. (Automobiles) . . . . . . . . . . . . . . . . . . . . . . . . . . . . . . . . . . . . . . . . . . . . . . . . . . . . . . . . . . . . . . . 32,783 1,199,858Gentex Corp. (Auto Components) . . . . . . . . . . . . . . . . . . . . . . . . . . . . . . . . . . . . . . . . . . . . . . . . . . . . . . . . . . . . . . . . 1,760 51,005Goodyear Tire & Rubber Co. / The (Auto Components) . . . . . . . . . . . . . . . . . . . . . . . . . . . . . . . . . . . . . . . . . . . . . . . . . . . 32,888 511,573H&R Block, Inc. (Diversified Consumer Svs.) . . . . . . . . . . . . . . . . . . . . . . . . . . . . . . . . . . . . . . . . . . . . . . . . . . . . . . . . . 26,408 620,060Harley-Davidson, Inc. (Automobiles) . . . . . . . . . . . . . . . . . . . . . . . . . . . . . . . . . . . . . . . . . . . . . . . . . . . . . . . . . . . . . . 898 33,397Home Depot, Inc. / The (Specialty Retail) . . . . . . . . . . . . . . . . . . . . . . . . . . . . . . . . . . . . . . . . . . . . . . . . . . . . . . . . . . . 22,097 4,825,543McDonald’s Corp. (Hotels, Restaurants & Leisure) . . . . . . . . . . . . . . . . . . . . . . . . . . . . . . . . . . . . . . . . . . . . . . . . . . . . . 15,919 3,145,754NIKE, Inc. Class B (Textiles, Apparel & Luxury Goods) . . . . . . . . . . . . . . . . . . . . . . . . . . . . . . . . . . . . . . . . . . . . . . . . . . . 30,248 3,064,425O’Reilly Automotive, Inc. (Specialty Retail) . . . . . . . . . . . . . . . . . . . . . . . . . . . . . . . . . . . . . . . . . . . . . . . . . . . . . . . . . . (a) 642 281,363Penn National Gaming, Inc. (Hotels, Restaurants & Leisure) . . . . . . . . . . . . . . . . . . . . . . . . . . . . . . . . . . . . . . . . . . . . . . . (a) 5,424 138,637Pool Corp. (Distributors). . . . . . . . . . . . . . . . . . . . . . . . . . . . . . . . . . . . . . . . . . . . . . . . . . . . . . . . . . . . . . . . . . . . . . 271 57,555Ralph Lauren Corp. (Textiles, Apparel & Luxury Goods) . . . . . . . . . . . . . . . . . . . . . . . . . . . . . . . . . . . . . . . . . . . . . . . . . . 3,510 411,442Ross Stores, Inc. (Specialty Retail) . . . . . . . . . . . . . . . . . . . . . . . . . . . . . . . . . . . . . . . . . . . . . . . . . . . . . . . . . . . . . . . 899 104,661Target Corp. (Multiline Retail) . . . . . . . . . . . . . . . . . . . . . . . . . . . . . . . . . . . . . . . . . . . . . . . . . . . . . . . . . . . . . . . . . . 7,420 951,318Texas Roadhouse, Inc. (Hotels, Restaurants & Leisure) . . . . . . . . . . . . . . . . . . . . . . . . . . . . . . . . . . . . . . . . . . . . . . . . . . 6,880 387,482Wyndham Destinations, Inc. (Hotels, Restaurants & Leisure). . . . . . . . . . . . . . . . . . . . . . . . . . . . . . . . . . . . . . . . . . . . . . . 1,419 73,348
38,036,997
CONSUMER STAPLES – 4.9%Altria Group, Inc. (Tobacco) . . . . . . . . . . . . . . . . . . . . . . . . . . . . . . . . . . . . . . . . . . . . . . . . . . . . . . . . . . . . . . . . . . . 25,413 1,268,363Church & Dwight Co., Inc. (Household Products) . . . . . . . . . . . . . . . . . . . . . . . . . . . . . . . . . . . . . . . . . . . . . . . . . . . . . . 17,446 1,227,152Coca-Cola Co. / The (Beverages) . . . . . . . . . . . . . . . . . . . . . . . . . . . . . . . . . . . . . . . . . . . . . . . . . . . . . . . . . . . . . . . . 24,307 1,345,392Coca-Cola European Partners PLC (Beverages) . . . . . . . . . . . . . . . . . . . . . . . . . . . . . . . . . . . . . . . . . . . . . . . . . . . . . . . 7,076 360,027Costco Wholesale Corp. (Food & Staples Retailing). . . . . . . . . . . . . . . . . . . . . . . . . . . . . . . . . . . . . . . . . . . . . . . . . . . . . 18,008 5,292,911Estee Lauder Cos., Inc. / The Class A (Personal Products) . . . . . . . . . . . . . . . . . . . . . . . . . . . . . . . . . . . . . . . . . . . . . . . . 14,349 2,963,643Hershey Co. / The (Food Products) . . . . . . . . . . . . . . . . . . . . . . . . . . . . . . . . . . . . . . . . . . . . . . . . . . . . . . . . . . . . . . . 22,587 3,319,837
Ohio National Fund, Inc. ON BlackRock Balanced Allocation Portfolio
Schedule of Investments December 31, 2019
12 (continued)

Common Stocks (Continued) Shares Value
CONSUMER STAPLES (continued)Hormel Foods Corp. (Food Products) . . . . . . . . . . . . . . . . . . . . . . . . . . . . . . . . . . . . . . . . . . . . . . . . . . . . . . . . . . . . . . 10,462 $ 471,941Molson Coors Brewing Co. Class B (Beverages) . . . . . . . . . . . . . . . . . . . . . . . . . . . . . . . . . . . . . . . . . . . . . . . . . . . . . . 6,453 347,817Monster Beverage Corp. (Beverages) . . . . . . . . . . . . . . . . . . . . . . . . . . . . . . . . . . . . . . . . . . . . . . . . . . . . . . . . . . . . . (a) 7,411 470,969PepsiCo, Inc. (Beverages) . . . . . . . . . . . . . . . . . . . . . . . . . . . . . . . . . . . . . . . . . . . . . . . . . . . . . . . . . . . . . . . . . . . . 22,333 3,052,251Performance Food Group Co. (Food & Staples Retailing) . . . . . . . . . . . . . . . . . . . . . . . . . . . . . . . . . . . . . . . . . . . . . . . . . (a) 3,855 198,455Philip Morris International, Inc. (Tobacco) . . . . . . . . . . . . . . . . . . . . . . . . . . . . . . . . . . . . . . . . . . . . . . . . . . . . . . . . . . 8,901 757,386Procter & Gamble Co. / The (Household Products) . . . . . . . . . . . . . . . . . . . . . . . . . . . . . . . . . . . . . . . . . . . . . . . . . . . . . 36,954 4,615,555Walmart, Inc. (Food & Staples Retailing) . . . . . . . . . . . . . . . . . . . . . . . . . . . . . . . . . . . . . . . . . . . . . . . . . . . . . . . . . . . 9,682 1,150,609
26,842,308
ENERGY – 2.9%ConocoPhillips (Oil, Gas & Consumable Fuels) . . . . . . . . . . . . . . . . . . . . . . . . . . . . . . . . . . . . . . . . . . . . . . . . . . . . . . . . 14,220 924,726Continental Resources, Inc. (Oil, Gas & Consumable Fuels). . . . . . . . . . . . . . . . . . . . . . . . . . . . . . . . . . . . . . . . . . . . . . . . 8,316 285,239Devon Energy Corp. (Oil, Gas & Consumable Fuels). . . . . . . . . . . . . . . . . . . . . . . . . . . . . . . . . . . . . . . . . . . . . . . . . . . . . 3,429 89,051EOG Resources, Inc. (Oil, Gas & Consumable Fuels) . . . . . . . . . . . . . . . . . . . . . . . . . . . . . . . . . . . . . . . . . . . . . . . . . . . . 27,147 2,273,833Exxon Mobil Corp. (Oil, Gas & Consumable Fuels) . . . . . . . . . . . . . . . . . . . . . . . . . . . . . . . . . . . . . . . . . . . . . . . . . . . . . . 109,865 7,666,380Marathon Oil Corp. (Oil, Gas & Consumable Fuels) . . . . . . . . . . . . . . . . . . . . . . . . . . . . . . . . . . . . . . . . . . . . . . . . . . . . . 7,110 96,554Marathon Petroleum Corp. (Oil, Gas & Consumable Fuels) . . . . . . . . . . . . . . . . . . . . . . . . . . . . . . . . . . . . . . . . . . . . . . . . 27,031 1,628,618National Oilwell Varco, Inc. (Energy Equip. & Svs.) . . . . . . . . . . . . . . . . . . . . . . . . . . . . . . . . . . . . . . . . . . . . . . . . . . . . . 2,153 53,933Patterson-UTI Energy, Inc. (Energy Equip. & Svs.). . . . . . . . . . . . . . . . . . . . . . . . . . . . . . . . . . . . . . . . . . . . . . . . . . . . . . 10,136 106,428Phillips 66 (Oil, Gas & Consumable Fuels) . . . . . . . . . . . . . . . . . . . . . . . . . . . . . . . . . . . . . . . . . . . . . . . . . . . . . . . . . . . 3,560 396,619SRC Energy, Inc. (Oil, Gas & Consumable Fuels) . . . . . . . . . . . . . . . . . . . . . . . . . . . . . . . . . . . . . . . . . . . . . . . . . . . . . . . (a) 93,855 386,683TechnipFMC PLC (Energy Equip. & Svs.). . . . . . . . . . . . . . . . . . . . . . . . . . . . . . . . . . . . . . . . . . . . . . . . . . . . . . . . . . . . 5,635 120,814Transocean Ltd. (Energy Equip. & Svs.) . . . . . . . . . . . . . . . . . . . . . . . . . . . . . . . . . . . . . . . . . . . . . . . . . . . . . . . . . . . . (a) 26,286 180,848Valero Energy Corp. (Oil, Gas & Consumable Fuels). . . . . . . . . . . . . . . . . . . . . . . . . . . . . . . . . . . . . . . . . . . . . . . . . . . . . 10,919 1,022,564Williams Cos., Inc. / The (Oil, Gas & Consumable Fuels) . . . . . . . . . . . . . . . . . . . . . . . . . . . . . . . . . . . . . . . . . . . . . . . . . . 30,304 718,811
15,951,101
FINANCIALS – 9.9%Affiliated Managers Group, Inc. (Capital Markets) . . . . . . . . . . . . . . . . . . . . . . . . . . . . . . . . . . . . . . . . . . . . . . . . . . . . . 5,517 467,511Aflac, Inc. (Insurance). . . . . . . . . . . . . . . . . . . . . . . . . . . . . . . . . . . . . . . . . . . . . . . . . . . . . . . . . . . . . . . . . . . . . . . 3,053 161,504Allstate Corp. / The (Insurance) . . . . . . . . . . . . . . . . . . . . . . . . . . . . . . . . . . . . . . . . . . . . . . . . . . . . . . . . . . . . . . . . . 20,829 2,342,221Ally Financial, Inc. (Consumer Finance) . . . . . . . . . . . . . . . . . . . . . . . . . . . . . . . . . . . . . . . . . . . . . . . . . . . . . . . . . . . . 25,127 767,881American Express Co. (Consumer Finance). . . . . . . . . . . . . . . . . . . . . . . . . . . . . . . . . . . . . . . . . . . . . . . . . . . . . . . . . . 16,265 2,024,830Aon PLC (Insurance) . . . . . . . . . . . . . . . . . . . . . . . . . . . . . . . . . . . . . . . . . . . . . . . . . . . . . . . . . . . . . . . . . . . . . . . . 849 176,838Arthur J. Gallagher & Co. (Insurance) . . . . . . . . . . . . . . . . . . . . . . . . . . . . . . . . . . . . . . . . . . . . . . . . . . . . . . . . . . . . . 8,561 815,264AXA Equitable Holdings, Inc. (Diversified Financial Svs.) . . . . . . . . . . . . . . . . . . . . . . . . . . . . . . . . . . . . . . . . . . . . . . . . . 4,308 106,752Bank of America Corp. (Banks) . . . . . . . . . . . . . . . . . . . . . . . . . . . . . . . . . . . . . . . . . . . . . . . . . . . . . . . . . . . . . . . . . 112,692 3,969,012Bank of New York Mellon Corp. / The (Capital Markets) . . . . . . . . . . . . . . . . . . . . . . . . . . . . . . . . . . . . . . . . . . . . . . . . . . 14,262 717,806Bank OZK (Banks) . . . . . . . . . . . . . . . . . . . . . . . . . . . . . . . . . . . . . . . . . . . . . . . . . . . . . . . . . . . . . . . . . . . . . . . . . 3,849 117,414Berkshire Hathaway, Inc. Class B (Diversified Financial Svs.) . . . . . . . . . . . . . . . . . . . . . . . . . . . . . . . . . . . . . . . . . . . . . . (a) 32,768 7,421,952Brown & Brown, Inc. (Insurance) . . . . . . . . . . . . . . . . . . . . . . . . . . . . . . . . . . . . . . . . . . . . . . . . . . . . . . . . . . . . . . . . 9,327 368,230Capital One Financial Corp. (Consumer Finance) . . . . . . . . . . . . . . . . . . . . . . . . . . . . . . . . . . . . . . . . . . . . . . . . . . . . . . 15,284 1,572,876Charles Schwab Corp. / The (Capital Markets). . . . . . . . . . . . . . . . . . . . . . . . . . . . . . . . . . . . . . . . . . . . . . . . . . . . . . . . 29,377 1,397,170Cincinnati Financial Corp. (Insurance) . . . . . . . . . . . . . . . . . . . . . . . . . . . . . . . . . . . . . . . . . . . . . . . . . . . . . . . . . . . . . 10,702 1,125,315CIT Group, Inc. (Banks) . . . . . . . . . . . . . . . . . . . . . . . . . . . . . . . . . . . . . . . . . . . . . . . . . . . . . . . . . . . . . . . . . . . . . . 17,078 779,269Citigroup, Inc. (Banks) . . . . . . . . . . . . . . . . . . . . . . . . . . . . . . . . . . . . . . . . . . . . . . . . . . . . . . . . . . . . . . . . . . . . . . . 991 79,171Citizens Financial Group, Inc. (Banks) . . . . . . . . . . . . . . . . . . . . . . . . . . . . . . . . . . . . . . . . . . . . . . . . . . . . . . . . . . . . . 12,950 525,900CME Group, Inc. (Capital Markets) . . . . . . . . . . . . . . . . . . . . . . . . . . . . . . . . . . . . . . . . . . . . . . . . . . . . . . . . . . . . . . . 6,299 1,264,335Cullen / Frost Bankers, Inc. (Banks) . . . . . . . . . . . . . . . . . . . . . . . . . . . . . . . . . . . . . . . . . . . . . . . . . . . . . . . . . . . . . . 9,591 937,808East West Bancorp, Inc. (Banks) . . . . . . . . . . . . . . . . . . . . . . . . . . . . . . . . . . . . . . . . . . . . . . . . . . . . . . . . . . . . . . . . 6,341 308,807Essent Group Ltd. (Thrifts & Mortgage Finance) . . . . . . . . . . . . . . . . . . . . . . . . . . . . . . . . . . . . . . . . . . . . . . . . . . . . . . . 4,246 220,750Evercore, Inc. Class A (Capital Markets) . . . . . . . . . . . . . . . . . . . . . . . . . . . . . . . . . . . . . . . . . . . . . . . . . . . . . . . . . . . 1,469 109,822FactSet Research Systems, Inc. (Capital Markets) . . . . . . . . . . . . . . . . . . . . . . . . . . . . . . . . . . . . . . . . . . . . . . . . . . . . . 4,956 1,329,695First American Financial Corp. (Insurance) . . . . . . . . . . . . . . . . . . . . . . . . . . . . . . . . . . . . . . . . . . . . . . . . . . . . . . . . . . 18,488 1,078,220First Citizens BancShares, Inc. Class A (Banks) . . . . . . . . . . . . . . . . . . . . . . . . . . . . . . . . . . . . . . . . . . . . . . . . . . . . . . . 276 146,890First Horizon National Corp. (Banks) . . . . . . . . . . . . . . . . . . . . . . . . . . . . . . . . . . . . . . . . . . . . . . . . . . . . . . . . . . . . . . 3,321 54,996Globe Life, Inc. (Insurance). . . . . . . . . . . . . . . . . . . . . . . . . . . . . . . . . . . . . . . . . . . . . . . . . . . . . . . . . . . . . . . . . . . . 10,933 1,150,698Hartford Financial Services Group, Inc. / The (Insurance) . . . . . . . . . . . . . . . . . . . . . . . . . . . . . . . . . . . . . . . . . . . . . . . . . 1,213 73,714Intercontinental Exchange, Inc. (Capital Markets) . . . . . . . . . . . . . . . . . . . . . . . . . . . . . . . . . . . . . . . . . . . . . . . . . . . . . 28,451 2,633,140Invesco Ltd. (Capital Markets) . . . . . . . . . . . . . . . . . . . . . . . . . . . . . . . . . . . . . . . . . . . . . . . . . . . . . . . . . . . . . . . . . . 627 11,273JPMorgan Chase & Co. (Banks). . . . . . . . . . . . . . . . . . . . . . . . . . . . . . . . . . . . . . . . . . . . . . . . . . . . . . . . . . . . . . . . . 34,547 4,815,852Lincoln National Corp. (Insurance) . . . . . . . . . . . . . . . . . . . . . . . . . . . . . . . . . . . . . . . . . . . . . . . . . . . . . . . . . . . . . . . 7,835 462,343Marsh & McLennan Cos., Inc. (Insurance) . . . . . . . . . . . . . . . . . . . . . . . . . . . . . . . . . . . . . . . . . . . . . . . . . . . . . . . . . . 5,176 576,658MetLife, Inc. (Insurance) . . . . . . . . . . . . . . . . . . . . . . . . . . . . . . . . . . . . . . . . . . . . . . . . . . . . . . . . . . . . . . . . . . . . . 3,994 203,574MGIC Investment Corp. (Thrifts & Mortgage Finance) . . . . . . . . . . . . . . . . . . . . . . . . . . . . . . . . . . . . . . . . . . . . . . . . . . . 2,584 36,615Moody’s Corp. (Capital Markets) . . . . . . . . . . . . . . . . . . . . . . . . . . . . . . . . . . . . . . . . . . . . . . . . . . . . . . . . . . . . . . . . 4,489 1,065,733Morgan Stanley (Capital Markets) . . . . . . . . . . . . . . . . . . . . . . . . . . . . . . . . . . . . . . . . . . . . . . . . . . . . . . . . . . . . . . . 39,505 2,019,496Nasdaq, Inc. (Capital Markets) . . . . . . . . . . . . . . . . . . . . . . . . . . . . . . . . . . . . . . . . . . . . . . . . . . . . . . . . . . . . . . . . . 1,145 122,630PNC Financial Services Group, Inc. / The (Banks) . . . . . . . . . . . . . . . . . . . . . . . . . . . . . . . . . . . . . . . . . . . . . . . . . . . . . . 810 129,300
Ohio National Fund, Inc. ON BlackRock Balanced Allocation Portfolio (Continued)
Schedule of Investments December 31, 2019
13 (continued)

Common Stocks (Continued) Shares Value
FINANCIALS (continued)Progressive Corp. / The (Insurance) . . . . . . . . . . . . . . . . . . . . . . . . . . . . . . . . . . . . . . . . . . . . . . . . . . . . . . . . . . . . . . 6,457 $ 467,422Prudential Financial, Inc. (Insurance) . . . . . . . . . . . . . . . . . . . . . . . . . . . . . . . . . . . . . . . . . . . . . . . . . . . . . . . . . . . . . 17,350 1,626,389Reinsurance Group of America, Inc. (Insurance) . . . . . . . . . . . . . . . . . . . . . . . . . . . . . . . . . . . . . . . . . . . . . . . . . . . . . . 275 44,842S&P Global, Inc. (Capital Markets) . . . . . . . . . . . . . . . . . . . . . . . . . . . . . . . . . . . . . . . . . . . . . . . . . . . . . . . . . . . . . . . 11,752 3,208,884SEI Investments Co. (Capital Markets) . . . . . . . . . . . . . . . . . . . . . . . . . . . . . . . . . . . . . . . . . . . . . . . . . . . . . . . . . . . . . 1,136 74,385TD Ameritrade Holding Corp. (Capital Markets) . . . . . . . . . . . . . . . . . . . . . . . . . . . . . . . . . . . . . . . . . . . . . . . . . . . . . . . 8,121 403,614Travelers Cos., Inc. / The (Insurance) . . . . . . . . . . . . . . . . . . . . . . . . . . . . . . . . . . . . . . . . . . . . . . . . . . . . . . . . . . . . . 954 130,650Truist Financial Corp. (Banks) . . . . . . . . . . . . . . . . . . . . . . . . . . . . . . . . . . . . . . . . . . . . . . . . . . . . . . . . . . . . . . . . . . 2,977 167,665U.S. Bancorp (Banks) . . . . . . . . . . . . . . . . . . . . . . . . . . . . . . . . . . . . . . . . . . . . . . . . . . . . . . . . . . . . . . . . . . . . . . . 12,454 738,398Unum Group (Insurance) . . . . . . . . . . . . . . . . . . . . . . . . . . . . . . . . . . . . . . . . . . . . . . . . . . . . . . . . . . . . . . . . . . . . . 8,448 246,344W.R. Berkley Corp. (Insurance) . . . . . . . . . . . . . . . . . . . . . . . . . . . . . . . . . . . . . . . . . . . . . . . . . . . . . . . . . . . . . . . . . 830 57,353Wells Fargo & Co. (Banks) . . . . . . . . . . . . . . . . . . . . . . . . . . . . . . . . . . . . . . . . . . . . . . . . . . . . . . . . . . . . . . . . . . . . 46,071 2,478,620Willis Towers Watson PLC (Insurance) . . . . . . . . . . . . . . . . . . . . . . . . . . . . . . . . . . . . . . . . . . . . . . . . . . . . . . . . . . . . 1,917 387,119
53,720,950
HEALTH CARE – 10.6%Abbott Laboratories (Health Care Equip. & Supplies) . . . . . . . . . . . . . . . . . . . . . . . . . . . . . . . . . . . . . . . . . . . . . . . . . . . . 2,280 198,041AbbVie, Inc. (Biotechnology). . . . . . . . . . . . . . . . . . . . . . . . . . . . . . . . . . . . . . . . . . . . . . . . . . . . . . . . . . . . . . . . . . . 33,982 3,008,766Alexion Pharmaceuticals, Inc. (Biotechnology) . . . . . . . . . . . . . . . . . . . . . . . . . . . . . . . . . . . . . . . . . . . . . . . . . . . . . . . (a) 2,648 286,381Allergan PLC (Pharmaceuticals) . . . . . . . . . . . . . . . . . . . . . . . . . . . . . . . . . . . . . . . . . . . . . . . . . . . . . . . . . . . . . . . . 857 163,833AmerisourceBergen Corp. (Health Care Providers & Svs.) . . . . . . . . . . . . . . . . . . . . . . . . . . . . . . . . . . . . . . . . . . . . . . . . 8,093 688,067Amgen, Inc. (Biotechnology) . . . . . . . . . . . . . . . . . . . . . . . . . . . . . . . . . . . . . . . . . . . . . . . . . . . . . . . . . . . . . . . . . . . 8,100 1,952,667Anthem, Inc. (Health Care Providers & Svs.) . . . . . . . . . . . . . . . . . . . . . . . . . . . . . . . . . . . . . . . . . . . . . . . . . . . . . . . . . 8,390 2,534,032Biogen, Inc. (Biotechnology) . . . . . . . . . . . . . . . . . . . . . . . . . . . . . . . . . . . . . . . . . . . . . . . . . . . . . . . . . . . . . . . . . . . (a) 3,178 943,008Bristol-Myers Squibb Co. (Pharmaceuticals) . . . . . . . . . . . . . . . . . . . . . . . . . . . . . . . . . . . . . . . . . . . . . . . . . . . . . . . . . 55,642 3,571,660Cigna Corp. (Health Care Providers & Svs.) . . . . . . . . . . . . . . . . . . . . . . . . . . . . . . . . . . . . . . . . . . . . . . . . . . . . . . . . . . 1,108 226,575CVS Health Corp. (Health Care Providers & Svs.) . . . . . . . . . . . . . . . . . . . . . . . . . . . . . . . . . . . . . . . . . . . . . . . . . . . . . . 35,008 2,600,744DexCom, Inc. (Health Care Equip. & Supplies) . . . . . . . . . . . . . . . . . . . . . . . . . . . . . . . . . . . . . . . . . . . . . . . . . . . . . . . . (a) 1,310 286,549Edwards Lifesciences Corp. (Health Care Equip. & Supplies) . . . . . . . . . . . . . . . . . . . . . . . . . . . . . . . . . . . . . . . . . . . . . . . (a) 8,270 1,929,308Gilead Sciences, Inc. (Biotechnology) . . . . . . . . . . . . . . . . . . . . . . . . . . . . . . . . . . . . . . . . . . . . . . . . . . . . . . . . . . . . . 83,777 5,443,830Hologic, Inc. (Health Care Equip. & Supplies) . . . . . . . . . . . . . . . . . . . . . . . . . . . . . . . . . . . . . . . . . . . . . . . . . . . . . . . . (a) 20,085 1,048,638Humana, Inc. (Health Care Providers & Svs.). . . . . . . . . . . . . . . . . . . . . . . . . . . . . . . . . . . . . . . . . . . . . . . . . . . . . . . . . 1,995 731,207IDEXX Laboratories, Inc. (Health Care Equip. & Supplies) . . . . . . . . . . . . . . . . . . . . . . . . . . . . . . . . . . . . . . . . . . . . . . . . . (a) 3,722 971,926Incyte Corp. (Biotechnology). . . . . . . . . . . . . . . . . . . . . . . . . . . . . . . . . . . . . . . . . . . . . . . . . . . . . . . . . . . . . . . . . . . (a) 2,110 184,245Johnson & Johnson (Pharmaceuticals) . . . . . . . . . . . . . . . . . . . . . . . . . . . . . . . . . . . . . . . . . . . . . . . . . . . . . . . . . . . . 53,260 7,769,036McKesson Corp. (Health Care Providers & Svs.) . . . . . . . . . . . . . . . . . . . . . . . . . . . . . . . . . . . . . . . . . . . . . . . . . . . . . . 1,066 147,449Medtronic PLC (Health Care Equip. & Supplies) . . . . . . . . . . . . . . . . . . . . . . . . . . . . . . . . . . . . . . . . . . . . . . . . . . . . . . . 11,015 1,249,652Merck & Co., Inc. (Pharmaceuticals). . . . . . . . . . . . . . . . . . . . . . . . . . . . . . . . . . . . . . . . . . . . . . . . . . . . . . . . . . . . . . 47,043 4,278,561Mylan N.V. (Pharmaceuticals) . . . . . . . . . . . . . . . . . . . . . . . . . . . . . . . . . . . . . . . . . . . . . . . . . . . . . . . . . . . . . . . . . . (a) 20,960 421,296Pfizer, Inc. (Pharmaceuticals) . . . . . . . . . . . . . . . . . . . . . . . . . . . . . . . . . . . . . . . . . . . . . . . . . . . . . . . . . . . . . . . . . . 67,026 2,626,079Regeneron Pharmaceuticals, Inc. (Biotechnology) . . . . . . . . . . . . . . . . . . . . . . . . . . . . . . . . . . . . . . . . . . . . . . . . . . . . . (a) 2,941 1,104,287Stryker Corp. (Health Care Equip. & Supplies) . . . . . . . . . . . . . . . . . . . . . . . . . . . . . . . . . . . . . . . . . . . . . . . . . . . . . . . . 20,963 4,400,972Thermo Fisher Scientific, Inc. (Life Sciences Tools & Svs.) . . . . . . . . . . . . . . . . . . . . . . . . . . . . . . . . . . . . . . . . . . . . . . . . 2,252 731,607United Therapeutics Corp. (Biotechnology). . . . . . . . . . . . . . . . . . . . . . . . . . . . . . . . . . . . . . . . . . . . . . . . . . . . . . . . . . (a) 1,964 172,989UnitedHealth Group, Inc. (Health Care Providers & Svs.) . . . . . . . . . . . . . . . . . . . . . . . . . . . . . . . . . . . . . . . . . . . . . . . . . 11,133 3,272,879Veeva Systems, Inc. Class A (Health Care Technology) . . . . . . . . . . . . . . . . . . . . . . . . . . . . . . . . . . . . . . . . . . . . . . . . . . (a) 3,419 480,917Vertex Pharmaceuticals, Inc. (Biotechnology) . . . . . . . . . . . . . . . . . . . . . . . . . . . . . . . . . . . . . . . . . . . . . . . . . . . . . . . . (a) 7,153 1,566,149WellCare Health Plans, Inc. (Health Care Providers & Svs.). . . . . . . . . . . . . . . . . . . . . . . . . . . . . . . . . . . . . . . . . . . . . . . . (a) 743 245,346Zoetis, Inc. (Pharmaceuticals) . . . . . . . . . . . . . . . . . . . . . . . . . . . . . . . . . . . . . . . . . . . . . . . . . . . . . . . . . . . . . . . . . . 17,493 2,315,199
57,551,895
INDUSTRIALS – 6.9%3M Co. (Industrial Conglomerates) . . . . . . . . . . . . . . . . . . . . . . . . . . . . . . . . . . . . . . . . . . . . . . . . . . . . . . . . . . . . . . . 2,372 418,468AGCO Corp. (Machinery) . . . . . . . . . . . . . . . . . . . . . . . . . . . . . . . . . . . . . . . . . . . . . . . . . . . . . . . . . . . . . . . . . . . . . 2,981 230,282Alaska Air Group, Inc. (Airlines) . . . . . . . . . . . . . . . . . . . . . . . . . . . . . . . . . . . . . . . . . . . . . . . . . . . . . . . . . . . . . . . . . 1,284 86,991Allegion PLC (Building Products) . . . . . . . . . . . . . . . . . . . . . . . . . . . . . . . . . . . . . . . . . . . . . . . . . . . . . . . . . . . . . . . . 23,896 2,976,008AMETEK, Inc. (Electrical Equip.). . . . . . . . . . . . . . . . . . . . . . . . . . . . . . . . . . . . . . . . . . . . . . . . . . . . . . . . . . . . . . . . . 16,055 1,601,326Boeing Co. / The (Aerospace & Defense) . . . . . . . . . . . . . . . . . . . . . . . . . . . . . . . . . . . . . . . . . . . . . . . . . . . . . . . . . . . 633 206,206Canadian Pacific Railway Ltd. (Road & Rail) . . . . . . . . . . . . . . . . . . . . . . . . . . . . . . . . . . . . . . . . . . . . . . . . . . . . . . . . . 591 150,675Copart, Inc. (Commercial Svs. & Supplies) . . . . . . . . . . . . . . . . . . . . . . . . . . . . . . . . . . . . . . . . . . . . . . . . . . . . . . . . . . (a) 875 79,573CSX Corp. (Road & Rail) . . . . . . . . . . . . . . . . . . . . . . . . . . . . . . . . . . . . . . . . . . . . . . . . . . . . . . . . . . . . . . . . . . . . . . 6,696 484,523Curtiss-Wright Corp. (Aerospace & Defense) . . . . . . . . . . . . . . . . . . . . . . . . . . . . . . . . . . . . . . . . . . . . . . . . . . . . . . . . 562 79,180Delta Air Lines, Inc. (Airlines) . . . . . . . . . . . . . . . . . . . . . . . . . . . . . . . . . . . . . . . . . . . . . . . . . . . . . . . . . . . . . . . . . . 4,407 257,721Eaton Corp. PLC (Electrical Equip.) . . . . . . . . . . . . . . . . . . . . . . . . . . . . . . . . . . . . . . . . . . . . . . . . . . . . . . . . . . . . . . . 957 90,647EMCOR Group, Inc. (Construction & Engineering) . . . . . . . . . . . . . . . . . . . . . . . . . . . . . . . . . . . . . . . . . . . . . . . . . . . . . . 514 44,358Expeditors International of Washington, Inc. (Air Freight & Logistics) . . . . . . . . . . . . . . . . . . . . . . . . . . . . . . . . . . . . . . . . . 2,492 194,426Fluor Corp. (Construction & Engineering) . . . . . . . . . . . . . . . . . . . . . . . . . . . . . . . . . . . . . . . . . . . . . . . . . . . . . . . . . . . 11,136 210,248GATX Corp. (Trading Companies & Distributors) . . . . . . . . . . . . . . . . . . . . . . . . . . . . . . . . . . . . . . . . . . . . . . . . . . . . . . . 12,940 1,072,079HEICO Corp. (Aerospace & Defense). . . . . . . . . . . . . . . . . . . . . . . . . . . . . . . . . . . . . . . . . . . . . . . . . . . . . . . . . . . . . . 80 9,132Hexcel Corp. (Aerospace & Defense) . . . . . . . . . . . . . . . . . . . . . . . . . . . . . . . . . . . . . . . . . . . . . . . . . . . . . . . . . . . . . 486 35,629
Ohio National Fund, Inc. ON BlackRock Balanced Allocation Portfolio (Continued)
Schedule of Investments December 31, 2019
14 (continued)

Common Stocks (Continued) Shares Value
INDUSTRIALS (continued)Honeywell International, Inc. (Industrial Conglomerates) . . . . . . . . . . . . . . . . . . . . . . . . . . . . . . . . . . . . . . . . . . . . . . . . . 9,412 $ 1,665,924Hubbell, Inc. (Electrical Equip.) . . . . . . . . . . . . . . . . . . . . . . . . . . . . . . . . . . . . . . . . . . . . . . . . . . . . . . . . . . . . . . . . . 6,470 956,395IDEX Corp. (Machinery) . . . . . . . . . . . . . . . . . . . . . . . . . . . . . . . . . . . . . . . . . . . . . . . . . . . . . . . . . . . . . . . . . . . . . . 6,266 1,077,752Ingersoll-Rand PLC (Machinery) . . . . . . . . . . . . . . . . . . . . . . . . . . . . . . . . . . . . . . . . . . . . . . . . . . . . . . . . . . . . . . . . 1,811 240,718Landstar System, Inc. (Road & Rail) . . . . . . . . . . . . . . . . . . . . . . . . . . . . . . . . . . . . . . . . . . . . . . . . . . . . . . . . . . . . . . 5,460 621,730Lockheed Martin Corp. (Aerospace & Defense) . . . . . . . . . . . . . . . . . . . . . . . . . . . . . . . . . . . . . . . . . . . . . . . . . . . . . . . 14,023 5,460,276MasTec, Inc. (Construction & Engineering) . . . . . . . . . . . . . . . . . . . . . . . . . . . . . . . . . . . . . . . . . . . . . . . . . . . . . . . . . . (a) 9,835 631,014Northrop Grumman Corp. (Aerospace & Defense) . . . . . . . . . . . . . . . . . . . . . . . . . . . . . . . . . . . . . . . . . . . . . . . . . . . . . 3,284 1,129,597Old Dominion Freight Line, Inc. (Road & Rail). . . . . . . . . . . . . . . . . . . . . . . . . . . . . . . . . . . . . . . . . . . . . . . . . . . . . . . . . 875 166,058Oshkosh Corp. (Machinery) . . . . . . . . . . . . . . . . . . . . . . . . . . . . . . . . . . . . . . . . . . . . . . . . . . . . . . . . . . . . . . . . . . . 23,318 2,207,049PACCAR, Inc. (Machinery) . . . . . . . . . . . . . . . . . . . . . . . . . . . . . . . . . . . . . . . . . . . . . . . . . . . . . . . . . . . . . . . . . . . . 57,706 4,564,545Raytheon Co. (Aerospace & Defense) . . . . . . . . . . . . . . . . . . . . . . . . . . . . . . . . . . . . . . . . . . . . . . . . . . . . . . . . . . . . . 14,352 3,153,708Resideo Technologies, Inc. (Building Products) . . . . . . . . . . . . . . . . . . . . . . . . . . . . . . . . . . . . . . . . . . . . . . . . . . . . . . . (a) 5,722 68,263Robert Half International, Inc. (Professional Svs.) . . . . . . . . . . . . . . . . . . . . . . . . . . . . . . . . . . . . . . . . . . . . . . . . . . . . . . 22,831 1,441,778Roper Technologies, Inc. (Industrial Conglomerates) . . . . . . . . . . . . . . . . . . . . . . . . . . . . . . . . . . . . . . . . . . . . . . . . . . . . 5,046 1,787,445Snap-on, Inc. (Machinery) . . . . . . . . . . . . . . . . . . . . . . . . . . . . . . . . . . . . . . . . . . . . . . . . . . . . . . . . . . . . . . . . . . . . 3,121 528,697Teledyne Technologies, Inc. (Aerospace & Defense) . . . . . . . . . . . . . . . . . . . . . . . . . . . . . . . . . . . . . . . . . . . . . . . . . . . . (a) 5,635 1,952,753United Airlines Holdings, Inc. (Airlines) . . . . . . . . . . . . . . . . . . . . . . . . . . . . . . . . . . . . . . . . . . . . . . . . . . . . . . . . . . . . (a) 16,147 1,422,389United Parcel Service, Inc. Class B (Air Freight & Logistics) . . . . . . . . . . . . . . . . . . . . . . . . . . . . . . . . . . . . . . . . . . . . . . . 3,514 411,349Watsco, Inc. (Trading Companies & Distributors) . . . . . . . . . . . . . . . . . . . . . . . . . . . . . . . . . . . . . . . . . . . . . . . . . . . . . . 203 36,570Xylem, Inc. (Machinery). . . . . . . . . . . . . . . . . . . . . . . . . . . . . . . . . . . . . . . . . . . . . . . . . . . . . . . . . . . . . . . . . . . . . . 1,065 83,911
37,835,393
INFORMATION TECHNOLOGY – 16.9%Accenture PLC Class A (IT Svs.). . . . . . . . . . . . . . . . . . . . . . . . . . . . . . . . . . . . . . . . . . . . . . . . . . . . . . . . . . . . . . . . . 1,548 325,962Adobe, Inc. (Software) . . . . . . . . . . . . . . . . . . . . . . . . . . . . . . . . . . . . . . . . . . . . . . . . . . . . . . . . . . . . . . . . . . . . . . (a) 5,713 1,884,205Amdocs Ltd. (IT Svs.) . . . . . . . . . . . . . . . . . . . . . . . . . . . . . . . . . . . . . . . . . . . . . . . . . . . . . . . . . . . . . . . . . . . . . . . 5,124 369,902Apple, Inc. (Tech. Hardware, Storage & Periph.) . . . . . . . . . . . . . . . . . . . . . . . . . . . . . . . . . . . . . . . . . . . . . . . . . . . . . . 63,859 18,752,195Applied Materials, Inc. (Semiconductors & Equip.) . . . . . . . . . . . . . . . . . . . . . . . . . . . . . . . . . . . . . . . . . . . . . . . . . . . . . 30,563 1,865,566Automatic Data Processing, Inc. (IT Svs.) . . . . . . . . . . . . . . . . . . . . . . . . . . . . . . . . . . . . . . . . . . . . . . . . . . . . . . . . . . . 20,874 3,559,017Avnet, Inc. (Electronic Equip., Instr. & Comp.) . . . . . . . . . . . . . . . . . . . . . . . . . . . . . . . . . . . . . . . . . . . . . . . . . . . . . . . . 5,250 222,810Broadcom, Inc. (Semiconductors & Equip.). . . . . . . . . . . . . . . . . . . . . . . . . . . . . . . . . . . . . . . . . . . . . . . . . . . . . . . . . . 245 77,425Broadridge Financial Solutions, Inc. (IT Svs.). . . . . . . . . . . . . . . . . . . . . . . . . . . . . . . . . . . . . . . . . . . . . . . . . . . . . . . . . 5,250 648,585CDW Corp. (Electronic Equip., Instr. & Comp.) . . . . . . . . . . . . . . . . . . . . . . . . . . . . . . . . . . . . . . . . . . . . . . . . . . . . . . . . 14,102 2,014,330Cirrus Logic, Inc. (Semiconductors & Equip.). . . . . . . . . . . . . . . . . . . . . . . . . . . . . . . . . . . . . . . . . . . . . . . . . . . . . . . . . (a) 12,951 1,067,292Cisco Systems, Inc. (Communications Equip.) . . . . . . . . . . . . . . . . . . . . . . . . . . . . . . . . . . . . . . . . . . . . . . . . . . . . . . . . 42,148 2,021,418GoDaddy, Inc. Class A (IT Svs.) . . . . . . . . . . . . . . . . . . . . . . . . . . . . . . . . . . . . . . . . . . . . . . . . . . . . . . . . . . . . . . . . . (a) 2,714 184,335HP, Inc. (Tech. Hardware, Storage & Periph.). . . . . . . . . . . . . . . . . . . . . . . . . . . . . . . . . . . . . . . . . . . . . . . . . . . . . . . . . 21,867 449,367Intel Corp. (Semiconductors & Equip.) . . . . . . . . . . . . . . . . . . . . . . . . . . . . . . . . . . . . . . . . . . . . . . . . . . . . . . . . . . . . . 80,517 4,818,942International Business Machines Corp. (IT Svs.) . . . . . . . . . . . . . . . . . . . . . . . . . . . . . . . . . . . . . . . . . . . . . . . . . . . . . . 527 70,639Intuit, Inc. (Software) . . . . . . . . . . . . . . . . . . . . . . . . . . . . . . . . . . . . . . . . . . . . . . . . . . . . . . . . . . . . . . . . . . . . . . . 11,159 2,922,877Jack Henry & Associates, Inc. (IT Svs.) . . . . . . . . . . . . . . . . . . . . . . . . . . . . . . . . . . . . . . . . . . . . . . . . . . . . . . . . . . . . 4,992 727,185Lam Research Corp. (Semiconductors & Equip.) . . . . . . . . . . . . . . . . . . . . . . . . . . . . . . . . . . . . . . . . . . . . . . . . . . . . . . 6,854 2,004,110Manhattan Associates, Inc. (Software) . . . . . . . . . . . . . . . . . . . . . . . . . . . . . . . . . . . . . . . . . . . . . . . . . . . . . . . . . . . . (a) 1,625 129,594Mastercard, Inc. Class A (IT Svs.) . . . . . . . . . . . . . . . . . . . . . . . . . . . . . . . . . . . . . . . . . . . . . . . . . . . . . . . . . . . . . . . 27,731 8,280,199Micron Technology, Inc. (Semiconductors & Equip.) . . . . . . . . . . . . . . . . . . . . . . . . . . . . . . . . . . . . . . . . . . . . . . . . . . . . (a) 13,666 734,957Microsoft Corp. (Software) . . . . . . . . . . . . . . . . . . . . . . . . . . . . . . . . . . . . . . . . . . . . . . . . . . . . . . . . . . . . . . . . . . . . 128,375 20,244,738National Instruments Corp. (Electronic Equip., Instr. & Comp.) . . . . . . . . . . . . . . . . . . . . . . . . . . . . . . . . . . . . . . . . . . . . . . 25,874 1,095,505NVIDIA Corp. (Semiconductors & Equip.) . . . . . . . . . . . . . . . . . . . . . . . . . . . . . . . . . . . . . . . . . . . . . . . . . . . . . . . . . . . 11,337 2,667,596Paychex, Inc. (IT Svs.) . . . . . . . . . . . . . . . . . . . . . . . . . . . . . . . . . . . . . . . . . . . . . . . . . . . . . . . . . . . . . . . . . . . . . . . 40,515 3,446,206Paylocity Holding Corp. (Software) . . . . . . . . . . . . . . . . . . . . . . . . . . . . . . . . . . . . . . . . . . . . . . . . . . . . . . . . . . . . . . . (a) 1,019 123,116PayPal Holdings, Inc. (IT Svs.) . . . . . . . . . . . . . . . . . . . . . . . . . . . . . . . . . . . . . . . . . . . . . . . . . . . . . . . . . . . . . . . . . . (a) 4,990 539,768QUALCOMM, Inc. (Semiconductors & Equip.) . . . . . . . . . . . . . . . . . . . . . . . . . . . . . . . . . . . . . . . . . . . . . . . . . . . . . . . . 10,236 903,122salesforce.com, Inc. (Software) . . . . . . . . . . . . . . . . . . . . . . . . . . . . . . . . . . . . . . . . . . . . . . . . . . . . . . . . . . . . . . . . . (a) 18,160 2,953,542ServiceNow, Inc. (Software) . . . . . . . . . . . . . . . . . . . . . . . . . . . . . . . . . . . . . . . . . . . . . . . . . . . . . . . . . . . . . . . . . . . (a) 6,548 1,848,631Skyworks Solutions, Inc. (Semiconductors & Equip.) . . . . . . . . . . . . . . . . . . . . . . . . . . . . . . . . . . . . . . . . . . . . . . . . . . . . 3,251 392,981Texas Instruments, Inc. (Semiconductors & Equip.). . . . . . . . . . . . . . . . . . . . . . . . . . . . . . . . . . . . . . . . . . . . . . . . . . . . . 12,883 1,652,760Visa, Inc. (IT Svs.) . . . . . . . . . . . . . . . . . . . . . . . . . . . . . . . . . . . . . . . . . . . . . . . . . . . . . . . . . . . . . . . . . . . . . . . . . 15,336 2,881,634Workday, Inc. Class A (Software) . . . . . . . . . . . . . . . . . . . . . . . . . . . . . . . . . . . . . . . . . . . . . . . . . . . . . . . . . . . . . . . . (a) 2,585 425,103
92,305,614
MATERIALS – 1.6%Air Products & Chemicals, Inc. (Chemicals) . . . . . . . . . . . . . . . . . . . . . . . . . . . . . . . . . . . . . . . . . . . . . . . . . . . . . . . . . 4,549 1,068,970Alcoa Corp. (Metals & Mining) . . . . . . . . . . . . . . . . . . . . . . . . . . . . . . . . . . . . . . . . . . . . . . . . . . . . . . . . . . . . . . . . . (a) 25,652 551,775CF Industries Holdings, Inc. (Chemicals) . . . . . . . . . . . . . . . . . . . . . . . . . . . . . . . . . . . . . . . . . . . . . . . . . . . . . . . . . . . 6,438 307,350Domtar Corp. (Paper & Forest Products) . . . . . . . . . . . . . . . . . . . . . . . . . . . . . . . . . . . . . . . . . . . . . . . . . . . . . . . . . . . 20,924 800,134Ecolab, Inc. (Chemicals) . . . . . . . . . . . . . . . . . . . . . . . . . . . . . . . . . . . . . . . . . . . . . . . . . . . . . . . . . . . . . . . . . . . . . 7,752 1,496,058Graphic Packaging Holding Co. (Containers & Packaging) . . . . . . . . . . . . . . . . . . . . . . . . . . . . . . . . . . . . . . . . . . . . . . . . 8,397 139,810LyondellBasell Industries N.V. Class A (Chemicals) . . . . . . . . . . . . . . . . . . . . . . . . . . . . . . . . . . . . . . . . . . . . . . . . . . . . . 5,406 510,759Mosaic Co. / The (Chemicals) . . . . . . . . . . . . . . . . . . . . . . . . . . . . . . . . . . . . . . . . . . . . . . . . . . . . . . . . . . . . . . . . . . 30,254 654,697
Ohio National Fund, Inc. ON BlackRock Balanced Allocation Portfolio (Continued)
Schedule of Investments December 31, 2019
15 (continued)
Common Stocks (Continued) Shares Value
MATERIALS (continued)Packaging Corp. of America (Containers & Packaging) . . . . . . . . . . . . . . . . . . . . . . . . . . . . . . . . . . . . . . . . . . . . . . . . . . 3,452 $ 386,589PPG Industries, Inc. (Chemicals) . . . . . . . . . . . . . . . . . . . . . . . . . . . . . . . . . . . . . . . . . . . . . . . . . . . . . . . . . . . . . . . . 1,986 265,111Reliance Steel & Aluminum Co. (Metals & Mining) . . . . . . . . . . . . . . . . . . . . . . . . . . . . . . . . . . . . . . . . . . . . . . . . . . . . . 3,496 418,681Scotts Miracle-Gro Co. / The (Chemicals) . . . . . . . . . . . . . . . . . . . . . . . . . . . . . . . . . . . . . . . . . . . . . . . . . . . . . . . . . . . 419 44,489Sherwin-Williams Co. / The (Chemicals). . . . . . . . . . . . . . . . . . . . . . . . . . . . . . . . . . . . . . . . . . . . . . . . . . . . . . . . . . . . 2,112 1,232,436Steel Dynamics, Inc. (Metals & Mining) . . . . . . . . . . . . . . . . . . . . . . . . . . . . . . . . . . . . . . . . . . . . . . . . . . . . . . . . . . . . 3,707 126,186Westrock Co. (Containers & Packaging). . . . . . . . . . . . . . . . . . . . . . . . . . . . . . . . . . . . . . . . . . . . . . . . . . . . . . . . . . . . 12,269 526,463
8,529,508
REAL ESTATE – 1.7%Boston Properties, Inc. (Equity REIT) . . . . . . . . . . . . . . . . . . . . . . . . . . . . . . . . . . . . . . . . . . . . . . . . . . . . . . . . . . . . . . 1,949 268,689Brandywine Realty Trust (Equity REIT) . . . . . . . . . . . . . . . . . . . . . . . . . . . . . . . . . . . . . . . . . . . . . . . . . . . . . . . . . . . . . 3,451 54,353Equity Residential (Equity REIT) . . . . . . . . . . . . . . . . . . . . . . . . . . . . . . . . . . . . . . . . . . . . . . . . . . . . . . . . . . . . . . . . . 6,102 493,774Host Hotels & Resorts, Inc. (Equity REIT) . . . . . . . . . . . . . . . . . . . . . . . . . . . . . . . . . . . . . . . . . . . . . . . . . . . . . . . . . . . 39,399 730,851Invitation Homes, Inc. (Equity REIT) . . . . . . . . . . . . . . . . . . . . . . . . . . . . . . . . . . . . . . . . . . . . . . . . . . . . . . . . . . . . . . 6,243 187,103Lamar Advertising Co. Class A (Equity REIT) . . . . . . . . . . . . . . . . . . . . . . . . . . . . . . . . . . . . . . . . . . . . . . . . . . . . . . . . . 10,777 961,955Macerich Co. / The (Equity REIT) . . . . . . . . . . . . . . . . . . . . . . . . . . . . . . . . . . . . . . . . . . . . . . . . . . . . . . . . . . . . . . . . 2,178 58,632National Retail Properties, Inc. (Equity REIT) . . . . . . . . . . . . . . . . . . . . . . . . . . . . . . . . . . . . . . . . . . . . . . . . . . . . . . . . . 8,267 443,277Outfront Media, Inc. (Equity REIT). . . . . . . . . . . . . . . . . . . . . . . . . . . . . . . . . . . . . . . . . . . . . . . . . . . . . . . . . . . . . . . . 6,805 182,510Park Hotels & Resorts, Inc. (Equity REIT) . . . . . . . . . . . . . . . . . . . . . . . . . . . . . . . . . . . . . . . . . . . . . . . . . . . . . . . . . . . 53,370 1,380,682Prologis, Inc. (Equity REIT) . . . . . . . . . . . . . . . . . . . . . . . . . . . . . . . . . . . . . . . . . . . . . . . . . . . . . . . . . . . . . . . . . . . . 8,316 741,288Regency Centers Corp. (Equity REIT) . . . . . . . . . . . . . . . . . . . . . . . . . . . . . . . . . . . . . . . . . . . . . . . . . . . . . . . . . . . . . . 2,043 128,893RLJ Lodging Trust (Equity REIT) . . . . . . . . . . . . . . . . . . . . . . . . . . . . . . . . . . . . . . . . . . . . . . . . . . . . . . . . . . . . . . . . . 30,746 544,819Simon Property Group, Inc. (Equity REIT) . . . . . . . . . . . . . . . . . . . . . . . . . . . . . . . . . . . . . . . . . . . . . . . . . . . . . . . . . . . 20,545 3,060,383STAG Industrial, Inc. (Equity REIT) . . . . . . . . . . . . . . . . . . . . . . . . . . . . . . . . . . . . . . . . . . . . . . . . . . . . . . . . . . . . . . . 3,986 125,838Ventas, Inc. (Equity REIT) . . . . . . . . . . . . . . . . . . . . . . . . . . . . . . . . . . . . . . . . . . . . . . . . . . . . . . . . . . . . . . . . . . . . . 1,180 68,133
9,431,180
UTILITIES – 2.4%Ameren Corp. (Multi-Utilities) . . . . . . . . . . . . . . . . . . . . . . . . . . . . . . . . . . . . . . . . . . . . . . . . . . . . . . . . . . . . . . . . . . 16,997 1,305,370American Water Works Co., Inc. (Water Utilities) . . . . . . . . . . . . . . . . . . . . . . . . . . . . . . . . . . . . . . . . . . . . . . . . . . . . . . 13,268 1,629,974Atmos Energy Corp. (Gas Utilities) . . . . . . . . . . . . . . . . . . . . . . . . . . . . . . . . . . . . . . . . . . . . . . . . . . . . . . . . . . . . . . . 1,232 137,811Consolidated Edison, Inc. (Multi-Utilities) . . . . . . . . . . . . . . . . . . . . . . . . . . . . . . . . . . . . . . . . . . . . . . . . . . . . . . . . . . . 5,628 509,165DTE Energy Co. (Multi-Utilities) . . . . . . . . . . . . . . . . . . . . . . . . . . . . . . . . . . . . . . . . . . . . . . . . . . . . . . . . . . . . . . . . . 30,434 3,952,464Pinnacle West Capital Corp. (Electric Utilities) . . . . . . . . . . . . . . . . . . . . . . . . . . . . . . . . . . . . . . . . . . . . . . . . . . . . . . . . 7,470 671,777Southwest Gas Holdings, Inc. (Gas Utilities) . . . . . . . . . . . . . . . . . . . . . . . . . . . . . . . . . . . . . . . . . . . . . . . . . . . . . . . . . 6,333 481,118Xcel Energy, Inc. (Electric Utilities) . . . . . . . . . . . . . . . . . . . . . . . . . . . . . . . . . . . . . . . . . . . . . . . . . . . . . . . . . . . . . . . 68,261 4,333,891
13,021,570Total Common Stocks (Cost $350,769,169). . . . . . . . . . . . . . . . . . . . . . . . . . . . . . . . . . . . . . . . . . . . . . . . . . . . . . . . . . . $395,711,450
Corporate Bonds – 25.9% Rate Maturity Face Amount Value
COMMUNICATION SERVICES – 1.5%AT&T, Inc. (Diversified Telecom. Svs.) . . . . . . . . . . . . . . . . . . . . . . . . . . . . . . . . . . . . . . . . . 3.400% 05/15/2025 $1,000,000 $ 1,047,427AT&T, Inc. (Diversified Telecom. Svs.) . . . . . . . . . . . . . . . . . . . . . . . . . . . . . . . . . . . . . . . . . 4.900% 08/15/2037 1,000,000 1,148,836Comcast Corp. (Media) . . . . . . . . . . . . . . . . . . . . . . . . . . . . . . . . . . . . . . . . . . . . . . . . . . 3.250% 11/01/2039 2,000,000 2,026,273Discovery Communications LLC (Media) . . . . . . . . . . . . . . . . . . . . . . . . . . . . . . . . . . . . . . . 3.950% 03/20/2028 100,000 106,622Rogers Communications, Inc. (Wireless Telecom. Svs.) . . . . . . . . . . . . . . . . . . . . . . . . . . . . . . 3.700% 11/15/2049 1,400,000 1,408,560Time Warner Cable LLC (Media) . . . . . . . . . . . . . . . . . . . . . . . . . . . . . . . . . . . . . . . . . . . . . 6.550% 05/01/2037 150,000 183,630Verizon Communications, Inc. (Diversified Telecom. Svs.) . . . . . . . . . . . . . . . . . . . . . . . . . . . . . 4.500% 08/10/2033 1,000,000 1,166,849Verizon Communications, Inc. (Diversified Telecom. Svs.) . . . . . . . . . . . . . . . . . . . . . . . . . . . . . 4.400% 11/01/2034 1,000,000 1,157,006ViacomCBS, Inc. (Media) . . . . . . . . . . . . . . . . . . . . . . . . . . . . . . . . . . . . . . . . . . . . . . . . . 4.250% 09/01/2023 150,000 159,655
8,404,858
CONSUMER DISCRETIONARY – 1.5%Amazon.com, Inc. (Internet & Direct Marketing Retail). . . . . . . . . . . . . . . . . . . . . . . . . . . . . . . 3.875% 08/22/2037 1,000,000 1,133,848Aptiv PLC (Auto Components) . . . . . . . . . . . . . . . . . . . . . . . . . . . . . . . . . . . . . . . . . . . . . . 4.350% 03/15/2029 150,000 162,558Booking Holdings, Inc. (Internet & Direct Marketing Retail) . . . . . . . . . . . . . . . . . . . . . . . . . . . . 3.550% 03/15/2028 200,000 212,865Expedia Group, Inc. (Internet & Direct Marketing Retail) . . . . . . . . . . . . . . . . . . . . . . . . . . . . . (b) 3.250% 02/15/2030 1,000,000 961,003Hasbro, Inc. (Leisure Products) . . . . . . . . . . . . . . . . . . . . . . . . . . . . . . . . . . . . . . . . . . . . . 3.900% 11/19/2029 2,000,000 2,011,989KB Home (Household Durables) . . . . . . . . . . . . . . . . . . . . . . . . . . . . . . . . . . . . . . . . . . . . . 4.800% 11/15/2029 200,000 204,000Lear Corp. (Auto Components) . . . . . . . . . . . . . . . . . . . . . . . . . . . . . . . . . . . . . . . . . . . . . . 5.250% 01/15/2025 3,172,000 3,260,848
7,947,111
CONSUMER STAPLES – 2.1%Anheuser-Busch Cos. LLC / Anheuser-Busch InBev Worldwide, Inc. (Beverages). . . . . . . . . . . . . . 4.700% 02/01/2036 2,000,000 2,306,704B.A.T. Capital Corp. (Tobacco) . . . . . . . . . . . . . . . . . . . . . . . . . . . . . . . . . . . . . . . . . . . . . . 3.215% 09/06/2026 1,000,000 1,006,558Campbell Soup Co. (Food Products) . . . . . . . . . . . . . . . . . . . . . . . . . . . . . . . . . . . . . . . . . . 4.150% 03/15/2028 2,000,000 2,168,782Diageo Capital PLC (Beverages). . . . . . . . . . . . . . . . . . . . . . . . . . . . . . . . . . . . . . . . . . . . . 2.375% 10/24/2029 2,000,000 1,970,293Keurig Dr Pepper, Inc. (Beverages) . . . . . . . . . . . . . . . . . . . . . . . . . . . . . . . . . . . . . . . . . . . 3.430% 06/15/2027 1,000,000 1,040,857
Ohio National Fund, Inc. ON BlackRock Balanced Allocation Portfolio (Continued)
Schedule of Investments December 31, 2019
16 (continued)

Corporate Bonds (Continued) Rate Maturity Face Amount Value
CONSUMER STAPLES (continued)Kraft Heinz Foods Co. (Food Products) . . . . . . . . . . . . . . . . . . . . . . . . . . . . . . . . . . . . . . . . . (b) 4.875% 02/15/2025 $1,635,000 $ 1,679,877Mead Johnson Nutrition Co. (Food Products) . . . . . . . . . . . . . . . . . . . . . . . . . . . . . . . . . . . . 3.000% 11/15/2020 100,000 100,873Philip Morris International, Inc. (Tobacco) . . . . . . . . . . . . . . . . . . . . . . . . . . . . . . . . . . . . . . 3.375% 08/11/2025 100,000 105,085Philip Morris International, Inc. (Tobacco) . . . . . . . . . . . . . . . . . . . . . . . . . . . . . . . . . . . . . . 3.375% 08/15/2029 1,000,000 1,048,639
11,427,668
ENERGY – 2.7%Apache Corp. (Oil, Gas & Consumable Fuels). . . . . . . . . . . . . . . . . . . . . . . . . . . . . . . . . . . . . 4.375% 10/15/2028 1,000,000 1,044,009Baker Hughes, a GE Co. LLC / Baker Hughes Co-Obligor, Inc. (Energy Equip. & Svs.) . . . . . . . . . . . . 3.337% 12/15/2027 1,000,000 1,042,658BP Capital Markets America, Inc. (Oil, Gas & Consumable Fuels) . . . . . . . . . . . . . . . . . . . . . . . . 3.017% 01/16/2027 1,000,000 1,034,986Chevron Corp. (Oil, Gas & Consumable Fuels) . . . . . . . . . . . . . . . . . . . . . . . . . . . . . . . . . . . . 2.895% 03/03/2024 100,000 103,577Concho Resources, Inc. (Oil, Gas & Consumable Fuels) . . . . . . . . . . . . . . . . . . . . . . . . . . . . . . 3.750% 10/01/2027 1,000,000 1,050,501Continental Resources, Inc. (Oil, Gas & Consumable Fuels) . . . . . . . . . . . . . . . . . . . . . . . . . . . . 5.000% 09/15/2022 2,718,000 2,736,113Energy Transfer Operating LP (Oil, Gas & Consumable Fuels). . . . . . . . . . . . . . . . . . . . . . . . . . . 4.950% 06/15/2028 1,000,000 1,094,490EOG Resources, Inc. (Oil, Gas & Consumable Fuels) . . . . . . . . . . . . . . . . . . . . . . . . . . . . . . . . 3.150% 04/01/2025 100,000 104,915EQM Midstream Partners LP (Oil, Gas & Consumable Fuels) . . . . . . . . . . . . . . . . . . . . . . . . . . . 4.750% 07/15/2023 100,000 100,253Exxon Mobil Corp. (Oil, Gas & Consumable Fuels) . . . . . . . . . . . . . . . . . . . . . . . . . . . . . . . . . . 4.114% 03/01/2046 100,000 117,143Halliburton Co. (Energy Equip. & Svs.) . . . . . . . . . . . . . . . . . . . . . . . . . . . . . . . . . . . . . . . . . 4.850% 11/15/2035 100,000 112,910Kinder Morgan Energy Partners LP (Oil, Gas & Consumable Fuels) . . . . . . . . . . . . . . . . . . . . . . . 4.150% 03/01/2022 75,000 77,876Kinder Morgan, Inc. (Oil, Gas & Consumable Fuels). . . . . . . . . . . . . . . . . . . . . . . . . . . . . . . . . 5.300% 12/01/2034 1,000,000 1,175,934Marathon Oil Corp. (Oil, Gas & Consumable Fuels) . . . . . . . . . . . . . . . . . . . . . . . . . . . . . . . . . 3.850% 06/01/2025 150,000 158,703Marathon Petroleum Corp. (Oil, Gas & Consumable Fuels) . . . . . . . . . . . . . . . . . . . . . . . . . . . . 3.800% 04/01/2028 150,000 157,710MPLX LP (Oil, Gas & Consumable Fuels). . . . . . . . . . . . . . . . . . . . . . . . . . . . . . . . . . . . . . . . (b) 6.375% 05/01/2024 1,000,000 1,045,602ONEOK, Inc. (Oil, Gas & Consumable Fuels). . . . . . . . . . . . . . . . . . . . . . . . . . . . . . . . . . . . . . 4.000% 07/13/2027 150,000 159,571Peabody Energy Corp. (Oil, Gas & Consumable Fuels) . . . . . . . . . . . . . . . . . . . . . . . . . . . . . . . (b) 6.000% 03/31/2022 200,000 195,000Shell International Finance BV (Oil, Gas & Consumable Fuels) . . . . . . . . . . . . . . . . . . . . . . . . . . 4.000% 05/10/2046 1,500,000 1,706,676Williams Cos., Inc. / The (Oil, Gas & Consumable Fuels) . . . . . . . . . . . . . . . . . . . . . . . . . . . . . . 3.350% 08/15/2022 109,000 111,628Williams Cos., Inc. / The (Oil, Gas & Consumable Fuels) . . . . . . . . . . . . . . . . . . . . . . . . . . . . . . 3.750% 06/15/2027 1,000,000 1,041,889Williams Cos., Inc. / The (Oil, Gas & Consumable Fuels) . . . . . . . . . . . . . . . . . . . . . . . . . . . . . . 5.400% 03/04/2044 100,000 112,434
14,484,578
FINANCIALS – 6.8%AerCap Ireland Capital DAC / AerCap Global Aviation Trust (Diversified Financial Svs.) . . . . . . . . . . 3.300% 01/23/2023 1,000,000 1,024,465AerCap Ireland Capital DAC / AerCap Global Aviation Trust (Diversified Financial Svs.) . . . . . . . . . . 4.875% 01/16/2024 1,000,000 1,083,272American International Group, Inc. (Insurance) . . . . . . . . . . . . . . . . . . . . . . . . . . . . . . . . . . . 3.875% 01/15/2035 150,000 158,940Bank of America Corp. (Banks) . . . . . . . . . . . . . . . . . . . . . . . . . . . . . . . . . . . . . . . . . . . . . 3.875% 08/01/2025 1,000,000 1,073,851Bank of Montreal (Rate is fixed until 12/15/2027, at which point, the rate becomes USSW5 + 143)
(Banks) . . . . . . . . . . . . . . . . . . . . . . . . . . . . . . . . . . . . . . . . . . . . . . . . . . . . . . . . . . (c) 3.803% 12/15/2032 200,000 208,590Bank of New York Mellon Corp. / The (Capital Markets) . . . . . . . . . . . . . . . . . . . . . . . . . . . . . . 3.300% 08/23/2029 200,000 209,092Berkshire Hathaway, Inc. (Diversified Financial Svs.). . . . . . . . . . . . . . . . . . . . . . . . . . . . . . . . 3.125% 03/15/2026 100,000 105,299CIT Bank NA (Rate is fixed until 09/27/2024, at which point, the rate becomes SOFR + 172) (Banks) . . . (c) 2.969% 09/27/2025 2,000,000 1,995,000Citigroup, Inc. (Banks) . . . . . . . . . . . . . . . . . . . . . . . . . . . . . . . . . . . . . . . . . . . . . . . . . . . 4.400% 06/10/2025 100,000 108,602Citigroup, Inc. (Rate is fixed until 07/24/2027, at which point, the rate becomes QL + 139) (Banks) . . . . (c) 3.668% 07/24/2028 1,000,000 1,064,847Citigroup, Inc. (Rate is fixed until 11/05/2029, at which point, the rate becomes SOFR + 142) (Banks) . . (c) 2.976% 11/05/2030 1,000,000 1,014,020Comerica, Inc. (Banks) . . . . . . . . . . . . . . . . . . . . . . . . . . . . . . . . . . . . . . . . . . . . . . . . . . 3.800% 07/22/2026 100,000 105,302Deutsche Bank AG (Capital Markets) . . . . . . . . . . . . . . . . . . . . . . . . . . . . . . . . . . . . . . . . . 2.700% 07/13/2020 200,000 200,138Discover Bank (Banks) . . . . . . . . . . . . . . . . . . . . . . . . . . . . . . . . . . . . . . . . . . . . . . . . . . 2.450% 09/12/2024 1,000,000 996,867Discover Bank (Rate is fixed until 08/09/2023, at which point, the rate becomes USSW5 + 173) (Banks). (c) 4.682% 08/09/2028 250,000 261,250E*TRADE Financial Corp. (Capital Markets) . . . . . . . . . . . . . . . . . . . . . . . . . . . . . . . . . . . . . . 2.950% 08/24/2022 200,000 203,652Ford Motor Credit Co. LLC (Consumer Finance) . . . . . . . . . . . . . . . . . . . . . . . . . . . . . . . . . . . 3.157% 08/04/2020 100,000 100,395General Motors Financial Co., Inc. (Consumer Finance) . . . . . . . . . . . . . . . . . . . . . . . . . . . . . . 4.200% 03/01/2021 1,500,000 1,532,259General Motors Financial Co., Inc. (Consumer Finance) . . . . . . . . . . . . . . . . . . . . . . . . . . . . . . 3.200% 07/06/2021 100,000 101,358Goldman Sachs Group, Inc. / The (Capital Markets). . . . . . . . . . . . . . . . . . . . . . . . . . . . . . . . . 3.750% 05/22/2025 1,000,000 1,060,522Goldman Sachs Group, Inc. / The (Rate is fixed until 06/05/2027, at which point, the rate becomes QL +
151) (Capital Markets) . . . . . . . . . . . . . . . . . . . . . . . . . . . . . . . . . . . . . . . . . . . . . . . . . (c) 3.691% 06/05/2028 1,000,000 1,061,539Jefferies Group LLC / Jefferies Group Capital Finance, Inc. (Diversified Financial Svs.). . . . . . . . . . . 4.850% 01/15/2027 200,000 220,669JPMorgan Chase & Co. (Banks) . . . . . . . . . . . . . . . . . . . . . . . . . . . . . . . . . . . . . . . . . . . . . 3.250% 09/23/2022 100,000 103,410JPMorgan Chase & Co. (Banks) . . . . . . . . . . . . . . . . . . . . . . . . . . . . . . . . . . . . . . . . . . . . . 3.625% 12/01/2027 1,000,000 1,055,377Marsh & McLennan Cos., Inc. (Insurance) . . . . . . . . . . . . . . . . . . . . . . . . . . . . . . . . . . . . . . 3.500% 06/03/2024 100,000 104,972Morgan Stanley (Capital Markets) . . . . . . . . . . . . . . . . . . . . . . . . . . . . . . . . . . . . . . . . . . . 3.950% 04/23/2027 1,000,000 1,071,730Nasdaq, Inc. (Capital Markets) . . . . . . . . . . . . . . . . . . . . . . . . . . . . . . . . . . . . . . . . . . . . . 3.850% 06/30/2026 1,000,000 1,070,411Northern Trust Corp. (Capital Markets) . . . . . . . . . . . . . . . . . . . . . . . . . . . . . . . . . . . . . . . . 3.950% 10/30/2025 200,000 217,497PNC Bank NA (Banks) . . . . . . . . . . . . . . . . . . . . . . . . . . . . . . . . . . . . . . . . . . . . . . . . . . . 3.250% 06/01/2025 500,000 524,241PNC Bank NA (Banks) . . . . . . . . . . . . . . . . . . . . . . . . . . . . . . . . . . . . . . . . . . . . . . . . . . . 4.050% 07/26/2028 1,950,000 2,138,212Principal Financial Group, Inc. (Rate is fixed until 05/15/2020, at which point, the rate becomes QL +
304) (Insurance) . . . . . . . . . . . . . . . . . . . . . . . . . . . . . . . . . . . . . . . . . . . . . . . . . . . . . (c) 4.700% 05/15/2055 4,250,000 4,265,937Progressive Corp. / The (Insurance) . . . . . . . . . . . . . . . . . . . . . . . . . . . . . . . . . . . . . . . . . . 2.450% 01/15/2027 100,000 100,308Prudential Financial, Inc. (Rate is fixed until 09/15/2022, at which point, the rate becomes QL + 418)
(Insurance) . . . . . . . . . . . . . . . . . . . . . . . . . . . . . . . . . . . . . . . . . . . . . . . . . . . . . . . . (c) 5.875% 09/15/2042 4,000,000 4,300,000Raymond James Financial, Inc. (Capital Markets) . . . . . . . . . . . . . . . . . . . . . . . . . . . . . . . . . . 3.625% 09/15/2026 150,000 158,400
Ohio National Fund, Inc. ON BlackRock Balanced Allocation Portfolio (Continued)
Schedule of Investments December 31, 2019
17 (continued)

Corporate Bonds (Continued) Rate Maturity Face Amount Value
FINANCIALS (continued)Royal Bank of Scotland Group PLC (Rate is fixed until 11/01/2024, at which point, the rate becomes
H15T5Y + 210) (Banks) . . . . . . . . . . . . . . . . . . . . . . . . . . . . . . . . . . . . . . . . . . . . . . . . . (c) 3.754% 11/01/2029 $ 800,000 $ 816,315S&P Global, Inc. (Capital Markets) . . . . . . . . . . . . . . . . . . . . . . . . . . . . . . . . . . . . . . . . . . . 4.000% 06/15/2025 150,000 163,010Synchrony Financial (Consumer Finance) . . . . . . . . . . . . . . . . . . . . . . . . . . . . . . . . . . . . . . . 4.250% 08/15/2024 1,000,000 1,066,463TD Ameritrade Holding Corp. (Capital Markets) . . . . . . . . . . . . . . . . . . . . . . . . . . . . . . . . . . . 3.300% 04/01/2027 1,000,000 1,046,371Teachers Insurance & Annuity Association of America (Insurance) . . . . . . . . . . . . . . . . . . . . . . (b) 4.270% 05/15/2047 100,000 113,389Truist Bank (Rate is fixed until 09/17/2024, at which point, the rate becomes H15T5Y + 115) (Banks) . . . (c) 2.636% 09/17/2029 3,000,000 2,996,837Volkswagen Group of America Finance LLC (Consumer Finance) . . . . . . . . . . . . . . . . . . . . . . . . (b) 4.625% 11/13/2025 200,000 221,209Wells Fargo & Co. (Banks) . . . . . . . . . . . . . . . . . . . . . . . . . . . . . . . . . . . . . . . . . . . . . . . . 3.500% 03/08/2022 75,000 77,445Wells Fargo & Co. (Banks) . . . . . . . . . . . . . . . . . . . . . . . . . . . . . . . . . . . . . . . . . . . . . . . . 3.000% 04/22/2026 1,500,000 1,540,844Westpac Banking Corp. (Rate is fixed until 11/23/2026, at which point, the rate becomes USISDA05 +
224) (Banks). . . . . . . . . . . . . . . . . . . . . . . . . . . . . . . . . . . . . . . . . . . . . . . . . . . . . . . . (c) 4.322% 11/23/2031 200,000 211,56437,253,871
HEALTH CARE – 2.6%AbbVie, Inc. (Biotechnology) . . . . . . . . . . . . . . . . . . . . . . . . . . . . . . . . . . . . . . . . . . . . . . . 2.900% 11/06/2022 1,000,000 1,020,058AbbVie, Inc. (Biotechnology) . . . . . . . . . . . . . . . . . . . . . . . . . . . . . . . . . . . . . . . . . . . . . . . (b) 3.200% 11/21/2029 1,000,000 1,016,674AbbVie, Inc. (Biotechnology) . . . . . . . . . . . . . . . . . . . . . . . . . . . . . . . . . . . . . . . . . . . . . . . (b) 4.250% 11/21/2049 2,000,000 2,104,887Becton Dickinson and Co. (Health Care Equip. & Supplies) . . . . . . . . . . . . . . . . . . . . . . . . . . . . 3.875% 05/15/2024 3,000,000 3,154,759Bristol-Myers Squibb Co. (Pharmaceuticals) . . . . . . . . . . . . . . . . . . . . . . . . . . . . . . . . . . . . . (b) 3.875% 08/15/2025 150,000 162,152CVS Health Corp. (Health Care Providers & Svs.) . . . . . . . . . . . . . . . . . . . . . . . . . . . . . . . . . . 4.100% 03/25/2025 2,250,000 2,413,444HCA, Inc. (Health Care Providers & Svs.) . . . . . . . . . . . . . . . . . . . . . . . . . . . . . . . . . . . . . . . 5.250% 06/15/2026 2,000,000 2,238,605UnitedHealth Group, Inc. (Health Care Providers & Svs.) . . . . . . . . . . . . . . . . . . . . . . . . . . . . . 3.875% 12/15/2028 2,000,000 2,211,461
14,322,040
INDUSTRIALS – 1.5%Air Lease Corp. (Trading Companies & Distributors) . . . . . . . . . . . . . . . . . . . . . . . . . . . . . . . . 2.250% 01/15/2023 1,000,000 1,000,259Boeing Co. / The (Aerospace & Defense) . . . . . . . . . . . . . . . . . . . . . . . . . . . . . . . . . . . . . . . 3.200% 03/01/2029 1,500,000 1,562,223Burlington Northern Santa Fe LLC (Road & Rail) . . . . . . . . . . . . . . . . . . . . . . . . . . . . . . . . . . . 4.550% 09/01/2044 100,000 118,885FedEx Corp. (Air Freight & Logistics) . . . . . . . . . . . . . . . . . . . . . . . . . . . . . . . . . . . . . . . . . . 4.900% 01/15/2034 1,000,000 1,139,872Lockheed Martin Corp. (Aerospace & Defense) . . . . . . . . . . . . . . . . . . . . . . . . . . . . . . . . . . . 3.600% 03/01/2035 100,000 109,137Northrop Grumman Corp. (Aerospace & Defense) . . . . . . . . . . . . . . . . . . . . . . . . . . . . . . . . . 2.930% 01/15/2025 100,000 103,023Parker-Hannifin Corp. (Machinery) . . . . . . . . . . . . . . . . . . . . . . . . . . . . . . . . . . . . . . . . . . . 4.200% 11/21/2034 100,000 110,511Union Pacific Corp. (Road & Rail) . . . . . . . . . . . . . . . . . . . . . . . . . . . . . . . . . . . . . . . . . . . . 3.250% 08/15/2025 100,000 105,324United Rentals North America, Inc. (Trading Companies & Distributors) . . . . . . . . . . . . . . . . . . . . 4.875% 01/15/2028 1,000,000 1,041,230United Rentals North America, Inc. (Trading Companies & Distributors) . . . . . . . . . . . . . . . . . . . . 5.250% 01/15/2030 100,000 107,630USG Corp. (Building Products) . . . . . . . . . . . . . . . . . . . . . . . . . . . . . . . . . . . . . . . . . . . . . . (b) 5.500% 03/01/2025 2,700,000 2,706,750Waste Connections, Inc. (Commercial Svs. & Supplies) . . . . . . . . . . . . . . . . . . . . . . . . . . . . . . 4.250% 12/01/2028 200,000 222,750
8,327,594
INFORMATION TECHNOLOGY – 0.9%Apple, Inc. (Tech. Hardware, Storage & Periph.). . . . . . . . . . . . . . . . . . . . . . . . . . . . . . . . . . . 2.500% 02/09/2025 100,000 101,764Apple, Inc. (Tech. Hardware, Storage & Periph.). . . . . . . . . . . . . . . . . . . . . . . . . . . . . . . . . . . 2.200% 09/11/2029 2,000,000 1,959,425Hewlett Packard Enterprise Co. (Tech. Hardware, Storage & Periph.) . . . . . . . . . . . . . . . . . . . . . 4.900% 10/15/2025 150,000 166,563Microsoft Corp. (Software) . . . . . . . . . . . . . . . . . . . . . . . . . . . . . . . . . . . . . . . . . . . . . . . . 4.100% 02/06/2037 100,000 117,967Microsoft Corp. (Software) . . . . . . . . . . . . . . . . . . . . . . . . . . . . . . . . . . . . . . . . . . . . . . . . 4.450% 11/03/2045 100,000 124,836Oracle Corp. (Software) . . . . . . . . . . . . . . . . . . . . . . . . . . . . . . . . . . . . . . . . . . . . . . . . . . 4.300% 07/08/2034 2,100,000 2,452,217Seagate HDD Cayman (Tech. Hardware, Storage & Periph.) . . . . . . . . . . . . . . . . . . . . . . . . . . . 4.875% 03/01/2024 100,000 106,542
5,029,314
MATERIALS – 1.2%Anglo American Capital PLC (Metals & Mining) . . . . . . . . . . . . . . . . . . . . . . . . . . . . . . . . . . . (b) 4.000% 09/11/2027 100,000 104,671Cemex S.A.B de C.V. (Construction Materials) . . . . . . . . . . . . . . . . . . . . . . . . . . . . . . . . . . . . (b) 5.450% 11/19/2029 400,000 418,000CF Industries, Inc. (Chemicals). . . . . . . . . . . . . . . . . . . . . . . . . . . . . . . . . . . . . . . . . . . . . . (b) 4.500% 12/01/2026 150,000 163,050Dow Chemical Co. / The (Chemicals) . . . . . . . . . . . . . . . . . . . . . . . . . . . . . . . . . . . . . . . . . . 4.250% 10/01/2034 2,000,000 2,188,299Kinross Gold Corp. (Metals & Mining) . . . . . . . . . . . . . . . . . . . . . . . . . . . . . . . . . . . . . . . . . 4.500% 07/15/2027 1,000,000 1,047,500Mosaic Co. / The (Chemicals) . . . . . . . . . . . . . . . . . . . . . . . . . . . . . . . . . . . . . . . . . . . . . . 4.050% 11/15/2027 1,000,000 1,037,280Nutrien Ltd. (Chemicals). . . . . . . . . . . . . . . . . . . . . . . . . . . . . . . . . . . . . . . . . . . . . . . . . . 4.200% 04/01/2029 100,000 110,135Steel Dynamics, Inc. (Metals & Mining) . . . . . . . . . . . . . . . . . . . . . . . . . . . . . . . . . . . . . . . . 2.800% 12/15/2024 1,000,000 1,005,466Yamana Gold, Inc. (Metals & Mining). . . . . . . . . . . . . . . . . . . . . . . . . . . . . . . . . . . . . . . . . . 4.625% 12/15/2027 171,000 178,698
6,253,099
REAL ESTATE – 1.2%Alexandria Real Estate Equities, Inc. (Equity REIT) . . . . . . . . . . . . . . . . . . . . . . . . . . . . . . . . . 3.950% 01/15/2028 1,000,000 1,073,214American Tower Corp. (Equity REIT) . . . . . . . . . . . . . . . . . . . . . . . . . . . . . . . . . . . . . . . . . . 2.750% 01/15/2027 2,000,000 1,995,559Crown Castle International Corp. (Equity REIT). . . . . . . . . . . . . . . . . . . . . . . . . . . . . . . . . . . . 4.000% 03/01/2027 200,000 215,729Healthcare Realty Trust, Inc. (Equity REIT) . . . . . . . . . . . . . . . . . . . . . . . . . . . . . . . . . . . . . . 3.875% 05/01/2025 100,000 105,151Healthpeak Properties, Inc. (Equity REIT) . . . . . . . . . . . . . . . . . . . . . . . . . . . . . . . . . . . . . . . 4.000% 06/01/2025 100,000 107,418Highwoods Realty LP (Equity REIT) . . . . . . . . . . . . . . . . . . . . . . . . . . . . . . . . . . . . . . . . . . . 4.200% 04/15/2029 1,000,000 1,074,303
Ohio National Fund, Inc. ON BlackRock Balanced Allocation Portfolio (Continued)
Schedule of Investments December 31, 2019
18 (continued)

Corporate Bonds (Continued) Rate Maturity Face Amount Value
REAL ESTATE (continued)Highwoods Realty LP (Equity REIT) . . . . . . . . . . . . . . . . . . . . . . . . . . . . . . . . . . . . . . . . . . . 3.050% 02/15/2030 $1,000,000 $ 984,781Welltower, Inc. (Equity REIT) . . . . . . . . . . . . . . . . . . . . . . . . . . . . . . . . . . . . . . . . . . . . . . . 2.700% 02/15/2027 1,000,000 1,003,101
6,559,256
UTILITIES – 3.9%AEP Transmission Co. LLC (Electric Utilities) . . . . . . . . . . . . . . . . . . . . . . . . . . . . . . . . . . . . . 4.000% 12/01/2046 1,000,000 1,109,783AEP Transmission Co. LLC (Electric Utilities) . . . . . . . . . . . . . . . . . . . . . . . . . . . . . . . . . . . . . 3.750% 12/01/2047 1,000,000 1,072,900Alabama Power Co. (Electric Utilities) . . . . . . . . . . . . . . . . . . . . . . . . . . . . . . . . . . . . . . . . . 3.450% 10/01/2049 2,000,000 2,044,898Ameren Corp. (Multi-Utilities) . . . . . . . . . . . . . . . . . . . . . . . . . . . . . . . . . . . . . . . . . . . . . . 2.500% 09/15/2024 1,000,000 1,007,781American Water Capital Corp. (Water Utilities) . . . . . . . . . . . . . . . . . . . . . . . . . . . . . . . . . . . 4.300% 12/01/2042 100,000 111,403Berkshire Hathaway Energy Co. (Multi-Utilities) . . . . . . . . . . . . . . . . . . . . . . . . . . . . . . . . . . . 3.250% 04/15/2028 100,000 105,598Black Hills Corp. (Multi-Utilities). . . . . . . . . . . . . . . . . . . . . . . . . . . . . . . . . . . . . . . . . . . . . 3.050% 10/15/2029 2,500,000 2,487,334Commonwealth Edison Co. (Electric Utilities). . . . . . . . . . . . . . . . . . . . . . . . . . . . . . . . . . . . . 4.350% 11/15/2045 1,000,000 1,169,998Connecticut Light & Power Co. / The (Electric Utilities) . . . . . . . . . . . . . . . . . . . . . . . . . . . . . . 4.000% 04/01/2048 1,000,000 1,144,696Consolidated Edison Co. of New York, Inc. (Multi-Utilities) . . . . . . . . . . . . . . . . . . . . . . . . . . . . 3.850% 06/15/2046 2,000,000 2,148,680Duke Energy Corp. (Electric Utilities) . . . . . . . . . . . . . . . . . . . . . . . . . . . . . . . . . . . . . . . . . . 3.750% 09/01/2046 1,500,000 1,546,786Duke Energy Indiana LLC (Electric Utilities) . . . . . . . . . . . . . . . . . . . . . . . . . . . . . . . . . . . . . . 3.250% 10/01/2049 1,000,000 996,545FirstEnergy Transmission LLC (Electric Utilities) . . . . . . . . . . . . . . . . . . . . . . . . . . . . . . . . . . . (b) 4.550% 04/01/2049 200,000 228,561Florida Power & Light Co. (Electric Utilities) . . . . . . . . . . . . . . . . . . . . . . . . . . . . . . . . . . . . . 3.150% 10/01/2049 2,000,000 2,015,793Fortis, Inc. (Electric Utilities) . . . . . . . . . . . . . . . . . . . . . . . . . . . . . . . . . . . . . . . . . . . . . . . 3.055% 10/04/2026 100,000 102,036Jersey Central Power & Light Co. (Electric Utilities) . . . . . . . . . . . . . . . . . . . . . . . . . . . . . . . . (b) 4.300% 01/15/2026 100,000 108,787Oncor Electric Delivery Co. LLC (Electric Utilities) . . . . . . . . . . . . . . . . . . . . . . . . . . . . . . . . . . 3.100% 09/15/2049 1,000,000 988,572Public Service Electric & Gas Co. (Multi-Utilities) . . . . . . . . . . . . . . . . . . . . . . . . . . . . . . . . . . 3.600% 12/01/2047 1,000,000 1,080,667Vistra Energy Corp. (Ind. Power & Renewable Elec.) . . . . . . . . . . . . . . . . . . . . . . . . . . . . . . . . (b) 8.125% 01/30/2026 1,500,000 1,605,000
21,075,818Total Corporate Bonds (Cost $139,586,597) . . . . . . . . . . . . . . . . . . . . . . . . . . . . . . . . . . . . . . $141,085,207
Asset-Backed Securities – 0.2% Rate Maturity Face Amount Value
INDUSTRIALS – 0.2%American Airlines 2015-1 Class B Pass Through Trust . . . . . . . . . . . . . . . . . . . . . . . . . . . . . . . 3.700% 05/01/2023 $ 119,565 $ 120,366United Airlines 2016-1 Class B Pass Through Trust . . . . . . . . . . . . . . . . . . . . . . . . . . . . . . . . . 3.650% 01/07/2026 174,306 176,984United Airlines 2019-2 Class AA Pass Through Trust . . . . . . . . . . . . . . . . . . . . . . . . . . . . . . . . 2.700% 05/01/2032 1,000,000 1,002,873Total Asset-Backed Securities (Cost $1,293,892) . . . . . . . . . . . . . . . . . . . . . . . . . . . . . . . . . . $ 1,300,223
Rights – 0.0% Quantity Value
HEALTH CARE – 0.0%Bristol-Myers Squibb Co. (Pharmaceuticals) . . . . . . . . . . . . . . . . . . . . . . . . . . . . . . . . . . . . . . . . . . . . . . . . . . . . . . . . . (a) 10,603 $ 31,915Total Rights (Cost $22,584) . . . . . . . . . . . . . . . . . . . . . . . . . . . . . . . . . . . . . . . . . . . . . . . . . . . . . . . . . . . . . . . . . . . . $ 31,915
Money Market Funds – 1.0% Shares Value
State Street Institutional Liquid Reserves Fund Institutional Class, 1.734% . . . . . . . . . . . . . . . . . . . . . . . . . . . . . . . . . . . . . . . . (d) 5,704,139 $ 5,704,709Total Money Market Funds (Cost $5,704,741) . . . . . . . . . . . . . . . . . . . . . . . . . . . . . . . . . . . . . . . . . . . . . . . . . . . . . . . . . . . . . $ 5,704,709Total Investments – 99.7% (Cost $497,376,983) . . . . . . . . . . . . . . . . . . . . . . . . . . . . . . . . . . . . . . . . . . . . . . . . . . . . . . . . . . . . . . (e) $543,833,504Other Assets in Excess of Liabilities – 0.3% . . . . . . . . . . . . . . . . . . . . . . . . . . . . . . . . . . . . . . . . . . . . . . . . . . . . . . . . . . . . . . (f) 1,384,716Net Assets – 100.0% $545,218,220
Percentages are stated as a percent of net assets.Abbreviations:
ADR: American Depositary ReceiptsH15T5Y: U.S. Treasury Yield Curve Rate T-Note Constant Maturity 5 Year, 1.690% at 12/31/2019QL: Quarterly U.S. LIBOR Rate, 1.908% at 12/31/2019SOFR: Secured Overnight Financing Rate, 1.550% at 12/31/2019USISDA05: USD ICE Swap Rate 11:00am NY 5 Year, 1.690% at 12/31/2019USSW5: USD Swap Semi 30/360 5 Year, 1.729% at 12/31/2019
Footnotes:(a) Non-income producing security.(b) Security exempt from registration under Regulation D of the Securities Act of 1933. These securities may be resold in transactions exempt from registration,
normally to qualified buyers under Rule 144A. At December 31, 2019, the value of these securities totaled $12,834,612, or 2.4% of the Portfolio’s net assets.(c) Security is a fixed-then-variable rate instrument in which the coupon or dividend rate is fixed until a later specified date, then is adjusted periodically. Rates
stated, including interest rate caps and floors, if any, are those in effect at December 31, 2019.(d) Rate represents the seven-day yield at December 31, 2019.(e) Represents cost for financial reporting purposes, which may differ from cost basis for federal income tax purposes. See also Note 8 of the Notes to Financial
Statements.(f) Includes $163,800 of cash pledged as collateral for the futures contracts outstanding at December 31, 2019. See also the following Schedule of Open Futures
Contracts.
The accompanying notes are an integral part of these financial statements.
Ohio National Fund, Inc. ON BlackRock Balanced Allocation Portfolio (Continued)
Schedule of Investments December 31, 2019
19 (continued)

Schedule of Open Futures Contracts December 31, 2019
DescriptionNumber ofcontracts Expiration Date
NotionalAmount Value
UnrealizedAppreciation
(Depreciation)
Variation MarginReceivable(Payable)
CME E-mini S&P 500 Index - Long 26 March 20, 2020 $4,138,269 $4,200,430 $62,161 $2,923
The accompanying notes are an integral part of these financial statements.
Ohio National Fund, Inc. ON BlackRock Balanced Allocation Portfolio (Continued)
20

Objective/Strategy
The ON International Equity Portfolio seeks long-term growth of capitalby investing, under normal circumstances, at least 80% of its net assetsin equity securities of foreign companies.
Performance as of December 31, 2019
Average Annual returnsOne year 20.72%Five years 4.68%Ten years 4.21%
Past performance does not guarantee future results. The performance dataquoted represents past performance and current returns may be lower or higher.Total return figures include change in share price and reinvestment of dividendsand capital gains. The investment return and principal value will fluctuate so thatan investor’s shares, when redeemed, may be worth more or less than the originalcost. To obtain performance information up to the most recent month end, calltoll-free 1-877-781-6392.
The Portfolio is not open to direct retail investment. Beneficial interest in shares isobtained solely by purchase of variable life insurance policies and variable annuitycontracts. Actual performance results for variable annuity and variable universallife contracts will be lower due to contract charges. Consult your contract forapplicable charges.
Total expense ratio is 0.82% per the Fund’s prospectus dated November 22, 2019.Additional information pertaining to the Portfolio’s expense ratio as ofDecember 31, 2019 can be found in the Portfolio’s Financial Highlights.
Comments from Sub-Adviser
Q. How did the Portfolio perform in comparison to its benchmark duringthe reporting period?
A. For the year ended December 31, 2019, the Portfolio returned 20.72%versus 22.01% for its benchmark, the MSCI EAFE Index (Net – USD).
Effective December 7, 2019, BlackRock Investment Management, LLC(“BlackRock”) replaced the Portfolio’s previous sub-adviser, LazardAsset Management, LLC (“Lazard”). The Portfolio’s benchmark wasunchanged.
For the period from January 1, 2019 to December 6, 2019 (the “firstperformance period”), the Portfolio returned 18.06% versus 18.62% forthe MSCI EAFE Index (Net – USD).
For the period from December 7, 2019 to December 31, 2019 (the “latterperformance period”), the Portfolio returned 2.25% versus 2.86% for theMSCI EAFE Index (Net – USD).
Q. Were there specific market conditions, investment strategies, ortechniques that materially affected the Portfolio’s benchmark-relativeperformance during the reporting period?
A. Lazard: Equity markets rose strongly on the back of encouraginggeo-political news regarding trade and Brexit, while accommodativecentral bank policy was also a strong driver of equity returns. While highquality and growth stocks continued to lead the market for the firstperformance period, deep value cyclical stocks rallied at the beginningof September, as the prospect of improving global growth drove interestrates higher. Despite this, growth stocks finished the first performanceperiod well ahead of value stocks.
A. BlackRock: International equity markets continued to climb inDecember, as an easing of global trade tensions, supportive central bankpolicy, and improving economic indicators, particularly in Germany, allhelped drive positive returns throughout the fourth quarter and into theend of the year. As markets were largely driven by geopolitical and broad
macroeconomic factors, including a widely-followed general election inthe U.K., some of the Portfolio’s stock selection insights struggledthroughout the period. Given the continuously evolving geopolitical andmarket landscape late in the year, the Portfolio’s trend-based insightswere challenged throughout the latter performance period. Similarly,sentiment-driven signals struggled as the macro-driven market moveswere often disconnected from stock-specific sentiment. Insightsevaluating company fundamentals were mixed during the latterperformance period, as signals designed to identify relative valueopportunities, as well as the Portfolio’s company quality signals, weregenerally flat, detracting modestly in aggregate. Lastly, macro thematicinsights were broadly mixed amongst both country timing and industrytiming signals.
Q. How did country selection impact the Portfolio’s performancerelative to its benchmark?
A. Lazard: Lazard’s relative value investment philosophy is based onvalue creation through the process of bottom-up stock selection. Thisphilosophy is implemented by assessing the trade-off between valuationand financial productivity for an individual security. As such, sector andcountry/regional weightings are a residual of its bottom up stockselection process. The Portfolio’s attribution has historically beenprimarily driven by stock selection. During the first performance period,the Portfolio’s overall country allocation effect was slightly negative,although this was offset by security selection.
A. BlackRock: The Portfolio targets a relatively country-neutralapproach. That being said, maintaining a modest underweight to Japancontributed to results for the latter performance period, whereas amodest underweight to Hong Kong detracted from relative returns. Froma country perspective, stock selection was strongest in Switzerland andHong Kong. Selection was weakest in Japan and Spain. (1)
Q. How did sector allocation and security selection each impact thePortfolio’s performance relative to its benchmark? For sector allocation,were there any factors that impacted the benchmark’s performancemore significantly than the Portfolio’s performance? For stock selection,was there anything specific regarding the Portfolio’s strategy thatcaused deviation from the benchmark?
A. Lazard: Relative returns for the first performance period were helpedby stock selection in the Financials, Materials, and Consumer Staplessectors. Relative returns were hurt by stock selection within theConsumer Discretionary, Health Care, and Real Estate Sectors.Allocation also detracted, with underweights to Consumer Discretionaryand Health Care. Cash was the largest detractor from relative returns.
A. BlackRock: The portfolio management team targets a relativelysector-neutral approach and seeks to derive the majority of its alphafrom security selection. Over the latter performance period, no sectorallocation decisions meaningfully affected relative returns. The majorityof the Portfolio’s excess returns were driven by security selectiondecisions. Stock selection in the Health Care sector, especially amongpharmaceuticals companies, added to performance. Selection in theIndustrials sector further bolstered performance. In contrast, securityselection within the Consumer Staples sector, in particular amongbeverage companies, was a notable detractor from relativeperformance. Selection in the Materials sector, especially within thechemicals industry, hindered relative returns as well.(1)
Q. Which holdings contributed the most to, and detracted the most from,the Portfolio’s benchmark-relative performance?
A. Lazard: Aon PLC, the global insurance broker domiciled in the UnitedKingdom, was the top relative contributor during the first performanceperiod. This long-term, non-benchmark holding has demonstrated theability to generate strong free cash flow from operating leverage derivedfrom strong organic revenue growth and disciplined spending and
Ohio National Fund, Inc. ON International Equity Portfolio (Unaudited)
21 (continued)

capital allocation. We believe Aon is well positioned to delivermid-single-digit revenue growth and margin expansion, as the businessmix shifts to higher growth/margin businesses, such as intellectualproperty, cyber, delegated investments, and as they divest from lowerreturn businesses. SAP SE, a German enterprise software company withhigh margin licensing fees and maintenance contracts, was the nextlargest relative contributor. With a new product cycle underway and alarge recurring revenue base, we believe SAP SE represents anattractive relative value investment opportunity. Safran SA, the thirdhighest relative contributor for the first performance period, is a Frenchtier-1 supplier of systems and equipment in aerospace, defense, andsecurity and is a lead partner in the world’s propulsion business. Thestock outperformed after reporting better-than-expected results. Thecompany’s organic sales grew 14%, led by propulsion, which grew 19%.Critical to our thesis, margins also grew, with higher margin aftermarketsales growth of 10% combined with continued restructuring benefitsfrom the acquired Zodiac business.
ABN AMRO Bank N.V. (“ABN AMRO”), the top relative detractor duringthe first performance period, is a high quality bank domiciled in theNetherlands that fell 24% during the period. Significantly lower interestrates drove the banking sector lower, and ABN AMRO was not immune.The company guided net interest income 2% lower for 2020 based onlower rates. With a strong tier-1 capital base of 14%, the company hassignificant excess capital. Daiwa House Industry Co. Ltd., the secondlargest detractor, is a Japanese real estate developer and one of thelargest developers of residential real estate (both detached and rental).The company has significantly diversified its footprint into developinglogistics facilities, retail and convenience stores, as well as energy andhealthcare facilities, to balance its exposure to the mature residentialmarket. The company reported a slowdown in rental apartments in thefirst half of the year and forecasted a weaker than expected second half,which overshadowed upward revisions in its commercial and logisticsbusinesses. Red Electrica, the third largest relative detractor for the firstperformance period, is a Spanish utility that underperformed as themarket worried about the Spanish political climate.
A. BlackRock: The Portfolio’s overweight position in Sanofi was thelargest contributor to relative performance over the latter performanceperiod. The stock surged on an announcement that it was ending itsresearch into diabetes and heart disease drugs and shifting its focusonto treatments for cancer, hemophilia, MS and rare diseases. In linewith this initiative, the French pharmaceutical company announcedplans to buy U.S. biotech company Synthorx, Inc. in mid-December,which was also supported by investors. Remaining overweightPrudential PLC was beneficial as well, as shares of the companyincreased on news that the company had received approval to offer lifeinsurance products and solutions in new Asian markets. An overweightposition in Informa PLC, a British multinational events and publishingcompany, further supported relative returns, as the stock price rosethroughout the latter performance period. The company’s plans to furtherexpand into the international events industry, in addition to positive 2019financial results, helped drive the share price up. (1)
In contrast, the Portfolio’s overweight position in Assa Abloy AB Class Bwas the largest individual detractor over the latter performance period,as the stock sold off significantly in the first few days as severalprominent sell-side shops downgraded the stock and revised their pricetargets downwards. An overweight position in Safran SA furtherhindered results. As one of The Boeing Co.’s largest European suppliers,Safran SA sold off considerably on news that The Boeing Co. wouldsuspend production of its grounded 737 Max jet in January. Remainingoverweight Telefonica SA also detracted from relative returns, asinvestors reacted negatively to company announcements regarding thestructure of its Latin American business and its continued globaldivestiture of cell towers. (1)
Q. How did the Portfolio’s use of derivative instruments and initialpublic offerings (IPOs), if any, impact performance?
A. Lazard: The Portfolio did not hold any derivatives during the firstperformance period. The Portfolio participated in two IPOs, whichpositively impacted relative return by 6 basis points.
A. BlackRock: Pursuant to the Portfolio’s investment strategy, futurescontracts were used in the latter performance period to equitize cashand prevent a cash drag on performance. The futures did notmeaningfully impact relative performance, however, due to their indexcharacteristics and size in relation to the Portfolio’s net assets. (1)
(1) The Portfolio’s composition is subject to change. Holdings and weightings areas of December 31, 2019.
Change in Value of $10,000 Investment
ON International Equity Portfolio (A)MSCI EAFE Index (Net - USD) (B)
8,000
10,000
12,000
14,000
16,000
$18,000
6/1
012
/10 6
/1112
/11 6
/1212
/12 6
/1312
/13 6
/1412
/14 6
/1512
/15 6
/1612
/16 6
/1712
/17 6
/1812
/18 6
/19
12/3
1/09
12/1
9
$17,085 (B)
$15,098 (A)
Hypothetical illustration based on past performance. Future performance will vary.The Portfolio’s returns reflect reinvested dividends. The Portfolio’s holdings maydiffer significantly from the securities in the index. The index is unmanaged andtherefore does not reflect the cost of portfolio management and accounting.
The MSCI EAFE Index (Net-USD) is a free-float-adjusted market-capitalizationweighted index that is designed to measure the equity market performance of 21developed markets, including countries in Europe, Australasia and the Far East,excluding the U.S. and Canada. The returns for this index include the effects ofreinvested dividends, net of taxes, and adjustment to U.S. Dollar denomination.
Past performance is no guarantee of future results. Redemption of fund sharescould have tax implications unique to each shareholder.
Ohio National Fund, Inc. ON International Equity Portfolio (Unaudited) (Continued)
22 (continued)

Portfolio Composition as of December 31, 2019 (1)
% of Net AssetsCommon Stocks (4) (5) 97.8Money Market Funds and
Other Net Assets 2.2100.0
Top 10 Portfolio Holdings as of December 31, 2019 (1) (2) (3)
% of Net Assets1. Roche Holding AG 2.32. Novartis AG 2.13. LVMH Moet Hennessy Louis Vuitton SE 1.74. SAP SE 1.65. GlaxoSmithKline PLC 1.56. Nestle SA 1.57. British American Tobacco PLC 1.58. Allianz SE 1.59. L’Oreal SA 1.3
10. Zurich Insurance Group AG 1.2
(1) Composition of Portfolio subject to change.(2) Short-term investments have been excluded from the list of Top 10 Portfolio Holdings.(3) Top 10 Portfolio Holdings is presented at an individual security level. Total investment exposure by issuer may be higher.(4) Top 10 Country Weightings (Common Stocks):
% of Net AssetsJapan 22.5United Kingdom 14.4France 12.0Switzerland 10.4Germany 8.3Australia 7.4Netherlands 5.3Finland 2.7Denmark 2.3Sweden 2.0
(5) Sectors (Common Stocks):% of Net Assets
Financials 16.9Industrials 15.9Health Care 12.5Consumer Staples 12.1Consumer Discretionary 11.9Materials 7.4Information Technology 6.4Communication Services 5.5Energy 3.5Real Estate 3.3Utilities 2.4
97.8
Ohio National Fund, Inc. ON International Equity Portfolio (Unaudited) (Continued)
23

Common Stocks – 97.8% Shares Value
JAPAN – 22.5%ABC-Mart, Inc. (Consumer Discretionary) . . . . (a) 2,300 $ 157,001Advantest Corp. (Information Technology) . . . (a) 11,000 620,379Aica Kogyo Co. Ltd. (Industrials) . . . . . . . . . . (a) 1,800 59,396Aisin Seiki Co. Ltd. (Consumer Discretionary). . (a) 2,800 103,711Alfresa Holdings Corp. (Health Care) . . . . . . . (a) 40,300 818,695Amada Holdings Co. Ltd. (Industrials) . . . . . . (a) 138,700 1,577,538Citizen Watch Co. Ltd.
(Information Technology) . . . . . . . . . . . . (a) 2,800 15,249Daicel Corp. (Materials) . . . . . . . . . . . . . . . (a) 1,600 15,297Daido Steel Co. Ltd. (Materials) . . . . . . . . . . (a) 400 17,475Dai-ichi Life Holdings, Inc. (Financials). . . . . . (a) 214,400 3,533,370Daikin Industries Ltd. (Industrials). . . . . . . . . (a) 6,700 945,301Daito Trust Construction Co. Ltd. (Real Estate) . (a) 6,800 840,318Daiwa House Industry Co. Ltd. (Real Estate) . . (a) 104,919 3,247,961Daiwa Office Investment Corp. (Real Estate) . . (a) 14 107,507Denka Co. Ltd. (Materials) . . . . . . . . . . . . . (a) 7,000 208,093Denso Corp. (Consumer Discretionary) . . . . . (a) 86,900 3,924,607Dentsu Group, Inc. (Communication Services) . (a) 11,200 385,905DIC Corp. (Materials). . . . . . . . . . . . . . . . . (a) 42,800 1,181,212Dip Corp. (Communication Services) . . . . . . . (a) 4,100 121,112DMG Mori Co. Ltd. (Industrials) . . . . . . . . . . (a) 2,500 38,250East Japan Railway Co. (Industrials) . . . . . . . (a) 18,500 1,669,846Electric Power Development Co. Ltd. (Utilities) . (a) 2,900 70,390Fast Retailing Co. Ltd.
(Consumer Discretionary) . . . . . . . . . . . . (a) 8,000 4,752,591Fuji Electric Co. Ltd. (Industrials) . . . . . . . . . (a) 600 18,226Fuji Media Holdings, Inc.
(Communication Services). . . . . . . . . . . . (a) 62,500 887,397Fuji Seal International, Inc. (Materials). . . . . . (a) 23,700 525,659Fujikura Ltd. (Industrials) . . . . . . . . . . . . . . (a) 8,900 36,621Furukawa Electric Co. Ltd. (Industrials) . . . . . (a) 1,200 30,719Glory Ltd. (Industrials) . . . . . . . . . . . . . . . . (a) 5,500 166,205Izumi Co. Ltd. (Consumer Discretionary) . . . . . (a) 15,400 554,684Japan Post Holdings Co. Ltd. (Financials) . . . . (a) 65,000 611,290JFE Holdings, Inc. (Materials) . . . . . . . . . . . (a) 8,200 105,218JSR Corp. (Materials) . . . . . . . . . . . . . . . . (a) 75,100 1,373,776JTEKT Corp. (Industrials) . . . . . . . . . . . . . . (a) 42,600 503,238JXTG Holdings, Inc. (Energy) . . . . . . . . . . . . (a) 287,200 1,303,479Kaneka Corp. (Materials) . . . . . . . . . . . . . . (a) 27,600 883,927Kansai Electric Power Co., Inc. / The (Utilities) . (a) 2,200 25,487Kao Corp. (Consumer Staples) . . . . . . . . . . . (a) 60,010 4,949,329Kawasaki Heavy Industries Ltd. (Industrials) . . (a) 22,200 485,219KDDI Corp. (Communication Services) . . . . . . (a) 12,000 358,036Kirin Holdings Co. Ltd. (Consumer Staples) . . . (a) 47,300 1,032,397Kobe Steel Ltd. (Materials) . . . . . . . . . . . . . (a) 21,200 113,593Koito Manufacturing Co. Ltd.
(Consumer Discretionary) . . . . . . . . . . . . (a) 3,900 180,593Konica Minolta, Inc. (Information Technology) . (a) 224,400 1,461,761Kyowa Exeo Corp. (Industrials) . . . . . . . . . . (a) 1,300 32,885Kyushu Electric Power Co., Inc. (Utilities) . . . . (a) 9,000 78,084Makita Corp. (Industrials) . . . . . . . . . . . . . . (a) 108,500 3,747,032Marubeni Corp. (Industrials) . . . . . . . . . . . . (a) 12,200 90,138Maruha Nichiro Corp. (Consumer Staples) . . . (a) 2,500 64,002Maruichi Steel Tube Ltd. (Materials) . . . . . . . (a) 2,200 61,825Mazda Motor Corp. (Consumer Discretionary) . (a) 11,800 100,553MEIJI Holdings Co. Ltd. (Consumer Staples) . . (a) 5,000 337,901Mitsubishi Chemical Holdings Corp.
(Materials) . . . . . . . . . . . . . . . . . . . . . (a) 11,000 81,963Mitsubishi Electric Corp. (Industrials) . . . . . . (a) 38,900 529,650Mitsubishi Gas Chemical Co., Inc. (Materials) . (a) 4,600 70,077Mitsubishi Materials Corp. (Materials) . . . . . . (a) 36,400 987,884Mitsubishi UFJ Financial Group, Inc.
(Financials) . . . . . . . . . . . . . . . . . . . . . (a) 520,900 2,816,159Mitsui Chemicals, Inc. (Materials) . . . . . . . . (a) 52,600 1,281,299Mitsui Mining & Smelting Co. Ltd. (Materials) . (a) 1,600 42,431Mizuho Financial Group, Inc. (Financials) . . . . (a) 1,719,100 2,648,134NGK Spark Plug Co. Ltd.
(Consumer Discretionary) . . . . . . . . . . . . (a) 1,600 31,014Nichirei Corp. (Consumer Staples) . . . . . . . . (a) 6,100 142,497
Common Stocks (Continued) Shares Value
JAPAN (continued)Nidec Corp. (Industrials) . . . . . . . . . . . . . . (a) 23,200 $ 3,168,741Nifco Inc. (Consumer Discretionary) . . . . . . . (a) 6,000 163,854Nihon Kohden Corp. (Health Care) . . . . . . . . (a) 5,900 163,627Nikon Corp. (Consumer Discretionary) . . . . . . (a) 5,800 70,932Nintendo Co. Ltd. (Communication Services) . . (a) 2,800 1,119,888Nippon Electric Glass Co. Ltd.
(Information Technology) . . . . . . . . . . . . (a) 50,400 1,118,876Nippon Paint Holdings Co. Ltd. (Materials) . . . (a) 2,500 128,704Nippon Shokubai Co. Ltd. (Materials). . . . . . . (a) 7,400 458,567Nissan Motor Co. Ltd.
(Consumer Discretionary) . . . . . . . . . . . . (a) 27,000 156,458Nisshin Seifun Group, Inc.
(Consumer Staples) . . . . . . . . . . . . . . . . (a) 12,200 212,859NS Solutions Corp. (Information Technology) . . (a) 500 16,429NSK Ltd. (Industrials). . . . . . . . . . . . . . . . . (a) 24,300 229,713NTN Corp. (Industrials) . . . . . . . . . . . . . . . (a) 27,900 87,246NTT Data Corp. (Information Technology) . . . . (a) 144,700 1,935,215Pan Pacific International Holdings Corp.
(Consumer Discretionary) . . . . . . . . . . . . (a) 4,628 76,784PeptiDream, Inc. (Health Care). . . . . . . . . . . (a)(b) 2,900 148,200Pola Orbis Holdings, Inc. (Consumer Staples) . (a) 29,600 705,044Recruit Holdings Co. Ltd. (Industrials) . . . . . . (a) 12,700 475,683Resona Holdings, Inc. (Financials) . . . . . . . . (a) 416,200 1,814,019Sankyu, Inc. (Industrials) . . . . . . . . . . . . . . (a) 300 15,076Sanwa Holdings Corp. (Industrials) . . . . . . . . (a) 69,000 773,196Secom Co. Ltd. (Industrials) . . . . . . . . . . . . (a) 23,200 2,070,430Seven & I Holdings Co. Ltd.
(Consumer Staples) . . . . . . . . . . . . . . . . (a) 120,900 4,431,638Shin-Etsu Chemical Co. Ltd. (Materials) . . . . . (a) 31,200 3,431,159Shionogi & Co. Ltd. (Health Care) . . . . . . . . . (a) 53,900 3,334,334SMC Corp. (Industrials) . . . . . . . . . . . . . . . (a) 4,600 2,103,650Sumitomo Forestry Co. Ltd.
(Consumer Discretionary) . . . . . . . . . . . . (a) 15,200 223,836Sumitomo Heavy Industries Ltd. (Industrials) . . (a) 39,200 1,113,468Sumitomo Mitsui Financial Group, Inc.
(Financials) . . . . . . . . . . . . . . . . . . . . . (a) 141,400 5,222,659Sumitomo Mitsui Trust Holdings, Inc.
(Financials) . . . . . . . . . . . . . . . . . . . . . (a) 32,400 1,280,803Sumitomo Rubber Industries Ltd.
(Consumer Discretionary) . . . . . . . . . . . . (a) 1,200 14,632Suntory Beverage & Food Ltd.
(Consumer Staples) . . . . . . . . . . . . . . . . (a) 36,100 1,507,127Taisho Pharmaceutical Holdings Co. Ltd.
(Health Care) . . . . . . . . . . . . . . . . . . . . (a) 300 22,139Takeda Pharmaceutical Co. Ltd. (Health Care) . (a) 137,500 5,438,426Teijin Ltd. (Materials) . . . . . . . . . . . . . . . . . (a) 2,100 39,232Tokyo Electron Ltd. (Information Technology). . (a) 11,300 2,467,129Topcon Corp. (Information Technology) . . . . . (a) 19,100 246,868Toyota Industries Corp.
(Consumer Discretionary) . . . . . . . . . . . . (a) 4,100 235,914Toyota Motor Corp. (Consumer Discretionary) . (a) 32,500 2,289,998Toyota Tsusho Corp. (Industrials) . . . . . . . . . (a) 12,200 428,557Trend Micro, Inc. (Information Technology) . . . (a)(b) 29,000 1,483,924Ube Industries Ltd. (Materials). . . . . . . . . . . (a) 44,200 957,294Yakult Honsha Co. Ltd. (Consumer Staples) . . . (a) 4,000 220,450Yamaha Corp. (Consumer Discretionary) . . . . (a) 20,700 1,147,680Yamaha Motor Co. Ltd.
(Consumer Discretionary) . . . . . . . . . . . . (a) 8,100 162,267Yokogawa Electric Corp.
(Information Technology) . . . . . . . . . . . . (a) 36,500 640,979106,715,290
UNITED KINGDOM – 14.4%AstraZeneca PLC (Health Care) . . . . . . . . . . (a) 41,519 4,155,717Berkeley Group Holdings PLC
(Consumer Discretionary) . . . . . . . . . . . . (a) 25,494 1,641,136BP PLC (Energy). . . . . . . . . . . . . . . . . . . . (a) 199,042 1,252,134British American Tobacco PLC
(Consumer Staples) . . . . . . . . . . . . . . . . (a) 164,302 6,983,175
Ohio National Fund, Inc. ON International Equity Portfolio
Schedule of Investments December 31, 2019
24 (continued)

Common Stocks (Continued) Shares Value
UNITED KINGDOM (continued)Compass Group PLC
(Consumer Discretionary) . . . . . . . . . . . . (a) 167,727 $ 4,203,536Diageo PLC (Consumer Staples) . . . . . . . . . . (a) 63,459 2,673,950Ferguson PLC (Industrials) . . . . . . . . . . . . . (a) 12,863 1,170,621GlaxoSmithKline PLC (Health Care) . . . . . . . . (a) 314,525 7,390,401Howden Joinery Group PLC (Industrials) . . . . (a) 143,539 1,278,825HSBC Holdings PLC (Financials) . . . . . . . . . . (a) 264,059 2,067,169Informa PLC (Communication Services) . . . . . (a) 394,841 4,490,774John Wood Group PLC (Energy) . . . . . . . . . . (a) 76,641 406,482London Stock Exchange Group PLC
(Financials) . . . . . . . . . . . . . . . . . . . . . (a) 12,832 1,318,770Moneysupermarket.com Group PLC
(Consumer Discretionary) . . . . . . . . . . . . (a) 312,238 1,370,671Pearson PLC (Communication Services) . . . . . (a) 95,287 804,994Prudential PLC (Financials) . . . . . . . . . . . . . (a) 279,476 5,354,936RELX PLC (Industrials) . . . . . . . . . . . . . . . . (a) 141,331 3,567,665Rightmove PLC (Communication Services) . . . (a) 359,415 3,015,903Rio Tinto PLC (Materials) . . . . . . . . . . . . . . (a) 9,165 542,522RSA Insurance Group PLC (Financials). . . . . . (a) 32,679 244,919Smith & Nephew PLC (Health Care). . . . . . . . (a) 86,610 2,087,364Standard Chartered PLC (Financials) . . . . . . . (a) 148,199 1,396,492Unilever N.V. (Consumer Staples) . . . . . . . . . (a) 19,652 1,127,841Unilever PLC (Consumer Staples) . . . . . . . . . (a) 67,126 3,842,469Vodafone Group PLC
(Communication Services). . . . . . . . . . . . (a) 1,760,328 3,417,454Wm Morrison Supermarkets PLC
(Consumer Staples) . . . . . . . . . . . . . . . . (c) 858,293 2,271,51668,077,436
FRANCE – 12.0%Arkema SA (Materials) . . . . . . . . . . . . . . . (a) 176 18,819BNP Paribas SA (Financials) . . . . . . . . . . . . (a) 19,937 1,185,017Bureau Veritas SA (Industrials) . . . . . . . . . . (a) 33,676 880,356Credit Agricole SA (Financials) . . . . . . . . . . (a) 66,082 961,581Dassault Systemes SE
(Information Technology) . . . . . . . . . . . . (a) 13,874 2,288,174Engie SA (Utilities) . . . . . . . . . . . . . . . . . . (a) 277,872 4,501,060Faurecia SE (Consumer Discretionary) . . . . . . (a) 1,587 86,154Imerys SA (Materials) . . . . . . . . . . . . . . . . (a) 32,866 1,395,090Kering SA (Consumer Discretionary) . . . . . . . (a) 3,094 2,038,681Korian SA (Health Care) . . . . . . . . . . . . . . . (a) 983 46,338Lagardere SCA (Communication Services) . . . (a) 15,566 339,802Legrand SA (Industrials). . . . . . . . . . . . . . . (a) 236 19,273L’Oreal SA (Consumer Staples) . . . . . . . . . . (a) 20,774 6,143,025LVMH Moet Hennessy Louis Vuitton SE
(Consumer Discretionary) . . . . . . . . . . . . (a) 17,000 7,921,212Nexans SA (Industrials) . . . . . . . . . . . . . . . (a) 4,058 198,573Orpea (Health Care) . . . . . . . . . . . . . . . . . (a) 1,004 128,808Pernod Ricard SA (Consumer Staples) . . . . . . (a) 27,347 4,893,405Peugeot SA (Consumer Discretionary) . . . . . . (a) 78,494 1,889,912Publicis Groupe SA
(Communication Services). . . . . . . . . . . . (a) 55,435 2,513,500Renault SA (Consumer Discretionary) . . . . . . (a) 24,588 1,167,621Rexel SA (Industrials) . . . . . . . . . . . . . . . . (a) 280,586 3,731,986Rubis SCA (Utilities) . . . . . . . . . . . . . . . . . (a) 12,737 783,784Safran SA (Industrials). . . . . . . . . . . . . . . . (a) 34,044 5,258,412Sanofi (Health Care) . . . . . . . . . . . . . . . . . (a) 13,757 1,381,580TOTAL SA (Energy) . . . . . . . . . . . . . . . . . . (a) 23,820 1,321,784Vinci SA (Industrials). . . . . . . . . . . . . . . . . (a) 50,122 5,582,265
56,676,212
SWITZERLAND – 10.4%Bucher Industries AG (Industrials) . . . . . . . . (a) 3,901 1,369,089Givaudan SA (Materials) . . . . . . . . . . . . . . (a) 412 1,290,794LafargeHolcim Ltd. (Materials). . . . . . . . . . . (a) 69,562 3,859,123Logitech International SA
(Information Technology) . . . . . . . . . . . . (a) 83,462 3,953,827Nestle SA (Consumer Staples) . . . . . . . . . . . (a) 66,755 7,227,243Novartis AG (Health Care) . . . . . . . . . . . . . (a) 104,020 9,849,609Roche Holding AG (Health Care). . . . . . . . . . (a) 33,918 11,023,440
Common Stocks (Continued) Shares Value
SWITZERLAND (continued)Sika AG (Materials). . . . . . . . . . . . . . . . . . (a) 18,382 $ 3,452,054UBS Group AG (Financials) . . . . . . . . . . . . . (a) 142,375 1,796,685Zurich Insurance Group AG (Financials) . . . . . (a) 13,743 5,637,368
49,459,232
GERMANY – 8.3%adidas AG (Consumer Discretionary) . . . . . . . (a) 1,934 629,552Allianz SE (Financials) . . . . . . . . . . . . . . . . (a) 28,473 6,976,676BASF SE (Materials) . . . . . . . . . . . . . . . . . (a) 8,661 652,491Bayer AG (Health Care) . . . . . . . . . . . . . . . (a) 17,430 1,417,000Bayerische Motoren Werke AG
(Consumer Discretionary) . . . . . . . . . . . . (a) 34,201 2,801,256CompuGroup Medical SE (Health Care) . . . . . (a) 9,042 644,879Continental AG (Consumer Discretionary) . . . . (a) 31,903 4,122,833Daimler AG (Consumer Discretionary) . . . . . . (a) 18,447 1,019,829Deutsche Post AG (Industrials) . . . . . . . . . . (a) 127,619 4,852,604DWS Group GmbH & Co. KGaA (Financials). . . (a) 8,628 306,358Fielmann AG (Consumer Discretionary) . . . . . (a) 229 18,482Hella GmbH & Co. KGaA
(Consumer Discretionary) . . . . . . . . . . . . (a) 835 46,143Merck KGaA (Health Care) . . . . . . . . . . . . . (a) 23,716 2,795,968Rational AG (Industrials) . . . . . . . . . . . . . . (a) 92 73,703SAP SE (Information Technology) . . . . . . . . . (a) 58,250 7,840,341Siemens AG (Industrials) . . . . . . . . . . . . . . (a) 31,981 4,176,448Stroeer SE & Co. KGaA
(Communication Services). . . . . . . . . . . . (a) 537 43,264TAG Immobilien AG (Real Estate) . . . . . . . . . (a) 865 21,483Volkswagen AG (Consumer Discretionary) . . . (a) 4,571 885,333
39,324,643
AUSTRALIA – 7.4%AGL Energy Ltd. (Utilities) . . . . . . . . . . . . . . (a) 130,103 1,872,649Ansell Ltd. (Health Care). . . . . . . . . . . . . . . (a) 4,683 95,359APA Group (Utilities) . . . . . . . . . . . . . . . . . (a) 167,284 1,302,212Aristocrat Leisure Ltd.
(Consumer Discretionary) . . . . . . . . . . . . (a) 157,708 3,726,506ASX Ltd. (Financials) . . . . . . . . . . . . . . . . . (a) 4,773 262,802Bendigo & Adelaide Bank Ltd. (Financials) . . . (a) 240,089 1,647,453BHP Group Ltd. (Materials) . . . . . . . . . . . . . (a) 102,488 2,806,357BHP Group PLC (Materials) . . . . . . . . . . . . . (a) 815 19,099Brambles Ltd. (Industrials) . . . . . . . . . . . . . (a) 41,905 344,908carsales.com Ltd. (Communication Services). . (a) 40,247 469,352Coca-Cola Amatil Ltd. (Consumer Staples) . . . (a) 35,385 274,788Cochlear Ltd. (Health Care) . . . . . . . . . . . . . (a) 701 110,482Commonwealth Bank of Australia (Financials) . (a) 55,998 3,141,365Computershare Ltd. (Information Technology) . (a) 176,641 2,082,581Crown Resorts Ltd. (Consumer Discretionary) . (a) 26,374 222,364CSL Ltd. (Health Care) . . . . . . . . . . . . . . . . (a) 14,130 2,739,553GPT Group / The (Real Estate) . . . . . . . . . . . (a) 172,899 681,056IDP Education Ltd. (Consumer Discretionary). . (a) 30,599 368,851Magellan Financial Group Ltd. (Financials) . . . (a) 1,723 69,032Orica Ltd. (Materials). . . . . . . . . . . . . . . . . (a) 73,935 1,140,113REA Group Ltd. (Communication Services) . . . (a) 749 54,412Scentre Group (Real Estate) . . . . . . . . . . . . (a) 1,576,451 4,242,632Sonic Healthcare Ltd. (Health Care) . . . . . . . (a) 87,855 1,771,414Suncorp Group Ltd. (Financials) . . . . . . . . . . (a) 1,369 12,436Tabcorp Holdings Ltd.
(Consumer Discretionary) . . . . . . . . . . . . (a) 169,874 540,047Treasury Wine Estates Ltd.
(Consumer Staples) . . . . . . . . . . . . . . . . (a) 346,125 3,942,621Westpac Banking Corp. (Financials) . . . . . . . (a) 68,968 1,177,748
35,118,192
NETHERLANDS – 5.3%ABN AMRO Bank N.V. (Financials) . . . . . . . . (a) 146,734 2,674,421Aegon N.V. (Financials) . . . . . . . . . . . . . . . (a) 862,937 3,950,185ASM International N.V.
(Information Technology) . . . . . . . . . . . . (a) 315 35,555ASML Holding N.V. (Information Technology). . (a) 3,610 1,068,764ING Groep N.V. (Financials). . . . . . . . . . . . . (a) 161,587 1,942,664
Ohio National Fund, Inc. ON International Equity Portfolio (Continued)
Schedule of Investments December 31, 2019
25 (continued)

Common Stocks (Continued) Shares Value
NETHERLANDS (continued)NN Group N.V. (Financials) . . . . . . . . . . . . . (a) 105,457 $ 4,009,767Royal Dutch Shell PLC Class A (Energy) . . . . . (a) 174,138 5,156,961Royal Dutch Shell PLC Class B (Energy) . . . . . (a) 85,405 2,535,133Wolters Kluwer N.V. (Industrials) . . . . . . . . . (a) 49,807 3,636,682
25,010,132
FINLAND – 2.7%Fortum Oyj (Utilities) . . . . . . . . . . . . . . . . . (a) 64,333 1,587,958Huhtamaki Oyj (Materials) . . . . . . . . . . . . . (a) 2,272 105,489Kone Oyj Class B (Industrials) . . . . . . . . . . . (a) 67,764 4,430,942Nordea Bank Abp (Financials) . . . . . . . . . . . (a) 346,891 2,806,411TietoEVRY Oyj (Information Technology) . . . . . (a) 48,573 1,510,851UPM-Kymmene Oyj (Materials) . . . . . . . . . . (a) 39,179 1,359,295Valmet Oyj (Industrials) . . . . . . . . . . . . . . . (a) 48,919 1,173,073
12,974,019
DENMARK – 2.3%Carlsberg A/S Class B (Consumer Staples) . . . (a) 28,767 4,293,071Chr Hansen Holding A/S (Materials) . . . . . . . (a) 45,030 3,579,656Coloplast A/S Class B (Health Care) . . . . . . . (a) 15,220 1,888,209Genmab A/S (Health Care) . . . . . . . . . . . . . (a)(b) 2,043 454,370H Lundbeck A/S (Health Care) . . . . . . . . . . . (a) 658 25,156Novo Nordisk A/S Class B (Health Care) . . . . . (a) 7,277 421,693
10,662,155
SWEDEN – 2.0%Assa Abloy AB Class B (Industrials) . . . . . . . (a) 20,652 482,750Boliden AB (Materials) . . . . . . . . . . . . . . . (a) 1,437 38,165Investor AB (Financials) . . . . . . . . . . . . . . . (a) 79,855 4,359,588Volvo AB (Industrials) . . . . . . . . . . . . . . . . (a) 287,652 4,815,636
9,696,139
IRELAND – 1.6%DCC PLC (Industrials) . . . . . . . . . . . . . . . . (a) 7,481 648,895Experian PLC (Industrials). . . . . . . . . . . . . . (a) 141,135 4,784,399James Hardie Industries PLC (Materials) . . . . (a) 114,020 2,228,459
7,661,753
HONG KONG – 1.5%AIA Group Ltd. (Financials) . . . . . . . . . . . . . (a) 104,400 1,098,075ASM Pacific Technology Ltd.
(Information Technology) . . . . . . . . . . . . (a) 3,100 43,029BOC Hong Kong Holdings Ltd. (Financials) . . . (a) 21,500 74,636Champion REIT (Real Estate) . . . . . . . . . . . . (a) 300,000 198,255CK Asset Holdings Ltd. (Real Estate) . . . . . . . (a) 27,500 198,446CK Hutchison Holdings Ltd. (Industrials) . . . . . (a) 177,000 1,687,780CK Infrastructure Holdings Ltd. (Utilities) . . . . (a) 36,000 256,201CLP Holdings Ltd. (Utilities) . . . . . . . . . . . . . (a) 19,500 204,700ESR Cayman Ltd. (Real Estate) . . . . . . . . . . . (b)(c) 7,600 17,166HKT Trust & HKT Ltd.
(Communication Services). . . . . . . . . . . . (a) 324,000 456,609Hongkong Land Holdings Ltd. (Real Estate) . . . (a) 16,300 93,758Hysan Development Co. Ltd. (Real Estate) . . . . (a) 8,000 31,370Kerry Properties Ltd. (Real Estate) . . . . . . . . (a) 29,500 93,694NWS Holdings Ltd. (Industrials) . . . . . . . . . . (a) 359,000 503,161Sino Land Co. Ltd. (Real Estate) . . . . . . . . . . (a) 74,000 107,412Swire Pacific Ltd. Class A (Real Estate) . . . . . (a) 165,500 1,537,444Swire Properties Ltd. (Real Estate) . . . . . . . . (a) 156,600 518,792Techtronic Industries Co. Ltd. (Industrials) . . . (a) 5,000 40,808Xinyi Glass Holdings Ltd.
(Consumer Discretionary) . . . . . . . . . . . . (a) 22,000 29,1497,190,485
Common Stocks (Continued) Shares Value
SPAIN – 1.5%Acerinox SA (Materials) . . . . . . . . . . . . . . . (a) 46,650 $ 527,131Amadeus IT Group SA
(Information Technology) . . . . . . . . . . . . (a) 18,833 1,542,361Banco Bilbao Vizcaya Argentaria SA
(Financials) . . . . . . . . . . . . . . . . . . . . . (a) 25,064 140,718CaixaBank SA (Financials) . . . . . . . . . . . . . (a) 5,736 18,063CIE Automotive SA (Consumer Discretionary) . (a) 8,984 213,204Grifols SA (Health Care) . . . . . . . . . . . . . . . (a) 9,375 331,233Telefonica SA (Communication Services) . . . . (a) 629,384 4,401,346
7,174,056
SINGAPORE – 1.2%DBS Group Holdings Ltd. (Financials). . . . . . . (a) 108,820 2,098,185NetLink NBN Trust (Communication Services) . (c) 4,531,100 3,183,679Singapore Technologies Engineering Ltd.
(Industrials) . . . . . . . . . . . . . . . . . . . . . (a) 133,600 391,2665,673,130
ITALY – 1.0%A2A SpA (Utilities) . . . . . . . . . . . . . . . . . . (a) 358,598 673,390Ferrari N.V. (Consumer Discretionary) . . . . . . (a) 22,962 3,812,510Italgas SpA (Utilities). . . . . . . . . . . . . . . . . (a) 10,309 63,026
4,548,926
NORWAY – 0.9%Equinor ASA (Energy) . . . . . . . . . . . . . . . . (a) 223,243 4,451,972
ISRAEL – 0.9%Bank Leumi Le-Israel BM (Financials) . . . . . . (a) 558,568 4,073,597
LUXEMBOURG – 0.8%APERAM SA (Materials). . . . . . . . . . . . . . . (a) 4,539 145,806Aroundtown SA (Real Estate) . . . . . . . . . . . (a) 413,454 3,713,551
3,859,357
MACAO – 0.7%Sands China Ltd. (Consumer Discretionary). . . (a) 619,200 3,308,428
BELGIUM – 0.4%Galapagos N.V. (Health Care) . . . . . . . . . . . (a)(b) 1,363 283,841Groupe Bruxelles Lambert SA (Financials) . . . (a) 13,550 1,429,808Solvay SA (Materials) . . . . . . . . . . . . . . . . (a) 815 94,860
1,808,509
AUSTRIA – 0.0%Raiffeisen Bank International AG (Financials) . (a) 4,652 116,437Total Common Stocks (Cost $451,404,565) . . . . $463,580,100
Money Market Funds – 0.9% Shares Value
State Street Institutional Liquid Reserves FundInstitutional Class, 1.734% . . . . . . . . . . . . (d) 4,433,373 $ 4,433,817
Total Money Market Funds (Cost $4,433,817) . . . . . . $ 4,433,817Total Investments – 98.7% (Cost $455,838,382) . . . . (e) $468,013,917Other Assets in Excess of Liabilities – 1.3% . . . . . (f) 6,223,521Net Assets – 100.0% $474,237,438
Ohio National Fund, Inc. ON International Equity Portfolio (Continued)
Schedule of Investments December 31, 2019
26 (continued)

Percentages are stated as a percent of net assets.Footnotes:
(a) Security traded on a foreign exchange has been valued at an estimate of fair value that is different than the local market close price. These fair value estimatesare determined by an independent fair valuation service that has been approved by the Board. These securities represent $458,107,739 or 96.6% of the Portfolio’snet assets.
(b) Non-income producing security.(c) As discussed in Note 2 of the Notes to Financial Statements, not all investments that are traded on a foreign exchange are valued at an estimate that is different
from the local close price. In some instances, the independent fair valuation service uses a stock’s local close price because the service’s measure ofpredictability related to their valuation model of a stock is below a chosen threshold. These securities represent $5,472,361 or 1.2% of the Portfolio’s net assets.Other Portfolio securities are not subjected to fair valuation procedures because they are traded on domestic or foreign exchanges that have close times that areconsistent with the U.S. market close, normally 4:00 pm Eastern Time.
(d) Rate represents the seven-day yield at December 31, 2019.(e) Represents cost for financial reporting purposes, which may differ from cost basis for federal income tax purposes. See also Note 8 of the Notes to Financial
Statements.(f) Includes $545,494 of cash pledged as collateral for the futures contracts outstanding at December 31, 2019. See also the following Schedule of Open Futures
Contracts.
The accompanying notes are an integral part of these financial statements.
Schedule of Open Futures Contracts December 31, 2019
DescriptionNumber ofcontracts Expiration Date
NotionalAmount Value
UnrealizedAppreciation
(Depreciation)
Variation MarginReceivable(Payable)
CME Nikkei 225 Yen Index - Long 26 March 12, 2020 $2,804,181 $2,802,678 $ (1,503) $ 2,393ASX SPI 200 Index - Long 6 March 19, 2020 713,603 695,048 (18,555) (14,526)Euro Stoxx 50 Index - Long 105 March 20, 2020 4,405,304 4,391,960 (13,344) 0ICE FTSE 100 Index - Long 18 March 20, 2020 1,781,102 1,787,971 6,869 (8,822)
$9,704,190 $9,677,657 $(26,533) $(20,955)
The accompanying notes are an integral part of these financial statements.
Ohio National Fund, Inc. ON International Equity Portfolio (Continued)
Schedule of Investments December 31, 2019
27

Objective/Strategy
The ON Foreign Portfolio seeks long-term growth of capital by investing,under normal circumstances, at least 80% of its net assets in foreignsecurities.
Performance as of December 31, 2019
Average Annual returnsOne year 10.17%Five years 2.43%Ten years 4.75%
Past performance does not guarantee future results. The performance dataquoted represents past performance and current returns may be lower or higher.Total return figures include change in share price and reinvestment of dividendsand capital gains. The investment return and principal value will fluctuate so thatan investor’s shares, when redeemed, may be worth more or less than the originalcost. To obtain performance information up to the most recent month end, calltoll-free 1-877-781-6392.
The Portfolio is not open to direct retail investment. Beneficial interest in shares isobtained solely by purchase of variable life insurance policies and variable annuitycontracts. Actual performance results for variable annuity and variable universallife contracts will be lower due to contract charges. Consult your contract forapplicable charges.
Total expense ratio is 1.04% per the Fund’s prospectus dated November 22, 2019.Additional information pertaining to the Portfolio’s expense ratio as ofDecember 31, 2019 can be found in the Portfolio’s Financial Highlights.
Comments from Sub-Adviser
Q. How did the Portfolio perform in comparison to its benchmark duringthe reporting period?
A. For the year ended December 31, 2019, the Portfolio returned 10.17%versus 22.01% for its current benchmark, the MSCI EAFE Index (Net –USD), and 21.51% for its former benchmark, the MSCI All Country WorldEx-USA Index (Net – USD).
Effective December 7, 2019, BlackRock Investment Management, LLC(“BlackRock”) replaced the Portfolio’s previous sub-adviser, TempletonGlobal Advisors Limited (“Templeton”). In conjunction with the change insub-adviser and investment strategy, the Portfolio’s benchmark waschanged from MSCI All Country World Ex-USA Index (Net – USD) to MSCIEAFE Index (Net – USD). The change in the benchmark was madebecause the MSCI EAFE Index (Net – USD) better reflects the style of thestrategy utilized by BlackRock.
For the period from January 1, 2019 to December 6, 2019 (the “firstperformance period”), the Portfolio returned 7.92% versus 17.02% for theMSCI All Country World Ex-USA Index (Net – USD).
For the period from December 7, 2019 to December 31, 2019 (the “latterperformance period”), the Portfolio returned 2.08% versus 2.86% for theMSCI EAFE Index (Net – USD).
Q. Were there specific market conditions, investment strategies, ortechniques that materially affected the Portfolio’s benchmark-relativeperformance during the reporting period?
A. Templeton: The relative underperformance of value stocks continuedto hinder Templeton portfolios through most of the first performanceperiod. International growth stocks outperformed international valuestocks during every month of the period except September, when slightlyimproved economic news and more accommodative central bank
messaging sparked a sharp reversal. The U.S. dollar rose in value againstmost foreign currencies, which hurt the Portfolio’s performance becauseinvestments in securities with non-U.S. currency lost value as the U.S.dollar rose.
A. BlackRock: International equity markets continued to climb inDecember, as an easing of global trade tensions, supportive central bankpolicy, and improving economic indicators, particularly in Germany, allhelped drive positive returns throughout the fourth quarter and into theend of the year. As markets were largely driven by geopolitical and broadmacroeconomic factors, including a widely-followed general election inthe U.K., some of the Portfolio’s stock selection insights struggledthroughout the latter performance period. Given the continuouslyevolving geopolitical and market landscape late in the year, thePortfolio’s trend-based insights were challenged throughout the latterperformance period. Similarly, sentiment-driven signals struggled, as themacro-driven market moves were often disconnected fromstock-specific sentiment. Insights evaluating company fundamentalswere mixed during the latter performance period, as signals designed toidentify relative value opportunities, as well as the Portfolio’s companyquality signals, were generally flat, detracting modestly in aggregate.Lastly, macro thematic insights were broadly mixed amongst bothcountry timing and industry timing signals.
Q. How did country selection impact the Portfolio’s performancerelative to the benchmark?
A. Templeton: Country selection detracted from relative performanceduring the first performance period. Stock selection in Asia was thebiggest relative detractor, with China and Japan responsible for most ofthe region’s underperformance. Stock selection in Europe also hurtrelative results. The U.K., buffeted by uncertainties around Brexit, wasthe region’s biggest detractor, hurt by both stock selection and anunfavorable overweight. Stock selection helped relative results in NorthAmerica, the only region to contribute to relative performance.Off-benchmark and overweighted allocations in a handful of Americanand Canadian companies boosted those regions’ results.
A. BlackRock: The Portfolio targets a relatively country-neutralapproach. That being said, maintaining a modest underweight to Japancontributed to results, whereas a modest underweight to Swedendetracted from relative returns. From a country perspective, stockselection was strongest in Switzerland and Hong Kong. Selection wasweakest in Japan, Spain and Germany. (1)
Q. How did sector allocation and security selection each impact thePortfolio’s performance relative to its benchmark? For sector allocation,were there any factors that impacted the benchmark’s performancemore significantly than the Portfolio’s performance? For securityselection, was there anything specific regarding the Portfolio’s strategythat caused deviation from the benchmark?
A. Templeton: Both stock selection and sector allocation detracted fromrelative performance during the first performance period.Communication Services was the Portfolio’s biggest relative detractor,hurt by stock selection and an overweight. We added to the sector duringthe period in order to increase the Portfolio’s exposure to higher qualitystocks with defensive yield characteristics, which we believe shouldperform well once this mature cycle eventually inflects. The Portfolio’sEnergy holdings also detracted due to stock selection and an overweight.We continue to see counter-cyclical opportunities in Energy, wherehighly cash-generative companies with healthy dividend yields trade atvaluations consistent with oil prices, which are well below ournormalized expectations. Stock selection also pressured Health Careholdings, offsetting a favorable overweight in the well-performing sector.
Relative underperformance during the first performance period wasslightly offset by stock selection in the Information Technology andMaterials sectors.
Ohio National Fund, Inc. ON Foreign Portfolio (Unaudited)
28 (continued)

A. BlackRock: The portfolio management team targets a relativelysector-neutral approach and seeks to derive the majority of its alphafrom security selection. While a modest underweight to the Energysector detracted from relative returns, given the sector’s strongperformance over the latter performance period, no other sectorallocation decisions meaningfully affected results. As expected, themajority of the Portfolio’s modest underperformance was driven bysecurity selection decisions. Stock selection was additive in the HealthCare sector, especially among health care equipment and suppliescompanies. Selection in the Information Technology sector also helpedrelative performance. In contrast, security selection within the Financialssector, in particular among banks and insurance companies, was anotable detractor from relative performance. Selection in theCommunication Services sector, especially within the diversifiedtelecommunication services industry, also hindered relative returns. (1)
Q. Which holdings contributed the most to, and detracted the most from,the Portfolio’s benchmark-relative performance?
A. Templeton: Top Contributors (first performance period):
NXP Semiconductors N.V. (“NXP”) – Shares of the Dutch chip-makerrose to near-record highs after reporting better-than-expected sales andencouraging demand trends. NXP continues to offer solid near-termdownside support, aided by an aggressive share buyback program,attractive asset base and mixture of industry tailwinds and self-helpopportunities.
Alamos Gold, Inc. Class A – Shares of the Canadian precious metalsminer rallied after the price of gold reached a six-year high and the firmannounced lower-than-expected capital expenditures required to meetproduction forecasts.
BNP Paribas SA – Shares of the French lender advanced after reportingstrong results from its fixed income unit and benefiting from more benignmacroeconomic conditions in Europe.
Top Detractors (first performance period):
Teva Pharmaceutical Industries Ltd. – ADR (“Teva”) – Shares of theIsraeli generic drug-maker slumped amid concerns about the firm’sheavy debt load and ongoing regulatory and litigation risks. Unforeseenevents caused us to revisit our thesis on Teva, which, while cheap on aheadline basis, is faced with considerable structural and event-drivenrisks.
China Telecom Corp. Ltd. – Shares of China’s largest fixed-line providerand third-largest mobile operator declined amid elevated 5G capitalexpenditures and continued security scrutiny of Chinesetelecommunications companies.
Baidu, Inc. – ADR (“Baidu”) – Shares fell after China’s biggest onlinesearch engine posted its first loss since going public, as the firmstruggled with a changing local market and slowing economy.
A. BlackRock: The Portfolio’s overweight position in Standard CharteredPLC was the largest relative individual contributor for the latterperformance period. The primary driver of the stock’s appreciation wasthe successful sale of a non-core Indonesian bank, which netted about$500 million for the company. The U.K. election results also provided amodest tailwind for the British banking and financial services company.Overweighting energy company Equinor ASA also contributed to relativeperformance, as the increase in global oil prices towards the end of theyear improved expectations on the future profitability of the company.Investors also reacted positively to Equinor ASA increasing its stake inScatec Solar, which enabled the company to further diversify its revenuesourcing and strengthen its exposure to the rapidly-growing solar energysector. An overweight position in Volvo AB further bolstered relative
returns. The company’s share price rose on news that it was selling itsUD trucks business to Isuzu Motors Ltd. for roughly $2.3 billion andplanning to distribute the majority of the cash back to shareholders. (1)
In contrast, the Portfolio’s overweight position in Safran SA was thelargest relative individual detractor during the latter performance period.As one of Boeing’s largest European suppliers, Safran SA sold offconsiderably on news that Boeing would suspend production of itsgrounded 737 Max jet in January 2020. Remaining overweight TelefonicaSA also detracted from relative returns, as investors reacted negativelyto company announcements regarding the structure of its LatinAmerican business and to its continued global divestiture of cell towers.The Portfolio’s overweight position in Japan-based Suntory Beverageand Food Ltd. further diminished relative performance, as the stock pricedeclined following news that the company was planning to launch anIndia-only whiskey brand. (1)
Q. How did the Portfolio’s use of derivative instruments and initialpublic offerings (IPOs), if any, impact performance?
A. Templeton: The Portfolio did not hold any derivatives or participate inany IPOs during the first performance period.
A. BlackRock: Pursuant to the Portfolio’s investment strategy, futurescontracts were used in the latter performance period to equitize cashand prevent a cash drag on performance. The futures did notmeaningfully impact relative performance, however, due to their indexcharacteristics and size in relation to the Portfolio’s net assets. (1)
Q. Were there any significant changes to the Portfolio’s managementteam, investment strategy, or security selection process during thereporting period?
A. Templeton: Christopher Peel began co-managing the Portfolioalongside Tucker Scott in February 2019 and assumed full managementresponsibility on July 1, 2019. Alan Bartlett took over as Chief InvestmentOfficer of Templeton Global Advisors on October 1, 2019, in anticipation ofthe retirement of Norman Boersma at year-end.
A. BlackRock: There were no significant changes during the latterperformance period.
(1) The Portfolio’s composition is subject to change. Holdings and weightings areas of December 31, 2019.
Ohio National Fund, Inc. ON Foreign Portfolio (Unaudited) (Continued)
29 (continued)

Change in Value of $10,000 Investment
ON Foreign Portfolio (A)MSCI EAFE Index (Net - USD) (B)MSCI All Country World Ex-USA Index (Net - USD) (C)
8,000
10,000
12,000
14,000
16,000
$18,000
6/1
012
/10 6
/1112
/11 6
/1212
/12 6
/1312
/13 6
/1412
/14 6
/1512
/15 6
/1612
/16 6
/1712
/17 6
/1812
/18 6
/19
12/3
1/09
12/1
9
$17,085 (B)$16,236 (C)$15,910 (A)
Hypothetical illustration based on past performance. Future performance will vary.The Portfolio’s returns reflect reinvested dividends. The Portfolio’s holdings maydiffer significantly from the securities in the index. The index is unmanaged andtherefore does not reflect the cost of portfolio management and accounting.
The Portfolio’s benchmark was changed from MSCI All Country World Ex-USAIndex (Net-USD) to MSCI EAFE Index (Net-USD), effective December 7, 2019. Thechange in the benchmark was made because the MSCI EAFE Index (Net-USD)better reflects the style of the strategy utilized by the current sub-adviser.
The MSCI EAFE Index (Net-USD) is a free-float-adjusted market-capitalizationweighted index that is designed to measure the equity market performance oflarge and mid-cap securities across 21 developed markets, including countries inEurope, Australasia and the Far East, excluding the U.S. and Canada. The index isavailable for a number of regions, market segments/sizes and coversapproximately 85% of the free-float-adjusted market capitalization in each of the 21countries. The returns for this index include the effects of reinvested dividends, netof taxes, and adjustment to U.S. Dollar denomination.
The MSCI All Country World Ex-USA Index (Net-USD) is a free float adjustedmarket capitalization weighted index that is designed to measure the equity marketperformance of developed and emerging markets. The MSCI All Country WorldIndex (ACWI) consists of 23 developed and 24 emerging market country indices,while the MSCI All Country World Ex-USA Index specifically excludes the impact ofthe United States. The returns presented for this index include the effects ofreinvested dividends, net of taxes, and adjustment to U.S. Dollar denomination.
Past performance is no guarantee of future results. Redemption of fund sharescould have tax implications unique to each shareholder.
Ohio National Fund, Inc. ON Foreign Portfolio (Unaudited) (Continued)
30 (continued)

Portfolio Composition as of December 31, 2019 (1)
% of Net AssetsCommon Stocks (4) (5) 97.7Money Market Funds and
Other Net Assets 2.3100.0
Top 10 Portfolio Holdings as of December 31, 2019 (1) (2) (3)
% of Net Assets1. Roche Holding AG 2.32. LVMH Moet Hennessy Louis Vuitton SE 1.73. SAP SE 1.64. Equinor ASA 1.65. GlaxoSmithKline PLC 1.66. Novartis AG 1.57. Nestle SA 1.58. Allianz SE 1.59. British American Tobacco PLC 1.5
10. L’Oreal SA 1.3
(1) Composition of Portfolio subject to change.(2) Short-term investments have been excluded from the list of Top 10 Portfolio Holdings.(3) Top 10 Portfolio Holdings is presented at an individual security level. Total investment exposure by issuer may be higher.(4) Top 10 Country Weightings (Common Stocks):
% of Net AssetsJapan 22.3United Kingdom 14.0France 11.7Switzerland 10.4Germany 8.9Australia 7.4Netherlands 5.1Hong Kong 2.5Finland 2.4Denmark 2.2
(5) Sectors (Common Stocks):% of Net Assets
Financials 16.7Industrials 15.9Health Care 12.8Consumer Staples 12.7Consumer Discretionary 11.6Materials 7.3Information Technology 6.4Communication Services 4.6Energy 3.9Real Estate 3.3Utilities 2.5
97.7
Ohio National Fund, Inc. ON Foreign Portfolio (Unaudited) (Continued)
31

Common Stocks – 97.7% Shares Value
JAPAN – 22.3%Alfresa Holdings Corp. (Health Care) . . . . . . . (a) 3,200 $ 65,008Amada Holdings Co. Ltd. (Industrials) . . . . . . . (a) 16,600 188,804Dai-ichi Life Holdings, Inc. (Financials) . . . . . . (a) 25,400 418,599Daikin Industries Ltd. (Industrials) . . . . . . . . . (a) 800 112,872Daito Trust Construction Co. Ltd. (Real Estate) . (a) 800 98,861Denka Co. Ltd. (Materials) . . . . . . . . . . . . . . (a) 500 14,864Denso Corp. (Consumer Discretionary) . . . . . . (a) 9,400 424,526Dentsu Group, Inc. (Communication Services) . (a) 1,200 41,347DIC Corp. (Materials) . . . . . . . . . . . . . . . . . (a) 5,300 146,272Dip Corp. (Communication Services) . . . . . . . (a) 600 17,724DMG Mori Co. Ltd. (Industrials) . . . . . . . . . . . (a) 1,300 19,890East Japan Railway Co. (Industrials) . . . . . . . (a) 2,600 234,681Fast Retailing Co. Ltd.
(Consumer Discretionary) . . . . . . . . . . . . (a) 800 475,259Fuji Media Holdings, Inc.
(Communication Services) . . . . . . . . . . . . (a) 4,900 69,572Fuji Seal International, Inc. (Materials) . . . . . . (a) 2,200 48,795Isuzu Motors Ltd. (Consumer Discretionary) . . . (a) 13,800 163,127Izumi Co. Ltd. (Consumer Discretionary) . . . . . (a) 1,900 68,435Japan Post Holdings Co. Ltd. (Financials) . . . . (a) 13,800 129,782JSR Corp. (Materials) . . . . . . . . . . . . . . . . . (a) 6,600 120,731JXTG Holdings, Inc. (Energy) . . . . . . . . . . . . (a) 12,200 55,371Kaneka Corp. (Materials). . . . . . . . . . . . . . . (a) 3,900 124,903Kao Corp. (Consumer Staples) . . . . . . . . . . . (a) 6,000 494,850Kawasaki Heavy Industries Ltd. (Industrials) . . (a) 900 19,671KDDI Corp. (Communication Services) . . . . . . (a) 2,700 80,558Kirin Holdings Co. Ltd. (Consumer Staples). . . . (a) 18,800 410,339Konica Minolta, Inc. (Information Technology) . (a) 23,100 150,475Matsumotokiyoshi Holdings Co. Ltd.
(Consumer Staples) . . . . . . . . . . . . . . . . (a) 2,300 89,044Mitsubishi Electric Corp. (Industrials) . . . . . . . (a) 3,900 53,101Mitsubishi Materials Corp. (Materials) . . . . . . (a) 4,500 122,129Mitsubishi UFJ Financial Group, Inc.
(Financials) . . . . . . . . . . . . . . . . . . . . . (a) 61,200 330,868Mitsui Chemicals, Inc. (Materials) . . . . . . . . . (a) 4,900 119,361Mitsui Fudosan Co. Ltd. (Real Estate) . . . . . . . (a) 5,600 136,864Mizuho Financial Group, Inc. (Financials) . . . . (a) 184,100 283,591MS&AD Insurance Group Holdings, Inc.
(Financials) . . . . . . . . . . . . . . . . . . . . . (a) 1,300 42,911Nidec Corp. (Industrials) . . . . . . . . . . . . . . . (a) 2,600 355,118Nifco Inc. (Consumer Discretionary) . . . . . . . (a) 600 16,385Nihon Kohden Corp. (Health Care) . . . . . . . . . (a) 600 16,640Nippon Electric Glass Co. Ltd.
(Information Technology) . . . . . . . . . . . . . (a) 2,800 62,160Nippon Shokubai Co. Ltd. (Materials) . . . . . . . (a) 700 43,378NTN Corp. (Industrials) . . . . . . . . . . . . . . . . (a) 4,700 14,697NTT Data Corp. (Information Technology) . . . . (a) 12,600 168,512Pola Orbis Holdings, Inc. (Consumer Staples) . . (a) 3,100 73,839Recruit Holdings Co. Ltd. (Industrials) . . . . . . . (a) 2,700 101,129Resona Holdings, Inc. (Financials) . . . . . . . . . (a) 50,700 220,977Sanwa Holdings Corp. (Industrials) . . . . . . . . (a) 7,800 87,405Secom Co. Ltd. (Industrials) . . . . . . . . . . . . . (a) 3,400 303,425Seven & I Holdings Co. Ltd.
(Consumer Staples) . . . . . . . . . . . . . . . . (a) 12,700 465,524Shin-Etsu Chemical Co. Ltd. (Materials). . . . . . (a) 400 43,989Shionogi & Co. Ltd. (Health Care). . . . . . . . . . (a) 6,200 383,541SMC Corp. (Industrials). . . . . . . . . . . . . . . . (a) 500 228,658Sumitomo Heavy Industries Ltd. (Industrials) . . (a) 3,900 110,779Sumitomo Metal Mining Co. Ltd. (Materials) . . . (a) 3,500 112,700Sumitomo Mitsui Financial Group, Inc.
(Financials) . . . . . . . . . . . . . . . . . . . . . (a) 14,200 524,482Sumitomo Mitsui Trust Holdings, Inc.
(Financials) . . . . . . . . . . . . . . . . . . . . . (a) 3,800 150,218Sundrug Co. Ltd. (Consumer Staples) . . . . . . . (a) 3,300 119,400Suntory Beverage & Food Ltd.
(Consumer Staples) . . . . . . . . . . . . . . . . (a) 8,300 346,514Takeda Pharmaceutical Co. Ltd. (Health Care) . (a) 13,802 545,899Tokyo Electron Ltd. (Information Technology) . . (a) 1,200 261,996Topcon Corp. (Information Technology) . . . . . . (a) 2,400 31,020
Common Stocks (Continued) Shares Value
JAPAN (continued)Toyota Industries Corp.
(Consumer Discretionary) . . . . . . . . . . . . (a) 300 $ 17,262Toyota Motor Corp. (Consumer Discretionary) . (a) 3,400 239,569Toyota Tsusho Corp. (Industrials). . . . . . . . . . (a) 1,100 38,640Trend Micro, Inc. (Information Technology) . . . (a)(b) 2,900 148,392Ube Industries Ltd. (Materials) . . . . . . . . . . . (a) 3,900 84,467Yokogawa Electric Corp.
(Information Technology) . . . . . . . . . . . . . (a) 3,000 52,68310,742,583
UNITED KINGDOM – 14.0%AstraZeneca PLC (Health Care) . . . . . . . . . . (a) 5,994 599,951Berkeley Group Holdings PLC
(Consumer Discretionary) . . . . . . . . . . . . (a) 2,446 157,457BP PLC (Energy) . . . . . . . . . . . . . . . . . . . . (a) 20,204 127,099British American Tobacco PLC
(Consumer Staples) . . . . . . . . . . . . . . . . (a) 16,677 708,807Compass Group PLC (Consumer Discretionary) . (a) 9,648 241,796Diageo PLC (Consumer Staples) . . . . . . . . . . (a) 8,816 371,477GlaxoSmithKline PLC (Health Care) . . . . . . . . (a) 31,926 750,166HSBC Holdings PLC (Financials) . . . . . . . . . . (a) 26,815 209,920Johnson Matthey PLC (Materials) . . . . . . . . . (a) 10,655 423,657London Stock Exchange Group PLC
(Financials) . . . . . . . . . . . . . . . . . . . . . (a) 2,599 267,104Moneysupermarket.com Group PLC
(Consumer Discretionary) . . . . . . . . . . . . (a) 42,038 184,540Pearson PLC (Communication Services) . . . . . (a) 11,435 96,604Prudential PLC (Financials) . . . . . . . . . . . . . (a) 1,586 30,389RELX PLC (Industrials) . . . . . . . . . . . . . . . . (a) 14,346 362,141Rightmove PLC (Communication Services). . . . (a) 45,345 380,496Rio Tinto PLC (Materials) . . . . . . . . . . . . . . . (a) 931 55,111Smith & Nephew PLC (Health Care) . . . . . . . . (a) 14,455 348,376Standard Chartered PLC (Financials) . . . . . . . (a) 49,738 468,685Unilever N.V. (Consumer Staples) . . . . . . . . . (a) 2,866 164,482Unilever PLC (Consumer Staples) . . . . . . . . . (a) 1,039 59,475Vodafone Group PLC
(Communication Services) . . . . . . . . . . . . (a) 281,715 546,914Wm Morrison Supermarkets PLC
(Consumer Staples) . . . . . . . . . . . . . . . . (c) 82,273 217,7406,772,387
FRANCE – 11.7%BNP Paribas SA (Financials) . . . . . . . . . . . . (a) 2,683 159,472Bureau Veritas SA (Industrials) . . . . . . . . . . . (a) 6,772 177,033Cie de Saint-Gobain (Industrials) . . . . . . . . . . (a) 7,771 318,345Credit Agricole SA (Financials) . . . . . . . . . . . (a) 2,003 29,146Dassault Systemes SE
(Information Technology) . . . . . . . . . . . . . (a) 1,816 299,504Imerys SA (Materials) . . . . . . . . . . . . . . . . (a) 2,036 86,424Kering SA (Consumer Discretionary) . . . . . . . (a) 339 223,372Lagardere SCA (Communication Services). . . . (a) 1,897 41,411Legrand SA (Industrials) . . . . . . . . . . . . . . . (a) 375 30,624L’Oreal SA (Consumer Staples) . . . . . . . . . . . (a) 2,109 623,647LVMH Moet Hennessy Louis Vuitton SE
(Consumer Discretionary) . . . . . . . . . . . . (a) 1,726 804,236Orpea (Health Care) . . . . . . . . . . . . . . . . . . (a) 120 15,395Pernod Ricard SA (Consumer Staples) . . . . . . (a) 2,726 487,784Peugeot SA (Consumer Discretionary) . . . . . . (a) 6,268 150,916Publicis Groupe SA (Communication Services) . (a) 6,485 294,039Renault SA (Consumer Discretionary). . . . . . . (a) 336 15,956Rexel SA (Industrials) . . . . . . . . . . . . . . . . . (a) 24,908 331,293Rubis SCA (Utilities) . . . . . . . . . . . . . . . . . . (a) 1,739 107,011Safran SA (Industrials) . . . . . . . . . . . . . . . . (a) 3,462 534,738Sanofi (Health Care). . . . . . . . . . . . . . . . . . (a) 959 96,310TOTAL SA (Energy) . . . . . . . . . . . . . . . . . . (a) 2,419 134,232Veolia Environnement SA (Utilities) . . . . . . . . (a) 16,091 428,155Vinci SA (Industrials) . . . . . . . . . . . . . . . . . (a) 2,465 274,536
5,663,579
Ohio National Fund, Inc. ON Foreign Portfolio
Schedule of Investments December 31, 2019
32 (continued)

Common Stocks (Continued) Shares Value
SWITZERLAND – 10.4%Bucher Industries AG (Industrials). . . . . . . . . (a) 423 $ 148,455Givaudan SA (Materials) . . . . . . . . . . . . . . . (a) 89 278,837LafargeHolcim Ltd. (Materials) . . . . . . . . . . . (a) 6,434 356,942Logitech International SA
(Information Technology) . . . . . . . . . . . . . (a) 8,472 401,342Nestle SA (Consumer Staples) . . . . . . . . . . . (a) 6,847 741,292Novartis AG (Health Care) . . . . . . . . . . . . . . (a) 7,831 741,514Roche Holding AG (Health Care) . . . . . . . . . . (a) 3,443 1,118,984Sika AG (Materials) . . . . . . . . . . . . . . . . . . (a) 2,125 399,065UBS Group AG (Financials) . . . . . . . . . . . . . (a) 19,735 249,044Zurich Insurance Group AG (Financials) . . . . . (a) 1,406 576,740
5,012,215
GERMANY – 8.9%adidas AG (Consumer Discretionary) . . . . . . . (a) 630 205,076Allianz SE (Financials) . . . . . . . . . . . . . . . . (a) 2,898 710,090Bayer AG (Health Care) . . . . . . . . . . . . . . . (a) 1,770 143,895Bayerische Motoren Werke AG
(Consumer Discretionary) . . . . . . . . . . . . (a) 3,472 284,376CompuGroup Medical SE (Health Care). . . . . . (a) 831 59,267Continental AG (Consumer Discretionary) . . . . (a) 3,239 418,577Deutsche Post AG (Industrials) . . . . . . . . . . . (a) 12,954 492,565DWS Group GmbH & Co. KGaA (Financials) . . . (a) 431 15,304Fielmann AG (Consumer Discretionary). . . . . . (a) 224 18,079Merck KGaA (Health Care) . . . . . . . . . . . . . (a) 3,633 428,308Rational AG (Industrials) . . . . . . . . . . . . . . . (a) 22 17,625SAP SE (Information Technology) . . . . . . . . . (a) 5,869 789,956Siemens AG (Industrials). . . . . . . . . . . . . . . (a) 4,023 525,370Stroeer SE & Co. KGaA
(Communication Services) . . . . . . . . . . . . (a) 252 20,303Telefonica Deutschland Holding AG
(Communication Services) . . . . . . . . . . . . (a) 20,950 60,774Volkswagen AG (Consumer Discretionary). . . . (a) 507 98,198
4,287,763
AUSTRALIA – 7.4%AGL Energy Ltd. (Utilities) . . . . . . . . . . . . . . (a) 14,600 210,146APA Group (Utilities) . . . . . . . . . . . . . . . . . (a) 12,771 99,415Aristocrat Leisure Ltd.
(Consumer Discretionary) . . . . . . . . . . . . (a) 17,301 408,808Australia & New Zealand Banking Group Ltd.
(Financials) . . . . . . . . . . . . . . . . . . . . . (a) 3,242 55,911Bendigo & Adelaide Bank Ltd. (Financials). . . . (a) 19,934 136,784BHP Group Ltd. (Materials) . . . . . . . . . . . . . (a) 5,959 163,171carsales.com Ltd. (Communication Services) . . (a) 1,325 15,452Cochlear Ltd. (Health Care) . . . . . . . . . . . . . (a) 95 14,973Commonwealth Bank of Australia (Financials) . (a) 5,648 316,840Computershare Ltd. (Information Technology). . (a) 19,273 227,227Crown Resorts Ltd. (Consumer Discretionary). . (a) 11,058 93,232CSL Ltd. (Health Care) . . . . . . . . . . . . . . . . (a) 1,446 280,353GPT Group / The (Real Estate) . . . . . . . . . . . (a) 4,037 15,902IDP Education Ltd. (Consumer Discretionary) . . (a) 4,637 55,896Insurance Australia Group Ltd. (Financials) . . . (a) 4,177 22,444Orica Ltd. (Materials) . . . . . . . . . . . . . . . . . (a) 5,509 84,952Scentre Group (Real Estate). . . . . . . . . . . . . (a) 157,018 422,576Sonic Healthcare Ltd. (Health Care) . . . . . . . . (a) 7,834 157,956Suncorp Group Ltd. (Financials) . . . . . . . . . . (a) 2,851 25,898Tabcorp Holdings Ltd.
(Consumer Discretionary) . . . . . . . . . . . . (a) 51,444 163,546Treasury Wine Estates Ltd.
(Consumer Staples) . . . . . . . . . . . . . . . . (a) 29,506 336,095Westpac Banking Corp. (Financials). . . . . . . . (a) 14,740 251,711
3,559,288
NETHERLANDS – 5.1%Aegon N.V. (Financials). . . . . . . . . . . . . . . . (a) 66,282 303,413ASM International N.V.
(Information Technology) . . . . . . . . . . . . . (a) 259 29,234ASML Holding N.V. (Information Technology) . . (a) 367 108,653Flow Traders (Financials) . . . . . . . . . . . . . . (c) 5,507 133,057
Common Stocks (Continued) Shares Value
NETHERLANDS (continued)ING Groep N.V. (Financials) . . . . . . . . . . . . . (a) 42,095 $ 506,083NN Group N.V. (Financials) . . . . . . . . . . . . . (a) 10,704 406,996Royal Dutch Shell PLC Class B (Energy) . . . . . (a) 15,979 474,315Royal Dutch Shell PLC Class A (Energy) . . . . . (a) 10,433 308,965Wolters Kluwer N.V. (Industrials). . . . . . . . . . (a) 2,272 165,891
2,436,607
HONG KONG – 2.5%AIA Group Ltd. (Financials) . . . . . . . . . . . . . (a) 10,600 111,490CK Asset Holdings Ltd. (Real Estate). . . . . . . . (a) 64,100 462,560CK Hutchison Holdings Ltd. (Industrials) . . . . . (a) 47,500 452,936NWS Holdings Ltd. (Industrials) . . . . . . . . . . (a) 17,000 23,827Swire Pacific Ltd. Class A (Real Estate). . . . . . (a) 12,200 113,334Swire Properties Ltd. (Real Estate). . . . . . . . . (a) 7,000 23,190
1,187,337
FINLAND – 2.4%Fortum Oyj (Utilities). . . . . . . . . . . . . . . . . . (a) 9,107 224,792Kone Oyj Class B (Industrials). . . . . . . . . . . . (a) 6,913 452,026Nordea Bank Abp (Financials) . . . . . . . . . . . (a) 10,336 83,620TietoEVRY Oyj (Information Technology) . . . . . (a) 5,628 175,058UPM-Kymmene Oyj (Materials). . . . . . . . . . . (a) 3,851 133,608Valmet Oyj (Industrials). . . . . . . . . . . . . . . . (a) 3,491 83,714
1,152,818
DENMARK – 2.2%Carlsberg A/S Class B (Consumer Staples) . . . (a) 2,699 402,788Chr Hansen Holding A/S (Materials) . . . . . . . . (a) 3,927 312,176Coloplast A/S Class B (Health Care) . . . . . . . . (a) 2,077 257,675Genmab A/S (Health Care). . . . . . . . . . . . . . (a)(b) 208 46,260Novo Nordisk A/S Class B (Health Care) . . . . . (a) 781 45,258
1,064,157
IRELAND – 2.1%Bank of Ireland Group PLC (Financials) . . . . . . (a) 39,321 216,407DCC PLC (Industrials) . . . . . . . . . . . . . . . . . (a) 1,037 89,948Experian PLC (Industrials) . . . . . . . . . . . . . . (a) 14,326 485,644James Hardie Industries PLC (Materials). . . . . (a) 12,015 234,827
1,026,826
SWEDEN – 2.0%Investor AB (Financials) . . . . . . . . . . . . . . . (a) 8,293 452,747Volvo AB (Industrials). . . . . . . . . . . . . . . . . (a) 29,198 488,809
941,556
NORWAY – 1.6%Equinor ASA (Energy). . . . . . . . . . . . . . . . . (a) 39,122 780,181
SPAIN – 1.5%Acerinox SA (Materials) . . . . . . . . . . . . . . . (a) 1,577 17,820Amadeus IT Group SA
(Information Technology) . . . . . . . . . . . . . (a) 2,399 196,470CIE Automotive SA (Consumer Discretionary) . . (a) 828 19,650Grifols SA (Health Care) . . . . . . . . . . . . . . . (a) 952 33,635Telefonica SA (Communication Services) . . . . (a) 64,261 449,384
716,959
ITALY – 1.1%A2A SpA (Utilities) . . . . . . . . . . . . . . . . . . . (a) 46,604 87,515Ferrari N.V. (Consumer Discretionary). . . . . . . (a) 2,552 423,723Italgas SpA (Utilities) . . . . . . . . . . . . . . . . . (a) 3,700 22,620
533,858
LUXEMBOURG – 0.6%Aroundtown SA (Real Estate) . . . . . . . . . . . . (a) 33,828 303,836
MACAO – 0.5%Sands China Ltd. (Consumer Discretionary) . . . (a) 45,200 241,507
Ohio National Fund, Inc. ON Foreign Portfolio (Continued)
Schedule of Investments December 31, 2019
33 (continued)

Common Stocks (Continued) Shares Value
SINGAPORE – 0.4%DBS Group Holdings Ltd. (Financials) . . . . . . . (a) 3,100 $ 59,772Singapore Technologies Engineering Ltd.
(Industrials) . . . . . . . . . . . . . . . . . . . . . (a) 54,000 158,146217,918
CHINA – 0.4%Sinopec Engineering Group Co. Ltd.
(Industrials) . . . . . . . . . . . . . . . . . . . . . (a) 316,900 189,675
BELGIUM – 0.4%Galapagos N.V. (Health Care) . . . . . . . . . . . . (a)(b) 139 28,946Groupe Bruxelles Lambert SA (Financials) . . . . (a) 1,376 145,197
174,143
NEW ZEALAND – 0.2%SKY Network Television Ltd.
(Communication Services) . . . . . . . . . . . . (a) 186,336 89,263Total Common Stocks (Cost $46,405,010) . . . . . $47,094,456
Money Market Funds – 1.7% Shares Value
State Street Institutional Liquid Reserves FundInstitutional Class, 1.734% . . . . . . . . . . . . (d) 821,610 $ 821,692
Total Money Market Funds (Cost $821,692) . . . . . . . $ 821,692Total Investments – 99.4% (Cost $47,226,702) . . . . (e) $47,916,148Other Assets in Excess of Liabilities – 0.6% . . . . . (f) 295,243Net Assets – 100.0% $48,211,391
Percentages are stated as a percent of net assets.Footnotes:
(a) Security traded on a foreign exchange has been valued at an estimate of fair value that is different than the local market close price. These fair value estimatesare determined by an independent fair valuation service that has been approved by the Board. These securities represent $46,743,659 or 97.0% of the Portfolio’snet assets.
(b) Non-income producing security.(c) As discussed in Note 2 of the Notes to Financial Statements, not all investments that are traded on a foreign exchange are valued at an estimate that is different
from the local close price. In some instances, the independent fair valuation service uses a stock’s local close price because the service’s measure ofpredictability related to their valuation model of a stock is below a chosen threshold. These securities represent $350,797 or 0.7% of the Portfolio’s net assets.Other Portfolio securities are not subjected to fair valuation procedures because they are traded on domestic or foreign exchanges that have close times that areconsistent with the U.S. market close, normally 4:00 pm Eastern Time.
(d) Rate represents the seven-day yield at December 31, 2019.(e) Represents cost for financial reporting purposes, which may differ from cost basis for federal income tax purposes. See also Note 8 of the Notes to Financial
Statements.(f) Includes $56,105 of cash pledged as collateral for the futures contracts outstanding at December 31, 2019. See also the following Schedule of Open Futures
Contracts.
The accompanying notes are an integral part of these financial statements.
Schedule of Open Futures Contracts December 31, 2019
DescriptionNumber ofcontracts Expiration Date
NotionalAmount Value
UnrealizedAppreciation
(Depreciation)
Variation MarginReceivable(Payable)
CME Nikkei 225 Yen Index - Long 2 March 12, 2020 $217,312 $215,591 $(1,721) $ (184)ASX SPI 200 Index - Long 1 March 19, 2020 117,825 115,841 (1,984) 1,544Euro Stoxx 50 Index - Long 11 March 20, 2020 461,428 460,110 (1,318) 0ICE FTSE 100 Index - Long 2 March 20, 2020 197,508 198,663 1,155 (980)
$994,073 $990,205 $(3,868) $ 380
The accompanying notes are an integral part of these financial statements.
Ohio National Fund, Inc. ON Foreign Portfolio (Continued)
Schedule of Investments December 31, 2019
34

Objective/Strategy
The ON Janus Henderson Forty Portfolio seeks long-term capital growthby investing primarily in domestic and foreign equity securities selectedfor growth potential.
Performance as of December 31, 2019
Average Annual returnsOne year 34.89%Five years 15.60%Ten years 14.30%
Past performance does not guarantee future results. The performance dataquoted represents past performance and current returns may be lower or higher.Total return figures include change in share price and reinvestment of dividendsand capital gains. The investment return and principal value will fluctuate so thatan investor’s shares, when redeemed, may be worth more or less than the originalcost. To obtain performance information up to the most recent month end, calltoll-free 1-877-781-6392.
The Portfolio is not open to direct retail investment. Beneficial interest in shares isobtained solely by purchase of variable life insurance policies and variable annuitycontracts. Actual performance results for variable annuity and variable universallife contracts will be lower due to contract charges. Consult your contract forapplicable charges.
Total expense ratio is 0.80% per the Fund’s prospectus dated November 22, 2019.Additional information pertaining to the Portfolio’s expense ratio as ofDecember 31, 2019 can be found in the Portfolio’s Financial Highlights.
Comments from Sub-Adviser
Q. How did the Portfolio perform in comparison to its benchmark duringthe reporting period?
A. For the year ended December 31, 2019, the Portfolio returned 34.89%versus 36.39% for its benchmark, the Russell 1000 Growth Index.
Q. Were there specific market conditions, investment strategies, ortechniques that materially affected the Portfolio’s benchmark-relativeperformance during the reporting period?
A. Due to the concentrated nature of the Portfolio, relativeunderperformance was due largely to the individual stocks in thePortfolio, rather than a market condition or investment strategy thatworked for or against the Portfolio. (1)
Q. How did sector allocation and security selection each impact thePortfolio’s performance relative to its benchmark? For sector allocation,were there any factors that impacted the benchmark’s performancemore significantly than the Portfolio’s performance? For securityselection, was there anything specific regarding the Portfolio’s strategythat caused deviation from the benchmark?
A. Due to the concentrated nature of the Portfolio, sector holdings aresignificantly different from those in the benchmark. Sector allocationdetracted from Portfolio performance for the period. An overweightallocation to the Health Care sector, which was the second-worstperforming sector in the benchmark, was the primary drag from a sectorallocation perspective. In a period of strong returns, the Portfolio’s smallcash position also somewhat detracted from performance. (1)
Strong stock selection in the Information Technology sector was the keycontributor to relative performance. Stock selection within Materials andstock selection and an underweight allocation to the ConsumerDiscretionary sector also aided performance. (1)
Q. Which holdings contributed the most to, and detracted the most from,the Portfolio’s benchmark-relative performance?
A. Mastercard, Inc. Class A (“Mastercard”) was the largest relativecontributor. Our basic view is that Mastercard’s payments network is acompetitive moat that positions the business as a key beneficiary asmore transactions migrate from cash and check to plastic and electronicpayments. ASML Holding N.V. was the second-largest relativecontributor. Growth in cloud computing, which has translated into risingdemand for NAND flash memory and Dynamic Random Access Memory,and strong initial demand for 5G devices and infrastructure, benefited theposition in the developer of semiconductor manufacturing equipment.L3Harris Technologies, Inc. was another top contributor, as Harris Corp.and L3 Technologies Inc. merged during the year. We continue to seeupside for the newly formed company, and expect the combined entity torealize significant synergies from the merger. (1)
Apple Inc. was the largest relative detractor. The Portfolio had someexposure to Apple, Inc. but was underweight the stock relative to thebenchmark. The stock price of Apple, Inc. increased strongly during theyear. Facebook, Inc. Class A was another relative detractor, as concernsabout increased regulatory scrutiny have been an overhang for thestock. We expect expense growth to remain elevated as the companyaddresses these concerns. (1)
Q. How did the Portfolio’s use of derivative instruments and initialpublic offerings (IPOs), if any, impact performance?
A. The Portfolio did not use derivatives during the year. The Portfolioparticipated in two IPOs during the year, which added 6 basis points toabsolute return. (1)
(1) The Portfolio’s composition is subject to change. Holdings and weightings areas of December 31, 2019.
Change in Value of $10,000 Investment
ON Janus Henderson Forty Portfolio (A)Russell 1000 Growth Index (B)
0
10,000
20,000
30,000
40,000
$50,000
6/1
012
/10 6
/1112
/11 6
/1212
/12 6
/1312
/13 6
/1412
/14 6
/1512
/15 6
/1612
/16 6
/1712
/17 6
/1812
/18 6
/19
12/3
1/09
12/1
9
$41,234 (B)$38,069 (A)
Hypothetical illustration based on past performance. Future performance will vary.The Portfolio’s returns reflect reinvested dividends. The Portfolio’s holdings maydiffer significantly from the securities in the index. The index is unmanaged andtherefore does not reflect the cost of portfolio management and accounting.
The Russell 1000 Growth Index is a market-capitalization weighted index of thosefirms in the Russell 1000 Index with higher price-to-book ratios and higherforecasted growth values. The Russell 1000 Index measures the performance ofthe large-cap segment of the U.S. equity universe. The index presented includesthe effects of reinvested dividends.
Past performance is no guarantee of future results. Redemption of fund sharescould have tax implications unique to each shareholder.
Ohio National Fund, Inc. ON Janus Henderson Forty Portfolio (Unaudited)
35 (continued)

Portfolio Composition as of December 31, 2019 (1)
% of Net AssetsCommon Stocks (4) 98.6Money Market Funds
Less Net Liabilities 1.4100.0
Top 10 Portfolio Holdings as of December 31, 2019 (1) (2) (3)
% of Net Assets1. Microsoft Corp. 8.02. Mastercard, Inc. Class A 6.03. Alphabet, Inc. Class C 5.34. Apple, Inc. 4.95. Amazon.com, Inc. 4.46. Facebook, Inc. Class A 3.57. Boston Scientific Corp. 3.18. salesforce.com, Inc. 3.09. L3Harris Technologies, Inc. 3.0
10. American Tower Corp. 2.8
(1) Composition of Portfolio subject to change.(2) Short-term investments have been excluded from the list of Top 10 Portfolio Holdings.(3) Top 10 Portfolio Holdings is presented at an individual security level. Total investment exposure by issuer may be higher.(4) Sectors (Common Stocks):
% of Net AssetsInformation Technology 33.3Health Care 17.0Communication Services 14.9Consumer Discretionary 11.9Industrials 9.9Financials 6.1Real Estate 2.9Materials 2.6
98.6
Ohio National Fund, Inc. ON Janus Henderson Forty Portfolio (Unaudited) (Continued)
36

Common Stocks – 98.6% Shares Value
COMMUNICATION SERVICES – 14.9%Alphabet, Inc. Class C (Interactive Media &
Svs.) . . . . . . . . . . . . . . . . . . . . . . . . . . (a) 7,781 $ 10,403,353Facebook, Inc. Class A (Interactive Media &
Svs.) . . . . . . . . . . . . . . . . . . . . . . . . . . (a) 33,488 6,873,412GCI Liberty, Inc. Class A (Diversified Telecom.
Svs.) . . . . . . . . . . . . . . . . . . . . . . . . . . (a) 34,372 2,435,256Live Nation Entertainment, Inc. (Entertainment). (a) 18,128 1,295,608Netflix, Inc. (Entertainment) . . . . . . . . . . . . . (a) 12,412 4,016,151Walt Disney Co. / The (Entertainment). . . . . . . 30,186 4,365,801
29,389,581
CONSUMER DISCRETIONARY – 11.9%Amazon.com, Inc. (Internet & Direct Marketing
Retail) . . . . . . . . . . . . . . . . . . . . . . . . . (a) 4,693 8,671,913Hasbro, Inc. (Leisure Products). . . . . . . . . . . 39,075 4,126,711Home Depot, Inc. / The (Specialty Retail). . . . . 19,920 4,350,130NIKE, Inc. Class B (Textiles, Apparel & Luxury
Goods) . . . . . . . . . . . . . . . . . . . . . . . . 31,656 3,207,069ServiceMaster Global Holdings, Inc.
(Diversified Consumer Svs.) . . . . . . . . . . . (a) 80,234 3,101,84623,457,669
FINANCIALS – 6.1%Charles Schwab Corp. / The (Capital Markets) . 79,042 3,759,238Intercontinental Exchange, Inc.
(Capital Markets) . . . . . . . . . . . . . . . . . . 42,124 3,898,576Markel Corp. (Insurance) . . . . . . . . . . . . . . (a) 3,870 4,424,068
12,081,882
HEALTH CARE – 17.0%Boston Scientific Corp. (Health Care Equip. &
Supplies) . . . . . . . . . . . . . . . . . . . . . . . (a) 133,582 6,040,578Cooper Cos., Inc. / The (Health Care Equip. &
Supplies) . . . . . . . . . . . . . . . . . . . . . . . 15,732 5,054,534Danaher Corp. (Health Care Equip. & Supplies) . 30,165 4,629,724Edwards Lifesciences Corp. (Health Care
Equip. & Supplies) . . . . . . . . . . . . . . . . . (a) 6,725 1,568,875Globus Medical, Inc. Class A (Health Care
Equip. & Supplies) . . . . . . . . . . . . . . . . . (a) 38,909 2,290,962ICU Medical, Inc. (Health Care Equip. &
Supplies) . . . . . . . . . . . . . . . . . . . . . . . (a) 17,768 3,324,748Insmed, Inc. (Biotechnology) . . . . . . . . . . . . (a) 124,576 2,974,875Intuitive Surgical, Inc. (Health Care Equip. &
Supplies) . . . . . . . . . . . . . . . . . . . . . . . (a) 8,129 4,805,459Neurocrine Biosciences, Inc. (Biotechnology) . (a) 24,805 2,666,290
33,356,045
Common Stocks (Continued) Shares Value
INDUSTRIALS – 9.9%Boeing Co. / The (Aerospace & Defense). . . . . 13,476 $ 4,389,942CoStar Group, Inc. (Professional Svs.) . . . . . . (a) 6,618 3,959,549L3Harris Technologies, Inc. (Aerospace &
Defense) . . . . . . . . . . . . . . . . . . . . . . . 29,753 5,887,226Westinghouse Air Brake Technologies Corp.
(Machinery) . . . . . . . . . . . . . . . . . . . . . 68,299 5,313,66219,550,379
INFORMATION TECHNOLOGY – 33.3%Adobe, Inc. (Software) . . . . . . . . . . . . . . . . (a) 12,756 4,207,056Apple, Inc. (Tech. Hardware, Storage &
Periph.) . . . . . . . . . . . . . . . . . . . . . . . . 32,701 9,602,649ASML Holding N.V. (Semiconductors & Equip.) . 14,548 4,305,335Atlassian Corp. PLC Class A (Software). . . . . . (a) 8,774 1,055,863Avalara, Inc. (Software) . . . . . . . . . . . . . . . (a) 27,275 1,997,894Cognex Corp. (Electronic Equip., Instr. &
Comp.) . . . . . . . . . . . . . . . . . . . . . . . . 19,684 1,103,091Mastercard, Inc. Class A (IT Svs.) . . . . . . . . . 39,737 11,865,071Microchip Technology, Inc. (Semiconductors &
Equip.) . . . . . . . . . . . . . . . . . . . . . . . . 24,897 2,607,214Microsoft Corp. (Software) . . . . . . . . . . . . . 99,977 15,766,373salesforce.com, Inc. (Software) . . . . . . . . . . (a) 36,202 5,887,893Texas Instruments, Inc. (Semiconductors &
Equip.) . . . . . . . . . . . . . . . . . . . . . . . . 43,454 5,574,714Zendesk, Inc. (Software) . . . . . . . . . . . . . . . (a) 21,250 1,628,387
65,601,540
MATERIALS – 2.6%Ball Corp. (Containers & Packaging) . . . . . . . 34,948 2,260,087Sherwin-Williams Co. / The (Chemicals) . . . . . 5,015 2,926,453
5,186,540
REAL ESTATE – 2.9%American Tower Corp. (Equity REIT) . . . . . . . . 24,313 5,587,614Total Common Stocks (Cost $157,278,907) . . . . $194,211,250
Money Market Funds – 1.6% Shares Value
State Street Institutional Liquid Reserves FundInstitutional Class, 1.734% . . . . . . . . . . . . . (b) 3,069,396 $ 3,069,703
Total Money Market Funds (Cost $3,069,703) . . . . . . $ 3,069,703Total Investments – 100.2% (Cost $160,348,610) . . . . . . . (c) $197,280,953Liabilities in Excess of Other Assets – (0.2)% . . . . . . . (331,100)Net Assets – 100.0% $196,949,853
Percentages are stated as a percent of net assets.Footnotes:
(a) Non-income producing security.(b) Rate represents the seven-day yield at December 31, 2019.(c) Represents cost for financial reporting purposes, which may differ from cost basis for federal income tax purposes. See also Note 8 of the Notes to Financial
Statements.
The accompanying notes are an integral part of these financial statements.
Ohio National Fund, Inc. ON Janus Henderson Forty Portfolio
Schedule of Investments December 31, 2019
37

Objective/Strategy
The ON Janus Henderson Venture Portfolio seeks long-term capitalappreciation by investing, under normal circumstances, at least 80% ofits net assets in stocks of small capitalization companies.
Performance as of December 31, 2019
Average Annual returnsOne year 28.61%Five years 9.64%Ten years 14.92%
Past performance does not guarantee future results. The performance dataquoted represents past performance and current returns may be lower or higher.Total return figures include change in share price and reinvestment of dividendsand capital gains. The investment return and principal value will fluctuate so thatan investor’s shares, when redeemed, may be worth more or less than the originalcost. To obtain performance information up to the most recent month end, calltoll-free 1-877-781-6392.
The Portfolio is not open to direct retail investment. Beneficial interest in shares isobtained solely by purchase of variable life insurance policies and variable annuitycontracts. Actual performance results for variable annuity and variable universallife contracts will be lower due to contract charges. Consult your contract forapplicable charges.
Total expense ratio is 0.85% per the Fund’s prospectus dated November 22, 2019.Additional information pertaining to the Portfolio’s expense ratio as ofDecember 31, 2019 can be found in the Portfolio’s Financial Highlights.
Comments from Sub-Adviser
Q. How did the Portfolio perform in comparison to its benchmark duringthe reporting period?
A. For the year ended December 31, 2019, the Portfolio returned 28.61%versus 28.48% for its benchmark, the Russell 2000 Growth Index.
Q. Were there specific market conditions, investment strategies, ortechniques that materially affected the Portfolio’s benchmark-relativeperformance during the reporting period?
A. Relative performance was affected by a valuation bifurcation amongsmall-cap stocks. Companies tied to secular growth trends, such asbiotechnology innovation or software-as-a-service (“SaaS”), traded atextreme multiples during the year. Many of these companies have yet toproduce earnings and trade at absurdly high multiples of revenue. At theopposite end of the spectrum, stocks of many companies with anycyclicality to their business models were already pricing in a recession.
The Portfolio owns companies tied to powerful secular growth trends,such as biotechnology innovation or the transition of software servicesto the cloud, but we have taken a selective approach. Holdings in thebiotechnology industry demonstrate this process. We’ve generallyavoided the smallest biotechnology companies in the benchmark, whosepotential earnings streams are often tied to a single treatment still underdevelopment. Instead, we favor companies with established productswhose earnings streams are more visible. We also hold companiesproviding services that improve drug delivery and development. Suchbusinesses still benefit from broad industry innovation and theproliferation of new drugs, but should be less risky than owning a stockwhose performance is tied largely to the binary outcome of a singleclinical trial. At the same time, we endeavored to own fewer cyclicalcompanies. Many of our industrial companies, for example, have strongaftermarket businesses that help buttress earnings even in a less certaineconomic environment. This approach helped our relative performanceduring a year often marked by volatility. (1)
Q. How did sector allocation and security selection each impact thePortfolio’s performance relative to its benchmark? For sector allocation,were there any factors that impacted the benchmark’s performancemore significantly than the Portfolio’s performance? For securityselection, was there anything specific regarding the Portfolio’s strategythat caused deviation from the benchmark?
A. Stock selection and an overweight to Information Technologycontributed to the Portfolio’s relative outperformance. Many InformationTechnology holdings are not traditional technology companies, butrather business services companies that use technology to improveoperations for end markets from health care to financial services. Thesetypes of services have typically delivered steady, recurring revenuestreams for companies, helping to support strong stock marketperformance. (1)
Stock selection and an underweight in Health Care detracted fromrelative performance, however. (1)
Q. Which holdings contributed the most to, and detracted the most from,the Portfolio’s benchmark-relative performance?
A. Catalent, Inc. (“Catalent), an outsourced pharmaceuticalmanufacturer not in the benchmark, was the top relative contributor. Thestock rebounded strongly in the first quarter of 2019, following a fourthquarter 2018 decline that reflected concerns over an industry ibuprofenshortage. Catalent was able to source an alternative supplier ofibuprofen in the first quarter, which resolved the shortage issue. It alsoreported strong results for its biologics business, a key growth driver. Webelieve Catalent represents a less-risky way to invest in the innovationtaking place in the biotechnology and pharmaceutical industries. Thesecond largest relative contributor, aerospace and electronics companyHEICO Corp. Class A, specializes in aftermarket aerospace components,a business that provides steady, recurring revenue streams. Thecompany also benefited from international regulatory changes that madeit easier for manufacturers to use aftermarket parts. Neogenomics, Inc.,which operates diagnostic labs that help doctors analyze geneticmarkers and personalize cancer treatments, was the third largestrelative contributor. The stock rose as the company continued tostrengthen its market position through acquisitions. It is well positionedto benefit from a broad range of cancer treatment milestones. (1)
Not owning benchmark holding Arrowhead Biopharma, Inc. detractedfrom relative performance. The stock rose strongly after the early-stagebiopharmaceutical company reported strong clinical trial news related toa hepatitis B treatment it is developing with Johnson & Johnson. Notowning benchmark holding Array Biopharma also hurt relative results, asthe stock surged higher on news of the company’s acquisition by Pfizer.Waitr Holdings, Inc., a stock the Portfolio did own, was a third notabledetractor from relative performance. The company offers a platform thatfacilitates online ordering and delivery from local restaurants. The stockdeclined due to concerns over increased competition after larger, bettercapitalized competitors entered its markets. The company also facedchallenges with entering and ramping up in new markets, which weighedon its earnings performance. We exited the position during the year. (1)
Q. How did the Portfolio’s use of derivative instruments and initialpublic offerings (IPOs), if any, impact performance?
A. The Portfolio did not use derivatives during the year. The Portfolioparticipated in twelve IPOs during the year, which contributed 100 basispoints to absolute return. Notable individual contributors were BellRingBrands, Inc. Class A and Bridgebio Pharma, Inc., contributing 26 and 25basis points to absolute return, respectively. (1)
(1) The Portfolio’s composition is subject to change. Holdings and weightings areas of December 31, 2019.
Ohio National Fund, Inc. ON Janus Henderson Venture Portfolio (Unaudited)
38 (continued)

Change in Value of $10,000 Investment
ON Janus Henderson Venture Portfolio (A)Russell 2000 Growth Index (B)
0
10,000
20,000
30,000
40,000
$50,000
6/1
012
/10 6
/1112
/11 6
/1212
/12 6
/1312
/13 6
/1412
/14 6
/1512
/15 6
/1612
/16 6
/1712
/17 6
/1812
/18 6
/19
12/3
1/09
12/1
9
$40,169 (A)
$33,965 (B)
Hypothetical illustration based on past performance. Future performance will vary.The Portfolio’s returns reflect reinvested dividends. The Portfolio’s holdings maydiffer significantly from the securities in the index. The index is unmanaged andtherefore does not reflect the cost of portfolio management and accounting.
The Russell 2000 Growth Index measures the performance of the small-cap growthsegment of the U.S. equity universe. It includes the Russell 2000 Index companieswith higher price-to-value ratios and higher forecasted growth values. The Russell2000 Index includes the 2000 firms from the Russell 3000 Index with the smallestmarket capitalizations. The Russell 3000 Index represents 98% of the investableU.S. equity markets. The index presented includes the effects of reinvesteddividends.
Past performance is no guarantee of future results. Redemption of fund sharescould have tax implications unique to each shareholder.
Portfolio Composition as of December 31, 2019 (1)
% of Net AssetsCommon Stocks (4) 96.3Master Limited Partnerships (4) 1.4Money Market Funds and
Other Net Assets 2.3100.0
Top 10 Portfolio Holdings as of December 31, 2019 (1) (2) (3)
% of Net Assets1. Catalent, Inc. 2.62. Nice Ltd. – ADR 2.23. Euronet Worldwide, Inc. 2.14. LPL Financial Holdings, Inc. 2.05. ON Semiconductor Corp. 1.86. j2 Global, Inc. 1.87. SS&C Technologies Holdings, Inc. 1.68. Blackbaud, Inc. 1.69. ITT, Inc. 1.6
10. CSW Industrials, Inc. 1.6
(1) Composition of Portfolio subject to change.(2) Short-term investments have been excluded from the list of Top 10 Portfolio Holdings.(3) Top 10 Portfolio Holdings is presented at an individual security level. Total investment exposure by issuer may be higher.(4) Sectors (Common Stocks, Master Limited Partnerships):
% of Net AssetsInformation Technology 32.2Health Care 21.8Industrials 17.6Consumer Discretionary 9.2Financials 5.8Materials 5.2Consumer Staples 2.1Real Estate 2.0Energy 1.1Communication Services 0.7
97.7
Ohio National Fund, Inc. ON Janus Henderson Venture Portfolio (Unaudited) (Continued)
39

Common Stocks – 96.3% Shares Value
COMMUNICATION SERVICES – 0.7%Manchester United PLC Class A
(Entertainment) . . . . . . . . . . . . . . . . . . . 47,384 $ 944,363Vonage Holdings Corp. (Diversified Telecom.
Svs.) . . . . . . . . . . . . . . . . . . . . . . . . . . (a) 43,807 323,7341,268,097
CONSUMER DISCRETIONARY – 7.8%Carter’s, Inc. (Textiles, Apparel & Luxury
Goods) . . . . . . . . . . . . . . . . . . . . . . . . 9,542 1,043,322Dunkin’ Brands Group, Inc. (Hotels,
Restaurants & Leisure) . . . . . . . . . . . . . . 17,181 1,297,853frontdoor, Inc. (Diversified Consumer Svs.) . . . (a) 32,116 1,522,941K12, Inc. (Diversified Consumer Svs.) . . . . . . . (a) 55,264 1,124,622Lovesac Co. / The (Household Durables) . . . . . (a) 47,301 759,181MakeMyTrip Ltd. (Internet & Direct Marketing
Retail) . . . . . . . . . . . . . . . . . . . . . . . . . (a) 4,342 99,432Monarch Casino & Resort, Inc. (Hotels,
Restaurants & Leisure) . . . . . . . . . . . . . . (a) 22,610 1,097,715RealReal, Inc. / The (Internet & Direct
Marketing Retail) . . . . . . . . . . . . . . . . . . (a) 26,542 500,317ServiceMaster Global Holdings, Inc.
(Diversified Consumer Svs.) . . . . . . . . . . . (a) 64,232 2,483,209Thor Industries, Inc. (Automobiles) . . . . . . . . 14,248 1,058,484Visteon Corp. (Auto Components) . . . . . . . . . (a) 14,774 1,279,281Williams-Sonoma, Inc. (Specialty Retail) . . . . . 14,589 1,071,416
13,337,773
CONSUMER STAPLES – 2.1%BellRing Brands, Inc. Class A
(Personal Products) . . . . . . . . . . . . . . . . (a) 50,042 1,065,394Casey’s General Stores, Inc. (Food & Staples
Retailing) . . . . . . . . . . . . . . . . . . . . . . . 5,541 880,963Hain Celestial Group, Inc. / The
(Food Products) . . . . . . . . . . . . . . . . . . . (a) 24,960 647,837Ontex Group N.V. (Personal Products) . . . . . . (b) 51,061 1,074,745
3,668,939
ENERGY – 1.1%Magnolia Oil & Gas Corp. Class A (Oil, Gas &
Consumable Fuels) . . . . . . . . . . . . . . . . . (a) 79,881 1,004,903Solaris Oilfield Infrastructure, Inc. Class A
(Energy Equip. & Svs.) . . . . . . . . . . . . . . . 63,713 891,9821,896,885
FINANCIALS – 5.8%Assetmark Financial Holdings, Inc.
(Capital Markets) . . . . . . . . . . . . . . . . . . (a) 34,499 1,001,161Kearny Financial Corp. (Thrifts & Mortgage
Finance) . . . . . . . . . . . . . . . . . . . . . . . 59,698 825,623LendingTree, Inc. (Thrifts & Mortgage Finance). (a) 3,489 1,058,702LPL Financial Holdings, Inc. (Capital Markets). . 37,547 3,463,711MSCI, Inc. (Capital Markets) . . . . . . . . . . . . 2,955 762,922RLI Corp. (Insurance) . . . . . . . . . . . . . . . . . 17,180 1,546,544UMB Financial Corp. (Banks) . . . . . . . . . . . . 17,122 1,175,254
9,833,917
HEALTH CARE – 21.8%AngioDynamics, Inc. (Health Care Equip. &
Supplies) . . . . . . . . . . . . . . . . . . . . . . . (a) 46,797 749,220Bio-Techne Corp. (Life Sciences Tools & Svs.) . 7,940 1,742,909Bridgebio Pharma, Inc. (Biotechnology) . . . . . (a) 18,735 656,662Catalent, Inc. (Pharmaceuticals) . . . . . . . . . . (a) 78,126 4,398,494Codexis, Inc. (Life Sciences Tools & Svs.) . . . . (a) 59,993 959,288CryoPort, Inc. (Health Care Equip. & Supplies) . (a) 21,694 357,083Deciphera Pharmaceuticals, Inc.
(Biotechnology) . . . . . . . . . . . . . . . . . . . (a) 14,635 910,882Eagle Pharmaceuticals, Inc. (Biotechnology) . . (a) 23,968 1,439,997Enanta Pharmaceuticals, Inc. (Biotechnology) . (a) 5,479 338,493FibroGen, Inc. (Biotechnology) . . . . . . . . . . . (a) 19,605 840,859
Common Stocks (Continued) Shares Value
HEALTH CARE (continued)Global Blood Therapeutics, Inc.
(Biotechnology) . . . . . . . . . . . . . . . . . . . (a) 7,856 $ 624,473Globus Medical, Inc. Class A (Health Care
Equip. & Supplies) . . . . . . . . . . . . . . . . . (a) 34,563 2,035,069GW Pharmaceuticals PLC – ADR
(Pharmaceuticals) . . . . . . . . . . . . . . . . . (a) 7,478 781,900HealthEquity, Inc. (Health Care Providers &
Svs.) . . . . . . . . . . . . . . . . . . . . . . . . . . (a) 14,420 1,068,089Heron Therapeutics, Inc. (Biotechnology) . . . . (a) 28,369 666,672Heska Corp. (Health Care Equip. & Supplies) . . (a) 7,642 733,174ICU Medical, Inc. (Health Care Equip. &
Supplies) . . . . . . . . . . . . . . . . . . . . . . . (a) 6,208 1,161,641Immunomedics, Inc. (Biotechnology) . . . . . . . (a) 32,427 686,155Insmed, Inc. (Biotechnology) . . . . . . . . . . . . (a) 48,917 1,168,138Integra LifeSciences Holdings Corp. (Health
Care Equip. & Supplies) . . . . . . . . . . . . . . (a) 28,518 1,662,029Knight Therapeutics, Inc. (Pharmaceuticals) . . (a) 126,860 740,517Ligand Pharmaceuticals, Inc. (Biotechnology) . (a) 14,529 1,515,229Mirati Therapeutics, Inc. (Biotechnology) . . . . (a) 9,405 1,211,928MyoKardia, Inc. (Pharmaceuticals) . . . . . . . . (a) 7,028 512,236Myovant Sciences Ltd. (Biotechnology) . . . . . (a) 21,414 332,345NeoGenomics, Inc. (Life Sciences Tools &
Svs.) . . . . . . . . . . . . . . . . . . . . . . . . . . (a) 75,707 2,214,430Neurocrine Biosciences, Inc. (Biotechnology) . (a) 14,463 1,554,628Phathom Pharmaceuticals, Inc.
(Pharmaceuticals) . . . . . . . . . . . . . . . . . (a) 4,643 144,583Prestige Consumer Healthcare, Inc.
(Pharmaceuticals) . . . . . . . . . . . . . . . . . (a) 28,213 1,142,627PTC Therapeutics, Inc. (Biotechnology) . . . . . (a) 10,578 508,061Rhythm Pharmaceuticals, Inc. (Biotechnology) . (a) 29,101 668,159STERIS PLC (Health Care Equip. & Supplies) . . 15,230 2,321,357Surmodics, Inc. (Health Care Equip. &
Supplies) . . . . . . . . . . . . . . . . . . . . . . . (a) 17,175 711,560Zogenix, Inc. (Pharmaceuticals) . . . . . . . . . . (a) 11,350 591,676
37,150,563
INDUSTRIALS – 17.6%Alamo Group, Inc. (Machinery) . . . . . . . . . . . 2,916 366,104AMERCO (Road & Rail) . . . . . . . . . . . . . . . . 3,681 1,383,393Brady Corp. Class A (Commercial Svs. &
Supplies) . . . . . . . . . . . . . . . . . . . . . . . 35,137 2,011,945Cimpress PLC (Commercial Svs. & Supplies) . . (a) 8,956 1,126,396Clarivate Analytics PLC (Professional Svs.) . . . (a) 137,187 2,304,742Construction Partners, Inc. Class A
(Construction & Engineering) . . . . . . . . . . (a) 39,238 661,945CSW Industrials, Inc. (Building Products) . . . . 34,588 2,663,276EnerSys (Electrical Equip.). . . . . . . . . . . . . . 17,942 1,342,600Gates Industrial Corp. PLC (Machinery). . . . . . (a) 120,752 1,661,548HEICO Corp. Class A (Aerospace & Defense) . . 15,882 1,421,915ITT, Inc. (Machinery) . . . . . . . . . . . . . . . . . 36,429 2,692,467Kennametal, Inc. (Machinery) . . . . . . . . . . . 32,893 1,213,423Kornit Digital Ltd. (Machinery) . . . . . . . . . . . (a) 48,460 1,658,786Nordson Corp. (Machinery) . . . . . . . . . . . . . 11,799 1,921,349Old Dominion Freight Line, Inc. (Road & Rail) . . 3,125 593,062Proto Labs, Inc. (Machinery) . . . . . . . . . . . . (a) 8,846 898,311Rexnord Corp. (Machinery) . . . . . . . . . . . . . (a) 70,690 2,305,908Standex International Corp. (Machinery) . . . . . 22,045 1,749,271TrueBlue, Inc. (Professional Svs.) . . . . . . . . . (a) 51,382 1,236,251Westinghouse Air Brake Technologies Corp.
(Machinery) . . . . . . . . . . . . . . . . . . . . . 11,808 918,66230,131,354
INFORMATION TECHNOLOGY – 32.2%Altair Engineering, Inc. Class A (Software). . . . (a) 30,956 1,111,630Belden, Inc. (Electronic Equip., Instr. & Comp.) . 33,838 1,861,090Bill.Com Holdings, Inc. (Software) . . . . . . . . . (a) 1,111 42,274Blackbaud, Inc. (Software) . . . . . . . . . . . . . 33,892 2,697,803Broadridge Financial Solutions, Inc. (IT Svs.) . . 16,834 2,079,672Cadence Design Systems, Inc. (Software) . . . . (a) 12,221 847,649
Ohio National Fund, Inc. ON Janus Henderson Venture Portfolio
Schedule of Investments December 31, 2019
40 (continued)

Common Stocks (Continued) Shares Value
INFORMATION TECHNOLOGY (continued)ChannelAdvisor Corp. (Software) . . . . . . . . . (a) 78,045 $ 705,527Cision Ltd. (Software) . . . . . . . . . . . . . . . . . (a) 47,209 470,674Descartes Systems Group, Inc. / The
(Software) . . . . . . . . . . . . . . . . . . . . . . (a) 57,238 2,446,351Envestnet, Inc. (Software) . . . . . . . . . . . . . . (a) 27,967 1,947,342Euronet Worldwide, Inc. (IT Svs.) . . . . . . . . . (a) 22,777 3,588,744Everbridge, Inc. (Software) . . . . . . . . . . . . . (a) 13,505 1,054,470GTY Technology Holdings, Inc. (Software) . . . . (a) 102,692 604,856Guidewire Software, Inc. (Software) . . . . . . . (a) 10,293 1,129,863Instructure, Inc. (Software) . . . . . . . . . . . . . (a) 13,934 671,758j2 Global, Inc. (Software) . . . . . . . . . . . . . . . 32,248 3,021,960LivePerson, Inc. (Software) . . . . . . . . . . . . . (a) 43,445 1,607,465Medallia, Inc. (Software). . . . . . . . . . . . . . . (a) 25,157 782,634National Instruments Corp. (Electronic Equip.,
Instr. & Comp.) . . . . . . . . . . . . . . . . . . . 16,107 681,970Nice Ltd. – ADR (Software) . . . . . . . . . . . . . (a) 24,728 3,836,549Novanta, Inc. (Electronic Equip., Instr. &
Comp.) . . . . . . . . . . . . . . . . . . . . . . . . (a) 14,942 1,321,471ON Semiconductor Corp. (Semiconductors &
Equip.) . . . . . . . . . . . . . . . . . . . . . . . . (a) 126,687 3,088,629OSI Systems, Inc. (Electronic Equip., Instr. &
Comp.) . . . . . . . . . . . . . . . . . . . . . . . . (a) 17,299 1,742,701Paylocity Holding Corp. (Software) . . . . . . . . (a) 18,894 2,282,773RealPage, Inc. (Software) . . . . . . . . . . . . . . (a) 31,541 1,695,329Rogers Corp. (Electronic Equip., Instr. &
Comp.) . . . . . . . . . . . . . . . . . . . . . . . . (a) 10,086 1,258,027SailPoint Technologies Holding, Inc.
(Software) . . . . . . . . . . . . . . . . . . . . . . (a) 52,553 1,240,251SS&C Technologies Holdings, Inc. (Software). . 44,933 2,758,886Trade Desk, Inc. / The Class A (Software) . . . . (a) 6,301 1,636,874Tyler Technologies, Inc. (Software) . . . . . . . . (a) 5,309 1,592,806WEX, Inc. (IT Svs.) . . . . . . . . . . . . . . . . . . . (a) 9,283 1,944,417WNS Holdings Ltd. – ADR (IT Svs.). . . . . . . . . (a) 33,334 2,205,044Yext, Inc. (Software). . . . . . . . . . . . . . . . . . (a) 64,292 927,091
54,884,580
Common Stocks (Continued) Shares Value
MATERIALS – 5.2%Chase Corp. (Chemicals) . . . . . . . . . . . . . . . 7,000 $ 829,360Constellium SE (Metals & Mining) . . . . . . . . . (a) 56,649 759,097H.B. Fuller Co. (Chemicals). . . . . . . . . . . . . . 27,242 1,404,870Neenah, Inc. (Paper & Forest Products) . . . . . 15,690 1,105,047Sensient Technologies Corp. (Chemicals) . . . . 38,427 2,539,640Valvoline, Inc. (Chemicals). . . . . . . . . . . . . . 101,464 2,172,344
8,810,358
REAL ESTATE – 2.0%Easterly Government Properties, Inc.
(Equity REIT) . . . . . . . . . . . . . . . . . . . . . 45,298 1,074,922FirstService Corp. (Real Estate Mgmt. &
Development) . . . . . . . . . . . . . . . . . . . . 11,838 1,101,407Redfin Corp. (Real Estate Mgmt. &
Development) . . . . . . . . . . . . . . . . . . . . (a) 60,220 1,273,0513,449,380
Total Common Stocks (Cost $120,550,940) . . . . $164,431,846
Master Limited Partnerships – 1.4% Shares Value
CONSUMER DISCRETIONARY – 1.4%Cedar Fair LP (Hotels, Restaurants & Leisure) . . . . . 42,931 $ 2,380,095Total Master Limited Partnerships (Cost $2,183,558) . $ 2,380,095
Money Market Funds – 2.0% Shares Value
State Street Institutional Liquid Reserves FundInstitutional Class, 1.734% . . . . . . . . . . . . . (c) 3,354,824 $ 3,355,159
Total Money Market Funds (Cost $3,355,159) . . . . . . $ 3,355,159Total Investments – 99.7% (Cost $126,089,657) . . . . . . . . (d) $170,167,100Other Assets in Excess of Liabilities – 0.3%. . . . . . . . 507,759Net Assets – 100.0% $170,674,859
Percentages are stated as a percent of net assets.Abbreviations:
ADR: American Depositary ReceiptsFootnotes:
(a) Non-income producing security.(b) Security traded on a foreign exchange has been valued at an estimate of fair value that is different than the local market close price. These fair value estimates
are determined by an independent fair valuation service that has been approved by the Board. These securities represent $1,074,745 or 0.6% of the Portfolio’s netassets.Other Portfolio securities are not subjected to fair value procedures because they are traded on domestic or foreign exchanges that have close times that areconsistent with the U.S. market close, normally 4:00 pm Eastern Time.
(c) Rate represents the seven-day yield at December 31, 2019.(d) Represents cost for financial reporting purposes, which may differ from cost basis for federal income tax purposes. See also Note 8 of the Notes to Financial
Statements.
The accompanying notes are an integral part of these financial statements.
Ohio National Fund, Inc. ON Janus Henderson Venture Portfolio (Continued)
Schedule of Investments December 31, 2019
41

Objective/Strategy
The ON Janus Henderson Enterprise Portfolio seeks long-term totalreturn by investing, under normal circumstances, at least 50% of its netassets in equity securities of mid-cap companies, primarily those that arestrategically positioned for long-term growth.
Performance as of December 31, 2019
Average Annual returnsOne year 36.57%Five years 10.13%Ten years 12.72%
Past performance does not guarantee future results. The performance dataquoted represents past performance and current returns may be lower or higher.Total return figures include change in share price and reinvestment of dividendsand capital gains. The investment return and principal value will fluctuate so thatan investor’s shares, when redeemed, may be worth more or less than the originalcost. To obtain performance information up to the most recent month end, calltoll-free 1-877-781-6392.
The Portfolio is not open to direct retail investment. Beneficial interest in shares isobtained solely by purchase of variable life insurance policies and variable annuitycontracts. Actual performance results for variable annuity and variable universallife contracts will be lower due to contract charges. Consult your contract forapplicable charges.
Total expense ratio is 0.96% per the Fund’s prospectus dated November 22, 2019.Additional information pertaining to the Portfolio’s expense ratio as ofDecember 31, 2019 can be found in the Portfolio’s Financial Highlights.
Comments from Sub-Adviser
Q. How did the Portfolio perform in comparison to its benchmark duringthe reporting period?
A. For the year ended December 31, 2019, the Portfolio returned 36.57%versus 35.47% for its benchmark, the Russell Midcap Growth Index.
Q. Were there specific market conditions, investment strategies, ortechniques that materially affected the Portfolio’s benchmark-relativeperformance during the reporting period?
A. The Portfolio tends to emphasize “durable growth” companies thathave more predictable business models, recurring revenue streams,strong free-cash-flow growth and strong competitive positioning thatshould allow them to take market share and experience sustainablelong-term growth across a variety of economic environments. Many ofthese stocks performed well for the Portfolio. However, the Portfolio wasunderexposed to some of the highly valued consumer internet andsoftware-as-a-service (�SaaS�) companies that were strong marketperformers for the benchmark. These underweights dampened relativeperformance. We own a few of these companies – and like the businessmodels and management teams associated with others – but areconcerned about excessive valuations associated with many of thesebusinesses. We remain sensitive to valuation risk and downsideprotection and are comfortable with the Portfolio’s positioning within theInformation Technology sector. (1)
Q. How did sector allocation and security selection each impact thePortfolio’s performance relative to its benchmark? For sector allocation,were there any factors that impacted the benchmark’s performancemore significantly than the Portfolio’s performance? For stock selection,was there anything specific regarding the Portfolio’s strategy thatcaused deviation from the benchmark?
A. Stock selection was the key to outperformance, especially in theIndustrials sector. The Portfolio tends to own fewereconomically-sensitive Industrials companies than the benchmark, and
that positioning helped in an environment where global economic growthwas a growing market concern. The Portfolio’s underweights to theunderperforming Communication Services and Consumer Staplessectors also contributed. The reasons for these underweights are stockspecific and not reflective of a view on the broader sectors. Stockselection in the Consumer Discretionary, Health Care and Materialssectors detracted from relative performance. (1)
Q. Which holdings contributed the most to, and detracted the most from,the Portfolio’s benchmark-relative performance?
A. Constellation Software, Inc. (“Constellation”) was a leading relativecontributor. This diversified software company has a long history ofmaking strategic acquisitions and becoming the leading softwareprovider for a host of niche industries. It has deployed capital towardstrategic acquisitions, which the market generally viewed favorably,given Constellation’s history of creating value with the companies ittargets. Nice Ltd. – ADR was also a top contributor. The company helpsorganizations use data to improve performance, increase efficiency,comply with regulations and fight financial crime. Its services includesophisticated analytical applications that have helped boost customerengagement, and it benefits from recurring revenue streams and highcustomer retention rates. These attributes have helped support thecompany’s financial results and stock performance. TeledyneTechnologies, Inc., another strong contributor, owns diverse businesseswith exposure to end markets, including technology, defense, marine andindustrial. It delivered robust financial performance, supported in part bystrategic acquisitions. The company also issued strong earningsguidance that reflected strength in its defense business and some signsof early-stage recovery in its marine business. (1)
A lack of exposure to semiconductor company Advanced Micro Devices,Inc. hurt relative performance. The stock rose strongly for the year, aidedby the company’s generally positive revenue and earnings performance.Not owning benchmark holding Fiserv, Inc., a supplier of technology tothe Financial Services sector, also hindered relative performance. Thestock’s performance was lifted by the company’s strong financial resultsand expectations over the synergies provided by its merger with FirstData Corp. Not owning benchmark holding ServiceNow, Inc., a providerof enterprise SaaS solutions, also dampened relative performance, asthe stock rose strongly during the year, aided by its better than expectedearnings performance. We remain selective in our SaaS investments,given our concerns over excessive valuations in the space. (1)
Q. How did the Portfolio’s use of derivative instruments and initialpublic offerings (IPOs), if any, impact performance?
A. The Portfolio did not use derivatives during the year. The Portfolioparticipated in six IPOs during the year, which added 4 basis points toabsolute return.(1)
(1) The Portfolio’s composition is subject to change. Holdings and weightings areas of December 31, 2019.
Ohio National Fund, Inc. ON Janus Henderson Enterprise Portfolio (Unaudited)
42 (continued)

Change in Value of $10,000 Investment
ON Janus Henderson Enterprise Portfolio (A)Russell Midcap Growth Index (B)
5,000
10,000
15,000
20,000
25,000
30,000
35,000
$40,000
6/1
012
/10 6
/1112
/11 6
/1212
/12 6
/1312
/13 6
/1412
/14 6
/1512
/15 6
/1612
/16 6
/1712
/17 6
/1812
/18 6
/19
12/3
1/09
12/1
9
$37,856 (B)
$33,110 (A)
Hypothetical illustration based on past performance. Future performance will vary.The Portfolio’s returns reflect reinvested dividends. The Portfolio’s holdings maydiffer significantly from the securities in the index. The index is unmanaged andtherefore does not reflect the cost of portfolio management and accounting.
The Russell Midcap Growth Index is a subset of the Russell Midcap Index, whichmeasures the performance of the 800 smallest companies in the Russell 1000Index. The Russell Midcap Growth Index measures the performance of thosestocks of the Russell Midcap Index with higher price-to-book ratios and higherrelative forecasted growth rates. The index presented includes the effects ofreinvested dividends.
Past performance is no guarantee of future results. Redemption of fund sharescould have tax implications unique to each shareholder.
Portfolio Composition as of December 31, 2019 (1)
% of Net AssetsCommon Stocks (4) 98.2Money Market Funds
Less Net Liabilities 1.8100.0
Top 10 Portfolio Holdings as of December 31, 2019 (1) (2) (3)
% of Net Assets1. Microchip Technology, Inc. 2.72. Constellation Software, Inc. 2.63. Aon PLC 2.54. Sensata Technologies Holding PLC 2.45. LPL Financial Holdings, Inc. 2.46. Crown Castle International Corp. 2.47. WEX, Inc. 2.38. Lamar Advertising Co. Class A 2.29. SS&C Technologies Holdings, Inc. 2.2
10. Global Payments, Inc. 2.1
(1) Composition of Portfolio subject to change.(2) Short-term investments have been excluded from the list of Top 10 Portfolio Holdings.(3) Top 10 Portfolio Holdings is presented at an individual security level. Total investment exposure by issuer may be higher.(4) Sectors (Common Stocks):
% of Net AssetsInformation Technology 34.4Industrials 20.1Health Care 15.3Financials 13.5Consumer Discretionary 7.9Real Estate 4.5Communication Services 1.4Materials 1.1
98.2
Ohio National Fund, Inc. ON Janus Henderson Enterprise Portfolio (Unaudited) (Continued)
43

Common Stocks – 98.2% Shares Value
COMMUNICATION SERVICES – 1.4%Liberty Media Corp. - Liberty Formula One
Class C (Entertainment) . . . . . . . . . . . . . . (a) 12,715 $ 584,445Omnicom Group, Inc. (Media) . . . . . . . . . . . . 11,449 927,598
1,512,043
CONSUMER DISCRETIONARY – 7.9%Aramark (Hotels, Restaurants & Leisure). . . . . 24,628 1,068,855CarMax, Inc. (Specialty Retail) . . . . . . . . . . . (a) 8,582 752,384Dunkin’ Brands Group, Inc. (Hotels,
Restaurants & Leisure) . . . . . . . . . . . . . . 19,214 1,451,426frontdoor, Inc. (Diversified Consumer Svs.) . . . (a) 12,172 577,196Gildan Activewear, Inc. (Textiles, Apparel &
Luxury Goods) . . . . . . . . . . . . . . . . . . . . 43,968 1,298,375Norwegian Cruise Line Holdings Ltd. (Hotels,
Restaurants & Leisure) . . . . . . . . . . . . . . (a) 17,628 1,029,652ServiceMaster Global Holdings, Inc.
(Diversified Consumer Svs.) . . . . . . . . . . . (a) 24,350 941,371Visteon Corp. (Auto Components) . . . . . . . . . (a) 6,575 569,329Wayfair, Inc. Class A (Internet & Direct
Marketing Retail) . . . . . . . . . . . . . . . . . . (a) 4,045 365,547Williams-Sonoma, Inc. (Specialty Retail) . . . . . 8,030 589,723
8,643,858
FINANCIALS – 13.5%Aon PLC (Insurance) . . . . . . . . . . . . . . . . . 12,936 2,694,439Cboe Global Markets, Inc. (Capital Markets) . . 6,435 772,200Intact Financial Corp. (Insurance) . . . . . . . . . 16,327 1,765,536LPL Financial Holdings, Inc. (Capital Markets). . 28,714 2,648,866MSCI, Inc. (Capital Markets) . . . . . . . . . . . . 2,571 663,781SVB Financial Group (Banks) . . . . . . . . . . . . (a) 2,567 644,420Synchrony Financial (Consumer Finance) . . . . 19,893 716,347TD Ameritrade Holding Corp. (Capital Markets) . 44,845 2,228,797W.R. Berkley Corp. (Insurance) . . . . . . . . . . . 25,863 1,787,133Willis Towers Watson PLC (Insurance) . . . . . . 4,623 933,569
14,855,088
HEALTH CARE – 15.3%Boston Scientific Corp. (Health Care Equip. &
Supplies) . . . . . . . . . . . . . . . . . . . . . . . (a) 51,786 2,341,763Catalent, Inc. (Pharmaceuticals) . . . . . . . . . . (a) 23,366 1,315,506Cooper Cos., Inc. / The (Health Care Equip. &
Supplies) . . . . . . . . . . . . . . . . . . . . . . . 6,262 2,011,918DENTSPLY SIRONA, Inc. (Health Care Equip. &
Supplies) . . . . . . . . . . . . . . . . . . . . . . . 13,002 735,783Elanco Animal Health, Inc. (Pharmaceuticals) . (a) 15,859 467,047ICU Medical, Inc. (Health Care Equip. &
Supplies) . . . . . . . . . . . . . . . . . . . . . . . (a) 3,420 639,950IQVIA Holdings, Inc. (Life Sciences Tools &
Svs.) . . . . . . . . . . . . . . . . . . . . . . . . . . (a) 10,090 1,559,006Neurocrine Biosciences, Inc. (Biotechnology) . (a) 8,382 900,981PerkinElmer, Inc. (Life Sciences Tools & Svs.) . . 23,037 2,236,893PRA Health Sciences, Inc. (Life Sciences Tools
& Svs.) . . . . . . . . . . . . . . . . . . . . . . . . (a) 7,364 818,508Sage Therapeutics, Inc. (Biotechnology) . . . . . (a) 2,293 165,532Sarepta Therapeutics, Inc. (Biotechnology) . . . (a) 3,793 489,449Teleflex, Inc. (Health Care Equip. & Supplies) . . 2,867 1,079,253Varian Medical Systems, Inc. (Health Care
Equip. & Supplies) . . . . . . . . . . . . . . . . . (a) 5,171 734,334Waters Corp. (Life Sciences Tools & Svs.) . . . . (a) 5,895 1,377,367
16,873,290
INDUSTRIALS – 20.1%Carlisle Cos., Inc. (Industrial Conglomerates) . . 7,120 1,152,301Cimpress PLC (Commercial Svs. & Supplies) . . (a) 11,534 1,450,631CoStar Group, Inc. (Professional Svs.) . . . . . . (a) 1,888 1,129,590Edenred (Commercial Svs. & Supplies) . . . . . . (b) 16,730 867,023Ferguson PLC (Trading Companies &
Distributors) . . . . . . . . . . . . . . . . . . . . . (b) 8,805 801,315HEICO Corp. Class A (Aerospace & Defense) . . 2,550 228,302IHS Markit Ltd. (Professional Svs.). . . . . . . . . (a) 17,392 1,310,487Ingersoll-Rand PLC (Machinery) . . . . . . . . . . 4,881 648,783
Common Stocks (Continued) Shares Value
INDUSTRIALS (continued)L3Harris Technologies, Inc. (Aerospace &
Defense) . . . . . . . . . . . . . . . . . . . . . . . 7,591 $ 1,502,031Middleby Corp. / The (Machinery) . . . . . . . . . (a) 5,971 653,944Old Dominion Freight Line, Inc. (Road & Rail) . . 2,783 528,158Rexnord Corp. (Machinery) . . . . . . . . . . . . . (a) 45,954 1,499,019Ritchie Bros Auctioneers, Inc. (Commercial
Svs. & Supplies) . . . . . . . . . . . . . . . . . . 31,968 1,373,026Ryanair Holdings PLC – ADR (Airlines) . . . . . . (a) 10,853 950,831Sensata Technologies Holding PLC
(Electrical Equip.). . . . . . . . . . . . . . . . . . (a) 49,986 2,692,746Southwest Airlines Co. (Airlines) . . . . . . . . . . 10,220 551,676Teledyne Technologies, Inc. (Aerospace &
Defense) . . . . . . . . . . . . . . . . . . . . . . . (a) 4,795 1,661,659Verisk Analytics, Inc. (Professional Svs.) . . . . . 11,864 1,771,770Westinghouse Air Brake Technologies Corp.
(Machinery) . . . . . . . . . . . . . . . . . . . . . 17,139 1,333,41422,106,706
INFORMATION TECHNOLOGY – 34.4%Amdocs Ltd. (IT Svs.) . . . . . . . . . . . . . . . . . 28,496 2,057,126Atlassian Corp. PLC Class A (Software). . . . . . (a) 8,037 967,173Belden, Inc. (Electronic Equip., Instr. & Comp.) . 12,162 668,910Broadridge Financial Solutions, Inc. (IT Svs.) . . 13,876 1,714,241Constellation Software, Inc. (Software). . . . . . 2,976 2,890,310Dolby Laboratories, Inc. Class A (Electronic
Equip., Instr. & Comp.) . . . . . . . . . . . . . . . 15,940 1,096,672Euronet Worldwide, Inc. (IT Svs.) . . . . . . . . . (a) 3,919 617,478Fidelity National Information Services, Inc.
(IT Svs.) . . . . . . . . . . . . . . . . . . . . . . . . 12,579 1,749,613Flex Ltd. (Electronic Equip., Instr. & Comp.) . . . (a) 85,507 1,079,098Gartner, Inc. (IT Svs.) . . . . . . . . . . . . . . . . . (a) 1,032 159,031Global Payments, Inc. (IT Svs.) . . . . . . . . . . . 12,917 2,358,128GoDaddy, Inc. Class A (IT Svs.) . . . . . . . . . . . (a) 27,293 1,853,741Intuit, Inc. (Software) . . . . . . . . . . . . . . . . . 2,252 589,866KLA-Tencor Corp. (Semiconductors & Equip.) . . 10,481 1,867,400Lam Research Corp. (Semiconductors &
Equip.) . . . . . . . . . . . . . . . . . . . . . . . . 6,121 1,789,780Microchip Technology, Inc. (Semiconductors &
Equip.) . . . . . . . . . . . . . . . . . . . . . . . . 28,621 2,997,191National Instruments Corp. (Electronic Equip.,
Instr. & Comp.) . . . . . . . . . . . . . . . . . . . 36,780 1,557,265Nice Ltd. – ADR (Software) . . . . . . . . . . . . . (a) 13,782 2,138,277ON Semiconductor Corp. (Semiconductors &
Equip.) . . . . . . . . . . . . . . . . . . . . . . . . (a) 82,138 2,002,525SS&C Technologies Holdings, Inc. (Software). . 38,515 2,364,821TE Connectivity Ltd. (Electronic Equip., Instr. &
Comp.) . . . . . . . . . . . . . . . . . . . . . . . . 22,932 2,197,803WEX, Inc. (IT Svs.) . . . . . . . . . . . . . . . . . . . (a) 11,874 2,487,128Xilinx, Inc. (Semiconductors & Equip.) . . . . . . 5,890 575,865
37,779,442
MATERIALS – 1.1%Sealed Air Corp. (Containers & Packaging) . . . 31,669 1,261,376
REAL ESTATE – 4.5%Crown Castle International Corp. (Equity REIT) . 18,472 2,625,795Lamar Advertising Co. Class A (Equity REIT) . . . 26,660 2,379,671
5,005,466Total Common Stocks (Cost $89,984,991) . . . . . $108,037,269
Money Market Funds – 1.9% Shares Value
State Street Institutional Liquid Reserves FundInstitutional Class, 1.734% . . . . . . . . . . . . . (c) 2,072,168 $ 2,072,376
Total Money Market Funds (Cost $2,072,389) . . . . . . $ 2,072,376Total Investments – 100.1% (Cost $92,057,380) . . . . . . . . (d) $110,109,645Liabilities in Excess of Other Assets – (0.1)% . . . . . . . (136,576)Net Assets – 100.0% $109,973,069
Ohio National Fund, Inc. ON Janus Henderson Enterprise Portfolio
Schedule of Investments December 31, 2019
44 (continued)

Percentages are stated as a percent of net assets.Abbreviations:
ADR: American Depositary ReceiptsFootnotes:
(a) Non-income producing security.(b) Security traded on a foreign exchange has been valued at an estimate of fair value that is different than the local market close price. These fair value estimates
are determined by an independent fair valuation service that has been approved by the Board. These securities represent $1,668,338 or 1.5% of the Portfolio’s netassets.
(c) Rate represents the seven-day yield at December 31, 2019.(d) Represents cost for financial reporting purposes, which may differ from cost basis for federal income tax purposes. See also Note 8 of the Notes to Financial
Statements.
The accompanying notes are an integral part of these financial statements.
Ohio National Fund, Inc. ON Janus Henderson Enterprise Portfolio (Continued)
Schedule of Investments December 31, 2019
45

Objective/Strategy
The ON S&P 500® Index Portfolio seeks total return approximating that ofthe Standard & Poor’s 500® Index (S&P 500® Index), at a risk levelconsistent with that of the S&P 500® Index by investing, under normalcircumstances, more than 80% of its net assets in the securities includedin the S&P 500® Index.
Performance as of December 31, 2019
Average Annual returnsOne year 30.97%Five years 11.23%Ten years 13.05%
Past performance does not guarantee future results. The performance dataquoted represents past performance and current returns may be lower or higher.Total return figures include change in share price and reinvestment of dividendsand capital gains. The investment return and principal value will fluctuate so thatan investor’s shares, when redeemed, may be worth more or less than the originalcost. To obtain performance information up to the most recent month end, calltoll-free 1-877-781-6392.
The Portfolio is not open to direct retail investment. Beneficial interest in shares isobtained solely by purchase of variable life insurance policies and variable annuitycontracts. Actual performance results for variable annuity and variable universallife contracts will be lower due to contract charges. Consult your contract forapplicable charges.
Total expense ratio is 0.38% per the Fund’s prospectus dated November 22, 2019.Additional information pertaining to the Portfolio’s expense ratio as ofDecember 31, 2019 can be found in the Portfolio’s Financial Highlights.
Comments from Sub-Adviser
Q. How did the Portfolio perform in comparison to its benchmark duringthe reporting period?
A. For the year ended December 31, 2019, the Portfolio returned 30.97%versus 31.49% for its benchmark, the S&P 500® Index.
Q. Were there specific market conditions, investment strategies, ortechniques that materially affected the Portfolio’s benchmark-relativeperformance during the reporting period?
A. The Portfolio intends to track the underlying return of the S&P 500®
Index. There were no material market events or changes in strategyduring the year that materially impacted the Portfolio’s relative return.Sources of return variance were related to the cumulative impact ofinvesting the day-to-day cash flows in the Portfolio.
Q. How did sector allocation and security selection each impact thePortfolio’s performance relative to its benchmark? For sector allocation,were there any factors that impacted the benchmark’s performancemore significantly than the Portfolio’s performance? For securityselection, was there anything specific regarding the Portfolio’s strategythat caused deviation from the benchmark?
A. There was no impact from either sector or stock selection thatcaused any significant performance variance between the Portfolio andits benchmark. (1)
All eleven sectors in the benchmark produced positive returns in 2019.Information Technology led the way, returning 49.7% for the year.Financials and Communication Services returned 31.2% and 32.1%respectively. The Energy sector contributed the least to the overallbenchmark return, but still rose 10.6% for the year. (1)
Q. Which holdings contributed the most to, and detracted the most from,the Portfolio’s benchmark-relative performance?
A. Because the Portfolio weights its holdings to be similar to thoseutilized by the benchmark index, there were no holdings that significantlycontributed to or detracted from the Portfolio’s benchmark-relativeperformance. (1)
Q. How did the Portfolio’s use of derivative instruments and initialpublic offerings (IPOs), if any, impact performance?
A. The Portfolio uses S&P 500® Index futures contracts primarily toequitize open dividend receivables, as well as to manage day-to-daycash flows, to ensure the Portfolio is fully invested. The futures did notmeaningfully impact performance, however, due to their indexcharacteristics and size in relation to the Portfolio’s net assets. (1)
Q. Were there any significant changes to the Portfolio’s managementteam, investment strategy, or security selection process during thereporting period?
A. Over the course of 2019, the Portfolio’s management teamexperienced an unusually high amount of personnel changes for variedreasons including retirement, relocation due to family reasons, andpursuit of other opportunities. Departures have been replaced, in allcases, with portfolio managers who exceed the previous team member’sindustry experience, and the changes have resulted in no increase ordecrease in total team members dedicated to the Portfolio. Geode CapitalManagement LLC’s (�Geode�) investment management philosophyutilizes a team-based approach that follows a disciplined and repeatableinvestment process, seeking to limit dependency on any singleinvestment professional, and, in the case of a team member’s departure,is less disruptive to the execution of the investment process.
Additionally, in December, Geode added a new position to the team withthe hire of Diane Hsiung as CIO – Index and ETF Strategies. In this newlycreated role, Ms. Hsiung, is responsible for the overall development andimplementation of the firm’s Index strategies, and providing oversightand management of team members, while driving strategic initiatives toscale operational processes and manage portfolio risks. Geode believesthe management team is well-positioned going forward.
There were no material changes to the investment strategy or stockselection process during the period.
(1) The Portfolio’s composition is subject to change. Holdings and weightings areas of December 31, 2019.
Ohio National Fund, Inc. ON S&P 500® Index Portfolio (Unaudited)
46 (continued)

Change in Value of $10,000 Investment
ON S&P 500® Index Portfolio (A)S&P 500® Index (B)
5,000
10,000
15,000
20,000
25,000
30,000
35,000
$40,000
6/1
012
/10 6
/1112
/11 6
/1212
/12 6
/1312
/13 6
/1412
/14 6
/1512
/15 6
/1612
/16 6
/1712
/17 6
/1812
/18 6
/19
12/3
1/09
12/1
9
$35,666 (B)$34,104 (A)
Hypothetical illustration based on past performance. Future performance will vary.The Portfolio’s returns reflect reinvested dividends. The Portfolio’s holdings maydiffer significantly from the securities in the index. The index is unmanaged andtherefore does not reflect the cost of portfolio management and accounting.Investors cannot invest directly in an index, although they can invest in itsunderlying securities or funds.
The S&P 500®00 Index is a capitalization-weighted index designed to measureperformance of the broad domestic economy through changes in the aggregatemarket value of 500 stocks representing all major industries. The index presentedincludes the effects of reinvested dividends.
Past performance is no guarantee of future results. Redemption of fund sharescould have tax implications unique to each shareholder.
The S&P 500®00 Index is a product of S&P Dow Jones Indices LLC or its affiliates(“SPDJI”), and has been licensed for use by Ohio National Investments, Inc.(“ONI”). Standard & Poor’s® and S&P®PP are registered trademarks of Standard &Poor’s Financial Services LLC (“S&P”); Dow Jones® is a registered trademark ofDow Jones Trademark Holdings LLC (“Dow Jones”); and these trademarks havebeen licensed for use by SPDJI and sublicensed for certain purposes by ONI. TheS&P 500®00 Index Portfolio of Ohio National Fund, Inc. is not sponsored, endorsed,sold or promoted by SPDJI, Dow Jones, S&P, their respective affiliates, and noneof such parties make any representation regarding the advisability of investing insuch product(s) nor do they have any liability for any errors, omissions, orinterruptions of the S&P 500®00 Index.
Portfolio Composition as of December 31, 2019 (1)
% of Net AssetsCommon Stocks (4) 99.9U.S. Treasury Obligations 0.0Money Market Funds
Less Net Liabilities 0.1100.0
Top 10 Portfolio Holdings as of December 31, 2019 (1) (2) (3)
% of Net Assets1. Apple, Inc. 4.62. Microsoft Corp. 4.53. Amazon.com, Inc. 2.94. Facebook, Inc. Class A 1.85. Berkshire Hathaway, Inc. Class B 1.76. JPMorgan Chase & Co. 1.67. Alphabet, Inc. Class A 1.58. Alphabet, Inc. Class C 1.59. Johnson & Johnson 1.4
10. Visa, Inc. 1.2
(1) Composition of Portfolio subject to change.(2) Short-term investments have been excluded from the list of Top 10 Portfolio Holdings.(3) Top 10 Portfolio Holdings is presented at an individual security level. Total investment exposure by issuer may be higher.(4) Sectors (Common Stocks):
% of Net AssetsInformation Technology 23.2Health Care 14.2Financials 12.9Communication Services 10.4Consumer Discretionary 9.8Industrials 9.0Consumer Staples 7.2Energy 4.3Utilities 3.3Real Estate 2.9Materials 2.7
99.9
Ohio National Fund, Inc. ON S&P 500® Index Portfolio (Unaudited) (Continued)
47

Common Stocks – 99.9% Shares Value
COMMUNICATION SERVICES – 10.4%Activision Blizzard, Inc. (Entertainment) . . . . . 34,503 $ 2,050,168Alphabet, Inc. Class A (Interactive Media &
Svs.) . . . . . . . . . . . . . . . . . . . . . . . . . . (a) 13,433 17,992,026Alphabet, Inc. Class C (Interactive Media &
Svs.) . . . . . . . . . . . . . . . . . . . . . . . . . . (a) 13,445 17,976,234AT&T, Inc. (Diversified Telecom. Svs.). . . . . . . 328,054 12,820,350CenturyLink, Inc. (Diversified Telecom. Svs.) . . 44,011 581,385Charter Communications, Inc. Class A (Media) . (a) 7,042 3,415,933Comcast Corp. Class A (Media) . . . . . . . . . . 203,877 9,168,349Discovery, Inc. Class A (Media) . . . . . . . . . . (a) 7,068 231,406Discovery, Inc. Class C (Media) . . . . . . . . . . (a) 15,105 460,551DISH Network Corp. Class A (Media) . . . . . . . (a) 11,497 407,799Electronic Arts, Inc. (Entertainment) . . . . . . . (a) 13,113 1,409,779Facebook, Inc. Class A (Interactive Media &
Svs.) . . . . . . . . . . . . . . . . . . . . . . . . . . (a) 108,069 22,181,162Fox Corp. Class A (Media) . . . . . . . . . . . . . . 16,212 600,979Fox Corp. Class B (Media) . . . . . . . . . . . . . . 6,997 254,691Interpublic Group of Cos., Inc. / The (Media) . . 17,435 402,749Live Nation Entertainment, Inc.
(Entertainment) . . . . . . . . . . . . . . . . . . . (a) 6,333 452,620Netflix, Inc. (Entertainment) . . . . . . . . . . . . . (a) 19,682 6,368,505News Corp. Class A (Media) . . . . . . . . . . . . 17,381 245,767News Corp. Class B (Media) . . . . . . . . . . . . 5,430 78,789Omnicom Group, Inc. (Media). . . . . . . . . . . . 9,781 792,457Take-Two Interactive Software, Inc.
(Entertainment) . . . . . . . . . . . . . . . . . . . (a) 5,068 620,475T-Mobile U.S., Inc. (Wireless Telecom. Svs.). . . (a) 14,227 1,115,681Twitter, Inc. (Interactive Media & Svs.) . . . . . . (a) 34,871 1,117,616Verizon Communications, Inc. (Diversified
Telecom. Svs.). . . . . . . . . . . . . . . . . . . . 185,722 11,403,331ViacomCBS, Inc. Class B (Media) . . . . . . . . . 24,295 1,019,661Walt Disney Co. / The (Entertainment) . . . . . . 80,942 11,706,641
124,875,104
CONSUMER DISCRETIONARY – 9.8%Advance Auto Parts, Inc. (Specialty Retail) . . . 3,112 498,418Amazon.com, Inc. (Internet & Direct Marketing
Retail) . . . . . . . . . . . . . . . . . . . . . . . . . (a) 18,703 34,560,152Aptiv PLC (Auto Components). . . . . . . . . . . . 11,486 1,090,825AutoZone, Inc. (Specialty Retail) . . . . . . . . . . (a) 1,070 1,274,702Best Buy Co., Inc. (Specialty Retail) . . . . . . . . 10,227 897,931Booking Holdings, Inc. (Internet & Direct
Marketing Retail) . . . . . . . . . . . . . . . . . . (a) 1,880 3,861,012BorgWarner, Inc. (Auto Components) . . . . . . . 9,268 402,046Capri Holdings Ltd. (Textiles, Apparel & Luxury
Goods) . . . . . . . . . . . . . . . . . . . . . . . . (a) 6,802 259,496CarMax, Inc. (Specialty Retail) . . . . . . . . . . . (a) 7,376 646,654Carnival Corp. (Hotels, Restaurants & Leisure) . 17,949 912,348Chipotle Mexican Grill, Inc. (Hotels,
Restaurants & Leisure) . . . . . . . . . . . . . . (a) 1,149 961,839D.R. Horton, Inc. (Household Durables) . . . . . . 15,096 796,314Darden Restaurants, Inc. (Hotels, Restaurants
& Leisure) . . . . . . . . . . . . . . . . . . . . . . 5,501 599,664Dollar General Corp. (Multiline Retail) . . . . . . 11,434 1,783,475Dollar Tree, Inc. (Multiline Retail) . . . . . . . . . (a) 10,630 999,752eBay, Inc. (Internet & Direct Marketing Retail) . 34,352 1,240,451Expedia Group, Inc. (Internet & Direct
Marketing Retail) . . . . . . . . . . . . . . . . . . 6,262 677,173Ford Motor Co. (Automobiles). . . . . . . . . . . . 175,092 1,628,356Gap, Inc. / The (Specialty Retail) . . . . . . . . . . 9,616 170,011Garmin Ltd. (Household Durables) . . . . . . . . . 6,480 632,189General Motors Co. (Automobiles). . . . . . . . . 56,443 2,065,814Genuine Parts Co. (Distributors) . . . . . . . . . . 6,506 691,132H&R Block, Inc. (Diversified Consumer Svs.) . . 8,772 205,967Hanesbrands, Inc. (Textiles, Apparel & Luxury
Goods) . . . . . . . . . . . . . . . . . . . . . . . . 16,226 240,956Harley-Davidson, Inc. (Automobiles) . . . . . . . 6,897 256,499Hasbro, Inc. (Leisure Products) . . . . . . . . . . 5,717 603,772Hilton Worldwide Holdings, Inc. (Hotels,
Restaurants & Leisure) . . . . . . . . . . . . . . 12,674 1,405,673Home Depot, Inc. / The (Specialty Retail). . . . . 48,988 10,697,999
Common Stocks (Continued) Shares Value
CONSUMER DISCRETIONARY (continued)Kohl’s Corp. (Multiline Retail) . . . . . . . . . . . . 7,036 $ 358,484L Brands, Inc. (Specialty Retail) . . . . . . . . . . 10,419 188,792Las Vegas Sands Corp. (Hotels, Restaurants &
Leisure). . . . . . . . . . . . . . . . . . . . . . . . 15,187 1,048,511Leggett & Platt, Inc. (Household Durables) . . . 5,906 300,202Lennar Corp. Class A (Household Durables) . . . 12,574 701,503LKQ Corp. (Distributors) . . . . . . . . . . . . . . . (a) 13,830 493,731Lowe’s Cos., Inc. (Specialty Retail) . . . . . . . . 34,419 4,122,019Macy’s, Inc. (Multiline Retail) . . . . . . . . . . . . 13,855 235,535Marriott International, Inc. Class A (Hotels,
Restaurants & Leisure) . . . . . . . . . . . . . . 12,188 1,845,629McDonald’s Corp. (Hotels, Restaurants &
Leisure). . . . . . . . . . . . . . . . . . . . . . . . 33,819 6,682,973MGM Resorts International (Hotels,
Restaurants & Leisure) . . . . . . . . . . . . . . 23,101 768,570Mohawk Industries, Inc. (Household Durables). (a) 2,651 361,543Newell Brands, Inc. (Household Durables) . . . 17,098 328,624NIKE, Inc. Class B (Textiles, Apparel & Luxury
Goods) . . . . . . . . . . . . . . . . . . . . . . . . 55,931 5,666,370Nordstrom, Inc. (Multiline Retail). . . . . . . . . . 4,786 195,891Norwegian Cruise Line Holdings Ltd. (Hotels,
Restaurants & Leisure) . . . . . . . . . . . . . . (a) 9,564 558,633NVR, Inc. (Household Durables) . . . . . . . . . . (a) 156 594,112O’Reilly Automotive, Inc. (Specialty Retail). . . . (a) 3,398 1,489,208PulteGroup, Inc. (Household Durables) . . . . . . 11,447 444,144PVH Corp. (Textiles, Apparel & Luxury Goods) . 3,327 349,834Ralph Lauren Corp. (Textiles, Apparel & Luxury
Goods) . . . . . . . . . . . . . . . . . . . . . . . . 2,234 261,869Ross Stores, Inc. (Specialty Retail) . . . . . . . . 16,242 1,890,894Royal Caribbean Cruises Ltd. (Hotels,
Restaurants & Leisure) . . . . . . . . . . . . . . 7,722 1,030,964Starbucks Corp. (Hotels, Restaurants &
Leisure). . . . . . . . . . . . . . . . . . . . . . . . 53,036 4,662,925Tapestry, Inc. (Textiles, Apparel & Luxury
Goods) . . . . . . . . . . . . . . . . . . . . . . . . 12,396 334,320Target Corp. (Multiline Retail) . . . . . . . . . . . . 22,757 2,917,675Tiffany & Co. (Specialty Retail) . . . . . . . . . . . 4,833 645,930TJX Cos., Inc. / The (Specialty Retail) . . . . . . . 54,452 3,324,839Tractor Supply Co. (Specialty Retail) . . . . . . . 5,336 498,596Ulta Beauty, Inc. (Specialty Retail). . . . . . . . . (a) 2,567 649,810Under Armour, Inc. Class A (Textiles, Apparel &
Luxury Goods). . . . . . . . . . . . . . . . . . . . (a) 8,278 178,805Under Armour, Inc. Class C (Textiles, Apparel &
Luxury Goods). . . . . . . . . . . . . . . . . . . . (a) 9,156 175,612V.F. Corp. (Textiles, Apparel & Luxury Goods) . . 14,701 1,465,102Whirlpool Corp. (Household Durables) . . . . . . 2,853 420,903Wynn Resorts Ltd. (Hotels, Restaurants &
Leisure). . . . . . . . . . . . . . . . . . . . . . . . 4,345 603,390Yum! Brands, Inc. (Hotels, Restaurants &
Leisure). . . . . . . . . . . . . . . . . . . . . . . . 13,586 1,368,518117,225,080
CONSUMER STAPLES – 7.2%Altria Group, Inc. (Tobacco) . . . . . . . . . . . . . 83,896 4,187,249Archer-Daniels-Midland Co. (Food Products) . . 25,006 1,159,028Brown-Forman Corp. Class B (Beverages). . . . 8,166 552,022Campbell Soup Co. (Food Products) . . . . . . . . 7,566 373,912Church & Dwight Co., Inc.
(Household Products) . . . . . . . . . . . . . . . 11,010 774,443Clorox Co. / The (Household Products) . . . . . . 5,637 865,505Coca-Cola Co. / The (Beverages). . . . . . . . . . 173,172 9,585,070Colgate-Palmolive Co. (Household Products) . . 38,495 2,649,996Conagra Brands, Inc. (Food Products) . . . . . . 21,810 746,774Constellation Brands, Inc. Class A (Beverages). 7,524 1,427,679Costco Wholesale Corp. (Food & Staples
Retailing) . . . . . . . . . . . . . . . . . . . . . . . 19,840 5,831,373Coty, Inc. Class A (Personal Products) . . . . . . 13,189 148,376Estee Lauder Cos., Inc. / The Class A
(Personal Products) . . . . . . . . . . . . . . . . 9,996 2,064,574General Mills, Inc. (Food Products) . . . . . . . . 27,143 1,453,779Hershey Co. / The (Food Products). . . . . . . . . 6,677 981,385
Ohio National Fund, Inc. ON S&P 500® Index Portfolio
Schedule of Investments December 31, 2019
48 (continued)

Common Stocks (Continued) Shares Value
CONSUMER STAPLES (continued)Hormel Foods Corp. (Food Products) . . . . . . . 12,535 $ 565,454J.M. Smucker Co. / The (Food Products) . . . . . 5,104 531,480Kellogg Co. (Food Products). . . . . . . . . . . . . 11,153 771,342Kimberly-Clark Corp. (Household Products) . . . 15,388 2,116,619Kraft Heinz Co. / The (Food Products) . . . . . . . 27,985 899,158Kroger Co. / The (Food & Staples Retailing) . . . 36,028 1,044,452Lamb Weston Holdings, Inc. (Food Products) . . 6,576 565,733McCormick & Co., Inc. (Food Products) . . . . . 5,550 942,002Molson Coors Brewing Co. Class B
(Beverages) . . . . . . . . . . . . . . . . . . . . . 8,394 452,437Mondelez International, Inc. Class A
(Food Products). . . . . . . . . . . . . . . . . . . 64,657 3,561,308Monster Beverage Corp. (Beverages) . . . . . . (a) 17,149 1,089,819PepsiCo, Inc. (Beverages) . . . . . . . . . . . . . . 62,622 8,558,549Philip Morris International, Inc. (Tobacco) . . . . 69,871 5,945,323Procter & Gamble Co. / The
(Household Products) . . . . . . . . . . . . . . . 111,993 13,987,926Sysco Corp. (Food & Staples Retailing) . . . . . . 22,884 1,957,497Tyson Foods, Inc. Class A (Food Products) . . . . 13,258 1,207,008Walgreens Boots Alliance, Inc. (Food &
Staples Retailing). . . . . . . . . . . . . . . . . . 33,676 1,985,537Walmart, Inc. (Food & Staples Retailing) . . . . . 63,704 7,570,583
86,553,392
ENERGY – 4.3%Apache Corp. (Oil, Gas & Consumable Fuels) . . 16,860 431,447Baker Hughes, a GE Co. (Energy Equip. & Svs.) . 29,113 746,166Cabot Oil & Gas Corp. (Oil, Gas & Consumable
Fuels) . . . . . . . . . . . . . . . . . . . . . . . . . 18,339 319,282Chevron Corp. (Oil, Gas & Consumable Fuels) . . 84,917 10,233,348Cimarex Energy Co. (Oil, Gas & Consumable
Fuels) . . . . . . . . . . . . . . . . . . . . . . . . . 4,556 239,144Concho Resources, Inc. (Oil, Gas &
Consumable Fuels) . . . . . . . . . . . . . . . . . 9,015 789,444ConocoPhillips (Oil, Gas & Consumable Fuels) . 49,284 3,204,939Devon Energy Corp. (Oil, Gas & Consumable
Fuels) . . . . . . . . . . . . . . . . . . . . . . . . . 17,409 452,112Diamondback Energy, Inc. (Oil, Gas &
Consumable Fuels) . . . . . . . . . . . . . . . . . 7,241 672,399EOG Resources, Inc. (Oil, Gas & Consumable
Fuels) . . . . . . . . . . . . . . . . . . . . . . . . . 26,134 2,188,984Exxon Mobil Corp. (Oil, Gas & Consumable
Fuels) . . . . . . . . . . . . . . . . . . . . . . . . . 190,015 13,259,247Halliburton Co. (Energy Equip. & Svs.) . . . . . . 39,448 965,293Helmerich & Payne, Inc. (Energy Equip. &
Svs.) . . . . . . . . . . . . . . . . . . . . . . . . . . 4,910 223,061Hess Corp. (Oil, Gas & Consumable Fuels) . . . . 11,611 775,731HollyFrontier Corp. (Oil, Gas & Consumable
Fuels) . . . . . . . . . . . . . . . . . . . . . . . . . 6,675 338,489Kinder Morgan, Inc. (Oil, Gas & Consumable
Fuels) . . . . . . . . . . . . . . . . . . . . . . . . . 87,505 1,852,481Marathon Oil Corp. (Oil, Gas & Consumable
Fuels) . . . . . . . . . . . . . . . . . . . . . . . . . 35,925 487,862Marathon Petroleum Corp. (Oil, Gas &
Consumable Fuels) . . . . . . . . . . . . . . . . . 29,165 1,757,191National Oilwell Varco, Inc. (Energy Equip. &
Svs.) . . . . . . . . . . . . . . . . . . . . . . . . . . 17,306 433,515Noble Energy, Inc. (Oil, Gas & Consumable
Fuels) . . . . . . . . . . . . . . . . . . . . . . . . . 21,449 532,793Occidental Petroleum Corp. (Oil, Gas &
Consumable Fuels) . . . . . . . . . . . . . . . . . 40,129 1,653,716ONEOK, Inc. (Oil, Gas & Consumable Fuels) . . . 18,558 1,404,284Phillips 66 (Oil, Gas & Consumable Fuels) . . . . 19,957 2,223,409Pioneer Natural Resources Co. (Oil, Gas &
Consumable Fuels) . . . . . . . . . . . . . . . . . 7,425 1,123,922Schlumberger Ltd. (Energy Equip. & Svs.) . . . . 62,189 2,499,998TechnipFMC PLC (Energy Equip. & Svs.) . . . . . 18,820 403,501
Common Stocks (Continued) Shares Value
ENERGY (continued)Valero Energy Corp. (Oil, Gas & Consumable
Fuels) . . . . . . . . . . . . . . . . . . . . . . . . . 18,445 $ 1,727,374Williams Cos., Inc. / The (Oil, Gas &
Consumable Fuels) . . . . . . . . . . . . . . . . . 54,457 1,291,72052,230,852
FINANCIALS – 12.9%Aflac, Inc. (Insurance) . . . . . . . . . . . . . . . . 32,967 1,743,954Allstate Corp. / The (Insurance) . . . . . . . . . . 14,551 1,636,260American Express Co. (Consumer Finance) . . . 30,131 3,751,008American International Group, Inc.
(Insurance) . . . . . . . . . . . . . . . . . . . . . 39,080 2,005,976Ameriprise Financial, Inc. (Capital Markets) . . . 5,691 948,007Aon PLC (Insurance) . . . . . . . . . . . . . . . . . 10,514 2,189,961Arthur J. Gallagher & Co. (Insurance). . . . . . . 8,401 800,027Assurant, Inc. (Insurance) . . . . . . . . . . . . . . 2,709 355,096Bank of America Corp. (Banks) . . . . . . . . . . . 363,557 12,804,478Bank of New York Mellon Corp. / The
(Capital Markets) . . . . . . . . . . . . . . . . . . 37,692 1,897,038Berkshire Hathaway, Inc. Class B (Diversified
Financial Svs.) . . . . . . . . . . . . . . . . . . . (a) 87,839 19,895,533BlackRock, Inc. (Capital Markets) . . . . . . . . . 5,296 2,662,299Capital One Financial Corp.
(Consumer Finance) . . . . . . . . . . . . . . . . 20,923 2,153,186Cboe Global Markets, Inc. (Capital Markets) . . 4,998 599,760Charles Schwab Corp. / The (Capital Markets) . 51,345 2,441,968Chubb Ltd. (Insurance) . . . . . . . . . . . . . . . . 20,349 3,167,525Cincinnati Financial Corp. (Insurance) . . . . . . 6,808 715,861Citigroup, Inc. (Banks) . . . . . . . . . . . . . . . . 98,047 7,832,975Citizens Financial Group, Inc. (Banks). . . . . . . 19,550 793,926CME Group, Inc. (Capital Markets). . . . . . . . . 16,093 3,230,187Comerica, Inc. (Banks) . . . . . . . . . . . . . . . . 6,485 465,299Discover Financial Services
(Consumer Finance) . . . . . . . . . . . . . . . . 14,082 1,194,435E*TRADE Financial Corp. (Capital Markets) . . . 10,128 459,507Everest Re Group Ltd. (Insurance) . . . . . . . . . 1,825 505,233Fifth Third Bancorp (Banks) . . . . . . . . . . . . . 31,892 980,360First Republic Bank (Banks) . . . . . . . . . . . . . 7,571 889,214Franklin Resources, Inc. (Capital Markets). . . . 12,456 323,607Globe Life, Inc. (Insurance) . . . . . . . . . . . . . 4,458 469,205Goldman Sachs Group, Inc. / The
(Capital Markets) . . . . . . . . . . . . . . . . . . 14,314 3,291,218Hartford Financial Services Group, Inc. / The
(Insurance) . . . . . . . . . . . . . . . . . . . . . 16,202 984,596Huntington Bancshares, Inc. (Banks) . . . . . . . 46,260 697,601Intercontinental Exchange, Inc.
(Capital Markets) . . . . . . . . . . . . . . . . . . 25,003 2,314,028Invesco Ltd. (Capital Markets) . . . . . . . . . . . 16,754 301,237JPMorgan Chase & Co. (Banks) . . . . . . . . . . 140,848 19,634,211KeyCorp (Banks) . . . . . . . . . . . . . . . . . . . . 44,270 896,025Lincoln National Corp. (Insurance) . . . . . . . . 8,883 524,186Loews Corp. (Insurance) . . . . . . . . . . . . . . . 11,507 604,002M&T Bank Corp. (Banks) . . . . . . . . . . . . . . 5,928 1,006,278MarketAxess Holdings, Inc. (Capital Markets) . 1,706 646,762Marsh & McLennan Cos., Inc. (Insurance). . . . 22,650 2,523,436MetLife, Inc. (Insurance). . . . . . . . . . . . . . . 35,119 1,790,015Moody’s Corp. (Capital Markets) . . . . . . . . . . 7,295 1,731,906Morgan Stanley (Capital Markets) . . . . . . . . . 55,255 2,824,636MSCI, Inc. (Capital Markets) . . . . . . . . . . . . 3,798 980,568Nasdaq, Inc. (Capital Markets) . . . . . . . . . . . 5,156 552,208Northern Trust Corp. (Capital Markets) . . . . . . 9,518 1,011,192People’s United Financial, Inc. (Banks) . . . . . . 19,960 337,324PNC Financial Services Group, Inc. / The
(Banks) . . . . . . . . . . . . . . . . . . . . . . . . 19,677 3,141,040Principal Financial Group, Inc. (Insurance) . . . 11,627 639,485Progressive Corp. / The (Insurance). . . . . . . . 26,256 1,900,672Prudential Financial, Inc. (Insurance) . . . . . . . 18,061 1,693,038Raymond James Financial, Inc.
(Capital Markets) . . . . . . . . . . . . . . . . . . 5,545 496,056Regions Financial Corp. (Banks) . . . . . . . . . . 43,378 744,366S&P Global, Inc. (Capital Markets). . . . . . . . . 10,975 2,996,724
Ohio National Fund, Inc. ON S&P 500® Index Portfolio (Continued)
Schedule of Investments December 31, 2019
49 (continued)

Common Stocks (Continued) Shares Value
FINANCIALS (continued)State Street Corp. (Capital Markets). . . . . . . . 16,332 $ 1,291,861SVB Financial Group (Banks) . . . . . . . . . . . . (a) 2,309 579,651Synchrony Financial (Consumer Finance) . . . . 26,704 961,611T. Rowe Price Group, Inc. (Capital Markets) . . . 10,479 1,276,761Travelers Cos., Inc. / The (Insurance) . . . . . . . 11,591 1,587,387Truist Financial Corp. (Banks) . . . . . . . . . . . . 60,229 3,392,097U.S. Bancorp (Banks). . . . . . . . . . . . . . . . . 63,819 3,783,829Unum Group (Insurance). . . . . . . . . . . . . . . 9,201 268,301W.R. Berkley Corp. (Insurance) . . . . . . . . . . . 6,486 448,183Wells Fargo & Co. (Banks) . . . . . . . . . . . . . . 172,836 9,298,577Willis Towers Watson PLC (Insurance) . . . . . . 5,783 1,167,819Zions Bancorp N.A. (Banks). . . . . . . . . . . . . 7,673 398,382
155,629,154
HEALTH CARE – 14.2%Abbott Laboratories (Health Care Equip. &
Supplies) . . . . . . . . . . . . . . . . . . . . . . . 79,367 6,893,818AbbVie, Inc. (Biotechnology) . . . . . . . . . . . . 66,413 5,880,207ABIOMED, Inc. (Health Care Equip. &
Supplies) . . . . . . . . . . . . . . . . . . . . . . . (a) 2,035 347,151Agilent Technologies, Inc. (Life Sciences Tools
& Svs.) . . . . . . . . . . . . . . . . . . . . . . . . 13,907 1,186,406Alexion Pharmaceuticals, Inc. (Biotechnology) . (a) 9,941 1,075,119Align Technology, Inc. (Health Care Equip. &
Supplies) . . . . . . . . . . . . . . . . . . . . . . . (a) 3,221 898,788Allergan PLC (Pharmaceuticals) . . . . . . . . . . 14,743 2,818,419AmerisourceBergen Corp. (Health Care
Providers & Svs.) . . . . . . . . . . . . . . . . . . 6,752 574,055Amgen, Inc. (Biotechnology) . . . . . . . . . . . . 26,684 6,432,712Anthem, Inc. (Health Care Providers & Svs.) . . 11,389 3,439,820Baxter International, Inc. (Health Care Equip. &
Supplies) . . . . . . . . . . . . . . . . . . . . . . . 22,928 1,917,239Becton Dickinson and Co. (Health Care Equip.
& Supplies) . . . . . . . . . . . . . . . . . . . . . 12,146 3,303,348Biogen, Inc. (Biotechnology) . . . . . . . . . . . . (a) 8,104 2,404,700Boston Scientific Corp. (Health Care Equip. &
Supplies) . . . . . . . . . . . . . . . . . . . . . . . (a) 62,598 2,830,682Bristol-Myers Squibb Co. (Pharmaceuticals) . . 105,273 6,757,474Cardinal Health, Inc. (Health Care Providers &
Svs.) . . . . . . . . . . . . . . . . . . . . . . . . . . 13,147 664,975Centene Corp. (Health Care Providers & Svs.) . (a) 18,590 1,168,753Cerner Corp. (Health Care Technology) . . . . . . 14,110 1,035,533Cigna Corp. (Health Care Providers & Svs.) . . . 16,773 3,429,911Cooper Cos., Inc. / The (Health Care Equip. &
Supplies) . . . . . . . . . . . . . . . . . . . . . . . 2,223 714,228CVS Health Corp. (Health Care Providers &
Svs.) . . . . . . . . . . . . . . . . . . . . . . . . . . 58,431 4,340,839Danaher Corp. (Health Care Equip. & Supplies) . 28,707 4,405,950DaVita, Inc. (Health Care Providers & Svs.) . . . (a) 4,005 300,495DENTSPLY SIRONA, Inc. (Health Care Equip. &
Supplies) . . . . . . . . . . . . . . . . . . . . . . . 9,962 563,750Edwards Lifesciences Corp. (Health Care
Equip. & Supplies) . . . . . . . . . . . . . . . . . (a) 9,367 2,185,227Eli Lilly & Co. (Pharmaceuticals) . . . . . . . . . . 37,944 4,986,980Gilead Sciences, Inc. (Biotechnology) . . . . . . 56,820 3,692,164HCA Healthcare, Inc. (Health Care Providers &
Svs.) . . . . . . . . . . . . . . . . . . . . . . . . . . 11,888 1,757,165Henry Schein, Inc. (Health Care Providers &
Svs.) . . . . . . . . . . . . . . . . . . . . . . . . . . (a) 6,573 438,551Hologic, Inc. (Health Care Equip. & Supplies) . . (a) 12,081 630,749Humana, Inc. (Health Care Providers & Svs.) . . 5,948 2,180,061IDEXX Laboratories, Inc. (Health Care Equip. &
Supplies) . . . . . . . . . . . . . . . . . . . . . . . (a) 3,859 1,007,701Illumina, Inc. (Life Sciences Tools & Svs.) . . . . (a) 6,602 2,190,147Incyte Corp. (Biotechnology) . . . . . . . . . . . . (a) 8,006 699,084Intuitive Surgical, Inc. (Health Care Equip. &
Supplies) . . . . . . . . . . . . . . . . . . . . . . . (a) 5,190 3,068,068IQVIA Holdings, Inc. (Life Sciences Tools &
Svs.) . . . . . . . . . . . . . . . . . . . . . . . . . . (a) 8,099 1,251,376Johnson & Johnson (Pharmaceuticals) . . . . . 118,190 17,240,375
Common Stocks (Continued) Shares Value
HEALTH CARE (continued)Laboratory Corp. of America Holdings (Health
Care Providers & Svs.) . . . . . . . . . . . . . . (a) 4,352 $ 736,228McKesson Corp. (Health Care Providers &
Svs.) . . . . . . . . . . . . . . . . . . . . . . . . . . 8,094 1,119,562Medtronic PLC (Health Care Equip. &
Supplies) . . . . . . . . . . . . . . . . . . . . . . . 60,191 6,828,669Merck & Co., Inc. (Pharmaceuticals) . . . . . . . 114,334 10,398,677Mettler-Toledo International, Inc. (Life
Sciences Tools & Svs.) . . . . . . . . . . . . . . (a) 1,092 866,262Mylan N.V. (Pharmaceuticals) . . . . . . . . . . . (a) 23,140 465,114PerkinElmer, Inc. (Life Sciences Tools & Svs.). . 4,983 483,849Perrigo Co. PLC (Pharmaceuticals) . . . . . . . . 6,106 315,436Pfizer, Inc. (Pharmaceuticals). . . . . . . . . . . . 248,526 9,737,249Quest Diagnostics, Inc. (Health Care Providers
& Svs.) . . . . . . . . . . . . . . . . . . . . . . . . 6,035 644,478Regeneron Pharmaceuticals, Inc.
(Biotechnology). . . . . . . . . . . . . . . . . . . (a) 3,588 1,347,222ResMed, Inc. (Health Care Equip. & Supplies) . 6,472 1,002,966STERIS PLC (Health Care Equip. & Supplies) . . 3,810 580,720Stryker Corp. (Health Care Equip. & Supplies). . 14,459 3,035,522Teleflex, Inc. (Health Care Equip. & Supplies) . . 2,073 780,360Thermo Fisher Scientific, Inc. (Life Sciences
Tools & Svs.). . . . . . . . . . . . . . . . . . . . . 18,010 5,850,909UnitedHealth Group, Inc. (Health Care
Providers & Svs.) . . . . . . . . . . . . . . . . . . 42,548 12,508,261Universal Health Services, Inc. Class B (Health
Care Providers & Svs.) . . . . . . . . . . . . . . 3,606 517,317Varian Medical Systems, Inc. (Health Care
Equip. & Supplies) . . . . . . . . . . . . . . . . . (a) 4,083 579,827Vertex Pharmaceuticals, Inc. (Biotechnology) . (a) 11,550 2,528,872Waters Corp. (Life Sciences Tools & Svs.) . . . . (a) 2,895 676,417WellCare Health Plans, Inc. (Health Care
Providers & Svs.) . . . . . . . . . . . . . . . . . . (a) 2,255 744,624Zimmer Biomet Holdings, Inc. (Health Care
Equip. & Supplies) . . . . . . . . . . . . . . . . . 9,239 1,382,893Zoetis, Inc. (Pharmaceuticals) . . . . . . . . . . . 21,403 2,832,687
170,676,141
INDUSTRIALS – 9.0%3M Co. (Industrial Conglomerates). . . . . . . . . 25,824 4,555,870A.O. Smith Corp. (Building Products) . . . . . . . 6,160 293,462Alaska Air Group, Inc. (Airlines) . . . . . . . . . . 5,532 374,793Allegion PLC (Building Products). . . . . . . . . . 4,174 519,830American Airlines Group, Inc. (Airlines) . . . . . 17,516 502,359AMETEK, Inc. (Electrical Equip.) . . . . . . . . . . 10,241 1,021,437Arconic, Inc. (Aerospace & Defense) . . . . . . . 17,375 534,629Boeing Co. / The (Aerospace & Defense) . . . . 24,010 7,821,498C.H. Robinson Worldwide, Inc. (Air Freight &
Logistics). . . . . . . . . . . . . . . . . . . . . . . 6,068 474,518Caterpillar, Inc. (Machinery) . . . . . . . . . . . . 24,818 3,665,122Cintas Corp. (Commercial Svs. & Supplies) . . . 3,767 1,013,624Copart, Inc. (Commercial Svs. & Supplies) . . . . (a) 9,189 835,648CSX Corp. (Road & Rail) . . . . . . . . . . . . . . . 34,921 2,526,884Cummins, Inc. (Machinery) . . . . . . . . . . . . . 6,880 1,231,245Deere & Co. (Machinery) . . . . . . . . . . . . . . 14,141 2,450,070Delta Air Lines, Inc. (Airlines) . . . . . . . . . . . . 25,856 1,512,059Dover Corp. (Machinery). . . . . . . . . . . . . . . 6,525 752,072Eaton Corp. PLC (Electrical Equip.). . . . . . . . . 18,575 1,759,424Emerson Electric Co. (Electrical Equip.). . . . . . 27,366 2,086,931Equifax, Inc. (Professional Svs.) . . . . . . . . . . 5,439 762,113Expeditors International of Washington, Inc.
(Air Freight & Logistics) . . . . . . . . . . . . . . 7,645 596,463Fastenal Co. (Trading Companies &
Distributors) . . . . . . . . . . . . . . . . . . . . . 25,760 951,832FedEx Corp. (Air Freight & Logistics) . . . . . . . 10,783 1,630,497Flowserve Corp. (Machinery) . . . . . . . . . . . . 5,893 293,295Fortive Corp. (Machinery) . . . . . . . . . . . . . . 13,273 1,013,925Fortune Brands Home & Security, Inc.
(Building Products) . . . . . . . . . . . . . . . . 6,256 408,767General Dynamics Corp. (Aerospace &
Defense) . . . . . . . . . . . . . . . . . . . . . . . 10,525 1,856,084
Ohio National Fund, Inc. ON S&P 500® Index Portfolio (Continued)
Schedule of Investments December 31, 2019
50 (continued)

Common Stocks (Continued) Shares Value
INDUSTRIALS (continued)General Electric Co.
(Industrial Conglomerates) . . . . . . . . . . . . 392,217 $ 4,377,142Honeywell International, Inc.
(Industrial Conglomerates) . . . . . . . . . . . . 32,087 5,679,399Huntington Ingalls Industries, Inc. (Aerospace
& Defense). . . . . . . . . . . . . . . . . . . . . . 1,835 460,365IDEX Corp. (Machinery) . . . . . . . . . . . . . . . 3,430 589,960IHS Markit Ltd. (Professional Svs.). . . . . . . . . (a) 18,009 1,356,978Illinois Tool Works, Inc. (Machinery) . . . . . . . 13,132 2,358,901Ingersoll-Rand PLC (Machinery) . . . . . . . . . . 10,752 1,429,156J.B. Hunt Transport Services, Inc. (Road &
Rail) . . . . . . . . . . . . . . . . . . . . . . . . . . 3,830 447,267Jacobs Engineering Group, Inc. (Construction
& Engineering) . . . . . . . . . . . . . . . . . . . 6,081 546,256Johnson Controls International PLC
(Building Products) . . . . . . . . . . . . . . . . 34,646 1,410,439Kansas City Southern (Road & Rail) . . . . . . . . 4,452 681,868L3Harris Technologies, Inc. (Aerospace &
Defense) . . . . . . . . . . . . . . . . . . . . . . . 9,930 1,964,849Lockheed Martin Corp. (Aerospace &
Defense) . . . . . . . . . . . . . . . . . . . . . . . 11,145 4,339,640Masco Corp. (Building Products). . . . . . . . . . 12,762 612,448Nielsen Holdings PLC (Professional Svs.) . . . . 15,958 323,947Norfolk Southern Corp. (Road & Rail) . . . . . . . 11,710 2,273,262Northrop Grumman Corp. (Aerospace &
Defense) . . . . . . . . . . . . . . . . . . . . . . . 7,037 2,420,517Old Dominion Freight Line, Inc. (Road & Rail) . . 2,868 544,289PACCAR, Inc. (Machinery). . . . . . . . . . . . . . 15,533 1,228,660Parker-Hannifin Corp. (Machinery) . . . . . . . . 5,771 1,187,787Pentair PLC (Machinery) . . . . . . . . . . . . . . . 7,540 345,860Quanta Services, Inc. (Construction &
Engineering) . . . . . . . . . . . . . . . . . . . . . 6,394 260,300Raytheon Co. (Aerospace & Defense) . . . . . . 12,506 2,748,068Republic Services, Inc. (Commercial Svs. &
Supplies) . . . . . . . . . . . . . . . . . . . . . . . 9,433 845,480Robert Half International, Inc.
(Professional Svs.) . . . . . . . . . . . . . . . . . 5,281 333,495Rockwell Automation, Inc. (Electrical Equip.) . . 5,191 1,052,060Rollins, Inc. (Commercial Svs. & Supplies) . . . . 6,325 209,737Roper Technologies, Inc.
(Industrial Conglomerates) . . . . . . . . . . . . 4,674 1,655,671Snap-on, Inc. (Machinery). . . . . . . . . . . . . . 2,475 419,265Southwest Airlines Co. (Airlines) . . . . . . . . . . 21,269 1,148,101Stanley Black & Decker, Inc. (Machinery) . . . . 6,828 1,131,673Textron, Inc. (Aerospace & Defense) . . . . . . . 10,289 458,889TransDigm Group, Inc. (Aerospace & Defense) . 2,237 1,252,720Union Pacific Corp. (Road & Rail) . . . . . . . . . 31,174 5,635,947United Airlines Holdings, Inc. (Airlines) . . . . . . (a) 9,774 860,992United Parcel Service, Inc. Class B (Air Freight
& Logistics) . . . . . . . . . . . . . . . . . . . . . 31,468 3,683,644United Rentals, Inc. (Trading Companies &
Distributors) . . . . . . . . . . . . . . . . . . . . . (a) 3,378 563,349United Technologies Corp. (Aerospace &
Defense) . . . . . . . . . . . . . . . . . . . . . . . 36,436 5,456,655Verisk Analytics, Inc. (Professional Svs.) . . . . . 7,358 1,098,844W.W. Grainger, Inc. (Trading Companies &
Distributors) . . . . . . . . . . . . . . . . . . . . . 1,960 663,499Waste Management, Inc. (Commercial Svs. &
Supplies) . . . . . . . . . . . . . . . . . . . . . . . 17,531 1,997,833Westinghouse Air Brake Technologies Corp.
(Machinery) . . . . . . . . . . . . . . . . . . . . . 8,163 635,081Xylem, Inc. (Machinery) . . . . . . . . . . . . . . . 8,067 635,599
108,770,343
INFORMATION TECHNOLOGY – 23.2%Accenture PLC Class A (IT Svs.) . . . . . . . . . . 28,526 6,006,720Adobe, Inc. (Software) . . . . . . . . . . . . . . . . (a) 21,740 7,170,069Advanced Micro Devices, Inc.
(Semiconductors & Equip.) . . . . . . . . . . . . (a) 50,013 2,293,596Akamai Technologies, Inc. (IT Svs.) . . . . . . . . (a) 7,258 626,946Alliance Data Systems Corp. (IT Svs.) . . . . . . . 1,836 205,999
Common Stocks (Continued) Shares Value
INFORMATION TECHNOLOGY (continued)Amphenol Corp. Class A (Electronic Equip.,
Instr. & Comp.) . . . . . . . . . . . . . . . . . . . 13,336 $ 1,443,355Analog Devices, Inc. (Semiconductors &
Equip.) . . . . . . . . . . . . . . . . . . . . . . . . 16,559 1,967,872ANSYS, Inc. (Software) . . . . . . . . . . . . . . . (a) 3,845 989,742Apple, Inc. (Tech. Hardware, Storage &
Periph.) . . . . . . . . . . . . . . . . . . . . . . . . 187,562 55,077,581Applied Materials, Inc. (Semiconductors &
Equip.) . . . . . . . . . . . . . . . . . . . . . . . . 41,486 2,532,305Arista Networks, Inc. (Communications Equip.). (a) 2,432 494,669Autodesk, Inc. (Software) . . . . . . . . . . . . . . (a) 9,883 1,813,135Automatic Data Processing, Inc. (IT Svs.) . . . . 19,438 3,314,179Broadcom, Inc. (Semiconductors & Equip.) . . . 17,808 5,627,684Broadridge Financial Solutions, Inc. (IT Svs.) . . 5,163 637,837Cadence Design Systems, Inc. (Software) . . . . (a) 12,631 876,086CDW Corp. (Electronic Equip., Instr. & Comp.). . 6,452 921,604Cisco Systems, Inc. (Communications Equip.) . . 190,505 9,136,620Citrix Systems, Inc. (Software) . . . . . . . . . . . 5,507 610,726Cognizant Technology Solutions Corp. Class A
(IT Svs.). . . . . . . . . . . . . . . . . . . . . . . . 24,587 1,524,886Corning, Inc. (Electronic Equip., Instr. & Comp.). 34,541 1,005,489DXC Technology Co. (IT Svs.) . . . . . . . . . . . . 11,506 432,511F5 Networks, Inc. (Communications Equip.) . . . (a) 2,733 381,664Fidelity National Information Services, Inc.
(IT Svs.). . . . . . . . . . . . . . . . . . . . . . . . 27,601 3,839,023Fiserv, Inc. (IT Svs.) . . . . . . . . . . . . . . . . . . (a) 25,648 2,965,678FleetCor Technologies, Inc. (IT Svs.) . . . . . . . (a) 3,897 1,121,245FLIR Systems, Inc. (Electronic Equip., Instr. &
Comp.) . . . . . . . . . . . . . . . . . . . . . . . . 5,986 311,691Fortinet, Inc. (Software) . . . . . . . . . . . . . . . (a) 6,360 678,994Gartner, Inc. (IT Svs.) . . . . . . . . . . . . . . . . . (a) 4,006 617,325Global Payments, Inc. (IT Svs.) . . . . . . . . . . . 13,499 2,464,377Hewlett Packard Enterprise Co. (Tech.
Hardware, Storage & Periph.) . . . . . . . . . . 58,228 923,496HP, Inc. (Tech. Hardware, Storage & Periph.) . . 66,535 1,367,294Intel Corp. (Semiconductors & Equip.) . . . . . . 195,346 11,691,458International Business Machines Corp.
(IT Svs.). . . . . . . . . . . . . . . . . . . . . . . . 39,769 5,330,637Intuit, Inc. (Software) . . . . . . . . . . . . . . . . . 11,690 3,061,962IPG Photonics Corp. (Electronic Equip., Instr. &
Comp.) . . . . . . . . . . . . . . . . . . . . . . . . (a) 1,601 232,017Jack Henry & Associates, Inc. (IT Svs.). . . . . . 3,441 501,251Juniper Networks, Inc.
(Communications Equip.) . . . . . . . . . . . . . 15,050 370,682Keysight Technologies, Inc. (Electronic Equip.,
Instr. & Comp.) . . . . . . . . . . . . . . . . . . . (a) 8,410 863,118KLA-Tencor Corp. (Semiconductors & Equip.). . 7,081 1,261,622Lam Research Corp. (Semiconductors &
Equip.) . . . . . . . . . . . . . . . . . . . . . . . . 6,516 1,905,278Leidos Holdings, Inc. (IT Svs.). . . . . . . . . . . . 5,978 585,186Mastercard, Inc. Class A (IT Svs.) . . . . . . . . . 39,862 11,902,395Maxim Integrated Products, Inc.
(Semiconductors & Equip.) . . . . . . . . . . . . 12,159 747,900Microchip Technology, Inc. (Semiconductors &
Equip.) . . . . . . . . . . . . . . . . . . . . . . . . 10,735 1,124,169Micron Technology, Inc. (Semiconductors &
Equip.) . . . . . . . . . . . . . . . . . . . . . . . . (a) 49,719 2,673,888Microsoft Corp. (Software) . . . . . . . . . . . . . 342,589 54,026,285Motorola Solutions, Inc.
(Communications Equip.) . . . . . . . . . . . . . 7,694 1,239,811NetApp, Inc. (Tech. Hardware, Storage &
Periph.) . . . . . . . . . . . . . . . . . . . . . . . . 10,248 637,938NortonLifeLock, Inc. (Software) . . . . . . . . . . 25,758 657,344NVIDIA Corp. (Semiconductors & Equip.) . . . . 27,484 6,466,985Oracle Corp. (Software) . . . . . . . . . . . . . . . 97,289 5,154,371Paychex, Inc. (IT Svs.) . . . . . . . . . . . . . . . . 14,331 1,218,995PayPal Holdings, Inc. (IT Svs.) . . . . . . . . . . . (a) 52,730 5,703,804Qorvo, Inc. (Semiconductors & Equip.) . . . . . . (a) 5,219 606,604QUALCOMM, Inc. (Semiconductors & Equip.). . 51,278 4,524,258salesforce.com, Inc. (Software) . . . . . . . . . . (a) 39,835 6,478,764
Ohio National Fund, Inc. ON S&P 500® Index Portfolio (Continued)
Schedule of Investments December 31, 2019
51 (continued)

Common Stocks (Continued) Shares Value
INFORMATION TECHNOLOGY (continued)Seagate Technology PLC (Tech. Hardware,
Storage & Periph.) . . . . . . . . . . . . . . . . . 10,378 $ 617,491ServiceNow, Inc. (Software) . . . . . . . . . . . . (a) 8,471 2,391,533Skyworks Solutions, Inc. (Semiconductors &
Equip.) . . . . . . . . . . . . . . . . . . . . . . . . 7,658 925,699Synopsys, Inc. (Software) . . . . . . . . . . . . . . (a) 6,740 938,208TE Connectivity Ltd. (Electronic Equip., Instr. &
Comp.) . . . . . . . . . . . . . . . . . . . . . . . . 15,006 1,438,175Texas Instruments, Inc. (Semiconductors &
Equip.) . . . . . . . . . . . . . . . . . . . . . . . . 41,977 5,385,229VeriSign, Inc. (IT Svs.) . . . . . . . . . . . . . . . . (a) 4,640 894,035Visa, Inc. (IT Svs.) . . . . . . . . . . . . . . . . . . . 76,869 14,443,685Western Digital Corp. (Tech. Hardware,
Storage & Periph.) . . . . . . . . . . . . . . . . . 13,358 847,832Western Union Co. / The (IT Svs.) . . . . . . . . . 18,812 503,785Xerox Holdings Corp. (Tech. Hardware,
Storage & Periph.) . . . . . . . . . . . . . . . . . 8,353 307,975Xilinx, Inc. (Semiconductors & Equip.) . . . . . . 11,271 1,101,966Zebra Technologies Corp. Class A (Electronic
Equip., Instr. & Comp.) . . . . . . . . . . . . . . . (a) 2,422 618,676278,761,409
MATERIALS – 2.7%Air Products & Chemicals, Inc. (Chemicals) . . . 9,900 2,326,401Albemarle Corp. (Chemicals) . . . . . . . . . . . . 4,756 347,378Amcor PLC (Containers & Packaging) . . . . . . 72,767 788,794Avery Dennison Corp. (Containers &
Packaging). . . . . . . . . . . . . . . . . . . . . . 3,738 489,005Ball Corp. (Containers & Packaging) . . . . . . . 14,707 951,102Celanese Corp. (Chemicals) . . . . . . . . . . . . . 5,432 668,788CF Industries Holdings, Inc. (Chemicals) . . . . . 9,788 467,279Corteva, Inc. (Chemicals) . . . . . . . . . . . . . . 33,623 993,896Dow, Inc. (Chemicals) . . . . . . . . . . . . . . . . 33,317 1,823,439DuPont de Nemours, Inc. (Chemicals) . . . . . . 33,257 2,135,099Eastman Chemical Co. (Chemicals) . . . . . . . . 6,127 485,626Ecolab, Inc. (Chemicals) . . . . . . . . . . . . . . . 11,263 2,173,646FMC Corp. (Chemicals) . . . . . . . . . . . . . . . . 5,800 578,956Freeport-McMoRan, Inc. (Metals & Mining). . . 65,019 853,049International Flavors & Fragrances, Inc.
(Chemicals) . . . . . . . . . . . . . . . . . . . . . 4,786 617,490International Paper Co. (Containers &
Packaging). . . . . . . . . . . . . . . . . . . . . . 17,616 811,217Linde PLC (Chemicals) . . . . . . . . . . . . . . . . 24,125 5,136,212LyondellBasell Industries N.V. Class A
(Chemicals) . . . . . . . . . . . . . . . . . . . . . 11,521 1,088,504Martin Marietta Materials, Inc.
(Construction Materials) . . . . . . . . . . . . . 2,801 783,272Mosaic Co. / The (Chemicals) . . . . . . . . . . . . 15,689 339,510Newmont Goldcorp Corp. (Metals & Mining) . . 36,838 1,600,611Nucor Corp. (Metals & Mining) . . . . . . . . . . . 13,590 764,845Packaging Corp. of America (Containers &
Packaging). . . . . . . . . . . . . . . . . . . . . . 4,236 474,390PPG Industries, Inc. (Chemicals) . . . . . . . . . . 10,622 1,417,931Sealed Air Corp. (Containers & Packaging) . . . 6,926 275,863Sherwin-Williams Co. / The (Chemicals) . . . . . 3,690 2,153,263Vulcan Materials Co. (Construction Materials) . 5,932 854,149Westrock Co. (Containers & Packaging) . . . . . 11,544 495,353
31,895,068
REAL ESTATE – 2.9%Alexandria Real Estate Equities, Inc.
(Equity REIT). . . . . . . . . . . . . . . . . . . . . 5,176 836,338American Tower Corp. (Equity REIT). . . . . . . . 19,892 4,571,579Apartment Investment & Management Co.
Class A (Equity REIT) . . . . . . . . . . . . . . . 6,703 346,210AvalonBay Communities, Inc. (Equity REIT) . . . 6,274 1,315,658Boston Properties, Inc. (Equity REIT) . . . . . . . 6,460 890,576CBRE Group, Inc. Class A (Real Estate Mgmt. &
Development) . . . . . . . . . . . . . . . . . . . . (a) 15,011 920,024Crown Castle International Corp. (Equity REIT) . 18,672 2,654,225Digital Realty Trust, Inc. (Equity REIT) . . . . . . . 9,375 1,122,563
Common Stocks (Continued) Shares Value
REAL ESTATE (continued)Duke Realty Corp. (Equity REIT) . . . . . . . . . . 16,531 $ 573,130Equinix, Inc. (Equity REIT) . . . . . . . . . . . . . . 3,830 2,235,571Equity Residential (Equity REIT) . . . . . . . . . . 15,674 1,268,340Essex Property Trust, Inc. (Equity REIT). . . . . . 2,969 893,253Extra Space Storage, Inc. (Equity REIT). . . . . . 5,819 614,603Federal Realty Investment Trust (Equity REIT) . . 3,173 408,460Healthpeak Properties, Inc. (Equity REIT) . . . . 22,240 766,613Host Hotels & Resorts, Inc. (Equity REIT) . . . . . 32,234 597,941Iron Mountain, Inc. (Equity REIT) . . . . . . . . . . 12,832 408,956Kimco Realty Corp. (Equity REIT) . . . . . . . . . . 18,965 392,765Mid-America Apartment Communities, Inc.
(Equity REIT). . . . . . . . . . . . . . . . . . . . . 5,120 675,123Prologis, Inc. (Equity REIT). . . . . . . . . . . . . . 28,374 2,529,258Public Storage (Equity REIT) . . . . . . . . . . . . 6,745 1,436,415Realty Income Corp. (Equity REIT) . . . . . . . . . 14,644 1,078,238Regency Centers Corp. (Equity REIT) . . . . . . . 7,503 473,364SBA Communications Corp. (Equity REIT) . . . . 5,052 1,217,481Simon Property Group, Inc. (Equity REIT). . . . . 13,777 2,052,222SL Green Realty Corp. (Equity REIT) . . . . . . . . 3,649 335,270UDR, Inc. (Equity REIT) . . . . . . . . . . . . . . . . 13,152 614,198Ventas, Inc. (Equity REIT) . . . . . . . . . . . . . . 16,744 966,799Vornado Realty Trust (Equity REIT). . . . . . . . . 7,094 471,751Welltower, Inc. (Equity REIT) . . . . . . . . . . . . 18,227 1,490,604Weyerhaeuser Co. (Equity REIT) . . . . . . . . . . 33,473 1,010,885
35,168,413
UTILITIES – 3.3%AES Corp. (Ind. Power & Renewable Elec.) . . . 29,717 591,368Alliant Energy Corp. (Electric Utilities) . . . . . . 10,807 591,359Ameren Corp. (Multi-Utilities) . . . . . . . . . . . . 11,055 849,024American Electric Power Co., Inc.
(Electric Utilities) . . . . . . . . . . . . . . . . . . 22,178 2,096,043American Water Works Co., Inc.
(Water Utilities) . . . . . . . . . . . . . . . . . . . 8,128 998,525Atmos Energy Corp. (Gas Utilities) . . . . . . . . . 5,360 599,570CenterPoint Energy, Inc. (Multi-Utilities) . . . . . 22,495 613,439CMS Energy Corp. (Multi-Utilities) . . . . . . . . . 12,748 801,084Consolidated Edison, Inc. (Multi-Utilities) . . . . 14,928 1,350,536Dominion Energy, Inc. (Multi-Utilities). . . . . . . 36,959 3,060,944DTE Energy Co. (Multi-Utilities) . . . . . . . . . . . 8,628 1,120,518Duke Energy Corp. (Electric Utilities) . . . . . . . 32,739 2,986,124Edison International (Electric Utilities) . . . . . . 16,105 1,214,478Entergy Corp. (Electric Utilities) . . . . . . . . . . 8,959 1,073,288Evergy, Inc. (Electric Utilities). . . . . . . . . . . . 10,244 666,782Eversource Energy (Electric Utilities) . . . . . . . 14,541 1,237,003Exelon Corp. (Electric Utilities) . . . . . . . . . . . 43,662 1,990,551FirstEnergy Corp. (Electric Utilities) . . . . . . . . 24,266 1,179,328NextEra Energy, Inc. (Electric Utilities) . . . . . . 21,948 5,314,928NiSource, Inc. (Multi-Utilities) . . . . . . . . . . . 16,764 466,710NRG Energy, Inc. (Ind. Power & Renewable
Elec.) . . . . . . . . . . . . . . . . . . . . . . . . . 11,350 451,163Pinnacle West Capital Corp. (Electric Utilities) . 5,038 453,067PPL Corp. (Electric Utilities) . . . . . . . . . . . . . 32,472 1,165,095Public Service Enterprise Group, Inc.
(Multi-Utilities) . . . . . . . . . . . . . . . . . . . 22,706 1,340,789Sempra Energy (Multi-Utilities) . . . . . . . . . . . 12,658 1,917,434Southern Co. / The (Electric Utilities) . . . . . . . 47,092 2,999,760WEC Energy Group, Inc. (Multi-Utilities) . . . . . 14,166 1,306,530Xcel Energy, Inc. (Electric Utilities) . . . . . . . . 23,553 1,495,380
39,930,820Total Common Stocks (Cost $904,214,236) . . . . $1,201,715,776
U.S. TreasuryObligations – 0.0% Rate Maturity Face Amount Value
U.S. Treasury Bill . . . 0.000% 03/19/2020 $ 200,000 $ 199,366Total U.S. TreasuryObligations(Cost $199,217) . . . . $ 199,366
Ohio National Fund, Inc. ON S&P 500® Index Portfolio (Continued)
Schedule of Investments December 31, 2019
52 (continued)

Money Market Funds – 0.2% Shares Value
State Street Institutional Liquid Reserves FundInstitutional Class, 1.734% . . . . . . . . . . . . (b) 2,079,213 $ 2,079,421
Total Money Market Funds (Cost $2,079,421) . . . . . . $ 2,079,421Total Investments – 100.1% (Cost $906,492,874) . . . . . . . (c) $1,203,994,563Liabilities in Excess of Other Assets – (0.1)% . . . . . . (d) (1,403,189)Net Assets – 100.0% $1,202,591,374
Percentages are stated as a percent of net assets.Footnotes:
(a) Non-income producing security.(b) Rate represents the seven-day yield at December 31, 2019.(c) Represents cost for financial reporting purposes, which may differ from cost basis for federal income tax purposes. See also Note 8 of the Notes to Financial
Statements.(d) Includes $182,700 of cash pledged as collateral for the futures contracts outstanding at December 31, 2019. See also the following Schedule of Open Futures
Contracts.
The accompanying notes are an integral part of these financial statements.
Schedule of Open Futures Contracts December 31, 2019
DescriptionNumber ofcontracts Expiration Date
NotionalAmount Value
UnrealizedAppreciation
(Depreciation)
Variation MarginReceivable(Payable)
CME E-mini S&P 500 Index - Long 29 March 20, 2020 $4,633,748 $4,685,095 $51,347 $1,575
The accompanying notes are an integral part of these financial statements.
Ohio National Fund, Inc. ON S&P 500® Index Portfolio (Continued)
Schedule of Investments December 31, 2019
53

Objective/Strategy
The ON BlackRock Advantage Large Cap Value Portfolio (formerly theON Federated Strategic Value Dividend Portfolio) seeks growth ofcapital and income by investing under normal circumstances, at least80% of its net assets in stocks of large capitalization companies withmarket capitalizations at the time of investment that are within the rangeof market capitalizations of the companies in the Russell 1000 ValueIndex for the previous twelve months.
Performance as of December 31, 2019
Average Annual returnsOne year 19.21%Five years 7.66%Ten years 10.41%
Past performance does not guarantee future results. The performance dataquoted represents past performance and current returns may be lower or higher.Total return figures include change in share price and reinvestment of dividendsand capital gains. The investment return and principal value will fluctuate so thatan investor’s shares, when redeemed, may be worth more or less than the originalcost. To obtain performance information up to the most recent month end, calltoll-free 1-877-781-6392.
The Portfolio is not open to direct retail investment. Beneficial interest in shares isobtained solely by purchase of variable life insurance policies and variable annuitycontracts. Actual performance results for variable annuity and variable universallife contracts will be lower due to contract charges. Consult your contract forapplicable charges.
Total expense ratio is 0.72% per the Fund’s prospectus dated November 22, 2019.Additional information pertaining to the Portfolio’s expense ratio as ofDecember 31, 2019 can be found in the Portfolio’s Financial Highlights.
Comments from Sub-Adviser
Q. How did the Portfolio perform in comparison to its benchmark duringthe reporting period?
A. For the year ended December 31, 2019, the Portfolio returned 19.21%versus 26.54% for its current benchmark, the Russell 1000 Value Index,and 23.11% for its former benchmark, the Dow Jones U.S. SelectDividend Index.
Effective December 7, 2019, BlackRock Investment Management, LLCreplaced the Portfolio’s previous sub-adviser, Federated EquityManagement Company of Pennsylvania (“Federated Equity”). Inconjunction with the change in sub-adviser and investment strategy, thename of the Portfolio was changed from ON Federated Strategic ValueDividend Portfolio to ON BlackRock Advantage Large Cap ValuePortfolio. Also, the Portfolio’s benchmark was changed from the DowJones U.S. Select Dividend Index to the Russell 1000 Value Index. Thechange in the benchmark was made because the Russell 1000 ValueIndex better reflects the style of the strategy utilized by BlackRock.
For the period from January 1, 2019 to December 6, 2019 (the “firstperformance period”), the Portfolio returned 17.04% versus 19.97% forthe Dow Jones U.S. Select Dividend Index.
For the period from December 7, 2019 to December 31, 2019 (the “latterperformance period”), the Portfolio returned 1.85% versus 2.28% for theRussell 1000 Value Index.
Q. Were there specific market conditions, investment strategies, ortechniques that materially affected the Portfolio’s benchmark-relativeperformance during the reporting period?
A. Federated Equity: Overall, investor sentiment was positive for theyear, as investor optimism increased amid the Federal Reserve loweringrates and the hopes of a truce to the ongoing U.S. - China trade war.While the risk-on trade was temporarily sidelined in the third quarter, dueto increasing trade tensions, the high beta chase prevailed for much ofthe first performance period. Accordingly, high beta outperformed forthis period. The benchmark had an average weight of 20% in the topperforming, highest quintile of beta versus only 6% in the Portfolio,detracting 65 basis points from the Portfolio’s relative performance.
A. BlackRock: The U.S. equity market continued to climb in December,as an easing of global trade tensions, supportive central bank policy, andstrength across several economic indicators helped drive positivereturns. As the market was largely driven by geopolitical and broadmacroeconomic factors, some of the Portfolio’s stock selection insightswere challenged. The Portfolio’s sentiment-based investment insightswere some of the most notable detractors, as the geopolitically-drivenmarket moves were often disconnected from stock-specific sentiment.Cross-market sentiment signals, particularly those seeking to identify thesentiment of informed bond investors, were especially challenged.Insights evaluating company fundamentals were generally mixed duringthe latter performance period, as signals designed to identify relativevalue opportunities were broadly flat and the Portfolio’s company qualitysignals detracted slightly. The Portfolio’s macro thematic insightsdetracted modestly throughout the period as well, as a signal measuringsensitivity to changes in foreign exchange rates dampened relativereturns. (1)
Q. How did sector allocation and security selection each impact thePortfolio’s performance relative to its benchmark? For sector allocation,were there any factors that impacted the benchmark’s performancemore significantly than the Portfolio’s performance? For stock selection,was there anything specific regarding the Portfolio’s strategy thatcaused deviation from the benchmark?
A. Federated Equity: The former strategy focused on the dividend-richsegments of the economy, such as Consumer Staples, Health Care,Telecommunication Services and Utilities. Therefore, the former strategymaintained a structural underweight in cyclical sectors that affordedlittle to no dividend growth opportunities. The Portfolio had limitedexposure to Industrials, Information Technology, Materials, andConsumer Discretionary during the first performance period. Further, theformer benchmark typically has an outsized average weight in theUtilities sector, which creates notable dispersion in periods when thesector greatly underperforms or outperforms.
During the first performance period, the primary driver of relativeweakness was stock selection and an overweight in Energy. Energy wasthe worst performing sector in the benchmark, as crude oil pricesdeclined during the period. Additionally, the Portfolio had a larger weightin Occidental Petroleum Corp., which experienced short term pricepressure from investor concerns surrounding its Anadarko PetroleumCorp. deal. Further, the Portfolio had no exposure to benchmark holding,ONEOK, Inc., which appreciated almost 40% during the first performanceperiod. Relative performance was further hampered by an underweightin Information Technology, which was the top performing sector in theformer benchmark. The Portfolio had minimal exposure to cyclicalsectors, such as Information Technology, due to the lack of reliabledividend growth and yield opportunities.
Conversely, selection in Communication Services added to relativeperformance during the first performance period. The outperformance inthis sector was primarily driven by the Portfolio’s greater exposure toAT&T, Inc., which appreciated 42.34%. Furthermore, the Portfolio’sunderweight in Consumer Discretionary added to relative performance,as this sector underperformed the overall benchmark.
Ohio National Fund, Inc. ON BlackRock Advantage Large Cap Value Portfolio (Unaudited)
54 (continued)

A. BlackRock: The portfolio management team targets a relativelysector-neutral approach and seeks to derive the majority of its alphafrom security selection. Over the latter performance period, no sectorallocation decisions meaningfully affected relative returns. Stockselection was additive in the Utilities sector, especially among electricutilities companies. In contrast, security selection within the Financialssector, particularly among banks, was a notable detractor from relativeperformance. Selection in the Energy sector hindered relative returns aswell. (1)
Q. Which holdings contributed the most to, and detracted the most from,the Portfolio’s benchmark-relative performance?
A. Federated Equity: The Southern Co., a non-former-benchmarkholding, was the top relative contributor during the first performanceperiod, benefitting from declining interest rates and a strong secondquarter earnings report. AT&T, Inc. was the second largest relativecontributor, as its shares recovered off of their 2018 lows. The companymarked progress along its path to reducing debt following the TimeWarner acquisition, and news that activist investor Elliot Managementhad taken a position in the company and laid out a plan to improve thecompany’s positioning and performance was positive. Phillip MorrisInternational, Inc. was another top relative contributor, as the stock wasbuoyed by strong earnings and investor optimism surrounding thecompany’s next generation of I-Quit-Ordinary-Smoking (“IQOS”) devices.
The top relative detractors during the first performance period were allformer-benchmark names that performed well, but were not held by thePortfolio. Target Corp. was the largest detractor. The Portfolio has little tono exposure to Consumer Discretionary due to the lack of reliabledividend growth and yield opportunities. QUALCOMM, Inc. was thesecond largest detractor. The Portfolio also has little to no exposure toInformation Technology due to the lack of reliable dividend growth andyield opportunities. The third largest detractor was ONEOK, Inc., anenergy stock that performed well, but was also not selected by thePortfolio’s former concentrated strategy.
A. BlackRock: The top individual contributor for the latter performanceperiod was the Portfolio’s overweight position in EOG Resources, Inc., asthe stock rose over 10%. As one of the largest oil and natural gasexploration and production companies in the U.S., the rise in oil pricesthrough the end of the year provided a tailwind for the company’s stock.The Portfolio’s overweight position in LAM Research Corp. (“LAM”) wasalso beneficial. As the company manufactures components used insemiconductor devices, the increased demand for semiconductors onthe back of Apple, Inc.’s success and easing trade tensions into the endof the year caused LAM’s stock price to surge. The Portfolio’s overweightposition in The Mosaic Co. (“Mosaic”) further supported relative returns,as Mosaic’s stock price increased on news that the company was goingto materially decrease phosphate production at certain U.S. facilities,allowing the company to cut operating costs and focus on its lower-cost,higher margin Canadian potash business. (1)
In contrast, the Portfolio’s underweight position in Dominion Energy, Inc.was the largest individual detractor for the latter performance period.The company’s stock price rose on news of a $200 million strategicpartnership with Vanguard Renewables to convert methane from U.S.dairy farms into clean, renewable energy for U.S. consumers. Investorsrewarded the company’s initiative to reduce greenhouse gas emissions,while developing innovative sources of clean energy. Remainingunderweight, Occidental Petroleum Corp. (“Occidental”), also detractednotably from results. Occidental’s stock price was supported by positiveinvestor sentiment toward the company’s plan to sell approximatelytwenty major assets in an effort to significantly reduce the company’soutstanding debt and stabilize its balance sheet. Lastly, an overweightposition in Gilead Sciences, Inc. dampened relative returns, as concernsaround increased regulation on drug pricing and a possible patentextension denial caused the stock to sell off. (1)
Q. How did the Portfolio’s use of derivative instruments and initialpublic offerings (IPOs), if any, impact performance?
A. Federated Equity: The Portfolio did not hold any derivatives orparticipate in any IPOs during the first performance period.
A. BlackRock: Pursuant to the Portfolio’s investment strategy, futurescontracts were used in the latter performance period to equitize cashand prevent a cash drag on performance. The futures did notmeaningfully impact relative performance, however, due to their indexcharacteristics and size in relation to the Portfolio’s net assets. (1)
(1) The Portfolio’s composition is subject to change. Holdings and weightings areas of December 31, 2019.
Change in Value of $10,000 Investment
ON BlackRock Large Cap Value Portfolio (A)Russell 1000 Value Index (B)Dow Jones U.S. Select Dividend Index (C)
5,000
10,000
15,000
20,000
25,000
30,000
35,000
$40,000
6/1
012
/10 6
/1112
/11 6
/1212
/12 6
/1312
/13 6
/1412
/14 6
/1512
/15 6
/1612
/16 6
/1712
/17 6
/1812
/18 6
/19
12/3
1/09
12/1
9
$35,200 (C)
$30,505 (B)
$26,926 (A)
Hypothetical illustration based on past performance. Future performance will vary.The Portfolio’s returns reflect reinvested dividends. The Portfolio’s holdings maydiffer significantly from the securities in the index. The index is unmanaged andtherefore does not reflect the cost of portfolio management and accounting.
The Portfolio’s benchmark was changed from Dow Jones U.S. Select DividendIndex to Russell 1000 Value Index, effective December 7, 2019. The change in thebenchmark was made because the Russell 1000 Value Index better reflects thestyle of the strategy utilized by the current sub-adviser.
The Russell 1000 Value Index measures the performance of the large-cap valuesegment of the U.S. equity universe. It includes those Russell 1000 Indexcompanies with lower price-to-book ratios and lower expected and historicalgrowth rates.
The Dow Jones U.S. Select Dividend Index is comprised of all dividend-payingcompanies in the Dow Jones U.S. Index that have a non-negative historicalfive-year dividend-per-share growth rate, a five-year average dividend toearnings-per-share ratio of less than or equal to 60%, paid dividends in each of theprevious five years, and a three-month average daily trading volume of 200,000shares. Current index components are included in the universe regardless of theirdividend payout ratio or trading volume. The Dow Jones U.S. Index aims toconsistently represent the top 95% of U.S. companies based on float-adjustedmarket capitalization, excluding non common issues and illiquid stocks. The indexpresented includes the effects of reinvested dividends.
Past performance is no guarantee of future results. Redemption of fund sharescould have tax implications unique to each shareholder.
Ohio National Fund, Inc. ON BlackRock Advantage Large Cap Value Portfolio (Unaudited) (Continued)
55 (continued)

Portfolio Composition as of December 31, 2019 (1)
% of Net AssetsCommon Stocks (4) 98.2Money Market Funds and
Other Net Assets 1.8100.0
Top 10 Portfolio Holdings as of December 31, 2019 (1) (2) (3)
% of Net Assets1. Exxon Mobil Corp. 3.12. Berkshire Hathaway, Inc. Class B 3.13. Johnson & Johnson 2.44. JPMorgan Chase & Co. 2.25. AT&T, Inc. 2.16. Pfizer, Inc. 2.07. Verizon Communications, Inc. 1.98. Intel Corp. 1.99. Procter & Gamble Co. / The 1.7
10. Bank of America Corp. 1.7
(1) Composition of Portfolio subject to change.(2) Short-term investments have been excluded from the list of Top 10 Portfolio Holdings.(3) Top 10 Portfolio Holdings is presented at an individual security level. Total investment exposure by issuer may be higher.(4) Sectors (Common Stocks):
% of Net AssetsFinancials 23.9Health Care 13.2Industrials 10.4Communication Services 8.2Energy 7.9Consumer Staples 7.7Information Technology 6.7Consumer Discretionary 6.0Utilities 5.9Real Estate 4.7Materials 3.6
98.2
Ohio National Fund, Inc. ON BlackRock Advantage Large Cap Value Portfolio (Unaudited) (Continued)
56

Common Stocks – 98.2% Shares Value
COMMUNICATION SERVICES – 8.2%Activision Blizzard, Inc. (Entertainment) . . . . . 12,721 $ 755,882AT&T, Inc. (Diversified Telecom. Svs.) . . . . . . . 168,545 6,586,739CenturyLink, Inc. (Diversified Telecom. Svs.). . . 10,442 137,939Cinemark Holdings, Inc. (Entertainment) . . . . . 17,938 607,201Comcast Corp. Class A (Media). . . . . . . . . . . 77,319 3,477,035Discovery, Inc. Class A (Media) . . . . . . . . . . (a) 8,694 284,642Electronic Arts, Inc. (Entertainment). . . . . . . . (a) 1,861 200,076Facebook, Inc. Class A (Interactive Media &
Svs.) . . . . . . . . . . . . . . . . . . . . . . . . . . (a) 704 144,496Interpublic Group of Cos., Inc. / The (Media) . . 19,189 443,266Liberty Global PLC Class A (Media) . . . . . . . . (a) 3,164 71,949Live Nation Entertainment, Inc. (Entertainment). (a) 906 64,752Omnicom Group, Inc. (Media) . . . . . . . . . . . . 1,472 119,261Sirius XM Holdings, Inc. (Media) . . . . . . . . . . 203,994 1,458,557Take-Two Interactive Software, Inc.
(Entertainment) . . . . . . . . . . . . . . . . . . . (a) 4,581 560,852Telephone & Data Systems, Inc. (Wireless
Telecom. Svs.). . . . . . . . . . . . . . . . . . . . 3,413 86,793TripAdvisor, Inc. (Interactive Media & Svs.) . . . 12,223 371,335Twitter, Inc. (Interactive Media & Svs.) . . . . . . (a) 2,073 66,440United States Cellular Corp. (Wireless Telecom.
Svs.) . . . . . . . . . . . . . . . . . . . . . . . . . . (a) 6,452 233,756Verizon Communications, Inc. (Diversified
Telecom. Svs.). . . . . . . . . . . . . . . . . . . . 100,638 6,179,173Vodafone Group PLC – ADR (Wireless Telecom.
Svs.) . . . . . . . . . . . . . . . . . . . . . . . . . . 25,235 487,792Walt Disney Co. / The (Entertainment). . . . . . . 27,808 4,021,871
26,359,807
CONSUMER DISCRETIONARY – 6.0%AutoNation, Inc. (Specialty Retail) . . . . . . . . . (a) 4,344 211,249BorgWarner, Inc. (Auto Components) . . . . . . . 709 30,756Boyd Gaming Corp. (Hotels, Restaurants &
Leisure) . . . . . . . . . . . . . . . . . . . . . . . . 2,221 66,497Carnival Corp. (Hotels, Restaurants & Leisure) . 13,169 669,380Choice Hotels International, Inc. (Hotels,
Restaurants & Leisure) . . . . . . . . . . . . . . 15,625 1,616,094D.R. Horton, Inc. (Household Durables) . . . . . . 25,817 1,361,847Darden Restaurants, Inc. (Hotels, Restaurants
& Leisure) . . . . . . . . . . . . . . . . . . . . . . 1,052 114,678Dollar General Corp. (Multiline Retail). . . . . . . 4,112 641,390Dunkin’ Brands Group, Inc. (Hotels,
Restaurants & Leisure) . . . . . . . . . . . . . . 8,493 641,561Extended Stay America, Inc. (Hotels,
Restaurants & Leisure) . . . . . . . . . . . . . . 22,269 330,917Ford Motor Co. (Automobiles) . . . . . . . . . . . . 144,682 1,345,543Garmin Ltd. (Household Durables) . . . . . . . . . 476 46,439General Motors Co. (Automobiles) . . . . . . . . . 60,501 2,214,337Goodyear Tire & Rubber Co. / The
(Auto Components). . . . . . . . . . . . . . . . . 28,968 450,597H&R Block, Inc. (Diversified Consumer Svs.) . . 39,477 926,920Harley-Davidson, Inc. (Automobiles) . . . . . . . 2,023 75,235Hilton Grand Vacations, Inc. (Hotels,
Restaurants & Leisure) . . . . . . . . . . . . . . (a) 1,551 53,339Home Depot, Inc. / The (Specialty Retail). . . . . 10,280 2,244,946Kohl’s Corp. (Multiline Retail) . . . . . . . . . . . . 3,308 168,543Lennar Corp. Class A (Household Durables) . . . 881 49,151McDonald’s Corp. (Hotels, Restaurants &
Leisure) . . . . . . . . . . . . . . . . . . . . . . . . 13,591 2,685,717NIKE, Inc. Class B (Textiles, Apparel & Luxury
Goods) . . . . . . . . . . . . . . . . . . . . . . . . 3,985 403,720Penn National Gaming, Inc. (Hotels,
Restaurants & Leisure) . . . . . . . . . . . . . . (a) 19,346 494,484Pool Corp. (Distributors) . . . . . . . . . . . . . . . 241 51,184Qurate Retail, Inc. (Internet & Direct Marketing
Retail) . . . . . . . . . . . . . . . . . . . . . . . . . (a) 27,220 229,465Ralph Lauren Corp. (Textiles, Apparel & Luxury
Goods) . . . . . . . . . . . . . . . . . . . . . . . . 337 39,503Target Corp. (Multiline Retail) . . . . . . . . . . . . 9,881 1,266,843
Common Stocks (Continued) Shares Value
CONSUMER DISCRETIONARY (continued)Texas Roadhouse, Inc. (Hotels, Restaurants &
Leisure) . . . . . . . . . . . . . . . . . . . . . . . . 2,559 $ 144,123Thor Industries, Inc. (Automobiles) . . . . . . . . 419 31,127Whirlpool Corp. (Household Durables) . . . . . . 1,965 289,896Wyndham Destinations, Inc. (Hotels,
Restaurants & Leisure) . . . . . . . . . . . . . . 3,837 198,33519,093,816
CONSUMER STAPLES – 7.7%Altria Group, Inc. (Tobacco) . . . . . . . . . . . . . 21,873 1,091,681Church & Dwight Co., Inc.
(Household Products) . . . . . . . . . . . . . . . 1,202 84,549Coca-Cola Co. / The (Beverages). . . . . . . . . . 21,942 1,214,490Coca-Cola European Partners PLC
(Beverages) . . . . . . . . . . . . . . . . . . . . . 2,414 122,824Costco Wholesale Corp. (Food & Staples
Retailing) . . . . . . . . . . . . . . . . . . . . . . . 11,502 3,380,668Estee Lauder Cos., Inc. / The Class A
(Personal Products) . . . . . . . . . . . . . . . . 11,230 2,319,444Hershey Co. / The (Food Products). . . . . . . . . 21,633 3,179,618Hormel Foods Corp. (Food Products) . . . . . . . 13,478 607,993J.M. Smucker Co. / The (Food Products) . . . . . 4,685 487,849Kimberly-Clark Corp. (Household Products) . . . 1,098 151,030Kraft Heinz Co. / The (Food Products) . . . . . . . 1,595 51,247Lancaster Colony Corp. (Food Products) . . . . . 279 44,668McCormick & Co., Inc. (Food Products). . . . . . 3,666 622,230Molson Coors Brewing Co. Class B
(Beverages) . . . . . . . . . . . . . . . . . . . . . 22,146 1,193,669PepsiCo, Inc. (Beverages) . . . . . . . . . . . . . . 8,088 1,105,387Philip Morris International, Inc. (Tobacco) . . . . 25,231 2,146,906Procter & Gamble Co. / The
(Household Products) . . . . . . . . . . . . . . . 44,845 5,601,141Walmart, Inc. (Food & Staples Retailing) . . . . . 10,454 1,242,353
24,647,747
ENERGY – 7.9%Chevron Corp. (Oil, Gas & Consumable Fuels) . . 22,528 2,714,849ConocoPhillips (Oil, Gas & Consumable Fuels) . 12,346 802,860Continental Resources, Inc. (Oil, Gas &
Consumable Fuels) . . . . . . . . . . . . . . . . . 21,163 725,891Devon Energy Corp. (Oil, Gas & Consumable
Fuels) . . . . . . . . . . . . . . . . . . . . . . . . . 51,034 1,325,353EOG Resources, Inc. (Oil, Gas & Consumable
Fuels) . . . . . . . . . . . . . . . . . . . . . . . . . 26,938 2,256,327EQT Corp. (Oil, Gas & Consumable Fuels). . . . . 12,698 138,408Exxon Mobil Corp. (Oil, Gas & Consumable
Fuels) . . . . . . . . . . . . . . . . . . . . . . . . . 141,837 9,897,386Halliburton Co. (Energy Equip. & Svs.). . . . . . . 1,272 31,126HollyFrontier Corp. (Oil, Gas & Consumable
Fuels) . . . . . . . . . . . . . . . . . . . . . . . . . 4,378 222,008Marathon Oil Corp. (Oil, Gas & Consumable
Fuels) . . . . . . . . . . . . . . . . . . . . . . . . . 82,718 1,123,311Marathon Petroleum Corp. (Oil, Gas &
Consumable Fuels) . . . . . . . . . . . . . . . . . 34,600 2,084,650National Oilwell Varco, Inc. (Energy Equip. &
Svs.) . . . . . . . . . . . . . . . . . . . . . . . . . . 18,633 466,757Patterson-UTI Energy, Inc. (Energy Equip. &
Svs.) . . . . . . . . . . . . . . . . . . . . . . . . . . 6,488 68,124Phillips 66 (Oil, Gas & Consumable Fuels) . . . . 5,761 641,833Range Resources Corp. (Oil, Gas &
Consumable Fuels) . . . . . . . . . . . . . . . . . 20,565 99,740TechnipFMC PLC (Energy Equip. & Svs.) . . . . . 15,428 330,776Transocean Ltd. (Energy Equip. & Svs.) . . . . . . (a) 50,603 348,149Valero Energy Corp. (Oil, Gas & Consumable
Fuels) . . . . . . . . . . . . . . . . . . . . . . . . . 19,740 1,848,651Williams Cos., Inc. / The (Oil, Gas &
Consumable Fuels) . . . . . . . . . . . . . . . . . 9,730 230,79625,356,995
Ohio National Fund, Inc. ON BlackRock Advantage Large Cap Value Portfolio
Schedule of Investments December 31, 2019
57 (continued)

Common Stocks (Continued) Shares Value
FINANCIALS – 23.9%Affiliated Managers Group, Inc.
(Capital Markets) . . . . . . . . . . . . . . . . . . 11,544 $ 978,239Aflac, Inc. (Insurance) . . . . . . . . . . . . . . . . 18,487 977,962Allstate Corp. / The (Insurance) . . . . . . . . . . 27,144 3,052,343Ally Financial, Inc. (Consumer Finance). . . . . . 39,311 1,201,344American Express Co. (Consumer Finance) . . . 7,974 992,683American National Insurance Co. (Insurance) . 1,915 225,357Arch Capital Group Ltd. (Insurance) . . . . . . . . (a) 6,032 258,713Arthur J. Gallagher & Co. (Insurance) . . . . . . . 9,796 932,873AXA Equitable Holdings, Inc. (Diversified
Financial Svs.). . . . . . . . . . . . . . . . . . . . 11,936 295,774Bank of America Corp. (Banks) . . . . . . . . . . . 151,202 5,325,334Bank of New York Mellon Corp. / The
(Capital Markets) . . . . . . . . . . . . . . . . . . 21,442 1,079,176Bank OZK (Banks) . . . . . . . . . . . . . . . . . . . 3,573 108,994Berkshire Hathaway, Inc. Class B (Diversified
Financial Svs.). . . . . . . . . . . . . . . . . . . . (a) 43,154 9,774,381Brighthouse Financial, Inc. (Insurance). . . . . . (a) 6,136 240,715Capital One Financial Corp.
(Consumer Finance) . . . . . . . . . . . . . . . . 15,166 1,560,733Charles Schwab Corp. / The (Capital Markets) . 16,225 771,661Cincinnati Financial Corp. (Insurance) . . . . . . 3,196 336,059CIT Group, Inc. (Banks) . . . . . . . . . . . . . . . . 32,725 1,493,242Citigroup, Inc. (Banks) . . . . . . . . . . . . . . . . 19,100 1,525,899CME Group, Inc. (Capital Markets). . . . . . . . . 8,603 1,726,794Comerica, Inc. (Banks) . . . . . . . . . . . . . . . . 765 54,889Commerce Bancshares, Inc. (Banks) . . . . . . . 6,045 410,697Cullen / Frost Bankers, Inc. (Banks) . . . . . . . . 11,129 1,088,194East West Bancorp, Inc. (Banks) . . . . . . . . . . 5,582 271,843Essent Group Ltd. (Thrifts & Mortgage
Finance) . . . . . . . . . . . . . . . . . . . . . . . 3,691 191,895Evercore, Inc. Class A (Capital Markets) . . . . . 2,269 169,630FactSet Research Systems, Inc.
(Capital Markets) . . . . . . . . . . . . . . . . . . 4,618 1,239,009Fidelity National Financial, Inc. (Insurance) . . . 2,232 101,221Fifth Third Bancorp (Banks) . . . . . . . . . . . . . 7,572 232,763First American Financial Corp. (Insurance) . . . 18,103 1,055,767First Citizens BancShares, Inc. Class A (Banks). 336 178,823First Horizon National Corp. (Banks) . . . . . . . . 4,076 67,499First Republic Bank (Banks) . . . . . . . . . . . . . 1,038 121,913FirstCash, Inc. (Consumer Finance) . . . . . . . . 741 59,747Globe Life, Inc. (Insurance) . . . . . . . . . . . . . 10,621 1,117,860Hartford Financial Services Group, Inc. / The
(Insurance) . . . . . . . . . . . . . . . . . . . . . 7,567 459,847Intercontinental Exchange, Inc.
(Capital Markets) . . . . . . . . . . . . . . . . . . 27,772 2,570,299Invesco Ltd. (Capital Markets) . . . . . . . . . . . 97,217 1,747,962JPMorgan Chase & Co. (Banks) . . . . . . . . . . 50,367 7,021,160KeyCorp (Banks) . . . . . . . . . . . . . . . . . . . . 23,313 471,855Legg Mason, Inc. (Capital Markets) . . . . . . . . 2,382 85,538Lincoln National Corp. (Insurance). . . . . . . . . 4,745 280,002Loews Corp. (Insurance) . . . . . . . . . . . . . . . 1,182 62,043Markel Corp. (Insurance) . . . . . . . . . . . . . . (a) 535 611,596Marsh & McLennan Cos., Inc. (Insurance). . . . 8,198 913,339Mercury General Corp. (Insurance) . . . . . . . . 2,109 102,772MetLife, Inc. (Insurance) . . . . . . . . . . . . . . . 16,637 847,988MGIC Investment Corp. (Thrifts & Mortgage
Finance) . . . . . . . . . . . . . . . . . . . . . . . 4,993 70,751Morgan Stanley (Capital Markets) . . . . . . . . . 36,084 1,844,614Nasdaq, Inc. (Capital Markets) . . . . . . . . . . . 8,489 909,172PacWest Bancorp (Banks) . . . . . . . . . . . . . 9,012 344,889Pinnacle Financial Partners, Inc. (Banks) . . . . 3,077 196,928PNC Financial Services Group, Inc. / The
(Banks) . . . . . . . . . . . . . . . . . . . . . . . . 9,478 1,512,973Progressive Corp. / The (Insurance) . . . . . . . . 9,936 719,267Prudential Financial, Inc. (Insurance) . . . . . . . 17,552 1,645,325Regions Financial Corp. (Banks) . . . . . . . . . . 120,327 2,064,811Reinsurance Group of America, Inc.
(Insurance) . . . . . . . . . . . . . . . . . . . . . 4,561 743,717
Common Stocks (Continued) Shares Value
FINANCIALS (continued)S&P Global, Inc. (Capital Markets). . . . . . . . . 5,462 $ 1,491,399SEI Investments Co. (Capital Markets) . . . . . . 6,015 393,862SVB Financial Group (Banks) . . . . . . . . . . . . (a) 395 99,161Synchrony Financial (Consumer Finance) . . . . 7,665 276,017T. Rowe Price Group, Inc. (Capital Markets) . . . 1,681 204,813TD Ameritrade Holding Corp. (Capital Markets) . 768 38,170Travelers Cos., Inc. / The (Insurance) . . . . . . . 903 123,666Truist Financial Corp. (Banks) . . . . . . . . . . . . 15,573 877,071U.S. Bancorp (Banks) . . . . . . . . . . . . . . . . . 32,461 1,924,613Unum Group (Insurance) . . . . . . . . . . . . . . . 4,377 127,633Voya Financial, Inc. (Diversified Financial Svs.) . 8,467 516,318W.R. Berkley Corp. (Insurance) . . . . . . . . . . . 3,759 259,747Wells Fargo & Co. (Banks) . . . . . . . . . . . . . . 81,744 4,397,827Willis Towers Watson PLC (Insurance) . . . . . . 2,710 547,257Wintrust Financial Corp. (Banks) . . . . . . . . . . 5,298 375,628Zions Bancorp N.A. (Banks) . . . . . . . . . . . . . 11,925 619,146
76,719,202
HEALTH CARE – 13.2%Abbott Laboratories (Health Care Equip. &
Supplies) . . . . . . . . . . . . . . . . . . . . . . . 17,346 1,506,673AbbVie, Inc. (Biotechnology) . . . . . . . . . . . . 10,061 890,801Alexion Pharmaceuticals, Inc. (Biotechnology) . (a) 2,792 301,955Allergan PLC (Pharmaceuticals) . . . . . . . . . . 4,454 851,471AmerisourceBergen Corp. (Health Care
Providers & Svs.) . . . . . . . . . . . . . . . . . . 1,251 106,360Amgen, Inc. (Biotechnology) . . . . . . . . . . . . 838 202,017Anthem, Inc. (Health Care Providers & Svs.). . . 4,789 1,446,422Biogen, Inc. (Biotechnology) . . . . . . . . . . . . (a) 1,368 405,927Bristol-Myers Squibb Co. (Pharmaceuticals) . . 29,428 1,888,983Centene Corp. (Health Care Providers & Svs.). . (a) 1,186 74,564Cigna Corp. (Health Care Providers & Svs.) . . . 2,502 511,634CVS Health Corp. (Health Care Providers &
Svs.) . . . . . . . . . . . . . . . . . . . . . . . . . . 41,742 3,101,013Danaher Corp. (Health Care Equip. & Supplies) . 3,786 581,075DexCom, Inc. (Health Care Equip. & Supplies). . (a) 1,821 398,325Edwards Lifesciences Corp. (Health Care
Equip. & Supplies) . . . . . . . . . . . . . . . . . (a) 3,903 910,531Gilead Sciences, Inc. (Biotechnology) . . . . . . 75,856 4,929,123HCA Healthcare, Inc. (Health Care Providers &
Svs.) . . . . . . . . . . . . . . . . . . . . . . . . . . 828 122,387Hologic, Inc. (Health Care Equip. & Supplies) . . (a) 8,469 442,166Humana, Inc. (Health Care Providers & Svs.) . . 1,619 593,396IDEXX Laboratories, Inc. (Health Care Equip. &
Supplies) . . . . . . . . . . . . . . . . . . . . . . . (a) 1,170 305,522Incyte Corp. (Biotechnology) . . . . . . . . . . . . (a) 1,593 139,101Johnson & Johnson (Pharmaceuticals). . . . . . 52,755 7,695,372McKesson Corp. (Health Care Providers &
Svs.) . . . . . . . . . . . . . . . . . . . . . . . . . . 7,230 1,000,054Medtronic PLC (Health Care Equip. & Supplies). 19,071 2,163,605Merck & Co., Inc. (Pharmaceuticals) . . . . . . . 7,146 649,929Mylan N.V. (Pharmaceuticals) . . . . . . . . . . . (a) 40,980 823,698Pfizer, Inc. (Pharmaceuticals) . . . . . . . . . . . . 167,098 6,546,900Regeneron Pharmaceuticals, Inc.
(Biotechnology) . . . . . . . . . . . . . . . . . . . (a) 2,260 848,585Stryker Corp. (Health Care Equip. & Supplies) . . 13,032 2,735,938United Therapeutics Corp. (Biotechnology) . . . (a) 1,375 121,110Veeva Systems, Inc. Class A (Health Care
Technology) . . . . . . . . . . . . . . . . . . . . . (a) 520 73,143WellCare Health Plans, Inc. (Health Care
Providers & Svs.) . . . . . . . . . . . . . . . . . . (a) 98 32,36042,400,140
INDUSTRIALS – 10.4%AECOM (Construction & Engineering). . . . . . . (a) 1,368 59,002AGCO Corp. (Machinery) . . . . . . . . . . . . . . . 15,988 1,235,073Allegion PLC (Building Products) . . . . . . . . . . 19,329 2,407,234AMERCO (Road & Rail) . . . . . . . . . . . . . . . . 440 165,361American Airlines Group, Inc. (Airlines) . . . . . 2,844 81,566AMETEK, Inc. (Electrical Equip.) . . . . . . . . . . 1,563 155,894
Ohio National Fund, Inc. ON BlackRock Advantage Large Cap Value Portfolio (Continued)
Schedule of Investments December 31, 2019
58 (continued)

Common Stocks (Continued) Shares Value
INDUSTRIALS (continued)Carlisle Cos., Inc. (Industrial Conglomerates) . . 1,566 $ 253,441Colfax Corp. (Machinery). . . . . . . . . . . . . . . (a) 2,266 82,437Curtiss-Wright Corp. (Aerospace & Defense) . . 1,304 183,721Delta Air Lines, Inc. (Airlines) . . . . . . . . . . . . 12,533 732,930Eaton Corp. PLC (Electrical Equip.). . . . . . . . . 13,181 1,248,504Expeditors International of Washington, Inc.
(Air Freight & Logistics) . . . . . . . . . . . . . . 10,996 857,908Fluor Corp. (Construction & Engineering). . . . . 19,099 360,589GATX Corp. (Trading Companies &
Distributors) . . . . . . . . . . . . . . . . . . . . . 6,975 577,879General Dynamics Corp. (Aerospace &
Defense) . . . . . . . . . . . . . . . . . . . . . . . 2,324 409,837General Electric Co.
(Industrial Conglomerates) . . . . . . . . . . . . 38,928 434,436HEICO Corp. (Aerospace & Defense) . . . . . . . 2,559 292,110Hexcel Corp. (Aerospace & Defense) . . . . . . . 7,780 570,352Honeywell International, Inc.
(Industrial Conglomerates) . . . . . . . . . . . . 11,205 1,983,285Hubbell, Inc. (Electrical Equip.) . . . . . . . . . . . 11,724 1,733,042IDEX Corp. (Machinery) . . . . . . . . . . . . . . . 9,783 1,682,676IHS Markit Ltd. (Professional Svs.). . . . . . . . . (a) 12,372 932,230Ingersoll-Rand PLC (Machinery) . . . . . . . . . . 6,586 875,411Landstar System, Inc. (Road & Rail) . . . . . . . . 5,640 642,227Lockheed Martin Corp. (Aerospace &
Defense) . . . . . . . . . . . . . . . . . . . . . . . 7,103 2,765,766MasTec, Inc. (Construction & Engineering) . . . (a) 4,166 267,291MSC Industrial Direct Co., Inc. Class A (Trading
Companies & Distributors) . . . . . . . . . . . . 764 59,951Old Dominion Freight Line, Inc. (Road & Rail) . . 4,646 881,718Oshkosh Corp. (Machinery) . . . . . . . . . . . . . 3,278 310,263PACCAR, Inc. (Machinery) . . . . . . . . . . . . . . 49,282 3,898,206Parker-Hannifin Corp. (Machinery) . . . . . . . . 214 44,045Raytheon Co. (Aerospace & Defense). . . . . . . 2,321 510,016Robert Half International, Inc.
(Professional Svs.) . . . . . . . . . . . . . . . . . 849 53,614Roper Technologies, Inc.
(Industrial Conglomerates) . . . . . . . . . . . . 3,534 1,251,849Snap-on, Inc. (Machinery) . . . . . . . . . . . . . . 8,797 1,490,212Teledyne Technologies, Inc. (Aerospace &
Defense) . . . . . . . . . . . . . . . . . . . . . . . (a) 3,643 1,262,445United Airlines Holdings, Inc. (Airlines) . . . . . . (a) 13,979 1,231,410United Technologies Corp. (Aerospace &
Defense) . . . . . . . . . . . . . . . . . . . . . . . 3,356 502,595Watsco, Inc. (Trading Companies &
Distributors) . . . . . . . . . . . . . . . . . . . . . 2,229 401,554Xylem, Inc. (Machinery) . . . . . . . . . . . . . . . 3,576 281,753
33,169,833
INFORMATION TECHNOLOGY – 6.7%Applied Materials, Inc. (Semiconductors &
Equip.) . . . . . . . . . . . . . . . . . . . . . . . . 10,718 654,227Automatic Data Processing, Inc. (IT Svs.) . . . . 6,467 1,102,623Avnet, Inc. (Electronic Equip., Instr. & Comp.) . . 16,799 712,949CDW Corp. (Electronic Equip., Instr. & Comp.) . . 9,176 1,310,700Ciena Corp. (Communications Equip.) . . . . . . . (a) 3,420 146,000Cirrus Logic, Inc. (Semiconductors & Equip.) . . (a) 3,517 289,836DXC Technology Co. (IT Svs.) . . . . . . . . . . . . 1,613 60,633Intel Corp. (Semiconductors & Equip.) . . . . . . 102,602 6,140,730Intuit, Inc. (Software) . . . . . . . . . . . . . . . . . 4,411 1,155,373Jack Henry & Associates, Inc. (IT Svs.). . . . . . 7,300 1,063,391Lam Research Corp. (Semiconductors &
Equip.) . . . . . . . . . . . . . . . . . . . . . . . . 5,779 1,689,780Manhattan Associates, Inc. (Software) . . . . . . (a) 2,417 192,756Mastercard, Inc. Class A (IT Svs.) . . . . . . . . . 3,081 919,956Maxim Integrated Products, Inc.
(Semiconductors & Equip.) . . . . . . . . . . . . 2,689 165,400Micron Technology, Inc. (Semiconductors &
Equip.) . . . . . . . . . . . . . . . . . . . . . . . . (a) 33,695 1,812,117Paychex, Inc. (IT Svs.) . . . . . . . . . . . . . . . . 11,500 978,190
Common Stocks (Continued) Shares Value
INFORMATION TECHNOLOGY (continued)Paylocity Holding Corp. (Software) . . . . . . . . (a) 1,061 $ 128,190ServiceNow, Inc. (Software) . . . . . . . . . . . . (a) 3,034 856,559Skyworks Solutions, Inc. (Semiconductors &
Equip.) . . . . . . . . . . . . . . . . . . . . . . . . 6,019 727,577VeriSign, Inc. (IT Svs.) . . . . . . . . . . . . . . . . (a) 4,955 954,729Western Digital Corp. (Tech. Hardware,
Storage & Periph.) . . . . . . . . . . . . . . . . . 7,254 460,41121,522,127
MATERIALS – 3.6%Air Products & Chemicals, Inc. (Chemicals) . . . 2,115 497,004Alcoa Corp. (Metals & Mining) . . . . . . . . . . . (a) 49,145 1,057,109AptarGroup, Inc. (Containers & Packaging) . . . 2,408 278,413Avery Dennison Corp. (Containers &
Packaging). . . . . . . . . . . . . . . . . . . . . . 535 69,989CF Industries Holdings, Inc. (Chemicals) . . . . . 4,543 216,883Corteva, Inc. (Chemicals) . . . . . . . . . . . . . . 20,289 599,743Domtar Corp. (Paper & Forest Products) . . . . . 31,695 1,212,017DuPont de Nemours, Inc. (Chemicals) . . . . . . 3,943 253,140Graphic Packaging Holding Co. (Containers &
Packaging). . . . . . . . . . . . . . . . . . . . . . 4,078 67,899International Paper Co. (Containers &
Packaging). . . . . . . . . . . . . . . . . . . . . . 785 36,149LyondellBasell Industries N.V. Class A
(Chemicals) . . . . . . . . . . . . . . . . . . . . . 32,369 3,058,223Mosaic Co. / The (Chemicals) . . . . . . . . . . . . 48,862 1,057,374Packaging Corp. of America (Containers &
Packaging). . . . . . . . . . . . . . . . . . . . . . 1,625 181,984PPG Industries, Inc. (Chemicals) . . . . . . . . . . 7,446 993,966Reliance Steel & Aluminum Co. (Metals &
Mining) . . . . . . . . . . . . . . . . . . . . . . . . 7,899 945,984Royal Gold, Inc. (Metals & Mining). . . . . . . . . 958 117,115Sherwin-Williams Co. / The (Chemicals) . . . . . 815 475,585Steel Dynamics, Inc. (Metals & Mining) . . . . . 3,168 107,839Valvoline, Inc. (Chemicals). . . . . . . . . . . . . . 4,059 86,903Vulcan Materials Co. (Construction Materials) . 1,771 255,006Westrock Co. (Containers & Packaging) . . . . . 780 33,470
11,601,795
REAL ESTATE – 4.7%Alexandria Real Estate Equities, Inc.
(Equity REIT) . . . . . . . . . . . . . . . . . . . . . 1,968 317,989Camden Property Trust (Equity REIT) . . . . . . . 1,113 118,089CyrusOne, Inc. (Equity REIT). . . . . . . . . . . . . 725 47,437Digital Realty Trust, Inc. (Equity REIT) . . . . . . . 803 96,151Douglas Emmett, Inc. (Equity REIT) . . . . . . . . 3,776 165,766Duke Realty Corp. (Equity REIT). . . . . . . . . . . 7,743 268,450Equity Residential (Equity REIT). . . . . . . . . . . 20,561 1,663,796Essex Property Trust, Inc. (Equity REIT) . . . . . . 953 286,720Host Hotels & Resorts, Inc. (Equity REIT) . . . . . 16,290 302,179Invitation Homes, Inc. (Equity REIT) . . . . . . . . 30,193 904,884Lamar Advertising Co. Class A (Equity REIT) . . . 9,429 841,633National Retail Properties, Inc. (Equity REIT) . . 66,042 3,541,172Park Hotels & Resorts, Inc. (Equity REIT) . . . . . 32,506 840,930Realty Income Corp. (Equity REIT) . . . . . . . . . 16,579 1,220,712RLJ Lodging Trust (Equity REIT). . . . . . . . . . . 40,823 723,384Simon Property Group, Inc. (Equity REIT) . . . . . 219 32,622Ventas, Inc. (Equity REIT) . . . . . . . . . . . . . . 22,013 1,271,031Welltower, Inc. (Equity REIT) . . . . . . . . . . . . 31,355 2,564,212
15,207,157
UTILITIES – 5.9%Ameren Corp. (Multi-Utilities) . . . . . . . . . . . . 41,296 3,171,533American Water Works Co., Inc.
(Water Utilities) . . . . . . . . . . . . . . . . . . . 1,655 203,317Atmos Energy Corp. (Gas Utilities) . . . . . . . . . 14,966 1,674,097CMS Energy Corp. (Multi-Utilities) . . . . . . . . . 15,482 972,889Consolidated Edison, Inc. (Multi-Utilities) . . . . 2,853 258,111DTE Energy Co. (Multi-Utilities) . . . . . . . . . . . 30,744 3,992,723Eversource Energy (Electric Utilities) . . . . . . . 23,637 2,010,800
Ohio National Fund, Inc. ON BlackRock Advantage Large Cap Value Portfolio (Continued)
Schedule of Investments December 31, 2019
59 (continued)

Common Stocks (Continued) Shares Value
UTILITIES (continued)Pinnacle West Capital Corp. (Electric Utilities) . 29,695 $ 2,670,471PNM Resources, Inc. (Electric Utilities). . . . . . 558 28,296PPL Corp. (Electric Utilities) . . . . . . . . . . . . . 32,309 1,159,247Xcel Energy, Inc. (Electric Utilities) . . . . . . . . 43,543 2,764,545
18,906,029Total Common Stocks (Cost $308,096,773) . . . . $314,984,648
Money Market Funds – 1.4% Shares Value
State Street Institutional Liquid Reserves FundInstitutional Class, 1.734% . . . . . . . . . . . . (b) 4,408,144 $ 4,408,585
Total Money Market Funds (Cost $4,408,585) . . . . . . $ 4,408,585Total Investments – 99.6% (Cost $312,505,358) . . . . . . . . (c) $319,393,233Other Assets in Excess of Liabilities – 0.4% . . . . . . . (d) 1,287,828Net Assets – 100.0% $320,681,061
Percentages are stated as a percent of net assets.Abbreviations:
ADR: American Depositary ReceiptsFootnotes:
(a) Non-income producing security.(b) Rate represents the seven-day yield at December 31, 2019.(c) Represents cost for financial reporting purposes, which may differ from cost basis for federal income tax purposes. See also Note 8 of the Notes to Financial
Statements.(d) Includes $235,620 of cash pledged as collateral for the futures contracts outstanding at December 31, 2019. See also the following Schedule of Open Futures
Contracts.
The accompanying notes are an integral part of these financial statements.
Schedule of Open Futures Contracts December 31, 2019
DescriptionNumber ofcontracts Expiration Date
NotionalAmount Value
UnrealizedAppreciation
(Depreciation)
Variation MarginReceivable(Payable)
CME E-mini S&P 500 Index - Long 34 March 20, 2020 $5,404,749 $5,492,870 $88,121 $13,090
The accompanying notes are an integral part of these financial statements.
Ohio National Fund, Inc. ON BlackRock Advantage Large Cap Value Portfolio (Continued)
Schedule of Investments December 31, 2019
60

Objective/Strategy
The ON Federated High Income Bond Portfolio seeks high currentincome by investing, under normal circumstances, at least 80% of its netassets in lower rated corporate debt obligations commonly referred to as“junk bonds”. The Portfolio’s investments are generally rated BB or lowerby Standard & Poor’s or Fitch, or Ba or lower by Moody’s.
Performance as of December 31, 2019
Average Annual returnsOne year 15.29%Five years 5.76%Ten years 7.18%
Past performance does not guarantee future results. The performance dataquoted represents past performance and current returns may be lower or higher.Total return figures include change in share price and reinvestment of dividendsand capital gains. The investment return and principal value will fluctuate so thatan investor’s shares, when redeemed, may be worth more or less than the originalcost. To obtain performance information up to the most recent month end, calltoll-free 1-877-781-6392.
The Portfolio is not open to direct retail investment. Beneficial interest in shares isobtained solely by purchase of variable life insurance policies and variable annuitycontracts. Actual performance results for variable annuity and variable universallife contracts will be lower due to contract charges. Consult your contract forapplicable charges.
Total expense ratio is 0.75% per the Fund’s prospectus dated November 22, 2019.Additional information pertaining to the Portfolio’s expense ratio as ofDecember 31, 2019 can be found in the Portfolio’s Financial Highlights.
Comments from Sub-Adviser
Q. How did the Portfolio perform in comparison to its benchmark duringthe reporting period?
A. For the year ended December 31, 2019, the Portfolio returned 15.29%versus 14.41% for its current benchmark, the ICE BofAML U.S. High YieldConstrained Index, and 14.32% for its former benchmark, the BloombergBarclays U.S. Corporate High Yield 2% Issuer Capped Index.
Effective December 6, 2019, the Portfolio changed its benchmark from theBloomberg Barclays U.S. Corporate High Yield 2% Issuer Capped Indexto the ICE BofAML U.S. High Yield Constrained Index in an effort tominimize index licensing costs while maintaining a benchmark thatclosely reflects the style of the Portfolio’s investment strategy.
Q. Were there specific market conditions, investment strategies, ortechniques that materially affected the Portfolio’s benchmark-relativeperformance during the reporting period?
A. Within the high-yield market, major industry sectors that substantiallyoutperformed the overall benchmark during the year includedconsumer/commercial/lease finance, banking, health facilities, building& construction and auto parts & equipment. Major industry sectors thatsubstantially underperformed the overall benchmark during the reportingperiod included: oil field equipment, energy, telecom satellite, advertisingand managed care. From a credit quality perspective, the “BB”-ratedsector led the way followed by the “B”-rated sector. Given the overallstrong returns for the bond market as a whole, it is somewhat surprisingthat the “CCC”-rated sector was the weakest returning sector in themarket, as credit specific issues negatively impacted returns. (1)
Q. How did sector allocation and security selection each impact thePortfolio’s performance relative to its benchmark? For sector allocation,were there any factors that impacted the benchmark’s performance
more significantly than the Portfolio’s performance? For securityselection, was there anything specific regarding the Portfolio’s strategythat caused deviation from the benchmark?
A. The Portfolio’s security selection during the year was strong,positively impacting relative returns. This was especially true in the oilfield equipment, energy, packaging, metals/mining, cable & satellite TV,building materials and health facilities industries. The Portfolio wasnegatively impacted by security selection in the pharmaceutical healthservices, specialty retail and tech hardware & equipment industries. (1)
The Portfolio was positively affected by its sector allocation during theyear. The Portfolio benefited from its overweight to the strong performinginsurance brokerage, cable & satellite TV, and auto parts and equipmentindustries, and its underweight to the poor performing oil field equipment,energy and telecom satellite industries. The Portfolio was negativelyimpacted by its underweight to the strong performing banking andbuilding & construction industries. Cash holdings also negativelyimpacted performance, given the strong absolute returns for themarket. (1)
Q. Which holdings contributed the most to, and detracted the most from,the Portfolio’s benchmark-relative performance?
A. Specific high-yield issuers held by the Portfolio that positivelyimpacted performance relative to the benchmark included:
Bausch Health Cos., Inc, a global pharmaceutical company, continued togenerate strong free cash flow, allowing it to pay down debt. Thecompany’s performance was driven by its strong eye care business. (1)
Navient Corp., one of the largest servicers of student loans, continued tobenefit from strong cash generation from its loan portfolio, whichenabled the company to pay down debt. In addition, its portfolio creditquality continued to exhibit strength. (1)
Hub International Ltd., one of the largest privately owned property &casualty brokers, benefited from strong organic growth and positivebusiness fundamentals. (1)
Specific high-yield issuers held by the Portfolio that negatively impactedperformance relative to the benchmark included:
Mallinckrodt International Finance SA / Mallinckrodt CB LLC, whichcontinues to suffer from potential opioid related liabilities, disputes withgovernment agencies concerning past reimbursements and cash flowconcentration concerns centered on its Acthar drug. (1)
Team Health Holdings, Inc., a physician staffing company, was negativelyimpacted by disputes over reimbursements with a large insurancecompany customer, as well as concerns over possible surprise billinglegislation. (1)
Party City Holdings, Inc., a wholesaler and retailer of party related goods,was negatively impacted by weak Halloween sales and a shortage ofhelium, which impacted its balloon business. (1)
(1) The Portfolio’s composition is subject to change. Holdings and weightings areas of December 31, 2019.
Ohio National Fund, Inc. ON Federated High Income Bond Portfolio (Unaudited)
61 (continued)

Change in Value of $10,000 Investment
ON Federated High Income Bond Portfolio (A)ICE BofAML U.S. High Yield Constrained Index (B)Bloomberg Barclays U.S. Corporate High Yield 2% Issuer Capped Index (C)
8,000
10,000
12,000
14,000
16,000
18,000
20,000
$22,000
6/1
012
/10 6
/1112
/11 6
/1212
/12 6
/1312
/13 6
/1412
/14 6
/1512
/15 6
/1612
/16 6
/1712
/17 6
/1812
/18 6
/19
12/3
1/09
12/1
9
$20,710 (C)$20,580 (B)$20,012 (A)
Hypothetical illustration based on past performance. Future performance will vary.All returns reflect reinvested dividends. The Portfolio’s holdings may differsignificantly from the securities in the index. The index is unmanaged andtherefore does not reflect the cost of portfolio management and accounting.
Effective December 7, 2019, the benchmark for the Portfolio was changed from theBloomberg Barclays U.S. Corporate High Yield 2% Issuer Capped Index to the ICEBofAML U.S. High Yield Constrained Index. The change in benchmark was made toto minimize index licensing costs while maintaining a benchmark that closelyreflects the style of the Portfolio’s investment strategy.
The ICE BofAML U.S. High Yield Constrained Index tracks the performance ofbelow investment grade, but not in default, U.S. dollar denominated corporatebonds publicly issued in the U.S. domestic market, and includes issues with acredit rating of BBB or below, as rated by Moody’s and S&P.
The Bloomberg Barclays U.S. Corporate High Yield 2% Issuer Capped Index is the2% Issuer Cap component of the Bloomberg Barclays U.S. Corporate High YieldBond Index. The Bloomberg Barclays U.S. Corporate High Yield Bond Index is anunmanaged index that includes all fixed income securities having a maximumquality rating of Ba1/BB+/BB+, a minimum amount outstanding of $150 million, anda least 1 year to maturity. The 2% Issuer Cap component limits the exposure ofeach issuer to 2% of the total market value and distributes any excess market valueindex–wide on a pro–rata basis. The index is presented on a total return basis.
Past performance is no guarantee of future results. Redemption of fund sharescould have tax implications unique to each shareholder.
Portfolio Composition as of December 31, 2019 (1)
% of Net AssetsCorporate Bonds (4) 94.9Common Stocks (4) 0.1Money Market Funds and
Other Net Assets 5.0100.0
Top 10 Portfolio Holdings as of December 31, 2019 (1) (2) (3)
% of Net Assets1. HUB International Ltd.
7.000%, 05/01/20261.1
2. CCO Holdings LLC / CCO Holdings CapitalCorp.4.750%, 03/01/2030
1.1
3. Jaguar Holding Co. II / PharmaceuticalProduct Development LLC6.375%, 08/01/2023
0.9
4. Sprint Corp.7.625%, 02/15/2025
0.9
5. Altice France SA7.375%, 05/01/2026
0.8
6. 1011778 B.C. ULC / New Red Finance, Inc.5.000%, 10/15/2025
0.8
7. Tempo Acquisition LLC / TempoAcquisition Finance Corp.6.750%, 06/01/2025
0.8
8. Mauser Packaging Solutions Holding Co.7.250%, 04/15/2025
0.7
9. Park Aerospace Holdings Ltd.5.500%, 02/15/2024
0.7
10. Allied Universal Holdco LLC / AlliedUniversal Finance Corp.9.750%, 07/15/2027
0.7
(1) Composition of Portfolio subject to change.(2) Short-term investments have been excluded from the list of Top 10 Portfolio Holdings.(3) Top 10 Portfolio Holdings is presented at an individual security level. Total investment exposure by issuer may be higher.(4) Sectors (Common Stocks, Corporate Bonds):
% of Net AssetsCommunication Services 18.0Health Care 15.1Energy 12.7Consumer Discretionary 11.5Materials 9.5Industrials 9.2Financials 6.9Information Technology 5.0Utilities 3.9Consumer Staples 2.9Real Estate 0.3
95.0
Ohio National Fund, Inc. ON Federated High Income Bond Portfolio (Unaudited) (Continued)
62

Corporate Bonds – 94.9% Rate Maturity Face Amount Value
COMMUNICATION SERVICES – 18.0%Acosta, Inc. (Acquired 09/15/2014 through 06/25/2015, Cost $1,087,224) (Media) . . . . . . . . . (a)(b) 7.750% 10/01/2022 $1,075,000 $ 53,750Altice France SA (Diversified Telecom. Svs.). . . . . . . . . . . . . . . . . . . . . . . . . . . . . . . (a) 7.375% 05/01/2026 1,550,000 1,664,142Altice France SA (Diversified Telecom. Svs.). . . . . . . . . . . . . . . . . . . . . . . . . . . . . . . (a) 8.125% 02/01/2027 200,000 225,250Altice Luxembourg SA (Wireless Telecom. Svs.) . . . . . . . . . . . . . . . . . . . . . . . . . . . . (a) 7.625% 02/15/2025 500,000 520,000AMC Networks, Inc. (Media) . . . . . . . . . . . . . . . . . . . . . . . . . . . . . . . . . . . . . . . . 5.000% 04/01/2024 600,000 612,000AMC Networks, Inc. (Media) . . . . . . . . . . . . . . . . . . . . . . . . . . . . . . . . . . . . . . . . 4.750% 08/01/2025 225,000 225,844CCO Holdings LLC / CCO Holdings Capital Corp. (Media) . . . . . . . . . . . . . . . . . . . . . . . 5.125% 02/15/2023 150,000 151,500CCO Holdings LLC / CCO Holdings Capital Corp. (Media) . . . . . . . . . . . . . . . . . . . . . . . 5.750% 09/01/2023 225,000 229,219CCO Holdings LLC / CCO Holdings Capital Corp. (Media) . . . . . . . . . . . . . . . . . . . . . . . 5.750% 01/15/2024 349,000 355,108CCO Holdings LLC / CCO Holdings Capital Corp. (Media) . . . . . . . . . . . . . . . . . . . . . . . (a) 5.875% 05/01/2027 400,000 423,000CCO Holdings LLC / CCO Holdings Capital Corp. (Media) . . . . . . . . . . . . . . . . . . . . . . . (a) 5.000% 02/01/2028 650,000 682,058CCO Holdings LLC / CCO Holdings Capital Corp. (Media) . . . . . . . . . . . . . . . . . . . . . . . (a) 5.375% 06/01/2029 175,000 186,813CCO Holdings LLC / CCO Holdings Capital Corp. (Media) . . . . . . . . . . . . . . . . . . . . . . . (a) 4.750% 03/01/2030 2,075,000 2,116,562CSC Holdings LLC (Media) . . . . . . . . . . . . . . . . . . . . . . . . . . . . . . . . . . . . . . . . . . (a) 5.375% 07/15/2023 375,000 384,375CSC Holdings LLC (Media) . . . . . . . . . . . . . . . . . . . . . . . . . . . . . . . . . . . . . . . . . . 5.250% 06/01/2024 825,000 888,937CSC Holdings LLC (Media) . . . . . . . . . . . . . . . . . . . . . . . . . . . . . . . . . . . . . . . . . . (a) 7.750% 07/15/2025 525,000 559,760CSC Holdings LLC (Media) . . . . . . . . . . . . . . . . . . . . . . . . . . . . . . . . . . . . . . . . . . (a) 6.625% 10/15/2025 300,000 318,375CSC Holdings LLC (Media) . . . . . . . . . . . . . . . . . . . . . . . . . . . . . . . . . . . . . . . . . . (a) 5.500% 04/15/2027 1,100,000 1,181,235CSC Holdings LLC (Media) . . . . . . . . . . . . . . . . . . . . . . . . . . . . . . . . . . . . . . . . . . (a) 7.500% 04/01/2028 550,000 621,500CSC Holdings LLC (Media) . . . . . . . . . . . . . . . . . . . . . . . . . . . . . . . . . . . . . . . . . . (a) 5.750% 01/15/2030 200,000 213,500Cumulus Media New Holdings, Inc. (Media) . . . . . . . . . . . . . . . . . . . . . . . . . . . . . . . (a) 6.750% 07/01/2026 200,000 214,250Diamond Sports Group LLC / Diamond Sports Finance Co. (Media) . . . . . . . . . . . . . . . . . (a) 5.375% 08/15/2026 400,000 404,621Diamond Sports Group LLC / Diamond Sports Finance Co. (Media) . . . . . . . . . . . . . . . . . (a) 6.625% 08/15/2027 600,000 583,500DISH DBS Corp. (Media) . . . . . . . . . . . . . . . . . . . . . . . . . . . . . . . . . . . . . . . . . . . 5.875% 11/15/2024 400,000 408,750DISH DBS Corp. (Media) . . . . . . . . . . . . . . . . . . . . . . . . . . . . . . . . . . . . . . . . . . . 7.750% 07/01/2026 825,000 873,997Entercom Media Corp. (Media) . . . . . . . . . . . . . . . . . . . . . . . . . . . . . . . . . . . . . . . (a) 7.250% 11/01/2024 575,000 605,188Entercom Media Corp. (Media) . . . . . . . . . . . . . . . . . . . . . . . . . . . . . . . . . . . . . . . (a) 6.500% 05/01/2027 400,000 428,000Gray Television, Inc. (Media) . . . . . . . . . . . . . . . . . . . . . . . . . . . . . . . . . . . . . . . . (a) 5.125% 10/15/2024 250,000 259,375Gray Television, Inc. (Media) . . . . . . . . . . . . . . . . . . . . . . . . . . . . . . . . . . . . . . . . (a) 5.875% 07/15/2026 825,000 877,594iHeartCommunications, Inc. (Media) . . . . . . . . . . . . . . . . . . . . . . . . . . . . . . . . . . . 6.375% 05/01/2026 41,769 45,319iHeartCommunications, Inc. (Media) . . . . . . . . . . . . . . . . . . . . . . . . . . . . . . . . . . . 8.375% 05/01/2027 1,025,707 1,133,406iHeartCommunications, Inc. (Media) . . . . . . . . . . . . . . . . . . . . . . . . . . . . . . . . . . . (a) 5.250% 08/15/2027 200,000 209,260iHeartCommunications, Inc. (Media) . . . . . . . . . . . . . . . . . . . . . . . . . . . . . . . . . . . (a) 4.750% 01/15/2028 100,000 102,500Intelsat Jackson Holdings SA (Diversified Telecom. Svs.). . . . . . . . . . . . . . . . . . . . . . . 5.500% 08/01/2023 400,000 343,616Intelsat Jackson Holdings SA (Diversified Telecom. Svs.). . . . . . . . . . . . . . . . . . . . . . . (a) 8.500% 10/15/2024 350,000 318,791Intelsat Jackson Holdings SA (Diversified Telecom. Svs.). . . . . . . . . . . . . . . . . . . . . . . (a) 9.750% 07/15/2025 350,000 323,750Live Nation Entertainment, Inc. (Entertainment). . . . . . . . . . . . . . . . . . . . . . . . . . . . . (a) 4.750% 10/15/2027 125,000 129,375Match Group, Inc. (Interactive Media & Svs.) . . . . . . . . . . . . . . . . . . . . . . . . . . . . . . (a) 5.000% 12/15/2027 675,000 703,688Nexstar Broadcasting, Inc. (Media) . . . . . . . . . . . . . . . . . . . . . . . . . . . . . . . . . . . . (a) 5.625% 08/01/2024 1,025,000 1,068,562Nexstar Broadcasting, Inc. (Media) . . . . . . . . . . . . . . . . . . . . . . . . . . . . . . . . . . . . (a) 5.625% 07/15/2027 300,000 316,140Rackspace Hosting, Inc. (Interactive Media & Svs.) . . . . . . . . . . . . . . . . . . . . . . . . . . (a) 8.625% 11/15/2024 950,000 928,625Scripps Escrow, Inc. (Media) . . . . . . . . . . . . . . . . . . . . . . . . . . . . . . . . . . . . . . . . (a) 5.875% 07/15/2027 400,000 419,000Sinclair Television Group, Inc. (Media) . . . . . . . . . . . . . . . . . . . . . . . . . . . . . . . . . . (a) 5.625% 08/01/2024 700,000 720,125Sinclair Television Group, Inc. (Media) . . . . . . . . . . . . . . . . . . . . . . . . . . . . . . . . . . (a) 5.875% 03/15/2026 400,000 420,500Sinclair Television Group, Inc. (Media) . . . . . . . . . . . . . . . . . . . . . . . . . . . . . . . . . . (a) 5.125% 02/15/2027 250,000 256,875Sirius XM Radio, Inc. (Media) . . . . . . . . . . . . . . . . . . . . . . . . . . . . . . . . . . . . . . . . (a) 4.625% 05/15/2023 425,000 431,375Sirius XM Radio, Inc. (Media) . . . . . . . . . . . . . . . . . . . . . . . . . . . . . . . . . . . . . . . . (a) 4.625% 07/15/2024 125,000 131,250Sirius XM Radio, Inc. (Media) . . . . . . . . . . . . . . . . . . . . . . . . . . . . . . . . . . . . . . . . (a) 5.375% 04/15/2025 75,000 77,496Sirius XM Radio, Inc. (Media) . . . . . . . . . . . . . . . . . . . . . . . . . . . . . . . . . . . . . . . . (a) 5.375% 07/15/2026 725,000 770,086Sirius XM Radio, Inc. (Media) . . . . . . . . . . . . . . . . . . . . . . . . . . . . . . . . . . . . . . . . (a) 5.000% 08/01/2027 250,000 263,750Sprint Capital Corp. (Wireless Telecom. Svs.) . . . . . . . . . . . . . . . . . . . . . . . . . . . . . . 6.875% 11/15/2028 850,000 915,875Sprint Corp. (Wireless Telecom. Svs.) . . . . . . . . . . . . . . . . . . . . . . . . . . . . . . . . . . . 7.625% 02/15/2025 1,550,000 1,700,892Sprint Corp. (Wireless Telecom. Svs.) . . . . . . . . . . . . . . . . . . . . . . . . . . . . . . . . . . . 7.625% 03/01/2026 325,000 358,410TEGNA, Inc. (Media) . . . . . . . . . . . . . . . . . . . . . . . . . . . . . . . . . . . . . . . . . . . . . 6.375% 10/15/2023 475,000 489,250TEGNA, Inc. (Media) . . . . . . . . . . . . . . . . . . . . . . . . . . . . . . . . . . . . . . . . . . . . . (a) 5.000% 09/15/2029 550,000 559,625Telenet Finance Luxembourg Notes SARL (Media) . . . . . . . . . . . . . . . . . . . . . . . . . . . (a) 5.500% 03/01/2028 1,000,000 1,067,500Terrier Media Buyer, Inc. (Media) . . . . . . . . . . . . . . . . . . . . . . . . . . . . . . . . . . . . . (a) 8.875% 12/15/2027 675,000 713,812T-Mobile U.S.A., Inc. (Wireless Telecom. Svs.) . . . . . . . . . . . . . . . . . . . . . . . . . . . . . 6.500% 01/15/2024 325,000 334,350T-Mobile U.S.A., Inc. (Wireless Telecom. Svs.) . . . . . . . . . . . . . . . . . . . . . . . . . . . . . 6.375% 03/01/2025 125,000 129,166T-Mobile U.S.A., Inc. (Wireless Telecom. Svs.) . . . . . . . . . . . . . . . . . . . . . . . . . . . . . 5.125% 04/15/2025 675,000 698,267T-Mobile U.S.A., Inc. (Wireless Telecom. Svs.) . . . . . . . . . . . . . . . . . . . . . . . . . . . . . 6.500% 01/15/2026 325,000 348,468T-Mobile U.S.A., Inc. (Wireless Telecom. Svs.) . . . . . . . . . . . . . . . . . . . . . . . . . . . . . 5.375% 04/15/2027 200,000 213,000Virgin Media Finance PLC (Media) . . . . . . . . . . . . . . . . . . . . . . . . . . . . . . . . . . . . . (a) 6.000% 10/15/2024 800,000 824,000Virgin Media Finance PLC (Media) . . . . . . . . . . . . . . . . . . . . . . . . . . . . . . . . . . . . . (a) 5.750% 01/15/2025 600,000 617,250Ziggo B.V. (Diversified Telecom. Svs.) . . . . . . . . . . . . . . . . . . . . . . . . . . . . . . . . . . . (a) 5.500% 01/15/2027 600,000 637,500Ziggo Bond Co. B.V. (Diversified Telecom. Svs.) . . . . . . . . . . . . . . . . . . . . . . . . . . . . . (a) 6.000% 01/15/2027 775,000 817,625
35,806,682
CONSUMER DISCRETIONARY – 11.5%1011778 B.C. ULC / New Red Finance, Inc. (Hotels, Restaurants & Leisure) . . . . . . . . . . . . (a) 5.000% 10/15/2025 1,550,000 1,600,3751011778 B.C. ULC / New Red Finance, Inc. (Hotels, Restaurants & Leisure) . . . . . . . . . . . . (a) 4.375% 01/15/2028 150,000 150,375
Ohio National Fund, Inc. ON Federated High Income Bond Portfolio
Schedule of Investments December 31, 2019
63 (continued)

Corporate Bonds (Continued) Rate Maturity Face Amount Value
CONSUMER DISCRETIONARY (continued)Adient Global Holdings Ltd. (Auto Components). . . . . . . . . . . . . . . . . . . . . . . . . . . . . (a) 4.875% 08/15/2026 $ 825,000 $ 736,312American Axle & Manufacturing, Inc. (Auto Components) . . . . . . . . . . . . . . . . . . . . . . 6.500% 04/01/2027 750,000 778,125Aramark Services, Inc. (Hotels, Restaurants & Leisure). . . . . . . . . . . . . . . . . . . . . . . . 5.125% 01/15/2024 175,000 179,585Aramark Services, Inc. (Hotels, Restaurants & Leisure). . . . . . . . . . . . . . . . . . . . . . . . (a) 5.000% 04/01/2025 175,000 182,438Aramark Services, Inc. (Hotels, Restaurants & Leisure). . . . . . . . . . . . . . . . . . . . . . . . 4.750% 06/01/2026 375,000 390,000Aramark Services, Inc. (Hotels, Restaurants & Leisure). . . . . . . . . . . . . . . . . . . . . . . . (a) 5.000% 02/01/2028 575,000 605,906Boyd Gaming Corp. (Hotels, Restaurants & Leisure) . . . . . . . . . . . . . . . . . . . . . . . . . . 6.375% 04/01/2026 525,000 564,867Boyd Gaming Corp. (Hotels, Restaurants & Leisure) . . . . . . . . . . . . . . . . . . . . . . . . . . 6.000% 08/15/2026 100,000 107,375Boyd Gaming Corp. (Hotels, Restaurants & Leisure) . . . . . . . . . . . . . . . . . . . . . . . . . . (a) 4.750% 12/01/2027 75,000 77,906Caesars Resort Collection LLC / CRC Finco, Inc. (Hotels, Restaurants & Leisure) . . . . . . . . (a) 5.250% 10/15/2025 650,000 671,937Dana Financing Luxembourg SARL (Auto Components) . . . . . . . . . . . . . . . . . . . . . . . . (a) 6.500% 06/01/2026 725,000 774,844Dana, Inc. (Auto Components) . . . . . . . . . . . . . . . . . . . . . . . . . . . . . . . . . . . . . . . 5.375% 11/15/2027 100,000 103,000Eldorado Resorts, Inc. (Hotels, Restaurants & Leisure) . . . . . . . . . . . . . . . . . . . . . . . . 6.000% 04/01/2025 500,000 526,250Eldorado Resorts, Inc. (Hotels, Restaurants & Leisure) . . . . . . . . . . . . . . . . . . . . . . . . 6.000% 09/15/2026 200,000 220,250Gates Global LLC / Gates Corp. (Auto Components) . . . . . . . . . . . . . . . . . . . . . . . . . . (a) 6.250% 01/15/2026 800,000 813,768Goodyear Tire & Rubber Co. / The (Auto Components). . . . . . . . . . . . . . . . . . . . . . . . . 5.125% 11/15/2023 50,000 50,856Goodyear Tire & Rubber Co. / The (Auto Components). . . . . . . . . . . . . . . . . . . . . . . . . 5.000% 05/31/2026 375,000 390,000Goodyear Tire & Rubber Co. / The (Auto Components). . . . . . . . . . . . . . . . . . . . . . . . . 4.875% 03/15/2027 300,000 310,500GW B-CR Security Corp. (Diversified Consumer Svs.) . . . . . . . . . . . . . . . . . . . . . . . . . (a) 9.500% 11/01/2027 953,000 1,017,327Hanesbrands, Inc. (Textiles, Apparel & Luxury Goods) . . . . . . . . . . . . . . . . . . . . . . . . (a) 4.875% 05/15/2026 275,000 291,156Hilton Domestic Operating Co., Inc. (Hotels, Restaurants & Leisure) . . . . . . . . . . . . . . . . 5.125% 05/01/2026 525,000 552,562Hilton Domestic Operating Co., Inc. (Hotels, Restaurants & Leisure) . . . . . . . . . . . . . . . . 4.875% 01/15/2030 150,000 158,911IHO Verwaltungs GmbH (Auto Components) . . . . . . . . . . . . . . . . . . . . . . . . . . . . . . . (a)(c) 4.750%, 5.500% PIK 09/15/2026 675,000 688,500IHO Verwaltungs GmbH (Auto Components) . . . . . . . . . . . . . . . . . . . . . . . . . . . . . . . (a)(c) 6.000%, 6.750% PIK 05/15/2027 400,000 424,000J.B. Poindexter & Co., Inc. (Auto Components) . . . . . . . . . . . . . . . . . . . . . . . . . . . . . (a) 7.125% 04/15/2026 475,000 501,125KFC Holding Co. / Pizza Hut Holdings LLC / Taco Bell of America LLC (Hotels, Restaurants &
Leisure) . . . . . . . . . . . . . . . . . . . . . . . . . . . . . . . . . . . . . . . . . . . . . . . . . . . . (a) 5.250% 06/01/2026 300,000 316,500KFC Holding Co. / Pizza Hut Holdings LLC / Taco Bell of America LLC (Hotels, Restaurants &
Leisure) . . . . . . . . . . . . . . . . . . . . . . . . . . . . . . . . . . . . . . . . . . . . . . . . . . . . (a) 4.750% 06/01/2027 525,000 552,562MGM Resorts International (Hotels, Restaurants & Leisure) . . . . . . . . . . . . . . . . . . . . . 5.750% 06/15/2025 500,000 560,000MGM Resorts International (Hotels, Restaurants & Leisure) . . . . . . . . . . . . . . . . . . . . . 4.625% 09/01/2026 1,075,000 1,139,500Michaels Stores, Inc. (Specialty Retail) . . . . . . . . . . . . . . . . . . . . . . . . . . . . . . . . . . (a) 8.000% 07/15/2027 400,000 382,000Mohegan Gaming & Entertainment (Hotels, Restaurants & Leisure) . . . . . . . . . . . . . . . . (a) 7.875% 10/15/2024 700,000 714,000Panther BF Aggregator 2 LP / Panther Finance Co., Inc. (Auto Components) . . . . . . . . . . . (a) 6.250% 05/15/2026 125,000 134,688Panther BF Aggregator 2 LP / Panther Finance Co., Inc. (Auto Components) . . . . . . . . . . . (a) 8.500% 05/15/2027 1,300,000 1,381,250Party City Holdings, Inc. (Specialty Retail) . . . . . . . . . . . . . . . . . . . . . . . . . . . . . . . . (a) 6.125% 08/15/2023 625,000 546,875Party City Holdings, Inc. (Specialty Retail) . . . . . . . . . . . . . . . . . . . . . . . . . . . . . . . . (a) 6.625% 08/01/2026 600,000 423,000Six Flags Entertainment Corp. (Hotels, Restaurants & Leisure) . . . . . . . . . . . . . . . . . . . (a) 5.500% 04/15/2027 875,000 932,969Stars Group Holdings B.V. / Stars Group U.S. Co-Borrower LLC (Hotels, Restaurants &
Leisure) . . . . . . . . . . . . . . . . . . . . . . . . . . . . . . . . . . . . . . . . . . . . . . . . . . . . (a) 7.000% 07/15/2026 925,000 1,002,469Station Casinos LLC (Hotels, Restaurants & Leisure). . . . . . . . . . . . . . . . . . . . . . . . . . (a) 5.000% 10/01/2025 725,000 737,687Sugarhouse HSP Gaming Prop. Mezz. LP / Sugarhouse HSP Gaming Finance Corp. (Hotels,
Restaurants & Leisure) . . . . . . . . . . . . . . . . . . . . . . . . . . . . . . . . . . . . . . . . . . (a) 5.875% 05/15/2025 275,000 274,313Viking Cruises Ltd. (Hotels, Restaurants & Leisure). . . . . . . . . . . . . . . . . . . . . . . . . . . (a) 6.250% 05/15/2025 50,000 52,063Viking Cruises Ltd. (Hotels, Restaurants & Leisure). . . . . . . . . . . . . . . . . . . . . . . . . . . (a) 5.875% 09/15/2027 25,000 26,719VOC Escrow Ltd. (Hotels, Restaurants & Leisure) . . . . . . . . . . . . . . . . . . . . . . . . . . . . (a) 5.000% 02/15/2028 325,000 340,437William Carter Co. / The (Textiles, Apparel & Luxury Goods) . . . . . . . . . . . . . . . . . . . . . (a) 5.625% 03/15/2027 75,000 80,625Wyndham Hotels & Resorts, Inc. (Hotels, Restaurants & Leisure). . . . . . . . . . . . . . . . . . (a) 5.375% 04/15/2026 200,000 211,000Yum! Brands, Inc. (Hotels, Restaurants & Leisure) . . . . . . . . . . . . . . . . . . . . . . . . . . . (a) 4.750% 01/15/2030 75,000 78,563
22,755,470
CONSUMER STAPLES – 2.9%Albertsons Cos., Inc. / Safeway, Inc. / New Albertsons LP / Albertsons LLC (Food & Staples
Retailing) . . . . . . . . . . . . . . . . . . . . . . . . . . . . . . . . . . . . . . . . . . . . . . . . . . . 6.625% 06/15/2024 750,000 784,995Albertsons Cos., Inc. / Safeway, Inc. / New Albertsons LP / Albertsons LLC (Food & Staples
Retailing) . . . . . . . . . . . . . . . . . . . . . . . . . . . . . . . . . . . . . . . . . . . . . . . . . . . 5.750% 03/15/2025 825,000 853,875Albertsons Cos., Inc. / Safeway, Inc. / New Albertsons LP / Albertsons LLC (Food & Staples
Retailing) . . . . . . . . . . . . . . . . . . . . . . . . . . . . . . . . . . . . . . . . . . . . . . . . . . . (a) 5.875% 02/15/2028 100,000 106,250B&G Foods, Inc. (Food Products) . . . . . . . . . . . . . . . . . . . . . . . . . . . . . . . . . . . . . . 5.250% 04/01/2025 525,000 539,873Energizer Holdings, Inc. (Household Products) . . . . . . . . . . . . . . . . . . . . . . . . . . . . . (a) 5.500% 06/15/2025 125,000 129,688Energizer Holdings, Inc. (Household Products) . . . . . . . . . . . . . . . . . . . . . . . . . . . . . (a) 6.375% 07/15/2026 100,000 106,500Energizer Holdings, Inc. (Household Products) . . . . . . . . . . . . . . . . . . . . . . . . . . . . . (a) 7.750% 01/15/2027 225,000 251,449Performance Food Group, Inc. (Food & Staples Retailing) . . . . . . . . . . . . . . . . . . . . . . (a) 5.500% 06/01/2024 75,000 76,875Performance Food Group, Inc. (Food & Staples Retailing) . . . . . . . . . . . . . . . . . . . . . . (a) 5.500% 10/15/2027 300,000 320,625Post Holdings, Inc. (Food Products) . . . . . . . . . . . . . . . . . . . . . . . . . . . . . . . . . . . . (a) 5.000% 08/15/2026 1,125,000 1,188,281Post Holdings, Inc. (Food Products) . . . . . . . . . . . . . . . . . . . . . . . . . . . . . . . . . . . . (a) 5.750% 03/01/2027 550,000 589,875U.S. Foods, Inc. (Food & Staples Retailing) . . . . . . . . . . . . . . . . . . . . . . . . . . . . . . . . (a) 5.875% 06/15/2024 825,000 849,750
5,798,036
Ohio National Fund, Inc. ON Federated High Income Bond Portfolio (Continued)
Schedule of Investments December 31, 2019
64 (continued)

Corporate Bonds (Continued) Rate Maturity Face Amount Value
ENERGY – 12.7%Antero Midstream Partners LP / Antero Midstream Finance Corp. (Oil, Gas & Consumable
Fuels) . . . . . . . . . . . . . . . . . . . . . . . . . . . . . . . . . . . . . . . . . . . . . . . . . . . . . 5.375% 09/15/2024 $ 675,000 $ 626,062Antero Midstream Partners LP / Antero Midstream Finance Corp. (Oil, Gas & Consumable
Fuels) . . . . . . . . . . . . . . . . . . . . . . . . . . . . . . . . . . . . . . . . . . . . . . . . . . . . . (a) 5.750% 03/01/2027 175,000 153,891Antero Midstream Partners LP / Antero Midstream Finance Corp. (Oil, Gas & Consumable
Fuels) . . . . . . . . . . . . . . . . . . . . . . . . . . . . . . . . . . . . . . . . . . . . . . . . . . . . . (a) 5.750% 01/15/2028 625,000 543,750Archrock Partners LP / Archrock Partners Finance Corp. (Oil, Gas & Consumable Fuels) . . . (a) 6.875% 04/01/2027 625,000 660,937Archrock Partners LP / Archrock Partners Finance Corp. (Oil, Gas & Consumable Fuels) . . . (a) 6.250% 04/01/2028 125,000 128,750Ascent Resources Utica Holdings LLC / ARU Finance Corp. (Oil, Gas & Consumable Fuels) . . (a) 7.000% 11/01/2026 200,000 159,500Berry Petroleum Co. LLC (Oil, Gas & Consumable Fuels) . . . . . . . . . . . . . . . . . . . . . . . (a) 7.000% 02/15/2026 325,000 301,031Callon Petroleum Co. (Oil, Gas & Consumable Fuels). . . . . . . . . . . . . . . . . . . . . . . . . . 6.125% 10/01/2024 425,000 433,050Callon Petroleum Co. (Oil, Gas & Consumable Fuels). . . . . . . . . . . . . . . . . . . . . . . . . . 6.375% 07/01/2026 225,000 228,286Carrizo Oil & Gas, Inc. (Oil, Gas & Consumable Fuels) . . . . . . . . . . . . . . . . . . . . . . . . . 8.250% 07/15/2025 450,000 460,125Centennial Resource Production LLC (Oil, Gas & Consumable Fuels). . . . . . . . . . . . . . . . (a) 6.875% 04/01/2027 350,000 364,000Cheniere Corpus Christi Holdings LLC (Oil, Gas & Consumable Fuels) . . . . . . . . . . . . . . . 5.875% 03/31/2025 350,000 393,561Cheniere Energy Partners LP (Oil, Gas & Consumable Fuels). . . . . . . . . . . . . . . . . . . . . 5.250% 10/01/2025 900,000 937,881Cheniere Energy Partners LP (Oil, Gas & Consumable Fuels). . . . . . . . . . . . . . . . . . . . . (a) 4.500% 10/01/2029 275,000 282,590Chesapeake Energy Corp. (Oil, Gas & Consumable Fuels) . . . . . . . . . . . . . . . . . . . . . . (a) 11.500% 01/01/2025 752,000 710,640CNX Midstream Partners LP / CNX Midstream Finance Corp. (Oil, Gas & Consumable
Fuels) . . . . . . . . . . . . . . . . . . . . . . . . . . . . . . . . . . . . . . . . . . . . . . . . . . . . . (a) 6.500% 03/15/2026 725,000 668,812CrownRock LP / CrownRock Finance, Inc. (Oil, Gas & Consumable Fuels). . . . . . . . . . . . . (a) 5.625% 10/15/2025 675,000 688,500CVR Refining LLC / Coffeyville Finance, Inc. (Oil, Gas & Consumable Fuels). . . . . . . . . . . . 6.500% 11/01/2022 1,250,000 1,265,625Enviva Partners LP / Enviva Partners Finance Corp. (Oil, Gas & Consumable Fuels). . . . . . . (a) 6.500% 01/15/2026 750,000 802,972EP Energy LLC / Everest Acquisition Finance, Inc. (Acquired 11/17/2016 through 07/27/2018,
Cost $548,719) (Oil, Gas & Consumable Fuels) . . . . . . . . . . . . . . . . . . . . . . . . . . . . (a)(b)(d) 8.000% 11/29/2024 550,000 275,000Gulfport Energy Corp. (Oil, Gas & Consumable Fuels) . . . . . . . . . . . . . . . . . . . . . . . . . 6.000% 10/15/2024 250,000 177,500Gulfport Energy Corp. (Oil, Gas & Consumable Fuels) . . . . . . . . . . . . . . . . . . . . . . . . . 6.375% 05/15/2025 275,000 174,625Gulfport Energy Corp. (Oil, Gas & Consumable Fuels) . . . . . . . . . . . . . . . . . . . . . . . . . 6.375% 01/15/2026 125,000 77,500Hess Midstream Operations LP (Oil, Gas & Consumable Fuels) . . . . . . . . . . . . . . . . . . . (a) 5.125% 06/15/2028 300,000 303,750Holly Energy Partners LP / Holly Energy Finance Corp. (Oil, Gas & Consumable Fuels) . . . . . (a) 6.000% 08/01/2024 1,075,000 1,120,687Jagged Peak Energy LLC (Oil, Gas & Consumable Fuels) . . . . . . . . . . . . . . . . . . . . . . . 5.875% 05/01/2026 350,000 361,368Laredo Petroleum, Inc. (Oil, Gas & Consumable Fuels) . . . . . . . . . . . . . . . . . . . . . . . . 6.250% 03/15/2023 475,000 445,312NuStar Logistics LP (Oil, Gas & Consumable Fuels) . . . . . . . . . . . . . . . . . . . . . . . . . . 5.625% 04/28/2027 875,000 899,062Oasis Petroleum, Inc. (Oil, Gas & Consumable Fuels) . . . . . . . . . . . . . . . . . . . . . . . . . 6.875% 03/15/2022 625,000 601,562Oasis Petroleum, Inc. (Oil, Gas & Consumable Fuels) . . . . . . . . . . . . . . . . . . . . . . . . . (a) 6.250% 05/01/2026 75,000 62,250Parsley Energy LLC / Parsley Finance Corp. (Oil, Gas & Consumable Fuels). . . . . . . . . . . . (a) 5.250% 08/15/2025 75,000 77,063Parsley Energy LLC / Parsley Finance Corp. (Oil, Gas & Consumable Fuels). . . . . . . . . . . . (a) 5.625% 10/15/2027 300,000 317,250PDC Energy, Inc. (Oil, Gas & Consumable Fuels) . . . . . . . . . . . . . . . . . . . . . . . . . . . . 6.125% 09/15/2024 275,000 278,438PDC Energy, Inc. (Oil, Gas & Consumable Fuels) . . . . . . . . . . . . . . . . . . . . . . . . . . . . 5.750% 05/15/2026 200,000 199,500Precision Drilling Corp. (Energy Equip. & Svs.) . . . . . . . . . . . . . . . . . . . . . . . . . . . . . 7.750% 12/15/2023 425,000 423,938Precision Drilling Corp. (Energy Equip. & Svs.) . . . . . . . . . . . . . . . . . . . . . . . . . . . . . (a) 7.125% 01/15/2026 100,000 95,000QEP Resources, Inc. (Oil, Gas & Consumable Fuels) . . . . . . . . . . . . . . . . . . . . . . . . . . 5.250% 05/01/2023 75,000 74,250QEP Resources, Inc. (Oil, Gas & Consumable Fuels) . . . . . . . . . . . . . . . . . . . . . . . . . . 5.625% 03/01/2026 400,000 390,100Range Resources Corp. (Oil, Gas & Consumable Fuels) . . . . . . . . . . . . . . . . . . . . . . . . 4.875% 05/15/2025 600,000 513,000SESI LLC (Energy Equip. & Svs.) . . . . . . . . . . . . . . . . . . . . . . . . . . . . . . . . . . . . . . 7.125% 12/15/2021 175,000 149,258SESI LLC (Energy Equip. & Svs.) . . . . . . . . . . . . . . . . . . . . . . . . . . . . . . . . . . . . . . 7.750% 09/15/2024 1,000,000 665,000Shelf Drilling Holdings Ltd. (Oil, Gas & Consumable Fuels) . . . . . . . . . . . . . . . . . . . . . . (a) 8.250% 02/15/2025 575,000 547,687SM Energy Co. (Oil, Gas & Consumable Fuels). . . . . . . . . . . . . . . . . . . . . . . . . . . . . . 5.000% 01/15/2024 175,000 166,688SM Energy Co. (Oil, Gas & Consumable Fuels). . . . . . . . . . . . . . . . . . . . . . . . . . . . . . 5.625% 06/01/2025 100,000 94,917SM Energy Co. (Oil, Gas & Consumable Fuels). . . . . . . . . . . . . . . . . . . . . . . . . . . . . . 6.750% 09/15/2026 350,000 343,000SM Energy Co. (Oil, Gas & Consumable Fuels). . . . . . . . . . . . . . . . . . . . . . . . . . . . . . 6.625% 01/15/2027 25,000 24,571SRC Energy, Inc. (Oil, Gas & Consumable Fuels) . . . . . . . . . . . . . . . . . . . . . . . . . . . . 6.250% 12/01/2025 425,000 428,188Summit Midstream Holdings LLC / Summit Midstream Finance Corp. (Oil, Gas &
Consumable Fuels) . . . . . . . . . . . . . . . . . . . . . . . . . . . . . . . . . . . . . . . . . . . . . 5.500% 08/15/2022 950,000 845,500Summit Midstream Holdings LLC / Summit Midstream Finance Corp. (Oil, Gas &
Consumable Fuels) . . . . . . . . . . . . . . . . . . . . . . . . . . . . . . . . . . . . . . . . . . . . . 5.750% 04/15/2025 350,000 267,313Sunoco LP / Sunoco Finance Corp. (Oil, Gas & Consumable Fuels) . . . . . . . . . . . . . . . . . 5.500% 02/15/2026 75,000 77,813Sunoco LP / Sunoco Finance Corp. (Oil, Gas & Consumable Fuels) . . . . . . . . . . . . . . . . . 5.875% 03/15/2028 350,000 371,632Targa Resources Partners LP / Targa Resources Partners Finance Corp. (Oil, Gas &
Consumable Fuels) . . . . . . . . . . . . . . . . . . . . . . . . . . . . . . . . . . . . . . . . . . . . . 5.250% 05/01/2023 150,000 151,500Targa Resources Partners LP / Targa Resources Partners Finance Corp. (Oil, Gas &
Consumable Fuels) . . . . . . . . . . . . . . . . . . . . . . . . . . . . . . . . . . . . . . . . . . . . . 5.875% 04/15/2026 150,000 159,375Targa Resources Partners LP / Targa Resources Partners Finance Corp. (Oil, Gas &
Consumable Fuels) . . . . . . . . . . . . . . . . . . . . . . . . . . . . . . . . . . . . . . . . . . . . . 5.375% 02/01/2027 700,000 726,250Targa Resources Partners LP / Targa Resources Partners Finance Corp. (Oil, Gas &
Consumable Fuels) . . . . . . . . . . . . . . . . . . . . . . . . . . . . . . . . . . . . . . . . . . . . . (a) 6.500% 07/15/2027 25,000 27,375Targa Resources Partners LP / Targa Resources Partners Finance Corp. (Oil, Gas &
Consumable Fuels) . . . . . . . . . . . . . . . . . . . . . . . . . . . . . . . . . . . . . . . . . . . . . 5.000% 01/15/2028 700,000 714,000Targa Resources Partners LP / Targa Resources Partners Finance Corp. (Oil, Gas &
Consumable Fuels) . . . . . . . . . . . . . . . . . . . . . . . . . . . . . . . . . . . . . . . . . . . . . (a) 5.500% 03/01/2030 375,000 385,313Tervita Corp. (Energy Equip. & Svs.) . . . . . . . . . . . . . . . . . . . . . . . . . . . . . . . . . . . . (a) 7.625% 12/01/2021 450,000 452,812
Ohio National Fund, Inc. ON Federated High Income Bond Portfolio (Continued)
Schedule of Investments December 31, 2019
65 (continued)

Corporate Bonds (Continued) Rate Maturity Face Amount Value
ENERGY (continued)TransMontaigne Partners LP / TLP Finance Corp. (Oil, Gas & Consumable Fuels) . . . . . . . . 6.125% 02/15/2026 $ 225,000 $ 220,500U.S.A. Compression Partners LP / U.S.A. Compression Finance Corp. (Energy Equip. & Svs.) . 6.875% 04/01/2026 850,000 892,500U.S.A. Compression Partners LP / U.S.A. Compression Finance Corp. (Energy Equip. & Svs.) . 6.875% 09/01/2027 100,000 104,160Ultra Resources, Inc. (Oil, Gas & Consumable Fuels). . . . . . . . . . . . . . . . . . . . . . . . . . (a) 6.875% 04/15/2022 150,000 18,375Ultra Resources, Inc. (Oil, Gas & Consumable Fuels). . . . . . . . . . . . . . . . . . . . . . . . . . (a) 7.125% 04/15/2025 200,000 13,000Whiting Petroleum Corp. (Oil, Gas & Consumable Fuels) . . . . . . . . . . . . . . . . . . . . . . . 6.250% 04/01/2023 425,000 355,938Whiting Petroleum Corp. (Oil, Gas & Consumable Fuels) . . . . . . . . . . . . . . . . . . . . . . . 6.625% 01/15/2026 325,000 221,481WPX Energy, Inc. (Oil, Gas & Consumable Fuels) . . . . . . . . . . . . . . . . . . . . . . . . . . . . 5.250% 10/15/2027 200,000 211,000
25,312,264
FINANCIALS – 6.9%Acrisure LLC / Acrisure Finance, Inc. (Insurance) . . . . . . . . . . . . . . . . . . . . . . . . . . . (a) 8.125% 02/15/2024 150,000 163,125Acrisure LLC / Acrisure Finance, Inc. (Insurance) . . . . . . . . . . . . . . . . . . . . . . . . . . . (a) 7.000% 11/15/2025 800,000 772,000Alliant Holdings Intermediate LLC / Alliant Holdings Co-Issuer (Insurance) . . . . . . . . . . . . (a) 6.750% 10/15/2027 325,000 348,059Ally Financial, Inc. (Consumer Finance) . . . . . . . . . . . . . . . . . . . . . . . . . . . . . . . . . . 5.750% 11/20/2025 400,000 447,500AmWINS Group, Inc. (Insurance) . . . . . . . . . . . . . . . . . . . . . . . . . . . . . . . . . . . . . (a) 7.750% 07/01/2026 950,000 1,049,873Ardonagh Midco 3 PLC (Insurance) . . . . . . . . . . . . . . . . . . . . . . . . . . . . . . . . . . . . (a) 8.625% 07/15/2023 225,000 223,313AssuredPartners, Inc. (Insurance) . . . . . . . . . . . . . . . . . . . . . . . . . . . . . . . . . . . . . (a) 7.000% 08/15/2025 775,000 788,330Atotech Alpha 2 B.V. (Diversified Financial Svs.) . . . . . . . . . . . . . . . . . . . . . . . . . . . . (a)(c) 8.750%, 9.500% PIK 06/01/2023 250,000 255,000Atotech Alpha 3 B.V. / Alpha U.S. Bidco, Inc. (Diversified Financial Svs.) . . . . . . . . . . . . . (a) 6.250% 02/01/2025 675,000 691,875GTCR AP Finance, Inc. (Insurance) . . . . . . . . . . . . . . . . . . . . . . . . . . . . . . . . . . . . (a) 8.000% 05/15/2027 200,000 208,000HUB International Ltd. (Insurance). . . . . . . . . . . . . . . . . . . . . . . . . . . . . . . . . . . . . (a) 7.000% 05/01/2026 2,075,000 2,194,312Navient Corp. (Consumer Finance). . . . . . . . . . . . . . . . . . . . . . . . . . . . . . . . . . . . . 6.125% 03/25/2024 175,000 189,875Navient Corp. (Consumer Finance). . . . . . . . . . . . . . . . . . . . . . . . . . . . . . . . . . . . . 5.875% 10/25/2024 800,000 856,000Navient Corp. (Consumer Finance). . . . . . . . . . . . . . . . . . . . . . . . . . . . . . . . . . . . . 6.750% 06/25/2025 175,000 193,200Navient Corp. (Consumer Finance). . . . . . . . . . . . . . . . . . . . . . . . . . . . . . . . . . . . . 6.750% 06/15/2026 125,000 137,388NFP Corp. (Insurance) . . . . . . . . . . . . . . . . . . . . . . . . . . . . . . . . . . . . . . . . . . . . (a) 6.875% 07/15/2025 975,000 977,437NFP Corp. (Insurance) . . . . . . . . . . . . . . . . . . . . . . . . . . . . . . . . . . . . . . . . . . . . (a) 8.000% 07/15/2025 100,000 102,000Outfront Media Capital LLC / Outfront Media Capital Corp. (Mortgage REIT) . . . . . . . . . . . (a) 4.625% 03/15/2030 75,000 76,313Quicken Loans, Inc. (Thrifts & Mortgage Finance) . . . . . . . . . . . . . . . . . . . . . . . . . . . (a) 5.750% 05/01/2025 1,075,000 1,111,281Quicken Loans, Inc. (Thrifts & Mortgage Finance) . . . . . . . . . . . . . . . . . . . . . . . . . . . (a) 5.250% 01/15/2028 375,000 388,125Refinitiv U.S. Holdings, Inc. (Capital Markets) . . . . . . . . . . . . . . . . . . . . . . . . . . . . . . (a) 6.250% 05/15/2026 200,000 218,250Refinitiv U.S. Holdings, Inc. (Capital Markets) . . . . . . . . . . . . . . . . . . . . . . . . . . . . . . (a) 8.250% 11/15/2026 1,050,000 1,182,562USI, Inc. (Insurance) . . . . . . . . . . . . . . . . . . . . . . . . . . . . . . . . . . . . . . . . . . . . . (a) 6.875% 05/01/2025 1,050,000 1,073,310
13,647,128
HEALTH CARE – 15.1%Acadia Healthcare Co., Inc. (Health Care Providers & Svs.) . . . . . . . . . . . . . . . . . . . . . 5.625% 02/15/2023 750,000 762,187Acadia Healthcare Co., Inc. (Health Care Providers & Svs.) . . . . . . . . . . . . . . . . . . . . . 6.500% 03/01/2024 400,000 414,500Air Medical Group Holdings, Inc. (Health Care Providers & Svs.) . . . . . . . . . . . . . . . . . . (a) 6.375% 05/15/2023 875,000 783,125Avantor, Inc. (Health Care Equip. & Supplies) . . . . . . . . . . . . . . . . . . . . . . . . . . . . . . (a) 6.000% 10/01/2024 125,000 133,279Avantor, Inc. (Health Care Equip. & Supplies) . . . . . . . . . . . . . . . . . . . . . . . . . . . . . . (a) 9.000% 10/01/2025 975,000 1,089,592Bausch Health Americas, Inc. (Pharmaceuticals) . . . . . . . . . . . . . . . . . . . . . . . . . . . (a) 8.500% 01/31/2027 525,000 597,870Bausch Health Cos., Inc. (Pharmaceuticals) . . . . . . . . . . . . . . . . . . . . . . . . . . . . . . . (a) 5.500% 03/01/2023 70,000 70,350Bausch Health Cos., Inc. (Pharmaceuticals) . . . . . . . . . . . . . . . . . . . . . . . . . . . . . . . (a) 5.875% 05/15/2023 275,000 277,406Bausch Health Cos., Inc. (Pharmaceuticals) . . . . . . . . . . . . . . . . . . . . . . . . . . . . . . . (a) 7.000% 03/15/2024 225,000 234,000Bausch Health Cos., Inc. (Pharmaceuticals) . . . . . . . . . . . . . . . . . . . . . . . . . . . . . . . (a) 6.125% 04/15/2025 950,000 981,568Bausch Health Cos., Inc. (Pharmaceuticals) . . . . . . . . . . . . . . . . . . . . . . . . . . . . . . . (a) 5.500% 11/01/2025 200,000 209,000Bausch Health Cos., Inc. (Pharmaceuticals) . . . . . . . . . . . . . . . . . . . . . . . . . . . . . . . (a) 9.000% 12/15/2025 525,000 597,030Bausch Health Cos., Inc. (Pharmaceuticals) . . . . . . . . . . . . . . . . . . . . . . . . . . . . . . . (a) 5.750% 08/15/2027 175,000 189,875Bausch Health Cos., Inc. (Pharmaceuticals) . . . . . . . . . . . . . . . . . . . . . . . . . . . . . . . (a) 5.000% 01/30/2028 225,000 230,938Bausch Health Cos., Inc. (Pharmaceuticals) . . . . . . . . . . . . . . . . . . . . . . . . . . . . . . . (a) 7.250% 05/30/2029 375,000 428,438Centene Corp. (Health Care Providers & Svs.) . . . . . . . . . . . . . . . . . . . . . . . . . . . . . . (a) 4.750% 01/15/2025 325,000 337,587Centene Corp. (Health Care Providers & Svs.) . . . . . . . . . . . . . . . . . . . . . . . . . . . . . . (a) 5.375% 06/01/2026 425,000 451,031Centene Corp. (Health Care Providers & Svs.) . . . . . . . . . . . . . . . . . . . . . . . . . . . . . . (a) 4.250% 12/15/2027 725,000 745,844Centene Corp. (Health Care Providers & Svs.) . . . . . . . . . . . . . . . . . . . . . . . . . . . . . . (a) 4.625% 12/15/2029 875,000 922,119Charles River Laboratories International, Inc. (Life Sciences Tools & Svs.) . . . . . . . . . . . . (a) 5.500% 04/01/2026 225,000 241,875Charles River Laboratories International, Inc. (Life Sciences Tools & Svs.) . . . . . . . . . . . . (a) 4.250% 05/01/2028 75,000 76,406CHS / Community Health Systems, Inc. (Health Care Providers & Svs.) . . . . . . . . . . . . . . 6.250% 03/31/2023 700,000 710,500CHS / Community Health Systems, Inc. (Health Care Providers & Svs.) . . . . . . . . . . . . . . (a) 8.625% 01/15/2024 50,000 53,000CHS / Community Health Systems, Inc. (Health Care Providers & Svs.) . . . . . . . . . . . . . . (a) 8.000% 03/15/2026 200,000 206,000Eagle Holding Co. II LLC (Health Care Providers & Svs.) . . . . . . . . . . . . . . . . . . . . . . . . (a)(c) 7.625%, 8.375% PIK 05/15/2022 50,000 50,787Eagle Holding Co. II LLC (Health Care Providers & Svs.) . . . . . . . . . . . . . . . . . . . . . . . . (a)(c) 7.750%, 8.500% PIK 05/15/2022 350,000 355,383Endo Dac / Endo Finance LLC / Endo Finco, Inc. (Pharmaceuticals). . . . . . . . . . . . . . . . . (a) 6.000% 07/15/2023 200,000 144,500Endo Dac / Endo Finance LLC / Endo Finco, Inc. (Pharmaceuticals). . . . . . . . . . . . . . . . . (a) 6.000% 02/01/2025 1,075,000 724,959Envision Healthcare Corp. (Health Care Providers & Svs.) . . . . . . . . . . . . . . . . . . . . . . (a) 8.750% 10/15/2026 750,000 465,000HCA, Inc. (Health Care Providers & Svs.) . . . . . . . . . . . . . . . . . . . . . . . . . . . . . . . . . 5.875% 05/01/2023 275,000 303,919HCA, Inc. (Health Care Providers & Svs.) . . . . . . . . . . . . . . . . . . . . . . . . . . . . . . . . . 5.000% 03/15/2024 375,000 409,613HCA, Inc. (Health Care Providers & Svs.) . . . . . . . . . . . . . . . . . . . . . . . . . . . . . . . . . 5.375% 02/01/2025 900,000 995,247HCA, Inc. (Health Care Providers & Svs.) . . . . . . . . . . . . . . . . . . . . . . . . . . . . . . . . . 5.875% 02/15/2026 650,000 739,134HCA, Inc. (Health Care Providers & Svs.) . . . . . . . . . . . . . . . . . . . . . . . . . . . . . . . . . 5.375% 09/01/2026 100,000 111,375
Ohio National Fund, Inc. ON Federated High Income Bond Portfolio (Continued)
Schedule of Investments December 31, 2019
66 (continued)

Corporate Bonds (Continued) Rate Maturity Face Amount Value
HEALTH CARE (continued)HCA, Inc. (Health Care Providers & Svs.) . . . . . . . . . . . . . . . . . . . . . . . . . . . . . . . . . 5.625% 09/01/2028 $ 425,000 $ 484,330HCA, Inc. (Health Care Providers & Svs.) . . . . . . . . . . . . . . . . . . . . . . . . . . . . . . . . . 5.875% 02/01/2029 375,000 433,594Hill-Rom Holdings, Inc. (Health Care Equip. & Supplies). . . . . . . . . . . . . . . . . . . . . . . . (a) 4.375% 09/15/2027 75,000 77,156IQVIA, Inc. (Health Care Technology) . . . . . . . . . . . . . . . . . . . . . . . . . . . . . . . . . . . (a) 5.000% 10/15/2026 300,000 316,500IQVIA, Inc. (Life Sciences Tools & Svs.) . . . . . . . . . . . . . . . . . . . . . . . . . . . . . . . . . . (a) 5.000% 05/15/2027 300,000 317,357Jaguar Holding Co. II / Pharmaceutical Product Development LLC (Health Care Providers &
Svs.) . . . . . . . . . . . . . . . . . . . . . . . . . . . . . . . . . . . . . . . . . . . . . . . . . . . . . . (a) 6.375% 08/01/2023 1,750,000 1,806,328Mallinckrodt International Finance SA / Mallinckrodt CB LLC (Pharmaceuticals) . . . . . . . . (a) 5.625% 10/15/2023 1,275,000 484,500Mallinckrodt International Finance SA / Mallinckrodt CB LLC (Pharmaceuticals) . . . . . . . . (a) 5.500% 04/15/2025 400,000 142,000MEDNAX, Inc. (Health Care Providers & Svs.). . . . . . . . . . . . . . . . . . . . . . . . . . . . . . (a) 6.250% 01/15/2027 325,000 333,125MPH Acquisition Holdings LLC (Health Care Providers & Svs.) . . . . . . . . . . . . . . . . . . . (a) 7.125% 06/01/2024 1,425,000 1,378,687Ortho-Clinical Diagnostics, Inc. / Ortho-Clinical Diagnostics SA (Health Care Equip. &
Supplies) . . . . . . . . . . . . . . . . . . . . . . . . . . . . . . . . . . . . . . . . . . . . . . . . . . . (a) 6.625% 05/15/2022 800,000 795,000Polaris Intermediate Corp. (Health Care Providers & Svs.) . . . . . . . . . . . . . . . . . . . . . . (a)(c) 8.500%, 9.250% PIK 12/01/2022 375,000 349,219Prestige Brands, Inc. (Pharmaceuticals) . . . . . . . . . . . . . . . . . . . . . . . . . . . . . . . . . (a) 6.375% 03/01/2024 1,200,000 1,248,000RegionalCare Hospital Partners Holdings, Inc. (Health Care Providers & Svs.). . . . . . . . . . (a) 11.500% 05/01/2024 125,000 134,650RegionalCare Hospital Partners Holdings, Inc. / LifePoint Health, Inc. (Health Care
Providers & Svs.) . . . . . . . . . . . . . . . . . . . . . . . . . . . . . . . . . . . . . . . . . . . . . . (a) 9.750% 12/01/2026 750,000 847,500Surgery Center Holdings, Inc. (Health Care Providers & Svs.) . . . . . . . . . . . . . . . . . . . . (a) 6.750% 07/01/2025 575,000 575,000Team Health Holdings, Inc. (Health Care Providers & Svs.) . . . . . . . . . . . . . . . . . . . . . . (a) 6.375% 02/01/2025 1,725,000 1,151,437Teleflex, Inc. (Health Care Equip. & Supplies) . . . . . . . . . . . . . . . . . . . . . . . . . . . . . . 4.625% 11/15/2027 175,000 185,467Tenet Healthcare Corp. (Health Care Providers & Svs.) . . . . . . . . . . . . . . . . . . . . . . . . 6.750% 06/15/2023 450,000 494,420Tenet Healthcare Corp. (Health Care Providers & Svs.) . . . . . . . . . . . . . . . . . . . . . . . . 4.625% 07/15/2024 125,000 127,969Tenet Healthcare Corp. (Health Care Providers & Svs.) . . . . . . . . . . . . . . . . . . . . . . . . 5.125% 05/01/2025 650,000 669,500Tenet Healthcare Corp. (Health Care Providers & Svs.) . . . . . . . . . . . . . . . . . . . . . . . . 7.000% 08/01/2025 375,000 396,094Tenet Healthcare Corp. (Health Care Providers & Svs.) . . . . . . . . . . . . . . . . . . . . . . . . (a) 4.875% 01/01/2026 300,000 314,220Tenet Healthcare Corp. (Health Care Providers & Svs.) . . . . . . . . . . . . . . . . . . . . . . . . (a) 5.125% 11/01/2027 325,000 343,281Vizient, Inc. (Health Care Providers & Svs.) . . . . . . . . . . . . . . . . . . . . . . . . . . . . . . . (a) 6.250% 05/15/2027 125,000 133,750WellCare Health Plans, Inc. (Health Care Providers & Svs.) . . . . . . . . . . . . . . . . . . . . . (a) 5.375% 08/15/2026 225,000 239,625West Street Merger Sub, Inc. (Life Sciences Tools & Svs.) . . . . . . . . . . . . . . . . . . . . . . (a) 6.375% 09/01/2025 1,075,000 1,072,312
29,894,458
INDUSTRIALS – 9.2%Allied Universal Holdco LLC / Allied Universal Finance Corp. (Commercial Svs. & Supplies) . (a) 6.625% 07/15/2026 150,000 161,205Allied Universal Holdco LLC / Allied Universal Finance Corp. (Commercial Svs. & Supplies) . (a) 9.750% 07/15/2027 1,325,000 1,415,458American Builders & Contractors Supply Co., Inc. (Trading Companies & Distributors) . . . . (a) 5.875% 05/15/2026 975,000 1,035,937American Builders & Contractors Supply Co., Inc. (Trading Companies & Distributors) . . . . (a) 4.000% 01/15/2028 50,000 50,750Amsted Industries, Inc. (Machinery). . . . . . . . . . . . . . . . . . . . . . . . . . . . . . . . . . . . (a) 5.625% 07/01/2027 175,000 185,500Colfax Corp. (Machinery). . . . . . . . . . . . . . . . . . . . . . . . . . . . . . . . . . . . . . . . . . . (a) 6.375% 02/15/2026 125,000 136,250Core & Main LP (Commercial Svs. & Supplies) . . . . . . . . . . . . . . . . . . . . . . . . . . . . . (a) 6.125% 08/15/2025 800,000 830,000Cornerstone Building Brands, Inc. (Building Products) . . . . . . . . . . . . . . . . . . . . . . . . (a) 8.000% 04/15/2026 700,000 729,750Dun & Bradstreet Corp. / The (Professional Svs.) . . . . . . . . . . . . . . . . . . . . . . . . . . . . (a) 6.875% 08/15/2026 225,000 248,344Dun & Bradstreet Corp. / The (Professional Svs.) . . . . . . . . . . . . . . . . . . . . . . . . . . . . (a) 10.250% 02/15/2027 1,025,000 1,178,750Hillman Group, Inc. / The (Building Products) . . . . . . . . . . . . . . . . . . . . . . . . . . . . . . (a) 6.375% 07/15/2022 450,000 418,500IAA, Inc. (Commercial Svs. & Supplies) . . . . . . . . . . . . . . . . . . . . . . . . . . . . . . . . . . (a) 5.500% 06/15/2027 100,000 106,250Nielsen Co. Luxembourg SARL / The (Professional Svs.) . . . . . . . . . . . . . . . . . . . . . . . (a) 5.000% 02/01/2025 125,000 128,750Nielsen Finance LLC / Nielsen Finance Co. (Professional Svs.) . . . . . . . . . . . . . . . . . . . (a) 5.000% 04/15/2022 550,000 552,062Park Aerospace Holdings Ltd. (Trading Companies & Distributors) . . . . . . . . . . . . . . . . . (a) 5.500% 02/15/2024 1,325,000 1,454,731Resideo Funding, Inc. (Building Products) . . . . . . . . . . . . . . . . . . . . . . . . . . . . . . . . (a) 6.125% 11/01/2026 250,000 251,875Sensata Technologies, Inc. (Electrical Equip.) . . . . . . . . . . . . . . . . . . . . . . . . . . . . . . (a) 4.375% 02/15/2030 225,000 229,370Standard Industries Inc. (Building Products) . . . . . . . . . . . . . . . . . . . . . . . . . . . . . . (a) 6.000% 10/15/2025 150,000 157,688Standard Industries Inc. (Building Products) . . . . . . . . . . . . . . . . . . . . . . . . . . . . . . (a) 5.000% 02/15/2027 1,200,000 1,251,000Tempo Acquisition LLC / Tempo Acquisition Finance Corp. (Professional Svs.) . . . . . . . . . . (a) 6.750% 06/01/2025 1,425,000 1,471,312Titan Acquisition Ltd. / Titan Co-Borrower LLC (Machinery) . . . . . . . . . . . . . . . . . . . . . (a) 7.750% 04/15/2026 475,000 470,250TransDigm U.K. Holdings PLC (Aerospace & Defense). . . . . . . . . . . . . . . . . . . . . . . . . 6.875% 05/15/2026 275,000 292,875TransDigm, Inc. (Aerospace & Defense) . . . . . . . . . . . . . . . . . . . . . . . . . . . . . . . . . 6.500% 07/15/2024 500,000 515,675TransDigm, Inc. (Aerospace & Defense) . . . . . . . . . . . . . . . . . . . . . . . . . . . . . . . . . 6.500% 05/15/2025 350,000 364,000TransDigm, Inc. (Aerospace & Defense) . . . . . . . . . . . . . . . . . . . . . . . . . . . . . . . . . (a) 6.250% 03/15/2026 575,000 622,501TransDigm, Inc. (Aerospace & Defense) . . . . . . . . . . . . . . . . . . . . . . . . . . . . . . . . . 6.375% 06/15/2026 850,000 901,518TransDigm, Inc. (Aerospace & Defense) . . . . . . . . . . . . . . . . . . . . . . . . . . . . . . . . . (a) 5.500% 11/15/2027 100,000 101,123Trident TPI Holdings, Inc. (Machinery) . . . . . . . . . . . . . . . . . . . . . . . . . . . . . . . . . . (a) 9.250% 08/01/2024 175,000 176,750Trident TPI Holdings, Inc. (Machinery) . . . . . . . . . . . . . . . . . . . . . . . . . . . . . . . . . . (a) 6.625% 11/01/2025 700,000 630,000United Rentals North America, Inc. (Trading Companies & Distributors). . . . . . . . . . . . . . 5.875% 09/15/2026 100,000 107,275United Rentals North America, Inc. (Trading Companies & Distributors). . . . . . . . . . . . . . 6.500% 12/15/2026 250,000 274,766United Rentals North America, Inc. (Trading Companies & Distributors). . . . . . . . . . . . . . 5.500% 05/15/2027 250,000 267,817United Rentals North America, Inc. (Trading Companies & Distributors). . . . . . . . . . . . . . 3.875% 11/15/2027 100,000 102,095United Rentals North America, Inc. (Trading Companies & Distributors). . . . . . . . . . . . . . 4.875% 01/15/2028 425,000 442,523United Rentals North America, Inc. (Trading Companies & Distributors). . . . . . . . . . . . . . 5.250% 01/15/2030 100,000 107,630WESCO Distribution, Inc. (Trading Companies & Distributors) . . . . . . . . . . . . . . . . . . . . 5.375% 12/15/2021 350,000 350,875WESCO Distribution, Inc. (Trading Companies & Distributors) . . . . . . . . . . . . . . . . . . . . 5.375% 06/15/2024 600,000 622,500
18,343,655
Ohio National Fund, Inc. ON Federated High Income Bond Portfolio (Continued)
Schedule of Investments December 31, 2019
67 (continued)

Corporate Bonds (Continued) Rate Maturity Face Amount Value
INFORMATION TECHNOLOGY – 5.0%Anixter, Inc. (Electronic Equip., Instr. & Comp.) . . . . . . . . . . . . . . . . . . . . . . . . . . . . . 6.000% 12/01/2025 $ 175,000 $ 182,000Banff Merger Sub, Inc. (IT Svs.) . . . . . . . . . . . . . . . . . . . . . . . . . . . . . . . . . . . . . . (a) 9.750% 09/01/2026 675,000 683,437CDW LLC / CDW Finance Corp. (Electronic Equip., Instr. & Comp.) . . . . . . . . . . . . . . . . . 5.500% 12/01/2024 475,000 527,250CDW LLC / CDW Finance Corp. (Electronic Equip., Instr. & Comp.) . . . . . . . . . . . . . . . . . 4.250% 04/01/2028 150,000 157,313Dell International LLC / EMC Corp. (Computers & Peripherals). . . . . . . . . . . . . . . . . . . . (a) 7.125% 06/15/2024 950,000 1,002,250Fair Isaac Corp. (Software) . . . . . . . . . . . . . . . . . . . . . . . . . . . . . . . . . . . . . . . . . (a) 4.000% 06/15/2028 75,000 75,563Gartner, Inc. (IT Svs.) . . . . . . . . . . . . . . . . . . . . . . . . . . . . . . . . . . . . . . . . . . . . . (a) 5.125% 04/01/2025 200,000 208,250Go Daddy Operating Co. LLC / GD Finance Co., Inc. (IT Svs.) . . . . . . . . . . . . . . . . . . . . . (a) 5.250% 12/01/2027 150,000 157,875Infor U.S., Inc. (Software) . . . . . . . . . . . . . . . . . . . . . . . . . . . . . . . . . . . . . . . . . . 6.500% 05/15/2022 1,375,000 1,395,625Informatica LLC (Software) . . . . . . . . . . . . . . . . . . . . . . . . . . . . . . . . . . . . . . . . . (a) 7.125% 07/15/2023 1,100,000 1,116,500NCR Corp. (Tech. Hardware, Storage & Periph.) . . . . . . . . . . . . . . . . . . . . . . . . . . . . 6.375% 12/15/2023 225,000 230,625NCR Corp. (Tech. Hardware, Storage & Periph.) . . . . . . . . . . . . . . . . . . . . . . . . . . . . (a) 5.750% 09/01/2027 275,000 292,875Nuance Communications, Inc. (Software) . . . . . . . . . . . . . . . . . . . . . . . . . . . . . . . . 5.625% 12/15/2026 550,000 586,154Qorvo, Inc. (Semiconductors & Equip.) . . . . . . . . . . . . . . . . . . . . . . . . . . . . . . . . . . (a) 4.375% 10/15/2029 250,000 261,875Riverbed Technology, Inc. (Communications Equip.) . . . . . . . . . . . . . . . . . . . . . . . . . . (a) 8.875% 03/01/2023 175,000 100,625RP Crown Parent LLC (Software) . . . . . . . . . . . . . . . . . . . . . . . . . . . . . . . . . . . . . . (a) 7.375% 10/15/2024 1,075,000 1,116,656Sophia LP / Sophia Finance, Inc. (Software) . . . . . . . . . . . . . . . . . . . . . . . . . . . . . . . (a) 9.000% 09/30/2023 325,000 333,938SS&C Technologies, Inc. (Software) . . . . . . . . . . . . . . . . . . . . . . . . . . . . . . . . . . . . (a) 5.500% 09/30/2027 775,000 827,312TTM Technologies, Inc. (Electronic Equip., Instr. & Comp.) . . . . . . . . . . . . . . . . . . . . . . (a) 5.625% 10/01/2025 400,000 413,500Western Digital Corp. (Tech. Hardware, Storage & Periph.) . . . . . . . . . . . . . . . . . . . . . 4.750% 02/15/2026 250,000 260,625
9,930,248
MATERIALS – 9.4%ARD Finance SA (Containers & Packaging) . . . . . . . . . . . . . . . . . . . . . . . . . . . . . . . (a)(c) 6.500%, 7.250% PIK 06/30/2027 1,200,000 1,240,740Ardagh Packaging Finance PLC / Ardagh Holdings U.S.A., Inc. (Containers & Packaging) . . (a) 6.000% 02/15/2025 250,000 262,188Ardagh Packaging Finance PLC / Ardagh Holdings U.S.A., Inc. (Containers & Packaging) . . (a) 5.250% 08/15/2027 275,000 289,443Berry Global, Inc. (Containers & Packaging) . . . . . . . . . . . . . . . . . . . . . . . . . . . . . . . 5.500% 05/15/2022 850,000 859,562Berry Global, Inc. (Containers & Packaging) . . . . . . . . . . . . . . . . . . . . . . . . . . . . . . . 6.000% 10/15/2022 56,000 57,050Berry Global, Inc. (Containers & Packaging) . . . . . . . . . . . . . . . . . . . . . . . . . . . . . . . (a) 4.875% 07/15/2026 475,000 500,983Berry Global, Inc. (Containers & Packaging) . . . . . . . . . . . . . . . . . . . . . . . . . . . . . . . (a) 5.625% 07/15/2027 275,000 294,938Clearwater Paper Corp. (Paper & Forest Products) . . . . . . . . . . . . . . . . . . . . . . . . . . (a) 5.375% 02/01/2025 775,000 769,187Coeur Mining, Inc. (Metals & Mining) . . . . . . . . . . . . . . . . . . . . . . . . . . . . . . . . . . . 5.875% 06/01/2024 500,000 500,000Compass Minerals International, Inc. (Metals & Mining) . . . . . . . . . . . . . . . . . . . . . . . (a) 4.875% 07/15/2024 900,000 896,625Compass Minerals International, Inc. (Metals & Mining) . . . . . . . . . . . . . . . . . . . . . . . (a) 6.750% 12/01/2027 200,000 212,500Crown Americas LLC / Crown Americas Capital Corp. VI (Containers & Packaging) . . . . . . 4.750% 02/01/2026 450,000 475,313Element Solutions, Inc. (Chemicals) . . . . . . . . . . . . . . . . . . . . . . . . . . . . . . . . . . . . (a) 5.875% 12/01/2025 450,000 470,813Flex Acquisition Co., Inc. (Containers & Packaging) . . . . . . . . . . . . . . . . . . . . . . . . . . (a) 6.875% 01/15/2025 1,400,000 1,410,500Flex Acquisition Co., Inc. (Containers & Packaging) . . . . . . . . . . . . . . . . . . . . . . . . . . (a) 7.875% 07/15/2026 675,000 680,062Freeport-McMoRan, Inc. (Metals & Mining) . . . . . . . . . . . . . . . . . . . . . . . . . . . . . . . 3.875% 03/15/2023 650,000 661,849Freeport-McMoRan, Inc. (Metals & Mining) . . . . . . . . . . . . . . . . . . . . . . . . . . . . . . . 5.000% 09/01/2027 225,000 236,250Freeport-McMoRan, Inc. (Metals & Mining) . . . . . . . . . . . . . . . . . . . . . . . . . . . . . . . 5.250% 09/01/2029 225,000 241,043Freeport-McMoRan, Inc. (Metals & Mining) . . . . . . . . . . . . . . . . . . . . . . . . . . . . . . . 5.400% 11/14/2034 625,000 654,687Graphic Packaging International LLC (Containers & Packaging) . . . . . . . . . . . . . . . . . . (a) 4.750% 07/15/2027 150,000 160,500Hexion, Inc. (Chemicals) . . . . . . . . . . . . . . . . . . . . . . . . . . . . . . . . . . . . . . . . . . . (a) 7.875% 07/15/2027 375,000 389,981Hudbay Minerals, Inc. (Metals & Mining). . . . . . . . . . . . . . . . . . . . . . . . . . . . . . . . . (a) 7.250% 01/15/2023 100,000 103,688Hudbay Minerals, Inc. (Metals & Mining). . . . . . . . . . . . . . . . . . . . . . . . . . . . . . . . . (a) 7.625% 01/15/2025 600,000 633,300Koppers, Inc. (Chemicals) . . . . . . . . . . . . . . . . . . . . . . . . . . . . . . . . . . . . . . . . . . (a) 6.000% 02/15/2025 775,000 811,812Mauser Packaging Solutions Holding Co. (Containers & Packaging) . . . . . . . . . . . . . . . . (a) 5.500% 04/15/2024 300,000 309,030Mauser Packaging Solutions Holding Co. (Containers & Packaging) . . . . . . . . . . . . . . . . (a) 7.250% 04/15/2025 1,475,000 1,456,562Owens-Brockway Glass Container, Inc. (Containers & Packaging) . . . . . . . . . . . . . . . . . (a) 5.875% 08/15/2023 225,000 240,188Owens-Brockway Glass Container, Inc. (Containers & Packaging) . . . . . . . . . . . . . . . . . (a) 5.375% 01/15/2025 175,000 180,250Owens-Brockway Glass Container, Inc. (Containers & Packaging) . . . . . . . . . . . . . . . . . (a) 6.375% 08/15/2025 600,000 655,500PQ Corp. (Chemicals) . . . . . . . . . . . . . . . . . . . . . . . . . . . . . . . . . . . . . . . . . . . . . (a) 5.750% 12/15/2025 125,000 130,625Reynolds Group Issuer, Inc. / Reynolds Group Issuer LLC / Reynolds Group Issuer
(Containers & Packaging). . . . . . . . . . . . . . . . . . . . . . . . . . . . . . . . . . . . . . . . . (a) 7.000% 07/15/2024 900,000 930,375Sealed Air Corp. (Containers & Packaging) . . . . . . . . . . . . . . . . . . . . . . . . . . . . . . . (a) 4.000% 12/01/2027 350,000 354,375Starfruit Finco B.V. / Starfruit U.S. Holdco LLC (Chemicals) . . . . . . . . . . . . . . . . . . . . . . (a) 8.000% 10/01/2026 800,000 848,000Steel Dynamics, Inc. (Metals & Mining). . . . . . . . . . . . . . . . . . . . . . . . . . . . . . . . . . 5.500% 10/01/2024 250,000 257,523Trivium Packaging Finance BV (Containers & Packaging) . . . . . . . . . . . . . . . . . . . . . . (a) 5.500% 08/15/2026 200,000 210,750Trivium Packaging Finance BV (Containers & Packaging) . . . . . . . . . . . . . . . . . . . . . . (a) 8.500% 08/15/2027 250,000 278,125
18,664,317
REAL ESTATE – 0.3%Ryman Hospitality Properties, Inc. (Equity REIT) . . . . . . . . . . . . . . . . . . . . . . . . . . . . (a) 4.750% 10/15/2027 150,000 154,875VICI Properties LP / VICI Note Co., Inc. (Equity REIT). . . . . . . . . . . . . . . . . . . . . . . . . . (a) 4.250% 12/01/2026 225,000 231,750VICI Properties LP / VICI Note Co., Inc. (Equity REIT). . . . . . . . . . . . . . . . . . . . . . . . . . (a) 4.625% 12/01/2029 175,000 182,875
569,500
UTILITIES – 3.9%AmeriGas Partners LP / AmeriGas Finance Corp. (Gas Utilities) . . . . . . . . . . . . . . . . . . . 5.875% 08/20/2026 800,000 882,000AmeriGas Partners LP / AmeriGas Finance Corp. (Gas Utilities) . . . . . . . . . . . . . . . . . . . 5.750% 05/20/2027 100,000 109,750
Ohio National Fund, Inc. ON Federated High Income Bond Portfolio (Continued)
Schedule of Investments December 31, 2019
68 (continued)

Corporate Bonds (Continued) Rate Maturity Face Amount Value
UTILITIES (continued)Calpine Corp. (Ind. Power & Renewable Elec.) . . . . . . . . . . . . . . . . . . . . . . . . . . . . . 5.750% 01/15/2025 $ 675,000 $ 692,719Calpine Corp. (Ind. Power & Renewable Elec.) . . . . . . . . . . . . . . . . . . . . . . . . . . . . . (a) 5.250% 06/01/2026 150,000 156,188Calpine Corp. (Ind. Power & Renewable Elec.) . . . . . . . . . . . . . . . . . . . . . . . . . . . . . (a) 4.500% 02/15/2028 350,000 353,105Calpine Corp. (Ind. Power & Renewable Elec.) . . . . . . . . . . . . . . . . . . . . . . . . . . . . . (a) 5.125% 03/15/2028 250,000 255,175Ferrellgas LP / Ferrellgas Finance Corp. (Gas Utilities). . . . . . . . . . . . . . . . . . . . . . . . . 6.500% 05/01/2021 200,000 173,000Ferrellgas LP / Ferrellgas Finance Corp. (Gas Utilities). . . . . . . . . . . . . . . . . . . . . . . . . 6.750% 01/15/2022 425,000 361,250Ferrellgas LP / Ferrellgas Finance Corp. (Gas Utilities). . . . . . . . . . . . . . . . . . . . . . . . . 6.750% 06/15/2023 250,000 211,250NRG Energy, Inc. (Ind. Power & Renewable Elec.) . . . . . . . . . . . . . . . . . . . . . . . . . . . 7.250% 05/15/2026 750,000 819,375NRG Energy, Inc. (Ind. Power & Renewable Elec.) . . . . . . . . . . . . . . . . . . . . . . . . . . . 6.625% 01/15/2027 250,000 271,250NRG Energy, Inc. (Ind. Power & Renewable Elec.) . . . . . . . . . . . . . . . . . . . . . . . . . . . (a) 5.250% 06/15/2029 125,000 135,156Suburban Propane Partners LP / Suburban Energy Finance Corp. (Gas Utilities) . . . . . . . . 5.500% 06/01/2024 425,000 436,687Suburban Propane Partners LP / Suburban Energy Finance Corp. (Gas Utilities) . . . . . . . . 5.875% 03/01/2027 600,000 624,000TerraForm Power Operating LLC (Ind. Power & Renewable Elec.) . . . . . . . . . . . . . . . . . (a) 4.250% 01/31/2023 75,000 77,210TerraForm Power Operating LLC (Ind. Power & Renewable Elec.) . . . . . . . . . . . . . . . . . (a) 5.000% 01/31/2028 1,125,000 1,189,474Vistra Operations Co. LLC (Ind. Power & Renewable Elec.) . . . . . . . . . . . . . . . . . . . . . . (a) 5.500% 09/01/2026 225,000 238,500Vistra Operations Co. LLC (Ind. Power & Renewable Elec.) . . . . . . . . . . . . . . . . . . . . . . (a) 5.625% 02/15/2027 400,000 421,500Vistra Operations Co. LLC (Ind. Power & Renewable Elec.) . . . . . . . . . . . . . . . . . . . . . . (a) 5.000% 07/31/2027 375,000 391,867
7,799,456Total Corporate Bonds (Cost $187,632,138) . . . . . . . . . . . . . . . . . . . . . . . . . . . . . . . . $188,521,214
Common Stocks – 0.1% Shares Value
COMMUNICATION SERVICES – 0.0%iHeartMedia, Inc. Class A (Media) . . . . . . . . . . . . . . . . . . . . . . . . . . . . . . . . . . . . . . . . . . . . . . . . . . . . . . . . . . . . . . . (d) 7,387 $ 124,840
MATERIALS – 0.1%Hexion Holdings Corp. Class B (Chemicals). . . . . . . . . . . . . . . . . . . . . . . . . . . . . . . . . . . . . . . . . . . . . . . . . . . . . . . . . . (d) 10,888 131,201Total Common Stocks (Cost $498,023) . . . . . . . . . . . . . . . . . . . . . . . . . . . . . . . . . . . . . . . . . . . . . . . . . . . . . . . . . . . . . $ 256,041
Money Market Funds – 3.4% Shares Value
State Street Institutional Liquid Reserves Fund Institutional Class, 1.734% . . . . . . . . . . . . . . . . . . . . . . . . . . . . . . . . . . . . . . . . (e) 6,781,590 $ 6,782,268Total Money Market Funds (Cost $6,782,268) . . . . . . . . . . . . . . . . . . . . . . . . . . . . . . . . . . . . . . . . . . . . . . . . . . . . . . . . . . . . . $ 6,782,268Total Investments – 98.4% (Cost $194,912,429) . . . . . . . . . . . . . . . . . . . . . . . . . . . . . . . . . . . . . . . . . . . . . . . . . . . . . . . . . . . . . . (f) $195,559,523Other Assets in Excess of Liabilities – 1.6% . . . . . . . . . . . . . . . . . . . . . . . . . . . . . . . . . . . . . . . . . . . . . . . . . . . . . . . . . . . . . . 3,092,620Net Assets – 100.0% $198,652,143
Percentages are stated as a percent of net assets.Abbreviations:
PIK: Payment-in-KindFootnotes:
(a) Security exempt from registration under Regulation D of the Securities Act of 1933. These securities may be resold in transactions exempt from registration,normally to qualified buyers under Rule 144A. At December 31, 2019, the value of these securities totaled $128,428,476, or 64.6% of the Portfolio’s net assets.
(b) Represents a security that is in default.(c) Issuer of the security has the option to make coupon payments in cash or in additional par value of this bond (Payment-in-Kind).(d) Non-income producing security.(e) Rate represents the seven-day yield at December 31, 2019.(f) Represents cost for financial reporting purposes, which may differ from cost basis for federal income tax purposes. See also Note 8 of the Notes to Financial
Statements.
The accompanying notes are an integral part of these financial statements.
Ohio National Fund, Inc. ON Federated High Income Bond Portfolio (Continued)
Schedule of Investments December 31, 2019
69

Objective/Strategy
The ON Nasdaq-100® Index Portfolio seeks long-term growth of capitalby investing, under normal circumstances, more than 80% of its netassets in the common stocks of companies that are included in theNasdaq-100® Index.
Performance as of December 31, 2019
Average Annual returnsOne year 38.86%Five years 16.35%Ten years 17.46%
Past performance does not guarantee future results. The performance dataquoted represents past performance and current returns may be lower or higher.Total return figures include change in share price and reinvestment of dividendsand capital gains. The investment return and principal value will fluctuate so thatan investor’s shares, when redeemed, may be worth more or less than the originalcost. To obtain performance information up to the most recent month end, calltoll-free 1-877-781-6392.
The Portfolio is not open to direct retail investment. Beneficial interest in shares isobtained solely by purchase of variable life insurance policies and variable annuitycontracts. Actual performance results for variable annuity and variable universallife contracts will be lower due to contract charges. Consult your contract forapplicable charges.
Total expense ratio is 0.41% per the Fund’s prospectus dated November 22, 2019.Additional information pertaining to the Portfolio’s expense ratio as ofDecember 31, 2019 can be found in the Portfolio’s Financial Highlights.
Comments from Sub-Adviser
Q. How did the Portfolio perform in comparison to its benchmark duringthe reporting period?
A. For the year ended December 31, 2019, the Portfolio returned 38.86%versus 39.46% for its benchmark, the Nasdaq-100® Index.
Q. Were there specific market conditions, investment strategies, ortechniques that materially affected the Portfolio’s benchmark-relativeperformance during the reporting period?
A. The Portfolio intends to track the underlying return of theNasdaq-100® Index. There were no material market events or changes instrategy during the year that materially impacted the Portfolio’s relativereturn. Sources of return variance were related to the cumulative impactof investing the day-to-day cash flows in the Portfolio.
Q. How did sector allocation and security selection each impact thePortfolio’s performance relative to its benchmark? For sector allocation,were there any factors that impacted the benchmark’s performancemore significantly than the Portfolio’s performance? For securityselection, was there anything specific regarding the Portfolio’s strategythat caused deviation from the benchmark?
A. There was no impact from either sector or stock selection thatcaused any significant performance variance between the Portfolio andits benchmark. (1)
All eight of the sectors in the benchmark produced positive returns in2019. Information Technology led the way, returning 54.6% for the year.Communication Services and Consumer Discretionary returned 32.7%and 27.1% for the year, respectively. (1)
Q. Which holdings contributed the most to, and detracted the most from,the Portfolio’s benchmark-relative performance?
A. Because the Portfolio weights its holdings to be similar to thoseutilized by the benchmark index, there were no holdings that significantlycontributed to or detracted from the Portfolio’s benchmark-relativeperformance. (1)
Q. How did the Portfolio’s use of derivative instruments and initialpublic offerings (IPOs), if any, impact performance?
A. The Portfolio uses Nasdaq-100® Index futures contracts primarily toequitize open dividend receivables, as well as to manage day-to-daycash flows, to ensure the Portfolio is fully invested. The futures did notmeaningfully impact performance, however, due to their indexcharacteristics and size in relation to the Portfolio’s net assets. (1)
Q. Were there any significant changes to the Portfolio’s managementteam, investment strategy, or security selection process during thereporting period?
A. Over the course of 2019, the Portfolio’s management teamexperienced an unusually high amount of personnel changes for variedreasons including retirement, relocation due to family reasons, andpursuit of other opportunities. Departures have been replaced, in allcases, with portfolio managers who exceed the previous team member’sindustry experience, and the changes have resulted in no increase ordecrease in total team members dedicated to the Portfolio. Geode CapitalManagement LLC’s (�Geode�) investment management philosophyutilizes a team-based approach that follows a disciplined and repeatableinvestment process, seeking to limit dependency on any singleinvestment professional, and, in the case of a team member’s departure,is less disruptive to the execution of the investment process.
Additionally, in December, Geode added a new position to the team withthe hire of Diane Hsiung as CIO – Index and ETF Strategies. In this newlycreated role, Ms. Hsiung, is responsible for the overall development andimplementation of the firm’s Index strategies, and providing oversightand management of team members, while driving strategic initiatives toscale operational processes and manage portfolio risks. Geode believesthe management team is well-positioned going forward.
There were no material changes to the investment strategy or stockselection process during the period.
(1) The Portfolio’s composition is subject to change. Holdings and weightings areas of December 31, 2019.
Ohio National Fund, Inc. ON Nasdaq-100® Index Portfolio (Unaudited)
70 (continued)

Change in Value of $10,000 Investment
ON Nasdaq-100® Index Portfolio (A)Nasdaq-100® Index (B)
0
10,000
20,000
30,000
40,000
50,000
$60,000
6/1
012
/10 6
/1112
/11 6
/1212
/12 6
/1312
/13 6
/1412
/14 6
/1512
/15 6
/1612
/16 6
/1712
/17 6
/1812
/18 6
/19
12/3
1/09
12/1
9
$52,636 (B)$50,000 (A)
Hypothetical illustration based on past performance. Future performance will vary.The Portfolio’s returns reflect reinvested dividends. The Portfolio’s holdings maydiffer significantly from the securities in the index. The index is unmanaged andtherefore does not reflect the cost of portfolio management and accounting.
The Nasdaq-100®00 Index is a modified capitalization-weighted index of the 100largest domestic and international non-financial companies listed on theNASDAQ® Stock Market. The index presented includes the effects of reinvesteddividends.
Past performance is no guarantee of future results. Redemption of fund sharescould have tax implications unique to each shareholder.
The Nasdaq-100®00 , Nasdaq-100 Index® ®x , and Nasdaq® ® are registered trademarks ofThe NASDAQ OMX Group, Inc. (which with its affiliates is referred to as “NASDAQOMX”). Ohio National Investments, Inc. has licensed these marks for the Portfolio’suse. NASDAQ OMX has not passed on the Portfolio’s legality or suitability.NASDAQ OMX does not sponsor, endorse, sell or promote the Portfolio. NASDAQOMX MAKES NO WARRANTIES AND BEARS NO LIABILITY WITH RESPECT TOTHE PORTFOLIO.
Portfolio Composition as of December 31, 2019 (1)
% of Net AssetsCommon Stocks (4) 99.3U.S. Treasury Obligations 0.0Money Market Funds
Less Net Liabilities 0.7100.0
Top 10 Portfolio Holdings as of December 31, 2019 (1) (2) (3)
% of Net Assets1. Apple, Inc. 11.52. Microsoft Corp. 10.63. Amazon.com, Inc. 8.14. Facebook, Inc. Class A 4.45. Alphabet, Inc. Class A 4.16. Alphabet, Inc. Class C 4.17. Intel Corp. 2.98. Comcast Corp. Class A 2.39. Cisco Systems, Inc. 2.3
10. PepsiCo, Inc. 2.1
(1) Composition of Portfolio subject to change.(2) Short-term investments have been excluded from the list of Top 10 Portfolio Holdings.(3) Top 10 Portfolio Holdings is presented at an individual security level. Total investment exposure by issuer may be higher.(4) Sectors (Common Stocks):
% of Net AssetsInformation Technology 47.0Communication Services 20.7Consumer Discretionary 14.6Health Care 7.2Consumer Staples 5.9Industrials 2.7Utilities 0.9Financials 0.3
99.3
Ohio National Fund, Inc. ON Nasdaq-100® Index Portfolio (Unaudited) (Continued)
71

Common Stocks – 99.3% Shares Value
COMMUNICATION SERVICES – 20.7%Activision Blizzard, Inc. (Entertainment) . . . . . 30,535 $ 1,814,390Alphabet, Inc. Class A (Interactive Media &
Svs.) . . . . . . . . . . . . . . . . . . . . . . . . . . (a) 10,711 14,346,206Alphabet, Inc. Class C (Interactive Media &
Svs.) . . . . . . . . . . . . . . . . . . . . . . . . . . (a) 10,704 14,311,462Baidu, Inc. – ADR (Interactive Media & Svs.) . . (a) 10,989 1,389,010Charter Communications, Inc. Class A (Media) . (a) 8,537 4,141,128Comcast Corp. Class A (Media) . . . . . . . . . . 180,437 8,114,252Electronic Arts, Inc. (Entertainment) . . . . . . . (a) 11,605 1,247,654Facebook, Inc. Class A (Interactive Media &
Svs.) . . . . . . . . . . . . . . . . . . . . . . . . . . (a) 74,981 15,389,850Fox Corp. Class A (Media) . . . . . . . . . . . . . . 14,090 522,316Fox Corp. Class B (Media) . . . . . . . . . . . . . . 10,579 385,076Liberty Global PLC Class A (Media) . . . . . . . . (a) 7,215 164,069Liberty Global PLC Class C (Media) . . . . . . . . (a) 17,440 380,105NetEase, Inc. – ADR (Entertainment) . . . . . . . 2,900 889,256Netflix, Inc. (Entertainment) . . . . . . . . . . . . . (a) 17,419 5,636,266Sirius XM Holdings, Inc. (Media) . . . . . . . . . . 175,823 1,257,134Take-Two Interactive Software, Inc.
(Entertainment) . . . . . . . . . . . . . . . . . . . (a) 4,505 551,547T-Mobile U.S., Inc. (Wireless Telecom. Svs.). . . (a) 34,005 2,666,672
73,206,393
CONSUMER DISCRETIONARY – 14.6%Amazon.com, Inc. (Internet & Direct Marketing
Retail) . . . . . . . . . . . . . . . . . . . . . . . . . (a) 15,448 28,545,432Booking Holdings, Inc. (Internet & Direct
Marketing Retail) . . . . . . . . . . . . . . . . . . (a) 1,664 3,417,407Dollar Tree, Inc. (Multiline Retail) . . . . . . . . . (a) 9,406 884,634eBay, Inc. (Internet & Direct Marketing Retail) . 32,334 1,167,581Expedia Group, Inc. (Internet & Direct
Marketing Retail) . . . . . . . . . . . . . . . . . . 5,539 598,988JD.com, Inc. – ADR (Internet & Direct
Marketing Retail) . . . . . . . . . . . . . . . . . . (a) 36,841 1,297,908Lululemon Athletica, Inc. (Textiles, Apparel &
Luxury Goods). . . . . . . . . . . . . . . . . . . . (a) 4,894 1,133,793Marriott International, Inc. Class A (Hotels,
Restaurants & Leisure) . . . . . . . . . . . . . . 12,994 1,967,681MercadoLibre, Inc. (Internet & Direct
Marketing Retail) . . . . . . . . . . . . . . . . . . (a) 1,976 1,130,154O’Reilly Automotive, Inc. (Specialty Retail). . . . (a) 3,007 1,317,848Ross Stores, Inc. (Specialty Retail) . . . . . . . . 14,377 1,673,770Starbucks Corp. (Hotels, Restaurants &
Leisure). . . . . . . . . . . . . . . . . . . . . . . . 46,939 4,126,877Tesla, Inc. (Automobiles). . . . . . . . . . . . . . . (a) 7,164 2,996,916Trip.com Group Ltd. – ADR (Internet & Direct
Marketing Retail) . . . . . . . . . . . . . . . . . . (a) 20,786 697,162Ulta Beauty, Inc. (Specialty Retail). . . . . . . . . (a) 2,339 592,095
51,548,246
CONSUMER STAPLES – 5.9%Costco Wholesale Corp. (Food & Staples
Retailing) . . . . . . . . . . . . . . . . . . . . . . . 17,559 5,160,941Kraft Heinz Co. / The (Food Products) . . . . . . . 48,536 1,559,462Mondelez International, Inc. Class A
(Food Products). . . . . . . . . . . . . . . . . . . 57,227 3,152,063Monster Beverage Corp. (Beverages) . . . . . . (a) 21,370 1,358,064PepsiCo, Inc. (Beverages) . . . . . . . . . . . . . . 55,423 7,574,661Walgreens Boots Alliance, Inc. (Food &
Staples Retailing). . . . . . . . . . . . . . . . . . 35,475 2,091,60620,896,797
FINANCIALS – 0.3%Willis Towers Watson PLC (Insurance) . . . . . . 5,110 1,031,913
HEALTH CARE – 7.2%Alexion Pharmaceuticals, Inc. (Biotechnology) . (a) 8,795 951,179Align Technology, Inc. (Health Care Equip. &
Supplies) . . . . . . . . . . . . . . . . . . . . . . . (a) 3,132 873,953Amgen, Inc. (Biotechnology) . . . . . . . . . . . . 23,616 5,693,109
Common Stocks (Continued) Shares Value
HEALTH CARE (continued)Biogen, Inc. (Biotechnology) . . . . . . . . . . . . (a) 7,172 $ 2,128,148BioMarin Pharmaceutical, Inc.
(Biotechnology). . . . . . . . . . . . . . . . . . . (a) 7,139 603,603Cerner Corp. (Health Care Technology) . . . . . . 12,484 916,201Gilead Sciences, Inc. (Biotechnology) . . . . . . 50,284 3,267,454IDEXX Laboratories, Inc. (Health Care Equip. &
Supplies) . . . . . . . . . . . . . . . . . . . . . . . (a) 3,409 890,192Illumina, Inc. (Life Sciences Tools & Svs.) . . . . (a) 5,843 1,938,357Incyte Corp. (Biotechnology) . . . . . . . . . . . . (a) 8,561 747,547Intuitive Surgical, Inc. (Health Care Equip. &
Supplies) . . . . . . . . . . . . . . . . . . . . . . . (a) 4,594 2,715,743Regeneron Pharmaceuticals, Inc.
(Biotechnology). . . . . . . . . . . . . . . . . . . (a) 4,290 1,610,809Seattle Genetics, Inc. (Biotechnology) . . . . . . (a) 6,812 778,339Vertex Pharmaceuticals, Inc. (Biotechnology) . (a) 10,221 2,237,888
25,352,522
INDUSTRIALS – 2.7%American Airlines Group, Inc. (Airlines) . . . . . 17,411 499,347Cintas Corp. (Commercial Svs. & Supplies) . . . 4,114 1,106,995Copart, Inc. (Commercial Svs. & Supplies) . . . . (a) 9,239 840,195CoStar Group, Inc. (Professional Svs.) . . . . . . (a) 1,456 871,125CSX Corp. (Road & Rail) . . . . . . . . . . . . . . . 31,094 2,249,962Fastenal Co. (Trading Companies &
Distributors) . . . . . . . . . . . . . . . . . . . . . 22,795 842,275PACCAR, Inc. (Machinery). . . . . . . . . . . . . . 13,747 1,087,388United Airlines Holdings, Inc. (Airlines) . . . . . . (a) 10,057 885,921Verisk Analytics, Inc. (Professional Svs.) . . . . . 6,513 972,651
9,355,859
INFORMATION TECHNOLOGY – 47.0%Adobe, Inc. (Software) . . . . . . . . . . . . . . . . (a) 19,240 6,345,544Advanced Micro Devices, Inc.
(Semiconductors & Equip.) . . . . . . . . . . . . (a) 44,262 2,029,855Analog Devices, Inc. (Semiconductors &
Equip.) . . . . . . . . . . . . . . . . . . . . . . . . 14,638 1,739,580ANSYS, Inc. (Software) . . . . . . . . . . . . . . . (a) 3,346 861,294Apple, Inc. (Tech. Hardware, Storage &
Periph.) . . . . . . . . . . . . . . . . . . . . . . . . 138,443 40,653,787Applied Materials, Inc. (Semiconductors &
Equip.) . . . . . . . . . . . . . . . . . . . . . . . . 36,715 2,241,084ASML Holding N.V. (Semiconductors & Equip.) . 2,944 871,247Autodesk, Inc. (Software) . . . . . . . . . . . . . . (a) 8,728 1,601,239Automatic Data Processing, Inc. (IT Svs.) . . . . 17,198 2,932,259Broadcom, Inc. (Semiconductors & Equip.) . . . 15,766 4,982,371Cadence Design Systems, Inc. (Software) . . . . (a) 11,152 773,503CDW Corp. (Electronic Equip., Instr. & Comp.). . 5,711 815,759Check Point Software Technologies Ltd.
(Software) . . . . . . . . . . . . . . . . . . . . . . (a) 6,051 671,419Cisco Systems, Inc. (Communications Equip.) . . 168,611 8,086,584Citrix Systems, Inc. (Software) . . . . . . . . . . . 5,176 574,018Cognizant Technology Solutions Corp. Class A
(IT Svs.). . . . . . . . . . . . . . . . . . . . . . . . 21,763 1,349,741Fiserv, Inc. (IT Svs.) . . . . . . . . . . . . . . . . . . (a) 27,023 3,124,670Intel Corp. (Semiconductors & Equip.) . . . . . . 172,893 10,347,646Intuit, Inc. (Software) . . . . . . . . . . . . . . . . . 10,346 2,709,928KLA-Tencor Corp. (Semiconductors & Equip.). . 6,272 1,117,482Lam Research Corp. (Semiconductors &
Equip.) . . . . . . . . . . . . . . . . . . . . . . . . 5,766 1,685,978Maxim Integrated Products, Inc.
(Semiconductors & Equip.) . . . . . . . . . . . . 10,756 661,602Microchip Technology, Inc. (Semiconductors &
Equip.) . . . . . . . . . . . . . . . . . . . . . . . . 9,498 994,631Micron Technology, Inc. (Semiconductors &
Equip.) . . . . . . . . . . . . . . . . . . . . . . . . (a) 44,000 2,366,320Microsoft Corp. (Software) . . . . . . . . . . . . . 237,699 37,485,132NetApp, Inc. (Tech. Hardware, Storage &
Periph.) . . . . . . . . . . . . . . . . . . . . . . . . 9,071 564,670NVIDIA Corp. (Semiconductors & Equip.) . . . . 24,324 5,723,437
Ohio National Fund, Inc. ON Nasdaq-100® Index Portfolio
Schedule of Investments December 31, 2019
72 (continued)

Common Stocks (Continued) Shares Value
INFORMATION TECHNOLOGY (continued)NXP Semiconductors N.V. (Semiconductors &
Equip.) . . . . . . . . . . . . . . . . . . . . . . . . 11,110 $ 1,413,859Paychex, Inc. (IT Svs.) . . . . . . . . . . . . . . . . 14,227 1,210,149PayPal Holdings, Inc. (IT Svs.) . . . . . . . . . . . (a) 46,669 5,048,186QUALCOMM, Inc. (Semiconductors & Equip.). . 45,383 4,004,142Skyworks Solutions, Inc. (Semiconductors &
Equip.) . . . . . . . . . . . . . . . . . . . . . . . . 6,772 818,599Splunk, Inc. (Software) . . . . . . . . . . . . . . . . (a) 6,015 900,867Synopsys, Inc. (Software) . . . . . . . . . . . . . . (a) 5,973 831,442Texas Instruments, Inc. (Semiconductors &
Equip.) . . . . . . . . . . . . . . . . . . . . . . . . 37,153 4,766,358VeriSign, Inc. (IT Svs.) . . . . . . . . . . . . . . . . (a) 4,666 899,045Western Digital Corp. (Tech. Hardware,
Storage & Periph.) . . . . . . . . . . . . . . . . . 11,820 750,215Workday, Inc. Class A (Software) . . . . . . . . . (a) 6,518 1,071,885Xilinx, Inc. (Semiconductors & Equip.) . . . . . . 9,995 977,211
166,002,738
UTILITIES – 0.9%Exelon Corp. (Electric Utilities) . . . . . . . . . . . 38,637 1,761,461Xcel Energy, Inc. (Electric Utilities) . . . . . . . . 21,313 1,353,162
3,114,623Total Common Stocks (Cost $259,001,225) . . . . $350,509,091
U.S. TreasuryObligations – 0.0% Rate Maturity Face Amount Value
U.S. Treasury Bill . . . 0.000% 03/19/2020 $ 80,000 $ 79,746Total U.S. TreasuryObligations(Cost $79,687) . . . . . $ 79,746
Money Market Funds – 1.1% Shares Value
State Street Institutional Liquid Reserves FundInstitutional Class, 1.734% . . . . . . . . . . . . . (b) 3,751,195 $ 3,751,571
Total Money Market Funds (Cost $3,751,571) . . . . . . $ 3,751,571Total Investments – 100.4% (Cost $262,832,483) . . . . . . . (c) $354,340,408Liabilities in Excess of Other Assets – (0.4)% . . . . . . . (d) (1,354,115)Net Assets – 100.0% $352,986,293
Percentages are stated as a percent of net assets.Abbreviations:
ADR: American Depositary ReceiptsFootnotes:
(a) Non-income producing security.(b) Rate represents the seven-day yield at December 31, 2019.(c) Represents cost for financial reporting purposes, which may differ from cost basis for federal income tax purposes. See also Note 8 of the Notes to Financial
Statements.(d) Includes $187,200 of cash pledged as collateral for the futures contracts outstanding at December 31, 2019. See also the following Schedule of Open Futures
Contracts.
The accompanying notes are an integral part of these financial statements.
Schedule of Open Futures Contracts December 31, 2019
DescriptionNumber ofcontracts Expiration Date
NotionalAmount Value
UnrealizedAppreciation
(Depreciation)
Variation MarginReceivable(Payable)
CME E-mini Nasdaq-100 Index - Long 26 March 20, 2020 $4,470,877 $4,551,170 $80,293 $(3,319)
The accompanying notes are an integral part of these financial statements.
Ohio National Fund, Inc. ON Nasdaq-100® Index Portfolio (Continued)
Schedule of Investments December 31, 2019
73

Objective/Strategy
The ON BlackRock Advantage Large Cap Core Portfolio (formerly the ONBristol Portfolio) seeks long-term growth of capital by investing, undernormal circumstances, at least 80% of its net assets in common stocks ofthe 1,000 largest publicly traded U.S. companies in terms of marketcapitalization.
Performance as of December 31, 2019
Average Annual returnsOne year 33.60%Five years 9.91%Ten years 11.86%
Past performance does not guarantee future results. The performance dataquoted represents past performance and current returns may be lower or higher.Total return figures include change in share price and reinvestment of dividendsand capital gains. The investment return and principal value will fluctuate so thatan investor’s shares, when redeemed, may be worth more or less than the originalcost. To obtain performance information up to the most recent month end, calltoll-free 1-877-781-6392.
The Portfolio is not open to direct retail investment. Beneficial interest in shares isobtained solely by purchase of variable life insurance policies and variable annuitycontracts. Actual performance results for variable annuity and variable universallife contracts will be lower due to contract charges. Consult your contract forapplicable charges.
Total expense ratio is 0.68% per the Fund’s prospectus dated November 22, 2019.Additional information pertaining to the Portfolio’s expense ratio as ofDecember 31, 2019 can be found in the Portfolio’s Financial Highlights.
Comments from Sub-Adviser
Q. How did the Portfolio perform in comparison to its benchmark duringthe reporting period?
A. For the year ended December 31, 2019, the Portfolio returned 33.60%versus 31.49% for its benchmark, the S&P 500 Index.
Effective February 1, 2019, BlackRock Investment Management, LLC(“BlackRock”) replaced the Portfolio’s previous sub-adviser, SuffolkCapital Management, LLC (“Suffolk”). In conjunction with the change insub-adviser, the name of the Portfolio was changed from ON BristolPortfolio to ON BlackRock Advantage Large Cap Core Portfolio. ThePortfolio’s benchmark was unchanged.
For the period from January 1, 2019 to January 31, 2019 (the “firstone-month period”), the Portfolio returned 13.51% versus 8.01% for theS&P 500 Index.
For the period from February 1, 2019 to December 31, 2019 (the “lattereleven-month period”), the Portfolio returned 17.69% versus 21.73% forthe S&P 500 Index.
Q. Were there specific market conditions, investment strategies, ortechniques that materially affected the Portfolio’s benchmark-relativeperformance during the reporting period?
A. Suffolk: For the first one-month period, there were no marketconditions, investment strategies, or techniques that materially affectedthe Portfolio’s benchmark-relative performance.
A. BlackRock: Portfolio performance was challenged throughout muchof the latter eleven-month period, underperforming the benchmark.Underperformance during the first several months of the period waslargely driven by investment insights designed to evaluate companyfundamentals. Most specifically, insights seeking to identify relativevalue opportunities were challenged early in the year, as investors
sought out speculative growth opportunities at the expense of companyfundamentals. In the final months of the year, mentality shifted, asinvestors began to seek out pockets of relative value, leading to a slightperformance improvement for this group of signals. Despite the modestrebound in performance late in the year, in aggregate, the Portfolio’srelative value insights were significant detractors from relative returns.Also evaluating company fundamentals, the Portfolio’s quality insightswere mixed throughout the period. Though this group of insightsdetracted modestly in aggregate, struggling somewhat in the finalmonths of the year, select signals added meaningfully to relative returnsand provided ballast to performance among fundamental signals.Stronger performance among the Portfolio’s quality insights wasunsurprising, given investor preference for sustainable, high-qualitybusinesses amidst increased market uncertainty.
After delivering moderate performance through the first few months ofthe latter eleven-month period, the Portfolio’s trend and sentiment-basedinsights struggled considerably during the latter part of the period andwere responsible for the bulk of the Portfolio’s underperformance. Aseries of inflection points, largely motivated by shifts in global tradeconversations and central bank policy, created a difficult environmentfor the Portfolio’s trend-based insights. Similarly, these sharp,macro-driven inflection points often resulted in a disconnect betweenstock returns and company-specific sentiment, creating a challengingenvironment for the Portfolio’s sentiment insights. Cross-marketsentiment insights struggled in particular, most specifically thoseseeking to capture the sentiment of informed bond and credit defaultswap investors.
Q. How did sector allocation and security selection each impact thePortfolio’s performance relative to its benchmark? For sector allocation,were there any factors that impacted the benchmark’s performancemore significantly than the Portfolio’s performance? For securityselection, was there anything specific regarding the Portfolio’s strategythat caused deviation from the benchmark?
A. Suffolk: For the first one-month period, both sector allocation andstock selection contributed to relative outperformance. Stock selectionin Health Care and Consumer Discretionary contributed to relativeoutperformance, while stock selection in Communication Servicesdetracted from relative performance.
A. BlackRock: The portfolio management team targets a relativelysector-neutral approach and seeks to derive the majority of its alphafrom security selection. That being said, a modest underweight to theEnergy sector throughout much of the latter eleven-month periodcontributed to relative performance, as the sector underperformed thebroader market. On the other hand, positioning in the CommunicationServices sector detracted from performance. The majority of relativeperformance was driven by security selection. Stock selection wasadditive in the Health Care sector, especially among pharmaceutical andbiotechnology companies. In contrast, selection within the Financialssector, the capital markets industry in particular, was a notable detractorfrom relative performance. Stock selection in the CommunicationServices sector, especially among media companies, and the Energysector, hindered relative returns as well. (1)
Q. Which holdings contributed the most to, and detracted the most from,the Portfolio’s benchmark-relative performance?
A. Suffolk: Top contributors for the first one-month period included SageTherapeutics, Inc., as the company announced positive results for aPhase 3 trial in postpartum depression. Celgene Corp. contributed, as itwas acquired by Bristol-Myers Squibb Co. Aerie Pharmaceuticals, Inc.,another top contributor, expects to achieve its revenue target forRhopressa, its new glaucoma drug, and announced positive pilot studyresults for Rhopressa in Japan, a significant new market opportunity.
Ohio National Fund, Inc. ON BlackRock Advantage Large Cap Core Portfolio (Unaudited)
74 (continued)

Alphabet, Inc. Class C detracted most from relative performance for thefirst one-month period, as there were concerns Google would lose sharein online advertising to Amazon and might withdraw its news service inEurope if a “snippet” tax were implemented. Apple, Inc., a relativeunderweight due to expected phone pricing cuts, was another relativedetractor. A third relative detractor was Amazon.com, Inc. (“Amazon”),as the Portfolio was underweight due to concerns of weaker U.S.e-commerce market share gain and belief that increased regulation ofe-commerce in India would impact growth.
A. BlackRock: The Portfolio’s positioning in Medtronic PLC was thelargest contributor to relative performance for the latter eleven-monthperiod. An overweight position in the middle of the year was particularlybeneficial, as Medtronic PLC’s stock price climbed towards the end ofsecond quarter and into the third. Encouraging forward guidance fromthe company, along with positive earnings announcements, supportedthe company’s share price. Several promising research projects,including one project to develop memory chips enabling improvement inhuman memory, helped support investor sentiment on the future of thecompany as well. Remaining underweight Pfizer, Inc. further supportedrelative performance throughout the latter eleven-month period, as thepharmaceuticals company struggled during much of 2019. Its stock pricedeclined on increasing concerns around the potential of restrictive drugpricing legislation. Additionally, when the company announced in lateJuly that it would be combining parts of its business with Mylan N.V., thestock price dropped following several analyst downgrades, citingconcerns around the effect of the deal on the company’s stock.Positioning in Biogen, Inc. was also beneficial to results. An underweightto the stock early in the year was additive, as the share price plummetedon news that its experimental Alzheimer’s drug, which had beentremendously promising, was unlikely to be effective, and that researchon the drug was being stopped. Moving to an overweight towards theend of the year further bolstered results, as Biogen, Inc.’s shares spikedon news that there were new, promising results from research on theAlzheimer’s drug. News that the company was requesting approval fromthe Federal Drug Administration (“FDA”) on the experimental therapy ledto renewed hope among investors and a resulting surge in the stockprice. (1)
In contrast, the top individual detractor for the latter eleven-month periodwas the Portfolio’s overweight position in The Charles Schwab Corp. Thecompany struggled amidst increased pricing pressure that someanalysts believe could act as a headwind and stifle company revenuegrowth going forward. The Portfolio’s positioning in ConocoPhillips wasalso a persistent detractor from results throughout the lattereleven-month period. Maintaining an overweight to the company throughthe end of the second quarter and much of the third was a drag onrelative returns, as downward pressure on oil prices created concernsaround the future profitability of the company. An unsuccessfulexploration-drilling project in Louisiana was an additional hit to thecompany, as the expensive operation did not yield viable oil reserves andthe company was forced to sell the acreage. In a similar vein, thePortfolio’s overweight to Halliburton Co. during the early part of theperiod further dampened relative returns, as there was significantdownward pricing pressure on oilfield servicing and fracking due todepressed oil prices and exploration and production activity. This pricingpressure and reduced activity caused the share prices to slump. (1)
Q. How did the Portfolio’s use of derivative instruments and initialpublic offerings (IPOs), if any, impact performance?
A. Suffolk: The Portfolio did not hold any derivatives or participate in anyIPOs during the first one-month period.
A. BlackRock: Pursuant to the Portfolio’s investment strategy, futurescontracts were used in the latter eleven-month period to equitize cashand prevent a cash drag on performance. The futures did notmeaningfully impact performance, however, due to their index
characteristics and size in relation to the Portfolio’s net assets. ThePortfolio participated in two IPOs during the latter eleven-month period,which detracted 11 basis points relative to the benchmark. (1)
(1) The Portfolio’s composition is subject to change. Holdings and weightings areas of December 31, 2019.
Change in Value of $10,000 Investment
ON BlackRock Advantage Large Cap Core Portfolio (A)S&P 500 Index (B)
5,000
10,000
15,000
20,000
25,000
30,000
35,000
$40,000
6/1
012
/10 6
/1112
/11 6
/1212
/12 6
/1312
/13 6
/1412
/14 6
/1512
/15 6
/1612
/16 6
/1712
/17 6
/1812
/18 6
/19
12/3
1/09
12/1
9
$35,666 (B)
$30,660 (A)
Hypothetical illustration based on past performance. Future performance will vary.The Portfolio’s returns reflect reinvested dividends. The Portfolio’s holdings maydiffer significantly from the securities in the index. The index is unmanaged andtherefore does not reflect the cost of portfolio management and accounting.
The S&P 500 Index is a capitalization-weighted index designed to measureperformance of the broad domestic economy through changes in the aggregatemarket value of 500 stocks representing all major industries. The index presentedincludes the effects of reinvested dividends.
Past performance is no guarantee of future results. Redemption of fund sharescould have tax implications unique to each shareholder.
Ohio National Fund, Inc. ON BlackRock Advantage Large Cap Core Portfolio (Unaudited) (Continued)
75 (continued)

Portfolio Composition as of December 31, 2019 (1)
% of Net AssetsCommon Stocks (4) 99.5Rights (4) 0.0Money Market Funds
Less Net Liabilities 0.5100.0
Top 10 Portfolio Holdings as of December 31, 2019 (1) (2) (3)
% of Net Assets1. Microsoft Corp. 5.12. Apple, Inc. 4.73. Amazon.com, Inc. 3.24. Mastercard, Inc. Class A 2.15. Facebook, Inc. Class A 2.06. Johnson & Johnson 2.07. Exxon Mobil Corp. 2.08. Berkshire Hathaway, Inc. Class B 1.89. Alphabet, Inc. Class C 1.5
10. Alphabet, Inc. Class A 1.5
(1) Composition of Portfolio subject to change.(2) Short-term investments have been excluded from the list of Top 10 Portfolio Holdings.(3) Top 10 Portfolio Holdings is presented at an individual security level. Total investment exposure by issuer may be higher.(4) Sectors (Common Stocks, Rights):
% of Net AssetsInformation Technology 23.0Health Care 14.5Financials 13.5Communication Services 10.8Consumer Discretionary 9.5Industrials 9.5Consumer Staples 6.8Energy 4.0Utilities 3.3Real Estate 2.4Materials 2.2
99.5
Ohio National Fund, Inc. ON BlackRock Advantage Large Cap Core Portfolio (Unaudited) (Continued)
76

Common Stocks – 99.5% Shares Value
COMMUNICATION SERVICES – 10.8%Activision Blizzard, Inc. (Entertainment) . . . . . 1,558 $ 92,576Alphabet, Inc. Class A (Interactive Media &
Svs.) . . . . . . . . . . . . . . . . . . . . . . . . . . (a) 4,723 6,325,939Alphabet, Inc. Class C (Interactive Media &
Svs.) . . . . . . . . . . . . . . . . . . . . . . . . . . (a) 4,844 6,476,525AMC Networks, Inc. Class A (Media) . . . . . . . (a) 16,442 649,459AT&T, Inc. (Diversified Telecom. Svs.) . . . . . . . 78,137 3,053,594CenturyLink, Inc. (Diversified Telecom. Svs.). . . 31,698 418,730Cinemark Holdings, Inc. (Entertainment) . . . . . 5,827 197,244Comcast Corp. Class A (Media). . . . . . . . . . . 43,322 1,948,190Discovery, Inc. Class A (Media) . . . . . . . . . . (a) 24,570 804,422Electronic Arts, Inc. (Entertainment). . . . . . . . (a) 5,831 626,891Facebook, Inc. Class A (Interactive Media &
Svs.) . . . . . . . . . . . . . . . . . . . . . . . . . . (a) 42,920 8,809,330Interpublic Group of Cos., Inc. / The (Media) . . 75,289 1,739,176Live Nation Entertainment, Inc. (Entertainment). (a) 6,883 491,928Netflix, Inc. (Entertainment) . . . . . . . . . . . . . (a) 998 322,923Pinterest, Inc. Class A (Interactive Media &
Svs.) . . . . . . . . . . . . . . . . . . . . . . . . . . (a) 10,540 196,465Sirius XM Holdings, Inc. (Media) . . . . . . . . . . 287,667 2,056,819Take-Two Interactive Software, Inc.
(Entertainment) . . . . . . . . . . . . . . . . . . . (a) 5,993 733,723Telephone & Data Systems, Inc. (Wireless
Telecom. Svs.). . . . . . . . . . . . . . . . . . . . 38,090 968,629TripAdvisor, Inc. (Interactive Media & Svs.) . . . 7,010 212,964Twitter, Inc. (Interactive Media & Svs.) . . . . . . (a) 13,357 428,092United States Cellular Corp. (Wireless Telecom.
Svs.) . . . . . . . . . . . . . . . . . . . . . . . . . . (a) 19,894 720,760Verizon Communications, Inc. (Diversified
Telecom. Svs.). . . . . . . . . . . . . . . . . . . . 78,465 4,817,751ViacomCBS, Inc. Class A (Media) . . . . . . . . . 5,452 244,631ViacomCBS, Inc. Class B (Media) . . . . . . . . . 23,157 971,899Walt Disney Co. / The (Entertainment). . . . . . . 16,995 2,457,987Yelp, Inc. (Interactive Media & Svs.). . . . . . . . (a) 7,519 261,887Zynga, Inc. Class A (Entertainment) . . . . . . . . (a) 104,690 640,703
46,669,237
CONSUMER DISCRETIONARY – 9.5%Alibaba Group Holding Ltd. – ADR (Internet &
Direct Marketing Retail). . . . . . . . . . . . . . (a) 2,347 497,799Amazon.com, Inc. (Internet & Direct Marketing
Retail) . . . . . . . . . . . . . . . . . . . . . . . . . (a) 7,554 13,958,583AutoNation, Inc. (Specialty Retail) . . . . . . . . . (a) 973 47,317Booking Holdings, Inc. (Internet & Direct
Marketing Retail) . . . . . . . . . . . . . . . . . . (a) 59 121,170Boyd Gaming Corp. (Hotels, Restaurants &
Leisure) . . . . . . . . . . . . . . . . . . . . . . . . 18,108 542,153Carnival Corp. (Hotels, Restaurants & Leisure) . 17,226 875,598Chipotle Mexican Grill, Inc. (Hotels,
Restaurants & Leisure) . . . . . . . . . . . . . . (a) 94 78,688Choice Hotels International, Inc. (Hotels,
Restaurants & Leisure) . . . . . . . . . . . . . . 16,290 1,684,875D.R. Horton, Inc. (Household Durables) . . . . . . 14,787 780,014Darden Restaurants, Inc. (Hotels, Restaurants
& Leisure) . . . . . . . . . . . . . . . . . . . . . . 18,228 1,987,034Dollar General Corp. (Multiline Retail). . . . . . . 13,837 2,158,295Dunkin’ Brands Group, Inc. (Hotels,
Restaurants & Leisure) . . . . . . . . . . . . . . 1,702 128,569Extended Stay America, Inc. (Hotels,
Restaurants & Leisure) . . . . . . . . . . . . . . 4,381 65,102Ford Motor Co. (Automobiles) . . . . . . . . . . . . 107,448 999,266General Motors Co. (Automobiles) . . . . . . . . . 36,600 1,339,560Gentex Corp. (Auto Components). . . . . . . . . . 3,072 89,027Goodyear Tire & Rubber Co. / The
(Auto Components). . . . . . . . . . . . . . . . . 27,686 430,656H&R Block, Inc. (Diversified Consumer Svs.) . . 28,212 662,418Home Depot, Inc. / The (Specialty Retail). . . . . 26,923 5,879,445International Game Technology PLC (Hotels,
Restaurants & Leisure) . . . . . . . . . . . . . . 3,938 58,952
Common Stocks (Continued) Shares Value
CONSUMER DISCRETIONARY (continued)McDonald’s Corp. (Hotels, Restaurants &
Leisure) . . . . . . . . . . . . . . . . . . . . . . . . 13,074 $ 2,583,553Melco Resorts & Entertainment Ltd. – ADR
(Hotels, Restaurants & Leisure) . . . . . . . . . 8,957 216,491NIKE, Inc. Class B (Textiles, Apparel & Luxury
Goods) . . . . . . . . . . . . . . . . . . . . . . . . 32,891 3,332,187O’Reilly Automotive, Inc. (Specialty Retail) . . . . (a) 552 241,920Penn National Gaming, Inc. (Hotels,
Restaurants & Leisure) . . . . . . . . . . . . . . (a) 5,480 140,069Pool Corp. (Distributors) . . . . . . . . . . . . . . . 217 46,086Ralph Lauren Corp. (Textiles, Apparel & Luxury
Goods) . . . . . . . . . . . . . . . . . . . . . . . . 3,684 431,838Starbucks Corp. (Hotels, Restaurants &
Leisure) . . . . . . . . . . . . . . . . . . . . . . . . 1,616 142,079Target Corp. (Multiline Retail) . . . . . . . . . . . . 7,600 974,396Texas Roadhouse, Inc. (Hotels, Restaurants &
Leisure) . . . . . . . . . . . . . . . . . . . . . . . . 9,787 551,204Wyndham Destinations, Inc. (Hotels,
Restaurants & Leisure) . . . . . . . . . . . . . . 1,219 63,01041,107,354
CONSUMER STAPLES – 6.8%Altria Group, Inc. (Tobacco) . . . . . . . . . . . . . 23,902 1,192,949Anheuser-Busch InBev SA / N.V. – ADR
(Beverages) . . . . . . . . . . . . . . . . . . . . . 1,423 116,743Church & Dwight Co., Inc.
(Household Products) . . . . . . . . . . . . . . . 17,126 1,204,643Coca-Cola Co. / The (Beverages). . . . . . . . . . 35,790 1,980,976Coca-Cola European Partners PLC
(Beverages) . . . . . . . . . . . . . . . . . . . . . 6,824 347,205Costco Wholesale Corp. (Food & Staples
Retailing) . . . . . . . . . . . . . . . . . . . . . . . 20,150 5,922,488Estee Lauder Cos., Inc. / The Class A
(Personal Products) . . . . . . . . . . . . . . . . 15,622 3,226,568Hershey Co. / The (Food Products). . . . . . . . . 25,493 3,746,961Hormel Foods Corp. (Food Products) . . . . . . . 12,378 558,372Molson Coors Brewing Co. Class B
(Beverages) . . . . . . . . . . . . . . . . . . . . . 5,468 294,725Monster Beverage Corp. (Beverages) . . . . . . (a) 8,640 549,072PepsiCo, Inc. (Beverages) . . . . . . . . . . . . . . 25,288 3,456,111Performance Food Group Co. (Food & Staples
Retailing) . . . . . . . . . . . . . . . . . . . . . . . (a) 6,909 355,675Philip Morris International, Inc. (Tobacco) . . . . 7,196 612,308Procter & Gamble Co. / The
(Household Products) . . . . . . . . . . . . . . . 40,687 5,081,806Walmart, Inc. (Food & Staples Retailing) . . . . . 7,099 843,645
29,490,247
ENERGY – 4.0%Chevron Corp. (Oil, Gas & Consumable Fuels) . . 668 80,501ConocoPhillips (Oil, Gas & Consumable Fuels) . 14,712 956,721Continental Resources, Inc. (Oil, Gas &
Consumable Fuels) . . . . . . . . . . . . . . . . . 13,371 458,625Devon Energy Corp. (Oil, Gas & Consumable
Fuels) . . . . . . . . . . . . . . . . . . . . . . . . . 4,537 117,826EOG Resources, Inc. (Oil, Gas & Consumable
Fuels) . . . . . . . . . . . . . . . . . . . . . . . . . 31,927 2,674,206Exxon Mobil Corp. (Oil, Gas & Consumable
Fuels) . . . . . . . . . . . . . . . . . . . . . . . . . 120,320 8,395,930Marathon Oil Corp. (Oil, Gas & Consumable
Fuels) . . . . . . . . . . . . . . . . . . . . . . . . . 10,233 138,964Marathon Petroleum Corp. (Oil, Gas &
Consumable Fuels) . . . . . . . . . . . . . . . . . 28,620 1,724,355National Oilwell Varco, Inc. (Energy Equip. &
Svs.) . . . . . . . . . . . . . . . . . . . . . . . . . . 3,179 79,634Patterson-UTI Energy, Inc. (Energy Equip. &
Svs.) . . . . . . . . . . . . . . . . . . . . . . . . . . 16,894 177,387Phillips 66 (Oil, Gas & Consumable Fuels) . . . . 4,502 501,568TechnipFMC PLC (Energy Equip. & Svs.) . . . . . 8,381 179,689
Ohio National Fund, Inc. ON BlackRock Advantage Large Cap Core Portfolio
Schedule of Investments December 31, 2019
77 (continued)

Common Stocks (Continued) Shares Value
ENERGY (continued)Valero Energy Corp. (Oil, Gas & Consumable
Fuels) . . . . . . . . . . . . . . . . . . . . . . . . . 11,685 $ 1,094,300Williams Cos., Inc. / The (Oil, Gas &
Consumable Fuels) . . . . . . . . . . . . . . . . . 25,870 613,63617,193,342
FINANCIALS – 13.5%Affiliated Managers Group, Inc.
(Capital Markets) . . . . . . . . . . . . . . . . . . 5,076 430,140Allstate Corp. / The (Insurance) . . . . . . . . . . 21,665 2,436,229Ally Financial, Inc. (Consumer Finance). . . . . . 33,526 1,024,555American Express Co. (Consumer Finance) . . . 16,276 2,026,199Aon PLC (Insurance) . . . . . . . . . . . . . . . . . 636 132,472Arthur J. Gallagher & Co. (Insurance) . . . . . . . 6,291 599,092AXA Equitable Holdings, Inc. (Diversified
Financial Svs.). . . . . . . . . . . . . . . . . . . . 2,763 68,467Bank of America Corp. (Banks) . . . . . . . . . . . 113,685 4,003,986Bank of New York Mellon Corp. / The
(Capital Markets) . . . . . . . . . . . . . . . . . . 15,709 790,634Bank OZK (Banks) . . . . . . . . . . . . . . . . . . . 2,867 87,458Berkshire Hathaway, Inc. Class B (Diversified
Financial Svs.). . . . . . . . . . . . . . . . . . . . (a) 34,341 7,778,236Capital One Financial Corp.
(Consumer Finance) . . . . . . . . . . . . . . . . 14,592 1,501,663Charles Schwab Corp. / The (Capital Markets) . 30,511 1,451,103Chubb Ltd. (Insurance) . . . . . . . . . . . . . . . . 2,141 333,268Cincinnati Financial Corp. (Insurance) . . . . . . 15,600 1,640,340CIT Group, Inc. (Banks) . . . . . . . . . . . . . . . . 18,181 829,599Citizens Financial Group, Inc. (Banks) . . . . . . . 11,015 447,319CME Group, Inc. (Capital Markets). . . . . . . . . 6,520 1,308,694Comerica, Inc. (Banks) . . . . . . . . . . . . . . . . 1,168 83,804Cullen / Frost Bankers, Inc. (Banks) . . . . . . . . 8,310 812,552East West Bancorp, Inc. (Banks) . . . . . . . . . . 6,539 318,449Essent Group Ltd. (Thrifts & Mortgage
Finance) . . . . . . . . . . . . . . . . . . . . . . . 5,041 262,082Evercore, Inc. Class A (Capital Markets) . . . . . 2,542 190,040FactSet Research Systems, Inc.
(Capital Markets) . . . . . . . . . . . . . . . . . . 5,187 1,391,672First American Financial Corp. (Insurance) . . . 19,667 1,146,979First Citizens BancShares, Inc. Class A (Banks). 348 185,209First Horizon National Corp. (Banks) . . . . . . . . 22,621 374,604Globe Life, Inc. (Insurance) . . . . . . . . . . . . . 11,906 1,253,107Intercontinental Exchange, Inc.
(Capital Markets) . . . . . . . . . . . . . . . . . . 28,645 2,651,095Invesco Ltd. (Capital Markets) . . . . . . . . . . . 1,032 18,555JPMorgan Chase & Co. (Banks) . . . . . . . . . . 34,662 4,831,883Marsh & McLennan Cos., Inc. (Insurance). . . . 4,897 545,575MetLife, Inc. (Insurance) . . . . . . . . . . . . . . . 25,835 1,316,810Moody’s Corp. (Capital Markets) . . . . . . . . . . 4,646 1,103,007Morgan Stanley (Capital Markets) . . . . . . . . . 58,165 2,973,395Nasdaq, Inc. (Capital Markets) . . . . . . . . . . . 1,266 135,589Progressive Corp. / The (Insurance) . . . . . . . . 7,844 567,827Prudential Financial, Inc. (Insurance) . . . . . . . 14,088 1,320,609S&P Global, Inc. (Capital Markets). . . . . . . . . 12,312 3,361,792SEI Investments Co. (Capital Markets) . . . . . . 936 61,289TD Ameritrade Holding Corp. (Capital Markets) . 8,026 398,892Truist Financial Corp. (Banks) . . . . . . . . . . . . 6,007 338,314U.S. Bancorp (Banks) . . . . . . . . . . . . . . . . . 26,058 1,544,979Unum Group (Insurance) . . . . . . . . . . . . . . . 26,993 787,116Wells Fargo & Co. (Banks) . . . . . . . . . . . . . . 52,629 2,831,440Willis Towers Watson PLC (Insurance) . . . . . . 2,073 418,622
58,114,741
HEALTH CARE – 14.5%Abbott Laboratories (Health Care Equip. &
Supplies) . . . . . . . . . . . . . . . . . . . . . . . 3,310 287,507AbbVie, Inc. (Biotechnology) . . . . . . . . . . . . 36,912 3,268,188Alexion Pharmaceuticals, Inc. (Biotechnology) . (a) 2,711 293,195Allergan PLC (Pharmaceuticals) . . . . . . . . . . 862 164,789
Common Stocks (Continued) Shares Value
HEALTH CARE (continued)AmerisourceBergen Corp. (Health Care
Providers & Svs.) . . . . . . . . . . . . . . . . . . 8,393 $ 713,573Amgen, Inc. (Biotechnology) . . . . . . . . . . . . 8,764 2,112,737Anthem, Inc. (Health Care Providers & Svs.). . . 10,526 3,179,168Biogen, Inc. (Biotechnology) . . . . . . . . . . . . (a) 3,347 993,155Bristol-Myers Squibb Co. (Pharmaceuticals) . . 58,336 3,744,588Cigna Corp. (Health Care Providers & Svs.) . . . 425 86,908CVS Health Corp. (Health Care Providers &
Svs.) . . . . . . . . . . . . . . . . . . . . . . . . . . 37,038 2,751,553DexCom, Inc. (Health Care Equip. & Supplies). . (a) 1,500 328,110Edwards Lifesciences Corp. (Health Care
Equip. & Supplies) . . . . . . . . . . . . . . . . . (a) 9,249 2,157,699Gilead Sciences, Inc. (Biotechnology) . . . . . . 90,720 5,894,986Hologic, Inc. (Health Care Equip. & Supplies) . . (a) 22,356 1,167,207Humana, Inc. (Health Care Providers & Svs.) . . 2,165 793,516IDEXX Laboratories, Inc. (Health Care Equip. &
Supplies) . . . . . . . . . . . . . . . . . . . . . . . (a) 2,993 781,562Incyte Corp. (Biotechnology) . . . . . . . . . . . . (a) 2,375 207,385Johnson & Johnson (Pharmaceuticals). . . . . . 58,238 8,495,177McKesson Corp. (Health Care Providers &
Svs.) . . . . . . . . . . . . . . . . . . . . . . . . . . 1,377 190,467Medtronic PLC (Health Care Equip. & Supplies). 8,260 937,097Merck & Co., Inc. (Pharmaceuticals) . . . . . . . 56,670 5,154,137Mylan N.V. (Pharmaceuticals) . . . . . . . . . . . (a) 19,958 401,156Pfizer, Inc. (Pharmaceuticals) . . . . . . . . . . . . 76,588 3,000,718Regeneron Pharmaceuticals, Inc.
(Biotechnology) . . . . . . . . . . . . . . . . . . . (a) 3,225 1,210,923Stryker Corp. (Health Care Equip. & Supplies) . . 24,626 5,169,982Thermo Fisher Scientific, Inc. (Life Sciences
Tools & Svs.). . . . . . . . . . . . . . . . . . . . . 1,448 470,412United Therapeutics Corp. (Biotechnology) . . . (a) 2,275 200,382UnitedHealth Group, Inc. (Health Care
Providers & Svs.) . . . . . . . . . . . . . . . . . . 11,035 3,244,069Veeva Systems, Inc. Class A (Health Care
Technology) . . . . . . . . . . . . . . . . . . . . . (a) 3,488 490,622Vertex Pharmaceuticals, Inc. (Biotechnology) . (a) 8,833 1,933,985WellCare Health Plans, Inc. (Health Care
Providers & Svs.) . . . . . . . . . . . . . . . . . . (a) 807 266,479Zoetis, Inc. (Pharmaceuticals) . . . . . . . . . . . 16,415 2,172,525
62,263,957
INDUSTRIALS – 9.5%3M Co. (Industrial Conglomerates). . . . . . . . . 2,417 426,407AGCO Corp. (Machinery) . . . . . . . . . . . . . . . 3,402 262,804Allegion PLC (Building Products) . . . . . . . . . . 26,933 3,354,236AMETEK, Inc. (Electrical Equip.) . . . . . . . . . . 16,432 1,638,928Beacon Roofing Supply, Inc. (Trading
Companies & Distributors) . . . . . . . . . . . . (a) 2,067 66,103Boeing Co. / The (Aerospace & Defense). . . . . 1,091 355,404Copart, Inc. (Commercial Svs. & Supplies) . . . . (a) 1,557 141,594CSX Corp. (Road & Rail) . . . . . . . . . . . . . . . 9,806 709,562Curtiss-Wright Corp. (Aerospace & Defense) . . 719 101,300Delta Air Lines, Inc. (Airlines) . . . . . . . . . . . . 7,226 422,576EMCOR Group, Inc. (Construction &
Engineering) . . . . . . . . . . . . . . . . . . . . . 479 41,338Expeditors International of Washington, Inc.
(Air Freight & Logistics) . . . . . . . . . . . . . . 2,989 233,202Fluor Corp. (Construction & Engineering). . . . . 16,084 303,666GATX Corp. (Trading Companies &
Distributors) . . . . . . . . . . . . . . . . . . . . . 19,276 1,597,017HEICO Corp. (Aerospace & Defense) . . . . . . . 2,863 326,811Hexcel Corp. (Aerospace & Defense) . . . . . . . 1,664 121,988Honeywell International, Inc.
(Industrial Conglomerates) . . . . . . . . . . . . 13,231 2,341,887Hubbell, Inc. (Electrical Equip.) . . . . . . . . . . . 7,996 1,181,969IDEX Corp. (Machinery) . . . . . . . . . . . . . . . 6,231 1,071,732IHS Markit Ltd. (Professional Svs.). . . . . . . . . (a) 824 62,088Illinois Tool Works, Inc. (Machinery) . . . . . . . 439 78,858Ingersoll-Rand PLC (Machinery) . . . . . . . . . . 2,400 319,008
Ohio National Fund, Inc. ON BlackRock Advantage Large Cap Core Portfolio (Continued)
Schedule of Investments December 31, 2019
78 (continued)
Common Stocks (Continued) Shares Value
INDUSTRIALS (continued)Landstar System, Inc. (Road & Rail) . . . . . . . . 5,337 $ 607,724Lockheed Martin Corp. (Aerospace &
Defense) . . . . . . . . . . . . . . . . . . . . . . . 15,864 6,177,124MasTec, Inc. (Construction & Engineering) . . . (a) 10,826 694,596Northrop Grumman Corp. (Aerospace &
Defense) . . . . . . . . . . . . . . . . . . . . . . . 4,308 1,481,823Old Dominion Freight Line, Inc. (Road & Rail) . . 732 138,919Oshkosh Corp. (Machinery) . . . . . . . . . . . . . 24,114 2,282,390PACCAR, Inc. (Machinery) . . . . . . . . . . . . . . 62,078 4,910,370Raytheon Co. (Aerospace & Defense). . . . . . . 4,534 996,301Robert Half International, Inc.
(Professional Svs.) . . . . . . . . . . . . . . . . . 22,336 1,410,518Roper Technologies, Inc.
(Industrial Conglomerates) . . . . . . . . . . . . 5,469 1,937,284Snap-on, Inc. (Machinery) . . . . . . . . . . . . . . 3,869 655,409Teledyne Technologies, Inc. (Aerospace &
Defense) . . . . . . . . . . . . . . . . . . . . . . . (a) 6,545 2,268,104United Airlines Holdings, Inc. (Airlines) . . . . . . (a) 16,904 1,489,073United Parcel Service, Inc. Class B (Air Freight
& Logistics) . . . . . . . . . . . . . . . . . . . . . 4,446 520,449Xylem, Inc. (Machinery) . . . . . . . . . . . . . . . 1,428 112,512
40,841,074
INFORMATION TECHNOLOGY – 23.0%Accenture PLC Class A (IT Svs.) . . . . . . . . . . 833 175,405Adobe, Inc. (Software) . . . . . . . . . . . . . . . . (a) 3,128 1,031,646Apple, Inc. (Tech. Hardware, Storage &
Periph.) . . . . . . . . . . . . . . . . . . . . . . . . 69,310 20,352,881Applied Materials, Inc. (Semiconductors &
Equip.) . . . . . . . . . . . . . . . . . . . . . . . . 32,130 1,961,215Automatic Data Processing, Inc. (IT Svs.) . . . . 25,457 4,340,418Avnet, Inc. (Electronic Equip., Instr. & Comp.) . . 2,724 115,607Broadridge Financial Solutions, Inc. (IT Svs.) . . 5,931 732,716CDW Corp. (Electronic Equip., Instr. & Comp.) . . 15,677 2,239,303Cirrus Logic, Inc. (Semiconductors & Equip.) . . (a) 12,998 1,071,165Cisco Systems, Inc. (Communications Equip.) . . 46,490 2,229,660GoDaddy, Inc. Class A (IT Svs.) . . . . . . . . . . . (a) 2,181 148,134HP, Inc. (Tech. Hardware, Storage & Periph.) . . 23,680 486,624Intel Corp. (Semiconductors & Equip.) . . . . . . 89,181 5,337,483International Business Machines Corp.
(IT Svs.) . . . . . . . . . . . . . . . . . . . . . . . . 5,056 677,706Intuit, Inc. (Software) . . . . . . . . . . . . . . . . . 12,952 3,392,517Jack Henry & Associates, Inc. (IT Svs.). . . . . . 4,864 708,539Lam Research Corp. (Semiconductors &
Equip.) . . . . . . . . . . . . . . . . . . . . . . . . 7,921 2,316,100Manhattan Associates, Inc. (Software) . . . . . . (a) 1,084 86,449Mastercard, Inc. Class A (IT Svs.) . . . . . . . . . 30,215 9,021,897Micron Technology, Inc. (Semiconductors &
Equip.) . . . . . . . . . . . . . . . . . . . . . . . . (a) 14,196 763,461Microsoft Corp. (Software) . . . . . . . . . . . . . 139,650 22,022,805National Instruments Corp. (Electronic Equip.,
Instr. & Comp.) . . . . . . . . . . . . . . . . . . . 18,396 778,887NVIDIA Corp. (Semiconductors & Equip.) . . . . 12,335 2,902,426Paychex, Inc. (IT Svs.) . . . . . . . . . . . . . . . . 48,217 4,101,338Paylocity Holding Corp. (Software) . . . . . . . . (a) 2,459 297,096PayPal Holdings, Inc. (IT Svs.) . . . . . . . . . . . (a) 6,000 649,020QUALCOMM, Inc. (Semiconductors & Equip.) . . 9,645 850,978salesforce.com, Inc. (Software) . . . . . . . . . . (a) 20,216 3,287,930ServiceNow, Inc. (Software) . . . . . . . . . . . . (a) 7,573 2,138,009Skyworks Solutions, Inc. (Semiconductors &
Equip.) . . . . . . . . . . . . . . . . . . . . . . . . 2,880 348,134Texas Instruments, Inc. (Semiconductors &
Equip.) . . . . . . . . . . . . . . . . . . . . . . . . 13,827 1,773,866Visa, Inc. (IT Svs.) . . . . . . . . . . . . . . . . . . . 11,635 2,186,217Workday, Inc. Class A (Software) . . . . . . . . . (a) 2,851 468,847
98,994,479
Common Stocks (Continued) Shares Value
MATERIALS – 2.2%Air Products & Chemicals, Inc. (Chemicals) . . . 4,344 $ 1,020,796Alcoa Corp. (Metals & Mining) . . . . . . . . . . . (a) 27,017 581,136Barrick Gold Corp. (Metals & Mining) . . . . . . . 8,657 160,934CF Industries Holdings, Inc. (Chemicals) . . . . . 6,197 295,845Domtar Corp. (Paper & Forest Products) . . . . . 25,229 964,757Ecolab, Inc. (Chemicals) . . . . . . . . . . . . . . . 8,762 1,690,978LyondellBasell Industries N.V. Class A
(Chemicals) . . . . . . . . . . . . . . . . . . . . . 5,889 556,393Mosaic Co. / The (Chemicals) . . . . . . . . . . . . 32,728 708,234PPG Industries, Inc. (Chemicals) . . . . . . . . . . 1,162 155,115Reliance Steel & Aluminum Co. (Metals &
Mining) . . . . . . . . . . . . . . . . . . . . . . . . 3,804 455,567Scotts Miracle-Gro Co. / The (Chemicals) . . . . 1,139 120,939Sherwin-Williams Co. / The (Chemicals) . . . . . 2,355 1,374,237Steel Dynamics, Inc. (Metals & Mining) . . . . . 6,339 215,779Summit Materials, Inc. Class A
(Construction Materials) . . . . . . . . . . . . . (a) 13,083 312,684Westrock Co. (Containers & Packaging) . . . . . 15,448 662,874
9,276,268
REAL ESTATE – 2.4%Boston Properties, Inc. (Equity REIT) . . . . . . . 3,478 479,477Brandywine Realty Trust (Equity REIT) . . . . . . 4,095 64,496Equity Residential (Equity REIT). . . . . . . . . . . 7,958 643,961Host Hotels & Resorts, Inc. (Equity REIT) . . . . . 34,528 640,494Invitation Homes, Inc. (Equity REIT) . . . . . . . . 51,224 1,535,183Lamar Advertising Co. Class A (Equity REIT) . . . 11,537 1,029,793National Retail Properties, Inc. (Equity REIT) . . 7,950 426,279Park Hotels & Resorts, Inc. (Equity REIT) . . . . . 60,466 1,564,255Prologis, Inc. (Equity REIT). . . . . . . . . . . . . . 2,802 249,770Regency Centers Corp. (Equity REIT) . . . . . . . 1,717 108,326RLJ Lodging Trust (Equity REIT). . . . . . . . . . . 26,191 464,105Simon Property Group, Inc. (Equity REIT) . . . . . 19,655 2,927,809STAG Industrial, Inc. (Equity REIT) . . . . . . . . . 3,512 110,874Ventas, Inc. (Equity REIT) . . . . . . . . . . . . . . 1,519 87,707
10,332,529
UTILITIES – 3.3%Ameren Corp. (Multi-Utilities) . . . . . . . . . . . . 21,551 1,655,117American Water Works Co., Inc.
(Water Utilities) . . . . . . . . . . . . . . . . . . . 7,883 968,426Atmos Energy Corp. (Gas Utilities) . . . . . . . . . 1,631 182,444Consolidated Edison, Inc. (Multi-Utilities) . . . . 7,117 643,875DTE Energy Co. (Multi-Utilities) . . . . . . . . . . . 36,921 4,794,930Eversource Energy (Electric Utilities) . . . . . . . 508 43,216Pinnacle West Capital Corp. (Electric Utilities) . 9,197 827,086Southwest Gas Holdings, Inc. (Gas Utilities) . . . 4,702 357,211Xcel Energy, Inc. (Electric Utilities) . . . . . . . . 75,472 4,791,717
14,264,022Total Common Stocks (Cost $386,574,836) . . . . $428,547,250
Rights – 0.0% Quantity Value
HEALTH CARE – 0.0%Bristol-Myers Squibb Co. (Pharmaceuticals) . . (a) 11,619 $ 34,973Total Rights (Cost $24,749) . . . . . . . . . . . . . . $ 34,973
Money Market Funds – 1.0% Shares Value
State Street Institutional Liquid Reserves FundInstitutional Class, 1.734% . . . . . . . . . . . . . (b) 4,302,479 $ 4,302,909
Total Money Market Funds (Cost $4,302,918) . . . . . . $ 4,302,909Total Investments – 100.5% (Cost $390,902,503) . . . . . . . (c) $432,885,132Liabilities in Excess of Other Assets – (0.5)% . . . . . . . (d) (2,315,165)Net Assets – 100.0% $430,569,967
Ohio National Fund, Inc. ON BlackRock Advantage Large Cap Core Portfolio (Continued)
Schedule of Investments December 31, 2019
79 (continued)

Percentages are stated as a percent of net assets.Abbreviations:
ADR: American Depositary ReceiptsFootnotes:
(a) Non-income producing security.(b) Rate represents the seven-day yield at December 31, 2019.(c) Represents cost for financial reporting purposes, which may differ from cost basis for federal income tax purposes. See also Note 8 of the Notes to Financial
Statements.(d) Includes $195,300 of cash pledged as collateral for the futures contracts outstanding at December 31, 2019. See also the following Schedule of Open Futures
Contracts.
The accompanying notes are an integral part of these financial statements.
Schedule of Open Futures Contracts December 31, 2019
DescriptionNumber ofcontracts Expiration Date
NotionalAmount Value
UnrealizedAppreciation
(Depreciation)
Variation MarginReceivable(Payable)
CME E-mini S&P 500 Index - Long 31 March 20, 2020 $4,929,016 $5,008,205 $79,189 $7,210
The accompanying notes are an integral part of these financial statements.
Ohio National Fund, Inc. ON BlackRock Advantage Large Cap Core Portfolio (Continued)
Schedule of Investments December 31, 2019
80

Objective/Strategy
The ON BlackRock Advantage Small Cap Growth Portfolio (formerly theON Bryton Growth Portfolio) seeks long-term growth of capital byinvesting, under normal circumstances, at least 80% of its net assets instocks of companies with a market capitalization at the time ofinvestment that is no greater than the largest market capitalization of acompany in the Russell 2000 Index for the previous twelve months.
Performance as of December 31, 2019
Average Annual returnsOne year 34.07%Five years 9.12%Ten years 11.21%
Past performance does not guarantee future results. The performance dataquoted represents past performance and current returns may be lower or higher.Total return figures include change in share price and reinvestment of dividendsand capital gains. The investment return and principal value will fluctuate so thatan investor’s shares, when redeemed, may be worth more or less than the originalcost. To obtain performance information up to the most recent month end, calltoll-free 1-877-781-6392.
The Portfolio is not open to direct retail investment. Beneficial interest in shares isobtained solely by purchase of variable life insurance policies and variable annuitycontracts. Actual performance results for variable annuity and variable universallife contracts will be lower due to contract charges. Consult your contract forapplicable charges.
Total expense ratio is 0.83% per the Fund’s prospectus dated November 22, 2019.Additional information pertaining to the Portfolio’s expense ratio as ofDecember 31, 2019 can be found in the Portfolio’s Financial Highlights.
Comments from Sub-Adviser
Q. How did the Portfolio perform in comparison to its benchmark duringthe reporting period?
A. For the year ended December 31, 2019, the Portfolio returned 34.07%versus 28.48% for its benchmark, the Russell 2000 Growth Index.
Effective February 1, 2019, BlackRock Investment Management, LLC(“BlackRock”) replaced the Portfolio’s previous sub-adviser, SuffolkCapital Management, LLC (“Suffolk”). In conjunction with the change insub-adviser, the name of the Portfolio was changed from ON BrytonGrowth Portfolio to ON BlackRock Advantage Small Cap GrowthPortfolio. The Portfolio’s benchmark was unchanged.
For the period from January 1, 2019 to January 31, 2019 (the “firstone-month period”), the Portfolio returned 12.96% versus 11.55% for theRussell 2000 Growth Index
For the period from February 1, 2019 to December 31, 2019 (the “lattereleven-month period”), the Portfolio returned 18.69% versus 15.18% forthe Russell 2000 Growth Index.
Q. Were there specific market conditions, investment strategies, ortechniques that materially affected the Portfolio’s benchmark-relativeperformance during the reporting period?
A. Suffolk: For the first one-month period, there were no marketconditions, investment strategies, or techniques that materially affectedthe Portfolio’s benchmark relative performance.
A. BlackRock: Performance over the latter eleven-month period wasvery strong, as the Portfolio outperformed its benchmark. Encouragingly,performance across both fundamental-based and trend/sentiment-based insights was tremendously additive throughout theperiod. The Portfolio’s quality insights were especially positive, which
was unsurprising given investor preference for sustainable, high-qualitybusinesses amidst increased market uncertainty. Of note, conductingmachine learned text analysis of company news filings, most specifically8-K’s, contributed positively to performance. Evaluating companies on aseries of long-term sustainability measures and rewarding companieswith founder-led management structures were both beneficial as well,as they provided an alternative lens into company quality. Elsewhere,insights seeking to identify relative value opportunities were broadly flatfor the period. These signals detracted modestly early in the period, asinvestors sought out speculative growth opportunities at the expense ofcompany fundamentals. However, performance of these insightsrebounded slightly towards the end of the period, as market mentalityshifted and investors began to seek out areas of relative value.
Despite an increase in market volatility and inflection points, thePortfolio’s investment insights were able to successfully captureevolving trends in the marketplace and the sentiment of informed marketparticipants, as the Portfolio’s trend- and sentiment-based insightsfurther bolstered relative returns during the latter eleven-month period.Among these signals, using machine learned text analysis of companyconference calls to identify trends in longer-term company fundamentalswas particularly beneficial. Gauging investor sentiment based on thenumber of sell-side meetings with company management was alsoadditive, as was evaluating changes in company supply chains.
The Portfolio’s macro thematic insights contributed modestly throughoutthe latter eleven-month period as well, supported primarily by a signalmeasuring sensitivity to changes in foreign exchange rates.
Q. How did sector allocation and security selection each impact thePortfolio’s performance relative to its benchmark? For sector allocation,were there any factors that impacted the benchmark’s performancemore significantly than the Portfolio’s performance? For securityselection, was there anything specific regarding the Portfolio’s strategythat caused deviation from the benchmark?
A. Suffolk: For the first one-month period, sector allocation and stockselection both contributed positively to relative performance. Stockselection in Information Technology and Materials contributed to relativeoutperformance, while stock selection in Industrials detracted fromrelative performance.
A. BlackRock: The portfolio management team targets a relativelysector-neutral approach and seeks to derive the majority of its relativeperformance from security selection. That being said, a modestoverweight to the Industrials sector during the earlier months of the lattereleven-month period contributed to performance, as the sectoroutperformed the broader market. A modest underweight to Financialsthroughout much of the period also contributed, due to theunderperformance of Financials in the small cap growth space. On theother hand, a modest overweight to Communication Services companiesdetracted slightly, as that sector underperformed. (1)
The majority of relative outperformance for the latter eleven-monthperiod was driven by security selection. Security selection wasparticularly positive in the Consumer Discretionary sector, especiallyamong specialty retailers and internet and direct marketing retailers.Security selection was also very beneficial in the Information Technologysector, particularly among semiconductor, semiconductor equipment,and software companies. Selection in the Health Care and Industrialssectors further contributed to returns. In contrast, security selectionwithin the Energy sector, most notably in the energy equipment andservices industry, was a notable detractor from relative performance.Selection in the Communication Services sector hindered relativereturns as well. (1)
Q. Which holdings contributed the most to, and detracted the most from,the Portfolio’s benchmark-relative performance?
Ohio National Fund, Inc. ON BlackRock Advantage Small Cap Growth Portfolio (Unaudited)
81 (continued)
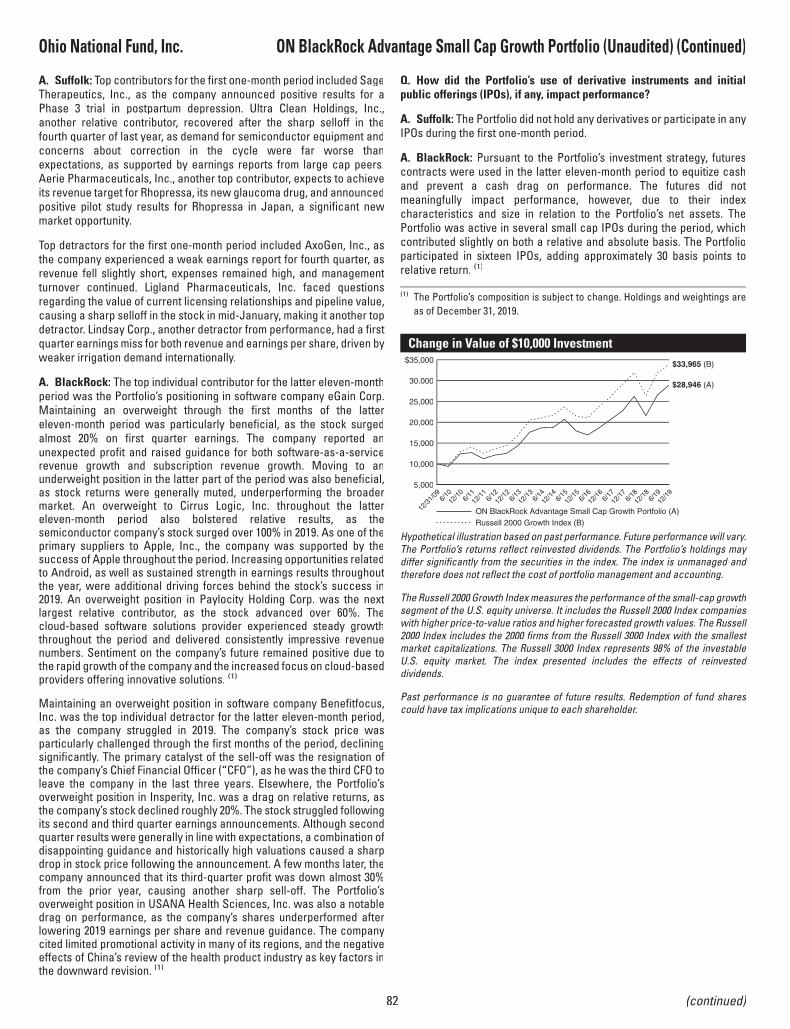
A. Suffolk: Top contributors for the first one-month period included SageTherapeutics, Inc., as the company announced positive results for aPhase 3 trial in postpartum depression. Ultra Clean Holdings, Inc.,another relative contributor, recovered after the sharp selloff in thefourth quarter of last year, as demand for semiconductor equipment andconcerns about correction in the cycle were far worse thanexpectations, as supported by earnings reports from large cap peers.Aerie Pharmaceuticals, Inc., another top contributor, expects to achieveits revenue target for Rhopressa, its new glaucoma drug, and announcedpositive pilot study results for Rhopressa in Japan, a significant newmarket opportunity.
Top detractors for the first one-month period included AxoGen, Inc., asthe company experienced a weak earnings report for fourth quarter, asrevenue fell slightly short, expenses remained high, and managementturnover continued. Ligland Pharmaceuticals, Inc. faced questionsregarding the value of current licensing relationships and pipeline value,causing a sharp selloff in the stock in mid-January, making it another topdetractor. Lindsay Corp., another detractor from performance, had a firstquarter earnings miss for both revenue and earnings per share, driven byweaker irrigation demand internationally.
A. BlackRock: The top individual contributor for the latter eleven-monthperiod was the Portfolio’s positioning in software company eGain Corp.Maintaining an overweight through the first months of the lattereleven-month period was particularly beneficial, as the stock surgedalmost 20% on first quarter earnings. The company reported anunexpected profit and raised guidance for both software-as-a-servicerevenue growth and subscription revenue growth. Moving to anunderweight position in the latter part of the period was also beneficial,as stock returns were generally muted, underperforming the broadermarket. An overweight to Cirrus Logic, Inc. throughout the lattereleven-month period also bolstered relative results, as thesemiconductor company’s stock surged over 100% in 2019. As one of theprimary suppliers to Apple, Inc., the company was supported by thesuccess of Apple throughout the period. Increasing opportunities relatedto Android, as well as sustained strength in earnings results throughoutthe year, were additional driving forces behind the stock’s success in2019. An overweight position in Paylocity Holding Corp. was the nextlargest relative contributor, as the stock advanced over 60%. Thecloud-based software solutions provider experienced steady growththroughout the period and delivered consistently impressive revenuenumbers. Sentiment on the company’s future remained positive due tothe rapid growth of the company and the increased focus on cloud-basedproviders offering innovative solutions. (1)
Maintaining an overweight position in software company Benefitfocus,Inc. was the top individual detractor for the latter eleven-month period,as the company struggled in 2019. The company’s stock price wasparticularly challenged through the first months of the period, decliningsignificantly. The primary catalyst of the sell-off was the resignation ofthe company’s Chief Financial Officer (“CFO”), as he was the third CFO toleave the company in the last three years. Elsewhere, the Portfolio’soverweight position in Insperity, Inc. was a drag on relative returns, asthe company’s stock declined roughly 20%. The stock struggled followingits second and third quarter earnings announcements. Although secondquarter results were generally in line with expectations, a combination ofdisappointing guidance and historically high valuations caused a sharpdrop in stock price following the announcement. A few months later, thecompany announced that its third-quarter profit was down almost 30%from the prior year, causing another sharp sell-off. The Portfolio’soverweight position in USANA Health Sciences, Inc. was also a notabledrag on performance, as the company’s shares underperformed afterlowering 2019 earnings per share and revenue guidance. The companycited limited promotional activity in many of its regions, and the negativeeffects of China’s review of the health product industry as key factors inthe downward revision. (1)
Q. How did the Portfolio’s use of derivative instruments and initialpublic offerings (IPOs), if any, impact performance?
A. Suffolk: The Portfolio did not hold any derivatives or participate in anyIPOs during the first one-month period.
A. BlackRock: Pursuant to the Portfolio’s investment strategy, futurescontracts were used in the latter eleven-month period to equitize cashand prevent a cash drag on performance. The futures did notmeaningfully impact performance, however, due to their indexcharacteristics and size in relation to the Portfolio’s net assets. ThePortfolio was active in several small cap IPOs during the period, whichcontributed slightly on both a relative and absolute basis. The Portfolioparticipated in sixteen IPOs, adding approximately 30 basis points torelative return. (1)
(1) The Portfolio’s composition is subject to change. Holdings and weightings areas of December 31, 2019.
Change in Value of $10,000 Investment
ON BlackRock Advantage Small Cap Growth Portfolio (A)Russell 2000 Growth Index (B)
5,000
10,000
15,000
20,000
25,000
30,000
$35,000
6/1
012
/10 6
/1112
/11 6
/1212
/12 6
/1312
/13 6
/1412
/14 6
/1512
/15 6
/1612
/16 6
/1712
/17 6
/1812
/18 6
/19
12/3
1/09
12/1
9
$33,965 (B)
$28,946 (A)
Hypothetical illustration based on past performance. Future performance will vary.The Portfolio’s returns reflect reinvested dividends. The Portfolio’s holdings maydiffer significantly from the securities in the index. The index is unmanaged andtherefore does not reflect the cost of portfolio management and accounting.
The Russell 2000 Growth Index measures the performance of the small-cap growthsegment of the U.S. equity universe. It includes the Russell 2000 Index companieswith higher price-to-value ratios and higher forecasted growth values. The Russell2000 Index includes the 2000 firms from the Russell 3000 Index with the smallestmarket capitalizations. The Russell 3000 Index represents 98% of the investableU.S. equity market. The index presented includes the effects of reinvesteddividends.
Past performance is no guarantee of future results. Redemption of fund sharescould have tax implications unique to each shareholder.
Ohio National Fund, Inc. ON BlackRock Advantage Small Cap Growth Portfolio (Unaudited) (Continued)
82 (continued)

Portfolio Composition as of December 31, 2019 (1)
% of Net AssetsCommon Stocks (4) 99.2Rights (4) 0.0Money Market Funds
Less Net Liabilities 0.8100.0
Top 10 Portfolio Holdings as of December 31, 2019 (1) (2) (3)
% of Net Assets1. Texas Roadhouse, Inc. 1.42. AMN Healthcare Services, Inc. 1.23. Performance Food Group Co. 1.14. TriState Capital Holdings, Inc. 1.15. HealthEquity, Inc. 1.16. Benefitfocus, Inc. 1.07. SPS Commerce, Inc. 1.08. Ryman Hospitality Properties, Inc. 1.09. Insperity, Inc. 0.9
10. PolyOne Corp. 0.9
(1) Composition of Portfolio subject to change.(2) Short-term investments have been excluded from the list of Top 10 Portfolio Holdings.(3) Top 10 Portfolio Holdings is presented at an individual security level. Total investment exposure by issuer may be higher.(4) Sectors (Common Stocks, Rights):
% of Net AssetsHealth Care 30.5Industrials 18.0Information Technology 17.6Consumer Discretionary 12.2Real Estate 5.3Financials 4.7Consumer Staples 4.0Materials 3.1Communication Services 2.8Utilities 0.6Energy 0.4
99.2
Ohio National Fund, Inc. ON BlackRock Advantage Small Cap Growth Portfolio (Unaudited) (Continued)
83

Common Stocks – 99.2% Shares Value
COMMUNICATION SERVICES – 2.8%Bandwidth, Inc. Class A (Diversified Telecom.
Svs.) . . . . . . . . . . . . . . . . . . . . . . . . . . (a) 1,355 $ 86,788Boingo Wireless, Inc. (Wireless Telecom. Svs.) . (a) 13,014 142,503Cardlytics, Inc. (Media). . . . . . . . . . . . . . . . (a) 3,469 218,061Care.com, Inc. (Interactive Media & Svs.) . . . . (a) 3,779 56,798Cargurus, Inc. (Interactive Media & Svs.) . . . . (a) 32,522 1,144,124Cogent Communications Holdings, Inc.
(Diversified Telecom. Svs.) . . . . . . . . . . . . 18,478 1,216,037EverQuote, Inc. Class A (Interactive Media &
Svs.) . . . . . . . . . . . . . . . . . . . . . . . . . . (a) 6,450 221,558Glu Mobile, Inc. (Entertainment) . . . . . . . . . . (a) 46,895 283,715Gogo, Inc. (Wireless Telecom. Svs.) . . . . . . . . (a) 12,254 78,426Gray Television, Inc. (Media) . . . . . . . . . . . . (a) 7,026 150,637IDT Corp. Class B (Diversified Telecom. Svs.) . . (a) 8,567 61,768MSG Networks, Inc. Class A (Media) . . . . . . . (a) 12,114 210,784Ooma, Inc. (Diversified Telecom. Svs.) . . . . . . (a) 7,140 94,462QuinStreet, Inc. (Interactive Media & Svs.) . . . (a) 26,782 410,032TechTarget, Inc. (Media) . . . . . . . . . . . . . . . (a) 3,534 92,237TrueCar, Inc. (Interactive Media & Svs.) . . . . . (a) 22,630 107,493Vonage Holdings Corp. (Diversified Telecom.
Svs.) . . . . . . . . . . . . . . . . . . . . . . . . . . (a) 5,758 42,552Yelp, Inc. (Interactive Media & Svs.). . . . . . . . (a) 29,975 1,044,029
5,662,004
CONSUMER DISCRETIONARY – 12.2%1-800-Flowers.com, Inc. Class A (Internet &
Direct Marketing Retail). . . . . . . . . . . . . . (a) 22,938 332,601Aaron’s, Inc. (Specialty Retail) . . . . . . . . . . . 2,794 159,565American Eagle Outfitters, Inc.
(Specialty Retail) . . . . . . . . . . . . . . . . . . 3,631 53,376America’s Car-Mart, Inc. (Specialty Retail) . . . (a) 238 26,099Asbury Automotive Group, Inc.
(Specialty Retail) . . . . . . . . . . . . . . . . . . (a) 16,284 1,820,388BJ’s Restaurants, Inc. (Hotels, Restaurants &
Leisure) . . . . . . . . . . . . . . . . . . . . . . . . 12,542 476,094Boyd Gaming Corp. (Hotels, Restaurants &
Leisure) . . . . . . . . . . . . . . . . . . . . . . . . 27,415 820,805Brinker International, Inc. (Hotels, Restaurants
& Leisure) . . . . . . . . . . . . . . . . . . . . . . 12,046 505,932Chegg, Inc. (Diversified Consumer Svs.) . . . . . (a) 27,125 1,028,309Children’s Place, Inc. / The (Specialty Retail) . . 1,583 98,969Churchill Downs, Inc. (Hotels, Restaurants &
Leisure) . . . . . . . . . . . . . . . . . . . . . . . . 7,418 1,017,750Chuy’s Holdings, Inc. (Hotels, Restaurants &
Leisure) . . . . . . . . . . . . . . . . . . . . . . . . (a) 20,240 524,621Cooper-Standard Holdings, Inc.
(Auto Components). . . . . . . . . . . . . . . . . (a) 3,453 114,501Core-Mark Holding Co., Inc. (Distributors) . . . . 19,257 523,598Cracker Barrel Old Country Store, Inc. (Hotels,
Restaurants & Leisure) . . . . . . . . . . . . . . 2,037 313,168Crocs, Inc. (Textiles, Apparel & Luxury Goods) . (a) 24,705 1,034,892Deckers Outdoor Corp. (Textiles, Apparel &
Luxury Goods) . . . . . . . . . . . . . . . . . . . . (a) 872 147,246Denny’s Corp. (Hotels, Restaurants & Leisure) . (a) 16,339 324,819Dorman Products, Inc. (Auto Components) . . . (a) 316 23,928Everi Holdings, Inc. (Hotels, Restaurants &
Leisure) . . . . . . . . . . . . . . . . . . . . . . . . (a) 9,639 129,452Fox Factory Holding Corp. (Auto Components) . (a) 2,301 160,081Helen of Troy Ltd. (Household Durables) . . . . . (a) 6,195 1,113,799Hooker Furniture Corp. (Household Durables) . . 7,469 191,879iRobot Corp. (Household Durables) . . . . . . . . (a) 6,318 319,880KB Home (Household Durables) . . . . . . . . . . 5,787 198,321La-Z-Boy, Inc. (Household Durables) . . . . . . . 985 31,008LCI Industries (Auto Components) . . . . . . . . . 12,871 1,378,870LGI Homes, Inc. (Household Durables) . . . . . . (a) 11,117 785,416Lithia Motors, Inc. Class A (Specialty Retail) . . 4,604 676,788Malibu Boats, Inc. Class A (Leisure Products). . (a) 16,101 659,336MDC Holdings, Inc. (Household Durables) . . . . 18,348 700,160
Common Stocks (Continued) Shares Value
CONSUMER DISCRETIONARY (continued)OneSpaWorld Holdings Ltd. (Diversified
Consumer Svs.) . . . . . . . . . . . . . . . . . . . (a) 6,756 $ 113,771Oxford Industries, Inc. (Textiles, Apparel &
Luxury Goods) . . . . . . . . . . . . . . . . . . . . 10,997 829,394Planet Fitness, Inc. Class A (Hotels,
Restaurants & Leisure) . . . . . . . . . . . . . . (a) 1,700 126,956Scientific Games Corp. (Hotels, Restaurants &
Leisure) . . . . . . . . . . . . . . . . . . . . . . . . (a) 6,013 161,028Sonos, Inc. (Household Durables) . . . . . . . . . (a) 4,175 65,214Standard Motor Products, Inc.
(Auto Components). . . . . . . . . . . . . . . . . 2,770 147,419Steven Madden Ltd. (Textiles, Apparel &
Luxury Goods) . . . . . . . . . . . . . . . . . . . . 35,442 1,524,360Stitch Fix, Inc. Class A (Internet & Direct
Marketing Retail) . . . . . . . . . . . . . . . . . . (a) 11,630 298,426Strategic Education, Inc. (Diversified Consumer
Svs.) . . . . . . . . . . . . . . . . . . . . . . . . . . 8,171 1,298,372Texas Roadhouse, Inc. (Hotels, Restaurants &
Leisure) . . . . . . . . . . . . . . . . . . . . . . . . 52,693 2,967,670TopBuild Corp. (Household Durables) . . . . . . . (a) 9,488 978,023Wingstop, Inc. (Hotels, Restaurants & Leisure) . 6,384 550,492Wolverine World Wide, Inc. (Textiles, Apparel
& Luxury Goods) . . . . . . . . . . . . . . . . . . 8,276 279,23225,032,008
CONSUMER STAPLES – 4.0%Boston Beer Co., Inc. / The Class A
(Beverages) . . . . . . . . . . . . . . . . . . . . . (a) 237 89,550Calavo Growers, Inc. (Food Products). . . . . . . 13,288 1,203,760Freshpet, Inc. (Food Products) . . . . . . . . . . . (a) 22,903 1,353,338J&J Snack Foods Corp. (Food Products) . . . . . 9,785 1,803,082John B Sanfilippo & Son, Inc. (Food Products) . 4,559 416,146National Beverage Corp. (Beverages) . . . . . . (a) 7,508 383,058Performance Food Group Co. (Food & Staples
Retailing) . . . . . . . . . . . . . . . . . . . . . . . (a) 44,341 2,282,675Sprouts Farmers Market, Inc. (Food & Staples
Retailing) . . . . . . . . . . . . . . . . . . . . . . . (a) 8,800 170,280USANA Health Sciences, Inc.
(Personal Products) . . . . . . . . . . . . . . . . (a) 907 71,245Vector Group Ltd. (Tobacco). . . . . . . . . . . . . 35,532 475,773
8,248,907
ENERGY – 0.4%Evolution Petroleum Corp. (Oil, Gas &
Consumable Fuels) . . . . . . . . . . . . . . . . . 31,209 170,713Liberty Oilfield Services, Inc. Class A (Energy
Equip. & Svs.) . . . . . . . . . . . . . . . . . . . . 28,705 319,200ProPetro Holding Corp. (Energy Equip. & Svs.) . (a) 9,977 112,241Smart Sand, Inc. (Energy Equip. & Svs.) . . . . . (a) 47,289 119,168
721,322
FINANCIALS – 4.7%Ares Management Corp. Class A
(Capital Markets) . . . . . . . . . . . . . . . . . . 8,911 318,034Artisan Partners Asset Management, Inc.
Class A (Capital Markets). . . . . . . . . . . . . 11,808 381,635BankFinancial Corp. (Banks) . . . . . . . . . . . . 5,622 73,536Cohen & Steers, Inc. (Capital Markets) . . . . . . 9,975 626,031Enova International, Inc. (Consumer Finance) . . (a) 3,325 79,999Essent Group Ltd. (Thrifts & Mortgage
Finance) . . . . . . . . . . . . . . . . . . . . . . . 21,949 1,141,129FedNat Holding Co. (Insurance) . . . . . . . . . . 8,877 147,625First Savings Financial Group, Inc. (Banks) . . . 2,205 147,955FirstCash, Inc. (Consumer Finance) . . . . . . . . 8,732 704,061Focus Financial Partners, Inc. Class A
(Capital Markets) . . . . . . . . . . . . . . . . . . (a) 9,231 272,038Green Dot Corp. Class A (Consumer Finance) . . (a) 25,864 602,631Hamilton Lane, Inc. Class A (Capital Markets). . 4,546 270,942Kinsale Capital Group, Inc. (Insurance) . . . . . . 5,862 595,931LendingTree, Inc. (Thrifts & Mortgage Finance). (a) 184 55,833
Ohio National Fund, Inc. ON BlackRock Advantage Small Cap Growth Portfolio
Schedule of Investments December 31, 2019
84 (continued)

Common Stocks (Continued) Shares Value
FINANCIALS (continued)Main Street Capital Corp. (Capital Markets) . . . 110 $ 4,742Moelis & Co. Class A (Capital Markets) . . . . . . 18,170 579,986NMI Holdings, Inc. Class A (Thrifts & Mortgage
Finance) . . . . . . . . . . . . . . . . . . . . . . . (a) 4,242 140,750OceanFirst Financial Corp. (Thrifts & Mortgage
Finance) . . . . . . . . . . . . . . . . . . . . . . . 1,686 43,060Pacific Mercantile Bancorp (Banks) . . . . . . . (a) 18,854 153,094Republic First Bancorp, Inc. (Banks) . . . . . . . (a) 9,423 39,388Riverview Bancorp, Inc. (Thrifts & Mortgage
Finance) . . . . . . . . . . . . . . . . . . . . . . . 1,100 9,031Sandy Spring Bancorp, Inc. (Banks) . . . . . . . . 6,473 245,197TriState Capital Holdings, Inc. (Banks) . . . . . . (a) 86,446 2,257,970Virtus Investment Partners, Inc.
(Capital Markets) . . . . . . . . . . . . . . . . . . 1,299 158,114West Bancorporation, Inc. (Banks) . . . . . . . . 2,913 74,660Wintrust Financial Corp. (Banks) . . . . . . . . . . 6,180 438,162
9,561,534
HEALTH CARE – 30.5%10X Genomics, Inc. Class A (Life Sciences
Tools & Svs.). . . . . . . . . . . . . . . . . . . . . (a) 1,266 96,533ACADIA Pharmaceuticals, Inc.
(Biotechnology) . . . . . . . . . . . . . . . . . . . (a) 28,463 1,217,647Acceleron Pharma, Inc. (Biotechnology) . . . . . (a) 9,015 477,975Accuray, Inc. (Health Care Equip. & Supplies). . (a) 4,004 11,291Aerie Pharmaceuticals, Inc. (Pharmaceuticals). (a) 4,071 98,396Agenus, Inc. (Biotechnology) . . . . . . . . . . . . (a) 128,389 522,543Aimmune Therapeutics, Inc. (Biotechnology) . . (a) 5,844 195,599Akcea Therapeutics, Inc. (Biotechnology) . . . . (a) 2,274 38,522Alector, Inc. (Biotechnology) . . . . . . . . . . . . (a) 7,528 129,707Allakos, Inc. (Biotechnology) . . . . . . . . . . . . (a) 1,247 118,914Amarin Corp. PLC – ADR (Biotechnology) . . . . (a) 17,101 366,645Amedisys, Inc. (Health Care Providers & Svs.) . (a) 439 73,278Amicus Therapeutics, Inc. (Biotechnology) . . . (a) 35,768 348,380AMN Healthcare Services, Inc. (Health Care
Providers & Svs.) . . . . . . . . . . . . . . . . . . (a) 39,440 2,457,506Amneal Pharmaceuticals, Inc.
(Pharmaceuticals) . . . . . . . . . . . . . . . . . (a) 61,351 295,712Amphastar Pharmaceuticals, Inc.
(Pharmaceuticals) . . . . . . . . . . . . . . . . . (a) 16,443 317,185AnaptysBio, Inc. (Biotechnology) . . . . . . . . . (a) 867 14,089Apellis Pharmaceuticals, Inc. (Biotechnology) . (a) 13,519 413,952Arcus Biosciences, Inc. (Biotechnology) . . . . . (a) 8,261 83,436Arena Pharmaceuticals, Inc. (Biotechnology) . . (a) 2,752 124,996Arrowhead Pharmaceuticals, Inc.
(Biotechnology) . . . . . . . . . . . . . . . . . . . (a) 19,362 1,228,132Arvinas, Inc. (Pharmaceuticals) . . . . . . . . . . (a) 2,154 88,508Atara Biotherapeutics, Inc. (Biotechnology) . . . (a) 5,726 94,307Athersys, Inc. (Biotechnology) . . . . . . . . . . . (a) 60,257 74,116AtriCure, Inc. (Health Care Equip. & Supplies). . (a) 21,088 685,571Audentes Therapeutics, Inc. (Biotechnology) . . (a) 8,640 517,018BioDelivery Sciences International, Inc.
(Pharmaceuticals) . . . . . . . . . . . . . . . . . (a) 18,702 118,197Biohaven Pharmaceutical Holding Co. Ltd.
(Biotechnology) . . . . . . . . . . . . . . . . . . . (a) 2,869 156,188Blueprint Medicines Corp. (Biotechnology) . . . (a) 6,124 490,594Cara Therapeutics, Inc. (Pharmaceuticals) . . . (a) 8,301 133,729Cardiovascular Systems, Inc. (Health Care
Equip. & Supplies) . . . . . . . . . . . . . . . . . (a) 6,388 310,393Castle Biosciences, Inc. (Biotechnology). . . . . (a) 4,170 143,323Castlight Health, Inc. Class B (Health Care
Technology) . . . . . . . . . . . . . . . . . . . . . (a) 39,467 52,491ChemoCentryx, Inc. (Biotechnology) . . . . . . . (a) 21,441 847,992Coherus Biosciences, Inc. (Biotechnology) . . . (a) 27,502 495,174Collegium Pharmaceutical, Inc.
(Pharmaceuticals) . . . . . . . . . . . . . . . . . (a) 5,584 114,919CONMED Corp. (Health Care Equip. &
Supplies) . . . . . . . . . . . . . . . . . . . . . . . 1,278 142,919Corcept Therapeutics, Inc. (Pharmaceuticals) . (a) 30,175 365,117
Common Stocks (Continued) Shares Value
HEALTH CARE (continued)CorVel Corp. (Health Care Providers & Svs.) . . . (a) 3,837 $ 335,200Crinetics Pharmaceuticals, Inc.
(Biotechnology) . . . . . . . . . . . . . . . . . . . (a) 2,601 65,259Deciphera Pharmaceuticals, Inc.
(Biotechnology) . . . . . . . . . . . . . . . . . . . (a) 8,032 499,912Denali Therapeutics, Inc. (Biotechnology) . . . . (a) 8,753 152,477Dermira, Inc. (Pharmaceuticals) . . . . . . . . . . (a) 15,192 230,311Dynavax Technologies Corp. (Biotechnology) . . (a) 56,145 321,149Eagle Pharmaceuticals, Inc. (Biotechnology) . . (a) 8,141 489,111Editas Medicine, Inc. (Biotechnology) . . . . . . (a) 8,930 264,417Emergent BioSolutions, Inc. (Biotechnology) . . (a) 3,695 199,345Enanta Pharmaceuticals, Inc. (Biotechnology) . (a) 8,208 507,090Endo International PLC (Pharmaceuticals) . . . . (a) 35,295 165,534Ensign Group, Inc. / The (Health Care Providers
& Svs.) . . . . . . . . . . . . . . . . . . . . . . . . 6,434 291,911Epizyme, Inc. (Biotechnology). . . . . . . . . . . . (a) 5,308 130,577Esperion Therapeutics, Inc. (Biotechnology) . . (a) 4,046 241,263Evolent Health, Inc. Class A (Health Care
Technology) . . . . . . . . . . . . . . . . . . . . . (a) 26,979 244,160Exact Sciences Corp. (Biotechnology) . . . . . . (a) 2,323 214,831Fate Therapeutics, Inc. (Biotechnology) . . . . . (a) 29,022 567,961FibroGen, Inc. (Biotechnology) . . . . . . . . . . . (a) 19,250 825,632Flexion Therapeutics, Inc. (Biotechnology) . . . (a) 10,954 226,748GenMark Diagnostics, Inc. (Health Care Equip.
& Supplies) . . . . . . . . . . . . . . . . . . . . . (a) 47,045 226,286Glaukos Corp. (Health Care Equip. & Supplies) . (a) 1,659 90,366Global Blood Therapeutics, Inc.
(Biotechnology) . . . . . . . . . . . . . . . . . . . (a) 14,349 1,140,602Globus Medical, Inc. Class A (Health Care
Equip. & Supplies) . . . . . . . . . . . . . . . . . (a) 20,318 1,196,324Gossamer Bio, Inc. (Biotechnology) . . . . . . . . (a) 4,355 68,069Halozyme Therapeutics, Inc. (Biotechnology) . . (a) 13,603 241,181HealthEquity, Inc. (Health Care Providers &
Svs.) . . . . . . . . . . . . . . . . . . . . . . . . . . (a) 29,092 2,154,844Horizon Therapeutics PLC (Pharmaceuticals) . . (a) 9,478 343,104Immunomedics, Inc. (Biotechnology) . . . . . . . (a) 36,309 768,298Innoviva, Inc. (Pharmaceuticals) . . . . . . . . . . (a) 12,873 182,282Inogen, Inc. (Health Care Equip. & Supplies) . . (a) 15,488 1,058,295Inovalon Holdings, Inc. Class A (Health Care
Technology) . . . . . . . . . . . . . . . . . . . . . (a) 25,733 484,295Insmed, Inc. (Biotechnology) . . . . . . . . . . . . (a) 30,820 735,982Inspire Medical Systems, Inc. (Health Care
Technology) . . . . . . . . . . . . . . . . . . . . . (a) 8,320 617,427Integer Holdings Corp. (Health Care Equip. &
Supplies) . . . . . . . . . . . . . . . . . . . . . . . (a) 5,063 407,217Intellia Therapeutics, Inc. (Biotechnology). . . . (a) 8,824 129,448Intercept Pharmaceuticals, Inc.
(Biotechnology) . . . . . . . . . . . . . . . . . . . (a) 8,364 1,036,467Intersect ENT, Inc. (Pharmaceuticals). . . . . . . (a) 19,785 492,646Intra-Cellular Therapies, Inc.
(Pharmaceuticals) . . . . . . . . . . . . . . . . . (a) 22,356 767,034Invitae Corp. (Biotechnology) . . . . . . . . . . . . (a) 29,981 483,594Iovance Biotherapeutics, Inc. (Biotechnology) . (a) 8,909 246,601iRadimed Corp. (Health Care Equip. &
Supplies) . . . . . . . . . . . . . . . . . . . . . . . (a) 4,808 112,411iRhythm Technologies, Inc. (Health Care Equip.
& Supplies) . . . . . . . . . . . . . . . . . . . . . (a) 11,454 779,903Ironwood Pharmaceuticals, Inc.
(Biotechnology) . . . . . . . . . . . . . . . . . . . (a) 62,443 831,116Joint Corp. / The (Health Care Providers &
Svs.) . . . . . . . . . . . . . . . . . . . . . . . . . . (a) 5,943 95,920KalVista Pharmaceuticals, Inc.
(Biotechnology) . . . . . . . . . . . . . . . . . . . (a) 3,078 54,819Kodiak Sciences, Inc. (Biotechnology) . . . . . . (a) 3,585 257,941LeMaitre Vascular, Inc. (Health Care Equip. &
Supplies) . . . . . . . . . . . . . . . . . . . . . . . 5,048 181,476LHC Group, Inc. (Health Care Providers & Svs.) . (a) 5,017 691,142Ligand Pharmaceuticals, Inc. (Biotechnology) . (a) 3,674 383,161LivaNova PLC (Health Care Equip. & Supplies) . (a) 2,055 155,009
Ohio National Fund, Inc. ON BlackRock Advantage Small Cap Growth Portfolio (Continued)
Schedule of Investments December 31, 2019
85 (continued)
Common Stocks (Continued) Shares Value
HEALTH CARE (continued)MacroGenics, Inc. (Biotechnology) . . . . . . . . (a) 8,789 $ 95,624Madrigal Pharmaceuticals, Inc.
(Biotechnology) . . . . . . . . . . . . . . . . . . . (a) 213 19,406Medicines Co. / The (Biotechnology) . . . . . . . (a) 4,810 408,561Medpace Holdings, Inc. (Life Sciences Tools &
Svs.) . . . . . . . . . . . . . . . . . . . . . . . . . . (a) 10,238 860,606MeiraGTx Holdings PLC (Biotechnology) . . . . . (a) 1,192 23,864Merit Medical Systems, Inc. (Health Care
Equip. & Supplies) . . . . . . . . . . . . . . . . . (a) 10,544 329,184Mirati Therapeutics, Inc. (Biotechnology) . . . . (a) 5,261 677,932NanoString Technologies, Inc. (Life Sciences
Tools & Svs.). . . . . . . . . . . . . . . . . . . . . (a) 7,675 213,518Natera, Inc. (Biotechnology) . . . . . . . . . . . . (a) 20,770 699,741Neogen Corp. (Health Care Equip. & Supplies) . (a) 6,358 414,923NeoGenomics, Inc. (Life Sciences Tools &
Svs.) . . . . . . . . . . . . . . . . . . . . . . . . . . (a) 17,764 519,597Nevro Corp. (Health Care Equip. & Supplies) . . (a) 2,320 272,693NextGen Healthcare, Inc. (Health Care
Technology) . . . . . . . . . . . . . . . . . . . . . (a) 8,538 137,206NGM Biopharmaceuticals, Inc.
(Pharmaceuticals) . . . . . . . . . . . . . . . . . (a) 24,645 455,686Novocure Ltd. (Health Care Equip. & Supplies) . (a) 22,208 1,871,468Omeros Corp. (Pharmaceuticals). . . . . . . . . . (a) 9,141 128,797Omnicell, Inc. (Health Care Technology) . . . . . (a) 23,327 1,906,282Pacira BioSciences, Inc. (Pharmaceuticals). . . (a) 17,685 801,130Patterson Cos., Inc. (Health Care Providers &
Svs.) . . . . . . . . . . . . . . . . . . . . . . . . . . 55,511 1,136,865Pennant Group, Inc. / The (Health Care
Providers & Svs.) . . . . . . . . . . . . . . . . . . (a) 3,217 106,386PetIQ, Inc. (Health Care Providers & Svs.) . . . . (a) 8,300 207,915Phibro Animal Health Corp. Class A
(Pharmaceuticals) . . . . . . . . . . . . . . . . . 4,888 121,369Phreesia, Inc. (Health Care Technology) . . . . . (a) 27,947 744,508Portola Pharmaceuticals, Inc. (Biotechnology) . (a) 26,827 640,629Precision BioSciences, Inc. (Biotechnology) . . (a) 8,717 121,079Prestige Consumer Healthcare, Inc.
(Pharmaceuticals) . . . . . . . . . . . . . . . . . (a) 1,373 55,607Principia Biopharma, Inc. (Biotechnology) . . . . (a) 6,695 366,752PTC Therapeutics, Inc. (Biotechnology) . . . . . (a) 8,159 391,877Puma Biotechnology, Inc. (Biotechnology). . . . (a) 19,032 166,530Quotient Ltd. (Health Care Equip. & Supplies) . . (a) 74,941 712,689Ra Pharmaceuticals, Inc. (Biotechnology) . . . . (a) 6,697 314,290Radius Health, Inc. (Biotechnology) . . . . . . . . (a) 13,550 273,168Reata Pharmaceuticals, Inc. Class A
(Pharmaceuticals) . . . . . . . . . . . . . . . . . (a) 2,137 436,867Recro Pharma, Inc. (Pharmaceuticals) . . . . . . (a) 3,321 60,874REGENXBIO, Inc. (Biotechnology) . . . . . . . . . (a) 1,826 74,811Repligen Corp. (Life Sciences Tools & Svs.) . . . (a) 6,515 602,637Retrophin, Inc. (Biotechnology). . . . . . . . . . . (a) 36,005 511,271Rigel Pharmaceuticals, Inc. (Biotechnology) . . (a) 60,790 130,091Sage Therapeutics, Inc. (Biotechnology) . . . . . (a) 361 26,061Sangamo Therapeutics, Inc. (Biotechnology) . . (a) 5,737 48,019Select Medical Holdings Corp. (Health Care
Providers & Svs.) . . . . . . . . . . . . . . . . . . (a) 14,947 348,863Seres Therapeutics, Inc. (Biotechnology) . . . . (a) 22,788 78,619SI-BONE, Inc. (Health Care Equip. & Supplies) . (a) 8,320 178,880Silk Road Medical, Inc. (Health Care Equip. &
Supplies) . . . . . . . . . . . . . . . . . . . . . . . (a) 9,097 367,337SmileDirectClub, Inc. (Health Care Equip. &
Supplies) . . . . . . . . . . . . . . . . . . . . . . . (a) 22,871 199,893Spectrum Pharmaceuticals, Inc.
(Biotechnology) . . . . . . . . . . . . . . . . . . . (a) 13,585 49,449Stemline Therapeutics, Inc. (Biotechnology) . . (a) 6,478 68,861Supernus Pharmaceuticals, Inc.
(Pharmaceuticals) . . . . . . . . . . . . . . . . . (a) 23,504 557,515Syneos Health, Inc. (Life Sciences Tools &
Svs.) . . . . . . . . . . . . . . . . . . . . . . . . . . (a) 8,401 499,649Tabula Rasa HealthCare, Inc. (Health Care
Technology) . . . . . . . . . . . . . . . . . . . . . (a) 3,179 154,754
Common Stocks (Continued) Shares Value
HEALTH CARE (continued)Tactile Systems Technology, Inc. (Health Care
Equip. & Supplies) . . . . . . . . . . . . . . . . . (a) 3,864 $ 260,859Tandem Diabetes Care, Inc. (Health Care Equip.
& Supplies) . . . . . . . . . . . . . . . . . . . . . (a) 10,523 627,276Teladoc Health, Inc. (Health Care Technology) . (a) 15,453 1,293,725Tenet Healthcare Corp. (Health Care Providers
& Svs.) . . . . . . . . . . . . . . . . . . . . . . . . (a) 11,235 427,267TherapeuticsMD, Inc. (Pharmaceuticals) . . . . (a) 28,331 68,561Theravance Biopharma, Inc.
(Pharmaceuticals) . . . . . . . . . . . . . . . . . (a) 6,507 168,466TransMedics Group, Inc. (Health Care Equip. &
Supplies) . . . . . . . . . . . . . . . . . . . . . . . (a) 6,958 132,272Tricida, Inc. (Pharmaceuticals) . . . . . . . . . . . (a) 2,917 110,088Turning Point Therapeutics, Inc.
(Biotechnology) . . . . . . . . . . . . . . . . . . . (a) 4,223 263,051Twist Bioscience Corp. (Biotechnology) . . . . . (a) 4,664 97,944U.S. Physical Therapy, Inc. (Health Care
Providers & Svs.) . . . . . . . . . . . . . . . . . . 9,002 1,029,379Ultragenyx Pharmaceutical, Inc.
(Biotechnology) . . . . . . . . . . . . . . . . . . . (a) 18,172 776,126UNITY Biotechnology, Inc. (Biotechnology) . . . (a) 7,381 53,217Vanda Pharmaceuticals, Inc. (Biotechnology). . (a) 15,755 258,540Veracyte, Inc. (Biotechnology) . . . . . . . . . . . (a) 19,226 536,790Vocera Communications, Inc. (Health Care
Technology) . . . . . . . . . . . . . . . . . . . . . (a) 20,173 418,791Xencor, Inc. (Biotechnology) . . . . . . . . . . . . (a) 14,313 492,224
62,452,051
INDUSTRIALS – 18.0%Advanced Drainage Systems, Inc.
(Building Products). . . . . . . . . . . . . . . . . 33,488 1,300,674Aerojet Rocketdyne Holdings, Inc. (Aerospace
& Defense). . . . . . . . . . . . . . . . . . . . . . (a) 11,696 534,039Albany International Corp. Class A
(Machinery) . . . . . . . . . . . . . . . . . . . . . 7,216 547,839Apogee Enterprises, Inc. (Building Products) . . 6,338 205,985Applied Industrial Technologies, Inc. (Trading
Companies & Distributors) . . . . . . . . . . . . 16,923 1,128,595ASGN, Inc. (Professional Svs.) . . . . . . . . . . . (a) 18,427 1,307,764Atkore International Group, Inc.
(Electrical Equip.). . . . . . . . . . . . . . . . . . (a) 17,910 724,639Blue Bird Corp. (Machinery). . . . . . . . . . . . . (a) 25,254 578,822BMC Stock Holdings, Inc. (Trading Companies
& Distributors) . . . . . . . . . . . . . . . . . . . (a) 9,917 284,519Builders FirstSource, Inc. (Building Products). . (a) 39,599 1,006,211Comfort Systems U.S.A., Inc. (Construction &
Engineering) . . . . . . . . . . . . . . . . . . . . . 30,429 1,516,886Continental Building Products, Inc.
(Building Products). . . . . . . . . . . . . . . . . (a) 3,186 116,066Covenant Transportation Group, Inc. Class A
(Road & Rail) . . . . . . . . . . . . . . . . . . . . (a) 6,504 84,064Dycom Industries, Inc. (Construction &
Engineering) . . . . . . . . . . . . . . . . . . . . . (a) 14,433 680,516EMCOR Group, Inc. (Construction &
Engineering) . . . . . . . . . . . . . . . . . . . . . 8,570 739,591ESCO Technologies, Inc. (Machinery) . . . . . . . 15,992 1,479,260Evoqua Water Technologies Corp. (Machinery). (a) 61,504 1,165,501Federal Signal Corp. (Machinery) . . . . . . . . . 9,136 294,636Forrester Research, Inc. (Professional Svs.) . . . 6,769 282,267Foundation Building Materials, Inc. (Trading
Companies & Distributors) . . . . . . . . . . . . (a) 41,737 807,611Franklin Covey Co. (Professional Svs.) . . . . . . (a) 297 9,572Generac Holdings, Inc. (Electrical Equip.) . . . . (a) 8,770 882,174GMS, Inc. (Trading Companies & Distributors) . (a) 4,350 117,798H&E Equipment Services, Inc. (Trading
Companies & Distributors) . . . . . . . . . . . . 8,101 270,816Harsco Corp. (Machinery) . . . . . . . . . . . . . . (a) 6,107 140,522Healthcare Services Group, Inc. (Commercial
Svs. & Supplies) . . . . . . . . . . . . . . . . . . 21,742 528,765
Ohio National Fund, Inc. ON BlackRock Advantage Small Cap Growth Portfolio (Continued)
Schedule of Investments December 31, 2019
86 (continued)

Common Stocks (Continued) Shares Value
INDUSTRIALS (continued)Herc Holdings, Inc. (Trading Companies &
Distributors) . . . . . . . . . . . . . . . . . . . . . (a) 1,775 $ 86,869Hillenbrand, Inc. (Machinery) . . . . . . . . . . . . 29,317 976,549Hub Group, Inc. Class A (Air Freight &
Logistics) . . . . . . . . . . . . . . . . . . . . . . . (a) 1,237 63,446Insperity, Inc. (Professional Svs.) . . . . . . . . . 22,561 1,941,148John Bean Technologies Corp. (Machinery) . . . 7,998 901,055Kforce, Inc. (Professional Svs.) . . . . . . . . . . . 20,786 825,204Landstar System, Inc. (Road & Rail) . . . . . . . . 4,643 528,698Marten Transport Ltd. (Road & Rail) . . . . . . . . 45,145 970,166MasTec, Inc. (Construction & Engineering) . . . (a) 15,807 1,014,177McGrath RentCorp (Commercial Svs. &
Supplies) . . . . . . . . . . . . . . . . . . . . . . . 14,679 1,123,531Mercury Systems, Inc. (Aerospace & Defense). (a) 8,842 611,071Meritor, Inc. (Machinery) . . . . . . . . . . . . . . (a) 3,839 100,543Miller Industries, Inc. (Machinery). . . . . . . . . 4,975 184,722Mobile Mini, Inc. (Commercial Svs. &
Supplies) . . . . . . . . . . . . . . . . . . . . . . . 19,952 756,380MYR Group, Inc. (Construction & Engineering) . (a) 3,819 124,461Navistar International Corp. (Machinery). . . . . (a) 8,260 239,044Parsons Corp. (Aerospace & Defense) . . . . . . (a) 5,376 221,921Radiant Logistics, Inc. (Air Freight & Logistics) . (a) 10,231 56,987RBC Bearings, Inc. (Machinery) . . . . . . . . . . (a) 911 144,248Rexnord Corp. (Machinery) . . . . . . . . . . . . . (a) 9,238 301,344Rush Enterprises, Inc. Class A (Trading
Companies & Distributors) . . . . . . . . . . . . 10,356 481,554Saia, Inc. (Road & Rail) . . . . . . . . . . . . . . . . (a) 2,211 205,888SiteOne Landscape Supply, Inc. (Trading
Companies & Distributors) . . . . . . . . . . . . (a) 3,325 301,411SkyWest, Inc. (Airlines). . . . . . . . . . . . . . . . 4,659 301,111Spirit Airlines, Inc. (Airlines). . . . . . . . . . . . . (a) 4,147 167,166Steelcase, Inc. Class A (Commercial Svs. &
Supplies) . . . . . . . . . . . . . . . . . . . . . . . 41,726 853,714Sunrun, Inc. (Electrical Equip.) . . . . . . . . . . . (a) 16,451 227,188Tetra Tech, Inc. (Commercial Svs. & Supplies) . 17,521 1,509,609Trex Co., Inc. (Building Products). . . . . . . . . . (a) 12,012 1,079,639TriNet Group, Inc. (Professional Svs.) . . . . . . . (a) 20,132 1,139,673Triumph Group, Inc. (Aerospace & Defense). . . 2,920 73,788Universal Forest Products, Inc.
(Building Products). . . . . . . . . . . . . . . . . 7,051 336,333Universal Logistics Holdings, Inc. (Road & Rail). 1,593 30,203Viad Corp. (Commercial Svs. & Supplies) . . . . . 16,563 1,118,003Wabash National Corp. (Machinery) . . . . . . . 6,850 100,627Watts Water Technologies, Inc. Class A
(Machinery) . . . . . . . . . . . . . . . . . . . . . 4,624 461,290Woodward, Inc. (Machinery) . . . . . . . . . . . . 4,661 552,049
36,845,942
INFORMATION TECHNOLOGY – 17.6%2U, Inc. (Software). . . . . . . . . . . . . . . . . . . (a) 6,390 153,296Advanced Energy Industries, Inc.
(Semiconductors & Equip.) . . . . . . . . . . . . (a) 25,762 1,834,254Alarm.com Holdings, Inc. (Software) . . . . . . . (a) 14,364 617,221Ambarella, Inc. (Semiconductors & Equip.) . . . (a) 28,145 1,704,461Appfolio, Inc. Class A (Software) . . . . . . . . . . (a) 4,193 461,020Avalara, Inc. (Software) . . . . . . . . . . . . . . . (a) 571 41,826Benefitfocus, Inc. (Software) . . . . . . . . . . . . (a) 92,674 2,033,268Bill.Com Holdings, Inc. (Software) . . . . . . . . . (a) 1,263 48,057Blackline, Inc. (Software) . . . . . . . . . . . . . . (a) 4,928 254,088Bottomline Technologies DE, Inc. (Software) . . (a) 23,035 1,234,676Box, Inc. Class A (Software). . . . . . . . . . . . . (a) 27,812 466,685Brooks Automation, Inc. (Semiconductors &
Equip.) . . . . . . . . . . . . . . . . . . . . . . . . 5,115 214,625Calix, Inc. (Communications Equip.) . . . . . . . . (a) 6,233 49,864Ciena Corp. (Communications Equip.) . . . . . . . (a) 11,330 483,678Cirrus Logic, Inc. (Semiconductors & Equip.) . . (a) 20,342 1,676,384Cloudflare, Inc. Class A (Software) . . . . . . . . (a) 3,044 51,931CommVault Systems, Inc. (Software) . . . . . . . (a) 29,119 1,299,872Cornerstone OnDemand, Inc. (Software) . . . . . (a) 26,488 1,550,872
Common Stocks (Continued) Shares Value
INFORMATION TECHNOLOGY (continued)CSG Systems International, Inc. (IT Svs.) . . . . . 33,527 $ 1,736,028Endurance International Group Holdings, Inc.
(IT Svs.) . . . . . . . . . . . . . . . . . . . . . . . . (a) 25,718 120,875Envestnet, Inc. (Software) . . . . . . . . . . . . . . (a) 2,090 145,527ePlus, Inc. (Electronic Equip., Instr. & Comp.) . . (a) 5,157 434,684Five9, Inc. (Software) . . . . . . . . . . . . . . . . . (a) 10,186 667,998FormFactor, Inc. (Semiconductors & Equip.) . . . (a) 11,096 288,163Hackett Group, Inc. / The (IT Svs.) . . . . . . . . . 8,456 136,480Inphi Corp. (Semiconductors & Equip.) . . . . . . (a) 6,897 510,516Insight Enterprises, Inc. (Electronic Equip.,
Instr. & Comp.) . . . . . . . . . . . . . . . . . . . (a) 4,935 346,881International Money Express, Inc. (IT Svs.) . . . (a) 18,136 218,358j2 Global, Inc. (Software) . . . . . . . . . . . . . . . 7,361 689,799ManTech International Corp. Class A (IT Svs.) . 7,747 618,830MAXIMUS, Inc. (IT Svs.) . . . . . . . . . . . . . . . 2,737 203,605Model N, Inc. (Software) . . . . . . . . . . . . . . . (a) 22,938 804,436OSI Systems, Inc. (Electronic Equip., Instr. &
Comp.) . . . . . . . . . . . . . . . . . . . . . . . . (a) 18,916 1,905,598Paylocity Holding Corp. (Software) . . . . . . . . (a) 8,561 1,034,340PC Connection, Inc. (Electronic Equip., Instr. &
Comp.) . . . . . . . . . . . . . . . . . . . . . . . . 10,698 531,263Perficient, Inc. (IT Svs.). . . . . . . . . . . . . . . . (a) 1,773 81,682Power Integrations, Inc. (Semiconductors &
Equip.) . . . . . . . . . . . . . . . . . . . . . . . . 10,218 1,010,662Progress Software Corp. (Software). . . . . . . . 7,862 326,666PROS Holdings, Inc. (Software). . . . . . . . . . . (a) 7,486 448,561Q2 Holdings, Inc. (Software). . . . . . . . . . . . . (a) 9,277 752,179Qualys, Inc. (Software) . . . . . . . . . . . . . . . . (a) 3,308 275,788Radware Ltd. (Communications Equip.) . . . . . . (a) 5,120 131,994Rapid7, Inc. (Software) . . . . . . . . . . . . . . . . (a) 29,154 1,633,207RingCentral, Inc. Class A (Software). . . . . . . . (a) 6,150 1,037,321Science Applications International Corp.
(IT Svs.) . . . . . . . . . . . . . . . . . . . . . . . . 4,260 370,705Semtech Corp. (Semiconductors & Equip.). . . . (a) 1,320 69,828Silicon Laboratories, Inc. (Semiconductors &
Equip.) . . . . . . . . . . . . . . . . . . . . . . . . (a) 2,914 337,966Silicon Motion Technology Corp. – ADR
(Semiconductors & Equip.) . . . . . . . . . . . . 1,921 97,414SPS Commerce, Inc. (Software) . . . . . . . . . . (a) 36,253 2,009,141SVMK, Inc. (Software) . . . . . . . . . . . . . . . . (a) 16,236 290,137TESSCO Technologies, Inc.
(Communications Equip.) . . . . . . . . . . . . . 4,987 55,954Tower Semiconductor Ltd. (Semiconductors &
Equip.) . . . . . . . . . . . . . . . . . . . . . . . . (a) 33,370 802,882Virtusa Corp. (IT Svs.) . . . . . . . . . . . . . . . . . (a) 6,463 292,968WNS Holdings Ltd. – ADR (IT Svs.). . . . . . . . . (a) 11,349 750,736Yext, Inc. (Software). . . . . . . . . . . . . . . . . . (a) 56,073 808,573
36,153,823
MATERIALS – 3.1%Boise Cascade Co. (Paper & Forest Products) . 25,760 941,013Compass Minerals International, Inc. (Metals &
Mining) . . . . . . . . . . . . . . . . . . . . . . . . 2,101 128,077Ingevity Corp. (Chemicals) . . . . . . . . . . . . . . (a) 7,809 682,350Innospec, Inc. (Chemicals) . . . . . . . . . . . . . 6,531 675,567Materion Corp. (Metals & Mining) . . . . . . . . . 12,749 757,928PolyOne Corp. (Chemicals) . . . . . . . . . . . . . 52,405 1,927,980Silgan Holdings, Inc. (Containers & Packaging). 12,779 397,171Summit Materials, Inc. Class A
(Construction Materials) . . . . . . . . . . . . . (a) 14,621 349,442Venator Materials PLC (Chemicals) . . . . . . . . (a) 146,203 559,958
6,419,486
REAL ESTATE – 5.3%EastGroup Properties, Inc. (Equity REIT) . . . . . 11,760 1,560,199First Industrial Realty Trust, Inc. (Equity REIT) . . 38,591 1,601,912Four Corners Property Trust, Inc. (Equity REIT) . 13,173 371,347Hersha Hospitality Trust (Equity REIT) . . . . . . . 7,640 111,162National Storage Affiliates Trust (Equity REIT). . 4,676 157,207NexPoint Residential Trust, Inc. (Equity REIT) . . 34,007 1,530,315
Ohio National Fund, Inc. ON BlackRock Advantage Small Cap Growth Portfolio (Continued)
Schedule of Investments December 31, 2019
87 (continued)

Common Stocks (Continued) Shares Value
REAL ESTATE (continued)Plymouth Industrial REIT, Inc. (Equity REIT) . . . 12,071 $ 221,986QTS Realty Trust, Inc. Class A (Equity REIT) . . . 32,543 1,766,109RLJ Lodging Trust (Equity REIT). . . . . . . . . . . 20,841 369,303RMR Group, Inc. / The Class A (Real Estate
Mgmt. & Development) . . . . . . . . . . . . . . 8,260 376,986Ryman Hospitality Properties, Inc.
(Equity REIT) . . . . . . . . . . . . . . . . . . . . . 22,723 1,969,175Summit Hotel Properties, Inc. (Equity REIT) . . . 67,375 831,407
10,867,108
UTILITIES – 0.6%American States Water Co. (Water Utilities) . . . 7,547 653,872New Jersey Resources Corp. (Gas Utilities) . . . 10,813 481,936PNM Resources, Inc. (Electric Utilities). . . . . . 1,079 54,716
1,190,524Total Common Stocks (Cost $181,645,362) . . . . $203,154,709
Rights – 0.0% Quantity Value
HEALTH CARE – 0.0%Alder BioPharmaceuticals, Inc. CVR
(Pharmaceuticals) . . . . . . . . . . . . . . . . . 14,631 $ 12,876Total Rights (Cost $12,875) . . . . . . . . . . . . . $ 12,876
Money Market Funds – 1.5% Shares Value
State Street Institutional Liquid Reserves FundInstitutional Class, 1.734% . . . . . . . . . . . . . (b) 3,073,096 $ 3,073,403
Total Money Market Funds (Cost $3,073,403) . . . . . . $ 3,073,403Total Investments – 100.7% (Cost $184,731,640) . . . . . . . (c) $206,240,988Liabilities in Excess of Other Assets – (0.7)% . . . . . . . (d) (1,392,867)Net Assets – 100.0% $204,848,121
Percentages are stated as a percent of net assets.Abbreviations:
ADR: American Depositary ReceiptsFootnotes:
(a) Non-income producing security.(b) Rate represents the seven-day yield at December 31, 2019.(c) Represents cost for financial reporting purposes, which may differ from cost basis for federal income tax purposes. See also Note 8 of the Notes to Financial
Statements.(d) Includes $117,000 of cash pledged as collateral for the futures contracts outstanding at December 31, 2019. See also the following Schedule of Open Futures
Contracts.
The accompanying notes are an integral part of these financial statements.
Schedule of Open Futures Contracts December 31, 2019
DescriptionNumber ofcontracts Expiration Date
NotionalAmount Value
UnrealizedAppreciation
(Depreciation)
Variation MarginReceivable(Payable)
CME E-mini Russell 2000 Index - Long 39 March 20, 2020 $3,229,798 $3,257,670 $27,872 $3,127
The accompanying notes are an integral part of these financial statements.
Ohio National Fund, Inc. ON BlackRock Advantage Small Cap Growth Portfolio (Continued)
Schedule of Investments December 31, 2019
88

Objective/Strategy
The ON S&P MidCap 400® Index Portfolio seeks total returnapproximating that of the Standard & Poor’s MidCap 400® Index(S&P MidCap 400® Index), including reinvestment of dividends, at a risklevel consistent with that of the S&P MidCap 400® Index by investing,under normal circumstances, more than 80% of its net assets in thesecurities included in the S&P MidCap 400® Index.
Performance as of December 31, 2019
Average Annual returnsOne year 25.58%Five years 6.35%Ten years 10.49%
Past performance does not guarantee future results. The performance dataquoted represents past performance and current returns may be lower or higher.Total return figures include change in share price and reinvestment of dividendsand capital gains. The investment return and principal value will fluctuate so thatan investor’s shares, when redeemed, may be worth more or less than the originalcost. To obtain performance information up to the most recent month end, calltoll-free 1-877-781-6392.
The Portfolio is not open to direct retail investment. Beneficial interest in shares isobtained solely by purchase of variable life insurance policies and variable annuitycontracts. Actual performance results for variable annuity and variable universallife contracts will be lower due to contract charges. Consult your contract forapplicable charges.
Total expense ratio is 0.51% per the Fund’s prospectus dated November 22, 2019.Additional information pertaining to the Portfolio’s expense ratio as ofDecember 31, 2019 can be found in the Portfolio’s Financial Highlights.
Comments from Sub-Adviser
Q. How did the Portfolio perform in comparison to its benchmark duringthe reporting period?
A. For the year ended December 31, 2019, the Portfolio returned 25.58%versus 26.20% for the benchmark, the S&P MidCap 400® Index.
Q. Were there specific market conditions, investment strategies, ortechniques that materially affected the Portfolio’s benchmark-relativeperformance during the reporting period?
A. The Portfolio intends to track the underlying return of the S&P MidCap400® Index. There were no material market events or changes in strategyduring the year that materially impacted the Portfolio’s relative return.Sources of return variance were related to the cumulative impact ofinvesting the day-to-day cash flows in the Portfolio.
Q. How did sector allocation and security selection each impact thePortfolio’s performance relative to its benchmark? For sector allocation,were there any factors that impacted the benchmark’s performancemore significantly than the Portfolio’s performance? For securityselection, was there anything specific regarding the Portfolio’s strategythat caused deviation from the benchmark?
A. There was no impact from either sector or stock selection thatcaused any significant performance variance between the Portfolio andits benchmark. (1)
All but one of eleven sectors in the benchmark produced positive returnsin 2019. Information Technology led the way, returning 42.7% for theperiod. Industrials & Financials returned 33.1% and 25.6%, respectively.Energy was the only sector in the benchmark without a positive return,falling 13.0%. (1)
Q. Which holdings contributed the most to, and detracted the most from,the Portfolio’s benchmark-relative performance?
A. Because the Portfolio weights its holdings to be similar to thoseutilized by the benchmark index, there were no holdings that significantlycontributed to or detracted from the Portfolio’s benchmark-relativeperformance. (1)
Q. How did the Portfolio’s use of derivative instruments and initialpublic offerings (IPOs), if any, impact performance?
A. The Portfolio uses S&P MidCap 400® Index futures contractsprimarily to equitize open dividend receivables, as well as to manageday-to-day cash flows, to ensure the Portfolio is fully invested. Thefutures did not meaningfully impact performance, however, due to theirindex characteristics and size in relation to the Portfolio’s net assets. (1)
Q. Were there any significant changes to the Portfolio’s managementteam, investment strategy, or security selection process during thereporting period?
A. Over the course of 2019, the Portfolio’s management teamexperienced an unusually high amount of personnel changes for variedreasons including retirement, relocation due to family reasons, andpursuit of other opportunities. Departures have been replaced, in allcases, with portfolio managers who exceed the previous team member’sindustry experience, and the changes have resulted in no increase ordecrease in total team members dedicated to the Portfolio. Geode CapitalManagement LLC’s (�Geode�) investment management philosophyutilizes a team-based approach that follows a disciplined and repeatableinvestment process, seeking to limit dependency on any singleinvestment professional, and, in the case of a team member’s departure,is less disruptive to the execution of the investment process.
Additionally, in December, Geode added a new position to the team withthe hire of Diane Hsiung as CIO – Index and ETF Strategies. In this newlycreated role, Ms. Hsiung, is responsible for the overall development andimplementation of the firm’s Index strategies, and providing oversightand management of team members, while driving strategic initiatives toscale operational processes and manage portfolio risks. Geode believesthe management team is well-positioned going forward.
There were no material changes to the investment strategy or stockselection process during the period.
(1) The Portfolio’s composition is subject to change. Holdings and weightings areas of December 31, 2019.
Ohio National Fund, Inc. ON S&P MidCap 400® Index Portfolio (Unaudited)
89 (continued)

Change in Value of $10,000 Investment
ON S&P MidCap 400® Index Portfolio (A)S&P MidCap 400® Index (B)
5,000
10,000
15,000
20,000
25,000
30,000
$35,000
6/1
012
/10 6
/1112
/11 6
/1212
/12 6
/1312
/13 6
/1412
/14 6
/1512
/15 6
/1612
/16 6
/1712
/17 6
/1812
/18 6
/19
12/3
1/09
12/1
9
$33,119 (B)
$27,119 (A)
Hypothetical illustration based on past performance. Future performance will vary.The Portfolio’s returns reflect reinvested dividends. The Portfolio’s holdings maydiffer significantly from the securities in the index. The index is unmanaged andtherefore does not reflect the cost of portfolio management and accounting.
The S&P MidCap 400®00 Index is a capitalization-weighted index of 400 commonstocks representing all major industries in the mid-range of the U.S. stock market.The index presented includes the effects of reinvested dividends.
Past performance is no guarantee of future results. Redemption of fund sharescould have tax implications unique to each shareholder.
Prior to December 16, 2016, the Portfolio was known as the Target VIP Portfolio.The strategy of the Target VIP Portfolio was to seek above average total return byinvesting in common stocks of companies which were identified by a model thatapplied separate uniquely specialized strategies.
The S&P MidCap 400®00 Index is a product of S&P Dow Jones Indices LLC or itsaffiliates (“SPDJI”), and has been licensed for use by Ohio National Investments,Inc. (“ONI”). Standard & Poor’s® and S&P®PP are registered trademarks of Standard& Poor’s Financial Services LLC (“S&P”); Dow Jones® is a registered trademark ofDow Jones Trademark Holdings LLC (“Dow Jones”); and these trademarks havebeen licensed for use by SPDJI and sublicensed for certain purposes by ONI. TheS&P MidCap 400®00 Index Portfolio of Ohio National Fund, Inc. is not sponsored,endorsed, sold or promoted by SPDJI, Dow Jones, S&P, their respective affiliates,and none of such parties make any representation regarding the advisability ofinvesting in such product(s) nor do they have any liability for any errors, omissions,or interruptions of the S&P MidCap 400®00 Index.
Portfolio Composition as of December 31, 2019 (1)
% of Net AssetsCommon Stocks (4) 99.3U.S. Treasury Obligations 0.0Money Market Funds and
Other Net Assets 0.7100.0
Top 10 Portfolio Holdings as of December 31, 2019 (1) (2) (3)
% of Net Assets1. Teledyne Technologies, Inc. 0.72. Domino’s Pizza, Inc. 0.63. Tyler Technologies, Inc. 0.64. Alleghany Corp. 0.65. Teradyne, Inc. 0.66. West Pharmaceutical Services, Inc. 0.67. Medical Properties Trust, Inc. 0.68. Fair Isaac Corp. 0.69. Trimble, Inc. 0.6
10. Camden Property Trust 0.6
(1) Composition of Portfolio subject to change.(2) Short-term investments have been excluded from the list of Top 10 Portfolio Holdings.(3) Top 10 Portfolio Holdings is presented at an individual security level. Total investment exposure by issuer may be higher.(4) Sectors (Common Stocks):
% of Net AssetsFinancials 16.5Industrials 15.5Information Technology 15.5Consumer Discretionary 13.5Real Estate 11.2Health Care 9.7Materials 6.0Utilities 4.5Consumer Staples 2.9Energy 2.1Communication Services 1.9
99.3
Ohio National Fund, Inc. ON S&P MidCap 400® Index Portfolio (Unaudited) (Continued)
90

Common Stocks – 99.3% Shares Value
COMMUNICATION SERVICES – 1.9%AMC Networks, Inc. Class A (Media) . . . . . . . (a) 10,825 $ 427,587Cable One, Inc. (Media) . . . . . . . . . . . . . . . 1,232 1,833,795Cinemark Holdings, Inc. (Entertainment) . . . . . 26,125 884,331John Wiley & Sons, Inc. Class A (Media). . . . . 10,715 519,892Meredith Corp. (Media) . . . . . . . . . . . . . . . 9,850 319,830New York Times Co. / The Class A (Media) . . . . 35,229 1,133,317TEGNA, Inc. (Media) . . . . . . . . . . . . . . . . . 53,155 887,157Telephone & Data Systems, Inc. (Wireless
Telecom. Svs.). . . . . . . . . . . . . . . . . . . . 23,966 609,455TripAdvisor, Inc. (Interactive Media & Svs.) . . . 25,750 782,285World Wrestling Entertainment, Inc. Class A
(Entertainment) . . . . . . . . . . . . . . . . . . . 11,630 754,438Yelp, Inc. (Interactive Media & Svs.) . . . . . . . (a) 15,640 544,741
8,696,828
CONSUMER DISCRETIONARY – 13.5%Aaron’s, Inc. (Specialty Retail) . . . . . . . . . . . 16,436 938,660Adient PLC (Auto Components) . . . . . . . . . . . (a) 21,332 453,305Adtalem Global Education, Inc. (Diversified
Consumer Svs.) . . . . . . . . . . . . . . . . . . . (a) 13,232 462,723American Eagle Outfitters, Inc.
(Specialty Retail) . . . . . . . . . . . . . . . . . . 38,922 572,153AutoNation, Inc. (Specialty Retail) . . . . . . . . . (a) 14,430 701,731Bed Bath & Beyond, Inc. (Specialty Retail) . . . 31,092 537,892Boyd Gaming Corp. (Hotels, Restaurants &
Leisure). . . . . . . . . . . . . . . . . . . . . . . . 19,614 587,243Brinker International, Inc. (Hotels, Restaurants
& Leisure) . . . . . . . . . . . . . . . . . . . . . . 9,125 383,250Brunswick Corp. (Leisure Products) . . . . . . . . 19,991 1,199,060Caesars Entertainment Corp. (Hotels,
Restaurants & Leisure) . . . . . . . . . . . . . . (a) 136,781 1,860,222Carter’s, Inc. (Textiles, Apparel & Luxury
Goods) . . . . . . . . . . . . . . . . . . . . . . . . 10,819 1,182,950Cheesecake Factory, Inc. / The (Hotels,
Restaurants & Leisure) . . . . . . . . . . . . . . 10,067 391,204Choice Hotels International, Inc. (Hotels,
Restaurants & Leisure) . . . . . . . . . . . . . . 7,785 805,203Churchill Downs, Inc. (Hotels, Restaurants &
Leisure). . . . . . . . . . . . . . . . . . . . . . . . 8,692 1,192,542Columbia Sportswear Co. (Textiles, Apparel &
Luxury Goods). . . . . . . . . . . . . . . . . . . . 7,116 712,952Cracker Barrel Old Country Store, Inc. (Hotels,
Restaurants & Leisure) . . . . . . . . . . . . . . 5,896 906,451Dana, Inc. (Auto Components) . . . . . . . . . . . 35,272 641,950Deckers Outdoor Corp. (Textiles, Apparel &
Luxury Goods). . . . . . . . . . . . . . . . . . . . (a) 6,856 1,157,704Delphi Technologies PLC (Auto Components) . . (a) 21,161 271,496Dick’s Sporting Goods, Inc. (Specialty Retail) . . 15,586 771,351Dillard’s, Inc. Class A (Multiline Retail) . . . . . . 2,416 177,528Domino’s Pizza, Inc. (Hotels, Restaurants &
Leisure). . . . . . . . . . . . . . . . . . . . . . . . 10,023 2,944,557Dunkin’ Brands Group, Inc. (Hotels,
Restaurants & Leisure) . . . . . . . . . . . . . . 20,302 1,533,613Eldorado Resorts, Inc. (Hotels, Restaurants &
Leisure). . . . . . . . . . . . . . . . . . . . . . . . (a) 16,009 954,777Etsy, Inc. (Internet & Direct Marketing Retail) . . (a) 29,038 1,286,383Five Below, Inc. (Specialty Retail) . . . . . . . . . (a) 13,643 1,744,394Foot Locker, Inc. (Specialty Retail) . . . . . . . . . 26,231 1,022,747Gentex Corp. (Auto Components) . . . . . . . . . 61,957 1,795,514Goodyear Tire & Rubber Co. / The
(Auto Components) . . . . . . . . . . . . . . . . 56,995 886,557Graham Holdings Co. Class B (Diversified
Consumer Svs.) . . . . . . . . . . . . . . . . . . . 1,066 681,163Grand Canyon Education, Inc. (Diversified
Consumer Svs.) . . . . . . . . . . . . . . . . . . . (a) 11,818 1,132,046Grubhub, Inc. (Internet & Direct Marketing
Retail) . . . . . . . . . . . . . . . . . . . . . . . . . (a) 22,411 1,090,071Helen of Troy Ltd. (Household Durables) . . . . . (a) 6,167 1,108,765
Common Stocks (Continued) Shares Value
CONSUMER DISCRETIONARY (continued)Jack in the Box, Inc. (Hotels, Restaurants &
Leisure). . . . . . . . . . . . . . . . . . . . . . . . 5,796 $ 452,262KB Home (Household Durables) . . . . . . . . . . 20,996 719,533Lear Corp. (Auto Components) . . . . . . . . . . . 13,486 1,850,279Marriott Vacations Worldwide Corp. (Hotels,
Restaurants & Leisure) . . . . . . . . . . . . . . 9,170 1,180,729Mattel, Inc. (Leisure Products) . . . . . . . . . . . (a) 84,968 1,151,316Murphy U.S.A., Inc. (Specialty Retail) . . . . . . . (a) 7,086 829,062Ollie’s Bargain Outlet Holdings, Inc.
(Multiline Retail) . . . . . . . . . . . . . . . . . . (a) 13,402 875,285Papa John’s International, Inc. (Hotels,
Restaurants & Leisure) . . . . . . . . . . . . . . 5,402 341,136Penn National Gaming, Inc. (Hotels,
Restaurants & Leisure) . . . . . . . . . . . . . . (a) 26,701 682,478Polaris, Inc. (Leisure Products) . . . . . . . . . . . 14,092 1,433,156Pool Corp. (Distributors) . . . . . . . . . . . . . . . 9,812 2,083,873RH (Specialty Retail) . . . . . . . . . . . . . . . . . (a) 4,150 886,025Sally Beauty Holdings, Inc. (Specialty Retail) . . (a) 28,508 520,271Scientific Games Corp. (Hotels, Restaurants &
Leisure). . . . . . . . . . . . . . . . . . . . . . . . (a) 13,257 355,022Service Corp. International (Diversified
Consumer Svs.) . . . . . . . . . . . . . . . . . . . 44,794 2,061,868Six Flags Entertainment Corp. (Hotels,
Restaurants & Leisure) . . . . . . . . . . . . . . 19,264 868,999Skechers U.S.A., Inc. Class A (Textiles, Apparel
& Luxury Goods) . . . . . . . . . . . . . . . . . . (a) 32,818 1,417,409Tempur Sealy International, Inc.
(Household Durables) . . . . . . . . . . . . . . . (a) 11,135 969,413Texas Roadhouse, Inc. (Hotels, Restaurants &
Leisure). . . . . . . . . . . . . . . . . . . . . . . . 16,003 901,289Thor Industries, Inc. (Automobiles) . . . . . . . . 13,528 1,004,995Toll Brothers, Inc. (Household Durables) . . . . . 31,662 1,250,966TRI Pointe Group, Inc. (Household Durables) . . (a) 34,124 531,652Urban Outfitters, Inc. (Specialty Retail) . . . . . . (a) 17,287 480,060Visteon Corp. (Auto Components) . . . . . . . . . (a) 6,853 593,401W.W. International, Inc. (Diversified Consumer
Svs.) . . . . . . . . . . . . . . . . . . . . . . . . . . (a) 11,384 434,983Wendy’s Co. / The (Hotels, Restaurants &
Leisure). . . . . . . . . . . . . . . . . . . . . . . . 45,102 1,001,715Williams-Sonoma, Inc. (Specialty Retail) . . . . . 19,020 1,396,829Wyndham Destinations, Inc. (Hotels,
Restaurants & Leisure) . . . . . . . . . . . . . . 22,228 1,148,965Wyndham Hotels & Resorts, Inc. (Hotels,
Restaurants & Leisure) . . . . . . . . . . . . . . 23,322 1,464,85560,975,983
CONSUMER STAPLES – 2.9%BJ’s Wholesale Club Holdings, Inc. (Food &
Staples Retailing). . . . . . . . . . . . . . . . . . (a) 29,939 680,813Boston Beer Co., Inc. / The Class A
(Beverages) . . . . . . . . . . . . . . . . . . . . . (a) 2,259 853,563Casey’s General Stores, Inc. (Food & Staples
Retailing) . . . . . . . . . . . . . . . . . . . . . . . 9,014 1,433,136Edgewell Personal Care Co.
(Personal Products) . . . . . . . . . . . . . . . . (a) 13,284 411,273Energizer Holdings, Inc. (Household Products) . 15,766 791,769Flowers Foods, Inc. (Food Products) . . . . . . . 47,169 1,025,454Hain Celestial Group, Inc. / The
(Food Products). . . . . . . . . . . . . . . . . . . (a) 19,688 511,002Ingredion, Inc. (Food Products). . . . . . . . . . . 16,361 1,520,755Lancaster Colony Corp. (Food Products) . . . . . 4,849 776,325Nu Skin Enterprises, Inc. Class A
(Personal Products) . . . . . . . . . . . . . . . . 13,613 557,861Pilgrim’s Pride Corp. (Food Products) . . . . . . . (a) 12,844 420,191Post Holdings, Inc. (Food Products) . . . . . . . . (a) 16,288 1,777,021Sanderson Farms, Inc. (Food Products) . . . . . 4,832 851,495Sprouts Farmers Market, Inc. (Food & Staples
Retailing) . . . . . . . . . . . . . . . . . . . . . . . (a) 28,950 560,182
Ohio National Fund, Inc. ON S&P MidCap 400® Index Portfolio
Schedule of Investments December 31, 2019
91 (continued)
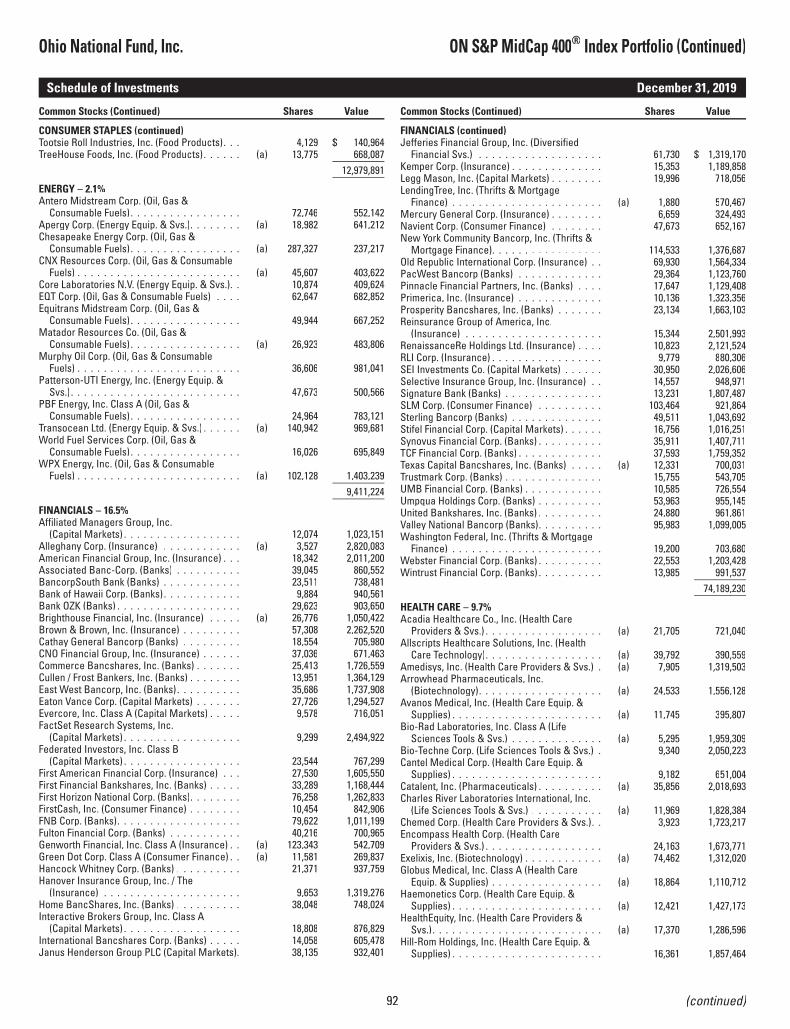
Common Stocks (Continued) Shares Value
CONSUMER STAPLES (continued)Tootsie Roll Industries, Inc. (Food Products). . . 4,129 $ 140,964TreeHouse Foods, Inc. (Food Products). . . . . . (a) 13,775 668,087
12,979,891
ENERGY – 2.1%Antero Midstream Corp. (Oil, Gas &
Consumable Fuels) . . . . . . . . . . . . . . . . . 72,746 552,142Apergy Corp. (Energy Equip. & Svs.). . . . . . . . (a) 18,982 641,212Chesapeake Energy Corp. (Oil, Gas &
Consumable Fuels) . . . . . . . . . . . . . . . . . (a) 287,327 237,217CNX Resources Corp. (Oil, Gas & Consumable
Fuels) . . . . . . . . . . . . . . . . . . . . . . . . . (a) 45,607 403,622Core Laboratories N.V. (Energy Equip. & Svs.). . 10,874 409,624EQT Corp. (Oil, Gas & Consumable Fuels) . . . . 62,647 682,852Equitrans Midstream Corp. (Oil, Gas &
Consumable Fuels) . . . . . . . . . . . . . . . . . 49,944 667,252Matador Resources Co. (Oil, Gas &
Consumable Fuels) . . . . . . . . . . . . . . . . . (a) 26,923 483,806Murphy Oil Corp. (Oil, Gas & Consumable
Fuels) . . . . . . . . . . . . . . . . . . . . . . . . . 36,606 981,041Patterson-UTI Energy, Inc. (Energy Equip. &
Svs.) . . . . . . . . . . . . . . . . . . . . . . . . . . 47,673 500,566PBF Energy, Inc. Class A (Oil, Gas &
Consumable Fuels) . . . . . . . . . . . . . . . . . 24,964 783,121Transocean Ltd. (Energy Equip. & Svs.) . . . . . . (a) 140,942 969,681World Fuel Services Corp. (Oil, Gas &
Consumable Fuels) . . . . . . . . . . . . . . . . . 16,026 695,849WPX Energy, Inc. (Oil, Gas & Consumable
Fuels) . . . . . . . . . . . . . . . . . . . . . . . . . (a) 102,128 1,403,2399,411,224
FINANCIALS – 16.5%Affiliated Managers Group, Inc.
(Capital Markets) . . . . . . . . . . . . . . . . . . 12,074 1,023,151Alleghany Corp. (Insurance) . . . . . . . . . . . . (a) 3,527 2,820,083American Financial Group, Inc. (Insurance) . . . 18,342 2,011,200Associated Banc-Corp. (Banks) . . . . . . . . . . 39,045 860,552BancorpSouth Bank (Banks) . . . . . . . . . . . . 23,511 738,481Bank of Hawaii Corp. (Banks) . . . . . . . . . . . . 9,884 940,561Bank OZK (Banks) . . . . . . . . . . . . . . . . . . . 29,623 903,650Brighthouse Financial, Inc. (Insurance) . . . . . (a) 26,776 1,050,422Brown & Brown, Inc. (Insurance) . . . . . . . . . 57,308 2,262,520Cathay General Bancorp (Banks) . . . . . . . . . 18,554 705,980CNO Financial Group, Inc. (Insurance) . . . . . . 37,036 671,463Commerce Bancshares, Inc. (Banks) . . . . . . . 25,413 1,726,559Cullen / Frost Bankers, Inc. (Banks) . . . . . . . . 13,951 1,364,129East West Bancorp, Inc. (Banks) . . . . . . . . . . 35,686 1,737,908Eaton Vance Corp. (Capital Markets) . . . . . . . 27,726 1,294,527Evercore, Inc. Class A (Capital Markets) . . . . . 9,578 716,051FactSet Research Systems, Inc.
(Capital Markets) . . . . . . . . . . . . . . . . . . 9,299 2,494,922Federated Investors, Inc. Class B
(Capital Markets) . . . . . . . . . . . . . . . . . . 23,544 767,299First American Financial Corp. (Insurance) . . . 27,530 1,605,550First Financial Bankshares, Inc. (Banks) . . . . . 33,289 1,168,444First Horizon National Corp. (Banks). . . . . . . . 76,258 1,262,833FirstCash, Inc. (Consumer Finance) . . . . . . . . 10,454 842,906FNB Corp. (Banks). . . . . . . . . . . . . . . . . . . 79,622 1,011,199Fulton Financial Corp. (Banks) . . . . . . . . . . . 40,216 700,965Genworth Financial, Inc. Class A (Insurance) . . (a) 123,343 542,709Green Dot Corp. Class A (Consumer Finance) . . (a) 11,581 269,837Hancock Whitney Corp. (Banks) . . . . . . . . . . 21,371 937,759Hanover Insurance Group, Inc. / The
(Insurance) . . . . . . . . . . . . . . . . . . . . . 9,653 1,319,276Home BancShares, Inc. (Banks) . . . . . . . . . . 38,048 748,024Interactive Brokers Group, Inc. Class A
(Capital Markets) . . . . . . . . . . . . . . . . . . 18,808 876,829International Bancshares Corp. (Banks) . . . . . 14,058 605,478Janus Henderson Group PLC (Capital Markets). 38,135 932,401
Common Stocks (Continued) Shares Value
FINANCIALS (continued)Jefferies Financial Group, Inc. (Diversified
Financial Svs.) . . . . . . . . . . . . . . . . . . . 61,730 $ 1,319,170Kemper Corp. (Insurance) . . . . . . . . . . . . . . 15,353 1,189,858Legg Mason, Inc. (Capital Markets) . . . . . . . . 19,996 718,056LendingTree, Inc. (Thrifts & Mortgage
Finance) . . . . . . . . . . . . . . . . . . . . . . . (a) 1,880 570,467Mercury General Corp. (Insurance) . . . . . . . . 6,659 324,493Navient Corp. (Consumer Finance) . . . . . . . . 47,673 652,167New York Community Bancorp, Inc. (Thrifts &
Mortgage Finance). . . . . . . . . . . . . . . . . 114,533 1,376,687Old Republic International Corp. (Insurance) . . 69,930 1,564,334PacWest Bancorp (Banks) . . . . . . . . . . . . . 29,364 1,123,760Pinnacle Financial Partners, Inc. (Banks) . . . . 17,647 1,129,408Primerica, Inc. (Insurance) . . . . . . . . . . . . . 10,136 1,323,356Prosperity Bancshares, Inc. (Banks) . . . . . . . 23,134 1,663,103Reinsurance Group of America, Inc.
(Insurance) . . . . . . . . . . . . . . . . . . . . . 15,344 2,501,993RenaissanceRe Holdings Ltd. (Insurance) . . . . 10,823 2,121,524RLI Corp. (Insurance) . . . . . . . . . . . . . . . . . 9,779 880,306SEI Investments Co. (Capital Markets) . . . . . . 30,950 2,026,606Selective Insurance Group, Inc. (Insurance) . . 14,557 948,971Signature Bank (Banks) . . . . . . . . . . . . . . . 13,231 1,807,487SLM Corp. (Consumer Finance) . . . . . . . . . . 103,464 921,864Sterling Bancorp (Banks) . . . . . . . . . . . . . . 49,511 1,043,692Stifel Financial Corp. (Capital Markets) . . . . . . 16,756 1,016,251Synovus Financial Corp. (Banks) . . . . . . . . . . 35,911 1,407,711TCF Financial Corp. (Banks) . . . . . . . . . . . . . 37,593 1,759,352Texas Capital Bancshares, Inc. (Banks) . . . . . (a) 12,331 700,031Trustmark Corp. (Banks) . . . . . . . . . . . . . . . 15,755 543,705UMB Financial Corp. (Banks) . . . . . . . . . . . . 10,585 726,554Umpqua Holdings Corp. (Banks) . . . . . . . . . . 53,963 955,145United Bankshares, Inc. (Banks) . . . . . . . . . . 24,880 961,861Valley National Bancorp (Banks). . . . . . . . . . 95,983 1,099,005Washington Federal, Inc. (Thrifts & Mortgage
Finance) . . . . . . . . . . . . . . . . . . . . . . . 19,200 703,680Webster Financial Corp. (Banks) . . . . . . . . . . 22,553 1,203,428Wintrust Financial Corp. (Banks) . . . . . . . . . . 13,985 991,537
74,189,230
HEALTH CARE – 9.7%Acadia Healthcare Co., Inc. (Health Care
Providers & Svs.) . . . . . . . . . . . . . . . . . . (a) 21,705 721,040Allscripts Healthcare Solutions, Inc. (Health
Care Technology). . . . . . . . . . . . . . . . . . (a) 39,792 390,559Amedisys, Inc. (Health Care Providers & Svs.) . (a) 7,905 1,319,503Arrowhead Pharmaceuticals, Inc.
(Biotechnology). . . . . . . . . . . . . . . . . . . (a) 24,533 1,556,128Avanos Medical, Inc. (Health Care Equip. &
Supplies) . . . . . . . . . . . . . . . . . . . . . . . (a) 11,745 395,807Bio-Rad Laboratories, Inc. Class A (Life
Sciences Tools & Svs.) . . . . . . . . . . . . . . (a) 5,295 1,959,309Bio-Techne Corp. (Life Sciences Tools & Svs.) . 9,340 2,050,223Cantel Medical Corp. (Health Care Equip. &
Supplies) . . . . . . . . . . . . . . . . . . . . . . . 9,182 651,004Catalent, Inc. (Pharmaceuticals) . . . . . . . . . . (a) 35,856 2,018,693Charles River Laboratories International, Inc.
(Life Sciences Tools & Svs.) . . . . . . . . . . . (a) 11,969 1,828,384Chemed Corp. (Health Care Providers & Svs.). . 3,923 1,723,217Encompass Health Corp. (Health Care
Providers & Svs.) . . . . . . . . . . . . . . . . . . 24,163 1,673,771Exelixis, Inc. (Biotechnology) . . . . . . . . . . . . (a) 74,462 1,312,020Globus Medical, Inc. Class A (Health Care
Equip. & Supplies) . . . . . . . . . . . . . . . . . (a) 18,864 1,110,712Haemonetics Corp. (Health Care Equip. &
Supplies) . . . . . . . . . . . . . . . . . . . . . . . (a) 12,421 1,427,173HealthEquity, Inc. (Health Care Providers &
Svs.) . . . . . . . . . . . . . . . . . . . . . . . . . . (a) 17,370 1,286,596Hill-Rom Holdings, Inc. (Health Care Equip. &
Supplies) . . . . . . . . . . . . . . . . . . . . . . . 16,361 1,857,464
Ohio National Fund, Inc. ON S&P MidCap 400® Index Portfolio (Continued)
Schedule of Investments December 31, 2019
92 (continued)
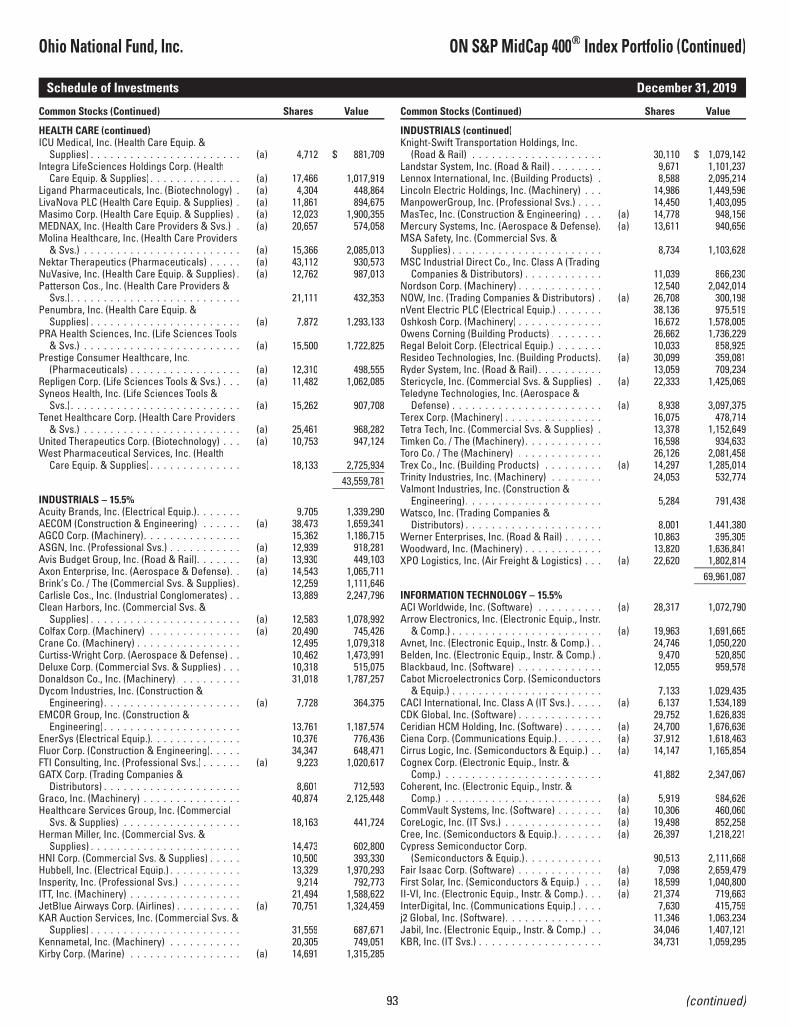
Common Stocks (Continued) Shares Value
HEALTH CARE (continued)ICU Medical, Inc. (Health Care Equip. &
Supplies) . . . . . . . . . . . . . . . . . . . . . . . (a) 4,712 $ 881,709Integra LifeSciences Holdings Corp. (Health
Care Equip. & Supplies) . . . . . . . . . . . . . . (a) 17,466 1,017,919Ligand Pharmaceuticals, Inc. (Biotechnology) . (a) 4,304 448,864LivaNova PLC (Health Care Equip. & Supplies) . (a) 11,861 894,675Masimo Corp. (Health Care Equip. & Supplies) . (a) 12,023 1,900,355MEDNAX, Inc. (Health Care Providers & Svs.) . (a) 20,657 574,058Molina Healthcare, Inc. (Health Care Providers
& Svs.) . . . . . . . . . . . . . . . . . . . . . . . . (a) 15,366 2,085,013Nektar Therapeutics (Pharmaceuticals) . . . . . (a) 43,112 930,573NuVasive, Inc. (Health Care Equip. & Supplies) . (a) 12,762 987,013Patterson Cos., Inc. (Health Care Providers &
Svs.) . . . . . . . . . . . . . . . . . . . . . . . . . . 21,111 432,353Penumbra, Inc. (Health Care Equip. &
Supplies) . . . . . . . . . . . . . . . . . . . . . . . (a) 7,872 1,293,133PRA Health Sciences, Inc. (Life Sciences Tools
& Svs.) . . . . . . . . . . . . . . . . . . . . . . . . (a) 15,500 1,722,825Prestige Consumer Healthcare, Inc.
(Pharmaceuticals) . . . . . . . . . . . . . . . . . (a) 12,310 498,555Repligen Corp. (Life Sciences Tools & Svs.) . . . (a) 11,482 1,062,085Syneos Health, Inc. (Life Sciences Tools &
Svs.) . . . . . . . . . . . . . . . . . . . . . . . . . . (a) 15,262 907,708Tenet Healthcare Corp. (Health Care Providers
& Svs.) . . . . . . . . . . . . . . . . . . . . . . . . (a) 25,461 968,282United Therapeutics Corp. (Biotechnology) . . . (a) 10,753 947,124West Pharmaceutical Services, Inc. (Health
Care Equip. & Supplies) . . . . . . . . . . . . . . 18,133 2,725,93443,559,781
INDUSTRIALS – 15.5%Acuity Brands, Inc. (Electrical Equip.). . . . . . . 9,705 1,339,290AECOM (Construction & Engineering) . . . . . . (a) 38,473 1,659,341AGCO Corp. (Machinery). . . . . . . . . . . . . . . 15,362 1,186,715ASGN, Inc. (Professional Svs.) . . . . . . . . . . . (a) 12,939 918,281Avis Budget Group, Inc. (Road & Rail). . . . . . . (a) 13,930 449,103Axon Enterprise, Inc. (Aerospace & Defense). . (a) 14,543 1,065,711Brink’s Co. / The (Commercial Svs. & Supplies) . 12,259 1,111,646Carlisle Cos., Inc. (Industrial Conglomerates) . . 13,889 2,247,796Clean Harbors, Inc. (Commercial Svs. &
Supplies) . . . . . . . . . . . . . . . . . . . . . . . (a) 12,583 1,078,992Colfax Corp. (Machinery) . . . . . . . . . . . . . . (a) 20,490 745,426Crane Co. (Machinery) . . . . . . . . . . . . . . . . 12,495 1,079,318Curtiss-Wright Corp. (Aerospace & Defense) . . 10,462 1,473,991Deluxe Corp. (Commercial Svs. & Supplies) . . . 10,318 515,075Donaldson Co., Inc. (Machinery) . . . . . . . . . . 31,018 1,787,257Dycom Industries, Inc. (Construction &
Engineering) . . . . . . . . . . . . . . . . . . . . . (a) 7,728 364,375EMCOR Group, Inc. (Construction &
Engineering) . . . . . . . . . . . . . . . . . . . . . 13,761 1,187,574EnerSys (Electrical Equip.). . . . . . . . . . . . . . 10,376 776,436Fluor Corp. (Construction & Engineering). . . . . 34,347 648,471FTI Consulting, Inc. (Professional Svs.) . . . . . . (a) 9,223 1,020,617GATX Corp. (Trading Companies &
Distributors) . . . . . . . . . . . . . . . . . . . . . 8,601 712,593Graco, Inc. (Machinery) . . . . . . . . . . . . . . . 40,874 2,125,448Healthcare Services Group, Inc. (Commercial
Svs. & Supplies) . . . . . . . . . . . . . . . . . . 18,163 441,724Herman Miller, Inc. (Commercial Svs. &
Supplies) . . . . . . . . . . . . . . . . . . . . . . . 14,473 602,800HNI Corp. (Commercial Svs. & Supplies) . . . . . 10,500 393,330Hubbell, Inc. (Electrical Equip.) . . . . . . . . . . . 13,329 1,970,293Insperity, Inc. (Professional Svs.) . . . . . . . . . 9,214 792,773ITT, Inc. (Machinery) . . . . . . . . . . . . . . . . . 21,494 1,588,622JetBlue Airways Corp. (Airlines) . . . . . . . . . . (a) 70,751 1,324,459KAR Auction Services, Inc. (Commercial Svs. &
Supplies) . . . . . . . . . . . . . . . . . . . . . . . 31,559 687,671Kennametal, Inc. (Machinery) . . . . . . . . . . . 20,305 749,051Kirby Corp. (Marine) . . . . . . . . . . . . . . . . . (a) 14,691 1,315,285
Common Stocks (Continued) Shares Value
INDUSTRIALS (continued)Knight-Swift Transportation Holdings, Inc.
(Road & Rail) . . . . . . . . . . . . . . . . . . . . 30,110 $ 1,079,142Landstar System, Inc. (Road & Rail) . . . . . . . . 9,671 1,101,237Lennox International, Inc. (Building Products) . 8,588 2,095,214Lincoln Electric Holdings, Inc. (Machinery) . . . 14,986 1,449,596ManpowerGroup, Inc. (Professional Svs.) . . . . 14,450 1,403,095MasTec, Inc. (Construction & Engineering) . . . (a) 14,778 948,156Mercury Systems, Inc. (Aerospace & Defense). (a) 13,611 940,656MSA Safety, Inc. (Commercial Svs. &
Supplies) . . . . . . . . . . . . . . . . . . . . . . . 8,734 1,103,628MSC Industrial Direct Co., Inc. Class A (Trading
Companies & Distributors) . . . . . . . . . . . . 11,039 866,230Nordson Corp. (Machinery) . . . . . . . . . . . . . 12,540 2,042,014NOW, Inc. (Trading Companies & Distributors) . (a) 26,708 300,198nVent Electric PLC (Electrical Equip.) . . . . . . . 38,136 975,519Oshkosh Corp. (Machinery) . . . . . . . . . . . . . 16,672 1,578,005Owens Corning (Building Products) . . . . . . . . 26,662 1,736,229Regal Beloit Corp. (Electrical Equip.) . . . . . . . 10,033 858,925Resideo Technologies, Inc. (Building Products). (a) 30,099 359,081Ryder System, Inc. (Road & Rail) . . . . . . . . . . 13,059 709,234Stericycle, Inc. (Commercial Svs. & Supplies) . (a) 22,333 1,425,069Teledyne Technologies, Inc. (Aerospace &
Defense) . . . . . . . . . . . . . . . . . . . . . . . (a) 8,938 3,097,375Terex Corp. (Machinery) . . . . . . . . . . . . . . . 16,075 478,714Tetra Tech, Inc. (Commercial Svs. & Supplies) . 13,378 1,152,649Timken Co. / The (Machinery) . . . . . . . . . . . . 16,598 934,633Toro Co. / The (Machinery) . . . . . . . . . . . . . 26,126 2,081,458Trex Co., Inc. (Building Products) . . . . . . . . . (a) 14,297 1,285,014Trinity Industries, Inc. (Machinery) . . . . . . . . 24,053 532,774Valmont Industries, Inc. (Construction &
Engineering) . . . . . . . . . . . . . . . . . . . . . 5,284 791,438Watsco, Inc. (Trading Companies &
Distributors) . . . . . . . . . . . . . . . . . . . . . 8,001 1,441,380Werner Enterprises, Inc. (Road & Rail) . . . . . . 10,863 395,305Woodward, Inc. (Machinery) . . . . . . . . . . . . 13,820 1,636,841XPO Logistics, Inc. (Air Freight & Logistics) . . . (a) 22,620 1,802,814
69,961,087
INFORMATION TECHNOLOGY – 15.5%ACI Worldwide, Inc. (Software) . . . . . . . . . . (a) 28,317 1,072,790Arrow Electronics, Inc. (Electronic Equip., Instr.
& Comp.) . . . . . . . . . . . . . . . . . . . . . . . (a) 19,963 1,691,665Avnet, Inc. (Electronic Equip., Instr. & Comp.) . . 24,746 1,050,220Belden, Inc. (Electronic Equip., Instr. & Comp.) . 9,470 520,850Blackbaud, Inc. (Software) . . . . . . . . . . . . . 12,055 959,578Cabot Microelectronics Corp. (Semiconductors
& Equip.) . . . . . . . . . . . . . . . . . . . . . . . 7,133 1,029,435CACI International, Inc. Class A (IT Svs.) . . . . . (a) 6,137 1,534,189CDK Global, Inc. (Software) . . . . . . . . . . . . . 29,752 1,626,839Ceridian HCM Holding, Inc. (Software) . . . . . . (a) 24,700 1,676,636Ciena Corp. (Communications Equip.) . . . . . . . (a) 37,912 1,618,463Cirrus Logic, Inc. (Semiconductors & Equip.) . . (a) 14,147 1,165,854Cognex Corp. (Electronic Equip., Instr. &
Comp.) . . . . . . . . . . . . . . . . . . . . . . . . 41,882 2,347,067Coherent, Inc. (Electronic Equip., Instr. &
Comp.) . . . . . . . . . . . . . . . . . . . . . . . . (a) 5,919 984,626CommVault Systems, Inc. (Software) . . . . . . . (a) 10,306 460,060CoreLogic, Inc. (IT Svs.) . . . . . . . . . . . . . . . (a) 19,498 852,258Cree, Inc. (Semiconductors & Equip.) . . . . . . . (a) 26,397 1,218,221Cypress Semiconductor Corp.
(Semiconductors & Equip.) . . . . . . . . . . . . 90,513 2,111,668Fair Isaac Corp. (Software) . . . . . . . . . . . . . (a) 7,098 2,659,479First Solar, Inc. (Semiconductors & Equip.) . . . (a) 18,599 1,040,800II-VI, Inc. (Electronic Equip., Instr. & Comp.) . . . (a) 21,374 719,663InterDigital, Inc. (Communications Equip.) . . . . 7,630 415,759j2 Global, Inc. (Software). . . . . . . . . . . . . . . 11,346 1,063,234Jabil, Inc. (Electronic Equip., Instr. & Comp.) . . 34,046 1,407,121KBR, Inc. (IT Svs.) . . . . . . . . . . . . . . . . . . . 34,731 1,059,295
Ohio National Fund, Inc. ON S&P MidCap 400® Index Portfolio (Continued)
Schedule of Investments December 31, 2019
93 (continued)

Common Stocks (Continued) Shares Value
INFORMATION TECHNOLOGY (continued)Littelfuse, Inc. (Electronic Equip., Instr. &
Comp.) . . . . . . . . . . . . . . . . . . . . . . . . 5,967 $ 1,141,487LiveRamp Holdings, Inc. (IT Svs.). . . . . . . . . . (a) 16,590 797,481LogMeIn, Inc. (Software) . . . . . . . . . . . . . . 11,963 1,025,708Lumentum Holdings, Inc.
(Communications Equip.) . . . . . . . . . . . . . (a) 18,919 1,500,277Manhattan Associates, Inc. (Software). . . . . . (a) 15,651 1,248,167MAXIMUS, Inc. (IT Svs.) . . . . . . . . . . . . . . . 15,679 1,166,361MKS Instruments, Inc. (Semiconductors &
Equip.) . . . . . . . . . . . . . . . . . . . . . . . . 13,359 1,469,624Monolithic Power Systems, Inc.
(Semiconductors & Equip.) . . . . . . . . . . . . 9,901 1,762,576National Instruments Corp. (Electronic Equip.,
Instr. & Comp.) . . . . . . . . . . . . . . . . . . . 28,882 1,222,864NCR Corp. (Tech. Hardware, Storage &
Periph.) . . . . . . . . . . . . . . . . . . . . . . . . (a) 31,271 1,099,488NetScout Systems, Inc.
(Communications Equip.) . . . . . . . . . . . . . (a) 16,123 388,081Perspecta, Inc. (IT Svs.) . . . . . . . . . . . . . . . 33,700 891,028PTC, Inc. (Software). . . . . . . . . . . . . . . . . . (a) 25,474 1,907,748Sabre Corp. (IT Svs.) . . . . . . . . . . . . . . . . . 67,120 1,506,173Science Applications International Corp.
(IT Svs.). . . . . . . . . . . . . . . . . . . . . . . . 12,024 1,046,328Semtech Corp. (Semiconductors & Equip.) . . . (a) 16,248 859,519Silicon Laboratories, Inc. (Semiconductors &
Equip.) . . . . . . . . . . . . . . . . . . . . . . . . (a) 10,630 1,232,867SolarEdge Technologies, Inc. (Semiconductors
& Equip.) . . . . . . . . . . . . . . . . . . . . . . . (a) 11,913 1,132,807Synaptics, Inc. (Semiconductors & Equip.) . . . (a) 8,201 539,380SYNNEX Corp. (Electronic Equip., Instr. &
Comp.) . . . . . . . . . . . . . . . . . . . . . . . . 10,014 1,289,803Tech Data Corp. (Electronic Equip., Instr. &
Comp.) . . . . . . . . . . . . . . . . . . . . . . . . (a) 8,678 1,246,161Teradata Corp. (Software) . . . . . . . . . . . . . . (a) 27,570 738,049Teradyne, Inc. (Semiconductors & Equip.) . . . . 41,070 2,800,563Trimble, Inc. (Electronic Equip., Instr. & Comp.) . (a) 61,058 2,545,508Tyler Technologies, Inc. (Software) . . . . . . . . (a) 9,555 2,866,691Universal Display Corp. (Semiconductors &
Equip.) . . . . . . . . . . . . . . . . . . . . . . . . 10,391 2,141,273ViaSat, Inc. (Communications Equip.) . . . . . . . (a) 14,135 1,034,611Vishay Intertechnology, Inc. (Electronic Equip.,
Instr. & Comp.) . . . . . . . . . . . . . . . . . . . 32,437 690,584WEX, Inc. (IT Svs.). . . . . . . . . . . . . . . . . . . (a) 10,609 2,222,161
69,799,138
MATERIALS – 6.0%Allegheny Technologies, Inc. (Metals &
Mining) . . . . . . . . . . . . . . . . . . . . . . . . (a) 30,898 638,353AptarGroup, Inc. (Containers & Packaging) . . . 15,667 1,811,419Ashland Global Holdings, Inc. (Chemicals). . . . 14,766 1,130,042Cabot Corp. (Chemicals) . . . . . . . . . . . . . . . 13,964 663,569Carpenter Technology Corp. (Metals & Mining). 11,694 582,127Chemours Co. / The (Chemicals) . . . . . . . . . . 40,068 724,830Commercial Metals Co. (Metals & Mining). . . . 29,076 647,523Compass Minerals International, Inc. (Metals
& Mining) . . . . . . . . . . . . . . . . . . . . . . 8,304 506,212Domtar Corp. (Paper & Forest Products) . . . . . 14,037 536,775Eagle Materials, Inc. (Construction Materials) . 10,203 925,004Greif, Inc. Class A (Containers & Packaging) . . 6,406 283,145Ingevity Corp. (Chemicals). . . . . . . . . . . . . . (a) 10,250 895,645Louisiana-Pacific Corp. (Paper & Forest
Products). . . . . . . . . . . . . . . . . . . . . . . 28,786 854,081Minerals Technologies, Inc. (Chemicals) . . . . . 8,532 491,699NewMarket Corp. (Chemicals) . . . . . . . . . . . 1,810 880,601O-I Glass, Inc. (Containers & Packaging). . . . . 38,139 454,998Olin Corp. (Chemicals) . . . . . . . . . . . . . . . . 39,130 674,992PolyOne Corp. (Chemicals) . . . . . . . . . . . . . 18,849 693,455Reliance Steel & Aluminum Co. (Metals &
Mining) . . . . . . . . . . . . . . . . . . . . . . . . 16,336 1,956,399
Common Stocks (Continued) Shares Value
MATERIALS (continued)Royal Gold, Inc. (Metals & Mining) . . . . . . . . 16,075 $ 1,965,169RPM International, Inc. (Chemicals). . . . . . . . 31,781 2,439,510Scotts Miracle-Gro Co. / The (Chemicals) . . . . 9,711 1,031,114Sensient Technologies Corp. (Chemicals) . . . . 10,371 685,419Silgan Holdings, Inc. (Containers & Packaging). 19,027 591,359Sonoco Products Co. (Containers &
Packaging). . . . . . . . . . . . . . . . . . . . . . 24,533 1,514,177Steel Dynamics, Inc. (Metals & Mining) . . . . . 52,799 1,797,278United States Steel Corp. (Metals & Mining) . . 41,767 476,561Valvoline, Inc. (Chemicals) . . . . . . . . . . . . . 46,172 988,543Worthington Industries, Inc. (Metals & Mining). 9,017 380,337
27,220,336
REAL ESTATE – 11.2%Alexander & Baldwin, Inc. (Equity REIT) . . . . . 16,668 349,361American Campus Communities, Inc.
(Equity REIT). . . . . . . . . . . . . . . . . . . . . 33,673 1,583,641Brixmor Property Group, Inc. (Equity REIT). . . . 72,993 1,577,379Camden Property Trust (Equity REIT) . . . . . . . 23,730 2,517,753CoreCivic, Inc. (Equity REIT). . . . . . . . . . . . . 29,186 507,253CoreSite Realty Corp. (Equity REIT) . . . . . . . . 9,236 1,035,540Corporate Office Properties Trust (Equity REIT) . 27,462 806,833Cousins Properties, Inc. (Equity REIT) . . . . . . . 35,966 1,481,799CyrusOne, Inc. (Equity REIT). . . . . . . . . . . . . 27,742 1,815,159Douglas Emmett, Inc. (Equity REIT) . . . . . . . . 40,394 1,773,297EastGroup Properties, Inc. (Equity REIT) . . . . . 9,413 1,248,823EPR Properties (Equity REIT) . . . . . . . . . . . . 19,228 1,358,266First Industrial Realty Trust, Inc. (Equity REIT) . . 31,113 1,291,501GEO Group, Inc. / The (Equity REIT) . . . . . . . . 29,720 493,649Healthcare Realty Trust, Inc. (Equity REIT) . . . . 32,774 1,093,668Highwoods Properties, Inc. (Equity REIT). . . . . 25,424 1,243,488JBG SMITH Properties (Equity REIT) . . . . . . . 28,923 1,153,738Jones Lang LaSalle, Inc. (Real Estate Mgmt. &
Development) . . . . . . . . . . . . . . . . . . . . 12,630 2,198,757Kilroy Realty Corp. (Equity REIT) . . . . . . . . . . 23,902 2,005,378Lamar Advertising Co. Class A (Equity REIT) . . . 21,078 1,881,422Liberty Property Trust (Equity REIT) . . . . . . . . 38,665 2,321,833Life Storage, Inc. (Equity REIT) . . . . . . . . . . . 11,433 1,237,965Macerich Co. / The (Equity REIT) . . . . . . . . . . 27,001 726,867Mack-Cali Realty Corp. (Equity REIT) . . . . . . . 22,192 513,301Medical Properties Trust, Inc. (Equity REIT) . . . 126,809 2,676,938National Retail Properties, Inc. (Equity REIT) . . 42,064 2,255,472Omega Healthcare Investors, Inc.
(Equity REIT). . . . . . . . . . . . . . . . . . . . . 53,549 2,267,800Park Hotels & Resorts, Inc. (Equity REIT) . . . . . 58,663 1,517,612Pebblebrook Hotel Trust (Equity REIT). . . . . . . 32,012 858,242PotlatchDeltic Corp. (Equity REIT) . . . . . . . . . 16,472 712,743PS Business Parks, Inc. (Equity REIT) . . . . . . . 4,909 809,347Rayonier, Inc. (Equity REIT) . . . . . . . . . . . . . 31,689 1,038,132Sabra Health Care REIT, Inc. (Equity REIT) . . . . 47,471 1,013,031Senior Housing Properties Trust (Equity REIT). . (a) 58,300 492,052Service Properties Trust (Equity REIT) . . . . . . 40,329 981,205Spirit Realty Capital, Inc. (Equity REIT) . . . . . . 24,442 1,202,057Tanger Factory Outlet Centers, Inc.
(Equity REIT). . . . . . . . . . . . . . . . . . . . . 22,749 335,093Taubman Centers, Inc. (Equity REIT). . . . . . . . 15,002 466,412Urban Edge Properties (Equity REIT) . . . . . . . 28,221 541,279Weingarten Realty Investors (Equity REIT) . . . . 29,641 925,985
50,310,071
UTILITIES – 4.5%ALLETE, Inc. (Electric Utilities) . . . . . . . . . . . 12,662 1,027,775Aqua America, Inc. (Water Utilities) . . . . . . . . 52,897 2,482,985Black Hills Corp. (Multi-Utilities) . . . . . . . . . . 15,061 1,182,891Hawaiian Electric Industries, Inc.
(Electric Utilities) . . . . . . . . . . . . . . . . . . 26,707 1,251,490IDACORP, Inc. (Electric Utilities) . . . . . . . . . . 12,351 1,319,087MDU Resources Group, Inc. (Multi-Utilities). . . 49,108 1,458,999National Fuel Gas Co. (Gas Utilities) . . . . . . . . 21,155 984,554New Jersey Resources Corp. (Gas Utilities) . . . 23,404 1,043,116
Ohio National Fund, Inc. ON S&P MidCap 400® Index Portfolio (Continued)
Schedule of Investments December 31, 2019
94 (continued)

Common Stocks (Continued) Shares Value
UTILITIES (continued)NorthWestern Corp. (Multi-Utilities). . . . . . . . 12,363 $ 886,056OGE Energy Corp. (Electric Utilities) . . . . . . . . 49,057 2,181,565ONE Gas, Inc. (Gas Utilities). . . . . . . . . . . . . 12,925 1,209,392PNM Resources, Inc. (Electric Utilities) . . . . . 19,521 989,910Southwest Gas Holdings, Inc. (Gas Utilities) . . . 13,387 1,017,010Spire, Inc. (Gas Utilities) . . . . . . . . . . . . . . . 12,493 1,040,792UGI Corp. (Gas Utilities) . . . . . . . . . . . . . . . 51,220 2,313,095
20,388,717Total Common Stocks (Cost $416,640,792) . . . . $447,492,286
U.S. TreasuryObligations – 0.0% Rate Maturity Face Amount Value
U.S. Treasury Bill . . . 0.000% 03/19/2020 $ 100,000 $ 99,683Total U.S. TreasuryObligations(Cost $99,609) . . . . . $ 99,683
Money Market Funds – 0.7% Shares Value
State Street Institutional Liquid Reserves FundInstitutional Class, 1.734% . . . . . . . . . . . . (b) 3,224,279 $ 3,224,601
Total Money Market Funds (Cost $3,224,601) . . . . . . $ 3,224,601Total Investments – 100.0% (Cost $419,965,002) . . . . . . . (c) $450,816,570Other Assets in Excess of Liabilities – 0.0% . . . . . . . (d) 122,688Net Assets – 100.0% $450,939,258
Percentages are stated as a percent of net assets.Footnotes:
(a) Non-income producing security.(b) Rate represents the seven-day yield at December 31, 2019.(c) Represents cost for financial reporting purposes, which may differ from cost basis for federal income tax purposes. See also Note 8 of the Notes to Financial
Statements.(d) Includes $165,600 of cash pledged as collateral for the futures contracts outstanding at December 31, 2019. See also the following Schedule of Open Futures
Contracts.
The accompanying notes are an integral part of these financial statements.
Schedule of Open Futures Contracts December 31, 2019
DescriptionNumber ofcontracts Expiration Date
NotionalAmount Value
UnrealizedAppreciation
(Depreciation)
Variation MarginReceivable(Payable)
CME E-mini S&P MidCap 400 Index - Long 23 March 20, 2020 $4,702,717 $4,749,040 $46,323 $4,196
The accompanying notes are an integral part of these financial statements.
Ohio National Fund, Inc. ON S&P MidCap 400® Index Portfolio (Continued)
Schedule of Investments December 31, 2019
95

Objective/Strategy
The ON BlackRock Advantage Large Cap Growth Portfolio (formerly theON Bristol Growth Portfolio) seeks long-term growth of capital byinvesting, under normal circumstances, at least 80% of its net assets instocks of companies with market capitalizations at the time of investmentthat are within the range of market capitalizations of the companies in theRussell 1000 Growth Index for the previous twelve months.
Performance as of December 31, 2019
Average Annual returnsOne year 38.68%Five years 11.76%Ten years 12.80%
Past performance does not guarantee future results. The performance dataquoted represents past performance and current returns may be lower or higher.Total return figures include change in share price and reinvestment of dividendsand capital gains. The investment return and principal value will fluctuate so thatan investor’s shares, when redeemed, may be worth more or less than the originalcost. To obtain performance information up to the most recent month end, calltoll-free 1-877-781-6392.
The Portfolio is not open to direct retail investment. Beneficial interest in shares isobtained solely by purchase of variable life insurance policies and variable annuitycontracts. Actual performance results for variable annuity and variable universallife contracts will be lower due to contract charges. Consult your contract forapplicable charges.
Total expense ratio is 0.76% per the Fund’s prospectus dated November 22, 2019.Additional information pertaining to the Portfolio’s expense ratio as ofDecember 31, 2019 can be found in the Portfolio’s Financial Highlights.
Comments from Sub-Adviser
Q. How did the Portfolio perform in comparison to its benchmark duringthe reporting period?
A. For the year ended December 31, 2019, the Portfolio returned 38.68%versus 36.39% for its benchmark, the Russell 1000 Growth Index.
Effective February 1, 2019, BlackRock Investment Management, LLC(“BlackRock”) replaced the Portfolio’s previous sub-adviser, SuffolkCapital Management, LLC (“Suffolk”). In conjunction with the change insub-adviser, the name of the Portfolio was changed from ON BristolGrowth Portfolio to ON BlackRock Advantage Large Cap GrowthPortfolio. The Portfolio’s benchmark was unchanged.
For the period from January 1, 2019 to January 31, 2019 (the “firstone-month period”), the Portfolio returned 13.31% versus 8.99% for theRussell 1000 Growth Index.
For the period from February 1, 2019 to December 31, 2019 (the “lattereleven-month period”), the Portfolio returned 22.39% versus 25.14% forthe Russell 1000 Growth Index.
Q. Were there specific market conditions, investment strategies, ortechniques that materially affected the Portfolio’s benchmark-relativeperformance during the reporting period?
A. Suffolk: For the first one-month period, there were no marketconditions, investment strategies, or techniques that materially affectedthe Portfolio’s benchmark relative performance.
A. BlackRock: Performance during the first few months of the lattereleven-month period was relatively flat, as a rebound in the secondquarter brought performance back in line with the benchmark after achallenging first few months. The Portfolio struggled considerably in thesecond half of the year, however, causing performance to lag the
benchmark for the latter eleven-month period. The primary drivers ofunderperformance during the second half of the year were the Portfolio’strend- and sentiment-based insights. Though these investment signalswere additive through the first months of the period, they struggled in thelatter months, amid increased market volatility. A series of inflectionpoints, largely motivated by shifts in global trade conversations andcentral bank policy, created a difficult environment for the Portfolio’strend-based insights. Similarly, these sharp, macro-driven inflectionpoints often resulted in a disconnect between stock returns andcompany-specific sentiment, creating a challenging environment for thePortfolio’s sentiment insights. Cross-market sentiment insights struggledin particular, most specifically those seeking to capture the sentiment ofinformed bond and credit default swap investors.
Insights evaluating company fundamentals detracted in aggregate overthe latter eleven-month period. Insights seeking to identify relative valueopportunities struggled early in the year, as investors sought outspeculative growth opportunities at the expense of companyfundamentals. Investor mentality shifted throughout the year, andperformance of these signals began to improve as investors sought outpockets of relative value in the market. Despite the modest rebound inperformance in the final months of the year, in aggregate, the Portfolio’srelative value insights were some of the most significant detractors fromrelative returns for the latter eleven-month period. Also evaluatingcompany fundamentals, the Portfolio’s quality insights were mixedthroughout the period. Though this group of insights detracted modestlyin aggregate, struggling somewhat in the final months of the year, selectsignals added meaningfully to relative returns and provided ballast toperformance among fundamental signals. Stronger performance amongthe Portfolio’s quality insights was unsurprising, given investorpreference for sustainable, high-quality businesses amidst increasedmarket uncertainty.
Q. How did sector allocation and security selection each impact thePortfolio’s performance relative to its benchmark? For sector allocation,were there any factors that impacted the benchmark’s performancemore significantly than the Portfolio’s performance? For securityselection, was there anything specific regarding the Portfolio’s strategythat caused deviation from the benchmark?
A. Suffolk: For the first one-month period, both sector allocation andstock selection contributed positively to relative performance. Stockselection in Consumer Discretionary and Health Care contributed torelative outperformance, while stock selection in CommunicationServices detracted from relative performance.
A. BlackRock: The portfolio management team targets a relativelysector-neutral approach and seeks to derive the majority of its relativeperformance from security selection. That being said, positioning in theCommunication Services sector was additive to relative returns duringthe latter eleven-month period. On the other hand, a modest underweightto the Information Technology sector throughout much of the perioddampened relative performance, as the sector outperformed the broadermarket. The majority of the Portfolio’s underperformance was driven bysecurity selection decisions. Stock selection was additive in the HealthCare sector, especially among biotechnology and pharmaceuticalcompanies. In contrast, selection within the Financials sector, inparticular the capital markets industry, was a notable detractor fromrelative performance. Stock selection in the Communication Servicessector, especially among media companies, and in the ConsumerDiscretionary sector hindered relative returns as well. (1)
Q. Which holdings contributed the most to, and detracted the most from,the Portfolio’s benchmark-relative performance?
A. Suffolk: Top contributors for the first one-month period included SageTherapeutics, Inc., as it announced positive results for a Phase 3 trial inpostpartum depression. Celgene Corp. contributed, as it was acquired by
Ohio National Fund, Inc. ON BlackRock Advantage Large Cap Growth Portfolio (Unaudited)
96 (continued)

Bristol-Myers Squibb Co. Aerie Pharmaceuticals, Inc., another topcontributor, expects to achieve its revenue target for Rhopressa, its newglaucoma drug, and announced positive pilot study results for Rhopressain Japan, a significant new market opportunity.
The top detractor for the first one-month period was Facebook, Inc.Class A (“Facebook”). The Portfolio was underweight Facebook due toconcerns of weaker growth for ad impressions and pricing. Amazon.com,Inc., underweighted due to concerns of weaker U.S. e-commerce sharegain and belief that increased regulation of e-commerce in India wouldimpact Amazon’s growth, was another detractor. Alphabet, Inc. Class Calso detracted from relative performance, as there were concernsGoogle would lose share in online advertising to Amazon.com, Inc. andmight withdraw its news service in Europe if a “snippet” tax wereimplemented.
A. BlackRock: The top individual contributor for the latter eleven-monthperiod was an underweight position in 3M Co. This underweight positionwas especially beneficial in April, as the share price tumbled. During thistime, company management slashed the company’s profit outlook andannounced that operating income decreased in all five of its majorbusiness units. High raw material prices, weak electronics andautomotive markets, and headwinds from China caused the company tomiss on earnings and forced it to cut 2,000 jobs. Lowering guidance againat the beginning of the fourth quarter, its fifth guidance cut in the pastseven quarters, along with disappointing third quarter operating results,led to a continued decline in the company’s stock price. Remainingunderweight the industrial manufacturer during the decline furthersupported Portfolio performance. Positioning in Biogen, Inc. was alsobeneficial to results. An underweight to the stock early in the year wasadditive, as the share price plummeted on news that the company’sexperimental Alzheimer’s drug, which had been promising, was unlikelyto be effective and that research on the drug was being stopped. Movingto an overweight towards the end of the period further bolstered results,as Biogen’s shares spiked on news that there were new, promisingresults from research on the Alzheimer’s drug. News that the companywas requesting approval from the Federal Drug Administration (“FDA”)on the experimental therapy led to renewed hope among investors, and aresulting surge in the stock price. Lastly, remaining overweight CDWCorp. throughout the latter eleven-month period was tremendouslybeneficial, as the stock returned almost 75%. The technology solutionsprovider was able to rapidly grow the business, setting net sales recordsin each of the first three quarters of the year, while consistentlyexceeding analyst earnings per share (“EPS”) expectations, andincreasing its quarterly cash dividend by over 25%. (1)
In contrast, the top individual detractor for the latter eleven-month periodwas the Portfolio’s overweight position in The Charles Schwab Corp. Thecompany struggled amidst increased pricing pressure that someanalysts believe could act as a headwind and stifle company revenuegrowth going forward. UnitedHealth Group, Inc. was the next largestindividual detractor. An overweight position in the first half of the yeardampened relative returns, as the stock declined roughly 8%. Despitefairly strong first quarter earnings, uncertainties such as Medicare-for-All proposals, could act as a significant headwind to health careproviders and insurers. Analysts felt that the management team did littleto address the potential risks and sooth investor concerns, causing asell-off. Shifting to an underweight position in the second half of the yearfurther hindered results, as the company’s stock price climbed, due tostrong third quarter earnings results and an improvement in forwardearnings guidance, citing a stabilization of medical costs at its healthinsurance unit. The Portfolio’s overweight position in AMC Networks, Inc.Class A during the first and fourth quarters further detracted from relativereturns, as the stock price steadily declined. Significant competition inthe media space, particularly among streaming services, continues topresent challenges for the company, as it seeks to transform itself into apremier content company and grow its subscription video on demand
(“SVOD”) business. The stock price decline accelerated towards the endof the year, as the company reported net revenue well below analystestimates, further detracting from the Portfolio’s relative returns. (1)
Q. How did the Portfolio’s use of derivative instruments and initialpublic offerings (IPOs), if any, impact performance?
A. Suffolk: The Portfolio did not hold any derivatives or participate in anyIPOs during the first one-month period.
A. BlackRock: Pursuant to the Portfolio’s investment strategy, futurescontracts were used in the latter eleven-month period to equitize cashand prevent a cash drag on performance. The futures did notmeaningfully impact performance, however, due to their indexcharacteristics and size in relation to the Portfolio’s net assets. ThePortfolio participated in two IPOs during the latter eleven-month period,which detracted 13 basis points relative to the benchmark. (1)
(1) The Portfolio’s composition is subject to change. Holdings and weightings areas of December 31, 2019.
Change in Value of $10,000 Investment
ON BlackRock Advantage Large Cap Growth Portfolio (A)Russell 1000 Growth Index (B)
0
10,000
20,000
30,000
40,000
$50,000
6/1
012
/10 6
/1112
/11 6
/1212
/12 6
/1312
/13 6
/1412
/14 6
/1512
/15 6
/1612
/16 6
/1712
/17 6
/1812
/18 6
/19
12/3
1/09
12/1
9
$41,234 (B)
$33,360 (A)
Hypothetical illustration based on past performance. Future performance will vary.The Portfolio’s returns reflect reinvested dividends. The Portfolio’s holdings maydiffer significantly from the securities in the index. The index is unmanaged andtherefore does not reflect the cost of portfolio management and accounting.
The Russell 1000 Growth Index is a market-capitalization weighted index of thosefirms in the Russell 1000 Index with higher price-to-book ratios and higherforecasted growth values. The Russell 1000 Index measures the performance ofthe large-cap segment of the U.S. equity universe. The index presented includesthe effects of reinvested dividends.
Past performance is no guarantee of future results. Redemption of fund sharescould have tax implications unique to each shareholder.
Ohio National Fund, Inc. ON BlackRock Advantage Large Cap Growth Portfolio (Unaudited) (Continued)
97 (continued)

Portfolio Composition as of December 31, 2019 (1)
% of Net AssetsCommon Stocks (4) 99.5Rights (4) 0.0Money Market Funds
Less Net Liabilities 0.5100.0
Top 10 Portfolio Holdings as of December 31, 2019 (1) (2) (3)
% of Net Assets1. Apple, Inc. 8.62. Microsoft Corp. 8.43. Amazon.com, Inc. 5.64. Facebook, Inc. Class A 3.45. Mastercard, Inc. Class A 2.86. Alphabet, Inc. Class C 2.67. Alphabet, Inc. Class A 2.48. Merck & Co., Inc. 1.79. Lockheed Martin Corp. 1.7
10. Costco Wholesale Corp. 1.4
(1) Composition of Portfolio subject to change.(2) Short-term investments have been excluded from the list of Top 10 Portfolio Holdings.(3) Top 10 Portfolio Holdings is presented at an individual security level. Total investment exposure by issuer may be higher.(4) Sectors (Common Stocks, Rights):
% of Net AssetsInformation Technology 38.4Health Care 14.7Consumer Discretionary 13.3Communication Services 12.0Industrials 9.6Consumer Staples 4.8Financials 3.6Real Estate 1.8Materials 0.8Utilities 0.4Energy 0.1
99.5
Ohio National Fund, Inc. ON BlackRock Advantage Large Cap Growth Portfolio (Unaudited) (Continued)
98

Common Stocks – 99.5% Shares Value
COMMUNICATION SERVICES – 12.0%Alphabet, Inc. Class A (Interactive Media &
Svs.) . . . . . . . . . . . . . . . . . . . . . . . . . . (a) 2,012 $ 2,694,853Alphabet, Inc. Class C (Interactive Media &
Svs.) . . . . . . . . . . . . . . . . . . . . . . . . . . (a) 2,235 2,988,240AMC Networks, Inc. Class A (Media) . . . . . . . (a) 3,979 157,170Cargurus, Inc. (Interactive Media & Svs.) . . . . (a) 1,267 44,573Cinemark Holdings, Inc. (Entertainment) . . . . . 3,328 112,653Comcast Corp. Class A (Media). . . . . . . . . . . 2,899 130,368Discovery, Inc. Class A (Media) . . . . . . . . . . (a) 4,962 162,456Electronic Arts, Inc. (Entertainment). . . . . . . . (a) 1,735 186,530Facebook, Inc. Class A (Interactive Media &
Svs.) . . . . . . . . . . . . . . . . . . . . . . . . . . (a) 19,004 3,900,571Interpublic Group of Cos., Inc. / The (Media) . . 12,582 290,644Live Nation Entertainment, Inc. (Entertainment). (a) 2,682 191,682Netflix, Inc. (Entertainment) . . . . . . . . . . . . . (a) 1,963 635,168Pinterest, Inc. Class A (Interactive Media &
Svs.) . . . . . . . . . . . . . . . . . . . . . . . . . . (a) 4,237 78,978Sirius XM Holdings, Inc. (Media) . . . . . . . . . . 95,281 681,259Spotify Technology SA (Entertainment) . . . . . . (a) 1,041 155,681Take-Two Interactive Software, Inc.
(Entertainment) . . . . . . . . . . . . . . . . . . . (a) 2,122 259,796Telephone & Data Systems, Inc. (Wireless
Telecom. Svs.). . . . . . . . . . . . . . . . . . . . 3,521 89,539TripAdvisor, Inc. (Interactive Media & Svs.) . . . 3,373 102,472Twitter, Inc. (Interactive Media & Svs.) . . . . . . (a) 6,894 220,953United States Cellular Corp. (Wireless Telecom.
Svs.) . . . . . . . . . . . . . . . . . . . . . . . . . . (a) 5,772 209,119Yelp, Inc. (Interactive Media & Svs.). . . . . . . . (a) 2,408 83,871Zynga, Inc. Class A (Entertainment) . . . . . . . . (a) 43,089 263,705
13,640,281
CONSUMER DISCRETIONARY – 13.3%Alibaba Group Holding Ltd. – ADR (Internet &
Direct Marketing Retail). . . . . . . . . . . . . . (a) 1,907 404,475Amazon.com, Inc. (Internet & Direct Marketing
Retail) . . . . . . . . . . . . . . . . . . . . . . . . . (a) 3,428 6,334,395AutoNation, Inc. (Specialty Retail) . . . . . . . . . (a) 1,127 54,806Booking Holdings, Inc. (Internet & Direct
Marketing Retail) . . . . . . . . . . . . . . . . . . (a) 106 217,695Boyd Gaming Corp. (Hotels, Restaurants &
Leisure) . . . . . . . . . . . . . . . . . . . . . . . . 4,711 141,047Chipotle Mexican Grill, Inc. (Hotels,
Restaurants & Leisure) . . . . . . . . . . . . . . (a) 277 231,879Choice Hotels International, Inc. (Hotels,
Restaurants & Leisure) . . . . . . . . . . . . . . 6,788 702,083D.R. Horton, Inc. (Household Durables) . . . . . . 3,619 190,902Darden Restaurants, Inc. (Hotels, Restaurants
& Leisure) . . . . . . . . . . . . . . . . . . . . . . 4,661 508,096Dollar General Corp. (Multiline Retail). . . . . . . 3,363 524,561Dunkin’ Brands Group, Inc. (Hotels,
Restaurants & Leisure) . . . . . . . . . . . . . . 2,630 198,670Extended Stay America, Inc. (Hotels,
Restaurants & Leisure) . . . . . . . . . . . . . . 4,138 61,491Gentex Corp. (Auto Components). . . . . . . . . . 2,194 63,582H&R Block, Inc. (Diversified Consumer Svs.) . . 8,519 200,026Home Depot, Inc. / The (Specialty Retail). . . . . 6,008 1,312,027Lowe’s Cos., Inc. (Specialty Retail) . . . . . . . . 2,471 295,927Lululemon Athletica, Inc. (Textiles, Apparel &
Luxury Goods) . . . . . . . . . . . . . . . . . . . . (a) 919 212,905McDonald’s Corp. (Hotels, Restaurants &
Leisure) . . . . . . . . . . . . . . . . . . . . . . . . 733 144,848NIKE, Inc. Class B (Textiles, Apparel & Luxury
Goods) . . . . . . . . . . . . . . . . . . . . . . . . 13,222 1,339,521O’Reilly Automotive, Inc. (Specialty Retail) . . . . (a) 516 226,142Penn National Gaming, Inc. (Hotels,
Restaurants & Leisure) . . . . . . . . . . . . . . (a) 6,717 171,687Pool Corp. (Distributors) . . . . . . . . . . . . . . . 671 142,507Ralph Lauren Corp. (Textiles, Apparel & Luxury
Goods) . . . . . . . . . . . . . . . . . . . . . . . . 726 85,102
Common Stocks (Continued) Shares Value
CONSUMER DISCRETIONARY (continued)Ross Stores, Inc. (Specialty Retail) . . . . . . . . 2,127 $ 247,625Starbucks Corp. (Hotels, Restaurants &
Leisure) . . . . . . . . . . . . . . . . . . . . . . . . 4,554 400,388Tesla, Inc. (Automobiles) . . . . . . . . . . . . . . . (a) 798 333,827Texas Roadhouse, Inc. (Hotels, Restaurants &
Leisure) . . . . . . . . . . . . . . . . . . . . . . . . 3,735 210,355Tractor Supply Co. (Specialty Retail). . . . . . . . 222 20,744Wyndham Destinations, Inc. (Hotels,
Restaurants & Leisure) . . . . . . . . . . . . . . 1,230 63,57915,040,892
CONSUMER STAPLES – 4.8%Altria Group, Inc. (Tobacco) . . . . . . . . . . . . . 2,707 135,106Church & Dwight Co., Inc.
(Household Products) . . . . . . . . . . . . . . . 3,248 228,464Coca-Cola Co. / The (Beverages). . . . . . . . . . 4,646 257,156Coca-Cola European Partners PLC
(Beverages) . . . . . . . . . . . . . . . . . . . . . 2,646 134,629Costco Wholesale Corp. (Food & Staples
Retailing) . . . . . . . . . . . . . . . . . . . . . . . 5,352 1,573,060Estee Lauder Cos., Inc. / The Class A
(Personal Products) . . . . . . . . . . . . . . . . 4,392 907,124Hershey Co. / The (Food Products). . . . . . . . . 5,883 864,683Molson Coors Brewing Co. Class B
(Beverages) . . . . . . . . . . . . . . . . . . . . . 702 37,838Monster Beverage Corp. (Beverages) . . . . . . (a) 4,573 290,614PepsiCo, Inc. (Beverages) . . . . . . . . . . . . . . 6,343 866,898Performance Food Group Co. (Food & Staples
Retailing) . . . . . . . . . . . . . . . . . . . . . . . (a) 1,729 89,0095,384,581
ENERGY – 0.1%Marathon Petroleum Corp. (Oil, Gas &
Consumable Fuels) . . . . . . . . . . . . . . . . . 1,898 114,354
FINANCIALS – 3.6%Affiliated Managers Group, Inc.
(Capital Markets) . . . . . . . . . . . . . . . . . . 848 71,859Allstate Corp. / The (Insurance) . . . . . . . . . . 1,808 203,309Ally Financial, Inc. (Consumer Finance). . . . . . 3,896 119,062American Express Co. (Consumer Finance) . . . 1,449 180,386Aon PLC (Insurance) . . . . . . . . . . . . . . . . . 351 73,110Brown & Brown, Inc. (Insurance) . . . . . . . . . 2,312 91,278Charles Schwab Corp. / The (Capital Markets) . 6,375 303,195Cincinnati Financial Corp. (Insurance) . . . . . . 1,425 149,839Evercore, Inc. Class A (Capital Markets) . . . . . 764 57,117FactSet Research Systems, Inc.
(Capital Markets) . . . . . . . . . . . . . . . . . . 1,698 455,573First American Financial Corp. (Insurance) . . . 4,015 234,155Intercontinental Exchange, Inc.
(Capital Markets) . . . . . . . . . . . . . . . . . . 5,085 470,617Marsh & McLennan Cos., Inc. (Insurance). . . . 1,180 131,464Moody’s Corp. (Capital Markets) . . . . . . . . . . 1,498 355,640S&P Global, Inc. (Capital Markets). . . . . . . . . 3,719 1,015,473SEI Investments Co. (Capital Markets) . . . . . . 440 28,811TD Ameritrade Holding Corp. (Capital Markets) . 2,648 131,606
4,072,494
HEALTH CARE – 14.7%AbbVie, Inc. (Biotechnology) . . . . . . . . . . . . 13,149 1,164,212Alexion Pharmaceuticals, Inc. (Biotechnology) . (a) 1,510 163,306AmerisourceBergen Corp. (Health Care
Providers & Svs.) . . . . . . . . . . . . . . . . . . 2,092 177,862Amgen, Inc. (Biotechnology) . . . . . . . . . . . . 3,503 844,468Anthem, Inc. (Health Care Providers & Svs.). . . 2,954 892,197Biogen, Inc. (Biotechnology) . . . . . . . . . . . . (a) 490 145,398Bristol-Myers Squibb Co. (Pharmaceuticals) . . 13,806 886,207CVS Health Corp. (Health Care Providers &
Svs.) . . . . . . . . . . . . . . . . . . . . . . . . . . 1,026 76,222DexCom, Inc. (Health Care Equip. & Supplies). . (a) 1,387 303,392
Ohio National Fund, Inc. ON BlackRock Advantage Large Cap Growth Portfolio
Schedule of Investments December 31, 2019
99 (continued)

Common Stocks (Continued) Shares Value
HEALTH CARE (continued)Edwards Lifesciences Corp. (Health Care
Equip. & Supplies) . . . . . . . . . . . . . . . . . (a) 3,177 $ 741,162Exelixis, Inc. (Biotechnology) . . . . . . . . . . . . (a) 999 17,602Gilead Sciences, Inc. (Biotechnology) . . . . . . 19,815 1,287,579Hologic, Inc. (Health Care Equip. & Supplies) . . (a) 5,301 276,765Humana, Inc. (Health Care Providers & Svs.) . . 427 156,504IDEXX Laboratories, Inc. (Health Care Equip. &
Supplies) . . . . . . . . . . . . . . . . . . . . . . . (a) 2,076 542,106Incyte Corp. (Biotechnology) . . . . . . . . . . . . (a) 3,464 302,476Insulet Corp. (Health Care Equip. & Supplies) . . (a) 208 35,610Ionis Pharmaceuticals, Inc. (Biotechnology) . . (a) 2,160 130,486Johnson & Johnson (Pharmaceuticals). . . . . . 5,387 785,802Masimo Corp. (Health Care Equip. & Supplies) . (a) 128 20,232McKesson Corp. (Health Care Providers &
Svs.) . . . . . . . . . . . . . . . . . . . . . . . . . . 164 22,684Merck & Co., Inc. (Pharmaceuticals) . . . . . . . 20,767 1,888,759Mylan N.V. (Pharmaceuticals) . . . . . . . . . . . (a) 2,876 57,808Regeneron Pharmaceuticals, Inc.
(Biotechnology) . . . . . . . . . . . . . . . . . . . (a) 810 304,139Seattle Genetics, Inc. (Biotechnology) . . . . . . (a) 143 16,339Stryker Corp. (Health Care Equip. & Supplies) . . 7,402 1,553,976Thermo Fisher Scientific, Inc. (Life Sciences
Tools & Svs.). . . . . . . . . . . . . . . . . . . . . 769 249,825United Therapeutics Corp. (Biotechnology) . . . (a) 1,347 118,644UnitedHealth Group, Inc. (Health Care
Providers & Svs.) . . . . . . . . . . . . . . . . . . 4,879 1,434,328Veeva Systems, Inc. Class A (Health Care
Technology) . . . . . . . . . . . . . . . . . . . . . (a) 2,183 307,061Vertex Pharmaceuticals, Inc. (Biotechnology) . (a) 4,459 976,298WellCare Health Plans, Inc. (Health Care
Providers & Svs.) . . . . . . . . . . . . . . . . . . (a) 338 111,611Zoetis, Inc. (Pharmaceuticals) . . . . . . . . . . . 5,277 698,411
16,689,471
INDUSTRIALS – 9.6%AGCO Corp. (Machinery) . . . . . . . . . . . . . . . 863 66,667Allegion PLC (Building Products) . . . . . . . . . . 8,067 1,004,664Boeing Co. / The (Aerospace & Defense). . . . . 1,492 486,034Carlisle Cos., Inc. (Industrial Conglomerates) . . 237 38,356Cintas Corp. (Commercial Svs. & Supplies) . . . 246 66,194Copart, Inc. (Commercial Svs. & Supplies) . . . . (a) 1,886 171,513CoStar Group, Inc. (Professional Svs.) . . . . . . (a) 63 37,693Curtiss-Wright Corp. (Aerospace & Defense) . . 228 32,123Delta Air Lines, Inc. (Airlines) . . . . . . . . . . . . 653 38,187EMCOR Group, Inc. (Construction &
Engineering) . . . . . . . . . . . . . . . . . . . . . 448 38,662Expeditors International of Washington, Inc.
(Air Freight & Logistics) . . . . . . . . . . . . . . 2,161 168,601Fluor Corp. (Construction & Engineering). . . . . 1,015 19,163GATX Corp. (Trading Companies &
Distributors) . . . . . . . . . . . . . . . . . . . . . 4,138 342,833HEICO Corp. (Aerospace & Defense) . . . . . . . 1,272 145,199HEICO Corp. Class A (Aerospace & Defense) . . 753 67,416Hexcel Corp. (Aerospace & Defense) . . . . . . . 1,285 94,203Honeywell International, Inc.
(Industrial Conglomerates) . . . . . . . . . . . . 1,518 268,686Hubbell, Inc. (Electrical Equip.) . . . . . . . . . . . 2,753 406,949IDEX Corp. (Machinery) . . . . . . . . . . . . . . . 1,863 320,436Ingersoll-Rand PLC (Machinery) . . . . . . . . . . 523 69,517Landstar System, Inc. (Road & Rail) . . . . . . . . 4,011 456,733Lockheed Martin Corp. (Aerospace &
Defense) . . . . . . . . . . . . . . . . . . . . . . . 4,840 1,884,599MasTec, Inc. (Construction & Engineering) . . . (a) 3,464 222,250Northrop Grumman Corp. (Aerospace &
Defense) . . . . . . . . . . . . . . . . . . . . . . . 1,144 393,502Old Dominion Freight Line, Inc. (Road & Rail) . . 698 132,467Oshkosh Corp. (Machinery) . . . . . . . . . . . . . 4,355 412,201PACCAR, Inc. (Machinery) . . . . . . . . . . . . . . 15,078 1,192,670Raytheon Co. (Aerospace & Defense). . . . . . . 1,292 283,904
Common Stocks (Continued) Shares Value
INDUSTRIALS (continued)Robert Half International, Inc.
(Professional Svs.) . . . . . . . . . . . . . . . . . 5,163 $ 326,044Roper Technologies, Inc.
(Industrial Conglomerates) . . . . . . . . . . . . 818 289,760Snap-on, Inc. (Machinery) . . . . . . . . . . . . . . 816 138,230Teledyne Technologies, Inc. (Aerospace &
Defense) . . . . . . . . . . . . . . . . . . . . . . . (a) 1,830 634,168United Airlines Holdings, Inc. (Airlines) . . . . . . (a) 2,402 211,592United Parcel Service, Inc. Class B (Air Freight
& Logistics) . . . . . . . . . . . . . . . . . . . . . 2,355 275,676Watsco, Inc. (Trading Companies &
Distributors) . . . . . . . . . . . . . . . . . . . . . 80 14,412Xylem, Inc. (Machinery) . . . . . . . . . . . . . . . 784 61,771
10,813,075
INFORMATION TECHNOLOGY – 38.4%Accenture PLC Class A (IT Svs.) . . . . . . . . . . 2,432 512,106Adobe, Inc. (Software) . . . . . . . . . . . . . . . . (a) 4,059 1,338,699Advanced Micro Devices, Inc.
(Semiconductors & Equip.) . . . . . . . . . . . . (a) 2,544 116,668Apple, Inc. (Tech. Hardware, Storage &
Periph.) . . . . . . . . . . . . . . . . . . . . . . . . 33,230 9,757,990Applied Materials, Inc. (Semiconductors &
Equip.) . . . . . . . . . . . . . . . . . . . . . . . . 7,968 486,367Automatic Data Processing, Inc. (IT Svs.) . . . . 8,205 1,398,953Avnet, Inc. (Electronic Equip., Instr. & Comp.) . . 1,359 57,676Booz Allen Hamilton Holding Corp. (IT Svs.) . . . 477 33,929Broadcom, Inc. (Semiconductors & Equip.) . . . 633 200,041Broadridge Financial Solutions, Inc. (IT Svs.) . . 3,099 382,850CACI International, Inc. Class A (IT Svs.) . . . . . (a) 116 28,999Cadence Design Systems, Inc. (Software) . . . . (a) 2,793 193,722CDW Corp. (Electronic Equip., Instr. & Comp.) . . 6,558 936,745Ciena Corp. (Communications Equip.) . . . . . . . (a) 1,846 78,806Cirrus Logic, Inc. (Semiconductors & Equip.) . . (a) 3,972 327,333Cisco Systems, Inc. (Communications Equip.) . . 23,715 1,137,371Dropbox, Inc. Class A (Software). . . . . . . . . . (a) 3,496 62,613DXC Technology Co. (IT Svs.) . . . . . . . . . . . . 1,772 66,609EPAM Systems, Inc. (IT Svs.) . . . . . . . . . . . . (a) 66 14,003Fiserv, Inc. (IT Svs.) . . . . . . . . . . . . . . . . . . (a) 1,161 134,246Fortinet, Inc. (Software) . . . . . . . . . . . . . . . (a) 728 77,721GoDaddy, Inc. Class A (IT Svs.) . . . . . . . . . . . (a) 4,185 284,245HP, Inc. (Tech. Hardware, Storage & Periph.) . . 569 11,693Intel Corp. (Semiconductors & Equip.) . . . . . . 3,876 231,979Intuit, Inc. (Software) . . . . . . . . . . . . . . . . . 5,110 1,338,462Jack Henry & Associates, Inc. (IT Svs.). . . . . . 3,369 490,762Lam Research Corp. (Semiconductors &
Equip.) . . . . . . . . . . . . . . . . . . . . . . . . 2,996 876,030Manhattan Associates, Inc. (Software) . . . . . . (a) 3,231 257,672Mastercard, Inc. Class A (IT Svs.) . . . . . . . . . 10,794 3,222,980Micron Technology, Inc. (Semiconductors &
Equip.) . . . . . . . . . . . . . . . . . . . . . . . . (a) 719 38,668Microsoft Corp. (Software) . . . . . . . . . . . . . 60,145 9,484,867National Instruments Corp. (Electronic Equip.,
Instr. & Comp.) . . . . . . . . . . . . . . . . . . . 2,463 104,283NVIDIA Corp. (Semiconductors & Equip.) . . . . 4,972 1,169,912Paychex, Inc. (IT Svs.) . . . . . . . . . . . . . . . . 16,509 1,404,256Paycom Software, Inc. (Software) . . . . . . . . . (a) 203 53,746Paylocity Holding Corp. (Software) . . . . . . . . (a) 3,683 444,980PayPal Holdings, Inc. (IT Svs.) . . . . . . . . . . . (a) 7,259 785,206QUALCOMM, Inc. (Semiconductors & Equip.) . . 5,713 504,058RingCentral, Inc. Class A (Software). . . . . . . . (a) 632 106,599salesforce.com, Inc. (Software) . . . . . . . . . . (a) 8,246 1,341,129ServiceNow, Inc. (Software) . . . . . . . . . . . . (a) 3,714 1,048,537Skyworks Solutions, Inc. (Semiconductors &
Equip.) . . . . . . . . . . . . . . . . . . . . . . . . 391 47,264Square, Inc. Class A (IT Svs.) . . . . . . . . . . . . (a) 1,632 102,098Texas Instruments, Inc. (Semiconductors &
Equip.) . . . . . . . . . . . . . . . . . . . . . . . . 6,227 798,862VeriSign, Inc. (IT Svs.) . . . . . . . . . . . . . . . . (a) 794 152,988
Ohio National Fund, Inc. ON BlackRock Advantage Large Cap Growth Portfolio (Continued)
Schedule of Investments December 31, 2019
100 (continued)

Common Stocks (Continued) Shares Value
INFORMATION TECHNOLOGY (continued)Visa, Inc. (IT Svs.) . . . . . . . . . . . . . . . . . . . 6,961 $ 1,307,972Workday, Inc. Class A (Software) . . . . . . . . . (a) 3,013 495,488
43,448,183
MATERIALS – 0.8%Alcoa Corp. (Metals & Mining) . . . . . . . . . . . (a) 4,345 93,461Domtar Corp. (Paper & Forest Products) . . . . . 3,527 134,872Ecolab, Inc. (Chemicals) . . . . . . . . . . . . . . . 249 48,055Mosaic Co. / The (Chemicals) . . . . . . . . . . . . 3,202 69,291Reliance Steel & Aluminum Co. (Metals &
Mining) . . . . . . . . . . . . . . . . . . . . . . . . 131 15,689Scotts Miracle-Gro Co. / The (Chemicals) . . . . 276 29,306Sherwin-Williams Co. / The (Chemicals) . . . . . 934 545,026
935,700
REAL ESTATE – 1.8%Equity Residential (Equity REIT). . . . . . . . . . . 522 42,240Invitation Homes, Inc. (Equity REIT) . . . . . . . . 5,845 175,175Lamar Advertising Co. Class A (Equity REIT) . . . 5,037 449,603National Retail Properties, Inc. (Equity REIT) . . 3,575 191,691Park Hotels & Resorts, Inc. (Equity REIT) . . . . . 11,921 308,396RLJ Lodging Trust (Equity REIT). . . . . . . . . . . 5,000 88,600SBA Communications Corp. (Equity REIT) . . . . 145 34,944Simon Property Group, Inc. (Equity REIT) . . . . . 3,840 572,006STAG Industrial, Inc. (Equity REIT) . . . . . . . . . 5,036 158,987
2,021,642
Common Stocks (Continued) Shares Value
UTILITIES – 0.4%Ameren Corp. (Multi-Utilities) . . . . . . . . . . . . 1,768 $ 135,782DTE Energy Co. (Multi-Utilities) . . . . . . . . . . . 1,269 164,805Pinnacle West Capital Corp. (Electric Utilities) . 136 12,231Xcel Energy, Inc. (Electric Utilities) . . . . . . . . 3,088 196,057
508,875Total Common Stocks (Cost $97,290,093) . . . . . $112,669,548
Rights – 0.0% Quantity Value
HEALTH CARE – 0.0%Bristol-Myers Squibb Co. (Pharmaceuticals) . . (a) 5,350 $ 16,103Total Rights (Cost $11,396) . . . . . . . . . . . . . . $ 16,103
Money Market Funds – 1.0% Shares Value
State Street Institutional Liquid Reserves FundInstitutional Class, 1.734% . . . . . . . . . . . . . (b) 1,063,596 $ 1,063,702
Total Money Market Funds (Cost $1,063,702) . . . . . . $ 1,063,702Total Investments – 100.5% (Cost $98,365,191) . . . . . . . . (c) $113,749,353Liabilities in Excess of Other Assets – (0.5)% . . . . . . . (d) (557,194)Net Assets – 100.0% $113,192,159
Percentages are stated as a percent of net assets.Abbreviations:
ADR: American Depositary ReceiptsFootnotes:
(a) Non-income producing security.(b) Rate represents the seven-day yield at December 31, 2019.(c) Represents cost for financial reporting purposes, which may differ from cost basis for federal income tax purposes. See also Note 8 of the Notes to Financial
Statements.(d) Includes $44,100 of cash pledged as collateral for the futures contracts outstanding at December 31, 2019. See also the following Schedule of Open Futures
Contracts.
The accompanying notes are an integral part of these financial statements.
Schedule of Open Futures Contracts December 31, 2019
DescriptionNumber ofcontracts Expiration Date
NotionalAmount Value
UnrealizedAppreciation
(Depreciation)
Variation MarginReceivable(Payable)
CME E-mini S&P 500 Index - Long 7 March 20, 2020 $1,112,851 $1,130,885 $18,034 $333
The accompanying notes are an integral part of these financial statements.
Ohio National Fund, Inc. ON BlackRock Advantage Large Cap Growth Portfolio (Continued)
Schedule of Investments December 31, 2019
101

Objective/Strategy
The ON Risk Managed Balanced Portfolio seeks long-term capitalgrowth, consistent with preservation of capital and balanced by currentincome. The Portfolio invests in a balanced portfolio of equity andfixed-income securities (the “Balanced Component”) and a riskmanagement portfolio intended to enhance the risk adjusted return of thePortfolio (the “Risk Management Component”).
Performance as of December 31, 2019
Average Annual returnsOne year 25.16%Five years 8.39%Since inception (5/1/14) 8.88%
Past performance does not guarantee future results. The performance dataquoted represents past performance and current returns may be lower or higher.Total return figures include change in share price and reinvestment of dividendsand capital gains. The investment return and principal value will fluctuate so thatan investor’s shares, when redeemed, may be worth more or less than the originalcost. To obtain performance information up to the most recent month end, calltoll-free 1-877-781-6392.
The Portfolio is not open to direct retail investment. Beneficial interest in shares isobtained solely by purchase of variable life insurance policies and variable annuitycontracts. Actual performance results for variable annuity and variable universallife contracts will be lower due to contract charges. Consult your contract forapplicable charges.
Total expense ratio is 1.01% per the Fund’s prospectus dated November 22, 2019.Additional information pertaining to the Portfolio’s expense ratio as ofDecember 31, 2019 can be found in the Portfolio’s Financial Highlights.
Comments from Sub-Advisers
Q. How did the Portfolio perform in comparison to its benchmark duringthe reporting period?
A. For the year ended December 31, 2019, the Portfolio returned 25.16%versus 31.49% for its benchmark, the S&P 500 Index. The Portfolio’scurrent secondary benchmark, which is comprised of 55% S&P 500Index/ 45% ICE BofAML U.S. Broad Market Index returned 21.12% for theyear, while its former secondary benchmark, which is comprised of 55%S&P 500 Index and 45% Bloomberg Barclays U.S. Aggregate Bond Index,returned 21.03% for the year.
Effective December 7, 2019, the Portfolio changed its secondarybenchmark from 55% S&P 500 Index/ 45% Bloomberg BarclaysU.S. Aggregate Bond Index to 55% S&P 500 Index/ 45% ICE BofAMLU.S. Broad Market Index in an effort to minimize index licensing costswhile maintaining a secondary benchmark that closely reflects the styleof the Portfolio’s investment strategy.
Q. Were there specific market conditions, investment strategies, ortechniques that materially affected the Portfolio’s benchmark-relativeperformance during the reporting period?
A. The Portfolio posted strong gains, but underperformed the S&P 500Index during the year, due to its allocation to bonds in a period whenequities posted robust gains. The Portfolio ended December withapproximately 38% allocated to fixed income, 62% allocated to equitiesand a small portion in cash. The asset allocations may vary based onmarket conditions, and positioning reflected the portfolio managers’belief that equities offered greater risk-adjusted opportunities versusfixed income throughout the year. (1)
The equity sleeve of the Balanced Component outperformed the S&P 500Index, aided by strong sector allocation decisions. An overweight andsecurity selection in Information Technology were particularlybeneficial, as technology led the S&P 500 Index higher. (1)
The fixed income sleeve of the Balanced Component outperformed theICE BofAML U.S. Broad Market Index but underperformed the S&P 500Index. Following the Federal Reserve’s (“Fed”) pivot early in 2019, theportfolio managers maintained a constructive outlook on credit markets,believing they would be supported by the more accommodative Fed, ahealthy consumer and favorable financial conditions, as well asinvestors’ continued search for yield. Exposure to floating-ratesecurities, including bank loans, was reduced given the Fed’s adjustedstance. The Treasury allocation was also reduced over the year, as wasoverall Portfolio duration. As corporate bonds fared well during the year,the Portfolio’s allocation to both investment-grade and high-yieldcorporate bonds generated strong positive returns. Given robustyear-to-date returns and less attractive valuations, the Portfoliomanagers opted to take profits in high yield near period end, reducingexposure to both metals and mining and energy. As the year progressed,the investment team increased its focus on higher-quality issuers withstable free-cash-flow-generative business models. An allocation to thebanking sector was increased as aggregate earnings reports confirmedthat a stabilizing economy and a steepening yield curve were improvingthe sector’s health.
Q. How did sector allocation and security selection each impact thePortfolio’s performance relative to its benchmark? For sector allocation,were there any factors that impacted the benchmark’s performancemore significantly than the Portfolio’s performance? For securityselection, was there anything specific regarding the Portfolio’s strategythat caused deviation from the benchmark?
A. In the equity sleeve, sector allocation decisions contributed to itsoutperformance relative to the S&P 500 Index. An overweight to thestrongest-performing sector, Information Technology, proved beneficial.The Portfolio’s underweight to the weakest-performing sector, Energy,also aided relative returns. Overall, stock selection had minimal impacton relative results. While holdings in Information Technologyoutperformed the broad sector, the impact was offset by weak securityselection in Industrials. (1)
In the fixed income sleeve, a focus on companies that prioritize soundfundamentals and deleveraging their balance sheets proved beneficial,as many of our larger positions benefited from spread tightening. (1)
Q. How did the Risk Management Component impact the Portfolio’sperformance during the period?
A. The Portfolio’s Risk Management Component, sub-advised byAnchorPath Financial LLC, is a sleeve of derivatives and cash equivalentsthat seeks to enhance the risk-adjusted return of the Portfolio. Undernormal circumstances, the Risk Management Component will representapproximately 20% of the Portfolio. For the calendar year 2019, thisallocation ranged between 18.4% and 23.2%, and ended the yearrepresenting approximately 22.4% of the Portfolio. (1)
The Portfolio’s performance is enhanced on a risk-adjusted basis whenthe aggregate Portfolio achieves lower volatility with similar returns, orhigher returns at similar volatility compared to a benchmark. For thecalendar year 2019, the Risk Management Component enhanced therisk-adjusted return, as the Portfolio’s return was 2.9% higher than theBalanced Component and the Portfolio’s annualized volatility wasapproximately 0.4% lower than the Balanced Component. The net gain inthe Risk Management Component was attributable to gains from the longTreasury futures positions and long equity index futures held over theperiod, which more than offset a loss from index-based options due to thetime decay of premium value. (1)
Ohio National Fund, Inc. ON Risk Managed Balanced Portfolio (Unaudited)
102 (continued)

Q. Which holdings contributed the most to, and detracted the most from,the Portfolio’s benchmark-relative performance?
A. Multinational financial services corporation Mastercard, Inc. Class Awas the strongest individual contributor to relative performance. Thecompany is growing faster than its competition and benefiting from smartacquisitions and its fixed-cost business model, which is resulting in highincremental margins. Payments companies continue to benefit as creditcards and electronic payments grow in popularity among consumers andbusinesses globally. Information Technology company Microsoft Corp.was the second-strongest positive contributor to relative performance.The company’s Azure cloud platform and subscription-based Office 365suite continue to grow, and the demand outlook for these productsremains robust. (1)
JPMorgan Chase & Co. and Facebook, Inc. Class A, stocks thatperformed well in the benchmark but not held in the Portfolio, were thelargest relative detractors. Online retailer Amazon.com, Inc. was thelargest benchmark-owned detractor on a relative basis. We wereunderweight and the stock rose early in the period. The companyreported a modest deceleration in its Amazon Web Services (“AWS”)revenue, which we would expect as the cloud business grows everlarger in size. It also increased spending on its one-day delivery service.We remain positive on the company, as its one-day shipping should beaccretive to Amazon’s long-term growth story, and AWS revenue stillgrew more than the rest of its competition combined – a testament to itsdominant industry position. Information Technology company Apple, Inc.was the second-largest owned detractor from relative performance. Thestock generated very strong performance during the year, and thePortfolio’s underweight position detracted from relative results. (1)
Q. How did the Portfolio’s use of derivative instruments and initialpublic offerings (IPOs), if any, impact overall Portfolio performance?
A. The Risk Management Component contributed 6.8% to the absolutereturn of the aggregate Portfolio during the year, primarily due to the useof derivative instruments. This was driven mainly by gains on bothtreasury and equity futures, slightly offset by the time decay of premiumvalue of the Portfolio’s options. IPOs did not have a significant impact onperformance.(1)
Q. Were there any significant changes to the Portfolio’s managementteam, investment strategy, or selection process during the reportingperiod?
A. Janus: There were no changes to the investment strategy or selectionprocess during the period, nor were their changes to the equity sleeve’sportfolio management team. Within the fixed income sleeve,long-standing portfolio manager Darrell Watters retired from the firm atthe end of 2019. Michael Keough, named portfolio manager alongsideDarrell on Janus Henderson’s Core Plus portfolios, joined the Portfolio’smanagement team. Effective February 1, 2020, Mayur Saigal will bedeparting the firm for personal reasons, and industry veteran GregWilensky, CFA, will join Janus Henderson as Head of U.S. Fixed Incomeand portfolio manager on the ON Risk Managed Balanced Portfolio.
(1) The Portfolio’s composition is subject to change. Holdings and weightings areas of December 31, 2019.
Change in Value of $10,000 Investment
ON Risk Managed Balanced Portfolio (A)S&P 500 Index (B)55% S&P 500 Index/ 45% ICE BofAML U.S. Broad Market Index (C)55% S&P 500 Index/ 45% Bloomberg Barclays U.S. Aggregate Bond Index (D)
8,000
10,000
12,000
14,000
16,000
18,000
$20,000
6/1
412
/14
6/1
512
/15
6/1
612
/16
6/1
712
/17
6/1
812
/18
6/1
9
5
/1/1
412
/19
$19,274 (B)
$16,200 (A)$15,751 (C)$15,717 (D)
Hypothetical illustration based on past performance. Future performance will vary.The Portfolio’s returns reflect reinvested dividends. The Portfolio’s holdings maydiffer significantly from the securities in the index. The index is unmanaged andtherefore does not reflect the cost of portfolio management and accounting.
Effective December 7, 2019, the secondary benchmark for the Portfolio waschanged from 55% S&P 500 Index/ 45% Bloomberg Barclays U.S. Aggregate BondIndex to 55% S&P 500 Index/ 45% ICE BofAML U.S. Broad Market Index. Thechange in benchmark was made to to minimize index licensing costs whilemaintaining a secondary benchmark that closely reflects the style of the Portfolio’sinvestment strategy.
The S&P 500 Index is a capitalization-weighted index designed to measureperformance of the broad domestic economy through changes in the aggregatemarket value of 500 stocks representing all major industries. The index includes theeffects of reinvested dividends.
The ICE BofAML U.S. Broad Market Index measures the performance of U.S.dollar-denominated, investment grade debt securities, including U.S. Treasurynotes and bonds, quasi-government securities, corporate securities, residentialand commercial mortgage-backed securities and asset-backed securities.Securities are cap-weighted based on their amount outstanding times the marketprice plus accrued interest.
The Bloomberg Barclays U.S. Aggregate Bond Index measures returns of U.S.investment grade bonds market, which includes investment gradeU.S. Government bonds, high quality corporate bonds, mortgage pass-throughsecurities, and asset-backed securities publicly offered for sale in the U.S. Theindex’s securities must have at least one year remaining to maturity; they must alsobe denominated in U.S. dollars and must be fixed rate, nonconvertible, and taxable.
Past performance is no guarantee of future results. Redemption of fund sharescould have tax implications unique to each shareholder.
Ohio National Fund, Inc. ON Risk Managed Balanced Portfolio (Unaudited) (Continued)
103 (continued)

Portfolio Composition as of December 31, 2019 (1)
% of Net AssetsCommon Stocks (4) 47.9Corporate Bonds (4) 11.6U.S. Government Agency Mortgage-Backed
Securities 8.8U.S. Treasury Obligations 7.3Purchased Options 7.1Asset-Backed / Mortgage-Backed
Securities (4) 2.3Preferred Securities (4) 0.2Money Market Funds
Less Net Liabilities 14.8100.0
Top 10 Portfolio Holdings as of December 31, 2019 (1) (2) (3)
% of Net Assets1. Microsoft Corp. 3.32. Mastercard, Inc. Class A 2.33. Apple, Inc. 1.94. Alphabet, Inc. Class C 1.85. UnitedHealth Group, Inc. 1.56. S&P 500 Index Call Option 1.47. U.S. Treasury Note
1.750%, 07/31/20241.4
8. McDonald’s Corp. 1.49. Boeing Co. / The 1.4
10. Home Depot, Inc. / The 1.3
(1) Composition of Portfolio subject to change.(2) Short-term investments have been excluded from the list of Top 10 Portfolio Holdings.(3) Top 10 Portfolio Holdings is presented at an individual security level. Total investment exposure by issuer may be higher.(4) Sectors (Common Stocks, Corporate Bonds, Preferred Securities, Asset-Backed / Mortgage Backed Securities):
% of Net AssetsInformation Technology 14.7Financials 9.5Consumer Discretionary 7.8Health Care 7.7Industrials 6.1Consumer Staples 5.6Communication Services 5.1Real Estate 2.0Energy 1.7Materials 1.4Utilities 0.4
62.0
Ohio National Fund, Inc. ON Risk Managed Balanced Portfolio (Unaudited) (Continued)
104

Common Stocks – 47.9% Shares Value
COMMUNICATION SERVICES – 3.6%Alphabet, Inc. Class C (Interactive Media & Svs.) . . . . . . . . . . . . . . . . . . . . . . . . . . . . . . . . . . . . . . . . . . . . . . . . . . . . (a) 5,522 $ 7,383,024Comcast Corp. Class A (Media) . . . . . . . . . . . . . . . . . . . . . . . . . . . . . . . . . . . . . . . . . . . . . . . . . . . . . . . . . . . . . . . 97,802 4,398,156Walt Disney Co. / The (Entertainment) . . . . . . . . . . . . . . . . . . . . . . . . . . . . . . . . . . . . . . . . . . . . . . . . . . . . . . . . . . . 19,781 2,860,926
14,642,106
CONSUMER DISCRETIONARY – 6.1%Amazon.com, Inc. (Internet & Direct Marketing Retail) . . . . . . . . . . . . . . . . . . . . . . . . . . . . . . . . . . . . . . . . . . . . . . . . . (a) 1,356 2,505,671Dollar General Corp. (Multiline Retail) . . . . . . . . . . . . . . . . . . . . . . . . . . . . . . . . . . . . . . . . . . . . . . . . . . . . . . . . . . . 5,959 929,485General Motors Co. (Automobiles). . . . . . . . . . . . . . . . . . . . . . . . . . . . . . . . . . . . . . . . . . . . . . . . . . . . . . . . . . . . . . 36,248 1,326,677Hasbro, Inc. (Leisure Products) . . . . . . . . . . . . . . . . . . . . . . . . . . . . . . . . . . . . . . . . . . . . . . . . . . . . . . . . . . . . . . . 19,916 2,103,329Hilton Worldwide Holdings, Inc. (Hotels, Restaurants & Leisure) . . . . . . . . . . . . . . . . . . . . . . . . . . . . . . . . . . . . . . . . . . . 23,432 2,598,843Home Depot, Inc. / The (Specialty Retail) . . . . . . . . . . . . . . . . . . . . . . . . . . . . . . . . . . . . . . . . . . . . . . . . . . . . . . . . . 23,605 5,154,860McDonald’s Corp. (Hotels, Restaurants & Leisure) . . . . . . . . . . . . . . . . . . . . . . . . . . . . . . . . . . . . . . . . . . . . . . . . . . . 28,093 5,551,458NIKE, Inc. Class B (Textiles, Apparel & Luxury Goods) . . . . . . . . . . . . . . . . . . . . . . . . . . . . . . . . . . . . . . . . . . . . . . . . . 27,934 2,829,993Norwegian Cruise Line Holdings Ltd. (Hotels, Restaurants & Leisure) . . . . . . . . . . . . . . . . . . . . . . . . . . . . . . . . . . . . . . . . (a) 28,567 1,668,598
24,668,914
CONSUMER STAPLES – 4.6%Altria Group, Inc. (Tobacco) . . . . . . . . . . . . . . . . . . . . . . . . . . . . . . . . . . . . . . . . . . . . . . . . . . . . . . . . . . . . . . . . . . 87,743 4,379,253Clorox Co. / The (Household Products) . . . . . . . . . . . . . . . . . . . . . . . . . . . . . . . . . . . . . . . . . . . . . . . . . . . . . . . . . . . 5,086 780,904Costco Wholesale Corp. (Food & Staples Retailing) . . . . . . . . . . . . . . . . . . . . . . . . . . . . . . . . . . . . . . . . . . . . . . . . . . . 13,578 3,990,846Estee Lauder Cos., Inc. / The Class A (Personal Products) . . . . . . . . . . . . . . . . . . . . . . . . . . . . . . . . . . . . . . . . . . . . . . . 7,101 1,466,641Hershey Co. / The (Food Products) . . . . . . . . . . . . . . . . . . . . . . . . . . . . . . . . . . . . . . . . . . . . . . . . . . . . . . . . . . . . . 10,705 1,573,421Monster Beverage Corp. (Beverages) . . . . . . . . . . . . . . . . . . . . . . . . . . . . . . . . . . . . . . . . . . . . . . . . . . . . . . . . . . . (a) 14,838 942,955Procter & Gamble Co. / The (Household Products). . . . . . . . . . . . . . . . . . . . . . . . . . . . . . . . . . . . . . . . . . . . . . . . . . . . 13,508 1,687,149Sysco Corp. (Food & Staples Retailing) . . . . . . . . . . . . . . . . . . . . . . . . . . . . . . . . . . . . . . . . . . . . . . . . . . . . . . . . . . . 41,782 3,574,032
18,395,201
ENERGY – 0.8%EOG Resources, Inc. (Oil, Gas & Consumable Fuels). . . . . . . . . . . . . . . . . . . . . . . . . . . . . . . . . . . . . . . . . . . . . . . . . . . 14,099 1,180,932Suncor Energy, Inc. (Oil, Gas & Consumable Fuels) . . . . . . . . . . . . . . . . . . . . . . . . . . . . . . . . . . . . . . . . . . . . . . . . . . . 65,265 2,140,692
3,321,624
FINANCIALS – 5.8%American Express Co. (Consumer Finance) . . . . . . . . . . . . . . . . . . . . . . . . . . . . . . . . . . . . . . . . . . . . . . . . . . . . . . . . 18,759 2,335,308Bank of America Corp. (Banks). . . . . . . . . . . . . . . . . . . . . . . . . . . . . . . . . . . . . . . . . . . . . . . . . . . . . . . . . . . . . . . . 88,890 3,130,706Blackstone Group, Inc. / The Class A (Capital Markets). . . . . . . . . . . . . . . . . . . . . . . . . . . . . . . . . . . . . . . . . . . . . . . . . 47,493 2,656,758CME Group, Inc. (Capital Markets) . . . . . . . . . . . . . . . . . . . . . . . . . . . . . . . . . . . . . . . . . . . . . . . . . . . . . . . . . . . . . 13,710 2,751,871Morgan Stanley (Capital Markets). . . . . . . . . . . . . . . . . . . . . . . . . . . . . . . . . . . . . . . . . . . . . . . . . . . . . . . . . . . . . . 36,245 1,852,844Progressive Corp. / The (Insurance). . . . . . . . . . . . . . . . . . . . . . . . . . . . . . . . . . . . . . . . . . . . . . . . . . . . . . . . . . . . . 36,097 2,613,062Synchrony Financial (Consumer Finance) . . . . . . . . . . . . . . . . . . . . . . . . . . . . . . . . . . . . . . . . . . . . . . . . . . . . . . . . . 61,809 2,225,742TD Ameritrade Holding Corp. (Capital Markets). . . . . . . . . . . . . . . . . . . . . . . . . . . . . . . . . . . . . . . . . . . . . . . . . . . . . . 26,578 1,320,927U.S. Bancorp (Banks). . . . . . . . . . . . . . . . . . . . . . . . . . . . . . . . . . . . . . . . . . . . . . . . . . . . . . . . . . . . . . . . . . . . . . 75,847 4,496,969
23,384,187
HEALTH CARE – 6.1%Abbott Laboratories (Health Care Equip. & Supplies) . . . . . . . . . . . . . . . . . . . . . . . . . . . . . . . . . . . . . . . . . . . . . . . . . . 34,738 3,017,343Bristol-Myers Squibb Co. (Pharmaceuticals) . . . . . . . . . . . . . . . . . . . . . . . . . . . . . . . . . . . . . . . . . . . . . . . . . . . . . . . 52,350 3,360,347Eli Lilly & Co. (Pharmaceuticals) . . . . . . . . . . . . . . . . . . . . . . . . . . . . . . . . . . . . . . . . . . . . . . . . . . . . . . . . . . . . . . . 23,801 3,128,165Medtronic PLC (Health Care Equip. & Supplies) . . . . . . . . . . . . . . . . . . . . . . . . . . . . . . . . . . . . . . . . . . . . . . . . . . . . . 20,816 2,361,575Merck & Co., Inc. (Pharmaceuticals) . . . . . . . . . . . . . . . . . . . . . . . . . . . . . . . . . . . . . . . . . . . . . . . . . . . . . . . . . . . . 53,015 4,821,714Thermo Fisher Scientific, Inc. (Life Sciences Tools & Svs.). . . . . . . . . . . . . . . . . . . . . . . . . . . . . . . . . . . . . . . . . . . . . . . 5,928 1,925,829UnitedHealth Group, Inc. (Health Care Providers & Svs.) . . . . . . . . . . . . . . . . . . . . . . . . . . . . . . . . . . . . . . . . . . . . . . . . 20,461 6,015,125
24,630,098
INDUSTRIALS – 5.0%Boeing Co. / The (Aerospace & Defense) . . . . . . . . . . . . . . . . . . . . . . . . . . . . . . . . . . . . . . . . . . . . . . . . . . . . . . . . . 16,679 5,433,351CSX Corp. (Road & Rail) . . . . . . . . . . . . . . . . . . . . . . . . . . . . . . . . . . . . . . . . . . . . . . . . . . . . . . . . . . . . . . . . . . . . 37,786 2,734,195Deere & Co. (Machinery) . . . . . . . . . . . . . . . . . . . . . . . . . . . . . . . . . . . . . . . . . . . . . . . . . . . . . . . . . . . . . . . . . . . 11,808 2,045,854Delta Air Lines, Inc. (Airlines). . . . . . . . . . . . . . . . . . . . . . . . . . . . . . . . . . . . . . . . . . . . . . . . . . . . . . . . . . . . . . . . . 31,696 1,853,582General Dynamics Corp. (Aerospace & Defense) . . . . . . . . . . . . . . . . . . . . . . . . . . . . . . . . . . . . . . . . . . . . . . . . . . . . 22,526 3,972,460Honeywell International, Inc. (Industrial Conglomerates) . . . . . . . . . . . . . . . . . . . . . . . . . . . . . . . . . . . . . . . . . . . . . . . 10,985 1,944,345Stanley Black & Decker, Inc. (Machinery) . . . . . . . . . . . . . . . . . . . . . . . . . . . . . . . . . . . . . . . . . . . . . . . . . . . . . . . . . 6,623 1,097,696United Parcel Service, Inc. Class B (Air Freight & Logistics). . . . . . . . . . . . . . . . . . . . . . . . . . . . . . . . . . . . . . . . . . . . . . 11,290 1,321,608
20,403,091
INFORMATION TECHNOLOGY – 13.4%Accenture PLC Class A (IT Svs.) . . . . . . . . . . . . . . . . . . . . . . . . . . . . . . . . . . . . . . . . . . . . . . . . . . . . . . . . . . . . . . . 20,250 4,264,042Adobe, Inc. (Software) . . . . . . . . . . . . . . . . . . . . . . . . . . . . . . . . . . . . . . . . . . . . . . . . . . . . . . . . . . . . . . . . . . . . . (a) 14,270 4,706,389Apple, Inc. (Tech. Hardware, Storage & Periph.) . . . . . . . . . . . . . . . . . . . . . . . . . . . . . . . . . . . . . . . . . . . . . . . . . . . . . 26,662 7,829,296
Ohio National Fund, Inc. ON Risk Managed Balanced Portfolio
Schedule of Investments December 31, 2019
105 (continued)
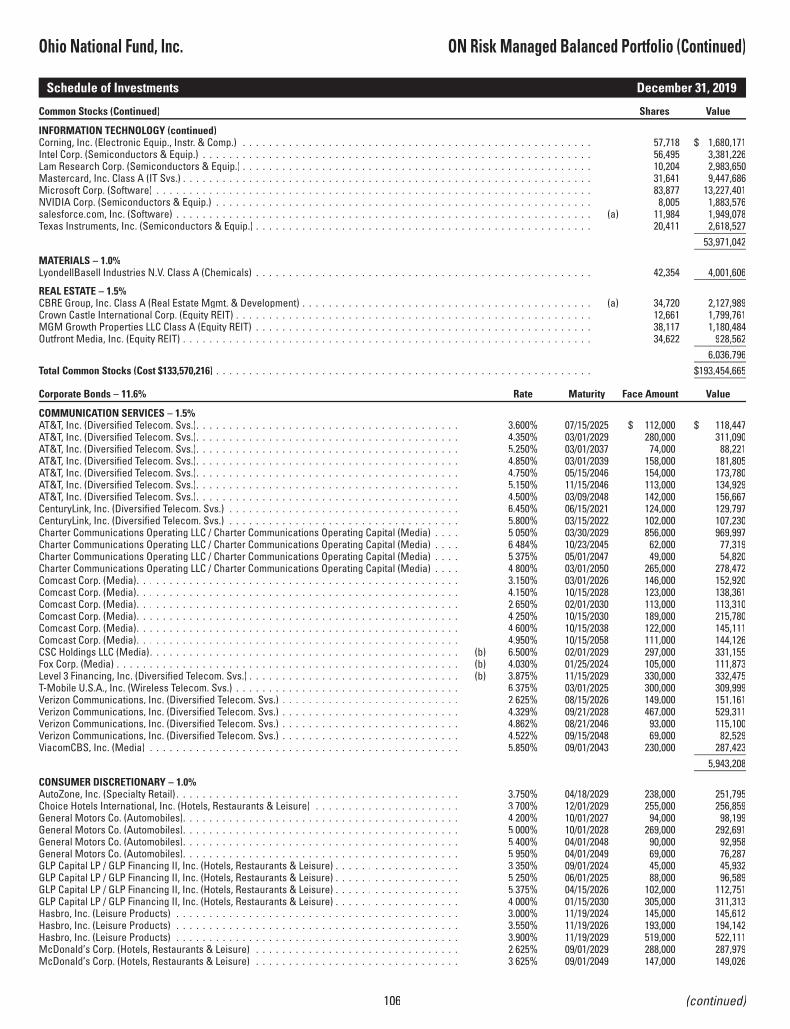
Common Stocks (Continued) Shares Value
INFORMATION TECHNOLOGY (continued)Corning, Inc. (Electronic Equip., Instr. & Comp.) . . . . . . . . . . . . . . . . . . . . . . . . . . . . . . . . . . . . . . . . . . . . . . . . . . . . . 57,718 $ 1,680,171Intel Corp. (Semiconductors & Equip.) . . . . . . . . . . . . . . . . . . . . . . . . . . . . . . . . . . . . . . . . . . . . . . . . . . . . . . . . . . . 56,495 3,381,226Lam Research Corp. (Semiconductors & Equip.) . . . . . . . . . . . . . . . . . . . . . . . . . . . . . . . . . . . . . . . . . . . . . . . . . . . . . 10,204 2,983,650Mastercard, Inc. Class A (IT Svs.) . . . . . . . . . . . . . . . . . . . . . . . . . . . . . . . . . . . . . . . . . . . . . . . . . . . . . . . . . . . . . . 31,641 9,447,686Microsoft Corp. (Software) . . . . . . . . . . . . . . . . . . . . . . . . . . . . . . . . . . . . . . . . . . . . . . . . . . . . . . . . . . . . . . . . . . 83,877 13,227,401NVIDIA Corp. (Semiconductors & Equip.) . . . . . . . . . . . . . . . . . . . . . . . . . . . . . . . . . . . . . . . . . . . . . . . . . . . . . . . . . 8,005 1,883,576salesforce.com, Inc. (Software) . . . . . . . . . . . . . . . . . . . . . . . . . . . . . . . . . . . . . . . . . . . . . . . . . . . . . . . . . . . . . . . (a) 11,984 1,949,078Texas Instruments, Inc. (Semiconductors & Equip.) . . . . . . . . . . . . . . . . . . . . . . . . . . . . . . . . . . . . . . . . . . . . . . . . . . . 20,411 2,618,527
53,971,042
MATERIALS – 1.0%LyondellBasell Industries N.V. Class A (Chemicals) . . . . . . . . . . . . . . . . . . . . . . . . . . . . . . . . . . . . . . . . . . . . . . . . . . . 42,354 4,001,606
REAL ESTATE – 1.5%CBRE Group, Inc. Class A (Real Estate Mgmt. & Development) . . . . . . . . . . . . . . . . . . . . . . . . . . . . . . . . . . . . . . . . . . . . (a) 34,720 2,127,989Crown Castle International Corp. (Equity REIT) . . . . . . . . . . . . . . . . . . . . . . . . . . . . . . . . . . . . . . . . . . . . . . . . . . . . . . 12,661 1,799,761MGM Growth Properties LLC Class A (Equity REIT) . . . . . . . . . . . . . . . . . . . . . . . . . . . . . . . . . . . . . . . . . . . . . . . . . . . 38,117 1,180,484Outfront Media, Inc. (Equity REIT) . . . . . . . . . . . . . . . . . . . . . . . . . . . . . . . . . . . . . . . . . . . . . . . . . . . . . . . . . . . . . . 34,622 928,562
6,036,796Total Common Stocks (Cost $133,570,216) . . . . . . . . . . . . . . . . . . . . . . . . . . . . . . . . . . . . . . . . . . . . . . . . . . . . . . . . . $193,454,665
Corporate Bonds – 11.6% Rate Maturity Face Amount Value
COMMUNICATION SERVICES – 1.5%AT&T, Inc. (Diversified Telecom. Svs.). . . . . . . . . . . . . . . . . . . . . . . . . . . . . . . . . . . . . . . . 3.600% 07/15/2025 $ 112,000 $ 118,447AT&T, Inc. (Diversified Telecom. Svs.). . . . . . . . . . . . . . . . . . . . . . . . . . . . . . . . . . . . . . . . 4.350% 03/01/2029 280,000 311,090AT&T, Inc. (Diversified Telecom. Svs.). . . . . . . . . . . . . . . . . . . . . . . . . . . . . . . . . . . . . . . . 5.250% 03/01/2037 74,000 88,221AT&T, Inc. (Diversified Telecom. Svs.). . . . . . . . . . . . . . . . . . . . . . . . . . . . . . . . . . . . . . . . 4.850% 03/01/2039 158,000 181,805AT&T, Inc. (Diversified Telecom. Svs.). . . . . . . . . . . . . . . . . . . . . . . . . . . . . . . . . . . . . . . . 4.750% 05/15/2046 154,000 173,780AT&T, Inc. (Diversified Telecom. Svs.). . . . . . . . . . . . . . . . . . . . . . . . . . . . . . . . . . . . . . . . 5.150% 11/15/2046 113,000 134,929AT&T, Inc. (Diversified Telecom. Svs.). . . . . . . . . . . . . . . . . . . . . . . . . . . . . . . . . . . . . . . . 4.500% 03/09/2048 142,000 156,667CenturyLink, Inc. (Diversified Telecom. Svs.) . . . . . . . . . . . . . . . . . . . . . . . . . . . . . . . . . . . 6.450% 06/15/2021 124,000 129,797CenturyLink, Inc. (Diversified Telecom. Svs.) . . . . . . . . . . . . . . . . . . . . . . . . . . . . . . . . . . . 5.800% 03/15/2022 102,000 107,230Charter Communications Operating LLC / Charter Communications Operating Capital (Media) . . . . 5.050% 03/30/2029 856,000 969,997Charter Communications Operating LLC / Charter Communications Operating Capital (Media) . . . . 6.484% 10/23/2045 62,000 77,319Charter Communications Operating LLC / Charter Communications Operating Capital (Media) . . . . 5.375% 05/01/2047 49,000 54,820Charter Communications Operating LLC / Charter Communications Operating Capital (Media) . . . . 4.800% 03/01/2050 265,000 278,472Comcast Corp. (Media). . . . . . . . . . . . . . . . . . . . . . . . . . . . . . . . . . . . . . . . . . . . . . . . . 3.150% 03/01/2026 146,000 152,920Comcast Corp. (Media). . . . . . . . . . . . . . . . . . . . . . . . . . . . . . . . . . . . . . . . . . . . . . . . . 4.150% 10/15/2028 123,000 138,361Comcast Corp. (Media). . . . . . . . . . . . . . . . . . . . . . . . . . . . . . . . . . . . . . . . . . . . . . . . . 2.650% 02/01/2030 113,000 113,310Comcast Corp. (Media). . . . . . . . . . . . . . . . . . . . . . . . . . . . . . . . . . . . . . . . . . . . . . . . . 4.250% 10/15/2030 189,000 215,780Comcast Corp. (Media). . . . . . . . . . . . . . . . . . . . . . . . . . . . . . . . . . . . . . . . . . . . . . . . . 4.600% 10/15/2038 122,000 145,111Comcast Corp. (Media). . . . . . . . . . . . . . . . . . . . . . . . . . . . . . . . . . . . . . . . . . . . . . . . . 4.950% 10/15/2058 111,000 144,126CSC Holdings LLC (Media). . . . . . . . . . . . . . . . . . . . . . . . . . . . . . . . . . . . . . . . . . . . . . . (b) 6.500% 02/01/2029 297,000 331,155Fox Corp. (Media) . . . . . . . . . . . . . . . . . . . . . . . . . . . . . . . . . . . . . . . . . . . . . . . . . . . . (b) 4.030% 01/25/2024 105,000 111,873Level 3 Financing, Inc. (Diversified Telecom. Svs.) . . . . . . . . . . . . . . . . . . . . . . . . . . . . . . . . (b) 3.875% 11/15/2029 330,000 332,475T-Mobile U.S.A., Inc. (Wireless Telecom. Svs.) . . . . . . . . . . . . . . . . . . . . . . . . . . . . . . . . . . 6.375% 03/01/2025 300,000 309,999Verizon Communications, Inc. (Diversified Telecom. Svs.) . . . . . . . . . . . . . . . . . . . . . . . . . . . 2.625% 08/15/2026 149,000 151,161Verizon Communications, Inc. (Diversified Telecom. Svs.) . . . . . . . . . . . . . . . . . . . . . . . . . . . 4.329% 09/21/2028 467,000 529,311Verizon Communications, Inc. (Diversified Telecom. Svs.) . . . . . . . . . . . . . . . . . . . . . . . . . . . 4.862% 08/21/2046 93,000 115,100Verizon Communications, Inc. (Diversified Telecom. Svs.) . . . . . . . . . . . . . . . . . . . . . . . . . . . 4.522% 09/15/2048 69,000 82,529ViacomCBS, Inc. (Media) . . . . . . . . . . . . . . . . . . . . . . . . . . . . . . . . . . . . . . . . . . . . . . . 5.850% 09/01/2043 230,000 287,423
5,943,208
CONSUMER DISCRETIONARY – 1.0%AutoZone, Inc. (Specialty Retail) . . . . . . . . . . . . . . . . . . . . . . . . . . . . . . . . . . . . . . . . . . . 3.750% 04/18/2029 238,000 251,795Choice Hotels International, Inc. (Hotels, Restaurants & Leisure) . . . . . . . . . . . . . . . . . . . . . . 3.700% 12/01/2029 255,000 256,859General Motors Co. (Automobiles). . . . . . . . . . . . . . . . . . . . . . . . . . . . . . . . . . . . . . . . . . 4.200% 10/01/2027 94,000 98,199General Motors Co. (Automobiles). . . . . . . . . . . . . . . . . . . . . . . . . . . . . . . . . . . . . . . . . . 5.000% 10/01/2028 269,000 292,691General Motors Co. (Automobiles). . . . . . . . . . . . . . . . . . . . . . . . . . . . . . . . . . . . . . . . . . 5.400% 04/01/2048 90,000 92,958General Motors Co. (Automobiles). . . . . . . . . . . . . . . . . . . . . . . . . . . . . . . . . . . . . . . . . . 5.950% 04/01/2049 69,000 76,287GLP Capital LP / GLP Financing II, Inc. (Hotels, Restaurants & Leisure) . . . . . . . . . . . . . . . . . . . 3.350% 09/01/2024 45,000 45,932GLP Capital LP / GLP Financing II, Inc. (Hotels, Restaurants & Leisure) . . . . . . . . . . . . . . . . . . . 5.250% 06/01/2025 88,000 96,589GLP Capital LP / GLP Financing II, Inc. (Hotels, Restaurants & Leisure) . . . . . . . . . . . . . . . . . . . 5.375% 04/15/2026 102,000 112,751GLP Capital LP / GLP Financing II, Inc. (Hotels, Restaurants & Leisure) . . . . . . . . . . . . . . . . . . . 4.000% 01/15/2030 305,000 311,313Hasbro, Inc. (Leisure Products) . . . . . . . . . . . . . . . . . . . . . . . . . . . . . . . . . . . . . . . . . . . 3.000% 11/19/2024 145,000 145,612Hasbro, Inc. (Leisure Products) . . . . . . . . . . . . . . . . . . . . . . . . . . . . . . . . . . . . . . . . . . . 3.550% 11/19/2026 193,000 194,142Hasbro, Inc. (Leisure Products) . . . . . . . . . . . . . . . . . . . . . . . . . . . . . . . . . . . . . . . . . . . 3.900% 11/19/2029 519,000 522,111McDonald’s Corp. (Hotels, Restaurants & Leisure) . . . . . . . . . . . . . . . . . . . . . . . . . . . . . . . 2.625% 09/01/2029 288,000 287,979McDonald’s Corp. (Hotels, Restaurants & Leisure) . . . . . . . . . . . . . . . . . . . . . . . . . . . . . . . 3.625% 09/01/2049 147,000 149,026
Ohio National Fund, Inc. ON Risk Managed Balanced Portfolio (Continued)
Schedule of Investments December 31, 2019
106 (continued)

Corporate Bonds (Continued) Rate Maturity Face Amount Value
CONSUMER DISCRETIONARY (continued)MDC Holdings, Inc. (Household Durables) . . . . . . . . . . . . . . . . . . . . . . . . . . . . . . . . . . . . . 5.500% 01/15/2024 $ 53,000 $ 57,638MGM Resorts International (Hotels, Restaurants & Leisure) . . . . . . . . . . . . . . . . . . . . . . . . . 7.750% 03/15/2022 44,000 49,060Nordstrom, Inc. (Multiline Retail) . . . . . . . . . . . . . . . . . . . . . . . . . . . . . . . . . . . . . . . . . . 4.375% 04/01/2030 274,000 279,039O’Reilly Automotive, Inc. (Specialty Retail) . . . . . . . . . . . . . . . . . . . . . . . . . . . . . . . . . . . . 3.600% 09/01/2027 6,000 6,397O’Reilly Automotive, Inc. (Specialty Retail) . . . . . . . . . . . . . . . . . . . . . . . . . . . . . . . . . . . . 4.350% 06/01/2028 47,000 52,413O’Reilly Automotive, Inc. (Specialty Retail) . . . . . . . . . . . . . . . . . . . . . . . . . . . . . . . . . . . . 3.900% 06/01/2029 275,000 300,115Starbucks Corp. (Hotels, Restaurants & Leisure) . . . . . . . . . . . . . . . . . . . . . . . . . . . . . . . . . 4.450% 08/15/2049 180,000 208,123
3,887,029
CONSUMER STAPLES – 1.0%Anheuser-Busch InBev Worldwide, Inc. (Beverages) . . . . . . . . . . . . . . . . . . . . . . . . . . . . . . 4.150% 01/23/2025 512,000 557,025Anheuser-Busch InBev Worldwide, Inc. (Beverages) . . . . . . . . . . . . . . . . . . . . . . . . . . . . . . 4.750% 01/23/2029 242,000 280,153Campbell Soup Co. (Food Products) . . . . . . . . . . . . . . . . . . . . . . . . . . . . . . . . . . . . . . . . . 3.950% 03/15/2025 113,000 120,294Campbell Soup Co. (Food Products) . . . . . . . . . . . . . . . . . . . . . . . . . . . . . . . . . . . . . . . . . 4.150% 03/15/2028 221,000 239,650Campbell Soup Co. (Food Products) . . . . . . . . . . . . . . . . . . . . . . . . . . . . . . . . . . . . . . . . . 4.800% 03/15/2048 238,000 274,849General Mills, Inc. (Food Products) . . . . . . . . . . . . . . . . . . . . . . . . . . . . . . . . . . . . . . . . . 4.200% 04/17/2028 281,000 312,852Keurig Dr Pepper, Inc. (Beverages) . . . . . . . . . . . . . . . . . . . . . . . . . . . . . . . . . . . . . . . . . 4.597% 05/25/2028 277,000 310,675Keurig Dr Pepper, Inc. (Beverages) . . . . . . . . . . . . . . . . . . . . . . . . . . . . . . . . . . . . . . . . . 5.085% 05/25/2048 111,000 133,332Kraft Heinz Foods Co. (Food Products) . . . . . . . . . . . . . . . . . . . . . . . . . . . . . . . . . . . . . . . 3.000% 06/01/2026 518,000 517,584Kraft Heinz Foods Co. (Food Products) . . . . . . . . . . . . . . . . . . . . . . . . . . . . . . . . . . . . . . . 4.625% 01/30/2029 98,000 107,679Kraft Heinz Foods Co. (Food Products) . . . . . . . . . . . . . . . . . . . . . . . . . . . . . . . . . . . . . . . 4.375% 06/01/2046 217,000 213,290Mars, Inc. (Food Products) . . . . . . . . . . . . . . . . . . . . . . . . . . . . . . . . . . . . . . . . . . . . . . (b) 2.700% 04/01/2025 113,000 115,524Mars, Inc. (Food Products) . . . . . . . . . . . . . . . . . . . . . . . . . . . . . . . . . . . . . . . . . . . . . . (b) 3.200% 04/01/2030 139,000 147,008Mars, Inc. (Food Products) . . . . . . . . . . . . . . . . . . . . . . . . . . . . . . . . . . . . . . . . . . . . . . (b) 4.200% 04/01/2059 118,000 134,464Mondelez International Holdings Netherlands BV (Food Products) . . . . . . . . . . . . . . . . . . . . . (b) 2.250% 09/19/2024 249,000 248,108Reckson Operating Partnership LP (Household Products) . . . . . . . . . . . . . . . . . . . . . . . . . . . 7.750% 03/15/2020 237,000 239,611Sysco Corp. (Food & Staples Retailing) . . . . . . . . . . . . . . . . . . . . . . . . . . . . . . . . . . . . . . . 2.500% 07/15/2021 73,000 73,600
4,025,698
ENERGY – 0.9%Cheniere Corpus Christi Holdings LLC (Oil, Gas & Consumable Fuels) . . . . . . . . . . . . . . . . . . . . (b) 3.700% 11/15/2029 557,000 568,019Continental Resources, Inc. (Oil, Gas & Consumable Fuels) . . . . . . . . . . . . . . . . . . . . . . . . . . 5.000% 09/15/2022 245,000 246,633Continental Resources, Inc. (Oil, Gas & Consumable Fuels) . . . . . . . . . . . . . . . . . . . . . . . . . . 4.500% 04/15/2023 179,000 186,917Energy Transfer Operating LP (Oil, Gas & Consumable Fuels) . . . . . . . . . . . . . . . . . . . . . . . . . 5.875% 01/15/2024 127,000 140,504Energy Transfer Operating LP (Oil, Gas & Consumable Fuels) . . . . . . . . . . . . . . . . . . . . . . . . . 5.500% 06/01/2027 98,000 110,060Energy Transfer Operating LP (Oil, Gas & Consumable Fuels) . . . . . . . . . . . . . . . . . . . . . . . . . 4.950% 06/15/2028 25,000 27,362EQM Midstream Partners LP (Oil, Gas & Consumable Fuels) . . . . . . . . . . . . . . . . . . . . . . . . . 5.500% 07/15/2028 234,000 229,731Hess Corp. (Oil, Gas & Consumable Fuels) . . . . . . . . . . . . . . . . . . . . . . . . . . . . . . . . . . . . . 4.300% 04/01/2027 258,000 275,123Hess Midstream Operations LP (Oil, Gas & Consumable Fuels) . . . . . . . . . . . . . . . . . . . . . . . . (b) 5.125% 06/15/2028 381,000 385,762HollyFrontier Corp. (Oil, Gas & Consumable Fuels) . . . . . . . . . . . . . . . . . . . . . . . . . . . . . . . . 5.875% 04/01/2026 242,000 272,591Kinder Morgan, Inc. (Oil, Gas & Consumable Fuels) . . . . . . . . . . . . . . . . . . . . . . . . . . . . . . . 4.300% 03/01/2028 69,000 75,190Kinder Morgan, Inc. (Oil, Gas & Consumable Fuels) . . . . . . . . . . . . . . . . . . . . . . . . . . . . . . . 5.550% 06/01/2045 66,000 78,897Kinder Morgan, Inc. (Oil, Gas & Consumable Fuels) . . . . . . . . . . . . . . . . . . . . . . . . . . . . . . . 5.200% 03/01/2048 44,000 50,946NGPL PipeCo LLC (Oil, Gas & Consumable Fuels) . . . . . . . . . . . . . . . . . . . . . . . . . . . . . . . . (b) 4.375% 08/15/2022 189,000 196,221NGPL PipeCo LLC (Oil, Gas & Consumable Fuels) . . . . . . . . . . . . . . . . . . . . . . . . . . . . . . . . (b) 4.875% 08/15/2027 242,000 256,909Petroleos Mexicanos (Oil, Gas & Consumable Fuels) . . . . . . . . . . . . . . . . . . . . . . . . . . . . . . (b) 6.840% 01/23/2030 61,000 65,047Petroleos Mexicanos (Oil, Gas & Consumable Fuels) . . . . . . . . . . . . . . . . . . . . . . . . . . . . . . (b) 7.690% 01/23/2050 56,000 61,115Plains All American Pipeline LP (Oil, Gas & Consumable Fuels). . . . . . . . . . . . . . . . . . . . . . . . 4.650% 10/15/2025 241,000 257,973Sabine Pass Liquefaction LLC (Oil, Gas & Consumable Fuels) . . . . . . . . . . . . . . . . . . . . . . . . . 4.200% 03/15/2028 140,000 148,233Tallgrass Energy Partners LP / Tallgrass Energy Finance Corp. (Oil, Gas & Consumable Fuels) . . . . (b) 4.750% 10/01/2023 134,000 133,665
3,766,898
FINANCIALS – 2.0%Bank of America Corp. (Rate is fixed until 04/24/2027, at which point, the rate becomes QL + 151)
(Banks) . . . . . . . . . . . . . . . . . . . . . . . . . . . . . . . . . . . . . . . . . . . . . . . . . . . . . . . . . (c) 3.705% 04/24/2028 501,000 535,116Bank of America Corp. (Rate is fixed until 03/05/2028, at which point, the rate becomes QL + 107)
(Banks) . . . . . . . . . . . . . . . . . . . . . . . . . . . . . . . . . . . . . . . . . . . . . . . . . . . . . . . . . (c) 3.970% 03/05/2029 232,000 252,513Bank of America Corp. (Rate is fixed until 02/07/2029, at which point, the rate becomes QL + 121)
(Banks) . . . . . . . . . . . . . . . . . . . . . . . . . . . . . . . . . . . . . . . . . . . . . . . . . . . . . . . . . (c) 3.974% 02/07/2030 283,000 310,886BNP Paribas SA (Rate is fixed until 11/19/2024, at which point, the rate becomes QL + 111) (Banks) . (b)(c) 2.819% 11/19/2025 306,000 309,342Brown & Brown, Inc. (Insurance) . . . . . . . . . . . . . . . . . . . . . . . . . . . . . . . . . . . . . . . . . . 4.500% 03/15/2029 140,000 153,894Cboe Global Markets, Inc. (Capital Markets) . . . . . . . . . . . . . . . . . . . . . . . . . . . . . . . . . . . 3.650% 01/12/2027 165,000 177,032CIT Bank NA (Rate is fixed until 09/27/2024, at which point, the rate becomes SOFR + 172) (Banks) . (c) 2.969% 09/27/2025 250,000 249,375Citigroup, Inc. (Rate is fixed until 01/10/2027, at which point, the rate becomes QL + 156) (Banks). . . (c) 3.887% 01/10/2028 833,000 896,658Citizens Financial Group, Inc. (Banks) . . . . . . . . . . . . . . . . . . . . . . . . . . . . . . . . . . . . . . . 3.750% 07/01/2024 47,000 48,774Citizens Financial Group, Inc. (Banks) . . . . . . . . . . . . . . . . . . . . . . . . . . . . . . . . . . . . . . . 4.350% 08/01/2025 41,000 44,148Citizens Financial Group, Inc. (Banks) . . . . . . . . . . . . . . . . . . . . . . . . . . . . . . . . . . . . . . . 4.300% 12/03/2025 114,000 122,395Credit Suisse Group AG (Capital Markets) . . . . . . . . . . . . . . . . . . . . . . . . . . . . . . . . . . . . . (b) 4.282% 01/09/2028 282,000 306,513First Republic Bank (Banks). . . . . . . . . . . . . . . . . . . . . . . . . . . . . . . . . . . . . . . . . . . . . . 4.625% 02/13/2047 100,000 113,785General Motors Financial Co., Inc. (Consumer Finance) . . . . . . . . . . . . . . . . . . . . . . . . . . . . 4.350% 04/09/2025 177,000 189,548
Ohio National Fund, Inc. ON Risk Managed Balanced Portfolio (Continued)
Schedule of Investments December 31, 2019
107 (continued)

Corporate Bonds (Continued) Rate Maturity Face Amount Value
FINANCIALS (continued)General Motors Financial Co., Inc. (Consumer Finance) . . . . . . . . . . . . . . . . . . . . . . . . . . . . 4.300% 07/13/2025 $ 54,000 $ 57,679General Motors Financial Co., Inc. (Consumer Finance) . . . . . . . . . . . . . . . . . . . . . . . . . . . . 4.350% 01/17/2027 99,000 103,968JPMorgan Chase & Co. (Rate is fixed until 01/29/2026, at which point, the rate becomes QL + 125)
(Banks) . . . . . . . . . . . . . . . . . . . . . . . . . . . . . . . . . . . . . . . . . . . . . . . . . . . . . . . . . (c) 3.960% 01/29/2027 508,000 550,820JPMorgan Chase & Co. (Rate is fixed until 02/01/2027, at which point, the rate becomes QL + 134)
(Banks) . . . . . . . . . . . . . . . . . . . . . . . . . . . . . . . . . . . . . . . . . . . . . . . . . . . . . . . . . (c) 3.782% 02/01/2028 302,000 325,308JPMorgan Chase & Co. (Rate is fixed until 12/05/2028, at which point, the rate becomes QL + 133)
(Banks) . . . . . . . . . . . . . . . . . . . . . . . . . . . . . . . . . . . . . . . . . . . . . . . . . . . . . . . . . (c) 4.452% 12/05/2029 460,000 522,826JPMorgan Chase & Co. (Rate is fixed until 05/06/2029, at which point, the rate becomes QL + 116)
(Banks) . . . . . . . . . . . . . . . . . . . . . . . . . . . . . . . . . . . . . . . . . . . . . . . . . . . . . . . . . (c) 3.702% 05/06/2030 275,000 295,858JPMorgan Chase & Co. (Rate is fixed until 10/15/2029, at which point, the rate becomes SOFR +
151) (Banks) . . . . . . . . . . . . . . . . . . . . . . . . . . . . . . . . . . . . . . . . . . . . . . . . . . . . . . (c) 2.739% 10/15/2030 218,000 217,688Morgan Stanley (Capital Markets). . . . . . . . . . . . . . . . . . . . . . . . . . . . . . . . . . . . . . . . . . 4.350% 09/08/2026 251,000 274,300Morgan Stanley (Capital Markets). . . . . . . . . . . . . . . . . . . . . . . . . . . . . . . . . . . . . . . . . . 3.950% 04/23/2027 396,000 424,405Morgan Stanley (Rate is fixed until 01/23/2029, at which point, the rate becomes QL + 163)
(Capital Markets). . . . . . . . . . . . . . . . . . . . . . . . . . . . . . . . . . . . . . . . . . . . . . . . . . . (c) 4.431% 01/23/2030 343,000 387,437Raymond James Financial, Inc. (Capital Markets) . . . . . . . . . . . . . . . . . . . . . . . . . . . . . . . . 4.950% 07/15/2046 185,000 215,675Synchrony Financial (Consumer Finance) . . . . . . . . . . . . . . . . . . . . . . . . . . . . . . . . . . . . . 4.375% 03/19/2024 61,000 65,034Synchrony Financial (Consumer Finance) . . . . . . . . . . . . . . . . . . . . . . . . . . . . . . . . . . . . . 3.950% 12/01/2027 321,000 336,997Synchrony Financial (Consumer Finance) . . . . . . . . . . . . . . . . . . . . . . . . . . . . . . . . . . . . . 5.150% 03/19/2029 281,000 319,332Wells Fargo & Co. (Rate is fixed until 10/30/2029, at which point, the rate becomes QL + 117)
(Banks) . . . . . . . . . . . . . . . . . . . . . . . . . . . . . . . . . . . . . . . . . . . . . . . . . . . . . . . . . (c) 2.879% 10/30/2030 411,000 413,2298,220,535
HEALTH CARE – 1.6%AbbVie, Inc. (Biotechnology) . . . . . . . . . . . . . . . . . . . . . . . . . . . . . . . . . . . . . . . . . . . . . (b) 2.600% 11/21/2024 165,000 165,945AbbVie, Inc. (Biotechnology) . . . . . . . . . . . . . . . . . . . . . . . . . . . . . . . . . . . . . . . . . . . . . (b) 2.950% 11/21/2026 174,000 176,602AbbVie, Inc. (Biotechnology) . . . . . . . . . . . . . . . . . . . . . . . . . . . . . . . . . . . . . . . . . . . . . (b) 3.200% 11/21/2029 134,000 136,234AbbVie, Inc. (Biotechnology) . . . . . . . . . . . . . . . . . . . . . . . . . . . . . . . . . . . . . . . . . . . . . (b) 4.050% 11/21/2039 201,000 212,419AbbVie, Inc. (Biotechnology) . . . . . . . . . . . . . . . . . . . . . . . . . . . . . . . . . . . . . . . . . . . . . (b) 4.250% 11/21/2049 116,000 122,083Allergan Finance LLC (Pharmaceuticals). . . . . . . . . . . . . . . . . . . . . . . . . . . . . . . . . . . . . . 3.250% 10/01/2022 175,000 178,781Allergan Funding SCS (Pharmaceuticals) . . . . . . . . . . . . . . . . . . . . . . . . . . . . . . . . . . . . . 3.450% 03/15/2022 292,000 298,588Allergan Funding SCS (Pharmaceuticals) . . . . . . . . . . . . . . . . . . . . . . . . . . . . . . . . . . . . . 3.800% 03/15/2025 210,000 220,484Allergan, Inc. (Pharmaceuticals). . . . . . . . . . . . . . . . . . . . . . . . . . . . . . . . . . . . . . . . . . . 2.800% 03/15/2023 14,000 14,102Boston Scientific Corp. (Health Care Equip. & Supplies) . . . . . . . . . . . . . . . . . . . . . . . . . . . . 3.750% 03/01/2026 137,000 146,708Boston Scientific Corp. (Health Care Equip. & Supplies) . . . . . . . . . . . . . . . . . . . . . . . . . . . . 4.000% 03/01/2029 71,000 78,472Boston Scientific Corp. (Health Care Equip. & Supplies) . . . . . . . . . . . . . . . . . . . . . . . . . . . . 4.700% 03/01/2049 114,000 138,289Bristol-Myers Squibb Co. (Pharmaceuticals) . . . . . . . . . . . . . . . . . . . . . . . . . . . . . . . . . . . (b) 3.400% 07/26/2029 125,000 133,581Bristol-Myers Squibb Co. (Pharmaceuticals) . . . . . . . . . . . . . . . . . . . . . . . . . . . . . . . . . . . (b) 4.125% 06/15/2039 90,000 103,617Bristol-Myers Squibb Co. (Pharmaceuticals) . . . . . . . . . . . . . . . . . . . . . . . . . . . . . . . . . . . (b) 4.250% 10/26/2049 155,000 183,413Centene Corp. (Health Care Providers & Svs.) . . . . . . . . . . . . . . . . . . . . . . . . . . . . . . . . . . 4.750% 05/15/2022 15,000 15,300Centene Corp. (Health Care Providers & Svs.) . . . . . . . . . . . . . . . . . . . . . . . . . . . . . . . . . . 6.125% 02/15/2024 113,000 117,238Centene Corp. (Health Care Providers & Svs.) . . . . . . . . . . . . . . . . . . . . . . . . . . . . . . . . . . (b) 5.375% 06/01/2026 371,000 393,724Centene Corp. (Health Care Providers & Svs.) . . . . . . . . . . . . . . . . . . . . . . . . . . . . . . . . . . (b) 4.250% 12/15/2027 326,000 335,372Centene Corp. (Health Care Providers & Svs.) . . . . . . . . . . . . . . . . . . . . . . . . . . . . . . . . . . (b) 4.625% 12/15/2029 490,000 516,386Cigna Corp. (Health Care Providers & Svs.) . . . . . . . . . . . . . . . . . . . . . . . . . . . . . . . . . . . . 3.400% 09/17/2021 47,000 48,099CVS Health Corp. (Health Care Providers & Svs.). . . . . . . . . . . . . . . . . . . . . . . . . . . . . . . . . 4.100% 03/25/2025 297,000 318,575CVS Health Corp. (Health Care Providers & Svs.). . . . . . . . . . . . . . . . . . . . . . . . . . . . . . . . . 3.000% 08/15/2026 33,000 33,629CVS Health Corp. (Health Care Providers & Svs.). . . . . . . . . . . . . . . . . . . . . . . . . . . . . . . . . 4.300% 03/25/2028 116,000 126,583CVS Health Corp. (Health Care Providers & Svs.). . . . . . . . . . . . . . . . . . . . . . . . . . . . . . . . . 3.250% 08/15/2029 53,000 53,789CVS Health Corp. (Health Care Providers & Svs.). . . . . . . . . . . . . . . . . . . . . . . . . . . . . . . . . 5.050% 03/25/2048 535,000 632,092DH Europe Finance II SARL . . . . . . . . . . . . . . . . . . . . . . . . . . . . . . . . . . . . . . . . . . . . . . 2.200% 11/15/2024 129,000 129,052DH Europe Finance II SARL . . . . . . . . . . . . . . . . . . . . . . . . . . . . . . . . . . . . . . . . . . . . . . 2.600% 11/15/2029 71,000 70,634DH Europe Finance II SARL . . . . . . . . . . . . . . . . . . . . . . . . . . . . . . . . . . . . . . . . . . . . . . 3.400% 11/15/2049 91,000 92,395Elanco Animal Health, Inc. (Pharmaceuticals) . . . . . . . . . . . . . . . . . . . . . . . . . . . . . . . . . . 4.272% 08/28/2023 112,000 118,235Elanco Animal Health, Inc. (Pharmaceuticals) . . . . . . . . . . . . . . . . . . . . . . . . . . . . . . . . . . 4.900% 08/28/2028 24,000 26,085HCA, Inc. (Health Care Providers & Svs.). . . . . . . . . . . . . . . . . . . . . . . . . . . . . . . . . . . . . . 4.500% 02/15/2027 285,000 307,055HCA, Inc. (Health Care Providers & Svs.). . . . . . . . . . . . . . . . . . . . . . . . . . . . . . . . . . . . . . 4.125% 06/15/2029 697,000 738,562HCA, Inc. (Health Care Providers & Svs.). . . . . . . . . . . . . . . . . . . . . . . . . . . . . . . . . . . . . . 5.125% 06/15/2039 124,000 136,849
6,518,972
INDUSTRIALS – 1.0%Boeing Co. / The (Aerospace & Defense) . . . . . . . . . . . . . . . . . . . . . . . . . . . . . . . . . . . . . 2.250% 06/15/2026 35,000 34,539Boeing Co. / The (Aerospace & Defense) . . . . . . . . . . . . . . . . . . . . . . . . . . . . . . . . . . . . . 3.250% 03/01/2028 44,000 45,770Boeing Co. / The (Aerospace & Defense) . . . . . . . . . . . . . . . . . . . . . . . . . . . . . . . . . . . . . 3.200% 03/01/2029 250,000 260,370Boeing Co. / The (Aerospace & Defense) . . . . . . . . . . . . . . . . . . . . . . . . . . . . . . . . . . . . . 3.600% 05/01/2034 290,000 310,151Equifax, Inc. (Professional Svs.) . . . . . . . . . . . . . . . . . . . . . . . . . . . . . . . . . . . . . . . . . . . 2.600% 12/01/2024 423,000 425,260Experian Finance PLC (Professional Svs.) . . . . . . . . . . . . . . . . . . . . . . . . . . . . . . . . . . . . . (b) 2.750% 03/08/2030 573,000 563,650GE Capital International Funding Co. Unlimited Co. (Industrial Conglomerates) . . . . . . . . . . . . . . 4.418% 11/15/2035 565,000 601,598General Electric Co. (Industrial Conglomerates) . . . . . . . . . . . . . . . . . . . . . . . . . . . . . . . . . 6.750% 03/15/2032 129,000 165,468
Ohio National Fund, Inc. ON Risk Managed Balanced Portfolio (Continued)
Schedule of Investments December 31, 2019
108 (continued)

Corporate Bonds (Continued) Rate Maturity Face Amount Value
INDUSTRIALS (continued)Huntington Ingalls Industries, Inc. (Aerospace & Defense) . . . . . . . . . . . . . . . . . . . . . . . . . . (b) 5.000% 11/15/2025 $ 349,000 $ 364,705IHS Markit Ltd. (Professional Svs.) . . . . . . . . . . . . . . . . . . . . . . . . . . . . . . . . . . . . . . . . . (b) 5.000% 11/01/2022 26,000 27,701IHS Markit Ltd. (Professional Svs.) . . . . . . . . . . . . . . . . . . . . . . . . . . . . . . . . . . . . . . . . . (b) 4.750% 02/15/2025 215,000 234,870Verisk Analytics, Inc. (Professional Svs.). . . . . . . . . . . . . . . . . . . . . . . . . . . . . . . . . . . . . . 5.500% 06/15/2045 101,000 125,359Westinghouse Air Brake Technologies Corp. (Machinery) . . . . . . . . . . . . . . . . . . . . . . . . . . . 4.400% 03/15/2024 189,000 200,658Westinghouse Air Brake Technologies Corp. (Machinery) . . . . . . . . . . . . . . . . . . . . . . . . . . . 3.450% 11/15/2026 66,000 66,704Westinghouse Air Brake Technologies Corp. (Machinery) . . . . . . . . . . . . . . . . . . . . . . . . . . . 4.950% 09/15/2028 656,000 721,236
4,148,039
INFORMATION TECHNOLOGY – 1.3%Broadcom Corp. / Broadcom Cayman Finance Ltd. (Semiconductors & Equip.) . . . . . . . . . . . . . . 3.875% 01/15/2027 134,000 139,046Broadcom, Inc. (Semiconductors & Equip.) . . . . . . . . . . . . . . . . . . . . . . . . . . . . . . . . . . . . (b) 4.250% 04/15/2026 177,000 188,060Broadcom, Inc. (Semiconductors & Equip.) . . . . . . . . . . . . . . . . . . . . . . . . . . . . . . . . . . . . (b) 4.750% 04/15/2029 240,000 262,421Broadridge Financial Solutions, Inc. (IT Svs.) . . . . . . . . . . . . . . . . . . . . . . . . . . . . . . . . . . . 2.900% 12/01/2029 414,000 413,496Dell International LLC / EMC Corp. (Tech. Hardware, Storage & Periph.) . . . . . . . . . . . . . . . . . . (b) 5.875% 06/15/2021 341,000 346,330Fidelity National Information Services, Inc. (IT Svs.). . . . . . . . . . . . . . . . . . . . . . . . . . . . . . . 3.750% 05/21/2029 83,000 90,744Global Payments, Inc. (IT Svs.) . . . . . . . . . . . . . . . . . . . . . . . . . . . . . . . . . . . . . . . . . . . . 4.800% 04/01/2026 185,000 205,648Global Payments, Inc. (IT Svs.) . . . . . . . . . . . . . . . . . . . . . . . . . . . . . . . . . . . . . . . . . . . . 3.200% 08/15/2029 75,000 76,492Global Payments, Inc. (IT Svs.) . . . . . . . . . . . . . . . . . . . . . . . . . . . . . . . . . . . . . . . . . . . . 4.150% 08/15/2049 56,000 59,720Keysight Technologies, Inc. (Electronic Equip., Instr. & Comp.) . . . . . . . . . . . . . . . . . . . . . . . . 3.000% 10/30/2029 287,000 287,529Lam Research Corp. (Semiconductors & Equip.) . . . . . . . . . . . . . . . . . . . . . . . . . . . . . . . . . 4.000% 03/15/2029 51,000 56,157Marvell Technology Group Ltd. (Semiconductors & Equip.) . . . . . . . . . . . . . . . . . . . . . . . . . . 4.200% 06/22/2023 108,000 113,980Marvell Technology Group Ltd. (Semiconductors & Equip.) . . . . . . . . . . . . . . . . . . . . . . . . . . 4.875% 06/22/2028 358,000 395,118Micron Technology, Inc. (Semiconductors & Equip.) . . . . . . . . . . . . . . . . . . . . . . . . . . . . . . 4.975% 02/06/2026 114,000 126,455Micron Technology, Inc. (Semiconductors & Equip.) . . . . . . . . . . . . . . . . . . . . . . . . . . . . . . 5.327% 02/06/2029 293,000 335,809PayPal Holdings, Inc. (IT Svs.) . . . . . . . . . . . . . . . . . . . . . . . . . . . . . . . . . . . . . . . . . . . . 2.400% 10/01/2024 139,000 140,292PayPal Holdings, Inc. (IT Svs.) . . . . . . . . . . . . . . . . . . . . . . . . . . . . . . . . . . . . . . . . . . . . 2.650% 10/01/2026 416,000 421,371PayPal Holdings, Inc. (IT Svs.) . . . . . . . . . . . . . . . . . . . . . . . . . . . . . . . . . . . . . . . . . . . . 2.850% 10/01/2029 429,000 431,153Qorvo, Inc. (Semiconductors & Equip.) . . . . . . . . . . . . . . . . . . . . . . . . . . . . . . . . . . . . . . . 5.500% 07/15/2026 137,000 145,905Trimble, Inc. (Electronic Equip., Instr. & Comp.) . . . . . . . . . . . . . . . . . . . . . . . . . . . . . . . . . . 4.750% 12/01/2024 270,000 291,434Trimble, Inc. (Electronic Equip., Instr. & Comp.) . . . . . . . . . . . . . . . . . . . . . . . . . . . . . . . . . . 4.900% 06/15/2028 544,000 593,574
5,120,734
MATERIALS – 0.4%Allegheny Technologies, Inc. (Metals & Mining) . . . . . . . . . . . . . . . . . . . . . . . . . . . . . . . . . 5.875% 12/01/2027 250,000 262,500Ball Corp. (Containers & Packaging) . . . . . . . . . . . . . . . . . . . . . . . . . . . . . . . . . . . . . . . . 4.375% 12/15/2020 120,000 122,519Constellium SE (Metals & Mining) . . . . . . . . . . . . . . . . . . . . . . . . . . . . . . . . . . . . . . . . . . (b) 5.750% 05/15/2024 281,000 288,727Georgia-Pacific LLC (Paper & Forest Products) . . . . . . . . . . . . . . . . . . . . . . . . . . . . . . . . . (b) 3.163% 11/15/2021 99,000 100,841Hudbay Minerals, Inc. (Metals & Mining) . . . . . . . . . . . . . . . . . . . . . . . . . . . . . . . . . . . . . (b) 7.250% 01/15/2023 248,000 257,145Reliance Steel & Aluminum Co. (Metals & Mining) . . . . . . . . . . . . . . . . . . . . . . . . . . . . . . . 4.500% 04/15/2023 116,000 122,542Steel Dynamics, Inc. (Metals & Mining) . . . . . . . . . . . . . . . . . . . . . . . . . . . . . . . . . . . . . . 5.500% 10/01/2024 227,000 233,831WRKCo, Inc. (Containers & Packaging) . . . . . . . . . . . . . . . . . . . . . . . . . . . . . . . . . . . . . . 4.900% 03/15/2029 192,000 218,246
1,606,351
REAL ESTATE – 0.5%Crown Castle International Corp. (Equity REIT) . . . . . . . . . . . . . . . . . . . . . . . . . . . . . . . . . . 3.650% 09/01/2027 133,000 140,589Crown Castle International Corp. (Equity REIT) . . . . . . . . . . . . . . . . . . . . . . . . . . . . . . . . . . 4.300% 02/15/2029 154,000 170,457Crown Castle International Corp. (Equity REIT) . . . . . . . . . . . . . . . . . . . . . . . . . . . . . . . . . . 3.100% 11/15/2029 338,000 341,793CyrusOne LP / CyrusOne Finance Corp. (Equity REIT) . . . . . . . . . . . . . . . . . . . . . . . . . . . . . . 2.900% 11/15/2024 147,000 147,564CyrusOne LP / CyrusOne Finance Corp. (Equity REIT) . . . . . . . . . . . . . . . . . . . . . . . . . . . . . . 3.450% 11/15/2029 320,000 320,877Equinix, Inc. (Equity REIT) . . . . . . . . . . . . . . . . . . . . . . . . . . . . . . . . . . . . . . . . . . . . . . . 2.625% 11/18/2024 123,000 123,229Equinix, Inc. (Equity REIT) . . . . . . . . . . . . . . . . . . . . . . . . . . . . . . . . . . . . . . . . . . . . . . . 2.900% 11/18/2026 104,000 104,182Equinix, Inc. (Equity REIT) . . . . . . . . . . . . . . . . . . . . . . . . . . . . . . . . . . . . . . . . . . . . . . . 3.200% 11/18/2029 233,000 233,867Jones Lang LaSalle, Inc. (Real Estate Mgmt. & Development). . . . . . . . . . . . . . . . . . . . . . . . . 4.400% 11/15/2022 197,000 205,606
1,788,164
UTILITIES – 0.4%NRG Energy, Inc. (Ind. Power & Renewable Elec.) . . . . . . . . . . . . . . . . . . . . . . . . . . . . . . . . (b) 3.750% 06/15/2024 308,000 318,222NRG Energy, Inc. (Ind. Power & Renewable Elec.) . . . . . . . . . . . . . . . . . . . . . . . . . . . . . . . . 7.250% 05/15/2026 273,000 298,252NRG Energy, Inc. (Ind. Power & Renewable Elec.) . . . . . . . . . . . . . . . . . . . . . . . . . . . . . . . . 6.625% 01/15/2027 274,000 297,290Oncor Electric Delivery Co. LLC (Electric Utilities) . . . . . . . . . . . . . . . . . . . . . . . . . . . . . . . . 3.700% 11/15/2028 194,000 212,086Oncor Electric Delivery Co. LLC (Electric Utilities) . . . . . . . . . . . . . . . . . . . . . . . . . . . . . . . . 3.800% 06/01/2049 257,000 278,541PPL WEM Ltd. / Western Power Distribution Ltd. (Electric Utilities) . . . . . . . . . . . . . . . . . . . . . (b) 5.375% 05/01/2021 203,000 208,949Vistra Operations Co. LLC (Ind. Power & Renewable Elec.) . . . . . . . . . . . . . . . . . . . . . . . . . . (b) 5.500% 09/01/2026 114,000 120,840
1,734,180Total Corporate Bonds (Cost $44,217,911) . . . . . . . . . . . . . . . . . . . . . . . . . . . . . . . . . . . . . $ 46,759,808
U.S. Government Agency Mortgage-Backed Securities – 8.8% Rate Maturity Face Amount Value
Fannie Mae or Freddie Mac UMBS TBA . . . . . . . . . . . . . . . . . . . . . . . . . . . . . . . . . . . . . . . . . 2.500% 01/15/2035 $ 220,820 $ 222,686
Ohio National Fund, Inc. ON Risk Managed Balanced Portfolio (Continued)
Schedule of Investments December 31, 2019
109 (continued)

U.S. Government Agency Mortgage-Backed Securities (Continued) Rate Maturity Face Amount Value
Fannie Mae or Freddie Mac UMBS TBA . . . . . . . . . . . . . . . . . . . . . . . . . . . . . . . . . . . . . . . . . 3.500% 01/15/2050 $ 234,000 $ 240,587Fannie Mae or Freddie Mac UMBS TBA . . . . . . . . . . . . . . . . . . . . . . . . . . . . . . . . . . . . . . . . . 3.000% 01/15/2035 68,000 69,669Fannie Mae or Freddie Mac UMBS TBA . . . . . . . . . . . . . . . . . . . . . . . . . . . . . . . . . . . . . . . . . 3.500% 01/15/2035 493,000 510,930Fannie Mae or Freddie Mac UMBS TBA . . . . . . . . . . . . . . . . . . . . . . . . . . . . . . . . . . . . . . . . . 4.000% 01/15/2035 154,000 160,631Fannie Mae or Freddie Mac UMBS TBA . . . . . . . . . . . . . . . . . . . . . . . . . . . . . . . . . . . . . . . . . 3.000% 01/15/2050 2,400,752 2,433,282Fannie Mae Pool FN AB6548 . . . . . . . . . . . . . . . . . . . . . . . . . . . . . . . . . . . . . . . . . . . . . . . . 3.500% 10/01/2042 93,000 97,256Fannie Mae Pool FN AB7563 . . . . . . . . . . . . . . . . . . . . . . . . . . . . . . . . . . . . . . . . . . . . . . . . 3.000% 01/01/2043 21,091 21,724Fannie Mae Pool FN AB8407 . . . . . . . . . . . . . . . . . . . . . . . . . . . . . . . . . . . . . . . . . . . . . . . . 3.500% 02/01/2043 23,546 24,740Fannie Mae Pool FN AL3083 . . . . . . . . . . . . . . . . . . . . . . . . . . . . . . . . . . . . . . . . . . . . . . . . . 3.500% 12/01/2042 209,437 220,051Fannie Mae Pool FN AL5310 . . . . . . . . . . . . . . . . . . . . . . . . . . . . . . . . . . . . . . . . . . . . . . . . . 3.500% 04/01/2044 4,034 4,299Fannie Mae Pool FN AL5439 . . . . . . . . . . . . . . . . . . . . . . . . . . . . . . . . . . . . . . . . . . . . . . . . . 3.500% 11/01/2043 21,970 23,083Fannie Mae Pool FN AL5887 . . . . . . . . . . . . . . . . . . . . . . . . . . . . . . . . . . . . . . . . . . . . . . . . . 4.500% 10/01/2044 24,338 26,980Fannie Mae Pool FN AL5942 . . . . . . . . . . . . . . . . . . . . . . . . . . . . . . . . . . . . . . . . . . . . . . . . . 5.000% 07/01/2044 137,683 150,541Fannie Mae Pool FN AL6348 . . . . . . . . . . . . . . . . . . . . . . . . . . . . . . . . . . . . . . . . . . . . . . . . . 3.500% 02/01/2045 31,519 33,114Fannie Mae Pool FN AL6535 . . . . . . . . . . . . . . . . . . . . . . . . . . . . . . . . . . . . . . . . . . . . . . . . . 3.500% 02/01/2045 5,815 6,109Fannie Mae Pool FN AL6542 . . . . . . . . . . . . . . . . . . . . . . . . . . . . . . . . . . . . . . . . . . . . . . . . . 4.500% 03/01/2045 39,122 43,371Fannie Mae Pool FN AL6620 . . . . . . . . . . . . . . . . . . . . . . . . . . . . . . . . . . . . . . . . . . . . . . . . . 4.500% 08/01/2042 257,521 285,067Fannie Mae Pool FN AL6997 . . . . . . . . . . . . . . . . . . . . . . . . . . . . . . . . . . . . . . . . . . . . . . . . . 4.500% 11/01/2042 18,857 20,574Fannie Mae Pool FN AL7381 . . . . . . . . . . . . . . . . . . . . . . . . . . . . . . . . . . . . . . . . . . . . . . . . . 4.500% 06/01/2045 102,155 110,227Fannie Mae Pool FN AL8855 . . . . . . . . . . . . . . . . . . . . . . . . . . . . . . . . . . . . . . . . . . . . . . . . . 3.500% 07/01/2046 16,994 17,894Fannie Mae Pool FN AR2624. . . . . . . . . . . . . . . . . . . . . . . . . . . . . . . . . . . . . . . . . . . . . . . . . 3.500% 02/01/2043 36,687 38,541Fannie Mae Pool FN AS7168. . . . . . . . . . . . . . . . . . . . . . . . . . . . . . . . . . . . . . . . . . . . . . . . . 3.500% 05/01/2046 43,079 45,150Fannie Mae Pool FN AS7587. . . . . . . . . . . . . . . . . . . . . . . . . . . . . . . . . . . . . . . . . . . . . . . . . 3.500% 07/01/2046 187,279 198,037Fannie Mae Pool FN AS7822. . . . . . . . . . . . . . . . . . . . . . . . . . . . . . . . . . . . . . . . . . . . . . . . . 3.500% 08/01/2046 531,174 556,774Fannie Mae Pool FN AS9751. . . . . . . . . . . . . . . . . . . . . . . . . . . . . . . . . . . . . . . . . . . . . . . . . 4.000% 05/01/2047 46,737 49,221Fannie Mae Pool FN AT2957 . . . . . . . . . . . . . . . . . . . . . . . . . . . . . . . . . . . . . . . . . . . . . . . . . 3.000% 05/01/2043 29,266 30,101Fannie Mae Pool FN AZ9203. . . . . . . . . . . . . . . . . . . . . . . . . . . . . . . . . . . . . . . . . . . . . . . . . 3.000% 10/01/2045 69,676 70,970Fannie Mae Pool FN BA2885 . . . . . . . . . . . . . . . . . . . . . . . . . . . . . . . . . . . . . . . . . . . . . . . . 3.000% 10/01/2045 113,193 115,290Fannie Mae Pool FN BA4752 . . . . . . . . . . . . . . . . . . . . . . . . . . . . . . . . . . . . . . . . . . . . . . . . 3.000% 01/01/2046 15,210 15,493Fannie Mae Pool FN BC1520. . . . . . . . . . . . . . . . . . . . . . . . . . . . . . . . . . . . . . . . . . . . . . . . . 3.500% 08/01/2046 321,301 336,768Fannie Mae Pool FN BC2468. . . . . . . . . . . . . . . . . . . . . . . . . . . . . . . . . . . . . . . . . . . . . . . . . 3.000% 03/01/2046 289,996 295,372Fannie Mae Pool FN BC2488. . . . . . . . . . . . . . . . . . . . . . . . . . . . . . . . . . . . . . . . . . . . . . . . . 3.000% 03/01/2046 426,414 434,319Fannie Mae Pool FN BC9077. . . . . . . . . . . . . . . . . . . . . . . . . . . . . . . . . . . . . . . . . . . . . . . . . 3.500% 12/01/2046 22,191 23,261Fannie Mae Pool FN BD0667 . . . . . . . . . . . . . . . . . . . . . . . . . . . . . . . . . . . . . . . . . . . . . . . . 4.500% 06/01/2047 16,568 17,739Fannie Mae Pool FN BD6435 . . . . . . . . . . . . . . . . . . . . . . . . . . . . . . . . . . . . . . . . . . . . . . . . 4.000% 10/01/2046 7,430 7,943Fannie Mae Pool FN BD8952 . . . . . . . . . . . . . . . . . . . . . . . . . . . . . . . . . . . . . . . . . . . . . . . . 3.000% 11/01/2046 33,742 34,601Fannie Mae Pool FN BD8980 . . . . . . . . . . . . . . . . . . . . . . . . . . . . . . . . . . . . . . . . . . . . . . . . 3.000% 11/01/2046 33,928 34,792Fannie Mae Pool FN BE0637. . . . . . . . . . . . . . . . . . . . . . . . . . . . . . . . . . . . . . . . . . . . . . . . . 4.000% 07/01/2047 4,921 5,140Fannie Mae Pool FN BE0640. . . . . . . . . . . . . . . . . . . . . . . . . . . . . . . . . . . . . . . . . . . . . . . . . 4.500% 08/01/2047 10,002 10,572Fannie Mae Pool FN BE2717. . . . . . . . . . . . . . . . . . . . . . . . . . . . . . . . . . . . . . . . . . . . . . . . . 4.500% 07/01/2047 8,860 9,418Fannie Mae Pool FN BE2732. . . . . . . . . . . . . . . . . . . . . . . . . . . . . . . . . . . . . . . . . . . . . . . . . 4.000% 07/01/2047 21,632 22,754Fannie Mae Pool FN BE2733. . . . . . . . . . . . . . . . . . . . . . . . . . . . . . . . . . . . . . . . . . . . . . . . . 4.500% 07/01/2047 12,500 13,386Fannie Mae Pool FN BE2774. . . . . . . . . . . . . . . . . . . . . . . . . . . . . . . . . . . . . . . . . . . . . . . . . 4.000% 10/01/2047 53,473 56,240Fannie Mae Pool FN BE2784. . . . . . . . . . . . . . . . . . . . . . . . . . . . . . . . . . . . . . . . . . . . . . . . . 4.000% 11/01/2047 71,025 74,654Fannie Mae Pool FN BE2786. . . . . . . . . . . . . . . . . . . . . . . . . . . . . . . . . . . . . . . . . . . . . . . . . 4.500% 11/01/2047 53,817 57,175Fannie Mae Pool FN BF0130 . . . . . . . . . . . . . . . . . . . . . . . . . . . . . . . . . . . . . . . . . . . . . . . . . 3.500% 08/01/2056 320,713 337,280Fannie Mae Pool FN BF0167 . . . . . . . . . . . . . . . . . . . . . . . . . . . . . . . . . . . . . . . . . . . . . . . . . 3.000% 02/01/2057 281,500 289,175Fannie Mae Pool FN BF0168 . . . . . . . . . . . . . . . . . . . . . . . . . . . . . . . . . . . . . . . . . . . . . . . . . 3.500% 02/01/2057 458,068 481,730Fannie Mae Pool FN BH1902 . . . . . . . . . . . . . . . . . . . . . . . . . . . . . . . . . . . . . . . . . . . . . . . . 3.500% 12/01/2047 19,585 20,939Fannie Mae Pool FN BH3305 . . . . . . . . . . . . . . . . . . . . . . . . . . . . . . . . . . . . . . . . . . . . . . . . 4.500% 05/01/2047 26,631 28,990Fannie Mae Pool FN BH3306 . . . . . . . . . . . . . . . . . . . . . . . . . . . . . . . . . . . . . . . . . . . . . . . . 4.500% 05/01/2047 20,914 22,510Fannie Mae Pool FN BH3307 . . . . . . . . . . . . . . . . . . . . . . . . . . . . . . . . . . . . . . . . . . . . . . . . 4.500% 05/01/2047 21,394 22,972Fannie Mae Pool FN BH3336 . . . . . . . . . . . . . . . . . . . . . . . . . . . . . . . . . . . . . . . . . . . . . . . . 4.500% 05/01/2047 16,090 17,516Fannie Mae Pool FN BH3337 . . . . . . . . . . . . . . . . . . . . . . . . . . . . . . . . . . . . . . . . . . . . . . . . 4.500% 05/01/2047 12,768 13,743Fannie Mae Pool FN BH3338 . . . . . . . . . . . . . . . . . . . . . . . . . . . . . . . . . . . . . . . . . . . . . . . . 4.500% 05/01/2047 16,615 17,841Fannie Mae Pool FN BH3540 . . . . . . . . . . . . . . . . . . . . . . . . . . . . . . . . . . . . . . . . . . . . . . . . 4.000% 06/01/2047 5,711 6,019Fannie Mae Pool FN BH3892 . . . . . . . . . . . . . . . . . . . . . . . . . . . . . . . . . . . . . . . . . . . . . . . . 3.500% 08/01/2047 68,875 71,492Fannie Mae Pool FN BH4380 . . . . . . . . . . . . . . . . . . . . . . . . . . . . . . . . . . . . . . . . . . . . . . . . 4.000% 06/01/2047 12,427 13,058Fannie Mae Pool FN BH4639 . . . . . . . . . . . . . . . . . . . . . . . . . . . . . . . . . . . . . . . . . . . . . . . . 4.500% 06/01/2047 9,399 10,232Fannie Mae Pool FN BH4640 . . . . . . . . . . . . . . . . . . . . . . . . . . . . . . . . . . . . . . . . . . . . . . . . 4.500% 05/01/2047 8,144 8,766Fannie Mae Pool FN BH4667 . . . . . . . . . . . . . . . . . . . . . . . . . . . . . . . . . . . . . . . . . . . . . . . . 4.500% 05/01/2047 4,788 5,213Fannie Mae Pool FN BH4706 . . . . . . . . . . . . . . . . . . . . . . . . . . . . . . . . . . . . . . . . . . . . . . . . 4.500% 05/01/2047 4,426 4,687Fannie Mae Pool FN BH5672 . . . . . . . . . . . . . . . . . . . . . . . . . . . . . . . . . . . . . . . . . . . . . . . . 4.000% 06/01/2047 12,715 13,444Fannie Mae Pool FN BH5673 . . . . . . . . . . . . . . . . . . . . . . . . . . . . . . . . . . . . . . . . . . . . . . . . 4.000% 07/01/2047 7,551 7,879Fannie Mae Pool FN BH6165 . . . . . . . . . . . . . . . . . . . . . . . . . . . . . . . . . . . . . . . . . . . . . . . . 4.000% 07/01/2047 19,319 20,336Fannie Mae Pool FN BH6168 . . . . . . . . . . . . . . . . . . . . . . . . . . . . . . . . . . . . . . . . . . . . . . . . 4.000% 06/01/2047 26,446 27,824Fannie Mae Pool FN BH6170 . . . . . . . . . . . . . . . . . . . . . . . . . . . . . . . . . . . . . . . . . . . . . . . . 4.500% 07/01/2047 50,617 53,696Fannie Mae Pool FN BH6940 . . . . . . . . . . . . . . . . . . . . . . . . . . . . . . . . . . . . . . . . . . . . . . . . 3.500% 08/01/2047 46,743 48,983Fannie Mae Pool FN BH8168 . . . . . . . . . . . . . . . . . . . . . . . . . . . . . . . . . . . . . . . . . . . . . . . . 4.000% 08/01/2047 24,021 25,275Fannie Mae Pool FN BH8170 . . . . . . . . . . . . . . . . . . . . . . . . . . . . . . . . . . . . . . . . . . . . . . . . 4.000% 08/01/2047 39,176 41,225Fannie Mae Pool FN BH8171 . . . . . . . . . . . . . . . . . . . . . . . . . . . . . . . . . . . . . . . . . . . . . . . . 4.500% 08/01/2047 74,472 79,329
Ohio National Fund, Inc. ON Risk Managed Balanced Portfolio (Continued)
Schedule of Investments December 31, 2019
110 (continued)

U.S. Government Agency Mortgage-Backed Securities (Continued) Rate Maturity Face Amount Value
Fannie Mae Pool FN BH8224 . . . . . . . . . . . . . . . . . . . . . . . . . . . . . . . . . . . . . . . . . . . . . . . . 4.000% 08/01/2047 $ 116,502 $ 122,488Fannie Mae Pool FN BH9216 . . . . . . . . . . . . . . . . . . . . . . . . . . . . . . . . . . . . . . . . . . . . . . . . 4.000% 01/01/2048 81,750 87,157Fannie Mae Pool FN BJ0241. . . . . . . . . . . . . . . . . . . . . . . . . . . . . . . . . . . . . . . . . . . . . . . . . 4.000% 09/01/2047 11,552 12,153Fannie Mae Pool FN BJ1588. . . . . . . . . . . . . . . . . . . . . . . . . . . . . . . . . . . . . . . . . . . . . . . . . 4.000% 10/01/2047 24,191 25,427Fannie Mae Pool FN BJ1692. . . . . . . . . . . . . . . . . . . . . . . . . . . . . . . . . . . . . . . . . . . . . . . . . 3.500% 12/01/2047 111,339 117,109Fannie Mae Pool FN BJ1695. . . . . . . . . . . . . . . . . . . . . . . . . . . . . . . . . . . . . . . . . . . . . . . . . 3.500% 12/01/2047 19,977 20,854Fannie Mae Pool FN BJ1735. . . . . . . . . . . . . . . . . . . . . . . . . . . . . . . . . . . . . . . . . . . . . . . . . 4.000% 10/01/2047 48,834 51,334Fannie Mae Pool FN BJ1747. . . . . . . . . . . . . . . . . . . . . . . . . . . . . . . . . . . . . . . . . . . . . . . . . 4.000% 10/01/2047 30,821 32,436Fannie Mae Pool FN BJ1758. . . . . . . . . . . . . . . . . . . . . . . . . . . . . . . . . . . . . . . . . . . . . . . . . 4.000% 10/01/2047 48,991 51,477Fannie Mae Pool FN BJ3260. . . . . . . . . . . . . . . . . . . . . . . . . . . . . . . . . . . . . . . . . . . . . . . . . 4.500% 10/01/2047 4,828 5,143Fannie Mae Pool FN BJ3265. . . . . . . . . . . . . . . . . . . . . . . . . . . . . . . . . . . . . . . . . . . . . . . . . 4.000% 11/01/2047 19,847 20,848Fannie Mae Pool FN BJ4558. . . . . . . . . . . . . . . . . . . . . . . . . . . . . . . . . . . . . . . . . . . . . . . . . 3.500% 01/01/2048 79,012 83,263Fannie Mae Pool FN BJ4559. . . . . . . . . . . . . . . . . . . . . . . . . . . . . . . . . . . . . . . . . . . . . . . . . 3.500% 01/01/2048 29,454 30,987Fannie Mae Pool FN BJ4566. . . . . . . . . . . . . . . . . . . . . . . . . . . . . . . . . . . . . . . . . . . . . . . . . 4.000% 01/01/2048 272,521 288,180Fannie Mae Pool FN BJ4567. . . . . . . . . . . . . . . . . . . . . . . . . . . . . . . . . . . . . . . . . . . . . . . . . 4.000% 01/01/2048 461,759 488,108Fannie Mae Pool FN BJ5170. . . . . . . . . . . . . . . . . . . . . . . . . . . . . . . . . . . . . . . . . . . . . . . . . 3.500% 03/01/2048 16,692 17,761Fannie Mae Pool FN BJ5796. . . . . . . . . . . . . . . . . . . . . . . . . . . . . . . . . . . . . . . . . . . . . . . . . 4.500% 03/01/2048 89,776 95,507Fannie Mae Pool FN BJ5834. . . . . . . . . . . . . . . . . . . . . . . . . . . . . . . . . . . . . . . . . . . . . . . . . 4.500% 05/01/2048 56,762 60,619Fannie Mae Pool FN BJ5844. . . . . . . . . . . . . . . . . . . . . . . . . . . . . . . . . . . . . . . . . . . . . . . . . 4.500% 04/01/2048 78,499 84,037Fannie Mae Pool FN BJ7349. . . . . . . . . . . . . . . . . . . . . . . . . . . . . . . . . . . . . . . . . . . . . . . . . 4.000% 10/01/2048 21,645 22,953Fannie Mae Pool FN BK1964. . . . . . . . . . . . . . . . . . . . . . . . . . . . . . . . . . . . . . . . . . . . . . . . . 4.000% 03/01/2048 106,308 111,313Fannie Mae Pool FN BK1975. . . . . . . . . . . . . . . . . . . . . . . . . . . . . . . . . . . . . . . . . . . . . . . . . 3.500% 03/01/2048 48,658 51,135Fannie Mae Pool FN BK3211. . . . . . . . . . . . . . . . . . . . . . . . . . . . . . . . . . . . . . . . . . . . . . . . . 4.500% 03/01/2048 119,671 126,361Fannie Mae Pool FN BK3986. . . . . . . . . . . . . . . . . . . . . . . . . . . . . . . . . . . . . . . . . . . . . . . . . 4.500% 05/01/2048 56,693 60,097Fannie Mae Pool FN BK4039. . . . . . . . . . . . . . . . . . . . . . . . . . . . . . . . . . . . . . . . . . . . . . . . . 4.500% 06/01/2048 61,090 64,648Fannie Mae Pool FN BK4157. . . . . . . . . . . . . . . . . . . . . . . . . . . . . . . . . . . . . . . . . . . . . . . . . 4.000% 05/01/2048 285,843 299,480Fannie Mae Pool FN BK8767. . . . . . . . . . . . . . . . . . . . . . . . . . . . . . . . . . . . . . . . . . . . . . . . . 4.000% 09/01/2049 492,088 526,699Fannie Mae Pool FN BM3032 . . . . . . . . . . . . . . . . . . . . . . . . . . . . . . . . . . . . . . . . . . . . . . . . 3.000% 02/01/2047 586,923 604,256Fannie Mae Pool FN BM3144 . . . . . . . . . . . . . . . . . . . . . . . . . . . . . . . . . . . . . . . . . . . . . . . . 4.000% 11/01/2047 129,471 137,485Fannie Mae Pool FN BM3282 . . . . . . . . . . . . . . . . . . . . . . . . . . . . . . . . . . . . . . . . . . . . . . . . 3.500% 12/01/2047 9,713 10,406Fannie Mae Pool FN BM3511 . . . . . . . . . . . . . . . . . . . . . . . . . . . . . . . . . . . . . . . . . . . . . . . . 4.500% 02/01/2046 171,668 186,184Fannie Mae Pool FN BM3557 . . . . . . . . . . . . . . . . . . . . . . . . . . . . . . . . . . . . . . . . . . . . . . . . 4.000% 09/01/2047 265,458 288,640Fannie Mae Pool FN BM3912 . . . . . . . . . . . . . . . . . . . . . . . . . . . . . . . . . . . . . . . . . . . . . . . . 3.000% 03/01/2047 229,636 235,540Fannie Mae Pool FN BM4427 . . . . . . . . . . . . . . . . . . . . . . . . . . . . . . . . . . . . . . . . . . . . . . . . 3.500% 04/01/2048 169,320 177,355Fannie Mae Pool FN BM4735 . . . . . . . . . . . . . . . . . . . . . . . . . . . . . . . . . . . . . . . . . . . . . . . . 3.500% 04/01/2048 166,819 177,221Fannie Mae Pool FN BM4896 . . . . . . . . . . . . . . . . . . . . . . . . . . . . . . . . . . . . . . . . . . . . . . . . 3.000% 02/01/2047 1,740,067 1,790,313Fannie Mae Pool FN BM5138 . . . . . . . . . . . . . . . . . . . . . . . . . . . . . . . . . . . . . . . . . . . . . . . . 3.500% 11/01/2048 276,288 294,784Fannie Mae Pool FN BM5334 . . . . . . . . . . . . . . . . . . . . . . . . . . . . . . . . . . . . . . . . . . . . . . . . 3.500% 01/01/2049 102,774 107,500Fannie Mae Pool FN BN0012 . . . . . . . . . . . . . . . . . . . . . . . . . . . . . . . . . . . . . . . . . . . . . . . . 4.500% 08/01/2048 103,479 108,991Fannie Mae Pool FN BN4541 . . . . . . . . . . . . . . . . . . . . . . . . . . . . . . . . . . . . . . . . . . . . . . . . 4.000% 02/01/2049 105,843 110,131Fannie Mae Pool FN BN5286 . . . . . . . . . . . . . . . . . . . . . . . . . . . . . . . . . . . . . . . . . . . . . . . . 4.000% 02/01/2049 579,846 619,188Fannie Mae Pool FN BO2950 . . . . . . . . . . . . . . . . . . . . . . . . . . . . . . . . . . . . . . . . . . . . . . . . 3.000% 09/01/2049 35,762 36,410Fannie Mae Pool FN BO2968 . . . . . . . . . . . . . . . . . . . . . . . . . . . . . . . . . . . . . . . . . . . . . . . . 3.000% 09/01/2049 51,192 52,019Fannie Mae Pool FN BO3212 . . . . . . . . . . . . . . . . . . . . . . . . . . . . . . . . . . . . . . . . . . . . . . . . 2.500% 10/01/2034 132,857 134,477Fannie Mae Pool FN BO3223 . . . . . . . . . . . . . . . . . . . . . . . . . . . . . . . . . . . . . . . . . . . . . . . . 3.000% 10/01/2034 68,911 70,947Fannie Mae Pool FN BO4725 . . . . . . . . . . . . . . . . . . . . . . . . . . . . . . . . . . . . . . . . . . . . . . . . 2.500% 11/01/2034 72,951 73,908Fannie Mae Pool FN BO8905 . . . . . . . . . . . . . . . . . . . . . . . . . . . . . . . . . . . . . . . . . . . . . . . . 3.000% 01/01/2050 183,497 186,130Fannie Mae Pool FN CA0108. . . . . . . . . . . . . . . . . . . . . . . . . . . . . . . . . . . . . . . . . . . . . . . . . 3.500% 08/01/2047 34,672 37,144Fannie Mae Pool FN CA4249. . . . . . . . . . . . . . . . . . . . . . . . . . . . . . . . . . . . . . . . . . . . . . . . . 3.000% 10/01/2049 719,625 730,452Fannie Mae Pool FN FM0029 . . . . . . . . . . . . . . . . . . . . . . . . . . . . . . . . . . . . . . . . . . . . . . . . 3.000% 09/01/2046 410,739 422,702Fannie Mae Pool FN FM1439 . . . . . . . . . . . . . . . . . . . . . . . . . . . . . . . . . . . . . . . . . . . . . . . . 4.000% 05/01/2049 449,366 480,624Fannie Mae Pool FN FM1689 . . . . . . . . . . . . . . . . . . . . . . . . . . . . . . . . . . . . . . . . . . . . . . . . 3.500% 07/01/2049 52,135 53,749Fannie Mae Pool FN MA1363 . . . . . . . . . . . . . . . . . . . . . . . . . . . . . . . . . . . . . . . . . . . . . . . . 3.000% 02/01/2043 7,453 7,665Fannie Mae Pool FN MA1404 . . . . . . . . . . . . . . . . . . . . . . . . . . . . . . . . . . . . . . . . . . . . . . . . 3.500% 04/01/2043 120,491 126,601Fannie Mae Pool FN MA3239 . . . . . . . . . . . . . . . . . . . . . . . . . . . . . . . . . . . . . . . . . . . . . . . . 4.000% 01/01/2048 28,868 30,293Fannie Mae Pool FN MA3896 . . . . . . . . . . . . . . . . . . . . . . . . . . . . . . . . . . . . . . . . . . . . . . . . 2.500% 01/01/2035 230,864 232,822Freddie Mac Gold Pool FG G60658 . . . . . . . . . . . . . . . . . . . . . . . . . . . . . . . . . . . . . . . . . . . . . 3.500% 07/01/2046 359,823 383,106Freddie Mac Gold Pool FG G61360 . . . . . . . . . . . . . . . . . . . . . . . . . . . . . . . . . . . . . . . . . . . . . 3.500% 03/01/2048 84,247 88,456Freddie Mac Gold Pool FG G61596 . . . . . . . . . . . . . . . . . . . . . . . . . . . . . . . . . . . . . . . . . . . . . 3.500% 08/01/2048 319,193 334,944Freddie Mac Gold Pool FG G61737 . . . . . . . . . . . . . . . . . . . . . . . . . . . . . . . . . . . . . . . . . . . . . 3.500% 11/01/2048 404,374 424,989Freddie Mac Gold Pool FG J33776 . . . . . . . . . . . . . . . . . . . . . . . . . . . . . . . . . . . . . . . . . . . . . 3.000% 02/01/2031 94,929 97,765Freddie Mac Gold Pool FG Q54793 . . . . . . . . . . . . . . . . . . . . . . . . . . . . . . . . . . . . . . . . . . . . . 4.500% 03/01/2048 105,103 110,932Freddie Mac Gold Pool FG Q55394 . . . . . . . . . . . . . . . . . . . . . . . . . . . . . . . . . . . . . . . . . . . . . 3.500% 04/01/2048 29,097 30,563Freddie Mac Gold Pool FG Q58159 . . . . . . . . . . . . . . . . . . . . . . . . . . . . . . . . . . . . . . . . . . . . . 5.000% 09/01/2048 25,066 26,875Freddie Mac Gold Pool FG Q60839 . . . . . . . . . . . . . . . . . . . . . . . . . . . . . . . . . . . . . . . . . . . . . 4.000% 01/01/2049 117,832 127,479Freddie Mac Gold Pool FG U99096 . . . . . . . . . . . . . . . . . . . . . . . . . . . . . . . . . . . . . . . . . . . . . 4.500% 05/01/2044 99,845 107,748Freddie Mac Pool FR QA2215 . . . . . . . . . . . . . . . . . . . . . . . . . . . . . . . . . . . . . . . . . . . . . . . . 3.500% 08/01/2049 232,029 239,170Freddie Mac Pool FR QA2276 . . . . . . . . . . . . . . . . . . . . . . . . . . . . . . . . . . . . . . . . . . . . . . . . 3.500% 09/01/2049 99,557 103,997Freddie Mac Pool FR QA2550 . . . . . . . . . . . . . . . . . . . . . . . . . . . . . . . . . . . . . . . . . . . . . . . . 3.500% 09/01/2049 152,561 157,552Freddie Mac Pool FR QA3092 . . . . . . . . . . . . . . . . . . . . . . . . . . . . . . . . . . . . . . . . . . . . . . . . 3.000% 09/01/2049 31,390 31,881Freddie Mac Pool FR QA3225 . . . . . . . . . . . . . . . . . . . . . . . . . . . . . . . . . . . . . . . . . . . . . . . . 3.000% 10/01/2049 44,138 44,803
Ohio National Fund, Inc. ON Risk Managed Balanced Portfolio (Continued)
Schedule of Investments December 31, 2019
111 (continued)
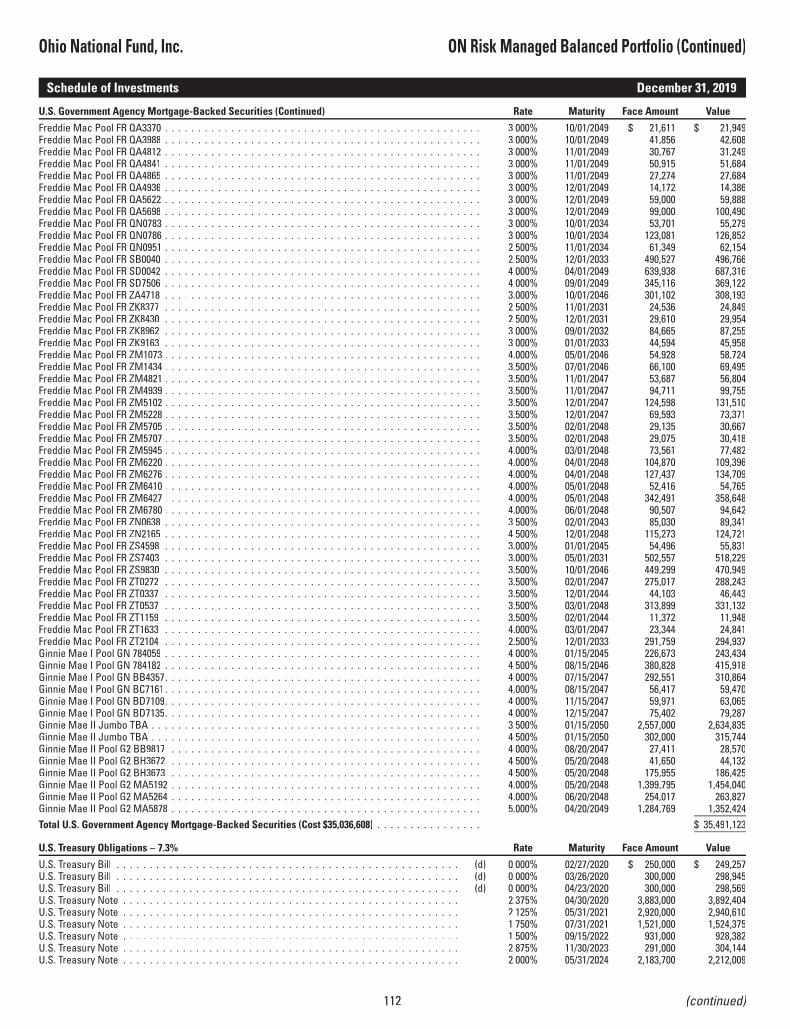
U.S. Government Agency Mortgage-Backed Securities (Continued) Rate Maturity Face Amount Value
Freddie Mac Pool FR QA3370 . . . . . . . . . . . . . . . . . . . . . . . . . . . . . . . . . . . . . . . . . . . . . . . . 3.000% 10/01/2049 $ 21,611 $ 21,949Freddie Mac Pool FR QA3988 . . . . . . . . . . . . . . . . . . . . . . . . . . . . . . . . . . . . . . . . . . . . . . . . 3.000% 10/01/2049 41,856 42,608Freddie Mac Pool FR QA4812 . . . . . . . . . . . . . . . . . . . . . . . . . . . . . . . . . . . . . . . . . . . . . . . . 3.000% 11/01/2049 30,767 31,249Freddie Mac Pool FR QA4841 . . . . . . . . . . . . . . . . . . . . . . . . . . . . . . . . . . . . . . . . . . . . . . . . 3.000% 11/01/2049 50,915 51,684Freddie Mac Pool FR QA4865 . . . . . . . . . . . . . . . . . . . . . . . . . . . . . . . . . . . . . . . . . . . . . . . . 3.000% 11/01/2049 27,274 27,684Freddie Mac Pool FR QA4936 . . . . . . . . . . . . . . . . . . . . . . . . . . . . . . . . . . . . . . . . . . . . . . . . 3.000% 12/01/2049 14,172 14,386Freddie Mac Pool FR QA5622 . . . . . . . . . . . . . . . . . . . . . . . . . . . . . . . . . . . . . . . . . . . . . . . . 3.000% 12/01/2049 59,000 59,888Freddie Mac Pool FR QA5698 . . . . . . . . . . . . . . . . . . . . . . . . . . . . . . . . . . . . . . . . . . . . . . . . 3.000% 12/01/2049 99,000 100,490Freddie Mac Pool FR QN0783 . . . . . . . . . . . . . . . . . . . . . . . . . . . . . . . . . . . . . . . . . . . . . . . . 3.000% 10/01/2034 53,701 55,279Freddie Mac Pool FR QN0786 . . . . . . . . . . . . . . . . . . . . . . . . . . . . . . . . . . . . . . . . . . . . . . . . 3.000% 10/01/2034 123,081 126,852Freddie Mac Pool FR QN0951 . . . . . . . . . . . . . . . . . . . . . . . . . . . . . . . . . . . . . . . . . . . . . . . . 2.500% 11/01/2034 61,349 62,154Freddie Mac Pool FR SB0040 . . . . . . . . . . . . . . . . . . . . . . . . . . . . . . . . . . . . . . . . . . . . . . . . 2.500% 12/01/2033 490,527 496,766Freddie Mac Pool FR SD0042 . . . . . . . . . . . . . . . . . . . . . . . . . . . . . . . . . . . . . . . . . . . . . . . . 4.000% 04/01/2049 639,938 687,316Freddie Mac Pool FR SD7506 . . . . . . . . . . . . . . . . . . . . . . . . . . . . . . . . . . . . . . . . . . . . . . . . 4.000% 09/01/2049 345,116 369,122Freddie Mac Pool FR ZA4718 . . . . . . . . . . . . . . . . . . . . . . . . . . . . . . . . . . . . . . . . . . . . . . . . 3.000% 10/01/2046 301,102 308,193Freddie Mac Pool FR ZK8377 . . . . . . . . . . . . . . . . . . . . . . . . . . . . . . . . . . . . . . . . . . . . . . . . 2.500% 11/01/2031 24,536 24,849Freddie Mac Pool FR ZK8430 . . . . . . . . . . . . . . . . . . . . . . . . . . . . . . . . . . . . . . . . . . . . . . . . 2.500% 12/01/2031 29,610 29,954Freddie Mac Pool FR ZK8962 . . . . . . . . . . . . . . . . . . . . . . . . . . . . . . . . . . . . . . . . . . . . . . . . 3.000% 09/01/2032 84,665 87,255Freddie Mac Pool FR ZK9163 . . . . . . . . . . . . . . . . . . . . . . . . . . . . . . . . . . . . . . . . . . . . . . . . 3.000% 01/01/2033 44,594 45,958Freddie Mac Pool FR ZM1073 . . . . . . . . . . . . . . . . . . . . . . . . . . . . . . . . . . . . . . . . . . . . . . . . 4.000% 05/01/2046 54,928 58,724Freddie Mac Pool FR ZM1434 . . . . . . . . . . . . . . . . . . . . . . . . . . . . . . . . . . . . . . . . . . . . . . . . 3.500% 07/01/2046 66,100 69,495Freddie Mac Pool FR ZM4821 . . . . . . . . . . . . . . . . . . . . . . . . . . . . . . . . . . . . . . . . . . . . . . . . 3.500% 11/01/2047 53,687 56,804Freddie Mac Pool FR ZM4939 . . . . . . . . . . . . . . . . . . . . . . . . . . . . . . . . . . . . . . . . . . . . . . . . 3.500% 11/01/2047 94,711 99,755Freddie Mac Pool FR ZM5102 . . . . . . . . . . . . . . . . . . . . . . . . . . . . . . . . . . . . . . . . . . . . . . . . 3.500% 12/01/2047 124,598 131,510Freddie Mac Pool FR ZM5228 . . . . . . . . . . . . . . . . . . . . . . . . . . . . . . . . . . . . . . . . . . . . . . . . 3.500% 12/01/2047 69,593 73,371Freddie Mac Pool FR ZM5705 . . . . . . . . . . . . . . . . . . . . . . . . . . . . . . . . . . . . . . . . . . . . . . . . 3.500% 02/01/2048 29,135 30,667Freddie Mac Pool FR ZM5707 . . . . . . . . . . . . . . . . . . . . . . . . . . . . . . . . . . . . . . . . . . . . . . . . 3.500% 02/01/2048 29,075 30,418Freddie Mac Pool FR ZM5945 . . . . . . . . . . . . . . . . . . . . . . . . . . . . . . . . . . . . . . . . . . . . . . . . 4.000% 03/01/2048 73,561 77,482Freddie Mac Pool FR ZM6220 . . . . . . . . . . . . . . . . . . . . . . . . . . . . . . . . . . . . . . . . . . . . . . . . 4.000% 04/01/2048 104,870 109,396Freddie Mac Pool FR ZM6276 . . . . . . . . . . . . . . . . . . . . . . . . . . . . . . . . . . . . . . . . . . . . . . . . 4.000% 04/01/2048 127,437 134,709Freddie Mac Pool FR ZM6410 . . . . . . . . . . . . . . . . . . . . . . . . . . . . . . . . . . . . . . . . . . . . . . . . 4.000% 05/01/2048 52,416 54,765Freddie Mac Pool FR ZM6427 . . . . . . . . . . . . . . . . . . . . . . . . . . . . . . . . . . . . . . . . . . . . . . . . 4.000% 05/01/2048 342,491 358,648Freddie Mac Pool FR ZM6780 . . . . . . . . . . . . . . . . . . . . . . . . . . . . . . . . . . . . . . . . . . . . . . . . 4.000% 06/01/2048 90,507 94,642Freddie Mac Pool FR ZN0638 . . . . . . . . . . . . . . . . . . . . . . . . . . . . . . . . . . . . . . . . . . . . . . . . 3.500% 02/01/2043 85,030 89,341Freddie Mac Pool FR ZN2165 . . . . . . . . . . . . . . . . . . . . . . . . . . . . . . . . . . . . . . . . . . . . . . . . 4.500% 12/01/2048 115,273 124,721Freddie Mac Pool FR ZS4598 . . . . . . . . . . . . . . . . . . . . . . . . . . . . . . . . . . . . . . . . . . . . . . . . 3.000% 01/01/2045 54,496 55,831Freddie Mac Pool FR ZS7403 . . . . . . . . . . . . . . . . . . . . . . . . . . . . . . . . . . . . . . . . . . . . . . . . 3.000% 05/01/2031 502,557 518,229Freddie Mac Pool FR ZS9830 . . . . . . . . . . . . . . . . . . . . . . . . . . . . . . . . . . . . . . . . . . . . . . . . 3.500% 10/01/2046 449,299 470,949Freddie Mac Pool FR ZT0272 . . . . . . . . . . . . . . . . . . . . . . . . . . . . . . . . . . . . . . . . . . . . . . . . 3.500% 02/01/2047 275,017 288,243Freddie Mac Pool FR ZT0337 . . . . . . . . . . . . . . . . . . . . . . . . . . . . . . . . . . . . . . . . . . . . . . . . 3.500% 12/01/2044 44,103 46,443Freddie Mac Pool FR ZT0537 . . . . . . . . . . . . . . . . . . . . . . . . . . . . . . . . . . . . . . . . . . . . . . . . 3.500% 03/01/2048 313,899 331,132Freddie Mac Pool FR ZT1159 . . . . . . . . . . . . . . . . . . . . . . . . . . . . . . . . . . . . . . . . . . . . . . . . 3.500% 02/01/2044 11,372 11,948Freddie Mac Pool FR ZT1633 . . . . . . . . . . . . . . . . . . . . . . . . . . . . . . . . . . . . . . . . . . . . . . . . 4.000% 03/01/2047 23,344 24,841Freddie Mac Pool FR ZT2104 . . . . . . . . . . . . . . . . . . . . . . . . . . . . . . . . . . . . . . . . . . . . . . . . 2.500% 12/01/2033 291,759 294,937Ginnie Mae I Pool GN 784059 . . . . . . . . . . . . . . . . . . . . . . . . . . . . . . . . . . . . . . . . . . . . . . . . 4.000% 01/15/2045 226,673 243,434Ginnie Mae I Pool GN 784182 . . . . . . . . . . . . . . . . . . . . . . . . . . . . . . . . . . . . . . . . . . . . . . . . 4.500% 08/15/2046 380,828 415,918Ginnie Mae I Pool GN BB4357. . . . . . . . . . . . . . . . . . . . . . . . . . . . . . . . . . . . . . . . . . . . . . . . 4.000% 07/15/2047 292,551 310,864Ginnie Mae I Pool GN BC7161 . . . . . . . . . . . . . . . . . . . . . . . . . . . . . . . . . . . . . . . . . . . . . . . . 4.000% 08/15/2047 56,417 59,470Ginnie Mae I Pool GN BD7109. . . . . . . . . . . . . . . . . . . . . . . . . . . . . . . . . . . . . . . . . . . . . . . . 4.000% 11/15/2047 59,971 63,065Ginnie Mae I Pool GN BD7135. . . . . . . . . . . . . . . . . . . . . . . . . . . . . . . . . . . . . . . . . . . . . . . . 4.000% 12/15/2047 75,402 79,287Ginnie Mae II Jumbo TBA . . . . . . . . . . . . . . . . . . . . . . . . . . . . . . . . . . . . . . . . . . . . . . . . . . 3.500% 01/15/2050 2,557,000 2,634,835Ginnie Mae II Jumbo TBA . . . . . . . . . . . . . . . . . . . . . . . . . . . . . . . . . . . . . . . . . . . . . . . . . . 4.500% 01/15/2050 302,000 315,744Ginnie Mae II Pool G2 BB9817 . . . . . . . . . . . . . . . . . . . . . . . . . . . . . . . . . . . . . . . . . . . . . . . 4.000% 08/20/2047 27,411 28,570Ginnie Mae II Pool G2 BH3672 . . . . . . . . . . . . . . . . . . . . . . . . . . . . . . . . . . . . . . . . . . . . . . . 4.500% 05/20/2048 41,650 44,132Ginnie Mae II Pool G2 BH3673 . . . . . . . . . . . . . . . . . . . . . . . . . . . . . . . . . . . . . . . . . . . . . . . 4.500% 05/20/2048 175,955 186,425Ginnie Mae II Pool G2 MA5192 . . . . . . . . . . . . . . . . . . . . . . . . . . . . . . . . . . . . . . . . . . . . . . . 4.000% 05/20/2048 1,399,795 1,454,040Ginnie Mae II Pool G2 MA5264 . . . . . . . . . . . . . . . . . . . . . . . . . . . . . . . . . . . . . . . . . . . . . . . 4.000% 06/20/2048 254,017 263,827Ginnie Mae II Pool G2 MA5878 . . . . . . . . . . . . . . . . . . . . . . . . . . . . . . . . . . . . . . . . . . . . . . . 5.000% 04/20/2049 1,284,769 1,352,424Total U.S. Government Agency Mortgage-Backed Securities (Cost $35,036,608) . . . . . . . . . . . . . . . . $ 35,491,123
U.S. Treasury Obligations – 7.3% Rate Maturity Face Amount Value
U.S. Treasury Bill . . . . . . . . . . . . . . . . . . . . . . . . . . . . . . . . . . . . . . . . . . . . . . . . . . . . (d) 0.000% 02/27/2020 $ 250,000 $ 249,257U.S. Treasury Bill . . . . . . . . . . . . . . . . . . . . . . . . . . . . . . . . . . . . . . . . . . . . . . . . . . . . (d) 0.000% 03/26/2020 300,000 298,945U.S. Treasury Bill . . . . . . . . . . . . . . . . . . . . . . . . . . . . . . . . . . . . . . . . . . . . . . . . . . . . (d) 0.000% 04/23/2020 300,000 298,569U.S. Treasury Note . . . . . . . . . . . . . . . . . . . . . . . . . . . . . . . . . . . . . . . . . . . . . . . . . . . 2.375% 04/30/2020 3,883,000 3,892,404U.S. Treasury Note . . . . . . . . . . . . . . . . . . . . . . . . . . . . . . . . . . . . . . . . . . . . . . . . . . . 2.125% 05/31/2021 2,920,000 2,940,610U.S. Treasury Note . . . . . . . . . . . . . . . . . . . . . . . . . . . . . . . . . . . . . . . . . . . . . . . . . . . 1.750% 07/31/2021 1,521,000 1,524,375U.S. Treasury Note . . . . . . . . . . . . . . . . . . . . . . . . . . . . . . . . . . . . . . . . . . . . . . . . . . . 1.500% 09/15/2022 931,000 928,382U.S. Treasury Note . . . . . . . . . . . . . . . . . . . . . . . . . . . . . . . . . . . . . . . . . . . . . . . . . . . 2.875% 11/30/2023 291,000 304,144U.S. Treasury Note . . . . . . . . . . . . . . . . . . . . . . . . . . . . . . . . . . . . . . . . . . . . . . . . . . . 2.000% 05/31/2024 2,183,700 2,212,009
Ohio National Fund, Inc. ON Risk Managed Balanced Portfolio (Continued)
Schedule of Investments December 31, 2019
112 (continued)

U.S. Treasury Obligations (Continued) Rate Maturity Face Amount Value
U.S. Treasury Note . . . . . . . . . . . . . . . . . . . . . . . . . . . . . . . . . . . . . . . . . . . . . . . . . . . 1.750% 07/31/2024 $ 5,622,900 $ 5,635,675U.S. Treasury Note . . . . . . . . . . . . . . . . . . . . . . . . . . . . . . . . . . . . . . . . . . . . . . . . . . . (d) 2.250% 11/15/2024 1,865,000 1,912,065U.S. Treasury Note . . . . . . . . . . . . . . . . . . . . . . . . . . . . . . . . . . . . . . . . . . . . . . . . . . . 1.625% 02/15/2026 308,000 304,948U.S. Treasury Note . . . . . . . . . . . . . . . . . . . . . . . . . . . . . . . . . . . . . . . . . . . . . . . . . . . 1.375% 08/31/2026 93,000 90,362U.S. Treasury Note . . . . . . . . . . . . . . . . . . . . . . . . . . . . . . . . . . . . . . . . . . . . . . . . . . . 1.625% 10/31/2026 271,000 267,300U.S. Treasury Note . . . . . . . . . . . . . . . . . . . . . . . . . . . . . . . . . . . . . . . . . . . . . . . . . . . 2.375% 05/15/2029 2,134,400 2,216,736U.S. Treasury Note . . . . . . . . . . . . . . . . . . . . . . . . . . . . . . . . . . . . . . . . . . . . . . . . . . . 1.625% 08/15/2029 1,597,700 1,555,235U.S. Treasury Note . . . . . . . . . . . . . . . . . . . . . . . . . . . . . . . . . . . . . . . . . . . . . . . . . . . 3.000% 02/15/2049 69,000 77,752U.S. Treasury Note . . . . . . . . . . . . . . . . . . . . . . . . . . . . . . . . . . . . . . . . . . . . . . . . . . . 2.875% 05/15/2049 31,000 34,131U.S. Treasury Note . . . . . . . . . . . . . . . . . . . . . . . . . . . . . . . . . . . . . . . . . . . . . . . . . . . 2.250% 08/15/2049 5,059,400 4,902,084Total U.S. Treasury Obligations (Cost $29,742,714) . . . . . . . . . . . . . . . . . . . . . . . . . . . . . . . . $ 29,644,983
Purchased Options – 7.1%NotionalAmount Expiration Exercise Price Contracts (e) Value
S&P 500 Index Call Option. . . . . . . . . . . . . . . . . . . . . . . . . . . . $32,307,800 December 2021 $2,800 100 $ 5,636,000S&P 500 Index Call Option. . . . . . . . . . . . . . . . . . . . . . . . . . . . 14,538,510 December 2021 $2,850 45 2,375,100S&P 500 Index Call Option. . . . . . . . . . . . . . . . . . . . . . . . . . . . 27,461,630 December 2021 $2,900 85 4,189,650S&P 500 Index Call Option. . . . . . . . . . . . . . . . . . . . . . . . . . . . 14,538,510 December 2021 $3,000 45 1,911,600S&P 500 Index Call Option. . . . . . . . . . . . . . . . . . . . . . . . . . . . 11,307,730 December 2021 $3,050 35 1,375,150S&P 500 Index Call Option. . . . . . . . . . . . . . . . . . . . . . . . . . . . 8,076,950 December 2021 $3,100 25 901,250S&P 500 Index Call Option. . . . . . . . . . . . . . . . . . . . . . . . . . . . 4,846,170 December 2021 $3,150 15 494,400S&P 500 Index Call Option. . . . . . . . . . . . . . . . . . . . . . . . . . . . 3,230,780 December 2021 $3,200 10 300,000S&P 500 Index Call Option. . . . . . . . . . . . . . . . . . . . . . . . . . . . 3,230,780 December 2021 $3,250 10 273,500S&P 500 Index Call Option. . . . . . . . . . . . . . . . . . . . . . . . . . . . 1,615,390 December 2021 $3,300 5 121,550S&P 500 Index Put Option . . . . . . . . . . . . . . . . . . . . . . . . . . . . 32,307,800 December 2021 $2,800 100 1,488,000S&P 500 Index Put Option . . . . . . . . . . . . . . . . . . . . . . . . . . . . 14,538,510 December 2021 $2,850 45 771,300S&P 500 Index Put Option . . . . . . . . . . . . . . . . . . . . . . . . . . . . 27,461,630 December 2021 $2,900 85 1,484,100S&P 500 Index Put Option . . . . . . . . . . . . . . . . . . . . . . . . . . . . 14,538,510 December 2021 $3,000 45 908,100S&P 500 Index Put Option . . . . . . . . . . . . . . . . . . . . . . . . . . . . 11,307,730 December 2021 $3,050 35 800,520S&P 500 Index Put Option . . . . . . . . . . . . . . . . . . . . . . . . . . . . 8,076,950 December 2021 $3,100 25 618,600S&P 500 Index Put Option . . . . . . . . . . . . . . . . . . . . . . . . . . . . 4,846,170 December 2021 $3,150 15 397,500S&P 500 Index Put Option . . . . . . . . . . . . . . . . . . . . . . . . . . . . 3,230,780 December 2021 $3,200 10 280,000S&P 500 Index Put Option . . . . . . . . . . . . . . . . . . . . . . . . . . . . 3,230,780 December 2021 $3,250 10 288,400S&P 500 Index Put Option . . . . . . . . . . . . . . . . . . . . . . . . . . . . 1,615,390 December 2021 $3,300 5 154,600SPDR S&P 500 ETF Trust Call Option . . . . . . . . . . . . . . . . . . . . . 1,609,300 December 2021 $280 50 284,850SPDR S&P 500 ETF Trust Call Option . . . . . . . . . . . . . . . . . . . . . 2,413,950 December 2021 $285 75 400,425SPDR S&P 500 ETF Trust Call Option . . . . . . . . . . . . . . . . . . . . . 2,735,810 December 2021 $290 85 423,980SPDR S&P 500 ETF Trust Call Option . . . . . . . . . . . . . . . . . . . . . 2,381,764 December 2021 $295 74 343,730SPDR S&P 500 ETF Trust Call Option . . . . . . . . . . . . . . . . . . . . . 8,239,616 December 2021 $300 256 1,133,568SPDR S&P 500 ETF Trust Call Option . . . . . . . . . . . . . . . . . . . . . 965,580 December 2021 $305 30 119,520SPDR S&P 500 ETF Trust Call Option . . . . . . . . . . . . . . . . . . . . . 965,580 December 2021 $310 30 106,050SPDR S&P 500 ETF Trust Put Option. . . . . . . . . . . . . . . . . . . . . . 1,609,300 December 2021 $280 50 80,750SPDR S&P 500 ETF Trust Put Option. . . . . . . . . . . . . . . . . . . . . . 2,413,950 December 2021 $285 75 129,600SPDR S&P 500 ETF Trust Put Option. . . . . . . . . . . . . . . . . . . . . . 2,735,810 December 2021 $290 85 157,505SPDR S&P 500 ETF Trust Put Option. . . . . . . . . . . . . . . . . . . . . . 2,381,764 December 2021 $295 74 147,260SPDR S&P 500 ETF Trust Put Option. . . . . . . . . . . . . . . . . . . . . . 8,239,616 December 2021 $300 256 561,152SPDR S&P 500 ETF Trust Put Option. . . . . . . . . . . . . . . . . . . . . . 965,580 December 2021 $305 30 69,900SPDR S&P 500 ETF Trust Put Option. . . . . . . . . . . . . . . . . . . . . . 965,580 December 2021 $310 30 74,550Total Purchased Options (Cost $25,545,540) . . . . . . . . . . . . . . . . . $ 28,802,160
Asset-Backed / Mortgage-Backed Securities – 2.3% Rate MaturityFace
Amount Value
CONSUMER DISCRETIONARY – 0.7%Applebee’s Funding LLC / IHOP Funding LLC 2019-1A A2I . . . . . . . . . . . . . . . . . . . . . . . . . . . (b) 4.194% 06/07/2049 $ 248,000 $ 251,413DB Master Finance LLC 2019-1A A23 . . . . . . . . . . . . . . . . . . . . . . . . . . . . . . . . . . . . . . . . (b) 4.352% 05/20/2049 90,545 93,807DB Master Finance LLC 2019-1A A2I . . . . . . . . . . . . . . . . . . . . . . . . . . . . . . . . . . . . . . . . (b) 3.787% 05/20/2049 113,430 115,852DB Master Finance LLC 2019-1A A2II . . . . . . . . . . . . . . . . . . . . . . . . . . . . . . . . . . . . . . . (b) 4.021% 05/20/2049 49,750 50,969Domino’s Pizza Master Issuer LLC 2017-1A A23 . . . . . . . . . . . . . . . . . . . . . . . . . . . . . . . . . (b) 4.118% 07/25/2047 49,980 51,771Domino’s Pizza Master Issuer LLC 2017-1A A2II . . . . . . . . . . . . . . . . . . . . . . . . . . . . . . . . . (b) 3.082% 07/25/2047 57,820 57,866Domino’s Pizza Master Issuer LLC 2018-1A A2I . . . . . . . . . . . . . . . . . . . . . . . . . . . . . . . . . (b) 4.116% 07/25/2048 229,100 235,611Domino’s Pizza Master Issuer LLC 2018-1A A2II . . . . . . . . . . . . . . . . . . . . . . . . . . . . . . . . . (b) 4.328% 07/25/2048 34,563 35,995Domino’s Pizza Master Issuer LLC 2019-1A A2 . . . . . . . . . . . . . . . . . . . . . . . . . . . . . . . . . . (b) 3.668% 10/25/2049 406,000 406,069Great Wolf Trust 2019-WOLF A . . . . . . . . . . . . . . . . . . . . . . . . . . . . . . . . . . . . . . . . . . . . (b) ML + 103 12/15/2036 64,000 63,737Great Wolf Trust 2019-WOLF B . . . . . . . . . . . . . . . . . . . . . . . . . . . . . . . . . . . . . . . . . . . . (b) ML + 133 12/15/2036 72,000 71,864Great Wolf Trust 2019-WOLF C . . . . . . . . . . . . . . . . . . . . . . . . . . . . . . . . . . . . . . . . . . . . (b) ML + 163 12/15/2036 79,000 78,874Great Wolf Trust 2019-WOLF D . . . . . . . . . . . . . . . . . . . . . . . . . . . . . . . . . . . . . . . . . . . . (b) ML + 193 12/15/2036 60,000 59,904Jack in the Box Funding LLC 2019-1A A23 . . . . . . . . . . . . . . . . . . . . . . . . . . . . . . . . . . . . . (b) 4.970% 08/25/2049 240,000 242,078Jack in the Box Funding LLC 2019-1A A2I . . . . . . . . . . . . . . . . . . . . . . . . . . . . . . . . . . . . . (b) 3.982% 08/25/2049 240,000 241,769Jack in the Box Funding LLC 2019-1A A2II . . . . . . . . . . . . . . . . . . . . . . . . . . . . . . . . . . . . . (b) 4.476% 08/25/2049 240,000 241,841
Ohio National Fund, Inc. ON Risk Managed Balanced Portfolio (Continued)
Schedule of Investments December 31, 2019
113 (continued)

Asset-Backed / Mortgage-Backed Securities (Continued) Rate MaturityFace
Amount Value
CONSUMER DISCRETIONARY (continued)Planet Fitness Master Issuer LLC 2019-1A A2 . . . . . . . . . . . . . . . . . . . . . . . . . . . . . . . . . . (b) 3.858% 12/05/2049 $ 208,000 $ 204,959Taco Bell Funding LLC 2018-1A A2II . . . . . . . . . . . . . . . . . . . . . . . . . . . . . . . . . . . . . . . . (b) 4.940% 11/25/2048 46,530 50,050Wendy’s Funding LLC 2018-1A A2I . . . . . . . . . . . . . . . . . . . . . . . . . . . . . . . . . . . . . . . . . (b) 3.573% 03/15/2048 78,400 79,219Wendy’s Funding LLC 2018-1A A2II . . . . . . . . . . . . . . . . . . . . . . . . . . . . . . . . . . . . . . . . . (b) 3.884% 03/15/2048 52,920 53,813Wendy’s Funding LLC 2019-1A A2I . . . . . . . . . . . . . . . . . . . . . . . . . . . . . . . . . . . . . . . . . (b) 3.783% 06/15/2049 122,385 124,824
2,812,285
FINANCIALS – 1.6%AmeriCredit Automobile Receivables Trust 2015-3 D . . . . . . . . . . . . . . . . . . . . . . . . . . . . . . 3.340% 08/08/2021 369,786 370,103Angel Oak Mortgage Trust I LLC 2018-2 A1 . . . . . . . . . . . . . . . . . . . . . . . . . . . . . . . . . . . . (b) 3.674% 07/27/2048 39,629 39,995Arroyo Mortgage Trust 2018-1 A1 . . . . . . . . . . . . . . . . . . . . . . . . . . . . . . . . . . . . . . . . . . (b) 3.763% 04/25/2048 73,468 74,320BANK 2019-BN24 A3 . . . . . . . . . . . . . . . . . . . . . . . . . . . . . . . . . . . . . . . . . . . . . . . . . . 2.960% 11/15/2062 52,000 53,266BBCMS Mortgage Trust 2018-TALL A . . . . . . . . . . . . . . . . . . . . . . . . . . . . . . . . . . . . . . . (b) ML + 72 03/15/2037 161,000 160,193BBCMS Trust 2015-SRCH A2 . . . . . . . . . . . . . . . . . . . . . . . . . . . . . . . . . . . . . . . . . . . . . (b) 4.197% 08/10/2035 210,000 230,254BX Commercial Mortgage Trust 2018-IND A . . . . . . . . . . . . . . . . . . . . . . . . . . . . . . . . . . . (b) ML + 75 11/15/2035 221,390 221,258BX Commercial Mortgage Trust 2019-XL A . . . . . . . . . . . . . . . . . . . . . . . . . . . . . . . . . . . . (b) ML + 92 10/15/2036 282,000 282,226BX Commercial Mortgage Trust 2019-XL B . . . . . . . . . . . . . . . . . . . . . . . . . . . . . . . . . . . . (b) ML + 108 10/15/2036 100,000 100,125BX Trust 2019-OC11 A . . . . . . . . . . . . . . . . . . . . . . . . . . . . . . . . . . . . . . . . . . . . . . . . . (b) 3.202% 12/09/2041 268,000 275,366BX Trust 2019-OC11 B . . . . . . . . . . . . . . . . . . . . . . . . . . . . . . . . . . . . . . . . . . . . . . . . . (b) 3.605% 12/09/2041 134,000 137,237BX Trust 2019-OC11 C . . . . . . . . . . . . . . . . . . . . . . . . . . . . . . . . . . . . . . . . . . . . . . . . . (b) 3.856% 12/09/2041 134,000 137,577BX Trust 2019-OC11 D . . . . . . . . . . . . . . . . . . . . . . . . . . . . . . . . . . . . . . . . . . . . . . . . . (b) 4.075% 12/09/2041 201,000 204,282BX Trust 2019-OC11 E . . . . . . . . . . . . . . . . . . . . . . . . . . . . . . . . . . . . . . . . . . . . . . . . . (b) 4.075% 12/09/2041 51,000 49,269BXP Trust 2017-GM A . . . . . . . . . . . . . . . . . . . . . . . . . . . . . . . . . . . . . . . . . . . . . . . . . (b) 3.379% 06/13/2039 96,000 100,565Chase Home Lending Mortgage Trust 2019-ATR2 A11 . . . . . . . . . . . . . . . . . . . . . . . . . . . . . (b) ML + 90 07/25/2049 46,614 46,415Connecticut Avenue Securities Trust 2019-R03 1M2 . . . . . . . . . . . . . . . . . . . . . . . . . . . . . . (b) ML + 215 09/25/2031 202,166 203,688Connecticut Avenue Securities Trust 2019-R04 2M2 . . . . . . . . . . . . . . . . . . . . . . . . . . . . . . (b) ML + 210 06/25/2039 75,000 75,446Connecticut Avenue Securities Trust 2019-R05 1M2 . . . . . . . . . . . . . . . . . . . . . . . . . . . . . . (b) ML + 200 07/25/2039 115,396 115,978Connecticut Avenue Securities Trust 2019-R07 1M2 . . . . . . . . . . . . . . . . . . . . . . . . . . . . . . (b) ML + 210 10/25/2039 30,000 30,282Drive Auto Receivables Trust 2017-AA D . . . . . . . . . . . . . . . . . . . . . . . . . . . . . . . . . . . . . (b) 4.160% 05/15/2024 101,000 102,375Drive Auto Receivables Trust 2019-1 D . . . . . . . . . . . . . . . . . . . . . . . . . . . . . . . . . . . . . . . 4.090% 06/15/2026 42,000 43,231Fannie Mae Connecticut Avenue Securities 2017-C02 2M1 . . . . . . . . . . . . . . . . . . . . . . . . . . ML + 115 09/25/2029 8,575 8,582Fannie Mae Connecticut Avenue Securities 2017-C03 1M1 . . . . . . . . . . . . . . . . . . . . . . . . . . ML + 95 10/25/2029 11,889 11,906Fannie Mae Connecticut Avenue Securities 2017-C06 1M1 . . . . . . . . . . . . . . . . . . . . . . . . . . ML + 75 02/25/2030 3,263 3,263Fannie Mae Connecticut Avenue Securities 2018-C01 1M1 . . . . . . . . . . . . . . . . . . . . . . . . . . ML + 60 07/25/2030 37,688 37,678Fannie Mae Connecticut Avenue Securities 2018-C05 1M1 . . . . . . . . . . . . . . . . . . . . . . . . . . ML + 72 01/25/2031 6,433 6,435Fannie Mae Connecticut Avenue Securities 2018-C06 1M2 . . . . . . . . . . . . . . . . . . . . . . . . . . ML + 200 03/25/2031 278,158 279,324Fannie Mae REMICS FNR 2018-27 EA . . . . . . . . . . . . . . . . . . . . . . . . . . . . . . . . . . . . . . . 3.000% 05/25/2048 283,791 291,639Fannie Mae REMICS FNR 2019-71 P . . . . . . . . . . . . . . . . . . . . . . . . . . . . . . . . . . . . . . . . 3.000% 11/25/2049 446,838 457,809Freddie Mac Structured Agency Credit Risk Debt Notes 2018-DNA1 M2 . . . . . . . . . . . . . . . . . . ML + 180 07/25/2030 115,454 115,682JP Morgan Mortgage Trust 2019-5 A11 . . . . . . . . . . . . . . . . . . . . . . . . . . . . . . . . . . . . . . (b) ML + 90 11/25/2049 30,272 30,179JP Morgan Mortgage Trust 2019-6 A11 . . . . . . . . . . . . . . . . . . . . . . . . . . . . . . . . . . . . . . (b) ML + 90 12/25/2049 49,535 49,380JP Morgan Mortgage Trust 2019-7 A11 . . . . . . . . . . . . . . . . . . . . . . . . . . . . . . . . . . . . . . (b) ML + 90 02/25/2050 92,974 92,689JP Morgan Mortgage Trust 2019-LTV2 A11 . . . . . . . . . . . . . . . . . . . . . . . . . . . . . . . . . . . . (b) ML + 90 12/25/2049 129,742 129,513Mello Warehouse Securitization Trust 2018-W1 A . . . . . . . . . . . . . . . . . . . . . . . . . . . . . . . . (b) ML + 85 11/25/2051 333,333 333,498New Residential Mortgage Loan Trust 2018-2A A1 . . . . . . . . . . . . . . . . . . . . . . . . . . . . . . . (b) 4.500% 02/25/2058 89,089 93,122OneMain Direct Auto Receivables Trust 2018-1A C . . . . . . . . . . . . . . . . . . . . . . . . . . . . . . . (b) 3.850% 10/14/2025 100,000 102,252OneMain Direct Auto Receivables Trust 2018-1A D . . . . . . . . . . . . . . . . . . . . . . . . . . . . . . . (b) 4.400% 01/14/2028 100,000 102,816PRPM 2019-4A A1 . . . . . . . . . . . . . . . . . . . . . . . . . . . . . . . . . . . . . . . . . . . . . . . . . . . (b) 3.351% 11/25/2024 99,133 99,129PRPM 2019-GS1 A1 . . . . . . . . . . . . . . . . . . . . . . . . . . . . . . . . . . . . . . . . . . . . . . . . . . . (b) 3.500% 10/25/2024 132,019 131,871Station Place Securitization Trust Series 2019-10 NT . . . . . . . . . . . . . . . . . . . . . . . . . . . . . . 2.944% 10/24/2020 482,000 482,002Station Place Securitization Trust Series 2019-WL1 D . . . . . . . . . . . . . . . . . . . . . . . . . . . . . (b) ML + 120 08/25/2052 93,000 93,012Station Place Securitization Trust Series 2019-WL1 E . . . . . . . . . . . . . . . . . . . . . . . . . . . . . (b) ML + 140 08/25/2052 189,000 189,025Towd Point HE Trust 2019-HE1 A1 . . . . . . . . . . . . . . . . . . . . . . . . . . . . . . . . . . . . . . . . . . (b) ML + 90 04/25/2048 111,518 111,412
6,305,669Total Asset-Backed / Mortgage-Backed Securities (Cost $9,086,919) . . . . . . . . . . . . . . . . . . . . $ 9,117,954
Preferred Securities – 0.2% Rate Quantity Value
FINANCIALS – 0.1%Goldman Sachs Group, Inc. / The (Rate is fixed until 02/10/2025, at which point, the rate becomes H15T5Y + 322)
DR (Capital Markets) . . . . . . . . . . . . . . . . . . . . . . . . . . . . . . . . . . . . . . . . . . . . . . . . . . . . . . . . . . (c) 4.950% 186,000 $ 192,696Synchrony Financial DR (Consumer Finance) . . . . . . . . . . . . . . . . . . . . . . . . . . . . . . . . . . . . . . . . . . . . 5.625% 7,225 184,599
377,295
Ohio National Fund, Inc. ON Risk Managed Balanced Portfolio (Continued)
Schedule of Investments December 31, 2019
114 (continued)

Preferred Securities (Continued) Rate Quantity Value
INDUSTRIALS – 0.1%General Electric Co. (Rate is fixed until 01/21/2021, at which point, the rate becomes QL + 333)
(Industrial Conglomerates) . . . . . . . . . . . . . . . . . . . . . . . . . . . . . . . . . . . . . . . . . . . . . . . . . . . . . . (c) 5.000% 336,000 $ 329,098Total Preferred Securities (Cost $681,389) . . . . . . . . . . . . . . . . . . . . . . . . . . . . . . . . . . . . . . . . . . . . . . $ 706,393
Money Market Funds – 16.4% Shares Value
State Street Institutional Liquid Reserves Fund Institutional Class, 1.734% . . . . . . . . . . . . . . . . . . . . . . . . . . . . . . . . . . . . . . . (f) 57,690,015 $ 57,695,784State Street Institutional U.S. Government Money Market Fund, 1.535% . . . . . . . . . . . . . . . . . . . . . . . . . . . . . . . . . . . . . . . . (f) 8,571,837 8,571,837Total Money Market Funds (Cost $66,268,497) . . . . . . . . . . . . . . . . . . . . . . . . . . . . . . . . . . . . . . . . . . . . . . . . . . . . . . . . . . . $ 66,267,621Total Investments – 101.6% (Cost $344,149,794) . . . . . . . . . . . . . . . . . . . . . . . . . . . . . . . . . . . . . . . . . . . . . . . . . . . . . . . . . . . . (g) $410,244,707Total TBA Sales Commitments – (0.4)% (see the following Schedule of TBA Sales Commitments). . . . . . . . . . . . . . . . . . . . . . . . . . . . (1,416,142)Liabilities in Excess of Other Assets – (1.2)% (d) (5,221,588)Net Assets – 100.0% $403,606,977
Percentages are stated as a percent of net assets.Abbreviations:
DR: Depositary ReceiptH15T5Y: U.S. Treasury Yield Curve Rate T-Note Constant Maturity 5 Year, 1.690% at 12/31/2019ML: Monthly U.S. LIBOR Rate, 1.763% at 12/31/2019QL: Quarterly U.S. LIBOR Rate, 1.908% at 12/31/2019SOFR: Secured Overnight Financing Rate, 1.550% at 12/31/2019TBA: To Be AnnouncedUMBS: Uniform Mortgage-Backed Security; the securities actually delivered on settlement of the TBA could be issued by Fannie Mae, Freddie Mac, or any
combination thereofFootnotes:
(a) Non-income producing security.(b) Security exempt from registration under Regulation D of the Securities Act of 1933. These securities may be resold in transactions exempt from registration,
normally to qualified buyers under Rule 144A. At December 31, 2019, the value of these securities totaled $16,422,071, or 4.1% of the Portfolio’s net assets.(c) Security is a fixed-then-variable rate instrument in which the coupon or dividend rate is fixed until a later specified date, then is adjusted periodically. Rates
stated, including interest rate caps and floors, if any, are those in effect at December 31, 2019.(d) Security is fully pledged, in addition to $300,560 of the Portfolio’s cash holdings, as collateral for the futures contracts outstanding at December 31, 2019. See also
the following Schedule of Open Futures Contracts.(e) 100 shares per contract.(f) Rate represents the seven-day yield at December 31, 2019.(g) Represents cost for financial reporting purposes, which may differ from cost basis for federal income tax purposes. See also Note 8 of the Notes to Financial
Statements.
The accompanying notes are an integral part of these financial statements.
Schedule of Open Futures Contracts December 31, 2019
DescriptionNumber ofcontracts Expiration Date
NotionalAmount Value
UnrealizedAppreciation
(Depreciation)
Variation MarginReceivable(Payable)
CME E-mini S&P 500 Index - Long 192 March 20, 2020 $ 30,562,874 $ 31,018,560 $ 455,686 $ 47,64510-Year U.S. Treasury Note - Long 1,778 March 20, 2020 230,388,493 228,334,094 (2,054,399) (194,460)U.S. Treasury Long Bond - Long 64 March 20, 2020 10,176,555 9,978,000 (198,555) (22,000)
$271,127,922 $269,330,654 $(1,797,268) $(168,815)
The accompanying notes are an integral part of these financial statements.
Schedule of TBA Sales Commitments December 31, 2019
Description Rate MaturityFace
Amount ValueFannie Mae or Freddie Mac UMBS TBA Sale Commitment 2.500% 01/15/2035 $220,820 $ (222,686)Fannie Mae or Freddie Mac UMBS TBA Sale Commitment 3.000% 01/15/2050 940,130 (952,869)Fannie Mae or Freddie Mac UMBS TBA Sale Commitment 3.500% 01/15/2050 234,000 (240,587)Total TBA Sales Commitments (Proceeds $1,415,234) $(1,416,142)
Ohio National Fund, Inc. ON Risk Managed Balanced Portfolio (Continued)
Schedule of Investments December 31, 2019
115

Objective/Strategy
The ON Conservative Model Portfolio is a fund of funds that seeks currentincome and preservation of capital by investing in underlying mutualfunds. Under normal circumstances, the Portfolio intends to haveinvestment exposure to various asset classes within the following targetasset allocation ranges: U.S. Equity 0-25%, International Equity 0-10%,and Fixed Income 65-90%.
Performance as of December 31, 2019
Average Annual returnsOne year 13.18%Since inception (3/1/17) 5.23%
Past performance does not guarantee future results. The performance dataquoted represents past performance and current returns may be lower or higher.Total return figures include change in share price and reinvestment of dividendsand capital gains. The investment return and principal value will fluctuate so thatan investor’s shares, when redeemed, may be worth more or less than the originalcost. To obtain performance information up to the most recent month end, calltoll-free 1-877-781-6392.
The Portfolio is not open to direct retail investment. Beneficial interest in shares isobtained solely by purchase of variable life insurance policies and variable annuitycontracts. Actual performance results for variable annuity and variable universallife contracts will be lower due to contract charges. Consult your contract forapplicable charges.
Total gross expense ratio is estimated to be 1.13% per the Fund’s prospectus datedNovember 22, 2019. Additional information pertaining to the Portfolio’s expenseratio as of December 31, 2019 can be found in the Portfolio’s Financial Highlights.The Portfolio’s expense ratio included in the Financial Highlights does not includeAcquired Fund Fees and Expenses (AFFE), which is a major component of theexpense ratio that is required to be presented in the Fund’s prospectus. TheAdviser has contractually agreed to make payments to the Fund to the extentnecessary to maintain the Portfolio’s expense ratio (including AFFE, but excludingcertain other expenses) at 0.92% through April 30, 2020.
Comments from Adviser
Q. How did the Portfolio perform in comparison to its benchmark duringthe reporting period?
A. For the year ended December 31, 2019, the Portfolio returned 13.18%versus 11.22% for its benchmark, the Morningstar® Conservative TargetRisk Index.
Q. Were there specific market conditions, investment strategies, ortechniques that materially affected the Portfolio’s benchmark-relativeperformance during the reporting period?
A. In 2019, domestic and foreign equity markets provided large positivereturns. Domestic stocks generally outperformed foreign stocks, andlarge cap stocks generally outperformed mid cap and small cap stocks.Growth stocks materially outperformed value stocks during the year. ThePortfolio’s large cap and domestic stock holdings benefited relativeperformance. (1)
Fixed income markets also provided positive returns for the year. Interestrates declined across the curve, as the Federal Reserve reduced theFederal Funds rate by 75 basis points during the year. In this environment,longer duration bonds outperformed shorter duration bonds. Corporatecredit spreads tightened, and lower quality bonds outperformed higherquality bonds during the year. The Portfolio’s overweight to corporateand high yield bonds benefited performance, while its exposure to shortterm bonds detracted from performance versus the benchmark. (1)
Q. How did asset class allocation impact the Portfolio’s performancerelative to its benchmark?
A. The Portfolio invests in affiliated and unaffiliated open-end mutualfunds, comprised mostly of fixed income funds, but also some equityfunds. The asset allocation between fixed income funds and equity fundswas roughly in-line with the benchmark. On the equity side, theoverweight allocation to large cap domestic equity funds benefitedperformance versus the benchmark. On the fixed income side, theoverweight allocation to corporate and high yield bonds aidedperformance versus the benchmark, while the allocation to shorterbonds detracted from performance relative to the benchmark during theyear. (1)
Q. Which holdings contributed the most to, and detracted the most from,the Portfolio’s benchmark-relative performance?
A. The top three performing funds in the Portfolio were the ON S&P 500®
Index Portfolio, ON Janus Henderson Venture Portfolio, and ONS&P MidCap 400® Index Portfolio. The ON S&P 500® Index Portfolio iscomprised of stocks that represent a large percentage of the U.S.domestic equity market, which performed well. The ON Janus HendersonVenture Portfolio benefited from its exposure to growth stocks, whichoutperformed during the year. Lastly, the ON S&P MidCap 400® IndexPortfolio benefited from its exposure to domestic stocks, whichoutperformed foreign stocks during the year. The top three funds thatdetracted from performance versus the benchmark were PIMCO LowDuration Institutional, PIMCO Total Return Institutional, and PIMCO RealReturn Institutional. PIMCO Low Duration Institutional underperformeddue to its shorter duration and exposure to higher quality bonds. PIMCOTotal Return Institutional underperformed due to its lower weighting incorporate bonds. PIMCO Real Return Institutional focuses on inflationprotected securities and underperformed in an environment of lowinflation. (1)
(1) The Portfolio’s composition is subject to change. Holdings and weightings areas of December 31, 2019.
Change in Value of $10,000 Investment
ON Conservative Model Portfolio (A)Morningstar® Conservative Target Risk Index (B)
9,500
10,000
10,500
11,000
11,500
$12,000
6/1
712
/17
6/1
812
/18
6/1
9
3
/1/1
712
/19
$11,575 (B)$11,556 (A)
Hypothetical illustration based on past performance. Future performance will vary.The Portfolio’s returns reflect reinvested dividends. The Portfolio’s holdings maydiffer significantly from the securities in the index. The index is unmanaged andtherefore does not reflect the cost of portfolio management and accounting.
The Morningstar®rr Target Risk Index Family is a series of Morningstar Indexes thatprovide exposure to a broad array of asset classes using Morningstar assetallocation methodology. The index family provides global equity market risk levelsthat are scaled to fit five equity market risk profiles: aggressive, moderatelyaggressive, moderate, moderately conservative, and conservative. The five levelsof global equity exposure are set at 95%, 80%, 60%, 40%, and 20%, respectively,and the Morningstar®rr Conservative Target Risk Index exposure is set at 20%.
Past performance is no guarantee of future results. Redemption of fund sharescould have tax implications unique to each shareholder.
Ohio National Fund, Inc. ON Conservative Model Portfolio (Unaudited)
116 (continued)
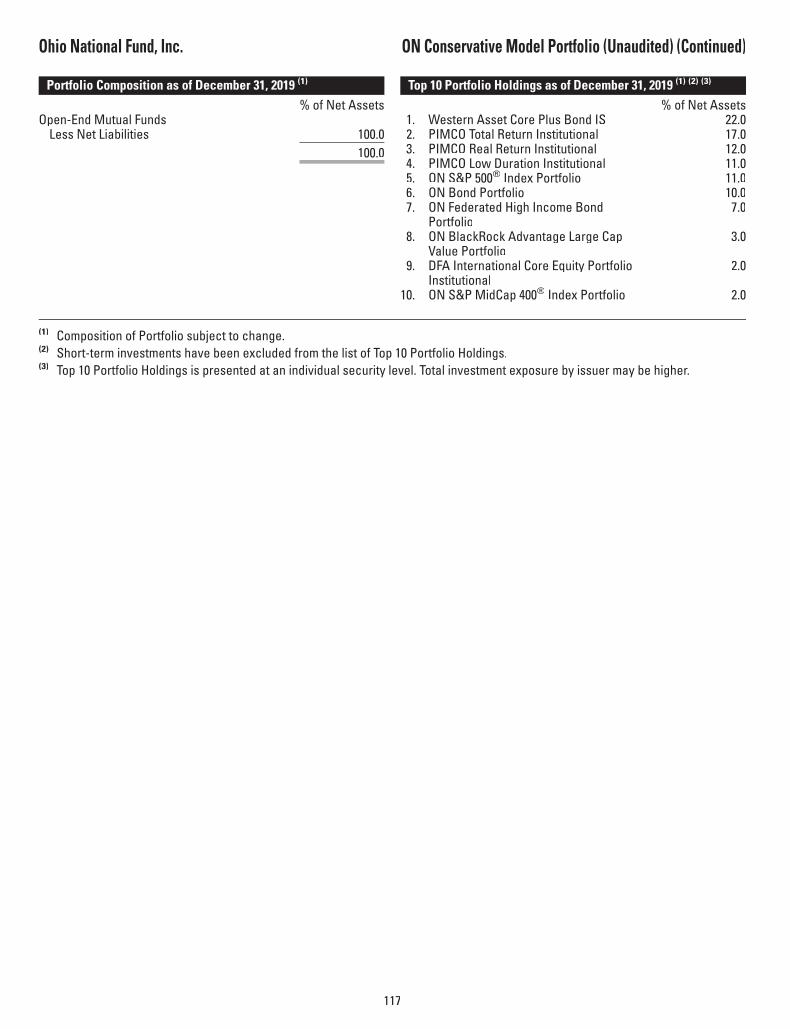
Portfolio Composition as of December 31, 2019 (1)
% of Net AssetsOpen-End Mutual Funds
Less Net Liabilities 100.0100.0
Top 10 Portfolio Holdings as of December 31, 2019 (1) (2) (3)
% of Net Assets1. Western Asset Core Plus Bond IS 22.02. PIMCO Total Return Institutional 17.03. PIMCO Real Return Institutional 12.04. PIMCO Low Duration Institutional 11.05. ON S&P 500® Index Portfolio 11.06. ON Bond Portfolio 10.07. ON Federated High Income Bond
Portfolio7.0
8. ON BlackRock Advantage Large CapValue Portfolio
3.0
9. DFA International Core Equity PortfolioInstitutional
2.0
10. ON S&P MidCap 400® Index Portfolio 2.0
(1) Composition of Portfolio subject to change.(2) Short-term investments have been excluded from the list of Top 10 Portfolio Holdings.(3) Top 10 Portfolio Holdings is presented at an individual security level. Total investment exposure by issuer may be higher.
Ohio National Fund, Inc. ON Conservative Model Portfolio (Unaudited) (Continued)
117

Open-End Mutual Funds – 64.1% Shares Value
DFA International Core Equity Portfolio Institutional . . . . . . . . . . . . . . . . . . . . . . . . . . . . . . . . . . . . . . . . . . . . . . . . . . . . . 108,636 $ 1,500,256PIMCO Low Duration Institutional . . . . . . . . . . . . . . . . . . . . . . . . . . . . . . . . . . . . . . . . . . . . . . . . . . . . . . . . . . . . . . . . 844,166 8,272,822PIMCO Real Return Institutional . . . . . . . . . . . . . . . . . . . . . . . . . . . . . . . . . . . . . . . . . . . . . . . . . . . . . . . . . . . . . . . . . 802,573 9,020,925PIMCO Total Return Institutional . . . . . . . . . . . . . . . . . . . . . . . . . . . . . . . . . . . . . . . . . . . . . . . . . . . . . . . . . . . . . . . . . 1,236,660 12,787,069Western Asset Core Plus Bond IS . . . . . . . . . . . . . . . . . . . . . . . . . . . . . . . . . . . . . . . . . . . . . . . . . . . . . . . . . . . . . . . . 1,383,951 16,552,060Total Open-End Mutual Funds . . . . . . . . . . . . . . . . . . . . . . . . . . . . . . . . . . . . . . . . . . . . . . . . . . . . . . . . . . . . . . . . . . $48,133,132Total Investments in Securities of Unaffiliated Issuers – 64.1% (Cost $47,082,186) . . . . . . . . . . . . . . . . . . . . . . . . . . . . . . . . . . . . . . (a) $48,133,132Total Investments in Affiliates – 35.9% (Cost $25,170,936) (see schedule below) (a) 27,004,616Liabilities in Excess of Other Assets – 0.0% (34,833)Net Assets – 100.0% $75,102,915
Percentages are stated as a percent of net assets.Footnotes:
(a) Represents cost for financial reporting purposes, which may differ from cost basis for federal income tax purposes. See also Note 8 of the Notes to FinancialStatements.
The accompanying notes are an integral part of these financial statements.
Schedule of Investments in Affiliates December 31, 2019
AffiliateValue at
January 1, 2019Cost of
PurchasesProceeds
from SalesNet RealizedGain (Loss)
Change inUnrealized
Appreciation(Depreciation)
IncomeDistributions
Capital GainDistributions
Shares atDecember 31,
2019
Value atDecember 31,
2019
Open-End Mutual Funds – 35.9%ON BlackRock Advantage Large Cap Value
Portfolio . . . . . . . . . . . . . . . . . . . . . . (a) $2,307,819 $ 578,934 $ 959,265 $ 65,511 $ 257,386 $ 66,596 $ 22,894 120,021 $ 2,250,385ON Bond Portfolio . . . . . . . . . . . . . . . . . . (a) 5,557,747 2,994,429 1,624,279 63,407 509,978 164,517 — 392,737 7,501,282ON Federated High Income Bond Portfolio . . . . . (a) 5,470,926 922,575 1,689,886 129,944 417,339 220,716 — 253,789 5,250,898ON International Equity Portfolio . . . . . . . . . . (a) 1,572,159 337,323 680,787 (34,381) 305,942 24,847 — 96,666 1,500,256ON Janus Henderson Venture Portfolio . . . . . . (a) 767,825 344,018 454,074 13,639 78,720 — 110,017 22,134 750,128ON S&P 500® Index Portfolio . . . . . . . . . . . . (a) 8,441,448 2,819,672 4,549,391 433,419 1,106,263 101,029 689,195 247,865 8,251,411ON S&P MidCap 400® Index Portfolio . . . . . . . (a) 1,525,495 462,872 841,417 15,525 337,781 12,694 — 77,935 1,500,256Total Open-End Mutual Funds. . . . . . . . . . . . $687,064 $3,013,409 $590,399 $822,106 $27,004,616
Percentages are stated as a percent of net assets.Footnotes:
(a) Pursuant to Section 2(a)(3) of the Investment Company Act of 1940, the investment meets the definition of “affiliated person”, as the Portfolio directly or indirectlyowns, controls, or holds with power to vote 5 percent or more of the outstanding voting securities of the holding at December 31, 2019.
The accompanying notes are an integral part of these financial statements.
Ohio National Fund, Inc. ON Conservative Model Portfolio
Schedule of Investments in Unaffiliated Issuers December 31, 2019
118

Objective/Strategy
The ON Moderately Conservative Model Portfolio is a fund of funds thatseeks current income and moderate growth of capital with a greateremphasis on current income by investing in underlying mutual funds.Under normal circumstances, the Portfolio intends to have investmentexposure to various asset classes within the following target assetallocation ranges: U.S. Equity 20-40%, International Equity 5-20%, andFixed Income 30-70%.
Performance as of December 31, 2019
Average Annual returnsOne year 16.58%Since inception (3/1/17) 5.89%
Past performance does not guarantee future results. The performance dataquoted represents past performance and current returns may be lower or higher.Total return figures include change in share price and reinvestment of dividendsand capital gains. The investment return and principal value will fluctuate so thatan investor’s shares, when redeemed, may be worth more or less than the originalcost. To obtain performance information up to the most recent month end, calltoll-free 1-877-781-6392.
The Portfolio is not open to direct retail investment. Beneficial interest in shares isobtained solely by purchase of variable life insurance policies and variable annuitycontracts. Actual performance results for variable annuity and variable universallife contracts will be lower due to contract charges. Consult your contract forapplicable charges.
Total gross expense ratio is estimated to be 1.06% per the Fund’s prospectus datedNovember 22, 2019. Additional information pertaining to the Portfolio’s expenseratio as of December 31, 2019 can be found in the Portfolio’s Financial Highlights.The Portfolio’s expense ratio included in the Financial Highlights does not includeAcquired Fund Fees and Expenses (AFFE), which is a major component of theexpense ratio that is required to be presented in the Fund’s prospectus. TheAdviser has contractually agreed to make payments to the Fund to the extentnecessary to maintain the Portfolio’s expense ratio (including AFFE, but excludingcertain other expenses) at 1.00% through April 30, 2020.
Comments from Adviser
Q. How did the Portfolio perform in comparison to its benchmark duringthe reporting period?
A. For the year ended December 31, 2019, the Portfolio returned 16.58%versus 15.25% for its benchmark, the Morningstar® ModeratelyConservative Target Risk Index.
Q. Were there specific market conditions, investment strategies, ortechniques that materially affected the Portfolio’s benchmark-relativeperformance during the reporting period?
A. In 2019, domestic and foreign equity markets provided large positivereturns. Domestic stocks generally outperformed foreign stocks, andlarge cap stocks generally outperformed mid cap and small cap stocks.Growth stocks materially outperformed value stocks during the period.The Portfolio’s holdings of large cap, domestic, and growth stocksbenefited relative performance. (1)
Fixed income markets also provided positive returns for the year. Interestrates declined across the curve, as the Federal Reserve reduced theFederal Funds rate by 75 basis points during the year. In this environment,longer duration bonds outperformed shorter duration bonds. Corporatecredit spreads tightened, and lower quality bonds outperformed higherquality bonds during the year. The Portfolio’s overweight to corporateand high yield bonds benefited performance, while its exposure to shortterm bonds detracted from performance versus the benchmark. (1)
Q. How did asset class allocation impact the Portfolio’s performancerelative to its benchmark?
A. The Portfolio invests in affiliated and unaffiliated open-end mutualfunds, comprised mostly of fixed income funds, but also some equityfunds. The asset allocation between fixed income funds and equity fundswas roughly in-line with the benchmark. On the equity side, theoverweight allocation to large cap, domestic, and growth equity fundsbenefited performance versus the benchmark. On the fixed income side,the overweight allocation to corporate and high yield bonds aidedperformance versus the benchmark, while the allocation to shorterbonds detracted from performance relative to the benchmark during theyear. (1)
Q. Which holdings contributed the most to, and detracted the most from,the Portfolio’s benchmark-relative performance?
A. The top three performing funds in the Portfolio were the ONNasdaq-100® Index Portfolio, ON Janus Henderson Enterprise Portfolio,and ON Janus Henderson Forty Portfolio. Each of the Portfolios benefitedfrom its exposure to domestic growth stocks. The top three funds thatdetracted from performance versus the benchmark were PIMCO LowDuration Institutional, PIMCO Total Return Institutional, and PIMCO RealReturn Institutional. PIMCO Low Duration Institutional underperformeddue to its shorter duration and exposure to higher quality bonds. PIMCOTotal Return Institutional underperformed due to its lower weighting incorporate bonds. PIMCO Real Return Institutional focuses on inflationprotected securities and underperformed in an environment of lowinflation. (1)
(1) The Portfolio’s composition is subject to change. Holdings and weightings areas of December 31, 2019.
Change in Value of $10,000 Investment
ON Moderately Conservative Model Portfolio (A)Morningstar® Moderately Conservative Target Risk Index (B)
9,500
10,000
10,500
11,000
11,500
12,000
$12,500
6/1
712
/17
6/1
812
/18
6/1
9
3
/1/1
712
/19
$12,067 (B)
$11,763 (A)
Hypothetical illustration based on past performance. Future performance will vary.The Portfolio’s returns reflect reinvested dividends. The Portfolio’s holdings maydiffer significantly from the securities in the index. The index is unmanaged andtherefore does not reflect the cost of portfolio management and accounting.
The Morningstar®rr Target Risk Index Family is a series of Morningstar Indexes thatprovide exposure to a broad array of asset classes using Morningstar assetallocation methodology. The index family provides global equity market risk levelsthat are scaled to fit five equity market risk profiles: aggressive, moderatelyaggressive, moderate, moderately conservative, and conservative. The five levelsof global equity exposure are set at 95%, 80%, 60%, 40%, and 20%, respectively,and the Morningstar®rr Moderately Conservative Target Risk Index exposure is setat 40%.
Past performance is no guarantee of future results. Redemption of fund sharescould have tax implications unique to each shareholder.
Ohio National Fund, Inc. ON Moderately Conservative Model Portfolio (Unaudited)
119 (continued)

Portfolio Composition as of December 31, 2019 (1)
% of Net AssetsOpen-End Mutual Funds
Less Net Liabilities 100.0100.0
Top 10 Portfolio Holdings as of December 31, 2019 (1) (2) (3)
% of Net Assets1. Western Asset Core Plus Bond IS 17.02. PIMCO Total Return Institutional 13.03. ON S&P 500® Index Portfolio 13.04. PIMCO Low Duration Institutional 8.05. PIMCO Real Return Institutional 8.06. ON Bond Portfolio 7.07. ON Federated High Income Bond
Portfolio6.0
8. ON BlackRock Advantage Large CapValue Portfolio
5.0
9. ON S&P MidCap 400® Index Portfolio 5.010. ON International Equity Portfolio 4.5
(1) Composition of Portfolio subject to change.(2) Short-term investments have been excluded from the list of Top 10 Portfolio Holdings.(3) Top 10 Portfolio Holdings is presented at an individual security level. Total investment exposure by issuer may be higher.
Ohio National Fund, Inc. ON Moderately Conservative Model Portfolio (Unaudited) (Continued)
120

Open-End Mutual Funds – 51.6% Shares Value
DFA Emerging Markets Portfolio Institutional. . . . . . . . . . . . . . . . . . . . . . . . . . . . . . . . . . . . . . . . . . . . . . . . . . . . . . . . . 114,609 $ 3,345,448DFA International Core Equity Portfolio Institutional . . . . . . . . . . . . . . . . . . . . . . . . . . . . . . . . . . . . . . . . . . . . . . . . . . . . 484,497 6,690,896PIMCO Low Duration Institutional. . . . . . . . . . . . . . . . . . . . . . . . . . . . . . . . . . . . . . . . . . . . . . . . . . . . . . . . . . . . . . . . 1,825,326 17,888,196PIMCO Real Return Institutional. . . . . . . . . . . . . . . . . . . . . . . . . . . . . . . . . . . . . . . . . . . . . . . . . . . . . . . . . . . . . . . . . 1,590,787 17,880,442PIMCO Total Return Institutional . . . . . . . . . . . . . . . . . . . . . . . . . . . . . . . . . . . . . . . . . . . . . . . . . . . . . . . . . . . . . . . . 2,811,645 29,072,409Vanguard International Growth Fund Admiral Class . . . . . . . . . . . . . . . . . . . . . . . . . . . . . . . . . . . . . . . . . . . . . . . . . . . . 21,698 2,230,299Western Asset Core Plus Bond IS. . . . . . . . . . . . . . . . . . . . . . . . . . . . . . . . . . . . . . . . . . . . . . . . . . . . . . . . . . . . . . . . 3,179,526 38,027,134Total Open-End Mutual Funds . . . . . . . . . . . . . . . . . . . . . . . . . . . . . . . . . . . . . . . . . . . . . . . . . . . . . . . . . . . . . . . . . . $115,134,824Total Investments in Securities of Unaffiliated Issuers – 51.6% (Cost $112,218,149) . . . . . . . . . . . . . . . . . . . . . . . . . . . . . . . . . . . . . (a) $115,134,824Total Investments in Affiliates – 48.4% (Cost $99,697,026) (see schedule below) (a) 108,169,495Liabilities in Excess of Other Assets – 0.0% (80,651)Net Assets – 100.0% $223,223,668
Percentages are stated as a percent of net assets.Footnotes:
(a) Represents cost for financial reporting purposes, which may differ from cost basis for federal income tax purposes. See also Note 8 of the Notes to FinancialStatements.
The accompanying notes are an integral part of these financial statements.
Schedule of Investments in Affiliates December 31, 2019
AffiliateValue at
January 1, 2019Cost of
Purchases TransfersProceeds
from SalesNet RealizedGain (Loss)
Change inUnrealized
Appreciation(Depreciation)
IncomeDistributions
Capital GainDistributions
Shares atDecember 31,
2019
Value atDecember 31,
2019
Open-End Mutual Funds – 48.4%Fidelity Advisor® Mid Cap II Class I . . (a) $ 4,511,453 $ 640,692 $ — $ 5,578,659 $ (576,078) $ 1,002,592 $ — $ 136,771 — $ —Fidelity Advisor® Real Estate I. . . . . (b) 2,260,163 599,163 — 952,897 (16,002) 339,872 44,423 131,533 101,331 2,230,299ON BlackRock Advantage Large Cap
Core Portfolio . . . . . . . . . . . . (b) — 41,144 5,670,303 554,806 (751,460) 55,417 22,463 — 135,375 4,460,598ON BlackRock Advantage Large Cap
Value Portfolio . . . . . . . . . . . (b) 11,658,209 1,219,410 — 3,332,256 308,794 1,297,337 326,700 112,313 594,746 11,151,494ON Bond Portfolio . . . . . . . . . . . (b) 14,429,925 3,252,260 — 3,637,859 145,026 1,422,740 338,105 — 817,387 15,612,092ON Equity Portfolio . . . . . . . . . . . (a) 6,856,092 892,543 (5,670,303) 3,387,858 659,120 650,406 39,495 576,600 — —ON Federated High Income Bond
Portfolio . . . . . . . . . . . . . . . (b) 14,266,409 868,734 — 3,175,959 235,551 1,187,058 555,282 — 646,776 13,381,793ON International Equity Portfolio . . . (b) 14,354,319 820,384 — 6,898,655 (809,046) 2,569,343 164,734 — 646,672 10,036,345ON Janus Henderson Enterprise
Portfolio . . . . . . . . . . . . . . . (b) 2,315,876 339,321 — 1,056,329 48,863 582,568 — 107,008 45,957 2,230,299ON Janus Henderson Forty Portfolio . (b) 2,315,481 409,764 — 1,030,210 54,546 480,718 — 172,192 85,583 2,230,299ON Janus Henderson Venture
Portfolio . . . . . . . . . . . . . . . (b) 2,264,567 679,247 — 997,781 28,159 256,107 — 322,419 65,810 2,230,299ON Nasdaq-100® Index Portfolio . . . (b) 4,605,428 1,146,578 — 2,226,865 79,503 855,954 21,600 590,551 224,942 4,460,598ON S&P 500® Index Portfolio . . . . . (b) 27,742,673 7,345,271 — 11,636,964 1,662,924 3,879,981 349,795 2,386,219 870,949 28,993,885ON S&P MidCap 400® Index
Portfolio . . . . . . . . . . . . . . . (b) 6,777,920 5,551,665 — 3,137,132 (120,692) 2,079,733 93,057 — 579,298 11,151,494Total Open-End Mutual Funds . . . . . $ 949,208 $16,659,826 $1,955,654 $4,535,606 $108,169,495
Percentages are stated as a percent of net assets.Footnotes:
(a) Pursuant to Section 2(a)(3) of the Investment Company Act of 1940, the investment met the definition of “affiliated person” at a point in time during the year endedDecember 31, 2019, as the Portfolio directly or indirectly owned, controlled, or held with power to vote 5 percent or more of the outstanding voting securities of theholding.
(b) Pursuant to Section 2(a)(3) of the Investment Company Act of 1940, the investment meets the definition of “affiliated person”, as the Portfolio directly or indirectlyowns, controls, or holds with power to vote 5 percent or more of the outstanding voting securities of the holding at December 31, 2019.
The accompanying notes are an integral part of these financial statements.
Ohio National Fund, Inc. ON Moderately Conservative Model Portfolio
Schedule of Investments in Unaffiliated Issuers December 31, 2019
121

Objective/Strategy
The ON Balanced Model Portfolio is a fund of funds that seeks a balancebetween growth of capital and current income with a greater emphasison growth of capital by investing in underlying mutual funds. Undernormal circumstances, the Portfolio intends to have investment exposureto various asset classes within the following target asset allocationranges: U.S. Equity 25-50%, International Equity 10-25%, and FixedIncome 25-50%.
Performance as of December 31, 2019
Average Annual returnsOne year 19.46%Since inception (3/1/17) 6.35%
Past performance does not guarantee future results. The performance dataquoted represents past performance and current returns may be lower or higher.Total return figures include change in share price and reinvestment of dividendsand capital gains. The investment return and principal value will fluctuate so thatan investor’s shares, when redeemed, may be worth more or less than the originalcost. To obtain performance information up to the most recent month end, calltoll-free 1-877-781-6392.
The Portfolio is not open to direct retail investment. Beneficial interest in shares isobtained solely by purchase of variable life insurance policies and variable annuitycontracts. Actual performance results for variable annuity and variable universallife contracts will be lower due to contract charges. Consult your contract forapplicable charges.
Total gross expense ratio is estimated to be 1.07% per the Fund’s prospectus datedNovember 22, 2019. Additional information pertaining to the Portfolio’s expenseratio as of December 31, 2019 can be found in the Portfolio’s Financial Highlights.The Portfolio’s expense ratio included in the Financial Highlights does not includeAcquired Fund Fees and Expenses (AFFE), which is a major component of theexpense ratio that is required to be presented in the Fund’s prospectus. TheAdviser has contractually agreed to make payments to the Fund to the extentnecessary to maintain the Portfolio’s expense ratio (including AFFE, but excludingcertain other expenses) at 1.00% through April 30, 2020.
Comments from Adviser
Q. How did the Portfolio perform in comparison to its benchmark duringthe reporting period?
A. For the year ended December 31, 2019, the Portfolio returned 19.46%versus 19.03% for its benchmark, the Morningstar® Moderate Target RiskIndex.
Q. Were there specific market conditions, investment strategies, ortechniques that materially affected the Portfolio’s benchmark-relativeperformance during the reporting period?
A. In 2019, domestic and foreign equity markets provided large positivereturns. Domestic stocks generally outperformed foreign stocks, andlarge cap stocks generally outperformed mid cap and small cap stocks.Growth stocks materially outperformed value stocks during the year. ThePortfolio’s holdings of large cap, domestic, and growth stocks benefitedrelative performance, while its exposure to value stocks and emergingmarket stocks detracted from performance versus the benchmark. (1)
Fixed income markets also provided positive returns for the year. Interestrates declined across the curve, as the Federal Reserve reduced theFederal Funds rate by 75 basis points during the year. In this environment,longer duration bonds outperformed shorter duration bonds. Corporatecredit spreads tightened, and lower quality bonds outperformed higherquality bonds during the year. The Portfolio’s overweight to corporateand high yield bonds benefited performance, while its exposure to shortterm bonds detracted from performance versus the benchmark. (1)
Q. How did asset class allocation impact the Portfolio’s performancerelative to its benchmark?
A. The Portfolio invests in affiliated and unaffiliated open-end mutualfunds, comprised of fixed income and equity funds. The asset allocationbetween fixed income funds and equity funds was roughly in-line withthe benchmark. On the equity side, the overweight allocation to largecap, domestic, and growth equity funds benefited performance versusthe benchmark, while exposure to emerging market funds detracted fromrelative performance. On the fixed income side, the overweightallocation to corporate and high yield bonds aided performance versusthe benchmark, while the allocation to shorter bonds detracted fromperformance relative to the benchmark during the year. (1)
Q. Which holdings contributed the most to, and detracted the most from,the Portfolio’s benchmark-relative performance?
A. The top three performing funds in the Portfolio were the ONNasdaq-100® Index Portfolio, ON BlackRock Advantage Large CapGrowth Portfolio, and ON Janus Henderson Forty Portfolio. Each of thePortfolios benefited from its exposure to domestic growth stocks. The topthree funds that detracted from performance versus the benchmarkwere PIMCO Low Duration Institutional, PIMCO Total Return Institutional,and PIMCO Real Return Institutional. PIMCO Low Duration Institutionalunderperformed due to its shorter duration and exposure to higherquality bonds. PIMCO Total Return Institutional underperformed due to itslower weighting in corporate bonds. PIMCO Real Return Institutionalfocuses on inflation protected securities and underperformed in anenvironment of low inflation.(1)
(1) The Portfolio’s composition is subject to change. Holdings and weightings areas of December 31, 2019.
Change in Value of $10,000 Investment
ON Balanced Model Portfolio (A)Morningstar® Moderate Target Risk Index (B)
9,500
10,000
10,500
11,000
11,500
12,000
$12,500
6/1
712
/17
6/1
812
/18
6/1
9
3
/1/1
712
/19
$12,486 (B)
$11,911 (A)
Hypothetical illustration based on past performance. Future performance will vary.The Portfolio’s returns reflect reinvested dividends. The Portfolio’s holdings maydiffer significantly from the securities in the index. The index is unmanaged andtherefore does not reflect the cost of portfolio management and accounting.
The Morningstar®rr Target Risk Index Family is a series of Morningstar Indexes thatprovide exposure to a broad array of asset classes using Morningstar assetallocation methodology. The index family provides global equity market risk levelsthat are scaled to fit five equity market risk profiles: aggressive, moderatelyaggressive, moderate, moderately conservative, and conservative. The five levelsof global equity exposure are set at 95%, 80%, 60%, 40%, and 20%, respectively,and the Morningstar®rr Moderate Target Risk Index exposure is set at 60%.
Past performance is no guarantee of future results. Redemption of fund sharescould have tax implications unique to each shareholder.
Ohio National Fund, Inc. ON Balanced Model Portfolio (Unaudited)
122 (continued)

Portfolio Composition as of December 31, 2019 (1)
% of Net AssetsOpen-End Mutual Funds
Less Net Liabilities 100.0100.0
Top 10 Portfolio Holdings as of December 31, 2019 (1) (2) (3)
% of Net Assets1. ON S&P 500® Index Portfolio 14.02. PIMCO Total Return Institutional 10.03. ON S&P MidCap 400® Index Portfolio 10.04. Western Asset Core Plus Bond IS 9.05. ON International Equity Portfolio 7.56. PIMCO Low Duration Institutional 7.07. ON BlackRock Advantage Large Cap
Value Portfolio6.0
8. ON Bond Portfolio 5.09. PIMCO Real Return Institutional 4.0
10. ON Federated High Income BondPortfolio
4.0
(1) Composition of Portfolio subject to change.(2) Short-term investments have been excluded from the list of Top 10 Portfolio Holdings.(3) Top 10 Portfolio Holdings is presented at an individual security level. Total investment exposure by issuer may be higher.
Ohio National Fund, Inc. ON Balanced Model Portfolio (Unaudited) (Continued)
123

Open-End Mutual Funds – 41.6% Shares Value
DFA Emerging Markets Portfolio Institutional . . . . . . . . . . . . . . . . . . . . . . . . . . . . . . . . . . . . . . . . . . . . . . . . . . . . . . . 1,139,731 $ 33,268,754DFA International Core Equity Portfolio Institutional . . . . . . . . . . . . . . . . . . . . . . . . . . . . . . . . . . . . . . . . . . . . . . . . . . . 3,212,045 44,358,339Lazard Emerging Markets Equity Class R6 . . . . . . . . . . . . . . . . . . . . . . . . . . . . . . . . . . . . . . . . . . . . . . . . . . . . . . . . . 900,616 16,634,377PIMCO Low Duration Institutional . . . . . . . . . . . . . . . . . . . . . . . . . . . . . . . . . . . . . . . . . . . . . . . . . . . . . . . . . . . . . . 7,941,354 77,825,272PIMCO Real Return Institutional . . . . . . . . . . . . . . . . . . . . . . . . . . . . . . . . . . . . . . . . . . . . . . . . . . . . . . . . . . . . . . . 3,954,848 44,452,495PIMCO Total Return Institutional . . . . . . . . . . . . . . . . . . . . . . . . . . . . . . . . . . . . . . . . . . . . . . . . . . . . . . . . . . . . . . . 10,753,801 111,194,305Vanguard International Growth Fund Admiral Class . . . . . . . . . . . . . . . . . . . . . . . . . . . . . . . . . . . . . . . . . . . . . . . . . . . 323,658 33,268,754Western Asset Core Plus Bond IS . . . . . . . . . . . . . . . . . . . . . . . . . . . . . . . . . . . . . . . . . . . . . . . . . . . . . . . . . . . . . . 8,369,554 100,099,861Total Open-End Mutual Funds . . . . . . . . . . . . . . . . . . . . . . . . . . . . . . . . . . . . . . . . . . . . . . . . . . . . . . . . . . . . . . . . $ 461,102,157Total Investments in Securities of Unaffiliated Issuers – 41.6% (Cost $448,745,754) . . . . . . . . . . . . . . . . . . . . . . . . . . . . . . . . . . . . (a) $ 461,102,157Total Investments in Affiliates – 58.4% (Cost $593,145,473) (see schedule below) (a) 648,740,702Liabilities in Excess of Other Assets – 0.0% (344,626)Net Assets – 100.0% $1,109,498,233
Percentages are stated as a percent of net assets.Footnotes:
(a) Represents cost for financial reporting purposes, which may differ from cost basis for federal income tax purposes. See also Note 8 of the Notes to FinancialStatements.
The accompanying notes are an integral part of these financial statements.
Schedule of Investments in Affiliates December 31, 2019
AffiliateValue at
January 1, 2019Cost of
Purchases TransfersProceeds
from SalesNet RealizedGain (Loss)
Change inUnrealized
Appreciation(Depreciation)
IncomeDistributions
Capital GainDistributions
Shares atDecember 31,
2019
Value atDecember 31,
2019
Open-End Mutual Funds – 58.4%Fidelity Advisor® Mid Cap II Class I . (a) $ 33,130,964 $ 2,340,389 $ — $38,552,582 $(3,608,766) $ 6,689,995 $ — $ 996,841 — $ —Fidelity Advisor® Real Estate I . . . . (b) 11,117,605 2,526,473 — 4,101,758 58,755 1,488,510 217,396 649,643 503,843 11,089,585ON BlackRock Advantage Large
Cap Core Portfolio. . . . . . . . . (b) 32,873,140 121,311 29,007,412 39,204,641 (3,491,652) 2,873,599 111,535 — 673,116 22,179,169ON BlackRock Advantage Large
Cap Growth Portfolio . . . . . . . (b) — 23,571,818 — 2,806,357 103,196 1,310,512 95,326 678,427 805,344 22,179,169ON BlackRock Advantage Large
Cap Value Portfolio . . . . . . . . (b) 68,460,865 4,329,122 — 15,564,511 1,468,081 7,843,951 1,938,950 666,571 3,548,667 66,537,508ON BlackRock Advantage Small
Cap Growth Portfolio . . . . . . . (b) — 12,292,057 11,367,808 3,130,866 (747,017) 2,397,187 11,542 159,419 705,893 22,179,169ON Bond Portfolio . . . . . . . . . . (b) 46,653,347 13,997,556 — 10,219,652 404,891 4,611,781 1,197,248 — 2,903,033 55,447,923ON ClearBridge Small Cap Portfolio . (a) 21,582,749 2,671,685 (11,367,808) 16,553,780 3,598,966 68,188 24,745 631,636 — —ON Equity Portfolio . . . . . . . . . . (a) 33,632,658 3,144,024 (29,007,412) 16,116,116 6,068,564 2,278,282 189,305 2,763,696 — —ON Federated High Income Bond
Portfolio . . . . . . . . . . . . . . (b) 46,073,588 2,400,450 — 8,703,710 721,480 3,866,531 1,835,675 — 2,143,951 44,358,339ON International Equity Portfolio . . (b) 104,680,132 3,269,546 — 39,216,608 (4,374,472) 18,813,287 1,359,123 — 5,359,013 83,171,885ON Janus Henderson Enterprise
Portfolio . . . . . . . . . . . . . . (b) 11,370,364 914,696 — 4,259,426 167,938 2,896,013 — 531,264 228,510 11,089,585ON Janus Henderson Forty
Portfolio . . . . . . . . . . . . . . (b) 11,381,204 13,636,237 — 8,381,977 407,746 5,135,959 — 1,711,330 851,081 22,179,169ON Nasdaq-100® Index Portfolio . . (b) 22,571,601 4,149,486 — 9,040,377 808,476 3,689,983 107,324 2,934,261 1,118,466 22,179,169ON S&P 500® Index Portfolio . . . . (b) 147,536,690 29,945,871 — 50,973,854 9,278,066 19,467,412 1,871,021 12,763,685 4,663,688 155,254,185ON S&P MidCap 400® Index
Portfolio . . . . . . . . . . . . . . (b) 77,497,515 38,760,059 — 25,944,651 (890,039) 21,472,963 923,850 — 5,760,823 110,895,847Total Open-End Mutual Funds . . . . $ 9,974,213 $104,904,153 $9,883,040 $24,486,773 $648,740,702
Percentages are stated as a percent of net assets.Footnotes:
(a) Pursuant to Section 2(a)(3) of the Investment Company Act of 1940, the investment met the definition of “affiliated person” at a point in time during the year endedDecember 31, 2019, as the Portfolio directly or indirectly owned, controlled, or held with power to vote 5 percent or more of the outstanding voting securities of theholding.
(b) Pursuant to Section 2(a)(3) of the Investment Company Act of 1940, the investment meets the definition of “affiliated person”, as the Portfolio directly or indirectlyowns, controls, or holds with power to vote 5 percent or more of the outstanding voting securities of the holding at December 31, 2019.
The accompanying notes are an integral part of these financial statements.
Ohio National Fund, Inc. ON Balanced Model Portfolio
Schedule of Investments in Unaffiliated Issuers December 31, 2019
124

Objective/Strategy
The ON Moderate Growth Model Portfolio is a fund of funds that seeksgrowth of capital and moderate current income with a greater emphasison growth of capital by investing in underlying mutual funds. Undernormal circumstances, the Portfolio intends to have investment exposureto various asset classes within the following target asset allocationranges: U.S. Equity 40-60%, International Equity 15-35%, and FixedIncome 10-30%.
Performance as of December 31, 2019
Average Annual returnsOne year 23.81%Since inception (3/1/17) 7.55%
Past performance does not guarantee future results. The performance dataquoted represents past performance and current returns may be lower or higher.Total return figures include change in share price and reinvestment of dividendsand capital gains. The investment return and principal value will fluctuate so thatan investor’s shares, when redeemed, may be worth more or less than the originalcost. To obtain performance information up to the most recent month end, calltoll-free 1-877-781-6392.
The Portfolio is not open to direct retail investment. Beneficial interest in shares isobtained solely by purchase of variable life insurance policies and variable annuitycontracts. Actual performance results for variable annuity and variable universallife contracts will be lower due to contract charges. Consult your contract forapplicable charges.
Total gross expense ratio is estimated to be 1.07% per the Fund’s prospectus datedNovember 22, 2019. Additional information pertaining to the Portfolio’s expenseratio as of December 31, 2019 can be found in the Portfolio’s Financial Highlights.The Portfolio’s expense ratio included in the Financial Highlights does not includeAcquired Fund Fees and Expenses (AFFE), which is a major component of theexpense ratio that is required to be presented in the Fund’s prospectus. TheAdviser has contractually agreed to make payments to the Fund to the extentnecessary to maintain the Portfolio’s expense ratio (including AFFE, but excludingcertain other expenses) at 1.07% through April 30, 2020.
Comments from Adviser
Q. How did the Portfolio perform in comparison to its benchmark duringthe reporting period?
A. For the year ended December 31, 2019, the Portfolio returned 23.81%versus 22.95% for its benchmark, the Morningstar® ModeratelyAggressive Target Risk Index.
Q. Were there specific market conditions, investment strategies, ortechniques that materially affected the Portfolio’s benchmark-relativeperformance during the reporting period?
A. In 2019, domestic and foreign equity markets provided large positivereturns. Domestic stocks generally outperformed foreign stocks, andlarge cap stocks generally outperformed mid cap and small cap stocks.Growth stocks materially outperformed value stocks during the year. ThePortfolio’s large cap and domestic stock holdings benefited relativeperformance. (1)
Fixed income markets also provided positive returns for the year. Interestrates declined across the curve, as the Federal Reserve reduced theFederal Funds rate by 75 basis points during the year. In this environment,longer duration bonds outperformed shorter duration bonds. Corporatecredit spreads tightened, and lower quality bonds outperformed higherquality bonds during the year. The Portfolio’s overweight to corporateand high yield bonds benefited performance, while its exposure to shortterm bonds detracted from performance versus the benchmark. (1)
Q. How did asset class allocation impact the Portfolio’s performancerelative to its benchmark?
A. The Portfolio invests in affiliated and unaffiliated open-end mutualfunds, comprised mostly of equity funds, but also some fixed incomefunds. The asset allocation between fixed income funds and equity fundswas roughly in-line with the benchmark. On the equity side, theoverweight allocation to large cap, domestic, and growth equity fundsbenefited performance versus the benchmark, while exposure toemerging market funds detracted from relative performance. On the fixedincome side, the overweight allocation to corporate and high yield bondsaided performance versus the benchmark, while the allocation to shorterbonds detracted from performance relative to the benchmark during theperiod. (1)
Q. Which holdings contributed the most to, and detracted the most from,the Portfolio’s benchmark-relative performance?
A. The top three performing funds in the Portfolio were the ONNasdaq-100® Index Portfolio, ON Blackrock Advantage Large CapGrowth Portfolio, and ON Janus Henderson Forty Portfolio. Each of thePortfolios benefited from its exposure to domestic growth stocks. The topthree funds that detracted from performance versus the benchmarkwere PIMCO Low Duration Institutional, PIMCO Real Return Institutional,and Western Asset Core Bond IS. PIMCO Low Duration Institutionalunderperformed due to its shorter duration and exposure to higherquality bonds. PIMCO Real Return Institutional focuses on inflationprotected securities and underperformed in an environment of lowinflation. Lastly, Western Asset Core Bond IS performed well, but wasone of the few bond funds in the Portfolio, all of which underperformedthe equity based funds held by the Portfolio.(1)
(1) The Portfolio’s composition is subject to change. Holdings and weightings areas of December 31, 2019.
Change in Value of $10,000 Investment
ON Moderate Growth Model Portfolio (A)Morningstar® Moderately Aggressive Target Risk Index (B)
9,500
10,000
10,500
11,000
11,500
12,000
12,500
$13,000
6/1
712
/17
6/1
812
/18
6/1
9
3
/1/1
712
/19
$12,944 (B)
$12,294 (A)
Hypothetical illustration based on past performance. Future performance will vary.The Portfolio’s returns reflect reinvested dividends. The Portfolio’s holdings maydiffer significantly from the securities in the index. The index is unmanaged andtherefore does not reflect the cost of portfolio management and accounting.
The Morningstar®rr Target Risk Index Family is a series of Morningstar Indexes thatprovide exposure to a broad array of asset classes using Morningstar assetallocation methodology. The index family provides global equity market risk levelsthat are scaled to fit five equity market risk profiles: aggressive, moderatelyaggressive, moderate, moderately conservative, and conservative. The five levelsof global equity exposure are set at 95%, 80%, 60%, 40%, and 20%, respectively,and the Morningstar®rr Moderately Aggressive Target Risk Index exposure is set at80%.
Past performance is no guarantee of future results. Redemption of fund sharescould have tax implications unique to each shareholder.
Ohio National Fund, Inc. ON Moderate Growth Model Portfolio (Unaudited)
125 (continued)

Portfolio Composition as of December 31, 2019 (1)
% of Net AssetsOpen-End Mutual Funds
Less Net Liabilities 100.0100.0
Top 10 Portfolio Holdings as of December 31, 2019 (1) (2) (3)
% of Net Assets1. ON S&P 500® Index Portfolio 17.02. ON S&P MidCap 400® Index Portfolio 11.03. Western Asset Core Plus Bond IS 10.04. ON International Equity Portfolio 10.05. ON BlackRock Advantage Large Cap
Value Portfolio7.0
6. DFA International Core Equity PortfolioInstitutional
6.0
7. ON BlackRock Advantage Large CapCore Portfolio
4.0
8. ON Janus Henderson Forty Portfolio 4.09. ON Nasdaq-100® Index Portfolio 4.0
10. Vanguard International Growth FundAdmiral Class
4.0
(1) Composition of Portfolio subject to change.(2) Short-term investments have been excluded from the list of Top 10 Portfolio Holdings.(3) Top 10 Portfolio Holdings is presented at an individual security level. Total investment exposure by issuer may be higher.
Ohio National Fund, Inc. ON Moderate Growth Model Portfolio (Unaudited) (Continued)
126

Open-End Mutual Funds – 27.3% Shares Value
DFA Emerging Markets Portfolio Institutional . . . . . . . . . . . . . . . . . . . . . . . . . . . . . . . . . . . . . . . . . . . . . . . . . . . . . . . 2,015,822 $ 58,841,847DFA International Core Equity Portfolio Institutional . . . . . . . . . . . . . . . . . . . . . . . . . . . . . . . . . . . . . . . . . . . . . . . . . . . 8,521,629 117,683,694Lazard Emerging Markets Equity Class R6 . . . . . . . . . . . . . . . . . . . . . . . . . . . . . . . . . . . . . . . . . . . . . . . . . . . . . . . . . 2,123,871 39,227,898PIMCO Low Duration Institutional . . . . . . . . . . . . . . . . . . . . . . . . . . . . . . . . . . . . . . . . . . . . . . . . . . . . . . . . . . . . . . 4,614,916 45,226,173Vanguard International Growth Fund Admiral Class . . . . . . . . . . . . . . . . . . . . . . . . . . . . . . . . . . . . . . . . . . . . . . . . . . . 763,263 78,455,796Western Asset Core Plus Bond IS . . . . . . . . . . . . . . . . . . . . . . . . . . . . . . . . . . . . . . . . . . . . . . . . . . . . . . . . . . . . . . 16,447,431 196,711,281Total Open-End Mutual Funds . . . . . . . . . . . . . . . . . . . . . . . . . . . . . . . . . . . . . . . . . . . . . . . . . . . . . . . . . . . . . . . . $ 536,146,689Total Investments in Securities of Unaffiliated Issuers – 27.3% (Cost $523,802,182) . . . . . . . . . . . . . . . . . . . . . . . . . . . . . . . . . . . . (a) $ 536,146,689Total Investments in Affiliates – 72.7% (Cost $1,293,298,993) (see schedule below) (a) 1,425,934,091Liabilities in Excess of Other Assets – 0.0% (695,697)Net Assets – 100.0% $1,961,385,083
Percentages are stated as a percent of net assets.Footnotes:
(a) Represents cost for financial reporting purposes, which may differ from cost basis for federal income tax purposes. See also Note 8 of the Notes to FinancialStatements.
The accompanying notes are an integral part of these financial statements.
Schedule of Investments in Affiliates December 31, 2019
AffiliateValue at
January 1, 2019Cost of
Purchases TransfersProceeds
from SalesNet RealizedGain (Loss)
Change inUnrealized
Appreciation(Depreciation)
IncomeDistributions
Capital GainDistributions
Shares atDecember 31,
2019
Value atDecember 31,
2019
Open-End Mutual Funds – 72.7%Fidelity Advisor® Mid Cap II Class I . (a) $ 76,368,521 $ 3,353,646 $ — $86,639,233 $ (8,928,633) $ 15,845,699 $ — $ 2,308,521 — $ —Fidelity Advisor® Real Estate I. . . . (b) 19,006,606 4,717,556 — 6,723,121 (12,979) 2,625,887 378,717 1,140,239 891,138 19,613,949ON BlackRock Advantage Large
Cap Core Portfolio. . . . . . . . . (b) 56,954,349 402,628 54,241,941 30,871,284 (14,731,805) 12,459,967 390,722 — 2,381,056 78,455,796ON BlackRock Advantage Large
Cap Growth Portfolio . . . . . . . (b) 57,212,499 3,724,228 — 19,551,590 3,383,876 14,072,834 250,506 1,782,838 2,136,596 58,841,847ON BlackRock Advantage Large
Cap Value Portfolio . . . . . . . . (b) 136,023,700 11,505,648 — 28,802,565 2,361,209 16,209,651 3,976,295 1,366,968 7,322,541 137,297,643ON BlackRock Advantage Small
Cap Growth Portfolio . . . . . . . (b) — 42,111,086 23,727,075 7,643,447 (5,233,995) 5,881,128 30,307 418,574 1,872,751 58,841,847ON Bond Portfolio . . . . . . . . . . (b) 49,026,543 25,740,829 — 11,369,549 507,603 4,743,395 1,467,188 — 3,594,179 68,648,821ON ClearBridge Small Cap Portfolio. (a) 18,657,039 2,739,250 (23,727,075) 4,317,105 6,220,751 427,140 42,744 1,091,049 — —ON Equity Portfolio . . . . . . . . . . (a) 58,042,295 5,120,948 (54,241,941) 27,374,633 14,433,358 4,019,973 327,003 4,773,982 — —ON Federated High Income Bond
Portfolio . . . . . . . . . . . . . . (b) 38,972,697 3,242,679 — 6,906,146 582,581 3,336,087 1,607,074 — 1,895,984 39,227,898ON International Equity Portfolio . . (b) 216,202,907 5,561,644 — 59,038,231 (5,852,032) 39,265,202 3,192,674 — 12,637,854 196,139,490ON Janus Henderson Enterprise
Portfolio . . . . . . . . . . . . . . (b) 19,601,630 1,198,548 — 6,450,324 276,059 4,988,036 — 930,935 404,161 19,613,949ON Janus Henderson Forty
Portfolio . . . . . . . . . . . . . . (b) 58,733,759 26,493,465 — 25,166,803 1,326,350 17,069,025 — 5,994,703 3,010,583 78,455,796ON Janus Henderson Venture
Portfolio . . . . . . . . . . . . . . (b) 80,707,688 9,502,328 — 59,345,029 12,960,268 (674,567) — 6,173,717 1,273,257 43,150,688ON Nasdaq-100® Index Portfolio . . (b) 77,556,500 12,229,415 — 26,717,490 2,727,819 12,659,552 376,086 10,282,288 3,956,419 78,455,796ON S&P 500® Index Portfolio . . . . (b) 312,123,952 51,992,840 — 90,330,009 17,208,134 42,442,215 3,979,417 27,146,691 10,016,135 333,437,132ON S&P MidCap 400® Index
Portfolio . . . . . . . . . . . . . . (b) 134,046,140 80,939,460 — 36,214,733 (2,407,805) 39,390,377 1,780,495 — 11,207,971 215,753,439Total Open-End Mutual Funds . . . . $ 24,820,759 $234,761,601 $17,799,228 $63,410,505 $1,425,934,091
Percentages are stated as a percent of net assets.Footnotes:
(a) Pursuant to Section 2(a)(3) of the Investment Company Act of 1940, the investment met the definition of “affiliated person” at a point in time during the year endedDecember 31, 2019, as the Portfolio directly or indirectly owned, controlled, or held with power to vote 5 percent or more of the outstanding voting securities of theholding.
(b) Pursuant to Section 2(a)(3) of the Investment Company Act of 1940, the investment meets the definition of “affiliated person”, as the Portfolio directly or indirectlyowns, controls, or holds with power to vote 5 percent or more of the outstanding voting securities of the holding at December 31, 2019.
The accompanying notes are an integral part of these financial statements.
Ohio National Fund, Inc. ON Moderate Growth Model Portfolio
Schedule of Investments in Unaffiliated Issuers December 31, 2019
127

Objective/Strategy
The ON Growth Model Portfolio is a fund of funds that seeks growth ofcapital and some current income by investing in underlying mutual funds.Under normal circumstances, the Portfolio intends to have investmentexposure to various asset classes within the following target assetallocation ranges: U.S. Equity 50-80%, International Equity 15-45%, andFixed Income 0-15%.
Performance as of December 31, 2019
Average Annual returnsOne year 26.47%Since inception (3/1/17) 8.09%
Past performance does not guarantee future results. The performance dataquoted represents past performance and current returns may be lower or higher.Total return figures include change in share price and reinvestment of dividendsand capital gains. The investment return and principal value will fluctuate so thatan investor’s shares, when redeemed, may be worth more or less than the originalcost. To obtain performance information up to the most recent month end, calltoll-free 1-877-781-6392.
The Portfolio is not open to direct retail investment. Beneficial interest in shares isobtained solely by purchase of variable life insurance policies and variable annuitycontracts. Actual performance results for variable annuity and variable universallife contracts will be lower due to contract charges. Consult your contract forapplicable charges.
Total gross expense ratio is estimated to be 1.12% per the Fund’s prospectus datedNovember 22, 2019. Additional information pertaining to the Portfolio’s expenseratio as of December 31, 2019 can be found in the Portfolio’s Financial Highlights.The Portfolio’s expense ratio included in the Financial Highlights does not includeAcquired Fund Fees and Expenses (AFFE), which is a major component of theexpense ratio that is required to be presented in the Fund’s prospectus. TheAdviser has contractually agreed to make payments to the Fund to the extentnecessary to maintain the Portfolio’s expense ratio (including AFFE, but excludingcertain other expenses) at 1.12% through April 30, 2020.
Comments from Adviser
Q. How did the Portfolio perform in comparison to its benchmark duringthe reporting period?
A. For the year ended December 31, 2019, the Portfolio returned 26.47%versus 25.91% for its benchmark, the Morningstar® Aggressive TargetRisk Index.
Q. Were there specific market conditions, investment strategies, ortechniques that materially affected the Portfolio’s benchmark-relativeperformance during the reporting period?
A. In 2019, domestic and foreign equity markets provided large positivereturns. Domestic stocks generally outperformed foreign stocks, andlarge cap stocks generally outperformed mid cap and small cap stocks.Growth stocks materially outperformed value stocks during the year. ThePortfolio’s large cap and domestic stock holdings benefited relativeperformance. (1)
Fixed income markets also provided positive returns for the year. Interestrates declined across the curve, as the Federal Reserve reduced theFederal Funds rate by 75 basis points during the year. In this environment,longer duration bonds outperformed shorter duration bonds. Corporatecredit spreads tightened, and lower quality bonds outperformed higherquality bonds during the year. The Portfolio’s overweight to corporateand high yield bonds benefited relative performance. (1)
Q. How did asset class allocation impact the Portfolio’s performancerelative to its benchmark?
A. The Portfolio invests in affiliated and unaffiliated open-end mutualfunds, comprised mostly of equity funds, but also some fixed incomefunds. The asset allocation between fixed income funds and equity fundswas roughly in-line with the benchmark. On the equity side, theoverweight allocation to large cap, domestic, and growth equity fundsbenefited performance versus the benchmark, while exposure toemerging market funds detracted from relative performance. On the fixedincome side, the overweight allocation to corporate and high yield bondsaided performance versus the benchmark, while the allocation to shorterbonds detracted from performance relative to the benchmark during theyear. (1)
Q. Which holdings contributed the most to, and detracted the most from,the Portfolio’s benchmark-relative performance?
A. The top three performing funds in the Portfolio were the ONNasdaq-100® Index Portfolio, ON Blackrock Advantage Large CapGrowth Portfolio, and ON Janus Henderson Forty Portfolio. Each of thePortfolios benefited from its exposure to domestic growth stocks. The topthree funds that detracted from performance versus the benchmarkwere Western Asset Core Plus Bond IS, ON Bond Portfolio, and ONFederated High Income Bond Portfolio. While all three of these bondportfolios performed well, they all underperformed the equity Portfoliosheld during the year. (1)
(1) The Portfolio’s composition is subject to change. Holdings and weightings areas of December 31, 2019.
Change in Value of $10,000 Investment
ON Growth Model Portfolio (A)Morningstar® Aggressive Target Risk Index (B)
9,000
10,000
11,000
12,000
13,000
$14,000
6/1
712
/17
6/1
812
/18
6/1
9
3
/1/1
712
/19
$13,273 (B)
$12,470 (A)
Hypothetical illustration based on past performance. Future performance will vary.The Portfolio’s returns reflect reinvested dividends. The Portfolio’s holdings maydiffer significantly from the securities in the index. The index is unmanaged andtherefore does not reflect the cost of portfolio management and accounting.
The Morningstar®rr Target Risk Index Family is a series of Morningstar Indexes thatprovide exposure to a broad array of asset classes using Morningstar assetallocation methodology. The index family provides global equity market risk levelsthat are scaled to fit five equity market risk profiles: aggressive, moderatelyaggressive, moderate, moderately conservative, and conservative. The five levelsof global equity exposure are set at 95%, 80%, 60%, 40%, and 20%, respectively,and the Morningstar®rr Aggressive Target Risk Index exposure is set at 95%.
Past performance is no guarantee of future results. Redemption of fund sharescould have tax implications unique to each shareholder.
Ohio National Fund, Inc. ON Growth Model Portfolio (Unaudited)
128 (continued)

Portfolio Composition as of December 31, 2019 (1)
% of Net AssetsOpen-End Mutual Funds
Less Net Liabilities 100.0100.0
Top 10 Portfolio Holdings as of December 31, 2019 (1) (2) (3)
% of Net Assets1. ON S&P 500® Index Portfolio 17.02. ON International Equity Portfolio 12.03. ON S&P MidCap 400® Index Portfolio 12.04. DFA International Core Equity Portfolio
Institutional7.0
5. ON BlackRock Advantage Large CapValue Portfolio
7.0
6. ON Nasdaq-100® Index Portfolio 7.07. ON BlackRock Advantage Large Cap
Core Portfolio5.0
8. ON Janus Henderson Forty Portfolio 5.09. Vanguard International Growth Fund
Admiral Class5.0
10. ON BlackRock Advantage Small CapGrowth Portfolio
4.5
(1) Composition of Portfolio subject to change.(2) Short-term investments have been excluded from the list of Top 10 Portfolio Holdings.(3) Top 10 Portfolio Holdings is presented at an individual security level. Total investment exposure by issuer may be higher.
Ohio National Fund, Inc. ON Growth Model Portfolio (Unaudited) (Continued)
129

Open-End Mutual Funds – 19.5% Shares Value
DFA Emerging Markets Portfolio Institutional. . . . . . . . . . . . . . . . . . . . . . . . . . . . . . . . . . . . . . . . . . . . . . . . . . . . . . . . . 520,130 $ 15,182,598DFA International Core Equity Portfolio Institutional . . . . . . . . . . . . . . . . . . . . . . . . . . . . . . . . . . . . . . . . . . . . . . . . . . . . 2,198,783 30,365,197Lazard Emerging Markets Equity Class R6 . . . . . . . . . . . . . . . . . . . . . . . . . . . . . . . . . . . . . . . . . . . . . . . . . . . . . . . . . . 587,153 10,844,713Vanguard International Growth Fund Admiral Class . . . . . . . . . . . . . . . . . . . . . . . . . . . . . . . . . . . . . . . . . . . . . . . . . . . . 211,007 21,689,425Western Asset Core Plus Bond IS. . . . . . . . . . . . . . . . . . . . . . . . . . . . . . . . . . . . . . . . . . . . . . . . . . . . . . . . . . . . . . . . 545,631 6,525,741Total Open-End Mutual Funds . . . . . . . . . . . . . . . . . . . . . . . . . . . . . . . . . . . . . . . . . . . . . . . . . . . . . . . . . . . . . . . . . . $ 84,607,674Total Investments in Securities of Unaffiliated Issuers – 19.5% (Cost $83,108,776) . . . . . . . . . . . . . . . . . . . . . . . . . . . . . . . . . . . . . . (a) $ 84,607,674Total Investments in Affiliates – 80.5% (Cost $316,732,588) (see schedule below) (a) 349,199,746Liabilities in Excess of Other Assets – 0.0% (171,730)Net Assets – 100.0% $433,635,690
Percentages are stated as a percent of net assets.Footnotes:
(a) Represents cost for financial reporting purposes, which may differ from cost basis for federal income tax purposes. See also Note 8 of the Notes to FinancialStatements.
The accompanying notes are an integral part of these financial statements.
Schedule of Investments in Affiliates December 31, 2019
AffiliateValue at
January 1, 2019Cost of
Purchases TransfersProceeds
from SalesNet RealizedGain (Loss)
Change inUnrealized
Appreciation(Depreciation)
IncomeDistributions
Capital GainDistributions
Shares atDecember 31,
2019
Value atDecember 31,
2019
Open-End Mutual Funds – 80.5%Fidelity Advisor® Mid Cap II Class I . (a) $16,756,248 $ 576,019 $ — $18,821,752 $(2,082,836) $ 3,572,321 $ — $ 511,082 — $ —Fidelity Advisor® Real Estate I . . . . (b) 4,171,062 1,092,341 — 1,495,413 (11,280) 581,175 83,677 251,396 197,087 4,337,885ON BlackRock Advantage Large
Cap Core Portfolio. . . . . . . . . (b) 16,684,342 214,774 11,120,471 7,913,168 (2,049,057) 3,632,063 108,147 — 658,253 21,689,425ON BlackRock Advantage Large
Cap Growth Portfolio . . . . . . . (b) 12,570,572 798,273 — 4,177,269 745,913 3,076,166 55,511 395,066 472,536 13,013,655ON BlackRock Advantage Large
Cap Value Portfolio . . . . . . . . (b) 29,630,978 3,178,764 — 6,499,951 562,587 3,492,817 876,776 301,417 1,619,477 30,365,195ON BlackRock Advantage Small
Cap Growth Portfolio . . . . . . . (b) — 9,457,061 12,049,590 2,179,933 (1,703,900) 1,897,665 10,087 139,313 621,276 19,520,483ON Bond Portfolio . . . . . . . . . . (b) 4,275,363 706,945 — 1,141,070 56,257 440,390 92,823 — 227,114 4,337,885ON ClearBridge Small Cap Portfolio . (a) 10,226,333 1,337,670 (12,049,590) 2,091,598 2,100,957 476,228 23,620 602,905 — —ON Equity Portfolio . . . . . . . . . . (a) 8,457,091 1,153,705 (11,120,471) 1,687,154 2,369,235 827,594 72,293 1,055,423 — —ON Federated High Income Bond
Portfolio . . . . . . . . . . . . . . (b) 4,246,399 485,464 — 822,130 62,777 365,375 177,785 — 209,661 4,337,885ON International Equity Portfolio . . (b) 55,656,074 1,503,377 — 13,920,552 (1,317,304) 10,133,026 846,505 — 3,354,035 52,054,621ON Janus Henderson Enterprise
Portfolio . . . . . . . . . . . . . . (b) 4,289,634 308,575 — 1,416,016 70,733 1,084,959 — 206,512 89,386 4,337,885ON Janus Henderson Forty
Portfolio . . . . . . . . . . . . . . (b) 17,129,289 6,456,535 — 6,905,089 407,337 4,601,353 — 1,662,712 832,288 21,689,425ON Janus Henderson Venture
Portfolio . . . . . . . . . . . . . . (b) 25,305,964 3,430,846 — 14,930,716 3,300,345 245,101 — 2,488,441 511,996 17,351,540ON Nasdaq-100® Index Portfolio . . (b) 29,738,185 4,737,621 — 9,982,119 741,362 5,130,146 145,844 3,987,412 1,531,276 30,365,195ON S&P 500® Index Portfolio . . . . (b) 72,479,169 7,180,684 — 18,860,901 3,617,912 9,327,182 881,195 6,011,315 2,215,201 73,744,046ON S&P MidCap 400® Index
Portfolio . . . . . . . . . . . . . . (b) 33,609,521 17,702,520 — 8,324,409 145,306 8,921,683 430,112 — 2,704,136 52,054,621Total Open-End Mutual Funds . . . . $ 7,016,344 $57,805,244 $3,804,375 $17,612,994 $349,199,746
Percentages are stated as a percent of net assets.Footnotes:
(a) Pursuant to Section 2(a)(3) of the Investment Company Act of 1940, the investment met the definition of “affiliated person” at a point in time during the year endedDecember 31, 2019, as the Portfolio directly or indirectly owned, controlled, or held with power to vote 5 percent or more of the outstanding voting securities of theholding.
(b) Pursuant to Section 2(a)(3) of the Investment Company Act of 1940, the investment meets the definition of “affiliated person”, as the Portfolio directly or indirectlyowns, controls, or holds with power to vote 5 percent or more of the outstanding voting securities of the holding at December 31, 2019.
The accompanying notes are an integral part of these financial statements.
Ohio National Fund, Inc. ON Growth Model Portfolio
Schedule of Investments in Unaffiliated Issuers December 31, 2019
130

ON
Bon
dPo
rtfo
lio
ON
Bla
ckRo
ckB
alan
ced
Allo
catio
nPo
rtfo
lio
ON
Inte
rnat
iona
lEq
uity
Port
folio
ON
Fore
ign
Port
folio
ON
Janu
sH
ende
rson
Fort
yPo
rtfo
lio
ON
Janu
sH
ende
rson
Vent
ure
Port
folio
ON
Janu
sH
ende
rson
Ente
rpri
sePo
rtfo
lio
Asse
ts:
Inve
stm
ents
inse
curit
ies
ofun
affil
iate
dis
suer
s,at
valu
e*..
....
....
....
....
....
....
$284
,868
,306
$543
,833
,504
$468
,013
,917
$47,
916,
148
$197
,280
,953
$170
,167
,100
$110
,109
,645
Cash
....
....
....
....
....
....
....
....
....
....
....
....
....
....
....
....
—47
,300
——
——
—Ca
shsu
bjec
tto
usag
ere
stric
tions
....
....
....
....
....
....
....
....
....
....
...
—16
3,80
054
5,49
456
,105
——
—Fo
reig
ncu
rren
cies
,atv
alue
**..
....
....
....
....
....
....
....
....
....
....
....
——
6,09
0,11
060
7,41
5—
—8,
119
Rece
ivab
lefo
rsec
uriti
esso
ld..
....
....
....
....
....
....
....
....
....
....
....
——
——
—48
0,86
028
,409
Rece
ivab
lefo
rfun
dsh
ares
sold
....
....
....
....
....
....
....
....
....
....
....
.3,
310,
919
255,
186
238,
170
25,7
8431
,478
585,
339
17,4
91Re
ceiv
able
forv
aria
tion
mar
gin
onfu
ture
sco
ntra
cts
....
....
....
....
....
....
....
..—
2,92
3—
380
——
—Di
vide
nds
and
accr
ued
inte
rest
rece
ivab
le..
....
....
....
....
....
....
....
....
...
2,51
2,01
91,
854,
975
359,
120
85,7
7768
,235
39,3
5741
,537
Fore
i gn
tax
recl
aim
rece
ivab
le..
....
....
....
....
....
....
....
....
....
....
....
9,93
727
,160
496,
179
56,7
17—
14,8
172,
499
Prep
aid
expe
nses
and
othe
rass
ets
....
....
....
....
....
....
....
....
....
....
..3,
228
7,39
47,
287
778
2,96
02,
572
1,67
2To
tala
sset
s..
....
....
....
....
....
....
....
....
....
....
....
....
....
...
290,
704,
409
546,
192,
242
475,
750,
277
48,7
49,1
0419
7,38
3,62
617
1,29
0,04
511
0,20
9,37
2Li
abili
ties:
Cash
over
draf
t...
....
....
....
....
....
....
....
....
....
....
....
....
....
..—
—33
3,52
238
1,58
7—
——
Paya
ble
fors
ecur
ities
purc
hase
d..
....
....
....
....
....
....
....
....
....
....
..—
——
——
407,
897
—Pa
yabl
efo
rfun
dsh
ares
rede
emed
....
....
....
....
....
....
....
....
....
....
...
78,9
6268
5,52
971
7,10
850
,731
291,
791
66,5
1213
4,55
2Pa
yabl
efo
rinv
estm
entm
anag
emen
tser
vice
s...
....
....
....
....
....
....
....
....
128,
852
222,
956
286,
939
30,3
3411
6,83
611
3,45
278
,179
Paya
ble
forv
aria
tion
mar
gin
onfu
ture
sco
ntra
cts
....
....
....
....
....
....
....
....
——
20,9
55—
——
—Ac
crue
dcu
stod
yex
pens
e..
....
....
....
....
....
....
....
....
....
....
....
...
2,44
410
,936
78,8
0250
,026
2,77
65,
023
3,90
7Ac
crue
dpr
ofes
sion
alfe
es..
....
....
....
....
....
....
....
....
....
....
....
...
7,48
015
,553
7,95
57,
021
7,33
67,
277
7,14
8Ac
crue
dac
coun
ting
fees
....
....
....
....
....
....
....
....
....
....
....
....
.12
,767
27,4
5218
,648
6,93
86,
989
6,96
84,
889
Accr
ued
prin
ting
and
filin
gfe
es..
....
....
....
....
....
....
....
....
....
....
...
3,24
05,
707
4,87
488
72,
286
2,03
91,
466
Othe
rlia
bilit
ies.
....
....
....
....
....
....
....
....
....
....
....
....
....
....
5,79
55,
832
5,86
35,
678
5,75
95,
752
5,71
6W
ithho
ldin
gta
xpa
yabl
e..
....
....
....
....
....
....
....
....
....
....
....
....
—57
38,1
734,
511
—26
644
6To
tall
iabi
litie
s..
....
....
....
....
....
....
....
....
....
....
....
....
....
.23
9,54
097
4,02
21,
512,
839
537,
713
433,
773
615,
186
236,
303
Net
asse
ts..
....
....
....
....
....
....
....
....
....
....
....
....
....
....
...
$290
,464
,869
$545
,218
,220
$474
,237
,438
$48,
211,
391
$196
,949
,853
$170
,674
,859
$109
,973
,069
Net
asse
tsco
nsis
tof:
Paid
inca
pita
l..
....
....
....
....
....
....
....
....
....
....
....
....
....
...
275,
534,
870
495,
811,
762
470,
548,
757
52,8
37,8
3515
5,68
7,76
612
2,65
0,82
790
,538
,381
Tota
ldis
tribu
tabl
eea
rnin
gs..
....
....
....
....
....
....
....
....
....
....
....
..14
,929
,999
49,4
06,4
583,
688,
681
(4,6
26,4
44)
41,2
62,0
8748
,024
,032
19,4
34,6
88N
etas
sets
....
....
....
....
....
....
....
....
....
....
....
....
....
....
....
.$2
90,4
64,8
69$5
45,2
18,2
20$4
74,2
37,4
38$4
8,21
1,39
1$1
96,9
49,8
53$1
70,6
74,8
59$1
09,9
73,0
69*I
nves
tmen
tsin
secu
ritie
sof
unaf
filia
ted
issu
ers,
atco
st..
....
....
....
....
....
....
...
$271
,412
,293
$497
,376
,983
$455
,838
,382
$47,
226,
702
$160
,348
,610
$126
,089
,657
$92
,057
,380
**Fo
reig
ncu
rren
cies
,atc
ost
....
....
....
....
....
....
....
....
....
....
....
....
$—
$—
$6,
049,
112
$60
2,46
3$
—$
—$
8,07
6Sh
ares
outs
tand
ing,
parv
alue
,$1
pers
hare
....
....
....
....
....
....
....
....
....
..15
,210
,114
15,8
94,3
2230
,548
,709
1,58
6,28
87,
558,
455
5,03
6,49
22,
266,
150
Auth
orize
dFu
ndsh
ares
allo
cate
dto
Portf
olio
....
....
....
....
....
....
....
....
....
.40
,000
,000
95,0
00,0
0090
,000
,000
22,0
00,0
0024
,000
,000
30,0
00,0
0021
,000
,000
Net
asse
tval
uepe
rsha
re..
....
....
....
....
....
....
....
....
....
....
....
....
.$
19.1
0$
34.3
0$
15.5
2$
30.3
9$
26.0
6$
33.8
9$
48.5
3
Ohi
oN
atio
nalF
und,
Inc.
Stat
emen
tsof
Ass
ets
and
Liab
ilitie
sD
ecem
ber3
1,20
19
The
acco
mpa
nyin
gno
tes
are
anin
tegr
alpa
rtof
thes
efin
anci
alst
atem
ents
.
131

ON
S&P
500®
Inde
xPo
rtfo
lio
ON
Bla
ckRo
ckA
dvan
tage
Larg
eCa
pVa
lue
Port
folio
ON
Fede
rate
dH
igh
Inco
me
Bon
dPo
rtfo
lio
ON
Nas
daq-
100®
Inde
xPo
rtfo
lio
ON
Bla
ckRo
ckA
dvan
tage
Larg
eCa
pCo
reP o
rtfo
lio
ON
Bla
ckRo
ckA
dvan
tage
Smal
lCa
pG
row
thPo
rtfo
lio
ON
S&P
Mid
Cap
400®
Inde
xPo
rtfo
lio
Asse
ts:
Inve
stm
ents
inse
curit
ies
ofun
affil
iate
dis
suer
s,at
valu
e*..
....
....
....
....
....
$1,2
03,9
94,5
63$3
19,3
93,2
33$1
95,5
59,5
23$3
54,3
40,4
08$4
32,8
85,1
32$2
06,2
40,9
88$4
50,8
16,5
70Ca
sh..
....
....
....
....
....
....
....
....
....
....
....
....
....
....
..1,
492,
309
5,09
0—
589,
635
29,0
0817
,103
1,99
5,26
4Ca
shsu
bjec
tto
usag
ere
stric
tions
....
....
....
....
....
....
....
....
....
...
182,
700
235,
620
—18
7,20
019
5,30
011
7,00
016
5,60
0Fo
reig
ncu
rren
cies
,atv
alue
**..
....
....
....
....
....
....
....
....
....
....
—28
4,35
9—
——
——
Rece
ivab
lefo
rfun
dsh
ares
sold
....
....
....
....
....
....
....
....
....
....
.29
8,40
928
0,99
031
7,07
753
,228
262,
898
106,
521
4,84
0Re
ceiv
able
forv
aria
tion
mar
gin
onfu
ture
sco
ntra
cts.
....
....
....
....
....
....
.1,
575
13,0
90—
—7,
210
3,12
74,
196
Divi
dend
san
dac
crue
din
tere
stre
ceiv
able
....
....
....
....
....
....
....
....
.1,
226,
964
1,09
1,10
43,
159,
444
140,
034
546,
046
113,
463
508,
973
Fore
ign
tax
recl
aim
rece
ivab
le..
....
....
....
....
....
....
....
....
....
...
—18
7,65
7—
——
—5,
440
Pre p
aid
expe
nses
and
othe
rass
ets
....
....
....
....
....
....
....
....
....
..18
,173
4,96
22,
517
5,21
46,
023
2,85
96,
072
Tota
lass
ets.
....
....
....
....
....
....
....
....
....
....
....
....
....
1,20
7,21
4,69
332
1,49
6,10
519
9,03
8,56
135
5,31
5,71
943
3,93
1,61
720
6,60
1,06
145
3,50
6,95
5Li
abili
ties:
Paya
ble
fors
ecur
ities
purc
hase
d..
....
....
....
....
....
....
....
....
....
.—
——
——
—88
6,02
5Pa
yabl
efo
rfun
dsh
ares
rede
emed
....
....
....
....
....
....
....
....
....
..4,
190,
630
595,
151
232,
156
2,18
3,69
13,
070,
836
1,58
0,72
61,
497,
239
Paya
ble
fori
nves
tmen
tman
agem
ents
ervi
ces
....
....
....
....
....
....
....
..34
1,53
518
3,26
811
8,44
610
5,88
023
3,42
613
3,28
613
3,89
6Pa
yabl
efo
rvar
iatio
nm
argi
non
futu
res
cont
ract
s..
....
....
....
....
....
....
..—
——
3,31
9—
——
Accr
ued
cust
ody
expe
nse
....
....
....
....
....
....
....
....
....
....
....
25,8
288,
907
2,54
67,
274
12,1
166,
249
15,8
94Ac
crue
dpr
ofes
sion
alfe
es..
....
....
....
....
....
....
....
....
....
....
..9,
517
7,61
57,
351
7,67
518
,763
14,6
647,
894
Accr
ued
acco
untin
gfe
es..
....
....
....
....
....
....
....
....
....
....
...
37,8
8810
,866
17,7
0311
,422
16,1
199,
848
16,2
10Ac
crue
dpr
intin
gan
dfil
ing
fees
....
....
....
....
....
....
....
....
....
....
.11
,726
3,43
32,
462
3,75
14,
487
2,41
04,
686
Othe
rlia
bilit
ies
....
....
....
....
....
....
....
....
....
....
....
....
....
6,19
55,
804
5,75
45,
814
5,90
35,
757
5,85
3W
ithho
ldin
gta
xpa
yabl
e..
....
....
....
....
....
....
....
....
....
....
....
——
—60
0—
——
Tota
llia
bilit
ies
....
....
....
....
....
....
....
....
....
....
....
....
...
4,62
3,31
981
5,04
438
6,41
82,
329,
426
3,36
1,65
01,
752,
940
2,56
7,69
7Co
mm
itmen
tsan
dco
ntin
gent
liabi
litie
s(s
eeN
ote
9of
Not
esto
Fina
ncia
lSta
tem
ents
)N
etas
sets
....
....
....
....
....
....
....
....
....
....
....
....
....
....
.$1
,202
,591
,374
$320
,681
,061
$198
,652
,143
$352
,986
,293
$430
,569
,967
$204
,848
,121
$450
,939
,258
Net
asse
tsco
nsis
tof:
Paid
inca
pita
l...
....
....
....
....
....
....
....
....
....
....
....
....
..89
5,92
9,50
231
1,85
9,53
120
1,23
4,08
524
5,15
9,63
839
0,85
5,58
918
3,43
1,79
142
0,70
6,39
7To
tald
istri
buta
ble
earn
ings
....
....
....
....
....
....
....
....
....
....
....
306,
661,
872
8,82
1,53
0(2
,581
,942
)10
7,82
6,65
539
,714
,378
21,4
16,3
3030
,232
,861
Net
asse
ts..
....
....
....
....
....
....
....
....
....
....
....
....
....
...
$1,2
02,5
91,3
74$3
20,6
81,0
61$1
98,6
52,1
43$3
52,9
86,2
93$4
30,5
69,9
67$2
04,8
48,1
21$4
50,9
39,2
58*I
nves
tmen
tsin
secu
ritie
sof
unaf
filia
ted
issu
ers,
atco
st..
....
....
....
....
....
..$
906,
492,
874
$312
,505
,358
$194
,912
,429
$262
,832
,483
$390
,902
,503
$184
,731
,640
$419
,965
,002
**Fo
reig
ncu
rren
cies
,atc
ost.
....
....
....
....
....
....
....
....
....
....
...
$—
$27
9,89
0$
—$
—$
—$
—$
—Sh
ares
outs
tand
ing,
parv
alue
,$1
pers
hare
....
....
....
....
....
....
....
....
..36
,125
,992
17,1
04,8
549,
603,
568
17,7
96,6
2413
,068
,079
6,52
0,31
923
,423
,627
Auth
orize
dFu
ndsh
ares
allo
cate
dto
Portf
olio
....
....
....
....
....
....
....
....
90,0
00,0
0075
,000
,000
45,0
00,0
0050
,000
,000
73,0
00,0
0030
,000
,000
50,0
00,0
00N
etas
setv
alue
pers
hare
....
....
....
....
....
....
....
....
....
....
....
..$
33.2
9$
18.7
5$
20.6
9$
19.8
3$
32.9
5$
31.4
2$
19.2
5
Ohi
oN
atio
nalF
und,
Inc.
Stat
emen
tsof
Ass
ets
and
Liab
ilitie
sD
ecem
ber3
1,20
19
The
acco
mpa
nyin
gno
tes
are
anin
tegr
alpa
rtof
thes
efin
anci
alst
atem
ents
.
132

ON
Bla
ckRo
ckA
dvan
tage
Larg
eCa
pG
row
thPo
rtfo
lio
ON
Risk
Man
aged
Bal
ance
dPo
rtfo
lio
ON
Cons
erva
tive
Mod
elPo
rtfo
lio
ON
Mod
erat
ely
Cons
erva
tive
Mod
elPo
rtfo
lio
ON
Bal
ance
dM
odel
Port
folio
ON
Mod
erat
eG
row
thM
odel
Port
folio
ON
Gro
wth
Mod
elPo
rtfo
lio
Asse
ts:
Inve
stm
ents
inse
curit
ies
ofun
affil
iate
dis
suer
s,at
valu
e*..
....
....
....
....
$113
,749
,353
$410
,244
,708
$48,
133,
132
$115
,134
,824
$46
1,10
2,15
7$
536,
146,
689
$84
,607
,674
Inve
stm
ents
inaf
filia
tes,
atva
lue*
*...
....
....
....
....
....
....
....
...
——
27,0
04,6
1610
8,16
9,49
564
8,74
0,70
21,
425,
934,
091
349,
199,
746
Cash
....
....
....
....
....
....
....
....
....
....
....
....
....
...
11,4
5352
,230
——
——
—Ca
shsu
bjec
tto
usag
ere
stric
tions
....
....
....
....
....
....
....
....
..44
,100
300,
560
——
——
—Re
ceiv
able
fors
ecur
ities
sold
....
....
....
....
....
....
....
....
....
..—
26,0
4125
3,93
380
9,64
35,
302,
937
7,00
4,67
169
5,61
6Re
ceiv
able
forf
und
shar
esso
ld..
....
....
....
....
....
....
....
....
..32
,241
281,
669
—37
568
,280
3,22
4—
Rece
ivab
lefo
rvar
iatio
nm
argi
non
futu
res
cont
ract
s..
....
....
....
....
...
333
——
——
——
Rece
ivab
lefo
rTBA
sale
sco
mm
itmen
ts..
....
....
....
....
....
....
....
.—
1,41
5,23
4—
——
——
Divi
dend
san
dac
crue
din
tere
stre
ceiv
able
....
....
....
....
....
....
....
98,4
191,
047,
838
——
——
—Pr
epai
dex
pens
esan
dot
hera
sset
s...
....
....
....
....
....
....
....
...
1,67
56,
071
972
2,90
813
,940
24,1
175,
314
Tota
lass
ets
....
....
....
....
....
....
....
....
....
....
....
....
113,
937,
574
413,
374,
351
75,3
92,6
5322
4,11
7,24
51,
115,
228,
016
1,96
9,11
2,79
243
4,50
8,35
0Li
abili
ties:
Paya
ble
fors
ecur
ities
purc
hase
d..
....
....
....
....
....
....
....
....
.—
7,65
1,74
95,
910
773,
689
5,11
8,96
06,
630,
305
586,
641
Paya
ble
forf
und
shar
esre
deem
ed..
....
....
....
....
....
....
....
....
655,
986
151,
623
253,
189
36,3
2925
2,25
737
7,59
010
8,97
5Pa
yabl
efo
rinv
estm
entm
anag
emen
tser
vice
s..
....
....
....
....
....
....
63,0
2230
5,26
77,
026
57,7
4732
1,95
867
3,08
414
9,02
9Pa
yabl
efo
rvar
iatio
nm
argi
non
futu
res
cont
ract
s...
....
....
....
....
....
.—
168,
815
——
——
—TB
Asa
les
com
mitm
ents
,atv
alue
(pro
ceed
s$1
,415
,234
)...
....
....
....
....
—1,
416,
142
——
——
—Ac
crue
dcu
stod
yex
pens
e..
....
....
....
....
....
....
....
....
....
..6,
435
21,9
7163
363
172
790
669
1Ac
crue
dpr
ofes
sion
alfe
es..
....
....
....
....
....
....
....
....
....
..7,
161
7,79
26,
393
6,72
38,
675
10,4
907,
162
Accr
ued
acco
untin
gfe
es..
....
....
....
....
....
....
....
....
....
...
5,60
633
,814
6,21
56,
353
6,38
96,
389
6,32
9Ac
crue
dpr
intin
gan
dfil
ing
fees
....
....
....
....
....
....
....
....
....
1,49
94,
367
1,13
92,
523
10,8
0018
,770
4,48
9Ot
herl
iabi
litie
s..
....
....
....
....
....
....
....
....
....
....
....
..5,
706
5,83
49,
233
9,58
210
,017
10,1
759,
344
Tota
llia
bilit
ies.
....
....
....
....
....
....
....
....
....
....
....
..74
5,41
59,
767,
374
289,
738
893,
577
5,72
9,78
37,
727,
709
872,
660
Net
asse
ts..
....
....
....
....
....
....
....
....
....
....
....
....
...
$113
,192
,159
$403
,606
,977
$75,
102,
915
$223
,223
,668
$1,1
09,4
98,2
33$1
,961
,385
,083
$433
,635
,690
Net
asse
tsco
nsis
tof:
Paid
inca
pita
l...
....
....
....
....
....
....
....
....
....
....
....
..96
,536
,605
330,
937,
074
73,4
92,1
7122
0,83
0,68
31,
096,
426,
876
1,95
3,15
1,31
243
5,23
1,64
9To
tald
istri
buta
ble
earn
ings
....
....
....
....
....
....
....
....
....
...
16,6
55,5
5472
,669
,903
1,61
0,74
42,
392,
985
13,0
71,3
578,
233,
771
(1,5
95,9
59)
Net
asse
ts..
....
....
....
....
....
....
....
....
....
....
....
....
...
$113
,192
,159
$403
,606
,977
$75,
102,
915
$223
,223
,668
$1,1
09,4
98,2
33$1
,961
,385
,083
$433
,635
,690
*Inv
estm
ents
inse
curit
ies
ofun
affil
iate
dis
suer
s,at
cost
....
....
....
....
....
$98
,365
,191
$344
,149
,794
$47,
082,
186
$112
,218
,149
$44
8,74
5,75
4$
523,
802,
182
$83
,108
,776
**In
vest
men
tsin
affil
iate
s,at
cost
....
....
....
....
....
....
....
....
....
$—
$—
$25,
170,
936
$99
,697
,026
$59
3,14
5,47
3$1
,293
,298
,993
$316
,732
,588
Shar
esou
tsta
ndin
g,pa
rval
ue,$
1pe
rsha
re..
....
....
....
....
....
....
...
4,11
0,39
427
,244
,322
6,69
6,64
919
,630
,531
96,6
83,1
0816
8,60
7,24
136
,330
,731
Auth
orize
dFu
ndsh
ares
allo
cate
dto
Portf
olio
....
....
....
....
....
....
....
30,0
00,0
0085
,000
,000
30,0
00,0
0070
,000
,000
200,
000,
000
300,
000,
000
100,
000,
000
Net
asse
tval
uepe
rsha
re..
....
....
....
....
....
....
....
....
....
....
$27
.54
$14
.81
$11
.21
$11
.37
$11
.48
$11
.63
$11
.94
Ohi
oN
atio
nalF
und,
Inc.
Stat
emen
tsof
Ass
ets
and
Liab
ilitie
sD
ecem
ber3
1,20
19
The
acco
mpa
nyin
gno
tes
are
anin
tegr
alpa
rtof
thes
efin
anci
alst
atem
ents
.
133

ON
Bon
dPo
rtfo
lio
ON
Bla
ckRo
ckB
alan
ced
Allo
catio
nP o
rtfo
lio
ON
Inte
rnat
iona
lEq
uity
Port
folio
ON
Fore
ign
Port
folio
ON
Janu
sH
ende
rson
Fort
yPo
rtfo
lio
ON
Janu
sH
ende
rson
Vent
ure
Port
folio
ON
Janu
sH
ende
rson
Ente
rpri
seP o
rtfo
lio
Inve
stm
enti
ncom
e:In
tere
st..
....
....
....
....
....
....
....
....
....
....
....
....
....
....
....
..$
9,72
3,40
8$
1,86
0,92
7$
—$
2$
10,9
48$
6,61
8$
—Di
vide
nds
from
unaf
filia
ted
issu
ers,
neto
ftax
esw
ithhe
ld*
....
....
....
....
....
....
....
56,3
113,
461,
317
14,2
15,5
541,
764,
290
1,53
4,30
093
2,03
81,
134,
332
Tota
linv
estm
enti
ncom
e..
....
....
....
....
....
....
....
....
....
....
....
....
9,77
9,71
95,
322,
244
14,2
15,5
541,
764,
292
1,54
5,24
893
8,65
61,
134,
332
Expe
nses
:M
anag
emen
tfee
s...
....
....
....
....
....
....
....
....
....
....
....
....
....
..1,
386,
276
1,13
8,42
13,
538,
998
437,
139
1,40
9,35
81,
397,
649
910,
177
Cust
odia
nfe
e s..
....
....
....
....
....
....
....
....
....
....
....
....
....
....
.12
,025
29,3
1431
5,27
619
3,24
813
,433
34,9
5115
,628
Dire
ctor
s’fe
es..
....
....
....
....
....
....
....
....
....
....
....
....
....
....
.23
,235
16,1
4542
,401
4,85
017
,393
16,4
309,
822
Prof
essi
onal
fees
....
....
....
....
....
....
....
....
....
....
....
....
....
....
.25
,425
28,3
2029
,650
21,1
7024
,025
23,6
3725
,813
Acco
untin
gfe
es..
....
....
....
....
....
....
....
....
....
....
....
....
....
....
53,3
0155
,399
77,0
6328
,319
29,0
5629
,901
20,2
24Ad
min
istra
tion
fees
....
....
....
....
....
....
....
....
....
....
....
....
....
....
23,0
2723
,687
34,7
9133
,389
23,6
3424
,818
23,9
47Pr
intin
gan
dfil
ing
fees
....
....
....
....
....
....
....
....
....
....
....
....
....
..17
,050
27,1
2220
,093
10,2
6113
,292
12,4
2711
,174
Com
plia
nce
expe
nse
....
....
....
....
....
....
....
....
....
....
....
....
....
...
10,7
5910
,759
10,7
5910
,759
10,7
5910
,759
10,7
59Ot
her.
....
....
....
....
....
....
....
....
....
....
....
....
....
....
....
....
.6,
385
4,34
517
,450
1,71
75,
048
6,05
92,
439
Tota
lexp
ense
s..
....
....
....
....
....
....
....
....
....
....
....
....
....
...
1,55
7,48
31,
333,
512
4,08
6,48
174
0,85
21,
545,
998
1,55
6,63
11,
029,
983
Net
inve
stm
enti
ncom
e(lo
ss).
....
....
....
....
....
....
....
....
....
....
....
..8,
222,
236
3,98
8,73
210
,129
,073
1,02
3,44
0(7
50)
(617
,975
)10
4,34
9Re
alize
d/un
real
ized
gain
(loss
)on
inve
stm
ents
,fut
ures
cont
ract
s,an
dfo
reig
ncu
rren
cyre
late
dtra
nsac
tions
:N
etre
alize
dga
in(lo
ss)o
n:In
vest
men
tsin
secu
ritie
sof
unaf
filia
ted
issu
ers,
neto
ffor
eign
capi
talg
ain
taxe
s**
....
....
.88
3,52
927
,301
,257
2,11
5,59
4(5
,546
,534
)19
,451
,811
28,9
09,7
276,
551,
258
Futu
res
cont
ract
s..
....
....
....
....
....
....
....
....
....
....
....
....
....
.—
634,
273
312,
615
47,2
05—
——
Fore
ign
curr
ency
rela
ted
trans
actio
ns..
....
....
....
....
....
....
....
....
....
...
—27
165,
606
(31,
578)
—(4
29)
36Ch
ange
inun
real
ized
appr
ecia
tion/
depr
ecia
tion
on:
Inve
stm
ents
inse
curit
ies
ofun
affil
iate
dis
suer
s..
....
....
....
....
....
....
....
....
26,0
34,2
7224
,621
,017
76,1
72,6
159,
615,
664
39,6
98,6
6223
,375
,806
26,9
33,6
72Fu
ture
sco
ntra
cts
....
....
....
....
....
....
....
....
....
....
....
....
....
...
—62
,161
(26,
533)
(3,8
68)
——
—Fo
reig
ncu
rren
cyre
late
dtra
nsac
tions
....
....
....
....
....
....
....
....
....
....
.—
345
,616
6,25
6—
(317
)49
Net
real
ized/
unre
alize
dga
inon
inve
stm
ents
,fut
ures
cont
ract
s,an
dfo
reig
ncu
rren
cyre
late
dtra
nsac
tions
....
....
....
....
....
....
....
....
....
....
....
....
....
....
.26
,917
,801
52,6
18,7
3878
,785
,513
4,08
7,14
559
,150
,473
52,2
84,7
8733
,485
,015
Chan
gein
neta
sset
sfro
mop
erat
ions
....
....
....
....
....
....
....
....
....
....
.$3
5,14
0,03
7$5
6,60
7,47
0$8
8,91
4,58
6$
5,11
0,58
5$5
9,14
9,72
3$5
1,66
6,81
2$3
3,58
9,36
4*T
axes
with
held
....
....
....
....
....
....
....
....
....
....
....
....
....
....
....
$—
$37
5$
1,68
8,11
6$
188,
006
$9,
366
$4,
734
$26
,836
**Fo
reig
nca
pita
lgai
nta
xes
....
....
....
....
....
....
....
....
....
....
....
....
...
$—
$—
$—
$15
5$
—$
—$
—
Ohi
oN
atio
nalF
und,
Inc.
Stat
emen
tsof
Ope
ratio
nsFo
rthe
Year
Ende
dD
ecem
ber3
1,20
19
The
acco
mpa
nyin
gno
tes
are
anin
tegr
alpa
rtof
thes
efin
anci
alst
atem
ents
.
134

ON
S&P
500®
Inde
xPo
rtfo
lio
ON
Bla
ckRo
ckA
dvan
tage
Larg
eCa
pVa
lue
P ort
folio
ON
Fede
rate
dH
igh
Inco
me
Bon
dPo
rtfo
lio
ON
Nas
daq-
100®
Inde
xP o
rtfo
lio
ON
Bla
ckRo
ckA
dvan
tage
Larg
eCa
pCo
rePo
rtfo
lio
ON
Bla
ckRo
ckA
dvan
tage
Smal
lCa
pG
row
thPo
rtfo
lio
ON
S&P
Mid
Cap
400®
Inde
xPo
rtfo
lio
Inve
stm
enti
ncom
e:In
tere
st..
....
....
....
....
....
....
....
....
....
....
....
....
....
....
.$
20,5
35$
—$1
2,13
6,77
1$
12,5
53$
67$
76$
6,25
8Di
vide
nds
from
unaf
filia
ted
issu
ers,
neto
ftax
esw
ithhe
ld*
....
....
....
....
....
...
23,6
51,8
7115
,033
,321
126,
993
3,66
4,60
94,
498,
751
1,18
4,67
96,
546,
327
Tota
linv
estm
enti
ncom
e..
....
....
....
....
....
....
....
....
....
....
...
23,6
72,4
0615
,033
,321
12,2
63,7
643,
677,
162
4,49
8,81
81,
184,
755
6,55
2,58
5Ex
pens
es:
Man
a gem
entf
ees.
....
....
....
....
....
....
....
....
....
....
....
....
...
3,94
7,66
92,
271,
851
1,41
1,85
71,
216,
909
1,44
8,55
689
8,43
51,
295,
536
Cust
odia
nfe
es..
....
....
....
....
....
....
....
....
....
....
....
....
....
152,
058
31,4
5612
,630
46,1
6836
,807
27,6
4911
0,53
0Di
rect
ors’
fees
....
....
....
....
....
....
....
....
....
....
....
....
....
..10
4,62
728
,945
18,1
8730
,314
17,0
539,
142
31,2
54Pr
ofes
sion
alfe
es..
....
....
....
....
....
....
....
....
....
....
....
....
..43
,976
28,8
9424
,164
26,9
7828
,120
26,1
8427
,893
Acco
untin
gfe
es..
....
....
....
....
....
....
....
....
....
....
....
....
...
158,
208
45,2
9270
,462
47,2
4136
,645
27,6
9259
,685
Adm
inis
tratio
nfe
es..
....
....
....
....
....
....
....
....
....
....
....
....
.26
,532
23,9
6822
,668
23,8
0823
,269
23,6
6425
,303
Prin
ting
and
filin
gfe
es..
....
....
....
....
....
....
....
....
....
....
....
...
40,3
5616
,532
16,7
2418
,055
36,1
8729
,350
18,6
50Co
mpl
ianc
eex
pens
e...
....
....
....
....
....
....
....
....
....
....
....
...
10,7
5910
,759
10,7
5910
,759
10,7
5910
,759
10,7
59Ot
her.
....
....
....
....
....
....
....
....
....
....
....
....
....
....
....
34,9
6410
,217
5,63
810
,276
6,07
32,
649
7,56
6To
tale
xpen
ses
....
....
....
....
....
....
....
....
....
....
....
....
....
4,51
9,14
92,
467,
914
1,59
3,08
91,
430,
508
1,64
3,46
91,
055,
524
1,58
7,17
6N
etin
vest
men
tinc
ome
....
....
....
....
....
....
....
....
....
....
....
..19
,153
,257
12,5
65,4
0710
,670
,675
2,24
6,65
42,
855,
349
129,
231
4,96
5,40
9Re
alize
d/un
real
ized
gain
(loss
)on
inve
stm
ents
,fut
ures
cont
ract
s,an
dfo
reig
ncu
rren
cyre
late
dtra
nsac
tions
:N
etre
alize
dga
in(lo
ss)o
n:In
vest
men
tsin
secu
ritie
sof
unaf
filia
ted
issu
ers.
....
....
....
....
....
....
....
108,
504,
959
1,84
3,62
9(8
97,5
68)
61,3
49,9
35(2
,209
,220
)5,
007,
440
(716
,685
)Fu
ture
sco
ntra
cts
....
....
....
....
....
....
....
....
....
....
....
....
..1,
734,
821
(4,8
67)
—76
5,03
270
6,31
158
,297
364,
584
Fore
ign
curr
ency
rela
ted
trans
actio
ns..
....
....
....
....
....
....
....
....
.—
(177
,219
)—
——
——
Chan
gein
unre
alize
dap
prec
iatio
n/de
prec
iatio
non
:In
vest
men
tsin
secu
ritie
sof
unaf
filia
ted
issu
ers.
....
....
....
....
....
....
....
188,
577,
165
42,1
50,9
8618
,766
,682
47,7
43,3
1770
,928
,870
24,4
14,7
9080
,533
,145
Futu
res
cont
ract
s..
....
....
....
....
....
....
....
....
....
....
....
....
11,2
4788
,121
—73
,642
79,1
8927
,872
48,2
39Fo
reig
ncu
rren
cyre
late
dtra
nsac
tions
....
....
....
....
....
....
....
....
...
—1,
813
——
——
—N
etre
alize
d/un
real
ized
gain
onin
vest
men
ts,f
utur
esco
ntra
cts,
and
fore
ign
curr
ency
rela
ted
trans
actio
ns..
....
....
....
....
....
....
....
....
....
....
....
298,
828,
192
43,9
02,4
6317
,869
,114
109,
931,
926
69,5
05,1
5029
,508
,399
80,2
29,2
83Ch
ange
inne
tass
ets
from
oper
atio
ns..
....
....
....
....
....
....
....
....
..$3
17,9
81,4
49$5
6,46
7,87
0$2
8,53
9,78
9$1
12,1
78,5
80$7
2,36
0,49
9$2
9,63
7,63
0$8
5,19
4,69
2*T
axes
with
held
....
....
....
....
....
....
....
....
....
....
....
....
....
...
$—
$21
6,97
7$
—$
3,89
9$
17,8
26$
—$
4,70
2
Ohi
oN
atio
nalF
und,
Inc.
Stat
emen
tsof
Ope
ratio
nsFo
rthe
Year
Ende
dD
ecem
ber3
1,20
19
The
acco
mpa
nyin
gno
tes
are
anin
tegr
alpa
rtof
thes
efin
anci
alst
atem
ents
.
135

ON
Bla
ckRo
ckA
dvan
tage
Larg
eCa
pG
row
thPo
rtfo
lio
ON
Risk
Man
aged
Bal
ance
dPo
rtfo
lio
ON
Cons
erva
tive
Mod
elPo
rtfo
lio
ON
Mod
erat
ely
Cons
erva
tive
Mod
elPo
rtfo
lio
ON
Bal
ance
dM
odel
Port
folio
ON
Mod
erat
eG
row
thM
odel
Port
folio
ON
Gro
wth
Mod
elPo
rtfo
lio
Inve
stm
enti
ncom
e:In
tere
st..
....
....
....
....
....
....
....
....
....
....
....
....
....
.$
37$
3,96
2,52
9$
—$
—$
9$
—$
—Di
vide
nds
from
unaf
filia
ted
issu
ers,
neto
ftax
esw
ithhe
ld*
....
....
....
....
...
1,48
9,61
05,
106,
323
1,66
0,83
83,
908,
695
14,3
45,1
6416
,000
,918
2,06
2,94
9Di
vide
nds
from
affil
iliat
es..
....
....
....
....
....
....
....
....
....
....
——
590,
399
1,95
5,65
49,
883,
040
17,7
99,2
283,
804,
375
Tota
linv
estm
enti
ncom
e..
....
....
....
....
....
....
....
....
....
...
1,48
9,64
79,
068,
852
2,25
1,23
75,
864,
349
24,2
28,2
1333
,800
,146
5,86
7,32
4Ex
pens
es:
Man
agem
entf
ees.
....
....
....
....
....
....
....
....
....
....
....
...
703,
802
3,42
7,19
830
3,84
891
3,09
24,
453,
269
7,74
1,62
51,
712,
153
Cust
odia
nfe
es..
....
....
....
....
....
....
....
....
....
....
....
....
26,0
2281
,970
2,66
82,
716
3,10
93,
822
2,95
2Di
rect
ors’
fees
....
....
....
....
....
....
....
....
....
....
....
....
..9,
749
34,3
957,
002
20,7
4210
0,09
217
3,84
938
,558
Prof
essi
onal
fee s
....
....
....
....
....
....
....
....
....
....
....
....
22,3
0127
,921
20,6
9223
,751
41,5
9358
,217
27,8
02Ac
coun
ting
fees
....
....
....
....
....
....
....
....
....
....
....
....
.21
,641
146,
555
24,9
0625
,460
25,6
3725
,697
25,4
33Ad
min
istra
tion
fees
....
....
....
....
....
....
....
....
....
....
....
...
23,2
5524
,668
38,3
3541
,065
47,6
4952
,635
43,1
49Pr
intin
gan
dfil
ing
fees
....
....
....
....
....
....
....
....
....
....
....
.17
,494
22,1
549,
671
13,4
0235
,671
56,9
8518
,778
Com
plia
nce
expe
nse.
....
....
....
....
....
....
....
....
....
....
....
.10
,759
10,7
5910
,759
10,7
5910
,759
10,7
5910
,759
Reco
upm
ento
fpre
viou
sly
reim
burs
edex
pens
es..
....
....
....
....
....
....
——
——
—43
1,34
211
8,81
6Ot
her.
....
....
....
....
....
....
....
....
....
....
....
....
....
....
3,08
310
,279
1,92
55,
965
29,9
4451
,971
11,3
15To
tale
xpen
ses
....
....
....
....
....
....
....
....
....
....
....
....
838,
106
3,78
5,89
941
9,80
61,
056,
952
4,74
7,72
38,
606,
902
2,00
9,71
5
Less
expe
nses
redu
ced
orre
imbu
rsed
byad
viso
r..
....
....
....
....
...
——
(220
,103
)(2
61,2
01)
(778
,985
)(2
53,3
74)
(64,
344)
Net
expe
nses
....
....
....
....
....
....
....
....
....
....
....
....
.83
8,10
63,
785,
899
199,
703
795,
751
3,96
8,73
88,
353,
528
1,94
5,37
1N
etin
vest
men
tinc
ome
....
....
....
....
....
....
....
....
....
....
..65
1,54
15,
282,
953
2,05
1,53
45,
068,
598
20,2
59,4
7525
,446
,618
3,92
1,95
3Re
alize
d/un
real
ized
gain
onin
vest
men
ts,c
apita
lgai
ndi
strib
utio
nsre
ceiv
edfro
mun
derly
ing
mut
ualf
unds
,fut
ures
cont
ract
s,an
dfo
reig
ncu
rren
cyre
late
dtra
nsac
tions
:N
etre
alize
dga
in(lo
ss)o
n:In
vest
men
tsin
secu
ritie
sof
unaf
filia
ted
issu
ers.
....
....
....
....
....
....
5,43
6,64
111
,316
,415
(3,3
31)
(190
,136
)(2
,452
,115
)(7
,506
,206
)(2
,231
,190
)In
vest
men
tsin
affil
iate
s...
....
....
....
....
....
....
....
....
....
...
——
687,
064
949,
208
9,97
4,21
324
,820
,759
7,01
6,34
4Ca
pita
lgai
ndi
strib
utio
nsre
ceiv
edfro
mun
derly
ing
unaf
filia
ted
mut
ualf
unds
....
——
225,
073
512,
203
1,36
9,50
32,
494,
288
82,4
99Ca
pita
lgai
ndi
strib
utio
nsre
ceiv
edfro
mun
derly
ing
affil
iate
dm
utua
lfun
ds..
....
——
822,
106
4,53
5,60
624
,486
,773
63,4
10,5
0517
,612
,994
Futu
res
cont
ract
s..
....
....
....
....
....
....
....
....
....
....
....
186,
618
29,2
04,4
07—
——
——
Fore
ign
curr
ency
rela
ted
trans
actio
ns..
....
....
....
....
....
....
....
.—
436
——
——
—Ch
ange
inun
real
ized
appr
ecia
tion/
depr
ecia
tion
on:
Inve
stm
ents
inse
curit
ies
ofun
affil
iate
dis
suer
s...
....
....
....
....
....
..25
,857
,410
43,3
62,5
692,
673,
060
7,74
8,09
741
,229
,284
75,0
57,8
0416
,685
,057
Inve
stm
ents
inaf
filia
tes.
....
....
....
....
....
....
....
....
....
....
.—
—3,
013,
409
16,6
59,8
2610
4,90
4,15
323
4,76
1,60
157
,805
,244
Futu
res
cont
ract
s..
....
....
....
....
....
....
....
....
....
....
....
18,0
34(4
,554
,030
)—
——
——
Net
real
ized/
unre
alize
dga
inon
inve
stm
ents
,cap
italg
ain
dist
ribut
ions
rece
ived
from
unde
rlyin
gm
utua
lfun
ds,f
utur
esco
ntra
cts,
and
fore
ign
curr
ency
rela
ted
trans
actio
ns..
....
....
....
....
....
....
....
....
....
....
....
..31
,498
,703
79,3
29,7
977,
417,
381
30,2
14,8
0417
9,51
1,81
139
3,03
8,75
196
,970
,948
Chan
gein
neta
sset
sfro
mop
erat
ions
....
....
....
....
....
....
....
....
$32,
150,
244
$84,
612,
750
$9,4
68,9
15$3
5,28
3,40
2$1
99,7
71,2
86$4
18,4
85,3
69$1
00,8
92,9
01*T
axes
with
held
....
....
....
....
....
....
....
....
....
....
....
....
...
$33
$12
,716
$—
$—
$—
$—
$—
Ohi
oN
atio
nalF
und,
Inc.
Stat
emen
tsof
Ope
ratio
nsFo
rthe
Year
Ende
dD
ecem
ber3
1,20
19
The
acco
mpa
nyin
gno
tes
are
anin
tegr
alpa
rtof
thes
efin
anci
alst
atem
ents
.
136

ON
Bon
dPo
rtfo
lio
ON
Bla
ckRo
ckB
alan
ced
Allo
catio
nPo
rtfo
lioO
NIn
tern
atio
nalE
quity
Port
folio
ON
Fore
ign
Port
folio
Year
Ende
dYe
arEn
ded
Year
Ende
dYe
arEn
ded
Year
Ende
dYe
arEn
ded
Year
Ende
dYe
arEn
ded
Dec
embe
r31,
2019
Dec
embe
r31,
2018
Dec
embe
r31,
2019
Dec
embe
r31,
2018
Dec
embe
r31,
2019
Dec
embe
r31,
2018
Dec
embe
r31,
2019
Dec
embe
r31,
2018
Incr
ease
(Dec
reas
e)in
neta
sset
s:Op
erat
ions
:N
etin
vest
men
tinc
ome
....
....
....
....
....
....
....
....
....
....
...
$8,
222,
236
$9,
665,
588
$3,
988,
732
$77
4,38
3$
10,1
29,0
73$
9,20
3,11
8$
1,02
3,44
0$
1,19
8,78
3N
etre
alize
dga
in(lo
ss)o
nin
vest
men
ts,f
utur
esco
ntra
cts,
and
fore
ign
curr
ency
rela
ted
trans
actio
ns..
....
....
....
....
....
....
....
....
....
....
.88
3,52
9(1
,332
,707
)27
,935
,557
4,73
4,97
32,
593,
815
(13,
437,
629)
(5,5
30,9
07)
920,
353
Chan
gein
unre
alize
dap
prec
iatio
n/de
prec
iatio
non
inve
stm
ents
,fut
ures
cont
ract
s,an
dfo
reig
ncu
rren
cyre
late
dtra
nsac
tions
....
....
....
....
....
....
...
26,0
34,2
72(1
8,12
1,94
5)24
,683
,181
(15,
186,
311)
76,1
91,6
98(8
1,64
0,07
4)9,
618,
052
(12,
858,
643)
Chan
gein
neta
sset
sfro
mop
erat
ions
....
....
....
....
....
....
....
...
35,1
40,0
37(9
,789
,064
)56
,607
,470
(9,6
76,9
55)
88,9
14,5
86(8
5,87
4,58
5)5,
110,
585
(10,
739,
507)
Dist
ribut
ions
tosh
areh
olde
r s..
....
....
....
....
....
....
....
....
....
.(6
,277
,707
)—
(25,
500,
324)
—(7
,735
,538
)—
(765
,355
)—
Capi
talt
rans
actio
ns:
Rece
ived
from
shar
esso
ld..
....
....
....
....
....
....
....
....
....
..61
,748
,018
38,6
82,2
3218
,470
,860
10,9
20,6
6714
,258
,974
522,
211,
794
3,43
4,13
77,
071,
488
Rece
ived
from
shar
esis
sued
inre
orga
niza
tions
....
....
....
....
....
....
.—
—46
2,05
5,75
6—
——
——
R ece
ived
from
divi
dend
sre
inve
sted
....
....
....
....
....
....
....
....
..6,
277,
707
—25
,500
,324
—7,
735,
538
—76
5,35
5—
P aid
fors
hare
sre
deem
ed..
....
....
....
....
....
....
....
....
....
...
(64,
113,
870)
(88,
523,
835)
(45,
479,
414)
(16,
074,
459)
(147
,693
,116
)(7
5,66
6,96
0)(1
5,41
9,95
8)(2
0,93
6,08
4)Ch
ange
inne
tass
ets
from
capi
talt
rans
actio
ns..
....
....
....
....
....
..3,
911,
855
(49,
841,
603)
460,
547,
526
(5,1
53,7
92)
(125
,698
,604
)44
6,54
4,83
4(1
1,22
0,46
6)(1
3,86
4,59
6)Ch
ange
inne
tass
ets
....
....
....
....
....
....
....
....
....
....
32,7
74,1
85(5
9,63
0,66
7)49
1,65
4,67
2(1
4,83
0,74
7)(4
4,51
9,55
6)36
0,67
0,24
9(6
,875
,236
)(2
4,60
4,10
3)N
etas
sets
:Be
ginn
ing
ofye
ar..
....
....
....
....
....
....
....
....
....
....
....
.25
7,69
0,68
431
7,32
1,35
153
,563
,548
68,3
94,2
9551
8,75
6,99
415
8,08
6,74
555
,086
,627
79,6
90,7
30En
dof
year
....
....
....
....
....
....
....
....
....
....
....
....
...
$290
,464
,869
$257
,690
,684
$545
,218
,220
$53
,563
,548
$47
4,23
7,43
8$5
18,7
56,9
94$
48,2
11,3
91$
55,0
86,6
27
Ohi
oN
atio
nalF
und,
Inc.
Stat
emen
tsof
Chan
ges
inN
etA
sset
s
The
acco
mpa
nyin
gno
tes
are
anin
tegr
alpa
rtof
thes
efin
anci
alst
atem
ents
.
137

ON
Janu
sH
ende
rson
Fort
yPo
rtfo
lioO
NJa
nus
Hen
ders
onVe
ntur
ePo
rtfo
lioO
NJa
nus
Hen
ders
onEn
terp
rise
Port
folio
ON
S&P
500®
Inde
xPo
rtfo
lioY e
arEn
ded
Year
Ende
dYe
arEn
ded
Year
Ende
dYe
arEn
ded
Year
Ende
dYe
arEn
ded
Year
Ende
dD
ecem
ber3
1,20
19D
ecem
ber3
1,20
18D
ecem
ber3
1,20
19D
ecem
ber3
1,20
18D
ecem
ber3
1,20
19D
ecem
ber3
1,20
18D
ecem
ber3
1,20
19D
ecem
ber3
1,20
18In
crea
se(D
ecre
ase)
inne
tass
ets:
Oper
atio
ns:
Net
inve
stm
enti
ncom
e(lo
ss)
....
....
....
....
....
....
....
....
..$
(750
)$
(181
,828
)$
(617
,975
)$
(597
,775
)$
104,
349
$59
,084
$19
,153
,257
$19
,156
,628
Net
real
ized
gain
onin
vest
men
ts,f
utur
esco
ntra
cts,
and
fore
ign
curr
ency
rela
ted
trans
actio
ns..
....
....
....
....
....
....
....
....
....
.19
,451
,811
9,04
4,08
628
,909
,298
36,5
13,5
616,
551,
294
19,9
72,9
8611
0,23
9,78
012
3,48
0,16
7Ch
ange
inun
real
ized
appr
ecia
tion/
depr
ecia
tion
onin
vest
men
ts,f
utur
esco
ntra
cts,
and
fore
ign
curr
ency
rela
ted
trans
actio
ns..
....
....
....
.39
,698
,662
(14,
617,
276)
23,3
75,4
89(4
6,18
8,02
1)26
,933
,721
(26,
217,
301)
188,
588,
412
(196
,611
,132
)Ch
ange
inne
tass
ets
from
oper
atio
ns..
....
....
....
....
....
....
59,1
49,7
23(5
,755
,018
)51
,666
,812
(10,
272,
235)
33,5
89,3
64(6
,185
,231
)31
7,98
1,44
9(5
3,97
4,33
7)Di
strib
utio
nsto
shar
ehol
ders
....
....
....
....
....
....
....
....
..(1
5,11
9,87
4)—
(24,
504,
430)
—(5
,240
,352
)—
(112
,068
,403
)—
Capi
talt
rans
actio
ns:
Rece
ived
from
shar
esso
ld..
....
....
....
....
....
....
....
....
..47
,877
,936
131,
184,
789
13,4
07,1
4428
,648
,853
5,72
4,81
157
,214
,680
100,
470,
240
347,
702,
650
Rece
ived
from
divi
dend
sre
inve
sted
....
....
....
....
....
....
....
.15
,119
,874
—24
,504
,430
—5,
240,
352
—11
2,06
8,40
3—
Paid
fors
hare
sre
deem
ed..
....
....
....
....
....
....
....
....
...
(59,
415,
089)
(36,
734,
844)
(101
,846
,524
)(8
7,14
3,67
2)(3
1,93
2,16
8)(2
6,24
1,83
8)(3
27,3
98,8
50)
(326
,345
,158
)Ch
ange
inne
tass
ets
from
capi
talt
rans
actio
ns..
....
....
....
....
..3,
582,
721
94,4
49,9
45(6
3,93
4,95
0)(5
8,49
4,81
9)(2
0,96
7,00
5)30
,972
,842
(114
,860
,207
)21
,357
,492
Chan
gein
neta
sset
s..
....
....
....
....
....
....
....
....
..47
,612
,570
88,6
94,9
27(3
6,77
2,56
8)(6
8,76
7,05
4)7,
382,
007
24,7
87,6
1191
,052
,839
(32,
616,
845)
Net
asse
ts:
Begi
nnin
gof
year
....
....
....
....
....
....
....
....
....
....
..14
9,33
7,28
360
,642
,356
207,
447,
427
276,
214,
481
102,
591,
062
77,8
03,4
511,
111,
538,
535
1,14
4,15
5,38
0En
dof
year
....
....
....
....
....
....
....
....
....
....
....
...
$196
,949
,853
$149
,337
,283
$17
0,67
4,85
9$2
07,4
47,4
27$1
09,9
73,0
69$1
02,5
91,0
62$1
,202
,591
,374
$1,1
11,5
38,5
35
Ohi
oN
atio
nalF
und,
Inc.
Stat
emen
tsof
Chan
ges
inN
etA
sset
s
The
acco
mpa
nyin
gno
tes
are
anin
tegr
alpa
rtof
thes
efin
anci
alst
atem
ents
.
138

ON
Bla
ckRo
ckA
dvan
tage
Larg
eCa
pVa
lue
Port
folio
ON
Fede
rate
dH
igh
Inco
me
Bon
dPo
rtfo
lioO
NN
asda
q-10
0®In
dex
Port
folio
ON
Bla
ckRo
ckA
dvan
tage
Larg
eCa
pCo
reP o
rtfo
lioYe
arEn
ded
Year
Ende
dYe
arEn
ded
Year
Ende
dYe
arEn
ded
Year
Ende
dYe
arEn
ded
Year
Ende
dD
ecem
ber3
1,20
19D
ecem
ber3
1,20
18D
ecem
ber3
1,20
19D
ecem
ber3
1,20
18D
ecem
ber3
1,20
19D
ecem
ber3
1,20
18D
ecem
ber3
1,20
19D
ecem
ber3
1,20
18In
crea
se(D
ecre
ase)
inne
tass
ets:
Oper
atio
ns:
Net
inve
stm
enti
ncom
e..
....
....
....
....
....
....
....
....
....
...
$12
,565
,407
$17
,166
,976
$10
,670
,675
$15
,221
,264
$2,
246,
654
$2,
359,
160
$2,
855,
349
$1,
258,
378
Net
real
ized
gain
(loss
)on
inve
stm
ents
,fut
ures
cont
ract
s,an
dfo
reig
ncu
rren
cyre
late
dtra
nsac
tions
....
....
....
....
....
....
....
....
....
....
.1,
661,
543
15,2
50,0
75(8
97,5
68)
(539
,202
)62
,114
,967
47,3
05,8
84(1
,502
,909
)21
,820
,877
Chan
gein
unre
alize
dap
prec
iatio
n/de
prec
iatio
non
inve
stm
ents
,fut
ures
cont
ract
s,an
dfo
reig
ncu
rren
cyre
late
dtra
nsac
tions
....
....
....
....
..42
,240
,920
(75,
279,
284)
18,7
66,6
82(2
1,61
3,36
4)47
,816
,959
(58,
771,
178)
71,0
08,0
59(5
5,65
9,59
5)Ch
ange
inne
tass
ets
from
oper
atio
ns..
....
....
....
....
....
....
...
56,4
67,8
70(4
2,86
2,23
3)28
,539
,789
(6,9
31,3
02)
112,
178,
580
(9,1
06,1
34)
72,3
60,4
99(3
2,58
0,34
0)Di
strib
utio
nsto
shar
ehol
ders
....
....
....
....
....
....
....
....
....
.(1
2,49
8,62
6)—
(8,1
86,7
05)
—(4
7,51
9,64
1)—
(2,1
59,1
53)
—Ca
pita
ltra
nsac
tions
:Re
ceiv
edfro
msh
ares
sold
....
....
....
....
....
....
....
....
....
..18
,418
,626
32,5
10,0
1618
,147
,369
22,5
84,9
5432
,049
,119
203,
694,
976
7,05
6,98
624
,292
,885
Rece
ived
from
shar
esis
sued
inre
orga
niza
tions
....
....
....
....
....
...
——
——
——
312,
578,
298
—Re
ceiv
edfro
mdi
vide
nds
rein
vest
ed..
....
....
....
....
....
....
....
..12
,498
,626
—8,
186,
705
—47
,519
,641
—2,
159,
153
—Pa
idfo
rsha
res
rede
emed
....
....
....
....
....
....
....
....
....
...
(76,
044,
468)
(264
,473
,671
)(5
0,11
7,30
5)(1
32,6
23,9
08)
(118
,823
,588
)(1
24,2
24,1
69)
(116
,770
,432
)(6
0,06
9,87
2)Ch
ange
inne
tass
ets
from
capi
talt
rans
actio
ns..
....
....
....
....
....
(45,
127,
216)
(231
,963
,655
)(2
3,78
3,23
1)(1
10,0
38,9
54)
(39,
254,
828)
79,4
70,8
0720
5,02
4,00
5(3
5,77
6,98
7)Ch
ange
inne
tass
ets
....
....
....
....
....
....
....
....
....
..(1
,157
,972
)(2
74,8
25,8
88)
(3,4
30,1
47)
(116
,970
,256
)25
,404
,111
70,3
64,6
7327
5,22
5,35
1(6
8,35
7,32
7)N
etas
sets
:Be
ginn
ing
o fye
ar..
....
....
....
....
....
....
....
....
....
....
...
321,
839,
033
596,
664,
921
202,
082,
290
319,
052,
546
327,
582,
182
257,
217,
509
155,
344,
616
223,
701,
943
End
ofye
ar..
....
....
....
....
....
....
....
....
....
....
....
...
$320
,681
,061
$32
1,83
9,03
3$1
98,6
52,1
43$
202,
082,
290
$35
2,98
6,29
3$
327,
582,
182
$43
0,56
9,96
7$1
55,3
44,6
16
Ohi
oN
atio
nalF
und,
Inc.
Stat
emen
tsof
Chan
ges
inN
etA
sset
s
The
acco
mpa
nyin
gno
tes
are
anin
tegr
alpa
rtof
thes
efin
anci
alst
atem
ents
.
139
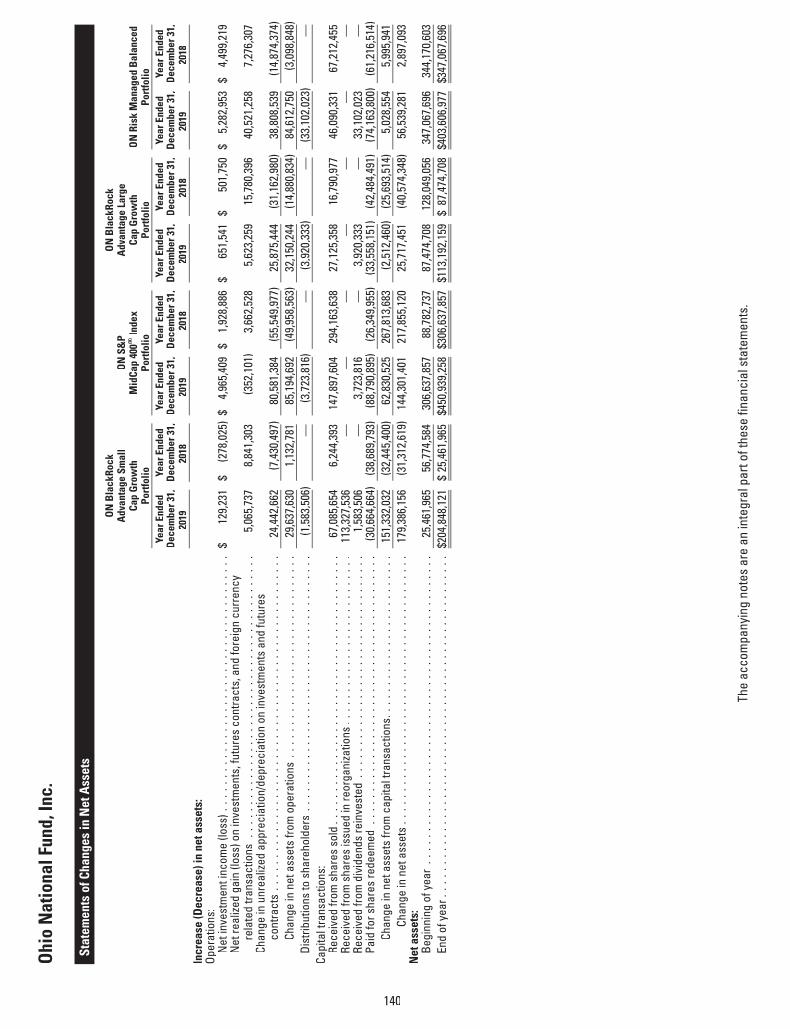
ON
Bla
ckRo
ckA
dvan
tage
Smal
lCa
pG
row
thPo
rtfo
lio
ON
S&P
Mid
Cap
400®
Inde
xP o
rtfo
lio
ON
Bla
ckRo
ckA
dvan
tage
Larg
eCa
pG
row
thP o
rtfo
lioO
NRi
skM
anag
edB
alan
ced
P ort
folio
Year
Ende
dYe
arEn
ded
Year
Ende
dYe
arEn
ded
Year
Ende
dYe
arEn
ded
Year
Ende
dYe
arEn
ded
Dec
embe
r31,
2019
Dec
embe
r31,
2018
Dec
embe
r31,
2019
Dec
embe
r31,
2018
Dec
embe
r31,
2019
Dec
embe
r31,
2018
Dec
embe
r31,
2019
Dec
embe
r31,
2018
Incr
ease
(Dec
reas
e)in
neta
sset
s:O p
erat
ions
:N
etin
vest
men
tinc
ome
(loss
)...
....
....
....
....
....
....
....
....
....
$12
9,23
1$
(278
,025
)$
4,96
5,40
9$
1,92
8,88
6$
651,
541
$50
1,75
0$
5,28
2,95
3$
4,49
9,21
9N
etre
alize
dga
in(lo
ss)o
nin
vest
men
ts,f
utur
esco
ntra
cts,
and
fore
ign
curr
ency
rela
ted
trans
actio
ns..
....
....
....
....
....
....
....
....
....
....
.5,
065,
737
8,84
1,30
3(3
52,1
01)
3,66
2,52
85,
623,
259
15,7
80,3
9640
,521
,258
7,27
6,30
7Ch
ange
inun
real
ized
appr
ecia
tion/
depr
ecia
tion
onin
vest
men
tsan
dfu
ture
sco
ntra
cts
....
....
....
....
....
....
....
....
....
....
....
....
...
24,4
42,6
62(7
,430
,497
)80
,581
,384
(55,
549,
977)
25,8
75,4
44(3
1,16
2,98
0)38
,808
,539
(14,
874,
374)
Chan
gein
neta
sset
sfro
mop
erat
ions
....
....
....
....
....
....
....
...
29,6
37,6
301,
132,
781
85,1
94,6
92(4
9,95
8,56
3)32
,150
,244
(14,
880,
834)
84,6
12,7
50(3
,098
,848
)Di
strib
utio
nsto
shar
ehol
ders
....
....
....
....
....
....
....
....
....
...
(1,5
83,5
06)
—(3
,723
,816
)—
(3,9
20,3
33)
—(3
3,10
2,02
3)—
Capi
talt
rans
actio
ns:
Rece
ived
from
shar
esso
ld..
....
....
....
....
....
....
....
....
....
...
67,0
85,6
546,
244,
393
147,
897,
604
294,
163,
638
27,1
25,3
5816
,790
,977
46,0
90,3
3167
,212
,455
Rece
ived
from
shar
esis
sued
inre
orga
niza
tions
....
....
....
....
....
....
..11
3,32
7,53
6—
——
——
——
Rece
ived
from
divi
dend
sre
inve
sted
....
....
....
....
....
....
....
....
..1,
583,
506
—3,
723,
816
—3,
920,
333
—33
,102
,023
—Pa
idfo
rsha
res
rede
emed
....
....
....
....
....
....
....
....
....
....
.(3
0,66
4,66
4)(3
8,68
9,79
3)(8
8,79
0,89
5)(2
6,34
9,95
5)(3
3,55
8,15
1)(4
2,48
4,49
1)(7
4,16
3,80
0)(6
1,21
6,51
4)Ch
ange
inne
tass
ets
from
capi
talt
rans
actio
ns..
....
....
....
....
....
...
151,
332,
032
(32,
445,
400)
62,8
30,5
2526
7,81
3,68
3(2
,512
,460
)(2
5,69
3,51
4)5,
028,
554
5,99
5,94
1Ch
ange
inne
tass
ets
....
....
....
....
....
....
....
....
....
....
.17
9,38
6,15
6(3
1,31
2,61
9)14
4,30
1,40
121
7,85
5,12
025
,717
,451
(40,
574,
348)
56,5
39,2
812,
897,
093
Net
asse
ts:
Begi
nnin
gof
year
....
....
....
....
....
....
....
....
....
....
....
...
25,4
61,9
6556
,774
,584
306,
637,
857
88,7
82,7
3787
,474
,708
128,
049,
056
347,
067,
696
344,
170,
603
End
ofye
ar..
....
....
....
....
....
....
....
....
....
....
....
....
..$2
04,8
48,1
21$
25,4
61,9
65$4
50,9
39,2
58$3
06,6
37,8
57$1
13,1
92,1
59$
87,4
74,7
08$4
03,6
06,9
77$3
47,0
67,6
96
Ohi
oN
atio
nalF
und,
Inc.
Stat
emen
tsof
Chan
ges
inN
etA
sset
s
The
acco
mpa
nyin
gno
tes
are
anin
tegr
alpa
rtof
thes
efin
anci
alst
atem
ents
.
140

ON
Cons
erva
tive
Mod
elPo
rtfo
lio
ON
Mod
erat
ely
Cons
erva
tive
Mod
elPo
rtfo
lio
ON
Bal
ance
dM
odel
Port
folio
ON
Mod
erat
eG
row
thM
odel
P ort
folio
ON
Gro
wth
Mod
elP o
rtfo
lioYe
arEn
ded
Year
Ende
dYe
arEn
ded
Year
Ende
dYe
arEn
ded
Year
Ende
dYe
arEn
ded
Year
Ende
dYe
arEn
ded
Year
Ende
dD
ecem
ber3
1,20
19D
ecem
ber3
1,20
18D
ecem
ber3
1,20
19D
ecem
ber3
1,20
18D
ecem
ber3
1,20
19D
ecem
ber3
1,20
18D
ecem
ber3
1,20
19D
ecem
ber3
1,20
18D
ecem
ber3
1,20
19D
ecem
ber3
1,20
18In
crea
se(D
ecre
ase)
inne
tass
ets:
Oper
atio
ns:
Net
inve
stm
enti
ncom
e...
....
....
....
...
$2,
051,
534
$1,
510,
170
$5,
068,
598
$3,
575,
597
$20
,259
,475
$10
,526
,530
$25
,446
,618
$10
,080
,252
$3,
921,
953
$84
5,68
6N
etre
alize
dga
inon
inve
stm
ents
and
capi
tal
gain
dist
ribut
ions
rece
ived
from
unde
rlyin
gm
utua
lfun
ds..
....
....
....
....
....
.1,
730,
912
1,81
7,27
85,
806,
881
9,61
2,83
233
,378
,374
67,6
42,9
7783
,219
,346
127,
657,
022
22,4
80,6
4731
,124
,553
Chan
gein
unre
alize
dap
prec
iatio
n/de
prec
iatio
non
inve
stm
ents
..5,
686,
469
(6,0
39,7
04)
24,4
07,9
23(2
8,27
0,23
1)14
6,13
3,43
7(1
80,2
55,1
98)
309,
819,
405
(366
,502
,824
)74
,490
,301
(88,
888,
976)
Chan
gein
neta
sset
sfro
mop
erat
ions
....
.9,
468,
915
(2,7
12,2
56)
35,2
83,4
02(1
5,08
1,80
2)19
9,77
1,28
6(1
02,0
85,6
91)
418,
485,
369
(228
,765
,550
)10
0,89
2,90
1(5
6,91
8,73
7)Di
strib
utio
nsto
shar
ehol
ders
....
....
....
.(2
,260
,264
)—
(7,1
04,9
87)
—(2
2,64
0,29
8)—
(48,
028,
519)
—(1
2,21
3,53
3)—
Retu
rnof
capi
tal
....
....
....
....
....
..—
—(3
72,2
15)
—(1
7,49
3,34
4)—
(57,
954,
547)
—(6
,226
,565
)—
T ota
ldis
tribu
tions
....
....
....
....
....
.(2
,260
,264
)—
(7,4
77,2
02)
—(4
0,13
3,64
2)—
(105
,983
,066
)—
(18,
440,
098)
—Ca
pita
ltra
nsac
tions
:Re
ceiv
edfro
msh
ares
sold
....
....
....
...
12,4
87,4
8216
,321
,184
15,8
63,3
0617
,226
,213
21,5
87,3
1832
,601
,532
25,1
39,4
0262
,284
,294
10,3
94,2
1137
,982
,945
Rece
ived
from
divi
dend
sre
inve
sted
....
....
2,26
0,26
4—
7,47
7,20
2—
40,1
33,6
42—
105,
983,
066
—18
,440
,098
—Pa
idfo
rsha
res
rede
emed
....
....
....
....
(25,
853,
548)
(34,
326,
169)
(65,
140,
990)
(90,
882,
373)
(258
,751
,251
)(3
46,2
00,9
79)
(427
,228
,533
)(5
35,3
21,7
97)
(101
,803
,149
)(1
00,6
90,2
31)
Chan
gein
neta
sset
sfro
mca
pita
ltra
nsac
tions
....
....
....
....
....
.(1
1,10
5,80
2)(1
8,00
4,98
5)(4
1,80
0,48
2)(7
3,65
6,16
0)(1
97,0
30,2
91)
(313
,599
,447
)(2
96,1
06,0
65)
(473
,037
,503
)(7
2,96
8,84
0)(6
2,70
7,28
6)Ch
ange
inne
tass
ets
....
....
....
...
(3,8
97,1
51)
(20,
717,
241)
(13,
994,
282)
(88,
737,
962)
(37,
392,
647)
(415
,685
,138
)16
,396
,238
(701
,803
,053
)9,
483,
963
(119
,626
,023
)N
etas
sets
:Be
ginn
ing
ofye
ar..
....
....
....
....
...
79,0
00,0
6699
,717
,307
237,
217,
950
325,
955,
912
1,14
6,89
0,88
01,
562,
576,
018
1,94
4,98
8,84
52,
646,
791,
898
424,
151,
727
543,
777,
750
End
ofye
ar..
....
....
....
....
....
....
$75
,102
,915
$79
,000
,066
$223
,223
,668
$237
,217
,950
$1,1
09,4
98,2
33$1
,146
,890
,880
$1,9
61,3
85,0
83$1
,944
,988
,845
$43
3,63
5,69
0$
424,
151,
727
Ohi
oN
atio
nalF
und,
Inc.
Stat
emen
tsof
Chan
ges
inN
etA
sset
s
The
acco
mpa
nyin
gno
tes
are
anin
tegr
alpa
rtof
thes
efin
anci
alst
atem
ents
.
141

Sele
cted
per-s
hare
data
Ratio
sand
supp
leme
ntal
data
Oper
atio
nsDi
strib
utio
nsRa
tiost
oave
rage
neta
sset
s
Ratio
snet
ofex
pens
esre
duce
dor
reim
burs
edby
advis
er
Ratio
sass
umin
gno
expe
nses
redu
cedo
rre
imbu
rsed
byad
viser
Neta
sset
valu
e,be
ginn
ingo
fyea
rNe
tinv
estm
ent
inco
meNe
trea
lized
and
unre
alize
dgai
n(lo
ss)
T ota
lfro
mop
erat
ions
Distr
ibut
ions
tosh
areh
olde
rsNe
tass
etva
lue,
endo
fyea
rTo
talR
etur
n#Ex
pens
esNe
tinv
estm
ent
inco
meEx
pens
esNe
tass
ets,
endo
fye
ar(m
illio
ns)
Portf
olio
turn
over
rate
ONBo
ndPo
rtfol
ioYe
arEn
dedD
ecem
ber3
1,20
19.
..
..
..
..
..
..
..
..
$17.0
20.5
51.9
62.5
1(0.
43)
$19.1
014
.73%
0.60%
3.19%
0.60%
$290
.560
%Ye
arEn
dedD
ecem
ber3
1 ,20
18.
..
..
..
..
..
..
..
..
$17.5
60.6
4(1.
18)
(0.54
)—
$17.0
2(3.
08)%
0.59%
3.27%
0.59%
$257
.740
%Ye
arEn
dedD
ecem
ber3
1 ,20
17.
..
..
..
..
..
..
..
..
$16.5
40.0
40.9
81.0
2—
$17.5
66.1
7%0.6
3%3.1
6%0.6
3%$3
17.3
114%
Year
Ende
dDec
embe
r31,
2016
..
..
..
..
..
..
..
..
.$1
5.33
0.59
0.62
1.21
—$1
6.54
7.89%
0.65%
3.33%
0.65%
$158
.788
%Ye
arEn
dedD
ecem
ber3
1,20
15.
..
..
..
..
..
..
..
..
$15.6
50.5
6(0.
88)
(0.32
)—
$15.3
3(2.
04)%
0.64%
3.46%
0.64%
$154
.093
%
ONBl
ackR
ockB
alan
cedA
lloca
tionP
ortfo
lioYe
arEn
dedD
ecem
ber3
1,20
19.
..
..
..
..
..
..
..
..
$27.8
50.2
67.8
58.1
1(1.
66)
$34.3
029
.29%
0.59%
1.77%
0.59%
$545
.297
%(a
)
Year
Ende
dDec
embe
r31,
2018
..
..
..
..
..
..
..
..
.$3
2.60
0.40
(5.15
)(4.
75)
—$2
7.85
(14.57
)%0.7
7%1.1
6%0.7
7%$
53.6
225%
Year
Ende
dDec
embe
r31 ,
2017
..
..
..
..
..
..
..
..
.$2
6.93
0.31
5.36
5.67
—$3
2.60
21.05
%0.7
8%1.0
2%0.7
8%$
68.4
187%
Year
Ende
dDec
embe
r31 ,
2016
..
..
..
..
..
..
..
..
.$2
4.43
0.25
2.25
2.50
—$2
6.93
10.23
%0.8
0%1.0
9%0.8
0%$
57.9
194%
Year
Ende
dDec
embe
r31 ,
2015
..
..
..
..
..
..
..
..
.$2
4.15
0.28
0.24
0.52
(0.24
)$2
4.43
2.15%
0.77%
1.23%
0.77%
$48
.718
6%
ONIn
tern
atio
nalE
quity
Portf
olio
Year
Ende
dDec
embe
r31,
2019
..
..
..
..
..
..
..
..
.$1
3.07
0.34
2.37
2.71
(0.26
)$1
5.52
20.72
%0.8
7%2.1
5%0.8
7%$4
74.2
105%
(b)
Year
Ende
dDec
embe
r31,
2018
..
..
..
..
..
..
..
..
.$1
5.08
0.23
(2.24
)(2.
01)
—$1
3.07
(13.33
)%0.8
6%1.9
3%0.8
6%$5
18.8
44%
Year
Ende
dDec
embe
r31 ,
2017
..
..
..
..
..
..
..
..
.$1
1.89
0.18
3.01
3.19
—$1
5.08
26.83
%1.0
6%1.2
5%1.0
6%$1
58.1
132%
(c)
Year
Ende
dDec
embe
r31,
2016
..
..
..
..
..
..
..
..
.$1
2.50
0.22
(0.83
)(0.
61)
—$1
1.89
(4.88
)%1.0
2%1.5
7%1.0
2%$1
41.5
69%
Year
Ende
dDec
embe
r31 ,
2015
..
..
..
..
..
..
..
..
.$1
2.55
0.19
(0.24
)(0.
05)
—$1
2.50
(0.40
)%(d
)1.0
0%1.2
1%1.0
0%$1
59.0
72%
ONFo
reig
nPor
tfolio
Year
Ende
dDec
embe
r31,
2019
..
..
..
..
..
..
..
..
.$2
8.03
0.65
2.20
2.85
(0.49
)$3
0.39
10.17
%1.4
3%1.9
7%1.4
3%$
48.2
112%
(b)
Year
Ende
dDec
embe
r31,
2018
..
..
..
..
..
..
..
..
.$3
3.22
0.57
(5.76
)(5.
19)
—$2
8.03
(15.62
)%1.1
7%1.7
2%1.1
7%$
55.1
22%
Year
Ende
dDec
embe
r31 ,
2017
..
..
..
..
..
..
..
..
.$2
7.72
0.32
5.18
5.50
—$3
3.22
19.84
%1.2
2%1.0
1%1.2
2%$
79.7
126%
(c)
Year
Ende
dDec
embe
r31,
2016
..
..
..
..
..
..
..
..
.$2
9.98
0.26
(2.52
)(2.
26)
—$2
7.72
(7.54
)%1.2
4%0.8
9%1.2
4%$
66.7
51%
Year
Ende
dDec
embe
r31 ,
2015
..
..
..
..
..
..
..
..
.$2
7.39
0.03
2.56
2.59
—$2
9.98
9.46%
(d)
1.23%
0.12%
1.23%
$78
.358
%
(a)
The
cost
ofpu
rcha
ses
and
proc
eeds
from
sale
sof
Portf
olio
secu
ritie
sth
atw
ere
incu
rred
tore
alig
nth
ePo
rtfol
io’s
hold
ings
subs
eque
ntto
the
Augu
st23
,201
9re
orga
niza
tion
are
excl
uded
from
the
portf
olio
turn
over
rate
calc
ulat
ion.
See
Not
e3
ofth
eN
otes
toFi
nanc
ialS
tate
men
tsfo
rfur
ther
info
rmat
ion
rega
rdin
gth
isre
orga
niza
tion.
Ifsu
cham
ount
sha
dno
tbee
nex
clud
ed,t
hepo
rtfol
iotu
rnov
erra
tew
ould
have
been
261%
.Effe
ctiv
eFe
brua
ry1,
2019
,the
sub-
advi
serf
orth
eeq
uity
porti
onof
the
ONBl
ackR
ock
Bala
nced
Allo
catio
nPo
rtfol
ioch
ange
dfro
mSu
ffolk
Capi
talM
anag
emen
t,LL
Cto
Blac
kRoc
kIn
vest
men
tMan
agem
ent,
LLC
(�Bla
ckRo
ck�).
(b)
Effe
ctiv
eDe
cem
ber7
,201
9,th
esu
b-ad
vise
rto
the
ONIn
tern
atio
nalE
quity
Portf
olio
chan
ged
from
Laza
rdAs
setM
anag
emen
tLLC
toBl
ackR
ock
Inve
stm
entM
anag
emen
t,LL
C,an
dth
esu
b-ad
vise
rto
the
ONFo
reig
nPo
rtfol
ioch
ange
dfro
mTe
mpl
eton
Glob
alAd
viso
rsLi
mite
dto
Blac
kRoc
kIn
vest
men
tM
anag
emen
t,LL
C.Co
sts
ofpu
rcha
ses
and
proc
eeds
from
sale
sof
portf
olio
secu
ritie
sas
soci
ated
with
the
chan
ges
inth
esu
b-ad
vise
rsco
ntrib
uted
tohi
gher
portf
olio
turn
over
rate
sfo
rthe
year
ende
dDe
cem
ber3
1,20
19as
com
pare
dto
prio
ryea
rs.
(c)
Effe
ctiv
eM
ay1,
2017
,the
sub-
advi
sert
oth
eON
Inte
rnat
iona
lEqu
ityPo
rtfol
ioch
ange
dfro
mFe
dera
ted
Glob
alIn
vest
men
tMan
agem
entC
orp.
toLa
zard
Asse
tMan
agem
entL
LC,a
ndth
esu
b-ad
vise
rto
the
ONFo
reig
nPo
rtfol
ioch
ange
dfro
mFe
dera
ted
Glob
alIn
vest
men
tMan
agem
entC
orp.
toTe
mpl
eton
Glob
alAd
viso
rsLi
mite
d.Co
sts
ofpu
rcha
ses
and
proc
eeds
from
sale
sof
portf
olio
secu
ritie
sas
soci
ated
with
the
chan
ges
inth
esu
b-ad
vise
rsco
ntrib
uted
tohi
gher
portf
olio
turn
over
rate
sfo
rthe
year
ende
dDe
cem
ber3
1,20
17as
com
pare
dto
prio
ryea
rs.
(d)
Initi
alPu
blic
Offe
ring
(IPO)
inve
stm
ents
had
asi
gnifi
cant
impa
cton
the
tota
lret
urn
inth
ispe
riod
and
such
perfo
rman
cem
aybe
diffi
cult
tore
peat
.
#Pe
rform
ance
does
noti
nclu
defe
esan
dex
pens
esim
pose
dby
ava
riabl
ean
nuity
cont
ract
.Had
thos
efe
esan
dex
pens
esbe
enin
clud
ed,p
erfo
rman
cew
ould
have
been
low
erth
anth
ere
turn
spr
esen
ted.
Ohi
oN
atio
nalF
und,
Inc.
Fina
ncia
lHig
hlig
hts
The
acco
mpa
nyin
gno
tes
are
anin
tegr
alpa
rtof
thes
efin
anci
alst
atem
ents
.
142

Sele
cted
per-s
hare
data
Ratio
sand
supp
leme
ntal
data
Oper
atio
nsDi
strib
utio
nsRa
tiost
oave
rage
neta
sset
s
Ratio
snet
ofex
pens
esre
duce
dor
reim
burs
edby
advis
er
Ratio
sass
umin
gno
expe
nses
redu
cedo
rre
imbu
rsed
byad
viser
Neta
sset
valu
e,be
ginn
ingo
fyea
rNe
tinv
estm
ent
inco
me(lo
ss)
Netr
ealiz
edan
dun
real
izedg
ain(
loss
)T o
talf
rom
oper
atio
nsDi
strib
utio
nsto
shar
ehol
ders
Neta
sset
valu
e,en
dofy
ear
Tota
lRet
urn#
Expe
nses
Neti
nves
tmen
tin
come
(loss
)Ex
pens
esNe
tass
ets,
endo
fye
ar(m
illio
ns)
Portf
olio
turn
over
rate
ONJa
nusH
ende
rson
Forty
Portf
olio
Year
Ende
dDec
embe
r31,
2019
..
..
..
..
..
..
..
..
.$2
0.97
(—)(a
)7.2
57.2
5(2.
16)
$26.0
634
.89%
0.81%
(—)%
(a)
0.81%
$19
6.953
%Ye
arEn
dedD
ecem
ber3
1,20
18.
..
..
..
..
..
..
..
..
$19.9
3(0.
03)
1.07
1.04
—$2
0.97
5.22%
0.87%
(0.15
)%0.8
7%$
149.3
48%
Year
Ende
dDec
embe
r31 ,
2017
..
..
..
..
..
..
..
..
.$1
5.61
(0.03
)4.3
54.3
2—
$19.9
327
.67%
0.96%
(0.15
)%0.9
6%$
60.6
57%
Year
Ende
dDec
embe
r31,
2016
..
..
..
..
..
..
..
..
.$1
5.09
(0.02
)0.5
40.5
2—
$15.6
13.4
5%0.9
5%(0.
09)%
0.95%
$49
.963
%Ye
arEn
dedD
ecem
ber3
1,20
15.
..
..
..
..
..
..
..
..
$13.7
0(0.
01)
1.40
1.39
—$1
5.09
10.15
%0.9
3%(0.
10)%
0.93%
$51
.460
%
ONJa
nusH
ende
rson
Vent
ureP
ortfo
lioYe
arEn
dedD
ecem
ber3
1,20
19.
..
..
..
..
..
..
..
..
$30.8
9(0.
15)
8.87
8.72
(5.72
)$3
3.89
28.61
%0.8
8%(0.
35)%
0.88%
$17
0.717
%Ye
arEn
dedD
ecem
ber3
1 ,20
18.
..
..
..
..
..
..
..
..
$32.9
9(0.
10)
(2.00
)(2.
10)
—$3
0.89
(6.37
)%0.8
5%(0.
23)%
0.85%
$20
7.433
%Ye
arEn
dedD
ecem
ber3
1 ,20
17.
..
..
..
..
..
..
..
..
$26.6
1(0.
06)
6.44
6.38
—$3
2.99
23.98
%0.8
5%(0.
19)%
0.85%
$27
6.226
%Ye
arEn
dedD
ecem
ber3
1 ,20
16.
..
..
..
..
..
..
..
..
$25.0
10.0
11.5
91.6
0—
$26.6
16.4
0%0.8
6%0.0
4%0.8
6%$
232.3
25%
Year
Ende
dDec
embe
r31 ,
2015
..
..
..
..
..
..
..
..
.$2
5.07
(0.03
)(0.
03)
(0.06
)—
$25.0
1(0.
24)%
(b)
0.85%
(0.12
)%0.8
5%$
238.2
37%
ONJa
nusH
ende
rson
Ente
rpris
ePor
tfolio
Year
Ende
dDec
embe
r31,
2019
..
..
..
..
..
..
..
..
.$3
7.36
0.05
13.54
13.59
(2.42
)$4
8.53
36.57
%0.9
6%0.1
0%0.9
6%$
110.0
10%
Year
Ende
dDec
embe
r31 ,
2018
..
..
..
..
..
..
..
..
.$3
8.60
0.02
(1.26
)(1.
24)
—$3
7.36
(3.21
)%0.9
6%0.0
6%0.9
6%$
102.6
103%
(c)
Year
Ende
dDec
embe
r31,
2017
..
..
..
..
..
..
..
..
.$3
0.37
(0.09
)8.3
28.2
3—
$38.6
027
.10%
0.98%
(0.24
)%0.9
8%$
77.8
57%
Year
Ende
dDec
embe
r31 ,
2016
..
..
..
..
..
..
..
..
.$2
9.90
(0.09
)0.5
60.4
7—
$30.3
71.5
7%0.9
8%(0.
29)%
0.98%
$70
.261
%Ye
arEn
dedD
ecem
ber3
1 ,20
15.
..
..
..
..
..
..
..
..
$31.4
9(0.
07)
(1.52
)(1.
59)
—$2
9.90
(5.05
)%(b
)0.9
4%(0.
21)%
0.94%
$78
.759
%
ONS&
P50
0®In
dexP
ortfo
lioYe
arEn
dedD
ecem
ber3
1,20
19.
..
..
..
..
..
..
..
..
$28.1
10.5
78.0
08.5
7(3.
39)
$33.2
930
.97%
0.39%
1.64%
0.39%
$1,20
2.67%
Year
Ende
dDec
embe
r31 ,
2018
..
..
..
..
..
..
..
..
.$2
9.52
0.48
(1.89
)(1.
41)
—$2
8.11
(4.78
)%0.3
8%1.5
8%0.3
8%$1
,111.5
18%
Year
Ende
dDec
embe
r31 ,
2017
..
..
..
..
..
..
..
..
.$2
4.32
0.37
4.83
5.20
—$2
9.52
21.38
%0.3
8%1.6
5%0.3
8%$1
,144.2
8%Ye
arEn
dedD
ecem
ber3
1 ,20
16.
..
..
..
..
..
..
..
..
$21.8
20.2
52.2
52.5
0—
$24.3
211
.46%
0.42%
1.84%
0.42%
$84
2.68%
Year
Ende
dDec
embe
r31 ,
2015
..
..
..
..
..
..
..
..
.$2
1.93
0.37
(0.17
)0.2
0(0.
31)
$21.8
20.9
1%0.4
1%1.7
2%0.4
1%$
410.7
14%
(a)
Less
than
$0.0
05pe
rsha
re,o
r0.0
05%
.(b
)In
itial
Publ
icOf
ferin
g(IP
O)in
vest
men
tsha
da
sign
ifica
ntim
pact
onth
eto
talr
etur
nin
this
perio
dan
dsu
chpe
rform
ance
may
bedi
fficu
ltto
repe
at.
(c)
Effe
ctiv
eM
ay1,
2018
,the
sub-
advi
serc
hang
edfro
mGo
ldm
anSa
chs
Asse
tMan
agem
ent,
L.P.
toJa
nus
Capi
talM
anag
emen
tLLC
.Cos
tsof
purc
hase
san
dpr
ocee
dsfro
msa
les
ofpo
rtfol
iose
curit
ies
asso
ciat
edw
ithth
ech
ange
inth
esu
b-ad
vise
rcon
tribu
ted
toa
high
erpo
rtfol
iotu
rnov
erra
tefo
rthe
year
ende
dDe
cem
ber3
1,20
18as
com
pare
dto
prio
ryea
rs.
#Pe
rform
ance
does
noti
nclu
defe
esan
dex
pens
esim
pose
dby
ava
riabl
ean
nuity
cont
ract
.Had
thos
efe
esan
dex
pens
esbe
enin
clud
ed,p
erfo
rman
cew
ould
have
been
low
erth
anth
ere
turn
spr
esen
ted.
Ohi
oN
atio
nalF
und,
Inc.
Fina
ncia
lHig
hlig
hts
The
acco
mpa
nyin
gno
tes
are
anin
tegr
alpa
rtof
thes
efin
anci
alst
atem
ents
.
143

Sele
cted
per-s
hare
data
Ratio
sand
supp
leme
ntal
data
Oper
atio
nsDi
strib
utio
nsRa
tiost
oave
rage
neta
sset
s
Ratio
snet
ofex
pens
esre
duce
dor
reim
burs
edby
advis
er
Ratio
sass
umin
gno
expe
nses
redu
cedo
rre
imbu
rsed
byad
viser
Neta
sset
valu
e,be
ginn
ingo
fyea
rNe
tinv
estm
ent
inco
meNe
trea
lized
and
unre
alize
dgai
n(lo
ss)
T ota
lfro
mop
erat
ions
Distr
ibut
ions
tosh
areh
olde
rsNe
tass
etva
lue,
endo
fyea
rTo
talR
etur
n#Ex
pens
esNe
tinv
estm
ent
inco
meEx
pens
esNe
tass
ets,
endo
fye
ar(m
illio
ns)
Portf
olio
turn
over
rate
ONBl
ackR
ockA
dvan
tage
Larg
eCap
Valu
ePor
tfolio
Year
Ende
dDec
embe
r31,
2019
..
..
..
..
..
..
..
..
.$1
6.37
0.76
2.38
3.14
(0.76
)$1
8.75
19.21
%0.7
7%3.9
4%0.7
7%$3
20.7
127%
(a)
Year
Ende
dDec
embe
r31,
2018
..
..
..
..
..
..
..
..
.$1
7.88
0.87
(2.38
)(1.
51)
—$1
6.37
(8.45
)%0.7
6%3.8
8%0.7
6%$3
21.8
18%
Year
Ende
dDec
embe
r31 ,
2017
..
..
..
..
..
..
..
..
.$1
5.60
0.59
1.69
2.28
—$1
7.88
14.62
%0.7
5%3.7
7%0.7
5%$5
96.7
27%
Year
Ende
dDec
embe
r31,
2016
..
..
..
..
..
..
..
..
.$1
4.07
0.36
1.17
1.53
—$1
5.60
10.87
%0.7
8%3.1
9%0.7
8%$4
75.5
32%
Year
Ende
dDec
embe
r31,
2015
..
..
..
..
..
..
..
..
.$1
3.92
0.53
0.06
0.59
(0.44
)$1
4.07
4.26%
0.78%
3.47%
0.78%
$309
.813
%
ONFe
dera
tedH
ighI
ncom
eBon
dPor
tfolio
Year
Ende
dDec
embe
r31,
2019
..
..
..
..
..
..
..
..
.$1
8.73
1.14
1.70
2.84
(0.88
)$2
0.69
15.29
%0.8
0%5.3
4%0.8
0%$1
98.7
23%
Year
Ende
dDec
embe
r31 ,
2018
..
..
..
..
..
..
..
..
.$1
9.36
1.41
(2.04
)(0.
63)
—$1
8.73
(3.25
)%0.7
5%5.3
9%0.7
5%$2
02.1
14%
Year
Ende
dDec
embe
r31 ,
2017
..
..
..
..
..
..
..
..
.$1
8.10
1.04
0.22
1.26
—$1
9.36
6.96%
0.74%
5.21%
0.74%
$319
.130
%Ye
arEn
dedD
ecem
ber3
1 ,20
16.
..
..
..
..
..
..
..
..
$15.8
20.4
31.8
52.2
8—
$18.1
014
.41%
0.80%
5.56%
0.80%
$313
.830
%Ye
arEn
dedD
ecem
ber3
1 ,20
15.
..
..
..
..
..
..
..
..
$16.3
21.1
8(1.
68)
(0.50
)—
$15.8
2(3.
06)%
0.80%
5.65%
0.80%
$194
.229
%
ONNa
sda q
-100
®In
dexP
ortfo
lioYe
arEn
dedD
ecem
ber3
1,20
19.
..
..
..
..
..
..
..
..
$16.6
00.1
46.1
56.2
9(3.
06)
$19.8
338
.86%
0.42%
0.66%
0.42%
$353
.08%
Year
Ende
dDec
embe
r31 ,
2018
..
..
..
..
..
..
..
..
.$1
6.67
0.12
(0.19
)(0.
07)
—$1
6.60
(0.42
)%0.4
1%0.6
7%0.4
1%$3
27.6
22%
Year
Ende
dDec
embe
r31 ,
2017
..
..
..
..
..
..
..
..
.$1
2.59
0.07
4.01
4.08
—$1
6.67
32.41
%0.4
5%0.7
1%0.4
5%$2
57.2
9%Ye
arEn
dedD
ecem
ber3
1 ,20
16.
..
..
..
..
..
..
..
..
$11.8
00.0
90.7
00.7
9—
$12.5
96.6
9%0.4
8%0.8
4%0.4
8%$1
56.1
13%
Year
Ende
dDec
embe
r31 ,
2015
..
..
..
..
..
..
..
..
.$1
0.88
0.09
0.91
1.00
(0.08
)$1
1.80
9.14%
0.46%
0.79%
0.46%
$138
.619
%
ONBl
ackR
ockA
dvan
tage
Larg
eCap
Core
Portf
olio
Year
Ende
dDec
embe
r31,
2019
..
..
..
..
..
..
..
..
.$2
4.79
0.22
8.10
8.32
(0.16
)$3
2.95
33.60
%0.7
4%1.2
8%0.7
4%$4
30.6
152%
(b)
Year
Ende
dDec
embe
r31,
2018
..
..
..
..
..
..
..
..
.$3
0.22
0.20
(5.63
)(5.
43)
—$2
4.79
(17.97
)%0.8
2%0.6
3%0.8
2%$1
55.3
272%
Year
Ende
dDec
embe
r31 ,
2017
..
..
..
..
..
..
..
..
.$2
4.02
0.16
6.04
6.20
—$3
0.22
25.81
%0.8
2%0.4
7%0.8
2%$2
23.7
220%
Year
Ende
dDec
embe
r31 ,
2016
..
..
..
..
..
..
..
..
.$2
1.49
0.12
2.41
2.53
—$2
4.02
11.77
%0.8
3%0.4
9%0.8
3%$2
07.9
223%
Year
Ende
dDec
embe
r31 ,
2015
..
..
..
..
..
..
..
..
.$2
0.75
0.12
0.73
0.85
(0.11
)$2
1.49
4.08%
0.81%
0.55%
0.81%
$218
.722
8%
(a)
Effe
ctiv
eDe
cem
ber7
,201
9,th
esu
b-ad
vise
rcha
nged
from
Fede
rate
dEq
uity
Man
agem
entC
ompa
nyof
Penn
sylv
ania
toBl
ackR
ock
Inve
stm
entM
anag
emen
t,LL
C.Co
sts
ofpu
rcha
ses
and
proc
eeds
from
sale
sof
portf
olio
secu
ritie
sas
soci
ated
with
the
chan
gein
the
sub-
advi
serc
ontri
bute
dto
ahi
gher
portf
olio
turn
over
rate
fort
heye
aren
ded
Dece
mbe
r31,
2019
asco
mpa
red
topr
iory
ears
.(b
)Th
eco
stof
purc
hase
san
dpr
ocee
dsfro
msa
les
ofPo
rtfol
iose
curit
ies
that
wer
ein
curr
edto
real
ign
the
Portf
olio
’sho
ldin
gssu
bseq
uent
toth
eAu
gust
23,2
019
reor
gani
zatio
nar
eex
clud
edfro
mth
epo
rtfol
iotu
rnov
erra
teca
lcul
atio
n.Se
eN
ote
3of
the
Not
esto
Fina
ncia
lSta
tem
ents
forf
urth
erin
form
atio
nre
gard
ing
this
reor
gani
zatio
n.If
such
amou
nts
had
notb
een
excl
uded
,the
portf
olio
turn
over
rate
wou
ldha
vebe
en21
1%.E
ffect
ive
Febr
uary
1,20
19,t
hesu
b-ad
vise
rto
the
ONBl
ackR
ock
Adva
ntag
eLa
rge
Cap
Core
Portf
olio
chan
ged
from
Suffo
lkCa
pita
lMan
agem
ent,
LLC
toBl
ackR
ock
Inve
stm
entM
anag
emen
t,LL
C.
#Pe
rform
ance
does
noti
nclu
defe
esan
dex
pens
esim
pose
dby
ava
riabl
ean
nuity
cont
ract
.Had
thos
efe
esan
dex
pens
esbe
enin
clud
ed,p
erfo
rman
cew
ould
have
been
low
erth
anth
ere
turn
spr
esen
ted.
Ohi
oN
atio
nalF
und,
Inc.
Fina
ncia
lHig
hlig
hts
The
acco
mpa
nyin
gno
tes
are
anin
tegr
alpa
rtof
thes
efin
anci
alst
atem
ents
.
144

Sele
cted
per-s
hare
data
Ratio
sand
supp
leme
ntal
data
Oper
atio
nsDi
strib
utio
nsRa
tiost
oave
rage
neta
sset
s
Ratio
snet
ofex
pens
esre
duce
dor
reim
burs
edby
advis
er
Ratio
sass
umin
gno
expe
nses
redu
cedo
rre
imbu
rsed
byad
viser
Neta
sset
valu
e,be
ginn
ingo
fyea
rNe
tinv
estm
ent
inco
me(lo
ss)
Netr
ealiz
edan
dun
real
izedg
ain(
loss
)T o
talf
rom
oper
atio
nsDi
strib
utio
nsto
shar
ehol
ders
Neta
sset
valu
e,en
dofy
ear
Tota
lRet
urn#
Expe
nses
Neti
nves
tmen
tin
come
(loss
)Ex
pens
esNe
tass
ets,
endo
fye
ar(m
illio
ns)
Portf
olio
turn
over
rate
ONBl
ackR
ockA
dvan
tage
Smal
lCap
Grow
thPo
rtfol
ioYe
arEn
dedD
ecem
ber3
1,20
19.
..
..
..
..
..
..
..
..
$23.6
20.0
28.0
28.0
4(0.
24)
$31.4
234
.07%
0.91%
0.11%
0.91%
$204
.811
4%(a
)
Year
Ende
dDec
embe
r31,
2018
..
..
..
..
..
..
..
..
.$2
4.91
(0.26
)(1.
03)
(1.29
)—
$23.6
2(5.
18)%
1.05%
(0.55
)%1.0
5%$
25.5
201%
Year
Ende
dDec
embe
r31 ,
2017
..
..
..
..
..
..
..
..
.$2
0.49
(0.21
)4.6
34.4
2—
$24.9
121
.57%
0.98%
(0.55
)%0.9
8%$
56.8
196%
Year
Ende
dDec
embe
r31,
2016
..
..
..
..
..
..
..
..
.$1
9.60
(0.19
)1.0
80.8
9—
$20.4
94.5
4%0.9
2%(0.
62)%
0.92%
$94
.618
8%Ye
arEn
dedD
ecem
ber3
1,20
15.
..
..
..
..
..
..
..
..
$20.4
7(0.
11)
(0.76
)(0.
87)
—$1
9.60
(4.25
)%0.8
8%(0.
53)%
0.88%
$162
.216
9%
ONS&
PM
idCa
p400
®In
dexP
ortfo
lioYe
arEn
dedD
ecem
ber3
1,20
19.
..
..
..
..
..
..
..
..
$15.4
60.2
13.7
43.9
5(0.
16)
$19.2
525
.58%
0.44%
1.37%
0.44%
$450
.939
%Ye
arEn
dedD
ecem
ber3
1 ,20
18.
..
..
..
..
..
..
..
..
$17.4
60.1
0(2.
10)
(2.00
)—
$15.4
6(11
.45)%
0.51%
1.32%
0.51%
$306
.628
%Ye
arEn
dedD
ecem
ber3
1 ,20
17.
..
..
..
..
..
..
..
..
$15.1
20.0
42.3
02.3
4—
$17.4
615
.48%
0.71%
0.92%
0.71%
$88
.841
%Ye
arEn
dedD
ecem
ber3
1 ,20
16.
..
..
..
..
..
..
..
..
$13.8
10.1
71.1
41.3
1—
$15.1
29.4
9%0.7
9%1.2
4%0.7
9%$
47.9
179%
(b)
Year
Ende
dDec
embe
r31,
2015
..
..
..
..
..
..
..
..
.$1
4.49
0.25
(0.72
)(0.
47)
(0.21
)$1
3.81
(3.24
)%0.7
7%1.5
4%0.7
7%$
46.3
72%
ONBl
ackR
ockA
dvan
tage
Larg
eCap
Grow
thPo
rtfol
ioYe
arEn
dedD
ecem
ber3
1,20
19.
..
..
..
..
..
..
..
..
$20.5
90.1
67.7
77.9
3(0.
98)
$27.5
438
.68%
0.80%
0.62%
0.80%
$113
.221
4%(a
)
Year
Ende
dDec
embe
r31,
2018
..
..
..
..
..
..
..
..
.$2
4.19
0.12
(3.72
)(3.
60)
—$2
0.59
(14.88
)%0.8
8%0.4
3%0.8
8%$
87.5
269%
Year
Ende
dDec
embe
r31 ,
2017
..
..
..
..
..
..
..
..
.$1
8.65
0.07
5.47
5.54
—$2
4.19
29.71
%0.8
8%0.2
4%0.8
8%$1
28.0
218%
Year
Ende
dDec
embe
r31 ,
2016
..
..
..
..
..
..
..
..
.$1
7.31
0.07
1.27
1.34
—$1
8.65
7.74%
0.89%
0.36%
0.89%
$117
.616
2%Ye
arEn
dedD
ecem
ber3
1 ,20
15.
..
..
..
..
..
..
..
..
$16.4
40.0
80.8
60.9
4(0.
07)
$17.3
15.7
2%0.8
6%0.4
3%0.8
6%$1
16.2
168%
ONRi
skM
anag
edBa
lanc
edPo
rtfol
ioYe
arEn
dedD
ecem
ber3
1,20
19.
..
..
..
..
..
..
..
..
$12.9
10.2
13.0
13.2
2(1.
32)
$14.8
125
.16%
0.99%
1.39%
0.99%
$403
.610
5%(c
)
Year
Ende
dDec
embe
r31,
2018
..
..
..
..
..
..
..
..
.$1
3.01
0.17
(0.27
)(0.
10)
—$1
2.91
(0.77
)%0.9
9%1.2
7%0.9
9%$3
47.1
131%
(c)
Year
Ende
dDec
embe
r31,
2017
..
..
..
..
..
..
..
..
.$1
1.06
0.14
1.81
1.95
—$1
3.01
17.63
%1.0
0%1.2
2%1.0
0%$3
44.2
72%
(c)
Year
Ende
dDec
embe
r31,
2016
..
..
..
..
..
..
..
..
.$1
0.66
0.09
0.31
0.40
—$1
1.06
3.75%
1.03%
1.09%
1.03%
$272
.178
%Ye
arEn
dedD
ecem
ber3
1 ,20
15.
..
..
..
..
..
..
..
..
$10.8
30.0
3(0.
17)
(0.14
)(0.
03)
$10.6
6(1.
32)%
1.11%
0.81%
1.11%
$154
.371
%
(a)
The
cost
ofpu
rcha
ses
and
proc
eeds
from
sale
sof
Portf
olio
secu
ritie
sth
atw
ere
incu
rred
tore
alig
nth
eON
Blac
kRoc
kAd
vant
age
Smal
lCap
Grow
thPo
rtfol
io’s
hold
ings
subs
eque
ntto
the
Augu
st23
,201
9re
orga
niza
tion
are
excl
uded
from
the
portf
olio
turn
over
rate
calc
ulat
ion.
See
Not
e3
ofth
eN
otes
toFi
nanc
ialS
tate
men
tsfo
rfur
ther
info
rmat
ion
rega
rdin
gth
isre
orga
niza
tion.
Ifsu
cham
ount
sha
dno
tbee
nex
clud
ed,t
hepo
rtfol
iotu
rnov
erra
tew
ould
have
been
177%
.Effe
ctiv
eFe
brua
ry1,
2019
,the
sub-
advi
sert
oth
eON
Blac
kRoc
kAd
vant
age
Smal
lCap
Grow
thPo
rtfol
ioan
dON
Blac
kRoc
kAd
vant
age
Larg
eCa
pGr
owth
Portf
olio
chan
ged
from
Suffo
lkCa
pita
lM
anag
emen
t,LL
Cto
Blac
kRoc
kIn
vest
men
tMan
agem
ent,
LLC.
(b)
Effe
ctiv
eDe
cem
ber1
6,20
16,t
hesu
b-ad
vise
rto
the
Portf
olio
chan
ged
from
Firs
tTru
stAd
viso
rsL.
P.to
Geod
eCa
pita
lMan
agem
ent,
LLC.
Cost
sof
purc
hase
san
dpr
ocee
dsfro
msa
les
ofpo
rtfol
iose
curit
ies
asso
ciat
edw
ithth
ech
ange
inth
esu
b-ad
vise
rcon
tribu
ted
toa
high
erpo
rtfol
iotu
rnov
erra
tefo
rthe
year
ende
dDe
cem
ber3
1,20
16as
com
pare
dto
prio
ryea
rs.
(c)
The
portf
olio
turn
over
calc
ulat
ion
incl
udes
purc
hase
san
dsa
les
from
mor
tgag
edo
llarr
ollt
rans
actio
ns.W
ithou
tthe
effe
ctof
mor
tgag
edo
llarr
ollt
rans
actio
ns,t
hepo
rtfol
iotu
rnov
erra
tew
ould
have
been
84%
fort
heye
aren
ded
Dece
mbe
r31,
2019
,102
%fo
rthe
year
ende
dDe
cem
ber3
1,20
18,a
nd63
%fo
rthe
year
ende
dDe
cem
ber3
1,20
17(s
eeN
ote
2of
the
Not
esto
Fina
ncia
lSta
tem
ents
).
#Pe
rform
ance
does
noti
nclu
defe
esan
dex
pens
esim
pose
dby
ava
riabl
ean
nuity
cont
ract
.Had
thos
efe
esan
dex
pens
esbe
enin
clud
ed,p
erfo
rman
cew
ould
have
been
low
erth
anth
ere
turn
spr
esen
ted.
Ohi
oN
atio
nalF
und,
Inc.
Fina
ncia
lHig
hlig
hts
The
acco
mpa
nyin
gno
tes
are
anin
tegr
alpa
rtof
thes
efin
anci
alst
atem
ents
.
145

Sele
cted
per-s
hare
data
Ratio
sand
supp
leme
ntal
data
Oper
atio
nsDi
strib
utio
nsRa
tiost
oave
rage
neta
sset
s
Ratio
snet
ofex
pens
esre
duce
dor
reim
burs
edby
advis
er
Ratio
sass
umin
gno
expe
nses
redu
cedo
rre
imbu
rsed
byad
viser
Neta
sset
valu
e,be
ginn
ingo
fye
arNe
tinv
estm
ent
inco
meNe
trea
lized
and
unre
alize
dgai
n(lo
ss)
Tota
lfro
mop
erat
ions
Distr
ibut
ions
tosh
areh
olde
rsRe
turn
ofca
pita
lTo
tal
distr
ibut
ions
Neta
sset
valu
e,en
dofy
ear
Tota
lRet
urn#
Expe
nses
†Ne
tinv
estm
ent
inco
me†
Expe
nses
†
Neta
sset
s,en
dof
year
(mill
ions
)Po
rtfol
iotu
rnov
erra
te
ONCo
nser
vativ
eMod
elPo
rtfol
ioYe
arEn
dedD
ecem
ber3
1,20
19.
..
..
.$1
0.21
0.31
1.04
1.35
(0.35
)—
(0.35
)$1
1.21
13.18
%0.2
6%2.7
0%0.5
5%$
75.1
23%
Year
Ende
dDec
embe
r31,
2018
..
..
..
$10.5
30.2
0(0.
52)
(0.32
)—
——
$10.2
1(3.
04)%
0.27%
1.70%
0.52%
$79
.035
%Pe
riodF
rom
Mar
ch1,
2017
(ince
ption
)to
Dece
mber
31,2
017.
..
..
..
..
.$1
0.00
0.16
0.37
0.53
——
—$1
0.53
5.30%
0.25%
**1.7
1%**
0.51%
**$
99.7
29%
*
ONM
oder
atel
yCon
serv
ative
Mod
elPo
rtfol
ioYe
arEn
dedD
ecem
ber3
1,20
19.
..
..
.$1
0.09
0.26
1.41
1.67
(0.37
)(0.
02)
(0.39
)$1
1.37
16.58
%0.3
5%2.2
2%0.4
6%$
223.2
18%
Year
Ende
dDec
embe
r31,
2018
..
..
..
$10.6
90.1
5(0.
75)
(0.60
)—
——
$10.0
9(5.
61)%
0.28%
1.26%
0.45%
$23
7.238
%Pe
riodF
rom
Mar
ch1,
2017
(ince
ption
)to
Dece
mber
31,2
017.
..
..
..
..
.$1
0.00
0.13
0.56
0.69
——
—$1
0.69
6.90%
0.25%
**1.4
0%**
0.45%
**$
326.0
22%
*
ONBa
lanc
edM
odel
Portf
olio
Year
Ende
dDec
embe
r31,
2019
..
..
..
$9.9
70.2
11.7
31.9
4(0.
24)
(0.19
)(0.
43)
$11.4
819
.46%
0.36%
1.82%
0.43%
$1,10
9.522
%Ye
arEn
dedD
ecem
ber3
1,20
18.
..
..
.$1
0.81
0.09
(0.93
)(0.
84)
——
—$
9.97
(7.77
)%0.3
1%0.7
7%0.4
2%$1
,146.9
37%
Perio
dFro
mM
arch
1,20
17(in
cept
ion)t
oDe
cemb
er31
,201
7..
..
..
..
..
$10.0
00.0
90.7
20.8
1—
——
$10.8
18.1
0%0.2
5%**
1.01%
**0.4
2%**
$1,56
2.625
%*
ONM
oder
ateG
row
thM
odel
Portf
olio
Year
Ende
dDec
embe
r31,
2019
..
..
..
$9.9
30.1
62.2
02.3
6(0.
30)
(0.36
)(0.
66)
$11.6
323
.81%
0.43%
1.31%
0.44%
$1,96
1.420
%Ye
arEn
dedD
ecem
ber3
1,20
18.
..
..
.$1
1.05
0.05
(1.17
)(1.
12)
——
—$
9.93
(10.14
)%0.3
5%0.4
2%0.4
2%$1
,945.0
49%
Perio
dFro
mM
arch
1,20
17(in
cept
ion)t
oDe
cemb
er31
,201
7..
..
..
..
..
$10.0
00.0
70.9
81.0
5—
——
$11.0
510
.50%
0.26%
**0.8
0%**
0.42%
**$2
,646.8
23%
*
ONGr
owth
Mod
elPo
rtfol
ioYe
arEn
dedD
ecem
ber3
1,20
19.
..
..
.$
9.86
0.11
2.50
2.61
(0.35
)(0.
18)
(0.53
)$1
1.94
26.47
%0.4
5%0.9
2%0.4
7%$
433.6
18%
Year
Ende
dDec
embe
r31,
2018
..
..
..
$11.1
50.0
2(1.
31)
(1.29
)—
——
$9.8
6(11
.57)%
0.31%
0.17%
0.43%
$42
4.262
%Pe
riodF
rom
Mar
ch1,
2017
(ince
ption
)to
Dece
mber
31,2
017.
..
..
..
..
.$1
0.00
0.05
1.10
1.15
——
—$1
1.15
11.50
%0.2
5%**
0.51%
**0.4
3%**
$54
3.824
%*
*N
otan
nual
ized
**An
nual
ized
#Pe
rform
ance
does
noti
nclu
defe
esan
dex
pens
esim
pose
dby
ava
riabl
ean
nuity
cont
ract
.Had
thos
efe
esan
dex
pens
esbe
enin
clud
ed,p
erfo
rman
cew
ould
have
been
low
erth
anth
ere
turn
spr
esen
ted.
†Ra
tios
pres
ente
don
lyre
flect
the
dire
ctin
com
ean
dex
pens
esfo
rthe
Portf
olio
,and
dono
tinc
lude
the
indi
rect
expe
nses
rela
ted
toth
eun
derly
ing
fund
sin
whi
chth
ePo
rtfol
ioin
vest
s.
Ohi
oN
atio
nalF
und,
Inc.
Fina
ncia
lHig
hlig
hts
The
acco
mpa
nyin
gno
tes
are
anin
tegr
alpa
rtof
thes
efin
anci
alst
atem
ents
.
146

(1) Organization
Ohio National Fund, Inc. (the “Fund”) is a Maryland corporation registered under the Investment Company Act of 1940, as amended(the �40 Act�). The Fund is an open-end investment company and follows accounting and reporting guidance under FinancialAccounting Standards Board (“FASB”) Accounting Standards Codification (“ASC”) Topic 946, “Financial Services-InvestmentCompanies”. The Fund consists of twenty-one separate investment portfolios (the “Portfolios”) that seek the following objectivesand strategies:
■ ON Bond Portfolio – High level of income and opportunity for capital appreciation consistent with preservation of capital byinvesting, under normal circumstances, at least 80% of its net assets in corporate debt securities.
■ ON BlackRock Balanced Allocation Portfolio – High level of long-term total return consistent with preservation of capital byinvesting in stocks, bonds, and money market instruments.
■ ON International Equity Portfolio – Long-term growth of capital by investing, under normal circumstances, at least 80% of its netassets in in non-U.S. equity securities and equity-like instruments of companies that are components of, or have characteristicssimilar to, the companies included in the MSCI EAFE Index (Net - USD)
■ ON Foreign Portfolio – Long-term growth of capital by investing, under normal circumstances, at least 80% of its net assets in innon-U.S. equity securities and equity-like instruments of companies that are components of, or have characteristics similar to,the companies included in the MSCI EAFE Index (Net - USD).
■ ON Janus Henderson Forty Portfolio – Long-term capital growth by investing primarily in domestic and foreign equity securitiesselected for growth potential.
■ ON Janus Henderson Venture Portfolio – Long-term capital appreciation by investing, under normal circumstances, at least 80%of its net assets in stocks of small capitalization companies.
■ ON Janus Henderson Enterprise Portfolio – Long-term total return by investing, under normal circumstances, at least 50% of itsnet assets in equity securities of mid-cap companies, primarily those that are strategically positioned for long-term growth.
■ ON S&P 500® Index Portfolio – Total return approximating that of the Standard & Poor’s 500® Index (S&P 500® Index), at a risklevel consistent with that of the S&P 500® Index by investing, under normal circumstances, more than 80% of its net assets insecurities included in the S&P 500® Index.
■ ON BlackRock Advantage Large Cap Value Portfolio – Growth of capital by investing, under normal circumstances, at least 80%of its net assets in stocks of large capitalization companies with market capitalizations at the time of investment that are withinthe range of market capitalizations of the companies in the Russell 1000 Value Index for the previous twelve months.
■ ON Federated High Income Bond Portfolio – High current income by investing, under normal circumstances, at least 80% of itsnet assets in lower rated corporate debt obligations commonly referred to as �junk bonds�. The Portfolio’s investments aregenerally rated BB or lower by Standard & Poor’s or Fitch, or Ba or lower by Moody’s.
■ ON Nasdaq-100® Index Portfolio – Long-term growth of capital by investing, under normal circumstances, more than 80% of itsnet assets in the common stocks of companies that are included in the Nasdaq-100® Index.
■ ON BlackRock Advantage Large Cap Core Portfolio– Long-term growth of capital by investing, under normal circumstances, atleast 80% of its net assets in common stocks of the 1,000 largest publicly traded U.S. companies in terms of market capitalization.
■ ON BlackRock Advantage Small Cap Growth Portfolio – Long-term growth of capital by investing, under normal circumstances,at least 80% of its net assets in stocks of companies with a market capitalization at the time of investment that is no greater thanthe largest market capitalization of a company in the Russell 2000 Index for the previous twelve months.
■ ON S&P MidCap 400® Index Portfolio – Total return approximating that of the Standard & Poor’s MidCap 400® Index(S&P MidCap 400® Index), including reinvestment of dividends, at a risk level consistent with that of the S&P MidCap 400® Indexby investing, under normal circumstances, more than 80% of its net assets in the securities included in the S&P MidCap 400®
Index.
■ ON BlackRock Advantage Large Cap Growth Portfolio – Long-term growth of capital by investing, under normal circumstances,at least 80% of its net assets in stocks of companies with market capitalizations at the time of investment that are within therange of market capitalizations of the companies in the Russell 1000 Growth Index for the previous twelve months.
■ ON Risk Managed Balanced Portfolio – Long-term capital growth, consistent with preservation of capital and balanced bycurrent income. The Portfolio invests in a balanced portfolio of equity and fixed-income securities and a risk managementportfolio intended to enhance the risk adjusted return of the Portfolio.
Ohio National Fund, Inc.
Notes to Financial Statements December 31, 2019
147 (continued)

■ ON Conservative Model Portfolio* – Current income and preservation of capital by investing in underlying mutual funds. Undernormal circumstances, the Portfolio intends to have investment exposure to various asset classes within the following targetasset allocation ranges: U.S. Equity 0-25%, International Equity 0-10%, and Fixed Income 65-90%.
■ ON Moderately Conservative Model Portfolio* – Current income and moderate growth of capital with a greater emphasis oncurrent income by investing in underlying mutual funds. Under normal circumstances, the Portfolio intends to have investmentexposure to various asset classes within the following target asset allocation ranges: U.S. Equity 20-40%, International Equity5-20%, and Fixed Income 30-70%.
■ ON Balanced Model Portfolio* – A balance between growth of capital and current income with a greater emphasis on growth ofcapital by investing in underlying mutual funds. Under normal circumstances, the Portfolio intends to have investment exposureto various asset classes within the following target asset allocation ranges: U.S. Equity 25-50%, International Equity 10-25%, andFixed Income 25-50%.
■ ON Moderate Growth Model Portfolio* – Growth of capital and moderate current income with a greater emphasis on growth ofcapital by investing in underlying mutual funds. Under normal circumstances, the Portfolio intends to have investment exposureto various asset classes within the following target asset allocation ranges: U.S. Equity 40-60%, International Equity 15-35%, andFixed Income 10-30%.
■ ON Growth Model Portfolio* – Growth of capital and some current income by investing in underlying mutual funds. Under normalcircumstances, the Portfolio intends to have investment exposure to various asset classes within the following target assetallocation ranges: U.S. Equity 50-80%, International Equity 15-45%, and Fixed Income 0-15%.* Collectively, the �ON Model Portfolios�.
The names presented above reflect the current Portfolio names. Effective May 1, 2019, several Portfolios of the Fund underwentname changes. The changes, approved by the Fund’s Board of Directors (the �Board�), are detailed below:Portfolio Name Prior to May 1, 2019 Current Portfolio Name
ON Omni Portfolio ON BlackRock Balanced Allocation PortfolioON Bristol Portfolio ON BlackRock Advantage Large Cap Core PortfolioON Bryton Growth Portfolio ON BlackRock Advantage Small Cap Growth PortfolioON Bristol Growth Portfolio ON BlackRock Advantage Large Cap Growth Portfolio
Also, effective December 7, 2019, the Board approved the change of the name of the ON Federated Strategic Value DividendPortfolio to the ON BlackRock Advantage Large Cap Value Portfolio.
Additional detail regarding portfolio-specific objectives, policies, and investment strategies is provided in the prospectus andStatement of Additional Information of Ohio National Fund, Inc. There are no assurances that these objectives will be met. EachPortfolio, except the ON Nasdaq-100® Index Portfolio, is classified as diversified for purposes of Section 5(b) of the 40 Act.
At present, the Fund issues its shares to separate accounts of The Ohio National Life Insurance Company (“ONLIC”), Ohio NationalLife Assurance Corporation (“ONLAC”), and National Security Life and Annuity Company (“NSLA”) to support certain benefits undervariable contracts issued by those entities, as well as for purchases by other Portfolios of the Fund. In the future, Fund shares maybe used for other purposes but, unless there is a change in applicable law, they will not be sold directly to the public.
Effective September 15, 2018 and March 16, 2018, respectively, ONLIC and NSLA no longer market, nor issue, variable annuities.ONLIC and NSLA will continue to service the in-force variable annuity contracts, the variable separate accounts, and underlyingsubaccounts regardless of new sales.
Interest in each Portfolio is represented by a separate class of the Fund’s capital stock, par value $1. Each share of a Portfolioparticipates equally in the Portfolio’s dividends, distributions, net assets, and voting matters.
The Fund is authorized to issue 1.55 billion of its capital shares. These authorized shares have been allocated to specific Portfolios ofthe Fund as follows:
Portfolio Authorized Shares
ON Bond 40,000,000ON BlackRock Balanced Allocation 95,000,000ON International Equity 90,000,000ON Foreign 22,000,000ON Janus Henderson Forty 24,000,000
Portfolio Authorized Shares
ON Janus Henderson Venture 30,000,000ON Janus Henderson Enterprise 21,000,000ON S&P 500® Index 90,000,000ON BlackRock Advantage Large Cap Value 75,000,000ON Federated High Income Bond 45,000,000
Ohio National Fund, Inc.
Notes to Financial Statements (Continued) December 31, 2019
148 (continued)

Portfolio Authorized Shares
ON Nasdaq-100® Index 50,000,000ON BlackRock Advantage Large Cap Core 73,000,000ON BlackRock Advantage Small Cap Growth 30,000,000ON S&P MidCap 400® Index 50,000,000ON BlackRock Advantage Large Cap Growth 30,000,000ON Risk Managed Balanced 85,000,000
Portfolio Authorized Shares
ON Conservative Model 30,000,000ON Moderately Conservative Model 70,000,000ON Balanced Model 200,000,000ON Moderate Growth Model 300,000,000ON Growth Model 100,000,000
The Board periodically reallocates authorized shares among the Portfolios of the Fund and may authorize additional shares asdeemed necessary.
Under the Fund’s organizational documents, its Officers and Directors are indemnified against certain liabilities arising out of theperformance of their duties to the Fund. In addition, in the normal course of business, the Fund enters into contracts with its vendorsand others that provide for general indemnifications. The Fund’s maximum exposure under these arrangements is unknown as thiswould involve future claims that may be made against the Fund. However, based on experience, the risk of loss to the Fund isexpected to be remote.
(2) Significant Accounting Policies
The following is a summary of significant accounting policies followed by the Fund in preparation of its financial statements:
Use of Estimates
The preparation of financial statements in conformity with U.S. generally accepted accounting principles (“U.S. GAAP”) requiresmanagement to make estimates and assumptions that affect the reported amounts of assets and liabilities and disclosure ofcontingent assets and liabilities at the date of the financial statements and the reported amounts of increases and decreases in netassets from operations during the reporting period. Actual results could differ from those estimates.
Security Valuation
Investments are valued using pricing procedures approved by the Board.
Fixed income instruments that mature in sixty days or less, and of sufficient credit quality, are valued at amortized cost. Amortizedcost valuation involves valuing a security at its cost initially and thereafter amortizing to maturity any discounts or premiums on thelevel-yield method, regardless of the impact of fluctuating market interest rates on the value of the security. In these instances,amortized cost approximates fair value.
Investments, other than those securities aforementioned, are valued as follows:
Domestic equity securities that are traded on U.S. exchanges, other than the Nasdaq Stock Market, are valued at the last tradeprice reported by the primary exchange of each security (4:00 pm Eastern Time for normal trading sessions). Domestic equitysecurities that are listed on the Nasdaq Stock Market are valued at the Nasdaq Official Closing Price (“NOCP”). Over-the-counterdomestic equity securities are valued at the last trade price reported daily as of 4:00 pm Eastern Time (normal trading sessions).
Over-the-counter traded American Depositary Receipts (�ADRs�) may also be valued at an evaluated price based on the value ofthe underlying securities. If a domestic equity security is not traded on a particular day, the mean between the bid and ask pricesreported at 4:00 pm Eastern Time (normal trading sessions) by the primary exchange will generally be used for valuation purposes.The principal sources for market quotations are independent pricing services that have been approved by the Board.
Fixed income securities that have a remaining maturity exceeding sixty days are generally valued at the evaluated bid pricereported at 4:00 pm Eastern Time (normal trading sessions), as provided by independent pricing services approved by the Board.Many fixed income securities, including investment grade and high-yield corporate bonds, U.S. Treasury and government agencyobligations, bank loans, and other asset-backed instruments are not actively traded on a daily basis. As such, the approvedpricing services may use asset type-specific valuation models to provide good faith determinations that the holders of securitieswould receive in an orderly transaction under current market conditions. The valuation models may use observable market datasuch as recent transaction data, benchmark yields, broker/dealer inputs, valuations and yields of comparable instruments,relative credit information, observed market movements, and market research and news. Asset-backed securities andmortgage-backed securities may use valuation models that heavily consider predicted cash flows of each tranche of an issue,benchmark spreads, and unique attributes of the tranche. The last trade or last evaluated bid may be used if an evaluated bid priceis not available.
Ohio National Fund, Inc.
Notes to Financial Statements (Continued) December 31, 2019
149 (continued)

U.S exchange-traded options are valued at the composite basis last sale price as reported to a Board-approved independentpricing service by the OPRA (Options Price Reporting Authority) at 4:15 pm Eastern Time (normal trading sessions). If there are noreported trades for a trading session, the evaluated composite-basis bid price will generally be used for valuation purposes.
Futures contracts are valued at the daily quoted settlement prices as reported by an approved independent pricing source.
Shares of open-end mutual funds are valued at each fund’s last calculated net asset value per share.
Shares of closed-end mutual funds that are traded on U.S. exchanges are valued similarly to other domestic equity securities,typically at the last trade price reported by the primary exchange of each fund (4:00 pm Eastern Time for normal trading sessions).
Foreign equity securities are initially priced at the reported close price of the exchange on which a security is primarily traded.Securities not traded on a particular day are valued at the mean between the last reported bid and ask quotes at daily close, or thelast sale price when appropriate. The principal sources for market quotations are independent pricing services that have beenapproved by the Board.
Equity securities that are primarily traded on foreign exchanges, other than those with close times that are consistent with thenormal 4:00 pm Eastern Time close of U.S. equity markets, are further subjected to fair valuation pricing procedures provided by anindependent fair valuation service. The service provides data that can be used to estimate the price of a foreign issue that wouldprevail in a liquid market given market information available daily at 4:00 pm Eastern Time (normal trading sessions). Multiplefactors may be considered in performing this valuation, including an issue’s local close price, relevant general and sector indices,currency fluctuations, and pricing of related depository receipts, exchange traded funds, and futures. The pricing procedures areperformed for each individual security for which there is a fairly large degree of certainty that the local close price is not the liquidmarket price at the time of U.S. market close. The procedures are performed each day there is a change in a consistently usedmarket index from the time of local close to the U.S. market close. Backtesting analysis is performed on a quarterly basis tomonitor the effectiveness of these procedures. The testing is reviewed by management of the Fund as well as the Board. Priorresults have indicated that these procedures have been effective in reaching valuation objectives.
Restricted securities, illiquid securities, or other investments for which market quotations or other observable market inputs arenot readily available are valued at an estimate of value using methods determined in good faith by the Fund’s Pricing Committeeunder the supervision of the Board.
The differences between the aggregate cost and values of investments are reflected as unrealized appreciation or unrealizeddepreciation.
Pricing inputs used in the Fund’s determination of its investment values are categorized according to a three-tier hierarchyframework. The hierarchy is summarized in three broad levels:
Level 1: Quoted prices in active markets for identical securities.
Level 2: Other significant observable inputs, including quoted prices for similar securities, interest rates, prepayment speeds, creditrisk, etc.
Level 3: Significant unobservable inputs, including the Fund’s own assumptions used to determine the value of securities.
The following is a summary of the inputs used in valuing each of the Portfolio’s assets (liabilities) at value as of December 31, 2019:
Portfolio Financial Instrument Type Level 1 Level 2 Level 3
ON Bond . . . . . . . . . . . . . . . . . . . . . . . . . . . Corporate Bonds** $ — $259,776,183 $ —U.S. Treasury Obligations — 10,992,698 —Asset-Backed Securities** — 7,732,841 —Sovereign Issues — 3,117,000 —Money Market Funds 3,249,584 — —
$ 3,249,584 $281,618,722 $ —
Ohio National Fund, Inc.
Notes to Financial Statements (Continued) December 31, 2019
150 (continued)

Portfolio Financial Instrument Type Level 1 Level 2 Level 3
ON BlackRock Balanced Allocation . . . . . . Common Stocks** $ 395,711,450 $ — $ —Corporate Bonds** — 141,085,207 —Asset-Backed Securities** — 1,300,223 —Rights** 31,915 — —Money Market Funds 5,704,709 — —
$ 401,448,074 $142,385,430 $ —Futures Contracts $ 62,161 $ — $ —
ON International Equity . . . . . . . . . . . . . . . . Common Stocks** $ 5,472,361 $458,107,739 $ —Money Market Funds 4,433,817 — —
$ 9,906,178 $458,107,739 $ —Futures Contracts $ (26,533) $ — $ —
ON Foreign. . . . . . . . . . . . . . . . . . . . . . . . . . Common Stocks** $ 350,797 $ 46,743,659 $ —Money Market Funds 821,692 — —
$ 1,172,489 $ 46,743,659 $ —Futures Contracts $ (3,868) $ — $ —
ON Janus Henderson Forty . . . . . . . . . . . . . Common Stocks** $ 194,211,250 $ — $ —Money Market Funds 3,069,703 — —
$ 197,280,953 $ — $ —ON Janus Henderson Venture . . . . . . . . . . . Common Stocks** $ 163,357,101 $ 1,074,745 $ —
Master Limited Partnerships** 2,380,095 — —Money Market Funds 3,355,159 — —
$ 169,092,355 $ 1,074,745 $ —ON Janus Henderson Enterprise . . . . . . . . . Common Stocks** $ 106,368,931 $ 1,668,338 $ —
Money Market Funds 2,072,376 — —$ 108,441,307 $ 1,668,338 $ —
ON S&P 500® Index . . . . . . . . . . . . . . . . . . . Common Stocks** $1,201,715,776 $ — $ —U.S. Treasury Obligations — 199,366 —Money Market Funds 2,079,421 — —
$1,203,795,197 $ 199,366 $ —Futures Contracts $ 51,347 $ — $ —
ON BlackRock Advantage Large CapValue . . . . . . . . . . . . . . . . . . . . . . . . . . . . . . Common Stocks** $ 314,984,648 $ — $ —
Money Market Funds 4,408,585 — —$ 319,393,233 $ — $ —
Futures Contracts $ 88,121 $ — $ —ON Federated High Income Bond . . . . . . . . Corporate Bonds** $ — $188,521,214 $ —
Common Stocks** 256,041 — —Money Market Funds 6,782,268 — —
$ 7,038,309 $188,521,214 $ —ON Nasdaq-100® Index . . . . . . . . . . . . . . . . Common Stocks** $ 350,509,091 $ — $ —
U.S. Treasury Obligations — 79,746 —Money Market Funds 3,751,571 — —
$ 354,260,662 $ 79,746 $ —Futures Contracts $ 80,293 $ — $ —
Ohio National Fund, Inc.
Notes to Financial Statements (Continued) December 31, 2019
151 (continued)

Portfolio Financial Instrument Type Level 1 Level 2 Level 3
ON BlackRock Advantage Large Cap Core . Common Stocks** $ 428,547,250 $ — $ —Rights** 34,973 — —Money Market Funds 4,302,909 — —
$ 432,885,132 $ — $ —Futures Contracts $ 79,189 $ — $ —
ON BlackRock Advantage Small CapGrowth . . . . . . . . . . . . . . . . . . . . . . . . . . . . . Common Stocks** $ 203,154,709 $ — $ —
Rights** — 12,876 —Money Market Funds 3,073,403 — —
$ 206,228,112 $ 12,876 $ —Futures Contracts $ 27,872 $ — $ —
ON S&P MidCap 400® Index . . . . . . . . . . . . Common Stocks** $ 447,492,286 $ — $ —U.S. Treasury Obligations — 99,683 —Money Market Funds 3,224,601 — —
$ 450,716,887 $ 99,683 $ —Futures Contracts $ 46,323 $ — $ —
ON BlackRock Advantage Large CapGrowth . . . . . . . . . . . . . . . . . . . . . . . . . . . . . Common Stocks** $ 112,669,548 $ — $ —
Rights** 16,103 — —Money Market Funds 1,063,702 — —
$ 113,749,353 $ — $ —Futures Contracts $ 18,034 $ — $ —
ON Risk Managed Balanced . . . . . . . . . . . . Common Stocks** $ 193,454,665 $ — $ —Corporate Bonds** — 46,759,808 —U.S. Government Agency Mortgage-BackedSecurities — 35,491,123 —U.S. Treasury Obligations — 29,644,983 —Purchased Options 5,601,755 23,200,405 —Asset-Backed / Mortgage-BackedSecurities** — 9,117,954 —Preferred Securities** 184,599 521,794 —Money Market Funds 66,267,621 — —
$ 265,508,640 $144,736,067 $ —Futures Contracts $ (1,797,268) $ — $ —TBA Sales Commitments $ — $ (1,416,142) $ —
ON Conservative Model. . . . . . . . . . . . . . . . Open-End Mutual Funds $ 75,137,748 $ — $ —ON Moderately Conservative Model . . . . . . Open-End Mutual Funds $ 223,304,319 $ — $ —ON Balanced Model . . . . . . . . . . . . . . . . . . Open-End Mutual Funds $1,109,842,859 $ — $ —ON Moderate Growth Model . . . . . . . . . . . . Open-End Mutual Funds $1,962,080,780 $ — $ —ON Growth Model . . . . . . . . . . . . . . . . . . . . Open-End Mutual Funds $ 433,807,420 $ — $ —
** For detailed industry descriptions, see the accompanying Schedules of Investments.
Foreign Securities and Currency
The books and records of all the Portfolios are maintained in U.S. dollars. All investments and cash quoted in foreign currencies arevalued daily in U.S. dollars on the basis of the foreign currency exchange rates provided by an independent source. These exchangerates are currently determined daily at 4:00 pm Eastern Time for normal trading sessions. Purchases and sales offoreign-denominated investments are recorded at rates of exchange prevailing on the respective dates of such transactions.
Ohio National Fund, Inc.
Notes to Financial Statements (Continued) December 31, 2019
152 (continued)

The Fund may not fully isolate that portion of the results of operations resulting from changes in foreign exchange rates fromfluctuations arising from changes in market prices on foreign currency-denominated investments. For the portion that is isolated,amounts are reflected in the Statements of Operations as other foreign currency related transactions. However, for tax purposes,the Fund does fully isolate the effect of fluctuations in foreign exchange rates when determining the gain or loss upon sale ormaturity of such investments to the extent required by federal income tax regulations.
All Portfolios of the Fund may invest in securities of foreign issuers. The ON International Equity and ON Foreign Portfolios may beinvested entirely in foreign securities. Investments in securities of foreign issuers, including investments in foreign companiesthrough the use of depositary receipts, carry certain risks not ordinarily associated with investments in securities of domesticissuers. Such risks include future political and economic developments, and the possible imposition of exchange controls or otherforeign governmental laws and restrictions. In addition, with respect to certain countries, there is the possibility of expropriation ofassets, confiscatory taxation, political or social instability, or diplomatic developments that could adversely affect capitalinvestment within those countries.
Restricted Securities
Restricted securities are those securities purchased through a private offering and cannot be resold to the general public withoutprior registration under the Securities Act of 1933 (“the 1933 Act”) or pursuant to the resale limitations provided by Rule 144A underthe 1933 Act, or an exemption from the registration requirements of the 1933 Act. 144A securities are issued by corporations withoutregistration in reliance on 1933 Act provisions allowing for the private resale of unregistered securities to qualified institutionalbuyers. Section 4(a)(2) commercial paper is issued pursuant to Section 4(a)(2) of the 1933 Act which exempts an issue fromregistration. This paper may be used to finance non-current transactions, such as acquisitions, stock repurchase programs, andother long-term assets. Investments by a portfolio in Rule 144A and Section 4(a)(2) securities could have the effect of decreasing theliquidity of a Portfolio during any period in which qualified institutional investors were no longer interested in purchasing thesesecurities.
Investment Transactions and Related Income
For financial reporting purposes, investment transactions are accounted for on a trade date basis. For purposes of executingseparate account shareholder transactions in the normal course of business, however, the Fund’s investment transactions arerecorded no later than the first calculation on the first business day following the trade date in accordance with Rule 2a-4 of the 40Act. Accordingly, differences between the net asset values for financial reporting and for executing separate account shareholdertransactions may arise.
Dividend income is recognized on the ex-dividend date, except in the case of those Portfolios holding foreign securities, in whichdividends are recorded as soon after the ex-dividend date as the Fund’s information agents become aware of such dividends.Interest income is accrued daily as earned and includes the amortization of premium and accretion of discount. Net realized gain orloss on investments and foreign exchange transactions are determined using the specific identification method.
Distributions to Shareholders and Federal Taxes
The Fund satisfies its distribution requirements, as required for each of the Portfolios to continue to qualify as a regulatedinvestment company pursuant to Subchapter M of the Internal Revenue Code, by using consent dividends and/or cash distributions.Consent dividends, when authorized, become taxable to the Fund’s shareholders as if they were paid in cash. The Fund has theintent to continue to comply with tax provisions pertaining to regulated investment companies and make distributions of taxableincome, whether by cash or consent dividends, sufficient to relieve it from substantially all federal income and excise taxes. Assuch, no provisions for federal income or excise taxes have been recorded. Also, no tax-related interest or penalties have beenincurred or recognized. The Board’s intent is that the Fund will not distribute any realized gain distributions (consent or otherwise)until any applicable capital loss carryforwards have been offset.
The character of ordinary income distributions, realized capital gains distributions, and return of capital, if any, are determined inaccordance with federal income tax regulations and may differ from net investment income and realized gains for financialreporting purposes. These “book/tax” differences are either considered temporary or permanent in nature. To the extent thesedifferences are permanent in nature they are reclassified within the composition of net assets; temporary differences do not requiresuch reclassification. Distributions to shareholders that exceed taxable income and net taxable realized gains are reported asreturn of capital distributions.
Ohio National Fund, Inc.
Notes to Financial Statements (Continued) December 31, 2019
153 (continued)

The Fund’s management and its tax agent perform an affirmative evaluation of tax positions taken or expected to be taken in thecourse of preparing the Fund’s tax returns to determine whether it is more-likely-than-not (i.e. greater than 50-percent) that each taxposition will be sustained upon examination by a taxing authority based on the technical merits of the position. Implementation of theevaluation included a review of tax positions taken in tax years that remain subject to examination by all major tax jurisdictions,including federal tax and the state of Maryland. The determination has been made that there are no uncertain tax positions thatwould require the Portfolios to record a tax liability or provision.
Expense Allocation
Expenses directly attributable to a Portfolio are charged to that Portfolio. Expenses that cannot be directly attributed to a Portfolioare allocated among all the benefited Portfolios on a basis of relative net assets or other appropriate method.
Foreign Withholding Taxes
Certain Portfolios in the Fund may be subject to taxes imposed by countries in which they invest with respect to their investments inissuers existing or operating in such countries. Such taxes are generally withheld based on income earned. These Portfolios accruesuch taxes as the related income is earned.
TBA Commitments
To-Be-Announced (“TBA”) commitments are agreements for the purchase or sale of mortgage-backed securities for a fixed price,with payment and delivery on an agreed upon future settlement date beyond the customary settlement period for such securities.The specific securities to be delivered are not identified at the trade date. However, delivered securities must meet specified terms,including issuer, rate and term and be within industry-accepted “good delivery” standards. When entering into TBA commitments,a Portfolio may take possession of or deliver the underlying mortgage-backed securities but can extend the settlement or roll thetransaction. TBA commitments involve a risk of loss if the value of the security to be purchased or sold declines or increases,respectively, prior to settlement date.
Mortgage Dollar Rolls
A Portfolio may enter into a mortgage dollar roll (“MDR”) transaction, in which the Portfolio agrees to both sell and purchase asimilar, but not identical, TBA mortgage-backed security with the same issuer, rate, and term on a later date at a set price. MDRs aretreated as purchases and sales, which may have the effect of increasing portfolio turnover rates, and result in realized gains andlosses based on the agreed-upon fixed prices.
Bank Loans
A Portfolio may invest in bank loans, which represent an interest in amounts owned by a borrower to a syndicate of lenders. Bankloans are generally non-investment grade and often involve borrowers whose financial condition is highly leveraged. Transactionsin bank loans may settle on a delayed basis, which could result in proceeds from the sale not being readily available for a Portfolioto make additional investments or meet its redemption obligations. Bank loans are typically senior in the corporate capital structureof the borrower. Bank loans generally pay interest at variable rates that are periodically determined by reference to a base lendingrate plus a premium. The base lending rates are generally the lending rate offered by one or more European banks, such as theLondon Interbank Offered Rate (“LIBOR”). Bank loans may involve foreign borrowers, and investments may be denominated inforeign currencies. While the Portfolios expect to invest in fully funded term loans, certain of the loans in which the Portfolios investmay include revolving loans, bridge loans, and delayed draw term loans. These investments are treated as fixed income securitiesfor valuation purposes.
Bank loans may be acquired through either an assignment or a participation. In a participation, a Portfolio would have a contractualrelationship with the lender, not with the borrower, and the lender would remain the official holder of the loan, with the participantowning the rights to the amount purchased. As such, the Portfolio would not only assume the credit risk of the borrower, but also thatof the selling participant or other persons interpositioned between the Portfolio and the borrower. In contrast, in an assignment, aPortfolio would become a direct signatory to the loan and receive interest and principal payments directly from the administrativeagent. The ON Risk Managed Balanced Portfolio and the ON Federated High Income Bond Portfolio were the only Portfolios to holdbank loans during the year ended December 31, 2019, and all bank loans were held via assignment.
Ohio National Fund, Inc.
Notes to Financial Statements (Continued) December 31, 2019
154 (continued)

New Accounting Pronouncements and Regulations
In March 2017, the Financial Accounting Standards Board (the “FASB”) issued ASU 2017-08, “Premium Amortization on PurchasedCallable Debt Securities”, which provides guidance related to the amortization period for certain purchased callable debt securitiesheld at a premium. This ASU is effective for annual periods beginning after December 15, 2018, and interim periods within thoseannual periods. The Fund adopted the ASU and concluded there was no significant impact on the Fund’s financial statements.
In August 2018, the FASB issued ASU 2018-13 “Disclosure Framework – Changes to the Disclosure Requirements for Fair ValueMeasurement“, which modifies the disclosure requirements on fair value measurements included in Topic 820, Fair ValueMeasurement. This ASU is effective for annual periods beginning after December 15, 2019, and interim periods within those annualperiods. The Fund has early-adopted the removal of the disclosure of the amount and reasons for transfers between Level 1 andLevel 2 of the fair value hierarchy, as well as the policy for timing of transfers between levels. The Fund’s management is currentlyevaluating the impact of the other modifications of this ASU on the Fund’s financial statements.
Subsequent Events
At meetings held on November 14, 2019 and February 12, 2020, the Board, including a majority of the Directors who are not“interested persons” of the Fund, approved an amendment to the advisory agreement between ONI and the Fund for the purpose ofadding five Portfolios to the Portfolios currently managed by the Adviser under the Advisory Agreement, as well as sub-advisoryagreements related to the additional Portfolios. The dates of commencement for those Portfolios have yet to be determined. At theFebruary 12, 2020 meeting, the Board, including a majority of the Directors who are not �interested persons� of the Fund, approved amerger of the ON International Equity Portfolio and the ON Foreign Portfolio. This merger will be effective on or about May 1, 2020.
Management has evaluated events and transactions through the date the financial statements were issued, for purposes ofrecognition or disclosure in these financial statements, and there are no other subsequent events to report.
(3) Portfolio Reorganizations
At meetings held on May 16, 2019 and June 19, 2019, the Board approved reorganizations pursuant to which the assets of each of theON Equity and ON Capital Appreciation Portfolios, ON ICON Balanced Portfolio, and ON ClearBridge Small Cap Portfolio (the “TargetPortfolios”) would be acquired, and each of the Portfolio’s liabilities would be assumed, by the Portfolio (the “Survivor Portfolio”)listed opposite the Target Portfolio(s) in the chart below in exchange for shares of the Survivor Portfolio. The reorganizations wereconsummated effective as of the end of business on August 23, 2019.
Target Portfolios To be reorganized into Survivor Portfolios
ON Equity, ON Capital Appreciation -> ON BlackRock Advantage Large Cap CoreON ICON Balanced -> ON BlackRock Balanced AllocationON ClearBridge Small Cap -> ON BlackRock Advantage Small Cap Growth
The combination of assets for each reorganization presented opportunities for operational efficiencies, which should translate to adecrease in the rate of future expenses borne by the shareholders of the Survivor Portfolios. It is anticipated that no gain or loss forfederal income tax purposes will be recognized by Portfolio shareholders as a result of the reorganizations. All fees and expensesincurred directly as a result of the reorganizations were borne by ONI.
Pursuant to the reorganizations, the shares of each Target Portfolio were liquidated, and shares of each Survivor Portfolio weredistributed to the Target Portfolio shareholders at the same aggregate dollar value as those of the Target Portfolio. The liquidation ofTarget Portfolio shares and distribution of Survivor Portfolio shares resulting from the reorganizations are summarized below:
Ohio National Fund, Inc.
Notes to Financial Statements (Continued) December 31, 2019
155 (continued)

Target Portfolios prior to the reorganizations:
ON EquityON Capital
AppreciationON ICONBalanced
ON ClearBridgeSmall Cap
Investment portfolio fair value . . . . . . . . . . . . . . . . . . . . . . . . . . . . . . . . $223,035,288 $ 89,148,174 $460,592,643 $113,322,189Investment portfolio cost . . . . . . . . . . . . . . . . . . . . . . . . . . . . . . . . . . . . $224,887,233 $ 91,889,534 $431,725,518 $112,226,496Unrealized portfolio appreciation (depreciation) . . . . . . . . . . . . . . . . . . $ (1,851,945) $ (2,741,360) $ 28,867,125 $ 1,095,693Net assets . . . . . . . . . . . . . . . . . . . . . . . . . . . . . . . . . . . . . . . . . . . . . . . . $223,245,270 $ 89,333,028 $462,055,756 $113,327,536Net asset value (per share, extended) . . . . . . . . . . . . . . . . . . . . . . . . . . $ 35.7255 $ 39.8373 $ 21.4979 $ 54.6402Shares. . . . . . . . . . . . . . . . . . . . . . . . . . . . . . . . . . . . . . . . . . . . . . . . . . . 6,248,906 2,242,446 21,493,028 2,074,069
Survivor Portfolios prior to the reorganizations:ON BlackRock
AdvantageLarge Cap Core
ON BlackRockBalancedAllocation
ON BlackRockAdvantage
Small Cap Growth
Investment portfolio fair value . . . . . . . . . . . . . . . . . . . . . . . . . . . . . . . . . . . . . . . . . $ 94,021,654 $ 55,607,905 $ 78,723,068Investment portfolio cost . . . . . . . . . . . . . . . . . . . . . . . . . . . . . . . . . . . . . . . . . . . . . $ 92,769,119 $ 53,682,160 $ 81,346,417Unrealized portfolio appreciation (depreciation) . . . . . . . . . . . . . . . . . . . . . . . . . . . $ 1,252,535 $ 1,925,745 $ (2,623,349)Net assets. . . . . . . . . . . . . . . . . . . . . . . . . . . . . . . . . . . . . . . . . . . . . . . . . . . . . . . . . $ 94,156,983 $ 55,776,643 $ 78,924,045Net asset value (per share, extended) . . . . . . . . . . . . . . . . . . . . . . . . . . . . . . . . . . . $ 29.3958 $ 32.9692 $ 27.6742Shares . . . . . . . . . . . . . . . . . . . . . . . . . . . . . . . . . . . . . . . . . . . . . . . . . . . . . . . . . . . 3,203,074 1,691,779 2,851,900
Survivor Portfolios subsequent to the reorganizations:ON BlackRock
AdvantageLarge Cap Core
ON BlackRockBalancedAllocation
ON BlackRockAdvantage
Small Cap Growth
Investment portfolio fair value . . . . . . . . . . . . . . . . . . . . . . . . . . . . . . . . . . . . . . . . . $406,205,116 $516,200,548 $192,045,257Investment portfolio cost . . . . . . . . . . . . . . . . . . . . . . . . . . . . . . . . . . . . . . . . . . . . . $409,545,886 $485,407,678 $193,572,913Unrealized portfolio appreciaton (depreciation) . . . . . . . . . . . . . . . . . . . . . . . . . . . . $ (3,340,770) $ 30,792,870 $ (1,527,656)Net assets. . . . . . . . . . . . . . . . . . . . . . . . . . . . . . . . . . . . . . . . . . . . . . . . . . . . . . . . . $406,735,281 $517,832,399 $192,251,581Net asset value (per share, extended) . . . . . . . . . . . . . . . . . . . . . . . . . . . . . . . . . . . $ 29.3958 $ 32.9692 $ 27.6742Shares. . . . . . . . . . . . . . . . . . . . . . . . . . . . . . . . . . . . . . . . . . . . . . . . . . . . . . . . . . . . 13,836,508 15,706,525 6,946,962
Assuming that each transaction had been completed on January 1, 2019, the beginning of the annual reporting period for the Fund,the unaudited pro forma results of operations for each Survivor Portfolio for the year ended December 31, 2019, are as follows:
ON BlackRock Advantage Large Cap Core (Unaudited)Net investment income . . . . . . . . . . . . . . . . . . . . . . . . . . . . . . . . . . . . . . . . . . . . . . . . . . . . . . . . . . . . . . . . . . . . . . . . . $ 5,852,902Net realized/unrealized gains . . . . . . . . . . . . . . . . . . . . . . . . . . . . . . . . . . . . . . . . . . . . . . . . . . . . . . . . . . . . . . . . . . . . 110,009,665Change in net assets resulting from operations . . . . . . . . . . . . . . . . . . . . . . . . . . . . . . . . . . . . . . . . . . . . . . . . . . . . . . $115,862,567ON BlackRock Balanced Allocation (Unaudited)Net investment income . . . . . . . . . . . . . . . . . . . . . . . . . . . . . . . . . . . . . . . . . . . . . . . . . . . . . . . . . . . . . . . . . . . . . . . . . $ 9,956,157Net realized/unrealized gains . . . . . . . . . . . . . . . . . . . . . . . . . . . . . . . . . . . . . . . . . . . . . . . . . . . . . . . . . . . . . . . . . . . . 96,134,061Change in net assets resulting from operations . . . . . . . . . . . . . . . . . . . . . . . . . . . . . . . . . . . . . . . . . . . . . . . . . . . . . . $106,090,218ON BlackRock Advantage Small Cap Growth (Unaudited)Net investment income . . . . . . . . . . . . . . . . . . . . . . . . . . . . . . . . . . . . . . . . . . . . . . . . . . . . . . . . . . . . . . . . . . . . . . . . . $ 562,582Net realized/unrealized gains . . . . . . . . . . . . . . . . . . . . . . . . . . . . . . . . . . . . . . . . . . . . . . . . . . . . . . . . . . . . . . . . . . . . 45,383,940Change in net assets resulting from operations . . . . . . . . . . . . . . . . . . . . . . . . . . . . . . . . . . . . . . . . . . . . . . . . . . . . . . $ 45,946,522
Because the combined investment portfolios have been managed as a single integrated portfolio since the acquisition wascompleted, it is not practicable to separate the amounts of revenue and earnings of the Target Portfolios that have been included inthe Survivor Portfolios’ Statements of Operations since August 23, 2019.
Ohio National Fund, Inc.
Notes to Financial Statements (Continued) December 31, 2019
156 (continued)

(4) Related Party and Other Transactions
The Fund has an Investment Advisory Agreement with Ohio National Investments, Inc. (�ONI�), a wholly-owned subsidiary of ONLIC.Under the terms of this agreement, ONI provides portfolio management and investment advice to the Fund and administers itsoperations, subject to the supervision of the Board. This agreement is renewed annually upon the approval by the Board. Ascompensation for its services, ONI receives advisory fees from the Fund calculated on the basis of each Portfolio’s average daily netassets and the following current schedule of Board-approved annualized fee breakpoints.ON Bond
0.60% of first $100 million0.50% of next $150 million0.45% of next $250 million0.40% of next $500 million0.30% of next $1 billion0.25% over $2 billionON BlackRock Balanced Allocation1
0.58% of first $100 million0.50% of next $150 million0.45% of next $250 million0.40% of next $500 million0.30% of next $1 billion0.25% over $2 billionON International Equity
3
0.72% of first $200 million0.70% of next $800 million0.66% over $1 billionON Foreign3
0.72% of first $200 million0.70% of next $800 million0.66% over $1 billionON Janus Henderson Forty
2
0.73% of first $100 million0.68% of next $400 million0.63% over $500 million
ON Janus Henderson Venture
0.80% of first $150 million0.75% of next $150 million0.70% of next $300 million0.65% over $600 millionON Janus Henderson Enterprise
0.85% of first $100 million0.80% of next $100 million0.75% of next $300 million0.70% over $500 millionON S&P 500® Index
0.40% of first $100 million0.35% of next $150 million0.33% over $250 millionON BlackRock Advantage Large Cap Value3
0.67% of first $500 million0.65% over $500 millionON Federated High Income Bond
0.75% of first $75 million0.70% of next $75 million0.65% of next $75 million0.60% over $225 millionON Nasdaq-100
®Index
0.40% of first $100 million0.35% of next $150 million0.33% over $250 millionON BlackRock Advantage Large Cap Core1
0.64% of first $500 million0.62% over $500 million
ON BlackRock Advantage Small Cap Growth1
0.78% of first $100 million0.75% of next $400 million0.70% over $500 millionON S&P MidCap 400
®Index
0.40% of first $100 million0.35% of next $150 million0.33% over $250 millionON BlackRock Advantage Large Cap Growth1
0.66% of first $500 million0.64% over $500 millionON Risk Managed Balanced
0.90% of first $500 million0.75% over $500 millionON Conservative Model
0.40% of all net assetsON Moderately Conservative Model
0.40% of all net assetsON Balanced Model
0.40% of all net assetsON Moderate Growth Model
0.40% of all net assetsON Growth Model
0.40% of all net assets
1 At a meeting held on January 25, 2019, the Board, including a majority of the Directors who are not “interested persons” of the Fund, approved the replacementof the sub-adviser to the Portfolio.
Effective February 1, 2019, BlackRock Investment Management, LLC (�BlackRock�) replaced the Portfolios’ previous sub-adviser, Suffolk Capital Management,LLC . In conjunction with the change in sub-adviser, the names of the Portfolios were changed. Also, the Board approved a revision to the Portfolios’ advisory feebreakpoint schedule, effective February 1, 2019. Previously, the advisory fee breakpoints, based on each of the Portfolio’s daily net assets, respectively, were asfollows:
ON BlackRock Balanced Allocation ON BlackRock Advantage Large Cap Core ON BlackRock Advantage Small Cap Growth ON BlackRock Advantage Large Cap Growth
0.60% of first $100 million 0.80% of first $100 million 0.85% of first $100 million 0.80% of first $100 million0.50% of next $150 million 0.70% of next $400 million 0.75% of next $400 million 0.70% of next $400 million0.45% of next $250 million 0.65% over $500 million 0.70% over $500 million 0.65% over $500 million0.40% of next $500 million0.30% of next $1 billion0.25% over $2 billion2 At a meeting held on May 16, 2019, the Board, including a majority of the Directors who are not “interested persons” of the Fund, approved a revision to the
Portfolio’s advisory fee breakpoint schedule, effective June 1, 2019. Previously, the advisory fee breakpoints, based on the Portfolio’s daily net assets, were:
Ohio National Fund, Inc.
Notes to Financial Statements (Continued) December 31, 2019
157 (continued)

ON Janus Henderson Forty
0.80% of first $100 million0.75% of next $400 million0.70% over $500 million3 At a meeting held on November 14, 2019, the Board, including a majority of the Directors who are not “interested persons” of the Fund, approved the replacement
of the sub-adviser to the ON International Equity, ON Foreign, and ON BlackRock Advantage Large Cap Value Portfolios.
Effective December 7, 2019, BlackRock Investment Management LLC replaced the Portfolios’ previous sub-advisers, Lazard Asset Management LLC (ONInternational Equity Portfolio), Templeton Global Advisors Limited (ON Foreign Portfolio), and Federated Equity Management Company of Pennsylvania (ON LargeCap Value Portfolio), respectively. In conjunction with the change in sub-adviser, the name of the ON Federated Strategic Dividend Value Portfolio was changedto the ON BlackRock Advantage Large Cap Value Portfolio. Also, the Board approved a revision to the Portfolios’ advisory fee breakpoint schedules, effectiveDecember 7, 2019. Previously, the advisory fee breakpoints, based on each of the Portfolio’s daily net assets, were:
ON International Equity ON Foreign ON BlackRock Advantage Large Cap Value
0.85% of first $100 million 0.85% of first $100 million 0.75% of first $100 million0.80% of next $100 million 0.80% of next $100 million 0.70% of next $400 million0.70% of next $800 million 0.70% of next $800 million 0.65% over $500 million0.67% over $1 billion 0.67% over $1 billion
Under the Investment Advisory Agreement, the Fund authorizes ONI to retain sub-advisers for all Portfolios of the Fund, subject tothe approval of the Board. ONI has entered into sub-advisory agreements with BlackRock Investment Management, LLC(�BlackRock�), Janus Capital Management LLC (“Janus”), Geode Capital Management, LLC (“Geode”), Federated InvestmentManagement Company (“Federated”), and AnchorPath Financial, LLC (“AnchorPath”) to manage the investment of certainPortfolios’ assets, subject to the supervision of ONI.
The sub-advisers receive from ONI a sub-advisory fee calculated on the basis of each of the aforementioned Portfolios’ averagedaily net assets and the following current Board-approved schedule of annualized fee breakpoints.ON Janus Henderson Forty (Janus)5
0.40% of first $100 million0.35% of next $400 million0.30% over $500 millionON Janus Henderson Venture (Janus)
0.55% of first $150 million0.45% over $150 millionON Janus Henderson Enterprise (Janus)
0.60% of first $100 million0.55% of next $100 million0.50% over $200 millionON S&P 500
®Index (Geode)6,7
0.01% of all net assets
ON Federated High Income Bond (Federated)
0.50% of first $30 million0.40% of next $20 million0.30% of next $25 million0.25% over $75 millionON Nasdaq-100® Index (Geode)7
0.05% of first $100 million0.04% of next $150 million0.03% over $250 millionON BlackRock Advantage Small Cap Growth (BlackRock)4,6
0.40% of first $250 million0.35% over $250 million
ON S&P MidCap 400® Index (Geode)7
0.039% of first $100 million0.038% of next $150 million0.037% of next $250 million0.036% of next $500 million0.035% over $1 billionON Risk Managed Balanced (Janus)
0.35% of first $500 million0.25% over $500 millionON Risk Managed Balanced (AnchorPath)
0.20% of first $500 million0.15% over $500 million
4 At a meeting held on January 25, 2019, the Board, including a majority of the Directors who are not “interested persons” of the Fund, approved the replacementof the sub-adviser to the Portfolio.
Effective February 1, 2019, BlackRock replaced the Portfolios’ previous sub-adviser, Suffolk Capital Management, LLC. In conjunction with the change insub-adviser, the names of the Portfolios were changed. Previously, the sub-advisory fee breakpoints, based on each of the Portfolio’s daily net assets,respectively, were:
ON BlackRock Advantage Small Cap Growth
0.50% of first $100 Million0.45% of next $400 Million0.40% over $500 million5 At a meeting held on May 16, 2019, the Board, including a majority of the Directors who are not “interested persons” of the Fund, approved a
revision to the Portfolio’s sub-advisory fee breakpoint schedule, effective on June 1, 2019. Previously, the sub-advisory fee breakpoints, basedon the Portfolio’s daily net assets, were:
Ohio National Fund, Inc.
Notes to Financial Statements (Continued) December 31, 2019
158 (continued)

ON Janus Henderson Forty
0.55% of first $100 Million0.50% of next $400 Million0.45% over $500 million6 At a meeting held on August 22, 2019, the Board, including a majority of the Directors who are not “interested persons” of the Fund, approved a
revision to the Portfolios’ sub-advisory fee breakpoint schedule, effective on September 1, 2019. Previously, the sub-advisory fee breakpoints,based on each of the Portfolio’s daily net assets, were:
ON S&P 500® IndexON BlackRock AdvantageSmall Cap Growth
0.025% of first $100 million 0.45% of all net assets0.020% of next $150 million0.015% over $250 million7 The sub-advisory fees for the three Portfolios sub-advised by Geode could be impacted by an agreed-upon minimum aggregate per annum fee of $150,000. For
the year ended December 31, 2019, the minimum aggregate fee had no impact on the sub-advisory fees that were calculated based on the breakpoint scheduleindicated above.
Effective December 7, 2019, BlackRock receives from ONI a sub-advisory fee on the aggregate average daily net assets of the ONInternational Equity Portfolio8 and the ON Foreign Portfolio8. The fee for the Portfolios is calculated based on 0.32% of the first$200 million in aggregate daily net assets, and 0.30% for aggregate daily net assets over $200 million.8 At a meeting held on November 14, 2019, the Board, including a majority of the Directors who are not “interested persons” of the Fund, approved the replacement
of the sub-adviser to the Portfolio.
Effective December 7, 2019, BlackRock Investment Management, LLC replaced the Portfolios’ previous sub-advisers, Lazard Asset Management, LLC (ONInternational Equity Portfolio) and Templeton Global Advisors Limited (ON Foreign Portfolio). In conjunction with the change in sub-adviser, the Board approveda revision to the sub-advisory fee schedules shown above. Previously, the sub-advisory fee breakpoints, based on the Portfolio’s daily net assets, were:
ON International Equity ON Foreign
0.40% of first $500 million 0.43% of first $500 million0.35% of next $500 million 0.38% of next $500 million0.32% over $1 billion 0.35% over $1 billion
Effective December 7, 2019, BlackRock also receives from ONI a sub-advisory fee on the aggregate average daily net assets of theON BlackRock Advantage Large Cap Core Portfolio9,10, ON BlackRock Advantage Large Cap Growth Portfolio9,10, ON BlackRockAdvantage Large Cap Value Portfolio10, and the equity sleeve of the ON BlackRock Balanced Allocation Portfolio sub-advised byBlackRock
9,10
(collectively, the �BlackRock Large Cap Portfolios�). The fee for the Portfolios is calculated based on 0.20% of the first$500 million in aggregate daily net assets, and 0.18% for aggregate daily net assets over $500 million.9 At a meeting held on January 25, 2019, the Board, including a majority of the Directors who are not “interested persons” of the Fund, approved the replacement
of the sub-adviser to the Portfolio.
Effective February 1, 2019, BlackRock replaced the Portfolios’ previous sub-adviser, Suffolk Capital Management, LLC. In conjunction with the change insub-adviser, the names of the Portfolios were changed. Previously, the sub-advisory fee breakpoints, based on each of the Portfolio’s daily net assets,respectively, were:
ON BlackRock Balanced Allocation ON BlackRock Advantage Large Cap Core ON BlackRock Advantage Large Cap Growth
0.30% of first $100 million 0.45% of first $100 million 0.45% of first $100 million0.25% of next $150 million 0.40% of next $400 million 0.40% of next $400 million0.225% of next $250 million 0.35% over $500 million 0.35% over $500 million0.20% of next $500 million0.15% of next $1 billion0.125% over $2 billion10 At a meeting held on November 14, 2019, the Board, including a majority of the Directors who are not �interested persons� of the Fund, approved the replacement
of the sub-adviser to the ON BlackRock Large Cap Value Portfolio.
Effective December 7, 2019, BlackRock replaced the Portfolio’s previous sub-adviser, Federated Equity Management Company of Pennsylvania. In conjunctionwith the change in sub-adviser, the name of the Portfolio was changed from ON Federated Strategic Value Dividend Portfolio to ON BlackRock Large Cap Value
Ohio National Fund, Inc.
Notes to Financial Statements (Continued) December 31, 2019
159 (continued)

Portfolio. The Board approved amendments to the sub-advisory agreements for the BlackRock Large Cap Portfolios, also effective December 7, 2019. Prior to theamendment, the BlackRock Large Cap Portfolios’ sub-advisory fee breakpoint schedules, based on the daily net assets of each Portfolio, were:
ON BlackRock Balanced Allocation(Equity Sleeve sub-advised by BlackRock) ON BlackRock Advantage Large Cap Core ON BlackRock Advantage Large Cap Growth ON BlackRock Advantage Large Cap Value
0.20% of first $500 million 0.20% of first $500 million 0.20% of first $500 million 0.50% of first $35 million0.18% over $500 million 0.18% over $500 million 0.18% over $500 million 0.35% of next $65 million
0.25% over $100 million
Pursuant to a service agreement among ONI, ONLIC, and the Fund, ONLIC has agreed to provide personnel and facilities to ONI ona cost-reimbursement basis. These personnel members include officers of the Fund. ONLIC also provides clerical andadministrative services and such supplies and equipment as may be reasonably required in order for ONI to properly perform itsadvisory function pursuant to the Investment Advisory Agreement. ONLIC further performs duties to fulfill the transfer agent functionon behalf of the Fund. Performance of these duties by ONLIC and availability of facilities, personnel, supplies, and equipment doesnot represent an expense to the Fund in excess of the advisory fees paid to ONI.
Pursuant to the Investment Advisory Agreement between ONI and the Fund, if the total expenses applicable to any Portfolio duringany calendar quarter (excluding taxes, brokerage commissions, interest expense and management fees) exceed 1%, on anannualized basis, evaluated quarterly, of such Portfolio’s average daily net asset value, ONI will reimburse the Portfolio for suchexcess expenses. There were no expense reimbursements associated with this agreement during the year ended December 31,2019.
ONI has contractually agreed to reimburse the Fund to the extent that the annual ordinary operating expenses of the five ON ModelPortfolios, excluding: portfolio transaction and other investment related costs (including brokerage fees and commissions); taxes;borrowing costs (such as interest and dividend expenses on securities sold short); fees and expenses associated with investmentsin derivative instruments (including for example option and swap fees and expenses); any amounts payable pursuant to adistribution or service plan adopted in accordance with Rule 12b-1 under the 40 Act; any administrative and/or shareholder servicingfees payable pursuant to a plan approved by the Board; expenses incurred in connection with any merger or reorganization;
extraordinary expenses (such as litigation expenses, indemnification of Fund officers and Directors and contractual indemnificationof Portfolio service providers); and other expenses that the Directors agree have not been incurred in the ordinary course of thePortfolio’s business, exceed certain percentages of the average daily net assets (the �Expense Limitation Agreement.�).
For the period from May 1, 2019 to April 30, 2020, the applicable percentages of the average daily net assets of the five ON ModelPortfolios are as follows:
PortfolioON Conservative ModelON Moderately Conservative ModelON Balanced ModelON Moderate Growth ModelON Growth Model
0.92%1.00%1.00%1.07%1.14%
For the period from May 1, 2018 to April 30, 2019, the applicable percentages of the average daily net assets of the five ON ModelPortfolios were as follows:
PortfolioON Conservative ModelON Moderately Conservative ModelON Balanced ModelON Moderate Growth ModelON Growth Model
0.87%0.92%0.99%1.04%1.08%
For purposes of calculating the expenses subject to the Expense Limitation Agreement, the annual operating expenses are those aspresented pursuant to the Fund’s prospectus requirements. The prospectus presentation of Fund expenses includes Acquired FundFees and Expenses, which is a calculation of the indirect costs associated with the Portfolios’ underlying investments in otherinvestment companies. The current Expense Limitation Agreement will continue through April 30, 2020. The Expense LimitationAgreement may only be terminated with the consent of the Board.
Ohio National Fund, Inc.
Notes to Financial Statements (Continued) December 31, 2019
160 (continued)

Pursuant to the current Expense Limitation Agreement, as well as the prior agreements for the period May 1, 2018 to April 30, 2019and March 1, 2017 to April 30, 2018, ONI reimbursed the expenses of the ON Model Portfolios as follows:
PortfolioYear Ended
December 31, 2019Year Ended
December 31, 2018
Period FromMarch 1, 2017 (inception)
to December 31, 2017
ON Conservative Model . . . . . . . . . . . . . . . . . . . . . . . . . . . . . . . . . . . . . $220,103 $ 226,418 $ 225,670ON Moderately Conservative Model. . . . . . . . . . . . . . . . . . . . . . . . . . . . 261,201 470,818 546,454ON Balanced Model . . . . . . . . . . . . . . . . . . . . . . . . . . . . . . . . . . . . . . . . 778,985 1,505,609 2,175,981ON Moderate Growth Model. . . . . . . . . . . . . . . . . . . . . . . . . . . . . . . . . . 253,374 1,692,796 3,208,708ON Growth Model . . . . . . . . . . . . . . . . . . . . . . . . . . . . . . . . . . . . . . . . . . 64,344 638,268 787,420
Under the terms of the current Expense Limitation Agreement and prior expense limitation agreements, ONI is entitled to recoverexpenses waived or reimbursed for a period of up to three years from the date on which ONI reimbursed excess expenses. Norecoupment will occur unless a Portfolio’s operating expenses are below the expense limitation amount in effect at the time of thewaiver or reimbursement and the Portfolio’s current expense limitation. For the year ended December 31, 2019, ONI recoupedreimbursed expenses from the ON Moderate Growth and ON Growth Model Portfolios amounting to $431,342 and $118,816,respectively. These recouped expenses were related to expenses reimbursed by ONI during the period from May 1, 2018 to April 30,2019. Amounts of expenses, previously reimbursed by ONI under the Expense Limitation Agreement and prior agreements, that areavailable for future recoupments at December 31, 2019 are as follows:
Expires April30, 2021
Expires April30, 2022
Expires April30, 2023 Total
ON Conservative Model. . . . . . . . . . . . . . . . . . . . . . . . . . . . . . . . . . . . . . . . . . . . $ 307,130 $212,490 $152,571 $ 672,191ON Moderately Conservative Model . . . . . . . . . . . . . . . . . . . . . . . . . . . . . . . . . . 752,636 376,793 149,044 1,278,473ON Balanced Model . . . . . . . . . . . . . . . . . . . . . . . . . . . . . . . . . . . . . . . . . . . . . . 3,025,712 952,043 482,820 4,460,575ON Moderate Growth Model . . . . . . . . . . . . . . . . . . . . . . . . . . . . . . . . . . . . . . . . 4,497,363 226,173 — 4,723,536ON Growth Model . . . . . . . . . . . . . . . . . . . . . . . . . . . . . . . . . . . . . . . . . . . . . . . . 1,110,925 260,291 — 1,371,216
There were no recorded liabilities related to the Expense Limitation Agreement at December 31, 2019.
The Investment Advisory Agreement allows for a portion of the expenses related to the Fund’s Chief Compliance Officer and staff tobe incurred by the Fund and paid from the Fund to the Fund’s adviser, ONI. Pursuant to the service agreement among ONI, ONLIC,and the Fund, ONLIC has provided the personnel, services, and equipment necessary for the execution of the Fund’sregulation-mandated compliance function and ONI has reimbursed ONLIC for costs allocated to the Fund. For the year endedDecember 31, 2019, the Fund incurred compliance expenses totaling $253,000, which are allocated to the Portfolios by equal dollaramounts. Expenses incurred by the Portfolios are reflected on the Statements of Operations as “Compliance expense”.
Each director of the Board is compensated based on an annual retainer fee of $155,000, paid quarterly. The Board chair receives anadditional quarterly retainer fee of $3,750, and the Audit Committee chair receives an additional quarterly retainer fee of $1,250; eachpaid quarterly. For the year ended December 31, 2019, directors’ compensation and reimbursement of director expenses by thePortfolios of the Fund totaled $818,916.
The accounting agent and custodian for the Fund is State Street Bank (Kansas City, MO and Boston, MA). For assets held outside ofthe United States, State Street Bank utilizes a foreign sub-custodian network that is subject to oversight and periodic approval of theBoard.
Ohio National Fund, Inc.
Notes to Financial Statements (Continued) December 31, 2019
161 (continued)

(5) Capital Share Transactions
Capital share transactions for the year ended December 31, 2019, and the year ended December 31, 2018, respectively, were asfollows:
ON Bond ON BlackRock Balanced Allocation ON International EquityYear Ended Year Ended Year Ended Year Ended Year Ended Year Ended
December 31,2019
December 31,2018
December 31,2019
December 31,2018
December 31,2019
December 31,2018
Capital shares issued on sales . . . . . . . . . 3,240,589 2,259,416 545,146 333,499 974,536 34,482,673Capital shares issued in reorganizations . — — 14,014,746 — — —Capital shares issued on reinvested
distributions. . . . . . . . . . . . . . . . . . . . . . 329,020 — 763,025 — 500,682 —Capital shares redeemed . . . . . . . . . . . . . (3,498,040) (5,188,262) (1,351,971) (508,020) (10,613,337) (5,279,130)Net increase/(decrease) . . . . . . . . . . . . . 71,569 (2,928,846) 13,970,946 (174,521) (9,138,119) 29,203,543
ON Foreign ON Janus Henderson Forty ON Janus Henderson VentureYear Ended Year Ended Year Ended Year Ended Year Ended Year Ended
December 31,2019
December 31,2018
December 31,2019
December 31,2018
December 31,2019
December 31,2018
Capital shares issued on sales . . . . . . . . . 116,471 218,991 2,255,356 5,693,993 381,735 807,578Capital shares issued in reorganizations . — — — — — —Capital shares issued on reinvested
distributions. . . . . . . . . . . . . . . . . . . . . . 25,268 — 598,807 — 737,419 —Capital shares redeemed . . . . . . . . . . . . . (520,609) (653,067) (2,417,355) (1,615,798) (2,797,597) (2,464,805)Net increase/(decrease) . . . . . . . . . . . . . (378,870) (434,076) 436,808 4,078,195 (1,678,443) (1,657,227)
ON Janus Henderson Enterprise ON S&P 500® IndexON BlackRock Advantage Large Cap
ValueYear Ended Year Ended Year Ended Year Ended Year Ended Year Ended
December 31,2019
December 31,2018
December 31,2019
December 31,2018
December 31,2019
December 31,2018
Capital shares issued on sales . . . . . . . . . 126,984 1,370,764 3,326,047 11,443,848 1,018,596 1,908,206Capital shares issued in reorganizations . — — — — — —Capital shares issued on reinvested
distributions. . . . . . . . . . . . . . . . . . . . . . 111,426 — 3,497,765 — 671,969 —Capital shares redeemed . . . . . . . . . . . . . (717,906) (640,902) (10,242,233) (10,664,652) (4,249,469) (15,617,523)Net increase/(decrease) . . . . . . . . . . . . . (479,496) 729,862 (3,418,421) 779,196 (2,558,904) (13,709,317)
ON Federated High Income Bond ON Nasdaq-100® IndexON BlackRock Advantage Large Cap
CoreYear Ended Year Ended Year Ended Year Ended Year Ended Year Ended
December 31,2019
December 31,2018
December 31,2019
December 31,2018
December 31,2019
December 31,2018
Capital shares issued on sales . . . . . . . . . 881,649 1,170,318 1,678,291 11,099,181 234,322 829,082Capital shares issued in reorganizations . — — — — 10,633,434 —Capital shares issued on reinvested
distributions. . . . . . . . . . . . . . . . . . . . . . 405,082 — 2,522,274 — 67,855 —Capital shares redeemed . . . . . . . . . . . . . (2,471,563) (6,860,078) (6,137,710) (6,796,455) (4,133,242) (1,966,097)Net increase/(decrease) . . . . . . . . . . . . . (1,184,832) (5,689,760) (1,937,145) 4,302,726 6,802,369 (1,137,015)
Ohio National Fund, Inc.
Notes to Financial Statements (Continued) December 31, 2019
162 (continued)

ON BlackRock Advantage Small CapGrowth ON S&P MidCap 400® Index
ON BlackRock Advantage Large CapGrowth
Year Ended Year Ended Year Ended Year Ended Year Ended Year EndedDecember 31,
2019December 31,
2018December 31,
2019December 31,
2018December 31,
2019December 31,
2018
Capital shares issued on sales . . . . . . . . . 2,344,042 232,264 8,405,131 16,253,134 1,070,137 682,377Capital shares issued in reorganizations . 4,095,062 — — — — —Capital shares issued on reinvested
distributions. . . . . . . . . . . . . . . . . . . . . . 51,935 — 199,776 — 147,937 —Capital shares redeemed . . . . . . . . . . . . . (1,048,823) (1,433,520) (5,020,228) (1,498,050) (1,355,693) (1,728,342)Net increase/(decrease) . . . . . . . . . . . . . 5,442,216 (1,201,256) 3,584,679 14,755,084 (137,619) (1,045,965)
ON Risk Managed Balanced ON Conservative Model ON Moderately Conservative ModelYear Ended Year Ended Year Ended Year Ended Year Ended Year Ended
December 31,2019
December 31,2018
December 31,2019
December 31,2018
December 31,2019
December 31,2018
Capital shares issued on sales . . . . . . . . . 3,173,323 5,049,116 1,134,157 1,569,020 1,436,394 1,634,214Capital shares issued in reorganizations . — — — — — —Capital shares issued on reinvested
distributions. . . . . . . . . . . . . . . . . . . . . . 2,279,753 — 201,990 — 658,784 —Capital shares redeemed . . . . . . . . . . . . . (5,091,874) (4,626,549) (2,374,963) (3,300,032) (5,963,369) (8,637,861)Net increase/(decrease) . . . . . . . . . . . . . 361,202 422,567 (1,038,816) (1,731,012) (3,868,191) (7,003,647)
ON Balanced Model ON Moderate Growth Model ON Growth ModelYear Ended Year Ended Year Ended Year Ended Year Ended Year Ended
December 31,2019
December 31,2018
December 31,2019
December 31,2018
December 31,2019
December 31,2018
Capital shares issued on sales . . . . . . . . . 1,956,344 3,043,170 2,228,980 5,659,528 930,126 3,385,893Capital shares issued in reorganizations . — — — — — —Capital shares issued on reinvested
distributions. . . . . . . . . . . . . . . . . . . . . . 3,505,121 — 9,136,471 — 1,548,287 —Capital shares redeemed . . . . . . . . . . . . . (23,785,531) (32,518,291) (38,709,593) (49,240,271) (9,143,969) (9,165,822)Net increase/(decrease) . . . . . . . . . . . . . (18,324,066) (29,475,121) (27,344,142) (43,580,743) (6,665,556) (5,779,929)
Ohio National Fund, Inc.
Notes to Financial Statements (Continued) December 31, 2019
163 (continued)

(6) Investment Transactions
Cost of purchases and proceeds from sales of investments (excluding short-term and government securities) for the year endedDecember 31, 2019 were as follows:
ON BondON BlackRock
Balanced AllocationON International
Equity ON ForeignON Janus Henderson
Forty
Cost of purchases . . . . . . . . . . . . . . . . . . $104,725,022 $533,932,188 $485,062,012 $55,455,126 $ 98,582,523Proceeds from sales . . . . . . . . . . . . . . . . $116,414,111 $537,677,651 $603,191,161 $65,332,938 $107,893,346
ON Janus HendersonVenture
ON Janus HendersonEnterprise ON S&P 500® Index
ON BlackRockAdvantage Large Cap
ValueON Federated High
Income Bond
Cost of purchases . . . . . . . . . . . . . . . . . . $ 29,218,244 $10,671,169 $ 76,132,820 $396,469,010 $44,792,824Proceeds from sales . . . . . . . . . . . . . . . . $121,300,490 $37,036,075 $271,516,266 $440,017,530 $67,960,025
ON Nasdaq-100®
Index
ON BlackRockAdvantage Large Cap
Core
ON BlackRockAdvantage Small Cap
GrowthON S&P MidCap 400®
Index
ON BlackRockAdvantage Large Cap
Growth
Cost of purchases . . . . . . . . . . . . . . . . . . $ 25,805,527 $488,965,178 $248,336,124 $201,717,585 $221,479,983Proceeds from sales . . . . . . . . . . . . . . . . $107,350,815 $579,962,304 $204,978,836 $140,409,544 $226,446,756
ON Risk ManagedBalanced
ON ConservativeModel
ON ModeratelyConservative Model ON Balanced Model
ON Moderate GrowthModel
Cost of purchases . . . . . . . . . . . . . . . . . . $199,415,613 $17,410,066 $40,727,175 $249,253,667 $391,028,089Proceeds from sales . . . . . . . . . . . . . . . . $201,723,385 $27,672,478 $79,882,447 $440,364,259 $701,843,168
ON Growth Model
Cost of purchases. . . . . . . . . . . . . . . . . . . . . . . . . . . . . . . . . . . . . . . . . . . . . . . . . . . . . . . . . . . . . . . . . . . . . . . . . . . . $ 76,036,301Proceeds from sales. . . . . . . . . . . . . . . . . . . . . . . . . . . . . . . . . . . . . . . . . . . . . . . . . . . . . . . . . . . . . . . . . . . . . . . . . . $145,856,463
Cost of purchases and proceeds from sales of government securities for the year ended December 31, 2019 were as follows:
ON BondON BlackRock
Balanced AllocationON Risk Managed
Balanced
Cost of purchases . . . . . . . . . . . . . . . . . . . . . . . . . . . . . . . . . . . . . . . . . . . . . . . . $48,915,098 $86,211,880 $137,621,782Proceeds from sales . . . . . . . . . . . . . . . . . . . . . . . . . . . . . . . . . . . . . . . . . . . . . . $37,755,332 $85,567,650 $159,919,764
(7) Financial Instruments
The Portfolios may trade in financial instruments with off-balance sheet risk for hedging purposes or, otherwise, in accordance withstated investing objectives. These financial instruments may include options, futures, and foreign currency contracts that mayinvolve, to a varying degree, elements of risk in excess of the amounts recognized on financial statements.
Options
A Portfolio may buy and write (i.e., sell) call and put options. In writing call options, the Portfolio gives the purchaser of the call optionthe right to purchase the underlying securities from the Portfolio at a specified “exercise” price at any time prior to the expiration ofthe option, normally within nine months. A Portfolio writes a covered call option when it owns the underlying securities and anuncovered call option when it does not. In purchasing put options, a Portfolio pays the seller of the put option a premium for the rightof the Portfolio to sell the underlying securities to the seller at a specified exercise price prior to the expiration of the option. Whena Portfolio sells a put option, it has the obligation to buy, and the purchaser of the put the right to sell, the underlying security at theexercise price during the option period. Whenever a Portfolio has a written covered call option outstanding, the underlyingsecurities will be segregated by the Custodian and held in an escrow account to assure that such securities will be delivered to theoption holder if the option is exercised. While the underlying securities are subject to the option, the Portfolio remains the recordowner of the securities, entitling it to receive dividends and to exercise any voting rights. Whenever a Portfolio has a writtenuncovered call option outstanding, it will segregate with the Custodian cash or liquid assets that, when added to the amounts
Ohio National Fund, Inc.
Notes to Financial Statements (Continued) December 31, 2019
164 (continued)
deposited with the broker as margin, equal to the market value of the securities underlying the call option (but not less than theexercise price of the call option). To cover a written put option, the Portfolio writing the option deposits cash or liquid securities in asegregated account at the Custodian. In order to terminate its position as the writer or the purchaser of an option, the Portfolio mayenter into a “closing” transaction, which is the purchase (if the Portfolio has written the option) or sale (if the Portfolio is thepurchaser of the option) of an option on the same underlying securities and having the same exercise price and expiration date asthe option previously written or purchased by the Portfolio.
When a Portfolio writes a put or call option, an amount equal to the premium received is included on the Statement of Assets andLiabilities as a liability. The amount of the liability is subsequently marked-to-market to reflect the current market value of the option.Such liability is subject to off balance sheet risks to the extent of any future increases in market value of the written options. If anoption expires on its stipulated expiration date or if the Portfolio enters into a closing purchase transaction, a gain or loss is realized.If a written call option on an individual security is exercised, a gain or loss is realized for the sale of the underlying security, and theproceeds from the sale are increased by the premium originally received. If a written call option on a securities index is exercised,a gain or loss is realized as determined by the premium originally received, the exercise price and the market value of the index. If awritten put option on an individual security is exercised, the cost of the security acquired is decreased by the premium originallyreceived. When a Portfolio purchases a put or call option, an amount equal to the premium paid is included on the Portfolio’sStatement of Assets and Liabilities as an investment, and is subsequently marked-to-market to reflect the current market value ofthe option. If an option expires on the stipulated expiration date or if the Portfolio enters into a closing sale transaction, a gain or lossis realized. If a Portfolio exercises a call option on an individual security, the cost of the security acquired is increased by thepremium paid for the call. If the Portfolio exercises a put option on an individual security, a gain or loss is realized from the sale of theunderlying security, and the proceeds from such a sale are decreased by the premium originally paid. If the Portfolio exercises a putoption on a security index, a gain or loss is realized as determined by the premium originally paid, the exercise price and the marketvalue of the index.
The ON Risk Managed Balanced Portfolio purchased call and put options associated with the S&P 500 Index or related exchangetraded fund during the year ended December 31, 2019. These instruments were used by the Risk Management Component of thePortfolio to provide for the Portfolio’s stated risk management strategy. Transactions involving purchased options by the ON RiskManaged Balanced Portfolio for the year ended December 31, 2019 were: Cost of purchases: $25.8 million, Proceeds from sales:$22.1 million.
Written and purchased options are non-income producing securities.
Futures Contracts
A Portfolio may buy or sell two kinds of financial futures contracts: stock index futures contracts and interest rate futures contracts.Stock index futures contracts are contracts developed by and traded on national commodity exchanges whereby the buyer will, ona specified future date, pay or receive a final cash payment equal to the difference between the actual value of the stock index onthe last day of the contract and the value of the stock index established by the contract multiplied by the specific dollar amount setby the exchange. Futures contracts may be based on broad-based stock indices such as the S&P 500 Index or on narrow-basedstock indices. A particular index will be selected according to the Adviser’s investment strategy for the particular Portfolio. Aninterest rate futures contract is an agreement whereby one party agrees to sell and another party agrees to purchase a specifiedamount of a specified financial instrument (debt security) at a specified price at a specified date, time and place. Although interestrate futures contracts typically require actual future delivery of and payment for financial instruments, the contracts are usuallyclosed out before the delivery date. A public market exists in interest rate futures contracts covering primarily the following financialinstruments: U.S. Treasury bonds; U.S. Treasury notes; Government National Mortgage Association (�GNMA�) modifiedpass-through mortgage-backed securities; three-month U.S. Treasury bills; 90-day commercial paper; bank certificates of deposit;and Eurodollar certificates of deposit. U.S. futures contracts are traded on exchanges which have been designated “contractmarkets” by the Commodities Futures Trading Commission (“CFTC”) and must be executed through a futures commission merchant(“FCM”), or brokerage firm, which is a member of the relevant contract market. It is expected that futures contracts trading inadditional financial instruments will be authorized.
The Fund, on behalf of each Portfolio, has filed with the National Futures Association, a notice claiming an exclusion from thedefinition of the term “commodity pool operator” under the Commodity Exchange Act, as amended, and the rules of the CFTCpromulgated thereunder, with respect to each Portfolio’s operation. Accordingly, the Portfolios are not subject to registration orregulation as a commodity pool operator.
The buyer or seller of a futures contract is not required to deliver or pay for the underlying instrument unless the contract is held untilthe delivery date. However, both the buyer and seller are required to deposit “initial margin” for the benefit of the broker when thecontract is entered into. Initial margin deposits are equal to a percentage of the contract’s value, as set by the exchange on whichthe contract is traded, and are similar to good faith deposits or performance bonds.
Ohio National Fund, Inc.
Notes to Financial Statements (Continued) December 31, 2019
165 (continued)

Unlike margin extended by a securities broker, initial margin payments do not constitute purchasing securities on margin forpurposes of a Portfolio’s investment limitations. A Portfolio, its futures commission merchant and the Custodian retain control of theinitial margin until the contract is liquidated. If the value of either party’s position declines, the party on the side of the decliningposition will be required to make additional “variation margin” payments to settle the change in value on a daily basis. The party thathas a gain may be entitled to receive all or a portion of this amount. Variation margin is recognized as a receivable and/or payable forvariation margin on futures contracts on the Statement of Assets and Liabilities. In the event of the bankruptcy of the FCM that holdsmargin on behalf of a Portfolio, the Portfolio may be entitled to return of margin owed to the Portfolio only in proportion to the amountreceived by the FCM’s other customers. ONI and the sub-advisers will attempt to minimize this risk by carefully monitoring thecreditworthiness of the FCMs with which the Portfolios do business. In addition to the margin restrictions discussed above,transactions in futures contracts and options on futures contracts may involve the segregation of funds pursuant to requirementsimposed by the SEC. Under those requirements, where a Portfolio has a long position in a futures contract or sells a put option, it willbe required to establish a segregated account (not with an FCM or broker) containing cash or certain liquid assets equal to thepurchase price of the contract or the exercise price of the option (less any margin on deposit). For a short position in futurescontacts held by a Portfolio or call options sold by a Portfolio, those requirements mandate the establishment of a segregatedaccount (not with a futures commission merchant or broker) containing cash or certain liquid assets that, when added to theamounts deposited as margin, equal the market value of the instruments underlying the futures contracts or call options. However,segregation of assets is not required if a Portfolio “covers” its position.
Portions of certain Portfolios’ securities and cash holdings, as noted on those Portfolios’ Schedules of Investments, were pledged atDecember 31, 2019 as collateral for the Portfolios’ futures contracts. The futures contracts, except those held by the ON RiskManaged Balanced Portfolio, were used for the purpose of gaining equity exposure for cash and cash equivalents, thereby seekingto lessen a performance difference between the Portfolios and their respective benchmark indices. For the ON Risk ManagedBalanced Portfolio, these futures contracts were used by the Portfolio to provide for the Portfolio’s stated risk management strategy.There were other futures contracts executed and closed in the Portfolios during the year ended December 31, 2019. Those contractswere executed for similar purposes as the contracts outstanding at December 31, 2019. For the year ended December 31, 2019, thenotional values of futures contracts opened and closed prior to contract settlement date by the Portfolios were as follows:
Portfolio Collateral PledgedFutures Contracts
Opened (in millions)Futures Contracts
Closed (in millions)
ON BlackRock Balanced Allocation . . . . . . . . . . . . . . Portions of cash holdings $ 33.3 $ 29.1ON International Equity . . . . . . . . . . . . . . . . . . . . . . . . Portions of cash holdings 82.6 73.0ON Foreign. . . . . . . . . . . . . . . . . . . . . . . . . . . . . . . . . . Portions of cash holdings 14.5 13.5ON S&P 500® Index . . . . . . . . . . . . . . . . . . . . . . . . . . . Portions of cash holdings 238.8 243.3ON BlackRock Advantage Large Cap Value . . . . . . . . Portions of cash holdings 30.3 24.9ON Nasdaq-100® Index . . . . . . . . . . . . . . . . . . . . . . . . Portions of cash holdings 70.8 67.3ON BlackRock Advantage Large Cap Core . . . . . . . . . Portions of cash holdings 61.3 56.4ON BlackRock Advantage Small Cap Growth . . . . . . . Portions of cash holdings 42.0 38.8ON S&P MidCap 400® Index . . . . . . . . . . . . . . . . . . . . Portions of cash holdings 68.3 63.9ON BlackRock Advantage Large Cap Growth . . . . . . . Portions of cash holdings 25.8 24.7ON Risk Managed Balanced . . . . . . . . . . . . . . . . . . . . Portions of securities and cash holdings 1,442.6 1,395.3
Ohio National Fund, Inc.
Notes to Financial Statements (Continued) December 31, 2019
166 (continued)

The values and financial statement effects of derivative instruments that were not accounted for as hedging instruments as of, andfor, the year ended December 31, 2019, were as follows:
Portfolio Instrument Primary Risk Type
Value-Asset
Derivatives
Value-Liability
Derivatives
Location onStatements of
Assets andLiabilities
ON BlackRock Balanced Allocation . . . . . . . . . . . . Futures contracts Equity price $ 4,200,430 $ 4,138,269 (1)
ON International Equity . . . . . . . . . . . . . . . . . . . . . . Futures contracts Equity price 9,677,657 9,704,190 (1)
ON Foreign . . . . . . . . . . . . . . . . . . . . . . . . . . . . . . . Futures contracts Equity price 990,205 994,073 (1)
ON S&P 500® Index. . . . . . . . . . . . . . . . . . . . . . . . . Futures contracts Equity price 4,685,095 4,633,748 (1)
ON BlackRock Advantage Large Cap Value . . . . . . Futures contracts Equity price 5,492,870 5,404,749 (1)
ON Nasdaq-100® Index. . . . . . . . . . . . . . . . . . . . . . Futures contracts Equity price 4,551,170 4,470,877 (1)
ON BlackRock Advantage Large Cap Core . . . . . . . Futures contracts Equity price 5,008,205 4,929,016 (1)
ON BlackRock Advantage Small Cap Growth . . . . . Futures contracts Equity price 3,257,670 3,229,798 (1)
ON S&P MidCap 400® Index . . . . . . . . . . . . . . . . . . Futures contracts Equity price 4,749,040 4,702,717 (1)
ON BlackRock Advantage Large Cap Growth . . . . . Futures contracts Equity price 1,130,885 1,112,851 (1)
ON Risk Managed Balanced . . . . . . . . . . . . . . . . . . Futures contracts Equity price 269,330,654 271,127,922 (1)
Purchased options Equity price 28,802,160 — (2)
(1) Total distributable earnings. The amounts represent the cumulative appreciation (depreciation) of these futures contracts as reported in the Statements ofAssets and Liabilities. Only the current day’s variation margin, if any, is reported within the Statements of Assets and Liabilities as receivable (payable) forvariation margin on futures contracts. Each Portfolio’s Schedule of Open Futures Contracts details the values by futures contract type.
(2) Investments in securities of unaffiliated issuers, at value.
Portfolio Instrument Primary Risk Type
Realized Gain(Loss) on
DerivativesRecognized in
Income
Change in UnrealizedAppreciation/
Depreciation onDerivatives
Recognized inIncome
Location onStatements
of Operations
ON BlackRock Balanced Allocation . . . . . . . . . Futures contracts Equity price $ 634,273 $ 62,161 (1),(2)
ON International Equity . . . . . . . . . . . . . . . . . . Futures contracts Equity price 312,615 (26,533) (1),(2)
ON Foreign . . . . . . . . . . . . . . . . . . . . . . . . . . . . Futures contracts Equity price 47,205 (3,868) (1),(2)
ON S&P 500® Index . . . . . . . . . . . . . . . . . . . . . Futures contracts Equity price 1,734,821 11,247 (1),(2)
ON BlackRock Advantage Large Cap Value . . . Futures contracts Equity price (4,867) 88,121 (1),(2)
ON Nasdaq-100® Index . . . . . . . . . . . . . . . . . . Futures contracts Equity price 765,032 73,642 (1),(2)
ON BlackRock Advantage Large Cap Core. . . . Futures contracts Equity price 706,311 79,189 (1),(2)
ON BlackRock Advantage Small Cap Growth. . Futures contracts Equity price 58,297 27,872 (1),(2)
ON S&P MidCap 400® Index. . . . . . . . . . . . . . . Futures contracts Equity price 364,584 48,239 (1),(2)
ON BlackRock Advantage Large Cap Growth . Futures contracts Equity price 186,618 18,034 (1),(2)
ON Risk Managed Balanced . . . . . . . . . . . . . . Futures contracts Equity price 29,204,407 (4,554,030) (1),(2)
Purchased options Equity price (3,474,325) 3,082,671 (3),(4)
(1) Net realized gain (loss) on futures contracts.(2) Change in unrealized appreciation/depreciation on futures contracts.(3) Net realized gain (loss) on investments in securities of unaffiliated issuers.(4) Change in unrealized appreciation/depreciation on investments in securities of unaffiliated issuers.
Ohio National Fund, Inc.
Notes to Financial Statements (Continued) December 31, 2019
167 (continued)

The Portfolios may enter into International Swaps and Derivatives Association, Inc. Master Agreements (“ISDA MasterAgreement”) or similar agreements with their derivative contract counterparties whereby the Portfolios may, under certaincircumstances, offset with the counterparty certain derivative financial instruments’ payables and/or receivables and create onesingle net payment. For financial reporting purposes, the Portfolios offset derivative assets and liabilities that are subject to nettingarrangements in the Statements of Assets and Liabilities. At December 31, 2019, there were no outstanding derivative transactionssubject to netting arrangements.
(8) Federal Income Tax Information
The following information is presented on a federal income tax basis. Differences between amounts for financial statements andfederal income tax purposes are primarily due to timing and character differences in recognizing certain gains and losses oninvestment transactions. Permanent differences between financial statement and federal income tax reporting are reclassifiedwithin the capital accounts based on their federal income tax treatment. Temporary differences do not require reclassification.Reclassifications related to permanent differences relate principally to consent dividends, foreign currency gains and losses, netinvestment losses, and distributions from real estate investment trusts and closed end mutual funds.
At December 31, 2019, the components of accumulated earnings (deficit) on a tax basis were as follows:
Portfolio
UndistributedOrdinaryIncome
UndistributedLong-Term
Capital Gains(Losses)
AccumulatedEarnings
AccumulatedCapital and
Other Losses
UnrealizedAppreciation
(Depreciation)(1)
TotalAccumulated
Earnings(Deficit)
ON Bond . . . . . . . . . . . . . . . . . . . . . . . . . . . $1,955,669 $ — $ 1,955,669 $ (454,301) $ 13,428,631 $ 14,929,999ON BlackRock Balanced Allocation . . . . . . . . 2,036,182 1,314,177 3,350,359 — 46,056,099 49,406,458ON International Equity . . . . . . . . . . . . . . . . . 2,738,370 — 2,738,370 (10,784,804) 11,735,115 3,688,681ON Foreign. . . . . . . . . . . . . . . . . . . . . . . . . . 230,804 — 230,804 (5,405,906) 548,658 (4,626,444)ON Janus Henderson Forty . . . . . . . . . . . . . . 678,796 3,725,197 4,403,993 — 36,858,094 41,262,087ON Janus Henderson Venture . . . . . . . . . . . . — 3,821,473 3,821,473 — 44,202,559 48,024,032ON Janus Henderson Enterprise . . . . . . . . . . 41,437 1,359,869 1,401,306 — 18,033,382 19,434,688ON S&P 500® Index . . . . . . . . . . . . . . . . . . . 4,999,583 11,761,960 16,761,543 — 289,900,329 306,661,872ON BlackRock Advantage Large Cap Value . . . 3,498,339 1,114,722 4,613,061 — 4,208,469 8,821,530ON Federated High Income Bond . . . . . . . . . . 2,647,672 — 2,647,672 (5,780,675) 551,061 (2,581,942)ON Nasdaq-100® Index . . . . . . . . . . . . . . . . . 848,167 16,178,839 17,027,006 — 90,799,649 107,826,655ON BlackRock Advantage Large Cap Core. . . . 639,058 — 639,058 (1,243,925) 40,319,245 39,714,378ON BlackRock Advantage Small Cap Growth . . 494,471 1,780,156 2,274,627 — 19,141,703 21,416,330ON S&P MidCap 400® Index . . . . . . . . . . . . . 716,555 1,373,402 2,089,957 — 28,142,904 30,232,861ON BlackRock Advantage Large Cap Growth. . 898,609 719,721 1,618,330 — 15,037,224 16,655,554ON Risk Managed Balanced . . . . . . . . . . . . . 5,239,478 5,577,480 10,816,958 — 61,852,945 72,669,903ON Conservative Model. . . . . . . . . . . . . . . . . 648,710 114,231 762,941 — 847,803 1,610,744ON Moderately Conservative Model . . . . . . . . — — — — 2,392,985 2,392,985ON Balanced Model . . . . . . . . . . . . . . . . . . . — — — (3,748,979) 16,820,336 13,071,357ON Moderate Growth Model . . . . . . . . . . . . . — — — — 8,233,771 8,233,771ON Growth Model. . . . . . . . . . . . . . . . . . . . . — — — — (1,595,959) (1,595,959)
(1) The differences between book-basis and tax-basis unrealized appreciation/(depreciation) are attributed primarily to tax deferral of losses on wash sales and therealization for tax purposes of unrealized gains/(losses) on certain instruments.
For federal income tax purposes, the following Portfolios had capital loss carryforwards as of December 31, 2019 that are available tooffset future realized gains, if any:
PortfolioTotal Loss
Carryforward
NoExpirationShort Term
NoExpirationLong Term
ON Bond . . . . . . . . . . . . . . . . . . . . . . . . . . . . . . . . . . . . . . . . . . . . . . . . . . . . . . . . . . . . . . . . . . $ 454,301 $ 454,301 $ —ON International Equity . . . . . . . . . . . . . . . . . . . . . . . . . . . . . . . . . . . . . . . . . . . . . . . . . . . . . . 10,784,804 10,784,804 —ON Foreign . . . . . . . . . . . . . . . . . . . . . . . . . . . . . . . . . . . . . . . . . . . . . . . . . . . . . . . . . . . . . . . . 5,405,906 — 5,405,906ON Federated High Income Bond . . . . . . . . . . . . . . . . . . . . . . . . . . . . . . . . . . . . . . . . . . . . . . 5,780,675 70,469 5,710,206ON BlackRock Advantage Large Cap Core . . . . . . . . . . . . . . . . . . . . . . . . . . . . . . . . . . . . . . . 1,243,925 1,243,925 —ON Balanced Model . . . . . . . . . . . . . . . . . . . . . . . . . . . . . . . . . . . . . . . . . . . . . . . . . . . . . . . . . 3,748,979 3,748,979 —
Ohio National Fund, Inc.
Notes to Financial Statements (Continued) December 31, 2019
168 (continued)

The cost basis for federal income tax purposes may differ from the cost basis for financial reporting purposes. The table belowdetails the unrealized appreciation (depreciation) and aggregate cost of investments at December 31, 2019 for federal income taxpurposes.
ON Bond
ON BlackRockBalancedAllocation
ON InternationalEquity ON Foreign
ON JanusHenderson Forty
ON JanusHenderson
Venture
Gross unrealized:Appreciation. . . . . . . . . . . . . . . . . . . . . . . $ 13,749,925 $ 49,722,697 $ 20,127,024 $ 1,543,764 $ 38,054,458 $ 48,351,980Depreciation. . . . . . . . . . . . . . . . . . . . . . . (321,294) (3,666,601) (8,439,174) (1,001,027) (1,196,364) (4,149,427)
Net unrealized appreciation (depreciation) . . $ 13,428,631 $ 46,056,096 $ 11,687,850 $ 542,737 $ 36,858,094 $ 44,202,553Aggregate cost of investments: . . . . . . . . . . $271,439,675 $497,839,568 $456,299,534 $47,369,543 $160,422,859 $125,964,547
ON JanusHendersonEnterprise
ON S&P 500®
Index
ON BlackRockAdvantage Large
Cap Value
ON FederatedHigh Income
BondON Nasdaq-100®
Index
ON BlackRockAdvantage Large
Cap Core
Gross unrealized:Appreciation. . . . . . . . . . . . . . . . . . . . . . . $20,082,164 $322,200,561 $ 6,428,215 $ 7,354,798 $ 95,858,401 $ 43,149,769Depreciation. . . . . . . . . . . . . . . . . . . . . . . (2,048,837) (32,300,232) (2,228,231) (6,803,737) (5,058,752) (2,830,524)
Net unrealized appreciation (depreciation) . . $18,033,327 $289,900,329 $ 4,199,984 $ 551,061 $ 90,799,649 $ 40,319,245Aggregate cost of investments: . . . . . . . . . . $92,076,318 $914,145,581 $315,281,370 $195,008,462 $263,621,052 $392,645,076
ON BlackRockAdvantage Small
Cap GrowthON S&P MidCap
400® Index
ON BlackRockAdvantage Large
Cap GrowthON Risk Managed
BalancedON Conservative
Model
ON ModeratelyConservative
Model
Gross unrealized:Appreciation. . . . . . . . . . . . . . . . . . . . . . . $ 27,014,647 $ 46,129,030 $15,950,160 $ 69,987,498 $ 875,196 $ 10,326,142Depreciation. . . . . . . . . . . . . . . . . . . . . . . (7,872,945) (17,986,126) (912,936) (8,134,553) (27,393) (7,933,157)
Net unrealized appreciation (depreciation) . . $ 19,141,702 $ 28,142,904 $15,037,224 $ 61,852,945 $ 847,803 $ 2,392,985Aggregate cost of investments: . . . . . . . . . . $187,127,157 $422,719,989 $98,730,163 $346,594,494 $74,289,945 $220,911,335
ON BalancedModel
ON ModerateGrowth Model ON Growth Model
Gross unrealized:Appreciation. . . . . . . . . . . . . . . . . . . . . . . $ 22,116,396 $ 153,055,055 $ 34,293,063Depreciation. . . . . . . . . . . . . . . . . . . . . . . (5,296,060) (144,821,284) (35,889,022)
Net unrealized appreciation (depreciation) . . $ 16,820,336 $ 8,233,771 $ (1,595,959)Aggregate cost of investments: . . . . . . . . . . $1,093,022,524 $1,953,847,007 $435,403,379
The tax character of distributions paid to shareholders for the year ended December 31, 2019, as well as other reclassifications ofcapital accounts due to permanent tax differences, were as follows (in aggregate):
Distribution Paid to Shareholders Other Reclassifications
PortfolioOrdinaryIncome*
NetLong-Term
Capital GainsReturn ofCapital
TotalDistribution
Paid-inCapital
TotalDistributable
Earnings
ON Bond . . . . . . . . . . . . . . . . . . . . . . . . . . . $6,277,707 $ — $ — $ 6,277,707 $ — $ —ON BlackRock Balanced Allocation . . . . . . . . 6,815,224 18,685,100 — 25,500,324 18,456 (18,456)ON International Equity . . . . . . . . . . . . . . . . . 7,735,538 — — 7,735,538 — —ON Foreign. . . . . . . . . . . . . . . . . . . . . . . . . . 765,355 — — 765,355 — —ON Janus Henderson Forty . . . . . . . . . . . . . . 2,367,096 12,752,778 — 15,119,874 — —ON Janus Henderson Venture . . . . . . . . . . . . — 24,504,430 — 24,504,430 (901,568) 901,568
Ohio National Fund, Inc.
Notes to Financial Statements (Continued) December 31, 2019
169 (continued)

Distribution Paid to Shareholders Other Reclassifications
PortfolioOrdinaryIncome*
NetLong-Term
Capital GainsReturn ofCapital
TotalDistribution
Paid-inCapital
TotalDistributable
Earnings
ON Janus Henderson Enterprise . . . . . . . . . . 1,701,176 3,539,176 — 5,240,352 (56,498) 56,498ON S&P 500® Index . . . . . . . . . . . . . . . . . . . 14,733,534 97,334,869 — 112,068,403 (188,480) 188,480ON BlackRock Advantage Large Cap Value . . . 10,971,267 1,527,359 — 12,498,626 (200,003) 200,003ON Federated High Income Bond . . . . . . . . . . 8,186,705 — — 8,186,705 — —ON Nasdaq-100® Index . . . . . . . . . . . . . . . . . 2,467,600 45,052,041 — 47,519,641 — —ON BlackRock Advantage Large Cap Core. . . . 2,159,153 — — 2,159,153 70,206 (70,206)ON BlackRock Advantage Small Cap Growth . . 106,912 1,476,594 — 1,583,506 (6,819) 6,819ON S&P MidCap 400® Index . . . . . . . . . . . . . 3,723,816 — — 3,723,816 36,480 (36,480)ON BlackRock Advantage Large Cap Growth . 2,758,764 1,161,569 — 3,920,333 40,457 (40,457)ON Risk Managed Balanced . . . . . . . . . . . . . 12,461,989 20,640,034 — 33,102,023 80,056 (80,056)ON Conservative Model. . . . . . . . . . . . . . . . . 1,577,295 682,969 — 2,260,264 (51,206) 51,206ON Moderately Conservative Model . . . . . . . . 5,584,882 1,520,105 372,215 7,477,202 (88,549) 88,549ON Balanced Model . . . . . . . . . . . . . . . . . . . 22,640,298 — 17,493,344 40,133,642 (536,385) 536,385ON Moderate Growth Model . . . . . . . . . . . . . 30,710,276 17,318,243 57,954,547 105,983,066 (222,867) 222,867ON Growth Model. . . . . . . . . . . . . . . . . . . . . 4,842,419 7,371,114 6,226,565 18,440,098 (51,191) 51,191
* Net ordinary income consists of net taxable income derived from dividends, interest, and net short-term capital gains, if any.
There were no cash distributions paid to shareholders for the year ended December 31, 2018, as the tax liability of the Portfolios wasintended to be passed on to shareholders through consent dividends.
The tax character of consent dividend distributions recognized, as well as other reclassifications of capital accounts due topermanent tax differences for the year ended December 31, 2018, were as follows (in aggregate):
Consent Dividend Distribution Reclassifcations Other Reclassifications
PortfolioOrdinaryIncome*
NetLong-Term
Capital GainsTotal
DistributionPaid-inCapital
TotalDistributable
Earnings
ON Bond . . . . . . . . . . . . . . . . . . . . . . . . . . . . . . . . . . . . . . . . . . . . $ 9,665,092 $ — $ 9,665,092 $ — $ —ON BlackRock Balanced Allocation . . . . . . . . . . . . . . . . . . . . . . . 1,289,971 4,474,333 5,764,304 — —ON International Equity . . . . . . . . . . . . . . . . . . . . . . . . . . . . . . . . . 9,257,690 — 9,257,690 2 (2)ON Foreign . . . . . . . . . . . . . . . . . . . . . . . . . . . . . . . . . . . . . . . . . . 1,488,810 279,878 1,768,688 (5) 5ON Janus Henderson Forty . . . . . . . . . . . . . . . . . . . . . . . . . . . . . . — 8,957,000 8,957,000 (181,772) 181,772ON Janus Henderson Venture . . . . . . . . . . . . . . . . . . . . . . . . . . . 2,608,972 33,102,527 35,711,499 67,081 (67,081)ON Janus Henderson Enterprise . . . . . . . . . . . . . . . . . . . . . . . . . 4,192,386 15,801,567 19,993,953 (114) 114ON S&P 500® Index. . . . . . . . . . . . . . . . . . . . . . . . . . . . . . . . . . . . 19,284,882 125,907,062 145,191,944 (86,284) 86,284ON BlackRock Advantage Large Cap Value . . . . . . . . . . . . . . . . . 18,768,679 13,760,575 32,529,254 19,769 (19,769)ON Federated High Income Bond . . . . . . . . . . . . . . . . . . . . . . . . . 15,228,668 — 15,228,668 — —ON Nasdaq-100® Index. . . . . . . . . . . . . . . . . . . . . . . . . . . . . . . . . 2,359,160 47,353,899 49,713,059 (71,657) 71,657ON BlackRock Advantage Large Cap Core . . . . . . . . . . . . . . . . . . 4,910,356 18,969,467 23,879,823 1 (1)ON BlackRock Advantage Small Cap Growth . . . . . . . . . . . . . . . . 8,402,902 502,874 8,905,776 (2,823) 2,823ON S&P MidCap 400® Index . . . . . . . . . . . . . . . . . . . . . . . . . . . . . 2,531,429 4,001,743 6,533,172 2,133 (2,133)ON BlackRock Advantage Large Cap Growth. . . . . . . . . . . . . . . . 3,352,103 13,634,538 16,986,641 — —ON Risk Managed Balanced. . . . . . . . . . . . . . . . . . . . . . . . . . . . . 4,454,280 7,507,812 11,962,092 (39,737) 39,737ON Conservative Model . . . . . . . . . . . . . . . . . . . . . . . . . . . . . . . . 2,803,756 1,674,556 4,478,312 (257) 257ON Moderately Conservative Model. . . . . . . . . . . . . . . . . . . . . . . 8,282,931 9,026,959 17,309,890 (27,633) 27,633ON Balanced Model . . . . . . . . . . . . . . . . . . . . . . . . . . . . . . . . . . . 37,204,396 74,393,236 111,597,632 (176,215) 176,215ON Moderate Growth Model . . . . . . . . . . . . . . . . . . . . . . . . . . . . 59,085,158 159,064,320 218,149,478 (478,754) 478,754ON Growth Model . . . . . . . . . . . . . . . . . . . . . . . . . . . . . . . . . . . . . 11,928,158 42,641,392 54,569,550 (117,654) 117,654
* Net ordinary income consists of net taxable income derived from dividends, interest, and net short-term capital gains, if any.
Ohio National Fund, Inc.
Notes to Financial Statements (Continued) December 31, 2019
170 (continued)
$$ $ $ $ $

(9) Legal Matters
In December 2007, the ON S&P 500® Index Portfolio and the ON BlackRock Advantage Large Cap Value Portfolio (formerly ONFederated Strategic Value Dividend Portfolio), shareholders of the Tribune Company, participated in a cash out merger in whichshareholders received $34 per share of consideration. The value of the proceeds received by the ON S&P 500® Index Portfolio andON BlackRock Advantage Large Cap Value Portfolio (formerly ON Federated Strategic Value Dividend Portfolio) was $37,910 and$384,200, respectively. The company subsequently filed for bankruptcy and several legal complaints have been initiated by groups ofTribune Company creditors seeking to recover, or clawback, proceeds received by shareholders based on fraudulent transferclaims.
The first action, Official Committee of Unsecured Creditors of Tribune Company v. FitzSimons, et. al. (“FitzSimons”) (the “CreditorAction”) was initiated on November 1, 2010 in the U.S. Bankruptcy Court for the District of Delaware. As a result of theseproceedings, the Court agreed to allow individual creditors to file similar complaints in U.S. district courts. The Fund is specificallynamed in a complaint in the U.S. District Court, Southern District of Ohio, Western Division, Deutsche Bank Trust Company Americas,et. al. v. American Electric Power, et. al., that was initiated in June of 2011. The Fund, along with the ON BlackRock Advantage LargeCap Value Portfolio, is also named in a similar complaint in the U.S. District Court, Eastern District of Pennsylvania, Deutsche BankTrust Company Americas, et. al. v. Ametek Inc. Employees Master Retirement Trust, et. al. (the “Trustee Action.”) These Tribunelitigation actions have been consolidated into a single Multidistrict Litigation (�MDL�) in the U.S. District Court, Southern District ofNew York (the “District Court”).
Thereafter, certain defendants in the MDL, including the Fund, filed various motions to dismiss. The District Court dismissed theCreditor Action on September 23, 2013, holding that the plaintiffs could not pursue their claims so long as the Trustee pursuedessentially the same claims in his action. On December 20, 2013, the plaintiffs appealed the dismissal to the Second Circuit Court ofAppeals. On March 29, 2016, the Court of Appeals affirmed the dismissal and rejected the plaintiffs’ appeal. On September 9, 2016,plaintiffs filed a petition for writ of certiorari in the Supreme Court and the defendants opposed it. The Supreme Court has not yetdecided whether to grant certiorari. On April 3, 2018, the Supreme Court issued a “Statement” from two justices announcing thatconsideration of the petition for certiorari would be deferred for an undetermined period of time to “allow” the Court of Appeals orthe District Court to consider, among other things, whether the Court of Appeals’ decision should be vacated as a result of theSupreme Court’s recent decision in Merit Management Group, LP v. FTI Consulting, Inc. On May 15, 2018, the Second Circuit recalledthe mandate on its earlier decision for further panel review. In December 2019, the Second Circuit reinstated its prior affirmance ofdismissal, which safe-harbors all of the claims except the trustee’s actual intent claims (those claims are excepted from the safeharbor altogether). Those claims were earlier dismissed on traditional grounds, and that dismissal is now on appeal. In January2020, the Tribune creditors sought panel rehearing and rehearing en banc, which is a likely precursor to a petition to the SupremeCourt. The Tribune creditors have asserted, among other arguments, that the Second Circuit improperly relied on extrinsic evidenceto reach its decision regarding Computershare’s status as Tribune’s agent, that the question of Computershare’s agency was a newargument on appeal that should not have been considered, and that the Court’s findings regarding preemption go against theSupreme Court’s decision in Merit Management and other cases.
In the Trustee Action, in 2014, various shareholder defendants filed a motion to dismiss the intentional fraudulent transfer claims. OnJanuary 9, 2017, the District Court granted the motion to dismiss the Trustee’s actual fraudulent conveyance claim. The plaintiff willalmost certainly appeal to the Second Circuit Court of Appeals. Because of a procedural issue, however, the plaintiff could notautomatically appeal the decision, but must first obtain permission from the District Court. On January 14, 2019, the District Courtheld a status conference during which it indicated that the plaintiff would be allowed to file a motion seeking reconsideration of theprior dismissal of the intentional fraudulent transfer claims.
On April 23, 2019, the District Court denied the Trustee’s motion to amend and add federal constructive fraudulent transfer claims.The judge accepted the defendants’ “alternative safe harbor” argument. In June 2019, the Trustee appealed the dismissal of theintentional fraudulent transfer claims and ruling that any constructive claims would be barred by the safe harbor. The Trustee’s initialbrief was filed January 8, 2020 and the brief in opposition is due April 7, 2020.
The outcome of these proceedings cannot be predicted. Management of the Fund continues to assess litigation matters and anyoffers of settlement.
Ohio National Fund, Inc.
Notes to Financial Statements (Continued) December 31, 2019
171

To the Shareholders and Board of DirectorsOhio National Fund, Inc.:
Opinion on the Financial Statements
We have audited the accompanying statements of assets and liabilities of ON Bond Portfolio, ON BlackRock Balanced AllocationPortfolio (formerly ON Omni Portfolio), ON International Equity Portfolio, ON Foreign Portfolio, ON Janus Henderson Forty Portfolio,ON Janus Henderson Venture Portfolio, ON Janus Henderson Enterprise Portfolio, ON S&P 500® Index Portfolio, ON BlackRockAdvantage Large Cap Value Portfolio (formerly ON Federated Strategic Value Dividend Portfolio), ON Federated High Income BondPortfolio, ON Nasdaq-100® Index Portfolio, ON BlackRock Advantage Large Cap Core Portfolio (formerly ON Bristol Portfolio), ONBlackRock Advantage Small Cap Growth Portfolio (formerly ON Bryton Growth Portfolio), ON S&P MidCap 400® Index Portfolio, ONBlackRock Advantage Large Cap Growth Portfolio (formerly ON Bristol Growth Portfolio), ON Risk Managed Balanced Portfolio, ONConservative Model Portfolio, ON Moderately Conservative Model Portfolio, ON Balanced Model Portfolio, ON Moderate GrowthModel Portfolio and ON Growth Model Portfolio (each a “Portfolio” and collectively, the “Portfolios” of the Ohio National Fund, Inc.),including the schedules of investments, as of December 31, 2019, the related statements of operations for the year then ended, thestatements of changes in net assets for each of the years in the two year period then ended, and the related notes (collectively, the“financial statements”) and the financial highlights for each of the years or periods in the five year period then ended. In our opinion,the financial statements and financial highlights present fairly, in all material respects, the financial position of the Portfolios as ofDecember 31, 2019, the results of their operations for the year then ended, the changes in their net assets for each of the years in thetwo year period then ended, and the financial highlights for each of the years or periods in the five year period then ended, inconformity with U.S. generally accepted accounting principles.
Emphasis of a Matter
As discussed in Note 2, Subsequent Events, the ON International Equity Portfolio and the ON Foreign Portfolio were approved tomerge effective on or about May 1, 2020.
Basis for Opinion
These financial statements and financial highlights are the responsibility of the Portfolios’ management. Our responsibility is toexpress an opinion on these financial statements and financial highlights based on our audits. We are a public accounting firmregistered with the Public Company Accounting Oversight Board (United States) (PCAOB) and are required to be independent withrespect to the Portfolios in accordance with the U.S. federal securities laws and the applicable rules and regulations of theSecurities and Exchange Commission and the PCAOB.
We conducted our audits in accordance with the standards of the PCAOB. Those standards require that we plan and perform theaudit to obtain reasonable assurance about whether the financial statements and financial highlights are free of materialmisstatement, whether due to error or fraud. Our audits included performing procedures to assess the risks of material misstatementof the financial statements and financial highlights, whether due to error or fraud, and performing procedures that respond to thoserisks. Such procedures included examining, on a test basis, evidence regarding the amounts and disclosures in the financialstatements and financial highlights. Such procedures also included confirmation of securities owned as of December 31, 2019, bycorrespondence with custodians, brokers, and transfer agents, or by other appropriate audit procedures. Our audits also includedevaluating the accounting principles used and significant estimates made by management, as well as evaluating the overallpresentation of the financial statements and financial highlights. We believe that our audits provide a reasonable basis for ouropinion.
/s/ KPMG LLP
We have served as the auditor of one or more of the Ohio National Fund, Inc. investment companies since 1969.
Columbus, OhioFebruary 27, 2020
Ohio National Fund, Inc.
Report of Independent Registered Public Accounting Firm
172

(1) Review and Approval of Advisory and Sub-Advisory Agreements for Existing Portfolios
At a meeting held on November 14, 2019 the Board of Directors (the “Board” or “Directors”), including a majority of the Directorswho are not “interested persons” (the “Independent Directors”) of Ohio National Fund, Inc. (the “Fund”), approved the continuationof the Investment Advisory Agreement (the “Advisory Agreement”) with Ohio National Investments, Inc. (“ONI” or “Adviser”) and,as applicable, the sub-advisory agreement with the sub-adviser (each a “Sub-Adviser,” and together the “Sub-Advisers”) for eachof the Portfolios identified below. The Independent Directors were separately represented by independent legal counsel inconnection with their consideration of the approval of the continuation of these agreements.
The Directors noted that the Adviser is responsible for monitoring the investment performance and other responsibilities of thevarious Sub-Advisers that have day-to-day responsibility for the decisions made for certain of the Fund’s investment portfolios(each, a “Portfolio”). The Directors further noted that, for those Portfolios subject to the Securities and Exchange Commission order(the “Order”) permitting them to operate as “funds of funds” and to invest in other investment companies in excess of the limits ofSection 12(d)(1), the Adviser bears significant responsibility and administrative burden in the monitoring and reporting required bythe Order’s conditions. They also noted that the Adviser reports to the Board on its analysis of each Sub-Adviser’s performance atthe regular meetings of the Board, which are held at least quarterly. When warranted, the Adviser will add or remove a particularPortfolio from a watchlist that it maintains. Watchlist criteria include, for example: (a) Portfolio performance over various timeperiods; (b) Portfolio risk issues, such as changes in key personnel involved with Portfolio management or changes in investmentphilosophy or process; and (c) organizational risk issues, such as regulatory, compliance or legal concerns, or changes in theownership of the Sub-Adviser. Finally, the Board noted that the Adviser provides the facilities and equipment utilized by thePortfolios; supplies business management services to the Fund, including monitoring expenses accruals and preparing thePortfolios’ financial statements; prepares and files Fund registration statements, proxies, shareholder reports and other regulatoryfilings; provides financial oversight; and ensures that proxies related to each Portfolio’s holdings are voted in compliance withpolicies approved by the Board.
In considering the Advisory Agreement and sub-advisory agreements, the Board requested, received and reviewed a significantamount of information relating to each Portfolio, the Adviser and the Sub-Advisers, including the following: (1) performance data foreach Portfolio for various time periods, including year-to-date, through September 30, 2019, (2) comparative performance, advisoryfee and expense ratio information for a peer group of funds in the respective Portfolio’s Morningstar category (a “Morningstar PeerGroup” or “peer group”), as well as management fee peer comparison charts showing where each Portfolio’s advisory fee waslocated in the dispersion of its peer group’s advisory fees; (3) comparable performance information for each Portfolio’s relevantbenchmark index or indices; (4) comparative data regarding advisory fees, including data regarding the fees charged by the Adviserand Sub-Advisers for managing other institutional funds and institutional accounts using investment strategies and techniquessimilar to those used in managing the Portfolios, as applicable; (5) comparative data regarding the expense ratio of each Portfolio, ascompared to its Morningstar Peer Group; (6) profitability analyses for the Adviser with respect to each Portfolio; and (7) otherinformation regarding the nature, extent and quality of services provided by the Adviser and the Sub-Advisers, as applicable. TheDirectors also took into account information regarding the services provided by the Adviser and each Sub-Adviser, andperformance, fee and expense ratio information regarding each Portfolio provided to them periodically throughout the year. Theyalso met with representatives of the Adviser to review the relative performance of each Portfolio, as compared with its benchmarkindex(es) and peer group.
The Directors, including all of the Independent Directors, were assisted by experienced independent legal counsel throughout theAdvisory Agreement and sub-advisory agreement review process. The Independent Directors discussed the proposedcontinuations in private session with such counsel at which no representatives of management, the Adviser or any Sub-Adviserwere present. Each Director, including each of the Independent Directors, relied upon the advice of independent legal counsel andhis or her own business judgment in determining the material factors to be considered in evaluating the Advisory Agreement andeach sub-advisory agreement and the weight to be given to each such factor. The conclusions reached by the Directors were basedon a comprehensive evaluation of all of the information provided and were not the result of any one factor. Moreover, each Directormay have afforded different weight to the various factors in reaching his or her conclusions with respect to the Advisory Agreementand each sub-advisory agreement.
Nature, Extent and Quality of Services
The Board evaluated the nature, extent and quality of the advisory services provided to the Portfolios by the Adviser. As part of itsreview, the Board reviewed information regarding the Adviser’s operations, procedures and personnel. The Directors took intoaccount information they received during the previous year at Board meetings and other discussions and through periodic reportsregarding the Adviser’s performance of its duties. The Directors considered the capabilities and resources that the Adviser hasdedicated to performing services on behalf of the Fund and its Portfolios, as well as the quality of administrative and other services
Ohio National Fund, Inc.
Additional Information December 31, 2019 (Unaudited)
173 (continued)

provided by the Adviser, which include monitoring each Sub-Adviser’s performance, monitoring the quality of each Sub-Adviser’scompliance program and providing other support to contract owners. The Directors also considered the quality of the Adviser’scompliance programs and the Adviser’s responsiveness to Board inquiries and requests.
For each Portfolio with a fund-of-funds structure, the Directors considered that the Adviser performs significant services to thePortfolio that are in addition to, rather than duplicative of, services provided under the advisory contracts of the underlying funds.The Directors noted the Adviser’s representations that it performs regular reviews of each Portfolio and its underlying funds,focusing on the asset class make-up of the Portfolio, the percentages invested in each underlying fund, and each underlying fund’sperformance against its benchmark, in order to confirm that the Portfolio is diversified, has the appropriate asset mix, and isperforming well. The Directors also noted that the Adviser periodically changes the mix of the underlying funds as a result of itsreviews.
For each Portfolio subject to a sub-advisory agreement, the Board considered similar criteria as applied to each Sub-Adviser,including the nature, extent and quality of the sub-advisory services provided by each Sub-Adviser. In addition to the criteria used toreview the Adviser, the Directors reviewed information on each Sub-Adviser’s portfolio management and brokerage practices,including any soft dollar benefits received. The Directors also reviewed the performance record of each Portfolio managed by theapplicable Sub-Adviser. With the exception of the services of the Sub-Advisers to the ON Federated Strategic Value DividendPortfolio, ON International Portfolio and ON Foreign Portfolio, which the Directors have determined to replace, it was the Board’sconclusion that overall, they were satisfied with the nature, extent and quality of services provided to the Fund and each of thePortfolios.
Investment Performance
Representatives of the Adviser reviewed with the Directors each Portfolio’s performance for the year-to-date, 1-, 3- and 5-yearperiods ended September 30, 2019, as compared to the Portfolio’s Morningstar Peer Group and benchmark(s). The Board alsoconsidered the Adviser’s effectiveness in monitoring the performance of each Sub-Adviser and the Adviser’s timeliness inresponding to performance issues. The Directors discussed with the Adviser representatives certain Portfolios thatunderperformed their respective benchmarks. A Portfolio-by-Portfolio discussion of each Portfolio’s performance and the Board’sconclusions regarding that performance is set forth below.
Fees and Expenses
The Board considered the advisory fee for each Portfolio, as well as the difference of each Portfolio’s fee from the average advisoryfee for the Portfolio’s Morningstar Peer Group and the fee’s percentile ranking within the peer group. The Board also consideredcharts showing, for each Portfolio, how the Portfolio’s advisory fees compared to the advisory fees of the funds in its peer group. Thecharts showed the number of funds in the peer group within each defined range of advisory fees, and the range that included thePortfolio. The Board also reviewed the difference between each Portfolio’s overall expense ratio and that of its Morningstar PeerGroup, as well as the expense ratio’s percentile ranking within the peer group. For these purposes, the Morningstar Peer Groupsexcluded funds with net assets over $1 billion, all funds identified as funds of funds, and for all Portfolios other than the ON S&P 500Index Portfolio, ON S&P MidCap 400 Index Portfolio and the and the ON Nasdaq-100 Index Portfolio, all index funds. Non-index fundswere excluded from the Morningstar Peer Group for the ON S&P 500 Index Portfolio, ON S&P MidCap 400 Index Portfolio, and the ONNasdaq-100 Index Portfolio.
When applicable, the Board considered the amount of net advisory fee retained by the Adviser, after payment of the sub-advisoryfee, as well as the proportion the net fee represented of the total advisory fee, in light of the services provided by the Adviser to thePortfolio.
When applicable, the Board also considered the fees paid to Sub-Advisers. The Board relied to a degree on the Adviser’snegotiation of each sub-advisory agreement on an arm’s-length basis and noted that, when the Adviser has negotiated decreases inthe sub-advisory fee for certain Portfolios, it has usually passed some, if not all, of the decrease on to shareholders by reducing itsadvisory fee. The Board considered the fees the Adviser and Sub-Advisers charge their separately managed institutional accountsand other accounts and expressed no concerns with those rates relative to the fees charged to the Portfolios. The Directors alsorecognized that it was difficult to make comparisons of advisory fees because there were variations in the services that wereincluded in the fees paid by other funds and separately managed accounts.
Profitability
The Directors reviewed the advisory fee paid to the Adviser for each Portfolio and noted the pre-tax profit margins reported by theAdviser for each Portfolio. The Directors noted that the profit margins for the Portfolios ranged from 24.74% to 87.71% with averageprofitability of 60.16%. The Directors also noted that the Adviser, and not the Portfolios, is responsible for paying sub-advisory fees to
Ohio National Fund, Inc.
Additional Information (Continued) December 31, 2019 (Unaudited)
174 (continued)
the Sub-Advisers. The Board also evaluated whether the net advisory fee received by the Adviser for each Portfolio, after payingsub-advisory fees to the Sub-Adviser, was reasonable, given the level of the Adviser’s services to the Portfolio. The Directors tookinto account the fact that the Adviser had contractually agreed to limit Portfolio expenses and reimburse expenses to the extentnecessary to keep total Portfolio expenses at or below a specified amount. The Directors further considered the statement of arepresentative of the Adviser that the profitability calculations may not account for all of the Adviser’s costs in providing services tothe Fund, including services outside the investment advisory function (such as Fund operations and legal functions), and thatprofitability would be less for each Portfolio if these costs were included. The Directors discussed that, if an adviser is extremelyefficient, resulting in enhanced profitability, the adviser’s effective use of resources should not be penalized on a comparative basis.The Directors then considered potential benefits that the Adviser may receive in connection with the Fund, noting in particular thatits insurance company parent earns revenue on the variable products through which the Fund is available as an investment vehicle.Additionally, the Directors acknowledged that calculating the Adviser’s profitability related to a specific Portfolio can be challengingand imprecise because of the difficulties in suitably allocating the Adviser’s expenses across the Portfolios given the Adviser’sshared efforts with respect to the Portfolios.
In considering the reasonableness of the sub-advisory fees paid by the Adviser to each Sub-Adviser, the Directors relied on theability of the Adviser to negotiate the sub-advisory fee at arm’s length, noting that the Adviser is not affiliated with any Sub-Adviser.The Directors also noted that the sub-advisory fees were paid by the Adviser and not by a Portfolio and, therefore, the Adviser wasincentivized to negotiate a favorable fee. They further considered the breakpoints established in the sub-advisory agreements andconsidered the impact of these breakpoints on the Sub-Adviser’s profitability. The Board discussed economies of scale and agreedit was a matter more appropriately considered at the Advisory Agreement level. The Board concluded that the profitability, fees andpotential realization of economies of scale by the Portfolios from the sub-advisory arrangements with the unaffiliated Sub-Advisersshould not be a material factor in its deliberations.
After considering all of the above, the Board concluded that the profitability of the Adviser with respect to each Portfolio wasreasonable.
Economies of Scale
The Directors noted that all of the advisory and sub-advisory fee schedules contain breakpoints that would reduce the applicableadvisory or sub-advisory fees on assets above a specified level as the applicable Portfolio’s assets increase. The Directors alsonoted that a Portfolio would realize additional economies of scale if the Portfolio’s net assets increase over time proportionatelymore than certain other expenses. The Directors took into account that many of the Portfolios had a small amount of net assetsrelative to the funds in their respective peer groups. After considering each Portfolio’s current size and potential for growth, theBoard concluded that each Portfolio was likely to benefit from economies of scale as the Portfolio’s net assets increased, and thatthe existing breakpoints are appropriate.
Portfolio-by-Portfolio Analysis
In addition to the foregoing, the Directors considered the specific factors and related conclusions set forth below with respect toeach Portfolio’s performance and fees and expenses. Except as otherwise indicated, the performance data described below foreach Portfolio is for periods ended September 30, 2019.
ON Bond Portfolio (Adviser – ONI). The Directors noted that the Portfolio outperformed its peer group median across all time periodsand provided returns in line with its benchmark index for all time periods (underperforming in all except the year-to-date period). TheDirectors noted that the Portfolio’s advisory fee was slightly above with the peer group average, while its net expense ratio wasbelow the peer group average. Overall, the Board concluded that the Portfolio’s performance was acceptable, and the advisory feewas reasonable.
ON BlackRock Balanced Allocation Portfolio, formerly the ON Omni Portfolio (Adviser – ONI, Sub-Adviser – BlackRock). TheDirectors noted that they were considering renewal only of the Advisory Agreement, because the sub-advisory agreement withBlackRock was approved at a meeting of the Board of Directors held on January 25, 2019 and was not required to be renewed at thismeeting. The Directors focused on year-to-date performance for the Portfolio, as the performance prior to February 2019 wasattributable to the prior Sub-Advisor. They observed that the Portfolio outperformed its benchmark index and ranked in the 1stpercentile of its peer group year-to-date. The Directors noted that the Portfolio’s advisory fee was below its peer group’s average,and that the Adviser had indicated that the Portfolio’s net expense ratio (after the fee reduction effective in February 2019) wasbelow the peer group average. Overall, the Directors concluded that the Portfolio’s performance was improving with the change inthe Sub-Adviser and that the advisory fee was reasonable.
Ohio National Fund, Inc.
Additional Information (Continued) December 31, 2019 (Unaudited)
175 (continued)
ON International Equity Portfolio (Adviser – ONI, Sub-Adviser – Lazard). The Directors reviewed the comparison performanceinformation for the Portfolio as sub-advised by Lazard, but noted that, at the recommendation of the Adviser, they had determined toreplace the Sub-Adviser for the Portfolio, effective December 6, 2019 (end of business day), due to the poor performance of thePortfolio. They therefore determined that, in their consideration of the renewal of the Advisory Agreement, they should focus on thefactors other than performance, as they believed that the Adviser had demonstrated the appropriate oversight of the Sub-Adviser indetermining to recommend the substitution of BlackRock as the new Sub-Adviser. The Board noted that the Portfolio’s advisory feewas at the peer group average, although the Portfolio’s expense ratio was above the peer group average. Overall, the Boardconcluded that the advisory fee was reasonable and that it was appropriate to continue the Lazard sub-advisory agreement for theperiod until BlackRock assumes the sub-adviser role.
ON Foreign Portfolio (Adviser – ONI, Sub-Adviser – Templeton). The Directors reviewed the comparison performance information forthe Portfolio as sub-advised by Templeton, but noted that, at the recommendation of the Adviser, they had determined to replace theSub-Adviser for the Portfolio, effective December 6, 2019 (end of business day), due to the poor performance of the Portfolio. Theytherefore determined that, in their consideration of the renewal of the Advisory Agreement, they should focus on the factors otherthan performance, as they believed that the Adviser had demonstrated the appropriate oversight of the Sub-Adviser in determiningto recommend the substitution of BlackRock as the new Sub-Adviser. The Board noted that the Portfolio’s advisory fee and expenseratio were above the peer group average, although they noted that pro forma expenses for the Portfolio, with the proposed reducedadvisory fee, are expected to be only slightly above the peer group average. Overall, the Board concluded that the advisory fee wasreasonable and that it was appropriate to continue the Templeton sub-advisory agreement for the period until BlackRock assumesthe sub-adviser role.
ON Janus Henderson Forty Portfolio (Adviser – ONI, Sub-Adviser – Janus). The Directors reviewed the Portfolio’s performance andnoted that it outperformed its benchmark index and peer group median across all periods with a top-quartile ranking for each period.A representative of the Adviser commented that stock selection within the technology sector was the main driver of the Portfolio’soutperformance. The Directors noted that the Portfolio’s advisory fee and net expense ratio were slightly above the peer groupaverage. Overall, the Board concluded that the Portfolio’s performance was acceptable and the advisory and sub-advisory feeswere reasonable.
ON Janus Henderson Venture Portfolio (Adviser – ONI, Sub-Adviser – Janus). The Directors noted that the Portfolio outperformed itsbenchmark index for all periods shown and outperformed its peer group median for all but the 3-year period. The Directors notedthat the Portfolio’s advisory fee was generally in line with the peer group’s average and its net expense ratio was below the peergroup average. Overall, the Directors concluded that the Portfolio’s performance was acceptable and that the advisory andsub-advisory fees were reasonable.
ON Janus Henderson Enterprise Portfolio (Adviser – ONI, Sub-Adviser – Janus). The Directors noted that the Portfolio outperformedits benchmark index and peer group median for all periods shown other than the 5-year period. The Directors also recalled that theSub-Adviser assumed management of the Portfolio in May 2018. and the Portfolio’s performance was now in the 6th percentile for itspeer group for the 1-year period and the 18th percentile year-to-date. The Directors observed that although the Portfolio’s advisoryfee was above its peer group average, its net expense ratio was below its peer group average. Overall, the Directors concluded thatthe Portfolio’s performance was acceptable and that the advisory and sub-advisory fees were reasonable.
ON S&P 500® Index Portfolio (Adviser – ONI, Sub-Adviser – Geode). The Directors observed that while the Portfolio underperformedits benchmark index for the year-to-date, 1-, 3- and 5-year periods, its performance generally was in line with the index whenexpenses were excluded. The Directors deemed peer group performance data for index funds to be generally irrelevant and did notrely on peer group comparison performance figures for the Portfolio. The Directors noted that, while the advisory fee was above thePortfolio’s peer group average, the overall expense ratio was the statistic most important to index fund shareholders, and thePortfolio’s net expense ratio was lower than the average for the peer group. Overall, the Directors concluded that the Portfolio’sperformance was acceptable and that the advisory and sub-advisory fees were reasonable.
ON BlackRock Advantage Large Cap Value Portfolio, formerly the ON Federated Strategic Value Dividend Portfolio (Adviser – ONI,Sub-Adviser – Federated). The Directors reviewed the comparison performance information for the Portfolio as sub-advised byFederated, but noted that, at the recommendation of the Adviser, they had determined to replace the Sub-Adviser for the Portfolio,effective December 6, 2019 (end of business day), due to the poor performance of the Portfolio. They therefore determined that, intheir consideration of the renewal of the Advisory Agreement, they should focus on the factors other than performance, as theybelieved that the Adviser had demonstrated the appropriate oversight of the Sub-Adviser in determining to recommend thesubstitution of BlackRock as the new Sub-Adviser. The Board noted that the Portfolio’s advisory fee was above the peer groupaverage, although the Portfolio’s expense ratio was below the peer group average. Overall the Board concluded that the advisoryfee was reasonable and that it was appropriate to continue the Federated sub-advisory agreement for the period until BlackRockassumes the sub-adviser role.
Ohio National Fund, Inc.
Additional Information (Continued) December 31, 2019 (Unaudited)
176 (continued)

ON Federated High Income Bond Portfolio (Adviser – ONI, Sub-Adviser – Federated Investment). The Directors observed that thePortfolio underperformed its benchmark index for the 1-, 3- and 5- year periods, outperformed its peer group median over all timeperiods and ranked in the top quartile among its peer group for the year-to-date and 5-year periods. The Directors noted that theadvisory fee was above the peer group average, while the net expense ratio was below the peer group average. Overall, the Boardconcluded that the Portfolio’s performance was acceptable, and the advisory and sub-advisory fees were reasonable.
ON Nasdaq-100® Index Portfolio (Adviser – ONI, Sub-Adviser – Geode). The Directors observed that while the Portfoliounderperformed its benchmark index across all time periods shown, its performance generally was in line with the index whenexpenses were excluded. The Directors deemed peer group performance data for index funds to be generally irrelevant and did notrely on peer group comparison performance figures for the Portfolio. The Directors noted that the Portfolio’s advisory fee and netexpense ratio were below the peer group average. Overall, the Directors concluded that the Portfolio’s performance wasacceptable and that the advisory and sub-advisory fees were reasonable.
ON BlackRock Advantage Large Cap Core Portfolio, formerly the ON Bristol Portfolio (Adviser – ONI, Sub-Adviser – BlackRock). TheDirectors noted that they were considering renewal only of the Advisory Agreement, because the sub-advisory agreement withBlackRock was approved at a meeting of the Board of Directors held on January 25, 2019 and was not required to be renewed at thismeeting. The Directors focused on year-to-date performance for the Portfolio, as the performance prior to February 2019 wasattributable to the prior Sub-Advisor. They observed that the Portfolio outperformed its benchmark index and ranked in the 6thpercentile of its peer group year-to-date. The Directors considered that, although the Portfolio’s advisory fee was above the peergroup average, the Adviser had indicated at this meeting that the Portfolio’s net expense ratio (after the fee reduction effectiveFebruary 2019) was below the peer group average. Overall, the Directors concluded that the Portfolio’s performance was improvingwith the change in the Sub-Adviser and that the advisory fee was reasonable.
ON BlackRock Advantage Small Cap Growth Portfolio, formerly the ON Bryton Growth Portfolio (Adviser – ONI, Sub-Adviser –BlackRock). The Directors noted that they were considering renewal only of the Advisory Agreement, because the sub-advisoryagreement with BlackRock was approved at a meeting of the Board of Directors held on January 25, 2019 and was not required to berenewed at this meeting. The Directors focused on year-to-date performance for the Portfolio, as the performance prior to February2019 was attributable to the prior Sub-Advisor. They observed that the Portfolio outperformed its benchmark index and ranked in the49th percentile of its peer group year-to-date. The Directors noted that the Portfolio’s advisory fee was at the average of its peergroup and that the Adviser had indicated that the Portfolio’s net expense ratio (after the fee reduction effective February 2019) wasbelow the peer group average. Overall, the Directors concluded that the Portfolio’s performance was improving with the change inthe Sub-Adviser and the advisory fee was reasonable.
ON S&P MidCap 400® Index (Adviser – ONI, Sub-Adviser – Geode). The Portfolio had only been operating as an index fund sinceDecember 16, 2016, and the Directors therefore did not consider performance for the 3- and 5-year periods. The Directors observedthat while the Portfolio underperformed its benchmark index for the year-to-date and 1-year periods, its performance generally wasin line with the benchmark index when expenses were excluded. The Directors deemed peer group performance data for indexfunds to be generally irrelevant and did not rely on peer group comparison performance figures for the Portfolio. The Directors notedthat Portfolio’s advisory fee and net expense ratio were higher than the averages of its peer group, but considered that the Portfolio’snet expense ratio was in the 52nd percentile of its peer group. Overall, the Directors concluded that the Portfolio’s performance wasacceptable and that the advisory and sub-advisory fees were reasonable.
ON BlackRock Advantage Large Cap Growth Portfolio, formerly the ON Bristol Growth Portfolio (Adviser – ONI, Sub-Adviser –BlackRock). The Directors noted that they were considering renewal only of the Advisory Agreement, because the sub-advisoryagreement with BlackRock was approved at a meeting of the Board of Directors held on January 25, 2019 and was not required to berenewed at this meeting. The Directors focused on year-to-date performance for the Portfolio, as the performance prior to February2019 was attributable to the prior Sub-Advisor. They observed that the Portfolio outperformed its benchmark index and ranked in the10th percentile of its peer group year-to-date. The Directors noted that the Portfolio’s advisory fee was at the average for its peergroup and that the Adviser had indicated that the Portfolio’s net expense ratio was below the peer group average. Overall, theDirectors concluded that the Portfolio’s performance was improving with the change in the Sub-Adviser and the advisory fee wasreasonable.
ON Risk Managed Balanced Portfolio (Adviser – ONI, Sub-Advisers – Janus and AnchorPath). The Directors noted that the Portfoliooutperformed its benchmark index for all periods shown. The Directors noted that the Portfolio’s performance was in the top quartileof its peer group for all periods shown and that the Janus-managed sleeve performed according to expectations in a generally risingmarket. The Directors noted that the AnchorPath component of the Portfolio was a risk management overlay without availablecomparison data, but noted the Adviser’s comment that the AnchorPath component had contributed positively to the Fund’sperformance. The Directors noted that the Portfolio’s advisory fee and net expense ratio were higher than its peer group’s average,
Ohio National Fund, Inc.
Additional Information (Continued) December 31, 2019 (Unaudited)
177 (continued)

but considered the Adviser’s comment that other funds in the peer group do not have risk management overlays and the feedifferential is consistent with industry charges for risk management overlay services. Overall, the Directors concluded that thePortfolio’s performance was acceptable and that the advisory and sub-advisory fees were reasonable.
ON Model Portfolios
With respect to each of the fund of funds Portfolios (the “ON Model Portfolios”), the Directors noted that the Adviser madesignificant changes in the mix of underlying funds, particularly among the equity funds, to reduce or remove underperforming fundsand to provide more balance between growth and value. They also noted that each fund of funds Portfolio has shown significantimprovement in performance relative to its peer group over the most recent quarter ended September 30, 2019, which arepresentative of the Adviser attributed to its adjustments. The representative noted the difficulty in assembling a meaningful peergroup of funds of funds for expense comparison purposes because, while the fund of funds Portfolios consist of underlying mutualfunds, the funds of funds in the peer groups are comprised primarily of exchange traded funds, which have much lower net expenseratios. To correct for this difference, the Adviser presented information comparing the average net expense ratio for each peergroup with the expense ratio of each fund of funds Portfolio as reported in that Portfolio’s annual report, which does not show feesand expenses of investing in underlying mutual funds.
ON Conservative Model (Adviser – ONI). The Directors observed that while the Portfolio underperformed its benchmark index for the1-year period, it outperformed the benchmark index for the year-to-date period and the peer group median for both the year-to-dateand 1- year periods. The Directors noted that the Portfolio’s advisory fee and net expense ratio as reported in the annual shareholderreport were lower than the averages of its peer group. Overall, the Directors concluded that the Portfolio’s performance wasacceptable and that the advisory fee was reasonable.
ON Moderately Conservative Model (Adviser – ONI). The Directors noted that while the Portfolio underperformed its benchmarkindex for the 1-year period, it outperformed the benchmark index for the year-to-date period and the peer group median for both theyear-to-date and 1- year periods. The Directors observed that the Portfolio’s advisory fee was slightly above the peer group average,and the net expense ratio as reported in the annual shareholder report was lower than the average of its peer group. Overall, theDirectors concluded that the Portfolio’s performance was acceptable and that the advisory fee was reasonable.
ON Balanced Model (Adviser – ONI). The Directors observed that while the Portfolio underperformed its benchmark index and peergroup median for the 1-year period, it outperformed the benchmark index and peer group average for the year-to-date period. TheDirectors noted that the Portfolio’s advisory fee was above the peer group average and net expense ratio as reported in the annualshareholder report was lower than the average of its peer group. Overall, the Directors concluded that the Portfolio’s performancewas acceptable and that the advisory fee was reasonable.
ON Moderate Growth Model (Adviser – ONI). The Directors observed that while the Portfolio underperformed its benchmark indexfor the 1-year period, it outperformed the benchmark index for the year-to-date period and the peer group median for both theyear-to-date and 1- year periods. The Directors also noted that the Portfolio’s advisory fee was above the peer group average andthe net expense ratio as reported in the annual shareholder report was lower than the average of its peer group. Overall, theDirectors concluded that the Portfolio’s performance was acceptable and that the advisory fee was reasonable.
ON Growth Model (Adviser – ONI). The Directors observed that while the Portfolio underperformed its benchmark index and peergroup median for the 1-year period, it outperformed the benchmark index and peer group median for the year-to-date period. TheDirectors noted that the Portfolio’s advisory fee was higher than the average of its peer group, and that the net expense ratio asreported in the annual shareholder report was lower than the average of its peer group. Overall, the Directors concluded that thePortfolio’s performance was acceptable and that the advisory fee was reasonable.
After consideration of the foregoing, the Board reached the following conclusions regarding the Investment Advisory Agreementand, as applicable, the sub-advisory agreement(s) with respect to each Portfolio, in addition to the conclusions set forth above: (a)ONI and the Sub-Adviser(s) had demonstrated that they possessed the capability and resources to perform the duties required ofthem under the Investment Advisory Agreement and applicable sub-advisory agreement(s), respectively; (b) the investmentphilosophy, strategies and techniques of ONI (with respect to the Portfolios without a Sub-Adviser) and the Sub-Adviser(s) wereappropriate for pursuing the applicable Portfolio’s investment objective; (c) ONI (with respect to the Portfolios without aSub-Adviser) and the Sub-Adviser(s) were likely to execute their investment philosophy, strategies and techniques consistentlyover time; and (d) ONI and the Sub-Adviser(s) maintained appropriate compliance programs. Based on all of the above-mentionedfactors and their related conclusions, with no single factor or conclusion being determinative and with each Director notnecessarily attributing the same weight to each factor, the Directors unanimously concluded that approval of the continuation of theInvestment Advisory Agreement and, as applicable, the sub-advisory agreement was in the best interests of each Portfolio and itsshareholders. Accordingly, the Board, including all of the Independent Directors, voted unanimously to approve the continuation ofthe Investment Advisory Agreement and, as applicable, the sub-advisory agreement(s) for each Portfolio.
Ohio National Fund, Inc.
Additional Information (Continued) December 31, 2019 (Unaudited)
178 (continued)

Also at the November 14, 2019 meeting, the Board, including a majority of the Independent Directors, approved sub-advisoryagreements between the Adviser and BlackRock Investment Management, LLC (“BlackRock” or the “Sub-Adviser”) with respect tothe ON BlackRock Advantage Large Cap Value Portfolio (formerly ON Federated Strategic Value Dividend Portfolio), ONInternational Equity Portfolio and the ON Foreign Portfolio (collectively, the “Sub-Advisory Agreements”) The Directors noted thatthey had determined to replace Federated as sub-adviser to the ON Federated Strategic Value Dividend Portfolio, to be renamed theON BlackRock Advantage Large Cap Value Portfolio (the “Value Portfolio”), replace Lazard as the sub-adviser to the ONInternational Equity Portfolio (the “International Portfolio”) and replace Templeton as sub-adviser to the ON Foreign Portfolio (the“Foreign Portfolio; together with the Value Portfolio and the International Portfolio, the “Portfolios”).
In considering the approval of the Sub-Advisory Agreements, the Board requested and reviewed a significant amount of informationrelating to each Portfolio, including the following: (1) proposed advisory and sub-advisory fee information, including a comparison toexisting fees for the Portfolio; (2) comparative advisory fee and expense ratio information for a peer group of funds, as well asadvisory fee and sub-advisory fee peer comparison charts showing where the Portfolio’s proposed advisory fee and sub-advisoryfee were located in the dispersion of its peer funds’ advisory fees and sub-advisory fees; (3) performance data for a BlackRock fundemploying similar strategies to the new strategy proposed for the Portfolio; and (4) other information regarding the nature, extentand quality of services anticipated to be provided by the Sub-Adviser.
The Directors recalled that at the August 2019 meeting they had met with representatives of BlackRock, who had described theinvestment strategies to be used by BlackRock in providing sub-advisory services to the Portfolios. A representative of the Adviserreviewed the strategy and performance history of the BlackRock Advantage Large Cap Value Fund (the “BlackRock Value Fund”)(indicating that BlackRock employs a strategy for that fund similar to the strategy BlackRock proposes to employ for the ValuePortfolio) and the strategy and performance of the BlackRock SAE International Tilts Composite (the “BlackRock Composite”)(indicating that BlackRock employs a strategy for that composite of accounts similar to the strategy BlackRock proposes to employfor the International Portfolio and the Foreign Portfolio).
The Directors, including all of the Independent Directors, were assisted by experienced independent legal counsel throughout thecontract review process. The Independent Directors discussed the proposed Sub-Advisory Agreements in private session withsuch counsel at which no representatives of management or the Adviser or BlackRock were present. The Directors, including all ofthe Independent Directors, relied upon the advice of independent legal counsel and their own business judgment in determining thematerial factors to be considered in evaluating the Sub-Advisory Agreements and the weight to be given to each such factor. Theconclusions reached by the Directors were based on a comprehensive evaluation of all of the information provided and were not theresult of any one factor. Moreover, each Director may have afforded different weight to the various factors in reaching his or herconclusions with respect to the Sub-Advisory Agreements.
Nature, Extent and Quality of Services
The Board evaluated the nature, extent and quality of the advisory services anticipated to be provided by BlackRock, noting thatthey had experience with BlackRock because it serves as a sub-adviser to four other portfolios of the Fund. As part of its review, theBoard reviewed information regarding the Sub-Adviser’s operations, procedures and personnel. The Directors considered thecapabilities and resources that the Sub-Adviser is expected to dedicate to performing services on behalf of the Portfolios, as well asthe quality of its administrative and other services. The Directors also considered the quality of the compliance program of theSub-Adviser, and reviewed information on the Sub-Adviser’s portfolio management and brokerage practices, including any softdollar benefits received. It was the Directors’ conclusion that overall, they were satisfied with the nature, extent and quality ofservices anticipated to be provided to each Portfolio by the Sub-Adviser.
Investment Performance
The Board considered the performance of the BlackRock Value Fund, which utilizes a strategy similar to the new strategy proposedfor the Value Portfolio, relative to that of the Portfolio’s peer group and benchmark index. The Directors noted that the BlackRockValue Fund underperformed the Value Portfolio’s peer group median and benchmark index for the year-to-date and 1- year periodsended September 30, 2019, but outperformed both the peer group median and benchmark index for the 3- and 5- year periods endedSeptember 30, 2019. A representative of the Adviser indicated that the Adviser is recommending BlackRock because Blackrock is asub-adviser that has a repeatable process with a reasonable likelihood of success. The representative noted that the BlackRockValue Fund 3- and 5-year performance was in the 13th and 26th percentile, respectively of its peer group. The Directors concludedthat BlackRock has the ability to manage the Value Portfolio effectively.
The Board considered the performance of the BlackRock Composite, which utilizes a strategy similar to the new strategy proposedfor the International Portfolio, relative to that of the Portfolio’s peer group and benchmark index. The Directors noted that theBlackRock Composite underperformed the International Portfolio’s benchmark index, but outperformed its peer group median, forthe 1- year period ended September 30, 2019. They also noted that, for the year-to-date, 3- and 5- year periods ended September 30,
Ohio National Fund, Inc.
Additional Information (Continued) December 31, 2019 (Unaudited)
179 (continued)

2019, the BlackRock Composite outperformed both the peer group median and benchmark index. A representative of the Adviserindicated that the Adviser is recommending BlackRock because Blackrock is a sub-adviser that has a repeatable process with areasonable likelihood of success. The representative noted that the BlackRock Composite 3- and 5-year performance was in the 7thpercentile of its peer group for both periods. The Directors concluded that BlackRock has the ability to manage the InternationalPortfolio effectively.
The Board considered the performance of the BlackRock Composite, which utilizes a strategy similar to the new strategy proposedfor the Foreign Portfolio, relative to that of the Portfolio’s peer group and benchmark index. The Directors noted that the BlackRockComposite underperformed the Foreign Portfolio’s benchmark index, but outperformed its peer group median, for the 1- year periodended September 30, 2019. They also noted that, for the year-to-date, 3- and 5- year periods ended September 30, 2019, theBlackRock Composite outperformed both the peer group median and benchmark index. A representative of the Adviser indicatedthat the Adviser is recommending BlackRock because Blackrock is a sub-adviser that has a repeatable process with a reasonablelikelihood of success. The representative noted that the BlackRock Composite 3- and 5-year performance was in the 7th percentileof its peer group for both periods. The Directors concluded that BlackRock has the ability to manage the Foreign Portfolio effectively.
Fees and Expenses, Profitability, & Economies of Scale.
The Directors noted that although the Value Portfolio’s proposed new advisory fee, which is less than the current fee, is higher thanthe average for its peer group, the pro forma net expenses ratio is below the peer group average. The Directors noted that theInternational Portfolio’s proposed new advisory fee and pro forma net expense ratio are each below the peer group average. TheDirectors noted that the Foreign Portfolio’s proposed new advisory fee is below the average for its peer group, while the pro formanet expense ratio is slightly higher than the peer group average.
The Directors also reviewed charts showing how the Portfolio’s proposed advisory and sub-advisory fees compared to the advisoryand sub-advisory fees of the funds in its peer group. The charts showed the number of funds in the peer group within each definedrange of advisory fees or sub-advisory fees, and the range that included the Portfolio. The Directors also noted that the Adviser, andnot the Portfolio, is responsible for paying sub-advisory fees to the Sub-Adviser. The Board also considered the reasonableness ofthe proposed sub-advisory fees to be paid by the Adviser to the Sub-Adviser. The Directors relied on the ability of the Adviser tonegotiate the terms of the Sub-advisory agreement, including the sub-advisory fee, at arm’s-length, noting that the Adviser is notaffiliated with the Sub-Adviser.
The Directors remarked that because the sub-advisory fees were paid by the Adviser and not by a Portfolio, the Adviser wasincentivized to negotiate a favorable fee. Accordingly, the cost of services provided by the Sub-Adviser and the profitability of theSub-Adviser in connection with its relationship with the Portfolio were not material factors in the Board’s deliberations. For similarreasons, the Board concluded that the potential realization of economies of scale by the Portfolio from the sub-advisoryarrangement with the Sub-Adviser should not be a material factor in its deliberations.
After consideration of the foregoing, the Board reached the following conclusions regarding each of the proposed Sub-AdvisoryAgreements, in addition to the conclusions set forth above: (a) the Sub-Adviser possesses the capability and resources to performthe duties required of it under the Sub-Advisory Agreement; (b) the investment philosophy, strategies and techniques of theSub-Adviser are appropriate for pursuing the applicable Portfolio’s investment objective; (c) the Sub-Adviser is likely to execute itsinvestment philosophy, strategies and techniques consistently over time; and (d) the Sub-Adviser maintains appropriate complianceprograms. Based on all of the above-mentioned factors and their related conclusions, with no single factor or conclusion beingdeterminative and with each Director not necessarily attributing the same weight to each factor, the Directors unanimouslyapproved the Sub-Advisory Agreements.
Ohio National Fund, Inc.
Additional Information (Continued) December 31, 2019 (Unaudited)
180 (continued)

In addition, at the meeting held on November 14, 2019, The Board, including a majority of the Independent Directors, approved anamendment to the advisory agreement (the “Advisory Agreement”) between Ohio National Investments, Inc. (the “Adviser”) and theOhio National Fund, Inc. (the “Fund”) for the purpose of adding the ON Federated Total Return Bond Portfolio (the “Portfolio”) to thePortfolios managed by the Adviser under the Advisory Agreement. The Directors also approved a new sub-advisory agreement (the“Sub-Advisory Agreement”) between the Adviser and Federated Investment Management Company (“Federated”) for the Portfolio.
The Directors noted that the Adviser will be responsible for monitoring the investment performance and other responsibilities of theSub-Adviser, which has day-to-day responsibility for the decisions made for the Portfolio. They also noted that the Adviser willreport to the Board on its analysis of the Sub-Adviser’s performance at the regular meetings of the Board, which are held at leastquarterly. Finally, the Board noted that the Adviser provides the facilities and equipment utilized by the Fund; supplies businessmanagement services to the Fund, including monitoring expenses accruals and preparing the Portfolio’s financial statements;prepares and files Fund registration statements, proxies, shareholder reports and other regulatory filings; provides financialoversight; and ensures that proxies related to the Portfolio’s holdings are voted in compliance with policies approved by the Board.
In considering the amendment to the Advisory Agreement and the approval of the Sub-Advisory Agreement, the Board requestedand reviewed a significant amount of information relating to the Portfolio, including the following: (1) proposed advisory andsub-advisory fee information; (2) comparative advisory fee and expense ratio information for a peer group of funds; (3) performancedata for funds employing strategies similar to that of the Portfolio ; and (4) other information regarding the nature, extent and qualityof services anticipated to be provided by the Sub-Adviser.
The Directors, including all the Independent Directors, were assisted by experienced independent legal counsel throughout thecontract review process. The Independent Directors discussed the proposed amendment to the Advisory Agreement and the newSub-Advisory Agreement in a private session with such counsel at which no representatives of management, the Adviser or theSub-Advisers were present. The Directors, including all of the Independent Directors, relied upon the advice of independent legalcounsel and their own business judgment in determining the material factors to be considered in evaluating adding the Portfolio tothe Advisory Agreement and approving the Sub-Advisory Agreement and the weight to be given to each such factor. Theconclusions reached by the Directors were based on a comprehensive evaluation of all the information provided and were not theresult of any one factor. Moreover, each Director may have afforded different weight to the various factors in reaching his or herconclusions with respect to approving the amendment to the Advisory Agreement and the new Sub-Advisory Agreement.
Nature, Extent and Quality of Services
The Board evaluated the nature, extent and quality of the advisory services anticipated to be provided to the Portfolio by the Adviser.As part of its review, the Board reviewed information regarding the Adviser’s operations, procedures and personnel. The Directorstook into account information they received during the previous year at Board meetings in connection with the Adviser’s service toother portfolios of the Fund and through periodic reports regarding the Adviser’s performance of its duties to the other portfolios. TheDirectors considered the capabilities and resources that the Adviser has dedicated to performing services on behalf of the Fund andits portfolios, as well as the quality of the Adviser’s administrative and other services, including the Adviser’s support to contractowners. The Directors also considered the quality of the compliance programs of the Adviser and its responsiveness to inquiries andrequests from the Board. It was the Directors’ conclusion that overall, they were satisfied with the nature, extent and quality ofservices anticipated to be provided to each Portfolio by the Adviser.
The Board also evaluated the nature, extent and quality of the advisory services anticipated to be provided by the Sub-Adviser,noting that the Board has experience with the Sub-Adviser, as it is the Sub-Adviser for another portfolio of the Fund. As part of itsreview, the Board reviewed information regarding the Sub-Adviser’s operations, procedures and personnel. The Directorsconsidered the capabilities and resources that the Sub-Adviser is expected to dedicate to performing services on behalf of thePortfolio, as well as the quality of its administrative and other services. The Directors also considered the quality of the complianceprograms of the Sub-Adviser, and reviewed information on the Sub-Adviser’s portfolio management and brokerage practices,including any soft dollar benefits received. The Directors concluded that, overall, they were satisfied with the nature, extent andquality of services anticipated to be provided to the Portfolio by the Sub-Adviser.
Investment Performance
The Directors reviewed the performance of a comparable fund managed by the Sub-Adviser that utilizes a strategy similar to that ofthe Portfolio, relative to that of its Morningstar peer group and benchmark. The Directors noted that although it had underperformedits peer group median for the 1- year period ended September 30, 2019, the comparable fund had outperformed its peer groupmedian for the year to date, 3- and 5- year periods ended September 30, 2019. They noted in particular that the comparable fundranked in the top 10% for the 3- year period and the top 7% for the 5- year period. Based on this performance, the Directors
Ohio National Fund, Inc.
Additional Information (Continued) December 31, 2019 (Unaudited)
181 (continued)

concluded that the Sub-Adviser has the ability to manage the Portfolio effectively going forward. The Board also considered theAdviser’s effectiveness in monitoring the performance of the Sub-Adviser, and the Adviser’s timeliness in responding toperformance issues, with respect to the other portfolios of the Fund that are sub-advised.
Fees and Expenses
The Board reviewed the Portfolio’s proposed advisory and sub-advisory fees compared to the advisory and sub-advisory fees offunds in its peer group, as well as a chart showing where the Portfolio’s proposed advisory fee and sub-advisory fee were located inthe dispersion of its peer funds’ advisory fees and sub-advisory fees. The chart showed the number of funds in the peer group withineach defined range of advisory fees or sub-advisory fees, and the range that included the Portfolio. The Directors also noted that theAdviser, and not the Portfolio, is responsible for paying sub-advisory fees to the Sub-Adviser. The Board also considered thereasonableness of the proposed sub-advisory fees to be paid by the Adviser to the Sub-Adviser for each applicable Portfolio. TheDirectors relied on the ability of the Adviser to negotiate the terms of each Sub-Advisory Agreement, including the sub-advisory fee,at arm’s-length, noting that the Adviser is not affiliated with any Sub-Adviser. The Directors noted that the proposed advisory feepayable by the Portfolio was well within the range of fees payable by the Portfolio’s peer group and included fee breakpoints. TheDirectors acknowledged that, because the sub-advisory fees were paid by the Adviser and not by the Portfolio, the Adviser isincentivized to negotiate a favorable fee. Accordingly, as to the Sub-Adviser, the cost of services provided by the Sub-Adviser andthe profitability of the Sub-Adviser in connection with its relationship with the Portfolio were not material factors in the Board’sdeliberations. The Directors considered that, although the Portfolio’s proposed advisory fee was above the peer group average, thePortfolio’s projected net expense ratio was below the peer group average. Overall, the Directors concluded that the proposedadvisory and sub-advisory fees were reasonable.
Profitability and Economies of Scale.
The Directors agreed that any projection of profit with respect to the Portfolio would be purely speculative at this time, as thePortfolio have not yet commenced operations. Accordingly, the profitability of the Adviser in connection with its relationship with thePortfolio was not a material factor in the Board’s deliberations.
The Directors noted that that advisory and sub-advisory fee schedules contain breakpoints that would reduce the applicableadvisory or sub-advisory fees on assets above a specified level as the Portfolio’s assets increase. The Directors also noted that thePortfolio would realize additional economies of scale if the Portfolio’s net assets increase over time proportionately more thancertain other expenses. After considering the Portfolio’s current size and potential for growth, the Board concluded that the Portfoliowas likely to benefit from economies of scale as the Portfolio’s net assets increased, and that the proposed breakpoints areappropriate.
After consideration of the foregoing, the Board reached the following conclusions regarding the Advisory Agreement andSub-Advisory Agreement with respect to the Portfolio, in addition to the conclusions set forth above: (a) the Adviser and theSub-Adviser possess the capability and resources to perform the duties required of them under the Advisory Agreement andSub-Advisory Agreement, respectively; (b) the investment philosophy, strategies and techniques of the Sub-Adviser is appropriatefor pursuing the Portfolio’s investment objective; (c) the Sub-Adviser is likely to execute its investment philosophy, strategies andtechniques consistently over time; and (d) the Adviser and Sub-Adviser maintain appropriate compliance programs. Based on theabove-mentioned factors and their related conclusions, with no single factor or conclusion being determinative and with eachDirector not necessarily attributing the same weight to each factor, the Directors unanimously concluded that approval of theamendment to the Advisory Agreement and the Sub-Advisory Agreement were in the best interests of the Portfolio and itsshareholders. Accordingly, the Board, including all the Independent Directors, voted unanimously to approve the amendment to theAdvisory Agreement and the Sub-Advisory Agreement for the Portfolio.
Ohio National Fund, Inc.
Additional Information (Continued) December 31, 2019 (Unaudited)
182 (continued)

(2) Expense Disclosure
An individual may not buy or own membership interests of the Fund directly. An individual acquires an indirect interest in the Fund bypurchasing a variable annuity contract or variable insurance policy and allocating premiums or purchase payments to FundPortfolios available through the separate accounts of ONLIC, ONLAC, and NSLA. Separate accounts of these entities are theshareholders of the Fund.
As a shareholder of the Fund, a separate account incurs ongoing costs, including management fees and other Fund expenses. Thisexample is intended to help a policy/contract owner understand ongoing costs (in dollars) associated with the underlyinginvestment in the Portfolios by the separate account shareholder and to compare these costs with the ongoing costs associatedwith investing in other mutual funds.
The example is based on an investment of $1,000 invested at July 1, 2019 and held through December 31, 2019.
Actual Expenses
The table below provides information about investment values and actual expenses associated with each Portfolio of the Fund. Theinformation below, together with the amount of an underlying investment, can be used to estimate expenses paid over the period. Anestimate can be obtained by simply dividing an underlying investment value by $1,000 (for example, an $8,600 investment valuedivided by $1,000 = 8.6), then multiplying the result by the number in the table under the heading entitled “Expenses Paid DuringPeriod”.
Portfolio
BeginningInvestment
Value7/1/2019
EndingInvestment
Value12/31/2019
Expenses PaidDuring Period*
7/1/2019 – 12/31/2019
Expense RatioDuring Period
7/1/2019 – 12/31/2019(Annualized)
ON Bond . . . . . . . . . . . . . . . . . . . . . . . . . . . . . . . . . . . . . . . . . . . . . . $1,000.00 $1,039.20 $3.08 0.60%ON BlackRock Balanced Allocation . . . . . . . . . . . . . . . . . . . . . . . . . $1,000.00 $1,074.60 $2.93 0.56%ON International Equity . . . . . . . . . . . . . . . . . . . . . . . . . . . . . . . . . . . $1,000.00 $1,044.90 $4.43 0.86%ON Foreign . . . . . . . . . . . . . . . . . . . . . . . . . . . . . . . . . . . . . . . . . . . . $1,000.00 $1,029.70 $8.03 1.57%ON Janus Henderson Forty . . . . . . . . . . . . . . . . . . . . . . . . . . . . . . . . $1,000.00 $1,097.60 $4.07 0.77%ON Janus Henderson Venture. . . . . . . . . . . . . . . . . . . . . . . . . . . . . . $1,000.00 $1,035.90 $4.46 0.87%ON Janus Henderson Enterprise. . . . . . . . . . . . . . . . . . . . . . . . . . . . $1,000.00 $1,076.20 $4.97 0.95%ON S&P 500® Index. . . . . . . . . . . . . . . . . . . . . . . . . . . . . . . . . . . . . . $1,000.00 $1,107.20 $2.02 0.38%ON BlackRock Advantage Large Cap Value . . . . . . . . . . . . . . . . . . . $1,000.00 $1,080.50 $4.04 0.77%ON Federated High Income Bond . . . . . . . . . . . . . . . . . . . . . . . . . . . $1,000.00 $1,044.20 $4.07 0.79%ON Nasdaq-100® Index . . . . . . . . . . . . . . . . . . . . . . . . . . . . . . . . . . . $1,000.00 $1,141.70 $2.21 0.41%ON BlackRock Advantage Large Cap Core . . . . . . . . . . . . . . . . . . . . $1,000.00 $1,086.20 $3.79 0.72%ON BlackRock Advantage Small Cap Growth . . . . . . . . . . . . . . . . . . $1,000.00 $1,090.50 $4.69 0.89%ON S&P MidCap 400® Index . . . . . . . . . . . . . . . . . . . . . . . . . . . . . . . $1,000.00 $1,067.30 $2.14 0.41%ON BlackRock Advantage Large Cap Growth . . . . . . . . . . . . . . . . . . $1,000.00 $1,101.60 $4.18 0.79%ON Risk Managed Balanced . . . . . . . . . . . . . . . . . . . . . . . . . . . . . . . $1,000.00 $1,089.60 $5.21 0.99%ON Conservative Model . . . . . . . . . . . . . . . . . . . . . . . . . . . . . . . . . . $1,000.00 $1,039.20 $1.44 0.28%ON Moderately Conservative Model . . . . . . . . . . . . . . . . . . . . . . . . . $1,000.00 $1,049.30 $1.96 0.38%ON Balanced Model . . . . . . . . . . . . . . . . . . . . . . . . . . . . . . . . . . . . . $1,000.00 $1,059.70 $1.87 0.36%ON Moderate Growth Model. . . . . . . . . . . . . . . . . . . . . . . . . . . . . . . $1,000.00 $1,071.80 $2.30 0.44%ON Growth Model . . . . . . . . . . . . . . . . . . . . . . . . . . . . . . . . . . . . . . . $1,000.00 $1,078.70 $2.46 0.47%
Ohio National Fund, Inc.
Additional Information (Continued) December 31, 2019 (Unaudited)
183 (continued)

Hypothetical Example for Comparison Purposes
The table below provides information about hypothetical investment values and hypothetical expenses based on each respectivePortfolio’s actual expense ratio and an assumed rate of return of 5% per year before expenses, which is not an actual return. Thehypothetical investment values and expenses may not be used to estimate the actual ending investment balance or expensesactually paid for the period by the shareholders. A policy/contract holder may use this information to compare this 5% hypotheticalexample with the 5% hypothetical examples that appear in the shareholder reports of other funds.
Portfolio
BeginningInvestment
Value7/1/2019
EndingInvestment
Value12/31/2019
Expenses PaidDuring Period*
7/1/2019 – 12/31/2019
Expense RatioDuring Period
7/1/2019 – 12/31/2019(Annualized)
ON Bond . . . . . . . . . . . . . . . . . . . . . . . . . . . . . . . . . . . . . . . . . . . . . . $1,000.00 $1,022.18 $3.06 0.60%ON BlackRock Balanced Allocation . . . . . . . . . . . . . . . . . . . . . . . . . $1,000.00 $1,022.38 $2.85 0.56%ON International Equity . . . . . . . . . . . . . . . . . . . . . . . . . . . . . . . . . . . $1,000.00 $1,020.87 $4.38 0.86%ON Foreign . . . . . . . . . . . . . . . . . . . . . . . . . . . . . . . . . . . . . . . . . . . . $1,000.00 $1,017.29 $7.98 1.57%ON Janus Henderson Forty . . . . . . . . . . . . . . . . . . . . . . . . . . . . . . . . $1,000.00 $1,021.32 $3.92 0.77%ON Janus Henderson Venture. . . . . . . . . . . . . . . . . . . . . . . . . . . . . . $1,000.00 $1,020.82 $4.43 0.87%ON Janus Henderson Enterprise. . . . . . . . . . . . . . . . . . . . . . . . . . . . $1,000.00 $1,020.42 $4.84 0.95%ON S&P 500® Index. . . . . . . . . . . . . . . . . . . . . . . . . . . . . . . . . . . . . . $1,000.00 $1,023.29 $1.94 0.38%ON BlackRock Advantage Large Cap Value . . . . . . . . . . . . . . . . . . . $1,000.00 $1,021.32 $3.92 0.77%ON Federated High Income Bond . . . . . . . . . . . . . . . . . . . . . . . . . . . $1,000.00 $1,021.22 $4.02 0.79%ON Nasdaq-100® Index . . . . . . . . . . . . . . . . . . . . . . . . . . . . . . . . . . . $1,000.00 $1,023.14 $2.09 0.41%ON BlackRock Advantage Large Cap Core . . . . . . . . . . . . . . . . . . . . $1,000.00 $1,021.58 $3.67 0.72%ON BlackRock Advantage Small Cap Growth . . . . . . . . . . . . . . . . . . $1,000.00 $1,020.72 $4.53 0.89%ON S&P MidCap 400® Index . . . . . . . . . . . . . . . . . . . . . . . . . . . . . . . $1,000.00 $1,023.14 $2.09 0.41%ON BlackRock Advantage Large Cap Growth . . . . . . . . . . . . . . . . . . $1,000.00 $1,021.22 $4.02 0.79%ON Risk Managed Balanced . . . . . . . . . . . . . . . . . . . . . . . . . . . . . . . $1,000.00 $1,020.21 $5.04 0.99%ON Conservative Model . . . . . . . . . . . . . . . . . . . . . . . . . . . . . . . . . . $1,000.00 $1,023.79 $1.43 0.28%ON Moderately Conservative Model . . . . . . . . . . . . . . . . . . . . . . . . . $1,000.00 $1,023.29 $1.94 0.38%ON Balanced Model . . . . . . . . . . . . . . . . . . . . . . . . . . . . . . . . . . . . . $1,000.00 $1,023.39 $1.84 0.36%ON Moderate Growth Model. . . . . . . . . . . . . . . . . . . . . . . . . . . . . . . $1,000.00 $1,022.99 $2.24 0.44%ON Growth Model . . . . . . . . . . . . . . . . . . . . . . . . . . . . . . . . . . . . . . . $1,000.00 $1,022.84 $2.40 0.47%
* Expenses are equal to the average account value times the Fund’s annualized expense ratio multiplied by the number of days in the most recent fiscal half-year(184 days) divided by the number of days in the fiscal year (365 days). Please note that the expenses shown in these tables are meant to highlight ongoing Fundcosts only and do not reflect any contract-level expenses or Fund transactional costs, such as sales charges (loads) or exchange fees (if any). Therefore, thesetables are useful in comparing ongoing fund costs only, and will not fully assist a policy/contract owner in determining the relative total expenses of differentfunds. In addition, if transactional costs were included, costs may have been higher for these Portfolios as well as for a fund being compared.
(3) Other Federal Tax Information
For corporate shareholders, the percentages of the total ordinary income dividends paid in 2019, that were incurred for the 2019 taxyear, that qualify for the corporate dividends received deduction are as follows:
ON Bond . . . . . . . . . . . . . . . . . . . . . . . . . . . . . . . . . 0.00%ON BlackRock Balanced Allocation . . . . . . . . . . . . 36.81%ON International Equity . . . . . . . . . . . . . . . . . . . . . . 0.00%ON Foreign . . . . . . . . . . . . . . . . . . . . . . . . . . . . . . . 0.82%ON Janus Henderson Forty . . . . . . . . . . . . . . . . . . . 41.69%ON Janus Henderson Venture. . . . . . . . . . . . . . . . . 0.00%ON Janus Henderson Enterprise. . . . . . . . . . . . . . . 35.59%ON S&P 500® Index . . . . . . . . . . . . . . . . . . . . . . . . . 100.00%ON BlackRock Advantage Large Cap Value . . . . . . 64.21%ON Federated High Income Bond . . . . . . . . . . . . . . 0.00%ON Nasdaq-100® Index . . . . . . . . . . . . . . . . . . . . . . 100.00%
ON BlackRock Advantage Large Cap Core . . . . . . . 100.00%ON BlackRock Advantage Small Cap Growth . . . . . 100.00%ON S&P MidCap 400® Index . . . . . . . . . . . . . . . . . . 100.00%ON BlackRock Advantage Large Cap Growth . . . . . 35.81%ON Risk Managed Balanced . . . . . . . . . . . . . . . . . . 18.12%ON Conservative Model . . . . . . . . . . . . . . . . . . . . . 7.48%ON Moderately Conservative Model . . . . . . . . . . . . 14.72%ON Balanced Model . . . . . . . . . . . . . . . . . . . . . . . . 22.65%ON Moderate Growth Model . . . . . . . . . . . . . . . . . . 35.58%ON Growth Model . . . . . . . . . . . . . . . . . . . . . . . . . . 52.33%
Ohio National Fund, Inc.
Additional Information (Continued) December 31, 2019 (Unaudited)
184 (continued)

Pursuant to Section 853 of the Internal Revenue Code, the Fund designates the following amounts as foreign taxes paid for the yearended December 31, 2019:
Creditable ForeignTaxes Paid
Per ShareAmount
Portion of OrdinaryIncome Distribution Derived
from Foreign SourcedIncome
ON International Equity . . . . . . . . . . . . . . . . . . . . . . . . . . . . . . . . . . . . . . . . . $1,468,876 $0.0488 98.19%ON Foreign . . . . . . . . . . . . . . . . . . . . . . . . . . . . . . . . . . . . . . . . . . . . . . . . . . . $ 174,513 $0.1115 97.11%ON Conservative Model . . . . . . . . . . . . . . . . . . . . . . . . . . . . . . . . . . . . . . . . . $ 7,697 $0.0011 2.64%ON Moderately Conservative Model . . . . . . . . . . . . . . . . . . . . . . . . . . . . . . . $ 52,254 $0.0027 7.34%ON Balanced Model . . . . . . . . . . . . . . . . . . . . . . . . . . . . . . . . . . . . . . . . . . . . $ 514,370 $0.0053 15.55%ON Moderate Growth Model . . . . . . . . . . . . . . . . . . . . . . . . . . . . . . . . . . . . . $1,202,946 $0.0071 24.53%ON Growth Model . . . . . . . . . . . . . . . . . . . . . . . . . . . . . . . . . . . . . . . . . . . . . $ 318,563 $0.0088 37.11%
Foreign taxes paid for purposes of Section 853 may be less than actual foreign taxes paid for financial statement purposes. None ofthe Portfolios listed above derived any income from ineligible foreign sources, as defined under Section 901(j) of the InternalRevenue Code.
(4) Liquidity Risk Management Program
To promote effective liquidity risk management throughout the fund industry and to enhance disclosure regarding fund liquidity andredemption practices, the Securities and Exchange Commission (the “Commission”) adopted Rule 22e-4 under the 40 Act, theInvestment Company Liquidity Risk Management Programs Rule. This Rule requires every registered open-end managementcompany to establish a liquidity risk management program (the “LRMP”) that, among other things, provides for the assessment,management and review of liquidity risk, the classification of a fund’s portfolio investments into one of four liquidity buckets basedupon the number of days that such investments may reasonably be expected to be converted into cash or otherwise disposed ofwithout significantly impacting their price, the establishment of a highly liquid investment minimum where required, and theestablishment of a 15% limitation on illiquid investments. Additionally, the Commission adopted Rule 30b1-10 and Form N-LIQUID,which generally requires a fund to notify the Commission when certain liquidity-related events occur.
The Fund’s Board approved the Fund’s LRMP at its regular board meeting on August 17, 2018, including the appointment of the Fund’sadviser, Ohio National Investments, Inc. (“ONI”) as the administrator of the LRMP. At the Board’s regular meeting on November 14,2019, ONI provided a report to the Fund’s Board on the operation and effectiveness of the LRMP after its first year of operation. ONImanages liquidity risks associated with the Fund’s investments by monitoring cash and cash equivalents, the use of derivatives, theconcentration of investments and the appropriateness of portfolio strategies for open-end funds, and by classifying every fundinvestment as either highly liquid, moderately liquid, less liquid or illiquid on at least a monthly basis. To assist with the classificationof Fund investments, ONI has contracted with a third party provider of liquidity monitoring services. ONI supplies portfolio-level dataand certain assumptions to this provider which it uses to determine preliminary classifications. Once these preliminaryclassifications are received by ONI, ONI personnel review the information, reconcile it with Fund sub-advisers, and whereappropriate take sub-adviser input into account in determining final classifications.
The LRMP effectively managed the Fund’s liquidity risks throughout calendar year 2019. During this period, no Portfolio held lessthan 99% of its total net assets in highly liquid investments. Because every Portfolio consisted primarily of highly liquid investments,no highly liquid investment minimum was required to be established for any portfolio, and all were well under their illiquid investmentlimitations. Additionally, no events that would require the filing of From N-LIQUID occurred.
Ohio National Fund, Inc.
Additional Information (Continued) December 31, 2019 (Unaudited)
185 (continued)

(5) Other Disclosures
The Statement of Additional Information of the Fund includes additional information about the the Board and is available athttp://www.ohionationalfund.com or upon request, without charge, by calling 877-781-6392 (toll-free).
A description of the policies and procedures that the Fund uses in voting proxies relating to Fund securities, as well as informationregarding how the Fund voted proxies during the most recent twelve-month period ended June 30, is available without charge, uponrequest, by calling 877-781-6392 (toll-free) and on the SEC’s website at http://www.sec.gov.
The Fund has filed its Schedules of Investments as of March 31 and September 30 with the SEC, as required, on Form N-Port Part F.Form N-Port Part F is required to be filed with the SEC for the first and third quarters of each fiscal year within sixty days after the endof each period and is available on the SEC website upon acceptance of each submission. The Fund’s Forms N-Port Part Fs may bereviewed and copied at the SEC’s Public Reference Room in Washington, DC. Information about the Public Reference Room isavailable by calling 1-800-SEC-0330 (toll-free).
This report and the financial statements contained herein are submitted for the general information of the shareholders of the Fund.This report is not authorized for distribution to prospective investors in the Fund unless preceded or accompanied by an effectiveprospectus of the Fund. For a prospectus containing more complete information, including charges and expenses, please contactOhio National Investments, Inc., One Financial Way, Cincinnati, OH 45242, telephone 877-781-6392 (toll-free).
Ohio National Fund, Inc.
Additional Information (Continued) December 31, 2019 (Unaudited)
186

Name and Address Age Position(s) with the Fund
Term of Officeand Length ofTime Served
Number of Portfoliosin the Fund to be
Overseen by DirectorPrincipal Occupation(s) During Past Five Years
and Other Directorships
IndependentDirectors
George M. VredeveldOne Financial WayCincinnati, Ohio
77 Director, Member ofAudit and IndependentDirectors Committees
Indefinite;SinceMarch
1996
21 Professor Emeritus, Finance: University ofCincinnati (January 2014 - present);Honorary Consul; Republic of Bulgaria(2019 - present); Alpaugh Professor ofEconomics: Lindner College of Business,University of Cincinnati (2004 - 2013);Founder/President: Economics Center atthe University of Cincinnati (1977 - 2012).
Madeleine W. LudlowOne Financial WayCincinnati, Ohio
65 Director, Chairman ofAudit Committee andMember of IndependentDirectors Committee
Indefinite;SinceApril2012
21 Founder/Managing Director: West CapitalPartners LLC (2010 - present), Ludlow WardCapital Advisors LLC (2005 - 2009);Director: ALLETE, Inc.
Geoffrey KeenanOne Financial WayCincinnati, Ohio
61 Chairman andDirector, Member ofAudit and IndependentDirectors Committees
Indefinite;Since
January2015
21 Executive Vice President and ChiefOperating Officer: Gateway InvestmentAdvisers, LLC (1995 - 2013).
Lawrence L. GryppOne Financial WayCincinnati, Ohio
71 Director, Member ofAudit and IndependentDirectors Committees
Indefinite;Since
December2016
21 Senior Business Advisor and BoardMember: Goering Center for Family andPrivate Business (January 2018 - Present);President: Goering Center for Family andPrivate Business (August 2008 - December2017).
Interested Director
John J. PalmerOne Financial WayCincinnati, Ohio
80 Director Indefinite;SinceJuly1997
21 Insurance industry consultant (April 2010 -December 2015), President: Ohio NationalFund, Inc. (1997 - 2010); Director and ViceChairman: ONLIC (1997 - 2010); Presidentand CEO: NSLA (2002 - 2010);Director: NSLA.
Officers
Michael J. DeWeirdtOne Financial WayCincinnati, Ohio
60 President Indefinite;SinceMarch
2017
Senior Vice President and Chief ProductOfficer: ONLIC (September 2018 - Present);President: NSLAC (May 2016 - Present);Senior Vice President and Head ofAnnuities SBU: ONLIC (January 2016 -September 2018); Senior Vice President,Chief Risk Officer: ONLIC (September 2015 -December 2015); Senior Vice President,Capital and Financial RiskManagement: ONLIC (December 2012 -September 2015)
Paul J. GerardOne Financial WayCincinnati, Ohio
60 Vice President Indefinite;SinceMarch
2016
Senior Vice President and Chief InvestmentOfficer: ONLIC and NSLA (January 2016 -present); Senior Vice President,Investments: ONLIC (July 2012 - December2015)
Ohio National Fund, Inc.
Information about Directors and Officers December 31, 2019 (Unaudited)
187
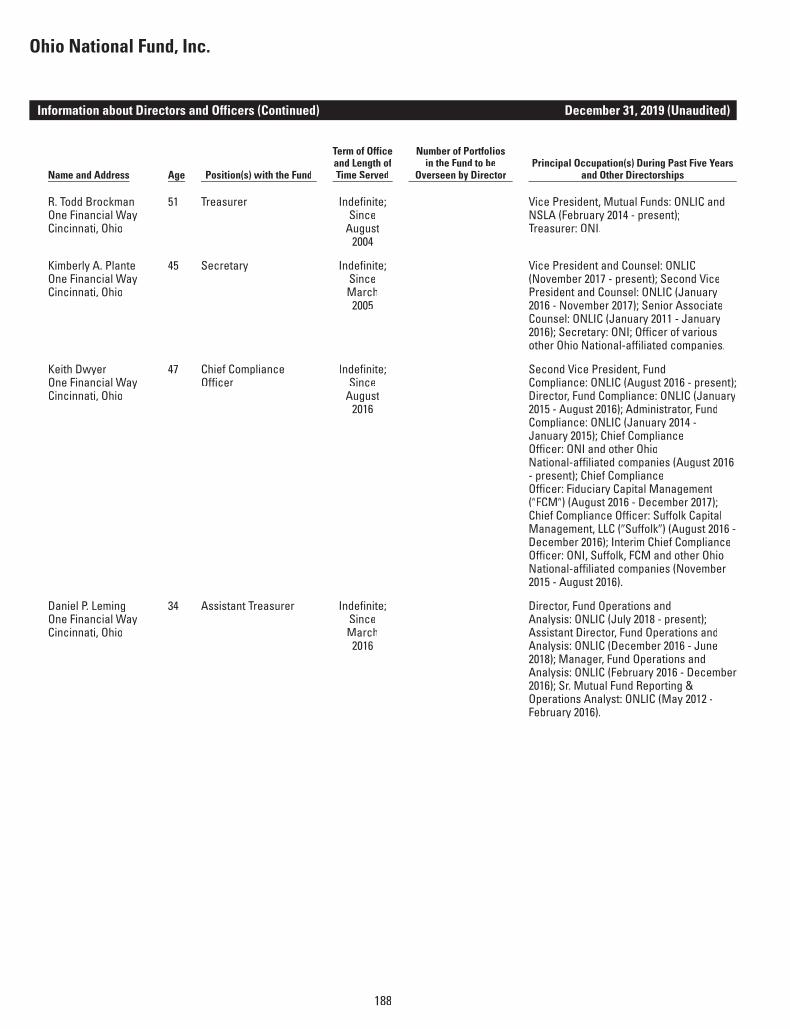
Name and Address Age Position(s) with the Fund
Term of Officeand Length ofTime Served
Number of Portfoliosin the Fund to be
Overseen by DirectorPrincipal Occupation(s) During Past Five Years
and Other Directorships
R. Todd BrockmanOne Financial WayCincinnati, Ohio
51 Treasurer Indefinite;Since
August2004
Vice President, Mutual Funds: ONLIC andNSLA (February 2014 - present);Treasurer: ONI.
Kimberly A. PlanteOne Financial WayCincinnati, Ohio
45 Secretary Indefinite;SinceMarch
2005
Vice President and Counsel: ONLIC(November 2017 - present); Second VicePresident and Counsel: ONLIC (January2016 - November 2017); Senior AssociateCounsel: ONLIC (January 2011 - January2016); Secretary: ONI; Officer of variousother Ohio National-affiliated companies.
Keith DwyerOne Financial WayCincinnati, Ohio
47 Chief ComplianceOfficer
Indefinite;Since
August2016
Second Vice President, FundCompliance: ONLIC (August 2016 - present);Director, Fund Compliance: ONLIC (January2015 - August 2016); Administrator, FundCompliance: ONLIC (January 2014 -January 2015); Chief ComplianceOfficer: ONI and other OhioNational-affiliated companies (August 2016- present); Chief ComplianceOfficer: Fiduciary Capital Management(�FCM�) (August 2016 - December 2017);Chief Compliance Officer: Suffolk CapitalManagement, LLC (�Suffolk�) (August 2016 -December 2016); Interim Chief ComplianceOfficer: ONI, Suffolk, FCM and other OhioNational-affiliated companies (November2015 - August 2016).
Daniel P. LemingOne Financial WayCincinnati, Ohio
34 Assistant Treasurer Indefinite;SinceMarch
2016
Director, Fund Operations andAnalysis: ONLIC (July 2018 - present);Assistant Director, Fund Operations andAnalysis: ONLIC (December 2016 - June2018); Manager, Fund Operations andAnalysis: ONLIC (February 2016 - December2016); Sr. Mutual Fund Reporting &Operations Analyst: ONLIC (May 2012 -February 2016).
Ohio National Fund, Inc.
Information about Directors and Officers (Continued) December 31, 2019 (Unaudited)
188

[THIS PAGE LEFT INTENTIONALLY BLANK]

Ohio National Fund, Inc.Post Office Box 371Cincinnati, Ohio 45201
Form 1320 Rev. 2-20