december 2017 position statement four: plymouth … · 1 december 2017 position statement four:...
TRANSCRIPT

1
December 2017
POSITION STATEMENT FOUR:
Plymouth and South West Devon Joint Local Plan Transport
Strategy Working Group
This position statement represents the agreed position regarding the
performance of key junctions / corridors connecting the local and
strategic road network in the Plymouth Policy Area1 of the Plymouth
and South West Devon Joint Local Plan of:-
PLYMOUTH CITY COUNCIL
DEVON COUNTY COUNCIL and
HIGHWAYS ENGLAND
As of December 2017
1 The Plymouth Policy Area is Plymouth's administrative area and the urban fringe within South Hams.

2
1.0 Background
This position statement builds on Position Statement Three which was the agreed position
of the three Highway Authorities within the Joint Local Plan (JLP) area with regard to the list
of strategic junctions which needed further investigation / mitigation during the life of the
Plymouth and South West Devon Joint Local Plan at the time the Plan was submitted for
Examination in July 2017.
When finalising Position Statement Three it was agreed that, in Position Statement Four, the
TSWG would:-
Consider mitigation options for the junctions of interest mindful of the principles set out in Policies SPT 9 and 10 of the Plymouth and South West Devon Joint Local Plan;
Test potential mitigation options in iterations of the B4 model scenario (Table One)2, understanding that;
o The B4 model will consider transport corridors/routes, rather than concentrating on the worst individual turning movements at specific nodes, with the identified corridors being;
Northern Corridor (A386 between the junction of Outland Road and Peverell Park Road and Derriford Roundabout, including Manadon Junction),
A38 Eastern Corridor (Manadon Junction, Forder Valley Interchange, Marsh Mills, Deep Lane, Forder Valley Link Road and Coypool Road) and
A38 Western Corridor (St Budeaux Interchange and Weston Mill including the interface between the SRN and Crownhill Road).
It was also acknowledged that:-
(1) The B4 model outputs might identify other locations which are 75%3 or more RFC4 in 2034 and that the TSWG would assess if these nodes also required further investigation / mitigation i.e. the process would be iterative.
2 Where mitigation options/interventions can be modelled in SATURN; there may be some interventions
agreed which cannot be effectively modelled but, through consensus, are accepted as appropriate/adequate mitigation for the particular issue to hand. 3 A figure of 75% has been agreed. This figure has been derived by reference to the operation of the A386
northbound from Manadon Junction in the morning peak period. This link is known to frequently experience congestion at this time. The outputs from HAM2 show parts of this corridor to be operating at up to 75% of theoretical capacity in the base model traffic flow conditions. It is therefore considered appropriate that a volume / capacity figure of 75% is used as the capacity threshold in the HAM 2 model to guide decisions on where further physical transport interventions and/ or sustainable transport measures might be required to support the efficient operation of both the local and strategic highway network. 4 RFC was calculated to two decimal places and then rounded to the nearest whole percent e.g. A1 = 93.51%
and B3 = 95.33% and amount to bring it back to A1 = 1.819%...i.e. A1 would be rounded to 94%, B3 to 95% and the amount to bring it back to A1 would be 2%.
3
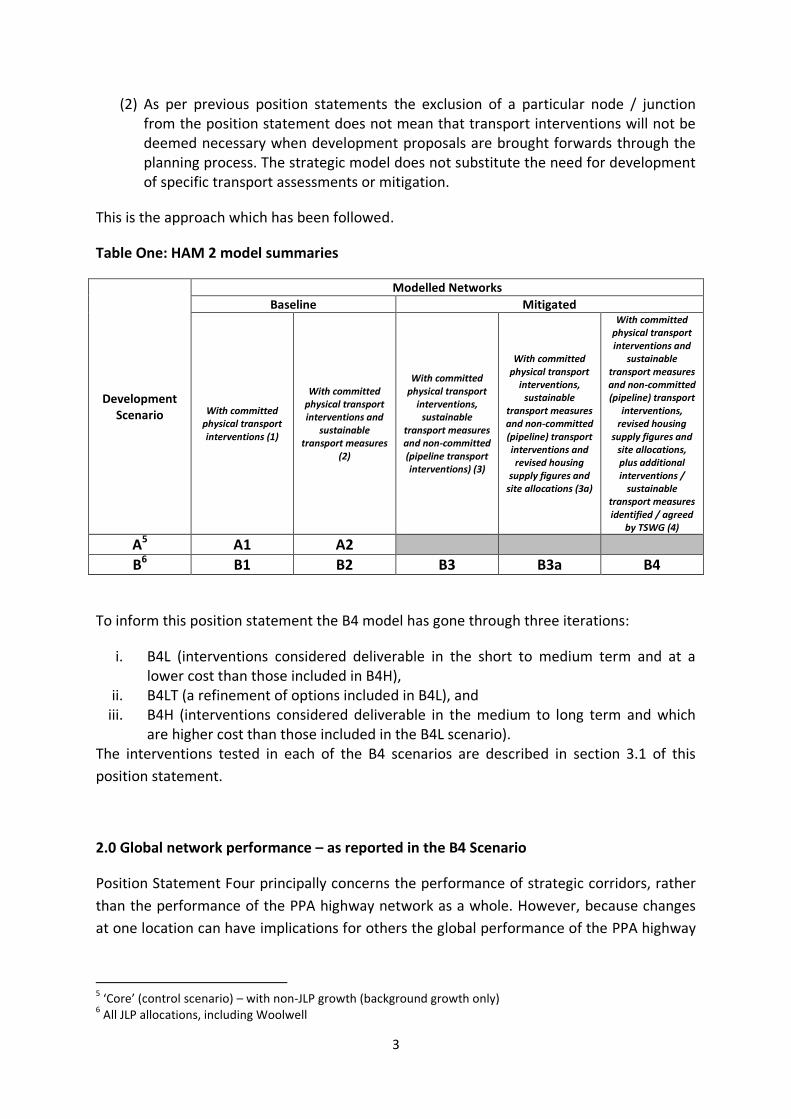
(2) As per previous position statements the exclusion of a particular node / junction from the position statement does not mean that transport interventions will not be deemed necessary when development proposals are brought forwards through the planning process. The strategic model does not substitute the need for development of specific transport assessments or mitigation.
This is the approach which has been followed.
Table One: HAM 2 model summaries
Development Scenario
Modelled Networks
Baseline Mitigated
With committed physical transport interventions (1)
With committed physical transport interventions and
sustainable transport measures
(2)
With committed physical transport
interventions, sustainable
transport measures and non-committed (pipeline transport interventions) (3)
With committed physical transport
interventions, sustainable
transport measures and non-committed (pipeline) transport interventions and revised housing
supply figures and site allocations (3a)
With committed physical transport interventions and
sustainable transport measures and non-committed (pipeline) transport
interventions, revised housing
supply figures and site allocations, plus additional interventions /
sustainable transport measures identified / agreed
by TSWG (4)
A5 A1 A2
B6 B1 B2 B3 B3a B4
To inform this position statement the B4 model has gone through three iterations:
i. B4L (interventions considered deliverable in the short to medium term and at a lower cost than those included in B4H),
ii. B4LT (a refinement of options included in B4L), and iii. B4H (interventions considered deliverable in the medium to long term and which
are higher cost than those included in the B4L scenario). The interventions tested in each of the B4 scenarios are described in section 3.1 of this
position statement.
2.0 Global network performance – as reported in the B4 Scenario
Position Statement Four principally concerns the performance of strategic corridors, rather
than the performance of the PPA highway network as a whole. However, because changes
at one location can have implications for others the global performance of the PPA highway
5 ‘Core’ (control scenario) – with non-JLP growth (background growth only)
6 All JLP allocations, including Woolwell

4
network is also an important metric by which to assess the impact of the Plymouth and
South West Devon Joint Local Plan. This data is therefore reported below.
Firstly, Figures One and Two report the overall number of congested junctions (RFC ≥75%)
for the AM and PM periods in each model scenario run so far (Table One); each iteration of
the B4 scenario sees either a reduction in the number of congested nodes, or an equivalent
number of congested nodes, with reference to the A1 (core) scenario, with B4H achieving a
reduction of 11 in the AM peak and 12 in the PM.
Figure One: AM – Number of congested nodes
Figure Two: PM – Number of congested nodes
The improved network performance is further corroborated by the data in Tables Two and
Three which show key performance indicators for the 2034 HAM2 network in the B4H
scenario, compared to A1.

5
Table Two: Comparison of the A1 and B4H AM model scenarios
Scenario A1 AM B4H AM Difference Commentary
Total Trips (PCUs) 62954 66114 3160
The number of trips increases in the
B4H, compared to in the A1, scenario
Average Speed
(MPH) 28.9 30.7 1.8
Average speed increases in B4H
Total Travel
Times (PCU Hr) 13255.8 13724.4 468.6
Total travel time increases in B4H.
However, this is because there are
more vehicles
Per Vehicle Travel
Time (Minutes
and seconds)
12:38 12:28 -0:10
There is a 10 second decrease in per
vehicle travel time in the B4H,
compared to the A1, scenario.
Table Three: Comparison of the A1 and B4H PM model scenarios
Scenario A1 PM B4H PM Difference Commentary
Total Trips
(PCUs) 60393 61299 906
The number of trips increases in the
B4H, compared to in the A1, scenario
Average Speed
(MPH) 27 28.6 1.6
Average speed increases in B4H
Total Travel
Times (PCU Hr) 14930.5 14838.5 -92
Total travel time decreases in the B4H
scenario.
Per Vehicle
Travel Time
(Minutes and
seconds)
14:50 14:31 -0:19
Per vehicle travel time reduces by 19
seconds in the B4H scenario when
compared to the A1 scenario.
The objective of the TSWG is to develop an effective transport strategy. The data above
suggests that, overall; each of the B4 scenarios performs better than in the A1 scenario,
despite the planned growth and the additional demands it will place on the network.
Therefore it is considered that this objective has been achieved and hence it is appropriate

6
for this Position Statement to principally consider residual road safety issues on strategic
corridors, rather than the performance of the PPA highway network as a whole.
3.0 Corridor / route performance – SATURN HAM2
The outputs of each iteration of the HAM2 model have been assessed in relation to the
performance of strategic routes. The performance of the A38 through Plymouth has been
the primary focus of this exercise. The ability of traffic to safely and efficiently move along
the A38 and to leave the A38 at the five Plymouth junctions7 is a key concern for the TSWG.
A total of 124 key nodes were identified, by Highways England, for assessing the impact of
the growth included in the plan on the operation of the A38. Of these, 22 failed the
acceptability criteria8 in the AM peak and 11 failed in the PM peak in scenario B1. The failure
of the nodes was as a direct result of the additional traffic likely to arise as a result of the
growth included in the JLP. Each iteration of the strategic transport model has sought to
resolve the congestion reported in the previous iteration. The number of nodes failing the
acceptability criteria for each scenario is shown below:-
Table Four: Number of nodes failing the acceptability criteria
Scenario AM Peak PM Peak
B1 22 11
B2 13 9
B3 15 6
B3a 17 10
B4L 18 15
B4LT 17 14
B4H 14 10
In each case, the effect of the reported congestion in terms of road safety and overall
customer experience was considered as part of the decision making process regarding
whether additional mitigation options needed to be tested in future model scenarios.
7 Victoria, Weston Mill, Manadon, Forder Valley and Marsh Mills
8 A volume / capacity figure of 75% is used as the capacity threshold in the HAM 2 model. The volume /
capacity figure achieved at a particular node in scenario A1 is also a relevant comparator as that is the level of performance that a particular node would achieve in the absence of the plan. The acceptability criteria is therefore 75% or the A1 figure whichever is the greatest. This has been used to guide decisions on where further physical transport interventions and/ or sustainable transport measures might be required to support the efficient operation of both the local and strategic highway network.

7
B4L was found not to be satisfactory primarily due to reported congestion at the following
locations:-
Victoria Junction – both off slips
Weston Mill – westbound off-slip
Manadon Junction – a significant worsening of congestion on the A386 northbound from the junction. This congestion already causes mainline blocking at times.
Marsh Mills – Westbound off-slip
A38 Mainline at various locations
B4LT included a number of additional interventions (Sections 3.1.1, 3.1.2 and 3.1.3) aimed at
resolving the above issues. This scenario was found not to be satisfactory primarily due to
reported significant congestion at the following locations:-
Manadon Junction – a significant worsening of congestion on the A386 northbound from the junction. This congestion already causes mainline blocking at times.
Marsh Mills – Westbound off-slip
A38 Mainline at various locations
The performance of the B4H scenario is reported below. It is the agreed position of the
TSWG that B4H is the best of the three B4 scenarios run, in terms of the performance of the
A38 strategic corridor, because it achieves the lowest overall number of congested nodes
within the PPA area in both the AM and PM peak period (Table Four).
3.1 Infrastructure interventions considered in the B4 model scenarios.
This section of the position statement records the schemes which were modelled in the B4
scenarios.
3.1.1 Northern Corridor (A386 between the junction of Outland Road and Peverell Park
Road and Derriford Roundabout, including Manadon Junction).
Scheme Modelled in scenario:-
B4L B4LT B4H
Additional eastbound off-slip lane from the A38 at Manadon Junction
Yes Yes Yes
Signalise the northbound slip from Manadon and A386 Yes Yes No
Additional northbound lane on the A386 from Manadon (relocation of the footbridge) to Boniface Lane
Yes
Lain gain with ghost island merge (Manadon Hill) Yes
Two lanes northbound A386 Flyover and northbound exit from Manadon
Yes Yes Yes
Boniface Lane Junction Signal Timings - Prioritise A386 Yes Yes Yes

8
Re-assigned A386 southbound at Manadon to ‘ahead’ and ‘left’
Yes Yes Yes
A38 Westbound off slip at Manadon widened to three lanes
Yes
A38 widened to three lanes between Manadon and Forder Valley eastbound and westbound
Yes
Widened and signalised southbound exit onto Outland Road and introduce two lanes on slip road
Yes Yes Yes
Northbound ahead added from Meavy Way to Budshead Way.
Yes Yes
3.1.2 A38 Eastern Corridor (Manadon Junction, Forder Valley Interchange, Marsh Mills,
Deep Lane, Forder Valley Link Road and Coypool Road).
Scheme Modelled in scenario:-
B4L B4LT B4H
Marsh Mills: Widen circulatory of inner roundabout to avoid impacts on intergreens
Yes Yes Yes
Longbridge Road Junction - Run on a give-way to reduce signal timings
Yes Yes Yes
Double cycle time for Node 652 in the AM with Sainsbury's running every other cycle
Yes Yes
Double cycle time for Node 652 in the PM with Sainsbury's running every other cycle.
Yes Yes
Marsh Mills overbridge - remove merge marker due to lane gain9
Yes
3.1.3 A38 Western Corridor (St Budeaux Interchange and Weston Mill including the
interface between the SRN and Crownhill Road).
Scheme Modelled in scenario:-
B4L B4LT B4H
St Budeaux: Change the junction to a ‘Dog Bone’ arrangement - I.e. Remove the right turn (signalise)
Yes Yes Yes
St Budeaux: Rebalance stage timings at node 634 to balance V/C across each arm.
Yes Yes
St Budeaux: Increase capacity at node 632 to reflect signal capacity instead of the give way capacities.
Yes Yes
Extra lane eastbound on the A38 between Tamar Bridge and St Budeaux
Yes
Extra lane eastbound on the A38 between St Budeaux and Weston Mill
Yes
9 Modelling amendment – no scheme required

9
Weston Mill: Give priority to the slip road i.e. make on-slip traffic give way to off slip traffic
Yes Yes Yes
Weston Mill: South side review give-way arrangement. Change lane allocations from ‘give way’ to 'merge' so there are now two southbound lanes and one northbound lane.
Yes Yes
Weston Mill: Reduce time to stage 3 at node 214 and reassign to stages 1 and 2 (favouring stage 2).
Yes Yes
An updated status of all the infrastructure interventions included within the B4H model
including ‘committed’ schemes (which are also modelled in the A1, B1 and B2 scenarios) and
‘pipeline’ schemes (which are modelled in the B3 and B3a scenarios) is included in Appendix
One.
3.2 Results
The TSWG agree that the unresolved strategic nodes in the B4H scenario, which are not on
the A38 (Section Four) mainline or being looked at with other models (e.g., Coypool Road),
are as follows:-
Node Name / Location
description Time
of day
RFC Change required to
bring it back to A1 (or 75%, whichever is
more)10
Decision of the TSWG A1 B4H
214
Weston Mill Drive - southbound approach to Ferndale Road/Carlton Terrace
AM 94 99 6%
This is primarily a Local Road Network issue which is unlikely to impact on the A38. This conclusion is based on available traffic count data which indicates that the HAM2 is overestimating11 the flow of traffic leaving the A38 at this location and hence the queue reported in HAM2 is expected to be less in reality. It is therefore agreed that no further mitigation needs
10
The figure reported is the absolute percentage point change required, not the actual percentage capacity increase required. This is consistent with previous position statements 11
Please see section four of this position statement for more information
10
to be identified by TSWG.
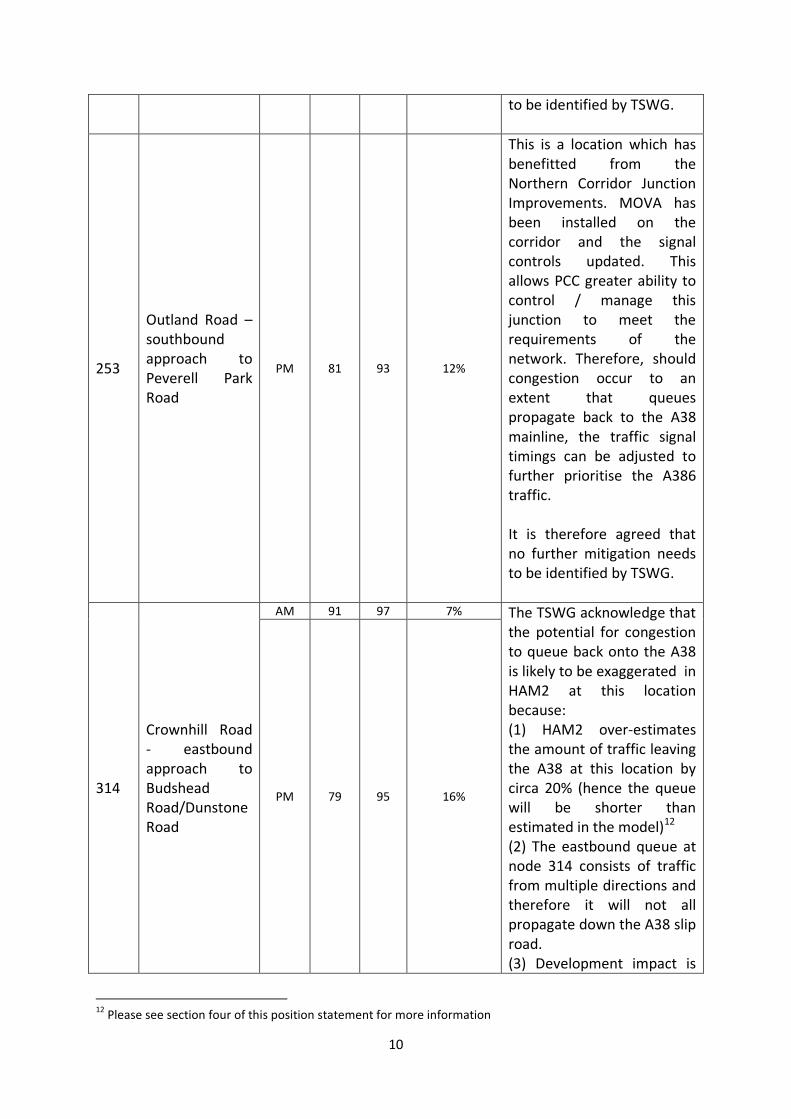
253
Outland Road – southbound approach to Peverell Park Road
PM 81 93 12%
This is a location which has benefitted from the Northern Corridor Junction Improvements. MOVA has been installed on the corridor and the signal controls updated. This allows PCC greater ability to control / manage this junction to meet the requirements of the network. Therefore, should congestion occur to an extent that queues propagate back to the A38 mainline, the traffic signal timings can be adjusted to further prioritise the A386 traffic. It is therefore agreed that no further mitigation needs to be identified by TSWG.
314
Crownhill Road - eastbound approach to Budshead Road/Dunstone Road
AM 91 97 7% The TSWG acknowledge that the potential for congestion to queue back onto the A38 is likely to be exaggerated in HAM2 at this location because: (1) HAM2 over-estimates the amount of traffic leaving the A38 at this location by circa 20% (hence the queue will be shorter than estimated in the model)12 (2) The eastbound queue at node 314 consists of traffic from multiple directions and therefore it will not all propagate down the A38 slip road. (3) Development impact is
PM 79 95 16%
12
Please see section four of this position statement for more information

11
quite small (23 pcu’s per hour (3%) in the AM peak, but the problem is exacerbated however by traffic signal timing adjustments which have been made in order to accommodate traffic flow increases on other approaches to the junction. Therefore, should congestion occur to an extent that queues propagate back to the A38 mainline, the traffic signal timings can be re-adjusted to further prioritise the Crownhill Road traffic. It is therefore agreed that no further mitigation needs to be identified by TSWG.
321
A386 northbound exit at Crownhill
PM 95 100 5%
This location benefits from a gap creation scheme, which isn’t / can’t be modelled in HAM2, which is designed to prevent traffic queuing on the A386 by favouring traffic exiting the A386 over traffic exiting Budshead Road in the PM. The model reports that the junction would be congested in both peaks in the absence of the plan but the traffic increases due to the plan growth does not make the junction significantly worse in B4H. It is therefore agreed that no further mitigation is necessary in terms of

12
scenario B4H. However, as B4H (R)13 seeks to remove downstream A386 constraints the implications of not improving this node may need to be re-considered when the B4H (R) scenario outputs are available.
367
Mannamead Road - Southbound approach to Torr Lane
AM 70 80 5%
This is a location which will benefit from the Northern Corridor Junction Improvements. MOVA will be installed on the corridor and the signal controls updated. This will allow PCC greater ability to control / manage this junction to meet the requirements of the network. While this scheme is included in all B3 scenarios, the flexibility of control that the scheme offers cannot be replicated in HAM2. It is therefore agreed that no further mitigation needs to be identified by TSWG.
648
Manadon Circulatory at the A386 southbound entry point.
AM 64 91 16% This result is thought to be due to the change on the A386 southbound, to the junction from an ahead and left lane to an ahead and ahead and left lane – it has attracted more traffic to the route which has caused an issue on the circulatory. It is the agreed position of the TSWG that a scheme for Manadon will be developed which will consider all issues.
PM 95 101 5%
13
B4H (R) – This scenario will be a future run of the HAM2 model which looks to refine the B4H model

13
In the interim it is agreed that changing the coding in HAM2 back to one ahead lane and one left lane will be tested in the B4H (R) scenario.
821
A386 – Northbound approach to William Prance Road
AM 62 98 23%
This is a location which will benefit from the Derriford Transport Scheme. MOVA will be installed on the corridor and the signal controls updated. This will allow PCC greater ability to control / manage this junction to meet the requirements of the network. It is therefore agreed that no further improvement will be included in B4H (R). However, as B4H (R) seeks to remove downstream A386 constraints the implications of not improving this node may need to be re-considered when the B4H (R) scenario outputs are available.
1235
A386 – Northbound approach to Boniface Lane.
AM 74 87 12%
It was agreed that the performance of this junction would be reviewed in LINSIG (by PCC) and SATURN (by Highways England) in order to identify and test possible intervention options. A preferred option will be included in the B4H (R) scenario. This node represents a significant constraint to traffic movement from Manadon Junction.
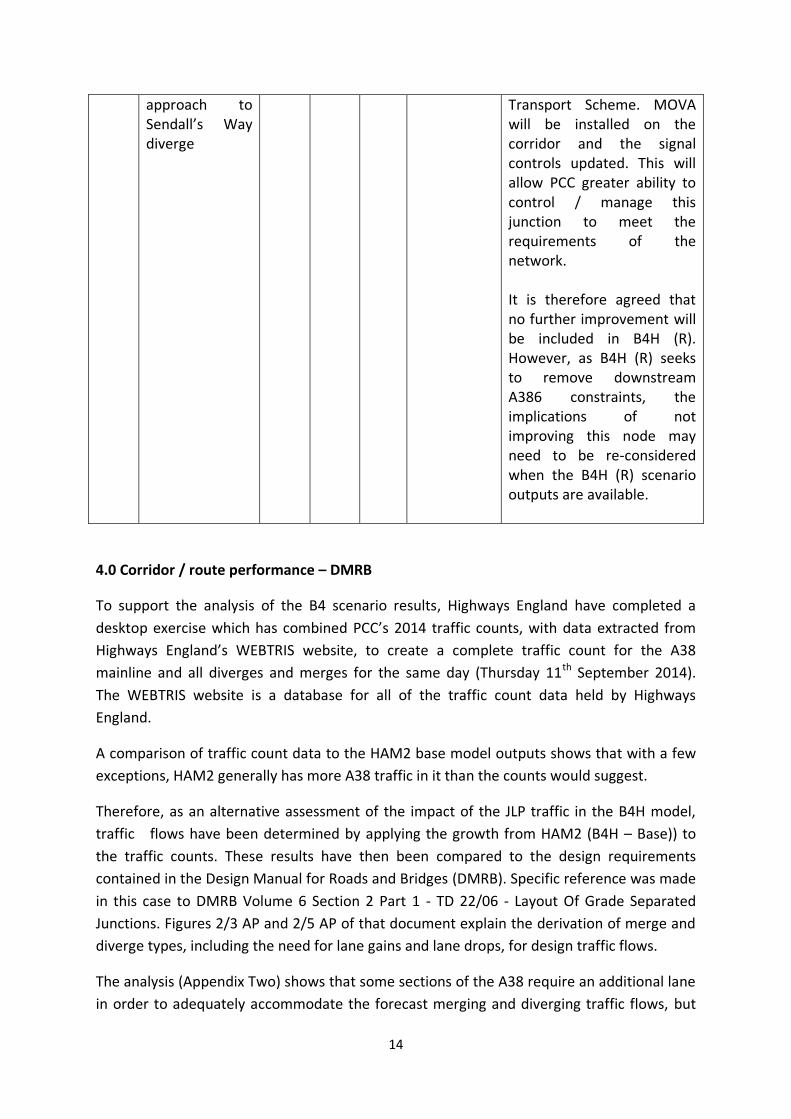
4078 A386 – Northbound
AM 52 91 16% This is a location which will benefit from the Derriford PM 38 82 7%
14
approach to Sendall’s Way diverge
Transport Scheme. MOVA will be installed on the corridor and the signal controls updated. This will allow PCC greater ability to control / manage this junction to meet the requirements of the network. It is therefore agreed that no further improvement will be included in B4H (R). However, as B4H (R) seeks to remove downstream A386 constraints, the implications of not improving this node may need to be re-considered when the B4H (R) scenario outputs are available.
4.0 Corridor / route performance – DMRB
To support the analysis of the B4 scenario results, Highways England have completed a
desktop exercise which has combined PCC’s 2014 traffic counts, with data extracted from
Highways England’s WEBTRIS website, to create a complete traffic count for the A38
mainline and all diverges and merges for the same day (Thursday 11th September 2014).
The WEBTRIS website is a database for all of the traffic count data held by Highways
England.
A comparison of traffic count data to the HAM2 base model outputs shows that with a few
exceptions, HAM2 generally has more A38 traffic in it than the counts would suggest.
Therefore, as an alternative assessment of the impact of the JLP traffic in the B4H model,
traffic flows have been determined by applying the growth from HAM2 (B4H – Base)) to
the traffic counts. These results have then been compared to the design requirements
contained in the Design Manual for Roads and Bridges (DMRB). Specific reference was made
in this case to DMRB Volume 6 Section 2 Part 1 - TD 22/06 - Layout Of Grade Separated
Junctions. Figures 2/3 AP and 2/5 AP of that document explain the derivation of merge and
diverge types, including the need for lane gains and lane drops, for design traffic flows.
The analysis (Appendix Two) shows that some sections of the A38 require an additional lane
in order to adequately accommodate the forecast merging and diverging traffic flows, but

15
the locations at which they are required differ from those according to the HAM2
methodology used so far. The methodology based on traffic flow data and DMRB gives the
following locations for additional running lanes:-
Victoria to Weston Mill (Eastbound) Manadon to Weston Mill (Westbound) Manadon to Forder Valley (Eastbound) – this would be required even in the absence
of the plan. Forder Valley to Manadon (Westbound)
Table Five: Comparison of the HAM2 results and the DMRB comparison results
Location Additional lane required in
HAM2 (B4H)
Additional lane required in the DMRB comparison
results
Tamar Bridge to Victoria (Eastbound)
Yes
Tamar Bridge to Victoria (Westbound)
Victoria to Western Mill (Eastbound)
Yes
Victoria to Western Mill (Westbound)
Western Mill to Manadon (Eastbound)
Yes
Western Mill to Manadon (Westbound)
Yes
Manadon to Forder Valley (Eastbound)
Yes Yes
Manadon to Forder Valley (Westbound)
Yes Yes
Forder Valley to Marsh Mills (Eastbound)
Forder Valley to Marsh Mills (Westbound)
(*) The TSWG acknowledge that whilst the analysis above indicates the need for additional
lanes, as schemes for the A38 mainline are developed alternative approaches to
accommodate demand, such as ramp metering, could also be considered. Furthermore the
TSWG acknowledge that, as part of the development and delivery of the transport
programme to support the JLP, it may be appropriate to consider how schemes which are
included within the programme can be enhanced, for the benefit of the overall performance
of the network. For example, at locations such as Node 1676 (Forder Valley Link Road,
northbound from Forder Valley interchange at the two to one lane merge). This node passes

16
the acceptability criteria test and hence no further work is required by the TSWG at this
time. However, it is acknowledged that, in future, addressing this constraint could improve
the overall performance of the network through reducing demand on the A386 through
increasing flows on Forder Valley Link Road.
5.0 Conclusions
At the time of the Examination the TSWG agree that the results of the B4H scenario
demonstrates that the highway network overall performs better than in the A1 scenario.
However, the TSWG acknowledge that there are three locations where the need for further
intervention has been identified. However, the precise details of the intervention are still
under investigation. These locations are:-
Marsh Mills - junction being assessed using a separate model
Manadon Circulatory at A386 southbound entry point (Node 648)
A386 northbound approach to Boniface Lane (Node 1235) The latter are the two locations on the network (section 3.2) where congestion is forecast to
occur in B4H.
The results of this ongoing work will be reported in Position Statement Five.

17
Name: Philip Heseltine, Head of Transport, Infrastructure and Investment
Signed: Date: 19th December 2017
For Plymouth City Council and Chair of the Transport Strategy Working Group
Name: Rachel Sandy
Signed: Date: 19th December 2017
For Highways England
Name: Jamie Hulland
Signed: Date: 22nd December 2017
For Devon County Council

18
Appendix One: Transport Infrastructure Investment in the PPA

19
Table Six: Transport Infrastructure Investment 2014-2020 onwards
Scheme Location Funding / Scheme Stage
Northern Corridor Junction
Improvements (Phase 1 and
2)
Northern Corridor Growth
Area Constructed Scheme
Stanborough Cross Eastern Corridor Growth Area Constructed Scheme
Marjon Link Road Northern Corridor Growth
Area Constructed Scheme
Derriford Hospital
Interchange
Northern Corridor Growth
Area Constructed Scheme
Derriford Transport Scheme Northern Corridor Growth
Area
Schemes currently in
delivery (2017-2018)
Forder Valley Interchange Northern Corridor Growth
Area
Funding approved (2018 -
2020)
Charles Cross The City Centre Funding approved (2018 -
2020)
Eastern Corridor Junction
Upgrades Eastern Corridor Growth Area
Funding approved (2018 -
2020)
Northern Corridor Junction
Improvements (Phase 3 to 5)
Northern Corridor Growth
Area
Funding approved (2018 -
2020)
Morlaix Drive Northern Corridor Growth
Area
Funded subject to Final
Business Case (2018-
2020)
Forder Valley Link Road Northern Corridor Growth
Area
Funded subject to Final
Business Case (2018-
2020)

20
Plymouth Station City Centre
Funded subject to Final
Business Case (2018-
2020)
Woolwell to The George Northern Corridor Growth
Area
On PCC Capital
Programme - Early design
stage (2019 - 2021)
A38 St. Budeaux:
Scheme details as reported in
section 3.1.3 of this Position
Statement
Western Corridor Pipeline scheme (2020
onwards)
A38 Weston Mill
Scheme details as reported in
section 3.1.3 of this Position
Statement
Western Corridor Pipeline scheme (2020
onwards)
A38 Manadon
Scheme details as reported in
section 3.1.1 of this Position
Statement
Northern Corridor Growth
Area
Pipeline scheme (2020
onwards)
A38 Marsh Mills
Scheme details as reported in
section 3.1.2 of this Position
Statement
Eastern Corridor Growth Area Pipeline scheme (2020
onwards)
A38 Deep Lane Eastern Corridor Growth Area Pipeline scheme (2020
onwards)
Pomphlett to The Ride Eastern Corridor Growth Area Pipeline scheme (2020
onwards)
Cattedown Junction Eastern Corridor Growth Area Pipeline scheme (2020
onwards)

21
Appendix Two: A38 Mainline analysis

A38 Merge/Diverge Assessment
Scenario Direction Peak
Existing Eastbound A A A A B B A A E
Forder Valley Marsh MillsVictoria Interchange Weston Mill Manadon
2 Lanes2 Lanes2 Lanes 2 Lanes 2 Lanes 2 Lanes 2 Lanes 2 Lanes 2 Lanes 3 Lanes
Eastbound AM A A B B B B B B BDN
Eastbound PM A A A B B E C B B
Requirement A A B B B E C B E
Eastbound AM A E C A B E C B A
Eastbound PM A B A B B E C B E
Requirement A E C B B E C B E
Scenario Direction Peak
Existing Westbound A C A A B B A A C
Marsh MillsForder ValleyVictoria Interchange Weston Mill Manadon
2 Lanes
DN
2 Lanes 2 Lanes 3 Lanes 2 Lanes 2 Lanes 2 Lanes 3 Lanes
3 Lanes
2 Lanes 2 Lanes
2 Lanes 3 Lanes 2 Lanes 3 Lanes2 Lanes2 Lanes 2 Lanes 2 Lanes 2 Lanes 2 Lanes
B4H
2 Lanes 2 Lanes 3 Lanes 2 Lanes 2 Lanes 2 Lanes 3 Lanes 2 Lanes 2 Lanes
Westbound AM A A A A A B B A CDN
Westbound PM A B A B B A B A C
Requirement A A B B B B B A C
Westbound AM A B A B A C E A C
Westbound PM A B E B E C E A C
Requirement A B E B E C E A C
Key
Merge Types
A Taper Merge
B Parallel Merge
E Lane Gain
Diverge Types
A Taper Diverge
B Ghost Island Diverge
C Lane Drop
Refer to Figure 2/4.1 of TD 22/06 - Layout of Grade Separated Junc5ons
Refer to Figure 2/4.1 of TD 22/06 - Layout of Grade Separated Junc5ons
Refer to Figure 2/4.3 of TD 22/06 - Layout of Grade Separated Junc5ons
Existing Provision
Upgrade Required
Refer to Figure 2/6.1 of TD 22/06 - Layout of Grade Separated Junc5ons
Refer to Figure 2/6.1 of TD 22/06 - Layout of Grade Separated Junc5ons
Refer to Figure 2/6.2 of TD 22/06 - Layout of Grade Separated Junc5ons
2 Lanes
DN
2 Lanes 2 Lanes 2 Lanes 2 Lanes 3 Lanes
B4H
2 Lanes 2 Lanes 3 Lanes 2 Lanes 3 Lanes 2 Lanes 3 Lanes 2 Lanes 2 Lanes 3 Lanes
2 Lanes 2 Lanes 2 Lanes 2 Lanes