december 2016 - canandaigua national bank & trust€¦ · investment newsletter | december 2016...
TRANSCRIPT

INVESTMENT NEWSLETTER December 2016
Investment Newsletter
December 2016
CLIENT INVESTMENT UPDATE NEWSLETTER
In an asset allocation strategy, we firmly advocate that the primary goal of a rebalancing strategy should be to minimize risk relative to a particular target asset allocation, rather than an attempt to maximize return. When an initial investment is made, a portfolio is established to reflect a certain asset allocation – the percentage of monies invested in varying asset classes (stocks, bonds, real estate, etc.). If set prudently, this asset allocation should reflect the individual investor’s personal circumstances and risk tolerance. Over time, through natural movements of the markets, securities prices rise and fall, causing portfolios to drift from their original allocations. Assuming an investor’s original asset allocation remains appropriate given their goals and risk preferences, these changes could cause the portfolio to no longer reflect the appropriate asset allocation for the investor. Therefore, to recapture the portfolio’s original risk-and-return characteristics, the portfolio should be rebalanced.
Rebalancing – the process of buying or selling assets in order to align to a target allocation – plays an important role in ensuring the integrity of an investor’s initial investment strategy is maintained. The following are three common approaches to rebalancing: time-based, threshold-based, and a combination of the two. Time-based rebalancing sets a particular interval – typically monthly, quarterly, semi-annually or annually – at which rebalancing of the portfolio is triggered. Threshold-based rebalancing sets a tolerance band within which the portfolio is allowed to drift without rebalancing being triggered; however, when drift exceeds
these bands rebalancing occurs and the portfolio is recalibrated. More commonly applied is a combination of time- and threshold-based rebalancing where portfolios are reviewed at a pre-set frequency with rebalancing occurring only if, at that time interval, there is drift beyond the tolerance band set.
In a vacuum, it may seem prudent to rebalance as frequently as possible to ensure the integrity of the original asset allocation; however, there are costs associated with rebalancing that must be considered. A study performed by Vanguard’s Investment Strategy Group, looks at the effects that rebalancing, or not rebalancing, has on portfolio returns and the risk structure of the portfolio while also considering the associated costs.
Table 1. Time-and-Threshold Portfolio Rebalancing Strategy Results, 1926 Through 2009
REBALANCING IN AN ASSET ALLOCATION STRATEGY By: OBS Financial
INVESTMENT NEWSLETTER | DECEMBER 2016 2
This table illustrates the results of employing a combined time- and threshold-based rebalancing strategy using rebalancing thresholds of 1%, 5%, and 10% while also considering multiple rebalancing frequencies including monthly, quarterly, and annual. It also considers the impact of never rebalancing the portfolio. Using a 60/40 stock to bond allocation of various indices from 1926 through 2009, we see that the average equity/bond allocation drifted over time from its original 60/40 allocation to approximately an 84/16 allocation (noted in the far right column) in the absence of rebalancing. Due to this increased exposure to equities, it is not surprising that the average annualized return for the 84/16 allocation is higher at 9.1% when compared to the return of the various portfolios employing a rebalancing protocol. Likewise, the portfolio with an increased equity exposure experiences higher volatility by comparison. Volatility, as measured by standard deviation, was 2% or greater when compared to a rebalanced portfolio. This is more than the incremental return experienced by the portfolio absent of rebalancing, suggesting lower risk adjusted returns for the non-rebalanced portfolio. Another conclusion from the above table is that a lower drift threshold will produce more turnover and rebalancing events, and consequently more costs.
So what is an optimal rebalancing strategy? What we know for certain is that a rebalancing schedule is imperative to ensure that an investment strategy continues to reflect an investor’s risk preferences as determined at the establishment of an investment plan. While the omission of a rebalancing strategy, as illustrated above, may provide a higher return, it may also result in higher volatility and concentration of risky assets that may be outside the investor’s risk parameters. Conversely, the above table also shows that an excessive amount of rebalancing generates more turnover and rebalancing events, which produces more costs thereby reducing the investor’s overall portfolio return.
While a specific “optimal” strategy may not exist, our experience suggests rebalancing no more frequently than quarterly and no less frequently than annually. Further, we suggest that these frequencies coupled with a drift allowance in the 2-5% range will provide a sensible strategy that should prevent significant shift in risk structure while limiting trading costs. We recognize that rebalancing strategies may differ from investor to investor and that there is no “one size fits all” solution; however, considering the above observations along with an investor's risk preferences should assist in determining the appropriate rebalancing strategy for a particular investor.
THE POWER OF MARKETS Source: Dimensional Fund Advisors
November 2016
In 1958, economist Leonard Read published an essay entitled “I, Pencil: My Family Tree as Told to Leonard E. Read.”
The essay, narrated from the point of view of a pencil, describes the “complex combination of miracles” necessary to create and bring to market the commonplace writing tool that has been used for generations. The narrator argues that no single individual possesses enough ability or know-how to create a pencil on their own. Rather, the mundane pencil—and the ability to purchase it for a “trifling” sum—is the result of an extraordinary process driven by the knowledge of market participants and the power of market prices.
THE IMPORTANCE OF PRICE Upon observing a pencil, it is tempting to think a single individual could easily make one. After all, it is made up of common items such as wood, paint, graphite, metal, and a rubber eraser. By delving deeper into how these seemingly ordinary
INVESTMENT NEWSLETTER | DECEMBER 2016 3
components are produced, however, we begin to understand the extraordinary backstory of their synthesis. Take the wood as an example: To produce wood requires a saw, to make the saw requires steel, to make steel requires iron. That iron must be mined, smelted, and shaped. A truck, train, or boat is needed to transport the wood from the forest to a factory where numerous machines convert it into lumber. The lumber is then transported to another factory where more machines assemble the pencil. Each of the components mentioned above and each step in the process have similarly complex backstories. All require materials that are sourced from far-flung locations, and countless processes are involved in refining them. While the multitude of inputs and processes necessary to create a pencil is impressive, even more impressive are the coordinated actions required by millions of people around the world to bring everything together. There is the direct involvement of farmers, loggers, miners, factory workers, and the providers of capital. There is also the indirect involvement of millions of others—the makers of rails, railroad cars, ships, and so on. Market prices are the unifying force that enables these millions of people to coordinate their actions efficiently.
Workers with specific knowledge about their costs, constraints, and efforts use market prices to leverage the knowledge of others to decide how to direct their own resources and make a living. Consider the farmer, the logger, and the price of a tree. The farmer will have a deep understanding of the costs, constraints, and efforts required to grow trees. To increase profit, the farmer will seek out the highest price when selling trees to a logger. After purchasing the trees, the logger will convert them to wood and sell that wood to a factory. The logger understands the costs, constraints, and efforts required to do this, so to increase profit, the logger seeks to pay the lowest price possible when buying trees from the farmer. When the farmer and the logger agree to transact, the agreed upon price reflects their combined knowledge of the costs and constraints of both growing and harvesting trees. That knowledge allows them to decide how to efficiently allocate their resources in seeking a profit. Ultimately, it is price that enables this coordination. On a much larger scale, price formation is facilitated by competition between the many farmers that sell trees to loggers and between the many loggers that buy trees from farmers. This market price of trees is observable and can be used by others in the production chain (e.g., the lumber factory mentioned above) to inform how much they can expect to pay for wood and to plan how to allocate their resources accordingly.
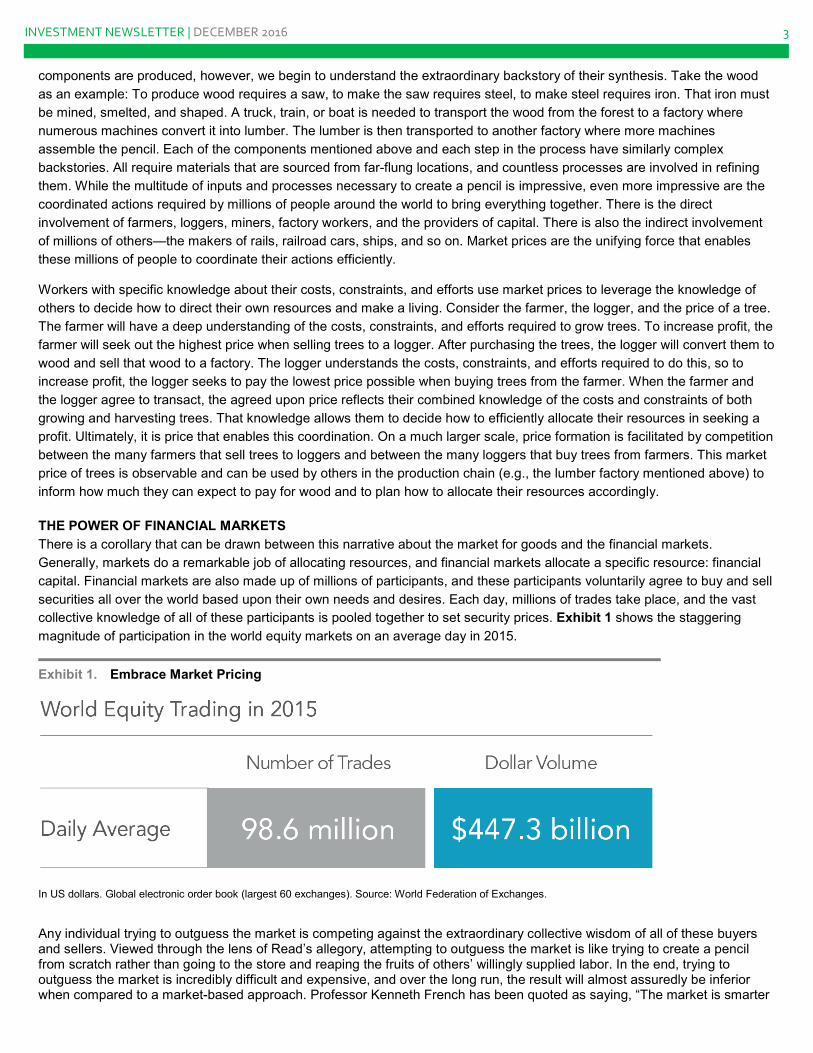
THE POWER OF FINANCIAL MARKETS There is a corollary that can be drawn between this narrative about the market for goods and the financial markets. Generally, markets do a remarkable job of allocating resources, and financial markets allocate a specific resource: financial capital. Financial markets are also made up of millions of participants, and these participants voluntarily agree to buy and sell securities all over the world based upon their own needs and desires. Each day, millions of trades take place, and the vast collective knowledge of all of these participants is pooled together to set security prices. Exhibit 1 shows the staggering magnitude of participation in the world equity markets on an average day in 2015.
Exhibit 1. Embrace Market Pricing
In US dollars. Global electronic order book (largest 60 exchanges). Source: World Federation of Exchanges.
Any individual trying to outguess the market is competing against the extraordinary collective wisdom of all of these buyers and sellers. Viewed through the lens of Read’s allegory, attempting to outguess the market is like trying to create a pencil from scratch rather than going to the store and reaping the fruits of others’ willingly supplied labor. In the end, trying to outguess the market is incredibly difficult and expensive, and over the long run, the result will almost assuredly be inferior when compared to a market-based approach. Professor Kenneth French has been quoted as saying, “The market is smarter

INVESTMENT NEWSLETTER | DECEMBER 2016 4
than we are and no matter how smart we get, the market will always be smarter than we are.” One doesn’t have to look far for data that supports this. Exhibit 2 shows that only 17% of US equity mutual funds have survived and outperformed their benchmarks over the past 15 years.
Exhibit 2. Don’t Try to Outguess the Market
Beginning sample includes funds as of the beginning of the 15-year period ending December 31, 2015. Past performance is no guarantee of future results. Source: Dimensional Fund Advisors, “The US Mutual Fund Landscape.” See disclosures for more information.
CONCLUSION The beauty of Leonard Read’s story is that it provides a glimpse of the incredibly complex tapestry of markets and how prices are formed, what types of information they contain, and how they are used. The story makes it clear that no single individual possesses enough ability or know-how to create a pencil on their own but rather that the pencil’s miraculous production is the result of the collective input and effort of countless motivated human beings. In the end, the power of markets benefits all of us. The market allows us to exchange the time we require to earn money for a few milliseconds of each person’s time involved in making a pencil. For an investor, we believe the lesson here is that instead of fighting the market, one should pursue an investment strategy that efficiently and effectively harnesses the extraordinary collective power of market prices. That is, an investment strategy that uses market prices and the information they contain in its design and day-to-day management. In doing so, an investor has access to the rewards that financial markets make available to providers of capital.
Source: Dimensional Fund Advisors LP.
There is no guarantee investment strategies will be successful.
US-domiciled mutual fund data is from the CRSP Survivor-Bias-Free US Mutual Fund Database, provided by the Center for Research in Security Prices, University of Chicago. Certain types of equity funds were excluded from the performance study. Index funds, sector funds, and funds with a narrow investment focus, such as real estate and gold, were excluded.
Funds are identified using Lipper fund classification codes. Correlation coefficients are computed for each fund with respect to diversified benchmark indices using all return data available between January 1, 2001, and December 31, 2015. The index most highly correlated with a fund is assigned as its benchmark. Winner funds are those whose cumulative return over the period exceeded that of their respective benchmark. Loser funds are funds that did not survive the period or whose cumulative return did not exceed their respective benchmark.
All expressions of opinion are subject to change. This article is distributed for informational purposes, and it is not to be construed as an offer, solicitation, recommendation, or endorsement of any particular security, products, or services.
Ken French is a member of the Board of Directors for and provides consulting services to Dimensional Fund Advisors LP.

INVESTMENT NEWSLETTER | DECEMBER 2016 5
Economy Has More Than Trump Policy Uncertainty to Worry About by Robert Johnson, CFA Morningstar Advisors, 11/12/2016
With earnings season behind us and only minor economic reports released this week, markets could focus full-time on the election and Donald Trump's surprising win. And focus they did. Wednesday, after the election, investment-related firms spent all day gearing up for expected large market declines. Many companies, including Morningstar, set up calls to reassure investors, to encourage them not to panic, and to stick with their carefully crafted investment plans. With 5%-10% declines after the equally surprising Brexit vote in June and large overnight losses in many world markets, everyone was geared up for the worst. In retrospect, it looks like the focus of those calls should have been why Trump won't get everything he wants, and to remind investors of weakening economic fundamentals and relatively high valuations.
After a very brief decline in the first half-hour of trading, U.S. equities moved up sharply on Wednesday and Thursday and a little more on Friday's Veterans Day holiday, which limited market activity. For the week, the S&P 500 was up almost 4%, and the Dow was up an even better 5% or so. European stocks didn't do much, with a gain of about 1%.
Not everyone was a winner. Emerging markets fell over 5% Friday to Friday and an even stronger 9% from Tuesday night's close to Friday's close, as worries about Trump's trade policies and potentially higher interest rates weighed particularly hard on this sector. Bonds did terribly, too, as investors feared a combination of Trump tax cuts and less spending restraint would lead to higher inflation and higher interest rates. The interest rates on U.S. 10-year Treasuries moved from 1.8% to 2.1% in a single week and are well off their July low of 1.5%. This will not be great news for the housing industry, as market-based 10-year rates, not the U.S. Federal Reserve, set mortgage rates. So while everyone is quibbling about which month a potentially small 0.25% interest rate increase by the Fed might occur, back in the real world, rates are up 0.6% on the 10-year, which will likely drive mortgage rates up and affordability down. It had nothing to do with the election, but commodities also had a down week as high inventories and warm weather took a toll on the energy complex.
After Trump's election, many strategists, almost all of whom assumed he would lose, dusted off the broad outlines of Trump's policies and discovered that a few of them might help the economy in general and some businesses in particular. He wants to cut taxes, is not fixated on cutting costs, and has shown interest in more infrastructure spending. Except to bond investors, that didn't seem like a bad idea. He had also talked about less regulation, particularly Dodd-Frank regulations, and that made many financial types very happy. And maybe the energy industry wouldn't feel quite so under the gun. Gee, maybe Trump wouldn't be so bad after all.
However, conveniently forgotten, at least through Friday, were trade policies that are likely to provoke at least some retaliation, and immigration policies that might limit labor force growth, which is one of the pillars of GDP growth. In addition, the stimulus plan could create more inflation, which was already on the rise without the help of Trump. And, of course, there is the issue of implementing his policies, which a lot of new presidents have found surprisingly difficult.

INVESTMENT NEWSLETTER | DECEMBER 2016 6
Trump Will Likely Inherit an Economy That Is Losing Steam I believe that the exact policies and winners and losers will prove to be just about as difficult to predict as who would win the current election. And even if all of those were clear, a lot of that would be priced into stocks and bonds. However, it is clear that a lot of clouds, perhaps not storm clouds, were gathering over the U.S. economy. A few weeks ago, we ran a chart of
industries that were driving the economy and were clearly past their prime.
We believe that erosion continues. The auto industry got some more bad news as Ford F announced that it would temporarily idle four North American plants for varying periods during the fourth quarter. That could involve as many as 9,000 workers in the U.S. and 4,000 in Mexico. Auto sales appear to have peaked out, but production remained relatively aggressive until recently. Cutbacks in the auto industry will slowly trickle back to a lot of supplier industries.
We note the weekly chain-store sales have shockingly gone into negative territory on a year-over-year basis. Business-related construction spending also looks worse than we had hoped, and billing by architects, a great economic indicator, continues to worsen.
More broadly, measured on a rolling 12-month basis, GDP growth has slowed from 2.9% to 1.6% and taken employment growth with it.
We have also raised concerns about accelerating inflation rates for some time. With gasoline prices failing to make their usually large autumn declines, headline inflation could approach 2% by December.
Core inflation has been relatively robust for some time, but falling energy prices have masked a lot of those increases. On a year-over-year, weekly basis, gasoline prices are now higher than they were a year ago, as shown below.
As we have said before, large increases in inflation, no matter which categories are causing the issue or whether they are core, are the number-one killer of recoveries. Potential fiscal stimulus, on top of inflation rates that have already moved uncomfortably higher, could throw more
gasoline on smoldering inflationary embers. The bond market has figured that out relatively quickly. Equity markets, not so much.
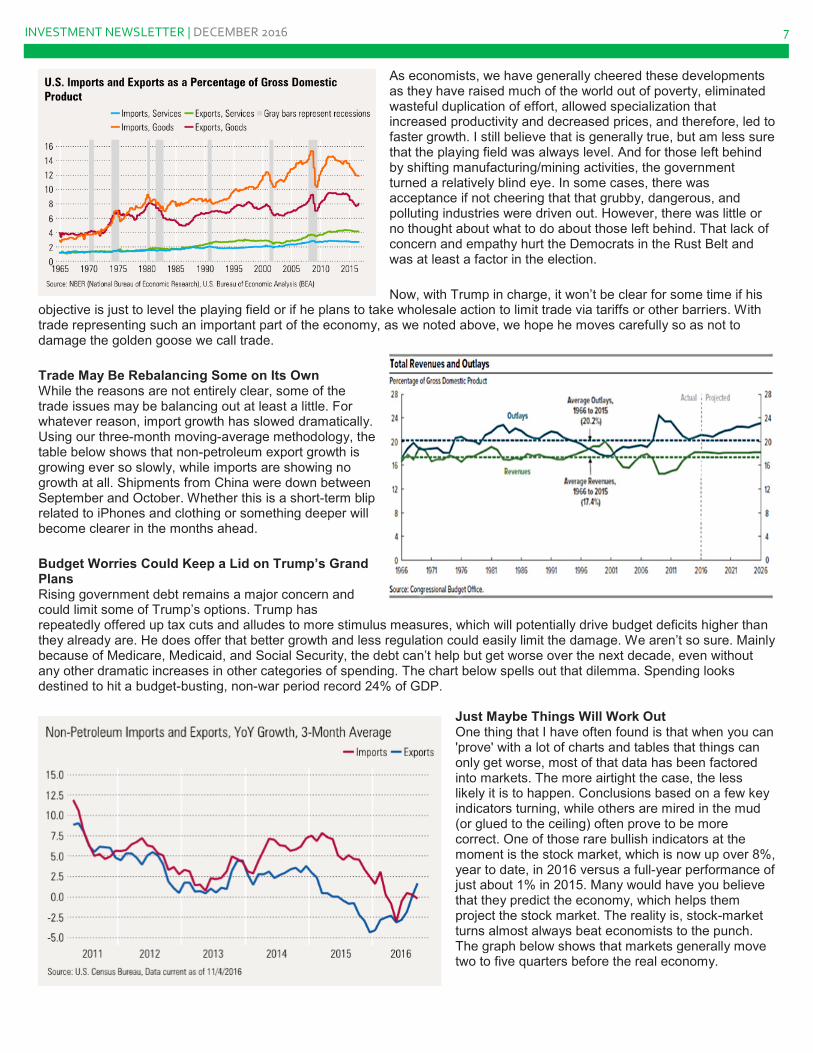
Trade Remains an Important Part of the Economy; Solutions Are Less Than Clear A lot of discussion about world economic growth and numerous elections and referendums have centered on trade. Even in the relatively insular U.S., exports still comprise 12% of GDP, and that number is way up from the 5% level of 50 years ago. However, imports, with a relatively large open door in the U.S., are an even larger 20%, and also have grown.
INVESTMENT NEWSLETTER | DECEMBER 2016 7
As economists, we have generally cheered these developments as they have raised much of the world out of poverty, eliminated wasteful duplication of effort, allowed specialization that increased productivity and decreased prices, and therefore, led to faster growth. I still believe that is generally true, but am less sure that the playing field was always level. And for those left behind by shifting manufacturing/mining activities, the government turned a relatively blind eye. In some cases, there was acceptance if not cheering that that grubby, dangerous, and polluting industries were driven out. However, there was little or no thought about what to do about those left behind. That lack of concern and empathy hurt the Democrats in the Rust Belt and was at least a factor in the election.
Now, with Trump in charge, it won’t be clear for some time if his objective is just to level the playing field or if he plans to take wholesale action to limit trade via tariffs or other barriers. With trade representing such an important part of the economy, as we noted above, we hope he moves carefully so as not to damage the golden goose we call trade.
Trade May Be Rebalancing Some on Its Own While the reasons are not entirely clear, some of the trade issues may be balancing out at least a little. For whatever reason, import growth has slowed dramatically. Using our three-month moving-average methodology, the table below shows that non-petroleum export growth is growing ever so slowly, while imports are showing no growth at all. Shipments from China were down between September and October. Whether this is a short-term blip related to iPhones and clothing or something deeper will become clearer in the months ahead.
Budget Worries Could Keep a Lid on Trump’s Grand Plans Rising government debt remains a major concern and could limit some of Trump’s options. Trump has repeatedly offered up tax cuts and alludes to more stimulus measures, which will potentially drive budget deficits higher than they already are. He does offer that better growth and less regulation could easily limit the damage. We aren’t so sure. Mainly because of Medicare, Medicaid, and Social Security, the debt can’t help but get worse over the next decade, even without any other dramatic increases in other categories of spending. The chart below spells out that dilemma. Spending looks destined to hit a budget-busting, non-war period record 24% of GDP.
Just Maybe Things Will Work Out One thing that I have often found is that when you can 'prove' with a lot of charts and tables that things can only get worse, most of that data has been factored into markets. The more airtight the case, the less likely it is to happen. Conclusions based on a few key indicators turning, while others are mired in the mud (or glued to the ceiling) often prove to be more correct. One of those rare bullish indicators at the moment is the stock market, which is now up over 8%, year to date, in 2016 versus a full-year performance of just about 1% in 2015. Many would have you believe that they predict the economy, which helps them project the stock market. The reality is, stock-market turns almost always beat economists to the punch. The graph below shows that markets generally move two to five quarters before the real economy.

INVESTMENT NEWSLETTER | DECEMBER 2016 8
The value of the chart is not in making exact forecasts. With largely variable lead times, hard to identify tops (at least at the time of the top), and rolling average lead times, this methodology isn't very helpful. Still, it does say that stocks almost always identify even relatively small economic turns before they happen.
And as many have pointed out, you can never underestimate the resourcefulness and flexibility of U.S. workers. That certainly proved to be the case in 2009 as many workers dramatically shifted career paths while workers in other developed markets dug in their heels in current professions.
Though Trump is no Ronald Reagan, we note that after a few years of pain, the last time we had movie star/TV personality win the White
House on a platform of tax cuts, unfunded spending requests, and less regulation, the economy managed to fare pretty well, in what some view as the good old days of the 1980s. We note the contrast between the two is strong and wouldn't use the trajectory of one to project the other. But it does say the unexpected can and does happen.
As every forecaster was reminded this week, the world is a set of probabilities, and things besides the expected case can happen. That is why we have offered up both of our worries, which are the very real and likely case, and the more bullish case.
Disclosure
Investment Update is published monthly by OBS Financial. All articles provided by Morningstar Advisors, Dimensional Fund Advisors, or OBS Financial. Source: Dimensional Fund Advisors LP. All expressions of opinion are subject to change. This information is intended for educational purposes, and it is not to be construed as an offer, solicitation, recommendation, or endorsement of any particular security, products, or services. Diversification does not eliminate the risk of market loss. Investment risks include loss of principal and fluctuating value. There is no guarantee an investing strategy will be successful. Past performance is not a guarantee of future results. Indices are not available for direct investment; therefore, their performance does not reflect the expenses associated with the management of an actual portfolio. The S&P data is provided by Standard & Poor’s Index Services Group. Information has been obtained from sources believed to be reliable, but its accuracy and completeness, and the opinions based thereon, are not guaranteed and no responsibility is assumed for errors and omissions. Nothing in this publication should be deemed as individual investment advice. Consult your personal financial adviser and investment prospectus before making an investment decision. Any performance data published herein are not predictive of future performance. Investors should always be aware that past performance has not been shown to predict the future. If in doubt about the tax or legal consequences of an investment decision it is best to consult a qualified expert. OBS Financial is a Registered Investment Advisor with the Securities and Exchange Commission.