december 2012 - bcdcog
TRANSCRIPT

DECEMBER 2012

{this page intentionally left blank}

p // i
Letter from the Chairman
From its inception, OurRegion OurPlan has been about gathering public input and ideas on how we can live and grow together as a region. We have assessed the growth and development options before us and we have talked about what we want for the region and how we can achieve it. After countless hours of collaboration between the BCDCOG, various jurisdictions, agencies, organizations and involved citizen groups – the much anticipated OurRegion OurPlan (OROP) is here.
Over the course of the plan’s development, we have met with hundreds of residents at public meetings across the region and received input and feedback from hundreds more via surveys and direct conversations. What we have learned from talking to our residents is that we all have the same goals: we want our region to prosper and grow, we want to do it in a way that preserves our way of life and our environment, and we know the importance of collaboration in overcoming the challenges our region faces.
OurRegion OurPlan is the blueprint the Lowcountry needs to achieve these goals. It provides a broad context in which local and regional decisions can be made to foster a healthy environment, a vibrant economy, and a high quality of life for all residents. In doing so, OROP balances our region’s needs for infrastructure, economic growth and development with our desire for preservation and conservation. The end result will be a sustainable future — one with more choices and opportunities for all residents.
OurRegion OurPlan takes a comprehensive view of the region, looking beyond jurisdictional borders to consider growth and development issues and opportunities more holistically. Its core recommendations focus on integrating land use choices with the demand for transportation infrastructure to promote
Thank you!
a better quality of life for the region’s citizens. The plan also recognizes the BCD region’s strong tradition of placemaking and urban design; the need for a diverse economic base; the importance of collaboration among various agencies and organizations; and the opportunities that can be created through public-private partnerships.
Crafting this Vision Plan was a chellenging, but rewarding task and I want to thank all the individuals, organizations, agencies, and leaders who participated in the process. Your perspective, involvement and input have not only enriched the plan, but have also inspired the region. But our task is not over yet – the journey has just begun. With OurRegion OurPlan we have defined our shared regional vision, now is the time to turn our efforts towards making this vision a reality.
LARRY HARGETTOurRegion OurPlan Committee Chair
p // ii
Acknowledgements
Mr. Larry Hargett, Committee Chair Dorchester County Council
Mr. Dan Davis, Supervisor Berkeley County
Mr. Philip Farley Berkeley County Council
Mr. Caldwell Pinckney Berkeley County Council
Mayor Michael Heitzler City of Goose Creek
Ms. Elaine Morgan Berkeley Chamber of Commerce
Mayor Keith Summey City of North Charleston
Mayor Billy Swails Town of Mt. Pleasant
Mayor Joseph Riley City of Charleston
TRI-COUNTY RESIDENTS AND STAKEHOLDERS
REGIONAL LAND USE PLAN COMMITTEE (RLUPC) FOR OURREGION OURPLAN
Mayor Opal Baldwin Town of Ravenel
Mr. Kurt Taylor Charleston County Admin.
Ms. Mary Miller NCSD
Mr. Tom Hund Making Places LLC
Rev. Robert Reid Charleston County
Mr. Aaron Brown Summerville Town Council
Mr. David Ginn Charleston Regional Development
Mr. George Freeman Citizen
Ms. Mary Graham Charleston Metro Chamber
Ms. Megan Desrosiers Coastal Conservation League
Mr. Jason Ward Dorchester County Admin.
Mr. Thom Penney LS3P Associates LTD
Mr. George McDaniel Drayton Hall
Mr. Mac Baughman Mead West Vaco
Ms. Rita Berry GS/DC Chamber of Commerce
Mr. Michael Allen National Park Service
Mr. Ron Brinson Citizen

Mr. Daniel Ben-Yisrael City of Goose Creek
Mr. Eric Greenway Berkeley County Planning
Mr. Steve Warner Charleston Regional Development Alliance
Mr. Johnny Cribb City of Hanahan
Mr. Colin Martin Berkeley County Water & Sanitation
Mr. Michael Maher Charleston Civic Design Center
Mr. Dan Pennick Charleston County Planning
Mr. Bill Gore City of North Charleston Planning
Mr. Christopher Morgan City of Charleston Planning
REGIONAL LAND USE TECHNICAL COMMITTEE (RLUTC) FOR OURREGION OURPLAN
Ms. Christiane Farrell Town of Mt. Pleasant Planning
Mr. John Sands G&D Donnelly Foundation
Mr. Steve Dykes Charleston County Economic Development
Mr. Harmon Shade Citizen
Mr. Clay Duffie Mt. Pleaseant Waterworks
Mr. Kendall Johnson NCSD
Mr. Andy Fairey Charleston Water System
Ms. Madelyn Robinson Town of Summerville Planning
Mr. Alec Brebner Dorchester County Planning
Ms. Kristin Champagne Dorchester County Public Works
Mr. Charlie Cuzzell Summervile CPW
Mr. Jake Libaire Coastal Conservation League
Ms. Michelle Mapp Lowcountry Housing Trust
Ms. Paige King uLI South Carolina
Ms. Elizabeth Von Kolnitz SCDHEC-OCRM
Mr. Jon Baggett Dorchester County Economic Development
Ms. Emily Pack Drayton Hall
p // iii
Acknowledgements
p // iv
Acknowledgements
Mr. Doug Frate SCDOT Deputy Secretary
Mr. Mark Nesbit, PE SCDOT District Traffic
Mr. Ryan Castle Charleston Trident Association of Realtors (CTAR)
NOVEMBER 2011 EXPERT PANEL PARTICIPANTS
Ms. Amy Kovach Berkeley County School District
Mr. Charlie Smith Charleston County Planning Commission
Ms. Megan Desrosiers Coastal Conservation League
Mr. Clay Duffie Mt. Pleasant Waterworks
Mr. Tom Hund Making Places LLC
Mr. Christopher Morgan CIty of Charleston Planning
Mr. Ron Mitchum Executive Director
BERKELEY CHARLESTON DORCHESTER COUNCIL OF GOVERNMENT STAFF
HNTB Corporation
Gateway Planning
Ron Thomas
CONSULTANT TEAM
Civic Communications, Inc.
Kimley-Horn & Associates, Inc.
America Speaks
Peter Katz
Donal Simpson

p // v
Preface
T he Berkeley-Charleston-Dorchester Council of Governments (BCDCOG) has taken up the challenge of creating a Vision Plan to provide
a framework for future growth, development and infrastructure improvements in the Berkeley-Charleston-Dorchester (BCD) region. Developed through a scenario planning process, this vision evolved from public input received through community workshops and public forums and is aptly called OurRegion OurPlan (OROP). OROP is not a one-size-fits-all regional vision. It accepts and celebrates the differences among various jurisdictions and stakeholders while also providing solutions to some of the common problems we are all facing. As the region grows and our communities contemplate investments, OROP will serve as a reference for the future we most want for ourselves, our families, our businesses and our communities.
By the year 2040, the tri-county region is expected to grow by at least 200,000 residents. This is equal to adding another City of Charleston and Mount Pleasant to the region. In addition to economic progress, there are also impacts associated with growth. In the BCD region, past growth has resulted in development patterns that caused land to be consumed at a far higher
rate than the growth of the region’s population. New subdivisions, office parks and retail centers continue to be built far from the centers of our communities, which have lead not only to the loss of farmland and open space, but also increased the stress on our natural environment, contributed to congestion, and limited our transportation choices. In turn, this has strained the capacity of our infrastructure and stretched our ability to provide the services that drive our region’s economic growth.
Additionally, the roads, open space, parks, schools, and resources that enhance our quality of life are generally regional amenities that serve multiple communities and cross jurisdictional boundaries. To continue providing and maintaining these in an effective and efficient manner requires regional cooperation and collaboration on the part of local governments. Citizens of the region have consistently stated that collaboration of this kind is critical for the success of our region.
They have also regularly cited the importance of the region’s natural beauty, historic identity, and livable communities. As we accommodate growth, maintaining these resources and our region’s quality of life will be key to our ongoing
competitiveness and prosperity. The good news is that continued growth need not further diminish these enviable resources or our quality of life. But avoiding negative consequences requires that we approach regional issues with regional solutions by planning thoughtfully and on a scale larger than individual towns and cities. Reports from other regions show that incorporating best practices into regional growth and development can actually heal problems resulting from earlier, poorly planned growth, even as we accommodate greater numbers of people. The process is not easy, but success is achievable if we proceed with a blueprint and a clear vision of the future that is informed by our shared values and interests.
OurRegion OurPlan is the launching pad for a bold new vision for the region. It sets a high bar for development that embodies what we most value and reflects the unique character and traditions of our region. Realizing the vision and implementing this plan will require tough decisions, but it should be viewed as an opportunity shared by both public sector agencies and private sector interests. Together, partnerships between these entities provide both the investment capacity to grow the region and the political will to achieve our vision.

{this page intentionally left blank}

p // vii
Contents
About the BCDCOG ...................................................................... viiCOMMUNITY DEVELOPMENT ........................................................................ VII
ECONOMIC DEVELOPMENT .......................................................................... VII
ENVIRONMENTAL PLANNING ...................................................................... VIII
LAND USE PLANNING ................................................................................... VIII
MAPPING ....................................................................................................... VIII
RESEARCH ....................................................................................................... IX
TRANSPORTATION PLANNING ....................................................................... IX
Plan Summary...................................................................................xiCHALLENGES ................................................................................................XIV
REALIZING THE VISION ................................................................................ XVII
PLAN SUMMARY FIGURES
Figure PS-1 (photo) ................................................................................................................ xiii
Figure PS-2 (photo) ................................................................................................................. xv
Figure PS-3 (photo) ................................................................................................................ xvi
Figure PS-4 (photo) ............................................................................................................... xvii
Figure PS-5 (photo) .............................................................................................................. xviii
OurRegion OurPlan: A Vision of the Lowcountry in 2040 ....... V-1THE GOALS ................................................................................................... V-1
» Growth, Development and Placemaking ..................................................................V-1
» Natural Environment ...................................................................................................V-2
» Mobility ..........................................................................................................................V-2
» Economy ........................................................................................................................V-2
» Regional Leadership .....................................................................................................V-2
» Partnership and Finance..............................................................................................V-2
THE VISION PLAN ......................................................................................... V-2
» Vision Plan Features .....................................................................................................V-5
» Centers ...........................................................................................................................V-5
» Corridors ........................................................................................................................V-8
» Green Infrastructure ................................................................................................. V-10
» Regional Land Uses ................................................................................................... V-12
A VISION OF THE LOWCOUNTRY IN 2040 FIGURES
Figure V-1 (photo) .................................................................................................................................V-2
Figure V-2 (photo).................................................................................................................. V-3
Figure V-3: The Vision Plan .................................................................................................. V-4
Figure V-4 (photo) .....................................................................................................................V-5
Figure V-5 (photo) .................................................................................................................. V-6
Figure V-6: Centers Types in the Vision Plan ....................................................................... V-6
Figure V-7: The Vision Plan’s Place Types and Centers ....................................................... V-7
Figure V-8 (photo).................................................................................................................. V-8
Figure V-9 (photo).................................................................................................................. V-8
Figure V-10: The Vision Plan’s Corridors ............................................................................. V-9
Figure V-11 (photo) .............................................................................................................. V-10
Figure V-12 The Vision Plan’s Green Infrastructure ......................................................... 0-11
Figure V-13 (photo) .............................................................................................................. 0-12
CONTENTS
p // viii
Figure V-14: The Vision Plan Land Uses ............................................................................ V-12
Figure V-15: The Vision Plan’s Land Use Map ................................................................... V-13
Plan Element 1: Growth, Development and Placemaking ........ 1-1ISSUES AND OPPORTUNITIES ....................................................................... 1-1
» Growth and Development in the BCD Region .........................................................1-2
» The Balance between Land Use and Transportation ..............................................1-7
» Placemaking and its Role in the BCD Region ...........................................................1-7
» A Nexus to Quality of Life ...........................................................................................1-8
» Historical Role in the BCD Region ..............................................................................1-8
» Urban Form ...................................................................................................................1-9
GUIDING PRINCIPLES ................................................................................... 1-9
GROWTH, DEVELOPMENT AND PLACEMAKING FRAMEWORK .................. 1-9
» The Goals .......................................................................................................................1-9
» The Path to Implementation: Objectives, Strategies and Indicators ..................1-10
PLAN ELEMENT 1 FIGURES
Figure 1-1 (photo) .................................................................................................................. 1-1
Figure 1-2: Forecasted Population Growth ......................................................................... 1-2
Figure 1-3: Percent Increase in Housing and Population, 2000-’10 .................................. 1-2
Figure 1-4: Vacancy Rates of Housing Units, 2000-’10 ...................................................... 1-3
Figure 1-5: Percent Increase in Median Household Income and Median Home Value, 2000-’2010 .................................................................................. 1-4
Figure 1-6: Percent Increase/Decrease in Share of Individuals Living Below the Poverty Level, 2000-’10 ............................................................................. 1-5
Figure 1-7: CNT’s H+T Affordability Index Methodology .................................................. 1-5
Figure 1-8: Affordability of Housing using the Traditional Model and Affordability of Housing using CNT’s H+T Index ...................................................... 1-6
Figure 1-9 (photo) .................................................................................................................. 1-7
Figure 1-10 (photo) ................................................................................................................ 1-8
Figure 1-11 (photo) ................................................................................................................ 1-8
Figure 1-12 (photo) ................................................................................................................ 1-9
Plan Element 2: Natural Environment ...................................... 2-1ISSUES AND OPPORTUNITIES ....................................................................... 2-2
» Preserving the Unique Environmental Context of the BCD Region ......................2-2
» Biodiversity ...................................................................................................................2-6
» Coastal Hazards and Regional Vulnerabilities .........................................................2-7
» Development Impacts on the Environment ...........................................................2-10
GUIDING PRINCIPLES ................................................................................. 2-11
NATURAL ENVIRONMENT FRAMEWORK ................................................... 2-11
» Goals .............................................................................................................................2-11
» The Path to Implementation: Objectives, Policies, Strategies and Indicators .....2-12
PLAN ELEMENT 2 FIGURES
Figure 2-1 (photo) .................................................................................................................. 2-1
Figure 2-2 (photo) .................................................................................................................. 2-1
Figure 2-3 (photo) .................................................................................................................. 2-1
Figure 2-4 (photo) .................................................................................................................. 2-2
Figure 2-5 (photo) .................................................................................................................. 2-3
Figure 2-6: Lowcountry Environmental Resources ............................................................. 2-4
Figure 2-7 (photo) .................................................................................................................. 2-5
CONTENTS
p // ix
Figure 2-8 (photo) .................................................................................................................. 2-6
Figure 2-9 (photo) .................................................................................................................. 2-7
Figure 2-10: The BCD Region’s Green Infrastructure .......................................................... 2-8
Figure 2-11 (photo) ................................................................................................................. 2-9
Figure 2-12 (photo) ............................................................................................................................2-9
Plan Element 3: Mobility and Transportation Infrastructure ... 3-1ISSUES AND OPPORTUNITIES ...................................................................... 3-1
» Planning for Transportation Infrastructure Concurrency ......................................3-1
» A Call for Multimodal Systems ...................................................................................3-4
» The Role of the LRTP ....................................................................................................3-6
GUIDING PRINCIPLES .................................................................................... 3-7
MOBILITY AND TRANSPORTATION INFRASTRUCTURE FRAMEWORK ......... 3-8
» The Goals .......................................................................................................................3-8
» The Path to Implementation: Objectives, Policies, Strategies and Indicators .....3-8
PLAN ELEMENT 3 FIGURES
Figure 3-1 (photo) .................................................................................................................. 3-1
Figure 3-2 (photo) .................................................................................................................. 3-2
Figure 3-3 (photo) .................................................................................................................. 3-2
Figure 3-4 (photo) .................................................................................................................. 3-3
Figure 3-5 (photo) .................................................................................................................. 3-3
Figure 3-6: Multimodal System Technologies ...................................................................... 3-5
Figure 3-7 (photo) .................................................................................................................. 3-6
Figure 3-8: East Coast Greenway® Trail System ................................................................. 3-7
Figure 3-9 (photo) .................................................................................................................. 3-8
Plan Element 4: Economy ........................................................... 4-1ISSUES AND OPPORTUNITIES ....................................................................... 4-2
» Economic Competitiveness ........................................................................................4-3
» Workforce Capabilities and Readiness ......................................................................4-6
GUIDING PRINCIPLES ................................................................................... 4-9
ECONOMY FRAMEWORK ............................................................................. 4-9
» The Goals .......................................................................................................................4-9
» The Path to Implementation: Objectives, Policies, Strategies and Indicators .....4-10
PLAN ELEMENT 4 FIGURES
Figure 4-1 (photo) .................................................................................................................. 4-1
Figure 4-2 (photo) .................................................................................................................. 4-1
Figure 4-3 (photo) .................................................................................................................. 4-2
Figure 4-4 (photo) .................................................................................................................. 4-2
Figure 4-5 (photo) .................................................................................................................. 4-3
Figure 4-6 (photo) .................................................................................................................. 4-3
Figure 4-7 (photo) .................................................................................................................. 4-5
Figure 4-8 (photo) .................................................................................................................. 4-5
Figure 4-9: Five Largest Regional Employers ...................................................................... 4-6
Figure 4-10 (photo) ................................................................................................................ 4-7
Figure 4-11 (photo) ................................................................................................................ 4-7
Figure 4-12 (photo) ................................................................................................................ 4-8
Figure 4-13 (photo) ................................................................................................................ 4-8
Plan Element 5: Regional Leadership and Stewardship .......... 5-1ISSUES AND OPPORTUNITIES ....................................................................... 5-2

CONTENTS
p // x
» The Need for Intergovernmental Agreement and Collaboration ....................... 5-2
» Stewarding the Implementation of OROP ............................................................. 5-4
» Aligning Local Plans and Regulations with OROP ................................................ 5-6
GUIDING PRINCIPLES ................................................................................... 5-7
» Goals ...............................................................................................................................5-7
» The Path to Implementation: Objectives, Policies, Strategies and Indicators .......5-7
PLAN ELEMENT 5 FIGURES
Figure 5-1 (photo) .................................................................................................................. 5-2
Figure 5-2 (photo) .................................................................................................................. 5-4
Figure 5-3 (photo) .................................................................................................................. 5-5
Figure 5-4 Regional Green Infrastructure Assets ................................................................ 5-6
Figure 5-5 Protected Lands in the Lowcountry of South Carolina (2011) ......................... 5-7
Plan Element 6: Partnership and Finance ................................. 6-1ISSUES AND OPPORTUNITIES ....................................................................... 6-1
» Municipal Coordination ...............................................................................................6-1
» Governance Based on Shared Responsibilities and Coordination ........................6-3
» Public/Private Cooperation .........................................................................................6-3
» Aligning Transportation Facilities with Appropriate Development to Achieve Sustainable Places .....................................................................................6-5
» Coordinating Planning and Zoning Tools .................................................................6-6
» Funding ..........................................................................................................................6-6
» Value Capture ................................................................................................................6-7
» Tax-Increment Financing (TIF) ....................................................................................6-7
GUIDING PRINCIPLES ................................................................................. 6-10
PARTNERSHIP AND FINANCE FRAMEWORK .............................................. 6-10
» The Goals .....................................................................................................................6-10
» The Path to Implementation: Objectives, Policies, Strategies and Indicators .....6-10
PLAN ELEMENT 6 FIGURES
Figure 6-1: Town of Summerville Priority Investment Areas ............................................. 6-1
Figure 6-2: Circulation Framework Plan – Neck Master Plan ............................................ 6-2
Figure 6-3: Complete Street ................................................................................................... 6-4
Figure 6-4: Components of an Urban Thoroughfare .......................................................... 6-5
Figure 6-5: East Edisto Tract ................................................................................................. 6-5
Figure 6-6: Value Capture Mechanism ................................................................................. 6-7
Figure 6-7: Impact Fees Levied by Local Jurisdictions in the BCD Region ......................... 6-9
Epilogue ........................................................................................Ep-1
Appendix A: The Process of Creating the Vision Plan ........App-1PLAN DEVELOPMENT ...............................................................................APP-1
» Project Kickoff .........................................................................................................App-1
» Cluster Workshops ..................................................................................................App-1
» Scenario Development and Performance Evaluation .........................................App-3 » Scenario Development ................................................................................................App-4 » Scenario Performance Evaluation..............................................................................App-9

CONTENTS
p // xi
» The Regional Forum ................................................................................................App-9
» Expert Panel Review..............................................................................................App-11
» Establishing the Vision Plan ................................................................................App-12 » Vision Plan Performance and Evaluation .............................................................. App-12
COMMUNITY INVOLVEMENT ..................................................................APP-12
» OurRegion OurPlan Leadership Committees .....................................................App-14 » Regional Land Use Planning Committee ............................................................... App-14
» Regional Land Use Technical Committee ............................................................... App-14
» Public Outreach Tools and Efforts .......................................................................App-14 » Traditional Media ..................................................................................................... App-14
» Direct Mail ................................................................................................................ App-15
» Social Media .............................................................................................................. App-15
» Presentations at Area Meetings .............................................................................. App-15
» Person to Person Outreach ...................................................................................... App-16
APPENDIX A FIGURES
Figure A-1 (photo) .............................................................................................................App-2
Figure A-2 (photo) .............................................................................................................App-2
Figure A-3: Regional Place Type Palette ...........................................................................App-3
Figure A-4: Trends Scenario Drivers .................................................................................App-4
Figure A-5: Trends Scenario Map .....................................................................................App-5
Figure A-6: Plans Scenario Drivers ...................................................................................App-6
Figure A-7: Citizens' Scenario Drivers ..............................................................................App-6
Figure A-8: Plans Scenario Map .......................................................................................App-7
Figure A-9: Citizens’ Scenario Map ..................................................................................App-8
Figure A-12: Green Infrastructure Scenario Drivers .......................................................App-9
Figure A-11: Green Infrastructure Scenario Map ..........................................................App-10
Figure A-12 (photo) .........................................................................................................App-11
Figure A-13: Measures of Effectiveness for the Four Scenarios and the Vision Plan ..App-13

CONTENTS
p // xii
List of Maps, Tables and Data Figures
A VISION OF THE LOWCOUNTRY IN 2040
Figure 0-3: The Vision Plan .......................................................................................... 0-4
Figure 0-6: Centers Types in the Vision Plan .............................................................. 0-6
Figure 0-7: The Vision Plan’s Place Types and Centers .............................................. 0-7
Figure 0-10: The Vision Plan’s Corridors .................................................................... 0-9
Figure 0-13: The Vision Plan’s Green Infrastructure ................................................ 0-11
Figure 0-14: The Vision Plan Land Uses .................................................................... 0-12
Figure 0-15: The Vision Plan’s Land Use Map .......................................................... 0-13
PLAN ELEMENT 1
Figure 1-2: Forecasted Population Growth ................................................................ 1-2
Figure 1-3: Percent Increase in Housing and Population, 2000-’10 ......................... 1-2
Figure 1-4: Vacancy Rates of Housing Units, 2000-’10 ............................................. 1-3
Figure 1-5: Percent Increase in Median Household Income and Median Home Value, 2000-’2010 ......................................................................... 1-4
Figure 1-6: Percent Increase/Decrease in Share of Individuals Living Below the Poverty Level, 2000-’10 ................................................................... 1-5
Figure 1-7: CNT’s H+T Affordability Index Methodology ........................................ 1-5
Figure 1-8: Affordability of Housing using the Traditional Model and Affordability of Housing using CNT’s H+T Index ............................................ 1-6
PLAN ELEMENT 3
Figure 3-6: Multimodal System Technologies ............................................................ 3-5
Figure 3-8: East Coast Greenway® Trail System ........................................................ 3-7
PLAN ELEMENT 6
Figure 6-1: Town of Summerville Priority Investment Areas .................................... 6-1
Figure 6-2: Circulation Framework Plan – Neck Master Plan .................................. 6-2
Figure 6-3: Components of an Urban Thoroughfare ................................................. 6-5
Figure 6-4: East Edisto Tract ....................................................................................... 6-5
Figure 6-5: Value Capture Mechanism ....................................................................... 6-7
Figure 6-6: Impact Fees Levied by Local Jurisdictions in the BCD Region ................ 6-8
APPENDIX A
Figure A-3: Regional Place Type Palette ..................................................................App-3
Figure A-4: Trends Scenario Drivers ........................................................................App-4
Figure A-5: Trends Scenario Map ............................................................................App-5
Figure A-6: Plans Scenario Drivers ..........................................................................App-6
Figure A-7: Citizens' Scenario Drivers .....................................................................App-6
Figure A-8: Plans Scenario Map ..............................................................................App-7
Figure A-9: Citizens’ Scenario Map .........................................................................App-8
Figure A-12: Green Infrastructure Scenario Drivers ..............................................App-9
Figure A-11: Green Infrastructure Scenario Map .................................................App-10
Figure A-13: Measures of Effectiveness for the Four Scenarios and the Vision Plan ...............................................................................................App-13

p // xiii
About the BCDCOG
As one of South Carolina’s 10 Regional Planning Councils and the designated Metropolitan Planning Organization (MPO) for the region, the Berkeley-Charleston-Dorchester Council of Governments (BCDCOG or “the COG”) focuses on issues of shared regional interest. It is a voluntary association of, by and for local governments to assist in planning for common needs, cooperating for mutual benefit, and coordinating for sound regional development. As the MPO for the region, it is certified by state and federal agencies to create transportation plans for the region and distribute funds to implement various projects called for in those plans.
BCDCOG’s purpose is to strengthen both the individual and collective power of local governments and to help them recognize regional opportunities, eliminate unnecessary duplication, and make joint decisions.
The agency’s roots go back to 1968, when local governments in Berkeley and Charleston counties first created a Regional Planning Commission. Three years later, Dorchester County elected to join the group and in 1976 it was renamed the Berkeley-Charleston-Dorchester Council of Governments. Today, BCDCOG represents 30 member governments, is led by a 13-member Executive Committee and is governed by a 57-member board, all of whom are appointed by the member governments. The board
sets policy and provides direction to the programs of the BCDCOG, which are centered on several service areas including Community and Economic Development, Environmental, Land Use, and Transportation Planning, Mapping and Research assistance.
» Community Development
Since 1990, the BCDCOG’s Community Development Department has administered grants totaling more than $20 million dollars. These funds have gone toward a variety of projects in all three counties, directly helping approximately 10,000 low-to-moderate income (LMI) residents.
While housing rehabilitation, community center development, and capital loans are key parts of the Community Development Block Grant Program, water and sewer improvements are the prevalent projects in the BCD region. More than $12 million in CDBG funds have gone through the BCDCOG during the last decade to improve the
region’s water and sewer infrastructure. These projects enhance the lives of residents and enable the creation and expansion of businesses, thereby improving the region’s job market, health status, and standard of living.
» Economic Development
The COG’s Economic Development Department is an integral part of the BCD Region’s fiscal revitalization. It has taken part in many of the region’s most high-profile economic ventures and is the clearinghouse for Economic Development Administration programs. With projects ranging from equipment financing to asbestos removal, the BCDCOG’s economic development department can be credited with the creation or retention of thousands of jobs. The BCDCOG has a federally initiated, but locally administered, Revolving Loan Fund (RLF) program that assists small businesses that will create or retain local jobs. The RLF has loaned out a total of $6.3 million to over 50 businesses throughout the BCD region. Through the workforce development program it administers, including SC Works Trident and SC Works, the COG helps prepare the region’s residents for these jobs. Some of the area’s most recent beneficiaries of the department’s efforts are the Charleston Naval Base, Trident Technical College, and the Charleston Area Convention Center Complex.

ABOUT THE BCDCOG
p // xiv
» Environmental Planning
The BCDCOG is actively engaged in planning for air and water quality issues in the BCD region. While the region is in attainment (i.e. compliance) with air quality standards in the Clean Air Act, the BCDCOG is taking the lead on the region’s participation in a statewide partnership to develop an Early Action Plan to proactively address air quality issues. The COG is also charged with water quality planning, integrating federal, state, and local interests, and carrying out the goals of Section 208 of the 1977 Federal Water Pollution Control Act, known as the Clean Water Act. Integrating these interests and charges is achieved through the preparation of the 208 Water Quality Management Plan and the review of all permit applications concerning wastewater treatment to assure conformance with the plan.
» Land Use Planning
One of the fastest growing roles of the BCDCOG is urban planning. Under the 1994 South Carolina Local Government Comprehensive Planning Enabling Act, all counties and municipalities were required to have comprehensive plans in place by May 4, 1999. These plans address nine distinct community elements – population, economics, natural resources, cultural resources, community facilities, housing, transportation, land use and priority investment areas – and are aimed at managing future growth and preserving community identity. Since the original legislation was enacted, the BCDCOG has completed several comprehensive plans for local governments and is now facilitating or completing updates for several more. OurRegion OurPlan is developing a broader regional context for these local planning efforts with targeted strategies for guiding growth and development in a way that will benefit the entire region and be relevant to the region’s communities.
BCDCOG Member Governments
• Town of Harleyville• Town of Reevesville• Town of Ridgeville
• Town of St. George• Town of Summerville• Town of Mt. Pleasant
DORCHESTER COUNTY
• Town of Awendaw• City of Charleston• City of Folly Beach• Town of Hollywood• Town of Meggett• Town of Ravenel• City of Isle of Palms• Town of James Island
• Town of Kiawah Island• Town of Seabrook Island• Town of Sullivan's Island• Town of Rockville• City of North Charleston• Town of Lincolnville• Town of McClellanville• Town of Mt. Pleasant
CHARLESTON COUNTY
• Town of Bonneau• City of Goose Creek• City of Hanahan
• Town of Jamestown• Town of Moncks Corner• Town of St. Stephen
BERKELEY COUNTY

ABOUT THE BCDCOG
p // xv
» Mapping
The BCDCOG provides a variety of digital mapping and geospatial data services for member governments and the general public. With Geographic Information Systems (GIS), geospatial data and analysis, BCDCOG facilitates informed decision-making and supports regional transportation, as well as environmental and land-use planning initiatives. In addition, the Planning Services department continues to provide technical services using GIS, such as zoning and parcel mapping, for a number of the smaller municipalities within the region.
» Research
The COG maintains an extensive demographic and economic database for the region and gathers, maintains, analyzes, updates and distributes a variety of other information in a number of formats. These resources are made available to local governments and the private sector to support their decision-making and planning efforts. BCDCOG staff also fields data requests and provides assistance to individuals from the public and private sector and support the data needs of OurRegion OurPlan.
» Transportation Planning
As the MPO for the region, the BCDCOG is responsible for ongoing, comprehensive and cooperative transportation planning. The region’s first detailed, comprehensive planning effort for transportation was
conducted between 1965 and 1968 and became the basis for the Charleston Area Transportation Study (CHATS), now overseen by BCDCOG’s CHATS Policy Committee. In cooperation with the South Carolina Department of Transportation (SCDOT), the Federal Highway Administration and the Federal Transit Administration, the CHATS Policy Committee and the COG are responsible for preparing the region’s Long Range Transportation Plan (LRTP) and the short term Transportation Improvement Plan (TIP), as well as providing technical assistance to other regional transportation planning initiatives for both urbanized and rural areas of the region.
These transportation planning efforts and responsibilities extend beyond the planning and design of roadways and bridges to all modes of transportation. Advisory committees oversee issues and initiatives covering a full range of transportation planning topics including freight and intermodal transportation, public transportation, transportation enhancements, bicycle and pedestrian transportation, and congestion management. These planning efforts enable the COG to receive federal transportation funds on behalf of the region and then distribute them according to project prioritization.
Prioritization of investments in the region’s transportation infrastructure is critical to the success of the tri-county region and the OurRegion OurPlan efforts. Key transportation projects that support the plan’s vision, goals and strategies will bolster the economic success of our communities and also provide for more livable and walkable communities and a safe and efficient transportation network.

{this page intentionally left blank}

p // xvii
Plan Summary
OurRegion OurPlan (OROP) is a Vision Plan for the future of the Berkeley-Charleston-Dorchester (BCD) region that is shaped by our residents, stakeholders,
leaders, and various agencies. This plan will guide us over the next 30 years and set the stage
for individual actions that will lead to long-term success. The Vision it paints is of a diverse
Lowcountry with unique communities whose sense of place, history, iconic landscapes and
rich environmental resources are preserved and whose quality of life is strengthened by a
vital economy that is built on emerging, high-growth industries, a multimodal transportation
system, and collaborative leadership. This Vision draws upon placemaking principles, such
as the need for compact, human-scale development. It also builds on a framework of centers,
corridors, and green areas, including waterways and wetlands, which fit well with the
traditional development patterns and natural environment of the Lowcountry.
6 Figure PS-1: Live oak trees, like these along Maybank Highway, are Lowcountry icons and contribute to the unique form and character of our historic region. Source: HNTB.
While the Vision Plan describes the future form and character of the region, OROP is not a physical plan, nor is it a regulatory document that prescribes rules communities must follow. Instead, as a Vision Plan, its purposes are to inspire us to achieve the Vision and Goals developed by Lowcountry residents and shared across our communities and to provide a blueprint for how we can go about shaping growth and development to achieve those Goals.
With a shared Vision and a blueprint to guide our work, we have a common foundation to build upon as we strive to improve our region for ourselves, our children and future generations, our businesses and our natural resources. Developed through a scenario planning process, OROP gives us the confidence and larger frame of reference needed to consider and respond to the issues and challenges we face as a region today and those that will
GREEN AREASOpen spaces, natural resources and agricultural lands
CENTERSCommunities and
activity nodes
CORRIDORSThe connections between
our centers and green areas

PLAN SUMMARY
p // xviii
arise in the future. It also provides us with a path forward via recommended policies, strategies and actions we can take to reach our Goals, grow our region and manage the unintended consequences of growth.
Challenges
While growth is not a new phenomenon in the BCD region, our development patterns have changed over time and so have their impacts. Consider that in just one decade – from 2000 to 2010 – our region’s population grew by 21%. This was more than twice that of the national growth rate (9.7%) and significantly more than the State of South Carolina’s 15.3% growth. And by 2040, our region will add over 200,000 more residents to the region – imagine accommodating the combined population of Charleston and Mount Pleasant into the present-day tri-county region!
These facts reveal some interesting patterns and illustrate some of the challenges before us – the region is growing at an incredibly fast pace and much of this growth is
Unique Character of PlaceDevelopment patterns and conservation should protect and build on the unique character of the BCD Region, including regional architecture and native flora and fauna.
Natural EnvironmentNative landscapes and habitats should be preserved as part of the unique character of the BCD Region. Development should be shaped to protect and conserve the natural environment. There is a strong desire to protect marshes, waterways, and native trees.
Historic PreservationHistoric neighborhoods should be preserved as part of the unique character of the BCD Region.
LandscapingLandscaping is an important amenity for both residential and commercial development.
Variety of PlaceDevelopment patterns should provide a variety of kinds of places for people to live, work, and shop. Urban, small town, and rural habitats are all important in the region. The region needs both areas with a lively mix of uses and quiet residential areas. Both higher and lower density areas are needed.
Public RealmDevelopment patterns should shape a high-quality public realm, with buildings that relate to the street and sidewalk.
Transportation OptionsDevelopment patterns should provide a variety of high quality transportation options, including walking, biking, transit, and auto.
AffordabilityDevelopment patterns should provide attractive, affordable living and shopping options.
Walkable StreetsMost streets should be designed to accommodate pedestrians and bicyclists in a safe and comfortable way. Streets should not be too wide.
Low-Impact ParkingParking should be provided in a way that minimizes its visual impact. Structured parking, on-street parking, and surface parking lots with adequate landscaping are desired. Excessive expanses of pavement should be discouraged.
Human ScaleDevelopment should have a human scale and fit within its context.
Economic DevelopmentDevelopment patterns should provide access to a variety of jobs in the region.
GREAT PLACES PRINCIPLES
BY THE YEAR 2040, THE TRI-COUNTY
REGION WILL GROW BY AT LEAST 200,000 RESIDENTS,
CLIMBING TO A POPULATION OF
NEARLY 874,000 – A 31% INCREASE
OVER THE 2010 POPULATION OF
665,000.
PLAN SUMMARY
p // xix
the face of natural disasters like hurricanes, which can disrupt fuel production and distribution and limit supplies for both businesses and commuters, as was the case with Hurricanes Katrina and Sandy.
Regional mobility is another challenge that we need to address. Our travel patterns have changed dramatically over just the last few decades. From
occurring in our more rural areas, where agricultural land and open space is quickly being developed, pushing growth farther from our historic centers and infrastructure investments.
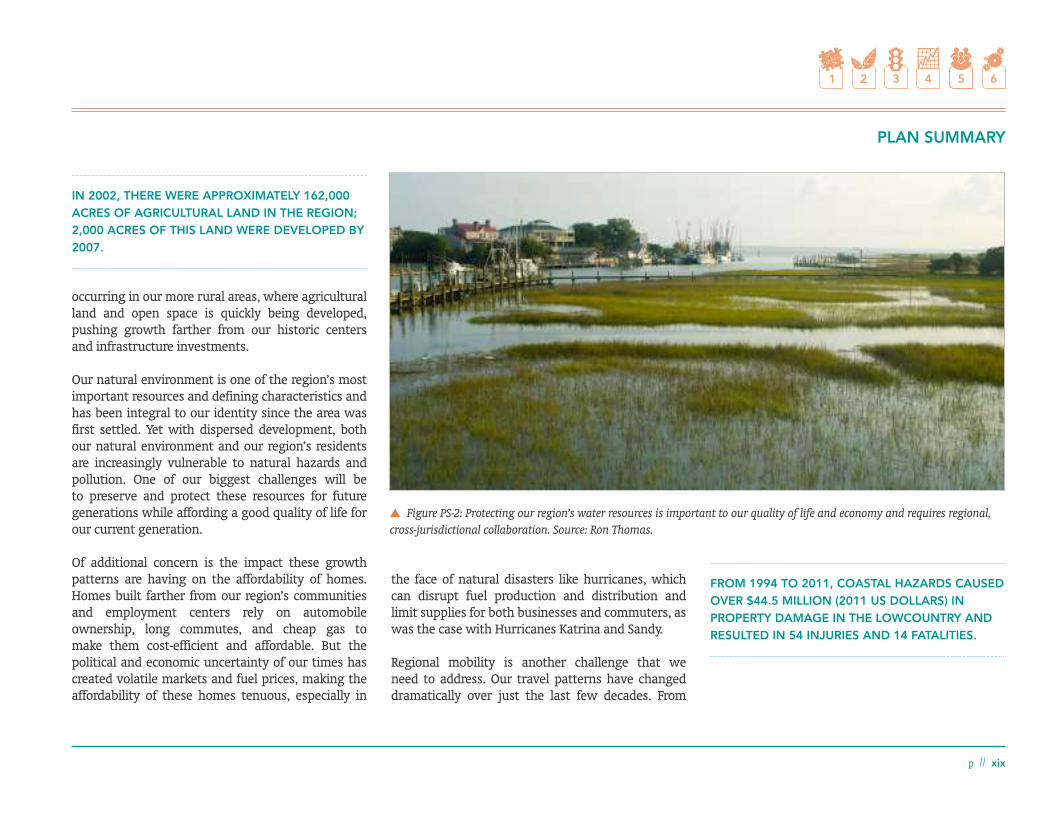
Our natural environment is one of the region’s most important resources and defining characteristics and has been integral to our identity since the area was first settled. Yet with dispersed development, both our natural environment and our region’s residents are increasingly vulnerable to natural hazards and pollution. One of our biggest challenges will be to preserve and protect these resources for future generations while affording a good quality of life for our current generation.
Of additional concern is the impact these growth patterns are having on the affordability of homes. Homes built farther from our region’s communities and employment centers rely on automobile ownership, long commutes, and cheap gas to make them cost-efficient and affordable. But the political and economic uncertainty of our times has created volatile markets and fuel prices, making the affordability of these homes tenuous, especially in
6 Figure PS-2: Protecting our region’s water resources is important to our quality of life and economy and requires regional, cross-jurisdictional collaboration. Source: Ron Thomas.
IN 2002, THERE WERE APPROXIMATELY 162,000 ACRES OF AGRICULTURAL LAND IN THE REGION; 2,000 ACRES OF THIS LAND WERE DEVELOPED BY 2007.
FROM 1994 TO 2011, COASTAL HAZARDS CAUSED OVER $44.5 MILLION (2011 US DOLLARS) IN PROPERTY DAMAGE IN THE LOWCOUNTRY AND RESULTED IN 54 INJURIES AND 14 FATALITIES.

PLAN SUMMARY
p // xx
1990 to 2008, 25% more individuals commuted to work in the Lowcountry, while the share of people commuting alone grew by an even wider margin – 41%. By 2008, 90% of all commuters in the tri-counties were getting to work in private vehicles and less than 5% commuted using other modes of transportation. The impacts of these habits are felt throughout the BCD-region – from Reevesville to Mt. Pleasant and from St. Stephen to Seabrook Island
and beyond. They include increased congestion and vehicle exhaust, resulting in air and water quality degradation, lost productivity and numerous other social and economic costs. When compounded with the growth of the region, rising fuel prices and the need to reduce emissions amidst a backdrop of increasing concerns about climate change, these impacts drive the need for increased transportation efficiency, alternative travel modes, and the increasingly efficient use of fiscal resources – all of which can only be accomplished through regional coordination.
Economically, the Lowcountry’s path towards the future hinges upon coordinated efforts to target,
attract and grow developing industries that will contribute to long-term, sustained economic growth. To be successful in this endeavor, we must build our region’s base of “knowledge workers” – those highly skilled employees who can support sophisticated high-tech industries and professional service firms. We need these workers to provide the intellectual capacity required for innovation and competitiveness in a global marketplace that is constantly changing.
During the OROP development process, many participants voiced lack of agency coordination as their number one concern. Many attributed this deficiency to jurisdictions seeing each other as competitors rather than collaborators. Although healthy competition among jurisdictions is good, and even desirable, it shouldn’t come at the cost of efficiencies and lost opportunities for the region. The creation of this regional plan is testimony to the collaborative approach we can take to address challenges in our region’s future. However, there are many ways that Lowcountry communities can strengthen collaboration and coordination efforts. Building regional collaborations through OROP will help achieve desirable outcomes that align future
growth and development with our values and our vision.
Our current fiscal environment, combined with our region’s needs for infrastructure and growth, require that we be more efficient and strategic in our use of public resources, including identifying and developing innovative approaches to project
IN 1969, THE AVERAGE HOUSEHOLD IN THE REGION MADE 3.83 VEHICLE TRIPS PER DAY. BY 1995, THE AVERAGE HAD INCREASED TO 6.36 TRIPS PER DAY AND BY 2003 IT WAS 7.62 TRIPS PER DAY – NEARLY DOUBLING OVER A 34-YEAR PERIOD.
6 Figure PS-3: The aerospace industry is one of four clusters targeted for growth in the region’s economic development strategy. Source: Flickr – Expert Infrantry.
TO BE ECONOMICALLY COMPETITIVE IN THE GLOBAL MARKETPLACE, THE TRI-COUNTY REGION MUST FOCUS ITS EFFORTS ON GROWING FOUR TARGET CLUSTERS – ADVANCED SECURITY AND IT, AEROSPACE, BIOMEDICAL AND WIND ENERGY –AND INCREASE ITS BASE OF “KNOWLEDGE WORKERS” TO SUPPORT THESE INDUSTRIES.

PLAN SUMMARY
p // xxi
financing and working to establish a tax base that is regenerative and resilient. Value capture tools such as public-private partnerships, Tax Increment Financing Districts, impact fees and others must all be put on the table in our efforts to incentivize desired investments and achieve the development patterns desired by the region and outlined in the Vision Plan.
By coordinating land use and transportation planning at the regional level, we will address housing, transportation mobility, and land use issues and successfully achieve our goals such as encouraging compact development patterns while also ensuring the efficient use of fiscal resources, reducing congestion, and lowering transportation and living costs. These issues cut across political jurisdictions and impact every community and resident of the Lowcountry and cannot be addressed without regional coordination and visionary thinking about our future.
Realizing the Vision
In the pages that follow, a series of six Plan Elements explore these issues and other significant growth and development challenges facing our Lowcountry region in the coming years. Centered around themes of placemaking, the natural environment, mobility and transportation, the economy, stewardship, and finance, these Plan Elements outline efforts we
6 Figure PS-4: The Vision Plan encourages compact development and the preservation of the Lowcountry architectural heritage and character. Source: HNTB.

PLAN SUMMARY
p // xxii
need to take to address regional issues, identifying a number of strategies, policies, and actions that will serve as a blueprint, guiding us on our path to accomplish ambitious goals and realize the Vision for our future.
Within this blueprint are strategies to focus growth in urbanized areas, help preserve natural resource protection areas, and further a regional network of green infrastructure, including:
•Encouraging compact mixed-use development in existing neighborhood and community centers.
•Aligning land use and transportation policies to conserve agricultural land and open space and maximize the use of existing infrastructure.
•Utilizing conservation subdivision design principles.
•Establishing a regional transfer of development rights program.
Our blueprint also contains economic strategies to grow our economy such as:
•Expanding our region’s base of knowledge workers through educational and career opportunities that emphasize advanced learning and technology.
•Building a robust and integrated transportation system that provides opportunities for active transportation and supports our communities and businesses, including the Port and its freight needs.
•Conducting detailed studies of the region’s freight and mobility networks to align the Vision Plan and the Long Range Transportation Plan (LRTP) and help establish a robust freight network and comprehensive transit system that supports our communities and the Port and its related industries.
With collaboration between communities and leadership from the BCDCOG, as well as other agencies and officials, these strategies can be implemented across the region. And by leveraging funds to support strategic regional infrastructure projects that support OROP Goals, our collective vision for the Lowcountry community will be realized.
6 Figure PS-5: The Lowcountry vision of having mixed used development served by transit provides opportunities to maintain the region’s historic development patterns, including walkable neighborhoods and town centers.


{this page intentionally left blank}

In providing this framework for growth, OurRegion OurPlan aims to inspire our residents, our communities and our leaders and opens up significant opportunities to realize a bold and vibrant future that will, among other accomplishments, preserve our diverse and unique Lowcountry communities, protect our valuable natural resources particularly water resources, sustain our economy, expand our options for transportation within the region, and promote intergovernmental cooperation and collaboration.
OurRegion OurPlan:A VISION of the LOWCOUNTRY in 2040
OurRegion OurPlan (OROP) is a blueprint for the growth of the Lowcountry based on the Vision, Goals and
aspirations of the BCD region. It is a Vision Plan
drawn from established growth management
techniques and built upon local plans to guide
development and focus growth towards the
region’s centers. It prioritizes infrastructure
investments such as transit and identifies
future lands for preservation and protection.
p // v-1
In 2040 the tri-counties of Berkeley Charleston and Dorchester will be a diverse
region with unique Lowcountry communities and a high quality of life that preserves the historical, cultural, architectural, and natural beauty of the region and its individual communities.
It will provide a variety of transportation options that include opportunities for walking, biking, and transit as well as the automobile. The region will be known for its vital economy with good jobs, excellent schools, healthcare and affordable housing, and an environment of clean air and water, sheltered wildlife habitats and renewed local agriculture including timbering.
The region will have a cooperative atmosphere where we share concerns about each other’s way of life with more intergovernmental cooperation, leadership, and inclusive public engagement, which will honor our region’s values and encourage future growth with “tradition anchoring the future”.
the VISION THE GOALS
Residents and leaders of the tri-county region have benefitted from working together by creating a Vision Plan that reflects shared regional goals. These goals reinforce the common belief that our futures and our communities are interconnected and we need to ensure creation of a more sustainable, prosperous and livable region while we address local challenges.
The following goals were created and continually refined throughout the OROP process with input from residents, stakeholders, community leaders and various agencies. The goals are organized around six broad focus areas, which are discussed in detail in this plan under each of the Plan Elements.
» Growth, Development and Placemaking
•Encourage compact, mixed-use development, redevelopment, reuse and infill•Offer a mix of housing types that provide
affordable options to all residents•Achieve a jobs-to-housing balance to discourage
commuting trips and enhance quality of life•Manage development in a way that will
make the most effective use of land, energy, infrastructure, and public services

A VISION of the LOWCOUNTRY in 2040
p // V-2
•Sustain or improve the Port of Charleston’s position as the eighth largest port in the nation in terms of import and export value •Ensure that all residents have equal
access to a quality education
» Regional Leadership
•Promote intergovernmental cooperation and inclusive public engagement to support a culture of “regional learning” •Promote transparency in decision-making•Create model development requirements
consistent with the regional Vision for predictable outcomes
» Partnership and Finance
•Establish a regional governance dynamic around shared and leveraged investments•Link transportation and development patterns•Align investment decisions and revenue sources
to support the Vision
THE VISION PLAN
OurRegion OurPlan is a Vision Plan that envisages a bold future for the Berkeley-Charleston-Dorchester region and sets a high bar for growth, development and conservation. As a Vision Plan, it gives shape
•Align land use policies with transportation and housing plans to connect destinations with neighborhoods via a broad range of public and private transportation choices for the region•Promote placemaking for diverse,
sustainable, livable communities•Protect, preserve, and promote diverse
and unique Lowcountry communities
» Natural Environment
• Protect water resources and quality•Maintain adequate air quality•Preserve the natural environment and
foster a network of green infrastructure•Protect our rural and open spaces
» Mobility
•Promote alternate modes of travel•Develop an integrated transportation
system that maximizes use of existing transportation infrastructure •Reduce reliance on carbon-based fuels•Ensure that transportation facilities are context-
sensitive with the natural and built environment
» Economy
•Promote a diverse regional economy that will support varied employment opportunities
6 Figure V-1: Home to both urban and rural communities, the Lowcountry is known worldwide for its historic buildings and architecture and walkability. Source: Ron Thomas.
to the potential for success and prosperity for all of our communities and residents, revealing regional assets and inspiring new strategies to address the challenges we face. It is also a blueprint – a resource to guide the actions of our local communities and agencies as we plan for the future and contemplate policies and investments in the region, illustrating how economic growth and development can be balanced by respecting the BCD region’s unique character, history and traditions.
The Vision Plan has its foundation in the Vision and Goals described above, which conceptualize the Lowcountry in 2040 and convey the region’s issues, concerns and priorities. They arose from an initial Regional Visioning Forum where nearly

p // V-3
A VISION of the LOWCOUNTRY in 2040
the Trends, Plans, Citizens’ and Green Infrastructure Scenarios – described different ways in which the region might grow and meet its goals, objectives and aspirations. In this sense, they were logical “pictures” or “snapshots” of the future to respond to “what if” questions about the tri-county region and its challenges, issues and opportunities. Through the scenario planning process, the outcomes or impacts of each scenario or picture of the future was measured, evaluated and compared. This allowed public stakeholders, a panel of experts on regional
and transformed into specific, yet advisory, policies, strategies and actions that provide a blueprint for regional growth and achieving regional goals.
The Vision Plan evolved from the scenario planning process, which was used to help the region evaluate the effects of different policies and actions on the region’s resources, communities, landscapes and waterways. It is a synthesis of four scenarios that were discussed and deliberated with the public, local leaders, professionals and experts. These scenarios –
400 people pondered the future of the tri-county region – identifying local and regional priorities and opportunities, articulating their hopes for overcoming challenges, and strategizing on how a prosperous and equitable regional future could be realized. These ideas were refined through subsequent public workshops and meetings. A series of Cluster Workshops later provided an opportunity for the public to affirm the Vision and Goals and solidify the role they would have in shaping the development of OROP.
The Vision Plan is communicated through six Plan Elements that generally correlate to, and build upon, the themes represented in the Vision and Goals. The Plan Elements include:
1. Growth, Development and Placemaking
2. Natural Environment
3. Mobility
4. Economy
5. Regional Leadership and Stewardship
6. Partnership and Finance
Through each of these Plan Elements, the issues and opportunities facing the Lowcountry are articulated 6 Figure V-2: McClellanville is a good example of a rural village in the Lowcountry. Source: HNTB.

p // V-4
A V
ISIO
N o
f the
LO
WC
OU
NTR
Y in
204
0 Figure V-3: The Vision Plan

p // V-5
A VISION of the LOWCOUNTRY in 2040
6 Figure V-4: Local, independent businesses like those found in Sullivan’s Island characterize many of the BCD region’s communities and seaside villages, contributing to the uniqueness of Lowcountry culture. Source: HNTB.
issues and the OROP Regional Land Use and Technical Advisory Committees to understand the pros and cons of various scenario elements and identify preferred elements to be included in a synthesized scenario that would become the Vision Plan, encapsulating the best and most desirable characteristics of future growth and development in the BCD region. (Appendix A contains more detailed information on the scenario planning process.)
The Vision Plan visually communicates these characteristics, but it is important to note that the Vision Plan is not a physical plan for the region nor is it a constrained program subject to the fiscal limitations of a particular time period or jurisdiction. Rather, it is used with the Vision and Goals to establish a framework for targeted policies regarding transportation and transit, growth management, infrastructure, facilities, housing, intergovernmental initiatives, as well as project funding and implementation, among others. It is also useful in illustrating the effect various policy decisions could have on the region’s land patterns, providing quantifiable ways of evaluating these impacts and ensuring that the policies and strategies inherent in the Vision Plan are aligned with the Vision and Goals.
» Vision Plan Features
Features of the Vision Plan convey the desired basic form and structure of the region in 2040.
Fundamental to this is the concentration of growth in, or in close proximity to, the region’s centers. This reflects one of the most consistent messages heard from the public: Development should be encouraged where infrastructure exists or where it could easily be provided with less infrastructure and resources. Building on this foundation, the Vision Plan, like the four scenarios it was derived from, uses a palette of typologies to communicate what types of communities or centers in which the region’s 873,000 people will live and do business, what types of corridors will connect them to their
neighbors and other communities, and where and how much open space will be accessible for exploration or recreation. In addition to these typologies, regional land uses paint a broad picture of the region’s rural and unincorporated areas.
» Centers
"Centers" refer to the different types, sizes and locations of communities and activity nodes (i.e. geographic points where economic resources are concentrated) that will support the region in 2040,

A VISION of the LOWCOUNTRY in 2040
p // V-6
made for potential differences in transportation networks, amenities, typical block sizes, building heights, households, employment and densities.
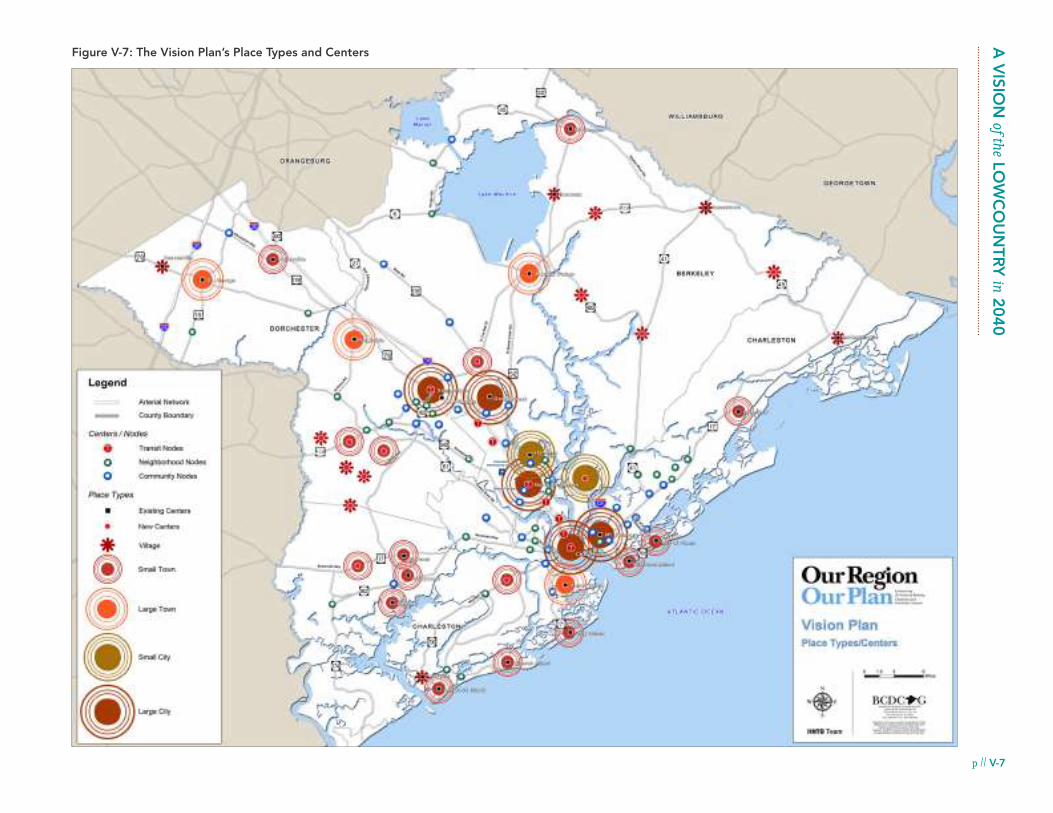
The Vision Plan includes over 100 centers of various sizes and scales, with different roles in the region’s economy and culture. This includes roughly 40 existing and future places that are, or could become,
ranging from large cities like Charleston to villages such as McClellanville. Other centers such as significant transit oriented places and neighborhood and community nodes are also present in the Vision Plan. They reflect a form that is to be achieved by either allowing growth or, in some cases, limiting growth, in locations desired by the region’s residents.
Many factors will shape the ultimate form and exact locations of these centers – such as the needs of the residents, their desire to protect natural resources and Lowcountry character, the attractiveness of an area, and the political will of a community, among others. The place types illustrate the general form and character the centers could take, with distinctions
incorporated jurisdictions of different types, such as villages, small towns, large towns, small cities and large cities. Only 27 of the 40 community places exist today in significant form; the remaining 13 are new community places that are anticipated to develop into more sizable places by the year 2040. Examples of these include the villages and small towns that make up the East Edisto development. The Vision Plan also
8 Figure V-5: Centers are the communities and activity nodes throughout the region. They range from pedestrian-scaled villages and small towns to large cities. Source: HNTB.
Figure V-6: Centers Types in the Vision Plan
Source: HNTB
CENTER TYPES APPROXIMATE SIZE EXAMPLES
VILLAGE <500 Residents Bonneau, McClellanville, Jamestown
SMALL TOWN <5,000 Residents Awendaw, Harleyville, Folly Beach
LARGE TOWN <15,000 Residents Moncks Corner, James Island
SMALL CITY <50,000 Residents Hanahan, Daniel Island
LARGE CITY >50,000 ResidentsGoose Creek, Summerville, Charleston, North Charleston, Mount Pleasant
TRANSIT NODE >15,000 Residents NA
NEIGHBORHOOD NODE <50,000 s.f. of Retail Montague and Virginia Avenues (North Charleston)
COMMUNITY NODE >50,000 s.f. of Retail Maybank Hwy and Folly Road (James Island)
A V
ISION
of the LOW
CO
UN
TRY in 2040
Figure V-7: The Vision Plan’s Place Types and Centers
p // V-7

A VISION of the LOWCOUNTRY in 2040
p // V-8
includes over 60 significant activity nodes – transit, neighborhood and community nodes that will be places of intense activity either within an incorporated municipality or within an unincorporated area.
» Corridors
Corridors form the back bone of our region; they both connect us and separate us, defining and forming the edges of our urban spaces, neighborhoods and communities. The tri-county region is blessed with a dense network of local and collector streets as well as both urban and rural transit systems. However, the Vision Plan shows only the most significant of the region’s transportation infrastructure in 2040,
including regional arterials and transit lines. These corridors form a network with local and collector streets, serving our freight and logistics industries and providing multimodal connections to our urban and rural transit system and access to employment and population centers.
Regional arterials relied upon for commuting and freight movement include expressways and roadways such as Interstate 26, the Mark Clark Expressway (I-526), Route 17, and U.S. 52. Also shown in the Vision Plan are those future regional arterials that are included in the adopted Long Range Transportation Plan, like the extension of the Glen McConnell Parkway. While these lay out the
backbone of a potential future arterial network, a full freight mobility study is needed to maximize efficiencies in freight movement and effectively serve the Port of Charleston.
Transit corridors in the Vision Plan include significant enhancements to the region’s transit system to create a premium transit system that is more efficient and comprehensive and could include travel modes such as commuter/light rail, bus/bus rapid transit, and ferry service as well as continued Amtrak service:
•Commuter or light rail service could be provided along the I-26 corridor, connecting the Peninsula to Ridgeville. Express bus or bus rapid transit (BRT) could connect the Charleston peninsula to Moncks Corner; Moncks Corner to the future development of East Edisto via Summerville; and/or it could loop around Charleston via the Mark Clark Expressway, connecting Mount Pleasant with Johns Island. This type of service could provide the greatest amount of flexibility as it would not have a fixed alignment, meaning that its service routes could be modified to serve future developments or destinations.
•Ferry service could make use of the Cooper and Ashley Rivers to connect the Peninsula with Hanahan and the Charleston International Airport and its employment centers.
6 Figure V-9: Corridors connect us and also define the edges of our urban spaces, neigh-borhoods and communities. Source: HNTB.
7 Figure V-8: Corridors in the Lowcountry vary in character from rural lanes passing under green canopies to multi-lane arterials and interstates. Source: Ron Thomas.

A V
ISION
of the LOW
CO
UN
TRY in 2040
Figure V-10: The Vision Plan’s Corridors
p // V-9

A VISION of the LOWCOUNTRY in 2040
p // V-10
•Amtrak service would continue its current service, directly connecting the BCD region to points south and north, including Florida, Georgia and North Carolina. In the BCD region, Amtrak service runs from Colleton County through West Ashley to the station in North Charleston before continuing on through Moncks Corner, Bonneau and St. Stephen where it continues on to Williamsburg County and North Carolina.
In realizing a comprehensive regional transit network, the region will have better access to places of employment with enhanced connectivity between our urbanized areas, like North Charleston, Summerville, and Moncks Corner, and the Charleston peninsula, and the less urban centers in Dorchester and Berkeley Counties. The actual alignments of all of these transit corridors, the technology to be used, and the type of service to be provided should be explored in more detail in future studies.
» Green Infrastructure
The BCD region contains a highly complex system of open space, natural resources and agricultural lands. Referred to as green infrastructure, these resources protect regional biodiversity and provide a utility function not unlike the traditional “grey” infrastructure that carries storm and waste water and protects us from flooding, among other functions. Green infrastructure also serves as an
important cultural and recreational resource for the region, appealing to tourists and outdoor enthusiasts who come to the Lowcountry for its unique landscape and its rural heritage and culture.
Because it is an integral part of the Lowcountry landscape and culture, including the tourism industry, the scenario planning process revealed strong support for preserving green infrastructure and using trails and greenways to provide access to them for pedestrians and bicyclists. At the 2011 Regional Forum, 45% of the participants identified the Green Infrastructure Scenario (a scenario which
emphasized the preservation of environmental resources) as the most effective in achieving the region’s goals. Additionally, 78% of the participants stated that they either agreed or strongly agreed that the Vision Plan should provide for the protection of existing natural features, especially watersheds. The green infrastructure feature of the Vision Plan reflects this charge and incorporates the most desirable aspects from the Green Infrastructure Scenario.
In addition to greenways, the Vision Plan incorporates three major green infrastructure elements: protected lands, agricultural lands,
6 Figure V-11: The Lowcountry has abundant natural resources with coastal waters, marshes, rivers, wetlands, forests and wildlife refuges. Source: Ron Thomas.
6 Figure V-12: Agriculture has long been a part of the BCD region, but growth and development threatens the remaining agricultural lands. Source: HNTB.

A V
ISION
of the LOW
CO
UN
TRY in 2040
Figure V-13: The Vision Plan’s Green Infrastructure
p // V-11

A VISION of the LOWCOUNTRY in 2040
p // V-12
and recreation/open space. Protected lands consist of those lands that are currently protected along with additional lands identified for future protection because of their resource or cultural value. Examples of areas that are already protected include local, state and federally protected lands such as the Francis Marion National Forest, the Cape Romain National Wildlife Refuge and the numerous properties throughout the region with conservation easements that were voluntarily granted by property owners to local agencies. Examples of lands targeted for future protection include critical wetlands and riparian habitat edging our rivers and major streams.
Agricultural lands are made up of the region’s key agricultural areas that have yet to be developed
Figure V-14: The Vision Plan Land Uses
Rural/unincorporated land uses derived from individual community and county plans and used in the Vision Plan. The intensity and density of these uses are shown in Appendix A.Source: HNTB.
LAND USES
Protected
Recreational
Agricultural
Rural Residential
Low Density Residential
Medium Density Residential
High Density Residential
Institutional
Retail / Commercial
Neighborhood / Mixed Use
Medium Density Mixed Use
Employment
Industrial
Water
in any significant manner and, because of the important economic and cultural role they play in the region, should be preserved for future generations as an agricultural resource.
Recreation/open space lands consist of the major recreation areas currently held by local governments and park agencies or identified by those same agencies are future recreation/open space amenities.
Greenways are the corridors of the green infrastructure system, creating connections between green infrastructure resources and offering opportunities for active transportation. Two of the region’s most significant greenways are the East Coast Greenway and the Palmetto Trail.
» Regional Land Uses
In the Vision Plan, the form and structure of the rural/unincorporated lands, between the region’s centers and outside of the region’s green infrastructure, is illustrated by land uses aligned with the aspirations of the local municipalities and jurisdictions. Derived from local plans, the land use palette reflects the future envisioned by the region’s communities. However, in order to paint a broad picture appropriate to the scale of the Vision Plan, the land uses have been refined and simplified.

A V
ISION
of the LOW
CO
UN
TRY in 2040
Figure V-15: The Vision Plan’s Land Use Map
p // V-13

{this page intentionally left blank}

PLAN
ELE
ME
NT
1
By the year 2040, the region is expected to grow to more than 874,000 people – a 31% increase over the nearly 665,000 people who resided in the region as of the 2010 Census. This will mean an increase of 7,000 residents annually over the next 30 years. As our population grows, we will guide development and balance our transportation and land use needs so that we are able to realize our vision of the future and preserve the unique sense of place that characterizes the Lowcountry. This will enable us to make the best of our assets and opportunities, while giving us the tools necessary to identify and address the challenges that come our way.
ISSUES AND OPPORTUNITIES
The Lowcountry has long been an attractive place to live. First drawing in explorers and colonists, and more recently the region has enticed young families, professionals, and retirees who appreciate the diverse cultural resources, abundant natural
Plan Element 1:GROWTH, DEVELOPMENT and PLACEMAKING
The Lowcountry is known for its high quality of life and a strong sense of place with breathtaking landscapes, inviting gardens
and historic architecture. It is filled with unique places, landmarks and vestiges of days gone by; included among the many are Drayton Hall,
Middleton Place, and Magnolia Plantation, the Market and the Battery, Fort Sumter and Edisto Island. These places reflect not only our regional
history, but the history of our nation and impart unto us an identity as the cultural hub of the South and a center of economic prosperity.
assets, history and great architecture. While many communities and regions struggle to attract new residents or even retain the population that they do have, the BCD region is blessed to be the focus of so much attention. But this blessing comes at a price and that price is the pressure and strain growth can have on our communities and resources. The danger lies in leaving our growth – and indeed our future –
p // 1-1
8 Figure 1-1: The Market in Downtown Charleston, SC. Source: www.flickr.com – Steven Hyatt Photography
THE DANGER LIES IN LEAVING OUR GROWTH – AND INDEED OUR FUTURE – TO CHANCE, ALLOWING IT TO OCCUR IN AN UNCOORDINATED, REACTIVE AND INEFFICIENT MANNER, INSTEAD OF MAKING THE BEST AND MOST EFFICIENT USE OF OUR TAX DOLLARS BY BEING PROACTIVE, COLLABORATIVE, COMMUNICATIVE AND FORWARD-THINKING.

PLA
N E
LEM
EN
T 1
GROWTH, DEVELOPMENT and PLACEMAKING
p // 1-2
» Growth and Development in the BCD Region
Since the early days of the explorers and settlers, the BCD region has been transformed from a single 66-acre settlement on the banks of the Cooper River housing a population of 5,000 into a booming three-county region, stretching over 1.65 million acres (2,578 square miles) with over thirty communities, 665,000 residents and nearly 300,000 housing units according to the 2010 Census. What was once a compact colony with a density of 77 persons to the acre has become a vast, highly developed yet dispersed region with a density of .40 persons per acre. This growth has had significant impacts on the region, many of which have been beneficial such as the creation of distinct communities and a strong economy. But growth comes at a price and more recent development patterns from the last several decades have resulted in the rapid conversion of rural and agricultural land, increased vacancy rates, and decreases in housing affordability, among others.
Yet still, the Lowcountry’s coastal living and high quality of life has made it an attractive place to live and growth trends indicate that the region will continue to draw new residents from across the country. By the year 2040, forecasts predict that nearly 874,000 people will call the tri-county region home – nearly 325,000 more people than the 2000 population of 549,033 and almost 209,000 more than the 2010 population of 664,607. Between 2000
and 2010, the United States Census showed that the region added over 115,000 people to its population, growing by 21%. Growth in the tri-counties is especially strong when compared to the rest of the state, and the Nation; during that time, the BCD region’s population growth rate was more than twice the national rate of 9.7% and significantly more than the South Carolina growth rate of 15.3%.
Although each of the three BCD counties had similar absolute gains in population between 2000 and 2010, the growth rate, or percent change in population, varied because of differences in each counties’ base population. For example, Dorchester County gained 40,142 people and Charleston County gained 40,240 – approximately the same amount. Berkeley County gained slightly less than Dorchester and Charleston Counties with
to chance, allowing it to occur in an uncoordinated, reactive and inefficient manner, instead of making the best and most efficient use of our tax dollars.
As the region grows, we have an opportunity to shape our communities and give voice to the “where, when and how” of growth and development. Our leaders have played an important role in helping draw out the vision we have for our towns and communities and implementing that vision through collaborative and coordinated actions. In continuing to do so, communities will guide and support development that aligns with the vision, giving confidence to developers and the business community that the region is prepared for growth and ready for success.
Source: U.S. Census Bureau, 2010, BCDCOG, HNTB, 2011
Figure 1-2: Forecasted Population Growth
Figure 1-3: Percent Increase in Housing and Population, 2000-’10
Source: U.S. Census Bureau, 2000, 2010

p // 1-3
PLAN
ELE
ME
NT
1GROWTH, DEVELOPMENT and PLACEMAKING
To understand how much housing is realistically needed for the region, consider how quickly the region’s vacancies could be absorbed. Over a course of ten years (2000 and 2010), the region built approximately 65,500 housing units. In 2010, 38,555 units were vacant. Between 2010 and 2040, it is forecasted that 208,872 additional people will live in the region and, with a continuing trend towards smaller household sizes, they would make up slightly more than 88,000 new households. Annually, this equates to an average of 2,934 new households per year. At that rate, it would take 13 years for all of the region’s existing vacant units from 2010 to be absorbed.
Yet if the 2000 to 2010 trend in housing construction were to continue, there would be nearly 196,500 new housing units constructed between 2010 and 2040. This is more than twice the number of anticipated new households needed. When adding the existing vacant units to the mix, the region could have over 235,000 housing units available for the 88,000 new households by 2040. Admittedly, this is a simplified assessment as it assumes that the building trend that characterized the last decade would continue despite the recession and that all vacant units should be absorbed by the market, which is neither realistic nor desirable as it would limit choice and drive housing prices to unaffordable levels. However, the lesson is an important one: the region’s fondness for building new housing is far outpacing the ability
vacancy rate for South Carolina. Nonetheless, these figures strongly suggest that housing construction has exceeded the needs of the region.
only 35,192 new residents. However, the growth rate for the three counties tells a different story. According to the growth rate, Dorchester County experienced the most growth of all three counties, with an increase of 41.6%, compared to the relatively moderate 13% growth rate of Charleston County and the more aggressive 24.7% growth rate of Berkeley County. Berkeley’s growth rate was almost twice the rate of Charleston County, but considerably less than the rate of Dorchester County (Table 2).
While the region’s 21% growth in population from 2000 to 2010 was substantial, it was significantly outpaced by the growth in housing units, which was just over 28% for the same ten year period (Table 2), a difference of over seven percentage points. This difference between the housing and population growth rates is slightly more than the statewide difference of six and six-tenths percentage points, but is significantly more than the nearly four percentage point difference across the United States.
The trend of housing growth outpacing population growth has been accompanied by an increase in housing vacancy rates throughout the region. From 2000 to 2010, the region’s vacancy rate increased over two percentage points, from 10.74% to 12.91%. This is slightly less than the national increase in vacancy rates and a full point less than the statewide
Figure 1-4: Vacancy Rates of Housing Units, 2000-’10
Source: U.S. Census Bureau, 2000, 2010

PLA
N E
LEM
EN
T 1
GROWTH, DEVELOPMENT and PLACEMAKING
p // 1-4
of the region to absorb the homes being built and it has also caused a sprawling growth pattern that continues to consume excessive amounts of land that could be protected or preserved.
Like other regions across the country, the Lowcountry’s sprawling growth pattern has been influenced by the automobile and the freedom of choice it has given us in where we live and work. The result of these influences and our appetite for construction can be seen in the amount of agricultural land that has been converted to residential and commercial uses over the years. In fact from 1973 to 2000, the region’s impervious surfaces increased 318% while the population only increased by 52%1.
Despite excess housing units, the high vacancy rates in the region and the recent recession, the median home value in the BCD region still saw a
1 Federal Highway Administration, Scenario Planning Peer Workshop, Monterey, CA, June 2006.
significant increase between 2000 and 2010. In all three counties, the median home value increased by at least 57%, with Charleston County’s median increasing by nearly 77%, which is more than twice the statewide increase of 35%. The increase in the national median was 55%, slightly less than that of Berkeley and Dorchester Counties.
The increase in regional home values is for the most part a positive sign in the context of the recent recession and slumping real estate market; however, there is also a downside. Across the region, increases in median home values have outpaced increases in income by more than twice as much. This clearly highlights the need for affordable housing. For Berkeley and Charleston counties, the median household income increased
by almost 25% between 2000 and 2010, while Dorchester County’s increase was slightly less at 18%, which was relatively in line with the 19% national increase. All were greater than the 13% increase in the State of South Carolina.
More than just statistics, this latest Census data gives a fresh insight into the way we have been building and developing our communities and the challenges that we now face as a result of these activities. New homes have been built at a much faster pace than the population has increased. Not only are we building more homes than are needed in the region, but the people of the BCD region are having a more difficult time affording the housing that we do have as increases in home values (and costs) has outpaced income growth. Concurrently, the share of people living below the poverty level also increased dramatically; increasing by at least 15% in Berkeley and Charleston counties, the State of South Carolina and across the United States from 2000 to 2010. Only Dorchester County saw an improvement in the poverty status of its residents, with a 9% decrease in the share of individuals living below the poverty level during the same time period.
Transportation costs associated with the location of a home also influence its affordability. With traditional affordability measures, homes are considered affordable if their price is
IN FACT, FROM 1973 TO 2000, THE REGION’S IMPERVIOUS SURFACES INCREASED 318% WHILE THE POPULATION ONLY INCREASED BY 52%.
SOURCE: FEDERAL HIGHWAY ADMINISTRATION, SCENARIO PLANNING PEER WORKSHOP, MONTEREY, CA, JUNE 2006.
Source: U.S. Census Bureau, 2000, 2010; U.S. Census Bureau American Community Survey 2005-’09
Figure 1-5: Percent Increase in Median Household Income and Median Home Value, 2000-’2010
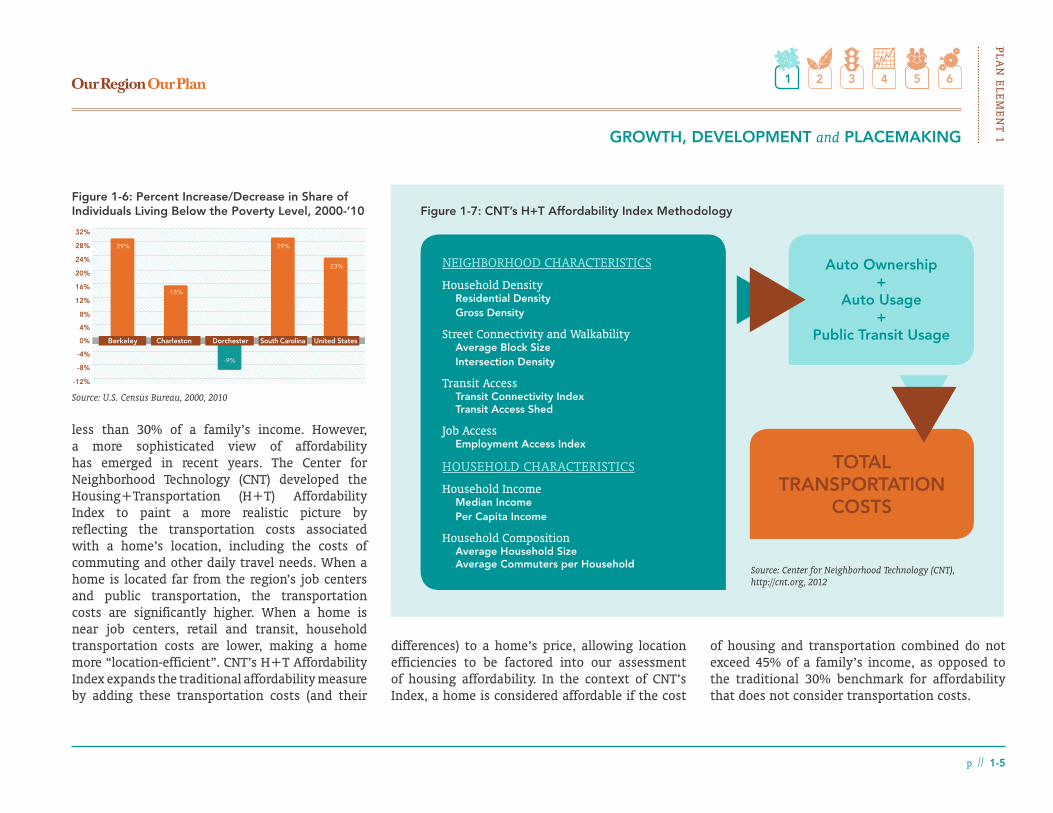
p // 1-5
PLAN
ELE
ME
NT
1GROWTH, DEVELOPMENT and PLACEMAKING
less than 30% of a family’s income. However, a more sophisticated view of affordability has emerged in recent years. The Center for Neighborhood Technology (CNT) developed the Housing+Transportation (H+T) Affordability Index to paint a more realistic picture by reflecting the transportation costs associated with a home’s location, including the costs of commuting and other daily travel needs. When a home is located far from the region’s job centers and public transportation, the transportation costs are significantly higher. When a home is near job centers, retail and transit, household transportation costs are lower, making a home more “location-efficient”. CNT’s H+T Affordability Index expands the traditional affordability measure by adding these transportation costs (and their
differences) to a home’s price, allowing location efficiencies to be factored into our assessment of housing affordability. In the context of CNT’s Index, a home is considered affordable if the cost
of housing and transportation combined do not exceed 45% of a family’s income, as opposed to the traditional 30% benchmark for affordability that does not consider transportation costs.
Source: U.S. Census Bureau, 2000, 2010
Figure 1-6: Percent Increase/Decrease in Share of Individuals Living Below the Poverty Level, 2000-’10
NEIGHBORHOOD CHARACTERISTICS
Household Density Residential Density Gross Density
Street Connectivity and Walkability Average Block Size Intersection Density
Transit Access Transit Connectivity Index Transit Access Shed
Job Access Employment Access Index
HOUSEHOLD CHARACTERISTICS
Household Income Median Income Per Capita Income
Household Composition Average Household Size Average Commuters per Household
Auto Ownership+
Auto Usage+
Public Transit Usage
TOTALTRANSPORTATION
COSTS
Source: Center for Neighborhood Technology (CNT), http://cnt.org, 2012
Figure 1-7: CNT’s H+T Affordability Index Methodology

PLA
N E
LEM
EN
T 1
GROWTH, DEVELOPMENT and PLACEMAKING
p // 1-6
When using this lens to look at housing on a region-wide scale, much more of the BCD region is considered unaffordable than is considered affordable. Figure 1-8 shows the affordability of
housing in the tri-counties using the traditional model that assumes housing is affordable if its median cost is less than 30% of the median family income, and also the region’s housing affordability,
according to CNT’s H+T Affordability Index. Adding the cost of transportation to the picture of affordability suggests that areas with greater housing affordability are located along and near the peninsula, as indicated by the yellow shaded areas in Figure 2, while much of the region outside of this area is unaffordable, or burdened with higher housing and transportation costs, as indicated by the extensive aqua blue areas.2
According to the H+T Affordability Index, homes built in the outskirts of the region become unaffordable because they are not readily connected to transit and jobs and therefore have higher transportation costs. Concentrating residential development and new construction in these areas has other long-term impacts such as the depletion of rural and agricultural lands, which has strong implications for the communities
2 http://htaindex.cnt.org/
Figure 1-8: Affordability of Housing using the Traditional Model and Affordability of Housing using CNT’s H+T Index
Source: Center for Neighborhood Technology (CNT), http://htaindex.cnt.org/map/, 2012
COORDINATED TRANSPORTATION AND LAND USE FOSTERS A MIX OF USES THAT SERVES PEOPLE OF DIFFERENT AGES AND INCOMES, HELPS PROTECT OUR CRITICAL ECOSYSTEMS AND OPEN SPACE, CREATES ECONOMIC OPPORTUNITY AND EXPANDS THE TRANSPORTATION OPTIONS AND MODES AVAILABLE TO THE REGION.

p // 1-7
PLAN
ELE
ME
NT
1GROWTH, DEVELOPMENT and PLACEMAKING
and character of the BCD region, as these lands are a vital to the Lowcountry’s charm and appeal. Of additional concern is that as growth occurs further from the region’s urban core and outside existing municipalities’ jurisdiction and service areas, new facilities and infrastructure are needed. This requires taxpayer investment in the extension of new infrastructure while long established communities suffer due to a lack of investment in infrastructure maintenance and improvement.
To prevent these impacts, the region’s housing and population growth will be better aligned to utilize existing and established centers and nodes while preserving open space and agricultural land. Future growth will be focused within existing centers, close to employment areas where infrastructure already exists and where there is the potential for multimodal transit, ensuring affordability for future housing and population growth.
» The Balance between Land Use and Transportation
As mentioned before, transportation has a significant impact on the affordability of housing in the Lowcountry, but it is also affects other aspects of our communities and built environment. Notably, it has significant impact on the character of our communities, the economic development opportunities available to us, and the regional
resources that we have access to, including agricultural lands. In short, transportation and land use are highly interrelated.
Transportation resources determine the region’s access to housing, jobs, schools, natural resources, and other goods and services. Likewise, the density and location of development influences regional travel and partly determines the transportation options available to a community, such as whether alternative transportation modes like bus rapid transit are feasible. Coordinated transportation and land use fosters communities and neighborhoods that serve people of different ages and incomes, help protect our critical ecosystems and open space, create economic opportunity and expand transportation options and modes available to the region. While developers’ response to the market will ultimately influence where development occurs, coordinating land use and transportation planning provides an opportunity for local communities to encourage the development it desires while at the same time ensuring fiscal resources are used efficiently and effectively, congestion is reduced, transportation and living costs are lowered.
In coordinating land use and transportation, existing communities will be better able to balance their needs, desires and priorities. The region will also be better poised for growth as our efforts will illustrate to developers and businesses alike that we value
growth, that we are proactive, and that we have anticipated the hard questions and are prepared to make tough decisions to realize our future. This requires that local governments and transportation agencies continue to be engaged partners in local decision making, establishing proactive, coordinated and consistent plans and policies that will guide land use and transportation decisions while taking into account local conditions, context, and priorities.
» Placemaking and its Role in the BCD Region
The BCD region’s sense of place and historical roots are well documented here and in the literature about the Lowcountry. However, it is important to keep in mind that our regional identity and
6 Figure 1-9: Placemaking draws out and builds upon our communities’ assets to enhance our quality of life. Source: Ron Thomas.

PLA
N E
LEM
EN
T 1
GROWTH, DEVELOPMENT and PLACEMAKING
p // 1-8
sense of place are not only defined by our historic landscapes and architecture, but are constantly re-invented and re-negotiated with every new development and construction project. As we engage in these endeavors, we will consider the context of the region and the ways in which we can create new places that reinforce our history and sense of place. These placemaking efforts will be a central aspect of every project that we undertake.
» A Nexus to Quality of Life
To frame it more broadly, placemaking is an approach to the planning and design of our communities and public spaces that draws out and builds upon our communities’ assets to enhance our quality of life. Placemaking does not occur in a bureaucratic or political vacuum. To the contrary, it is highly public and inclusive as stakeholder opinions and community values are essential to develop a collective vision and realize places that are meaningful to our residents. Placemaking is also a tool for revitalizing our neighborhoods and communities, fostering growth in a way that is reflective of our history and values.
» Historical Role in the BCD Region
Placemaking has long been used in the Lowcountry as a means of preserving our unique local history and culture, while at the same time making us
competitive in a global marketplace. In fact, placemaking has made the BCD region one of the country’s top travel destinations year after year as visitors are drawn to our historic neighborhoods, scenic beaches, lively arts community and the strong sense of place evident throughout the region. It has also contributed to the region’s continued growth and prosperity through this most recent recession as well as other challenging times.
One of the Nation’s best examples of the use of placemaking to revitalize communities can be found in the City of Charleston. The City’s leadership has championed placemaking efforts locally and
nationally, engaging the community in revitalizing the city and preserving its unique architectural, historical and cultural assets including the City Market, the Exchange, the Battery and downtown’s numerous gardens and park spaces. Although the City of Charleston is the most architecturally well-known community in the Lowcountry, many of our places – including Summerville, Sullivan’s Island, Kiawah and Mount Pleasant – have their own rich architectural history, unique physical and natural environment, and important cultural landscapes. These and each of our communities have their own distinct charms and character that contributes to the overall fabric of the Lowcountry.
6 Figure 1-10: Port of Charleston. Source: Flickr – Mr. T in DC’s photostream.
8 Figure 1-11: Residential neighborhoods with historic character like this add to the uniqueness of Charleston. Source: Kevin Walsh.

p // 1-9
PLAN
ELE
ME
NT
1GROWTH, DEVELOPMENT and PLACEMAKING
Together these assets attract the nearly 4 million worldwide visitors that come to Charleston and the region every year. They also help define Charleston as the cultural hub of the South and lend to the region’s vibrancy, telling the story of our long history and sharing its meaning to us with those who visit.
» Urban Form
The unique sense of place evident in the BCD region is admired and copied both locally and around the country. Communities like I’On in Mount Pleasant were based on the traditional design characteristics and mix of uses present in the peninsula and Charleston, as well as other distinctive places in the region like Summerville that include shared public green spaces, a central village square for civic buildings and community space, walkable and bikeable neighborhoods, narrow streets, and small lots densely packed with homes boasting coastal architecture and welcoming front porches reminiscent of the single house building type.
Not all of the BCD region’s communities share all of these exact qualities, but the lesson that places like Summerville, Charleston, I’On, and the island communities present is an important one – our communities are places that reflect our values and shared history and contribute to the region’s quality of life.
Looking forward to the growth and development we are planning for, placemaking principles will provide opportunities to shape our communities. It will help ensure that we provide meaningful spaces for community interaction, such as the creation of lively public spaces. It will create opportunities for a variety of housing and transportation options, such as walkable neighborhoods and a diverse selection of housing types and densities. And ultimately, it will help us build upon shared assets and collective history while
endowing us with the tools to achieve a character that is reflective of the Lowcountry vernacular.
GUIDING PRINCIPLES
As we plan for the future of the BCD region, the preservation and enhancement of our natural environment will be a high priority so that we can meet our goals for the future of our environment. In order to meet these goals, it is necessary that the impacts of growth and development be mitigated, the environmental hazards that threaten the stability and safety of our economy and communities be lessened, our unique Lowcountry environment be preserved, and the biodiversity of the region be supported. Our path to implementing our goals can be guided through a defined set of objectives, policies, and strategies. Indicators can be used to measure the effectiveness of our strategies.
GROWTH, DEVELOPMENT and PLACEMAKING FRAMEWORK
» The Goals
The following Growth, Development and Placemaking goals will ensure that the collective vision of the community is realized:
6 Figure 1-12: The I’On development has replicated many of the qualities of the older Charleston neighborhoods. Source: HNTB.
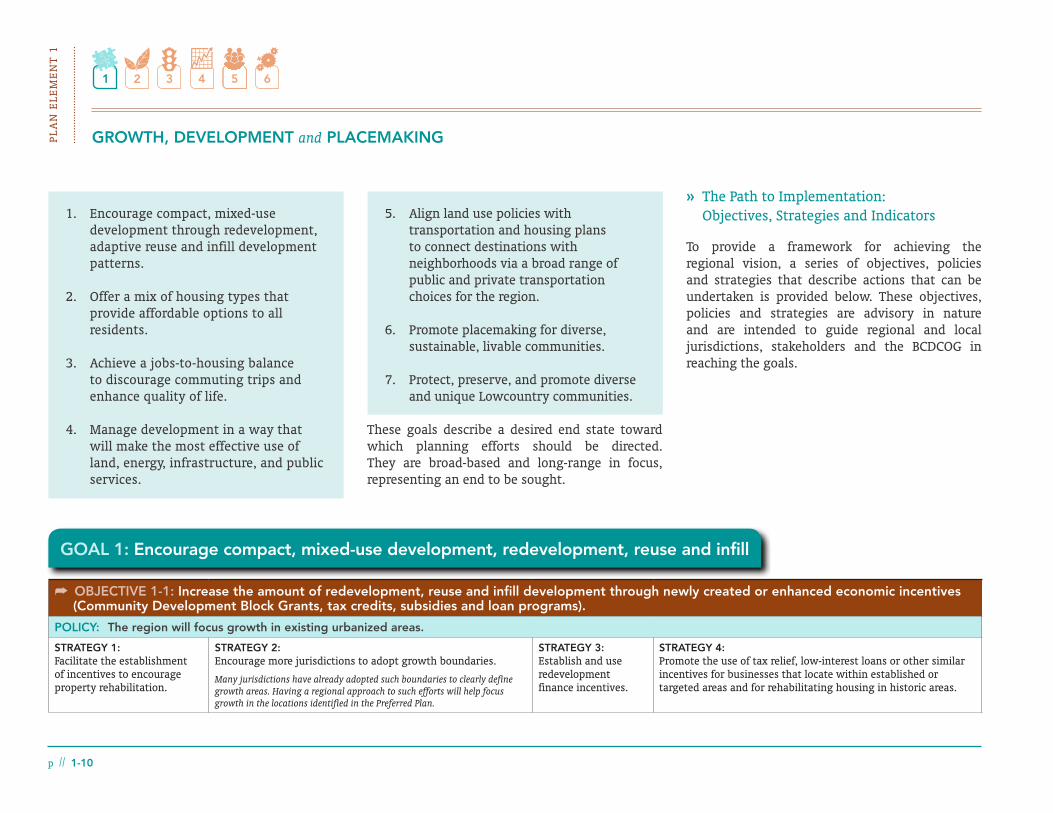
PLA
N E
LEM
EN
T 1
GROWTH, DEVELOPMENT and PLACEMAKING
p // 1-10
1. Encourage compact, mixed-use development through redevelopment, adaptive reuse and infill development patterns.
2. Offer a mix of housing types that provide affordable options to all residents.
3. Achieve a jobs-to-housing balance to discourage commuting trips and enhance quality of life.
4. Manage development in a way that will make the most effective use of land, energy, infrastructure, and public services.
5. Align land use policies with transportation and housing plans to connect destinations with neighborhoods via a broad range of public and private transportation choices for the region.
6. Promote placemaking for diverse, sustainable, livable communities.
7. Protect, preserve, and promote diverse and unique Lowcountry communities.
These goals describe a desired end state toward which planning efforts should be directed. They are broad-based and long-range in focus, representing an end to be sought.
» The Path to Implementation: Objectives, Strategies and Indicators
To provide a framework for achieving the regional vision, a series of objectives, policies and strategies that describe actions that can be undertaken is provided below. These objectives, policies and strategies are advisory in nature and are intended to guide regional and local jurisdictions, stakeholders and the BCDCOG in reaching the goals.
GOAL 1: Encourage compact, mixed-use development, redevelopment, reuse and infill
OBJECTIVE 1-1: Increase the amount of redevelopment, reuse and infill development through newly created or enhanced economic incentives (Community Development Block Grants, tax credits, subsidies and loan programs).
POLICY: The region will focus growth in existing urbanized areas.
STRATEGY 1:Facilitate the establishment of incentives to encourage property rehabilitation.
STRATEGY 2:Encourage more jurisdictions to adopt growth boundaries.
Many jurisdictions have already adopted such boundaries to clearly define growth areas. Having a regional approach to such efforts will help focus growth in the locations identified in the Preferred Plan.
STRATEGY 3:Establish and use redevelopment finance incentives.
STRATEGY 4:Promote the use of tax relief, low-interest loans or other similar incentives for businesses that locate within established or targeted areas and for rehabilitating housing in historic areas.
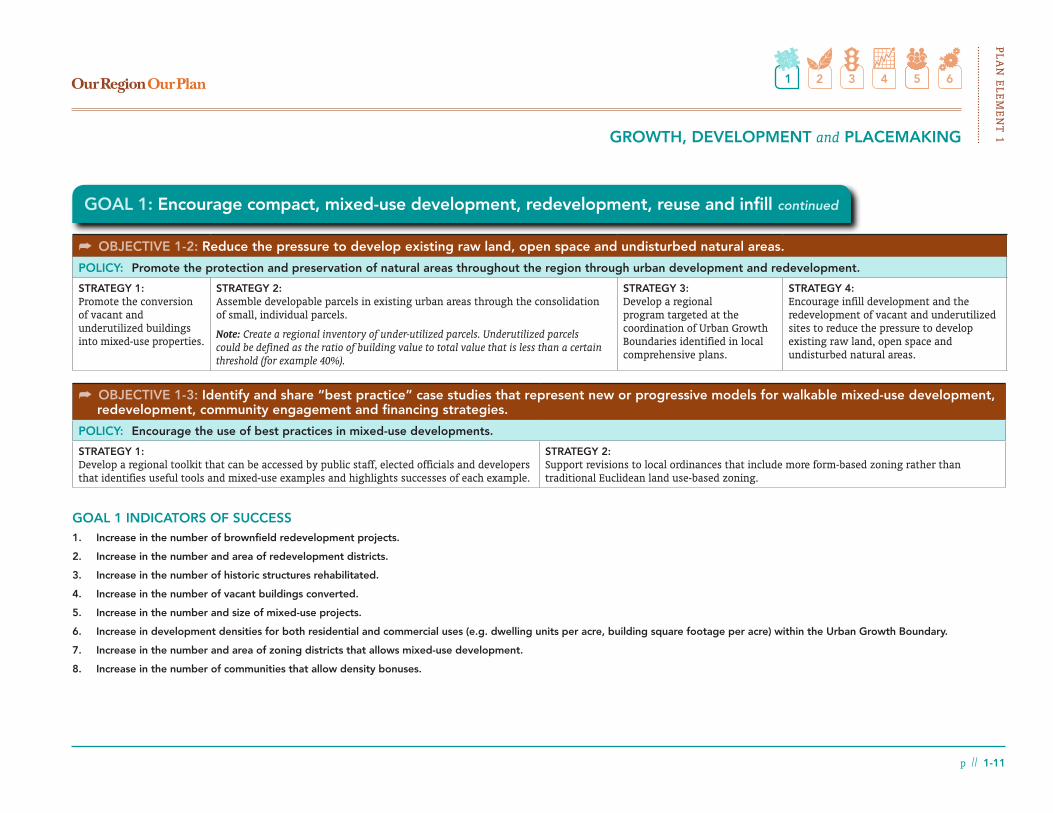
p // 1-11
PLAN
ELE
ME
NT
1GROWTH, DEVELOPMENT and PLACEMAKING
GOAL 1: Encourage compact, mixed-use development, redevelopment, reuse and infill continued
OBJECTIVE 1-2: Reduce the pressure to develop existing raw land, open space and undisturbed natural areas.
POLICY: Promote the protection and preservation of natural areas throughout the region through urban development and redevelopment.
STRATEGY 1:Promote the conversion of vacant and underutilized buildings into mixed-use properties.
STRATEGY 2:Assemble developable parcels in existing urban areas through the consolidation of small, individual parcels.
Note: Create a regional inventory of under-utilized parcels. Underutilized parcels could be defined as the ratio of building value to total value that is less than a certain threshold (for example 40%).
STRATEGY 3:Develop a regional program targeted at the coordination of Urban Growth Boundaries identified in local comprehensive plans.
STRATEGY 4:Encourage infill development and the redevelopment of vacant and underutilized sites to reduce the pressure to develop existing raw land, open space and undisturbed natural areas.
OBJECTIVE 1-3: Identify and share “best practice” case studies that represent new or progressive models for walkable mixed-use development, redevelopment, community engagement and financing strategies.
POLICY: Encourage the use of best practices in mixed-use developments.
STRATEGY 1:Develop a regional toolkit that can be accessed by public staff, elected officials and developers that identifies useful tools and mixed-use examples and highlights successes of each example.
STRATEGY 2:Support revisions to local ordinances that include more form-based zoning rather than traditional Euclidean land use-based zoning.
GOAL 1 INDICATORS OF SUCCESS1. Increase in the number of brownfield redevelopment projects.
2. Increase in the number and area of redevelopment districts.
3. Increase in the number of historic structures rehabilitated.
4. Increase in the number of vacant buildings converted.
5. Increase in the number and size of mixed-use projects.
6. Increase in development densities for both residential and commercial uses (e.g. dwelling units per acre, building square footage per acre) within the Urban Growth Boundary.
7. Increase in the number and area of zoning districts that allows mixed-use development.
8. Increase in the number of communities that allow density bonuses.

PLA
N E
LEM
EN
T 1
GROWTH, DEVELOPMENT and PLACEMAKING
p // 1-12
GOAL 2: Offer a mix of housing types that provide affordable options to all residents
OBJECTIVE 2-1: Encourage a diverse mix of housing types within the region.
POLICY: Provide housing opportunities that meet the diverse needs of the region’s residents.
STRATEGY 1:Continue to support the use of accessory dwelling units, attached or detached from the primary residential unit, on single-family building lots.
STRATEGY 2:Continue efforts to inventory the regional affordable housing supply and demand to determine how much is needed today and how much will be needed in the future.
OBJECTIVE 2-2: Promote collaboration between counties and local municipalities to develop regional zoning strategies and design guidelines to address the need for affordable housing opportunities at the regional level.
POLICY: Encourage the creation of affordable housing through integration into existing, sustainable communities.
STRATEGY 1:Continue to promote affordable housing that is integrated into communities and is comparable to market-rate housing.
STRATEGY 2:Address affordable housing at the regional level by creating stakeholder groups that will focus on funding and implementation strategies.
STRATEGY 3:Facilitate the preservation of existing affordable housing in gentrifying areas.
STRATEGY 4:Enable the streamlining of the review and approval process for affordable housing proposals.
STRATEGY 5:Identify additional opportunities to reduce or waive impact fees on new affordable housing projects.
Note: Provide incentives, such as reduced impact fees due to reduced water/wastewater demand for LEED projects.
F Best Practice: Edgewater on the Tualatin in Tigard, Oregon is a good example of housing projects that are both affordable and sustainable (Land Development, NAHB, Vol. 23, No. 4, Fall 2010).
STRATEGY 6:Assist in acquiring and assembling parcels, including tax-delinquent properties and vacant/abandoned buildings, for affordable housing development projects.
STRATEGY 7:Explore the use of location-efficient mortgages (LEMs) that allow buyers to qualify for larger mortgages to purchase homes convenient to public transportation.
STRATEGY 8:Support expansion of forgivable, deferred or repayable low-interest loan and additional grant programs to offset down payment costs for eligible homebuyers.
STRATEGY 9:Educate affordable housing developers on potential funding sources, programs and requirements for project capital.
STRATEGY 10:Continue to support financial literacy education and resources to current renters who are preparing to become homeowners. Initiate inclusionary zoning practices - update codes to allow for different housing types.
STRATEGY 11:Continue to work with transportation providers to expand public transit links between affordable housing and job centers.
STRATEGY 12:Collaborate to educate the regional community on the importance of integrating affordable housing into stable communities.

p // 1-13
PLAN
ELE
ME
NT
1GROWTH, DEVELOPMENT and PLACEMAKING
GOAL 2: Offer a mix of housing types that provide affordable options to all residents continued
1. Increase in affordable housing within regional market.
2. Changes in impact fee collection for affordable and sustainable (LEED) housing projects.
3. Increase in the number of location-efficient mortgages approved.
4. Increase in proportion of non-single family dwelling units.
GOAL 2 INDICATORS OF SUCCESS
OBJECTIVE 3-1: Create a regional advisory board tasked with assisting local governments in developing planning policies that support a jobs-to-housing balance
POLICY: Encourage communities to review/revise local planning policies to achieve an appropriate local and regional jobs-to-housing balance.
STRATEGY 1:Collaborate with and educate local jurisdictions on the relevance and need for an appropriate jobs-to-housing ratio.
Note: The recommended standard target for jobs-to-housing ratio is 1.5:1 (Weitz, Report Number 516)
STRATEGY 2:Include jobs-to-housing balance as one of the criteria in regional and local economic development agencies’ site-selection process. This will attract jobs to areas where there is more housing.
STRATEGY 3:Explore ways to encourage businesses to hire from the local labor force within close proximity to the business.
STRATEGY 4:Encourage the use of incentives to motivate businesses to locate in centers.
OBJECTIVE 3-2: Promote the development and implementation of policies and programs to support jobs-to-housing balance improvement.
POLICY: Provide assistance to local municipalities to integrate policies and programs at the local level to create a regional jobs-to-housing balance.
STRATEGY 1:Encourage local businesses and governments to provide employer-assisted housing benefits where local housing is not affordable to local employees.
STRATEGY 2:Promote the develop of policy guides and model codes to foster the inclusion of jobs-housing balance in local Comprehensive Plans and facilitate a greater diversity of housing choices located near centers and employment nodes.
STRATEGY 3:Attract a greater mix of employer types offering a range of job skill levels within each community.
GOAL 3: Achieve a jobs-to-housing balance to discourage commuting trips and enhance quality of life
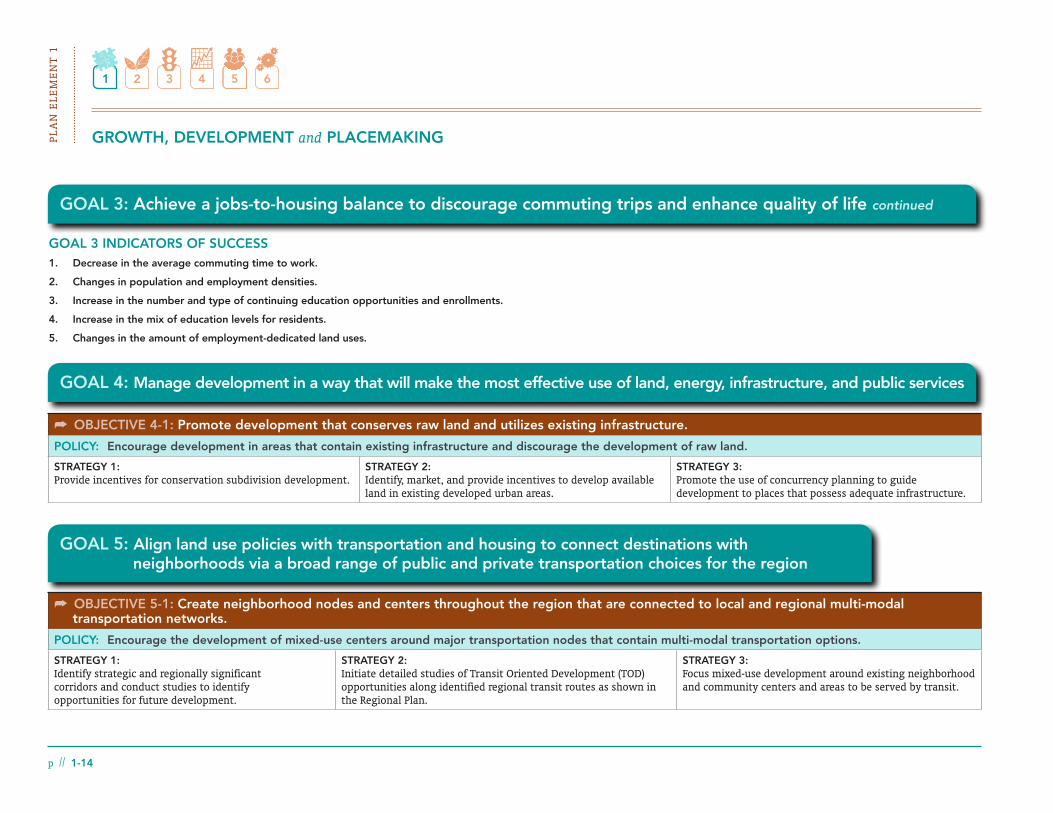
PLA
N E
LEM
EN
T 1
GROWTH, DEVELOPMENT and PLACEMAKING
p // 1-14
GOAL 5: Align land use policies with transportation and housing to connect destinations with neighborhoods via a broad range of public and private transportation choices for the region
OBJECTIVE 5-1: Create neighborhood nodes and centers throughout the region that are connected to local and regional multi-modal transportation networks.
POLICY: Encourage the development of mixed-use centers around major transportation nodes that contain multi-modal transportation options.
STRATEGY 1:Identify strategic and regionally significant corridors and conduct studies to identify opportunities for future development.
STRATEGY 2:Initiate detailed studies of Transit Oriented Development (TOD) opportunities along identified regional transit routes as shown in the Regional Plan.
STRATEGY 3:Focus mixed-use development around existing neighborhood and community centers and areas to be served by transit.
OBJECTIVE 4-1: Promote development that conserves raw land and utilizes existing infrastructure.
POLICY: Encourage development in areas that contain existing infrastructure and discourage the development of raw land.
STRATEGY 1:Provide incentives for conservation subdivision development.
STRATEGY 2:Identify, market, and provide incentives to develop available land in existing developed urban areas.
STRATEGY 3:Promote the use of concurrency planning to guide development to places that possess adequate infrastructure.
GOAL 4: Manage development in a way that will make the most effective use of land, energy, infrastructure, and public services
GOAL 3: Achieve a jobs-to-housing balance to discourage commuting trips and enhance quality of life continued
GOAL 3 INDICATORS OF SUCCESS1. Decrease in the average commuting time to work.
2. Changes in population and employment densities.
3. Increase in the number and type of continuing education opportunities and enrollments.
4. Increase in the mix of education levels for residents.
5. Changes in the amount of employment-dedicated land uses.

p // 1-15
PLAN
ELE
ME
NT
1GROWTH, DEVELOPMENT and PLACEMAKING
GOAL 6: Promote placemaking for diverse, sustainable, livable communities
STRATEGY 1:Encourage the increased use of alternative land use regulation systems such as SmartCode and Form Based Codes that address building structure, form and placement to promote placemaking.
STRATEGY 2:Promote the use of density bonuses to encourage developers to increase development intensity and utilization of mixed use development.
STRATEGY 3:Coordinate with the local ULI chapter to create a regional toolkit that demonstrates locally supported design practices that respect the region’s history while embracing new development.
STRATEGY 4:Establish local and regional processes for developments of “regional impact” or master planned communities, allowing for intergovernmental coordination and/or regional cooperation.
OBJECTIVE 6-2: Develop a palette of place types that are authentic, unique and attributable to the BCD region and its sub-regions.
POLICY: Foster a strong sense of place in new development.
STRATEGY 1:Identify various existing and accepted development patterns (e.g. urban, small town and rural hamlets) that differentiate the sub-regions of the tri-counties and provide development and design guidelines that support these patterns. These might include recommendations for the public realm, residential density or transportation options.
STRATEGY 2:Continue to promote walkability in neighborhoods and community/town centers with interconnected sidewalks and pedestrian amenities.
STRATEGY 5:Use intergovernmental, community-based strategies to establish development performance standards to protect environmentally sensitive areas and areas of significant cultural and historical value.
STRATEGY 6:Promote the implementation of a regional “design institute” similar to Charleston’s Civic Design Center for technical assistance and education on matters involving community design and Lowcountry character.
STRATEGY 7:Encourage training and workshops on placemaking and community-building.
STRATEGY 8:Promote the use of a unified regional “brand” through wayfinding signage, streetscape elements, including native plantings, and international marketing efforts.
OBJECTIVE 6-3: Market historic resources for tourism efforts.
POLICY: Focus on celebrating the rich historic heritage of the region.
STRATEGY 1:Continue to support the Charleston Visitors Bureau to run marketing campaigns targeted at out of state residents
STRATEGY 2:Continue to coordinate with the local historic societies to identify and integrate historic structures into the fabric of the community.
STRATEGY 3:Promote the identification of all historic structures for the region through a comprehensive inventory campaign.
OBJECTIVE 6-1: Continue the Lowcountry’s tradition of placemaking and urban design. Facilitate both becoming a primary underpinning of development so that neighborhoods are sustained and that unnecessary or inefficient land consumption is lessened and the premature loss of agricultural land is avoided.
POLICY: Foster successful placemaking and urban design policies at the regional level and coordinate with local goals.
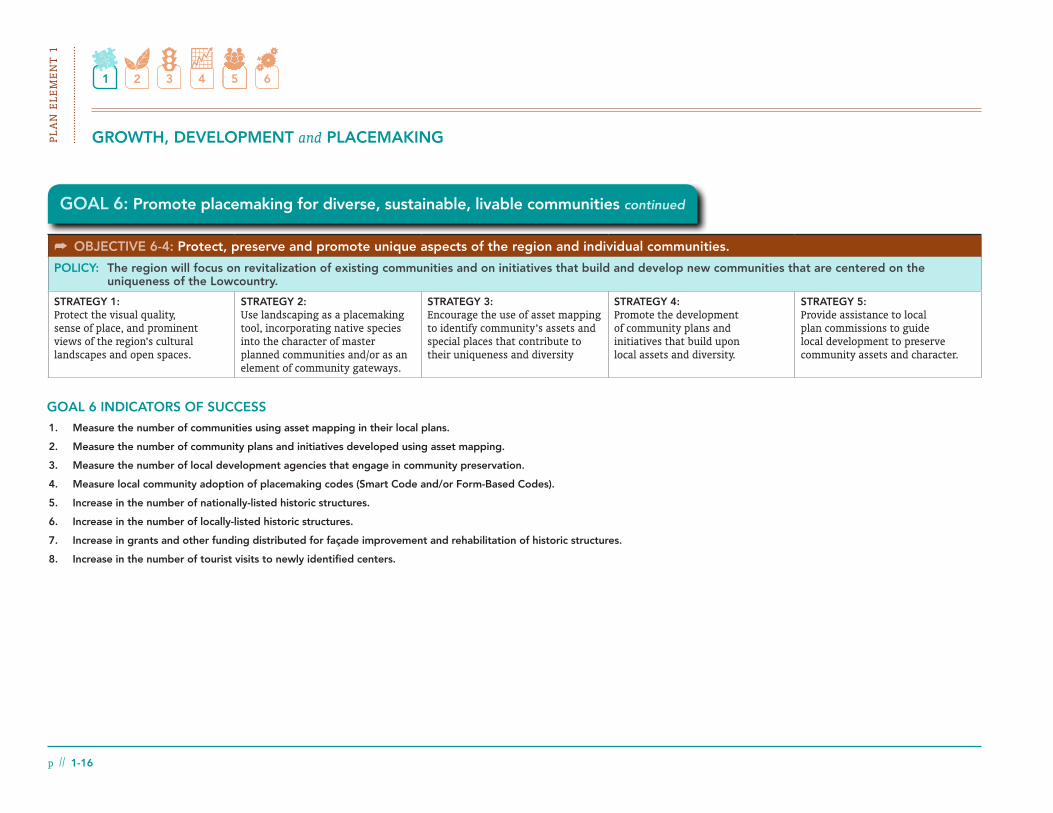
PLA
N E
LEM
EN
T 1
GROWTH, DEVELOPMENT and PLACEMAKING
p // 1-16
OBJECTIVE 6-4: Protect, preserve and promote unique aspects of the region and individual communities.
POLICY: The region will focus on revitalization of existing communities and on initiatives that build and develop new communities that are centered on the uniqueness of the Lowcountry.
STRATEGY 1:Protect the visual quality, sense of place, and prominent views of the region’s cultural landscapes and open spaces.
STRATEGY 2:Use landscaping as a placemaking tool, incorporating native species into the character of master planned communities and/or as an element of community gateways.
STRATEGY 3:Encourage the use of asset mapping to identify community’s assets and special places that contribute to their uniqueness and diversity
STRATEGY 4:Promote the development of community plans and initiatives that build upon local assets and diversity.
STRATEGY 5:Provide assistance to local plan commissions to guide local development to preserve community assets and character.
1. Measure the number of communities using asset mapping in their local plans.
2. Measure the number of community plans and initiatives developed using asset mapping.
3. Measure the number of local development agencies that engage in community preservation.
4. Measure local community adoption of placemaking codes (Smart Code and/or Form-Based Codes).
5. Increase in the number of nationally-listed historic structures.
6. Increase in the number of locally-listed historic structures.
7. Increase in grants and other funding distributed for façade improvement and rehabilitation of historic structures.
8. Increase in the number of tourist visits to newly identified centers.
GOAL 6 INDICATORS OF SUCCESS
GOAL 6: Promote placemaking for diverse, sustainable, livable communities continued

PLAN
ELE
ME
NT
2
Every Lowcountry community within the region is distinct and each has its own particular issues, but the environmental resources are common to us all, physically extending across municipal and county borders and providing region-wide, shared benefits. Planning for these resources is most effective when it’s done at a regional level as the issues and opportunities are similarly unconstrained by political boundaries. By working regionally, we will help each community
Plan Element 2: NATURAL ENVIRONMENT
The Lowcountry is an iconic region rich with natural resources and distinctive
landscapes. Our natural environment is one of the region’s most defining characteristics and
it has been integral to our identity since the area was settled in the 1600s. Our relationship
is not a simple one as the opportunities our environment blesses us with are often tempered
by accompanying issues that challenge us and our way of life. Over time it has both fortified
and challenged us – offering refuge, sustenance and valuable goods while also testing our
fortitude to survive hurricanes, tropical storms, and even swampy, boggy landscapes that are
often unfriendly and at times arduous.
achieve its goals, but first we need to ask ourselves difficult questions: How will we preserve the unique environment of the Lowcountry? How will we ensure its biodiversity is protected? How will we best prepare for and mitigate the impacts of coastal hazards? How will we pursue growth while managing its impacts on the natural environment? These are the questions that we will answer as we plan for the future of our natural environment, our region and our quality of life.
By considering these questions, we will be empowered and better able to meet our long term goals of protecting regional water resources and quality, maintaining adequate air quality, preserving the natural environment, fostering a network of green infrastructure, and protecting rural and open space. To meet these goals, our
THE FOUR HOLES SWAMP HAS TREES THAT ARE OVER 1,000 YEARS OLD AND THE LARGEST REMAINING STAND OF VIRGIN BALD CYPRESS AND TUPELO GUM SWAMP FOREST.
SOURCE: AUDUBON BEIDLER FOREST, 2012 (BEIDLERFOREST.AUDUBON.ORG/OVERVIEW-2)
p // 2-1
6 Figure 2-1: A sprawling angel oak tree. Source: Flickr – Charleston’s TheDigitel.
6 Figure 2-2: Four Holes Swamp. Source: Flickr – Duane Burdick.
8 Figure 2-3: Beidler Forest Trillium. Source: Flickr – Drama Queen.

PLA
N E
LEM
EN
T 2
NATURAL ENVIRONMENT
p // 2-2
numerous species, they support our economy by providing commodities, they temper the effects of tropical storms and climate change, and they serve as the backbone of the BCD region’s high quality of life by offering recreation opportunities and scenic amenities that attract tourists and outdoor enthusiasts. Preserving these resources ensures that these opportunities are not only available to us, but to future generations as well. To do this, we must better understand our natural environment and its valuable resources, as well as the threats
they face and the efforts needed to protect them.
Our region’s unique environmental context can best be understood by considering the breadth of natural resources we possess. The Lowcountry is most commonly associated with its coastal and water resources including the Atlantic Ocean, sea islands and beaches that attract millions of visitors every year, Charleston Harbor, and the rivers and tidal lands that are dotted with historic plantations. In addition to these vast coastal
actions must align with the guiding principles that frame our vision for the future of the Lowcountry and be carried out through policies and strategies built upon accepted best practices and measured by regional indicators of success.
ISSUES AND OPPORTUNITIES
Our natural environment presents numerous issues and opportunities for the Lowcountry. Irrespective of our political boundaries, they have the potential to impact us on a grand scale, either enhancing or impeding our growth and prosperity. Biodiversity and unique landscapes provide us with the means of having a high quality of life, full of opportunities for recreation, tourism and related businesses. The challenge is preserving these assets by mitigating development impacts and managing the coastal hazards and vulnerabilities to which our environment is subject.
» Preserving the Unique Environmental Context of the BCD Region
The Lowcountry is known for its unique landscapes and ecosystems and these are perhaps some of the most alluring features of the BCD region. As we plan for the future, these are forefront in our mind as we desire to preserve them and the opportunities they bless us with: they provide critical habitat for
8 Figure 2-4: Bald Cypress trees in the Francis Marion National Forest. Source: USDA Forest Service.
160,000 PEOPLE VISIT
THE 66,267 ACRE CAPE
ROMAIN NATIONAL
WILDLIFE REFUGE
EVERY YEAR.
SOURCE: WWW.FWS.GOV/CAPEROMAIN/FACTS.HTML, 2009

p // 2-3
PLAN
ELE
ME
NT
2NATURAL ENVIRONMENT
dunes, salt marshes and maritime forests. The Cape Romain NWR stretches 22 miles along the Atlantic Coast, made up of numerous barrier islands, including the largest and most significant – Bulls Island. Bulls Island is known around the world for its birdlife; its impoundments, salt marshes, mud flats and forest support the majority of the 277 bird species found in the Cape Romain NWR, including
National Wildlife Refuge. These refuges combined cover over 78,000 acres of the region’s coast.
The Cape Romain NWR is one of the region’s most unique and diverse landscapes. Of the refuge’s 66,000 acres, 31,000 acres consist of open water and over 35,000 acres are comprised of fresh and brackish water impoundments, beaches, sand
and water resources, we are also blessed with significant agricultural and forest resources.
Because of its low elevation, coastal setting and the confluence of the Wando, Ashley and Cooper Rivers with the Atlantic Ocean, the Lowcountry has a strong cultural and physical connection to water. It possesses tidal lands, estuaries, boggy swamps and wetlands in addition to its network of rivers; in fact, approximately 18% of the tri-county region is made up of water and another 27% is considered wetland.1
This network of water resources not only supports the numerous recreational and commercial activities the region is known for, including fishing and shipping, but it also sustains a diverse range of wildlife. Endangered and threatened species like the wood stork, bald eagle and American alligator make their home in the region’s forests and open spaces, including the National Wildlife Refuges (NWR): the Cape Romain National Wildlife Refuge and the Ashepoo Combahee Edisto (ACE) Basin
1 BCDCOG Regional Data, 2010.
6 Figure 2-5: Boneyard Beach on Bulls Island in the Cape Romain National Wildlife Refuge is littered with dead oak, cedar and pine trees. According to the US Fish and Wildlife Service, the sea is creeping up at a rate of about 25 to 30 feet a year, slowly overtaking a maritime forest. Source: Flickr – US Fish and Wildlife Service, Stacy Shelton.
EIGHTEEN PERCENT OF THE BCD REGION IS COVERED IN WATER, AND ANOTHER 27% IS CONSIDERED WETLAND.

p // 2-4
PLA
N E
LEM
EN
T 2
// N
ATU
RA
L E
NV
IRO
NM
EN
TFigure 2-6: Lowcountry Environmental Resources
The Lowcountry is home to a number of forests and natural areas including the Francis Marion National Forest, Beidler Forest, Four Hole Swamp and the ACE Basin and Cape Romain National Wildlife Refuges. Source: BCDCOG and HNTB, 2012.

p // 2-5
PLAN
ELE
ME
NT
2NATURAL ENVIRONMENT
migrating waterfowl, shorebirds and resident species such as the American oystercatcher, egrets, black ducks, wigeon, woodpeckers and raptors. Cape Island, one of the northernmost barrier islands in Cape Romain, hosts the most substantial number of nesting Loggerhead sea turtles north of Cape Canaveral. With abundant flora and fauna, Cape Romain’s landscape appeals to outdoor and wildlife enthusiasts, affording opportunities for bird watching and wildlife viewing, hiking, shelling, fishing and bow hunting.
While smaller in scale, at around 12,000 acres, the ACE Basin NWR is located along the Atlantic Flyway, a bird migration route that generally follows the Atlantic Coast of North America and the Appalachian Mountains. The ACE Basin NWR was once cultivated for rice production and served as a hunting retreat for the wealthy. Today it is a permanent refuge for migratory birds, such as wood ducks, pintails, painted buntings and ruby-throated hummingbirds, and also provides critical habitat for local species of birds, fish and wildlife.
The ACE Basin’s history as a rice plantation is evidence of the strong connection between our water resources, agriculture, economy and culture. Crops like indigo and rice were cultivated on tidal lands and swamps by manipulating the landscape to create more hospitable growing conditions that benefitted from the changing tides, fertile
soil, and cooling sea breezes that characterize our coastal climate. These crops became the major export commodities of both the Lowcountry and the New World, establishing the Lowcountry as an economic center and port while rooting our culture in its agricultural heritage.
Vast plantations were in fact the center of both our economy and cultural life up until the Civil War, lining the Cooper, Santee and Ashley Rivers as well as other waterways that provided the needed infrastructure to produce, ship, and receive supplies and crops. Only five of the remaining plantations are open to the public today, including Drayton Hall, Middleton Place, and Magnolia. While plantations no longer drive our economy, they play a starring role in the Lowcountry’s tourism industry and serve as reminders of agriculture’s importance to our region’s culture and prosperity.
In 2007, the BCD region had approximately 159,000 acres of agricultural land. However, our agricultural resources are dwindling as development advances outward into the rural Lowcountry landscape. In fact, in 2002 there was approximately 162,000 acres of agricultural land, a decrease of 3,000 acres.2 To retain our Lowcountry agricultural identity and its role in our regional
2 USDA, National Agricultural Statistics Service, Census of Agriculture, County Data, South Carolina, 2002 and 2007.
economy, preservation of the historic plantations as well as our agricultural landscapes and working farms are a high regional priority.
The Lowcountry’s forest resources are no less valuable or connected to our coastal and water
6 Figure 2-7: Longleaf pines are part of the timbered landscape of the Francis Marion National Forest, a strong contrast to cypress trees in the forested swamps of the Francis Marion. Source: Flickr – cm195902.

PLA
N E
LEM
EN
T 2
NATURAL ENVIRONMENT
p // 2-6
resources than agriculture. Hundreds of thousands of acres of forested and timbered lands in the BCD region are managed for habitat, watershed and resource protection as well as timber production. The largest is the almost 259,000-acre Francis Marion National Forest, which spreads across Berkeley and Charleston Counties, edging the Santee River as it runs from Lake Moultrie to the Atlantic coast. In addition to providing recreation opportunities such as hiking, cycling and camping, the USDA Forest Service manages the Francis Marion for timber and wood production. With its significant size and location in the upper reaches of the Santee and Cooper watersheds, the Francis Marion plays a strategic role in protecting our local and regional water resources – including ground water, the waters of the Santee and Cooper Rivers, and downstream coastal habitats and resources like the Cape Romain NWR that are critical to our region’s biodiversity, economy and culture.
While much smaller in size, the 16,000-acre Francis Beidler Forest in the Four Holes Swamp crossing Berkeley and Dorchester Counties also helps protect water quality and coastal habitats. Run by Audubon South Carolina, Beidler Forest is best known for its old growth cypress and tupelo swamp containing trees believed to be well over 1,000 years old. The Four Holes Swamp covers a larger area than the Forest itself with over 45,000 acres of networked swamps and lakes, which feed into the Edisto River
before travelling on to coastal waters. To facilitate resource conservation, public access in the Beidler Forest is limited to a Visitor Center, a 1¾ mile boardwalk and guided canoe tours.
Collectively, the Francis Marion and Beidler Forests and the Four Holes Swamp cover a significant portion of the BCD region, extending outside of the three counties and providing extensive regional benefits. Their relationship to the broader landscape and role in protecting our unique environmental ecosystems illustrate the need for a regional approach to resource protection. By protecting these
and other environmental assets, we will safeguard our economy and quality of life by ensuring that both commercial and recreational fishing, shrimping, and crabbing remain viable, sustainable and a central part of the Lowcountry culture.
» Biodiversity
A study conducted by the Nature Conservancy
determined that nearly 80 rare, imperiled or critically imperiled species are only capable of living below the ten-foot contour along the United States coastline.3 This reveals the significance of the Lowcountry and our low-lying coastal areas to species survival and biodiversity. The Cape Romain and ACE Basin NWR ecosystems play
3 Neumann, James E., Gary Yohe, Robert Nicholls, and Michelle Manion. Sea-level Rise & Global Climate Change: A Review of Impacts to U.S. Coasts. Washington D.C.: Pew Center on Global Climate Change, 2000.
6 Figure 2-8: Environmental scientists collect grass shrimp at Shipyard Creek in Charleston, a former Environmental Protection Agency Superfund site. Grass shrimp are monitored monthly and serve as indicators of the health of the salt marsh ecosystem. Source: Flickr – NOAA’s National Ocean Service.
NEARLY 80 RARE, IMPERILED OR CRITICALLY IMPERILED SPECIES ARE ONLY CAPABLE OF LIVING BELOW THE TEN-FOOT CONTOUR ALONG THE UNITED STATES.
SOURCE: NEUMANN, YOHE, NICHOLLS, & MANION, 2000

p // 2-7
PLAN
ELE
ME
NT
2NATURAL ENVIRONMENT
substantial roles in providing critical habitats to threatened and endangered species like the wood stork, bald eagle, American alligator, American oystercatcher and shortnose sturgeon. Along with the Francis Marion National Forest, the NWRs also provide important breeding and feeding grounds for migratory birds that travel along the Atlantic Flyway. The Francis Marion National Forest itself is home to 32 species of orchids, 12 species of carnivorous plants, black bears, bobcats and significant populations of birds that have high conservation priority including the black-throated green warbler, Swainson’s warbler, the swallow-
tailed kite that makes its nest high in the forest canopy as well as the endangered red-cockaded woodpecker that is dependent upon the forest’s large stands of longleaf pines. As of 2000, South Carolina was home to nearly 20% of all known red-cockaded woodpecker groups, which are made up of a breeding pair and up to seven (7) “helpers”. Over one-third, or 344, of the more than 1,000 South
Carolina groups made their nest in the Francis Marion National Forest in 2000; estimates at that time indicated that private lands supported another 400 groups.
While the Francis Marion National Forest and the ACE Basin and Cape Romain NWRs provide much of the region’s critical habitat, these landscapes are only part of a much larger, regional network of “green infrastructure” throughout the BCD region that includes other publicly protected or privately held forested lands, wetlands, marshes, waterways, and open space. Green infrastructure functions as nature’s utility service, collecting and filtering stormwater and cooling and cleaning the air, resulting in less pollution, reduced urban heat island effects and higher quality habitats. As more of the region is developed, these habitats are threatened, degraded or eliminated and the green infrastructure network becomes less functional and more fragmented,
making the Lowcountry even less capable of supporting species biodiversity. By protecting and enhancing green infrastructure, we will not only provide habitat for threatened and endangered species, but will also sustain the biodiversity of the entire Atlantic Coastal region and the vitality of our economy.
» Coastal Hazards and Regional Vulnerabilities
The protection of our green infrastructure and its critical habitats, ecosystems, and open space not only ensures that we have adequate resources for wildlife and recreation, but it also helps safeguard our drinking water supplies and limits our vulnerability to coastal hazards. The region is susceptible to a number of hazards including tornadoes, earthquakes, coastal erosion, fires, sea level rise, flooding, and, of particular concern to
8 Figure 2-9: This American oystercatcher spotted in the Cape Romain National Wildlife Refuge is considered a high priority shorebird on the eastern coast due to the degradation of its beach nesting habitat and low population counts. According to the South Carolina Department of Natural Resources, over one-third of the oystercatchers that winter along the U.S. Atlantic and Gulf Coasts are supported by South Carolina habitat. 50 to 60% of South Carolina’s wintering oystercatchers are in the Cape Romain region. Source: Flickr – US Fish and Wildlife Service – Garry Tucker.
THE RED-COCKADED
WOODPECKER
WAS ONE OF THE
FIRST SPECIES
TO BE LISTED AS
ENDANGERED WHEN
CONGRESS PASSED
THE ENDANGERED
SPECIES ACT IN
1973. IN SOUTH
CAROLINA, THE
BIRD IS CONSIDERED
IMPERILED.

p // 2-8
Figure 2-10: The BCD Region’s Green Infrastructure
The BCD region contains a highly complex system of open space, natural resources and agricultural lands. Together with greenways and waterways, they make up the region’s green infrastructure, protecting regional biodiversity and providing a utility function not unlike traditional “grey” infrastructure that carries storm and waste water and protects us from flooding, among other functions. In the Vision Plan for the future of the Lowcountry, these resources are buffered for protection, emphasizing the importance of their connectivity. Source: BCDCOG and HNTB, 2012.
PLA
N E
LEM
EN
T 2
// N
ATU
RA
L E
NV
IRO
NM
EN
T

p // 2-9
PLAN
ELE
ME
NT
2NATURAL ENVIRONMENT
the Lowcountry, hurricanes and tropical storms. Combined, these hazards threaten our personal safety, economy and communities.
From 1973 to 2000, the region’s impervious surfaces increased 318% while the population only increased by 52%. As the amount of impervious surface coverage is an indicator of urbanization, this data reveals that during that 17-year period, the BCD region urbanized six times as fast as the population grew.4 These growth patterns have resulted in reductions in our green infrastructure
4 Federal Highway Administration. "Scenario Planning Peer Workshop." Monterey, California, June 2, 2006.
as open space, forested and agricultural land have been converted to developed land. Consequently, this has increased the region’s vulnerability to storms and other coastal hazards because these resources play an important role in reducing hazard risks. For example, upland forests protect downstream water quality, while coastal marshes and wetlands protect our uplands from storm surges and saltwater intrusions, both of which cause flooding and heighten our vulnerability to storms.5
5 Neumann, James E., Gary Yohe, Robert Nicholls, and Michelle Manion. Sea-level Rise & Global Climate Change: A Review of Impacts to U.S. Coasts. Washington D.C.: Pew Center on Global
The risks and vulnerabilities we face with storm events and coastal hazards are not to be taken lightly. From 1994 to 2011, hazards, including hurricanes, tropical storms, flooding, hail, heat, lighting, tornadoes and wind, caused over $44.5 million (2011 US Dollars) in property damage in the three counties, resulted in 54 injuries and 14 fatalities.6 From 1980 to 2011, these same hazards resulted in over $2.6 billion (2011 US Dollars) in property damage, nearly 100 injuries and 59 deaths in the three counties (15).7
Climate Change, 2000.6 SHELDUS| Spatial Hazard Events and Losses Database for
the United States. University of South Carolina Hazards and Vulerability Research Institute. May 18, 2011. "Hazards & Vulnerability Research Institute (2011). The Spatial Hazard Events and Losses Database for the United States, Version 9.0 [Online Database]. Columbia, SC: University of South Carolina. Available from http://www.sheldus.org (accessed April 19, 2012).
7 SHELDUS| Spatial Hazard Events and Losses Database for
6 Figure 2-11: Damage from Hurricane Hugo to the barrier islands of Isle of Palms and Sullivan’s Island illustrate the economic and physical destruction from natural hazards in addition to threats to residents’ lives. Source: USGS.
FROM 1980 TO 2011, HURRICANES, TROPICAL STORMS, FLOODING, HAIL, HEAT, LIGHTING, TORNADOES AND WIND, CAUSED OVER $2.6 BILLION (2011 US DOLLARS) IN PROPERTY DAMAGE, NEARLY 100 INJURIES AND CAUSED 59 DEATHS IN THE THREE COUNTIES.
SOURCE: SHELDUS| SPATIAL HAZARD EVENTS AND LOSSES DATABASE FOR THE UNITED STATES, 2011
6 Figure 2-12: Hurricane Hugo made landfall north of Charleston on September 22, 1989. The eye of the storm was centered on the BCD region, but the damage extended well past Charlotte, NC, due to its hurricane-force winds. Source: NOAA.

PLA
N E
LEM
EN
T 2
NATURAL ENVIRONMENT
p // 2-10
Much of the damage in this larger time period was due to Hurricane Hugo, which struck the Lowcountry in September 1989, produced $1.6 billion (2011 US Dollars) in property damages, and brought about 20 injuries and eight (8) fatalities. Ten years later, in September 1999, Hurricane Floyd struck the BCD region. Largely because the eye of the storm hit North Carolina, Floyd did not result in any injuries or deaths, but it still caused $5.8 million (2011 US Dollars) in property damage.8 As the region’s population grows and our infrastructure expands to meet the needs of growing communities, property damages will likely increase and more lives will be at risk to hazards like these.
We need not only be concerned with major storm and hazard events, but we must also be prepared
the United States. University of South Carolina Hazards and Vulerability Research Institute. May 18, 2011. "Hazards & Vulnerability Research Institute (2011). The Spatial Hazard Events and Losses Database for the United States, Version 9.0 [Online Database]. Columbia, SC: University of South Carolina. Available from http://www.sheldus.org (accessed April 19, 2012).
8 SHELDUS| Spatial Hazard Events and Losses Database for the United States. University of South Carolina Hazards and Vulerability Research Institute. May 18, 2011. "Hazards & Vulnerability Research Institute (2011). The Spatial Hazard Events and Losses Database for the United States, Version 9.0 [Online Database]. Columbia, SC: University of South Carolina. Available from http://www.sheldus.org (accessed April 19, 2012).
for the threats that loom on a more regular basis. Tidal flooding is one such example. Extremely high tides, those of seven (7) feet or more, can flood roadways – creating road hazards, causing significant traffic disruptions and shuttering businesses. When high winds strike during extremely high tides, the threats are even more severe as high winds whip tidal waters further inland, resulting in more substantial flooding. In 2010, five (5) flood-producing tides were predicted to hit Charleston, yet when the year was finally up, a total of 19 flood producing tides had washed over the region, evidence of the constant threats posed by coastal hazards.9
With high probability for all of these natural events, the lives of the Lowcountry people are our
9 NOAA Coastal Services Center; South Carolina Sea Grant Consortium; City of Charleston. "Coastal Climate Adaptation." Resources. January 20, 2011. http://collaborate.csc.noaa.gov/climateadaptation/Lists/Resources/ AllItems.aspx (accessed April 19, 2012).
highest priority. Our greatest opportunity to save future lives – and the businesses that support us and our economy – is the forward planning that we are doing with OurRegion OurPlan. Making wise transportation and land use decisions will allow us to grow and prosper while protecting the natural resources that lessen our vulnerability to such events, including wetlands, coastal marshes, and open space. We must also continue to pursue advancements in building technologies and standards that help save lives once a hazard strikes, especially in the face of floods, hurricanes and earthquakes. These steps are critical to our future and the strength of our regional economy.
» Development Impacts on the Environment
While the attractiveness of the region may make growth inevitable, regional growth need not result in negative impacts on this unique environment. Similarly, our increasing vulnerability to coastal and other hazards are not the only environmental concerns we face. As the region continues to grow at a pace that surpasses our population growth, development is becoming increasingly dispersed and less concentrated around our existing historic communities and neighborhoods. The growth that has dispersed into our rural areas has resulted in fewer acres available for farming and agricultural uses as well as a reduction in forested lands, open space and wetlands.
IN 2010, FIVE FLOOD-PRODUCING TIDES WERE PREDICTED TO HIT CHARLESTON. WHEN THE YEAR WAS UP, A TOTAL OF 19 FLOOD PRODUCING TIDES HAD HIT THE REGION.
SOURCE: NOAA COASTAL SERVICES CENTER; SOUTH CAROLINA SEA GRANT CONSORTIUM; CITY OF CHARLESTON, 2011

p // 2-11
PLAN
ELE
ME
NT
2NATURAL ENVIRONMENT
These increasingly dispersed development patterns result in unintended consequences: we lose valuable open space and we drive farther and farther to get to work or run errands, which results in lost productivity, increased fuel costs, traffic congestion, vehicle emissions and air quality degradation. Currently, ozone levels for Charleston County register at .074 parts per million (ppm) – just 0.001 ppm below the EPA’s standard for air quality and dangerously close to achieving “non-attainment” status, which signifies that the region has unacceptable air quality for human activity. While the Lowcountry might be at an acceptable level now, it is a precarious situation. Both population growth and expansion of our region’s industries have the potential to make our air quality worse if mitigating actions are not taken.
An example of this can be seen with the expansion
of the Charleston Naval Complex port. While the expansion would bring much needed economic development to the Lowcountry, an Environmental Impact Statement (EIS) for the port expansion found that there would be long-term adverse environmental impacts associated with it. Fortunately, the insights obtained from the EIS created an opportunity for the port to develop a coordinated mitigation plan to control emissions and maintain or improve our air and water quality while still advancing the region’s economy.
Preservation of a network of open space, wetlands and other green infrastructure are important elements in our region’s mitigation plans as they not only work as a system to collect, store and filter stormwater, but they also help cool and clean the air. This reduces air pollution and heat islands and lessens the impacts of coastal and tropical storms. Because of its ability to mitigate the impacts of development and industrial activity, green infrastructure has enormous potential to help the Lowcountry be more resilient in the face of hazards and other uncertainties, while also enhancing our quality of life and economic opportunities.
In achieving a better match between the rate of population growth and the rate of urbanization in the BCD region, we will not only preserve our green infrastructure, but we will also foster the development of centers of economic activity. These
centers will be synergistic environments that foster business development, create more jobs, and enhance our quality of life and the stability of our region’s economy and environment.
GUIDING PRINCIPLES
As we plan for the future of the BCD region, the preservation and enhancement of our natural environment will be a high priority. In order to meet these goals, it is necessary that the impacts of growth and development be mitigated, the environmental hazards that threaten the stability and safety of our economy and communities be lessened, our unique Lowcountry environment be preserved, and the biodiversity of the region be supported. Our path to implementing our goals can be guided through a defined set of objectives, policies, and strategies. Indicators can be used to measure the effectiveness of our strategies.
NATURAL ENVIRONMENT FRAMEWORK
» Goals
Achieving the following Natural Environment goals will ensure the collective vision of the community is realized:
FROM 1973 TO 2000, THE REGION’S IMPERVIOUS SURFACES INCREASED 318% WHILE THE POPULATION ONLY INCREASED BY 52%. AS THE AMOUNT OF IMPERVIOUS SURFACE COVERAGE IS AN INDICATOR OF URBANIZATION, THIS DATA REVEALS THAT THE BCD REGION IS URBANIZING SIX TIMES AS FAST AS OUR POPULATION IS GROWING.
SOURCE: BCDCOG, FEDERAL HIGHWAY ADMINISTRATION, 2006 SCENARIO PLANNING WORKSHOP

PLA
N E
LEM
EN
T 2
NATURAL ENVIRONMENT
p // 2-12
These goals describe a desired end state toward which planning efforts should be directed. They are broad-based and long-range in focus, representing an end to be sought.
1. Protect water resources and quality
2. Maintain adequate air quality
3. Preserve the natural environment and foster a network of green infrastructure
4. Protect our rural and open spaces
» The Path to Implementation: Objectives, Policies, Strategies and Indicators
To provide a framework for achieving the regional vision, a series of objectives, policies and strategies is provided below. These objectives, policies and strategies are advisory in nature and intended to guide regional and local jurisdictions, stakeholders and the BCDCOG in reaching the goals.
GOAL 1: Protect water resources and quality
OBJECTIVE 1-1: Improve regional water quality and protect drinking water sources by reducing non-point source pollution.
POLICY: Promote continued adoption of tools and techniques that minimize stormwater runoff and non-point source pollution.
STRATEGY 1:Encourage the installation and maintenance of pollutant filtering mechanisms, such as rain gardens, green roofs, street trees, increased green space and permeable services, in buildings to minimize point source pollution.
STRATEGY 2:Establish incentives, such as density bonuses and reduced impact fees to reward alternative stormwater management strategies that decrease runoff volumes and improve water quality.
STRATEGY 3:Establish appropriate building setbacks in the region’s riparian areas to protect surface and ground water quality. Increase building setbacks from riparian areas adds additional filtration buffers which helps reduce the amount of pollutants entering streams and creeks.
STRATEGY 4:Incorporate policies from natural disaster hazard mitigation plans to address changes in sea levels and tidal flooding, which can contribute to non-point source pollution and water quality degradation.
STRATEGY 5:Foster the establishment of protective buffers around sensitive green spaces, waterways, jurisdictional wetlands, etc.
Note: Protective buffers reduce the impacts to these elements and improve water quality through filtration areas.
OBJECTIVE 1-2: Educate the public and government officials about the sources and impacts of non-point source pollution.
POLICY: Support the public outreach campaigns and programs that provide information about the sources and impacts of non-point source pollution.
STRATEGY 1:Aid in developing educational materials, such as pamphlets, to hand out at public events.
STRATEGY 2:Partner with local radio and news media to develop public service announcements and educational commercials.
STRATEGY 3:Continue to coordinate with South Carolina Sea Grant on their Coastal Communities Program and South Carolina Nonpoint Education for Municipal Officials (SC NEMO) program, as well as other regional stakeholder agencies, to bring awareness to the general public about the sources and impacts of non-point source pollution.
STRATEGY 4:Continue to work with local and county governments to strengthen infrastructure policies that encourage local industries and private land owners to reduce pollution.
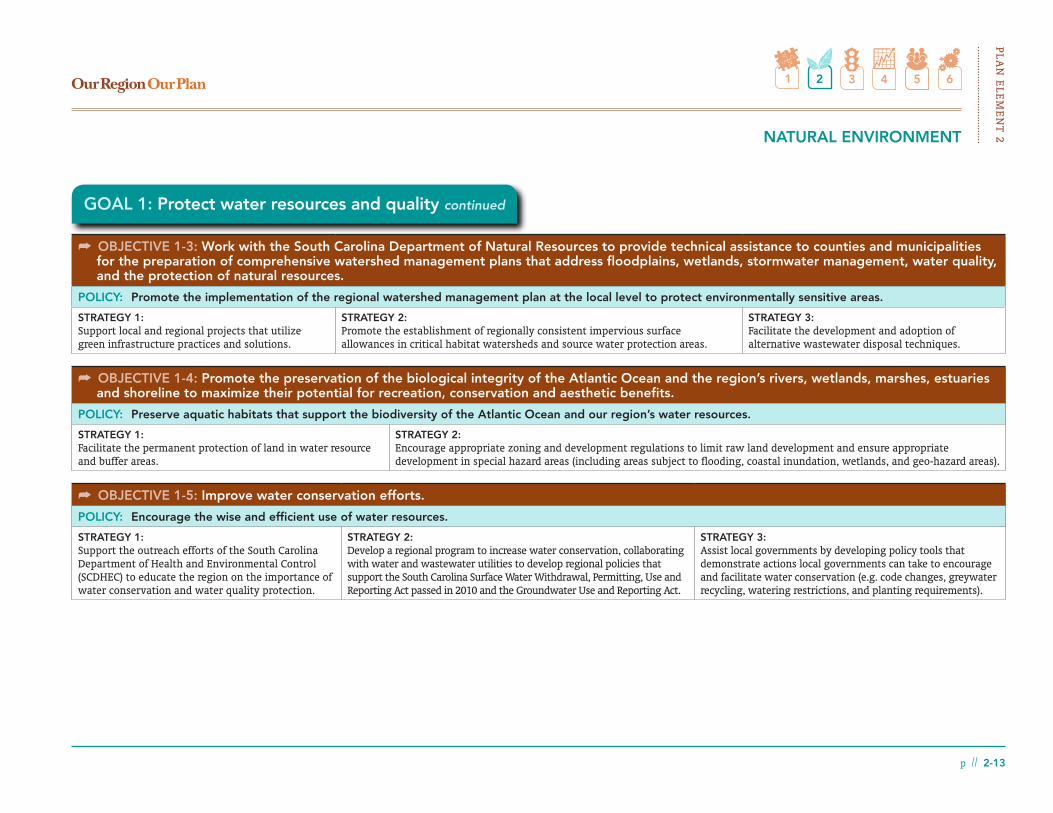
p // 2-13
PLAN
ELE
ME
NT
2NATURAL ENVIRONMENT
GOAL 1: Protect water resources and quality continued
OBJECTIVE 1-3: Work with the South Carolina Department of Natural Resources to provide technical assistance to counties and municipalities for the preparation of comprehensive watershed management plans that address floodplains, wetlands, stormwater management, water quality, and the protection of natural resources.
POLICY: Promote the implementation of the regional watershed management plan at the local level to protect environmentally sensitive areas.
STRATEGY 1:Support local and regional projects that utilize green infrastructure practices and solutions.
STRATEGY 2:Promote the establishment of regionally consistent impervious surface allowances in critical habitat watersheds and source water protection areas.
STRATEGY 3:Facilitate the development and adoption of alternative wastewater disposal techniques.
OBJECTIVE 1-4: Promote the preservation of the biological integrity of the Atlantic Ocean and the region’s rivers, wetlands, marshes, estuaries and shoreline to maximize their potential for recreation, conservation and aesthetic benefits.
POLICY: Preserve aquatic habitats that support the biodiversity of the Atlantic Ocean and our region’s water resources.
STRATEGY 1:Facilitate the permanent protection of land in water resource and buffer areas.
STRATEGY 2:Encourage appropriate zoning and development regulations to limit raw land development and ensure appropriate development in special hazard areas (including areas subject to flooding, coastal inundation, wetlands, and geo-hazard areas).
OBJECTIVE 1-5: Improve water conservation efforts.
POLICY: Encourage the wise and efficient use of water resources.
STRATEGY 1:Support the outreach efforts of the South Carolina Department of Health and Environmental Control (SCDHEC) to educate the region on the importance of water conservation and water quality protection.
STRATEGY 2:Develop a regional program to increase water conservation, collaborating with water and wastewater utilities to develop regional policies that support the South Carolina Surface Water Withdrawal, Permitting, Use and Reporting Act passed in 2010 and the Groundwater Use and Reporting Act.
STRATEGY 3:Assist local governments by developing policy tools that demonstrate actions local governments can take to encourage and facilitate water conservation (e.g. code changes, greywater recycling, watering restrictions, and planting requirements).
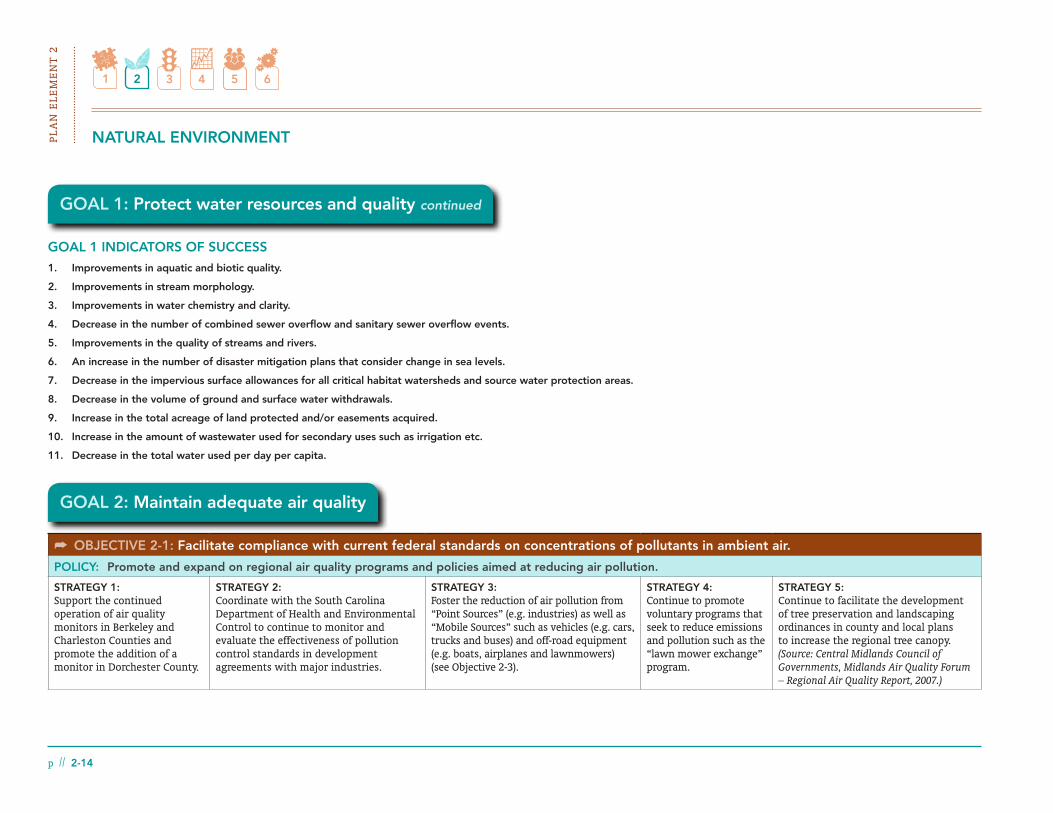
PLA
N E
LEM
EN
T 2
NATURAL ENVIRONMENT
p // 2-14
GOAL 1: Protect water resources and quality continued
1. Improvements in aquatic and biotic quality.
2. Improvements in stream morphology.
3. Improvements in water chemistry and clarity.
4. Decrease in the number of combined sewer overflow and sanitary sewer overflow events.
5. Improvements in the quality of streams and rivers.
6. An increase in the number of disaster mitigation plans that consider change in sea levels.
7. Decrease in the impervious surface allowances for all critical habitat watersheds and source water protection areas.
8. Decrease in the volume of ground and surface water withdrawals.
9. Increase in the total acreage of land protected and/or easements acquired.
10. Increase in the amount of wastewater used for secondary uses such as irrigation etc.
11. Decrease in the total water used per day per capita.
GOAL 1 INDICATORS OF SUCCESS
GOAL 2: Maintain adequate air quality
OBJECTIVE 2-1: Facilitate compliance with current federal standards on concentrations of pollutants in ambient air.
POLICY: Promote and expand on regional air quality programs and policies aimed at reducing air pollution.
STRATEGY 1:Support the continued operation of air quality monitors in Berkeley and Charleston Counties and promote the addition of a monitor in Dorchester County.
STRATEGY 2:Coordinate with the South Carolina Department of Health and Environmental Control to continue to monitor and evaluate the effectiveness of pollution control standards in development agreements with major industries.
STRATEGY 3:Foster the reduction of air pollution from “Point Sources” (e.g. industries) as well as “Mobile Sources” such as vehicles (e.g. cars, trucks and buses) and off-road equipment (e.g. boats, airplanes and lawnmowers) (see Objective 2-3).
STRATEGY 4:Continue to promote voluntary programs that seek to reduce emissions and pollution such as the “lawn mower exchange” program.
STRATEGY 5:Continue to facilitate the development of tree preservation and landscaping ordinances in county and local plans to increase the regional tree canopy. (Source: Central Midlands Council of Governments, Midlands Air Quality Forum – Regional Air Quality Report, 2007.)

p // 2-15
PLAN
ELE
ME
NT
2NATURAL ENVIRONMENT
GOAL 2: Maintain adequate air quality continued
OBJECTIVE 2-2: Facilitate the development and inclusion of alternative energy sources in the energy grid.
POLICY: Promote the development of alternative energy sources, such as offshore wind.
STRATEGY 1:Build support for and develop economic development initiatives around Clemson University’s Wind Turbine Drive Train Testing Facility to attract new businesses and agencies in the alternative energy industry in general and wind energy in particular.
STRATEGY 2:Develop policies that encourage communities and individuals to embrace alternative energy sources, including but not limited to wind, solar, nuclear, geothermal and fuel cell technologies.
STRATEGY 3:Create a “Landfill Methane Outreach Program” (LMOP) to promote Berkeley County’s landfill methane gas recovery and electricity generation station and encourage other counties and landfill operators to use landfill gas as an energy source. (Source: Central Midlands Council of Governments, Midlands Air Quality Forum – Regional Air Quality Report, 2007, and www.berkeleycountysc.gov, 2012.)
OBJECTIVE 2-3: Support transportation and land use policies that reduce congestion and air pollution, including Mobile Source pollution.
POLICY: Create a regional multi-modal transportation system.
STRATEGY 1:Pursue best-in-class public transit opportunities such as bus rapid transit.
STRATEGY 2:Continue to incorporate regional alternative transportation options connecting all three counties and major employment centers into long-term transportation programs.
STRATEGY 3:Continue to include pedestrian and bicycle infrastructure improvements in the CHATS Long Range Transportation Plan (LRTP) and pursue diverse funding sources such as Transportation Enhancements, Congestion Mitigation and Air Quality (CMAQ), and Surface Transportation Program grants.
POLICY: Encourage the use of sustainable development techniques to reduce air emissions and energy usage.
STRATEGY 1:Work with county and local municipalities to facilitate land use planning, policies and regulations that help improve air quality (e.g. Transit Oriented Development; compact, mixed-use development; infill development; LEED (Leadership in Energy and Environmental Design) and other national standards (National Home Builders and the Civil Engineering Society), live-work opportunities, employment areas sited near skilled workforces, business and development incentives to encourage ridesharing/carpooling and alternative transportation use).
STRATEGY 2:Educate local officials on the benefits of using LEED standards and other national standards and promote their use when constructing or renovating government facilities.
STRATEGY 3:Support the codification of LEED standards into county and municipal building codes.
STRATEGY 4:Facilitate the development of incentive programs for incorporating sustainable practices into design, e.g. expediting the permit process and reducing or waiving fees.
STRATEGY 5:Work with local governments to identify obstacles to incorporating sustainable design elements and practices such as green roofs and reductions in parking requirements.

PLA
N E
LEM
EN
T 2
NATURAL ENVIRONMENT
p // 2-16
GOAL 2: Maintain adequate air quality continued
1. Decrease in air pollutant levels.
2. Increase in the number of air pollution mitigation plans.
3. Increase in the number of alternative energy companies that provide technical expertise and/or manufacture the parts that are used to develop the alternative energy.
4. Increase in the number and length of trips on alternative modes of transportation, e.g. transit, bike and pedestrian trips, and carpooling.
5. Changes in commuting patterns and modal choice.
6. Decrease in the number of ozone action days per year.
7. Increase in the usage of alternative energy.
8. Decrease in fossil fuel usage.
9. Increase in the amount of new pedestrian and bicycle infrastructure built on an annual basis.
10. Increase in the number of LEED-certified structures.
11. Increase in the number of alternative energy source permits issued for buildings (i.e. solar panel permits for rooftops, individual wind turbine permits for residences, etc.).
12. Increase in the number of green roofs within the region.
GOAL 2 INDICATORS OF SUCCESS
GOAL 3: Preserve our natural environment and foster a network of green infrastructure
OBJECTIVE 3-1: Protect existing conservation areas and promote the preservation and protection of other environmentally-sensitive green areas and water resources.
POLICY 1: Preserve environmentally sensitive areas in the tri-county region.
STRATEGY 1:Work with the Coastal Conservation League to update and monitor the existing regional inventory of conservation areas.
STRATEGY 2:Develop policy guides to facilitate the protection of green areas and water resources in comprehensive plans.
STRATEGY 3:Develop a regional consensus on open space dedication requirements for new subdivisions and land development agreements.
Note: Such dedication requirements could vary based on the size and type of development.
STRATEGY 4:Facilitate the development of regulations to manage land development in tidal marshes.
STRATEGY 5:Ensure that coastal zone management is coordinated with the federal, county and municipal governments as well as Coastal South Carolina Environmental and Conservation Organizations to protect coastal areas such as beaches, marshes and other significant coastal ecosystems.
STRATEGY 6:Encourage establishment of buffer zones along perennial and non-manmade intermittent streams in the BCD region to protect the integrity of their habitats and to provide community recreational space.

p // 2-17
PLAN
ELE
ME
NT
2NATURAL ENVIRONMENT
GOAL 3: Preserve our natural environment and foster a network of green infrastructure continued
POLICY 2: Educate communities on techniques to preserve and enhance green areas.
STRATEGY 1:Partner with local land trusts such as the Lowcountry Open Land Trust and participate in public events to educate the region’s residents on the importance of open space preservation and the preservation tools available to them.
STRATEGY 2:Work with school districts to create regular programs in the k-12 curriculum to educate students about the benefits of open space preservation. For example, organize trips to national forests, parks, marshes, and other environmentally sensitive areas to demonstrate the link between the preservation of open space with habitat protection.
STRATEGY 3:Develop regional public outreach program to inform elected officials, planning commissions and the public regarding the importance of natural resources.
OBJECTIVE 3-2: Promote inter-connections between local and regional trails, greenways and waterways.
POLICY: Encourage the creation of a regional greenway system that connects all three counties and major natural resources within each county.
STRATEGY 1:Facilitate the inclusion of and connections to the Primary Regional Trails, as shown on the Regional Plan map, in each county’s Comprehensive Plan.
STRATEGY 2:Coordinate with local and regional environmental organizations to conserve and promote regional trails and major regional trail connections.
STRATEGY 3:Facilitate the acquisition of trail easements and/or property.
STRATEGY 4:Promote the development of a regional open space plan, including a secondary regional greenway network and trails system that will connect with the Primary Regional Trails identified in the Regional Plan.
1. Increases in the amount of land preserved in residential subdivisions.
2. Improvements in the extent and condition of coastal wetlands, tidal marshes and riparian corridors.
3. Increases in the number of acres of conservation land.
4. Linear feet of perennial and non-manmade intermittent streams preserved with buffers.
5. Amount of educational material provided to the public at events throughout the BCD region.
6. Number of educational programs launched and organized in a year.
7. Increases in the number of comprehensive plans incorporating greenway and open space improvements and protection.
8. Increases in the number of local comprehensive plans that consider conservation, open space and trails.
9. Increases in the number of capital plans incorporating greenway and open space improvements.
GOAL 3 INDICATORS OF SUCCESS
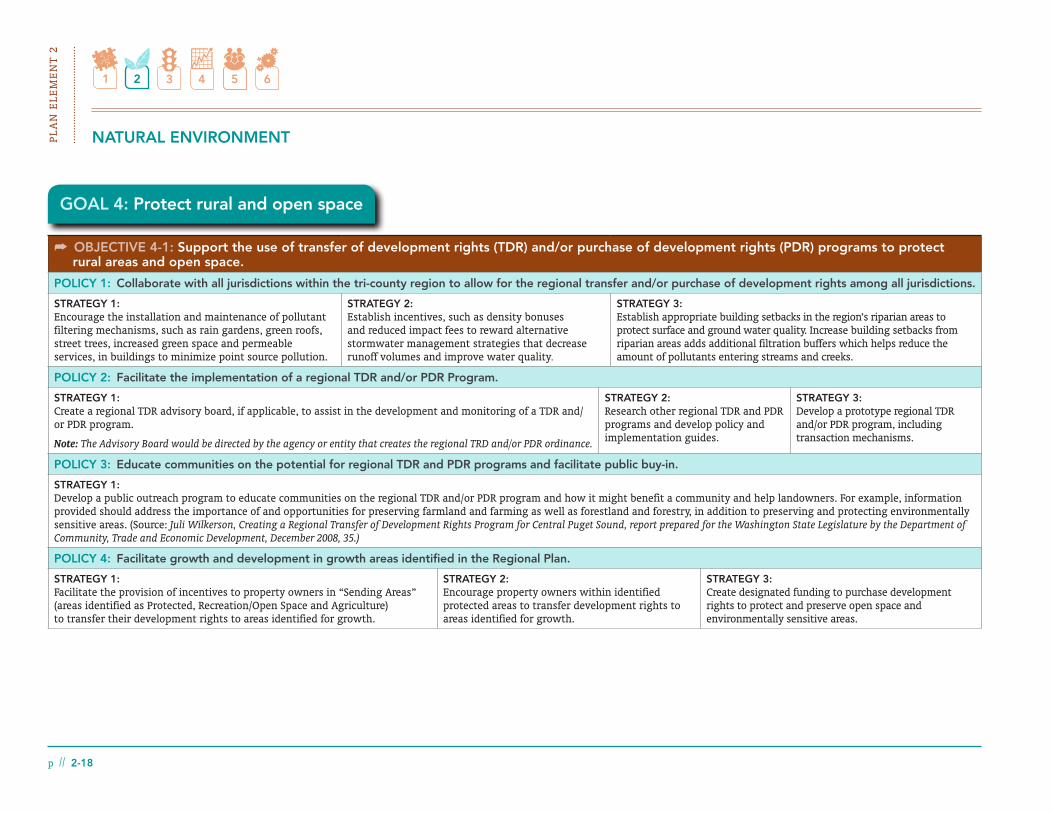
PLA
N E
LEM
EN
T 2
NATURAL ENVIRONMENT
p // 2-18
GOAL 4: Protect rural and open space
OBJECTIVE 4-1: Support the use of transfer of development rights (TDR) and/or purchase of development rights (PDR) programs to protect rural areas and open space.
POLICY 1: Collaborate with all jurisdictions within the tri-county region to allow for the regional transfer and/or purchase of development rights among all jurisdictions.
STRATEGY 1:Encourage the installation and maintenance of pollutant filtering mechanisms, such as rain gardens, green roofs, street trees, increased green space and permeable services, in buildings to minimize point source pollution.
STRATEGY 2:Establish incentives, such as density bonuses and reduced impact fees to reward alternative stormwater management strategies that decrease runoff volumes and improve water quality.
STRATEGY 3:Establish appropriate building setbacks in the region’s riparian areas to protect surface and ground water quality. Increase building setbacks from riparian areas adds additional filtration buffers which helps reduce the amount of pollutants entering streams and creeks.
POLICY 2: Facilitate the implementation of a regional TDR and/or PDR Program.
STRATEGY 1:Create a regional TDR advisory board, if applicable, to assist in the development and monitoring of a TDR and/or PDR program.
Note: The Advisory Board would be directed by the agency or entity that creates the regional TRD and/or PDR ordinance.
STRATEGY 2:Research other regional TDR and PDR programs and develop policy and implementation guides.
STRATEGY 3:Develop a prototype regional TDR and/or PDR program, including transaction mechanisms.
POLICY 3: Educate communities on the potential for regional TDR and PDR programs and facilitate public buy-in.
STRATEGY 1:Develop a public outreach program to educate communities on the regional TDR and/or PDR program and how it might benefit a community and help landowners. For example, information provided should address the importance of and opportunities for preserving farmland and farming as well as forestland and forestry, in addition to preserving and protecting environmentally sensitive areas. (Source: Juli Wilkerson, Creating a Regional Transfer of Development Rights Program for Central Puget Sound, report prepared for the Washington State Legislature by the Department of Community, Trade and Economic Development, December 2008, 35.)
POLICY 4: Facilitate growth and development in growth areas identified in the Regional Plan.
STRATEGY 1:Facilitate the provision of incentives to property owners in “Sending Areas” (areas identified as Protected, Recreation/Open Space and Agriculture) to transfer their development rights to areas identified for growth.
STRATEGY 2:Encourage property owners within identified protected areas to transfer development rights to areas identified for growth.
STRATEGY 3:Create designated funding to purchase development rights to protect and preserve open space and environmentally sensitive areas.

p // 2-19
PLAN
ELE
ME
NT
2NATURAL ENVIRONMENT
GOAL 4: Protect rural and open space continued
OBJECTIVE 4-2: Foster the utilization of conservation design to preserve rural and open space.
POLICY: Promote the use of conservation subdivision design techniques.
STRATEGY 1:Educate local government on conservation subdivision design techniques and benefits.
STRATEGY 2:Continue to develop model codes for local communities to incorporate and support conservation subdivision design.
STRATEGY 3:Facilitate the development of incentives to encourage conservation subdivisions.
1. Creation of a public inventory of existing regional conservation areas.
2. Creation of a monitoring tool to track the total acreage of conservation areas.
3. Creation of a Transfer of Development Rights (TDR) advisory board, selection of members to serve on the board and establishment of working principles and goals for the advisory board.
4. Development of a regional TDR and/or PDR educational program.
5. Total acres protected through TDR and/or PDR programs.
6. Number of conservation subdivision ordinances adopted in the BCD region.
7. Number of conservation subdivisions implemented in the BCD region.
8. Number of acres of rural land and open space preserved through use of conservation subdivisions.
GOAL 4 INDICATORS OF SUCCESS

{this page intentionally left blank}

supportable, meaning that multimodal systems must be a part of our future. Long range transportation planning must have the vision and breadth to include these options, which will be essential for supporting the region’s economy and livability.
PLAN
ELE
ME
NT
3
Planning for an effective, efficient transportation system is a complicated, multi-year process, requiring and long term vision. With that vision always in mind and a way to monitor its realization, the livability of our region will be enhanced.
ISSUES AND OPPORTUNITIES
Issues facing the BCD region over the next twenty to thirty years revolve around assuring that population growth during that period is supported by a robust transportation system that offers choices in modes of travel and destinations. Since mobility and accessibility also influences land development, the location, capacity and compatibility of the region’s transportation system will have a significant influence on the quality of our region’s physical environment and livability. Traffic congestion and fuel prices are anticipated to become even greater concerns in future decades, so options in transportation modes will be more desirable and
p // 3-1
6 Figure 3-1: Increased congestion and lack of multi-modal options on many arterials requires a comprehen-sive approach to transportation. Source: HNTB.
» Planning for Transportation Infrastructure Concurrency
As our region continues to grow, the increased population will need access to work, services, shopping, entertainment, and recreation. That will result in increased pressure on the mobility infrastructure and a need for increased capacity and modal choice. The analysis of various scenarios during the planning process showed that if current trends prevail the system-wide delay will be 22% worse than growth following the Vision Plan. The Vision Plan offers a significant improvement, not only in reducing congestion and the associated environmental side effects, but also in enhancing the productivity of the region.
The region’s geographic structure presents some challenges to extending mobility infrastructure. With the region’s central geography consisting of six peninsulas, these challenges will be present with virtually all future growth and development.
Plan Element 3:MOBILITY and TRANSPORTATION INFRASTRUCTURE
Mobility and transportation infrastructure affects all aspects of life for those living in the BCD region. Transportation
is integral to our lives, affording the mobility to experience the attributes of the entire region. If developed in conjunction with our
neighborhoods, places of employment, shopping, services and recreation areas, it serves us well without causing undue undesirable effects.
When we have choices of how to move about the region, it benefits our time and our pocketbooks.

PLA
N E
LEM
EN
T 3
p // 3-2
MOBILITY and TRANSPORTATION INFRASTRUCTURE
surrounding port facilities in North Charleston, the radial arterials still are at risk of becoming overburdened. Many of these arterials, such as the Ashley River Road, traverse environmentally, historically and culturally significant locations, which would suffer from excess widening. Roads such as this not only provide basic mobility, they add greatly to the recreational appeal of the region. Ashley River Road is one of several minor arterials in the region that has Scenic Byway status.
Planning for transportation system improvements must anticipate land development and growth in population centers, as well as planned major
employment and other generators. Coordination of transportation plans with local land use plans will help coordinate both, providing for transportation capacity and service for communities. The Vision Plan Map indicates placing more people more conveniently near destinations, and reducing the need for driving. The current trend of growth and development, as discussed in the Trend Scenario during the OROP process, would reduce the percentage of population living in centers from 64% to 62%, whereas the Vision Plan will increase that percentage to 82%. Similarly, the percentage of employment in centers will increase from 81% to 91% in the Vision Plan, further reducing
For that reason, it is imperative that any land development be accompanied by concurrent growth in the region’s mobility capacity.
The larger cities and many major employers are located along the Charleston peninsula, which provides constraints on expansion. Currently, the major north-south route in the region is I-26 along the peninsula, and virtually all rail services follow this same route from the Port of Charleston, the North Charleston Terminal at the Port of Charleston, and the Joint Base Charleston military installation. New development that will require increased use of I-26 will put additional vehicular trips on this north-south corridor, which will stress its capacity. While the geography presents challenges, the waterways that form this and the other peninsulas also offer some opportunities for water-based transportation services.
Similar to I-26, US 17 is the only arterial with access to the region’s center of Charleston from either end of Charleston County. Further growth in Mt. Pleasant to the east and communities to the west of the peninsula will add vehicular pressure to this route. That pressure and resulting congestion increase the rationale for additional modes of transportation to serve these corridors.
While I-526 provides access to the Charleston International Airport and the employment centers
8 Figure 3-2: The geographic structure of the region, with its four rivers and five peninsulas, presents challenges to extending mobility infrastructure. Source: www.Bing.com Maps
7 Figure 3-3: Traffic congestion on I-26. Source: Post and Courier newspaper.

p // 3-3
PLAN
ELE
ME
NT
3MOBILITY and TRANSPORTATION INFRASTRUCTURE
pressure on the street system during commuting times and increasing the attractiveness of transit or other means of access to employment. Approval of new development, whether it is residential or non-residential, should be linked to the current or planned availability of adequate mobility capacity to accommodate the development. Residential development must have access to work, shopping, services and recreational destinations. Major employment must be located near both roadway and transit infrastructure with the existing or planned capacity to accommodate employees, especially during morning and evening peak periods, and services, particularly truck and rail service.
Some development types can also relieve demands on transportation system capacity. Mixed use developments, providing a live/work/shop/play environment can minimize the need for trips by car and can be more easily served by transit. The Lowcountry has been a notable location for these place types, ranging from the more established ones such as Charleston, Mt. Pleasant and Summerville to newer place types such as I’On and Daniel Island.
Whether anticipating future land development or dealing with transportation systems in existing settings, communities and the natural environment will benefit when transportation facilities are sensitive to the context in which they will exist. This is best seen in established communities such
8 Figure 3-4: Mission Meridian Village in South Pasadena, California, is an example of compact, mixed use development that is within a five-minute walk to the new South Pasadena Gold Line Station. Source: Congress for the New Urbanism.
6 Figure 3-5: I’On in Mt. Pleasant is a recently developed mixed use, walkable community in the BCD region.

PLA
N E
LEM
EN
T 3
MOBILITY and TRANSPORTATION INFRASTRUCTURE
p // 3-4
A multimodal system, in addition to cars, trucks, bicycles and pedestrians, may include several types of transit service. It is important to keep in mind that although certain technologies – such as subways – have been perceived as “world class transit” many other technologies are more effective in resolving our needs and issues. We should understand and adopt the technology that best serves our needs. In the BCD region, these could include:
•Commuterrail– similar to traditional passenger rail, serving longer commuting trips within the region on its own tracks or tracks shared with freight rail or Amtrak service;
•Lightrail – smaller electrified vehicles operating as one to three car trains on their own tracks, separated from vehicular traffic but sometimes crossing local streets; one light rail vehicle typically has a passenger capacity that is as much as six times greater than a bus;
•Streetcar – a modern version of traditional “trolleys”, sometimes referred to as “European streetcars”, operating in streets with other traffic; these have higher passenger capacity than busses, but less capacity than light rail;
•Busrapidtransit – larger busses, similar to light rail in appearance and comfort, that can operate either in their own fixed guideway or on streets mixed with vehicular traffic, which gives them more flexibility than light rail;
•Bus– traditional bus vehicles that operate on streets mixed with vehicular traffic; and
•Demandresponsivetransit – vans or small busses that pick up and drop off passengers in response to a telephone request, rather that serving a fixed route.
In addition to carrying passengers (which reduces the number of individual automobiles on streets), fixed guideway transit such as commuter rail, light rail, streetcars and bus rapid transit can help to concentrate development within walking, bicycling or short drives of the stations or stops.
Transit is a big component of the multimodal system. Increased availability and use of transit will reduce the miles driven in private automobiles, thus relieving congestion on major corridors. It will
as downtown Charleston, Summerville, North Charleston, and St. George, where transportation facilities traditionally were not disconnected from the elements of the urban fabric blocks, buildings and public spaces. The region has become more auto-centric as it has become more urbanized, and thus the relationship among transportation, land uses, urban design, and the natural environment has deteriorated. By planning development types and future land use in conjunction with the transportation system, the Lowcountry will provide the mobility needed for a livable and sustainable region.
» A Call for Multimodal Systems
The BCD region is ripe for the evolution of a robust multimodal transportation system. Its geography limits the implementation of a fully interconnected roadway system because of the rivers and harbors. In many public meetings during the OROP process, there was a repeated emphasis from participants on the need for a multimodal transportation network that serves bicyclists, pedestrians, and transit users. That desire is supported by the region’s demographics, climate and geography as well as by the levels of traffic congestion currently being experienced and anticipated in the future. The Vision Plan recommends a concentration of employment and population centers, which lends itself to a robust multimodal system.
WHETHER ANTICIPATING FUTURE LAND DEVELOPMENT OR DEALING WITH TRANSPORTATION SYSTEMS IN EXISTING SETTINGS, COMMUNITIES AND THE NATURAL ENVIRONMENT WILL BENEFIT WHEN TRANSPORTATION FACILITIES ARE SENSITIVE TO THE CONTEXT IN WHICH THEY WILL EXIST.

p // 3-5
PLAN
ELE
ME
NT
3MOBILITY and TRANSPORTATION INFRASTRUCTURE
6 Modern streetcar in Portland, Ore., in revitalized warehouse district. Source: Donal Simpson.
6 Light rail vehicle at Sunset Station in Portland, Ore. Source: Donal Simpson.
6 The New Mexico “Rail Runner Express” opened in 2008 to provide commuter rail service between Albuquerque and Santa Fe. Source: News New Mexico.
Figure 3-6: Multimodal System Technologies
6 Bus rapid transit vehicle. Source: Bombardier Corporation.
6 CATS hybrid electric Airport Sprinter bus. Source: Charlotte Area Transit System.
6 CATS paratransit on-call vehicle. Source: Charlotte Area Transit System.

PLA
N E
LEM
EN
T 3
MOBILITY and TRANSPORTATION INFRASTRUCTURE
p // 3-6
the reliance on carbon-based fuels will be an ever increasing issue as petroleum resources continue to be consumed globally.
The geographic configuration of the Charleston peninsula, with a linear distribution of employment and population concentrations, lends itself to a high capacity transit line. The growing areas to the east and west have potential for express bus or bus rapid transit services to the core city of Charleston and the employment centers in Charleston, the “Neck” area and the Charleston International Airport area. The planned East Edisto development also has the potential for express bus or bus rapid transit service that will connect it to downtown Charleston, Summerville and Moncks Corner. And, the remainder of the area has potential for expanded local bus service as the population continues to grow.
The BCD region’s climate provides a favorable walking, running and bicycling environment. Yet, roughly 42 % of all trips under one-half mile in South Carolina are undertaken on foot, compared to the national average of 61%. Although many parts of the region have a higher percentage of trips completed by bicyclists and pedestrians, many of these trips are in tourist heavy areas of the peninsula and beach communities. Many residents echoed a strong support for bikeways, greenways, waterways, and pedestrian amenities that will connect major destinations. A network of pedestrian and bicycle
infrastructure supporting walking and bicycling activities will benefit residents and visitors alike. Residents will have access to walking and running networks for recreation and healthy living, and, in many cases, the ability to walk to work, shopping or entertainment. Visitors will have increased access to the beauty of the natural environment as well as to the many regional attractions with less need to drive. The Vision Plan proposed to expand these mode choices to other parts of the region by creating a multimodal transportation system.
OROP is not constrained by any particular transit technology. A detailed regional transit study, beyond the current Alternatives Analysis, which will not only analyze the feasibility of each corridor but will also identify potential technologies (Light Rail Transit, Bus Rapid Transit, Commuter Rail, and Streetcar etc.) for each corridor is recommended. With the projected rising cost of private automobile travel and ownership through mid-21st Century, an expanded emphasis on multimodal opportunities throughout the OROP region warrants serious development of a transit framework and an extensive network of greenways, sidewalks and bicycle routes.
» The Role of the LRTP
The CHATS Long-Range Transportation Plan (LRTP) identifies specific and general transportation system improvements and strategies to
also help reduce reliance on carbon-based fuels, further improving air quality. It also enhances the economic competitiveness of the region by connecting people to their jobs. According to the BCD Regional Transit Plan from 2008, Charleston County has the second highest influx of people into the county during the day in the state, due to the number of commuters and visitors. Many employees working in the tourism industry in the peninsula live in less urbanized areas of Berkeley and Dorchester County and could benefit from an efficient transit system. Furthermore, reducing
6 Figure 3-7: Transit oriented residential and retail development at the Plano DART station in Plano, Texas. Source: Dallas Area Rapid Transit.
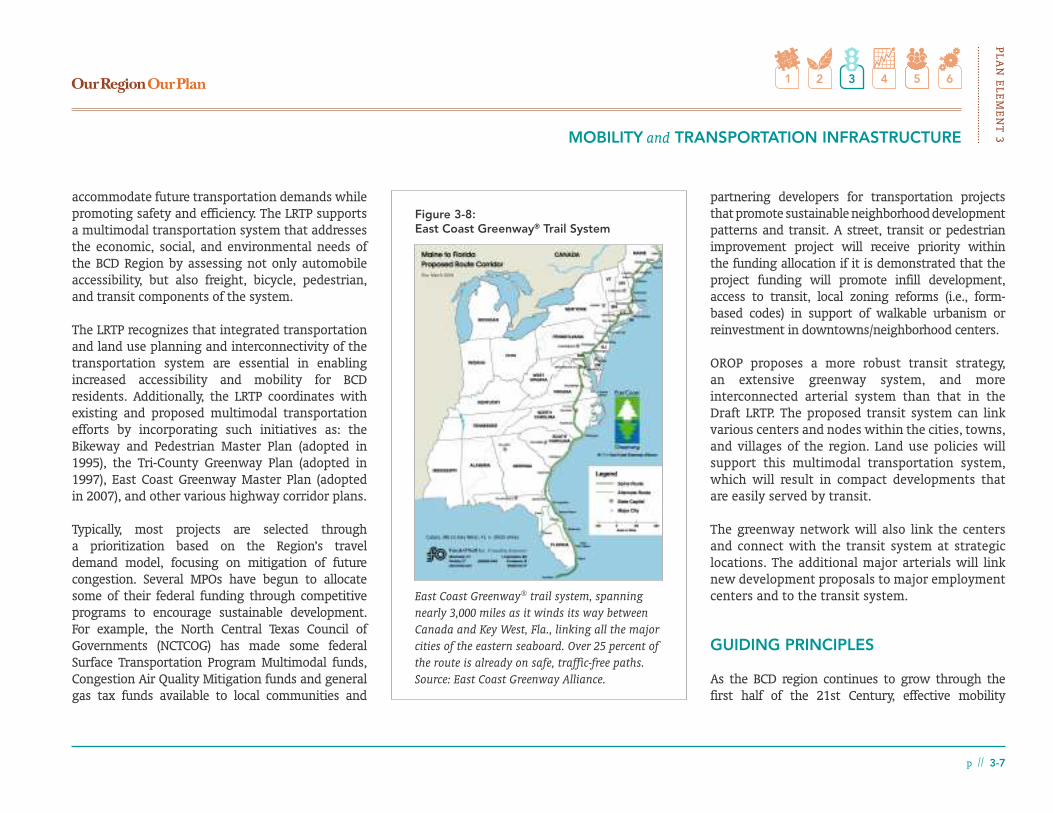
p // 3-7
PLAN
ELE
ME
NT
3MOBILITY and TRANSPORTATION INFRASTRUCTURE
accommodate future transportation demands while promoting safety and efficiency. The LRTP supports a multimodal transportation system that addresses the economic, social, and environmental needs of the BCD Region by assessing not only automobile accessibility, but also freight, bicycle, pedestrian, and transit components of the system.
The LRTP recognizes that integrated transportation and land use planning and interconnectivity of the transportation system are essential in enabling increased accessibility and mobility for BCD residents. Additionally, the LRTP coordinates with existing and proposed multimodal transportation efforts by incorporating such initiatives as: the Bikeway and Pedestrian Master Plan (adopted in 1995), the Tri-County Greenway Plan (adopted in 1997), East Coast Greenway Master Plan (adopted in 2007), and other various highway corridor plans.
Typically, most projects are selected through a prioritization based on the Region’s travel demand model, focusing on mitigation of future congestion. Several MPOs have begun to allocate some of their federal funding through competitive programs to encourage sustainable development. For example, the North Central Texas Council of Governments (NCTCOG) has made some federal Surface Transportation Program Multimodal funds, Congestion Air Quality Mitigation funds and general gas tax funds available to local communities and
Figure 3-8: East Coast Greenway® Trail System
East Coast Greenway® trail system, spanning nearly 3,000 miles as it winds its way between Canada and Key West, Fla., linking all the major cities of the eastern seaboard. Over 25 percent of the route is already on safe, traffic-free paths. Source: East Coast Greenway Alliance.
partnering developers for transportation projects that promote sustainable neighborhood development patterns and transit. A street, transit or pedestrian improvement project will receive priority within the funding allocation if it is demonstrated that the project funding will promote infill development, access to transit, local zoning reforms (i.e., form-based codes) in support of walkable urbanism or reinvestment in downtowns/neighborhood centers.
OROP proposes a more robust transit strategy, an extensive greenway system, and more interconnected arterial system than that in the Draft LRTP. The proposed transit system can link various centers and nodes within the cities, towns, and villages of the region. Land use policies will support this multimodal transportation system, which will result in compact developments that are easily served by transit.
The greenway network will also link the centers and connect with the transit system at strategic locations. The additional major arterials will link new development proposals to major employment centers and to the transit system.
GUIDING PRINCIPLES
As the BCD region continues to grow through the first half of the 21st Century, effective mobility
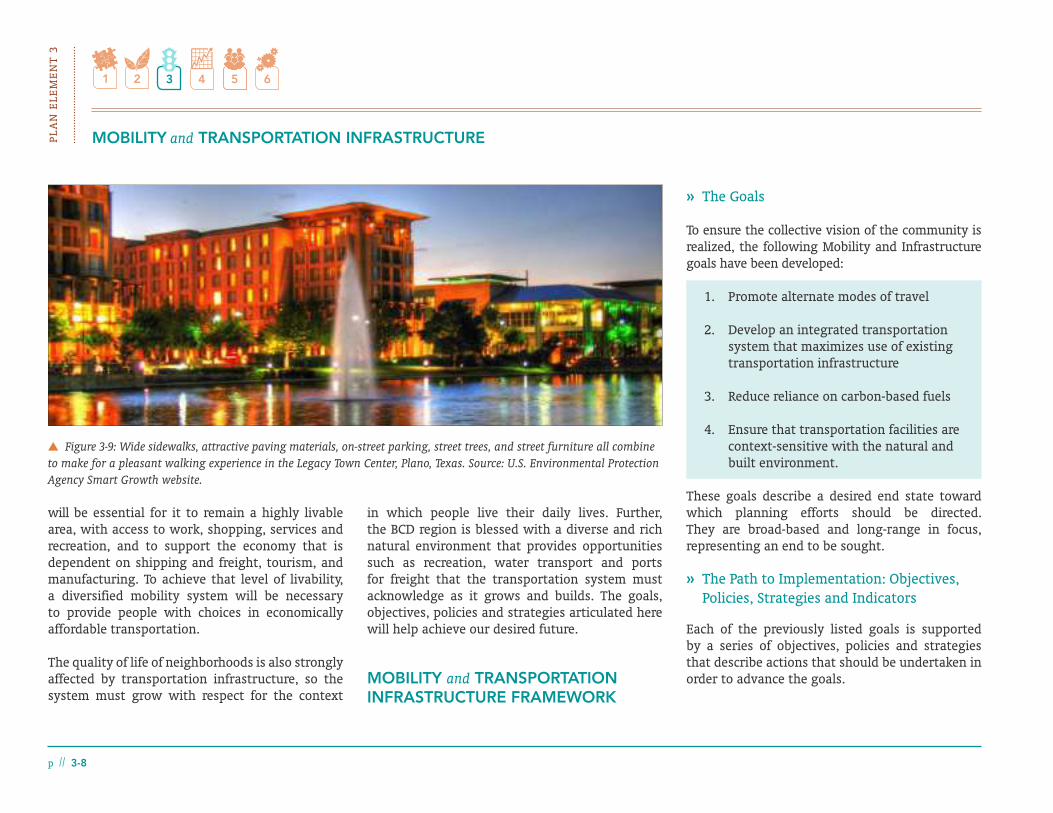
PLA
N E
LEM
EN
T 3
MOBILITY and TRANSPORTATION INFRASTRUCTURE
p // 3-8
in which people live their daily lives. Further, the BCD region is blessed with a diverse and rich natural environment that provides opportunities such as recreation, water transport and ports for freight that the transportation system must acknowledge as it grows and builds. The goals, objectives, policies and strategies articulated here will help achieve our desired future.
MOBILITY and TRANSPORTATION INFRASTRUCTURE FRAMEWORK
» The Goals
To ensure the collective vision of the community is realized, the following Mobility and Infrastructure goals have been developed:
1. Promote alternate modes of travel
2. Develop an integrated transportation system that maximizes use of existing transportation infrastructure
3. Reduce reliance on carbon-based fuels
4. Ensure that transportation facilities are context-sensitive with the natural and built environment.
These goals describe a desired end state toward which planning efforts should be directed. They are broad-based and long-range in focus, representing an end to be sought.
» The Path to Implementation: Objectives, Policies, Strategies and Indicators
Each of the previously listed goals is supported by a series of objectives, policies and strategies that describe actions that should be undertaken in order to advance the goals.
will be essential for it to remain a highly livable area, with access to work, shopping, services and recreation, and to support the economy that is dependent on shipping and freight, tourism, and manufacturing. To achieve that level of livability, a diversified mobility system will be necessary to provide people with choices in economically affordable transportation.
The quality of life of neighborhoods is also strongly affected by transportation infrastructure, so the system must grow with respect for the context
6 Figure 3-9: Wide sidewalks, attractive paving materials, on-street parking, street trees, and street furniture all combine to make for a pleasant walking experience in the Legacy Town Center, Plano, Texas. Source: U.S. Environmental Protection Agency Smart Growth website.

p // 3-9
PLAN
ELE
ME
NT
3MOBILITY and TRANSPORTATION INFRASTRUCTURE
GOAL 1: Promote alternate modes of travel
OBJECTIVE 1-1: Provide for comprehensive transit options.
POLICY: Establish a comprehensive transit system that attracts new riders; connects major centers identified in the Plan; reduces congestion on major arterials; enhances affordability, protects the natural environment, provides for sustainability of the region and provides a viable alternative to personal automobile travel. Together, this policy will serve other intended goals for the BCD region.
STRATEGY 1:Undertake a comprehensive study of the regional transit system.
Note: This comprehensive regional transit system study will focus on the feasibility of fixed guideway transit between established and emerging centers within the BCD region. For example, the study should not only focus on the previously discussed alignments such as Charleston Peninsula through Summerville and to Moncks Corner, but also explore new corridors such as US 17 and an outer loop that connects Moncks Corner with the emerging East Edisto area.
CASE STUDY
The Charlotte region embarked on an ambitious plan to connect growing communities around the City via a network of transit that goes beyond the regular urban/suburban bus service. Today, one of the spokes of the system is successfully operated by the regional transit agency and in FY2010 carried 14,600 passengers per weekday, which is nearly twice its projected 2025 ridership. The second spoke is currently in final design and is scheduled to begin construction in 2012 or 2013.
STRATEGY 2:Build support among residents, business community, and other regional agencies for the implementation of other transit alignments. These alignments could include - connecting Mount Pleasant to Hollywood through Charleston downtown, and connecting Moncks Corner to East Edisto through Summerville.
STRATEGY 3:Implement the major findings of the ongoing Regional Transit System Alternatives Analysis for corridors in the Charleston-North Charleston-Summerville Metropolitan Area.
STRATEGY 4:Expand CARTA and TriCounty Link local bus routes and expand on-demand transit services that provide a more integrated, holistic regional transit system.
STRATEGY 5:Establish additional ferry and water taxi services that take advantage of the region’s waterways and provide transportation options for commuters and visitors.
OBJECTIVE 1-2: Encourage and assist communities to work together to create a regional pedestrian and bikeway connections.
POLICY: Increase the availability and interconnectivity of greenways, bicycle routes, and sidewalks throughout the region.
STRATEGY 1:Promote the development of a regional greenway, bicycle, and walking system.
Note: The Vision Plan recommends connecting the entire region through a network of greenways and waterways as part of its “Primary Network”. The Primary Network is the major trunks of the greenway that will inter-connect major destinations in each county. As a tangible link that connects people with places, the Primary Network will encourage leadership and communities to build partnerships. One visible aspect of this partnership will be local jurisdiction’s efforts to connect to the “Primary Network” via a “Secondary Network” through local initiatives.
CASE STUDY
The 15-county region around the Charlotte Metropolitan area recently embarked on an ambitious regional greenway project called Carolina Thread Trail, a regional network of greenways and trails that will reach 2.3 million people, linking people, places, cities, towns and attractions.

PLA
N E
LEM
EN
T 3
MOBILITY and TRANSPORTATION INFRASTRUCTURE
p // 3-10
GOAL 1: Promote alternate modes of travel continued
OBJECTIVE 1-2 continued
POLICY: Increase the availability and interconnectivity of greenways, bicycle routes, and sidewalks throughout the region. continued
STRATEGY 2:Promote the creation of local, regional and state policies that require the inclusion of pedestrian and bicycle amenities to retrofitted and new roadways, following “complete streets” principles.
STRATEGY 3:Promote bicycle and pedestrian amenities that enhance the user’s experience.
STRATEGY 4:Promote the construction of new and connecting sidewalks.
STRATEGY 5:Assist communities in funding pedestrian and bicycle connections.
STRATEGY 6:Support communities by providing technical assistance in developing policies, codes, standards, and bicycle/pedestrian plans.
1. Development of a regional transit system plan, expanding the CHATS LRTP transit plan
2. Strategic planning for commuter rail or light rail service between Charleston and Ridgeville
3. Strategic planning for Express bus and/or bus rapid transit service between Charleston and Folly Beach, Ravenel , Mt. Pleasant, and Moncks Corner; along Interstate 526 between Mt. Pleasant and Savannah Highway; and between Moncks Corner and East Edisto
4. Increase in the miles of additional bus routes added
5. Annual increase in transit ridership
6. Annual increase in on-demand transit ridership
7. Establishment of ferry or water taxi service along Ashley River, Cooper River, Wando River and Charleston Harbor to James Island
8. Expansion of Charleston to Mt. Pleasant water taxi service
9. Increase in the miles of bicycle lanes added to existing streets
10. Increase in the miles of bicycle lanes incorporated into new roadway construction
11. Increase in the miles of signed bicycle routes added to existing and new roadways
12. Annual reduction in number of bicycle and pedestrian crashes and fatalities
13. Increase in the number of secure parking and storage spaces for bicycles
14. Establishment of bicycle sharing cooperatives in large cities
15. Increase in the number of transit vehicles equipped for bicycles to be transported
16. Increase in the grant amounts obtained for construction of greenways, bicycle lanes and sidewalks
17. Increase in the number of bicycle/pedestrian plans developed
18. Increase in the number of policies developed to require the inclusion of pedestrian and bicycle amenities in retrofitted and new roadway projects.
GOAL 1 INDICATORS OF SUCCESS

p // 3-11
PLAN
ELE
ME
NT
3MOBILITY and TRANSPORTATION INFRASTRUCTURE
GOAL 2: Develop an integrated transportation system that maximizes use of existing transportation infrastructure
OBJECTIVE 2-1: Establish road connectivity polices and plans for the BCD region.
POLICY: Pursue implementation of robust regional and local road connections.
STRATEGY 1:Study the feasibility of some major regional arterial connections that will alleviate the pressure off of I-26. Some of these regional connections are shown in the Vision Plan Map that connects Moncks Corner with Summerville and future East Edisto area.
STRATEGY 2:Promote adoption of local transportation plans that include connectivity policies.
STRATEGY 3:Assist counties and municipalities in pursuing funding for mid- and long-range connectivity projects.
OBJECTIVE 2-2: Achieve a reliable, integrated freight transportation system in partnership with other levels of government, non-profit agencies and the private sector.
POLICY: Develop an effective freight system that is compatible with the planned mobility and place-making goals of the region, as described in Plan Elements 1 and 2.
STRATEGY 1:Explore potential of rail freight lines, rights-of-way and corridors to support commuter rail or light rail transit.
STRATEGY 2:Plan truck freight routes that minimize impacts on existing and planned residential or mixed-use neighborhoods.
Note: The Charleston Neck Master Plan has proposed residential and mixed-use neighborhood centers that will minimize the impact of truck freight routes on existing and future residents in the Neck area.
Plan Element 5 discusses the need for regional leadership and stewardship which will assist in resolving conflicts such as these.
OBJECTIVE 2-3: Promote review of neighborhood and corridor land use plans as well as major projects for regional environmental impacts prior to the design phase.
POLICY: Continue to promote the review of neighborhood and corridor land use plans and plans for major projects in planning stage by SCDOT, CHATS, CARTA and other transportation agencies prior to beginning planning for transportation projects.
STRATEGY 1:Establish a regional repository for neighborhood and corridor land use plans and plans for major projects in planning stage, to make available to SCDOT, CHATS, CARTA and other transportation agencies.
STRATEGY 2:Consider establishing professional review committee for approval of transportation projects at planning and preliminary design phases. This would be the same committee as Goal 4, Objective 3, Strategy 4.
STRATEGY 3:Assure neighborhood and corridor land use plans and major projects in planning stage are included in Environmental Assessments and Environmental Impact Statements.

PLA
N E
LEM
EN
T 3
MOBILITY and TRANSPORTATION INFRASTRUCTURE
p // 3-12
GOAL 2 continued
1. Plan and construct Monck’s Corner to East Edisto arterials
2. Plan and construct US 176 to Henry E. Brown Jr. Boulevard arterial
3. Plan and construct Savannah Highway to Folly Road arterial
4. Plan and construct a new Charleston Neck port access road
5. Conduct feasibility study of sharing rail freight corridors with potential transit services
6. Re-routing of truck freight routes to avoid existing and planned residential and mixed-use neighborhoods
7. Establishment of regional repository for neighborhood and corridor land use plans and major projects in planning stage
8. Establishment of professional review committee
9. Increase in the number of EA’s and EIS’s that include review of neighborhood and corridor land use plans and major projects in planning stage for evaluation of regional impactspedestrian plans developed
GOAL 2 INDICATORS OF SUCCESS
OBJECTIVE 3-1: Promote and increase levels of public transit service available within the region through the implementation of regional rail transit and bus rapid transit.
POLICY: Implement a regional transit system that will connect various centers with each other as illustrated in the Plan. This policy would be implemented as described in Goal 1: Policy 1.
GOAL 3: Reduce reliance on carbon-based fuels
OBJECTIVE 3-2: Incentivize a reduction in the traditional pattern of single-occupant vehicle travel.
POLICY: Incentivize car-pooling and ride sharing.
STRATEGY 1:Promote the use of ride-sharing parking lots.
STRATEGY 2:Encourage major employers to implement employee car-pooling and ride-sharing programs.
STRATEGY 3:Promote the use of alternative modes of transportation by competitively price parking fees in employment and tourist destinations.
GOAL 2: Develop an integrated transportation system that maximizes use of existing transportation infrastructure continued

p // 3-13
PLAN
ELE
ME
NT
3MOBILITY and TRANSPORTATION INFRASTRUCTURE
GOAL 3: Reduce reliance on carbon-based fuels continued
OBJECTIVE 3-3: Promote transportation demand management strategies for major employers to minimize automobile trip generation.
POLICY: Encourage employee use of transit, car-pooling, ride-sharing and alternative non-carbon fuel based transportation.
STRATEGY 1:Promote station areas along future transit lines for major employment facilities.
STRATEGY 2:Continue to encourage major employers to sponsor transit services for their employees.
STRATEGY 3:Continue promotion and facilitation of the regional ride-sharing program.
OBJECTIVE 3-4: Implement alternative energy sources.
POLICY: Support alternative energy vehicles (EV Infrastructure).
STRATEGY 1:Collaborate with PlugInCarolina electricity providers and private companies to provide electric car battery charging stations.
CASE STUDY
The EV Project that is currently being led by San Francisco based ECOtality, Inc with funding from the US Department of Energy and support from Chevrolet and Nissan, has deployed charging infrastructure in 18 major markets in six states and Washington, D.C.
STRATEGY 2:Encourage hydrogen fuel cell refueling stations.
STRATEGY 3:Encourage conversion of busses to liquefied natural gas fuel.
STRATEGY 4:Encourage purchase of electric battery powered busses.
1. Increase in the number of new major employers to locate facilities along transit lines
2. Increase in the number of existing major employers locating new facilities along transit lines when expanding or relocating
3. Increase in the number of major employer car-pooling or ride-sharing programs
4. Increase in the number of employees participating in car-pooling or ride-sharing programs
5. Increase in the number of ride-sharing parking lots available
6. Increase in the number of electric car battery charging stations available
7. Increase in the number of hydrogen fuel cell refueling stations available
8. Increase in the number of regional transit services (CARTA and TriCounty Link) busses converted to liquefied natural gas
9. Increase in the number of electric battery powered busses in regional transit services fleets
GOAL 3 INDICATORS OF SUCCESS
STRATEGY 4:Continue to encourage major employers to promote car-pooling and ride-sharing.
STRATEGY 5:Connect major employment facilities with residential communities via bicycle and pedestrian facilities.
PLA
N E
LEM
EN
T 3
MOBILITY and TRANSPORTATION INFRASTRUCTURE
p // 3-14
OBJECTIVE 4-1: Promote context sensitive planning and design techniques that serve to enhance the location and improvement of transportation facilities relative to communities, residents and natural resources, tying transportation into the Lowcountry quality of life.
POLICY: Educate jurisdictions and consultant firms on sensitive multi-disciplinary planning for the location and improvement of transportation facilities relative to natural resources, communities and residents.
STRATEGY 1:Identify disciplines such as landscape architecture, architecture, urban design, urban planning, public art, etc. necessary to sensitively plan the location and improvement of transportation facilities relative to natural and man-made resources.
STRATEGY 2:Use qualifications-based selection procedures instead of low fee based selection for procurement of professional services to plan and design transportation facilities.
STRATEGY 3:Conduct professional education seminars on sensitive planning for the location and improvement of transportation facilities relative to natural and built environment.
STRATEGY 4:Establish a professional review committee to evaluate transportation facility plans during the conceptual planning and preliminary design phases. This would be the same committee as Goal 2, Objective 3, Strategy 2.
GOAL 4: Ensure that transportation facilities are context-sensitive with the natural and constructed environment
OBJECTIVE 4-2: Maximize the diversity of land uses and residential densities surrounding major employment centers.
POLICY: Encourage integrated transportation and land use planning that permits diversity of land uses and residential densities surrounding major employment centers.
STRATEGY 1:Provide examples of exemplary land uses surrounding major employment centers that minimize commute time to municipalities and land developers.
STRATEGY 2:Continue to encourage local governments to permit diverse land uses and residential densities surrounding major employment centers.
STRATEGY 3:Encourage road networks that minimize commuting time to major employment centers, maximizing the use of existing roads and minimizing the construction of new roads through connectivity with the existing network.
STRATEGY 4:Encourage transit access to major employment centers.
OBJECTIVE 4-3: Promote compact, mixed-use development.
POLICY: Promote development that locates majority of population within a 10 minute walk, 15 minute drive or 20 minute transit trip to neighborhood or regional retail/civic nodes.
STRATEGY 1:Promote inclusion of mixed use neighborhood centers and regional centers in local land use plans.
STRATEGY 2:Provide a library of built examples of effective compact, mixed-use development to local governments for use in explaining the value to residents and businesses.
STRATEGY 3:Encourage inclusion of street networks supporting compact, mixed-use development in local land use plans.
STRATEGY 4:Encourage regional transit service providers (CARTA and TriCounty Link) bus routes to serve small town centers, villages, new centers, and existing centers.

p // 3-15
PLAN
ELE
ME
NT
3MOBILITY and TRANSPORTATION INFRASTRUCTURE
1. Development of a library of exemplary land uses and examples of effective compact, mixed-use development for use by local jurisdictions
2. Updated LRTP that minimizes commute time to major employment centers
3. Increase in the number of local jurisdictions with planning and zoning that encourages mixed use neighborhood centers and regional centers
4. Increase in the number of transit routes serving Small Town centers, villages, new centers, and existing centers
5. Increase in the number of requests for proposals requiring qualified multi-discipline teams to perform integrated transportation and land use planning work
6. Increase in the number of professional education seminars conducted
7. Increase in the number of agency and consultant personnel participating in professional education seminars
8. Establishment of a professional review committee
GOAL 4 INDICATORS OF SUCCESS
GOAL 4: Ensure that transportation facilities are context-sensitive with the natural and constructed environment continued

{this page intentionally left blank}
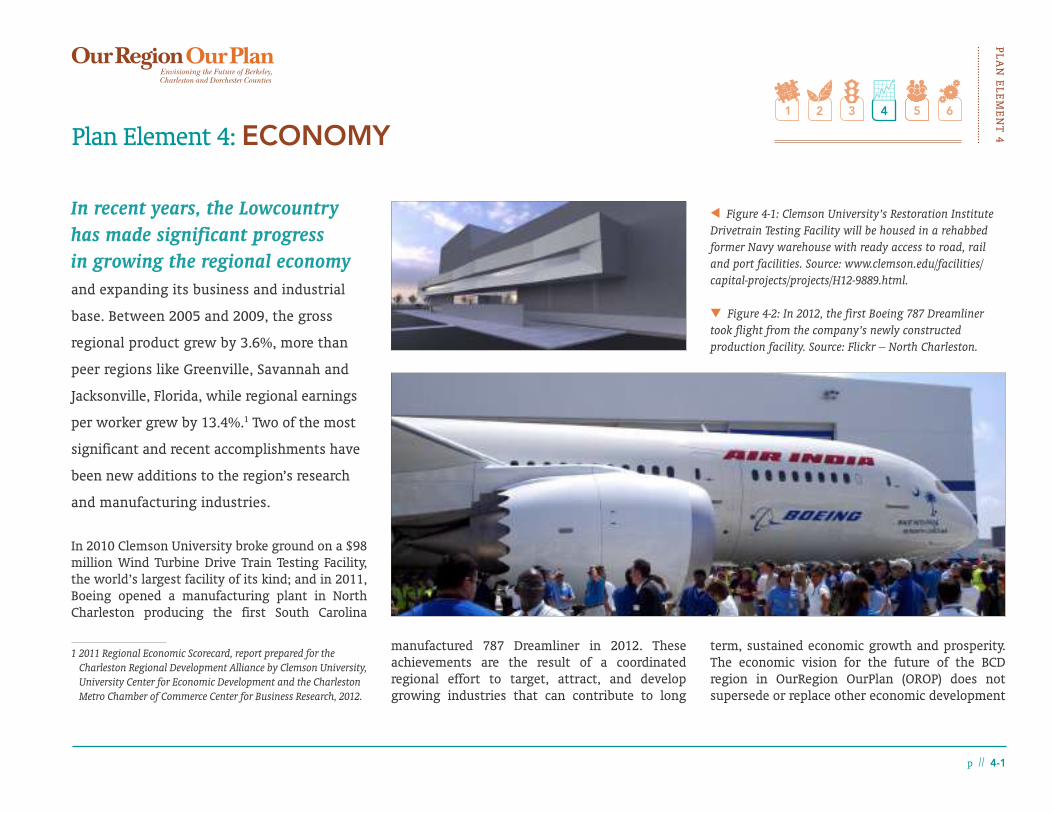
PLAN
ELE
ME
NT
4Plan Element 4: ECONOMY
In recent years, the Lowcountry has made significant progress in growing the regional economy
and expanding its business and industrial
base. Between 2005 and 2009, the gross
regional product grew by 3.6%, more than
peer regions like Greenville, Savannah and
Jacksonville, Florida, while regional earnings
per worker grew by 13.4%.1 Two of the most
significant and recent accomplishments have
been new additions to the region’s research
and manufacturing industries.
In 2010 Clemson University broke ground on a $98 million Wind Turbine Drive Train Testing Facility, the world’s largest facility of its kind; and in 2011, Boeing opened a manufacturing plant in North Charleston producing the first South Carolina
1 2011 Regional Economic Scorecard, report prepared for the Charleston Regional Development Alliance by Clemson University, University Center for Economic Development and the Charleston Metro Chamber of Commerce Center for Business Research, 2012.
p // 4-1
8 Figure 4-1: Clemson University’s Restoration Institute Drivetrain Testing Facility will be housed in a rehabbed former Navy warehouse with ready access to road, rail and port facilities. Source: www.clemson.edu/facilities/capital-projects/projects/H12-9889.html.
7 Figure 4-2: In 2012, the first Boeing 787 Dreamliner took flight from the company’s newly constructed production facility. Source: Flickr – North Charleston.
term, sustained economic growth and prosperity. The economic vision for the future of the BCD region in OurRegion OurPlan (OROP) does not supersede or replace other economic development
manufactured 787 Dreamliner in 2012. These achievements are the result of a coordinated regional effort to target, attract, and develop growing industries that can contribute to long

PLA
N E
LEM
EN
T 4
ECONOMY
p // 4-2
initiatives of the region, including the Charleston Regional Development Alliance’s Opportunity Next program. To the contrary, economic goals of the Vision Plan are strongly aligned with these regional efforts, reinforcing the goals of Opportunity Next while placing them within the context of a comprehensive regional vision. In this framework, the economic goals of enhancing the diverse regional economy (including continued promotion of Charleston as a tourist destination), sustaining the Port of Charleston, and ensuring that all residents have equal access to a quality education help support the regional vision of a vital economy, vibrant communities and high quality of life. In meeting these goals, we will align our actions with guiding principles that frame our vision of the Lowcountry’s future and will carry them out through policies and strategies built upon accepted best practices and measured by regional indicators of success.
ISSUES AND OPPORTUNITIES
The BCD region is fortunate to have such diverse and powerful economic drivers, including the deep-water Port of Charleston; the military, defense and security industries associated with Joint Base Charleston and the Space & Naval Warfare Systems Center (SPAWAR); the world class biomedical and science resources associated with the Medical
THE MILITARY AND DEFENSE INDUSTRIES ARE MAJOR ECONOMIC DRIVERS IN THE BCD REGION. JOINT BASE CHARLESTON AND ITS TENANTS, INCLUDING THE AIR FORCE, NAVY, ARMY, MARINE CORPS, COAST GUARD AND HOMELAND SECURITY, AMONG OTHERS, ARE USING THE BASE’S STRATEGIC COASTAL LOCATION ESTABLISH A WORLDWIDE HUB FOR JOINT MILITARY LOGISTICS, TRANSPORTATION AND ENGINEERING.
6 Figure 4-3: Tourists are drawn to the Lowcountry for its rich history. Fort Sumter is one of the top attractions, drawing in visitors interested in learning about the start of the Civil War and our nation’s struggles. Source: Flickr – Ron Cogswell.
6 Figure 4-4: The aerospace industry is one of the BCD region’s core industries identified by the CRDA as having potential for significant growth. Source: Flickr – Curi Media.
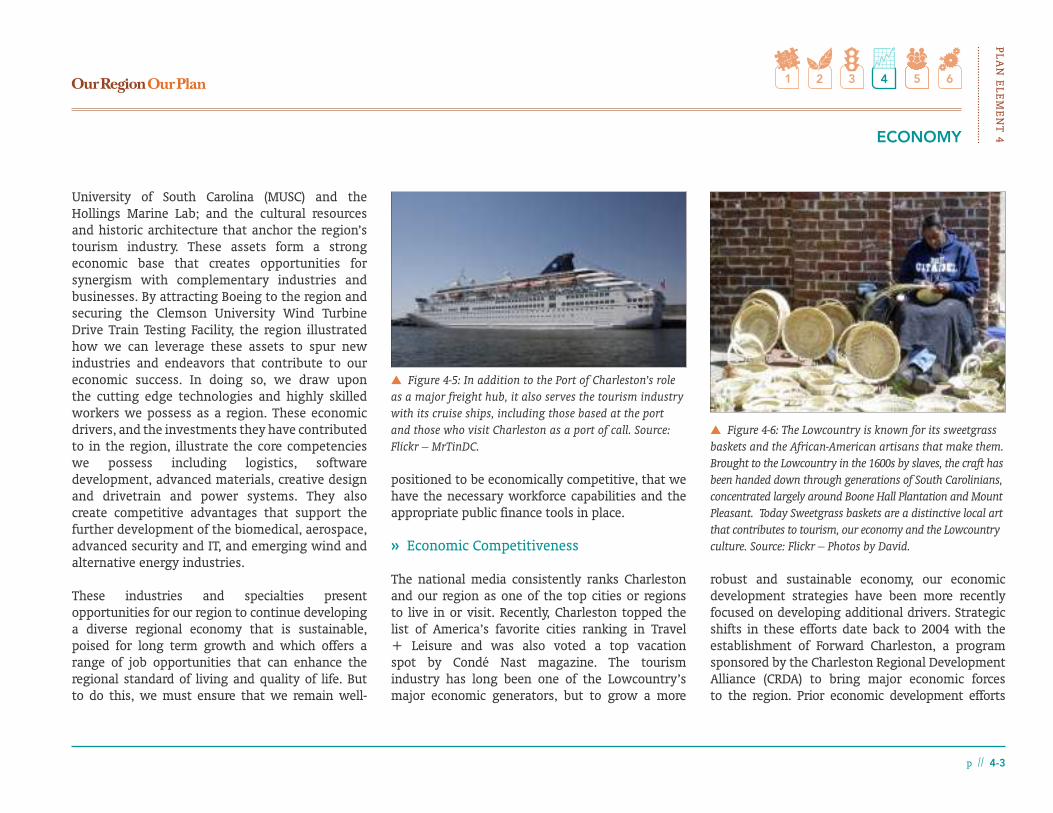
p // 4-3
PLAN
ELE
ME
NT
4ECONOMY
robust and sustainable economy, our economic development strategies have been more recently focused on developing additional drivers. Strategic shifts in these efforts date back to 2004 with the establishment of Forward Charleston, a program sponsored by the Charleston Regional Development Alliance (CRDA) to bring major economic forces to the region. Prior economic development efforts
positioned to be economically competitive, that we have the necessary workforce capabilities and the appropriate public finance tools in place.
» Economic Competitiveness
The national media consistently ranks Charleston and our region as one of the top cities or regions to live in or visit. Recently, Charleston topped the list of America’s favorite cities ranking in Travel + Leisure and was also voted a top vacation spot by Condé Nast magazine. The tourism industry has long been one of the Lowcountry’s major economic generators, but to grow a more
University of South Carolina (MUSC) and the Hollings Marine Lab; and the cultural resources and historic architecture that anchor the region’s tourism industry. These assets form a strong economic base that creates opportunities for synergism with complementary industries and businesses. By attracting Boeing to the region and securing the Clemson University Wind Turbine Drive Train Testing Facility, the region illustrated how we can leverage these assets to spur new industries and endeavors that contribute to our economic success. In doing so, we draw upon the cutting edge technologies and highly skilled workers we possess as a region. These economic drivers, and the investments they have contributed to in the region, illustrate the core competencies we possess including logistics, software development, advanced materials, creative design and drivetrain and power systems. They also create competitive advantages that support the further development of the biomedical, aerospace, advanced security and IT, and emerging wind and alternative energy industries.
These industries and specialties present opportunities for our region to continue developing a diverse regional economy that is sustainable, poised for long term growth and which offers a range of job opportunities that can enhance the regional standard of living and quality of life. But to do this, we must ensure that we remain well-
6 Figure 4-6: The Lowcountry is known for its sweetgrass baskets and the African-American artisans that make them. Brought to the Lowcountry in the 1600s by slaves, the craft has been handed down through generations of South Carolinians, concentrated largely around Boone Hall Plantation and Mount Pleasant. Today Sweetgrass baskets are a distinctive local art that contributes to tourism, our economy and the Lowcountry culture. Source: Flickr – Photos by David.
6 Figure 4-5: In addition to the Port of Charleston’s role as a major freight hub, it also serves the tourism industry with its cruise ships, including those based at the port and those who visit Charleston as a port of call. Source: Flickr – MrTinDC.

PLA
N E
LEM
EN
T 4
ECONOMY
p // 4-4
were largely shaped by South Carolina’s economic development plan, which pursued low-cost strategies and emphasized the region’s flexible workforce, good physical infrastructure and responsive government to attract manufacturing operations and develop the apparel, textiles and agricultural industries. While earlier efforts were successful in attracting new businesses and industries, it was more of a challenge to raise the standard of living.
In 2000, the region’s average wages were 78% of the U.S. average. By 2009, this gap had shortened by seven percentage points to 85% of the national average, yet there was still a difference between income and the cost of living. On a per capita basis, the 2009 regional income was $35,342, or 11% less than the $39,635 per capita income for the United
States. At the same time, our cost of living was only 2% less than the cost of living for the entire country2. This data illustrates that while we have made much progress in creating new business and job opportunities, and significant advances in boosting regional wages and income, there is still a mismatch between incomes and standards of living as the higher costs of living mitigate any income increases. In part, Forward Charleston was a regional response to this discrepancy. It advocated for bold actions to expand higher wage industries that are now present in the region (e.g. the aerospace, advanced security and creative industries) and create synergies to draw in other complementary businesses and industries.
More recently, the CRDA raised the bar with Opportunity Next, its aggressive, strategic economic development plan for the tri-county region launched in 2011. Opportunity Next’s objective is to “supercharge the region’s economy, strengthen employment and … become an international hub for business and talent."3 The focus of this strategy is on growing four target clusters: advanced
2 2011 Regional Economic Scorecard, report prepared for the Charleston Regional Development Alliance by Clemson University, University Center for Economic Development and the Charleston Metro Chamber of Commerce Center for Business Research, 2012.
3 Charleston Regional Development Alliance, Opportunity Next Strategic Plan Summary, 2012.
security and IT, aerospace, biomedical and wind energy. To grow these industries, ensure the region’s sustainability and prosperity, and become a global metropolitan area, the Lowcountry must increase its base of “knowledge workers” – those highly skilled and trained employees who can support sophisticated and high-tech industries. Knowledge workers are a key component in any global metro area: they provide the human capital to run corporate headquarters, they deliver the intellectual capacity needed for professional support services like law and finance, and they foster innovation. According to the CRDA and the Brookings Institution, innovation yields greater economic prospects as it translates to the production of patents and “strong manufacturing and patent producing communities generate the highest exports.”4 In 2009, the BCD
4 2011 Regional Economic Scorecard, report prepared for the
IN 2009, THE REGION’S PER CAPITA INCOME WAS $35,342, 11% LESS THAN THE $39,635 PER CAPITA INCOME FOR THE UNITED STATES. AT THE SAME TIME, THE LOWCOUNTRY’S COST OF LIVING WAS ONLY 2% LESS THAN THE COST OF LIVING FOR THE ENTIRE COUNTRY, INDICATING THAT LOWCOUNTRY RESIDENTS HAVE FEWER CASH RESOURCES AVAILABLE TO MEET THEIR DAILY LIVING NEEDS.
SOURCE: CHARLESTON REGIONAL DEVELOPMENT ALLIANCE, 2011 REGIONAL ECONOMIC SCORECARD, 2012.
IN 2009, THE BCD REGION ONLY HAD $6,603 IN EXPORT ACTIVITY PER JOB, COMPARED TO PEER REGIONS LIKE LEXINGTON, KENTUCKY ($9,831), GREENVILLE, SC ($8,835), AND AUSTIN, TEXAS ($7,971).
SOURCE: 2011 REGIONAL ECONOMIC SCORECARD, REPORT PREPARED FOR THE CHARLESTON REGIONAL DEVELOPMENT ALLIANCE BY CLEMSON UNIVERSITY, UNIVERSITY CENTER FOR ECONOMIC DEVELOPMENT AND THE CHARLESTON METRO CHAMBER OF COMMERCE CENTER FOR BUSINESS RESEARCH, 2012.

p // 4-5
PLAN
ELE
ME
NT
4ECONOMY
region only had $6,603 in export activity per job, compared to peer regions like Lexington, Kentucky ($9,831), Greenville, SC ($8,835), and Austin, Texas ($7,971).5 In boosting the Lowcountry’s base of knowledge workers, we will foster innovation and
Charleston Regional Development Alliance by Clemson University, University Center for Economic Development and the Charleston Metro Chamber of Commerce Center for Business Research, 2012.
5 2011 Regional Economic Scorecard, report prepared for the Charleston Regional Development Alliance by Clemson University, University Center for Economic Development and the Charleston Metro Chamber of Commerce Center for Business Research, 2012.
support emerging, high-growth sectors.
Like Boeing and the Clemson University Wind Turbine Drive Train Testing Facility, these growth sectors and the success of our economy require world-class infrastructure and freight facilities to move goods and people quickly and efficiently, including shipping and port facilities, airports, railways, roadways and multi-modal transit. While Plan Element 3 addresses regional mobility in more detail, it is important to consider that the Port of Charleston and our region’s freight infrastructure and goods mobility system are central to the
success of our economy and which requires prioritization or warrants focus study. According to the South Carolina Ports facts sheet, “The Port of Charleston is one of the busiest container ports along Southeast and Gulf coasts and is recognized as one of the nation’s most efficient and productive ports."6 The Charleston customs district ranks it as the nation’s eighth largest in dollar value of international shipments. A $1.3 billion effort is underway to enhance the Port’s capacity by 50% and
6 www.port-of-charleston.com/About/statistics/ FACT_SHEET_CY11.pdf
6 Figure 4-7: The region’s economy is highly dependent upon the efficient movement of goods, making freight facilities critical to our region’s infrastructure. Source: Flickr – Mike Miley.
6 Figure 4-8: The Port of Charleston has one of the deepest channels on the east coast and its terminals are within 2 hours sailing time of the open ocean. These advantages resulted in nearly $59 billion in imports and exports in 2011, ranking it 8th amongst all U.S. Seaport Districts, according to the South Carolina State Ports Authority and the U.S. Census Bureau. Source: Flickr – dok1.

PLA
N E
LEM
EN
T 4
ECONOMY
p // 4-6
boost efficiency through a new terminal operating system. Expansion of the Port will also include a new cruise ship terminal and improve the Port’s ability to handle the larger ships that will become the norm once expansion of the Panama Canal is completed.
Growing our target sectors requires a supportive legislative environment as well as finance and entrepreneurial resources. SC Launch and Charleston’s Digital Corridor are good examples of efforts to assist knowledge-based companies grow and thrive in the Lowcountry. SC Launch is a project of South Carolina Rapid Application of New Technologies (SCRA) to boost the creation of higher-wage jobs and technology cluster industries by helping fledgling businesses bring their products and services to market. Digital Corridor is a business incubator program whose aim is “facilitating a business, physical and social environment where technology companies thrive.” These kinds of programs contribute to providing a supportive Lowcountry climate for emerging industries and businesses, which has led to the region being dubbed “Silicone Harbor” by Nate DaPore, CEO of software startup company PeopleMatter.
In growing these types of industries and supporting them with the necessary infrastructure and business-friendly environment, the BCD region will be economically diverse and competitive. This diverse economy will foster long term sustainable growth by
creating jobs that offer higher wages and provides opportunities for all residents, across all sectors.
» Workforce Capabilities and Readiness
To be economically competitive and attract the sectors deemed most advantageous to our growth and prosperity – advanced security and IT, aerospace, biomedical, and wind energy - the Lowcountry will develop the workforce to sustain them. The five largest employers in the Lowcountry – Joint Base Charleston, the Medical University of South Carolina, Roper St. Francis Healthcare, Boeing, and Trident Health System – represent several of these key industries and demonstrate the number of jobs that are at stake.
The State of South Carolina recognized how important workforce development is to the region’s economy when it committed $45 million to Boeing to assist the company in training its new staff as it prepared to open its North Charleston facility. In its efforts, the State not only signaled its commitment to Boeing, but it also illustrated a key aspect of economic development: education and economic development are intrinsically tied together and our region’s human capital is the most important asset.
Education is not only a tool for our residents to acquire jobs and larger salaries. It also provides us with the means of better understanding our world
and our neighbors, it helps us identify challenges and opportunities, and it equips us with the tools to find solutions. These benefits easily translate to the workplace by helping businesses meet changing demands of the marketplace while also creating a culture that fosters and values innovation. These are but some of the reasons why the education and skill level of a region’s workforce are some of
Figure 4-9: Five Largest Regional Employers
Source: Charleston Regional Development Alliance, Charleston MSA Economic Profile, 2012.
Joint BaseCharleston
46%
RoperSt. FrancisHealthcare
11%
Trident Health Systems
5%

p // 4-7
PLAN
ELE
ME
NT
4ECONOMY
the most influential factors used by businesses in choosing a location.
It is true that the Lowcountry has a higher share of high school and college graduates than the whole of the United States: in 2010, 87% and 29% of the region’s population 25 years of age and over had high school diplomas and bachelor’s degrees, respectively. Nationally, only 85% of the population had a high school diploma and only 28% graduated from college. However, in competing with comparable regions like Raleigh (NC), Austin (TX), Lexington (KY) and Richmond (VA), the BCD region lags behind them all in the percentage of the population with college diplomas. Developing a highly skilled and knowledgeable workforce is important when competing with these regions and it will become increasingly so as our targeted sectors grow. Boeing and companies like GE who are developing alternative energy sources need a workforce skilled in engineering and advance manufacturing techniques. Companies such as PeopleMatter and other IT and advanced security concerns need employees skilled in the latest technologies and applications (9a). Trident Health Systems and emerging biomedical firms like Charleston Laboratories, Inc. require staff with specialized knowledge in life sciences and medical technology. Meeting the needs of these employers and the ones to follow requires a commitment from both the public and private sector to support and enhance all levels of education – from
pre-K to post-secondary, including technical and trade schools and continuing education.
There are numerous bright spots in the region with respect to the capabilities of our workforce as well as the State and region’s commitment to their development. One of the more notable is the work of The Education Foundation. Founded
in 1995 as an initiative of the Charleston Metro Chamber of Commerce, it seeks “to improve the region's economy by fostering a strong public education system.” The Foundation believes that partnerships between business and education are a key ingredient for ensuring that students graduate from high school equipped with the knowledge, skills and work ethic they will need to
6 Figure 4-10: The FIRST Robotics Competition® is a national high school competition that exposes students to the engineering fields, develops technical and project management skills, and encourages students to pursue careers in growing knowledge industries like those targeted in the BCD region, where regional FIRST competitions have been held. Source: Flickr – North Charleston.
7 Figure 4-11: Blackbaud, international software provider for nonprofits across the globe, is headquartered on Daniel Island and has operations in Australia, Canada, Hong Kong, the Netherlands, and the United Kingdom. In 2006, Blackbaud joined the NASDAQ and in 2010 was named to Forbes 100 Best Small Companies in America list. Source: Flickr – Blackbaud.
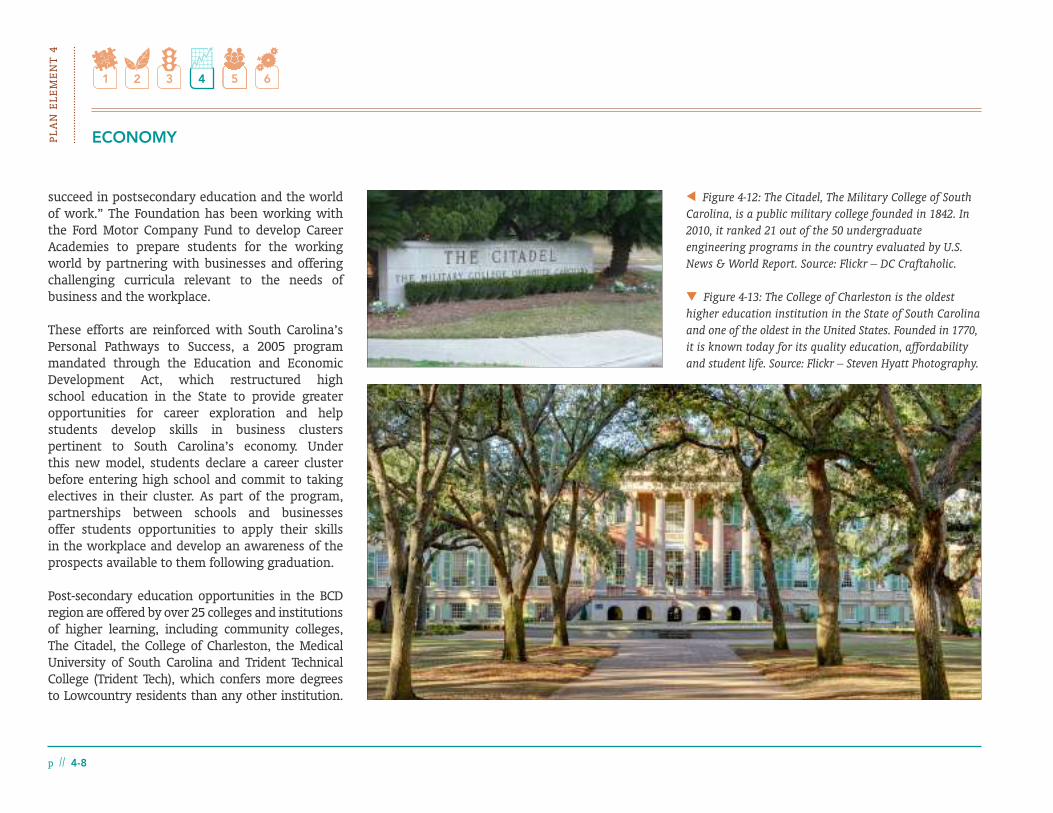
PLA
N E
LEM
EN
T 4
ECONOMY
p // 4-8
succeed in postsecondary education and the world of work.” The Foundation has been working with the Ford Motor Company Fund to develop Career Academies to prepare students for the working world by partnering with businesses and offering challenging curricula relevant to the needs of business and the workplace.
These efforts are reinforced with South Carolina’s Personal Pathways to Success, a 2005 program mandated through the Education and Economic Development Act, which restructured high school education in the State to provide greater opportunities for career exploration and help students develop skills in business clusters pertinent to South Carolina’s economy. Under this new model, students declare a career cluster before entering high school and commit to taking electives in their cluster. As part of the program, partnerships between schools and businesses offer students opportunities to apply their skills in the workplace and develop an awareness of the prospects available to them following graduation.
Post-secondary education opportunities in the BCD region are offered by over 25 colleges and institutions of higher learning, including community colleges, The Citadel, the College of Charleston, the Medical University of South Carolina and Trident Technical College (Trident Tech), which confers more degrees to Lowcountry residents than any other institution.
8 Figure 4-12: The Citadel, The Military College of South Carolina, is a public military college founded in 1842. In 2010, it ranked 21 out of the 50 undergraduate engineering programs in the country evaluated by U.S. News & World Report. Source: Flickr – DC Craftaholic.
7 Figure 4-13: The College of Charleston is the oldest higher education institution in the State of South Carolina and one of the oldest in the United States. Founded in 1770, it is known today for its quality education, affordability and student life. Source: Flickr – Steven Hyatt Photography.

p // 4-9
PLAN
ELE
ME
NT
4ECONOMY
All of these institutions are critical to cultivating the region’s human and cultural capital, but Trident Tech and the community colleges play an especially important role in economic development as they provide the region's residents with advanced skills, training and apprenticeships to support the broad spectrum of businesses in the BCD region.
In addition to providing quality education there are a number of initiatives in our region that connects job seekers to various employment opportunities. Trident One Stop Career System (TOSCS) is one such organization that is run by the Trident Workforce Investment Board (TWIB) and is currently administered by BCDCOG. TOSCS helps employers and job seekers meet their workforce development needs by offering recruiting, screening, training, and employee testing services in collaboration with Berkeley, Charleston, and Dorchester counties.
The BCDCOG and the TWIB are also charged with overseeing the programs and services of SC Works Trident, a public-private partnership that provides employment-related services to job seekers and employers, with integrated service centers in each of the three counties. The SC Works Centers offer space for job fairs, employee recruitment and other workforce development activities, including incum-bent workforce training which provides a business’s current employees with new skills in emerging tools and technologies to help maintain a competi-
tive business advantage in changing markets. SC Works Centers also provide individual-level services such as career counseling, job training, resume writing; youth employment services are provided by an SC Works partner – Palmetto Youth Connections.
By building upon the resources offered by programs like Pathways to Success, the Career Academies, Trident Tech, TOSCS, SC Works and additional academic institutions, the BCD region will build a strong base of knowledge workers skilled in emerging technologies and business processes to support not only the large corporations like Boeing, but also the startups and small businesses that are either just getting off the ground or trying to make their businesses more successful. In doing this, we will create the conditions for business and job growth, we will make the region globally competitive, we will provide employment opportunities throughout the region and we will raise our standard of living.
GUIDING PRINCIPLES
By the year 2040, the region is expected to have over 100,000 more jobs than it did in 2008. Many of these jobs will come from the four sectors poised for growth and targeted by the region’s economic development efforts – the aerospace, biomedical, advanced security and IT, and wind energy industries. Growing these industries will ensure a robust regional economy that provides diverse opportunities for employment. As we attract and develop businesses in these sectors, we will complement and build upon the assets that we have, like the Port of Charleston, and lay the foundation for sustained, long-term growth, raise the Lowcountry’s standard of living, and ensure a high quality of life.
Our path to implementing our goals can be guided through a defined set of objectives, policies, and strategies. Indicators can be used to measure the effectiveness of each of the strategies.
ECONOMY FRAMEWORK
» The Goals
Achieving the following Economic goals will ensure that the collective vision of the community is realized:
TRIDENT ONE STOP CAREER SYSTEM HELPS EMPLOYERS AND JOB SEEKERS MEET THEIR WORKFORCE DEVELOPMENT NEEDS BY OFFERING RECRUITING, SCREENING, TRAINING, AND EMPLOYEE TESTING SERVICES IN COLLABORATION WITH BERKELEY, CHARLESTON, AND DORCHESTER COUNTIES.
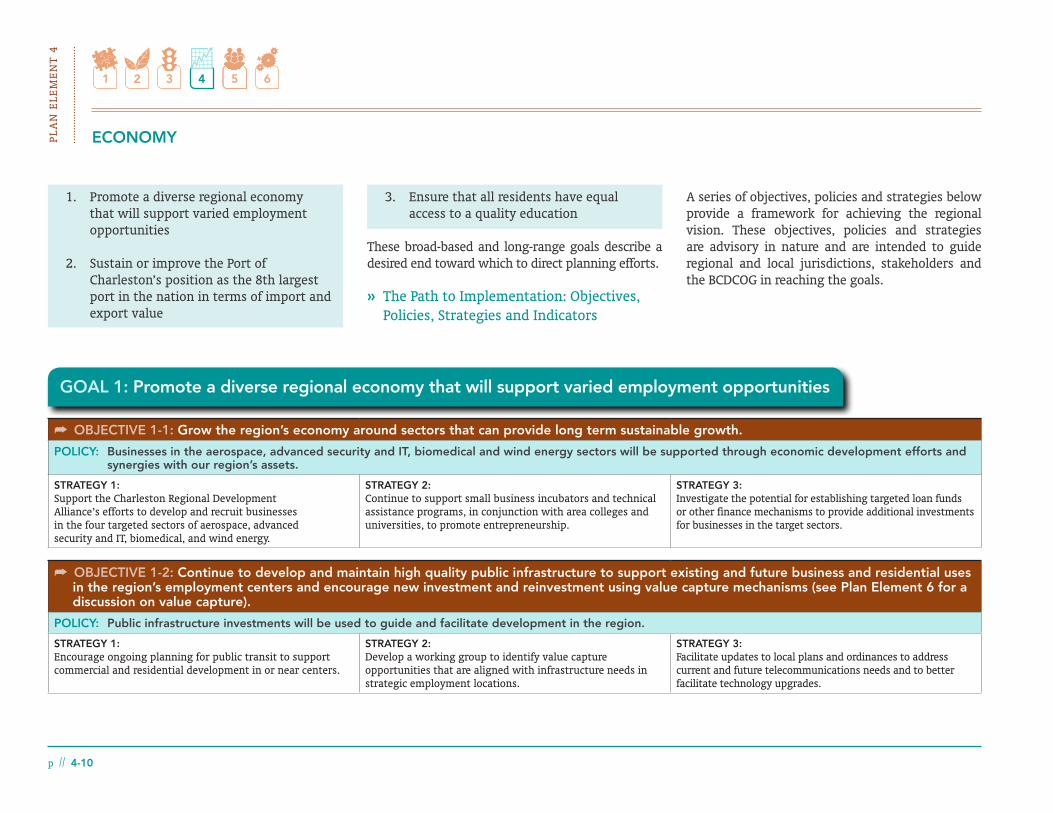
PLA
N E
LEM
EN
T 4
ECONOMY
p // 4-10
1. Promote a diverse regional economy that will support varied employment opportunities
2. Sustain or improve the Port of Charleston’s position as the 8th largest port in the nation in terms of import and export value
3. Ensure that all residents have equal access to a quality education
These broad-based and long-range goals describe a desired end toward which to direct planning efforts.
» The Path to Implementation: Objectives, Policies, Strategies and Indicators
A series of objectives, policies and strategies below provide a framework for achieving the regional vision. These objectives, policies and strategies are advisory in nature and are intended to guide regional and local jurisdictions, stakeholders and the BCDCOG in reaching the goals.
GOAL 1: Promote a diverse regional economy that will support varied employment opportunities
OBJECTIVE 1-1: Grow the region’s economy around sectors that can provide long term sustainable growth.
POLICY: Businesses in the aerospace, advanced security and IT, biomedical and wind energy sectors will be supported through economic development efforts and synergies with our region’s assets.
STRATEGY 1:Support the Charleston Regional Development Alliance’s efforts to develop and recruit businesses in the four targeted sectors of aerospace, advanced security and IT, biomedical, and wind energy.
STRATEGY 2:Continue to support small business incubators and technical assistance programs, in conjunction with area colleges and universities, to promote entrepreneurship.
STRATEGY 3:Investigate the potential for establishing targeted loan funds or other finance mechanisms to provide additional investments for businesses in the target sectors.
OBJECTIVE 1-2: Continue to develop and maintain high quality public infrastructure to support existing and future business and residential uses in the region’s employment centers and encourage new investment and reinvestment using value capture mechanisms (see Plan Element 6 for a discussion on value capture).
POLICY: Public infrastructure investments will be used to guide and facilitate development in the region.
STRATEGY 1:Encourage ongoing planning for public transit to support commercial and residential development in or near centers.
STRATEGY 2:Develop a working group to identify value capture opportunities that are aligned with infrastructure needs in strategic employment locations.
STRATEGY 3:Facilitate updates to local plans and ordinances to address current and future telecommunications needs and to better facilitate technology upgrades.

p // 4-11
PLAN
ELE
ME
NT
4ECONOMY
GOAL 1: Promote a diverse regional economy that will support varied employment opportunities continued
OBJECTIVE 1-3: Provide a supportive environment that fosters business growth and innovation at all scales, especially for small and local businesses.
POLICY: The region will foster a “business-friendly” atmosphere that supports entrepreneurship.
STRATEGY 1:Continue supporting partnerships that help communities plan jointly for economic development in the local and global marketplace.
STRATEGY 2:Foster continued coordination between local chambers of commerce, the Charleston Metro Chamber of Commerce and the Charleston Regional Development Alliance (CRDA) to promote strategic regional economic development and tourism activities that draw on the distinctiveness of our communities.
STRATEGY 3:Encourage the establishment of coalitions and partnerships with local civic organizations and business associations to promote and support small and locally-owned businesses.
STRATEGY 4:Encourage initiatives to improve and broaden higher education programs and facilities (see also Goal 3).
STRATEGY 5:Promote workforce development, training and job placement activities (see also Goal 3).
STRATEGY 6:Continue to encourage and support activities and industries that add to the creativity, ingenuity and quality of life in the region.
1. Increase in the number of industries headquartered in the region.
2. Increase in the number of Fortune 500 companies within the region.
3. Increase in the number of target sector businesses within the region.
4. Increase in the number of businesses in the creative industries.
5. Increase in the number of new businesses registered in the region.
6. Increases in the location quotients of the target sectors.
7. Increase in the gross regional product.
8. Increase in the number of employees in the target sectors.
9. Decrease in the unemployment rate.
10. Increase in employment growth for the region.
11. Increase in the average wages for the region.
12. Increase in the regional per capita income and a decrease in the regional cost of living.
13. Adoption and implementation of the Charleston Regional Development Alliance’s Opportunity Next recommendations.
14. Improvements in the survey ratings of the region’s infrastructure.
GOAL 1 INDICATORS OF SUCCESS

PLA
N E
LEM
EN
T 4
ECONOMY
p // 4-12
OBJECTIVE 2-2: Mitigate negative environmental impacts caused by Port activities.
POLICY: Provide a higher quality of life for the region by developing industries while mitigating the impacts and unintended consequences of their development.
STRATEGY 1:Engage the public in Port expansion planning efforts and decision-making, especially in regards to environmental justice issues.
Note: The South Carolina State Ports Authority (SCSPA) along with City of North Charleston and Lowcountry Alliance for Model Communities (LAMC) developed the Community Mitigation Plan (CMP) in 2009. This plan addressed issues faced by a group of seven neighborhoods due to the expansion of the Port on the former Naval Complex in North Charleston.
STRATEGY 2:Continue to work with surrounding communities to provide better ingress and egress for Port related traffic and mitigation of associated traffic impacts to the region.
STRATEGY 3:Support the Port in its efforts to cut diesel related emissions and use cleaner fuels like ultra-low sulfur diesel.
STRATEGY 4:Support the partnership between South Carolina’s Department of Health and Environmental Control (DHEC) and the S.C. State Ports Authority (SCSPA) to monitor air quality around the Port and mitigate the environmental impacts of Port operations.
GOAL 2: Sustain or improve the Port of Charleston’s position as the 8th largest port in the nation in terms of import and export value. (Source: South Carolina State Ports Authority- www.port-of-charleston.com/About/statistics/dollar value.asp)
OBJECTIVE 2-1: Maintain or enhance Port efficiency and productivity through the improvement and expansion of a well-connected, intermodal transportation network.
POLICY: Develop a robust, efficient transportation network that supports the region’s industries.
STRATEGY 1:Coordinate Port improvements and expansion with development of the Long Range Transportation Plan as well as with surrounding neighborhoods.
STRATEGY 2:Conduct a comprehensive Regional Freight Mobility Study to identify strategic issues and opportunities for intermodal and multimodal transportation (see Plan Element 3 for more information).
STRATEGY 3:Build a more effective regional transportation network that serves both the Port and nearby redevelopment opportunities.
OBJECTIVE 2-3: Encourage the development of Port-related industries.
POLICY: Capitalize on market synergies to develop additional related businesses that can support or be benefitted by the Port and its users.
STRATEGY 1:Continue efforts to build awareness and recognition of the Port and its advantages.
STRATEGY 2:Create partnerships with the Ports Authority to market the Port to global and regional businesses.
STRATEGY 3:Support efforts to secure and enhance economic advantages for Port related businesses, e.g. federal tax advantages, enhanced benefits and incentives for Foreign Trade Zone businesses.

p // 4-13
PLAN
ELE
ME
NT
4ECONOMY
GOAL 2: Sustain or improve the Port of Charleston’s position as the 8th largest port in the nation in terms of import and export value. (Source: South Carolina State Ports Authority- www.port-of-charleston.com/About/statistics/dollar value.asp) continued
1. Increase in Port efficiency (e.g. time in Port, time to load/unload, number of containers and vessels served etc.) in relation to other national and international ports.
2. Changes in truck traffic volume to and from the Port.
3. Decrease in the number of accidents related to Port traffic.
4. Increase in the number of intermodal facilities within the tri-county region.
5. Changes in regional traffic patterns and congestion before and after Port cargo modal decisions (i.e. increased rail shipments, cargo truck traffic and decreases in peak and off-peak travel times, etc.).
6. Increase in the tonnage that passes through the Port.
7. Decreases in air and water pollution levels around the Port, including the number and types of sea life found around the Port.
8. Increase in the number or share of community members who participate in Port and related LRTP planning efforts.
9. Increase in the number of Port-related industries.
10. Increase in the economic impact of Port activities and businesses.
GOAL 2 INDICATORS OF SUCCESS
OBJECTIVE 3-1: Support efforts to improve access and opportunities for education and training for all age groups.
POLICY: Continue to improve all BCD region residents’ access to education and training that will prepare them for the workplace.
STRATEGY 1:Assist in expanding the educational opportunities throughout the region, from pre-K-12th grade through post-secondary and continuing education.
STRATEGY 2:Identify areas and demographics in particular need of additional educational and workforce development opportunities.
GOAL 3: Ensure that all residents have equal access to a quality education
OBJECTIVE 3-2: Promote equal access to advanced learning and business technologies in all educational facilities.
POLICY: Comparable, high quality, advanced learning and business technologies will be available in educational facilities across the region.
STRATEGY 1:Continue to establish partnerships between schools and technology providers.
STRATEGY 2:Work with local and regional businesses to develop technology funds and programs that provide educational facilities with advanced technologies used in area industries and target sectors.

PLA
N E
LEM
EN
T 4
ECONOMY
p // 4-14
GOAL 3: Ensure that all residents have equal access to a quality education continued
OBJECTIVE 3-3: Increase the number of “knowledge workers” in the region.
POLICY: Promote the development of skills needed to support emerging businesses and sectors.
STRATEGY 1:Continue to build strong workforce development initiatives to support a high growth economy by focusing on skills needed in the four sectors targeted in Opportunity Next and matching employee skills with employer needs.
STRATEGY 2:Continue to support efforts to establish Career Academies throughout the BCD region.
STRATEGY 3:Support the continued development of public-private partnerships to provide students throughout the BCD region with career exploration and skill development opportunities.
OBJECTIVE 3-4: Improve school district performance levels on the State Report Card to achieve a ranking of “Excellent.” (South Carolina State Department of Education – www.ed.sc.gov/data/report-cards)
POLICY: Support school districts in preparing students for productive lives and careers.
STRATEGY 1:Encourage the provision of incentives to attract highly qualified teachers.
STRATEGY 2:Champion incentivized teacher pay based on school district and student performance.
STRATEGY 3:Support efforts to provide targeted assistance to school districts to improve district ratings on the State Report Card so that districts rated “Average” or below improve to “Good” and that districts rated “Good” improve to “Excellent.”
1. Increase in the number of school districts receiving a “good” or higher ranking level on the State Report Card.
2. Increase in the number of computers each primary school offers per student.
3. Decrease in the dropout rate for public schools K-12.
4. Increase in the number of high school graduates in the region.
5. Increase in the number of higher education institutions present in the region.
6. Increase in the number of college graduates in the region.
7. Increase in the number of people with advanced degrees in the region.
8. Increase in the number of knowledge workers in the region.
GOAL 3 INDICATORS OF SUCCESS

PLAN
ELE
ME
NT
5
While old historic and political boundaries have come to mean less and less as we grow, we are becoming a more integrated and interdependent region. Increasing fiscal constraints also require innovation and increased intergovernmental cooperation. Moreover, achieving efficiencies in providing services and pursuing elusive project funding has become increasingly contingent upon demonstrated regional collaboration. It is therefore natural that resolution of many of today’s environmental, infrastructure, land use, and economic issues necessitates collaboration across jurisdictional lines.
In fact, one of the top issues of concern identified through OurRegion OurPlan (OROP) surveys, forums and community workshops was a call for more cooperation, collaboration and consistency across the region and between local and regional governments. Elected officials, civic leaders and
The Berkeley, Charleston, Dorchester region has witnessed enormous change in the last several decades from the
close of the naval base to the growth of the high tech, security and port / container industries, as well as the boom in tourism and visitor
attractions. The resulting growth has changed the Lowcountry landscape significantly. The issues we face – such as congestion, economic
fluctuations, and the loss of our traditional landscape and community form – are not solvable by any single jurisdiction no matter how
large. These regional issues cross all of our boundaries, necessitating a collaborative, regional approach to problem-solving.
community activists alike expressed a growing realization that many, if not most, of the priority issues facing our communities cannot be solved without new levels of inter-jurisdictional and cross-sector collaboration.
As the metropolitan planning organization (MPO) and regional council of governments, the BCDCOG has a responsibility to steward implementation of OurRegion OurPlan (OROP) and to provide leadership
p // 5-1
Plan Element 5:REGIONAL LEADERSHIP and STEWARDSHIP
in achieving its goals including facilitating intergovernmental collaboration, fostering transparent decision-making, and aligning local plans and regulations with the Vision Plan. However, the COG cannot do this alone. To the contrary, OROP’s realization requires a regional effort and widespread civic engagement to ensure that implementation is consistent with the regional Vision and that Lowcountry communities and residents take ownership of the plan and are invested in its success.
Denver provides a model to consider with their Mile high Compact, which was formed by the chief elected officials of the region. The Compact is a supplement to the formal regional agency and
commits leaders to working face-to-face and negotiating significant issues. This approach has been adopted by a number of other regions including the San Francisco Bay Area as well as Knoxville, Tennessee.

PLA
N E
LEM
EN
T 5
REGIONAL LEADERSHIP and STEWARDSHIP
p // 5-2
process has opened the door for future collaborative efforts within the BCD region, revealed possibilities for aligning regional and local plans, demonstrated the public’s interest in regional decision-making and helped discover the potential for, and interest in, meaningful civic engagement on issues of regional planning, growth and development. It is now up to the BCDCOG and its community partners to be the stewards for the Vision Plan and lead the region in achieving its goals.
» The Need for Intergovernmental Agreement and Collaboration
OurRegion OurPlan is a blueprint to help realize the regional Vision and achieve the Lowcountry’s growth and development goals. It is not intended to subvert or interfere with local planning or authority, but instead should be used to foster intergovernmental agreement and collaboration on critical and complex cross-jurisdictional issues in the Lowcountry. These issues range from water resource protection, transportation, and transit, as well as satisfying the demand for future infrastructure and services with increasingly limited funds. Through intergovernmental collaboration, the region will be more effective in accomplishing its goals and will be better able to overcome obstacles to implementation. For example, through OROP and its public involvement process several issues were
identified as priorities for the region because they are integral to our quality of life and economic opportunities, but they will only be achieved through intergovernmental agreement and collaboration. Some of these issues include:
1. Protecting rural and agricultural land critical to the character of the Lowcountry.
2. Guiding new development towards developed and/or identified centers to align growth with the region’s preferred patterns, make efficient
ISSUES AND OPPORTUNITIES
At the core of our region’s history is a tradition of independence, self-sufficiency, and cultural, racial, and economic diversity. These traditions have enriched the Lowcountry, but have also brought about challenges in the form of cultural, social, economic and political differences. These differences can make collaboration difficult, effective implementation arduous and alignment of plans unlikely, especially when decisions are made behind closed doors outside of the public view and without the benefit of transparency. Yet the Lowcountry’s capacity for collaboration and transparent decision-making has been revealed through OROP’s regional planning process. This
An appropriately scaled example for the BCD Region can be found in Newton
County, GA, where the County and its five incorporated municipalities have jointly identified growth and conservation zones. Each municipality then simultaneously produced new comprehensive growth plans, synchronized with a shared vision and strategies. The nonprofit Center for Community Preservation and Planning helped coordinate the process with assistance from the state university.
Source: The Center for Community Preservation and Planning (www.centernewton.org/plan/the-2050-plan).
6 Figure 5-1: OurRegion OurPlan’s and its Regional Forum and community workshops demonstrated the possibilities for collaboration, civic engagement and community participation. Source: OurRegion OurPlan, Ron Thomas.

p // 5-3
PLAN
ELE
ME
NT
5REGIONAL LEADERSHIP and STEWARDSHIP
intergovernmental agreement and collaboration are also needed at an increasing level to secure project funding. More and more, federal funding programs are stressing the importance of regionally coordinated investments as evidenced by the Projects of National and Regional Significance program contained in MAP-21 and in joint planning programs like the Partnership for Sustainable Communities – a program of the U.S. Department of Housing and Urban Development, the Environmental Protection Agency and the Department of Transportation – which funds coordinated projects that provide cross-sector and cross-jurisdictional benefits. With leadership from the COG, OROP and its strategic recommendations, we can stimulate collaborative activities to leverage these types of funds and provide guidance to regional leaders and decision makers as they prioritize projects, program and infrastructure improvements.
improved quality of life across the BCD region. The region’s long range transportation plan (LRTP) is one tool the region has to ensure this happens, as it identifies and prioritizes projects to receive federal funding over both the near and long term, including projects like rail / highway grade separations, safety improvements, trail improvements, bridge rehabilitation and (re)construction, streetscape enhancements, transit planning and construction, and freight facility improvements. With the development of OROP, a broader context for the LRTP has been established that further prioritizes efforts and also identifies and addresses the interdependencies between transportation and land use decisions so that we can reconcile their impacts on the natural environment and our desired quality of life.
Because of these strong interdependencies, resource limitations and critical needs at all levels,
use of existing infrastructure and protect rural and agricultural lands from development.
3. Evaluating the potential for tools such as Urban Growth Boundaries and Developments of Regional Impact to be applied on a region-wide basis.
4. Prioritizing and funding infrastructure and transportation facilities consistent with the long range transportation plan (LRTP) and the OROP Vision.
Not only are collaboration and intergovernmental agreement needed to make these goals politically feasible, but it is also necessary to make the most efficient use of resources. Since both federal and local funding is increasingly limited, it is critical that they are used efficiently and that they contribute to increased economic opportunities and an
Mechanisms such as Developments of Regional Impact (DRI) reviews allow regional agencies to review and provide input on complex, large scale development projects that are likely to have a significant regional impact beyond the boundaries of a single jurisdiction. DRIs are not regulatory, but
function in an advisory capacity to enhance communication between affected jurisdictions and the governing jurisdiction and help reveal and mitigate impacts before they occur. A compelling benefit of DRIs is that a local jurisdiction’s authority over final development approvals is preserved while transparency and intergovernmental cooperation and communication are enhanced. DRI mechanisms have been used in Florida for 40 years while Georgia has applied the process since its 1989 enabling legislation was adopted.

PLA
N E
LEM
EN
T 5
REGIONAL LEADERSHIP and STEWARDSHIP
p // 5-4
efforts reflect the wider community. By engaging the community in a meaningful way, relationships between elected leaders, local communities, regional jurisdictions and citizens will also be strengthened and the plan will have a greater chance of enduring.
To achieve inclusionary planning and on-going community engagement, a variety of tools and outreach efforts must be used. Social media tools such as Twitter, Facebook and LinkedIn provide ways of connecting with youth and young professionals. Traditional community organizing techniques such as door-to-door canvassing and attending community and church meetings provide face-to-face opportunities to connect with residents, encourage participation, gather insight and reach diverse audiences who may not use social media or be otherwise inclined to attend traditional public involvement events. Establishing citizen committees to participate in the planning and implementation process directly connects regional planning efforts with local communities. Charrettes, community listening sessions and interactive town hall meetings provide opportunities for open discussions and consensus building. Using these tools and others to include a diverse range of voices in discussions and decisions will ensure that future plans and projects reflect the interests and values of the region and increase the chances for successful plan implementation.
While these tools will help engage citizens, keeping them involved and invested in the Plan’s achievement requires community trust. Trust is not only built through open dialogues, but it is also accomplished through a transparent decision-making process. Throughout the OROP process, promoting transparency in decision-making was publicly identified as a goal of the Plan. Including the public in the decision-making process and sharing the outcomes of actions taken can foster transparency at both the local and regional level. Further, by documenting progress towards the OROP goals, benchmarking project outcomes, and publicly monitoring and sharing regional quality of life indicators on a regular basis, the region’s leaders can make their decisions and policies more transparent.
Regional indicators can include any number of measurable data about the region and its residents, including, but not limited to, commute times, the cost of congestion, foreclosure rates, unemployment rates, educational attainment, and acres of agriculture land developed each year. Engaging independent entities or agencies, such as a university or civic group, to monitor these indicators not only enhances transparency, but it also builds credibility and establishes accountability, both of which are important to building community trust and effective partnerships.
» Stewarding the Implementation of OROP
By leveraging the COG’s resources, connections and capacity to convene regional leaders and stakeholders, there is significant potential to progress towards realization of the OROP goals. However, achieving the OROP vision and implementing its strategies will not only require stewardship of the plan, but also an engaged community that is invested in the plan and its achievement. Only an engaged community will guarantee that the plan is carried forward in a way that is consistent with the Vision, that the community values which helped shape the plan are translated into tangible projects, and that these
6 Figure 5-2: Small group discussions engage residents in a meaningful way and encourage open dialogues and the sharing of ideas. Source: OurRegion OurPlan, Ron Thomas.

p // 5-5
PLAN
ELE
ME
NT
5REGIONAL LEADERSHIP and STEWARDSHIP
New technology tools are an effective way to facilitate civic engagement and
collaboration. Web-based technologies like Granicus, NeighborWorks-America, MetroQuest and MindMixer (www.mindmixer.com) offer easy ways to share plan documents with the public, manage interactive project web sites, conduct surveys, solicit public input and stimulate dialogue. Social networks and media such as Facebook, Twitter, Flickr, You Tube and blogs contribute additional opportunities to solicit and listen to community input and offer alternatives to the typical public meeting or outreach event. By establishing an accessible and visual public record, these technologies also enhance the transparency of the process.
When public forums are needed, technology tools can also encourage civic engagement. New visualization tools such as GIS and computer modeling programs contribute to clear graphic communication of complex planning concepts, making them more understandable and accessible to a broader base. Digital modeling tools like CommunityViz, which was used in OurRegion OurPlan, can be used “live” in public meetings to help the public immediately see the impacts
of planning decisions. This is particularly useful when discussing the implications of land conservation, zoning or density changes. Another tool used successfully in OurRegion OurPlan was the “21st Century Town Meeting®”, a concept pioneered by AmericaSpeaks. The 21st Century Town Meeting® concept has been used successfully in regions as large as Washington, DC and was also used for the OurRegion OurPlan launch and subsequent community workshops and the Regional Forum. One of the key features
of the 21st Century Town Meeting® is the use of digital polling technology, which was employed in OurRegion OurPlan to gauge public opinions and preferences on regional planning issues and priorities as well as preferred plan elements. While events of this type require careful planning and management as well as a high-level of conference support in logistics, communication, technology and hospitality, they are effective in generating civic interest and media attention, lend transparency and credibility to the planning and decision making process.
Remote-access web conferencing software can also complement these public forums and expand their reach. In the August 2011 OurRegion OurPlan Regional Forum, this web based technology was added to the 21st Century Town Meeting® format to allow for greater stakeholder participation across the region. Five remote sites provided structured local workshops that were linked to the Regional Forum via web conferencing software. With a geographically dispersed region, the technology allowed more of the Lowcountry’s residents to engage in the planning process, share their concerns and collaborate in establishing the preferred scenario for growth in the BCD region.
6 Figure 5-3: The OurRegion OurPlan Regional Forum and workshops used the 21st Century Town Hall Meeting format, including small group discussions, real time preference voting and webcast technology. Source: OurRegion OurPlan, Ron Thomas.

PLA
N E
LEM
EN
T 5
REGIONAL LEADERSHIP and STEWARDSHIP
p // 5-6
» Aligning Local Plans and Regulations with OROP
The efforts described above are critical to securing local buy-in and the community’s acceptance of the plan. To realize widespread plan implementation and to translate the regional vision into local action, the COG will need to help build the capacity of local communities and jurisdictions. This will not only help to further engage the Lowcountry communities in the regional planning process, but it will also help each to better respond to local issues and opportunities and achieve real and tangible results.
A key step the COG can take to foster implementation at the local level is to collaborate on crafting more detailed sub-regional plans that further the OROP vision. Examples of this include working with communities and other organizations, such as Lowcountry Open Land Trust (LOLT), to develop the Green Infrastructure component of OROP into detailed local and sub-regional Green Infrastructure plans which would help communities further protect watersheds and critical areas, coordinate conservation efforts, and identify which parcels or areas might be best developed using conservation development methods.
The COG can also draw upon its technical resources to aid local communities in adopting and implementing code-based mechanisms such
In addition to regulatory code-based mechanisms, advisory programs can also help guide local plans into alignment with OROP. One example of such a program is a Developments of Regional Impact (DRI) review process. It would benefit the Lowcountry by
as Smart Codes and design pattern guides. These mechanisms not only help realize the development patterns identified by the community in the Vision Plan, but they also protect and cultivate the Lowcountry’s unique sense of place.
6 Figure 5-4: In 2008-2009, Richmond Regional Planning District Commission (RRPDC), the Crater Planning District Commission (CPDC), the Green Infrastructure Center, and the Capital Regional Land Conservancy documented the region’s green infrastructure assets. Based on all previous mapping and analysis, the regional agencies created a network of green infrastructure and identified opportunities for conservation and preservation. Source: www.richmondregional.org.
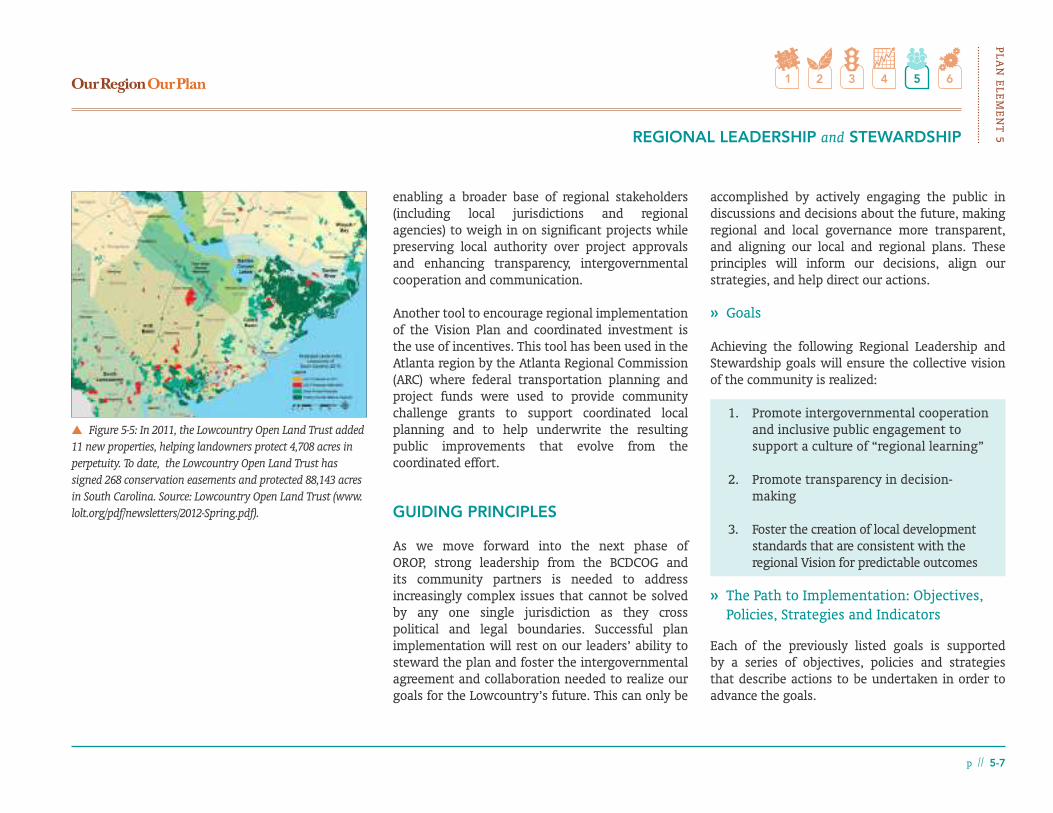
p // 5-7
PLAN
ELE
ME
NT
5REGIONAL LEADERSHIP and STEWARDSHIP
enabling a broader base of regional stakeholders (including local jurisdictions and regional agencies) to weigh in on significant projects while preserving local authority over project approvals and enhancing transparency, intergovernmental cooperation and communication.
Another tool to encourage regional implementation of the Vision Plan and coordinated investment is the use of incentives. This tool has been used in the Atlanta region by the Atlanta Regional Commission (ARC) where federal transportation planning and project funds were used to provide community challenge grants to support coordinated local planning and to help underwrite the resulting public improvements that evolve from the coordinated effort.
GUIDING PRINCIPLES
As we move forward into the next phase of OROP, strong leadership from the BCDCOG and its community partners is needed to address increasingly complex issues that cannot be solved by any one single jurisdiction as they cross political and legal boundaries. Successful plan implementation will rest on our leaders’ ability to steward the plan and foster the intergovernmental agreement and collaboration needed to realize our goals for the Lowcountry’s future. This can only be
6 Figure 5-5: In 2011, the Lowcountry Open Land Trust added 11 new properties, helping landowners protect 4,708 acres in perpetuity. To date, the Lowcountry Open Land Trust has signed 268 conservation easements and protected 88,143 acres in South Carolina. Source: Lowcountry Open Land Trust (www.lolt.org/pdf/newsletters/2012-Spring.pdf).
accomplished by actively engaging the public in discussions and decisions about the future, making regional and local governance more transparent, and aligning our local and regional plans. These principles will inform our decisions, align our strategies, and help direct our actions.
» Goals
Achieving the following Regional Leadership and Stewardship goals will ensure the collective vision of the community is realized:
1. Promote intergovernmental cooperation and inclusive public engagement to support a culture of “regional learning”
2. Promote transparency in decision-making
3. Foster the creation of local development standards that are consistent with the regional Vision for predictable outcomes
» The Path to Implementation: Objectives, Policies, Strategies and Indicators
Each of the previously listed goals is supported by a series of objectives, policies and strategies that describe actions to be undertaken in order to advance the goals.

PLA
N E
LEM
EN
T 5
REGIONAL LEADERSHIP and STEWARDSHIP
p // 5-8
GOAL 1: Promote intergovernmental cooperation and inclusive public engagement to support a culture of “regional learning”
OBJECTIVE 1-1: Leverage the capacity and connections of the COG and experiences of OROP to facilitate and build intergovernmental cooperation.
POLICY: The BCDCOG will continue to convene regional leaders to bring about comprehensive and cooperative solutions to regional issues, achieve efficiencies in governance and service provision, pursue funding for projects of regional significance and realize the vision of OROP.
STRATEGY 1:Conduct regular leadership workshops or charrettes with focused discussions on regional issues of importance (e.g. shared service provisions, regional transportation projects, growth boundaries, fiscal collaboration, local comprehensive plan integration, etc.) and build consensus on potential strategies or approaches.
STRATEGY 2:Establish and support task forces (e.g. a green infrastructure task force or a transfer-of-development rights task force) made up of local leaders and stakeholders to track regional issues on an on-going basis, including evaluation of current practices, identification of emerging practices, and development of model ordinances, codes and policies).
STRATEGY 3:Hold semi-annual “check-in” events to update regional leaders on the status of OROP implementation efforts as well as the opportunities, challenges and barriers to implementation.
OBJECTIVE 1-2: Build a broad platform for continued public involvement and community engagement in regional planning, governance and the implementation of OROP.
POLICY: The BCDCOG will steward implementation of OROP by engaging the community in its achievement, reinforcing the importance of regional planning, and building the region’s capacity for meaningful public involvement.
STRATEGY 1:Use web-based social media and other emerging technologies (including CommunityViz®, webcasts, digital surveys, Twitter and Facebook) to connect with the public on regional planning initiatives, solicit feedback and foster citizen engagement.
STRATEGY 2:Establish an inclusive citizen committee consisting of volunteer and appointed members who will give voice to regional and local concerns, provide community insights, and help connect local communities with OROP implementation activities.
STRATEGY 3:Develop a citizens’ guide (and / or other tool) to provide citizens with the knowledge and resources needed to establish and effectively run local community groups and citizen-driven campaigns to address local and regional issues.
STRATEGY 4:Develop resources and tools (e.g. training workshops and/or guides) to build the capacity of local governments and community agencies in engaging the public in meaningful dialogues about community priorities and decision-making.
STRATEGY 5:Assist local communities and jurisdictions with town hall meetings, community listening events and community charrettes, among other activities, to foster public involvement and citizen engagement on local and regional issues. Assistance could be provided through staff support and technical resources (e.g. keypad polling equipment), group facilitation training, etc.).

p // 5-9
PLAN
ELE
ME
NT
5REGIONAL LEADERSHIP and STEWARDSHIP
GOAL 2: Promote transparency in decision-making
OBJECTIVE 2-1: Enhance the transparency of regional planning initiatives and the implementation of OROP.
POLICY: The BCDCOG will lead by example by striving for transparency on the implementation of OROP and other regional planning efforts.
STRATEGY 1:Partner with local communities to host regular public forums, town hall meetings, and/or round table events to share information with citizens and receive insights on local and regional projects, OROP implementation, and “Regional Indicators” that measure quality of life issues and progress towards the OROP goals.
STRATEGY 2:Utilize partnerships with university and civic researchers to develop a public monitoring program to track implementation of OROP through the Regional Indicators.
STRATEGY 3:Support the development of a regularly updated digital portal to allow for public monitoring of the Regional Indicators and also facilitate the regular publication of a State of the Region Report on the Regional Indicators.
OBJECTIVE 2-2: Utilize the BCDCOG’s role as a regional agency to enhance local and regional government transparency.
POLICY: The BCDCOG will support local and regional governments in their efforts to increase government transparency.
STRATEGY 1:Identify and compile best practices that can be adopted by local communities and jurisdictions to increase transparency and enhance information sharing. Best practices should be drawn from and be applicable to different types of decisions, such as comprehensive plan updates, development plans, zoning decisions, capital plans, transit and transportation plans, etc.
STRATEGY 2:Conduct workshops for local jurisdictions on the benefits and strategic (and political) advantages of increased transparency and provide training on the most effective ways to achieve transparency.
STRATEGY 3:Publish and disseminate policy guides to be used by local communities and jurisdictions in establishing policies and practices that go beyond basic requirements for open records to increase the transparency of local decision-making.
STRATEGY 4:Facilitate enhanced transparency and information sharing for smaller jurisdictions by providing technical resources and / or additional capacity.

PLA
N E
LEM
EN
T 5
REGIONAL LEADERSHIP and STEWARDSHIP
p // 5-10
GOAL 3: Foster the creation of local development standards that are consistent with the regional Vision for predictable outcomes
OBJECTIVE 3-1: The BCDCOG will facilitate the alignment of OROP with the plans and regulations of Lowcountry communities and jurisdictions.
POLICY: Use the OurRegion OurPlan Green Infrastructure Vision Plan as a framework for regional planning (Model: Chicago Wilderness).
STRATEGY 1:Collaborate with local communities and agencies to develop detailed plans that further the OROP vision (e.g. detailed Green Infrastructure, Freight and Mobility Plans) and which can be adopted by local communities and integrated into their development regulationss.
STRATEGY 2:Encourage local and regional government jurisdictions to adopt OROP as policy.
STRATEGY 3:Communicate the benefits of aligning development regulations with the OROP Vision (e.g. increased potential for project funding) and assist local communities in doing so.
STRATEGY 4:Develop a means for prioritizing project funding based on conformance with the Vision Plan.
STRATEGY 5:Study the feasibility of establishing a Developments of Regional Impact (DRI) review process.

PLAN
ELE
ME
NT
6
The BCD region is no different than other U.S. regions which are facing growth issues that transcend local jurisdictional boundaries; like many others, it operates today under a governmental system that makes it challenging for the collective best interest of the region to be incorporated into local decisions. Nevertheless, the stage was set for the BCD region to develop the OROP vision and its implementation when the three county comprehensive plans were updated with a regional perspective in mind. The individual county plans complement OROP and the BCDCOG plays a significant role in the implementation of various plans.
With OROP, the BCDCOG’s traditional role as a metropolitan planning organization (MPO) that is the regional coordinating body in allocating federal and state transportation funds and providing “as needed” support for local governments is changing to a more comprehensive regional planning institution responsible for providing a
Plan Element 6: PARTNERSHIP and FINANCE
OurRegion OurPlan (OROP) seeks to convey a common vision for the BCD Region developed through a collaborative planning process. In order to
realize this vision, implementation should be viewed as a shared opportunity by all public
sector agencies and jurisdictions and among private sector interests that provide investment
capacity that sustains the region.
sustainable framework for regional governance. This transition will require strong leadership and a commitment from various stakeholders to a common philosophy of growth and development.
ISSUES AND OPPORTUNITIES
» Municipal Coordination
There are signs throughout the tri-county region that jurisdictions are actively coordinating with each other and will continue to do so in the future. The BCDCOG should continue to encourage this collaboration by facilitating the development and adoption of policies that favor growth in the areas identified in OROP. Current city and county comprehensive plans focus much of their growth within the nodes and districts that are outlined in OROP. These preferred development areas go by the different terms in different plans: Consistency Areas (Charleston County), Developments of
p // 6-1
Figure 6-1: Town of Summerville Priority Investment Areas
Source: Town of Summerville Comprehensive Plan Update (2009)

PLA
N E
LEM
EN
T 6
PARTNERSHIP and FINANCE
p // 6-2
infrastructure and additional planning efforts into nodal areas to encourage sustainable and efficient development. Some of these preferred development areas may also feature traditional neighborhood development patterns to encourage the most efficient use of regional transportation and utility systems.
Similarly, larger communities, such as Summerville, have begun to embrace the need to move from simple cooperation to more concerted, collective action. An example of this is the recent update of Summerville’s Comprehensive Plan. Summerville’s update establishes a growth framework built upon the Dorchester County Comprehensive Plan. In doing so, Summerville has identified six Priority Investment Areas that, to some degree, align with the place types, centers and priority corridors established in OROP. Coordination, such as this between the local and county level, will help in prioritizing and planning for a shared future for the region.
Many other examples exist of cooperation between stakeholders and decision makers within the region. The Partnership for Prosperity is a master plan for the Neck Area that straddles multiple jurisdictions. The plan will include strategies to spur economic vitality, promote environmental stewardship, and enhance quality of life for people and businesses within the core of the tri-county area.
County Significance, Special Areas, Master Planned Overlay Areas (Dorchester County), Priority Investment Zones, and Planned Developments (PD). The approach to each of these may be slightly different, but they all emphasize the need to direct
The common themes of infrastructure coordination, balance between development and nature, and innovative zoning policies incorporated in various comprehensive plans in the three counties underscore the potential for counties and municipalities to engage with BCDCOG as a regional partner in implementing OROP. This potential is reinforced by the fact that many of the Goals, Objectives, Policies and Strategies discussed in this plan find their origins in the more specific adopted county and municipal comprehensive plans. Although each county and local municipality has a unique focus, they all share a vision for a better region that can be accomplished through cooperative prioritization and common investment.
The differences in the sizes and resources of the region’s cities and towns underscore the challenge of aligning capacity and implementation. For Charleston, North Charleston, Summerville and Goose Creek, fiscal and institutional resources can be mobilized to manage and direct growth strategies. However, communities such as Harleyville and Meggett face significant growth pressures, but have more limited capacity to undertake long range strategies to prepare for that growth.
In working with stakeholders and regional leaders, several key elements have been identified for plan implementation. They provide guidance for aligned decision making across local, municipal, county
Figure 6-2: Circulation Framework Plan – Neck Master Plan
Source: Partnership for Prosperity – A Master Plan for the Neck Area of Charleston and North Charleston

p // 6-3
PLAN
ELE
ME
NT
6PARTNERSHIP and FINANCE
can be used to assist in the realization of OROP. Development agreements are a contract between a developer and a local government that outlines the character of a development, a timeline for completion of capital improvements, and name of the party responsible for completing the improvements and development. They typically are used with large, phased developments and can be useful in cases that involve review and action by multiple governmental agencies. This type of agreement is currently being considered for the East Edisto development, which crosses several jurisdictional lines and requires review by multiple authorities.
In addition to development agreements, Adequate Public Facilities Ordinance (APFO) is another tool that ensures concurrency between growth and public amenities and infrastructure. Adequate Public Facility requirements can address situations where development may potentially extend beyond the boundaries of municipal jurisdictions into rural or underdeveloped areas. Often these areas are designated as preservation or rural development zones; the challenge then is to direct development towards the most appropriate area – one where infrastructure already exists or where infrastructure expansions are planned.
Many jurisdictions in the region are already considering APFO as a means to address impact of growth on its public facilities. Education about the
that extend across jurisdictional boundaries, tools used to address this growth and ensure a positive future must also cross municipal and county boundaries. A governance structure utilizing local-area agreements and coordinated, inter-jurisdictional infrastructure funding can ensure a positive outcome and realization of the vision.
As discussed in Plan Element 5: Regional Leadership and Stewardship, a continuing stakeholder-based process will provide the context for realization of the OROP vision. More particularly, the OROP process has generated a cohesive group of formal stakeholders engaged through the Regional Land Use Technical and Planning Committees. Those committees represent key leaders and leadership organizations that must be vested in a process for any formalized implementation process to take hold and to be sustained. The continued involvement of these stakeholders and the identification of additional vested leaders are key to establishing and sustaining regional coordination and collaboration efforts.
» Public/Private Cooperation
In addition to inter-jurisdictional coordination and cooperation, public agencies need to work with private entities and developers to ensure the vision of OROP is clearly understood and embraced. Development agreements are just one tool that
and COG jurisdictions and areas of responsibility. These elements discussed in more detail below are:
• Governance based on shared responsibilities, coordination and public/private cooperation (as highlighted in the next column)
• Aligning transportation facilities with appropriate development to achieve sustainable places
• Coordinating planning and zoning tools
• Funding
» Governance Based on Shared Responsibilities and Coordination
The BCD region has undergone significant growth in recent decades. In 1990, the regional population was 506,875 and grew to 549,033 by the year 2000, an 8.3% increase over the ten year period. By 2010, the region’s population grew to 664,607, an increase of 21% from 2000. Although that growth rate will vary, it is anticipated to continue over the next 20-30 years. In order to manage growth in a responsible way that reflects the vision of the community, various local and regional government entities must cooperate and coordinate public investments in infrastructure. With a regional economy and growth patterns
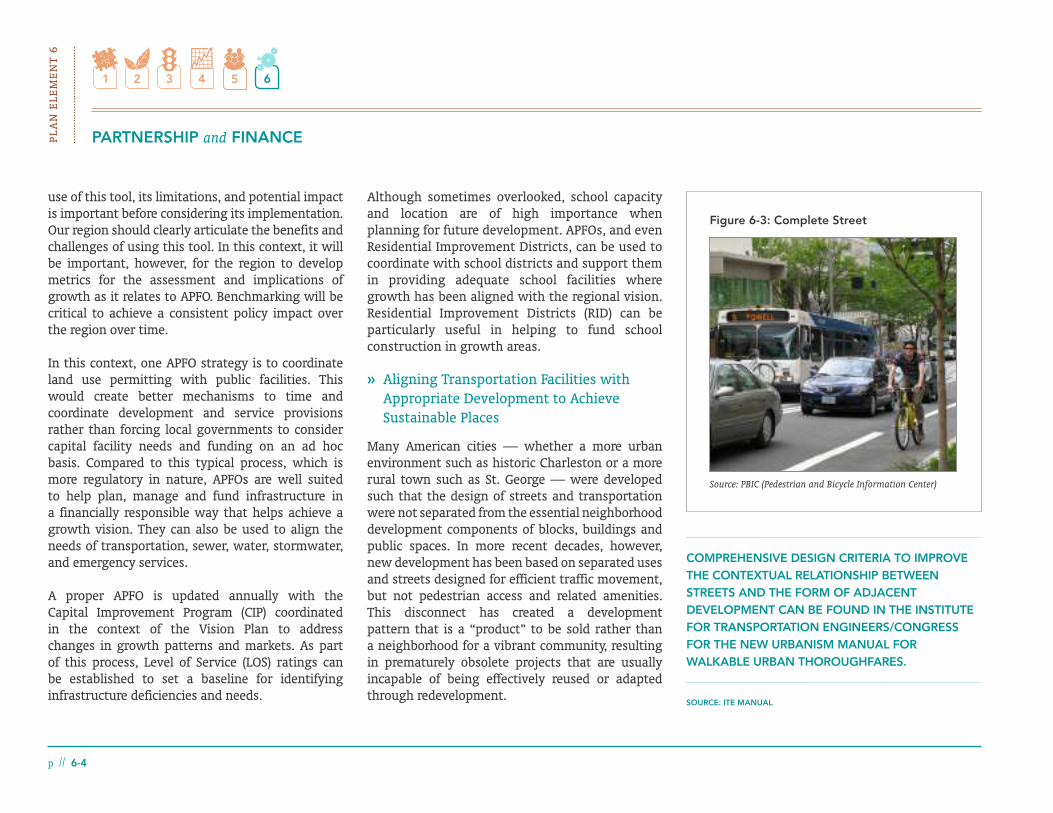
PLA
N E
LEM
EN
T 6
PARTNERSHIP and FINANCE
p // 6-4
use of this tool, its limitations, and potential impact is important before considering its implementation. Our region should clearly articulate the benefits and challenges of using this tool. In this context, it will be important, however, for the region to develop metrics for the assessment and implications of growth as it relates to APFO. Benchmarking will be critical to achieve a consistent policy impact over the region over time.
In this context, one APFO strategy is to coordinate land use permitting with public facilities. This would create better mechanisms to time and coordinate development and service provisions rather than forcing local governments to consider capital facility needs and funding on an ad hoc basis. Compared to this typical process, which is more regulatory in nature, APFOs are well suited to help plan, manage and fund infrastructure in a financially responsible way that helps achieve a growth vision. They can also be used to align the needs of transportation, sewer, water, stormwater, and emergency services.
A proper APFO is updated annually with the Capital Improvement Program (CIP) coordinated in the context of the Vision Plan to address changes in growth patterns and markets. As part of this process, Level of Service (LOS) ratings can be established to set a baseline for identifying infrastructure deficiencies and needs.
COMPREHENSIVE DESIGN CRITERIA TO IMPROVE THE CONTEXTUAL RELATIONSHIP BETWEEN STREETS AND THE FORM OF ADJACENT DEVELOPMENT CAN BE FOUND IN THE INSTITUTE FOR TRANSPORTATION ENGINEERS/CONGRESS FOR THE NEW URBANISM MANUAL FOR WALKABLE URBAN THOROUGHFARES.
SOURCE: ITE MANUAL
Although sometimes overlooked, school capacity and location are of high importance when planning for future development. APFOs, and even Residential Improvement Districts, can be used to coordinate with school districts and support them in providing adequate school facilities where growth has been aligned with the regional vision. Residential Improvement Districts (RID) can be particularly useful in helping to fund school construction in growth areas.
» Aligning Transportation Facilities with Appropriate Development to Achieve Sustainable Places
Many American cities — whether a more urban environment such as historic Charleston or a more rural town such as St. George — were developed such that the design of streets and transportation were not separated from the essential neighborhood development components of blocks, buildings and public spaces. In more recent decades, however, new development has been based on separated uses and streets designed for efficient traffic movement, but not pedestrian access and related amenities. This disconnect has created a development pattern that is a “product” to be sold rather than a neighborhood for a vibrant community, resulting in prematurely obsolete projects that are usually incapable of being effectively reused or adapted through redevelopment.
Figure 6-3: Complete Street
Source: PBIC (Pedestrian and Bicycle Information Center)
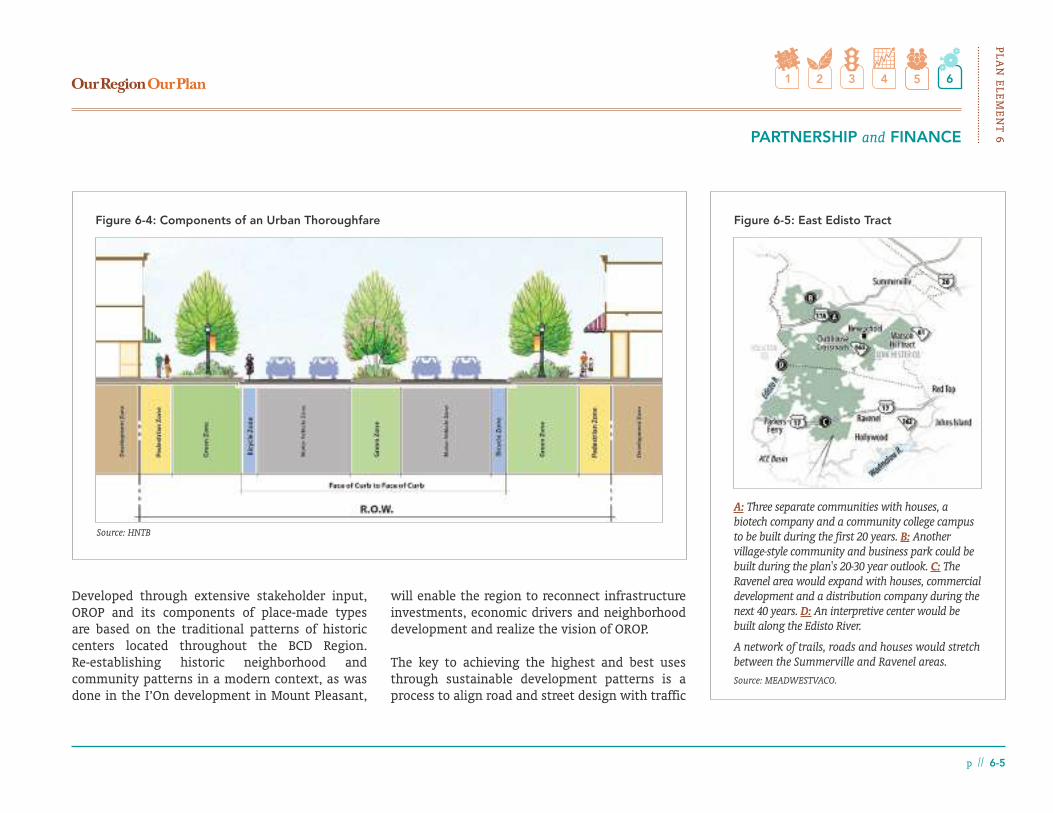
p // 6-5
PLAN
ELE
ME
NT
6PARTNERSHIP and FINANCE
Developed through extensive stakeholder input, OROP and its components of place-made types are based on the traditional patterns of historic centers located throughout the BCD Region. Re-establishing historic neighborhood and community patterns in a modern context, as was done in the I’On development in Mount Pleasant,
Figure 6-4: Components of an Urban Thoroughfare
Source: HNTB
A: Three separate communities with houses, a biotech company and a community college campus to be built during the first 20 years. B: Another village-style community and business park could be built during the plan's 20-30 year outlook. C: The Ravenel area would expand with houses, commercial development and a distribution company during the next 40 years. D: An interpretive center would be built along the Edisto River.
A network of trails, roads and houses would stretch between the Summerville and Ravenel areas.Source: MEADWESTVACO.
Figure 6-5: East Edisto Tract
will enable the region to reconnect infrastructure investments, economic drivers and neighborhood development and realize the vision of OROP.
The key to achieving the highest and best uses through sustainable development patterns is a process to align road and street design with traffic

PLA
N E
LEM
EN
T 6
PARTNERSHIP and FINANCE
p // 6-6
operations and the surrounding development context, whether in a rural or urban environment. This “context sensitive solution” (CSS) approach to street and roadway design can facilitate better access management, protect environmentally sensitive areas and focus development at desired nodes. At the local level, a focus on complete streets, and the use of transects to establish complementary development patterns, can create
a healthier tax-base resulting from higher quality development.
» Coordinating Planning and Zoning Tools
The utilization of innovative planning and zoning tools is also emerging as a preferred tool for high profile development projects. One example is the 78,000-acre East Edisto Tract being developed
by MeadWestvaco, which will use a progressive, scaled approach implemented through form-based codes to establish a sustainable development pattern that respects the distinctiveness of both rural and town development areas. Coordinated with both Dorchester and Charleston Counties, this approach provides real-world examples of the type of county-to-county coordination efforts that will be necessary for implementation of OROP.
Consistency of zoning standards must also exist between the counties and local jurisdictions. In Berkeley County, for example, county-wide zoning has only been used for fewer than twenty years and the majority of private land in the county is zoned “Flex,” which allows all but the most noxious land uses and which is often inconsistent with the zoning standards of local jurisdictions. Often times, a municipality looking to expand its tax base does not realize that by annexing an underdeveloped area to secure additional growth, it is taking on infrastructure and land uses that are not to their standards, which creates an untenable financial burden. Better coordination on these types of zoning, land use and annexation issues will facilitate realizing the regional vision.
» Funding
Many communities in the BCD region and across the country fund capital programs on an ad hoc
WHAT IS AN URBAN THOROUGHFARE?
Conventional thoroughfare design processes emphasize vehicular mobility and the provision of automobile access to adjoining land uses, primarily using functional classification, traffic volume and design speed as the determinants for design parameters. The principles of CSS expand the design process to better integrate thoroughfares with their surroundings. The result in many communities is a new emphasis on urban thoroughfares with features that emphasize multimodal safety and mobility as well as support for the activities of the adjacent land uses. Walkability, a key focus of this document, is better planned with an initial, clear focus on context.
A main tenet of walkable thoroughfare design is encapsulated in the phrase "one size does not fit all," which means the function of a thoroughfare and its design should complement the context that it serves, and the design of the thoroughfare should change as the existing and planned context changes. This tenet challenges the conventional design process used by many state and municipal agencies, which applies a single roadway cross-section, based on functional classification, to a thoroughfare—regardless of the context.
Source: ITE’s Context Sensitive Solutions guide (www.ite.org/css/online/DWUT04.html).

p // 6-7
PLAN
ELE
ME
NT
6PARTNERSHIP and FINANCE
basis based on specific project needs. For example, the public works budget considers expanding roadway capacity after a development has impacted the neighborhood; the school district sites and location of schools in response to demographic projections based on a developers’ request for building permits; and city engineers recommend drainage facilities to address flooding conditions created by development projects elsewhere in the watershed. These decisions rarely create a cohesive context for desired development and private investment that can support a regenerative tax base.
» Value Capture
Value capture is a tool for funding infrastructure improvements by capitalizing on the value added to an area as a result of improvements made to its infrastructure. It recognizes that with each infrastructure investment – typically transportation – some marginal improvement or marginal decline occurs in the value of the surrounding land and development. This shift in value can be due to a change in access, noise, aesthetics, safety, reliability or other transportation impact. When the impact is a positive one and there is a resulting (or anticipated) increase in the value of land in the area surrounding the improvement, the added value can be harnessed or “captured” to provide financial support for the improvement itself or for
other improvements that need to be made to the area. In this context, public investments can be leveraged to yield additional benefits, including higher quality development, interconnected transportation systems, and a sustainable tax base.
In the context of OurRegion OurPlan, understanding the relationship between transportation and infrastructure investments and the value they add is the key to achieving the development patterns called for in the regional vision and establishing a tax base that will be regenerative and resilient. Value capture then provides opportunities at the regional, jurisdictional, and neighborhood level to leverage public investment to secure greater levels of private investment and drive the preponderance of growth within the centers and nodes identified in the plan as well as along the region’s key and emerging transit corridors. Examples of value capture include Tax-Increment Financing, Local Option Taxes and Impact Fees.
» Tax-Increment Financing (TIF)
Tax-Increment Financing (TIF) is a well-recognized tool for encouraging revitalization. A TIF District is established through a Redevelopment Plan that explains why an area or parcels require redevelopment, the type of infrastructure that will be funded by TIF funds and the expected outcomes. As a result of the capital investments in land and
CapturedAppraised
Value
ValueAfter
Termination
TimeTermination
Source: Innovative Finance Initiative, DART.
Figure 6-6: Value Capture Mechanism
Ap
pra
ised
V
alue
Baseline Property Value
Creation
TaxIncrement
infrastructure that are required of redevelopment activities, additional taxes are generated by the increased value of the assessed property within the district. Instead of flowing into the general fund of a local taxing jurisdiction, the additional tax revenues are “captured” by the TIF district for a period of years. After the temporal expiration of the TIF district, all future tax revenues from the increased value of the property flow back into the general fund of each participating taxing jurisdiction. The South Carolina legislature empowered cities to create Tax Increment Financing (TIF) districts in 1984; counties were given TIF authority in 1999. Several TIF districts have already been created in the BCD region including the King Street Gateway TIF District in the City of Charleston.

PLA
N E
LEM
EN
T 6
PARTNERSHIP and FINANCE
p // 6-8
One of the concerns raised about implementing a TIF district is that it diverts revenues away from the general fund of the local government. However, TIF is no different than any other incentive or investment into a targeted opportunity. The key is that the incentive policy and strategy should provide greater long term value, both for the public sector as a whole and the particular project supported by the initiative, including the general fund from which the revenues were diverted.
TIF revenues are usually measured by the millage rates of all the overlapping taxing districts. Since 1999, the consent of the overlapping taxing districts is required in order to include their portion of millage in TIF revenues. In other words, without the consent of the overlapping taxing districts, only the millage of the local government creating the TIF district can be used to generate TIF revenues. Eligible tax revenue sources that can be captured in a TIF include:
• Property tax
• Payments in lieu of taxes (PILOTs)
• Assessments
• Redevelopment project revenues
Generally, TIF allows a jurisdiction to negotiate with developers for desirable project additions such as
the inclusion of affordable housing or greater public amenities, etc. in speculative development areas. As a value capture mechanism, TIFs provide local jurisdictions the ability to enter into partnerships with developers to attain development that better fits the vision of the community and the types of projects needed to create the place-made centers in the plan.
Local Option Taxes
Local option taxes are also used as a means of funding local and countywide infrastructure projects. In the BCD region, each county has utilized this type of financing tool to pay for much needed infrastructure projects.
In August 2008, Berkeley County Council approved a resolution to levy and impose a one-cent sales tax, subject to a voter referendum, with the proceeds to be used for transportation projects throughout the county. In November 2008, the voters of Berkeley County approved this referendum, and the new tax became effective May 1, 2009. The tax includes a seven year sunset clause, at which time voters will again be given an opportunity to keep or revoke the tax. Currently, the sales tax is being used to repay a 2010 $27.7 million General Obligation Refunding Bond, which provides resources for various transportation projects and was issued to retire a 2009 General Obligation Bond Anticipation Note.
Collection of a half percent sales tax, also approved by voter referendum, began in Charleston County in May 2005. The referendum authorized funding for transportation related projects, mass transit, and greenbelts.
In November 2004, Dorchester County voters approved a one-cent sales tax referendum. The Dorchester County Sales Tax Transportation Authority continues to complete the 22 projects approved with the referendum. In order to partially fund these projects, the county issued $125 Million in bonds, which will be repaid by sales tax collections. Many of the projects have been completed and several more are under construction.
Charleston County, SC – The transportation portion of a half-cent sales tax is used for
road construction and maintenance projects, as well as a $3.0 million annual payment for the Arthur Ravenel, Jr. Bridge. Eighteen percent of this sales tax revenue goes to mass transit and funds the existing operations of the local regional and rural bus systems. The overall tax is expected to bring in $1.3 billion over approximately 25 years.
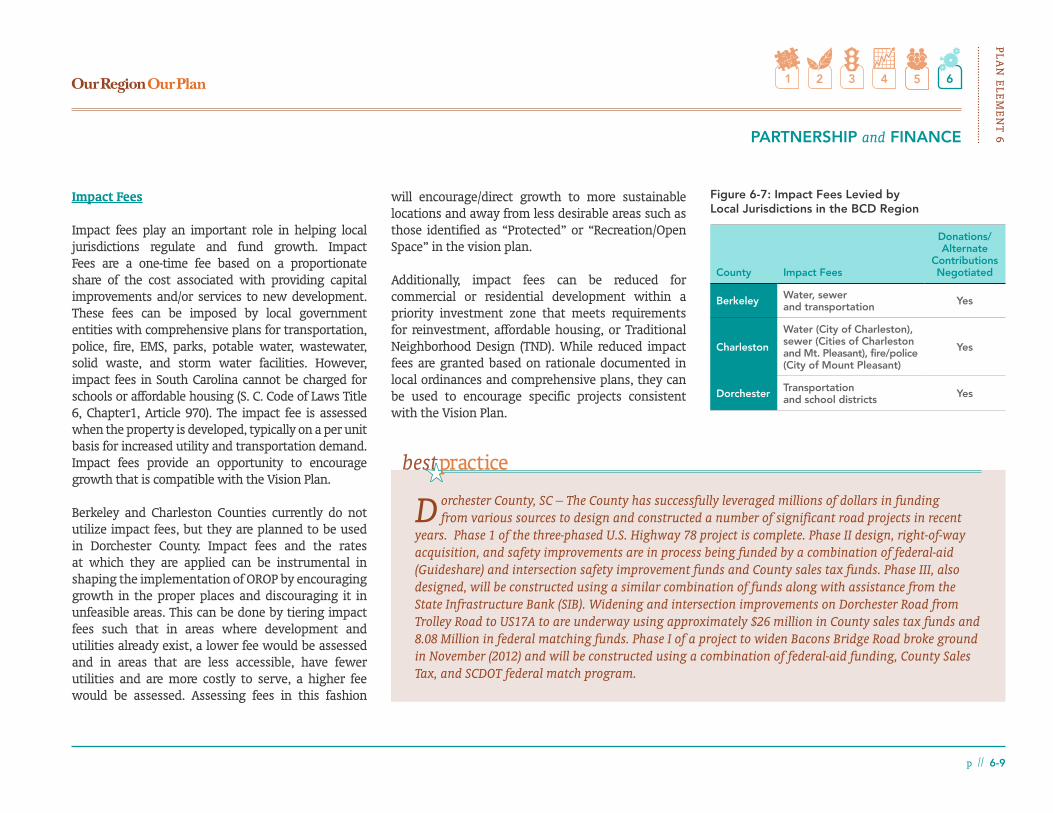
p // 6-9
PLAN
ELE
ME
NT
6PARTNERSHIP and FINANCE
Impact Fees
Impact fees play an important role in helping local jurisdictions regulate and fund growth. Impact Fees are a one-time fee based on a proportionate share of the cost associated with providing capital improvements and/or services to new development. These fees can be imposed by local government entities with comprehensive plans for transportation, police, fire, EMS, parks, potable water, wastewater, solid waste, and storm water facilities. However, impact fees in South Carolina cannot be charged for schools or affordable housing (S. C. Code of Laws Title 6, Chapter1, Article 970). The impact fee is assessed when the property is developed, typically on a per unit basis for increased utility and transportation demand. Impact fees provide an opportunity to encourage growth that is compatible with the Vision Plan.
Berkeley and Charleston Counties currently do not utilize impact fees, but they are planned to be used in Dorchester County. Impact fees and the rates at which they are applied can be instrumental in shaping the implementation of OROP by encouraging growth in the proper places and discouraging it in unfeasible areas. This can be done by tiering impact fees such that in areas where development and utilities already exist, a lower fee would be assessed and in areas that are less accessible, have fewer utilities and are more costly to serve, a higher fee would be assessed. Assessing fees in this fashion
Dorchester County, SC – The County has successfully leveraged millions of dollars in funding from various sources to design and constructed a number of significant road projects in recent
years. Phase 1 of the three-phased U.S. Highway 78 project is complete. Phase II design, right-of-way acquisition, and safety improvements are in process being funded by a combination of federal-aid (Guideshare) and intersection safety improvement funds and County sales tax funds. Phase III, also designed, will be constructed using a similar combination of funds along with assistance from the State Infrastructure Bank (SIB). Widening and intersection improvements on Dorchester Road from Trolley Road to US17A to are underway using approximately $26 million in County sales tax funds and 8.08 Million in federal matching funds. Phase I of a project to widen Bacons Bridge Road broke ground in November (2012) and will be constructed using a combination of federal-aid funding, County Sales Tax, and SCDOT federal match program.
County Impact Fees
Donations/ Alternate
Contributions Negotiated
Berkeley Water, sewer and transportation Yes
Charleston
Water (City of Charleston), sewer (Cities of Charleston and Mt. Pleasant), fire/police (City of Mount Pleasant)
Yes
Dorchester Transportation and school districts Yes
Figure 6-7: Impact Fees Levied by Local Jurisdictions in the BCD Region
will encourage/direct growth to more sustainable locations and away from less desirable areas such as those identified as “Protected” or “Recreation/Open Space” in the vision plan.
Additionally, impact fees can be reduced for commercial or residential development within a priority investment zone that meets requirements for reinvestment, affordable housing, or Traditional Neighborhood Design (TND). While reduced impact fees are granted based on rationale documented in local ordinances and comprehensive plans, they can be used to encourage specific projects consistent with the Vision Plan.

PLA
N E
LEM
EN
T 6
PARTNERSHIP and FINANCE
p // 6-10
Impact fee ordinances must include an explanation of the calculation of the impact fee and specify the system improvements for which the impact fee is intended to be used. The ordinance must also establish a procedure for timely determinations of applicable impact fees, a description of acceptable levels of service for system improvements and provide for the termination of the impact fee. However, because impact fees are not due until development occurs, funding large capital projects prior to new development becomes a challenge.
In addition to impact fees, jurisdictions may negotiate with developers for commitments to fund an improvement or a portion of a project. This is typically done as part of the development approval process when a developer is negotiating a development agreement with a jurisdiction and is seeking waivers from regulations or project requirements or development approvals beyond what may be strictly permitted by local regulations. The policies allowing for such donations could be modified to allow for additional density or other development attributes consistent with the place-made types in the OROP.
These sources provide an opportunity for the respective local jurisdictions to strategically raise capital for infrastructure called for in the vision plan. Those fees can be combined with other
funding sources to expedite needed infrastructure projects. Impact fees may be implemented to fund public infrastructure improvements if they are incorporated into the Capital Improvements Program.
GUIDING PRINCIPLES
Many regions have adopted plans for growth and seek to implement them; however, few have been successful in actually implementing them. OurRegion OurPlan promises to set a new course for regional planning by establishing a clear path for implementation. In order to realize the goals to do so, the following objectives, policies, strategies and indicators will provide a pathway for shared success by:
• Focusing on shared governance, rather than government;
• Utilizing design as an economic tool, rather than just an aesthetic outcome; and
• Assuming that there are shared opportunities in sustainable development patterns that can generate value simultaneously for the public sector, the non-profit community and private business interests.
PARTNERSHIP and FINANCE FRAMEWORK
» The Goals
1. Establish a regional governance dynamic around shared and leveraged investments
2. Link transportation and development patterns
3. Align investment decisions and revenue sources to support the vision plan
» The Path to Implementation: Objectives, Policies, Strategies and Indicators
The goals for implementation are supported by related objectives, policies and strategies, along with indicators to measure the advancement of the goals.

p // 6-11
PLAN
ELE
ME
NT
6PARTNERSHIP and FINANCE
GOAL 1: Establish a regional governance dynamic around shared and leveraged investments
OBJECTIVE 1-1: Create a formalized structure to align planning and budgeting decisions across jurisdictional lines.
POLICY: Expand the use of the State’s Priority Investment Act and other pertinent tools to support the implementation of OROP.
STRATEGY 1:Employ Local Area Agreements for infrastructure funding.
STRATEGY 2:Utilize inter-jurisdictional agreements to support special area planning.
STRATEGY 3:Utilize inter-jurisdictional agreements to support special area planning.
STRATEGY 4:Promote the alignment of municipal and county zoning ordinances to reflect the OROP vision plan.
STRATEGY 5:Explore the use of Residential Improvement Districts to help fund school classroom construction in growing areas.
STRATEGY 6:Promote the increased use of land-use intensity bonuses, market driven housing densities, form-based codes, payments-in-lieu of taxes or parking requirements, fast-track permitting, and design flexibility options in existing urbanized areas and/or areas identified for desired growth per the Vision Plan.
F Best Practice: Beaufort County Inter-Jurisdictional Cooperation
OBJECTIVE 1-2: Continue the regional dialogue and policy coordination facilitated by the OROP process.
POLICY: Build on and sustain the stakeholder capacity developed through the Regional Technical and Land Use Planning Committees.
STRATEGY 1:Engage the Regional Technical and Land Use Planning Committees in fostering agreements to use the Priority Investment Act provisions by individual jurisdictions.
STRATEGY 2:Continue to engage in regular meetings with the Charleston Regional Development Alliance to coordinate business recruitment, development and site selection efforts so that employment centers are developed consistent with nodes, centers and priority corridors of the vision plan.
1. Increase in the number of local area and inter-jurisdictional agreements
2. Improvement in the alignments / coordination of county and local zoning ordinances
3. Increase in the number of zoning ordinances updated to reflect the vision plan
4. Increase in the use of Residential Improvement Districts
5. Increase in the use of various bonuses and incentives to develop in centers and nodes
6. Continued involvement of the Regional Land Use Technical and Land Use Planning Committees
GOAL 1 INDICATORS OF SUCCESS

PLA
N E
LEM
EN
T 6
PARTNERSHIP and FINANCE
p // 6-12
GOAL 2: Link transportation and development patterns
OBJECTIVE 2-1: Facilitate the merging of transportation design and development policies to support sustainable growth patterns established in the vision plan.
POLICY: Coordination of transportation and development will be considered a high priority and will be accomplished through the collaboration of local governments with CHATS and the South Carolina Department of Transportation (SCDOT).
STRATEGY 1:Support local governments and SCDOT in establishment of design criteria and context sensitive processes to better match street design with adjacent development.
Note: Encourage the adoption of the Institute for Transportation Engineers/Congress for the New Urbanism Manual for Walkable Urban Thoroughfares (ITE Manual) and integrate the context-based design criteria into the process for retrofitting streets to better align with the place-made types underlying the vision plan.
STRATEGY 2:Discuss the benefits of Form Based Codes with local jurisdictions to implement the zoning policies necessary to achieve more context-sensitive street design.
Note: Conventional (Euclidian zoning) is primarily concerned with use, whereas Form-based zoning is primarily concerned with predictability of form. This provides a more market-sensitive dynamic as development evolves over time. BCDCOG or similar regional agency could initiate training sessions to educate local jurisdictions and council about the benefits of form-based codes and how they help achieve the desired built environment of the Vision Plan and provide opportunities for value capture.
Note: Form-Based Codes foster predictability in the built environment and a high-quality public realm by using physical form (rather than the separation of uses) as the code’s organizing principle.
1. Increase in the number of communities and agencies that have adopted context sensitive solutions in their local codes
2. Increase in the number of communities that have adopted Form Based codes
3. Increase in the number of agencies that have adopted the ITE Manual for Walkable Urban Thoroughfares
4. Improvement in regional and local multimodal level of service (MMLOS ), e.g. bicycle LOS, pedestrian LOS, transit LOS)
GOAL 2 INDICATORS OF SUCCESS

p // 6-13
PLAN
ELE
ME
NT
6PARTNERSHIP and FINANCE
GOAL 3: Align investment decisions and revenue sources to support the vision plan
OBJECTIVE 3-1: Systematically review and position revenue spending to facilitate value capture.
POLICY: Due to the limited availability of revenue sources, resources should be focused on infrastructure investments that can achieve sustainable development envisioned in OROP, which in turn will generate a more sustainable tax base for additional infrastructure investment.
STRATEGY 1:Utilize Tax Increment Financing to direct local tax revenues to locations and projects that create or enhance nodes and centers identified in the vision plan.
STRATEGY 2:Use local option taxes and impact fees for infrastructure to stimulate development in the nodes and centers in the vision plan.
STRATEGY 3:Align the CHATS Long Range Transportation Plan with OROP projects to leverage funding for regional infrastructure.
F Best Practice: North Central Texas Council of Governments (NCTCOG) has made some federal Surface Transportation Program Multimodal funds, Congestion Air Quality Mitigation funds and general gas tax funds available to local communities and partnering developers for transportation projects that promote sustainable neighborhood development patterns and transit. A roadway, transit or pedestrian improvement project will receive priority within the funding allocation if it is demonstrated that the project funding will promote infill development, access to transit, local zoning reforms (i.e., form-based codes) in support of walkable urbanism or reinvestment in downtowns/neighborhood centers.
1. Increase in the number of local and regional projects using value capture mechanisms
2. Increase in the amount of TIF funds directed towards local investments that serve greater public purpose and the associated benefits received
3. Increase in the adoption, use and renewal of local option sales taxes
4. Increase in the amount of TIF funds directed to projects in the region’s nodes and centers
5. Increase in the number of development projects that are within ½ mile of transit or enhanced transportation facilities
6. Decrease in the number of trips and vehicle miles travelled (also see Plan Element 3: Mobility)
7. Increase in the population density within ½ mile of existing infrastructure and services
8. Increase in the employment density within ½ mile of existing infrastructure and services
GOAL 3 INDICATORS OF SUCCESS

{this page intentionally left blank}

p // Ep-1
Epilogue
T he legacy we want to leave for future generations is clear: we want a Lowcountry with clean rivers where we can teach
our children to fish without concern for their health; pristine beaches that draw tourists to our shores and shops; oceans with abundant sea life that support our fishermen; communities that celebrate our history and diversity; a successful Port that draws industry to the region and creates new opportunities for our future; good paying jobs that provide a high quality of life; choices in where we live and how we move about the region; and leaders who work cooperatively, efficiently using our tax dollars to achieve these goals. OurRegion OurPlan (OROP) creates a roadmap for reaching these aspirations, providing us with a set of strategies and actions to realize our vision.
Yet it also identifies threats to the legacy we want to leave for the generations that come after us, calling attention to some of the biggest growth issues we face: development patterns that have resulted in reductions in agricultural land and
open space; threats to the biodiversity of the region; increasing vulnerability to coastal hazards; longer commutes and growing congestion; rising foreclosure rates; less affordable homes; and dwindling financial resources for growing needs. While we know these are the issues we face today, the issues we will face tomorrow are largely unknown. By using a scenario planning process to create this regional plan, we have acknowledged the uncertainties of the future by exploring conceivable scenarios and potential implications of choices we will make over the next 30 years. In doing so, we have not only equipped ourselves to address known issues, but have also prepared ourselves to handle unanticipated ones.
But now that we have been through this process, what does it mean to have a regional plan? On an aspirational level, it means having a shared voice and a clear vision for the entire region with inputs from diverse stakeholders. At a practical level, it means having a clearer understanding of regional priorities, helping tie together local decisions
and regional opportunities. At a personal level, it means having a cleaner environment, less traffic congestion and more transportation choices, great places to live, exciting places to recreate, and a diverse economy to work in.
OurRegion OurPlan is not just a theoretical concept of our future that bears no relationship to our lives because it provides a framework that we can use in making difficult decisions and it suggests a path forward to reach these goals. As the Lowcountry’s regional planning agency and designated MPO, the BCDCOG will bear primary responsibility for facilitating its implementation, but they can’t do it alone. We are all responsible for it: we must cooperate to ensure that these ideas don’t wither on the vine, but are brought to fruition, and we must work together to ensure that growth in our region contributes to our communities, our prosperity and the character of the Lowcountry. It is up to all of us to be invested in this plan and engaged in the civic life of our region because it is our future that is depending on it.

{this page intentionally left blank}

{this page intentionally left blank}
to guide the plan. Subsequent to that first Forum, nearly 100 stakeholders participated in a “Great Places” workshop to define ideal shapes and forms for the region’s communities and the “placemaking principles” that are important to the BCD region and to the Vision Plan.
» Cluster Workshops
With a draft Vision and Goals in hand and a strong understanding of placemaking principles important to the region, a series of cluster workshops were held in four different locations around the region. Attended by a total of approximately 100 people, valuable insight was gained from these interactive
p // App-1
From its inception, OurRegion OurPlan (OROP) has focused on gathering public input and ideas on how we can live and grow together as a region and prioritize our investments. The OROP process has been blessed with engaged residents who have provided rich input through interviews, planning and design workshops with local professionals, a day-long regional “Visioning” workshop, community cluster workshops and a regional forum, in addition to more than two dozen meetings with various committees. This appendix outlines major milestones in the formation of the Vision Plan. The Appendix also highlights the key methods used to solicit community involvement and gather public input, and summarizes the contributions of countless participants.
PLAN DEVELOPMENT
OurRegion OurPlan was developed through an extensive public involvement process. Our
The concept of regional planning was introduced in the Lowcountry in late 2007. The Berkeley Charleston Dorchester Council of
Governments was tasked with the responsibilty to facilitate the planning process and provide staff support to a diverse consultant team led by
the national planning firm of HNTB. A Regional Land Use Planning Committee (RLUPC) was formed at the onset of the project to guide the work
of the consultant team. The details about the RLUPC and other organizations involved in the plan formulation are described later in this section.
approach was designed to inform and involve various stakeholders, agencies, and regional residents in the decision-making process on issues such as growth and development, environmental stewardship, mobility and infrastructure, economic growth, collaboration and leadership, and financing and funding. To facilitate the conversation on regional issues, various types of meetings and events were held over the course of the plan’s development.
» Project Kickoff
The regional planning initiative was kicked off in 2008 with interview of over 70 stakeholders and key leaders, facilitating a planning and design workshop for area planners and architects, soliciting input on regional values and priorities through surveys published in local newspapers, and hosting a daylong regional “Visioning” forum. The forum was attended by nearly 400 people and culminated in a draft of regional Vision and Goals
DEVELOPMENT PATTERNS AND CONSERVATION SHOULD PROTECT AND BUILD ON THE UNIQUE CHARACTER OF THE BCD REGION, INCLUDING ARCHITECTUREAND NATIVE FLORA AND FAUNA.
Appendix A:THE PROCESS of CREATING the VISION PLAN

PLAN APPENDIX A
THE PROCESS of CREATING the VISION PLAN
p // App-2
workshops including deeper understanding of regional issues and priorities, participants’ vision of the region’s centers, corridors and green areas, and a detailed list of ideas, projects and policies that were viewed to be critical to achieving the vision.
All four workshops followed the same agenda and meeting format with presentations, group discussions and small group mapping exercises. In the small groups, participants reviewed the Vision and Goals, discussed and prioritized issues facing the region, and reported their priorities back to the larger group. This resulted in a participant-generated list of the most important issues that the region must work on together to achieve the Vision and Goals.
While each workshop produced a list of approximately ten priority issues, the top three issues from each of the four workshops were combined to form a list of the top twelve priority issues. Due to overlap between some of the issues in the top twelve list, they were consolidated and distilled to identify seven distinct areas of priority for the region. These topics are listed according to the priority workshop participants assigned to them using keypad polling:
1. Transportation / Transit
2. Intergovernmental Cooperation
3. Jobs / Housing Balance
4. Open Space / Environmental Preservation
5. Planned and Coordinated Growth
6. Infill / Reuse/ Redevelopment
7. Livable / Sustainable Communities
Following the discussion of regional issues, participants were provided with an overview of Place Types developed from the placemaking principles identified at the Great Places workshop, illustrating the ideal shapes and forms for the region’s communities and the types of communities which the Berkeley-Charleston-Dorchester region could strive for. These Place Types included centers,
corridors and green areas and were detailed in a “palette” given to the workshop participants. Using the palette as the basis for discussion, each table engaged in a group exercise to map their vision of their county and the region in the future, identifying preferred centers, corridors and green areas. Maps created at individual tables were consolidated into representative county and regional maps that summarized the input of the local participants after each workshop. At the end of all four workshops, these maps were synthesized into one representative "Citizen Scenario".
In addition to completing the mapping exercise, at each workshop participants selected their top ideas, projects, or policies which they believed to be critical
6 Figure A-1: Interactive Cluster Workshops were held across the BCD region, providing an opportunity for residents to discuss and prioritize issues facing the region. Source: Ron Thomas.
6 Figure A-2: Each Cluster Workshop included an activity that allowed participants to "map" their vision of centers, corridors and green areas, indicating their preference for how the region will grow to the year 2040. Source: Ron Thomas.

PLAN APPENDIX A
THE PROCESS of CREATING the VISION PLAN
p // App-3
to achieving their vision of preferred centers, corridors and green areas. Each table shared their top ideas with the rest of their workshop participants, resulting in a list of approximately ten ideas, projects, or policies per workshop. After all of the workshops had been held, the top three ideas and projects put forth at each were consolidated into a list of twelve priority ideas, projects and policies to form a single representative list. As before, there was significant overlap between the ideas identified in each of the four workshops. Therefore the results were consolidated to eliminate overlaps, resulting in five distinct ideas or priorities representing all four workshops. Here those ideas are listed according to the results of keypad polling in each of the workshops:
1. Glenn McConnell Parkway
2. Transportation / Transit
3. Infill / Reuse / Redevelopment
4. Open Space / Environmental Preservation
5. Energy Conservation / Efficiency
As the closing activity for each workshop, participants were given $50 million in play money to “spend” on regional projects. By “spending” the money, which consisted of three bills (two $20 million notes and one $10 million note), participants were able to vote on their funding priorities by placing any or all of their $50 million into one of nine
Figure A-3: Regional Place Type Palette
Source: East Coast Greenway Alliance.
boxes that represented the following regional issues:
•Roadways / Highways
•Freight / Railroad Improvements
•Economic Jobs Development
•Public Transportation Transit
•Utilities (Sewer / Water)
•Community Facilities
•Open Space / Green Infrastructure
•Bike / Pedestrian Facilities
•Preservation / Conservation
Participants were encouraged to distribute their play money amongst the issues instead of putting all of their funds into one category, although some still did just that. They were also asked to spend all of the money that they were given. Across all four workshops, the top three issues that were funded by participants were:
1. Economic / Jobs Development (22%)
2. Public Transportation Transit (21%)
3. Roadways / Highways (14%)

PLAN APPENDIX A
THE PROCESS of CREATING the VISION PLAN
p // App-4
» Scenario Development and Performance Evaluation
The cluster workshops facilitated the creation of one scenario for the future of the region. Since it was defined by the residents of the region, it was aptly named the Citizens’ Scenario. Three other scenarios were developed demonstrating alternative ways in which the region might grow and meet its goals, objectives and aspirations. The scenarios represent logical “pictures” of the future and its challenges, issues and opportunities and reflect the varied values of the region. Use of the scenario planning process afforded a way to examine the “what ifs” of future growth and development and helped to inform decisions about regional policies by providing a means to measure scenario performance. This gave a sense of the trade-offs and consequences of the choices embedded within each scenario and provided stakeholders with a clearer understanding of the differences between them.
Scenario Development
The four scenarios – Trends, Plans, Citizens’ and Green Infrastructure – were informed by the cluster workshops and other plan-related outreach activities and events, including the 2010 PlaceMatters’ Creating Resilient Communities project and the 2008 Regional Forum and ULI Reality Check events, as well as the ongoing research efforts of the BCDCOG and its consultant team. To make the scenarios comparable, each one assumed that the same amount of growth
would occur in the region by 2040. The regional Long Range Transportation Plan’s growth projections, for 2008 to 2035, were used as the basis for OROP’s assumptions about future growth in the region. For OROP’s growth assumptions, the base year of 2008 remained the same, but the projections were extended to 2040. During this time period of 2008 to 2040, the assumed growth for the region included adding over 101,000 new employees, nearly 91,000 more households and approximately 219,000 additional residents. In each scenario, where and how this growth might occur in the region varied, driven by different factors or influences referred to as the “key drivers” of growth. Each of the scenarios incorporated different key drivers to reflect distinct growth policies and each scenario is described in more detail below.
The Trends Scenario is a baseline scenario that reflects an assumption that today’s development trends continue into the future. The Plans Scenario echoes the growth plans of the region’s local jurisdictions. The Citizens’ Scenario evolved from the cluster workshops’ mapping exercises and the resulting synthesis map and directly reflects citizens’ values and input on how the region can achieve the Vision and Goals. The Green Infrastructure Scenario was a refinement of the Citizens’ Scenario, with more ambitions for protecting natural resources and concentrating growth in the region’s centers.
Trends Scenario
The Trends Scenario was based on the assumption
Figure A-4: Trends Scenario Drivers
Past and current development trends
KEY DRIVERS OF GROWTH IN THE TRENDS SCENARIO
Existing and committed
transportation projects
Committed development
projects

THE
PR
OC
ESS of C
RE
ATIN
G the V
ISION
PLA
NFigure A-5: Trends Scenario Map
p // App-5
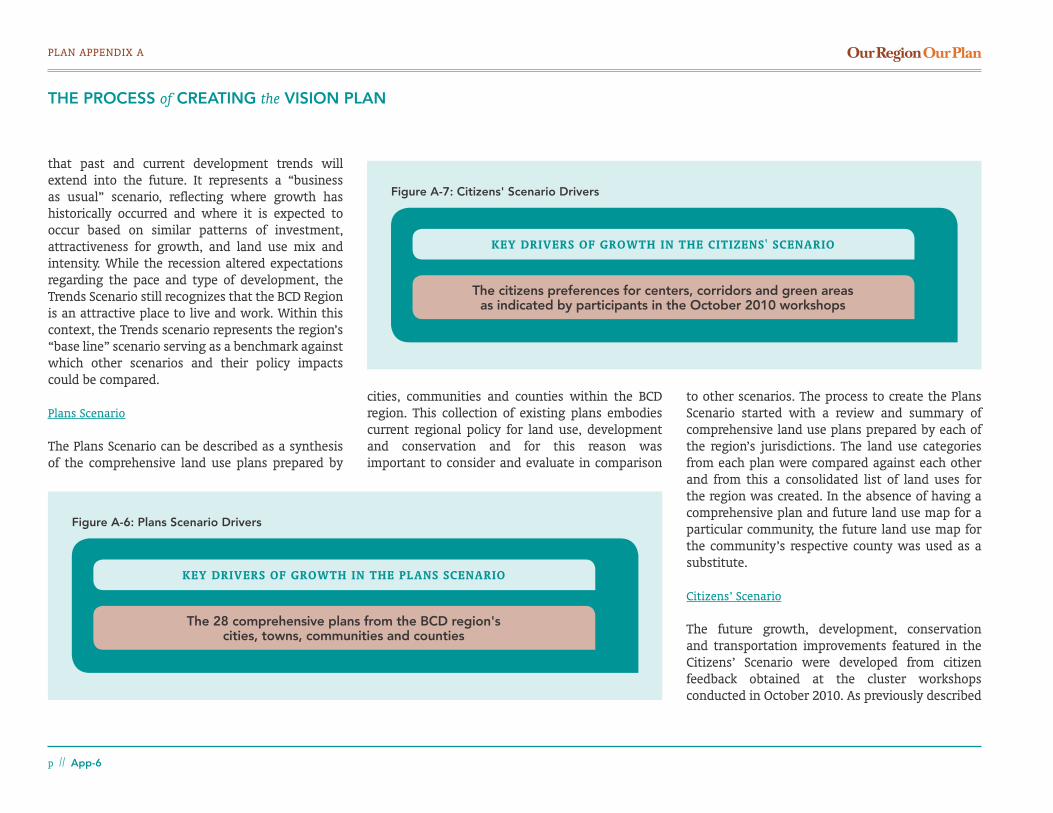
PLAN APPENDIX A
THE PROCESS of CREATING the VISION PLAN
p // App-6
that past and current development trends will extend into the future. It represents a “business as usual” scenario, reflecting where growth has historically occurred and where it is expected to occur based on similar patterns of investment, attractiveness for growth, and land use mix and intensity. While the recession altered expectations regarding the pace and type of development, the Trends Scenario still recognizes that the BCD Region is an attractive place to live and work. Within this context, the Trends scenario represents the region’s “base line” scenario serving as a benchmark against which other scenarios and their policy impacts could be compared.
Plans Scenario
The Plans Scenario can be described as a synthesis of the comprehensive land use plans prepared by
cities, communities and counties within the BCD region. This collection of existing plans embodies current regional policy for land use, development and conservation and for this reason was important to consider and evaluate in comparison
to other scenarios. The process to create the Plans Scenario started with a review and summary of comprehensive land use plans prepared by each of the region’s jurisdictions. The land use categories from each plan were compared against each other and from this a consolidated list of land uses for the region was created. In the absence of having a comprehensive plan and future land use map for a particular community, the future land use map for the community’s respective county was used as a substitute.
Citizens’ Scenario
The future growth, development, conservation and transportation improvements featured in the Citizens’ Scenario were developed from citizen feedback obtained at the cluster workshops conducted in October 2010. As previously described
Figure A-6: Plans Scenario Drivers
The 28 comprehensive plans from the BCD region's cities, towns, communities and counties
KEY DRIVERS OF GROWTH IN THE PLANS SCENARIO
Figure A-7: Citizens' Scenario Drivers
The citizens preferences for centers, corridors and green areas as indicated by participants in the October 2010 workshops
KEY DRIVERS OF GROWTH IN THE CITIZENS' SCENARIO

THE
PR
OC
ESS of C
RE
ATIN
G the V
ISION
PLA
NFigure A-8: Plans Scenario Map
p // App-7
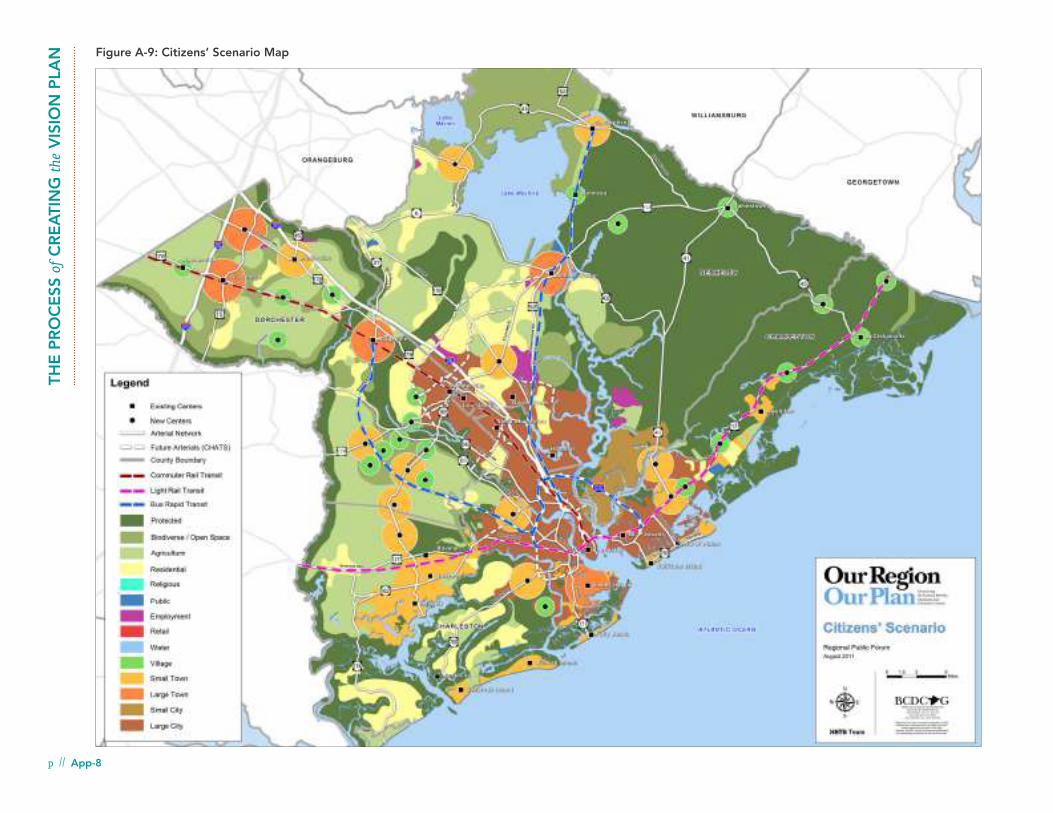
p // App-8
THE
PR
OC
ESS
of C
RE
ATI
NG
the
VIS
ION
PLA
N Figure A-9: Citizens’ Scenario Map
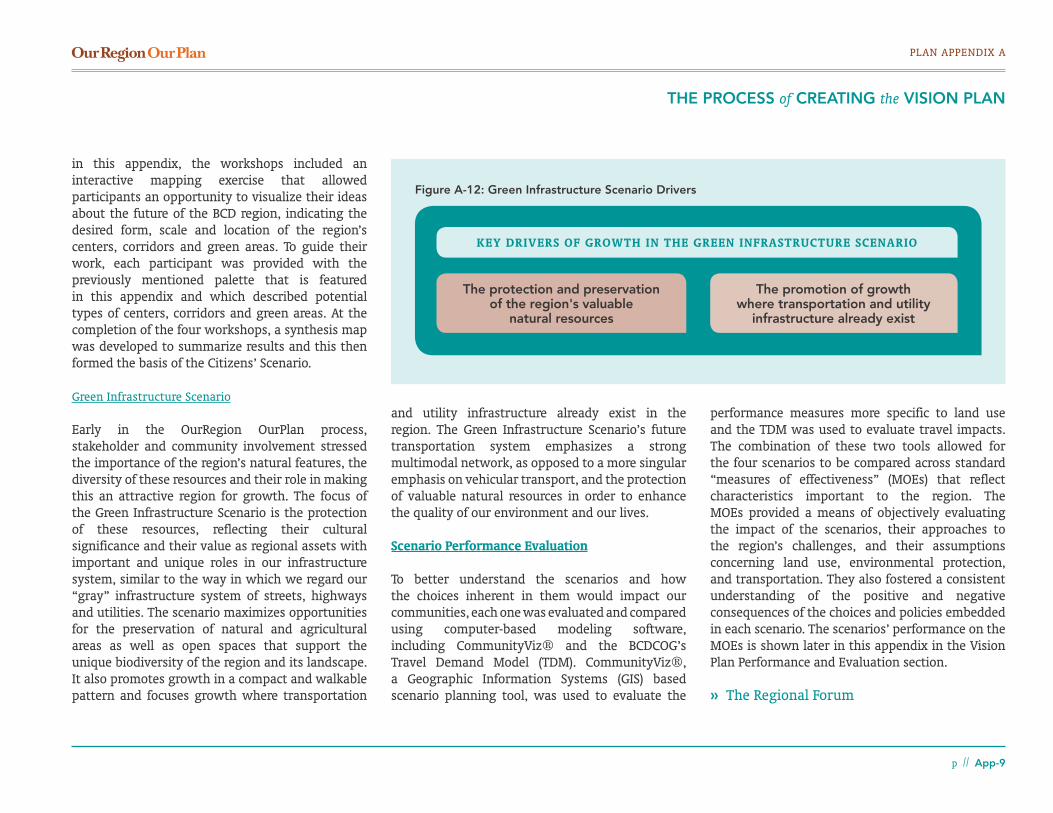
PLAN APPENDIX A
THE PROCESS of CREATING the VISION PLAN
p // App-9
in this appendix, the workshops included an interactive mapping exercise that allowed participants an opportunity to visualize their ideas about the future of the BCD region, indicating the desired form, scale and location of the region’s centers, corridors and green areas. To guide their work, each participant was provided with the previously mentioned palette that is featured in this appendix and which described potential types of centers, corridors and green areas. At the completion of the four workshops, a synthesis map was developed to summarize results and this then formed the basis of the Citizens’ Scenario.
Green Infrastructure Scenario
Early in the OurRegion OurPlan process, stakeholder and community involvement stressed the importance of the region’s natural features, the diversity of these resources and their role in making this an attractive region for growth. The focus of the Green Infrastructure Scenario is the protection of these resources, reflecting their cultural significance and their value as regional assets with important and unique roles in our infrastructure system, similar to the way in which we regard our “gray” infrastructure system of streets, highways and utilities. The scenario maximizes opportunities for the preservation of natural and agricultural areas as well as open spaces that support the unique biodiversity of the region and its landscape. It also promotes growth in a compact and walkable pattern and focuses growth where transportation
and utility infrastructure already exist in the region. The Green Infrastructure Scenario’s future transportation system emphasizes a strong multimodal network, as opposed to a more singular emphasis on vehicular transport, and the protection of valuable natural resources in order to enhance the quality of our environment and our lives.
Scenario Performance Evaluation
To better understand the scenarios and how the choices inherent in them would impact our communities, each one was evaluated and compared using computer-based modeling software, including CommunityViz® and the BCDCOG’s Travel Demand Model (TDM). CommunityViz®, a Geographic Information Systems (GIS) based scenario planning tool, was used to evaluate the
performance measures more specific to land use and the TDM was used to evaluate travel impacts. The combination of these two tools allowed for the four scenarios to be compared across standard “measures of effectiveness” (MOEs) that reflect characteristics important to the region. The MOEs provided a means of objectively evaluating the impact of the scenarios, their approaches to the region’s challenges, and their assumptions concerning land use, environmental protection, and transportation. They also fostered a consistent understanding of the positive and negative consequences of the choices and policies embedded in each scenario. The scenarios’ performance on the MOEs is shown later in this appendix in the Vision Plan Performance and Evaluation section.
» The Regional Forum
Figure A-12: Green Infrastructure Scenario Drivers
KEY DRIVERS OF GROWTH IN THE GREEN INFRASTRUCTURE SCENARIO
The protection and preservation of the region's valuable
natural resources
The promotion of growth where transportation and utility
infrastructure already exist

p // App-10
THE
PR
OC
ESS
of C
RE
ATI
NG
the
VIS
ION
PLA
N Figure A-11: Green Infrastructure Scenario Map

PLAN APPENDIX A
THE PROCESS of CREATING the VISION PLAN
p // App-11
Once complete, the four scenarios were shared with the public at an August 2011 Regional Forum. The purpose of the Forum was to gauge public reaction to the scenarios and the Measures of Effectiveness (MOEs) and also gather input and insight on scenario preferences and priorities. As part of the Forum program, a review of previous OROP activity was provided, including a summary of the cluster workshops and an illustration of how the input received at the workshops was incorporated into the scenarios.
The Forum was a highly interactive, round table-style event that allowed participants an opportunity to review, discuss and evaluate each scenario. Approximately 200 people participated,
including 140 who attended the live event in North Charleston and another 65 people who participated remotely at satellite locations in Hollywood, Mt. Pleasant, Moncks Corner and Summerville. At these satellite locations, participants were able to watch and listen to the live presentation in North Charleston via webcast technology and participate in local round table discussions.
At the live event in North Charleston, audience feedback and responses to scenario preference questions were tracked via digital keypad polling tools. However, technical limitations with the webcast precluded keypad polling at the satellite locations, but those who participated remotely were able to submit their ideas and questions via the chat function built into the webcast software. Additional feedback was gathered by volunteer table scribes at each facility, including the live event in North Charleston. The scribes recorded the key points of each table’s discussions, including specific feedback on each of the scenarios, the participants’ scenario preferences, major concerns for the future of the region and ideas on implementation of the scenarios.
The desired outcome of the event was not the selection or identification of one scenario that would serve as the Vision Plan; instead, it was to gain from the public a deeper understanding of the benefits and drawbacks of each scenario, how they might help or hinder the achievement
of the Vision and Goals and whether any of the scenarios represented a plausible scenario for regional growth. Although it was not intended that the Vision Plan would be taken directly from one of the four scenarios, it was nonetheless helpful to know which scenario was viewed by the audience as most effective in achieving the Vision and Goals as it could help establish a foundation for the Vision Plan. To that end, 45% of Forum participants identified the Green Infrastructure Scenario as being most effective, followed by the Citizens’ Scenario, which received 39% of the vote. Individual scenario components or ideas that received high support from the Forum participants were improving transportation efficiency, encouraging economic development, having realistic expectations for future transit, protecting existing natural features and ensuring all three counties are committed to the regional Vision Plan.
» Expert Panel Review
Following the Regional Forum, an Expert Panel was convened in October 2011 to consider and evaluate implementation of the four scenarios. The Expert Panel was made up of regional leaders respected for their expertise on growth, development, and quality of life issues. As with the Regional Forum, their charge was not to select a Preferred Scenario, but to contribute a practical, and yet visionary, understanding of how the scenario elements might be implemented, including what tools and
6 Figure A-12: The Regional Forum was attended by 140 participants and another 65 people who participated at remote locations connected to the live event via webcast. Source: Ron Thomas.
PLAN APPENDIX A
THE PROCESS of CREATING the VISION PLAN
p // App-12
resources might be needed, what barriers could hinder implementation and who might be best-suited to champion implementation of various elements.
» Establishing the Vision Plan
With valuable insights gained from the Regional Forum and the Expert Panel, the OROP Regional Land Use Planning Committee and itsTechnical Committee was armed with robust information to draw from as they framed a preferred scenario that would become known as the Vision Plan. Included in this information was the Regional Forum participants’ preference for the Green Infrastructure Scenario. However, the Regional Land Use Committee and the Expert Panel also noted the benefit of incorporating into the Vision Plan elements of the Citizens’ and Plans Scenarios because both were developed through public processes that involved significant public input, be it through land use plans adopted by local jurisdictions or through the cluster workshops. As a result, the Vision Plan was ultimately framed as a combination of the three scenarios, with the land uses based on the Plans Scenario and the centers, corridors and green infrastructure elements based on the Citizens’ and Green Infrastructure Scenarios.
It is important to note that the Vision Plan referenced here is not a physical plan for the region nor is it a constrained program subject to
the fiscal limitations of a particular time period or jurisdiction. Rather, it is a visual representation of the future region we desire and a framework for the policies and strategies outlined in the individual Plan Elements. They are meant to be used together and, in combination, they establish a path forward to achieve the regional vision.
Vision Plan Performance and Evaluation
As previously noted, the four scenarios were evaluated on a number of MOEs that were developed to assess their performance on matters important to the region and consistency with the OROP Vision and Goals. To understand how the Vision Plan would perform in comparison to these scenarios, the same MOEs were used for its evaluation.
The Vision Plan performed better and its effectiveness was largely accomplished by using the growth management techniques of the Green Infrastructure Scenario and the place center types of the Citizens’ Scenario in conjunction with the land uses called for in the Plans Scenario. As a result, the Vision Plan performs better than the Plans Scenario on most measures and in a manner similar to the Green Infrastructure Scenario.
The Vision Plan’s positive performance with respect to the MOEs indicates that focusing growth and development around the region’s centers provides greater opportunities to conserve
land while limiting potential negative impacts on air and water quality, travel times and congestion. To illustrate this, in the Trends Scenario only 62% of the region’s population would be living in centers in the year 2040 with 645,020 acres of land protected from development. By comparison, using the framework of the Vision Plan, 82% of the population would be living in the region’s centers and 876,580 acres land would be protected.
The table in Figure A-13 shows the MOE results for the Vision Plan, including a comparison to the performance of the four individual scenarios.
COMMUNITY INVOLVEMENT
OurRegion OurPlan was developed through an extensive public involvement process shepherded by the OurRegion OurPlan leadership committees, the staff of the BCDCOG and the consultant team. Widespread stakeholder involvement, including participation in the public forums and workshops described above, was fostered by the formal convening of leadership committees as well as through targeted outreach efforts that made use of traditional media, direct mail, social media, local area meeting presentations and direct person-to-person contact. Provided below is an overview of the OROP leadership committees’ role in fostering community involvement and a description of the outreach tools and efforts employed throughout the plan development process.

THE
PR
OC
ESS of C
RE
ATIN
G the V
ISION
PLA
NFigure A-13: Measures of Effectiveness for the Four Scenarios and the Vision Plan
p // App-13
PERFORMANCE MEASURE TRENDS PLANS CITIZENS’ GREEN INFRASTRUCTURE VISION PLAN
Co
mm
unit
yViz
®
Per
form
ance
Mea
sure
s% of 2008 Population in Centers1, 2 64 64 64 64 64
% of 2008 Employment in Centers 81 81 81 81 81
% of 2040 Population in Centers 62 62 76 82 82
% of 2040 Employment in Centers 77 74 88 90 91
% of 2040 Population outside Centers 40 38 23 17 17
% of 2040 Employment outside Centers 23 23 9 9 8
% of 2040 Population within ½ Mile of Transit Stops3 13 13 15 15
% of 2040 Employment within ½ Mile of Transit Stops 30 21 21 21
Acres of Protected Land 645,000 672,000 890,000 876,000 876,580
Trav
el D
eman
d M
od
el P
erfo
rman
ce M
easu
res
Vehicle Miles Traveled per Capita (System-wide) 25.17 25.81 25.11 24.98 23.86
% Change from Trends -1% 0% -1% -5%
Vehicle Hours Traveled per Capita (System-wide) 39 minutes 39 minutes 38 minutes 38 minutes 32 minutes
% Change from Trends -1% -2% -2% -18%
Delay in Hours (System-wide) 99,084 99,962 88,081 88,281 76,984
% Change from Trends 1% -11% -11% -22%
Delay per Driver (Minutes)
AM PEAK 4.40 4.44 3.86 3.86 3.61
% Change from Trends 1% -12% -12% -18%
PM PEAK 5.31 5.37 4.8 4.78 4.33
% Change from Trends 1% -10% -10% -18%
% of Congested Lane-Miles
AM PEAK 19.45 19.85 15.56 15.66 14.8
% Change from Trends 2% -20% -19% -24%
PM PEAK 26.77 26.04 21.77 21.91 20.96
% Change from Trends -3% -19% -18% -22%
Annual Congestion Cost (System-wide) $308,397,942 $311,131,316 $274,151,406 $274,774,618 $239,615,325
% Change from Trends 1% -11% -11% -22%
Person Trips (All purpose)
Drive Alone 903,976 903,431 890,543 895,543 847,138
Shared Ride (2 persons) 1,358,879 1,379,379 1,363,648 1,367,227 1,304,306
Shared Ride (3 persons) 143,745 145,650 142,996 143,540 136,665
Local Transit 10,935 10,513 9,209 9,329 9,006
Premium Transit 2,300 2,184 6,702 5,548 6,221
% Change from Trends -5% 191% 141% 170%
NO
TES
1. To be consistent with COG’s LRTP, 2008 population and employment numbers are used as a baseline.
2. Centers refer to incorporated areas and include villages, small and large towns, and small and large cities. In some cases, the total percent of population (and/or employment) in and outside of centers may not add up to 100 percent due to rounding errors and the use of the grid.
3. The Trends Scenario did not include enhanced transit services (e.g. bus rapid transit and commuter rail) and therefore there are no results for this MOE in the Trends Scenario.

PLAN APPENDIX A
THE PROCESS of CREATING the VISION PLAN
p // App-14
» OurRegion OurPlan Leadership Committees
To assure the OurRegion OurPlan process was grounded in the regional community and guided by local leaders, two committees were established: the BCDCOG Regional Land Use Planning Committee, led by Dorchester County Council member Larry Hargett, and a Technical Committee, mainly comprised of the staff and technical experts from the region. BCDCOG leadership and staff served as the formal liaison to these committees, providing tremendous support to both committees and the consultant team through data provision, meeting facilitation, document review, coordination with other agencies, and other technical guidance.
Regional Land Use Planning Committee
The Regional Land Use Planning Committee was comprised of local leaders from a variety of regional agencies, organizations and companies to ensure input from a broad range of the community with regional expertise and informed perspectives on issues of regional importance. Members of the committee included elected officials from a representative group of municipalities and counties within the tri-county region; architects, real estate agents, and land owners who provided perspectives on land development issues and concerns; staff from the South Carolina Coastal Conservation League who contributed knowledge on the region’s environmental interests; and staff
of area Chambers of Commerce who represented the business community and their interests. Leadership from these groups provided a direct connection to the larger region and acted as a conduit for sharing concerns. Over the course of the project, the Regional Land Use Planning Committee met on as needed basis to provide general guidance on the plan’s development and review progress towards the Vision Plan.
Regional Land Use Technical Committee
The Regional Land Use Technical Committee was made up of staff from municipal, county, and state agencies and non-profits familiar with comprehensive land use plans and transportation plans and their impact on the tri-county region and its quality of life, especially as it relates to growth and development. The Committee’s expertise on these issues was critical to the formation of the plan and member's insight and assistance was provided over the course of more than a dozen meetings throughout the OROP process.
» Public Outreach Tools and Efforts
To build attendance and participation in the committee meetings, community workshops and public forums, OurRegion OurPlan’s public information campaign and outreach efforts included traditional media, direct mail, social media, presentations and personal contact. Each of these efforts is described below.
Traditional Media
Throughout the development of OROP, information on the process and progress were shared with and through traditional media outlets. At the beginning of the project, editors from all traditional media providers were invited to a media breakfast. Among those who attended were the editors of regional papers, the Post and Courier and the Charleston Regional Business Journal.
Subsequently, members of the consultant team and the BCDCOG staff met with the Post and Courier’s editorial staff to solicit their assistance in promoting public awareness of OROP and building public participation in the plan-making process. In response, the Post and Courier included in the Sunday paper a special multi-page section that introduced OROP and promoted the regional Visioning Forum in the Sunday paper. It also included a printed survey that the public could submit to the COG to share their opinion on regional issues. This survey was also distributed and collected through library systems in all three counties. In addition to publication of the special section, the Post and Courier also ran an opinion piece from the Regional Land Use Planning Committee Chair, Larry Hargett, and Post and Courier contributor Ron Brinson also wrote a piece for the paper to voice his support for regional planning.
Additional media outlets such as the Summerville Journal Scene were also contacted or asked to
PLAN APPENDIX A
THE PROCESS of CREATING the VISION PLAN
p // App-15
support OROP by sharing information or providing opportunities for media appearances. As a result, Chairman Hargett appeared on the noonday program of WCSC, the local CBS station; on a local talk radio program on WTMA hosted by Rocky D; and on the local NBC station, WCBD News2. In addition, past-BCDCOG Chairman and Charleston Mayor Joseph Riley Jr. appeared on WCSC’s Talkback program.
In addition to the media breakfast, a press release announcing the 2008 Visioning Forum was sent to all local media and received good coverage, with reporters from the Post and Courier, Summerville Journal Scene, Charleston Currents, and local television stations attending and covering the event. The Great Places Workshop held after the Visioning Forum was attended by Post and Courier reporter Robert Behre, although it did not result in an article in the Post and Courier.
Media releases were also sent out to all area media to announce the four community cluster workshops held in 2010. The first of the workshops was held in Summerville and was covered by the Summerville Journal Scene and the local CBS affiliate, WCSC. The remaining three cluster workshops were also covered by local media and at the end of the week, when all four workshops had concluded, a press release was sent out to all media summarizing the workshops. At that time, a program update from Chairman Hargett was also sent to the e-newsletter and website, Charleston Currents.
Prior to the August 2011 Regional Forum, BCDCOG staff and the consultant team members had a second meeting with the Post and Courier staff, which resulted in the paper writing an article as well as running an editorial written by Chairman Hargett in which he encouraged Lowcountry residents to participate in the Forum. An invitation to the region’s residents from Chairman Hargett was also published in the Charleston Currents e-newsletter, encouraging them to attend and participate in the Regional Forum. In addition, a media release was sent to all area media announcing the Forum, which resulted in coverage from AOL’s Summerville PATCH, an on-line news source; the Charleston Regional Business Journal; and Comcast’s C2’s News and Notes program. Media releases were again set out to all area media to announce the creation of Regional Forum satellite locations to provide the additional capacity needed to accommodate the large regional interest. Immediately after the Regional Forum concluded, a summary of the event and a photo was e-mailed to a select list of area media including the Post and Courier and three local television stations. The Forum was attended by Charleston Currents publisher Andy Brack and a Summerville PATCH reporter.
Direct Mail
To utilize the BCDCOG’s vast contact list, invitations were sent out by BCDCOG staff prior to each public meeting. Formal letters of
invitation to the 2008 Visioning Forum were sent to BCDCOG’s contacts via the postal system while postcard invitations were sent for the 2011 Regional Forum. E-mails (eblasts) were also sent to all of the COG’s contacts, including those e-mail addresses that were gathered at each of the OROP public meetings and/or through the OROP project website. Flyers were also distributed to area church leaders prior to the Regional Forums and the cluster workshops to promote participation by a broad spectrum of the region’s population. Additionally, the BCDCOG’s e-newsletter also included regular project updates.
Social Media
One of the first outreach tools established for OROP was a project website (www.OurRegionOurPlan.org) maintained by BCDCOG staff and updated regularly with project information and resources as well as opportunities for involvement. A Facebook page was also established for the project. To help drive traffic to the both the OROP project website and Facebook page, links were placed on the BCDCOG’s website and on their Facebook page.
Presentations at Area Meetings
Because of the size of the study area, there was a recognition that no matter what location was selected for the Visioning Forum, or any of the other subsequent meetings, some of the public

PLAN APPENDIX A
THE PROCESS of CREATING the VISION PLAN
p // App-16
would need to travel out of their way to attend. To demonstrate an appreciation for this travel and to reach out across the tri-county region, prior to the 2008 Visioning Forum, OurRegion OurPlan project staff made presentations at municipal meetings throughout the region, including presentations to the Cities of Charleston, Folly Beach, Goose Creek, Isle of Palms, and North Charleston, the Towns of Harleyville, Hollywood, James Island, Jamestown, Kiawah Island, Mt. Pleasant, Ridgeville, St. Stephen, Sullivan’s Island, and Summerville, and Berkeley County. The Charleston County and Dorchester County Councils and the municipal councils not listed here received phone calls and e-mails with information about the OROP public meetings to be shared at their respective meetings. Additional presentations were given to community organizations including the Tri-County Chamber of Commerce, the Berkeley Chamber of Commerce, the Summerville Chamber of Commerce Board, the Summerville Rotary, the North Charleston Breakfast Rotary and the North Charleston Rotary, as well as at a community meeting of the Accabee Neighborhood.
While presentations were not made by members of the project team prior to the cluster workshops, area municipalities and county councils were contacted and asked to share information about the workshops, especially those located in their area. After the cluster workshops, BCDCOG staff gave a project update to a packed crowd at a meeting of the Charleston Metro Chamber of
Commerce’s Developer’s Council. Finally, prior to the 2011 Regional Forum, presentations were made by BCDCOG and project staff to all three counties’ council meetings.
Person to Person Outreach
Person to person outreach was also recognized as a valuable way to encourage greater attendance at the forums and cluster workshops. Names of influential citizens, collected through stakeholder interviews, were identified and called prior to the 2008 Visioning Forum. Prior to the cluster workshops, Regional Land Use Planning Committee members were each asked to identify and call five people with subsequent follow-up with the contacts provided by project team members. Calls were also made to active citizens to encourage them to attend a cluster workshop in their area. For the 2011 Regional Forum, committee members were also encouraged to make calls to contacts who might be interested in participating.

{this page intentionally left blank}
