decarbonization of fossil: pathway to hydrogen economy · decarbonization of fossil: pathway to...
TRANSCRIPT

1
JNCASR-I@CAM energy school,
Bangaluru
Nov30, 2017
Decarbonization of fossil: Pathway to
Hydrogen Economy
R. R. SondeExecutive VP, Thermax Global Ltd.Formerly with Atomic Energy Commission, India & NTPC Ltd.

COAL IS THE BACK BONE OF ENERGY & INDUSTRIAL REVOLUTION SINCE 16 th CENTURY.
Coal and Crude oil both of fossil origin meet almost 89% of global energy needs.
Both have carbon –carbon bonds, hydrogen- carbon bonds hybridized in various ways. SP3, cleavage, co valent bonds with energy from 400 kJ/kgmol to 800 k j/kgmol.
Coal is hydro carbon with a formula CH0.14
While oil is with an average formula of C8 H16 and gas is methane CH 4

Fossil Fuel Emissions
0
5
10
15
20
25
30
1750 1850 1950 2050 2150 2250 2350 2450 2550
Year
Em
issio
ns
(G
tC/y
r)
"Data"
"Logistic Fit"
Fossil fuels are going to be mainstay of energy security of the globe
Source for “all fossil fuel”: Bryan Mignone
IS92a
scenario
GtC/yr
Today
xxxxx xxx x
Hubbert oil curve:
3 GtC/yr peak today,
230 GtC (2000x109bbl) total
OIL
ALL FOSSIL
FUEL
Hubbert (logistic) curve for
all fossil fuel: 5600 GtC total,
fit to IS92a
x
PEAKING OF FOSSIL: AN UNENDING
RESOURCE? OR APOCALYPSE OF THE GLOABE

Fossil Energy Conversion: Corner stone in the great discoveries
James Clerk Maxwell Michael Faraday
Maxwell introduced the concepts of electro-
magnetism.
Faraday – Maxwell Equations talk about the
generation of electricity through a magnetic field
and the concepts of Electrodynamics
The modern steam turbine invented by Sir Charles Parsons in 1887 today generates
about 80 percent of the electric power in the world using a variety of heat sources.
Charles Algernon ParsonsFirst compound steam turbine, built by Parsons in 1887
Sir Charles Algernon
Parsons, invented the first
steam turbine in 1887
Very complex way of conversion “chemical– thermal-mechanical-electricity”
Combustion – Heat Transfer – Roto dynamics - Electromagnetism
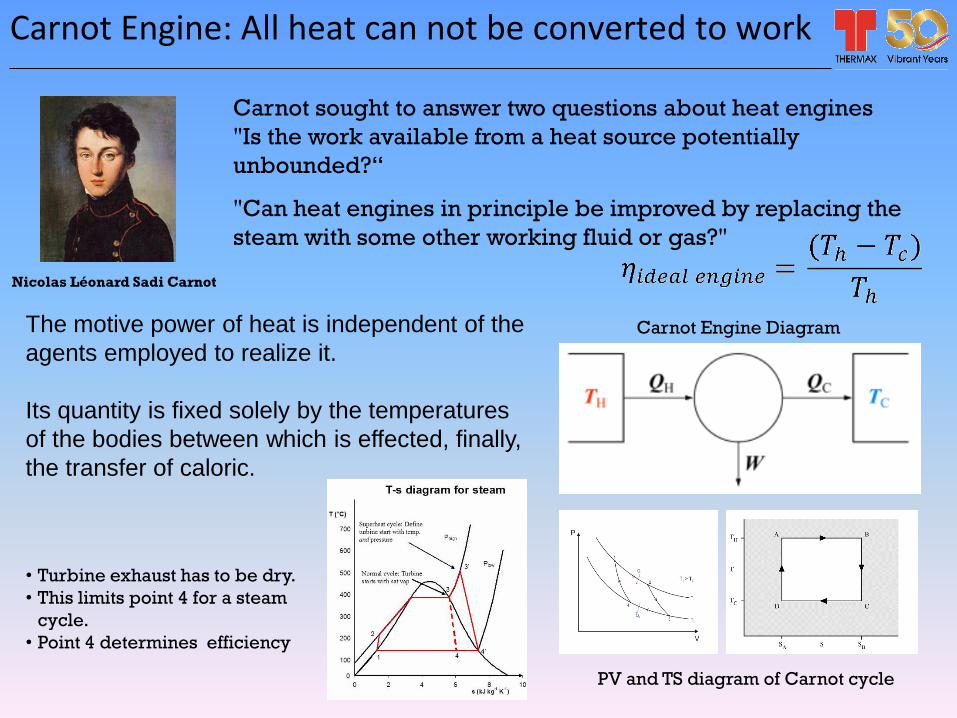
Carnot Engine: All heat can not be converted to work
Nicolas Léonard Sadi Carnot
Carnot sought to answer two questions about heat engines
"Is the work available from a heat source potentially
unbounded?“
"Can heat engines in principle be improved by replacing the
steam with some other working fluid or gas?"
Carnot Engine Diagram
PV and TS diagram of Carnot cycle
The motive power of heat is independent of the
agents employed to realize it.
Its quantity is fixed solely by the temperatures
of the bodies between which is effected, finally,
the transfer of caloric.
• Turbine exhaust has to be dry.
• This limits point 4 for a steam
cycle.
• Point 4 determines efficiency

THERMODYNAMIC CYCLE OF EXTRACTION OF FOSSIL ENERGY
Boiler (steam generator)
island
Steam Turbine cycle Electricity
Condensing Cycle
Condensing Cycle
FOSSIL FUEL
(HC)
Reject heat
Efficiency = Electricity (kWhr) /Heat input (kWhr)
CO2
The thermodynamic
efficiency is just
about 30-45%!Ash

Improve Thermal Efficiency in PC and USCPC
Current Level
35-
36%
37-38%Increasing
steam
Parameter
s
38-40%Super
critical
42%Second
Reheat
43%Supercritical
+
45%Ultra-
Supercritical
+
Novel
Technologie
s
T
E
M
p
535 deg C
580 deg C
620 deg C
660 deg C
Efficiency VS AVAILABILITY

Thermal to Electrical Conversion process
Sink temperature is
critical while higher
temperature of
steam (and the
supercritical cycles)
increase the
efficiency
The lower efficiency has two
impacts : Higher fuel
consumption and consequent
higher CO2 emissions

HOW DO WE CALCULATE CO2 FROM SUCH A CYCLE
1. Once we fix the steam temperature (source), for a given cooling water (sink) temperature, we can calculate the efficiency of the cycle
2. Then calculate the fossil fuel energy needed for generating 1 unit of electricity (kWhr)
3. Based on the heat content of the fossil fuel, now calculate the mass of fossil required for generating 1 unit of electricity
4. Now using the bond energy and moles of carbon bonds we can now calculate the CO2 generated from the mass of fuel foe 1 unit of electricity
5. The efficiency of the steam generating boiler will also need to be considered in this calculations

Clean Technology: Those technologies which emit near zero
pollutants in its process of energy conversion are by definition are
clean technologies. Zero emission can be achieved by ensuring
that the process is efficient (in strict thermodynamic sense of
reversibility) plus disposing of the residual pollutants.
CO2 Emissions from fossil fuel
Efficiency (%) Technology Specific CO2
emission, kg/KWh
100 Nil 0.3156
80 Nil 0.3945
60 DC+FC (*) 0.5260
50 IGCC +FC 0.6312
45 IGCC 0.7014
40 USC 0.7819
35 PC 0.9018
Gas Levels GHG
Potential
Net GHG
impact
CO2 12-13% 1 95%
NOx 250-400
ppm
288
(N2O)
5%
SOx 400-800
ppm
Nil Nil
SPM 120-150
ppm
Nil Nil
Table2. Variation of specific CO2 emission with efficiency
Table1. Typical emission levels from a coal fired power station
NGCC
(380)
(850)
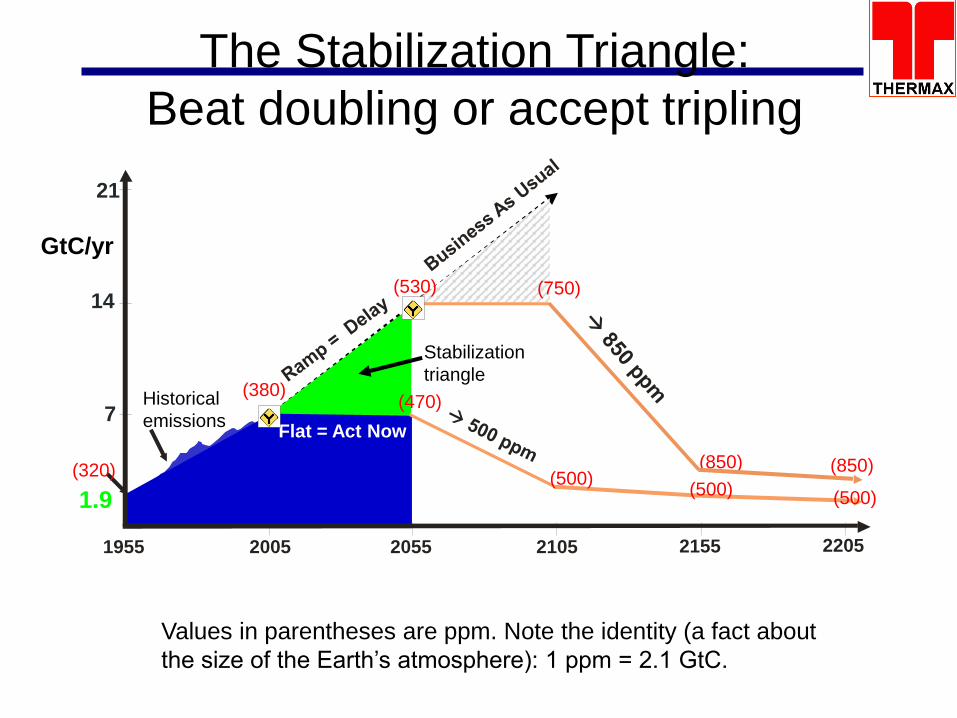
The Stabilization Triangle:
Beat doubling or accept tripling
Values in parentheses are ppm. Note the identity (a fact about
the size of the Earth’s atmosphere): 1 ppm = 2.1 GtC.
14
7
21
1955 2055 21052005
Flat = Act Now
1.9
(320)
(470)
(530) (750)
(500)(500)
(500)
(850)
2155 2205
GtC/yr
Historical
emissions
Stabilization
triangle

THIS ONE PICTURE SHOULD BRING UP THE
RESOLVE BEYOND ANY DOUBT
CLIMATE CHANGE AND ITS POTENTIAL FOR DESTRUCTIVE IMPACT IS NOW
UNDISPUTED.
AMITAVA GHOSH CALLED IT AS “ GREAT DERANGEMENT”
“Extreme Events” happening with regularity
37.8 Giga Tonnes of anthropogenic CO2 and 5 MT of ODP sitting in the earth’s
atmospheric crust is the root of all these
WE ARE AT THE TIPPING
POINT

CONSIDER THIS: HOW MANY OF US CAPTURED THE TWO RECENT HEAD LINES- OCT 2016
1. On 19 th October, CO2 (gold standard from the Lab Mauna Loa in Hawaii) , concentration touched 400 PPM – TIPPING POINT.
2. On 23 rd October, Scientists accidently discovered a process that turns CO2 into ethanol !!
400 ppm

Now how do we de carbonize the fossil but still get the energy ?
FOSSIL SOURCENON FOSSIL SOURCE
(NUCLEAR) RETAINS
CARNOT PRINCIPLE
RENEWABLE SOURCE
(NEW METHOD OF GENERATION
FOSSIL SOURCECARBON CAPTURE AND
SEQUESTRATION – CCS
TECHNOLOGIES
FOSSIL SOURCEHYDROGEN OR ITS
CARRIERS
CO2 TO FUEL
RENEWABLE SOURCE
SOLAR + WIND
De-
carbonizing
the fossil

Sources : WCI; Scientific American
Ref. : World Coal Institute
CARBON CAPTURE AND SEQUESTRATION : CCS TECHNOLOGIES

DECARBONIZING FOSSIL ENERGY
Boiler (steam generator)
island
Steam Turbine cycle Electricity
Condensing Cycle
Condensing Cycle
FOSSIL FUEL
(HC)
Reject heat
Efficiency = Electricity (kWhr) /Heat input (kWhr)
CO2
The thermodynamic
efficiency is just
about 30-45%!Ash

CO2 Transportation
CO2 Sequestration
CO2/AGR Capture
Pre-Combustion
IGCC
Post Combustion
Physical Separation
Chemical Separation
Membrane Separation
Hybrid Separation
During Combustion
Oxy-Fuel Combustion
CFBC
Hi-Pressure Transportation
Cryogenic Transportation
Carbon capture Technologies
CO2 Capture
CO2 SequestrationCO2 Transportation
The 3-Point Triangle
Deep Ocean Storage
Underground Coal Mines
Enhanced Coal Bed Methane
Enhanced Oil Recovery
Bio Technological Path
Underground Aquifers
Large R&D
Required
Advanced
chemistry
plays a major
role

Depleted Oil & Gas Fields;
? Availability ?
Enhanced coal bed
methane
? Net GHG mitigation ?
“Unmineable” coal seams
? Injectivity ?
Deep Saline Reservoirs
e.g. Sleipner, In Salah,
SnohvitEnhanced Oil Recovery e.g. Weyburn;
? limited total capacity ? Source IPCC
Sequestration issues: Well known concerns

Typical parameters for a 210 MW Indian Coal Unit
Coal : 130 ton / hr
Air : 700 ton / hr
Volume of flue gas : 800 ton/ hr or 410-430 m3/sec
CO2 Emission : 170 ton/hr
Temperature : 140-170 °C
Pressure : 350-500 mmwc
Excess oxygen : 3-4%
CO2 : 13 - 15 %
Moisture : 4-5%
SOx : 700-1200 mg/Nm3
NOx : 300-500 mg/Nm3
Fly ash : 65000 mg/Nm3 (before ESP)
About 120 mg/ Nm3 (after ESP)
Huge Quantities of Flue Gases
from a Typical Power Plant
Challenges in Carbon Capture in PC Fired Boiler

Challenges in Carbon Capture
Combustion in boiler at
Atmospheric pressure
Low CO2 concentration in
Flue Gas: GT / Gas fired
boiler is 4-5%
Low CO2 concentration in
Flue Gas: Coal fired boiler:
13-15%
Low Discharge pressure of
Flue Gas: 350-500 mmwc
Combustion in boiler at
Atmospheric pressure
Facts
High Energy
for
pressurization
Bulky equipment
- Higher capital
costs
High partial pressure
based CO2 separation
process like Benefild or
Catacrab cannot be used
Issues
Low partial pressure of CO2
1. Low partial pressure
of CO2

Challenges in Carbon Capture
2. High temperature of flue gases
Facts
Flue gas temperature
is generally 140-160 °C
Present solvent based
process operates at 40-
50 °C
CO2 laden solvent is
regenerated at 120 °C -
130 °C
Issues
Cooling is
required for
CO2 separation
Flue gas
cooling below
50°C is required
for membrane
or PSA process
Concerns
Cooling is very
energy intensive
process
Lower
temperatures
also pose risk of
acid corrosion

Challenges in Carbon Capture
3. SOx Removal
Flue gases from coal fired units contains 700-1200 mg/Nm3 of SOx
In amine process, SO2 reacts with amines to form thermally stablecorrosive salt.
SO3 forms sulfuric acid mist in cooler causing corrosion
SOx may adversely reacts with membrane materials or solidadsorbent or may get adsorbed on adsorbent
Facts:
The acceptable limits of SO2 for solvent process is 10 ppmv
A lime stone or wet FGD system followed by caustic soda or soda ash based scrubber is must for SO2 removal
Issues:
Cost of FGD (not mandatory otherwise), results in
higher cost of CO2 capture
Concerns:

Challenges in Carbon Capture
Level in flue gas 500-
800 mg/Nm3
In amine process,
solvent degradation
due to formation of
thermally stable salts
Corrosion due to nitric
acid formation
Adverse reaction or
adsorbed in solid
absorbents
Facts
NOx may degrade
membrane materials
NOX is removed by
SCR process at 250-
300 °C
Plugging of catalyst by
fly ash is a problem
Flue gas heating to
reaction temperature
not possible when
SCR is after
Economizer.
Issues
SNCR at high
temperature is an
option
Cost of NOx removal
results in higher cost
of CO2 capture
Development of Nox
/ corrosion resistant
process will be
better option
Concern
4. NOx Removal
Mercury is yet
another aspect

Challenges in Carbon Capture
5. Oxygen
in Flue
Gases
Issues:
Corrosion in solvent based process,
particularly at high temperature
Solvent degradation
Degradation of membrane due to oxidation
Oxygen may get adsorbed on solid absorbent
thus reducing its adsorption capacity
In solvent based process, corrosion inhibitor
or oxygen scavenger is used
Facts:
Corrosion in solvent based process, particularly
at high temperature
Concerns:
Screening of Oxygen may be a very cost
intensive process

Challenges in Carbon Capture
6. Fly Ash in Flue Gas
Facts:
About 100 -150 mg/Nm3 of fly ash present
in flue gases
Issues:
This causes plugging, erosion, solvent
degradation etc. in solvent based process
Fly ash may also plug membranes and
solid adsorbents
Generally Direct Contact Cooler or FGD
removes most of the fly ash

Technologies for CO2 Separation
CO2
Capture
Process
Physical
Separation
Chemical
Separation
Advanced
Separation
Biological
Separation
Hybrid
Separation
Cryogenic
Distillation
High
Pressure
Separation
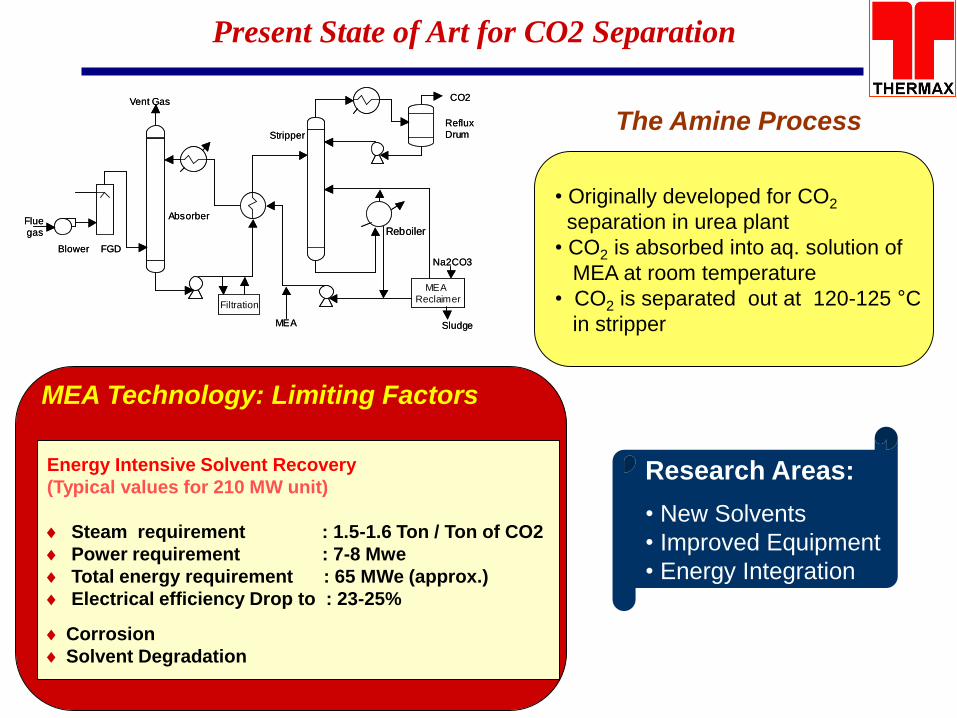
• Originally developed for CO2
separation in urea plant
• CO2 is absorbed into aq. solution of
MEA at room temperature
• CO2 is separated out at 120-125 °C
in stripper
Na2CO3
MEA Reclaimer
Blower FGD
Absorber
Stripper
Reflux Drum
Reboiler
Sludge
Filtration
Vent Gas CO2
Fluegas
MEA
Na2CO3
MEA Reclaimer
Blower FGD
Absorber
Stripper
Reflux Drum
Reboiler
Sludge
Filtration
Vent Gas CO2
Fluegas
MEA
Present State of Art for CO2 Separation
Energy Intensive Solvent Recovery
(Typical values for 210 MW unit)
Steam requirement : 1.5-1.6 Ton / Ton of CO2
Power requirement : 7-8 Mwe
Total energy requirement : 65 MWe (approx.)
Electrical efficiency Drop to : 23-25%
Corrosion
Solvent Degradation
MEA Technology: Limiting Factors
The Amine Process
Research Areas:
• New Solvents
• Improved Equipment
• Energy Integration

Basic chemistry in solvent absorption
2RNH2+CO2------ R-NH-COO-+ RNH3 + (MEA)
R2NH3 + CO2--- R2NCH4+ + HCO3- (MDEA)
Salient features
1.Kinetics vs. equilibrium absorption
2.Selectivity for Acidic gases
3.Degradation issues
New R&D directions
New engineered hindered amines, additives,
hybrids
Modified amines (sterically hindered amines where molecular structures of
these amines are generally similar except that amino group is attached to a
bulk alkyl group. 2AMP (2 Amino-2-methyl-1-propanol) is one such example

CO2 + RNH2 ------ RNH2+COO – (carbamate)
CO2 + R1R2NH <-------- R1R2NH +COO – (carbamate)
CO2 + R1R2R3N ---- R1R2R3NHCO3- (bicarbonate)
Solvent Development
R-NH2 R1R2NH R1R2NR3
Primary Amine Secondary Amine Tertiary Amine

Heat of Equilibrium Rate of
reaction capacity Reaction
(kcal/kg ) (mole/kg mole) kmol/m3kPa
Primary amine (MEA) : 455 0.45 5000
Secondary amine (DEA) : 360 0.50 2300
Tertiary amine (MDEA) : 320 0.80 100
Typical Properties of Amines

Low temperature
• Zeolites Molecular Sieves
• Activated Carbon
• Carbon Molecular Sieves
• Modified Silica
• Ion Exchange Resins
• -Complexation
• Activated alumina
High Temperature
• CaO, Ca(OH)2
• Hydrotalcite
• Lithium Zirconate
Alternate to solvents (PSA)
Alternate process on PSA
PH
I
PH
II
PM
III
PM
IV
PL
V
Off Gas
Flue gas
Power
Plant 1-3 atm
CO2 for
sequestration
• Preliminary estimate shows power consumption : 0.2 kwh/kg

Material Development
Property N2 O2 CO2
Kinetic
Diameter, A°
3.65 3.47 3.33
Polarizability,
A°3
1.72 1.55 2.91
Quadruple
Moment
Esu[-1X10-26]
1.2 0.4 4.2
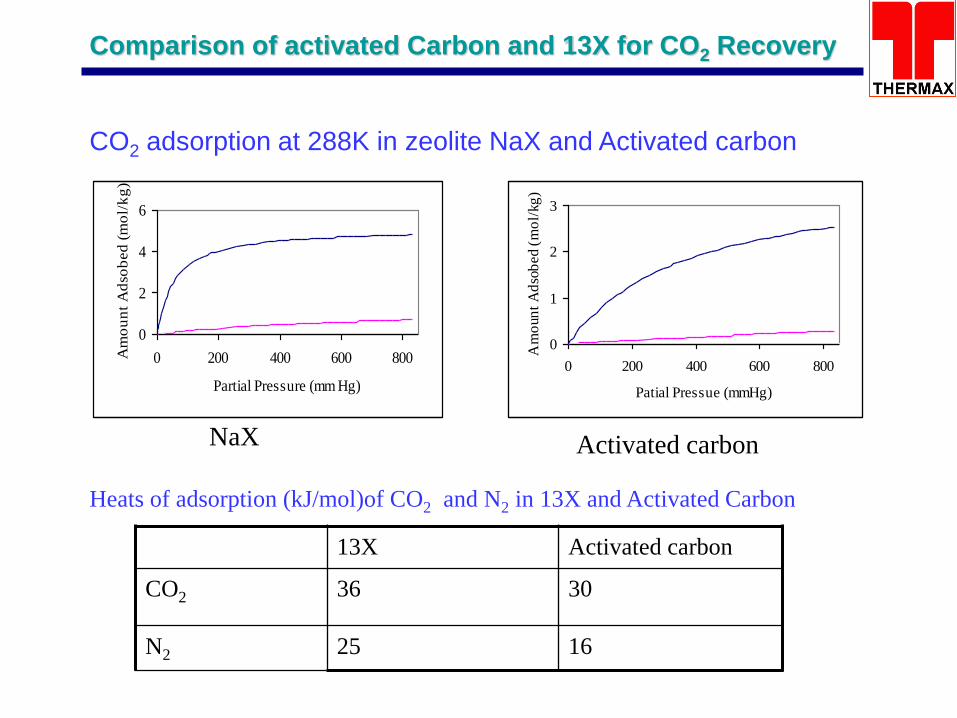
Comparison of activated Carbon and 13X for CO2 Recovery
0
2
4
6
0 200 400 600 800
Partial Pressure (mm Hg)
Am
ou
nt
Ad
sob
ed
(m
ol/
kg
)
N
C
0
1
2
3
0 200 400 600 800
Patial Pressue (mmHg)
Am
oun
t A
dso
bed (
mo
l/kg
)
N
C
CO2 adsorption at 288K in zeolite NaX and Activated carbon
NaX Activated carbon
Heats of adsorption (kJ/mol)of CO2 and N2 in 13X and Activated Carbon
13X Activated carbon
CO2 36 30
N2 25 16

Zeolite
• Cation Exchange
• Surface Functionalisation
With Amine
• Pore Engineering to
Control Diffusion of
CO2
Hydrotalcite
• Anionic Clay
• Mg based Octahedral
Layered Structure
• Increase in Positive Charge
• Replacing Al+3, Mg+2 ions
• Changing Ratio of Al+3/Mg+2
Material Development

Metal Organic
Frame Work
• Metal Organic Legand
• Complex Geometry with 3D
Channel
• MOF is Highly Selective to CO2
• Gate Opening Pressure
CO2 = 0.4 atm.
N2 = 50 atm
O2 = 53 atm
Mesoporous
Molecular Baskets
Carbon Molecular
Sieve
Surface
Functionalization
with Amines
Material Development

Ionic Liquid
Non-Corrosive molten organic salts
Alkyl Ammonium, Alkyl Phosphonium,
Alkyl Imidazolium,alkylpyridinium halide salt
No definite melting point
No Measurable Vapour Pressur
Low viscosity

Process Development
Ionic LiquidDialkyl Imidazolium salt
based
• Synthesis
• Characterization & Screening
• CO2 Absorption-desorption
isotherm study
Membrane Cellulose Acetate based
• Fabrication of Membrane
• Optimization of Membrane
Preparation Parameter
• Analysis of CO2 and N2
Permeation property
• Compatibility of membrane with Ionic Liquid
• Incorporation of Ionic Liquids into Membrane
• CO2 & N2 Permeation Study Using Ionic
Liquid-Membrane System
• Fabrication of Pilot Scale Membrane and
Permeability of CO2 Study with Ionic Liquid

CONVERT FOSSIL INTO HYDROGEN (FROM WATER) AND FIX CO2 TO A FUEL
Convert fossil fuel to synthesis gas (CO + hydrogen ) using coal steam partial oxidation. The
endothermic gasification reaction ( hydrogen ) is balanced with exothermic reaction ( CO2).
CO2 can then be further converted to fuel using renewable hydrogen
This is a complete new way of de carbonizing fossil
Gasifier Synthesis gas
(CO + H2)
Methanol
Hydrogen
CO2
New way for decarbonizing the fossil:

CH3OH
Wood
Alcohol
In Internal Combustion
Engines
In Direct Methanol Fuel Cells
Conversion to olefins-gasoline,
diesel, etc.
Dimethyl Ether (Diesel and Household Fuel)
The Methanol Economy: Methanol to de-carbonize the fuel
High octane (ON= 100)
clean burning fuel,
15.8 MJ/liter.
M-85 Fuel
CH3OCH3, high cetane
clean burning diesel fuel, LNG
and LPG substitute.

* Electricity production by combustion in existing gas
turbines or boilers
Interesting for local power generation especially
for nations composed of many islands such as Indonesia
and The Philippines where the construction cost of a
national grid might be prohibitive.
* Electricity generation through fuel cells
Fuel cells not limited by weight and space: other types of
fuel cells can be used; PAFC, MCFC and SOFC
* Use of methanol as cooking fuel in developing
countries (Indian Market: 35 Billion litres of methanol)
Much cleaner burning and efficient than wood
or kerosine
* Methanol for the production of chemicals:
formaldehyde, MTBE, acetaldehyde, polyethylene,
polypropylene and any other chemical obtained from
methanol today
* Methanol is a feed for single cell proteins- as a feed
for animals
Methanol as a fuel and feedstock

Methanol, a one carbon solution for a one
carbon problem
Methanol
Acetic Anhydride
Acetaldehyde
Polyacetal
Formaldehyde
Methyl tert-butyl ether
(MTBE)
Ethanol
Methyl formate
Acetic acid
Methyl amines
Single cell proteins
Biochemicals
Hydrogen H2
Dimethyl terephthalate
(DMT)
Others
Polymethyl methacrylate (PMMA)
Paraformaldehyde
Hexamine
Phenol resins
Urea resins
Polyols
Melamine resin
Methane-di-isocyanate (MDI)
Butanediol
Isoprene
Methyl methacrylate (MMA)
Dimethyl formamide (DMF)
Dimethylacetamide (DMAC)
Methylethanolamine
Tetramethyl ammonium hydroxide (TMAH)
Carbamates
Higher amines
Polyethyleneterephthalate (PET)
Chloromethanes
Xylene resin
Methacrylates
Coating resins
Formamide HCN
Formic acid
Others
Dimethyl ether (DME) Olefins Gasoline
Ethylene, Propylene
Polyethylene, PolypropyleneMethanol consumption
Already one of the most important
product in the chemical industry
Methanex mega-methanol plant
Methanol

MTO and MTG Processes

METHANOL AS A MEANS TO “TOTAL” CLEAN ENERGY
India is coal dependent for its electricity generation and India generates annually about 800 TWHR from its 300 GW Power Plants; simultaneously total energy consumption from other fossil fuel consumption is close to ~415 MTOE. And if we have to develop clean and green energy and meet our NDCs as well as keep our developmental momentum high, we need to target clean technologies at both levels.
Solar PV / CSP - electricity sector
Ethanol / bio diesel - fuel sector
Methanol perhaps has the capability to be part of both sectors and also can work with the India’s predominant power coal and make it as clean coal
Clearly energy is not electricity alone…..
Approximately 80% of energy is for transport, industry and buildings outside electricity consumption
India’s leap into Methanol Economy5th-6th September-2016 R R Sonde

HOW BOTH SECTORS (POWER & TRANSPORT) IS POSSIBLE
Electricity sector
Fossil : coal & gas
Solar (PV/CST)Fuel sector
Fossil : Oil
Bio diesel / Ethanol
Fossil to Liquid Fuels ( MeOH)
Solar to Hydrogen to MeOH
ElectricityUsing Fuel cells
& power engines
Fossil to MeOH
Solar, Bio waste to MeOH
Fuel segmentIn IC enginesFuel cells for automobile applications
1.Hybridising fossil and renewable gives high efficiency and fix CO2 as well2. Fuel cells can generate electricity at 50% plus efficiency and hence lower CO2 emissions per kWhr. Fuel cells in CHP mode can boost up efficiency to 75% plus
India’s leap into Methanol Economy5th-6th September-2016 R R Sonde

KEY DRIVERS
Basis for Methanol economy for India is
1. Methanol based fuel cells will deliver very high power generation efficiency compared to DG sets- which continue to pollute but also proliferate. Fuel cell on Methanol would reduce carbon emissions, reduce import dependence on crude and enable faster deployment of distributed energy solutions for buildings, telcom towers, off-grid applications, agricultural pumping system
2. Methanol – FC combination for automobile applications will be the next foray which will again bring alternate to battery driven cars. High efficiency and capability for larger mileage will tilt scales in favour of Methanol-FC hybrid
3. Gasoline engine running on Methanol is the quick way to introduce Methanol for transport sector. High efficiency and better environmental performance
India’s leap into Methanol Economy5th-6th September-2016; R R Sonde

KEY DRIVERS (CONTD.)
Basis for Methanol economy for India (continued)
4. Methanol is used as vehicle for transfer of hydrogen and hence developments of small reformers will be yet another development which will give right momentum to kick-in Methanol economy
5. CO2 capture and hydrogen from renewable energy will enable synthesis of Methanol and make CO2 a closed cycle carbon neutral cycle leading to meeting the carbon issue
DG set
Fuel cell
Methanol enables this efficiency enhancement
India’s leap into Methanol Economy5th-6th September-2016; R R Sonde

HYDROGEN (METHANOL) FROM FOSSIL (option 1)
Coal Gasification (80% efficiency)
Coal Gas clean up + Methanol conversion
island1 kWhr 0.8 kWhr 0.45 kWhr
Methanol
Fuel cell (with CHP)0.225 kWhr(0.34 kWhr)
Some excess CO2; possible for additional methanol if hydrogen is available
India’s leap into Methanol Economy5th-6th September-2016; R R Sonde
Go away from Carnot Engine to new combined cycle: Coal gasification
Electricity plus Air conditioning

Methanol from Solar : Option2
0.4 kWhr0.25 – 0.35 kWhr
ElectrolysisThermal
Split
SolarPV/CST
HydrogenH2-
MeOH
End use for electricity
or fuel1 kWhr0.7-0.8 kWhr
India’s leap into Methanol Economy5th-6th September-2016 R R Sonde
CO2 FROM SOME SOURCE
Getting CO2 from atmosphere is an issue and will involve energy penalty
This may be a future destination when generation and point of use are adjacent and CO2 can be recycled, But this is not the scenario presented now.
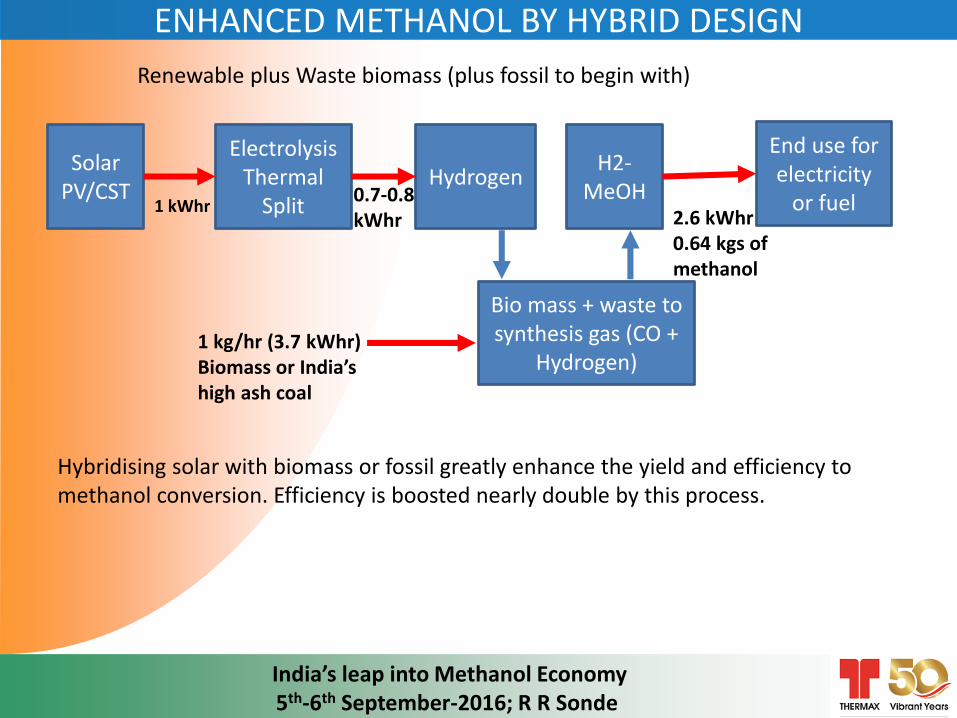
ENHANCED METHANOL BY HYBRID DESIGN
ElectrolysisThermal
Split
SolarPV/CST
HydrogenH2-
MeOH
End use for electricity
or fuel1 kWhr0.7-0.8 kWhr
1 kg/hr (3.7 kWhr)Biomass or India’s high ash coal
2.6 kWhr0.64 kgs of methanol
Bio mass + waste to synthesis gas (CO +
Hydrogen)
Hybridising solar with biomass or fossil greatly enhance the yield and efficiency to methanol conversion. Efficiency is boosted nearly double by this process.
India’s leap into Methanol Economy5th-6th September-2016; R R Sonde
Renewable plus Waste biomass (plus fossil to begin with)

Methanol Generation Technology
Technology provider Operating condition Catalyst
BASF 300-500 bar, >340oC Zn-Chromium oxide
Johnson Matthey Davy (Prv. ICI:Imperial Chemical Industries)
Linde
50 bar Cu-Zn-Chromium oxide
Haldor Topsoe Flexible, MK-151, FENCE Cu-Zn oxide, alumina

WHAT IS PROPOSED?Focus on indigenous development where critical technology control remains (inside the country) but balance the indigenous risks with non-critical (non-control) technology elements (already available as commercial) to hasten the process.
COAL TO MEHANOL
Building blocks in this are as follows:
Gasification Island (A)
Gas clean up island(B)
ASU Island (E)
Methanol reactor island (C)
Final Methanol purification and transport island
(D)

• India has abundant coal which can be used for meeting the demand of fuel methanol
• With the overall trend of decreasing coal thermal power plants, India’s coal will be available for other use → Methanol is a viable “clean coal” energy option
• Going forward, other carbonaceous feedstocks like agro-residues, biomass, MSW, etc. can also serve as raw feedstocks, thereby adding credibility to India’s climate change commitments
• Currently there is no plant (technology) available for demonstration of high ash coal to methanol
52
India’s coal and methanol
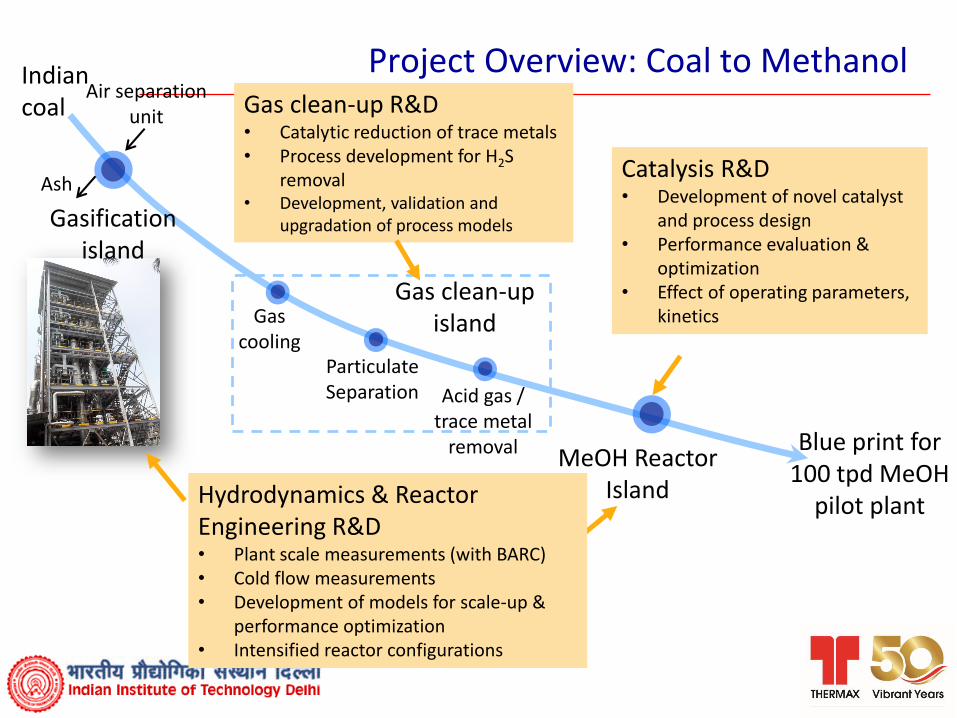
Project Overview: Coal to MethanolIndian coal
Gasification island
Air separation unit
Gas cooling
Particulate Separation Acid gas /
trace metal removal
Gas clean-up island
MeOH ReactorIsland
Blue print for 100 tpd MeOH
pilot plant
Ash
Hydrodynamics & Reactor Engineering R&D• Plant scale measurements (with BARC)• Cold flow measurements • Development of models for scale-up &
performance optimization• Intensified reactor configurations
Gas clean-up R&D• Catalytic reduction of trace metals• Process development for H2S
removal• Development, validation and
upgradation of process models
Catalysis R&D• Development of novel catalyst
and process design• Performance evaluation &
optimization• Effect of operating parameters,
kinetics

Flow scheme for 100 TPD Coal to Methanol plant
H2S,COS, CO2,NH3 removal
Gas coolerGasifierParticulate
removal
Gasification island
Shift reactor
350 TPD of coal input
Topping column
Refining column
Methanol reactor
Methanol
Water
60-80 bar
100 TPD
Gas cleanup Methanol synthesis
Methanol Purification
100 TPD is equivalent to typical 15 MWe coal power plant. Thermax has experience of establishing upto 300 MWe power plant
Char Combustor
Ash
steam

Flow Scheme for Methanol to DME
CatalystAl2O3OrZSM-5 zeolite
•Cetane number of DME :55-60 (Diesel: 40-55)•LHV: 6800 kcal/kg
2 CH3OH CH3OCH3 + H2O
Δ H°327° C. = −5.6 kcal/mol
AA Grade methanol

Pilot Plant : Coal to Methanol
56

• Being a leader in both AFBC (atmospheric fluid bed combustion) and its derivative CFBC (circulating fluid bed combustion) with units from 5 MW -300 MW in its technology basket, Thermax started working on Coal gasification using fluid bed concept.
• Over last four years, we have now four different fluid bed units from 250 kW to 4.5 MW on coal (India’s high ash coal) & biomass
• The design developed by Thermax is configured to take care of all the issues known in India’s high ash coal gasification in terms of carbon conversion, cold/hot gas efficiency, controls and more importantly failure of many sub components.
57
Thermax’s Experience in Gasification

58
500 kW coal Gasification facility EIL Gurgaon 1 MW coal Gasification facility Thermax Pune
Gasification Plant Installations
Turbulent fluidized bed with solid circulation Circulating fluidized bed
(Proposed to integrate with
methanol plant)
59
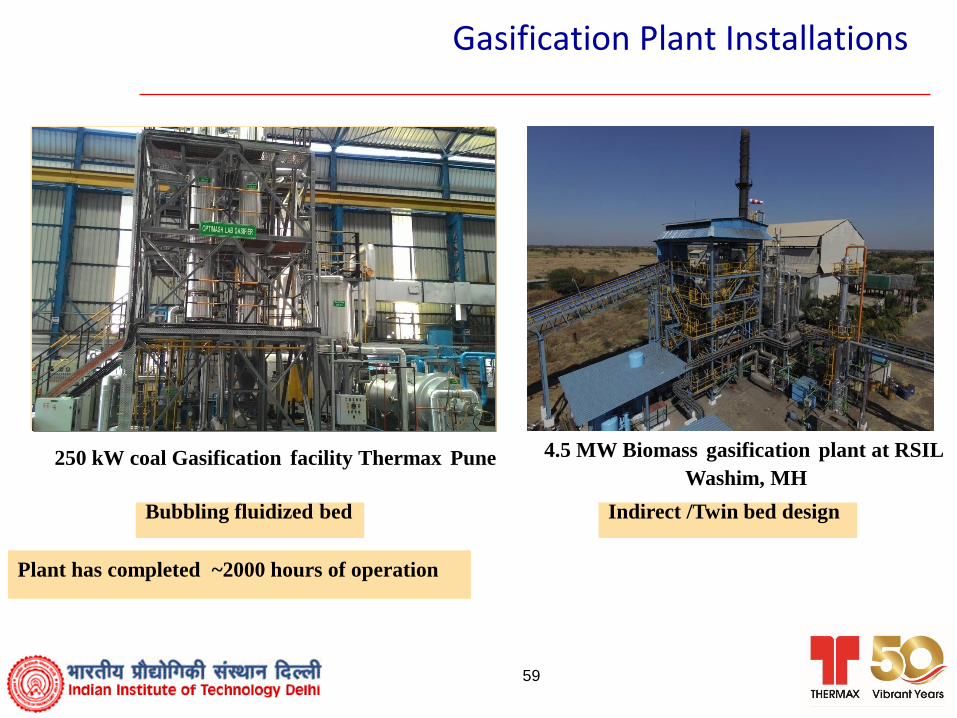
Gasification Plant Installations
250 kW coal Gasification facility Thermax Pune 4.5 MW Biomass gasification plant at RSIL
Washim, MH
Plant has completed ~2000 hours of operation
Bubbling fluidized bed Indirect /Twin bed design
60
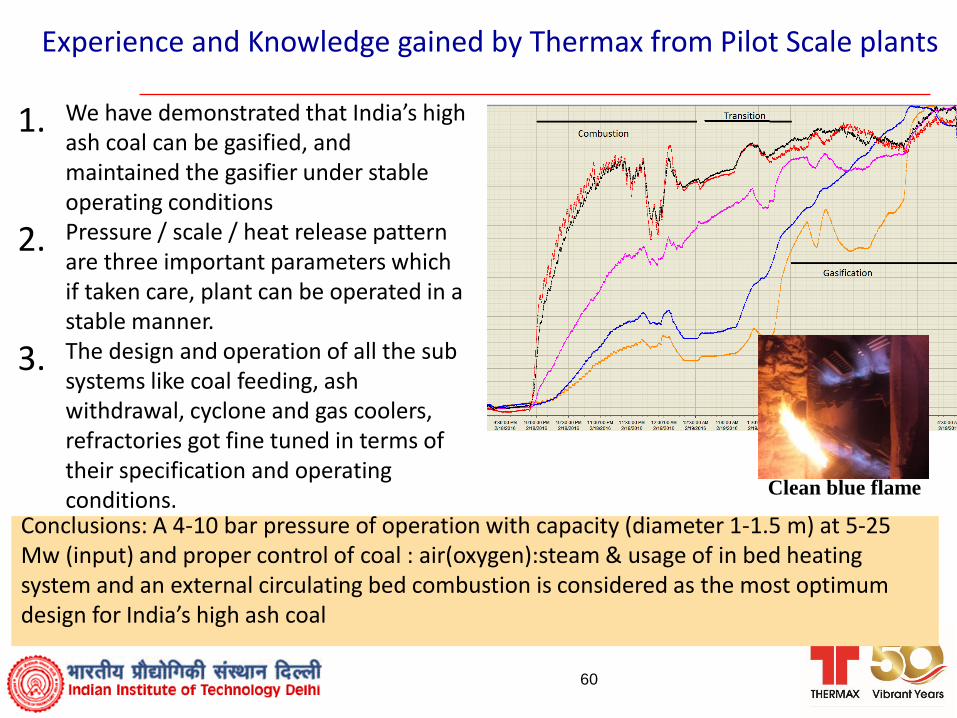
Experience and Knowledge gained by Thermax from Pilot Scale plants
1. We have demonstrated that India’s high ash coal can be gasified, and maintained the gasifier under stable operating conditions
2. Pressure / scale / heat release pattern are three important parameters which if taken care, plant can be operated in a stable manner.
3. The design and operation of all the sub systems like coal feeding, ash withdrawal, cyclone and gas coolers, refractories got fine tuned in terms of their specification and operating conditions.
Conclusions: A 4-10 bar pressure of operation with capacity (diameter 1-1.5 m) at 5-25 Mw (input) and proper control of coal : air(oxygen):steam & usage of in bed heating system and an external circulating bed combustion is considered as the most optimum design for India’s high ash coal
Clean blue flame

61
R&D elements in Thermax’s developments
Cold flow model of CFBG
HPTGA facility
GC facility for syngas and tar analysis

62
Proposed Flowsheet
Gasifier
Acid gas removal
system
Methanol
reactor
Syngas
purification
Methanol
purification

Catalysis & Reaction Engineering
63
Objectives
• To synthesize a novel catalyst for direct conversion of syn-gas toMethanol
• Establishment of evaluation methodology and selection of optimalcatalyst for syn-gas conversion to methanol in a lab scale slurryreactor
• Optimization of the operating parameters
• Developing phenomenological kinetic models based on theproduct distribution and estimating the kinetic parameters thatcan be used for scale-up
• Characterization of Indian coal (with high ash content and otherimpurities), biomass followed by bench scale gasification

Methodology: Synthesis of Novel Catalysts and Screening
65
Catalyst Synthesis: Procedure and Facilities
To fixed bed reactor for initial screening of catalysts activityTo slurry bed reactor for performance evaluation
• Preparation ofsuitableprecursor andsupport
• Suitabletransition metalor a combinationof metals (withinput from Sub-D)
Calcination and
Catalyst
Activation
X-RD, TPX, BET Surface Area Analyzer etc.• Determination of catalyst crystal structure• TPR, weak and strong acidity, surface area , Pore
volume
Other issues that need attention :
• Feed sulfur tolerance
• Interphase and intraphase heat and mass transfer resistances in
the catalyst and reactor
• Metal particle size and phase composition, support and support
texture as well as promoters are important
• Parameters that control catalyst structure and catalyst
performance in DME synthesis. For example the selectivity of
this catalyst strongly depends on nature of promoter, metal
crystallite size and pore structure as metal easily forms metal
oxides with support.
• Adjusting the parameters of catalyst synthesis, pre-treatment
and reaction conditions could minimize catalyst deactivation
and production of undesired mixed compounds.
➢The exact reaction mechanism for syngas conversion to various possible products is still not completely
understood. The catalytic structure required for sites to be active for hydrocarbon such as oxygenate formation is
not known. Both are needed in order to understand and design better catalysts for selective synthesis.
➢Development of active, selective, stable and attrition resistant catalyst formulations and a fundamental
understanding of reaction kinetics could lead to enhance reaction yield and desirable product distribution and
improved reactor design and operation. This area is still active and open for new innovation.
➢Deactivation of catalyst can be significant due to pore plugging by waxes, carbon deposition, partial oxidation,
poison and attrition. Catalyst deactivation and regeneration issues need to be addressed.
➢While much is known regarding FTS catalyst design and performance, there are nevertheless significant
improvements that could be made though a more detailed understanding of the nano-scale structure of the
catalyst, reaction mechanism and kinetics. Metal particle size and phase composition, support and support texture
as well as promoters are important parameters that control catalyst structure and catalyst performance in FT
synthesis. All these parameters need to be controlled competently in the design of efficient FT catalyst.
➢For example a higher concentration of metal active sites usually favoured the chain growth. However, the
selectivity of this catalyst strongly depends on nature of promoter, metal crystallite size and pore structure as
metal easily forms metal oxides with support.
CO + 2H2 CH3OH
CO2 + 2H2 CH3OH + H2O
2CH3OH CH3OCH3 + H2O
2CO + 4H2 CH3OCH3 + H2O
3CO2 + 6H2 CH3OCH3 + 3H2O
CO + H2O CO2 + H2
Metal
Metal + Bronsted Acidity
Bronsted Acidity
Metal + Bronsted Acidity
Metal + Bronsted Acidity
Metal
Selection of Metal & Support is Crucial as Syn
Gas to DME Process follows
different Reaction Pathways
Dominant

Scope of Work
Coal
Biomass
Syn gas CO+H
2
Feedstock
+
CO H2
CH3
OH
Cu based catalyst
Methanol
Potential ApplicationsStage-1Stage-2
Scope of Work: Catalysis, Kinetics & Reactor Design
Feed Characterization
Ref: US Department of Energy
Other Products

Catalyst selection and Synthesis of Novel Catalysts
In order to achieve maximum methanol yield catalyst should possess:• Good hydrogen activation ability• Ability to activate C-O bond of CO/CO2 molecule without breaking it• Stability against reduction and sintering under reaction conditions• Reasonably low stability of intermediate metal methoxide to avoid surface poisoning• Absence of active alumina, iron, nickel and alkali metals all resulting in side reactions
and/or decreased activity
Catalyst Synthesis: Procedure and Facilities
Preparation of suitable precursor and support via wet-impregnation or co-precipitation
Suitable addition of promoter (transition metal) or a combination of metals
Catalyst Calcination and in –situ Catalyst Activation
Selection of Metal & Support is Crucial as Syn Gas to methanol
Process follows different Reaction Pathways
Classification of methanolsynthesis catalysts
Type of active metal- Cu based- Pd based- intermetallic
Type of support- ZnO or ZnO/Al2O3
- MgO- SiO- ZrO2
Type of promoter- Alkali metals- Non-alkali metals- Non-metals- Transition metals
*Studt F. et al.,Nature chemistry,2014

Catalyst performance evaluation in Fixed and Slurry bed reactors
Catalyst Performance Studies▪ Syngas conversion and Methanol
yield maximization will be targeted▪ Effect of pressure and temperature
will be studied▪ Effect of varying feed ratio will be
analyzed▪ Comparative study between fixed
reactor vs. slurry bed reactor will be performed.
Issues that need attention :
▪ Feed sulfur tolerance and CO2 utilisation by RWGS
▪ Interphase and intraphase heat and mass transfer resistances in the catalyst and reactor
▪ Metal particle size, phase composition, support and support texture, crystallite size, pore structure
as well as promoters
▪ Adjusting the parameters of catalyst synthesis, pre-treatment and reaction conditions could
minimize catalyst deactivation and production of undesired mixed compounds

Methodology: Performance Evaluation of Synthesized Catalysts
Slurry Bed Reactor• Smaller size and improved heat transfer• Higher Conversion• Lower Feed to Recycle Ratio• Low pressure drop & Low operating cost• Make up catalysts feed provision• Lower cooling surface requirement• Process intensification via steam generation
or boiler feed water heating
Catalyst Development• Development and performance evaluation
of novel catalysts in high pressure fixedbed reactor
• Based on results, minor modificationssuch as addition of promoters can be doneto improve the catalyst activity
Why do we need a slurry bed reactor?
Catalyst Performance Studies Effect of pressure and
temperature and varying feed ratio
Comparative study between fixed reactor vs slurry bed reactor
Conversion and Methanol yield maximization will be targeted
• Characterization of Indian coal,Effect of process variables on coalgasification performance throughHPTGA
• Optimization of product selectivity inreaction through catalystmodification
• Metals /support for Methanolsynthesis reaction handling highCO/H2 Coal (Indian) based Syngascontaining impurities
• Catalyst characterization andstructure-activity relationships
• Catalyst stability and deactivationkinetics on the basis of intrinsickinetic data based on time-on-stream product distribution and cokeformation
• Investigation of kinetics of Methanol Synthesis with novel catalyst formulations
• Detailed kinetic modelling of the complex reactions occurring in the Methanol synthesis
• Catalyst stability assessment using time-on-stream investigations
Prepr. Pap.Am. Chem. Soc., Div. Fuel Chem. 2003, 48(2), 921

Hydrodynamics & Reactor Engineering (H&RE)
70

(1) Process design & scale-up– Pilot-scale gasifier and methanol reactor(s) designed using lower
order/semi-empirical models available in the literature (for kinetics, heat & mass transfer coefficients, flow approximations, etc).
– Assessment using the pilot plant measurements
– Uncertainties associated with lower order/semi-empirical process models: kinetics, flow non-idealities, heat and mass transfer coefficients for specific reactor(s), change of these parameters with respect to reactor design and operating conditions
– Trouble shooting, design modifications, development of new/intensified reactor configurations
71
H&RE: Goals
• Pilot-scale measurements • Advanced measurements on mockup unit• Development of models for trouble shooting,
performance optimization & scale-up

(2) Pilot plant measurements– Radiotracing and gamma scanning to assess flow non-idealities, RTD,
phase distributions
– To be carried on pilot units (under hot conditions) with help of BARC Mumbai
– Real life data: critical to assess the performance of pilot units and trouble shooting
(3) Advanced flow characterization– Cold flow mock-up test loop units at IIT Delhi
– Measurement of solids / liquid phase velocity distribution using Radio-active Particle Tracking (RPT)
– Local gas volume fraction and bubble size distribution measurements using conductivity/optic fiber probes, time-averaged void fraction distributions, and dynamic gas/solids/liquid holdup using Electrical Resistance Tomography (ERT) / Electrical Capacitance Tomography (ERT)
72
H&RE: Goals

– Effect of gas/liquid flow rates and solid loading on liquid phase flow field/back mixing, local gas volume fraction and bubble size distribution
– Segregation/mixing in the polydisperse fluidized beds;
– Effect of reactor internals on hydrodynamics in the case of slurry bubble column
(4) Development of experimentally validated detailed models for scale-up and performance optimization– CFD models to simulate gas-solid flows in gasifier fluidized beds, as
well as the methanol reactor (multi-fixed bed and slurry reactors)
– For scale-up of the process, to explore "what if" scenarios
– Crucial inputs for the lower order/phenomenological reactor models
73
H&RE: Goals

(5) Development of intensified reactors– Intensification of reactor performance through novel design
configurations.
– Process intensification studies on laboratory-scale through use of structured reactors/monoliths, etc.
– Promising options can be considered for scale-up of process in future, New IP
74
H&RE: Goals

Expertise & FacilitiesAdvanced Experimental facilities available @ IITD
Electrical Resistance Tomography (ERT)
g-ray densitometry/ tomography
Voidage probes
Gas volume fraction distribution using ERT and g-ray tomography
Liquid flow field using RPT
Bubble size distribution using probes
State-of-the-art invasive and non-invasive measurements facilities established & benchmarked in last 10+ years
Start-of-the-art modeling & simulation capabilities
Critical for the proposed project
Simultaneous ERT and g-ray measurements for solid volume fraction distribution
Radioactive Particle Tracking
Intensified reactors

Methodology: Performance Evaluation of Synthesized Catalysts
76
Slurry Bed Reactor• Smaller size and improved heat transfer• Higher Conversion• Lower Feed to Recycle Ratio• Low pressure drop & Low operating cost• Make up catalysts feed provision• Lower cooling surface requirement• Process intensification via steam generation
or boiler feed water heating
Catalyst Development• Development and performance evaluation
of novel catalysts in high pressure fixed bed reactor
• Based on results, minor modifications such as addition of promoters can be done to improve the catalyst activity
Performance evaluation in Slurry Bed Reactor
Catalyst Performance Studies Effect of pressure and
temperature and varying feed ratio
Comparative study between fixed reactor vs slurry bed reactor
Conversion and DME yield maximization will be targeted
• Characterization of Indian coal ,biomass and MSW
• Effect of process variables on coal/biomass/MSW gasification performance through HPTGA
• Optimization of product selectivity in reaction through catalyst modification (effect of promoter addition)
– Metals /support for DME synthesis reaction handling high CO/H2 Coal (Indian) based Syngas containing impurities
– Catalyst characterization and structure-activity relationships
– Catalyst stability and deactivation kinetics on the basis of intrinsic kinetic data based on time-on-stream product distribution and coke formation
• Investigation of kinetics of Methanol and DMESynthesis with novel catalyst formulations
• Detailed kinetic modeling of the complexreactions occurring in the Methanol and DMSsynthesis
• Catalyst stability assessment using time-on-stream investigations
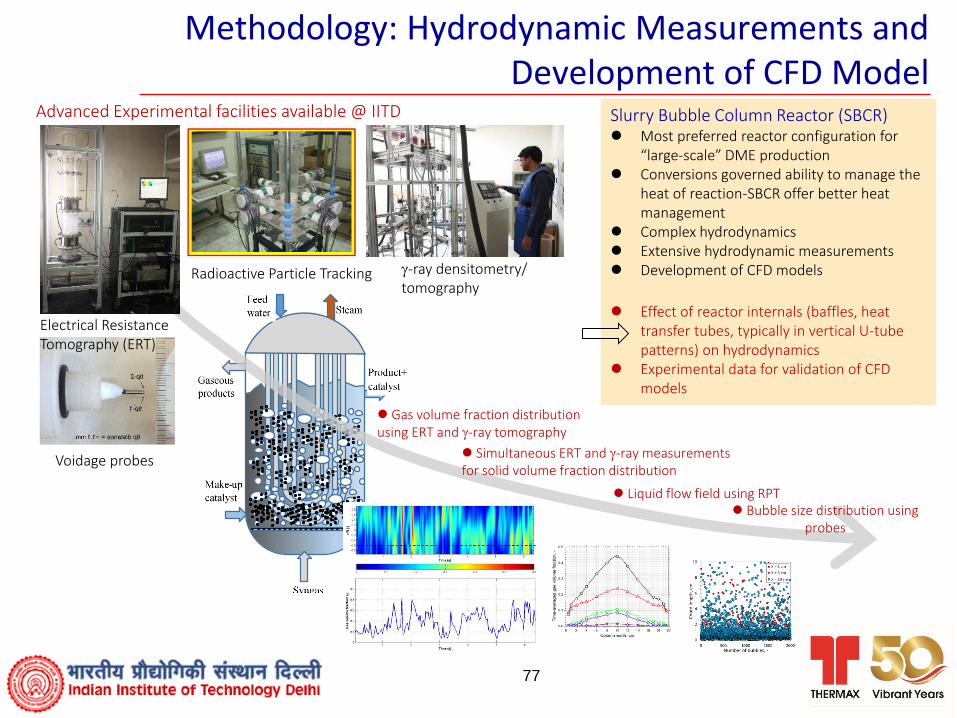
Methodology: Hydrodynamic Measurements and Development of CFD Model
Advanced Experimental facilities available @ IITD
Electrical Resistance Tomography (ERT)
g-ray densitometry/ tomography
Voidage probes
Gas volume fraction distribution using ERT and g-ray tomography
Liquid flow field using RPT Bubble size distribution using
probes
Slurry Bubble Column Reactor (SBCR) Most preferred reactor configuration for
“large-scale” DME production Conversions governed ability to manage the
heat of reaction-SBCR offer better heat management
Complex hydrodynamics Extensive hydrodynamic measurements Development of CFD models
Effect of reactor internals (baffles, heat transfer tubes, typically in vertical U-tube patterns) on hydrodynamics
Experimental data for validation of CFD models
Simultaneous ERT and g-ray measurements for solid volume fraction distribution
Radioactive Particle Tracking
77

Performance evolutions of intensified reactors Unit cell/volume approach Evaluation of alternative reactors configurations
involving monoliths and structures packings through CFD simulations
New configurations?
Methodology: Performance Evaluation of Different Reactor Configurations
Performance evaluation of conventional reactors through CFD simulations Slurry bubble columns vs. multi-tubular fixed beds Effects of feed flow rates and composition, particle size,
catalyst loading on reactor performance Local distribution of reactants/products and temperature
distribution Effect of reactor configuration and internals (multi-tubular
configurations for fixed beds and internals (baffles, heat transfer tubes) for slurry reactors
Development of experimentally validated CFD models Extensive experimental validation of hydrodynamics
under “cold flow conditions”, specifically for SBCRs Incorporation of chemistry and kinetics developed
through Sub-project B
Next phase (Pilot scale evaluations of promising reactor configurations)
78
Gas Cleanup R&D
79

• Multiple gas phase species other than H2 and CO – CO2, H2S, COS
• Particulates consist of ammonium compounds, hydrogen chloride in addition to trace metals such as Hg, Cd
• Multiple processes required for removal of contaminants– Candle filters / cyclone separators / scrubbers for particulates
– Solvent extraction / catalytic process for acid gases
– Adsorbents / catalytic processes for trace metals
• Widely different operating conditions for multiple processes
• Composition of coal will have a strong impact on the optimized process
• Desired H2:CO ratio to be obtained for optimum operation of the CH3OH production plant
80
Challenges of gas cleanup

Gas Cleanup Specification

Gas Composition Requirement for End Applications

83
Development and optimization of new technologies
• Selectivity towards various metals
• Activity at high temperatures
Reduction of trace metals using catalytically active
materials
• ZnO based catalysts
• Long term exposure studies under acidic conditions
Catalyst development for H2S removal
• Preparation of water gas shift catalysts
• Effect of sulphur
Optimization of process conditions for water gas
shift reaction
• Development of unit operation models
• Model upgradation using in-house data
Development, validation and upgradation of
process models
Process intensification studies

IN CONCLUSION
Enormous work is underway on managing Energy – Climate
change challenge. Solar + Wind alone can not meet the
energy needs of the globe. Fossil will continue to play a
major role and de carbonization of the fossil is the best way
forward.

We must learn to happily progress together or miserably perish together.
Man can live individually but can survive only collectively Atharva Veda