decadal change in the surface water salinity profile of indian
TRANSCRIPT
Research Article Open AccessOpen AccessReview Article
Marine ScienceResearch & Development
Banerjee, J Marine Sci Res Development 2013, S11http://dx.doi.org/10.4172/2155-9910.S11-002
J Marine Sci Res Development Climate Change ISSN:2155-9910 JMSRD an open access journal
*Corresponding author: Kakoli Banerjee, School of Biodiversity & Conservation of Natural Resources, Central University of Orissa, Landiguda, Koraput 764020, Odisha, India, Tel: 09439185655; E-mail: [email protected]
Received August 02, 2013; Accepted October 30, 2013; Published November 08, 2013
Citation: Banerjee K (2013) Decadal Change in the Surface Water Salinity Profile of Indian Sundarbans: A Potential Indicator of Climate Change.J Marine Sci Res Development S11: 002. doi: 10.4172/2155-9910.S11-002
Copyright: © 2012 Banerjee K. This is an open-access article distributed under the terms of the Creative Commons Attribution License, which permits unrestricted use, distribution, and reproduction in any medium, provided the original author and source are credited.
Decadal Change in the Surface Water Salinity Profile of Indian Sundarbans: A Potential Indicator of Climate ChangeKakoli Banerjee*School of Biodiversity & Conservation of Natural Resources, Central University of Orissa, Landiguda, Koraput 764020, Odisha, India
Keywords: Indian Sundarbans; Salinity; Climate change; Bay of Bengal; Farakka discharge; Deglaciation; Sea level rise
IntroductionThe Ganges delta is the largest delta and occupies the lower part of
the Bengal Basin of the South Asian region of Bengal. The delta has come into existence by the depositional activities of the three mighty rivers of the region: the Ganges, the Brahmaputra and the Meghna. The Ganges delta is situated just above the Bay of Bengal with its major portion occupied by Bangladesh. The delta is about 360 km wide along the Bay of Bengal [1]. The river courses in the delta are broad and active, carrying large amounts of water. This delta is a tract of vast alluvial flat roughly resembling the Greek letter ‘D’ (Delta) and commences at the off take of the Bhagirathi near Gour of Malda district in West Bengal, India [2]. The delta of the Ganges covers a total area of 80,000 km2 in Bangladesh and West Bengal of India [3-5]. It comprises part of the districts of Kushtia, Jessore, Khulna, Rajshahi, Pabna and Dhaka of Bangladesh and a major portion of West Bengal. As the silts are brought in by normal flow and flooding of the rivers annually, the Ganges delta is a growing delta. The air temperature is 9.3°C to 40°C; annual precipitation range is 1474 mm to 2265 mm. The dry months have an average rainfall between 20 mm to 60 mm and the average evapo-transpiration rate is 15 mm to 90 mm/month [1]. The Sundarbans is the legendary sanctuary for the famous Royal Bengal Tiger (about 500 to 600 in number). It is also called the Green delta which is also a nick name for Bangladesh. The Ganges delta is also called the Ganges-Brahmaputra River Delta. The landscapes of the deltaic region encompass strong aesthetic, cultural, biological and geological values [6]. At present, landscapes and wetlands are the most spectacular global issues for economic growth and balance ecosystems.
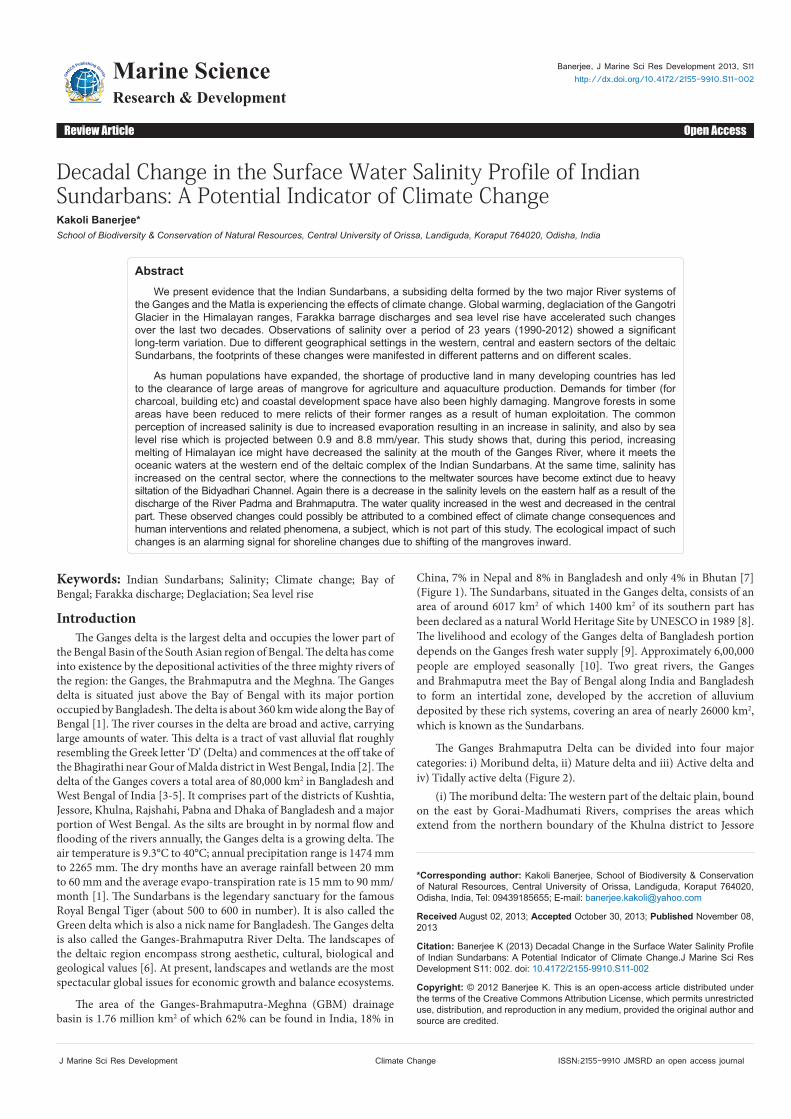
The area of the Ganges-Brahmaputra-Meghna (GBM) drainage basin is 1.76 million km2 of which 62% can be found in India, 18% in
China, 7% in Nepal and 8% in Bangladesh and only 4% in Bhutan [7] (Figure 1). The Sundarbans, situated in the Ganges delta, consists of an area of around 6017 km2 of which 1400 km2 of its southern part has been declared as a natural World Heritage Site by UNESCO in 1989 [8]. The livelihood and ecology of the Ganges delta of Bangladesh portion depends on the Ganges fresh water supply [9]. Approximately 6,00,000 people are employed seasonally [10]. Two great rivers, the Ganges and Brahmaputra meet the Bay of Bengal along India and Bangladesh to form an intertidal zone, developed by the accretion of alluvium deposited by these rich systems, covering an area of nearly 26000 km2, which is known as the Sundarbans.
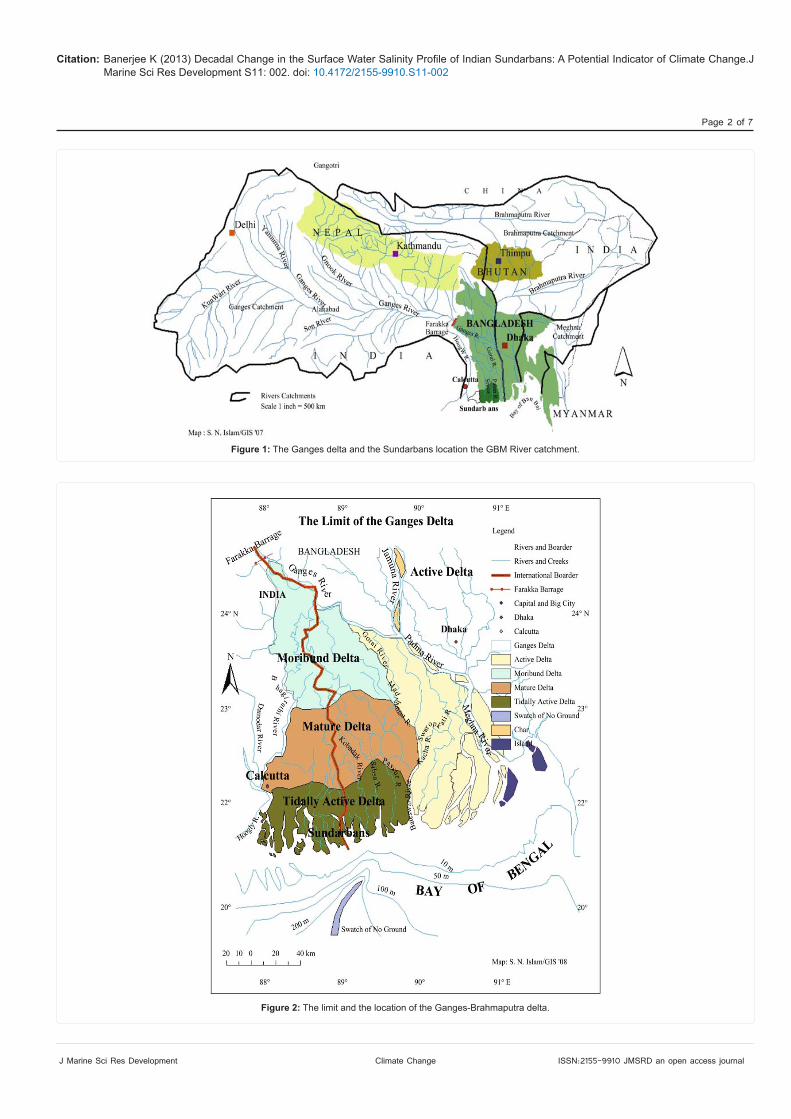
The Ganges Brahmaputra Delta can be divided into four major categories: i) Moribund delta, ii) Mature delta and iii) Active delta and iv) Tidally active delta (Figure 2).
(i) The moribund delta: The western part of the deltaic plain, bound on the east by Gorai-Madhumati Rivers, comprises the areas which extend from the northern boundary of the Khulna district to Jessore
AbstractWe present evidence that the Indian Sundarbans, a subsiding delta formed by the two major River systems of
the Ganges and the Matla is experiencing the effects of climate change. Global warming, deglaciation of the Gangotri Glacier in the Himalayan ranges, Farakka barrage discharges and sea level rise have accelerated such changes over the last two decades. Observations of salinity over a period of 23 years (1990-2012) showed a significant long-term variation. Due to different geographical settings in the western, central and eastern sectors of the deltaic Sundarbans, the footprints of these changes were manifested in different patterns and on different scales.
As human populations have expanded, the shortage of productive land in many developing countries has led to the clearance of large areas of mangrove for agriculture and aquaculture production. Demands for timber (for charcoal, building etc) and coastal development space have also been highly damaging. Mangrove forests in some areas have been reduced to mere relicts of their former ranges as a result of human exploitation. The common perception of increased salinity is due to increased evaporation resulting in an increase in salinity, and also by sea level rise which is projected between 0.9 and 8.8 mm/year. This study shows that, during this period, increasing melting of Himalayan ice might have decreased the salinity at the mouth of the Ganges River, where it meets the oceanic waters at the western end of the deltaic complex of the Indian Sundarbans. At the same time, salinity has increased on the central sector, where the connections to the meltwater sources have become extinct due to heavy siltation of the Bidyadhari Channel. Again there is a decrease in the salinity levels on the eastern half as a result of the discharge of the River Padma and Brahmaputra. The water quality increased in the west and decreased in the central part. These observed changes could possibly be attributed to a combined effect of climate change consequences and human interventions and related phenomena, a subject, which is not part of this study. The ecological impact of such changes is an alarming signal for shoreline changes due to shifting of the mangroves inward.
Citation: Banerjee K (2013) Decadal Change in the Surface Water Salinity Profile of Indian Sundarbans: A Potential Indicator of Climate Change.J Marine Sci Res Development S11: 002. doi: 10.4172/2155-9910.S11-002
Page 2 of 7
J Marine Sci Res Development Climate Change ISSN:2155-9910 JMSRD an open access journal
Figure 1: The Ganges delta and the Sundarbans location the GBM River catchment.
Figure 2: The limit and the location of the Ganges-Brahmaputra delta.
Citation: Banerjee K (2013) Decadal Change in the Surface Water Salinity Profile of Indian Sundarbans: A Potential Indicator of Climate Change.J Marine Sci Res Development S11: 002. doi: 10.4172/2155-9910.S11-002
Page 3 of 7
J Marine Sci Res Development Climate Change ISSN:2155-9910 JMSRD an open access journal
and part of Kushtia district. The area of moribund delta covers an area of about 18000 km2. The rivers of the moribund delta cannot bring down enough water and silt, even in flood and, being confined within high levees, are not in a position to inundate the entire area.
ii) The mature delta: The mature delta covers an area of about 31500 km2 in Bangladesh and in West Bengal of India. On average, it includes Murshidabad (West Bengal, India), Nadia and 24-Parganas of India and Meherpur, Kushtia, Chuadanga, Jhenaidaha, Magura, Jessore, Narial, Khulna, Sathkhira and Bagerhat districts of Bangladesh.
iii) The active delta: The eastern active delta covers an area of about 16500 km2. This part of the Ganges- Brahmaputra delta is about 300 km long in the north-south direction and about 100 km and 130 km wide in the upper and middle reaches, respectively. The eastern active Ganges-Brahmaputra delta includes Rajbari, Faridpur, Shariatpur, and Madaripur, Gopalgonj, Lakshmipur, Pirojpur, Barisal, Jhalokati, Patuakhali, Barguna and Bhola districts of the country.
iv) The tidally active delta: The southwestern part of the Ganges delta is coastal area and a tidally active delta. It is dominated by coastal tidal currents. The tidally active delta actually is the southern part of the Sundarbans region. It covers an area of about 13500 km2. The tidally active delta includes the southern part of Bagerhat, Khulna, Sathkhira district of Bangladesh and south 24 Parganas district of West Bengal in India.
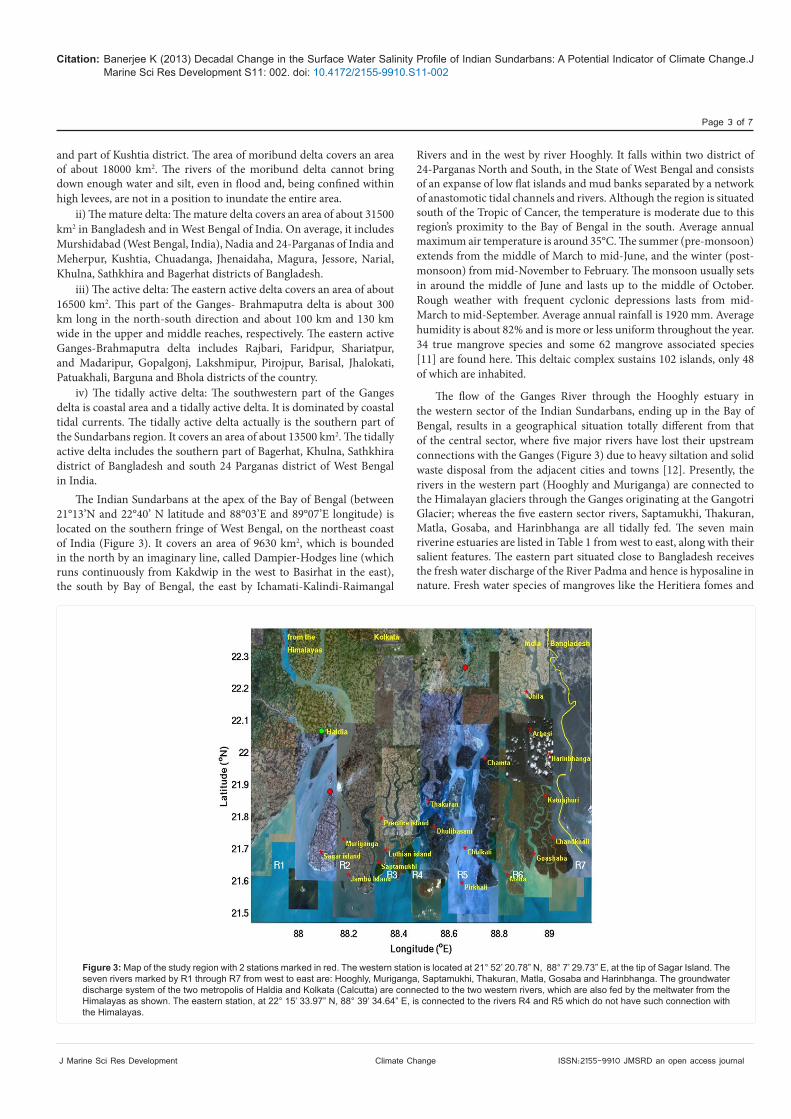
The Indian Sundarbans at the apex of the Bay of Bengal (between 21°13’N and 22°40’ N latitude and 88°03’E and 89°07’E longitude) is located on the southern fringe of West Bengal, on the northeast coast of India (Figure 3). It covers an area of 9630 km2, which is bounded in the north by an imaginary line, called Dampier-Hodges line (which runs continuously from Kakdwip in the west to Basirhat in the east), the south by Bay of Bengal, the east by Ichamati-Kalindi-Raimangal
Rivers and in the west by river Hooghly. It falls within two district of 24-Parganas North and South, in the State of West Bengal and consists of an expanse of low flat islands and mud banks separated by a network of anastomotic tidal channels and rivers. Although the region is situated south of the Tropic of Cancer, the temperature is moderate due to this region’s proximity to the Bay of Bengal in the south. Average annual maximum air temperature is around 35°C. The summer (pre-monsoon) extends from the middle of March to mid-June, and the winter (post-monsoon) from mid-November to February. The monsoon usually sets in around the middle of June and lasts up to the middle of October. Rough weather with frequent cyclonic depressions lasts from mid-March to mid-September. Average annual rainfall is 1920 mm. Average humidity is about 82% and is more or less uniform throughout the year. 34 true mangrove species and some 62 mangrove associated species [11] are found here. This deltaic complex sustains 102 islands, only 48 of which are inhabited.
The flow of the Ganges River through the Hooghly estuary in the western sector of the Indian Sundarbans, ending up in the Bay of Bengal, results in a geographical situation totally different from that of the central sector, where five major rivers have lost their upstream connections with the Ganges (Figure 3) due to heavy siltation and solid waste disposal from the adjacent cities and towns [12]. Presently, the rivers in the western part (Hooghly and Muriganga) are connected to the Himalayan glaciers through the Ganges originating at the Gangotri Glacier; whereas the five eastern sector rivers, Saptamukhi, Thakuran, Matla, Gosaba, and Harinbhanga are all tidally fed. The seven main riverine estuaries are listed in Table 1 from west to east, along with their salient features. The eastern part situated close to Bangladesh receives the fresh water discharge of the River Padma and hence is hyposaline in nature. Fresh water species of mangroves like the Heritiera fomes and
Figure 3: Map of the study region with 2 stations marked in red. The western station is located at 21° 52’ 20.78” N, 88° 7’ 29.73” E, at the tip of Sagar Island. The seven rivers marked by R1 through R7 from west to east are: Hooghly, Muriganga, Saptamukhi, Thakuran, Matla, Gosaba and Harinbhanga. The groundwater discharge system of the two metropolis of Haldia and Kolkata (Calcutta) are connected to the two western rivers, which are also fed by the meltwater from the Himalayas as shown. The eastern station, at 22° 15’ 33.97” N, 88° 39’ 34.64” E, is connected to the rivers R4 and R5 which do not have such connection with the Himalayas.
Citation: Banerjee K (2013) Decadal Change in the Surface Water Salinity Profile of Indian Sundarbans: A Potential Indicator of Climate Change.J Marine Sci Res Development S11: 002. doi: 10.4172/2155-9910.S11-002
Page 4 of 7
J Marine Sci Res Development Climate Change ISSN:2155-9910 JMSRD an open access journal
Nypa fruitcans grow luxuriantly. Hence, arbitrarily based on salinity, Sundarbans can be divided into three major sectors namely western (hyposaline), central (hypersaline) and eastern (hyposaline) region, although literally it is an undivided Sundarbans.
The effect of high tide causes the water level in the tidal rivers to rise as high as 3.65 m-4.57 m every six hours and large parts of the islands containing mangrove forest get inundated. Species like Avicennia and Ceriops, which tolerate prolonged water logging and high degree of salinity, come up naturally in such inter-tidal mud flats. The goal of this research is the contribution of a comprehensive management plan for the sustainable conservation and protection of the Sundarbans mangrove ecosystems in the Ganges delta.
Data Sources and Quality Two decades of premonsoon data (1990-2012) were compiled
from the archives of the Department of Marine Science, University of Calcutta for this study. A number of studies on different aspects of the Sunderban complex have been published over the years. A few of them which include description of the data (and methods) at different times over the past two decades [13-20]. The six main locations for collecting the data from each of the sector were Muriganga, Saptamukhi, Jambu, Lothian, Sagar, Prentice in the Hooghly estuary (western sector); Thakuran, Dhulibasani, Chulkathi, Goashaba, Matla, Pirkhali in
the Matla estuary (central sector) and Arbeshi, Jhilla, Harinbhanga, Katuajhuri, Chamta, Chandkhali (eastern sector) of the Matla estuary close to Raimangal River (Figure 3 and Table 2).
The analysis of salinity during pre-monsoon were carried out after partitioning the data into eastern, central and western sectors. For each observational station, at least three samples were collected from the surface during high tide condition within 500 meters of each other. A total of 92 months data of observations were available (spread unevenly) during the 23 years period. The collection method did not change since 1980. The surface water salinity was recorded by means of an optical refractometer (Atago, Japan) in the field and cross-checked in laboratory by employing Mohr- Knudsen method [21]. The correction factor was found out by titrating the silver nitrate solution against standard seawater (IAPO standard seawater service Charlottenlund, Slot Denmark, chlorinity 19.376%). Our method was applied to estimate the salinity of standard seawater procured from NIO and a standard deviation of 0.02% was obtained for salinity. The average accuracy for salinity (in connection to our triplicate sampling) is ± 0.28 psu.
Climate Change and its Effect on SundarbansThe Intergovernmental Panel on Climate Change (IPCC) projected
that the state of tropical forest ecosystems is likely to get worse due to climate change. Bangladesh and India being in the tropical region, different physical effects of climate change including increased temperature and precipitation, increased salinity and extreme weather events such as floods, cyclones and droughts will have profound negative impacts on its forests. The Sundarbans is already affected by climate change, importantly from increasing salinity and extreme weather events like tropical cyclones. Some researchers predict that top dying of Sundari trees is likely to be the consequence of slow increase of salinity over a long period of time. Salinity increase also affects the species combination and regular succession patterns in the Sundarbans as some non-woody shrubs and bushes replace the tree species, reducing the forest productivity and habitat quality for valuable wildlife. World Wide Fund for Nature (WWF) estimates that due to sea level rise, nearly 7500 hectares of mangrove forest in the Sundarbans is projected to be flooded. Many studies have shown that tropical cyclones destroy the mangrove forests to a large extent. For instance, in the recent past, cyclone Sidr has destroyed one-third of the Sundarbans.
Ganges Barrage: The most demanding option
The Ganges Barrage Project has been optioned to harness water of the Ganges River and to divert it to the Gorai River during dry seasons. This project has been conceived for tackling the adverse effects of the Farakka Barrage in India on the Ganges basin area within Bangladesh, particularly for augmenting environmental flow of the Gorai River. The people of the southern region, especially farmers and fishermen who are directly affected by less water in the rivers in dry seasons, have also been demanding the barrage for a long time. The conception of the Ganges Barrage Project dates back to 1957; the erstwhile Pakistani regime took an initiative to build a barrage on the Ganges River, three kilometers downstream of the Hardinge Bridge, after India had started constructing the Farakka Barrage. Presently the Pangsha-Sujanagar point of Rajbari and Pabna districts is being considered for the barrage, instead of the previous one near the Hardinge Bridge (Figure 1).
Surface water salinity: A clear signature of climate change
Salinity in the Sundarbans is highly dependent on the volume of freshwater coming from the upstream. The variation is subject to the Table 1: Seven most important rivers in the Indian Sundarbans.
Estuary Description
Hooghly (R1)
➢ It forms the western border of Indian Sundarbans.➢ It is the main river of West Bengal and is a direct continuation of the River Ganges.➢ Most of the coastal industries of West Bengal are concentrated along the western bank of this river.
Muriganga(R2)
➢ It is a branch of the Hooghly River.➢ It flows along the east of Sagar Island, the largest island in the deltaic complex.➢ Unique mangrove vegetation is found along its bank.
Saptamukhi(R3)
➢ It has its origin at Sultanpur.➢ It is connected with the Muriganga (Bartala) branch of the Hooghly River through the Hatania-Duania canal.
Thakuran(R4)
➢ It begins near Jayanagar in 24 Parganas (South) and has a number of connections with the Saptamukhi.➢ It was connected in the earlier times with the Calcutta Canal through the Kultali and the Piyali Rivers, which exist today in a dying state.
Matla(R5)
➢ This river originates at the confluence of Bidyadhari, Khuratya and the Rampur Khal close to the town of Canning in 24 Parganas (South).➢ Matla is connected to Bidya and ultimately flows to the Bay of Bengal. The fresh water connection and discharge to this river has been lost in recent times.➢ Salinity of the river water is relatively high (in comparison to Hooghly or Muriganga) owing to freshwater cut-off from the upstream region.
Bidyadhari*
➢ This was a flourishing branch of the Bhagirathi during the 15th and 16th centuries, but now serves only as a sewage and excess rainwater outlet from the city of Kolkata.➢ The river bed is completely silted and presently is almost in dying condition.
Gosaba(R6)
➢ The waters of Matla and Harinbhanga (Raimangal) through a large number of canals form the estuary.➢ The estuary and its numerous creeks flow through the reserve forests.
Harin-bhanga(R7)
➢ It is the extreme easternmost river in the Indian Sundarbans deltaic complex.➢ The Harinbhanga (also known as Ichamati and Raimangal) forms a natural demarcation between India and Bangladesh.
* Presently a dying estuary and not considered within the seven major types

Citation: Banerjee K (2013) Decadal Change in the Surface Water Salinity Profile of Indian Sundarbans: A Potential Indicator of Climate Change.J Marine Sci Res Development S11: 002. doi: 10.4172/2155-9910.S11-002
Page 5 of 7
J Marine Sci Res Development Climate Change ISSN:2155-9910 JMSRD an open access journal
nature of tide in the area. Annual pattern of salinity changes inside the Sundarbans is also related with the changes of freshwater flow from upstream rivers. The peak salinity was found to be about 26 psu in 2001 and 2002 and the minimum salinity during post monsoon was found to be about 5 psu [22]. Salinity in eastern boundary areas of Bangladesh is influenced by the Baleswar River; salinity in this part is almost zero throughout the monsoon. Salinity at northern and north central parts is also influenced by fresh water flow of the Pasur River which is originated from the Gorai River. Salinity remains almost zero during monsoon due to large discharge of the Sibsa River and starts to increase steadily from the post monsoon period. Salinity in the southern part of the Bay remains less than 5 psu during monsoon and starts to increase at a steady rate up to about 15 psu during the dry season [22]. Salinity in the western part is not reduced to low salinity range even during monsoon periods; salinity increases at a steady rate during dry periods.
The adverse effects of increased salinity on the ecosystem of the Sundarbans are manifested in the dying of tops of Sundari trees, retrogression of forest types, slow forest growth, and reduced productivity of forest sites [23,24] found that the discharge requirement in the Gorai River, in order to keep salinity level below 5.02×10⁸ psu in April, is about 240 m3/sec, and about 25 m3/s in each of its four main distributary rivers to the west is required to push back the saline front of South-West region.
Soil Quality in the SundarbansThe electrical conductivity of soil increases spatially from east to
west of the Sundarbans. It is in conformity with the salinity of the river waters. In maximum area, the soil at 10 cm depth has slightly higher electrical conductivity than that of surface soil as found by IWM [22]. The range of electrical conductivity of top soil was found to be 0.293 mS/cm to 4.58 mS/cm, with the highest values recorded in dry seasons. Soil salinity decreases to the lowest in post monsoon in both surface and bottom soils. The electrical conductivity of the soils in the forest land is quite high in comparison to the nearby cultivable land inside the polders. Because of increased rainfall in some periods of monsoon, water runoff rate on the forest floor has increased in recent years. As a result, rapid soil erosion now causes nutrient leaching and destroys micro-organism and reduces overall site quality for better forest growth in the previously dense forests.
Sea level rise in the Sundarbans
Sea level rise poses a major threat to mangrove ecosystems through sediment erosion, inundation stress and increased salinity at landward zones. These problems will be exacerbated for mangrove stands that are subjected to ‘coastal squeeze’, i.e., where landward migration is restricted by topography or human developments. Increased air temperatures and atmospheric CO2 concentrations are also likely to increase mangrove productivity, change phenological patterns, and expand the ranges of mangrove forests into higher latitudes. Global warming might impact
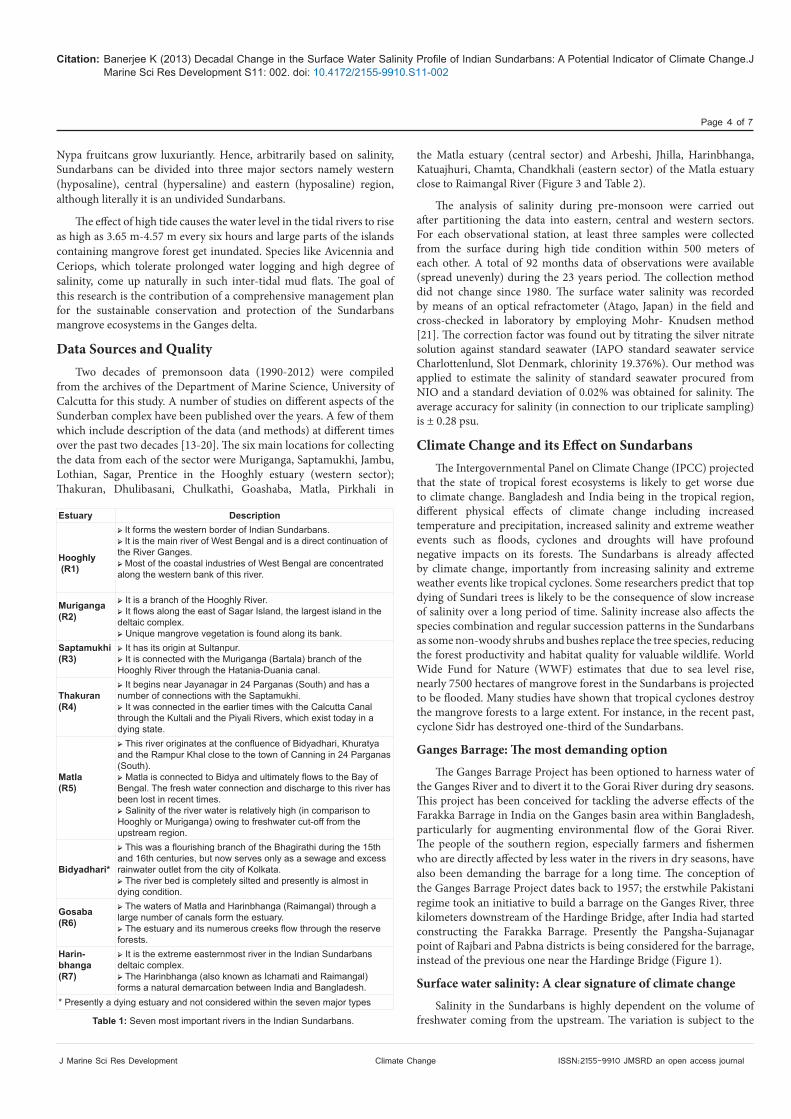
the salinity of oceanic waters in two very different ways. First, in the open ocean, rising temperature would lead to increased evaporation, which in turn would result in increased salinity. In contrast, the salinity of surface water in bays, estuaries and coastal waters is a function of freshwater input from glaciers, precipitation and subsequent runoff, and intrusion of sea water. That the phenomenon of global warming melts glaciers, brings more rain, and transfers more fresh water into estuaries, coasts and bays is a generalization that does not hold uniformly in all the segments of the Indian Sundarbans. The western and eastern stations showed a significant and continuous decrease in salinity (~2.0 psu/decade and ~1.7 psu/decade respectively) whereas the central eastern sector showed an increase in salt (~1.3 psu over 23 years) (Figure 4). This difference in the rate of change of salinity in the three different sectors is due to the difference between their geographical settings as explained below.
The rivers in the western sector of the Indian Sundarbans (Hooghly and Muriganga), being continuations of the River Ganges, receives the snow melt water of the Himalayas. The Himalayan glaciers, popularly called “the lifelines of major Indian rivers”, have entered into the phase of deglaciation on account of global warming. The 30.2 km-long Gangotri Glacier is receding rapidly: the rate of retreat over the last three decades has been found to be more than three times the rate during the previous 200 years or so. The average rate of recession has been evaluated by comparing the snout positions on the 1985 topo-sheet map and the satellite panchromatic satellite imagery; the results reflect an average recession for this period of about 23 m/yr [25-27]. This alteration of a glacial system is in alignment with the present situation in the Asian sub-continent as it has been determined that the number of retreating glaciers have risen from 90% in the 1980s to 95% in the 1990s and up to 2004. Thus, the observed long-term salinity decrease over the western sector is best attributed to the rapid recession of ice from the Himalayas.
According to multiple reports by the Working Group on Himalayan Glaciology (WGHG) of the International Commission for Snow and Ice (ICSI) and the World Wide Fund for Nature report, 67% of the Himalayan glaciers are receding rapidly, and by the year 2035 there is a high likelihood that these glaciers will disappear, causing widespread water shortage among a third of the world’s population [28].
On the other hand, for the central sector, the increase of 1.3 psu over two decades in salinity (~2.8 psu/decade), is much higher than that documented for the average in the Indian Ocean (0.01-0.02 psu/decade) [29]. In a separate study [30], found that the increase in salinity over the last 40 years in tropical Atlantic was on the order of 0.4-0.5 psu. This is a rate of 0.125 psu per decade, which is an order of magnitude less than that observed in the study area. Furthermore, most of the salinity increase (2.8 psu/decade) happened during the last 13 years (Figure 4). This increase may be due to the clogging of the connections of the estuaries with the main channel of the Ganges [12] on account of heavy siltation and solid waste disposal from the city of Kolkata. Thus,
Table 2: Location of the sampling stations.
WESTERN Muriganga Saptamukhi Jambu island Lothian island Sagar island Prentice88008/53.55// 88023/47.18// 88010/ 22.76// 88020/ 29.32// 88002/ 0.97// 88017/10.04//21038/25.86// 21036/02.49// 21035/42.03// 21038/21.20// 21038/51.55// 21042/40.97//
CENTRAL Thakuran Dhulibasani Chulkathi Goashaba Matla Pirkhali88033/21.57// 88033/48.20// 88034/10.31// 88046/41.44// 88044/08.74// 88034/10.31//21049/43.17// 21047/06.62// 21041/53.62// 21043/50.64// 21053/15.30// 21041/53.62//
EASTERN Arbesi Jhilla Harinbhanga Khatuajhuri Chamta Chandkhali89001/09.04// 88057/57.07// 88059/33.3124// 89001/05.3133// 88057/11.40// 89000/44.68//22011/43.14// 22009/51.53// 21057/17.85// 22003/06.6255// 21053/18.56// 21051/13.59//

Citation: Banerjee K (2013) Decadal Change in the Surface Water Salinity Profile of Indian Sundarbans: A Potential Indicator of Climate Change.J Marine Sci Res Development S11: 002. doi: 10.4172/2155-9910.S11-002
Page 6 of 7
J Marine Sci Res Development Climate Change ISSN:2155-9910 JMSRD an open access journal
the footprint of global warming is felt through rising temperature and increased salinity in the river mouths due to intrusion of saline water via tides from the adjacent Bay of Bengal region. The eastern region which has shown a decrease in salinity levels (1.71 psu/decade) is due to the influx of the large discharges of the Padma river from Bangladesh (Figure 4). This has contributed to the decrease in salinity in this sector.
The observed trends in the salinity are also interesting from two other perspectives. First, the salinity decreased by almost 2.65 psu for pre-monsoon over the 23 years in the west, in contrast to the central sector. In the east, the salinity during premonsoon held steady or minimally decreased; whereas there is an increase in the past fifteen years mostly during pre-monsoon times in the central sector. This increase is probably due to huge siltation and slow dying of Bidyadhari River since the 16th Century that was once a conveyor belt for fresh water from the Himalayas to the eastern Indian Sundarbans [12].
Second, the melting of ice has increased in the Himalayan range [13,14,31] which added freshwater and thereby decreased the salinity of the western Sundarbans by almost 2.65 psu over 23 years. This leads us to conclude that the accumulated effect of melt waters over 23 years in the Ganges delta is almost equivalent to one annual monsoon precipitation over this region. Note also that the western sector is also affected by intentional increase of freshwater in river Hooghly to maintain safe level for ship draft, however its contribution to the observed decrease need to be evaluated.
A recent study [19] showed that surface water temperature has been rising at the rate of 0.5ºC per decade over the past three decades in the Sundarbans, eight times the rate of global warming rate of 0.06ºC per decade that makes the Sundarbans one of the worst climate change hotspots on the globe. The study found a change of 1.5 degree Celsius from 1980 to 2007 indicating a clear challenge to the survival of flora and fauna in this forest.
The study also looked into the variations in dissolved oxygen, pH level, transparency and water quality in order to determine the impact of global warming on the ecosystem of the Sundarbans. Global warming will accelerate the process of erosion in coastal and estuarine zones either through increased summer flow from the glaciers or by increased tide penetration due to sea level rise. Erosion and sedimentation processes, along with subsequent churning action, increase the saturation of suspended solids, thus decreasing the transparency. The reduced transparency affects the growth and survival of phytoplankton, the small microscopic plants in the oceans that produce three-fourths
of the earth’s oxygen supply. With the increase in the salinity, damage to this community may adversely affect the food chain in this mangrove-dominated deltaic complex, which is the nursery and breeding ground of aquatic lives. The study has documented an increase in the marine species in the central sector of Indian Sundarbans, which is a clear signature of increased salinity either due to sea level rise or intrusion of tidal water from the Bay of Bengal.
ConclusionsThe increased flushing of the Hooghly, allowed by the construction
of the Farakka Barrage, has brought about a considerable increase in the freshwater supply in the Hooghly estuary. This has, of course, affected the entire river ecology, particularly its fishery resources, fishing patterns and fish production. According to a study done by the Central Inland Capture Fisheries Research Institute in West Bengal, the freshwater zone of the river “now extends to the mouth of the estuary”, the true estuarine zone “has moved seaward”, and the marine zone has “now been restricted to the area near the mouth of the estuary”. According to the study, these changes has led to a sharp decline in marine and neritic fish species in the upper estuary, but a marked increase in the fish Tenualosa ilisha (which migrate from the sea to freshwaters to spawn), as well as a doubling of average annual fish landings from the estuary as a whole. It is now established that sufficient freshwater flow from upstream through the South-Western region must be ensured for maintaining the ecosystem of the Sundarbans.
Mangroves are the most essential bounties in nature contributing to the sustenance of life on earth. The largest mangrove forest Sundarbans is therefore contributing to the sustenance as well as safety of living beings in major part of India. Unscrupulous human interventions are the major threat to nature. Similarly climate change: the fallout of exaggerated interventions in the name of development is horrifying the nature, including the Sundarbans. Flowing water in the rivers, canals etc through and around the Sundarbans flush out saline water intrusion from the sea. Increase in salinity intrusion due to anticipated sea level rise is one of the major threats to the Sundari trees, which are already under threat due to increased salinity levels.
Finally we list a few of our core findings:
• The waters of the western rivers (Hooghly and Muriganga) are fresher now than in the 80s and 90s, probably, primarily due to the increased amount of meltwater from the Gangotri Glacier which is receding at the rate of 23 m/yr.
• The waters in the central sector of the Indian Sundarbans show increasing salination due to siltation, mixing with ocean water and possible global warming led evaporation, while being deprived of the meltwater.
• The variations of salinity show a shift in behavior around the mid-1990s in the eastern sector. The trends in the later years are more significant than those in the previous 15 years.
• Additional factors than climatic effects should be considered for a full quantitative study. Reduction of salinity in the western sector could be a combination of meltwater and human intervention (forced discharge of freshwater). Increase in salinity to the central could be combination of lack of freshwater and tidal water supply. Again lowering of salinity in the east due to receiving flow of Padma River from Bangladesh.
• Finally, while observed changes could result from a combination of climate change and human interventions and related
y = -0.2131x + 26.818R 2 = 0.862
y = 0.1203x + 27.846R 2 = 0.8568
y = -0.1467x + 27.205R 2 = 0.7155
10
15
20
25
30
35
1989
1990
1991
1992
1993
1994
1995
1996
1997
1998
1999
2000
2001
2002
2003
2004
2005
2006
2007
2008
2009
2010
2011
2012
Salin
ity (P
SU)
Wes tern
C entral
E as tern
Figure 4: Trendline showing the increasing salinity in the central sector and decreasing salinity in the western and eastern sectors of Indian Sundarbans.

Citation: Banerjee K (2013) Decadal Change in the Surface Water Salinity Profile of Indian Sundarbans: A Potential Indicator of Climate Change.J Marine Sci Res Development S11: 002. doi: 10.4172/2155-9910.S11-002
Page 7 of 7
J Marine Sci Res Development Climate Change ISSN:2155-9910 JMSRD an open access journal
phenomena; however the changes are real and their impact will be felt in the ecosystem in the coming years.
• Intrusion of marine phytoplankton species also indicates the increased salinity profile in the central Sundarabans.
Acknowledgement
All the data were collected by scientists at the Marine Science Department at Calcutta University at various times. We are grateful to the faculty of the Department of Marine Science for helping us collect and assemble the data. We thank the many members of WWF, Calcutta Port Trust, IUCN and SMAST who have helped during the collection and water analysis phase.
References
1. Islam SN, Gnauck A (2008) Mangrove wetland ecosystem in Ganges-Brahmaputra delta in Bangladesh. Front Earth Sci China 2: 439-448.
2. Rob MA (1998) Changing morphology of the coastal region of Ganges Delta. Oriental Geographer 41: 49-64.
3. Bagchi KG (1944) The Ganges Delta. Calcutta: Calcutta University Press 1-25.
4. Coleman JM (1974) Deltaic Evolution, the Encyclopedia of Geomorphology. In: Fairbridge RW (ed.,), New York, USA 252-255.
5. Seidensticker J (1983) The Sundarbans Wildlife Management Plan, Conservation in the Bangladesh Coastal Zone. IUCN, Gland, Switzerland 1-20.
6. Zube EH (1986) Landscape values: History, Concepts and Applications. In: Smardon P, and Felleman (eds.,). Foundations for visual project analysis. New York: John Wilay & Sons, USA, 4-19.
7. Elahi KM, Das SC, Sultana S, et al (1998) Geography of coastal environment: a study of selected Issues: In: Bayes A, Mahammad A, Bangladesh at 25, an analytical discourse on development Dhaka: Geography of Coastal The University press limited 336-368.
8. Islam SN (2003) Sustainable Eco-tourism as a Practical Site Management Policy. Dhaka: AH Development Publishing House 34-47.
9. Hasna JM (1995) Women for Water Partnership. Dhaka: Academic Publishers 1-136.
10. (1988) UN ESCAP-United Nations/Economic and Social Cooperation for Asia and the Pacific Coastal environmental management plan for Bangladesh. UNESCAP, Bangkok, Thailand 2-25.
11. Mitra A (2000) The north-west coast of the Bay of Bengal and deltaic Sundarbans, In Seas at the Millennium: An Environmental Evaluation UK, Vol. II, 2000 160.
12. Chakrabarti PS (1998) Changing courses of Ganga, Ganga-Padma River System, West Bengal, India-RS data usage in user orientation, River Behavior and Control, Journal of River Research Institute, Ganges River at Hardinge Bridge and Gorai River at Gorai Railway Bridge, Dhaka.
13. Mitra A, Choudhury A, Yusuf Ali Zamaddar (1992) Effects of heavy metals on benthic molluscan communities in Hooghly estuary. Proceedings of the Zoological Society 45: 481-496.
14. Mitra A, Choudhury A (1994) Dissolved trace metals in surface waters around Sagar Island, India. Journal of Eco-biology 6: 135-139.
15. Saha SB, Mitra A, Bhattacharyya SB, Choudhury A (1999) Heavy metal pollution in Jagannath canal, an important tidal water body of the north Sundarbans aquatic ecosystem of West Bengal. Indian Journal of Environmental Protection 19: 801-804.
16. Banerjee K, Mitra A, Bhattacharyya DP, Choudhury A (2002) Role of nutrients on phytoplankton diversity in the North east coast of the Bay of Bengal. In: Ecology and Ethology of Aquatic Biota (Editor Arvind Kumar), Daya Publishing House, Chapter 6, 102-109.
17. Banerjee K, Mitra A, Bhattacharyya DP (2003) Phytopigment level of the aquatic sub-system of Indian Sundarbans at the apex of Bay of Bengal. Sea Explorers 6: 39-46.
18. Mukhopadhyay SK, Biswas H, De TK, Jana TK (2006) Fluxes of nutrients from the tropical River Hooghly at the land-ocean boundary of Sundarbans, NE Coast of Bay of Bengal, India. J Marine Sys 62: 9-21.
19. Mitra A, Banerjee K, Sengupta K, Gangopadhyay A (2009) Pulse of climate change in Indian Sundarbans: A myth or reality. National Academy of Science Letter 32: 19-25.
20. Raha A, Das S, Banerjee K, Mitra A (2012) Climate change impacts on Indian Sunderbans: a time series analysis (1924-2008). Biodiversity and Conservation 21: 1289-1307.
21. Strickland JDH, Parsons TR (1972) A Practical Handbook of Seawater Analysis. Fisheries Research Board of Canada Bulletin 310.
22. (2003) Sundarban Biodiversity Conservation Project. Surface Water Modeling Final Report. Dhaka Bangladesh.
23. (1986) Master Plan Organization (MPO): National Water Plan, MPO, Ministry of Irrigation, Water Development and Flood Control, Dhaka.
24. Mirza MQ, Warrick RA, Ericksen NJ, Kenny GJ (1998) Trends and persistence in precipitation in the Ganges, Brahmaputra and Meghna river basins. Hydrol Sci J 43: 845-858.
25. Hasnain SI (1999) Himalayan Glaciers: Hydrology and Hydrochemistry. Allied Publ Ltd 234.
26. Hasnain SI (2000) Status of the Glacier Research in the HKH region, ICIMOD, Kathmandu, Nepal.
27. Hasnain SI (2002) Himalayan glaciers meltdown: impact on South Asian Rivers. IAHS Pub No 274: 417-423.
28. (1999) New Scientist “Flooded Out: Retreating glaciers spell disaster for valley communities”, 18.
29. (2013) Climate Change: The Physical Science Basis. IPCC.
30. Curry R, Dickson B, Yashayaev I (2003) A change in the freshwater balance of the Atlantic Ocean over the past four decades. Nature 426: 826-829.
31. Mitra A, Ghosh PB, Choudhury A (1987) A marine bivalve Crassostrea cucullata can be used as an indicator species of marine pollution. Proceedings of National Seminar on Estuarine Management 177-180.
Submit your next manuscript and get advantages of OMICS Group submissionsUnique features:
• User friendly/feasible website-translation of your paper to 50 world’s leading languages• Audio Version of published paper• Digital articles to share and explore
Special features:
• 300 Open Access Journals• 25,000 editorial team• 21 days rapid review process• Quality and quick editorial, review and publication processing• Indexing at PubMed (partial), Scopus, EBSCO, Index Copernicus and Google Scholar etc• Sharing Option: Social Networking Enabled• Authors, Reviewers and Editors rewarded with online Scientific Credits• Better discount for your subsequent articles
Submit your manuscript at: www.editorialmanager.com/environsci
Citation: Banerjee K (2013) Decadal Change in the Surface Water Salinity Profile of Indian Sundarbans: A Potential Indicator of Climate Change.J Marine Sci Res Development S11: 002. doi: 10.4172/2155-9910.S11-002
This article was originally published in a special issue, Climate Change handled by Editor(s), Dr. Abhijit Mitra, University of Calcutta, India.