dec 2015 - phillipcapitalbackoffice.phillipcapital.in/backoffice/...dec_2015_20151222181803.pdf ·...
TRANSCRIPT

3GROUND VIEW GROUND VIEW Annual Edition 2016 Annual Edition 20162
1st Nov 2015 Issue 7
VOL 2 . ISSUE 8 . 1ST - 31ST DEC 2015
Vineet Bhatnagar- Managing Director and CEO
EDITORIAL BOARDNaveen Kulkarni, Manish Agarwalla, Kinshuk Bharti Tiwari
COVER & MAGAZINE DESIGN Chaitanya Modak, www.inhousedesign.co.in
EDITORRoshan Sony
RESEARCH
Portfolio StrategyAnindya Bhowmik
Technicals Subodh Gupta
Production Manager Ganesh Deorukhkar
Database Manager Deepak Agrawal
Sr. Manager – Equities Support Rosie Ferns
FOR EDITORIAL QUERIES:
PhillipCapital (India) Private Limited No. 1, 18th Floor, Urmi Estate, 95 Ganpatrao Kadam Marg, Lower Parel West, Mumbai 400 013
SALES & DISTRIBUTION Ashvin Patil, Shubhangi Agrawal, Kishor Binwal, Sidharth Agrawal, Bhavin Shah, Varun Kumar, Narayan Mulchandani
CORPORATE COMMUNICATIONS Zarine Damania
Ground View - Previous Issues
1st June 2015 Issue 4
1st Oct 2015 Issue 6
1st July 2015 Issue 5
1st Apr 2015 Issue 3 1st Feb 2015 Issue 2
Banking, NBFCs Manish Agarwalla, Pradeep Agrawal, Paresh Jain
Consumer, Media, Telecom Naveen Kulkarni, Jubil Jain, Manoj Behera
Cement Vaibhav Agarwal
Economics Anjali Verma
Engineering, Capital Goods Jonas Bhutta, Hrishikesh Bhagat
Infrastructure & IT Services Vibhor Singhal, Deepan Kapadia
Logistics, Transportation & Midcap Vikram Suryavanshi
Midcap Amol Rao
Metals & Automobiles Dhawal Doshi, Nitesh Sharma, Yash Doshi
Agri Inputs Gauri Anand
Oil & Gas Sabri Hazarika
Pharmaceuticals Surya Patra, Mehul Sheth

3GROUND VIEW GROUND VIEW Annual Edition 2016 Annual Edition 20162
From the MD
The road is life...Once again, it is time to reflect on the year that has gone by and also the time to
look forward to the New Year with many aspirations and a few apprehensions. The
second Annual Ground View edition peers into ideas, themes and events that will
shape Indian business landscape over the next twelve months.
This year’s edition is very special for a number of reasons. The most important is
that this GV is as experiential an account of India as it can become, especially in an
environment of hearsay. “The road is life,” said Jack Kerouac in his genre defining
work “On the Road” when he described his incessant cross-country travels across
the US, which ended up inspiring an entire nation. Our analysts have been living
out of suitcases for the last two months and have travelled more than 25,000km
across India, covering 15 states that contribute 75% of India’s GDP – all in an en-
deavour to provide a detailed account of what is actually happening on the ground
in India and its ramifications in the year ahead.
The issue presents 14 Ground View stories (themes) across sectors ranging from
agriculture to technology, which our team believes will shape the country’s fortunes
in 2016. We went to the unexplored northeast to understand the nuances of the
cement sector and to evaluate the seriousness of the government’s initiatives to
build that region. Exploring southern India gave us a glimpse of the vagaries of
the evolving consumption trends; not just the predilection of people, but also their
decision-making process in buying gold. In UP, which is fashioning itself as India’s
new growth engine, we were pleasantly surprised to see the concerted efforts of
both central and state governments to develop infrastructure and the rising con-
sumerism in that state. Western India presented mixed trends across agriculture,
consumption, and the rising divide in rural and urban consumption.
Our cover story, India in 2016: Repairs done, now testing growth engines, penned
by analysts Naveen Kulkarni and Anindya Bhowmik is inspired from the various
sector ground views and it is a take on the structural changes in India, which are in
stark contrast to the short-termism of the markets. While this short-termism is not
a menace in itself as it aids price discovery, structural changes take time to deliver
results. I have no doubt that 2016 will be better than 2015 because we are on the
right path and it is only a matter of time when palpable results will be seen.
It has been very satisfying for our team to provide ground-breaking research
through our “Ground View” magazine and I hope that this special edition will help
you to strategize your portfolios.
Wishing everybody a Merry Christmas and a very happy New Year!
Happy investing !
Vineet Bhatnagar
5GROUND VIEW GROUND VIEW Annual Edition 2016 Annual Edition 20164
49. Model Village Jayapur: Joys of adoption By Naveen Kulkarni & Nitesh Sharma
52. AGRICULTURE: Switching crops- Desperate measures needed By Gauri Anand
58. BFSI: Changing trends By Manish Agarwalla, Pradeep Agrawal, Paresh Jain & Deepak Agarwal
64. CEMENT: North-East India- Building the last frontier By Vaibhav Agarwal
7. Cover story: India 2016: Repairs done, now testing growth engines By Naveen Kulkarni & Anindya Bhowmik
27. Case for Indian Equities By Varun Kumar
29. 2015 - Year in charts By Anindya Bhowmik
35: AUTOMOBILES: Price Elasticity and premiumisation co-exist By Dhawal Doshi and Nitesh Sharma
CONTENTS

5GROUND VIEW GROUND VIEW Annual Edition 2016 Annual Edition 20164
120. Specialty Chemicals conference takeaways: By Surya Patra
123. DIVERSIFIED: Mangalore - The Serene Outlier By Amol Rao
129. Innovations: The value of innova-tion:Few examples from India Inc. By Varun Kumar
131. Warren Buffett’s Not so well known skill By Varun Kumar
132. INDIAN ECONOMY – Trend Indicators
134. PHILLIPCAPITAL INDIA COVERAGE UNIVERSE: Valuation Summary
2016EVENTS
98. E-COMMERCE:
The dawn of financial disci-pline in a sunrise sectorBy Manoj Behera
102. CALENDER
103. INFRA-STRUCTURE: Booming Infra-structure in the state of UP
By Vibhor Singhal
110. POWER: UDAY – a new dawn for discoms? By Jonas Bhutta & Hrishikesh Bhagat
88. CONSUMER: The Great Indian Consumer – Feeling the pinch By Naveen Kulkarni & Jubil Jain
CONTENTS

7GROUND VIEW GROUND VIEW Annual Edition 2016 Annual Edition 20166
BY NAVEEN KULKARNI & ANINDYA BHOWMIK
Structural improvements take time to deliver results, but they deliver sustainable growth and take a lot more courage to implement. Even though the PM has not been able to run the government with as much panache as he showed in his election campaign, India has managed to dart back onto a clear recovery path and achieve a healthy growth rate. 2016 will be better than 2015, even with a marginally better GDP growth. Quality of growth will be superior with rising government capital expenditure, stronger discretionary consumption, and green shoots in private investment. A slew of significant reforms have been announced and are in various stages of implementation – GST, Uday, FDI liberalisation, easing of norms for infra developers, and better ease of doing business. While political noise seems to be taking away the focus from core-development issues, it is only a short-term phenomenon, not a permanent dampener. With an agenda of radical centrism, India is better placed to deliver growth – not just vs. emerging economies, but even vs. developed ones. In a global environment marked by stagnant wages and low nominal GDP growth rate, populist quick fixes of a tax cut here, some hike there will only have ephemeral results. On the other hand, with the right brand of politics, India is steaming ahead and will start becoming visible in 2016. PM Modi’s ‘Make in India’ program aims to position India as an alternate destination to China. India saw higher FDI flows in 2015 and this is likely to accelerate. The year will be a good time for stock picking with attractive valuations, especially in core sectors and ones with medium capitalisation. Strong themes this year are likely to include - government spending, urban discretionary spending gaining momentum, persistence of a strong dollar, and bottom-up market.
India 2016:Repairs done, now testinggrowth engines
COVER STORY

7GROUND VIEW GROUND VIEW Annual Edition 2016 Annual Edition 20166

9GROUND VIEW GROUND VIEW Annual Edition 2016 Annual Edition 20168
“Market liquidity is tight” is a com-
mon refrain of traders and small-scale
businessmen across India, but the
four-wheeler market is now buzzing.
Premiumisation trends across India
are robust, but private investment ac-
tivity is sluggish. Rural growth is now
gloomy, but there seems to be just no
stopping the e-tech boom, which gets
bigger every day. Government infra-
structure spending is gathering pace
even as private construction is slow-
ing down. A boom here, a crisis there
– it seems like never before have so
many contrasting Indias been at play
simultaneously.
“We were safe, there was no flooding
in our area,” said Mr Prabhakar Rao,
a resident of Royapettah in Chennai.
“The drainage system of Royapettah
and old Chennai were constructed
during the colonial times. It is much
better than the rest of Chennai,”
he contends. Tamil Nadu, Andhra
Pradesh, and Puducherry, particularly
Chennai were ravaged by torrential
rains from 1st December 2015. Chen-
nai city saw its highest rainfall in the
last 100 years, causing heavy flooding
and loss of life and property. Chen-
nai Corporation, the city’s governing
body was established way back in
1688 – it is the oldest municipal cor-
poration in India and second-oldest
surviving municipal corporation in the
world. Even with so much history, the
city’s infrastructure is inadequate and
is indicative of the opportunities that
lie ahead.
Within India, different themes are
emerging. A leading consumer du-
rables dealer in Coimbatore says,
“Construction and infrastructure de-
velopment activities have reduced
significantly. Real-estate prices are
declining. Everybody in Tamil Nadu is
waiting for the upcoming elections in
May 2016”. In contrast, Mr Manohar
Agrawal, a leading automobiles deal-
er from Varanasi has become an avid
real-estate investor. He says, “Land
prices have moved up here. A four-
lane Varanasi bypass will come up in
another year; metro is in the works
and many other infra projects are
planned for the city. Things are mov-
ing. The state government function-
ing is picking up steam, as elections
are nearing – Akhilesh needs to show
something before February 2017.”
In this context, it appears that Tamil
Nadu lags UP; but Tamil Nadu con-
tributes +8% to India’s GDP with one
third of UP’s population) compared to
UP’s 8.5% contribution. Tamil Nadu
is also far more industrialised than
UP and its infrastructure is similar to
Gujarat and Maharashtra, which are
leading Indian states. It is these very
contradictions that make a Ground
View all the more important to assess
India’s real prospects.
Contrasting Indias!

9GROUND VIEW GROUND VIEW Annual Edition 2016 Annual Edition 20168
Surging growth in Industry to drive GDP growth in CY16
GFCF growth to be driven by Government focus on Capital Expenditure
Sour
ce: M
oSPI
, Phi
llipC
apita
l Res
earc
h In
dia
Sour
ce: M
oSPI
, Phi
llipC
apita
l Res
earc
h In
dia
Leading with radical centrism
India will always have contrasting stories and has always been a promising investment destination. But it has a history of punching below its weight. With PM Modi’s government well into its second year, the big question is whether India is moving in the right direction and what is its visibility? Ground View dived deep to explore urban and rural India in all its four corners in order to provide an unflinch-ingly real view of what is happening. PM Modi’s course seems one of radical centrism, marked by a strong willingness to reform institutions while taking a pragmatic approach towards solutions. This path will yield sustainable results and consistent growth — 2016 will be better than 2015, even with a similar or marginally better GDP growth. This is because quality of growth will be superior with a sustained uptick in government capital expenditure, stronger discretionary consump-tion, and green shoots appearing in private investment – all these factors will drive a compounding and multiplier effect.
Some stumbles, some learning – course correction
Jagdish Bhagwati, an old friend of PM Modi and professor of eco-nomics at Columbia University, made two interesting observations in a recent media interview – (1) PM Modi is learning and he is always open to suggestions and (2) he has not got the right people into the right place and is openly criticising some ministers. The first point is more crucial than the second, as it is a take on certain mistakes the PM made at the beginning of his tenure such as his stand on trade agreements where he blocked the trade facilitation agreement (TFA) in an environment of rising multilateralism marked by arrangements like the Trans Pacific Pact. According to ace economist Bhagwati, he is now rectifying past mistakes. The second point is more generic and speaks about the incompetence of certain ministers – getting the best people in the right places all the time is just an iterative process.
Even though the PM has not been able to run the government with as much panache as he showed in his election campaign, India has man-aged to dart back onto a clear recovery path and achieve a healthy growth rate. One of the indicators for economic growth is indirect tax revenue growth. Arvind Subramanian, the Chief Economic Advisor to the Government of India, said in a recent media interview, “Indirect tax revenue growth, (is) the actual hard money the government col-lects, which it can only collect if underlying activities are doing well. And that number, even if you take away all the new things, new tax-es (that) have been added, that number is growing at a robust rate of about 11.5-12.0% – and if that number is right, it means that the economy is recovering.” RBI Governor Raghuram Rajan has regularly said that the economy is on a recovery path. In a recent media inter-view he said, “I think there are some signs of things starting to pick up – look at the auto sector, 22% growth year on year, so there are some signs that at least urban demand is starting to get more confident, perhaps on the basis of higher incomes and lower outgos, because of fuel and so on.” He also always emphasizes the government’s focus on structural improvements. While these take more time to deliver results, they deliver sustainable growth and take a lot more courage to implement.
Approval rating still very high for Modi
Sour
ce: M
int-
Inst
avaa
ni, P
hilli
pCap
ital R
esea
rch
Indi
a

11GROUND VIEW GROUND VIEW Annual Edition 2016 Annual Edition 201610
CLEENEX
GV’s annual edition last year titled 2015: Swa-chh Bharat, A year of India cleansing’ had said that 2015 will be a year for reforms and systemic cleansing by reducing graft and black money. The government has managed to achieve quite a few of its objectives – central-government corruption has declined significantly and measures taken to curb black money have yielded results. Even though land acquisition, a major reform, was not approved in the de-sired format in parliament (a good example of Modi’s radi-cal centrism), states are doing their bit to ensure smoother land acquisition for infrastructure projects. A slew of signif-icant reforms have been announced (GST, Uday, FDI liber-alisation), whose implementation will pick up – this, in turn, will help in faster implementation of new projects and we may see further signs of renewal in the investment cycle.
GST
GST, a major indirect taxation reform that was conceptu-alised almost a decade ago, is likely to be passed in the upcoming budget session. It is widely expected to im-prove the efficiency of the system by eliminating the cur-rent regime of cascading taxation. Other palpable benefits include removal of the inverted duty structure, enhancing the tax base by including the unorganised sector under its purview (thereby boosting the government’s revenue con-siderably and improving tax-to-GDP ratio), and increasing the competitiveness of Indian manufactured goods. While the proposed revenue-neutral rate of 18% will push up ser-vices inflation, the overall impact on inflation will be mar-ginal-to-deflating, as goods (accounting for 70% of the CPI basket) will enjoy lower taxes than in the current (CENVAT + VAT + CST) regime.
UDAY
This initiative is the government’s radically centrist attempt to tackle the burgeoning debt burden of the state dis-coms. On the one hand, discoms are not signing new PPAs because of their stressed balance sheets and on the other, banks and financial institutions (who have an aggregate credit exposure of Rs 2.8tn to this sector), are bearing the brunt – the situation has the makings of a financial-sector contagion. If UDAY is successfully implemented by states, it will lead to an operational turnaround of discoms, en-hance accountability of states in future losses, alleviate bal-ance-sheet stress, and ease asset-quality stress for banks. GV team’s discussions with key bureaucrats suggest that UP, Rajasthan, and Jharkhand (accounting for ~40% of dis-com debt) are inclined positively towards this policy.
FDI liberalisation:
The government has further opened up the economy to FDI while enhancing limits in various sectors and in-cluding more sectors under the automatic route. There is a conscious approach to liberalise the economy and encouraging FDI inflows is a means to achieve that end. The government has simplified procedures and en-hanced limits, along with making changes in the lock-in period for some sectors. While the incremental delta of such moves will not be felt immediately (especially in a demand-starved scenario), when growth returns to a fast-er trajectory (medium term), this policy will fructify and enable acceleration.
Easing of norms for infra developers: To encourage private capex in construction, the gov-ernment has undertaken a number of administrative measures such as funding approvals for projects stuck due to lack of funds, extension of concession period to all BOT projects delayed during construction, easing of exit norms to redeploy proceeds for debt retiral, allow-ing full divestment of operational road projects, relaxing norms in lock-in period, improving rural connectivity, and a Road Asset Management System to increase the speed of building new roads.
Ease of doing business:
To improve the overall ease of doing business across the country, DIPP has been collaborating with states to im-prove efficiency and introduce a ranking methodology (based on eight broad parameters) to foster competition. The first year’s rankings (used as baseline) are throwing
Swachh Bharat: Less bumpy from here

11GROUND VIEW GROUND VIEW Annual Edition 2016 Annual Edition 201610
Advanced economies again becoming the driver of global growth
*8 major economies Source: Economist Intelligence Unit
FII outflows became stronger this year
Sour
ce: B
loom
berg
, Phi
llipC
apita
l Res
earc
h In
dia
up surprises; top-ranked states are using these rankings in their investor meets to showcase themselves as investment destinations. As the era of competitive federalism is being unleashed in India, states will be propelled to cut red-tapism (more than ever) and improve their administrative mecha-nisms (so that they do not lag behind in garnering funds).
India’s place in an unspectacular world
The year gone by has been unspectacular from the perspec-tive of stock returns; investors might as well have shoved their money under their mattresses and slept peacefully. Nif-ty fell 5% YTD and some of the major global indices such as S&P 500 and FTSE 100 virtually stagnated. However, a lot has changed in the last 11 months, which will have sig-nificant ramifications on medium- to long-term returns. In 2016, developed nations will contribute more than emerg-ing economies to the world economic growth for the first time since the 2008 financial crisis. Emerging economies, led by China, will face challenging times. China might do well by warding off an economic crisis – it has already failed to restructure its state-owned enterprises and bring down debt levels. India’s situation is more cheerful, but political noise takes away the focus from core-development issues – this has made it lose some of its sheen. However, this is only a short-term phenomenon, not a permanent dampener.
With an agenda of radical centrism, India is better placed to deliver growth – not just vs. emerging economies, but also vs. developed ones. Globally, there is a lot of disen-chantment with centrist pragmatism; populism in different forms is making headway. Some of the interesting exam-ples are xenophobic right-wing populism in the US with Trump garnering decent favourability ratings despite mak-ing statements that would usually not go down well with
Americans and France’s Marine Le Pen getting a boost in in French regional elections, or the left-wing politics of Jer-emy Corbyn in the UK. In a global environment marked by stagnant wages and low nominal GDP growth rate, populist quick fixes of a tax cut here, some hike there will only have ephemeral results. On the other hand, with the right brand of politics, India is streaming ahead and will start becoming visible in 2016. This will ensure India will continue to be a sought-after investment destination for global funds.
Challenging times for global businesses, but good times ahead for India
Developed markets will deliver better growth in 2016, but in its a intertwined world for companies, improving developed economies do not necessarily usher good times for all. Many global corporations have counted on emerging markets for growth and some firms such as HSBC were planning to shift headquarters to Hong Kong – such decisions are likely to take a back seat now. Corporate behaviour is quite different from fund managers’ behaviour – the latter tend to change investment destinations overnight. The focus of global cor-porations is on long-term growth strategy and corporations will not pull out money from their established businesses in China or promising destinations such as India.
In his endeavour to market India as an attractive investment destination to the world, PM Modi undertook whirlwind tours of the world. His ‘Make in India’ program aims to po-sition India as an alternate destination to China. India saw higher FDI flows in the 2015 and this is likely to accelerate, with ecommerce alone likely to garner US$ 10bn in 2016 vs. US$ 8bn in 2015. Foxconn and Xiaomi have announced plans to set up units in India under Make in India. Foreign direct investments will pick-up further and FII inflows should gain traction as the year progresses.

13GROUND VIEW GROUND VIEW Annual Edition 2016 Annual Edition 201612
Nominal GDP growth with NIFTY
Market expectation on the trajectory of Fed rate hike in CY16Govt capex has picked up this year
Sour
ce: M
inist
ry o
f Fin
ance
, Phi
llipC
apita
l Res
earc
h In
dia
Sour
ce: B
loom
berg
, Phi
llipC
apita
l Res
earc
h In
dia
India Equities: You are known by the company(ies) you keepThe nominal GDP growth rate in 2016 will be better than 2015 (quantum will be determined by global factors) and it will keep the markets interested. The year will be a good time for stock picking with attractive valuations, especially in core sectors and ones with medium capitalisation. The four big-gest themes for 2016 are likely to be:
1. Government spending will be a major driver of GDP: Gross tax collections for the first seven months of FY16 were up 23%. Tax revenue momentum has been strong and FY16 will close on a strong note. Revenue collection will be strong in 2016 despite a strong base in 2015 – rise in certain taxes (such as service tax) will help. This will significantly increase the government’s ability to spend in 2016. Government spending on the capital account was up 61% in 7MFY16, es-tablishing a strong base – 2016 will see this trend continuing. The infrastructure sector is already seeing a lot of activity – road orders are picking up and railway orders are gathering steam. These reinvigorated sectors will see further traction in 2016. With a pick up in government spending, public sector banks should see an improvement in credit growth.
2. Urban discretionary spending will gain momentum: Declining interest rates, rising incomes, and decreasing out-go (due to lower fuel and interest costs coupled with the government’s implementation of the seventh pay commis-sion) will mean improved spending capacity. Disposable in-comes in urban areas will rise and will lead to an increase in the consumption of discretionary products. Both small-tick-et and large-ticket discretionary consumption will benefit. Four-wheeler automobiles, consumer durables, and eating out will gain traction.
3. Persistence of a strong dollar: Fed rate hike will keep the dollar strong. Export-based plays will see continued interest, but valuations and business fundamentals will be a concern in sectors such as IT and pharmaceuticals.
4. Bottom-up market: Themes 1, 2, and 3 are a continuance of 2015 themes - to some extent are priced-in by the markets. While the 2016 real GDP growth rate will be better than 2015,

13GROUND VIEW GROUND VIEW Annual Edition 2016 Annual Edition 201612
Credit growth at historical low Consolidation in growth in stress assets
Industry credit vs project announcement + stalled project revival (adjusted for lag)
Sour
ce: R
BI, P
hilli
pCap
ital R
esea
rch
Indi
a
Sour
ce: P
hilli
pCap
ital R
esea
rch
Indi
aSo
urce
: CM
IE, P
hilli
pCap
ital R
esea
rch
Indi
a
it will not be materially different – because private invest-ment spending will continue to lag. The broader market is not likely to see huge appreciation; therefore, stock picking based on earnings growth in conjunction with valuations will be critical. Quality midcap stocks with earnings growth will perform well.
Swachh banks: Waiting for upswing in credit cycle
“We are beginning to see an end of the NPA cycle. Slip-pages are down sequentially as well as yoy and therefore, we believe that we are now getting to the bottom of the pile, so to speak. So, going forward, the prognosis should be good,” said Arundhati Bhattacharya, Chairman of SBI in a conference after SBI announced its 2QFY15 results. 2015 was a particularly rough year for Indian banks. The NPA cycle was expected to bottom in the early part of the year, but con-tinued to surge. Credit growth hit a 20-year low and demand in the credit ecosystem is yet to come back. In fact, the credit to industry, which accounts for 40% of the total credit, is even lower at 6% yoy.
Project announcements impact credit growth with a lag of around two years. Lack of new project initiatives over the last few years has exhausted the industrial capex pipeline, thus severely affecting corporate credit growth. New project an-nouncements (private and government) in FY13/14 were Rs 5.2/5.8tn, down from the peak of Rs 22tn in FY09. However, the rate improved in FY15 to Rs 10.2tn. Credit growth should see positive traction from FY17 onwards.
The recovery is unlikely to be V-shaped (like in earlier cy-cles), as decline in commodity prices and subdued corpo-rate toplines have impacted working-capital demand. Credit growth in 2016 is likely to be in the range of 12-14%, indicat-ing a significant increase from 9% in CY15.
The rate of slippages in the banking system has decelerat-
ed significantly. Growth in stressed assets in H1FY16 has been 3% and now the stressed-asset-to-loan-book ratio is stabilising. “We hope that over the next year, say by March 2017, a full clean-up will have been done by banks...the idea is to put the real assets back on track with whatever needs to be done,” said Dr Raghuram Rajan in a recent policy-announcement confer-ence.
A plethora of measures have been announced last year (5/25 scheme, UDAY, strategic debt restructuring, and management takeover trend under SDR). A hands-on approach by the RBI and the centre (by evaluating banks on certain KPIs) will deter-mine capital infusion by the centre. As such, the focus of PSU banks will be on improving their bottomline rather than chasing credit. CY16 should be marked by moderation in stressed-asset creation rather than subliminal credit growth.

15GROUND VIEW GROUND VIEW Annual Edition 2016 Annual Edition 201614
Unsold real estate inventory by citites
Sour
ce: L
iase
s For
as
Building the multipliers: Roads and Rails
Mr Ramnath recently quit his lucrative job at Goldman Sachs to work for the Nagpur Metro project. He says, “Apart from the clichéd ‘Indian infrastructure has tremendous potential’, I would say that the more critical aspect here is better plan-ning. Often, long-term planning takes a back seat and even newly developed projects’ short comings are seen within a few years. Better planning and adherence to international standards present the real outsized opportunity.” Mr Ram-nath’s view is an apt description of India’s infrastructure plan-ning – in the recent Chennai floods, the suburbs (with mod-ern infrastructure) were more impacted than the old city (with colonial infrastructure), which managed to deal with the situ-ation much better. However, the focus on better implementa-tion is getting more importance than before. Metro projects have been implemented with global standards. The National Highways Authority of India (NHAI) is awarding projects with far greater efficacy than before.
The roads sector is witnessing maximum traction within the infrastructure space. Not only has NHAI awarding kept up its pace, it has cleared many bottlenecks to revive stuck projects. In many cases, it has gone to the extent of altering the con-cession agreement – an unprecedented move in the sector. YTD, NHAI has awarded 3,000km of projects – moving stead-ily towards its target of 5,100km for FY16. Similarly, MoRTH has awarded ~1,000km of projects (its target is 2,500km for FY16). All in all, the road sector seems to be progressing well towards its total target of 7,500km of awards (4,000km award-ed already).
A key feature of the order awards this year has been NHAI’s success in awarding some of its long-pending projects. For ex-ample, it awarded the Eastern Peripheral Expressway – a pro-ject envisaged to decongest the national capital and provide a ring-road structure for heavy vehicles – albeit four years after it was first put up for bidding. Similarly, it awarded the Agra-Eta-wah project (which was terminated) to IRB Infra on a BOT basis.
Roads and infrastructure projects have a multiplier effect, as connectivity improves the overall system efficiency and encour-ages private investment. Private spending is sluggish, but as more infrastructure projects kick off, it will also see improve-ment.
Private investment anaemic: Where art jobs?
With real-estate-construction activity taking a back seat, the sector’s woes will persist because of the sheer number of de-velopers present. The system has more capacity than required, contends Mr Ashutosh Limaye, Head of Research at JLL, a leading real-estate consultant. The real-estate sector was a ma-jor contributor to job creation in the last investment cycle, but in the current situation, the sector will do well to just avert crisis
over next six months. By the end of 2016, the cycle should have bottomed and some pickup in activity is likely.
“Property developers in the top-seven cities have re-duced new project announcements. Supply correction has taken place according to the demand correction. Apart from NCR and Navi Mumbai, other major cities are unlikely to see a major crisis, but the situation in NCR is quite grim,” says Mr Limaye. He adds that property prices will appreciate slowly and expects price appreciation of around 5% annually in the medium term. Investor activity in the sector has reduced to around 15% of transactions from giddy levels of 50% around 3-4 years ago. However, alluding to sales growth of 28% yoy in the first six months of FY16, he contends that the worst is over.
Last time, the private-investment cycle was led by power, steel, and cement. All these sectors are now struggling. Power has excess capacity and it is grappling with low load factors, as many plants are unable to execute pur-chase agreements with distribution companies. UDAY reforms will come to the rescue, but the system still has excess capacity and is unlikely to see a major upswing in investments in the medium term. The metals and mining sectors are struggling because of excess global capacity and low prices. Investment in the steel sector is not likely to revive any time soon. Cement is seeing consolidation and it may not see revival in investment.
However, green shoots should start appearing for private investments led by construction and infrastructure devel-opment. Industrial capex in traditional sectors will happen with a lag, but capital spending in new-age sectors such as technology, will pick up in 2016.

15GROUND VIEW GROUND VIEW Annual Edition 2016 Annual Edition 201614
Funding in ecommerce and as % of FDI
Jeff Bezos, founder of Amazon on his visit to India. Pic Courtesy: Amazon
Sour
ce: M
inist
ry o
f Com
mer
ce, P
hilli
pCap
ital R
esea
rch
Indi
a
Age of the Unicorns: A healing touch for anaemic private investments?
Unicorns have long been revered in India. A unicorn was depicted
on ancient seals of the Indus-valley civilisation. In today’s context,
the term unicorn was coined by Aileen Lee, a venture capitalist,
to describe a private technology company valued at over US$
1bn. Globally, there are 145 unicorns of which eight live in India –
namely Flipkart, Snapdeal, InMobi, Paytm, Quickr, Ola, MuSigma,
and Zomato. Three more are likely to join the family – Shopclues,
Oyo Rooms, and Big Basket.
In 2015 (till date), FDI in ecommerce totalled at US$ 7bn, up 50%
yoy and constituting around 25% of India’s total FDI. In 2016, this
is likely to rise 25% at least to US$ 10bn, with Amazon’s plan
of making India its biggest market outside of the US.
Mr Neeraj Singla’s traditional family business is khaini (fla-
voured tobacco). While the business has generated tremen-
dous cash for years, now it is declining. Mr Singla wants
to invest aggressively in mobile applications. According to
him, “Investments for trialling ideas is not substantial, but if
an idea shows promise, then there is no problem in investing
any amount.” Like Mr Singla, many traditional Indian busi-
nesses are looking at investing in technology. Reliance Jio’s
first major product was Jio Chat and Bharti Enterprises has
invested in Hike Messenger. According to the grapevine,
the next-generation Ambanis, Akash and Isha, who are now
part of Jio, are keen on new age start-ups. Entrepreneurial
activity in ecommerce is rising at a fast clip; increasingly,
students from the prestigious Indian Institute of Technology
are seeing start-ups as the holy grail of success.
“There is a Silicon Valley coming up in Powai,” says the lead
character in a very successful online sitcom, TVF Pitchers.
The lure of start-ups is big and this is just the beginning, as
investors in the segment are long-term holders with a lot
of experience and patience to guide promising start-ups.
Wannabe entrepreneurs from IITs are modelling themselves
on global luminaries like Steve Jobs, going to the extent of
matching their eccentricities. However, a lot of good can
come out of this fast-developing ecosystem. Many jobs
(jobs as in employment, not the man) will be created, and
technology start-ups provide the best avenues for chan-
nelizing the energy and restlessness of the Indian youth.

17GROUND VIEW GROUND VIEW Annual Edition 2016 Annual Edition 201616
Make in India is gathering steam
One of PM Modi’s most-quoted campaign slogans is
“Make in India”, which was envisaged to be the prime
job-creating platform for India’s youth. This year, under
Make in India, the centre’s prime focus was on easing pro-
cesses through de-licensing and deregulation (such as sin-
gle-window clearance), opening up critical sectors such as
railways, defence, and construction, and wooing foreign
capital. While time will tell if the initiative is successful, it
has already started seeing investments coming in under
its flagship.
Xiaomi has partnered with Foxconn to set up a manufac-
turing unit in India. Alstom and GE have signed an esti-
mated Rs 400bn (US$ 6bn) agreement to set up manufac-
turing plants for railway locomotives. Powergrid has also
started complementing this initiative by having a Make in
India clause in its transmission projects tenders.
Indian consumer feeling the pinch
“Sales managers of FMCG companies have stopped going
to the market, they have lost touch with developments on the
ground. Targets keep rising irrespective of the demand scenar-
io and retail schemes have made a mess of the channel. The
whole system seems to be on steroids and corrective actions
are required. I am glad that the top management of some com-
panies have woken up. Still, a lot needs to be done, but its
better late than never,” sighs Ghanshyam Agarwal a leading re-
tailer, wholesaler, and distributor for multiple FMCG companies
in Kanpur, Uttar Pradesh.
A heady mix of low price growth and high channel incentives
has clogged the distribution channels, as FMCG sales manag-
ers scrambled to meet targets by resorting to revenue-at-any-
cost schemes. Complicated channel schemes, based on out-
FMCG growth trend
* Sales growth for Q1/Q2FY16 excludes Nestle**Volume growth is calculated as average of volume growth of Britannia, Dabur, Colgate, Emami, HUL, Marico, Asian Paints
Chandrababu Naidu signing deal with Xiaomi under the Make in India programme

17GROUND VIEW GROUND VIEW Annual Edition 2016 Annual Edition 201616
lets count and targets, have made a mess of the channels of
leading companies such as Hindustan Unilever. Undercutting
by distributors is rampant. HUL is now taking stock of the sit-
uation by optimising the schemes and outlet count. Howev-
er, while companies take stock, the system’s liquidity seems
to have evaporated, as wholesale channels have significantly
reduced inventory to combat price and scheme uncertain-
ty. Demand scenario has continued to remain uninspiring,
which has further aggravated channel woes.
Inventory destocking by the wholesale channel is a lead indi-
cator of the demand scenario and it also indicates that times
are going to be challenging. Receivables in the system are
rising across India and across companies, but the trading en-
vironment in the southern market is more sluggish than in
the northern part of India. A number of factors have been
attributed to lower liquidity in the market – these include
falling real estate prices, falling gold prices, slower income
growth in the southern market, and waning consumer confi-
dence in some parts.
Even though there are systemic problems for consump-
tion, trends (premiumisation, discretionary consumption,
and growth in categories such as food) remain robust. 2016
should be good for categories of consumption that are
helped by lower interest rates and deflationary trends.
Urban discretionary consumption strengthening; automobiles gathering pace
“Rural growth was twice as fast as urban about two years
ago; it is still growing faster than urban, but slowing down.
Now it is around 1.5 times the urban growth rate. In some
pockets, the pace of slowdown is alarming. Urban should
pick up soon,” says a leading distributor of consumer goods
Auto growth trend
Trend in urban CPI
Trend in advertising revenue growth
in Allahabad, UP. He believes that decline in the system’s
liquidity is because of slower growth in rural subsidies such
as MNREGA and that MSP prices are having an impact
now. In Punjab, land prices had soared in the last 10 years
and many farmers sold some of their land and enjoyed the
wealth effect. This phenomenon is waning and rural growth
has become quite sluggish in large-ticket discretionary pur-
chases in the states of Punjab and Haryana.
Urban demand is likely to pick up in 2016 in a meaningful
way. Earlier, while Dabur was focussing its energy towards
urban products, Hindustan Unilever contended that rural
demand would lead to a revival, as urban demand con-
tinued to remain sluggish through 2015. However, now
signs of a pickup in urban demand are becoming more
visible. Auto sales are picking up and are likely to sustain

19GROUND VIEW GROUND VIEW Annual Edition 2016 Annual Edition 201618
C O M P A N I E S 2 0 1 6 Operating Outperformers
According to PhillipCapital
India Research, the following
companies will deliver operational
outperformance in 2016. A
significant number of companies are
from the mid-cap space, indicating
the year is likely to belong to
medium capitalisation companies.
Bank of Baroda
Sour
ce: C
ompa
ny, P
hilli
pCap
ital I
ndia
Res
earc
h Es
timat
es
Plays on government spending
Bank of Baroda: Savvy PSU
BOB has a diversified portfolio and lower concentra-
tion of lending to leveraged corporate groups. Banks
with lesser exposure to stressed assets will see a faster
turnaround. The new management seems to be pro-
active in cleaning up the balance sheet and focusing
on profitable businesses. The strategy articulated by
the bank includes – containing asset quality and fo-
cusing on recovery, improvement in spread by reduc-
ing low-margin buyer’s credit, introducing risk-based
pricing model, and reducing dependency on syndi-
cate loans. The bank is likely to reach +15% RoE in the
next three years. The loan book may remain subdued
as the bank trims non-profitable business such as buy-
er’s credit. Earnings should fall 30% in FY16 followed
by 72% earnings growth in FY17.
momentum in 2016 aided by improving incomes, lower
inflation, and lower interest costs. Seventh Pay Commis-
sion (for government employees) has announced a pay
hike of 24% yoy. While the pay hike is lower than the
Sixth Pay Commission, which led to significant increase
in auto sales, still it is good enough to boost auto sales.
Another lead indicator of urban discretionary consump-
tion is advertising spend on television. Television adver-
tising revenue growth in 2015 was around 20% yoy. This
was driven by discretionary products such as personal
care, foods, and consumer durables. In 2016, advertis-
ing growth will remain robust at around 16% yoy. New
product launches, rising contribution of tech companies,
and margin cushion for FMCG companies ensure strong
growth and visibility.
Urban demand will gather further steam with consum-
er durables, four wheeler automobiles, eating out, and
personal care becoming key drivers of consumption.

19GROUND VIEW GROUND VIEW Annual Edition 2016 Annual Edition 201618
ITD Cementation
NCC
NCC: Trinity’s other play
NCC is witnessing remarkable improvement in its profitabil-ity on margin expansion and reduction in interest expenses. Over the last six quarters, its EBITDA margins have expand-ed by 330bps – to 8.8% in 2QFY16 from 5.5% in 4QFY14. Margins should improve further to 8.75% in FY16 and 9.25% in FY17 on lower competitive intensity.
However, the biggest delta for NCC will be from reduction in interest expenses. In September 2014, the company raised Rs 6bn via a rights issue, and used the entire pro-ceeds to reduce debt. Debt levels came down to Rs 20bn in 4QFY15 from Rs 27bn in 2QFY15 – and leverage to 0.6x in FY15 from 1.4x in FY14. Reduction in debt, as well as im-provement in credit rating (due to lower leverage levels) will lead to interest savings of Rs 1.3bn in FY16. In FY17, cash proceeds from the sale of power plants, and improvement in operating cash flows, should lead to further debt reduction of Rs 3bn and interest coverage ratio improving to 1.6x in FY17 from 0.9x in FY15.
Sour
ce: C
ompa
ny, P
hilli
pCap
ital I
ndia
Res
earc
h Es
timat
es
Sour
ce: C
ompa
ny, P
hilli
pCap
ital I
ndia
Res
earc
h Es
timat
es
ITD Cementation: Trinity in play
ITDC is the perfect turnaround story to play in this cycle. Over the last four years, the company was reeling under the pres-sure of delayed payments by various government bodies (es-pecially NHAI) and a countrywide lack of order inflows. How-ever, in the last 12 months, many of its claims were cleared (including Rs 3bn with NHAI) leading to easing of WC cycle. ITDC has grabbed multiple large orders, taking its orderbook to 3x book-to-sales (4.3x including L1) and its operating mar-gins have improved by 320bps, over the last three quarters.
Over CY14-17, ITDC should report a robust topline CAGR of 34%, margin expansion of over 420bps, and earnings CAGR of 99%. Its presence in segments such as MRTS and ports will lead to high and sustained growth, along with margin expansion as competitive intensity is much lower in these segments than others (such as roads, buildings). Its working capital situation, which has improved dramatically over last six months (debtor/inventory days down to 63/166 in 1HCY15, from 94/240 in CY14) should sustain at current levels, keeping leverage under check.

21GROUND VIEW GROUND VIEW Annual Edition 2016 Annual Edition 201620
Dalmia Bharat: A play on asset sweating
DBL’s capacity CAGR of 35% over the last 10 years was driven by both organic and inorganic growth. However, volumes are still in a ramp-up mode. It is all set to deliver consistent vol-ume growth of +20% yoy over the next few fiscals (Q3FY16 could be lacklustre due to the floods in Tamil Nadu). DBL will ramp up utilisation in Karnataka and northeast, and is likely to achieve its aggressive FY16/17 targets. Channel checks suggest that DBL has already started aggressive efforts to build its dealer network for its Belgaum plant across its target markets (Maharashtra and Karnataka). It expects minimum capacity utilisation for all the new plants at 50%+. Other highlights:
• Remains committed to cost efficiencies; is amongst the most cost efficient producer of cement in India current-ly.
• Immediate focus will be asset sweating and net debt reduction. Asset sweating will help volume growth and drive operating earnings.
• DBL’s region-mix remains very favourable. All markets (barring east India) are stable in terms of cement pric-
ing.
Dalmia Bharat
Sour
ce: C
ompa
ny, P
hilli
pCap
ital I
ndia
Res
earc
h Es
timat
es
Aurobindo Pharma
Sun Pharma
Sun Pharma: It’s back!
Sun Pharma will see strong growth momentum in US sales led by scheduled launch in gGleevec with 180-days exclusivity in February 2016. Additionally, a near-exclusivity scenario for gGleevec through-out FY17 would boost SUNP’s earnings by over 50% yoy for the next five quarters despite ongoing Halol plant issues. It expects synergy benefit of US$ 280mn, which will be a key earning booster in FY18. Negatives of Ranbaxy’s integration are already priced in.
Sour
ce: C
ompa
ny, P
hilli
pCap
ital I
ndia
Res
earc
h Es
timat
esSo
urce
: Com
pany
, Phi
llipC
apita
l Ind
ia R
esea
rch
Estim
ates
Dollar Plays
Aurobindo Pharma: #Approved
With 20 ANDA approvals YTD (highest within peers), and likely approval of few big-ticket injectables, Aurobindo is set to deliver strong US sales in H2 vs. H1. Additionally its robust ANDA pipe-line of 168 drugs will power US sales in the near future. Profitable growth in its European operation (led by site transfer of product sourcing from Actavis to its own greenfield plant) from FY17 would drive value growth over FY15-18.

21GROUND VIEW GROUND VIEW Annual Edition 2016 Annual Edition 201620
Bottom up plays Tata Com: It‘s all about adding value to data
TCom has made a paradigm shift in its data business strat-
egy from an ‘infrastructure-deployment-led approach’ to
an asset-light partnering approach in order to leverage
on its existing global infrastructure and vast new-age en-
terprise product suite. TCom’s capex intensity will remain
low and revenue/profitability growth trajectory will remain
robust. Currently, the new services are yet to gain traction
as the company has significantly scaled its capability in
executing complex projects, which take higher gestation
to yield results. Its data-services segment is showing im-
mense traction, but the revenue growth is likely to remain
lumpy in the medium term. Asset sale (Neotel and Data
Center businesses) will also help in significantly delever-
aging the balance sheet.
Tata Com
Praj Industries: Scaling up
Praj aspires to be a major player in the environ-
ment, energy, and agri-process-led applications
providing integrated solutions including plant,
equipment, and products. The worst is behind for
the company and 57% yoy growth in order book
in 1HFY16 should support its revenue growth. An
increased business scale will cover fixed cost and
improve margins along with monetisation of R&D
through contract research and commercial success
of second-generation ethanol. Praj has significant-
ly de-risked its business from oil-price volatility
— its order book has only 9% exposure to pure
fuel-based ethanol plant orders.
Sour
ce: C
ompa
ny, P
hilli
pCap
ital I
ndia
Res
earc
h Es
timat
es
Sour
ce: C
ompa
ny, P
hilli
pCap
ital I
ndia
Res
earc
h Es
timat
es
Praj Industries

23GROUND VIEW GROUND VIEW Annual Edition 2016 Annual Edition 201622
Bharti Airtel
Bharti Airtel
Plays on urban discretionary spending
Bharti Airtel: Capital productivity will improve
Bharti has secured most of the spectrum for data services and sustainability of voice services. Capex for FY16, including spectrum-related spending, has peaked and capex intensity will decline. Apart from decline in domestic capex intensity, capital spend-ing for Africa will also decline with sale of passive infrastructure assets. As capex intensity declines and data revenues grow at a fast clip, rising EBID-TA growth will result in significant improvement in capital productivity. Bharti’s superior spectrum assets and ubiquitous data and voice network will translate into market share gains, furthering the case for asset sweating, resulting in improving return ratios.
Sour
ce: C
ompa
ny, P
hilli
pCap
ital I
ndia
Res
earc
h Es
timat
es
Allcargo Ltd
Allcargo Ltd
The synergized business model provides cost effective
logistic solutions and is ready to exploit attractive
opportunities in new businesses with entry into costal
shipping and third party logistics (3PL). It is also
focusing on e-commerce and supply chain logistics and
will develop land bank of 200acres for ICD/warehousing
after GST. It has done upfront capex in CFS and project
business and has marginal routine capex leading to de-
leveraging of balance sheet with expected cash flow
generation of ~Rs 10bn over two years. Its presence
across the critical value chain in logistics, Allcargo
would be a major beneficiary of increased global trade
and recovery in domestic industrial activity.
Sour
ce: C
ompa
ny, P
hilli
pCap
ital I
ndia
Res
earc
h Es
timat
es

23GROUND VIEW GROUND VIEW Annual Edition 2016 Annual Edition 201622
Jubilant Foodworks:
Stuff it to heart’s content
Demand will improve in the next few quarters as
lower CPI and turnaround in industry growth will
stimulate individual/corporate discretionary con-
sumption. Jubilant Foodworks has a very high op-
erating leverage; a 1% increase in SSSG increases
EBIT by 8%. The company has already taken a
price hike of 3-4% in this quarter and improve-
ment in both SSSG and operational performance
will start in 3QFY16.
Jubilant Foodworks
Sour
ce: C
ompa
ny, P
hilli
pCap
ital I
ndia
Res
earc
h Es
timat
es
Bajaj Auto: Structural rider
Volume growth will remain strong led by the rag-
ing success of its newly-launched Avenger, which
dealers highlighted will clock 4-5x volume vs.
older version. Additionally, premiumisation story
in two wheelers is more structural, which will ben-
efit Bajaj’ Pulsar portfolio. Aggressive product
launches with four new two-wheelers until FY17
end will only mean significant market share gains.
While exports have been struggling recently,
African/LatAm markets are in nascent stages
of growth with two-wheeler penetration low at
4%/6% only, which would lead to sustained ex-
ports growth. All this would lead to a robust 18%
CAGR in earnings until FY17.
Bajaj Auto
Sour
ce: C
ompa
ny, P
hilli
pCap
ital I
ndia
Res
earc
h Es
timat
es

25GROUND VIEW GROUND VIEW Annual Edition 2016 Annual Edition 201624
C O M P A N I E S 2 0 1 6 Operating Underperformers
HUL: A lever less
Due to a further fall in crude prices, HUL’s de-
tergents category (growth driver in the past) will
continue to face severe deflationary and compe-
tition headwinds. Other categories such as sham-
poos, soaps, and oral care will continue to see
heightened competition, which will put pressure on
margins and sales. Channel checks suggest that the
winter-care portfolio will be impacted by some sup-
ply issues in north India. Hence, sales growth may
throw negative surprises in the near term. Operat-
ing profit growth will be lower in FY17 vs. FY16 due
to huge gross margin improvement in FY16, which
will not be the case in FY17.
HUL
Sour
ce: C
ompa
ny, P
hilli
pCap
ital I
ndia
Res
earc
h Es
timat
es
Maruti Suzuki
Maruti Suzuki: It’s all about the market share
Maruti will see strong growth in volumes with ro-
bust momentum across regions, further strength-
ening market share. This is just the beginning
of a recovery cycle in passenger cars. Maruti’s
strong launch pipeline means it will post over
15% growth in volumes in FY17 and benefits from
the Seventh Pay Commission will be an added
positive.
Sour
ce: C
ompa
ny, P
hilli
pCap
ital I
ndia
Res
earc
h Es
timat
es
The following companies are likely to face operational
headwinds in 2016 leading to deterioration in key
performance indicators as compared to 2015

25GROUND VIEW GROUND VIEW Annual Edition 2016 Annual Edition 201624
Apollo Tyres
Lupin
Lupin: Challenging times
Lupin’s US portfolio has already seen over
15% price erosion and its key product
launches (Welchol, Renagel, Renvela) are
delayed by one year to Q4FY17 or be-
yond, which worsens its already weakened
near-term US pipeline. Recent acquisition
of Gavis in the US is the only respite, but
slippage in guidance for Gavis’ ANDA
approvals (20 p.a.) and growth are likely. Its
ambitious long-term R&D spend and lack of
any major drug launches in the US will drag
down operating efficiency in the near future.
Apollo Tyres: Losing grip
Channel checks suggest that Chinese compe-
tition is rapidly taking away market share in the
Truck-Bus-Radial (TBR) space given the pric-
ing advantage (25-30% cheaper). Moreover,
Apollo has taken up to 10% price cuts and is
contemplating further cuts in order to combat
this competition. Heightened competition and
increased pricing pressures will lead to margins
remaining strained and benefits generated
from lower raw material prices are likely to
reverse in FY16/17.

27GROUND VIEW GROUND VIEW Annual Edition 2016 Annual Edition 201626
LIC Housing Finance: Base(rate) is the spoil-
sport
Its stellar core performance so far in FY16 was ac-
centuated by improvement in margins. Decline in
cost of funds and stability in lending yields added
to NIM expansion – up 27bps yoy in H1FY16. The
re-pricing benefit on the liability side has already
being reaped, as proportion of term loan from
banks has been reduced to 15% from the highs
of 34% of total borrowing. The lending yield was
held up due to change in portfolio mix towards
high-yielding LAP. With transmission of policy rate
cut, the bank has reduced its base-rate in a more
aggressive manner in the previous quarter, mak-
ing the mortgage market more competitive. The
problems of asset quality and poor capital position
have forced most of the PSBs to focus on secured
businesses such as mortgages. Heightened com-
petitive intensity would exert pressure on the mar-
gin, translating into moderation in core earnings.
NII growth is likely to be 14% /30% in FY17/16 and
PAT growth at 14%/23%.
LIC Housing Finance
Marico
Marico: Parachute missing
Fall in prices of copra, Parachute coconut oil
(past growth driver) continues to face severe de-
flationary and competition headwinds. Increase
in premium for Rice Bran Oil vis-a-vis palm oil,
which has seen a collapse in prices, makes sig-
nificant price hikes difficult in its edible oils port-
folio. While other categories like value-added
hair oils and new innovations such as Saffola
Oats will perform well, absence of price hike in
its crucial coconut oil and edible oils portfolios
and overall slowdown in volumes will put pres-
sure on sales. Sales growth may throw negative
surprises led by price cuts and heightened com-
petitive activity. Operating profit growth is likely
to be lower in FY17 vs. FY16 as further gross
margin expansion is improbable.
Naveen Kulkarni ([email protected])
Anindya Bhowmik ([email protected])

27GROUND VIEW GROUND VIEW Annual Edition 2016 Annual Edition 201626
Total real returns on US stocks, bonds, bills, gold and the dollar, 1802-2012
So if this basket can outperform the most-admired
fund basket in the world for a sustained period, why
not be bullish on the Nifty?
Consider another approach. Let’s begin with basic
principles – with the merit of the asset-class itself.
The adjacent chart definitively drives the point that
equities have been, by far, the most productive invest-
ment.
The simple case for Indian equities
Nifty vs Berkshire Peformance in USD
Sour
ce: B
loom
berg
Sour
ce: B
loom
berg
How can we make a simple case for investing in Indian equities? There can be many approaches but allow me to share a rather interesting one – I won’t bore you with the usual ‘next trillion dollar opportunity’ drivel, but will try and make an argument with a focus on the ‘look and feel’ of the India story.
Think about the most admired investment compa-
ny in recent years – it has to be Berkshire Hathaway.
Berkshire is the platinum standard of equity investing
and for good reasons. If any equity basket has outper-
formed Berkshire, wouldn’t it be worthy of attention?
Well, as it turns out, Nifty has outperformed Berkshire
over 2000-15 and that too in USD terms.
However, this is in the US, a cynic might counter. Sure,
but best Indian corporates have performed as well as
the best US corporates. Consider the performance of
HDFC Bank’s stock vs. Apple’s (in terms of local currency).
HDFC Bank has been in lockstep with the stock of the
most valuable company in the world over a long period,
indicating the bank’s strength.
BY VARUN KUMAR

29GROUND VIEW GROUND VIEW Annual Edition 2016 Annual Edition 201628
HDFC Bank vs Apple Stock Price Performance, Local Currency
HDFC Bank vs Apple Market Cap (USD)
India’s break from slow growth phase happened in 80s.
Source: http://www.nber.org/papers/w10376.pdf
Sour
ce :
PwC
India’s GDP (PPP) Projection
Should you worry about the noise on reforms? I believe
concerns are overblown and the evidence is in India’s
history. While the commonly held belief is that India’s
growth turned over a new leaf after the 1991 reforms,
some serious academics have argued that the growth
turned around much before, in the 1980s. This camp has
people like Princeton Professor Atul Kohli and Harvard
Professor Dani Rodrik and current Chief Economic
Advisor Arvind Subramanian. Dani Rodrik and Arvind
Subramanian’s paper shows that the breakthrough in
growth came in 1980 itself – seen in the chart.
So where is the opportunity then? It is in the fact
that HDFC Bank is much smaller than Apple and that
there is a headroom for growth in the years to come.
That growth headroom will come from (clichéd, but true)
GDP growth over the next few decades (PwC projections).
The reason for this break was not big-
bang reforms but simply the government’s
pro-business attitude, which helped in
the ease of doing business (compared
with constrained License Raj days) and
unleashed productivity growth in Indian
companies – this can also be seen in the
chart. Given bottlenecks in the economy
today and the focus of the government on
ease of business, this attitude shift itself
can do wonders. Reforms would be a big
icing on the cake.
Varun Kumar ([email protected])

29GROUND VIEW GROUND VIEW Annual Edition 2016 Annual Edition 201628
India’s break from slow growth phase happened in 80s.
Source: http://www.nber.org/papers/w10376.pdf
BELOW: Most brokerages (including us) were bullish on Indian equi-ties’ prospects in 2015 as seen in their December 2015 predictions
Sour
ce: F
inan
cial E
xpre
ss
Last year saw a consensus in bullishness about the prospects of Indian equities. At the beginning of the year, we were also expecting a healthy 18% EPS growth for our model portfolio, propelled by favourable tailwinds. However, a plethora of global factors unseated these tailwinds and we are poised to end the year with a negative Nifty return.
2015 - YEAR IN CHARTS
BY ANINDYA BHOWMIK
31GROUND VIEW GROUND VIEW Annual Edition 2016 Annual Edition 201630
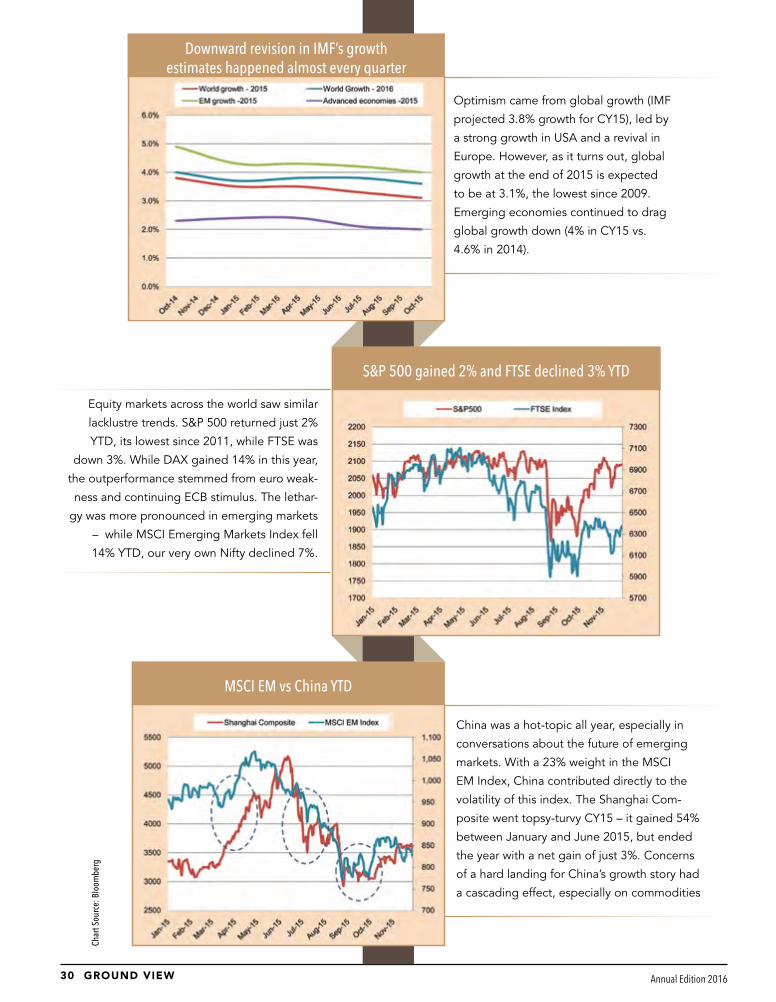
China was a hot-topic all year, especially in
conversations about the future of emerging
markets. With a 23% weight in the MSCI
EM Index, China contributed directly to the
volatility of this index. The Shanghai Com-
posite went topsy-turvy CY15 – it gained 54%
between January and June 2015, but ended
the year with a net gain of just 3%. Concerns
of a hard landing for China’s growth story had
a cascading effect, especially on commodities
MSCI EM vs China YTD
Downward revision in IMF’s growth estimates happened almost every quarter
Optimism came from global growth (IMF
projected 3.8% growth for CY15), led by
a strong growth in USA and a revival in
Europe. However, as it turns out, global
growth at the end of 2015 is expected
to be at 3.1%, the lowest since 2009.
Emerging economies continued to drag
global growth down (4% in CY15 vs.
4.6% in 2014).
Equity markets across the world saw similar
lacklustre trends. S&P 500 returned just 2%
YTD, its lowest since 2011, while FTSE was
down 3%. While DAX gained 14% in this year,
the outperformance stemmed from euro weak-
ness and continuing ECB stimulus. The lethar-
gy was more pronounced in emerging markets
– while MSCI Emerging Markets Index fell
14% YTD, our very own Nifty declined 7%.
S&P 500 gained 2% and FTSE declined 3% YTD
Char
t Sou
rce:
Blo
ombe
rg
31GROUND VIEW GROUND VIEW Annual Edition 2016 Annual Edition 201630
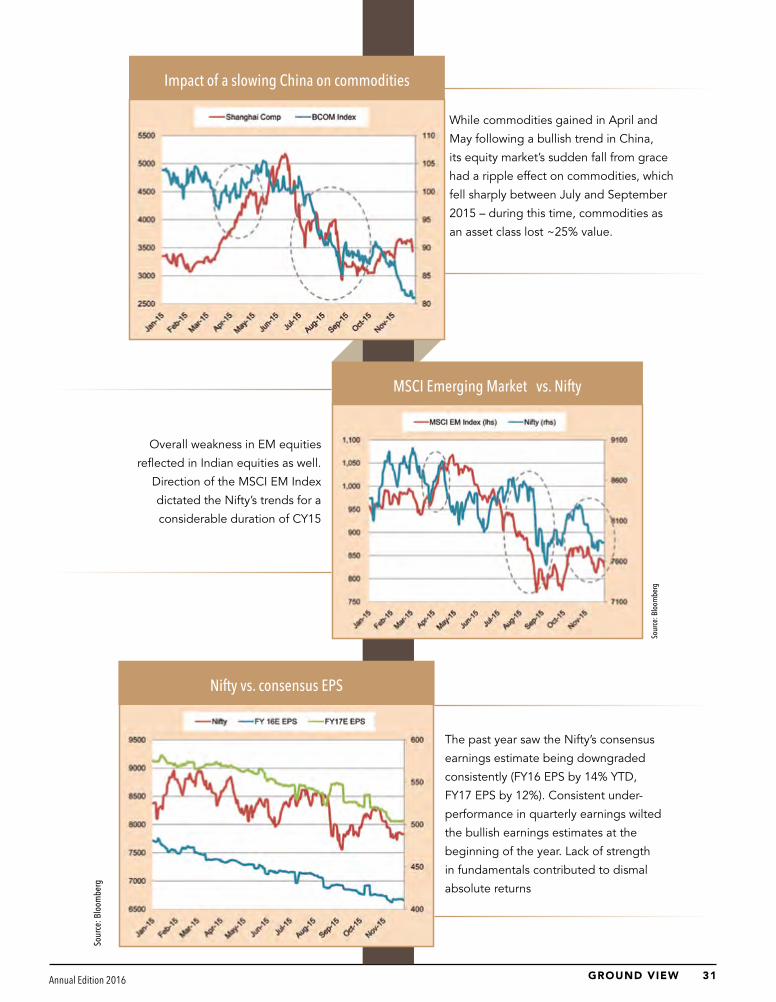
Impact of a slowing China on commodities
The past year saw the Nifty’s consensus
earnings estimate being downgraded
consistently (FY16 EPS by 14% YTD,
FY17 EPS by 12%). Consistent under-
performance in quarterly earnings wilted
the bullish earnings estimates at the
beginning of the year. Lack of strength
in fundamentals contributed to dismal
absolute returns
Overall weakness in EM equities
reflected in Indian equities as well.
Direction of the MSCI EM Index
dictated the Nifty’s trends for a
considerable duration of CY15
MSCI Emerging Market vs. Nifty
Nifty vs. consensus EPS
While commodities gained in April and
May following a bullish trend in China,
its equity market’s sudden fall from grace
had a ripple effect on commodities, which
fell sharply between July and September
2015 – during this time, commodities as
an asset class lost ~25% value.
Sour
ce: B
loom
berg
Sour
ce: B
loom
berg

33GROUND VIEW GROUND VIEW Annual Edition 2016 Annual Edition 201632
Falling global commodity prices and
the Indian government’s prudent
fiscal policy has been able to rein in
inflation. CPI inflation has been less
than 5.5% for CY15, below the RBI’s
target at the beginning of the year of
6% by January 2016.
On the other hand, FDI flows have
been very strong this year – cumu-
lative total inflow between January
and September 2015 was US$
27bn, a strong 18% like-to-like
increase over 2014.
FDI flows (in mn USD)
Inflation vs 10 Yr yieldCh
art S
ourc
e: B
loom
berg
Net foreign equity inflow per month vs. movements in monthly Nifty chart
Foreign flows into equity started slow-
ing from the start of 2015. Net foreign
equity this year was at US$ 752mn until
November vs. ~US$ 1.5bn in 2014

33GROUND VIEW GROUND VIEW Annual Edition 2016 Annual Edition 201632
This has helped the RBI to start the easing
cycle – repo rate cuts for 2015 totalled
125bps. However, banks have been slow
in passing on the benefits – the base rate
came down by only 70bps in this period.
SBI and HDFC: Repo rate vs. base rate
Trend of new project additions (in Rs bn)
Char
t Sou
rce:
Blo
ombe
rg
Sour
ce: B
loom
berg
With the demand environment not improv-ing, the trend of new project addition has seen a marked slowdown. The strong mo-mentum seen in project announcements in the latter end of last year has seen a marked slow-down, which is understandable under the context of demand paucity.
The real-estate sector continued to
suffer in 2015 – unsold inventory
levels in eight major city regions
increased 18% yoy in terms of
area and 24% in terms of months
required to sell.
Unsold stock (msf)

35GROUND VIEW GROUND VIEW Annual Edition 2016 Annual Edition 201634
Robust tax collection in FY16 fiscal (led by windfall gains due to excise on petroleum products) at 22% yoy enabled the gov-ernment to maintain spending momen-tum. Cumulative capital expenditure has increased by 29% yoy and has been a key driver in moving the economy
Despite facing opposition, the govern-ment has been intent on passing key re-forms – although the land acquisition bill had to be scrapped from re-introduction after passing ordinance on it thrice, other key reforms in the government’s legisla-tive agenda were implemented – these include:
a Hiking FDI limits in Insurance a Coal mining billa Mines and minerals development billa Regional Rural Banks Billa Undisclosed foreign income and assets bill
GST and Real Estate Regulation Bill is also likely to be passed by the legislature in the on-going winter session.
Also, a large number of incremental re-form initiatives were undertaken this year. Prominent ones were:
a UDAYa Liberalizing FDI norms for various sectorsa E-biz portal introduction – single win-dow clearance platforma Deferring GARR by two yearsa Market-rate based gas price revision
mechanisma New exit policy for stressed private players in road sectora Increased allocation in road sector and front-loading expenditure in road constructiona Fostering competitiveness among States to excel in ease of doing busi-nessa Jan Dhan scheme to ensure financial inclusion
Key events that could sway the markets include:
• Passing the GST legislation and its speedy implementation
• Acceptance of 7th Pay Panel Recom-mendations in Budget
• Bankruptcy bill Amendment• Real Estate (Regulation And Develop-
ment Bill)• MSME Development Bill• Execution uptick under AMRUT• Revising the PPP model of infrastruc-
ture development according to Kelkar Committee report.
Notwithstanding the gloomy outlook of other emerging economies, India has been strengthening structurally and the positive momentum will definitely be carried forward next year. The economy should take longer strides in 2016, which will draw out a stronger 2016 for Indian equity markets.
Anindya Bhowmik ([email protected])
However, as the year ends, a few structural pieces
seem to be falling into place and could give a
much-needed boost to the economy in 2016.
Inventory in months
High inventory pile-up has caused new pro-
jects off-take to slow and the entire real-es-
tate-based ecosystem – builders, real estate in-
vestors, and workers – has suffered as a result.
Unsold inventory levels across the country are
now above 36 months. Only NCR region has
seen marginal decrease sequentially.
Trend in Cumulative Tax collection and Capital Expenditure

35GROUND VIEW GROUND VIEW Annual Edition 2016 Annual Edition 201634
BY DHAWAL DOSHI & NITESH SHARMAA U T O M O B I L E S
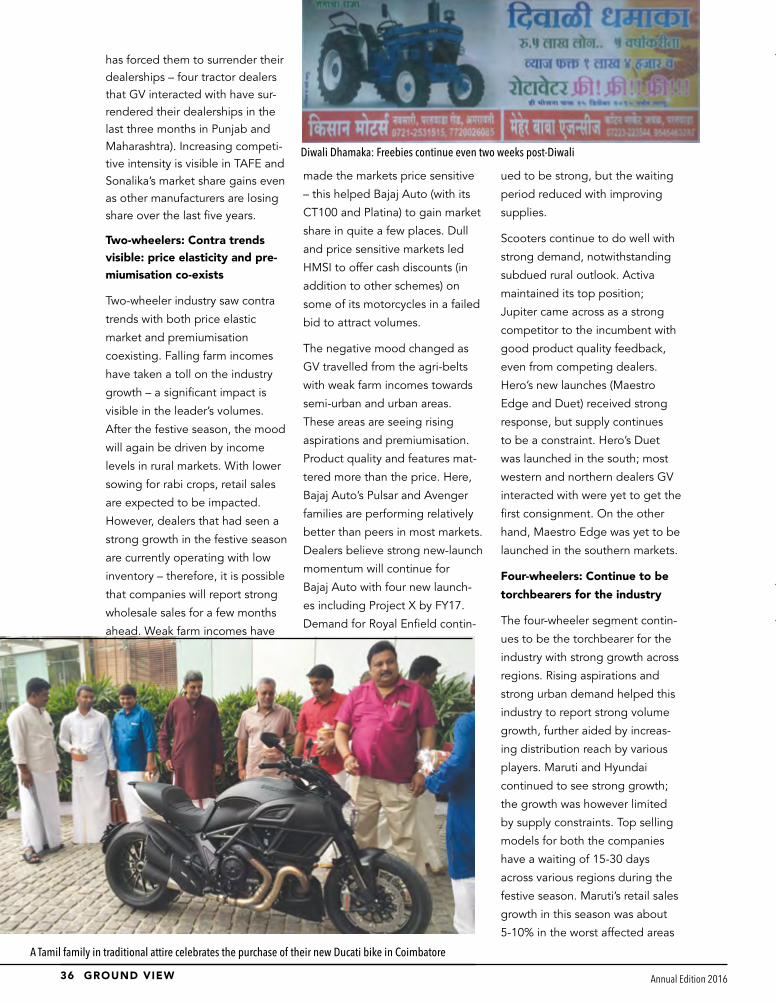
Price elasticity and premiumisation co-exist“Diwali is Diwali. I have seen 40 Diwalis and it is never different. People take loans during bad times but never stop spending in Diwali” – says a 2W, 4W and consumer electronics dealer in Nagpur.
Festive cheer was seen majorly across 10
states and 20 cities (barring a few places)
that GV visited, with strong momentum in
sales during the festive season. However,
this mood was not prevalent before the
festive season and is not likely to persist
after it. Weak monsoons, implying rural
weakness, and asset price (real estate and
gold) weakness impacted most markets while
states seeing higher infrastructure activity are
seeing strong demand pull. The prominent
theme – improving urban and weak rural
demand – continues.
Tractors: Continue to languish; strong
competitive intensity is impacting smaller
players
Deficient and inconsistent monsoon leading
to crop failures/lower yields, and oversupply
led by easy financing (highlighted in the No-
vember 2015 Ground View issue) have led to
subdued tractor volumes over the last year.
This is further exacerbated due to higher
repossessed stocks by various financing com-
panies (Madhya Pradesh market has seen
very high tractor repossessions over the last
one year; Punjab is seeing strong tractor re-
financing trends, limiting fresh sales). Dealer
interactions suggest demand revival is still
a while away with no major improvement in
demand until September 2016. Even this is
dependent on normal monsoons next year.
Increasing competitive intensity and chang-
ing terms of trade are also seen as deterrents
to dealer profitability. Credit periods offered
for down payments to be made by farmers,
exchange schemes, and price under-cutting
(Sonalika sells 15-20% cheaper compared
to its competitors across various markets) is
also seen as a deterrent to dealer profita-
bility. Few dealers said that profit pressures
and inventory pushing by few companies
Sonalika and TAFE has seen market share gainsSo
urce
: Cris
il, P
hilli
pCap
ital I
ndia
Res
earc
h
37GROUND VIEW GROUND VIEW Annual Edition 2016 Annual Edition 201636
has forced them to surrender their dealerships – four tractor dealers that GV interacted with have sur-rendered their dealerships in the last three months in Punjab and Maharashtra). Increasing competi-tive intensity is visible in TAFE and Sonalika’s market share gains even as other manufacturers are losing share over the last five years.
Two-wheelers: Contra trends visible: price elasticity and pre-miumisation co-exists
Two-wheeler industry saw contra
trends with both price elastic
market and premiumisation
coexisting. Falling farm incomes
have taken a toll on the industry
growth – a significant impact is
visible in the leader’s volumes.
After the festive season, the mood
will again be driven by income
levels in rural markets. With lower
sowing for rabi crops, retail sales
are expected to be impacted.
However, dealers that had seen a
strong growth in the festive season
are currently operating with low
inventory – therefore, it is possible
that companies will report strong
wholesale sales for a few months
ahead. Weak farm incomes have
made the markets price sensitive
– this helped Bajaj Auto (with its
CT100 and Platina) to gain market
share in quite a few places. Dull
and price sensitive markets led
HMSI to offer cash discounts (in
addition to other schemes) on
some of its motorcycles in a failed
bid to attract volumes.
The negative mood changed as
GV travelled from the agri-belts
with weak farm incomes towards
semi-urban and urban areas.
These areas are seeing rising
aspirations and premiumisation.
Product quality and features mat-
tered more than the price. Here,
Bajaj Auto’s Pulsar and Avenger
families are performing relatively
better than peers in most markets.
Dealers believe strong new-launch
momentum will continue for
Bajaj Auto with four new launch-
es including Project X by FY17.
Demand for Royal Enfield contin-
ued to be strong, but the waiting
period reduced with improving
supplies.
Scooters continue to do well with
strong demand, notwithstanding
subdued rural outlook. Activa
maintained its top position;
Jupiter came across as a strong
competitor to the incumbent with
good product quality feedback,
even from competing dealers.
Hero’s new launches (Maestro
Edge and Duet) received strong
response, but supply continues
to be a constraint. Hero’s Duet
was launched in the south; most
western and northern dealers GV
interacted with were yet to get the
first consignment. On the other
hand, Maestro Edge was yet to be
launched in the southern markets.
Four-wheelers: Continue to be
torchbearers for the industry
The four-wheeler segment contin-
ues to be the torchbearer for the
industry with strong growth across
regions. Rising aspirations and
strong urban demand helped this
industry to report strong volume
growth, further aided by increas-
ing distribution reach by various
players. Maruti and Hyundai
continued to see strong growth;
the growth was however limited
by supply constraints. Top selling
models for both the companies
have a waiting of 15-30 days
across various regions during the
festive season. Maruti’s retail sales
growth in this season was about
5-10% in the worst affected areas
A Tamil family in traditional attire celebrates the purchase of their new Ducati bike in Coimbatore
Diwali Dhamaka: Freebies continue even two weeks post-Diwali

37GROUND VIEW GROUND VIEW Annual Edition 2016 Annual Edition 201636
and around 30% in regions where economic activity
continues to be strong. While festive sales were strong,
dealers said there were no signs of a slowdown.
M&M and Tata Motors saw a mixed response in festive
sales with rural market slowdown being a pain point.
Well-irrigated areas and regions with strong infrastruc-
ture development saw growth, while areas with lower
farm incomes (areas dependant on monsoons) saw
sluggishness in volumes. Dealers of both companies
were upbeat on new launches helping them gain some
traction in volumes. TUV 300 saw strong bookings
with waiting across regions. However, this cannibalised
Bolero volumes by 15-20%. M&M lost market share to
Maruti in its biggest market (Uttar Pradesh) because
of the latter’s aggression in distribution reach and new
product pipeline.
Annual sales trajectory of one of the leading Maruti Dealer
Milestones set by Maruti dealer to drive performance
Maharashtra accounts for 12% of passenger vehicle
sales in India and 8% of two wheeler sales. GV
spent three days touring Maharashtra in which it
held 25 meetings with channels in Nagpur (also
known as Maharashtra’s second capital or winter
capital), Amravati (divisional headquarters) and
Nasik (administrative and divisional headquarters).
The visits highlighted contrasting trends – with
Vidarbha impacted by falling farm incomes due to
lower monsoons while Nasik showed strong growth
backed by robust agri output as the area is well irri-
gated and not dependant on monsoons. However,
Nasik is considered an outlier – most of Vidarbha
and Marathwada have seen deficient rainfall, which
has significantly impacted their economies.
Vidarbha: A tale of two economies
Refer to the November 2015 Ground View issue for a detailed report
With more than 50% of crop failure, the agri-de-pendent economy in Vidarbha has seen a signif-icant impact; farmers are delaying even some of their discretionary medical treatments (incidentally affecting hospital revenues). This has impacted overall two wheeler and tractor sales, which con-tinue to report strong negative growth. Companies with more rural-centric portfolios, such as Hero Mo-tocorp and M&M have seen their volumes plunge.
The other part of Vidarbha mirrors any upcoming region in India, where aspirations are rising and pre-miumisation is evident – probably nothing reflects this better than the presence of major automobile brands (both Indian and international) in the cities. It consists of a rising middle class (like any other region in India), the business community, govern-ment employees and other salaried people and the construction segment. Rising aspirations and better brand awareness has seen companies with a more premium product portfolio outpacing the growth compared to industry trends. Bajaj Auto, with its premium motorcycle segment and four-wheeler producers such as Maruti and Hyundai saw strong volumes defying the overall market slowdown.
Maharashtra: Agriculture bites

39GROUND VIEW GROUND VIEW Annual Edition 2016 Annual Edition 201638
Hero Motocorp: Strong festive sales save the day
Strong 10% festive-season growth helped the company report flat volumes YTD FY16 until Diwali. The company has lost market share to Bajaj Auto, especially in the entry-level segment. Dealer inventory currently stands at less than a month and while a dealer that GV interacted with expects some inventory push, given Hero’s relaxed credit-period norms, the dealer was not particularly concerned. Hero is offering a 15-day credit period against cash-and-carry ear-lier. Festive season saw an even higher credit period of about 1.5-2.0 months.
Newly launched Maestro Edge saw strong bookings; however, Duet was yet to be launched in Nasik. The dealer expected the first consignment of Duet in the last week of November 2015. He spoke of a strong R&D pipeline with expectations of the company launching new products over the next few years – he said 8-10 new products were lined up by the R&D team including one higher CC bike.
Bajaj Auto: Strong new launch mo-mentum
With four showrooms in the region and six sub dealers, dealers saw flat volume growth until the festive season. Howev-er, a strong 15% volume growth during the festive season saw the dealer be-coming one of the fastest growing in the region – 30% of overall volumes came from CT/Platina, which helped these products gain market share. Discover accounts for 15% of overall volumes and was doing better than targets; 40% of volumes came from Pulsar while the rest came from Avenger and KTM. Contrary to the industry trends, the ratio of sales through financing mode has come down to 60% from 80% 2-3 years ago.
The recently launched Avenger has seen a very strong response with monthly sales moving up 10x. With more than 150 deliveries and 60 bookings, Aveng-er volumes significantly contributed to festive growth for the dealer. This compares to monthly run rate of just 15 units for the old Avenger until the festive season began. More than 50% of the new Avenger sales came from the 150cc seg-ment while the Cruiser and Street versions accounted for 10% and 40% respectively. While 10x sales were due to the new launch euphoria, the dealer expects this to continue at 3-4 times the old run rate.
New Avenger 150CC waiting to be delivered
“We currently have an inventory of less than a month; there can be some inventory push from the company now, but we are not concerned about it as the company has relaxed the credit norms.”
–A Hero dealer in Nasik
“We have gained market share in the region helped by CT100 and Platina.”– A Bajaj dealer in Nasik
Nasik: Six rivers and 16 dams are
supporting the economy
Nasik, a city known for the famous
Kumbh Mela and grapes, depends
strongly on the farming economy
from nearby areas. However, unlike
other parts of Maharashtra, farm
incomes here are not as significantly
impacted – therefore, they haven’t
affected the sales momentum of au-
tomobile companies. Nasik has the
advantage of 16 dams on six rivers
(Godavari, Vaitarana, Bhima, Girana,
Kashyapi and Darana) – these have
insulated the local economy from the
vagaries of monsoons. Grapes and
pomegranate account for 60-70% of
the land under cultivation. Sugarcane
accounts for 10% while the rest is
from vegetables and grains. While
pomegranate yields have been
impacted in few areas, the rest of the
areas have seen a good crop.
Two wheelers: Flat yoy; Bajaj gain-
ing market share
Festive season saw Nasik’s
two-wheeler industry cheer with
10-15% growth; however, Q1FY16
volumes were very weak (lower
grapes sowing last year had impact-
ed volumes) saw the industry report
flat volumes YTDFY16. With better
sowing this year, volume momentum
is expected to improve – this year
should end with good growth. Bajaj
Auto and TVS Motors have seen
strong volume, outpacing industry
growth. Royal Enfield continued
to see strong demand, but waiting
came down to 2-4 months from 3-6
months earlier.

39GROUND VIEW GROUND VIEW Annual Edition 2016 Annual Edition 201638
The dealer did not see any cannibali-sation from the new Avenger 150cc for Pulsar series, but expects marginal canni-balisation after the festive season.
Overall, the mood remained strong with no major signs of slowdown seen for the rest of the year. With yields lower for pomegranate and onions (rains impacted standing crops), the dealer expects some weakness to kick in from April 2016.
TVS Motors: Jupiter driving the show
TVS reported 10-15% growth during the festive season with majority of sales coming from Jupiter, which accounted for 35% of overall volumes for the dealer. Better mileage compared to Activa is a major selling point for Jupiter in the region. Starcity accounted for 16% of the volumes and saw strong feedback from customers. The dealer expected Starcity volumes to pick up given strong feedback. While the dealer spoke highly about the product quality, he felt the company can improve its overall mar-keting strategy. The recent deal with Amitabh Bachchan was seen as a strong driver for volumes.
Four wheelers: Strong growth contin-ues; city awaiting Nexa
The four-wheeler industry reported strong volume growth, not only during the fes-tive season but also during the year. The growth once again continues to be sup-ply-constrained with a waiting of 15-30 days for newly launched and top-selling models for different companies. Inventory continues to be low across the system. The city awaits the entry of Maruti’s premium dealership Nexa, with deal-ers talking of strong referrals for Scross passed on to Mumbai and Pune branch-es. Other companies also benefitted from the negative publicity for VW, which saw its monthly volumes fall by 40%. Maruti and Hyundai gained from VW’s loss.
Maruti: Strong volume growth con-tinues; 2 Nexa showrooms to open in Q4FY17
Maruti continued to see strong volume traction, which helped the dealer report 15-20% volume growth during the festive season. Overall, the dealer expects sales to grow by 10-12% in FY16 (conservative estimate) despite weak Q1FY16, which was impacted by weak rural market demand.
Dzire accounted for around 25% of volumes while Swift, Alto and Wagon R accounted for 15% each. Ciaz has seen a pick up in volumes with word-of-mouth publicity due to the strong performance. Ertiga saw a waiting of close to a month, hence accounted for a lower share of total volumes.
Nasik does not have a Nexa showroom, but the hype around it was quite strong. Of the three Maruti dealers in the region, two are expected to open a showroom in Q4FY16. The dealer already highlighted some impact on Dzire volumes because of the recently launched Baleno. This is despite the region having no Nexa. The dealer had passed on more than 100 refer-ences to the Nexa showrooms in Mumbai and Pune, most of which were for Scross.
A Hyundai dealer also spoke highly about Nexa and expects it to be a success with good products under its stable. The dealer was categorical about Baleno and was expecting some impact to its I20 volumes. On the other hand, the Maruti showroom that did not have an upcoming Nexa was negative about Nexa products. When asked about Scross, the employee tried to cross-sell Swift saying it is a simi-lar product at half the price.
Both Maruti dealers that GV visited were upbeat on volumes and expected De-cember month volumes to also be strong, driven by exchange schemes.
M&M: Gained more compared to its competitors
The M&M showroom in Nasik was the second in the city and three years old. The dealer reported a strong 40% growth in the festive season, but on a low base. The dealership has already incurred a loss of Rs 20mn over the past three years due to lower volumes. However, with volumes picking up, it is looking at its first profit since opening. The two dealers in Nasik together sell around 400 units a month. Festive time volume growth for the two dealers was 15-20%. Both the personal and pick-up segments report strong vol-ume growth. Pick-ups account for 60% of this dealership’s volumes. While TUV 300 has seen strong response, it has cannibal-ised Bolero. Also Hyundai’s Creta has had an impact on XUV500 sales.
Strong customer activity at the Bajaj Auto showroom even after Diwali Under construction Nexa showroom in Nasik
“Sir, Scross kyu lena hai. Swift dekhiye na. Same product hai aadhe daam pe (Sir, why do you want to buy Scross; look at Swift. It’s the same product at half the price).” – A non-Nexa Maruti dealer in Nasik
Customers largely completing delivery formalities on the day after Diwali

41GROUND VIEW GROUND VIEW Annual Edition 2016 Annual Edition 201640
Tractors: A trend contrary to the rest
of Maharashtra
Good irrigation facilities have insu-
lated the farm economy from defi-
cient rainfall. This has had a positive
delta on tractor industry volumes in
the region, which have seen growth
compared to a fall in the rest of Maha-
rashtra. M&M continues to enjoy the
leading position followed by Swaraj,
while Sonalika is in third place. Interac-
tion with a Swaraj dealer highlighted
the fact that Sonalika was the fastest
growing in the segment and was
significantly gaining share from others.
While Swaraj grew 25% during the fes-
tive season, the dealer pegs Sonalika’s
growth at nothing less than 30%.
Aggressive marketing strategies and
lower prices (15-20% cheaper than
competition) by Sonalika are impact-
ing other players. One ex-M&M tractor
dealer that GV interacted with surren-
dered his dealership due to the rising
credit periods that he was forced to
offer farmers, which is a significant
drag on profitability. The painstaking
process of recovering down-payments
led to the dealer surrendering his
dealership and focusing on two-wheel-
er and four-wheeler dealerships that
he has in Nasik and around.
Uttar Pradesh – All-round growth led by infra boost
GV spent four days extensively touring Uttar
Pradesh, which is the largest market for two-wheel-
ers and second-largest for passenger vehicles. GV’s
road trip over 500km consisted of 25 dealer meet-
ings in Varanasi, Allahabad, Kanpur, and Lucknow.
Growth in the region has picked up, led by higher
government spends on infra recently as state elec-
tions near. However, pressure remained in rural are-
as. From Varanasi airport to the city, the many faces
of India were clearly visible – overcrowded small
passenger commercial vehicles, high penetration
of bicycles with many people commuting on these
(some even with heavy luggage), some luxury bikes
and PVs, and the presence of the cab aggregator
OLA in this otherwise small region.
TOP: Overloaded vehicles and overcrowded private transport are a common sight; BOTOOTM: Cycle usage is quite high in Varanasi and the whole of UP,

41GROUND VIEW GROUND VIEW Annual Edition 2016 Annual Edition 201640
No buyers at Multix; dealership was full of inventory with only five sales in three months
Eicher Polaris Multix
The distribution channel here was company owned, which was
surprising. The dealership was three months old, and the mood
was sombre as the employees said they have sold only five units
since opening. Given the category, even consumer footfalls were
very poor. In terms of product, customers seemed disappointed
with the wishbone suspension vs. higher load carrying multi-leaf
suspension that rivals sport; they were also disappointed with the
smaller engine of 500cc. Overall, the employees highlighted that
the marketing and customer education effort by the company
needs to be stepped up in a big way to improve sales.
Maruti Suzuki
Ye saal kamaal raha hai. Dzire, Swift petrol, Wagon R, Alto K10 ka maal hi nahi hai (this year has been rocking. No inventory of Dzire, Swift petrol, Wagon R, Alto K10.
- Maruti dealer on demand
Varanasi Allahabad Kanpur Lucknow
PVs Marketsize (pm) 1300 1100 1500 4000
Key marketshare holders
Maruti - 42%, M&M 30%
Maruti - 38%, M&M 19%
Maruti - 50%, M&M 20%
Maruti - 43%
2Ws Marketsize (pm) 5500 8500 10000 NA
Key marketshare holders
Hero Moto - 48% Hero - 50%, Bajaj 21%
Hero - 49%, Honda - 24%,
Bajaj - 14%
Player wise performance
Maruti
M&M NA
Hero Moto NA
Bajaj Auto NA
TVS NA
HMSI
Details on marketsize and playerwise performance
Maruti is rapidly taking market share - we were given target of 21% growth, but we will easily surpass it. I have recently received approval for Nexa.
- Maruti dealer
Maruti had grown by a strong 20-30%
YTD in all the regions of Uttar Pradesh
that GV visited. Swift and Dzire saw strong
demand momentum with dealer inventory
being nil; in a few places there were wait-
ing periods for these models. A Mahin-
dra’s Bolero was the top-selling model in
eastern UP region until FY15, this year the
throne has been taken over by Maruti’s
Dzire. Automatic cars were preferred even
in this small town with Celerio AMT hav-
ing a month’s waiting period. Varanasi and
Allahabad didn’t have a Nexa showroom
yet; however one of the dealers was plan-
ning to open it soon. Maruti didn’t feel
any heat because of Kwid, but Hyundai’s
Eon did. Discounts were ~Rs 4000 more
due to festive season offers; are expected
to taper off from December.

43GROUND VIEW GROUND VIEW Annual Edition 2016 Annual Edition 201642
Mahindra Automotive
M&M was seen struggling all across
UP with festive season providing some
relief. Sales saw a sharp drop of over
15-25% YTD in various regions due
to weak rural demand, especially for
Bolero. However, festive season saw
some pickup in growth with volumes
up 5-10%. Mahindra is the sec-
ond-largest player in all four regions
of UP that GV visited. TUV300 has
seen good demand and had a waiting
of 3-4 weeks, but dealers expect
this model to slowly fizzle out as the
engine is puny and customers are
complaining about the engine noise.
Bolero has seen an impact of 15-20%
due to the launch of TUV300. Scorpio
and XUV500 saw good demand, but
Bolero volumes declined to high teens.
M&M’s commercial segment continued
to be subdued, even in the festive
season, with over 20-25% decline.
Inventory levels were low at four weeks
and 65-70% of sales were financed.
TVS Motors
While feedback for TVS was very posi-
tive it was amusing to see a resurgence
of mopeds; TVS had launched its new
moped TVS XL100 recently and has
seen surging demand with the deal-
ership booking over 300 units in just
three days. GV understood that the
main reason for such a rise in demand
was a high powered 100cc engine vs.
previous mopeds that had an anaemic
70cc engine. The new moped can car-
ry heavy goods, has larger tyres, and
an attractive price tag of Rs 32,000 (on
road). TVS enjoyed a strong 15-20%
growth in the festive season across UP.
Demand for Jupiter remains strong
and has been taking market share
from Honda Activa. TVS Apache is also
enjoying strong growth; Wego and
Phoenix 125 are not doing well. TVS
was the fastest growing player in the
last two years in the region. The deal-
ership was eagerly awaiting the launch
of TVS Victor in January-February 2015
and TVS-BMW’s 330cc motorcycle
in April 2015. Apache has suddenly
started gaining market share after it
launched tubeless tyres and rear disc
brakes. TVS’s local official revealed that
Apache is the #1 premium motorcycle
now in western Uttar Pradesh (Agra,
Meerut region). Overall demand mo-
mentum seemed to continue for TVS
in this region.
Honda Motorcycles and Scooters
The festive season was not as bright for
Honda’s two-wheelers due to declining
sales of motorcycles. Dealers said they
were sitting on almost three months of
motorcycles inventory with the Dream
series sales nose diving and Honda’s
best seller 125cc Shine taking a hit in
demand as its resale value is very poor,
thereby deterring customers.
While Honda’s motorcycle sales were
declining, growth in scooters was
holding up with double-digit festive
sales growth. However, dealers voiced
concerns of market share losses to TVS
Jupiter.
Bajaj Auto
Bajaj Auto is the second largest player
in the regions GV visited within motor-
cycles. It was seeing growth all across
regions, even the ones struggling due
to rural impact. Preference for premi-
um products was clearly visible with
the Pulsar pack posting growth even in
Bolero leading to a sharp declining position for M&M in the region Moped segment resurgence
First time we are getting a premium of Rs 5000 (above MRP) on a TVS product. - TVS dealer on TVS XL100
Mahindra’s Bolero was the top selling model in eastern UP region until FY15, this year the throne has been taken over by Maruti’ Dzire. Bolero now stands second and Swift third. - Maruti dealer
Teen customer ne aake complain ki hai ke engine bahot aawaaj kartaa hai (three customers have comeback after buying and complained that engine is making huge noise at higher speeds)
- M&M dealer on TUV300

43GROUND VIEW GROUND VIEW Annual Edition 2016 Annual Edition 201642
Discounts and offers higher during festives
an otherwise dull market of Varanasi. It
was surprising to see that Discover is still
holding on in the region and forms a de-
cent chunk of Bajaj’s volumes; CT100 has
not seen any traction in the region (this
model has seen good demand across the
country). Response to Avenger has been
strong with dealer expecting 3x sales.
Hero Motocorp
There was mixed feedback for Hero
with Varanasi and Lucknow seeing 6-7%
decline in volumes during the festive
season while Kanpur grew 8% and
Allahabad by 20%+. Demand from rural
customers is majorly impacting Hero
Motocorp; Hero dominates the mar-
riage season in UP with its market share
touching 65-70%. New Splendour Plus
with self-start and Maestro saw good
demand, but the company has not been
able to fulfil it. Inventory ranged from
6-8 weeks. Overall, no respite was seen
in the near term, and demand pickup
seems dependent on vagaries of mon-
soon in 2016.
No space to fill further inventory
Honda motorcycles chock-full inventory

45GROUND VIEW GROUND VIEW Annual Edition 2016 Annual Edition 201644
Gujarat: Tight liquidity and lower yields impact
GV team spent two days in Gujarat
meeting various dealers in Rajkot and
Ahemdabad. The state accounts for
around 8% of four-wheeler sales and
6% of two-wheeler sales in India. Busi-
ness environment looked a bit weak,
but was far better than Maharashtra.
The weakness was relative to its past
performance and expectations of high-
er growth. Lower cotton yields (cot-
ton accounts for around 70% of land
under cultivation in Saurashtra, part of
Gujarat) and lower liquidity impacted
businesses on a yoy basis. With money
stuck in real estate (undergoing a time
correction after the price fall) and stock
markets, overall liquidity seems to be
impacted for the region. However, Gu-
jarat still fares better than other states
of India on the liquidity front.
Two wheelers: Lower cotton yields
impact
This industry saw flat to marginally
negative growth YTDFY16 primarily
driven by weaker motorcycle sales.
This was partly offset by growth in the
scooter segment, which saved the day.
Festive season sales grew in single
digits with Bajaj and Honda showing
higher growth. Festive season growth
for Hero was in low single digits, con-
strained by lower availability of newly
launched scooters. Inventory situation
was comfortable, given positive festive
season sales. However, the outlook was
subdued with dealers expecting no
major pickup in activity until the start of
next year. Dealers further highlighted
inventory push coming in from compa-
nies such as HMSI and Hero Motocorp.
Hero Motocorp: Overall flat; festive
season saves the day
Lower farm incomes and general indus-
try slowdown took a toll on Hero Moto-
corp’s sales in the region. GV met two
dealers in Rajkot and Ahmedabad each
selling over ~1,200units/month; festive
season saw good growth of 5-7% but
was lower than the 12% target set by
the company in the region. Scooters
drove overall growth for the company
with strong response to the recently
launched Maestro Edge (scooters al-
ready account for 50% of industry sales
in Ahemdabad). Duet was not launched
yet in the region and was expected to
reach the dealers in first week of De-
cember. YTD retail sales in the region
were flat and dealers expected full year
sales to be flattish.
Inventory stood at 1.0-1.5 months.
Dealers expected some inventory
push ahead given overall low inven-
tory situation. Stock situation in some
models saw dealers losing customers
to competition. A dealer highlighted
losing 40-50 customers, as he did not
have black and grey Passion Pro. Deal-
ers perceive Honda’s Dream series as
competition. Maestro Edge had a good
start in the region with waiting periods
of over two weeks.
Bajaj Auto: Strong festive growth;
overall positive momentum to con-
tinue
New product launches have helped Ba-
jaj Auto to perform better compared to
its peers notwithstanding the general
market slowdown – 70% of Bajaj’s deal-
ers in Gujarat have seen good growth.
Festive season saw 131% growth in the
M1 segment in Gujarat (after CT100
launch at the end of FY15) while the
premium segment saw 21% growth
driven by the new Avenger and Pulsar
series. The growth in the premium seg-
ment is further likely to be strong given
Avenger 150cc is yet to be launched in
Gujarat (as on November
Cotton fields
Maestro Edge displayed at a Hero showroom in Ahemdabad

45GROUND VIEW GROUND VIEW Annual Edition 2016 Annual Edition 201644
2015 end). The dealer said that he sees
new product launches ahead with a
gearless bike coming in FY16 and few
more products in FY17. He has a target
of 15-20% growth for Bajaj Auto in
Gujarat mainly fuelled by new launches.
He generates 40% of volumes through
CT100/Platina and 30% through Pulsar.
Four wheelers: Holding strong
A couple of Maruti dealers in Ah-
medabad/Rajkot said they could clearly
see very strong growth momentum
as urban demand remained robust.
However, some sluggishness was seen
in M&M sales due to its aging portfo-
lio. The trends could be corroborated
in the region as well with MSIL (ex-
Nexa) growing by a strong 14% YTD in
Gujarat.
Maruti dealer – Rajkot
Maruti has seen a robust 25%+ growth
YTD in this region with substantial mar-
ket share gains. The dealer sells over
1,200 units monthly and has seen a
growth across the region as monsoons
in Saurashtra were good and SMEs
are healthy. Inventory was very low at
around three weeks with demand for
Swift and Dzire being the strongest.
Maruti Dealer – Ahmedabad
This dealer had seen lower-than-ex-
pected growth of 8% YTD (Maruti’s
target was 15%) mainly due to weak-
ness in real estate and weak money
flow. Ertiga, Eeco and Celerio had
waiting periods of over three weeks.
Swift had a waiting period of 10 days
as production was shifted to Baleno.
The third Nexa showroom was about to
open in the Ahemdabad region in Jan-
uary 2016. Inventory was at one month
with 560 units at the dealership. All its
sales managers in Gujarat were sent to
Australia as a reward for over-achieving
the region-wise targets.
Tractors: Industry struggling, Sonali-
ka growing
GV met a large Sonalika dealer, who was known for his aggression in sales. He said that while the tractor industry in the region has declined by 30%, Sonalika has posted 10% growth in volumes. Rajkot district is a 2500units/month market, which is mainly dom-inated by M&M and TAFE followed by Sonalika. Over 80% of its sales are financed with financiers providing loans of up to 95% LTV. Key reason for Sonalika taking away market share was that it is over 15% cheaper than com-petition while providing good quality products.
Eicher commercial vehicles dealer
This was a large dealer of commer-cial vehicles in Saurashtra (11 districts
of Gujarat). CV market size is over
3000units p.a. with LD segment (5-15
tonnes) adding 580 units, HD segment
(12 tonnes+) adding 1880 units and
buses the rest. The CV market here has
remained sluggish over the last four
years, but 2015 has seen strong growth
with MHCVs expected to grow by over
60%. Eicher dominates the LD segment
with ~50% share while TTMT has ~36%
share. TTMT dominates the HD seg-
ment at 46% share with Ashok Leyland
a close second with 42% share. Overall,
MHCV segment is expected to con-
tinue growth as replacement demand
remains strong coupled with expected
order of 3000 vehicles by Reliance for
oil distribution. However, LCV demand
does not seem to have any respite due
to weak agri.
Sonalika the new threat to M&M

47GROUND VIEW GROUND VIEW Annual Edition 2016 Annual Edition 201646
Tractors
Tractors market has seen a sharp
decline of 25-30% in Ludhiana and
Amritsar. The real-estate boom 5-6
years ago meant people sold land and
bought new houses, cars, two-wheel-
ers, and tractors – hence tractor pene-
tration rose rapidly. Tractor sales have
been impacted this year due to weak
rabi crop last year and subdued profits
during the kharif season coupled with
weak sand mining and realty sectors.
Swaraj (owned by M&M) is the largest
player followed by Sonalika and Es-
corts. Escorts has been gaining market
share as its new range of tractors pro-
vide higher mileage and power com-
pared to competition. 40-50HP tractors
are the largest selling in the region.
Competition gearing up
Dealers highlighted that Sonalika has
been very aggressive and gaining
significant share as it sells at a dis-
count of Rs 40,000-50,000 compared
to competition. A dealer highlighted
that Sonalika was the first company
to start exchange of tractors in 2004,
which helped it gain popularity. M&M
started exchange schemes from 2009.
Competitive scenario is so bad that
GV met three dealers who surrendered
their dealership due to Sonalika’s
popularity or fearing that companies
would push inventory. One ex-dealer of
Escorts highlighted that he already had
an inventory of 25 tractors; when the
company billed him for 25 more units,
he had only two options – take the
inventory or surrender his dealership.
He fought with the company and finally
surrendered dealership in anger.
Two wheelersOverall two wheeler market was flattish
with TVS experiencing a robust growth
of 40% yoy, Bajaj growing marginally
and Hero Motocorp posting 3-4%
decline during festive season.
TVS Motors
It was surprising to see yet another
market where TVS has grown strongly
with festive season growth at 40%. TVS
holds 22% share in scooters and 11%
in motorcycles in this region. Custom-
er feedback has been very strong on
Jupiter, which has led it to gain market
share from Activa. Apache has seen
strong growth as well.
Bajaj Auto
Bajaj is the second largest motorcycle
player in the region and has seen mild
growth during the year. CT100 is the
top selling economy product in the
region, and it was surprising to see Dis-
cover having good demand – appar-
ently people like its design. Avenger
had not yet launched, but dealers said
that they have seen a surge in enquir-
ies for the motorcycle.
Inventory higher across tractor dealerships
Punjab – Ludhiana, Chandigarh
Yahaa mandi nahi mandaa hai (this is not just a slowdown, it’s a disastrous scenario)- A tractor dealer

47GROUND VIEW GROUND VIEW Annual Edition 2016 Annual Edition 201646
Maruti Suzuki dealer - New Delhi
This was one of the largest dealers in
the country for Maruti – he is target-
ing 19% volume growth. Swift is his
largest selling product with over 40%
contribution to volumes. He saw no
impact because of Renault kwid launch
as waiting for that car is at around six
months. If there would have been no
waiting, then he would have felt the
impact. Maruti clocked +20% increase
in sales during festive and +17% YTD.
Very good response was seen for the
newly launched Baleno and Scross. Fes-
tive discounts were ~Rs 4000 higher.
Waiting period on Wagon R CNG was
a month, Dzire was 15-20 days, EECO
was one month, Ertiga 15-20 days –
80% of sales were financed and inven-
tory stood below a month. The dealer
believes Nexa is a great step taken by
the company to catch premiumisation
of customers.
Maruti Suzuki dealer - Noida
This was one of the oldest and larg-
est dealers of Maruti. Overall growth
in Noida was on the lower side. The
dealership clocked 8% growth YTD.
Swift and Dzire were top selling models
followed by Alto and Wagon R. There
was no waiting period for any of the
products, but inventory was low at four
weeks.
Tata Motors – New Delhi
Tata Motors seemed to be perform-
ing better in New Delhi with good
demand for Zest. Nano AMT, which
had a waiting period, is now available
off the shelf. Dealership footfalls have
improved 30-35% after Zest and Nano
launches. Two new launches are in the
pipeline with Kite by January and HEXA
in March. Kite sedan is something
which dealers are eagerly waiting for as
the pricing is supposed to be very com-
petitive at Rs 350,000-400,000. Zest
contributed over 40% of dealership
volumes.
Rajasthan – Ajmer and JaipurRajasthan market was sluggish primar-
ily due to curb on black money and
slow property market. The region was
impacted by lower inflow of tourists,
which impacted the local economy.
Maruti dealer – Jaipur
The dealer said YTD sales growth was
5% with festive sales growth at 7%. He
also said that Alto and Celerio were not
affected by Renault kwid. The deal-
ership posted a 10% growth in FY15
to 6700 units, but is expecting 7-8%
growth in FY16 with a stronger second
half. Newly launched Ciaz diesel has
seen strong demand and has a waiting
period of 15 days. Inventory with dealer
was low at 10 days.
Mahindra dealer – Jaipur
This dealership sells ~500 units/month
with Bolero being the largest at 150
units and pickups at 120 units. Mahin-
dra has seen sharp fall in volumes of
15% YTD and festive sales were flattish.
Key reason for such a sharp drop is that
tourism market has declined, impacting
Bolero and Scorpio sales. Increased
competition has also impacted Scorpio
sales. Dealership was happy as profit-
ability has improved over the last 2-3
years due to some favourable policy
changes by M&M.
Honda two-wheeler dealer – Jaipur
Total market size of two wheelers in Jai-
pur is 11,000 units/month with Honda
selling over 3,500 units. YTD sales for
HMSI were flat with April-September
sales declining 10% and Septem-
ber-November sales rising 20-25% yoy.
Jupiter gives very strong competition
to Activa, but the dealer doesn’t think
Maestro Edge is a threat. Honda Shine
125 has slowed down substantially. It
is pushing a lot of inventory and now
stands lower at 45 days due to festive
season growth, before which it had
reached 75 days. Profitability of this
dealership is under pressure due to
higher inventory as Honda required
upfront cash, where as Hero provides
15 days of financing.
Maruti dealer – Ajmer
Ajmer market was the worst for Maruti
with sales flat at best. Only Dzire saw
sharp growth with a waiting period of
over three weeks. While the festive
season was good, dealers are eyeing
flattish sales for FY16. This dealer also
had Hero Motocorp’s franchise and said
volumes declined by 7-8% YTD.
HMSI Dealer – Ajmer
HMSI has been struggling due to rural
slowdown and has seen 13% drop
in volumes in the region YTD. This
dealer does not foresee any uptick in
demand in the near term due to lower
agriculture income. Activa sales were
strong and had a waiting of 12 days;
however, Shine and Dream series have
been struggling. Honda has the largest
market share in the region followed by
Hero Motocorp.
NCR region
Darr toh sirf Jupiter se hai, Maestro kuch jyadaa nahi kar paayegaa (we only fear Jupiter, don’t think Maestro will have any great impact)
- HMSI dealer on competition to Activa

49GROUND VIEW GROUND VIEW Annual Edition 2016 Annual Edition 201648
If it would have been any other OEM I would have surrendered the dealership; however, Tata has supported us in a big big way.
- Tata dealer on declining profitability
Karnataka - MangaloreMaruti dealership
Maruti dominates the region with
over 50% market share. FY15
growth for Maruti was 12%; this
year as well, the dealerships are
looking at over 12% growth. Newly
launched Baleno, Ciaz and Ertiga
have all seen robust demand. Scross
demand has been lukewarm due
to higher pricing, but Baleno is a
super hit with a waiting period of
six months. New channel building
for LCVs have not yet started and
will take another year. Car sales are
likely to spike due to seventh pay
commission.
Tata Motors dealership
Tata Motors has seen some im-
provement in the region lately due
to Zest; however, the dealership is
keenly waiting for Zica and Sway
sedan to launch, as the products
are perceived as ‘metrosexual’ with
much better quality. Dealers are
very happy with Tata Motors as the
company has been very supportive
in the last two years. Three new
products are in the pipeline Zica,
Hexa and Sway.
Madhya Pradesh
An official from a large NBFC
that finances LCVs, MHCVs, and
tractors in the region painted a
grim picture of tractor growth
with the demand virtually
collapsing. L&T and Magma
Finance recently shut shop
(tractor financing unit) here due
to high delinquencies cement
demand has also seen a huge
impact. Lot of tractors have been
repossessed due to non-pay-
ment of EMIs and repossessed
stock is above the annual sales
of this region, implying that a
pick up in fresh sales is still a
while away. NBFCs are working
on 1/3rd book compared to last
year. However, car sales have
been holding up led by salaries
and business class; festive sales
saw good growth for major PV
players.
Tamil Nadu GV met six dealers in the Chennai
and Coimbatore region – Maruti has
been in a prime position and grew
by over 15% YTD and Hyundai was
doing well with Creta having a size-
able waiting period. Walk-ins have
increased dramatically in FY16 and
conversions were healthy. Maruti’s
new Baleno was a super hit with a
waiting of as much as four months.
Hero seemed to be a laggard
and saw stable to declining sales
as it could capture the consumer
up-trading in the region. Bajaj Auto
saw some growth led by new launch
momentum. TVS has been gaining
market share in the region especially
from Activa.
Large tyre distributors
Chinese tyres have made a huge
dent in market share of domestic
players - for e.g., a rear radial Chi-
nese made pair will cost Rs 30000
while a locally made pair will cost Rs
42,000-44000. What makes matters
worse is that even Indian bias tyres
are expensive than Chinese radial
tyres. While Chinese tyre quality is
poor, it has been improving recent-
ly; Chinese tyres generally last for
30,000km vs. Indian tyres for 60,000
– Chinese tyres also provide lower
mileage. However, despite poor
quality, many fleet operators are
opting for Chinese tyres as the cost
difference is almost equivalent to
one month’s EMI of a truck. Large
operators haven’t shifted yet to Chi-
nese tyres, which is the only saving
grace as of now. All tyre companies
have taken a total of 10% price
cut across segments in the last
three months. In PVs, companies
have increased discounts and
offers to lure customers. Chinese
competition is also heating up in
PVs segment with taxi segment
completely shifting to Chinese.
Dhawal Doshi ([email protected])
Nitesh Sharma ([email protected])

49GROUND VIEW GROUND VIEW Annual Edition 2016 Annual Edition 201648
BY NAVEEN KULKARNI & NITESH SHARMA
MODEL VILLAGE JAYAPUR: JOYS OF ADOPTION
Shyam Garg, a paints dealer on the NH4
highway near Varanasi points at the nearby
village of Jayapur. “That’s where custom-
ers come from,” he says and his face lights
up when he talks about the development
in the village. “Lots is happening. Go and
see it yourself,” he urges. Jayapur was a
relatively obscure village of just 4200 resi-
dents, around 30km from Varanasi city un-
til it was adopted by PM Modi under the
Sansad Adarsh Gram Yojana in November
2014.
On the day of GVs visit, the village was
bustling with activity with a healthcare
camp being set up and renowned doctors
expected to arrive soon for checking pa-
tients in the village. The camp organiser
comes around and asks the Gram Pradhan
(village head), Mr. Narayan Patel, to keep
the Panchayat Bhavan toilets locked for the
sole purpose of the visiting doctors. As Mr.
Patel looks around with unease, he quickly
brightens up when quizzed about the re-
newed prospects of his village. With shin-
ing eyes he recounts how PM Modi visited
his village on November 7th and asked him
personally “What can I do for our village?”
– he believes “Modi displayed his willing-
ness to take the common man’s advice.”
In the same breath, Mr Patel starts listing
the developmental initiatives undertaken
for the village. While the list is long, the
most important aspect is that the agenda
is structurally changing the village’s econo-
my, which will bring sustainable and long-
term improvements in productivity and

51GROUND VIEW GROUND VIEW Annual Edition 2016 Annual Edition 201650
lead to enhanced growth prospects.
Mr Patel says that in the next six to nine months,
Jayapur will become a model village for the
whole of India and it will be an example of the vi-
sion that PM Modi has for rural India. The Adarsh
Gram Yojana primarily focuses on structural
changes to rural India, which will lead to long-
term improvements in productivity and quality of
life. Many of these initiatives can be replicated
across most Indian villages, which will lead to an
improvement in labour productivity, pick up in
the investment cycle, and a rise in consumption.
Banking for everyone
The opening of Union Bank of India and Syndi-
cate Bank branches in Jayapur village is a big
step for the small village. Equipped with an ATM
and knowledge centre, UBI’s branch is powered
by solar energy. The bank has accounts under the
PM Jan Dhan Yojana and also under savings-de-
posits schemes. According to Mr Patel, people
from Jayapur village and other neighbouring vil-
lages have opened over 6,000 accounts at the
bank. The UBI branch has brought banking fa-
cilities to almost all the families of Jayapur. The
PM’s Jan Dhan Yojana is one of the most success-
ful initiatives by the government with deposits of
Rs 260bn and close to 20 million accounts across
India. Financial inclusion for rural India is a big
step for integrating the rural economy for inclu-
sive growth.
Apart from banking facilities, Mudra Bank will
provide unsecured loans worth Rs 10,000-50,000
to villagers for small-scale business activities.
This facility is being actively utilised by the villagers
of Jayapur.
Empowering women: Gaushala or cowsheds are be-
ing developed in the village. In this scheme, wom-
en from the village can buy a cow on loan and are
allowed to keep them in these cowsheds. They can
milk them on a daily basis and utilise the dung for
agriculture and other purposes.
Surya Namaskar: Quelling darkness
Even though the village is connected to the power
grid, power supply cuts are frequent and villagers can
generally count the number of hours power supply is
available on their fingerstips. One villager said that
power supply from the grid is available for only 8-9
hours. Prolonged cuts result in significant decline
in productivity (especially when the power cut is at
night).
The government has set up two solar panels of 25Kw
each (with power back up) – this provides each home
with the power to light two bulbs. While this may not
seem like much, it is still a great relief for the villag-
ers, especially women and children, and at night, and
greatly enhances the productivity of rural economy.
The village did not have any street lights before com-
ing under this scheme. Now it has 250 solar-powered
street lights installed of which 135 are operational.
Housing for the very needy
In Jayapur, Modiji Atal Nagar provides housing for
the very needy. Quality homes have also been provid-

51GROUND VIEW GROUND VIEW Annual Edition 2016 Annual Edition 201650
Sour
ce: W
HO
Open defecators (mn)
ed to ultra-poor tribals of the village. In this scheme, 14
one-room kitchen dwellings with proper toilets and bath-
rooms have been built and provided for the families. The
houses have drinking-water facilities and solar-powered
lanterns. These 14 houses have been built from private
donations. Housing with toilet facilities provides great
long-term benefits in improving the quality of life of the
rural poor who have defecated in the open all their life.
Health and hygiene are top priority
Atal Nagar greatly enhances the lives of its tribal dwell-
ers with health and hygiene benefits encouraging other
villagers to focus on sanitation issues. The government
is constructing two water tanks with pumping facilities
for storing water; it is also improving the drinking-wa-
ter facility. The village has a Shishu Ghar, an infant-care
home with midwives for advising nursing mothers on in-
fant care. The crucial phase of a child’s development is
the first 1,000 days and in India, women are often under
nourished – this impacts the long-term health
of the child. Undernourished children (because
of undernourished mothers) often do badly
at school, have higher chances of being de-
pressed in adulthood, and have difficulty find-
ing and keeping jobs. Shishu Ghar provides
advice to women on aspects of childcare and
its objective is to improve child development
– including nutrition and early childhood edu-
cation. This is one of the most critical infrastruc-
tures that will have long-term implications on
labour productivity. One of the biggest costs
of industrialisation and urban-infrastructure
development in China today is the children
left behind in villages with their grandparents.
Addressing infant care is one of the most im-
portant socio-economic aspects for any gov-
ernment, and India is taking important steps in
this direction.
All-round development of rural life is the fo-
cus, rather than subsidy shortcuts
The development scheme focuses on structural
improvements in rural life, which will enhance
the long-term productivity by improving the
quality of life. Providing power supply, banking
facilities, and road connectivity are replicable
across India. The benefits of these schemes will
usually come with a lag while upfront invest-
ments tend to be significant.
Naveen Kulkarni ([email protected])
Nitesh Sharma ([email protected])

53GROUND VIEW GROUND VIEW Annual Edition 2016 Annual Edition 201652
BY GAURI ANANDA G R I C U L T U R E
Switching crops: Desperate measures neededThis year’s deficit monsoon has lowered acreage and water tables. The past three consecutive agricultural seasons have been bad – the current rabi season has also been a trying time for India’s farming community. Ground View visited important agrarian belts in Haryana and Punjab to get a reality check on farm sentiments, on-going distress, and the outlook. It made no sense that farmers in Haryana, Punjab, west UP, east UP, and Bihar are still growing most water-intensive crops (such as rice and wheat) despite consistently deficient rainfall (for the past five years). The average monsoon deficiency has been over 25% and water tables have been depleting at an alarming rate. Growers, government officials, and artiyas (middlemen) said the reason farmers were not ditching paddy for high-return crops include price support given to rice and wheat, ready infrastructure (FCI warehouses), and farmers’reluctance (mind-set) to switch to other crops. India needs to desperately overhaul its approach towards agriculture and cropping pattern, but very little is being done on the ground.This implies food inflation is here to stay and the rural consumption-growth story is at risk.

53GROUND VIEW GROUND VIEW Annual Edition 2016 Annual Edition 201652
GV stopped at a model hamlet –Manouli in Sonipat – which is an inspiration of sorts among the farmer fraternity. This village has switched to sweet corn from paddy about a decade ago, leading to sustainable growth, largely independent of weather vagaries.
GroundView’s travelogue
Jagraj Dand,Joint Director Statistics, Government of Haryana.
Mr Harbansh Singh, Deputy Director of Statistics, Government of Haryana.
Attempts to diversify crops not succeeding
Agriculture accounts for 16% of India’s GDP and about 10% of its exports. India has the second largest arable land base (160mn hectares) after the US and largest gross irrigated area (90mn hectares). Rice, wheat, cotton, oilseeds, jute, tea, sugarcane, milk, and potatoes are the major agricultural commodities produced. Over 60% of the country’s population depends on agriculture as a principal income source and land continues to be the main asset for livelihood security. A slew of agrarian reforms in the 1970s (called the Green Revolution) including marginal consolidation of land holdings, extension of credit, public investment in infrastructure, price support, and research, led to productivity gains –production more than doubled to 257mmt in FY15 from 100mmt in 1970s. However, the technologies used in the Green Revolution could not sustain production growth beyond the 1990s. As a result,the average yields of most crops are rather low and below world averages. Policy makers attribute this to gaps in technology, irrigation, inputs, and pricing policies.
An assured market is only available for wheat, rice,
sugarcane and cotton, which is why attempts at
diversification tend to fail (mainly due to the pub-
lic distribution system). For other crops like puls-
es, there are not enough buyers to offer minimum
support price (MSP) and farmers are forced to go
for distress sales. On the other hand, wholesale
markets have long chains of intermediaries, result-
ing in wide gaps between the producer and con-
sumer prices. Direct marketing, which does away
with intermediaries and hence provides a better
price to the farmer, needs to be promoted – but is
ABOUT INDIA’S AGRICULTUREGV in coversation with

55GROUND VIEW GROUND VIEW Annual Edition 2016 Annual Edition 201654
Water-intensive crops such as rice, cotton, and pulses still suffer from low irrigation reach
….though area under wheat and sugarcane is fully irrigated
Problem states: Monsoon has been deficient in these states for the past five years
Sour
ce: A
grico
op M
inist
ry o
f Agr
icultu
re, P
hilli
pCap
ital I
ndia
Res
earc
hSo
urce
: IM
D, P
hilli
pCap
ital I
ndia
Res
earc
h
“Farmers are used to subsidies and support. They are averse to change; they don’t want to adjust to realities, but tend to depend on government for support”
Mr Sukhdeep Singh, a local government officer in Ambala, Punjab
lacking so far. Therefore, despite dwindling in-
comes and water availability, the farmers of Pun-
jab and Haryana continue to sow rice and wheat.
“Most farmers are indebted to ‘artiyas’ (com-
mission agents); therefore, they are averse to
risk. A switch to any other crop from paddy is a
risk. Creation of cold storage, forward linkages
with agro-processing industries, and rural em-
ploymentwill reduce dependence on agriculture
and help farmers get out of the debt trap,” says
Jagraj Dandi, Joint Director Statistics, Depart-
ment of Agriculture, Government of Haryana.
Recently, the Punjab government gave paddy
farmers pulses (to encourage cultivation) at a
subsidised rate of Rs 40/kg — the farmers sold it
in the retail market for Rs 120/kg and made arbi-
trage gains! Paddy and wheat yields in Punjab and
Haryana are better than India’s average by a wide
margin, so it is difficult to find an alternate crop
for farmers here. Besides this, the current farm-
ing generation is more keen on seeking non-farm
employment and the older generation is averse to
experimenting with other crops.

55GROUND VIEW GROUND VIEW Annual Edition 2016 Annual Edition 201654
GV took its first break at Manouli, a small hamlet
in Haryana. This village is an inspiration among the
farmer community, as it has worked towards collec-
tive and sustainable growth to help reduce its car-
bon footprint in that region. The farmers here largely
grow wheat (45%), sweet corn (35%), and vegetables
(20%). Over the last decade, many Manouli farmers
have switched to sweet corn from paddy because of
lowering of the water table, higher investments, and
poor returns in paddy. Today, Manouli grows roughly
80% of India’s sweet corn. These sweet corn farmers
are indirectly helping the environment departments
by not escalating the carbon content in air (less use
of diesel to pump ground water out) and lowering
the damage to the water level.
These farmers are very progressive – they have es-
tablished their own processing units and direct mar-
ket access so that they are not cheated by market
players (middle-men). The village has 17 poly hous-
es (largest in any village) and is fully irrigated. They
are not too keen on contract farming, as they feel
realisations are incommensurate with market pric-
es. There was no despondency or weakness due to
the weather disturbance in this village in contrast to
neighbouring ones. This village’s progressive think-
ing has helped it to increase its income.
Case Study: Manouli– A model village
“Rising input costs, falling water levels, rising diesel prices and uncertain returns in paddy farming forced us to opt away from sowing this staple in the region. Sweet corn is a very high yielding crop (65-70/quintal per acre) and requires less investment (Rs 8000-10000/acre) – it can also be sown thrice a year, maximizing our returns. Other benefits of sweet corn are it is soil conservative and makes the soil suitable for wheat cultivation, besides generating fodder for cattle, which also at times generates income.”
- Says Arun Kumar, a sweet-corn farmer in Manoli (seated extreme right) with his friends (other large sweet corn farmers of Manouli, Sonepat
“We grow sweet corn, baby corn, broccoli, and seedless cucumber. JubliantFood, Al KabeerGroup, Everfresh, Reliance Fresh, Mother Dairy, and Walmart are some of our customers.”Pawan Kumar, an exotic vegetables farmer in Manouli, also talks about his protective cultivation, which insulates his crop from weather vagaries

57GROUND VIEW GROUND VIEW Annual Edition 2016 Annual Edition 201656
A deficient monsoon lowers kharif acreage in 2015
(over 2014): IMD’s forecast for this year was accu-
rate —rainfall shortage in June-September was 14%,
lower than the long period average (LPA). As a result,
overall area sown declined by 2% to 103mn hectares.
The area under cotton, sugarcane, rice and maize
declined by 10.6%/4.4%/3.3%/2.6% respectively to
11.7/4.9/38.4/7.49mn hectares respectively.
Inferiorrabi rains so far to lower acreage: Cumu-
lative rainfall in India from 1stOctober to 18th No-
vember was 28% lower than LPA. Rainfall shortage
was maximum in central/north India -65%/-60% and
higher by 4% in south India. So far, the gross sown
area is around 39% of the normal area under rabiup
to 20th Nov 2015. Area sown under all rabi crops is
12.6% lower than last year at 24.22mn hectares. Cur-
rent water table is 77% of last year and 74% of normal
storage (10-year average).
Reservoir water table below last year levels: As of
30th September, the all-India water storage is 59% of
overall of capacity vs. 71% in FY14 and a 10-year av-
erage of 70%. In June 2015, 13% above-normal rains
helped improve the water storagesomewhat. The
most important thing to note is that water availabil-
ity has been higher (vs. last year) for some important
grain producing states such as Punjab, West Bengal,
MP, and Gujarat and is poor in states such as Maha-
rashtra, Chattisgarh, UP, AP, Telengana, Karnataka,
and Kerala.
Gauri Anand ([email protected])
The year so far….in mn hect Normal Area for
whole Kharif1st adv est
for FY164th adv est
FY15Change
Rice 38.83 38.36 39.65 (3.3)
Bajra 8.48 7.33 7.12 2.9
Maize 7.25 7.30 7.49 (2.6)
Coarse Cereals 20.44 18.25 18.36 (0.6)
Total Cereals 59.28 56.60 58.01 (2.4)
Pulses 10.88 10.32 9.76 5.7
Soyabean 10.40 11.40 11.09 2.8
Oilseeds 18.52 18.65 18.34 1.7
Cotton 11.50 11.70 13.08 (10.6)
Sugarcane 4.82 4.92 5.14 (4.4)
All crops 105.86 102.94 105.14 (2.1)
Kharif sowings declined by 2%
Water storage
Total storage capacity
Storage 2015
%
Storage 2014
%
Avg storage
last 10 yrs
as on 30th Sep 2015 (BCM)
as a % of capacity
Northern region 16.45 18.01 91.3 79 78
Eastern region 10.98 18.83 58.3 67 64
Western region 15.93 27.07 58.8 70 72
Central region 32.42 42.03 77.1 74 61
Southern reg 17.14 51.59 33.2 67 75
Total 92.92 157.53 59.0 71 70
Reservoir water storage position
Area % to all India Production % to all India Yield Irrigation (%)
WB 5.5 12.51 15.31 14.37 2,786 48.2
UP 5.98 13.6 14.63 13.73 2,447 80.4
AP 4.51 10.25 13.03 12.23 2,891 97.1
Punjab 2.85 6.49 11.27 10.58 3,952 99.5
Odisha 4.18 9.51 7.58 7.12 1,815 33.2
All India 44.4 104.8 2,361 58.7
Rice - Major Producing States along with Coverage under Irrigation
India’s five largest grain-producing states
Source: Agricoop Ministry of Agriculture, PhillipCapital India Research
Source: Agricoop Ministry of Agriculture, PhillipCapital India Research
Source: Agricoop Ministry of Agriculture, PhillipCapital India Research

57GROUND VIEW GROUND VIEW Annual Edition 2016 Annual Edition 201656
Area % to all India Production % to all India Yield Irrigation (%)
UP 9.96 31.92 30.25 31.54 3,038 98.1
Punjab 3.51 11.27 17.04 17.76 4,848 98.9
MP 5.79 18.57 13.93 14.52 2,405 89.3
Haryana 2.5 8.01 11.8 12.3 4,722 99.5
Rajasthan 2.81 9.01 8.92 9.3 3,175 99.2
All India 30.88 88.94 2,880 58.7
Area % to all India Production % to all India Yield Irrigation (%)
UP 2.23 44.45 135.16 38.62 60,665 93.1
Maharashtra 0.94 18.7 76.55 21.87 81,702 100
Karnataka 0.42 8.38 35.91 10.26 85,500 100
Tamil Nadu 0.33 6.53 31.76 9.07 97,007 100
AP 0.19 3.83 15.36 4.39 80,000 95.8
All India 30.88 88.94 2,880 58.7
Area % to all India Production % to all India Yield Irrigation (%)
MP 5.43 21.52 5.09 26.41 938 35.1
Maharashtra 3.92 15.54 3.12 16.19 796 8.7
Rajasthan 4.2 16.64 2.47 12.82 589 13.1
UP 2.31 9.14 1.71 8.87 742 21
AP 1.67 6.62 1.55 8.04 928 3.7
All India 23.21 17.20 741 58.7
Area % to all India Production % to all India Yield Irrigation (%)
Gujarat 2.69 23.01 10.95 29.93 692 56.7
Maharashtra 3.87 33.11 8.52 23.29 374 2.7
AP 2.27 19.4 7.14 19.51 535 18.2
Haryana 0.57 4.84 2.55 6.97 766 99.9
Punjab 0.51 4.32 2.25 6.15 757 100
All India 12.6 35.48 2,816 58.7
Area - mn hect; Production mmt, Yield kg/hect; Cotton production mn bales (170kg of each)
Wheat - Major producing states along with coverage under irrigation
Sugarcane - Major producing states along with coverage under irrigation
Pulses - Major producing states along with coverage under irrigation
Cotton - Major producing states along with coverage under irrigation
Sour
ce: A
grico
op M
inist
ry o
f Agr
icultu
re, P
hilli
pCap
ital I
ndia
Res
earc
h

59GROUND VIEW GROUND VIEW Annual Edition 2016 Annual Edition 201658
BY MANISH AGARWALLA, PARESH JAIN & DEEPAK AGARWALB F S I
Changing face of the SME Sector
The Indian MSME (micro, small and medium
enterprises) sector has emerged as a highly vi-
brant and dynamic one in the last five decades.
MSMEs are the biggest contributors to employ-
ment generation and these entrepreneurships
will aid the government’s Make-in-India cam-
paign. This sector contributes about 8% to GDP,
45% to total manufacturing output, and 40% to
India’s exports. MSMEs plays a significant role
in the growth of the nation due to high contri-
bution to in-house production, export earnings,
low investment requirements, import substitu-
tion, contribution towards defense production,
technology-oriented industries, and competi-
tiveness in domestic and export markets, there-
by generating new entrepreneurs.
Enterprises Manufacturing Enterprises* Service Enterprises**
Micro Up to Rs. 2.5 Mn Up to Rs. 1.0 Mn
Small 2.5 Mn To 50 Mn 1.0 Mn To 20 Mn
Medium 50 Mn to 100 Mn 20 Mn to 500 Mn
Definition of MSMEs in India
Note: * Investment in Plant & Machinery ** Investment in Equipment’s
Bottlenecks for MSMEs
Despite high enthusiasm and inherent capabili-
ties to grow, MSMEs in India face a number of
problems such as limited scale of operation,
technology, supply chain, increasing domes-
tic and global competition, and lack of formal
funding. The banking system has been averse to
financing MSMEs, not because of asset quality,
but due to various factors such first-generation
entrepreneurs with lack of experience, lack of
collaterals, low promoter margin, and improper
books of accounts.
SBI sectorwise GNPA
SME loan book

59GROUND VIEW GROUND VIEW Annual Edition 2016 Annual Edition 201658
Ecommerce is playing a huge rule in the development of furniture and handicrafts manufacturers in Jodhpur. Big players such as Pepperfry and Urban ladder have tied up with many wooden furniture manufacturers of Jodhpur and have also set up exclusive stores in the city. Through this, the number of small and large furniture manufac-turers and vendors has increased to an impressive 1500 in last few years from 500. Small manufacturers are also getting huge profit through online market. Ecommerce players have selected Jodhpur due to its specialisation in this segment, low labor cost, and conducive climate. Jodhpur has emerged as an online furniture hub.
The advent of modern trade and ecommerce has started providing direct and wider market access to SMEs, whether its B2B or B2C, addressing the concerns of limited scale of operation. Adoption of technology in manufacturing, product promotion, packaging and logistics enabled this local furniture market to establish itself as national hub in a product that, until a few year’s ago, nobody thought would be sold over the internet.
What’s more amazing is the fast adoption of technology to meet scale and how these furniture makers have overcome the hindrance of supply chain related to ecommerce, espe-cially in bulky items like furniture.
This has not only benefited the furniture industry, but also various industries involved such as logistics, packaging, and web designing. It has given robust growth to employ-ment and average wages have also risen. Ecommerce has shown a new way to Jodhpur’s economy.
Jodhpur furniture and ancillary businesses have also attracted the attention of financiers, given their increased scale of operation, the need for routing transactions through the banking channel, and maintaining proper books of accounts. The funding for working capital or capi-tal expenditure is not a hindrance in this SME cluster.
By tying up with ecommerce players, financing/banking institution could help mobilise business for MSME clients. Facilitating MSMEs will also help secure their loan repay-ments. The increase in bill discounting, channel financing, and vendor financing has backed up the operations of MSMEs and given them a new boost.
Financing Support to ecommerce vendors (MSMEs)
Ecommerce players – Flipkart, Snapdeal, and Amazon
have tied up with financial institutions such as SBI, Axis
Bank, and Bajaj Finserv for vendor financing. These insti-
tutions will provide loans ranging from Rs 100,000 to Rs
20mn to ecommerce vendors and help these businesses
to grow.
Apart from large NBFCs, a host of alternate lending
start-ups such as Capital Float and Lending Kart are also
tying up with ecommerce companies. More than 60%
of the 450 merchants that have borrowed from Capi-
tal Float work with online marketplaces such as Flipkart,
Amazon, Snapdeal, Paytm, ShopClues.com, and eBay.
Conclusion
Because of the shift to modern trade, middlemen or
traders will perish. If MSMEs adapt themselves to the
changing scenario and join hands with modern trade
players, they will achieve growth. The Make in India in-
itiative, state-level summits (like Resurgent Rajasthan,
Vibrant Gujarat, Progressive Punjab), relaxation in SEBI
norms for listing startups, simpler financing norms by
banks, the rediscounting of bills, the infusion of capital
in the market, interest at concessional rate – all such in-
itiatives will make a favorable environment for MSMEs
to work in India and to develop their export potential.
n Flipkart has tied up with five financial institu-tions, including Axis Bank and Bajaj Finserv, for their vendors. These loans don’t require sellers to put up collateral. Flipkart has more than 30,000 vendors. While vendors can apply for loans on its back-end platform, the company will handpick sellers that will get financing from lenders. The company will select vendors based on customer ratings, sales growth, and service quality levels among other measures.
n Snapdeal also is working on the process of disbursing loans from banks to its vendors. It has negotiated with financers to disburse loans in an efficient manner with lower rate of interest than the offline market and loans disbursed with minimum documents. Since Snapdeal launched its vendor-financing program, it has facilitated disbursal of loans worth ~ Rs 1-3bn.
n Amazon India has tie-ups with State Bank of India and other financial institutions to provide loans to its sellers.
IN JODHPUR, ECOMMERCE HELPED OVERCOME A BASIC PROBLEM OF AN SME

61GROUND VIEW GROUND VIEW Annual Edition 2016 Annual Edition 201660
NBFC’s in the MP vehicle-financing industry: Stress at the bottom of the pyramidGV visited several vehicle-financing NBFCs,
banks, and automobile dealers in Indore to get
a ground view on the vehicle-financing mar-
ket (especially the commercial vehicle space).
Indore accounts for 30-40% of total sales in
Madhya Pradesh. The state is centrally located,
which gives it a unique advantage of being the
hub in India’s national logistics network; hence,
it is a good proxy of the overall activity level in
the commercial-vehicle space, despite holding
9th position with 4% share in CV sales.
Key conclusions (1) NBFCs that are more fo-
cused on medium (5+ vehicles) and strategic
customers (20+ vehicles) are seeing some pick-
up in demand largely aided by replacement of
old fleets and expect low double digit growth
in disbursement in the near to medium term.
(2) NBFCs focused on first-time users/ first-time
owners with one or two vehicles are facing huge
stress – this is because with deteriorating indus-
trial activity, subdued construction activity, and
successive failed crops, unorganised segments
have been sidelined. (3) Tractor portfolio of
most players is reduced to half and delinquen-
cies have risen many fold in the state. (4) Car
sales are sluggish due to negligible demand in
taxi segment and less government attachments.
While the goods movement in the state compris-
es of agri, industrial goods, and natural resourc-
es, agri accounts for a larger pie, as 70% of MP’s
population is dependent on agriculture with a
gross cropped area of 22.1mn hectares.
Pandit, who has a farm near Indore, suffered 80%
loss of his soya crops due to unseasonal rains –
the remaining 20% fetched him a lower price due
to sub-standard quality. This is the case with most
farmers in Madhya Pradesh. Soya, a major crop in
MP, suffered 50-70% damage as ~30 districts out
of 51 were hit by scanty or unseasonal rains and
pest attacks.
Replacement demand driving growth in
MHCV; LCV/tractors remain a laggard
Several NBFCs, banks (combined market share
of >50%) indicated that demand for MHCVs has
improved after August, but LCVs and tractors are
still laggards. However, a large part of the MHCV
demand that has come into the market is of the
replacement variety and very few strategic play-
ers are building fresh capacities. Most companies
GV visited expect replacement-demand momen-
tum to continue for some time, as fleet operators
replace their vehicles every 4-6 years. For most
government-related work, there is cap on the ve-
hicle age; hence, in this case, operators have to
replace their fleets every 4-6 years to be eligible
for such tenders. Nonetheless, companies do not
see any fresh demand coming into the market
until the next harvest season in March-April.
Stress at the bottom of the pyramid; stress in
the retail segment rising
While asset-quality in commercial vehicles is
showing improvement for most players, a few
with higher exposure to small customers (FTUs)
are seeing increased stress. The tractor segment
Madhya Pradesh comes at 9th position in CV sales
BY PRADEEP AGRAWAL

61GROUND VIEW GROUND VIEW Annual Edition 2016 Annual Edition 201660
is badly hit with significantly higher delinquen-
cies. According to one of the NBFCs with a size-
able tractor portfolio (20% of AUM), of the 200
stocks of reposed vehicles, 50% are from the
tractor segment.
Even car segment remained sluggish in the state
with September month showing 7.5% decline
yoy. As per one of the car dealers, there is almost
negligible demand from taxi segment and even
government attachments in the region are less –
this has impacted car sales.
India unprepared for stricter norms; ban on
15yr+ vehicles hard to implement
Vijay Chhibber, secretary, ministry of road trans-
port and highways recently talked about banning
commercial vehicles with a 15+-year vintage (in
popular media). Most vehicle-financing NBFCs,
banks, and automobile dealers were of the view
that it is very difficult to implement this, and even
if it is implemented, India lacks the systems to
track the age of active vehicles.
As per Mr. Gupta, Regional sales Manager, Mag-
ma Fincorp, “A large number of vehicles remain
in the field or in mines for months and years and
rarely come on road; hence, it is very difficult to
track those vehicles.
As per Sr. Branch Manager of another leading
NBFC, In MP, there is a ban on buses with a vintage
of more than 10 years, but still 40-50% of the buses
plying on road are more than 10 years old.”
Pradeep Agrawal ([email protected])
Sept 12 Sept 13 Sept 14 Sept 15
Maruti 700 1144 1172 1115
Hundai 248 300 392 385
Mahindra 651 371 232 192
TATA 443 168 162 37
others 494 498 440 489
Total 2536 2481 2398 2218
yoy change -2.2 -3.3 -7.5
All India CAR sales 154884 156494 154882 169590
yoy change 1.0 -1.0 9.5
Sept CAR sales (Indore)
CV - Market share in
MP
Focus on customer category
Asset quality
Sundaram 6% Medium and large
Stable
Cholamandalam 10% Medium and small
Improving
Magma 2% Small Under stress
HDFC Bank 23% Large Improving
TATA Motors 13% Small/ medium/ large
Improving
Key Vehicle financing players in MP
Agriculture contribution to GDP higher @ 29% in MP vs. 14% at all India level
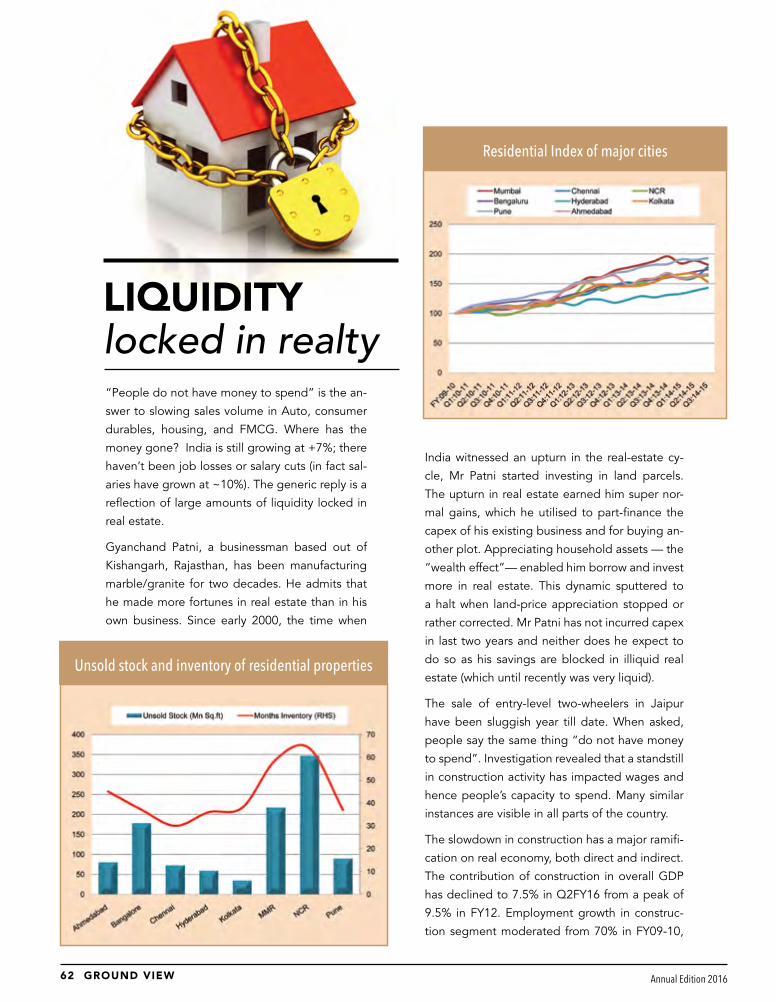
63GROUND VIEW GROUND VIEW Annual Edition 2016 Annual Edition 201662
LIQUIDITY locked in realty“People do not have money to spend” is the an-
swer to slowing sales volume in Auto, consumer
durables, housing, and FMCG. Where has the
money gone? India is still growing at +7%; there
haven’t been job losses or salary cuts (in fact sal-
aries have grown at ~10%). The generic reply is a
reflection of large amounts of liquidity locked in
real estate.
Gyanchand Patni, a businessman based out of
Kishangarh, Rajasthan, has been manufacturing
marble/granite for two decades. He admits that
he made more fortunes in real estate than in his
own business. Since early 2000, the time when
Unsold stock and inventory of residential properties
India witnessed an upturn in the real-estate cy-
cle, Mr Patni started investing in land parcels.
The upturn in real estate earned him super nor-
mal gains, which he utilised to part-finance the
capex of his existing business and for buying an-
other plot. Appreciating household assets — the
“wealth effect”— enabled him borrow and invest
more in real estate. This dynamic sputtered to
a halt when land-price appreciation stopped or
rather corrected. Mr Patni has not incurred capex
in last two years and neither does he expect to
do so as his savings are blocked in illiquid real
estate (which until recently was very liquid).
The sale of entry-level two-wheelers in Jaipur
have been sluggish year till date. When asked,
people say the same thing “do not have money
to spend”. Investigation revealed that a standstill
in construction activity has impacted wages and
hence people’s capacity to spend. Many similar
instances are visible in all parts of the country.
The slowdown in construction has a major ramifi-
cation on real economy, both direct and indirect.
The contribution of construction in overall GDP
has declined to 7.5% in Q2FY16 from a peak of
9.5% in FY12. Employment growth in construc-
tion segment moderated from 70% in FY09-10,
Residential Index of major cities

63GROUND VIEW GROUND VIEW Annual Edition 2016 Annual Edition 201662
to 12% in FY11-12, impacting the growth in rural
wages, which moderated to 5%. It’s not surpris-
ing that growth in consumer spending moderat-
ed to 7% yoy in Q2FY16 from a peak of 9.5% yoy
in FY12.
The battered state of real estate across the coun-
try has made investors shy away from the sector.
Delays in projects, pileup of inventory, and neg-
ative return in past few years has forced inves-
tors to vacate the space. Incrementally, savings
are moving away from physical assets to financial
ones. Dr Kaushal Kejriwal, a medical practitioner in
Delhi has started deploying significant portion of
his savings into financial assets (mutual funds, eq-
uities, and bank deposits). The trend can be seen
Gross Domsetic Saving as a % of GDP
House hold saving (% of GDP)
even in tier-3 and tier-4 cities. Mr Pawan Sharma,
manufacturer of wooden handicraft furniture in
Jodhpur has increased his financial savings and
waits for an opportune time to unlock his invest-
ment in property. Given recent experience in real
estate investment and its impact on liquidity, Mr
Sharma does not intent to come back to the real
estate market very soon.
Proportion of household savings has started de-
clining and moving to financial assets. This trend
is very encouraging for the economy from a long-
term perspective, as these savings are chan-
nelized towards productive assets, which have
a higher multiplier to the GDP. Gross domestic
savings rate (as a % of GDP) has been gradually
declining over the past few years. This is primar-
ily due to decline in the saving in physical assets
(such as real estate and gold), because of weak
returns in underlying assets. On the contrary, the
savings rate in financial assets, namely bank de-
posits, stocks, insurance, and mutual funds have
seen some stability over the last three years after
a gradual decline from FY10 and are expected to
improve going ahead.
The service sector of the economy has been grow-
ing profoundly over the years. The financial sector
is an important subsector of the service sector. So
it can be assumed that if there is an improvement
in the performance of the financial sector, it will
have necessary spillover effects on the service
sector and hence the GDP. Number of channels
through which finance promotes growth:
• Increasing savings rate and therefore investment
• Investment allocation
• Technical innovations
• Easing external financing constraints
• Improving corporate governance
• Reducing credit rationing
Manish Agarwalla ([email protected])
Paresh Jain ([email protected])
Deepak Agrawal ([email protected])

65GROUND VIEW GROUND VIEW Annual Edition 2016 Annual Edition 201664
Northeast India region (NER), India’s easternmost arm is connected to the sub-continent via a narrow sliver of a corridor squeezed between Bhutan and Bangladesh. Just like the narrow strip that connects NER with India, its relationship with the rest of the country over many decades has been tenuous at best. However, recent political commentary by the NDA government suggests that this region is likely to be in sharp focus during its tenure. Because of its inaccessibility and harsh hilly terrain, it has always retained an aura of mystery. To truly understand this largely unexplored, beautiful, and bountiful land, one has to actually spend some time there. Ground View toured NER extensively to uncover some of this region’s magic, especially from the standpoint of development potential, and especially of its relatively new cement industry. Interactions with bureaucrats, the local community, developers, contractors, and distributors revealed the region’s tremendous long-term growth potential, which is probably higher than the rest of India. Since infrastructure development will drive this progress, cement consumption in NER is likely to see strong growth. However, the dynamics of doing business in NER are not the same as the rest of India. Having had to face frequent natural calamities such as earthquakes, floods and landslides, man-made ones such as the numerous insurgencies and border conflicts, and a heavy perception of political apathy towards NER from the centre throughout India’s independent history, the people here tend to be wary of the motivations of what they perceive as outsiders. It is virtually impossible for an ‘outsider’ to set up a business here – many have tried, and even the mighty have fallen. Ground View takes you on an NER journey – not only through its picturesque cloud-clad mountains, not just to explore the potential of the cement industry, but also to the very heart and soul of the people who call this land of their own.
pg. 66 Political Commitments Recent political commentary indicates serious growth efforts are on_______________________________pg.71 NER’s cement industry & its dynamics Cement industry in NER_______________________________pg.79 Demand triggers for cement in NER Infrastructure growth agenda for NER will help the cement industry in the long term_______________________________pg.87 The Conclusion... What’s in store for cement manufacturers in NER__________________________________________________

65GROUND VIEW GROUND VIEW Annual Edition 2016 Annual Edition 201664
IN DEPTH
BY VAIBHAV AGARWAL
NORTH-EAST INDIA
The famous Elephant Falls near Shillong
BUILDING THE LAST FRONTIER

67GROUND VIEW GROUND VIEW Annual Edition 2016 Annual Edition 201666
NER and India’s troubled relationship – A tragic tale of unnecessary alienationWhile India embarked on its difficult yet steady path towards progress and growth, NER remained largely ignored – its economy kept collapsing, it faced huge unemployment, and power supply was non-existent in many parts – even until as late as 2010 – this, in the region that holds India’s highest hydroelectric power potential and some of the highest literacy rates. Insurgent groups wreaked havoc, often extracting money from people and extracting ‘protection tax’ from local businesses. While some of these groups demand a separate state, others seek regional autonomy – some extreme groups even want complete independence. The relationship between these states and the central government, between the native tribal people and migrants from other parts of India, between its various factions – have been tense. It is widely believed in this region that suc-cessive political regimes in India have largely ignored NER due to the limited influence of its vote-bank – however, the centre has viewed it as challenging to govern due to the many separatist movements.
Newertheless, efforts have been on for a while now to create a more inclusive environment for NER withing India’s development framework. The North Eastern Council (NEC), constituted in 1971, is the acting agency for the develop-ment of the eight states. DoNER was set up in September 2001 with a view to expedite development in NER with governance and in-dependence.PM Narendra Modi has remained steadfast in his commitment towards the devel-opment of NER – in his maiden budget, he allo-cated Rs 530bn toward NER while promising 14 railway lines, a sports university in Manipur, six agriculture colleges, Ishan Uday (scholarships for 10,000 students), and 18 FM stations.
Recent political commentary indicates serious growth efforts
P O L I T I C A L C O M M I T M E N T S
Recently, Modi’s government made a deal with Bangladesh to develop a link between Tripura and Chittagong, thus increasing flow of products between NER and the
rest of the country. In his Mann Ki Baat aired in July 2015 Modi had said “Is it possible to develop the northeast while sitting in Delhi? No. Officials will visit and see how it is to be done.”Many an-nouncements have already been made by India’s transport minister, Nitin Gadkari, for developing roads in NER. Union Minister of Urban Develop-ment, Venkaiah Naidu, said recently at a conclave, “The people of northeast are the first to see the rising sun in India. There is no reason why we should not rise to the occasion to help the north-east reach its optimum potential.”
Minister Jitendra Singh from the Ministry of Devel-opment of North Eastern Region (DoNER) has invit-ed women entrepreneurs from across the country to invest in NER and to take the lead in developing the region as an industrial hub. Mahesh Sharma (Minster for Culture, Tourism and Civil Aviation) has said that the government was giving a big push to tourism in the country, with a special focus on tap-ping the huge potential of the NER. Assam’s Chief Minister Tarun Gogoi has urged DoNER to publish a white paper giving details of the funds it has re-leased over the last 18 months for the development of NER. He also recently said, “Since DoNER has (now) come into being, NER should not be subject-ed to such shoddy treatment like the one meted out to the region by the present dispensation at the centre”.

67GROUND VIEW GROUND VIEW Annual Edition 2016 Annual Edition 201666
Need for Ground View on NERThis is imperative, given the government’s increasing focus on this region. It definitely calls for a visit and a reality
check. NER has seen many cement plants coming up since 2005; few are still in the pipeline. Even mainstream players
such as Dalmia Bharat have shown interest in this region and entered NER through acquisitions, which were considered
to be risky bets by peers and investors but yielding returns now. To evaluate opportunities and threats in NER, GV visit-
ed ministries, industries, infrastructure companies, contractors, cement distributors, factory sites, cities, and villages.
Products displayed at Assam Secretariat proudly declare ‘Made in Assam”
A board at the Assam Secretariat featuring NEIPP 2007
NER’s strategic fit
Road from NER to Thailand
NER: A brief
NER comprises the contigu-ous ‘seven sister’ states of Arunachal Pradesh,
Assam, Manipur, Meghalaya, Mizoram, Na-galand, and Tripura, plus the Himalayan state of Sikkim. Sikkim was annexed to the Indian union through a referendum in 1975 and was recognized as part of NER in the 1990s.
Demographics: Largest cities according to population census 2011 are Guwahati (As-sam), Agartala (Tripura), Shillong (Meghalaya), Aizawl (Mizoram), Imphal (Manipur), Silchar (Assam), Dibrugarh (Assam), Nagaon (Assam), Jorhat (Assam), Dimapur (Nagaland), Gangtok (Sikkim) and Kohima (Nagaland). NER houses 3.8% of India’s total population and is allot-ted 25 out of a total of 543 seats in the Lok Sabha (or 4.6% of the total seats).According to census data, the total literacy rate of the pop-ulation in the region is about 69%with female literacy at 62%– higher than the country’s av-erage. There are variations in the literacy rates among different states – Assam and Arunachal Pradeshare below the national average while Mizoram and Tripura top the list in India.
Strategic importance: It is vital to India’s de-fence architecture with a fairly heavy deploy-ment – it shares borders with Bangladesh, Myanmar, Nepal, Bhutan, and south-western China. NER is India’s land bridge to Myanmar and a gateway to Southeast Asia.
Natural resources: The region is endowed with bio-diversity, hydro-potential, oil and gas, coal, limestone, bamboo, and forests. It is ideally suited to produce a whole range of plantation crops, spices, fruit, flowers, and herbs – much of which can be processed and exported too.

69GROUND VIEW GROUND VIEW Annual Edition 2016 Annual Edition 201668
Most of the limestone reserves in NER are in Jaintia Hills district in Meghalaya; hence, almost all of the cement plants in the region are located here. Due to the difficult and hilly terrain where many places are inaccessible, the people have developed a tendency to resolve their problems without expecting outside intervention. In mining and related activities, external intervention is rarely seen and is not well tolerated.
For the cement industry, this means that all fuel-resource supplies are through the local community. In fact, it’s a common (and amusing) sight to find small piles of coal stacked at intervals besides the road across the hilly terrain. While there are many mining and crushing sites across NER, this region has virtually no external fuel supplies – hence the dependency risk on locals is huge. In certain cases, where limestone mining reserves are inadequate or not of cement-grade quality, few cement manufactur-ers choose to buy limestone from locals who own such limestone mines.
Adequate limestone and coal – the lifeblood for cement industry
A local crushing plant for limestone and coal
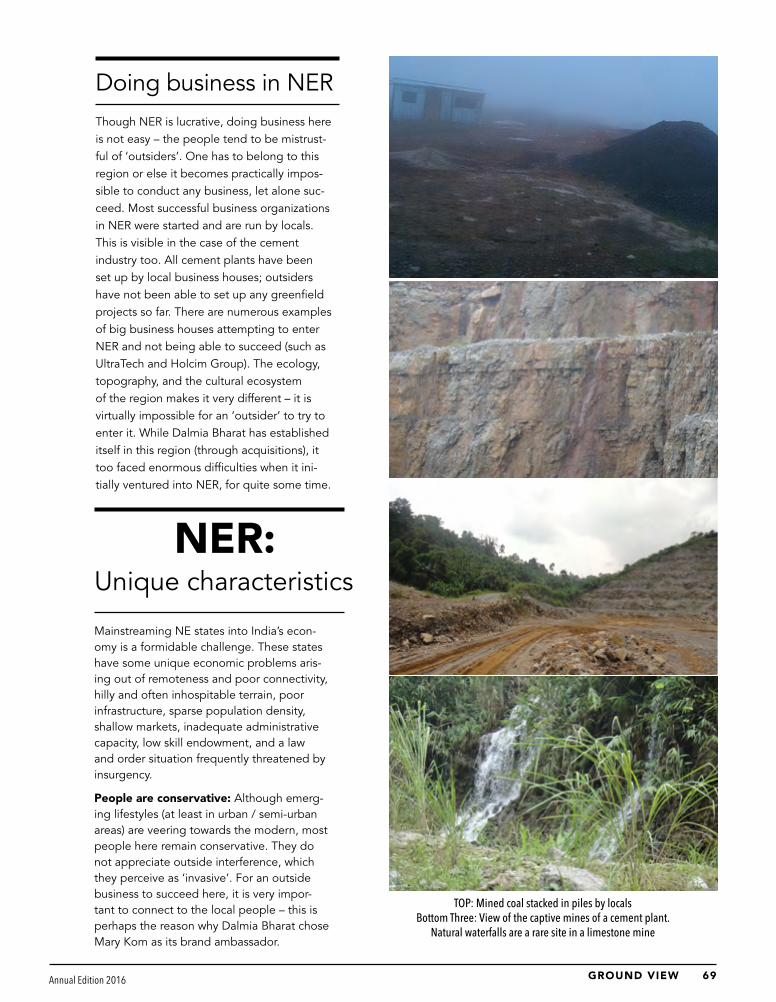
69GROUND VIEW GROUND VIEW Annual Edition 2016 Annual Edition 201668
TOP: Mined coal stacked in piles by locals Bottom Three: View of the captive mines of a cement plant.
Natural waterfalls are a rare site in a limestone mine
Doing business in NERThough NER is lucrative, doing business here is not easy – the people tend to be mistrust-ful of ‘outsiders’. One has to belong to this region or else it becomes practically impos-sible to conduct any business, let alone suc-ceed. Most successful business organizations in NER were started and are run by locals. This is visible in the case of the cement industry too. All cement plants have been set up by local business houses; outsiders have not been able to set up any greenfield projects so far. There are numerous examples of big business houses attempting to enter NER and not being able to succeed (such as UltraTech and Holcim Group). The ecology, topography, and the cultural ecosystem of the region makes it very different – it is virtually impossible for an ‘outsider’ to try to enter it. While Dalmia Bharat has established itself in this region (through acquisitions), it too faced enormous difficulties when it ini-tially ventured into NER, for quite some time.
NER: Unique characteristics
Mainstreaming NE states into India’s econ-omy is a formidable challenge. These states have some unique economic problems aris-ing out of remoteness and poor connectivity, hilly and often inhospitable terrain, poor infrastructure, sparse population density, shallow markets, inadequate administrative capacity, low skill endowment, and a law and order situation frequently threatened by insurgency.
People are conservative: Although emerg-ing lifestyles (at least in urban / semi-urban areas) are veering towards the modern, most people here remain conservative. They do not appreciate outside interference, which they perceive as ‘invasive’. For an outside business to succeed here, it is very impor-tant to connect to the local people – this is perhaps the reason why Dalmia Bharat chose Mary Kom as its brand ambassador.

71GROUND VIEW GROUND VIEW Annual Edition 2016 Annual Edition 201670
Top: Mary Kom, Brand ambassador for Dalmia Cement
Below Top: In many parts of Meghalaya, Bangladesh’s mobile networks can be easily caught
Middle: The famous Kamakhya Devi Temple at Guwahati
Bottom: Bangladesh, visible from the hills of Meghalaya
Language barriers persist, but it is manageable: Like other regions in India, language barrier exists. NER has several active dialects in use, but very few are known to the outside world. Almost 15 ‘main’ languages are spoken in NER – Assamese, Nepali, Manipuri or Meiteilon, Kokborok or Tripuri, Nagamese, Mizo, Khasi, Garo, Bodo, Karbi, Dimasa, Mishing and Apatani, Bishnupriya Manipuri, and Rabha. Among the seven states, Assamese and Manipuri lan-guages have been included in the eight schedule of the Indian constitution. But, within these main languages, there are many dialects, which are yet unknown (some are endangered). Since a lot of people from Bihar, West Bengal, and Bangladesh have settled in this region, one can get by speaking Hindi and Benga-li, especially in Assam. But for more insular and isolated states, such as Meghalaya where Khasi and Garo are the most spoken languages, this may not work. Bangladesh, where Bengali is the official language, is so close to some parts of Meghalaya that its mobile networks are visible in the manual selection mode of mobile handsets in this region.
God-fearing people: People here are god fearing – one possi-ble reason for this is the frequent natural calamities that they have to deal with such as floods and earthquakes. These calamities also act as barriers to what they perceive to be the ‘outside’ world and ‘outsiders’, especially for the businesses that are eager to venture into this region.
Sense of belonging is huge: Most of the people here are very attached to their lands, their villages, their towns – whatever part of NER they belong to. It is very rare to see people leaving their homes and states for higher income and better lifestyles – something that is becoming increasingly common across all parts of India. People here seem to be happier to remain close to the place that they were born in – this is not to say that they do not have aspirations – they do. However, their aspirations do not appear to be as high as in other regions in India. The people here appear more satisfied with their life and lifestyle – they seem self-contained and happy to grow within the region rather than without. Although people here do not have a closed mind-set exactly, making them accept new ideas is quite challenging.
People seem unsure about their inclusion in India’s growth: People here have their own reservations about being a part of India and yet being left to their own devices for years, largely ignored by successive po-litical regimes. They feel worried about their region’s inclusion in India’s growth. While politics is to blame, it is also because of the sheer physical isolation of NER, and also due to the conservative outlook of the people here and their attachment to their land –this remains a key bottleneck to growth. It is probably the reason why many ministers have increased their visits to NER, largely to reiterate the centre’s commitment to this region.
“NER is almost like a mini country in itself – its dynamics are very different from any other region in India.”

71GROUND VIEW GROUND VIEW Annual Edition 2016 Annual Edition 201670
Cement industry in NER
N E R ’ S C E M E N T I N D U S T R Y & I T S D Y N A M I C S
Today, cement is considered one of the vital industries in NER, by locals and
the government. It is surprising that nearly 20 cement brands exist in this
region. In terms of sheer number of distinct brands, it would probably be
much higher than any other region in India with similar demographics.
Interestingly, NER’s cement industry is not too old. While some smaller
plants started coming up in 1999, Star Cement, which started in 2005, is
believed to be the first large cement manufacturing plant in this region.
Before this, all cement for this region was imported from other parts of India
or from other countries. After Star Cement’s entry, multiple cement brands
sprang up in NER, but almost all these cement ventures were started by
local business houses. Dalmia Bharat is the only outsider to venture into
this region and succeed — but Dalmia did so through an acquisition even
though it had initially planned a greenfield plant.
Star Cement’s cement plant in Lumnshnong in Meghalaya –most efficient in NER

73GROUND VIEW GROUND VIEW Annual Edition 2016 Annual Edition 201672
Practically impossible for an outsider to set up a
greenfield plant
Despite multiple incentives to setup Greenfield plants
in NER, it is practically impossible for an outsider
to do this. Many describe the effort as nightmarish.
There are several instances of cement manufacturers
trying to set up greenfield capacities here and failing
miserably. Even big boys such as UltraTech and Holcim
have attempted to venture into this region but have
not yet tasted success. None of the mainstream
cement manufacturers (barring Dalmia Bharat) have
any manufacturing facilities in NER. Since these
majors have not succeeded in greenfield plants, they
are now determined to establish themselves in this
region through acquisitions and alliance partners. A
few are actively scouting deals or partnerships with
existing cement manufacturers of NER. Dalmia Bharat
initially planned a greenfield, but faced many hurdles.
Changing tacks, it made two sizeable acquisitions –
Calcom Cement and Adhunik Cement – and is now
well established in NER.
Incumbents are in a golden space
• High social and geographic entry barrier: It is
practically impossible for an outsider to enter this
region without local support. Moreover, the terrain
is difficult.
• Resource supply is committed, assuming no local
issues: Most of the land in the hills is owned by the
community, not the states. Plants located in states
falling under the Schedule-6 (areas from Assam,
Meghalaya, Tripura and Mizoram) do not fall under
the purview of recent mining acts. Hence, there is no
risk that cement players have to surrender limestone
mines or reserves. Almost all cement plants in NER
are based out of Meghalaya (barring few plants in
Assam of which most are grinding units) and all the
plants in this state enjoy Schedule-6 benefits. All fuel
supplies are also through local sources only and the
only threat to raw material sourcing is local agitation.
Falling under Schedule 6, Star Cement management
believes that the cement industry in Meghalaya is not
liable to pay DMF, but it is liable to pay royalty on
limestone (like any other region).
• A highly brand conscious market: Since NER is a
brand-conscious market, it will generally mean higher
price premium in realisations.
• Limited scalability means NER producers are in
golden space: NER’s growth potential in the long
term seems extremely strong. Given that NER’s
landscape offers limited scalability for cement
plants (scope largely only for existing players), the
incumbents are probably in a golden space – they
are likely to see sustainable earnings CAGR in the
medium to long term.
Structure of NER’s cement industry
Almost all integrated cement manufacturers in NER are
based in Meghalaya. More interestingly, all these plants
are on a single stretch of road – Jaintia Hills (spread
across 40-50km) barring a couple of plants that are a
bit ahead (another 40-50km). Meghalaya is the heart of
the cement industry and on the Jainitia Hills road, there
is nothing other than cement plants. The only notable
plant that is not located in this belt is the vintage plant
of Mawluh Chera – it was a government-owned plant in
Cherrapunji that is now shut for over two years. Set up in
the early 1960s, Mawluh Chera is the oldest Public Sector
Undertaking (PSU) in Meghalaya and its only state-owned
cement plant.
Details of the northeast industrial and investment promotion policy 2007• All new and existing units that go for substantial expansions,
and which begin commercial production within a 10-year period from the date of notification of NEIIPP, 2007, will be eligible for incentives for a period of ten years from the date of commence-ment of commercial production.
• Incentives available to all industrial units, new and existing, on substantial expansions located anywhere in NER. The distinction between ‘thrust’ and ‘non-thrust’ industries made in NEIP 1997 was discontinued.
• Incentives on substantial expansion will be given to units ef-fecting an increase by not less than 25% in value of fixed capital investment in plant and machinery for the purpose of expan-sion of capacity/modernization and diversification.
• 100% excise duty exemption on finished products made in NER.• 100% income tax exemption.• Capital Investment Subsidy for investment in plants and ma-
chinery at 30% capped at Rs300mn. For grant of Capital Invest-ment Subsidy higher than Rs15mn, an Empowered Committee will approve it and Union Cabinet consideration and approval will also be required.
• Interest subsidy at 3% on working capital loan.• New and existing industrial units are eligible for reimburse-
ment of 100% insurance premiumon substantial expansions.

73GROUND VIEW GROUND VIEW Annual Edition 2016 Annual Edition 201672
View of the closed Mawluh Cherra plant at Cherrapunji
Motivations of local entrepreneurs setting up cement plants
Given the various disadvantages that NER faces (geographical
isolation, transportation bottlenecks, small market size, low
investments and virtual absence of private sector),the central
and state governments announced various incentive and subsidy
schemes to attract investments and capital into the region. The first
such instance was the Transport Subsidy Scheme in 1971. This scheme
was introduced to develop industrialisation in the remote, hilly, and
inaccessible areas by providing subsidy in the transportation cost
incurred by industrial units so that they could compete with other
similar industries that were better off geographically. Subsequently,
other incentive plans such as NEIP 1997 and North East Industrial
and Investment Promotion Policy (NEIIPP) in 2007 (which itself
was an extension of NEIP, 1997) were also announced to attract
investments from industries in NER.
Given these benefits, many local business entrepreneurs who owned
mining lands contemplated venturing into cement manufacturing.
Star Cement was among the first to take initiative and others
followed. More interestingly, almost all of these plants were initially
setup only to cash in on incentives with a plan of seeking a lucrative
exit later. Today, Star Cement, Dalmia Bharat, and TopCem (three
largest) are the only players that appear committed to remain in
the business of cement manufacturing for the long term. Although
others may yet continue, it is too premature to assume that they will
make their mark in the region. It does appear that all other brands /
cement manufacturers are available for sale.
If plants are available, then why aren’t deals happening?
Despite multiple plants being available for sale, barring Dalmia’s
acquisition of Calcom Cement and Adhunik Cement, no other deal
has gone through. There are multiple reasons for this:
• Like in many failed consolidation discussions, the sellers’
expectations are too high.
• Logistical connection between NER and other regions of India
is not very strong. Many manufacturers do not want to venture
into this region, as they find virtually no synergies with their
operations in other regions.
• For many mainstream manufacturers, it has proven tough
to monitor developments in NER and seek an entry, given
the unique nature of this region. Existing ways in which raw
material is available, and the nature of fuel-supply agreements
with locals, did not provide comfort to most these cement
manufacturers.
• Mainstream cement manufacturers who do not want to deploy
substantial capital into the region sought entry by becoming
marketing partners or alliance partners of local cement
manufacturers in NER – these manufacturers have largely
rejected this approach.
• Its current market size – around 7mn tonnes per annum – does
not appeal to most mainstream cement companies.
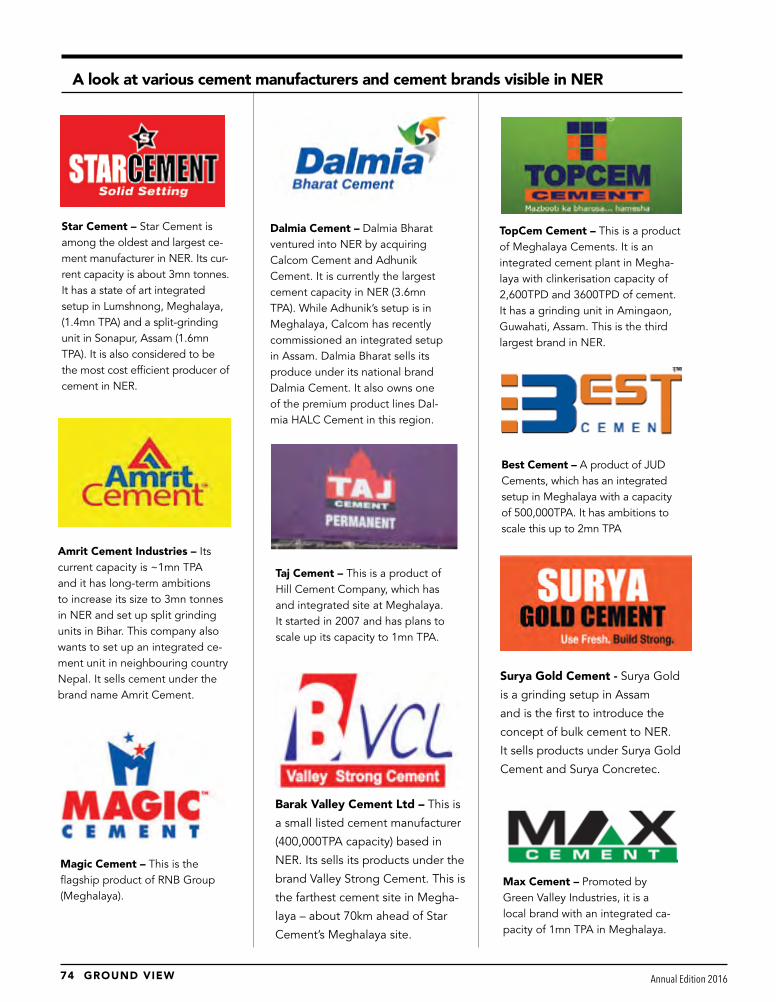
75GROUND VIEW GROUND VIEW Annual Edition 2016 Annual Edition 201674
A look at various cement manufacturers and cement brands visible in NER
Star Cement – Star Cement is among the oldest and largest ce-ment manufacturer in NER. Its cur-rent capacity is about 3mn tonnes. It has a state of art integrated setup in Lumshnong, Meghalaya, (1.4mn TPA) and a split-grinding unit in Sonapur, Assam (1.6mn TPA). It is also considered to be the most cost efficient producer of cement in NER.
TopCem Cement – This is a product of Meghalaya Cements. It is an integrated cement plant in Megha-laya with clinkerisation capacity of 2,600TPD and 3600TPD of cement. It has a grinding unit in Amingaon, Guwahati, Assam. This is the third largest brand in NER.
Dalmia Cement – Dalmia Bharat ventured into NER by acquiring Calcom Cement and Adhunik Cement. It is currently the largest cement capacity in NER (3.6mn TPA). While Adhunik’s setup is in Meghalaya, Calcom has recently commissioned an integrated setup in Assam. Dalmia Bharat sells its produce under its national brand Dalmia Cement. It also owns one of the premium product lines Dal-mia HALC Cement in this region.
Amrit Cement Industries – Its current capacity is ~1mn TPA and it has long-term ambitions to increase its size to 3mn tonnes in NER and set up split grinding units in Bihar. This company also wants to set up an integrated ce-ment unit in neighbouring country Nepal. It sells cement under the brand name Amrit Cement.
Taj Cement – This is a product of Hill Cement Company, which has and integrated site at Meghalaya. It started in 2007 and has plans to scale up its capacity to 1mn TPA.
Best Cement – A product of JUD Cements, which has an integrated setup in Meghalaya with a capacity of 500,000TPA. It has ambitions to scale this up to 2mn TPA
Magic Cement – This is the flagship product of RNB Group (Meghalaya).
Max Cement – Promoted by Green Valley Industries, it is a local brand with an integrated ca-pacity of 1mn TPA in Meghalaya.
Surya Gold Cement - Surya Gold
is a grinding setup in Assam
and is the first to introduce the
concept of bulk cement to NER.
It sells products under Surya Gold
Cement and Surya Concretec.
Barak Valley Cement Ltd – This is
a small listed cement manufacturer
(400,000TPA capacity) based in
NER. Its sells its products under the
brand Valley Strong Cement. This is
the farthest cement site in Megha-
laya – about 70km ahead of Star
Cement’s Meghalaya site.

75GROUND VIEW GROUND VIEW Annual Edition 2016 Annual Edition 201674
Goldstone Cement - Goldstone cement is an upcoming plant in Meghalaya with an integrated setup. The plant is likely to be operational in next 12-18 months. Scalability of this plant (as per sources) is likely to be upto 2.5mn TPA.
Raksha Cements – This is a small integrated unit – just 60,000 TPA capacity – based in Assam. Barring Calcom (Dalmia Bharat’s Assam unit), Raksha Cement is one of the few NER cement manufacturers with an integrated setup in Assam. It sells under the brand Raksha Cement.
Prithvi Cement - This unit is locat-ed in Lanka, Assam (near Dalmia Bharat’s Assam unit). It is a small cement manufacturer.
Purvanchal Infra & Industries: Yet another brand present in NER.
Cherra Cement: - This is the oldest cement brand in NER and a product of Mawluh Cherra Cement. This plant is now shut down, and barring a few hoard-ings advertisements around the plant area in Cherrapunji, its presence is virtually absent.
Virgo Cement - This is anoth-er cement brand in NER that is now virtually absent. It is a 600 TPD cement-manufacturing unit located in Damas, East Garo Hills District, Meghalaya. In June 2015, five suspected AMEF militants lobbed two IED bombs inside this factory and fled into darkness un-der the cover of open fire. There were no casualties, but the plant was partially damaged. The belief is that the attack was because of rejected extortion demands.
Consolidated markets
despite multiple brandsWhile there are nearly 20 cement brands in NER, it is still
a fairly consolidated market. Out of the installed capacity
of ~11mn TPA, the top-3 cement manufacturers – Dalmia
Bharat, Star Cement and TopCem – have almost 70% share.
Small cement manufacturers are hardly left with any choice
but to follow the larger cement manufacturers. Star Cement,
Dalmia Bharat and TopCem remain the tier-1 brands in this

77GROUND VIEW GROUND VIEW Annual Edition 2016 Annual Edition 201676
UltraTech Cement - It brings cement to NER from its Bangla-desh facility (it has a small grinding setup in Bangladesh of 500,000 TPA). Ambuja Cement - Ambuja supplies ce-
ment to NER through its Farrakka plant in West Bengal, but in minuscule quantities.
Lafarge - Lafarge is also present in this region to a small extent, but interesting-ly, it is the only cement capacity to have a fully integrated facility in Bangladesh. Given the scarcity of limestone in Bang-ladesh, Lafarge Bangladesh has laid a 17km-long conveyor belt that runs from Meghalaya to Lafarge’s cement plant in Bangladesh to supply crushed limestone to its integrated facility.
Crown Cement - This is a product of M.I. Cement Factory, Bangladesh. It exports marginal quantities of its produce into NER. Its capacity in Bangladesh is ~1.7mn TPA.
Rhino Cement - This is a new brand and believed to be intro-duced in NER by a local cement manufacturer - some large hoard-ings of this brand were seen at a couple of places in Guwahati. Interestingly, Rhino Cement is also a brand owned by an African Major - Arm Cement. Branding of both these brands appear similar and hence a possible tie-up of this local manufacturer with Afri-can giant cannot be ruled out.
Dragon Cement – This is a prod-uct of Dungsam Cement Corpo-ration, Bhutan. It is an integrated cement plant located 150km north-west of Guwahati with an installed capacity of ~1.3mn TPA and exports
minor quantities to NER.
Views of Lafarge’s conveyor belt that runs in from Meghalaya to Bangladesh
Other than local brands, large cement majors also make their presence felt

77GROUND VIEW GROUND VIEW Annual Edition 2016 Annual Edition 201676
Other than local brands, large cement majors also make their presence felt
Branding and advertising in NERThough there are only three top brands, amusingly, all cement manufac-turers tend to indulge in heavy advertising and branding – literally every second hoarding is a cement manufacturer’s. NER manufacturers have practically explored all kinds of local platforms to advertise their brands, especially the top three manufacturers. The branding campaigns are heavy on the local thrust with some unique attempts to connect with customers. Some such attempts include:
Surrogate branding
Star Cement initiated the concept of surrogate branding in NER – its aim was to increase visibility in places that its direct/indirect customers frequent (such as pan shops, dhabas, restaurants, plumbing shops, paint shops).
Radio advertising
Radio advertisements seems to be an excellent initiative to reach con-sumers, especially in underdeveloped and uncomfortable terrains such as NER – here, the reach of radio advertisements is much higher than other visual modes. This is a unique to this region – it is rare to hear ce-ment advertisements on radios in other regions of India.
Campaigns for dealers / user segments and the general public
Large cement companies in NER indulge in advertising and branding practices that involve a lot of participation from its end users – especially by regional leaders such as Star Cement. For example, during the Durga Pooja Mahotsav the company organised campaigns in which it offered an all-expenses-paid trip to Kolkata (to participate in festivities there) for the world’s largest and biggest durga idol. It also offered additional prizes such as tablets, smartphones, silver coins, and cash prizes. These kind of advertisements and branding exercises are very well appreciated by the audience in NER, where even a small token of appreciation acts as a big morale booster.
Bhupendra Hazarika at an event organized by Star Cement

79GROUND VIEW GROUND VIEW Annual Edition 2016 Annual Edition 201678
TopCem advertises heavily just outside Star Cement’s local head of-fice in Guwahati, indicating tough competition among tier-1 brands
Heavy branding in and around district and state roads and national highwaysAcross roads, advertisements of cement brands almost overpower all others. Even in the remotest roads, for exam-
ple the road from Shillong to Cherrapunji, the only advertisements those were visible were cement brands.

79GROUND VIEW GROUND VIEW Annual Edition 2016 Annual Edition 201678
Infrastructure growth agenda for NER will help the cement industry in the long term
D E M A N D T R I G G E R S F O R C E M E N T I N N E R
Both central and state governments have
been consistently announcing infrastruc-
ture development projects for NER.
Numerous comments by bureaucrats,
ministers, business leaders, local entrepreneurs,
distributors, and channel partners suggest robust
infrastructure initiatives in NER are underway,
which will ultimately trigger growth for cement
consumption. Initiatives on infrastructure develop-
ment in the region look positive with growth like-
ly across all infrastructure verticals including rail-
ways, roads, ports, inland waterways, airports, and
hydropower. NER also remains a focus area for PM
Modi – he has announced several initiatives. Any
project in this region will have a material impact
its growth because the base is too low. Here are
a few details:
Housing:
Given that NER is an earthquake-sensitive re-
gion, most houses are made of material other
than concrete – such as bamboo, mud, and
bricks – they are typically called ‘Assam-type
houses’.
Census data shows that only about 3% of hous-
es in Assam (NER’s largest state) are concrete
with concrete roofs; 11% (nearly 700,000) are
classified as not liveable. This suggests huge
potential housing demand in the long term.
Even if we consider rehabilitation of these
non-liveable houses and their conversion into
concrete (of say 200 sq. ft. area), the potential is
3.5mn tonnes of incremental cement demand.
Considering the long-term potential of con-
version of 6mn houses to concrete the overall
potential for cement is as high as 30mn tonnes
(assuming only 200 sq. ft. houses).
While theoretically these numbers look attrac-
tive, the conversion to concrete is going to be
a very long-term process. However, even if just
500,000 tonnes p.a. of cement is consumed
from the houses that are supposed to convert
to concrete, it will translate into +8% cement
demand growth in NER.
Assam-type houses

81GROUND VIEW GROUND VIEW Annual Edition 2016 Annual Edition 201680
NER is essentially hilly terrain – so it is amazing to
see that most of the highways are good quality.
In certain areas, the roads are even better than
our metros. Transport minister Nitin Gadkari re-
cently announced a 10,000km road network for
NER at a cost of Rs500bn. Though road projects
typically do not consume large quantities of ce-
ment, because of NER’s rough and hilly terrain,
cement consumption here is likely to be higher.
Due to frequent landslides, cement consumption
will also include RCC culverts, curves, bridges,
and road borders. For every 1,000km two-lane
road, the benchmark consumption is about 1mn
tonnes of cement. Theoretically, this will trans-
late to 10mn tonnes of demand, assuming 100%
cemented roads. However, even if 20% of this
network is cemented, it will translate into 2mn
tonnes of incremental cement demand and will
boost demand CAGR by +10% over the next few
years. Going by the announcements made by
central and NER’s state governments, expecta-
tions of huge road project development in NER
seem realistic.
Road infrastructure development
The governments (central and state) intend
to:
• Connect all state capitals in NER with im-
proved / upgraded national highways
• Provide connectivity to all district head-
quarters through improved state roads
• Improve connectivity with neighbouring
countries
• Provide road connectivity to backward and
remote areas of NER
• Improve some of the important roads of
strategic importance within NER
Specific emphasis on development of roads
in Arunachal Pradesh
Arunachal Pradesh has the lowest density of
roads among NERstates. It shares over 1000km
of sensitive border with China and Myanmar
and has vast potential for hydropower gen-
eration. Considering this, the trans-Arunachal
highway network of about 900km needs to be
upgraded urgently. This will also lead to mate-
rial demand for cement.
Urgent need to improve bridges in NER
NER consistently suffers from lack of inter-re-
gional connectivity. There has been consistent
demand to provide increased connectivity be-
tween north and south Assam by constructing
bridges on the river Brahmaputra at various lo-
cations such as (1) north and south Guwahati,
(2) Jorhat and north Lakhimpur via Majuli, (3)
Dhola and Sadia, and (4) Dhubri to Phulbari in
Meghalaya.
Roads in NER will be a key driver for cement
demand. The base of cement consumption in
NER is so low that any material demand from
such projects will look significant. Due to the
nature of the terrain, road projects could lead
to higher cement consumption. Mr Gadkari
seems committed to building quality infrastruc-
ture in NER. This region may generate higher
cement demand from road projects vs. other
parts of India, at least in the medium term.
A construction site in NER

81GROUND VIEW GROUND VIEW Annual Edition 2016 Annual Edition 201680
Central and state governments have ambitious plans to improve rail connectivity in NER. Though this may not lead to huge demand (railway projects do not tend to consume high quantities of cement vs. road projects), any material in-crease in demand is positive for the industry due to the low base. De-velopment of rail network will mean facilitation of trade and commerce in this region, addressing one of the major problems for long-term growth – poor connectivity.
The vision of the railways is to more than double the railway connectivi-ty in NER by the end of 2020
Connectivity issues in NER will be significantly addressed with im-proving railway connectivity. A sig-nificant boost to trade and com-merce is likely, though it is difficult to quantify demand for cement. Improving railway connectivity will bring a structural long-term change in the economics of doing busi-ness in NER. This will be more of a longer term positive rather than an immediate positive for the cement industry.
Development of railwaysYear / kms Length : Broad
Gauge (BG)Length : Meter
Gauge (MG)Length: Narrow
Gauge (NG)Total
1990 772.47 2986.56 87.48 3846.51
2010 2775.72 1389.80 87.48 4253
2020 5806.14 50* 87.48* 5943.62
*50 km MG & 87.48 km NG are world heritage sites
The vision of the railways is to more than double the railway connectivity in NER by the end of 2020
1990 2010 Vision 2020
1. BG (broad gauge) lines only uptoGuwahati. MG (meter gauge) lines beyond Guwahati
BGLine upto Dibrugarh and Tinsukia.Gauge conversion of Guwahati – Tinsukia – Di-brugarh completed including Furkating – Jorhat – Mariani and Simaluguri – Sibsagar – Moranhat branch lines
All state capitals on BG
2. Only one routebetween New Jalpaiguri and Guwahati
A complete alternative BG route from New Jalpaiguri to Guwahati commissioned by gauge conversion of Siliguri-New Jalpaiguri-New Bongaigaon MG line and Jogighopa – Guwahati new line
A third alternative BG route fromNew Maynaguri to Jo-gighopa will be commis-sioned
3. Mostly single BG line beyond Katihar and Malda.
Rajdhani Express introduced – Guwahati-Delhi takes 28 hours.
Doubling of New Jalpaiguri-Samuktala complete
4. Most express trains take 40-48 hours from Delhi to Guwahati
Dibrugarh/Tinsukia to Delhi – 40 hours
The entire Barak Valleyon BG network
5. Time taken to reachDibrugarh/Tinsukia from Delhi– up to 65 hours
Second railway bridge across river Brahmaputra (rail-cum-road) at Jogighopa
Third Railway Bridge across River Brahmaputra – rail-cum-road bridge at Bogibeel
6. Only one railway bridge across Brahmaputra (rail-cum-road bridge at Saraighat, Guwahati)
Capital of Tripura (Agartala) connected by MG line
Entire north bank of Brahmaputra will be on BG network and get connected to the south bank at Dibru-garh through Bogibee
7. No connectivity to capital city of any state except Assam
Comparative scenario of rail connectivity in NER in 1990 vs. 2010 and 2020

83GROUND VIEW GROUND VIEW Annual Edition 2016 Annual Edition 201682
R A I L W A Y M A P O F N O R T H E A S T F R O N T I E R R A I L W A Y
R A I L W A Y M A P O F A S S A M

83GROUND VIEW GROUND VIEW Annual Edition 2016 Annual Edition 201682
Railw
ay m
ap o
f Aru
nach
al P
rade
shRa
ilway
map
of M
anip
ur
R A I L W A Y M A P O F M A N I P U R
R A I L W A Y M A P O F A R U N A C H A L P R A D E S H

85GROUND VIEW GROUND VIEW Annual Edition 2016 Annual Edition 201684
Air connectivity to NER is also under revival.
Guwahati remains the only major commercial hub,
which is quite well connected to the rest of India.
Apart from Guwahati, air connectivity to NER
is poor or below average. Though the average
number of departures per week has improved to
nearly 500 from 226 in 2001, there is tremendous
scope to improve air connectivity to the region.
DoNER has listed the following reasons for a
revival and upgradation of air connectivity in NER.
1. Terrain makes air connectivity not just an option
for travel, but an absolute necessity.
2. Road and railways are highly capital intensive.
Development of air infrastructure is lesser so.
3. Improvement in air connectivity will help NER
gear up on agriculture, tourism, and services.
4. Improved air connectivity will also facilitate
movement of perishable agro commodities.
More so, quick and reliable movement of cargo
is necessary to find markets within and outside
NER for such commodities.
5. Cities such as Shillong can be developed
as educational hubs in the longer term and
improved air connectivity will facilitate this
initiative.
6. NER remains threatened by natural disasters.
Improving air connectivity will mean better
evacuation mechanism for patients during
natural disasters.
7. Improving air connectivity also has strategic
reasons – to protect NER from international
threats and opening up the region, especially
to the ASEAN countries.
There are 11 operational airports in NER, 12 non-
operational airfields, and three greenfield projects
are under evaluation or execution. For the time
being, revival of existing airports remains a priority
Aviation opportunity in
NER
A Hydro-Power construction site in NER
and major new greenfield announcements
may not happen. Governments are already
considering developmental plans for non-
operational airports in Arunachal Pradesh,
Tripura, and Meghalaya. Ground View’s
checks also suggest that around five
airfields are being developed in Arunachal
Pradesh, especially as an Air Force base. All
these developments will definitely add to
the cement demand in the region. However,
more importantly, upgradation and revival
of air connectivity to NER will significantly
help it to attract investment and will be
structurally positive in the long term.

85GROUND VIEW GROUND VIEW Annual Edition 2016 Annual Edition 201684
Hydropower projects in NER
State Identified capacity (MW) Capacity Developed (MW) Capacity under development Capacity yet to be developed
Total (MW) (MW) % of Total (MW) % of Total (MW) % of Total
Arunachal Pradesh 50,328 405 0.8 2,710 5.4 47,213 93.8
Assam 680 375 55.1 0 0.0 305 44.9
Manipur 1,784 105 5.9 0 0.0 1,679 94.1
Meghalaya 2,394 282 11.8 40 1.7 2,072 86.5
Mizoram 2,196 0 0.0 60 2.7 2,136 97.3
Nagaland 1,574 75 4.8 0 0.0 1,499 95.2
Sikkim 4,286 669 15.6 2,322 54.2 1,295 30.2
Tripura 15 0 0.0 0 0.0 15 100.0
Total (NER) 63,257 1,911 3.0 5,132 8.1 56,214 88.9
Potential of hydropower projects in NER
Among infrastructure projects, the cement-consumption inten-sity in hydropower projects is the highest. For every 1000MW of a hydropower project, the consumption of cement is ~1.5mn tonnes. A hydropower project has the potential to consume 10,000-15,000 (~200,000-300,000 bags) of cement per day of construction.
Across the country, NER has the maximumpotential for hydro-power capacities and most of this is in Arunachal Pradesh. The table below highlights the potential for development.
In NER, 89% of hydropower projects are yet to be devel-
oped. If they are implemented, they will lead to a whop-
ping cement consumption of ~90mn tonnes.
However, interactions with few developers construct-
ing these hydropower plants suggest numerous bot-
tlenecks such as:
• Non-availability / delay in environment and / or forest
clearance
• Delay in private land acquisition
• Inter-state disputes
• Law and order / militancy problems
• Provision of resettlement and rehabilitation of the pop-
ulation dislocated because of such projects.
• Non-provision of employment for project-affected
families
• Concerns regard the protection of aquatic life
The region is unlikely to see huge activity in hydropower
in the near term. However, even if say 5% of the pro-
posed or identified projects are executed in the medium
term, it will boost cement demand significantly. The long-
term potential remains exciting.
Agitation by locals in NER against a hydropower project

87GROUND VIEW GROUND VIEW Annual Edition 2016 Annual Edition 201686
Inland water transport (IWT)
India has about 14,500km of
navigable and potentially navigable
waterways of which around 55%
are used regularly. NER’s inland
waterways are classified as
National Waterway 2. This route is
established since September 1988
across the Sadiya-Dhubri stretch of
the Brahmaputra River and is the
second-largest inland waterway of
the country at 891km –a 121km
stretch of the Barak River is already
under consideration as NW6.
NER has identified a 1,566km
stretch of tributaries of the
Brahmaputra and Barak rivers as
state waterways (feeder routes).
Kaladan multi-nodal transport
project will also provide alternate
route through Myanmar to NER.
Moreover, river Brahmaputra offers
immense scope for development of
river cruise and eco-tourism in NER.
Development of these waterways
will significantly boost internal
transportation within NER and will
emerge as an economical logistic
support for the transportation of
cement, which should eventually
positively impact development of
infrastructure in remote areas of
NER.Though difficult to quantify,
development of the new proposed
feeders will consume significant
quantities of cement.
R O U T E M A P S O F I W T- 2 A N D P R O P O S E D I W T- 6

87GROUND VIEW GROUND VIEW Annual Edition 2016 Annual Edition 201686
Positive – but in the long term
NER has huge initiatives lined up for the de-
velopment, but bottlenecks are not easy to re-
solve here. The conservative nature of the pop-
ulation and resistance to change is one such
key bottleneck. Building nearly 10,000 kms of
road, +50,000 MWs of hydropower, building
infrastructure across railways, airports, inland
waterways is a definite trigger that will boost
cement demand in the long term but bottle-
necks (land acquisition, forest clearances etc.)
persist. Nevertheless, NER’s cement demand is
likely to grow at sustained and healthy growth
rate in the medium term.
Even if 10% of NER’s planned projects take off,
it will boost demand CAGR to +8% very easily
because of a low base of only 7mn tonnes p.a.
of cement consumption. Hence, any major in-
frastructure initiative will create significant de-
mand. Demand from housing is also likely to
provide the crucial near term support.
Opportunities remain in favor of incumbents
Growth opportunities in NER remain distinct
and unique and the regional decision making
authorities are aware of this. However, the local
environment is still not open enough to sup-
port all these growth initiatives though much
has changed from what it used to be around
20 years back.
Ground view firmly believes that NER will con-
tinue to be a region dominated by likes of Star
Cement, Dalmia Bharat and TopCem and it is
very unlikely that new players will make a mark
in this territory. Big boys like Holcim group, Ul-
traTech may not make a mark here at all and
may look for an opportunity in form of an alli-
ance partner with any of the existing leaders /
local cement manufacturers.
Local connect is the key to success
Unlike other regions in India, the success for
any cement manufacturer (non-local) in NER
is its ability to connect with the local people.
Branding initiatives in NER tend to be much
stronger than in other regions. Advertisement
budgets of regional leaders such as Star Ce-
ment are massive and in terms of percentage
of sales, they are even larger than the national
cement majors. Local connect is the key to suc-
cess in NER.
To sum up, NER is more of a long-term opportu-
nity and this region will generate huge cement
demand once infrastructure initiatives gather
steam. If this happens sooner than expected, it
won’t be surprising to see cement grinding ca-
pacities in West Bengal and Bihar upping their
supplies to NER (given that it is tiresome to
setup capacities in this region). It is premature
to quote absolute numbers for potential of ce-
ment consumption in the region, but given its
underdeveloped nature, NER offers significant
growth potential in the long term and remains
an attractive region to bet on.
Vaibhav Agarwal ([email protected])
What’s in store for cement manufacturers in NER
T H E C O N C L U S I O N . . .

89GROUND VIEW GROUND VIEW Annual Edition 2016 Annual Edition 201688
BY NAVEEN KULKARNI & JUBIL JAINC O N S U M E R
Mr Muthuraman, a leading distributor and retailer of consumer products in Coimbatore, Tamil Nadu, is a worried man today. His receivables have risen to more than three weeks (from one week) and he frets that some of them might turn bad. This trend is visible across India to some degree or the other. According to him, the wholesale channel has significantly reduced stocking – thus, invested capital in the system has reduced meaningfully, putting substantial pressure on retailers. The reasons for the wholesale channel de-stocking inventory are many – ranging from lower product prices and tepid demand scenario to reduction in
company schemes.De-stocking of channel inventory by wholesalers is a lead indicator of the impending slower inventory turns and sluggish growth of profitability in the FMCG channel. However, even as the consumer sector seems to be slowing, it still offers reasonable long-term growth prospects. As one distributor in the south says, “India has layers and layers of customers and satisfying these needs by penetration or premiumisation offers the biggest opportunities in the FMCG market. Growth might slow at times but there will be growth”.
The Great Indian Consumer –
Feeling the pinchThe Great Indian Consumer –
Feeling the pinchA squeeze or a pinch? Growth still hangs on!

89GROUND VIEW GROUND VIEW Annual Edition 2016 Annual Edition 201688
Recently, consumer team of PhillipCapital conducted a tour of various Indian ge-ographies and met with various FMCG channel partners to get a ground view of activity in the consumer sector.
South India: An evolved market with an even more evolved consumer
South India accounts for 30-35% of consumption of branded goods and is a key market for all FMCG companies, even though it is significantly smaller than northern India in terms of number of consum-ers. Consumers in southern India exhibit a very high degree of awareness, but they are conservative. For HUL, penetration of modern trade and e-commerce in south India is greater than its all-India average of 15%. This region has a greater degree of urbanisa-tion compared to the rest of the country. A lead-ing FMCG company categorises the whole state of Kerala as an urban market. Due to the developed nature of south markets, penetration of online and modern trade has seen rapid progress in the last few years.
People with a heart of (for) gold
Shrividya is pensive and wonders about the financial pressure her wedding will put on her parents. She quickly brushes her thoughts aside and becomes cheerful as her younger sister calls her to board the bus her family has arranged for their shopping expedition to the city. The bus is teeming with rel-atives who will accompany Shrividya for the most important purchase of a south Indian wedding – the Mangalyam (essentially, a necklace that a Hindu groom ties around his bride’s neck in a ceremony called Mangalya Dharanam, Sanskrit for ‘adorning of the pious thread’). While the Mangalyam weighs just about 4-8 grams or so, the entire family (about 50 relatives) are involved in its purchase decision. “Two mangalyam customers and the store is full of people,” notes a store manager of Lalitha Jewel-lers with a wry smile. The sales executive displays various Mangalyam options (quite a few) and each relative (all 50 in Shrividya’s case) will touch and see the product. This ritual (of an entire family travelling by a specially arranged bus to the city for purchas-ing the Mangalyam) is very common in Tamil Nadu and Karnataka.
TOP: GV’s South India tour MIDDLE: Jewellery store in the busy Parry’s market in Chennai INSET: Mangalyam

91GROUND VIEW GROUND VIEW Annual Edition 2016 Annual Edition 201690
The ancillary expenses of buying a Man-galyam, which include transportation and lunch for the entire extended family, far exceed the cost of the product. The emotional attachment with gold pur-chases is particularly high in south India and it accounts for a significant portion of the savings and investment pool.
While attachment to gold is particularly high, the south-India customer is also a savvy customer and investor. In the last few years or so, Diwali season has largely stopped having a significant impact on gold purchases, noted a leading gold wholesaler in Chennai. He elaborated, “When gold prices fall, Tamilians will even borrow money to buy gold. Dassera was very good – gold prices had fallen and people thronged. Now it’s back to normal – wedding purchases, some here and there. Activity is declining.”
Wait until elections for activity to pick up in TN
Gold price movement and transactions are helpful in assessing the economic ac-tivity in south India, as a significant por-tion of the people’s wealth is locked in gold. As gold prices increase, wealth-ef-fect impacts consumer confidence and trading activity rises. A decline in gold prices can impact cash-rotation in south-ern states negatively, as people fre-
quently use gold as collateral for funding activities. Apart from slowdown in gold prices, businessmen often complain about the lack of development activities in Tamil Nadu. One leading building-ma-terials dealer said, “Till elections, no ma-jor activity is likely to happen and insti-tutional demand will remain slow. Retail sales are ok, same as last year, at least there is no decline.” GST will be a boon for consumer products, believes Mr. Mu-thuraman, a leading distributor.
Modern trade vs. general trade: A split wide open
Mr James, another leading distributor for FMCG brands and modern trade in Tamil Nadu contends that modern trade, in conjunction with online, is growing at more than 15% as compared to gener-al trade, which sees sub-10% growth. It also seems that this Diwali saw far great-er buzz in the modern trade than general trade, with offers galore across catego-ries.
Apart from modern trade, penetration of e-commerce has also increased rapidly. All southern states are evolved telecom markets and consumers like to order online. Selvaraj, a dealer of lighting ac-cessories in Chennai’s Parry’s wholesale market said, “People are buying lighting accessories online so we have reduced our inventory and added new prod-ucts such as air conditioners and water heaters to increase our sales.” He fur-ther added, “This Diwali, our sales are down year on year. Online has impacted our sales, but the fact is people are not spending very much. Incomes in the city are stagnant, so new purchases are not happening”.
Foods see strong traction; uphill task for Maggi ahead
Mr James said that the foods segment is growing significantly faster in modern trade. Foods are growing at around 20% yoy vs. non-foods at around 10%. Discre-tionary and impulse purchases are show-
South India accounts for lion’s share in Indian gold consumption
Sour
ce: P
hilli
pCap
ital E
stim
ates
Offers galore across categories in a busy modern trade outlet in Coimbatore

91GROUND VIEW GROUND VIEW Annual Edition 2016 Annual Edition 201690
ing reasonable traction in the southern markets. Plethora of new products are flooding modern trade. Even though Maggi was absent from the market due to regulatory issues in the early part of October, modern trade has significant shelf space dedicated to instant noodles. Yipee and other brands have occupied the shelf space dedicated to Maggi. A leading retailer in Chen-nai said, “If Maggi achieves 50-60% of its lost sales, it would have done a good job. Earlier, competition was slow, but it has gained good traction in the last couple of months. Howev-er, mothers now consider these products not so safe for their children – I would say it will be gold standard if Maggi achieves 80% of sales – it will be the best ever performance by Nes-tle, as their strength is marketing but not chan-nel sales.” On Knorr Soupy noodles, a leading wholesaler quoted, “Despite its strong distribu-tion reach, HUL has completely failed to capital-ise on the Maggi controversy – it has lost out to Yippee noodles in terms of product availability and shelf-space occupancy.”
Tobacco market gone dud
Even though consumer market is showing some growth (even as it faces one of its toughest times in recent history), the tobacco market, in particular cigarettes, are seeing the worst pos-sible times. Cigarette volumes for some ITC distributors have declined by as high as 40% in Tamil Nadu and Kerala, which hiked VAT rates last year. Stocks movement from neighbouring states like Karnataka, which has significantly lower VAT rate has been rampant. Moreover, cigarette stocks from Sri Lanka, priced signifi-cantly lower, have been entering India through the illicit route in far greater quantities than before. While volumes in the near term have seem some rebound, the environment remains highly challenging and major consumption pick up seems unlikely. Tobacco GST will minimize the unnecessary interstate movement of tobac-co products and improve distribution. While a high GST rate will be negative in the medium term, over the long term, it will ensure better transparency and swifter movements of goods, resulting in better inventory turnover and high-er profitability.
TOP: Not the usual Diwali season rush in Parry’s market in Chennai
BELOW: Some of the noodles shelf space once occupied by Maggi noodles is now occupied by other brands
ITC CIGARETTE REVENUE CONTRIBUTION BY STATESo
urce
: Phi
llipC
apita
l Est
imat
es

93GROUND VIEW GROUND VIEW Annual Edition 2016 Annual Edition 201692
Affluent Gujarat and its value conscious customersRegional brands staging a slow
comeback here
In her four decades of existence, Ke-
sarben has seen how Ahmedabad,
then a regional textile hub, has grown
to become one of the larger metro-
politan cities of India and how her
husband’s textile business has grown
with it. Shopping in a nearby provision
store in the posh Satellite suburb of
Ahmedabad, she asks for a bottle of
coconut oil. The shopkeeper quickly
presents her with two 500 ml bottles
of Coco Plus and Malabar priced at Rs
65 and Rs 85 respectively – he inten-
tionally avoids showing her Parachute
oil priced at Rs 173, even though he
stocks it. Remembering her shopping
preferences, he assures her that both
Coco Plus and Malabar are of a similar
quality to Parachute and are available
at less than half the price.
Due to a decline in commodity costs,
the presence of local and regional
brands in Gujarat has increased and
customers have been gravitating to-
wards them. Praful bhai, a wholesaler in
Dana Peth market of Rajkopt explains,
“Last six months have seen an increase
in traction of many regional brands per-
ceived to be offering similar quality as
top brands, but at a fraction of cost of
branded products. The customers of
Gujarat have purchasing power, but are
very smart. They aspire to shift to prod-
ucts perceived to be offering superior
quality. However, it is not the brand
name that matters a lot – it is the per-
ceived cost-benefit equation that mat-
ters here.” A survey of wholesalers in
the Rajkot market indicated that Wheel
detergent bars, Parachute oil, and Lux
soap bars were losing market share to
regional brands/lower priced rivals.
Entrepreneurship finds appeal at all
levels, in all classes
Hardik, a resident of Rajkot and an au-
to-rickshaw driver by profession, fre-
quently gloats over a decision he took
four years ago. He says, “From 2002
to 2011, I worked as a salesman for
FMCG firms like Colgate, Godrej
Consumer and HUL for a salary of Rs
10,000-12,000 per month. I used to be
stressed about targets and the pressure
was unbearable at times. I quit my job
in 2011 and became an auto-rickshaw
driver – I am my own boss now and live
a far less stressful and structured life. In
fact recently, I overheard the conver-
sation of a passenger (possibly a sales
officer) with his superior on targets and
achievements – and when I glanced
through the rear-view mirror at his
face, I saw what I was four years ago.
The signs of stress were clearly visible
on the sales manager’s face – I knew
this man will not be able to meet his
targets. I’m glad I’m not in that place
anymore.”
The free-spirited Gujaratis
Labour retention is a big challenge in
Gujarat, claimed a leading FMCG dis-
tributor based in Rajkot, due to the
plethora of opportunities in engineer-
ing and chemical industries, office jobs,
and the entrepreneurial mind-set of the
people. While earlier, he owned de-
livery trucks and hired people for de-
liveries, in the last three years, he has Malabar Coconut hair oil by Marico – avail-able at half the price of sister brand Parachute
Hardik, auto rickshaw driver from Rajkot, Gujarat

93GROUND VIEW GROUND VIEW Annual Edition 2016 Annual Edition 201692
sold off all his trucks and only rents
trucks with drivers. Mr Jatin, an-
other distributor from Ahmedabad
echoed the former’s views, “In Ah-
medabad, it is common for sales-
men earning Rs 12,000+ a month
to quit jobs and open retail outlets
in the basements of their houses or
switch to driving rickshaws and tax-
is. The increase in opportunities for
immigrants from UP/Bihar in their
home states has also added to la-
bour issues for most businesses.”
Demand slowdown? To some ex-
tent…
Pradeep Sanghani, a gold Jewel-
ler in the busy Yagnik Road area of
Rajkot, has given up all hopes of a
recovery in gold demand this year.
His sales this Diwali season are 50%
lower than last year. When asked
about the cause, he says, “Most
people in Gujarat have some invest-
ments locked up in stock markets.
With the stock markets down, and
the real estate sector undergoing
time correction since the last three
years, demand for gold in Rajkot
has seen a downward trend. The
business this Diwali was pale com-
pared to last 6-7 years.”
However, demand for staples has
shown more resilience than gold.
A survey of distributors catering to
major FMCG brands indicated that
though FMCG demand has slowed
down slightly, the demand situa-
tion in Gujarat is better than that in
north and south India. Mr Jatin, a
distributor catering to major FMCG
brands in Ahmedabad, feels this is
justified “because of Gujarat’s low-
er dependence on the agricultural
sector, which has been adversely af-
fected throughout the country due
to poor monsoons.”
Undercutting is the practice in which
a distributor sells products in mar-
kets of other distributors at a lower
cost to meet sales targets. Increase
in undercutting is an indicator of the
amount of strain on demand in the
markets. As compared to markets
like north India, undercutting was
found to be at manageable levels in
Gujarat and not a cause of concern.
However, that may also be because
of access to sea-ports from where
products can be exported through
various channels.
Gujarat tour map
Uttar Pradesh: A giant beginning to crawl
Growth on steroids resulted in vanishing li-quidity: HUL case study
Mr Kartik, rural distributor of HUL in UP was thrown into an ethical dilemma six months ago – like many others, Kartik started finding it stressful to meet his targets in a slowing de-mand environment. To add to his woes, many wholesalers and retailers in his area were being supplied products by neighbouring distributors indirectly at lower rates to meet their respec-tive targets. Kartik realised that to meet his own sales targets, he would also have to undercut other markets, as his own markets were being poached by others. Although undercutting by distributors has always existed in FMCG busi-nesses in Uttar Pradesh, it has started getting out of hand.
Mr Niraj, a wholesaler in Varanasi says, “Last year saw huge undercutting in markets and HUL has taken actions to combat this issue. Schemes provided to wholesalers have been reduced and sales of some SKUs were restrict-ed to clear out wholesale channel inventory and bring down undercutting.”
The vicious cycle of undercutting – nobody is a winner
For companies, taking strong action against un-dercutting can lead to loss of sales temporarily. Taking action now, when growth is struggling, indicates a structural issue plaguing the FMCG industry. In the last one year, despite sluggish demand, FMCG companies did not revise tar-gets of distributors. Sharp surge in wages in-creased costs significantly while price cuts in various categories were reducing the profita-bility of distributors. To meet their targets and to maintain profitability, distributors resorted to channel-filling and undercutting. As retailers struggled in the face of slowdown in demand, inventory started piling up at their end, which partly contributed to a liquidity crunch. Earlier,

95GROUND VIEW GROUND VIEW Annual Edition 2016 Annual Edition 201694
UP tour map
wholesalers used to give credit to retail-ers – but they liquidated a huge portion of their inventory, which led to reduced liquidity. Retailers became reluctant to stock excess inventory – this hurt distrib-utors’ sales and eventually the company’s sales.
Modern trade culture has a long way to go before it reaches national average
Uttar Pradesh has a very low penetration of modern trade, even in cities. While a Vishal Mega Mart (modern trade outlet in Allahabad) has a sale of Rs 40,000 a month for products of a leading FMCG company, many nearby general trade stores have a sale of Rs 60,000+ per month for the same company. MT discounts are available majorly on larger SKUs. An average shopper from UP has a lower wallet size due to which s/he prefers buying smaller SKUs from nearby outlets. Also, since MT outlets are located away from homes/workplaces, MT shopping is beneficial only for big-ticket purchases, which most UP shoppers find difficult due to depressed socio-economic levels.
Opportunities galore, but no more easy pickings from here
Somewhere in rural UP, Premium ayurvedic brand Kesh King endorsed by Indian actress Juhi Chawla
What’s in a name? Apparently just about everything for the Indian consumer
Mr Mithun has been running a retail outlet on the outskirts of village Jayapur since last 15 years. When asked about the trends he has seen emerging in customer behaviour, his immediate response was, “Brands! Everyone, from a labourer, a housewife, a farm owner, or a student, wants to buy branded products. The sales of non-branded soaps, detergents, tooth powders, and hair oils have reduced drastically over the years. Now everyone wants to buy Lifebuoy, Wheel, Colgate or Bajaj Almond Hair Oil.” This trend is pervasive throughout the country, both in urban and rural markets – a long-term positive for the entire FMCG sector.
Et tu rural north India? It presents a huge opportunity for staples and discretionary
A survey of rural UP distributors reveals that rural growth has been in the range of 12-15%. Though it is lower than 15%+ rural growth seen in the last few years, it is better than current urban growth, which is struggling at 6-10%. The trade channel indicated that rural penetration for FMCG products continues to grow for all major categories, albeit on a small base.
Mr Yadav, a paints dealer on the Varanasi-Kanpur highway has seen his business grow by 20%+ in the last few years. He attributes this to rising land prices around Varanasi and proximity
Distributor targets not revised despite falling
demand
Distributors resort to chan-nel filing and undercutting
to meet targets
Inventory pile up at retailers leads to delay in
payment to distributor and increases collection period
Company acts against undercutting and channel
filling, which leads to wholesalers liquidating
inventory
Absence of credit, which was earlier provided by
wholesalers adds to liquidi-ty crunchy
I M P A C T O F U N D E R C U T T I N G

95GROUND VIEW GROUND VIEW Annual Edition 2016 Annual Edition 201694
TOP: Paints outlet on Varanasi-Allahabad highway MIDDLE & BOTTOM: Many houses in UP do not have plastered or painted exterior and interior walls because of economic reasons
to Jayapur, a model village adopted by PM Narendra Modi. Both western and eastern UP suffer from under-penetration of exterior wall putty and paints across villages and cities alike. In a cyclical upswing, paints will be one of the biggest gainers in discretionary categories in UP.
It is time for the sales force to pull up its socks
An inflationary cycle with sharp product-price hikes helps catapult the revenues of FMCG majors with even a mediocre effort. Last few years saw FMCG companies’ revenues and market capitalisation growing, largely helped by price hikes. Now, with price growth under pressure and volume growth struggling, FMCG companies will need to up the ante and get growth back on track. The general opinion among the distributor community is that the last five years of high growth has made sales officers complacent and apathetic to distributor RoI and working-capital needs. This was because the price rise automatically led to improved profits and healthy returns on investment.
Distribution infrastructure took a back seat – distribution channel growth (at any cost) became the focus. Now, with prices growing at a far slower pace than distributor’s costs, distributor profitability will be a concern – in this scenario distributors with quality infrastructure tend to suffer more than ones with poor infrastructure, because of the formers’ higher costs. Many distributors across the country were of the opinion that there needs to be lot more visits by top management to understand and safeguard distributor interests for sustainable growth. The focus is shifting back to infrastructure and a period of channel consolidation will ensue.
GV’S Uttarakhand tour map

97GROUND VIEW GROUND VIEW Annual Edition 2016 Annual Edition 201696
A me-too product of Oreo biscuits in Rajkot available at half the price
Saga noodles in Uttarakhand: Trying to replicate Maggi’s success while avoiding its troubles!
Pingo cheese balls in rural UP at Rs 1 per packet competes with Lays and Kurkure which sell at 5x its price (the authors found the product quite tasty!)
Baba Ramdev’s Patanjali range of products led by professional packaging, good quality, and attractive pricing have disrupted the markets
However, the sales force will have to double its efforts in maintaining sales growth in times of sluggish price growth and a consolidating channel environment.
Me-too products to gate crash the party
Like every disinflationary cycle, this one is also seeing a rise of me-too products (available at a fraction of the original’s price) in various categories, thereby preying on the incumbent’s market shares.

97GROUND VIEW GROUND VIEW Annual Edition 2016 Annual Edition 201696
Key company observations from GVs road trip
Colgate: Because of its strong brand equity and
dominant market share, it can take meaningful price
hikes and continue to grow at a healthy pace in most
major markets.
Emami: Continues to grow stronger in key markets.
Channel checks indicate that Kesh King inventory ly-
ing with old distributors was exhausted in October
and Kesh King sales should be back on track from
November. Checks also indicated that supply issues
for HUL winter products in many north Indian markets
would benefit Emami.
Britannia: Continues to show strong growth on pen-
etration and premiumisation across different regions.
Bajaj Corp: With strong distribution reach and strong
inventory levels (even in rural areas) in target markets,
it will be a big beneficiary of the expected unbrand-
ed-to-branded and heavy hair oil-to-light hair oil shift.
Dabur: Continues to show strong growth in oral care,
health supplements, OTC, and ethicals. It needs to
address mediocre growth in hair oil and skin-care cat-
egories quickly for it to outperform the sector. Real
fruit juices supply suffered because of the Nepal
blockade and Dabur will start losing market share to
Pepsi’s Tropicana and ITC’s B-Natural in the event of
an extended Nepal crisis.
Marico: Continues to show strong growth in val-
ue-added hair oil portfolio across regions. However,
absence of price growth in the Parachute coconut-oil
portfolio and huge premium in pricing of Parachute
vis-a-vis competitors is a cause for concern – it could
impact Marico’s short- to medium-term growth.
HUL: Continues to struggle in most markets due to
sluggishness in the dominant soaps and detergents
portfolio. Channel checks suggest that winter-care
portfolio will be impacted by some supply issues in
north India. HUL failed to capitalise on the Maggi con-
troversy and lost out to Yippee noodles with respect
to product availability and shelf-space occupancy.
Naveen Kulkarni ([email protected])
Jubil Jain ([email protected])Hoardings of luxury brands like Calvin Klein on streets used by bicycles dot the Varanasi landscapeW
A shop stocking mostly branded products near village Jayapur in rural UP

99GROUND VIEW GROUND VIEW Annual Edition 2016 Annual Edition 201698
BY MANOJ BEHERAE C O M M E R C E
The dawn of financial disciplinein a sunrise sector
India seems to be the new breeding ground for unicorns – a venture-capital industry terminology for start-up companies whose valuations have exceeded US$ 1bn
India’s ecommerce story is still going strong
One area in India’s economy that appears to
be safe from the stress of the indeterminate
policy environment is ecommerce. The coun-
try’s broader indices continue to fall, as the
economy sputters and reforms stumble along.
However, one would not know that the broad-
er environment is grim going by the gold-rush
mentality prevalent in Indian ecommerce. India
is now home to eight unicorn companies out of
the total 145 in the world. According to various
media sources, capital inflows in Indian com-
panies accelerated in 2015, with over US$ 7bn
coming in the first nine months vs. US$ 6bn in
all of 2014. Global hedge funds and private-eq-
uity firms have been making a beeline to invest
in the Indian internet start-up revolution. Could
India’s virtual economy maintain such a rally?
Valuations of ecommerce companies sky-
rocketing
Huge-fund inflow over the last 18 months has
resulted in valuation of various ecommerce
companies skyrocketing. Flipkart’s valuation
has gone up 7x over the last 18 months. Simi-
larly, Olacabs’ has risen to US$ 5bn in Septem-
ber 2015 from US$ 650mn in October 2014.
Thanks to such high valuations, India is now
home to eight unicorns out of 145 global uni-
corns. With its huge potential, India is the most
obvious destination for this fund inflow – these
funds do not mind paying a premium to partic-
ipate in the fabulous growth story (after all, it
took 15 years for Softbank to monetise its in-
vestment in Alibaba).
While India’s ecommerce story is still going strong and is full of unicorns and pixie dust and hopes of happily ever afters, there seems to be a definite shift in strategy towards pursuing ‘profitable growth’ rather than just rapid growth – especially by some of the larger well-established players. This was eventually inevitable – however, the fact that its seems to be happening sooner than expected is a big positive, as some of the fears of ecommerce becoming just another huge bubble (like the dotcom one) will now somewhat subside. In the next few quarters, the e-tailers dash towards profitability is likely to create more buzz than their GMV growth. Read on to find out more…

99GROUND VIEW GROUND VIEW Annual Edition 2016 Annual Edition 201698
Name of the firm Last Valuation(in $ bn) Industry Select Investors
Flipkart 15 e-commerce Accel Partners, Digital Sky Technologies, Iconiq Capital
Olacabs 5 On-Demand Accel Partners, Matrix Partners, Sequoia Capital
Snapdeal 4.8 e-commerce Alibaba, Softbank, Foxconn
PayTM 4 Fintech Intel Capital, Sapphire Ventures, Alibaba Group
Inmobi 2.5 Adtech Softbank, Sherpalo Ventures
Mu Sigma 1.5 Big Data Sequoia Capital, General Atlantic
Quikr 1.5 Marketplace Tiger Global Management, Norwest Venture Partners
Zomato 1 Social Sequoia Capital, VY Capital, Info Edge
List of Indian unicorns
Flipkart: Funding and implied valuation
Snapdeal: Funding and implied valuation
Sour
ce: P
hilli
pCap
ital I
ndia
Res
earc
hSo
urce
: Phi
llipC
apita
l Ind
ia R
esea
rch
Growing fast, but trouble in paradise?
Many mid-management employees told
the GV team that Indian ecommerce firms
are deviating from the usual core business
strategy of start-ups, which is to ask whether
the product is ‘elegantly solving a genuine
problem’ before scaling up the operations.
Some ecommerce companies started prema-
ture scaling, before testing the product for
market fit and chalking out a proper market
strategy, which resulted in aggressive hiring
and them rushing into new verticals without
adequate preparation. These factors, along
with wrong incentives given to their sales ex-
ecutives is resulting in duplicate listings or
bogus billing, which is causing huge financial
losses to these companies.
Record number of deal and huge fund inflows : Apart from usual participants like SAIF, Sequoia, Accel, and Tiger Global, other new participants such as Falcon Edge Capital of New York, Maverick Capital from Dallas, and Steadview Capital Management from Hong Kong have pumped US$ 3.8bn into 26 Indian technology and ecommerce start-ups since 2014 (source: Tracxn)

101GROUND VIEW GROUND VIEW Annual Edition 2016 Annual Edition 2016100
All is not so hunky-dory
Companies that are in the early phase of their product cycle and revenue models are not so well established; yet, their valuations have reached stratospheric levels. According to a mid-manage-ment employee in a large online housing portal, “Premature scaling across various verticals without a tested product was primarily driven by aggres-sion of the VCs to fetch higher valuation in the next round of funding”. Companies are raising money with near-term sales objectives; therefore, even for employees, the strategy revolves around achieving short-term sales targets that in turn drive higher promotional activities and aggressive discounting. “Long-term vision is lacking – since they don’t want to devise a long-term strategy, they end up burn-ing huge amounts of cash in a short while. Right now, it’s about achieving sales to prop-up valua-tions in the next round of funding,” revealed one employee who works with one of the largest fash-ion e-tailers.
As a result of pursuing this aggressive formula, cracks have started to appear in the functioning of several start-ups – restaurant look-out website Zomato, food-delivery app TinyOwl, and property portal Housing.com are all issuing pink slips. Mar-ket specialists say that this reminds them of the dot-com boom that crashed spectacularly in 2000. There may be a bubble in the sense that operation-al discipline has been lost in the early stages, be-cause companies are finding it easy to raise capital.
Financial discipline is now a focus of larger ecommerce companies
Indian ecommerce companies have an unsustaina-ble cash-burn rate of 133% of GMV because of dis-counts, marketing, free shipping, and cash incen-tives to attract consumers. Various industry sources indicate that e-tailers need a funding of US$ 4.2bn in FY15 alone to sustain the business.
Not surprisingly, huge financial losses are having a bearing on the strategy of at least some of the larger ecommerce players (who might find it in-creasingly difficult to keep raising money). They are focusing on profitable revenue growth, not just revenue growth. According to a mid-management employee with one of the largest e-tailers in India, “Financial discipline was a key focus area for the entire financial year FY15. We want to cut down on the variable cost as much as possible”. Since the larger players now have a well-established revenue
Losses (in Rs bn) of some Indian e-commerce companies in FY14 and FY15
*- EBITDA numbers for CY14/CY15
#-EBITDA loss for FY14/FY15
Sour
ce: P
hilli
pCap
ital I
ndia
Res
earc
h
• India has ~350mn active mobile-internet users, which is likely to see a CAGR of 35-40% over the next five years
• 2/3rd of India’s population is under 35, hence technology adoption would be faster
• Spread of cheap internet-enabled smartphones • Deployment of robust mobile-broadband in-
frastructure by various TSPs would help bypass the need for an extensive broadband network
• India’s per capita income is US$ 1,800 (vs. China’s US$ 6,807 and US’ US$ 53,000), which has a huge potential to grow in the next decade
• Onset of the digital payment revolution, driven by increased penetration of recently launched payment banks
• Increased penetration of credit cards, which currently stands at only 2%
The sector is expected to cross the US$ 100bn-mark within the next five years, contributing to over 4% of India’s GDP – India is at an inflection point of consumption moving online at a rapid pace, as digital transformation commences
FACTORS THAT WILL DRIVE
THE ECOMMERCE STORY

101GROUND VIEW GROUND VIEW Annual Edition 2016 Annual Edition 2016100
Rise of new unicorns? CY16 will see the emergence of at least three unicorns in India. Companies such as Grofers (a quick-delivery service for groceries and electronics), Big Basket (online grocer), and Shopclues (ecommerce) have already raised US$ 100mn+ in the latest round of funding at valuations north of US$ 400mn. Various media sources indicate that Oyo Rooms (an online hotel aggregator) is looking at raising US$ 400mn at a valuation of US$ 1.2-1.3bn and could be the next unicorn in the making
model that is scaled up across various geographies and product verticals, fi-nancial discipline would be the key met-ric in the near future.
“Cost rationalisation would be driven by cutting down variable costs through better supply-chain management and lower discounts and promotional activi-ties. We would continue to hire premium talent from top B-schools,” confirmed an HR manager of a large ecommerce player – this indicates that involuntary attrition from larger firms is unlikely to happen.
According to a zonal head of a leading
car aggregator, “Incentives are now be-
ing rationalised based on the city of op-
eration.” Earlier, this company used to
dole out fixed incentives on a per-ride
basis, which is now structured based on
distance travelled, rides fulfilled, and
hours of operation. This clearly indicates
that the era of cost rationalisation and
financial discipline has finally dawned
on this sunrise sector. Therefore, when
a new unicorn attains a particular scale
with a sustainable revenue model, it is
imperative that it undergoes a direc-
tional shift in strategy, which ensures
the long-term viability of this business’
operation.
Opportunity and business potential
are huge, but the purse is finite
Several unicorns and contenders have
already demonstrated their ability to
generate a sustainable revenue stream.
Hence, for the larger players, the next
round of funding will come through vis-
ible improvement in profitability. In the
next few quarters, their dash towards
profitability is likely to create more buzz
than GMV growth. For the smaller play-
ers, funding would still be determined
by viability and scalability of the busi-
ness model, which would enable them
to have more room for aggressive tar-
gets.
Periodic funding is the steroid, until industry achieves self-sustainability
E-tailers are burning cash at the rate of 133% of GMV (gross merchandise val-ue). This is likely to continue, as they battle it out to garner market share and reach a steady state (which could take as long as 2020-21). Various industry par-ticipants believe that the existing cash-burn rate will moderate by 7-10% every year, as players become more financially disciplined. Accordingly, e-tailers would need US$ 17bn over the next five years.
India’s most prolific start-up-backer
Tiger Global is changing tactics
Tiger Global Management, the most
prolific backer of start-ups in India, has
decided to tone down its current ag-
gressive style. Tiger Global invested
around US$ 2bn (Rs 130bn) in over 35
Indian companies. This year, it has been
even more active than in the past, but
that has changed along with the onset
of a more cautious mood about throw-
ing large sums of money at consumer
internet ventures. In a renewed strategy,
Tiger Global informed the laggard port-
folio companies to get external investor
validation for new rounds with positive
operating margins.
It is undeniable that the future of Indian
e-commerce is bright and superlative
growth seen in the past few years is like-
ly to continue over the next five as well.
However, firms have to realise that the
discounting game is a race to bottom
and the return of business fundamentals
is bound to happen sooner rather than
later. Hence, players with maximum
financial discipline will emerge clear
long-term winners in this race and will
enjoy maximum benefits.
Manoj Behera ([email protected])
Funding requirements of e-tailers up to FY20
Sour
ce: P
hilli
pCap
ital I
ndia
Res
earc
h

103GROUND VIEW GROUND VIEW Annual Edition 2016 Annual Edition 2016102
JULY
Slovakia's turn to hold EU presidency
Republican convention in Cleveland to determine the Republican nomination for US presidency
Democrats assemble a week later in Philadelphia
NASA's spacecraft Juno destined to reach Jupiter
AUGUST
Aug 5 - 21: Rio Olympics
Aug 15 - India celebrates its 69th Independence day
SEPTEMBER
Russia votes in parliamentary elections
PhillipCapital Kaizen Investor Conference
OCTOBER
World Bank and IMF hold their annual meetings
1st Friday of October is World Smile Day invented by Harvey Ball, inventor of Smiley Face
NOVEMBER
US elects its 45th President
So does Democratic Republic of Congo
China hosts G20 summit
DECEMBER
Troop withdrawal from Afghanistan by US, UK & Aus
Sunset date for Phase -IV digitization
JANUARYNetherlands takes over EU presidency for 6 months.
Davos World Economic Forum Summit
4G launch by Reliance Jio
Non-core mines auction to start
FEBRUARYLowa caucuses sets forth the race for US Presidential nominations
Economic Survey, Full-year GDP estimates, Budget FY17
Chinese new Year - Year of the Monkey
MARCHIndia hosts ICC T-20 World Cup
March 8th PhillipCapital Regional Investor Conference in Singapore
Possibility of Telecom Spectrum Auction for 2100 Mhz
APRILGermany celebrates 500 years of breweing beer - thanks to the Bavarian Reinheitsgebot
100 years of publication of Einstein’s article “The Foundations of Theory of Relativity”
Assembly Elections for Assam
MAYGeneral Elections in Scotland and Phillipines
UEFA Champions League Final in San Siro
G7 summit in Japan
Assembly elections for West bengal, Tamil Nadu & Kerala
JUNEEuro 2016 in France
International Yoga Day
PhillipCapital Ground View Conference
First round of launching of 4G operations by major opera-tors to get completed
EV
EN
TS 2016

103GROUND VIEW GROUND VIEW Annual Edition 2016 Annual Edition 2016102
BY VIBHOR SINGHALI N F R A S T R U C T U R E
Booming Infrastructurein the state of UPUttar Pradesh seems to be poised for mammoth infrastructure spending over the next two years. With the next state assembly elections (March 2017) in UP, the state government (headed by Chief Minister Akhilesh Yadav of the Samajwadi Party) has expedited is efforts in showcasing its ‘development’ efforts. Having said that, a lot of activity is already happening on the ground.
LUCKNOW is the core of infra-
structure activity in UP. While
many roads have been upgrad-
ed, it was still a shock to see
an extensive network of cycling lanes
across the city. Some of the key pro-
jects currently being executed in the
city are:
Lucknow Metro
The development plan of Lucknow
metro consists of two phases:
Work on Phase 1-A is already in full
swing and is expected to be complete
before December 2016 (well in time
for the state assembly elections). Ten-
ders for Phase 1-B are expected to be
awarded by March 2016 and execution
is scheduled to start by June 2016.

105GROUND VIEW GROUND VIEW Annual Edition 2016 Annual Edition 2016104
Lucknow Metro order awards
Phase EPC Transmission Rakes & Signalling
Phase IA L&T L&T Alstom India
Phase IB TBA L&T Alstom India
Phase II TBA TBA TBA
The funding for Phase-1 (A & B) has all been
tied up – 52% has been arranged from Euro
Bank, and the remaining as equity from the
Government of India and the Government of
Uttar Pradesh. The state government expects
healthy passenger traffic from the beginning
and significant decongestion in road traffic
after metro is commissioned.
Gomti River Waterfront
The Lucknow Development Authority (LDA)
is developing a 12km riverfront on the
river Gomti. The Rs 30bn project, for which
Gammon India has secured the civil contract,
is in full swing. The riverbed is being cleansed
and construction activity is ongoing on the
banks on either side. The project is expected
to be complete by March 2017.
State highways / Expressways in UP
The UP State Highway Authority (UPSHA)
and UP Expressway Industrial Development
Authority (UPEIDA) are implementing multiple
projects to build greenfield expressways and
upgrade the existing state highways. Key
projects under execution / to be awarded are:
1) Agra-Lucknow expressway: The 302km
long expressway, to be built at a cost of ~Rs
105bn, was awarded to five EPC players (PNC
Infratech, AFCONS Infra - two packages,
NCC and L&T) last year. While 70% of the
earthing work on the project is already
done, execution is expected to be over by
December 2016. The expressway will reduce
the travel time from Agra to Lucknow to
3.5 hours from current +6 hours. It will also
provide seamless travel between Lucknow
and NCR via the already functional Delhi-
Agra-Yamuna Expressway.
2) Lucknow-Balia Expressway: UPEIDA is
in late stages of calling bids for the 350km
Lucknow-Balia Expressway. Balia is very close
to the Bihar border (200km from Patna). Once
complete, this will provide a contiguous
expressway from Delhi to the Bihar border,
right across the entire state of UP.
Lucknow Metro Funding plan
Source Rs mn
GoI Equity 10,030
Gol Subordinate Debt 2,970
Gol Total 13,000
GoUP Equity 10,030
GoUP Subordinate Debt 4,490
Grant from Local Bodies 2,450
GoUP Total 16,970
Bilateral/Multilateral Loan 35,020
Total 64,990
GoUP Sub Debt for land 3,810
Additional PTA for IDC 480
Grand Total 69,280
Phase Length Stations Route Cost (Rs mn)
Target COD
Phase IA 8 8 Transport Nagar - Charbagh 68,800 Dec-16
Phase IB 15 13 Charbagh - Munshipuia
Phase II 12 12 Charbagh - Vasant Kunj 48,900
Lucknow Metro plan
Gomti River Waterfront

105GROUND VIEW GROUND VIEW Annual Edition 2016 Annual Edition 2016104
Bareilly-Almora-Bageshwar (SH-37) 54 3,550
Delhi-Saharanpur-Yamunotri (SH-57) 217 17,350
Varanasi-Shaktinagar (SH -5A) 115 12,120
Muzaffer Nagar-Saharanpur (SH-59) 53 7,529
Package Stretch - City (District) Length (km)
Pckg 1 Bakkas (Lucknow) to Sarai Chaubey (Baabanki) 43.1
Pckg 2 Sarai Chaubey (Baabanki) to Baradand (Amethi) 42.9
Pckg 3 Baradand (Amethi) to Gaura (Sultanpur) 44.0
Pckg 4 Gaura (Sultanpur) to Ratanpur (Sultanpur) 43.5
Pckg 5 Ratanpur (Sultanpur) to Ohani (Azamgarh) 44.4
Pckg 6 Ohani (Azamgarh) to Basti (Mau) 43.5
Pckg 7 Basti (Mau) to Parsupur (Ghazipur) 43.1
Pckg 8 Parsupur (Ghazipur) to Bharauli (Ballia) 43.6
Total Lucknow to Ballia expressway 348.1
Stretch Length (km) Project Cost (Rs mn)
Pukhraya -Ghatampur- Bindki (SH-46) 84 12,930
Garh-Meerut (SH-14) 37 3,700
Meerut-Bagpat (SH-14) 164 10,218
Chandausi-Badun (SH-43) 39 2,650
Total 323 29,498
Stretch Length (km)
Agra-Vah-Kachauraghat (SH-62) 68.2
Aligarh-Tappal (SH-22A) 65.2
Mawana-Kithoure-Hapur (MDR-102W) 48.4
Mathura-Sadabad (MDR-102W) 40.3
Bani-Mohanlalganj-Gosaiganj (MDR-89C) 33.5
Lucknow-Kursi-Mahmodabad (MDR-77C) 54.1
Sisaiya-Dhrahra-Pooranpur (SH-101) 119.0
Fatehpur-Baderu-Kartal (SH-0071) 116.6
Banda-Baberu-Rajapur (SH-92) 88.8
Jaloun-Bhind (SH-70) 30.7
Mahmodabad-Madhubhan-Belthara (SH-84E) 57.8
Babatpur-Chaubeypur-Jamalpur (SH-98) 40.0
Chandauli-Sakildiha-Saidqur (SH-69) 31.0
Total 793.6
Projects Under Construction StageLucknow to Ballia expressway
Project Under RFQ/RFP Stage
Projects Under Feasibility Stage
3) Seven more expressway projects:
UPEIDA is planning to develop seven more
expressways, to decongest the traffic on
state and national highways in the state, and
provide for faster movement of goods. The
authority estimates an expenditure of ~Rs
500bn, on these projects spread over the
next 4-5 years.
4) Upgradation of state highways: UPSHA
is planning to award upgradation contracts
for 15 state highways across the state over
the next 8-12 months. Expenditure on these
projects is expected to total ~Rs 500bn.
Metro projects in other cities in UP
Apart from Lucknow, plans are being drawn
to bring the metro network to four more
cities in UP – Kanpur, Varanasi, Agra, and
Merut.
As per the funding sources for these
infrastructure projects, the two government
bodies (UPSHA and LMRC) appear to have
taken different approaches. LMRC has
availed funding for Lucknow Metro (52%
of project cost) from European Investment
Bank. On the other hand, UPSHA intends
to fund the entire construction of highways/
expressway through internal sources.

107GROUND VIEW GROUND VIEW Annual Edition 2016 Annual Edition 2016106
Agra: Phase-1 is being planned to be 16km – from Cantt Railways Station to TYC-Phase-2. Currently, DPR is being prepared.
Kanpur: Phase-1 of the metro is being planned to be 26km – from IIT Kanpur to Naubas-ta (via railway station). The DPR has already been prepared, and EPC bids for the project are expected to be called in mid-2016.
Merrut: Phase-1 is being planned to be 13.5km – from Partapur to Merrut Cantt (via railways station road). Currently, DPR is being prepared.
City Area Population Phases Length Stations UG/EV Cost Expected PHPDT
sq km Lac (2011) Rs mn 2021 2031
Kanpur 1,041 34.8 IIT Kanpur - Naubasta 26.0 21 Mix 1,05,000 15,000 24,000
Rawatpur - Jarauli 10.0 8 Mix
Varanasi 260 15.4 Sarnath - BHU 12.5 11 Mix 75,000 10,000 14,000
BHEL - Godowlia 13.5 11 Mix
Agra 520 21.0 Agra Cantt - TYC Ph-II 16.0 12 Elevated 65,000 10,000 15,000
Sikandra - Hotel Trident 14.0 10 Mix
Meerut 565 18.4 Paratpur - Meerut Cantt 13.5 12 Mix 65,000 10,000 14,000
Rajban Bazar - Gokalpur 11.5 11 Elevated
Cities, Metros, Phases, length, stations, underground/overhead, cost

107GROUND VIEW GROUND VIEW Annual Edition 2016 Annual Edition 2016106
Varanasi: Phase 1 is being planned to be 12.5km – from Sarnath to BHU (via Kotwali). Currently, DPR is in late stages of completion. Work on the project has been expedited on request from the PMO (Varanasi being PM’s constituency). Ordering is expected to begin towards 2016 end.
Mammoth opportunity from NHAI in UP
Over the last five years, most of the projects awarded
by NHAI have been in the western belt of Rajasthan,
Gujarat, Maharashtra, and Karnataka. Accordingly,
the current bidding pipeline for NHAI (to be awarded
over next six months) is mainly concentrated in UP,
Bihar, Orissa, Jharkhand and Chhattisgarh.
State No of Projects
Length (km)
Cost (Rs bn)
% of length
% of cost
UP 8 476 81,080 25% 29%
Bihar 4 183 34,199 10% 12%
HP 2 60 7,406 3% 3%
Delhi 1 9 6,636 0% 2%
Odisha 6 500 54,381 27% 20%
Jharkhand 3 265 39,864 14% 14%
Chhattisgarh 3 126 13,700 7% 5%
West Bengal 3 128 19,280 7% 7%
Maharashtra 1 2 1,651 0% 1%
Karnataka 2 108 15,714 6% 6%
Gujarat 1 16 2,994 1% 1%
Total 34 1,874 2,76,906
Large part of NHAI’s order pipeline is from the Northern and Eastern states
“Funding from Europe/Japan is too time consuming. The proposals have to travel to those countries, and too much time is wasted in the back and forth. We intend to fund these projects through domestic sources only – if required, we might award some projects on PPP basis too,” - says Dr Navneet Kumar Sahgal, CEO, UPSHA and UPEIDA.

109GROUND VIEW GROUND VIEW Annual Edition 2016 Annual Edition 2016108
Road Sector – a lot moving on the ground
As expected, roads is the sector with maximum
traction within the infrastructure space. Not only
has NHAI awarding kept up its pace, it has cleared
many bottleneck to revive stuck projects. In many
cases, it has gone to the extent of altering the con-
cession agreement – an unprecedented move in
the sector.
YTD, NHAI has awarded 3,000km of projects – mov-
ing steadily towards its target of 5,100km for FY16.
Similarly, MoRTH has awarded ~1,000km of pro-
jects (its target is 2,500km for FY16). All in all, the
road sector seems to be progressing well towards
its total target of 7,500km of awards (4,000km
awarded already).
A key feature of the order awards this year has been
NHAI’s success in awarding some of its long-pend-
ing projects. For example, NHAI awarded the East-
ern Peripheral Expressway – a project envisaged
to decongest the national capital and provide a
ringroad structure for heavy vehicles –albeit four
years after it was first put up for bidding. NHAI has
divided this project into six packages – Sadbhav
Engg grabbed two packages and Ashoka Budlcon,
Oriental Structure, Gayatri Projects and JP Associ-
ates recieved one each. Similarly, it awarded the
Agra-Etawah project (which was terminated) to IRB
Infra on a BOT basis.
New pipeline ready to be rolled out
Beyond the 14,000km of projects to be awarded
under the current NHDP (which would be exhaust-
ed in next two years), MoRTH has already planned
the next phase, which will be awarded starting
FY18. Key projects to be awarded are:
1) Sagarmala: Projects connecting major ports to
the national highways. While part of these projects
have already been awarded, Sagarmala phase will
address the cargo evacuation problem at major
ports, by upgrading existing road network to 6/8
lanes.
2) Bharatmala: Projects improving connectivity in
border areas and coastal boundary for the Indian
peninsula.
Length: 6000km. Capex - Rs 700bn
3) CharDham Project: This phase, in its first part
would connect the four religious places of Kedar-
nath, Badrinath, Gangotri, and Yamunotri in Uttara-
khand with ‘disaster-proof’ two-lane roads. In its
second part, the project would encompass enhanc-
ing connectivity to other religious places.
Length: 2500km. Capex - Rs 500bn
Phase Description Total length Already 4-laned Under Implementation To be awarded
Phase I Golden Quadrilateral 5,846 5,846 - -
Phase II NS – EW 7,142 6,414 461 267
Phase III 4-laning of intercity connections 12,109 6,634 3,308 2,167
Phase IV 2-laning of arterial road 13,203 1,585 4,668 6,950
Phase V 6-laning of various highways 6,500 2,264 1,401 2,835
Phase VI Expressways 1,000 - 135 865
Phase VII Ringroads, flyovers etc 700 22 19 659
Total 46,500 22,765 9,992 13,743
Others Port Connectivity 402 379 23 -
Others Others 2,195 1,623 646 278
NHAI 49,097 24,767 10,661 14,021
NHDP status — September 2015 (length in km)
Roads – awards and reforms all along

109GROUND VIEW GROUND VIEW Annual Edition 2016 Annual Edition 2016108
Step Description Provided respite to Proposal extended to
Easier environmental clearance norms
Delinking FC and EC, EC not required for linear brownfield stretches
All projects that were stuck due to clearances
All projects - 24 stuck projects cleared due to this
Premium rescheduling
Back-ending premium payments to align with the cashflows
Developers facing low traffic on operational projects
Extended to 20 projects; 12 more projects eligible
Relaxation of exit clause
100% exit allowed for pre-2009 projects also (earlier only 76% was allowed)
Helps developers to rotate capital All projects awarded pre 2009
One-time fund infusion
One-time fund infusion by NHAI, to complete the project - NHAI would then recover its investment through first right on toll collections
Projects facing significant cost overruns
Extended to 16 projects - negative response from banks
Extension of conces-sion period
Concession period to be extended for project that faced delays due to no fault of developers
Projects facing significant time overruns
34 projects with more than 18 month delay have been identified
Hybrid annuity projects
New projects - mix of annuity and toll - 40% project cost to be funded by NHAI
Projects that were not feasible due to low traffic
8 hybrid annuity projects have been identified - muted response till date
Investment Trust Trusts with a portfolio of operational BOT projects to float a separately listed entity
Developers stuck with large BOT portfolios - helps them rotate capital
IRB Infrastructure has been ‘allowed’ to float the first InvIT
To address these concerns, NHAI has laid out some critical reforms in the last 12 months:
The DPRs for these phases are being finalised
and should be submitted to the Ministry of
Transport early 2016. The projects from these
phases are expected to be included in the
NHDP from FY18.
Kick-starting the reform process
Over the last twelve months, NHAI has un-
veiled a series of reforms, which have signifi-
cantly resolved the logjam in various projects.
Many projects awarded in FY11-14 were stuck
or were facing overruns, due to various prob-
lems such as land acquisition, environmental
clearance, right of way, and the financial state
of developers. Some projects, which were op-
erational, were reporting significantly lower
traffic than estimated – leading to inability of
these projects to service their debt obligations.
All these projects were threatening to derail the
award process in the road segment because:
1) Many were unable to service their debt ob-
ligations – the loans to these projects were on
the verge of becoming NPAs. This would have
significantly reduced banks’ ability to lend to
new projects.
2) With delays/lower traffic, the financial state
of developers was also deteriorating – raising
concerns over whether there would be enough
solvent developers to build new roads.
With a series of reforms unveiled over the last
twelve months, and a bursting-at-the-seam pipe-
line of orders over the next two years, the road
sector indeed appears to be on a good path.
Vibhor Singhal ([email protected])
“With this last proposal to extend the concession period for delayed projects, we have addressed all concerns that NHBF (National Highway Builders Federation) had raised. Now they should not have any complaints”.- Mr Satish Chandra, Member Finance, NHAI

111GROUND VIEW GROUND VIEW Annual Edition 2016 Annual Edition 2016110
BY JONAS BHUTTA & HRISHIKESH BHAGATP O W E R
UDAY
Ground View visited Rajasthan and Uttar Pradesh to assess if these states’ governments and discoms are prepared to participate in the UDAY (Ujwal Discom Assuarance Yojna) scheme. This scheme involves the transfer of discom debt to states and will make states accountable for discom losses. UP and Rajasthan discoms account for 50% of total (all-India) discom losses in FY14 and 23% of discom loans. Thus, these states are crucial for UDAY to succeed.
The momentum and awareness with which both discoms are working towards achieving timelines is surprising. However, there are still a few hurdles before UDAY achieves results. Investor appetite for bonds issued by the states in lieu of the debt taken over from discoms remains is a key challenge, as at its core, UDAY is a financial-engineering exercise – there is no new capital infusion. By making states accountable for future losses, UDAY attempts to address issues of discom losses on a sustainable basis. However, it does not address the key issue of bifurcating politics from regulation – the main reason that the previous two schemes that attempted to resolve this issue failed. The urgency shown by non-BJP states such as UP in adopting UDAY was surprising. Since state governments own discoms, the reduction in interest costs due to the scheme is a key selling point – this is perhaps why the scheme seems to have transcended political affiliations and gained acceptance.
Why UDAY? – mainly to avoid a contagion
In order to revive investment in power, the NDA
government has proposed various measures to
resolve fuel and transmission issues in the pow-
er-sector value chain. However, addressing these
constraints will not revive demand unless the is-
sues of the weakest link – discoms – are sorted
out.
Due to their weak financial health, discoms, with
accumulated losses of Rs 3.5tn, honoured only a
few of their power-purchase agreements. This im-
pacted PLFs of generation companies resulting in
lower discom capex, which exacerbated T&D loss-
es. Discom operations have also been vulnerable
to political intervention, leading to irregular pow-
er-tariff hikes that ultimately led to losses. Since
banks funded these losses, discoms’ bank borrow-
ings have now risen to a very high Rs 5.4tn (8%
of banking-system loans). These losses (includ-
ing subsidy) have ballooned 1.5x over FY10-15.
Intervention through UDAY is essential to avoid
spreading this contagion to the banking sector.
On an average, discoms have taken 8-16% tariff
hikes in FY11-16, but these hikes have been in-
adequate in curbing burgeoning losses. While
they helped stem incremental losses, unless these
hikes are accompanied by operational improve-
ment, losses will continue to widen. The gap be-
tween average cost of supply (ACS) and average
revenue realised (ARR) has increased by 67% to Rs
1.15/kwh in 2014 from Rs 0.68/kwh in 2011.
– a new dawn for discoms?

111GROUND VIEW GROUND VIEW Annual Edition 2016 Annual Edition 2016110
n Reduction in their interest costs, mainly through a phased takeover of discom debt by state governments
n Improving their operational efficiencies
n Reducing cost of power purchase
n Enforcing financial discipline on discoms through an alignment with state finances.
Sour
ce: P
FC
Inadequate power-tariff hikes have widened gap between ACS and ARR…
As a result, discoms’ losses remain high…
… while AT&C losses are still at elevated levels
…leading to higher borrowings
UDAY’S MANDATE: BRING ABOUT SUSTAINABLE IMPROVEMENT IN DISCOMS’ HEALTH THROUGH:

113GROUND VIEW GROUND VIEW Annual Edition 2016 Annual Edition 2016112
UDAY
FISCAL MEASURESFISCAL MEASURES
• Transfer of 75%
debt to states (50%
2016,25% 2017)
• Discoms to accrue
benefit of lower
interest cost as
interest on bond
lower than debt
• Balance 25%
converted to offered
to market as bond
or banks can lend to
discoms at lower rate.
• Demand side energy
savings through
equipment
• Linkage rationalisation
• Coal swapping
• Additional funding
through IPDS and
DDUGJY
• Higher allocation
of coal at notified
price and low cost
power from NTPC.
UDAY entails fiscal and non-fiscal
measures to address discom losses.
The scheme is optional for states, but
with government/RBI restricting banks
from funding incremental operational
losses of discoms, it is likely that
stressed states will have no option
but to opt for UDAY. By making states
accountable for future losses, UDAY
attempts to address issues of discom
losses on a sustainable basis.
From the policy standpoint, UDAY
is a welcome change as it makes
state governments accountable for
the performance of discoms. Also
unlike previous schemes, UDAY
does not involve cash infusion from
central governments and puts the
onus of performance solely on state
governments.
All about
UDAY - The scheme’s mechanism
Clear identification of responsi-bilities of each of the three parties
Details of specific operational activ-ities to be undertaken in the state
Circle-level targets for loss reduction with responsibilities,
resources, and timelines
MoU targets will be reviewed on a monthly basis by the MoP. States opting for UDAY will have to undertake time-bound meas-ures to bring about a turnaround
in the discoms’ fortunes
STATE GOVERNMENT
DISCOMS MINISTRY OF POWER
• Takeover debt of discom
• Measures to improve efficiency of state discoms
• Ensure discom follows accepted milestones
• Reduce AT&C loss to 15%
• Reduce gap between ACOS and ARR to zero through quarterly tariff hike.\
• Reduce power purchase cost
• Compulsory feeder and Distribution Transformer (DT) metering
• Consumer Indexing & GIS Mapping of losses
• Linkage rationalization
• Coal price rationalisation based on GCV
• Transmission line augmentation
• Review MoU targets on monthly basis
MOU
STATES OPTING FOR UDAY WILL BE BOUND BY A TRIPARTITE MOU BETWEEN THE MINISTRY OF POWER, THE STATE GOVERN-MENT, AND THE CONCERNED DISCOM. THE MOU WILL DETAIL:

113GROUND VIEW GROUND VIEW Annual Edition 2016 Annual Edition 2016112
The financialprocess explained
n States will take over 75% of DISCOM
debt as on 30 September 2015 – of this,
50% by March 2016 and 25% by March
2017. States will issue non-SLR bonds
(SDL) with a maturity period of 10-15
years and moratorium on principal up to
five years against the bond.
n After this, states will transfer grants to the
discom with an option to spread the pay-
ment of these grants over three years and
in some cases over five years.
n Principal debt taken over will not be in-
cluded in the fiscal deficit of states. How-
ever, interest will have to be serviced
within FRBM limits. The objective is to
reduce interest cost of discoms that ac-
counts for 75% of discom losses.
n Through UDAY, discoms will benefit from
lower cost of debt, as bonds backed by
states will carry lower interest rates result-
ing in savings of 200bps.
WHILE INTEREST COST ACCOUNTS FOR JUST 9% OF DISCOMS’ OPERATING EXPENDITURE…
...IT ACCOUNTS FOR 74% OF THEIR ANNUAL LOSSES
Debt Interest cost
75% debt Gsec + 0.5% + 0.25% spread for non-SLR status
25% debt To be converted to bonds and offered to market at a likely rate of State Bond + 0.2%.
THIS WILL LEAD TO LOWER INTEREST COST FOR DISCOMS…
…AND INTEREST SAVING
OF 200BPS
________
DISCOMS
BALANCE
SHEET
________Debt transfer
________
STATES
BALANCE
SHEET
________
Sour
ce: P
FC
Sour
ce: P
FC
75%
UDAY ENTAILS TRANSFER OF DEBT TO STATE BALANCE SHEETS FROM DISCOMS

115GROUND VIEW GROUND VIEW Annual Edition 2016 Annual Edition 2016114
Activity Benefit
Compulsory feeder and distribution metering by states
Ability to track losses at the feeder and DT level for corrective action
Consumer Indexing & GIS Mapping of losses
Identification of loss making areas for corrective action
Upgrade or change transformers, meters.
Reduce technical losses and mini-mize outages
Smart metering of all consumers consuming above 200 units / month
Smart meters will be tamper proof and allow remote reading thus helping reduce theft
Awareness campaign against theft to ensure honest do not pay for dishonest
Enhance public participation to reduce power theft
Assure increased power supply in areas where the AT&C losses reduce
Encourage local participation to reduce losses
Activities to be undertaken by states to reduce AT&C losses
States opting for UDAY will also have to
undertake measures to improve opera-
tional efficiency including:
• Reducing AT&C losses to 15% in
2018-19 through distribution and
infra augmentation
• Reducing gap between ACS and
ARR to zero through quarterly tariff
increases and rationalisation of pow-
er-purchase costs
• Demand-side management by en-
couraging wider use of energy-effi-
cient equipment
States achieving milestones will be aid-
ed by central governments through
additional measures such as: (1) coal
swapping, (2) linkage rationalisation,
(3) additional funding under various
government plans such as Deendayal
Upadhyaya Gram Jyoti Yojana, Integrat-
ed Power Development Scheme, Power
Sector Development Fund, and (4) high-
er allocation of coal at notified prices
and low cost of power from NTPC.
UDAY’s non-fiscal measures
Source: Power Ministry
Area Detail Amount (Rs bn)
Interest rate reduction 3% on 25% DISCOM debt 170
4% on 75% DISCOM debt -
Debt takeover by state 8% on 75% DISCOM debt 270
AT&C loss reduction 22% to 15% 575
Supply of domestic coal and coal swapping
360
DSM LED, appliances etc. 585
PAT 76
Transmission losses 1% of Intra state 16
Total 2,052
Govt estimates savings of Rs2052bn if UDAY is adopted by all states
Sour
ce: P
ower
Min
istry
Feeders and distribution
metering
30th June 2016
Consumer awareness campaign
31st Dec 2016
Upgrade distribution transformers
31st Dec 2017
Smart metering
(consumption >500 units)
31st Dec 2017
Consumer Indexing & GIS
Mapping of losses
30th Sept 2018
31st Mar 2018
Increase in power supply
inline with AT&C losses reduction

115GROUND VIEW GROUND VIEW Annual Edition 2016 Annual Edition 2016114
UP Rajasthan
Interest savings 135 197
AT&C savings 99 60
Total savings 234 267
Interest and AT&C savings : Rajasthan and UP
Over a five-year period, Rajasthan and UP
will accrue savings of Rs234bn and Rs-
267bn respectively through AT&C reduc-
tion and debt takeover. This will (at least)
turn UP networth positive.
UDAY addresses the issue of future losses
Another important feature of UDAY is it tries
to address future losses of discoms by making
states accountable for these. The scheme sug-
gests gradual inclusion of discoms’ losses in
states finances, ensuring discipline from states
and that future losses should be financed only
through discom bonds backed by state govern-
ments. The scheme has restricted working-capi-
tal funding to 25% of discoms ARR.
Year Previous years’ DISCOM loss to be taken over by the state
2015-16 0% loss for 2014-15
2016-17 0% loss for 2015-16
2017-18 5% loss for 2016-17
2018-19 10% loss for 2017-18
2019-20 25% loss for 2018-19
2020-21 50% of previous year loss
Timeline for takeover of discom losses by states
Difference between UDAY and FRP
Both FRP and UDAY are similar – in both cases,
the state is expected to drive implementation.
However, UDAY is more comprehensive than FRP,
as it provides flexibility to bring about sustainable
turnaround and addresses the issue of future loss-
es. FRP had a one-size-fits-all approach whereas
UDAY has separate MoUs for each state. UDAY
ensures that the efforts of discoms are comple-
mented with central schemes (such as DDUGJY
and IPDS) and does not involve any fund infusion
from the centre.
Sour
ce: P
ower
Min
istry
Sour
ce: G
V es
timat
es
UDAY FRP
Transfer of liabilities
Involves transfer of 75% debt to state’s balance sheet
Involves transfer of short term liabilities to states
Financial Flexibility
Flexibility to states’ finances by ensuring principal on debt taken over remains out of FRBM limit.
States had to ensure takeover of liabilities within the limits of FRBM limit set under 13th Finance Com-mission.
Monitoring Involves monthly moni-toring to ensure discoms adhere to MoU.
Involved quarterly monitoring by State level monitoring committee and half yearly monitoring by Central level monitoring committee
Legislative change
Requires no legislative changes by states to implement.
States were required to bring State electricity distri-bution responsibility bill
Central govern-ment support
Central government support through increased funding under IPDS, supply of additional coal and low cost power from NTPC plants
Central government sup-port through transitional financing to ensure states undertake operational turnaround measures.
Future losses
Indicates trajectory of future losses to be taken over by states post FY17 thus ensuring sustainable turnaround.
No clarity on treatment of future losses.
Adherence to restruc-turing plan
Not meeting operational milestones will be lead to forfeiting their claim on IPDS and DDUGJY grants
No onus on states to meet milestones strictly
Difference between UDAY and FRP
UDAY is different from the previous two
attempts
UDAY is the third attempt in the last 15
years to resolve the big issue of weak dis-
com health. In 2000, One Time Settlement
Scheme (OTSS) and in 2012 (FRP) were
launched to address discom losses. How-
ever, both these previous attempts did not
help.

117GROUND VIEW GROUND VIEW Annual Edition 2016 Annual Edition 2016116
Rajasthan and Uttar Pradesh together ac-
count for 23% of (all India) discom loans and
50% of losses in FY14. Thus, these states are
crucial for UDAY to succeed.
The momentum and sensitivity with which
both discoms are working towards achieving
timelines is surprising. However, there are still
a few hurdles. This scheme is largely finan-
cial engineering – investor appetite for these
bonds is a key challenge. UP and Rajasthan
alone will have to issue Rs 970bn worth of
bonds over the next three years.
Operating metricsof Rajasthan and UP
ARR and ACS gap has widened 2.3x for UP
AT&C losses still at elevated level
Sour
ce: P
FC
Discoms remain optimistic on implemen-
tation
Officials indicated that state discoms were
optimistic about UDAY. When UDAY was
launched, investors wondered whether non-
BJP states would accept this scheme – in
this light, the urgency shown by UP in imple-
menting UDAY is a pleasant surprise. Since
state governments own discoms, the reduc-
tion in interest costs due to the scheme is a
key selling point – this is perhaps why the
scheme seems to have transcended political
affiliations and gained acceptance.
Uttar Pradesh: UPPCL expects to seek
the state cabinet’s nod and sign an MoU
by mid-December. It has an internal target
to complete the debt transfer before the
government’s prescribed timeline of March
2016.
Rajasthan: This state was actively involved
in formulating the UDAY scheme; active dis-
cussions with the state government in for-
mulating conditions for MoU are on.
Positive takeaways
Other than these two states, Andhra Pradesh and
Jharkhand have also announced that they will opt
for UDAY.
Political sensitivity expediting implementation
The urgency to implement power reforms is driven
by political capital that can be leveraged through
improving power supply. UP remains a state with
one the highest deficits and elevated AT&C loss-
es. With election looming, resolving power-supply
issues remains critical. Since UDAY schemes in-
volve no legislative changes (only tri-partite MoUs),
its implementation is likely to be expedited. The

117GROUND VIEW GROUND VIEW Annual Edition 2016 Annual Edition 2016116
MoUs and compulsory monthly review meet-
ings are likely to ensure that states will ad-
here to timelines, irrespective of change in
state governments.
It was astonishing how many silent reforms
both UP and Rajasthan have undertaken
on a small scale, even before the adoption
of UDAY by both states. Through its TARA
scheme (Turn Around by Reduction of AT&C
Loss) UPPCL wants to sensitise people about
the economics of power supply.
Like UP, Rajasthan has already taken loss-re-
duction measures such as rationalisation of
power-purchase cost, flattening of load curve
by shifting agriculture demand to the night,
and regular monitoring of measures at the
government level.
As a result of accumulated losses borrowings of these discoms has swelled to Rs1243bn
Networth of these discoms has eroded
Both states account for 50% of annual discom losses
Sour
ce: P
FC
UPPCL launched TARA (Turn Around by Reduction of AT&C Loss) to sensitise people about implementa-tion of reform. The scheme involves selecting small hamlets with a population less than 30,000 to undertake reforms. Thus, under this programme, 51 towns were selected and reforms such as tariff hikes and reduction in losses were implement-ed. After implementation of these reforms, power supply was gradually increased as collection efficiency improved to 22 hours from 14 hours earlier – this ensured acceptability of reforms among people.
ABOUT TARA

119GROUND VIEW GROUND VIEW Annual Edition 2016 Annual Edition 2016118
Operational measures along with fiscal measures
to aid turnaround
Implementation of UDAY involves fiscal as well as
non-fiscal measures.
Uttar Pradesh: For UP discoms, interest costs
account for 14% of expenditure, leading to a Rs
167bn loss. The regulator does not allow interest
on debt taken to fund losses to be passed through,
leading to continued losses. UP discom expects
power purchase cost to reduce due to other op-
erational measures such as improved coal supply
from CIL leading to lower fuel cost. CIL has been
mandated to supply washed coal by January 2017
and crushed coal by June 2017 – this will lead to
improvement in quality of supply. UP has already
seen the benefit of higher coal supplies for its state-
owned plants in 2016, which has helped it to reduce
power purchase costs.
Turn around will lead to revival of PPA cycle
Both Rajasthan and UP could accrue savings of
more than Rs 100bn due to a fall in interest cost
and a moratorium on the principal. However, as
highlighted by UP discoms, this will not translate
into higher capex – these savings will be largely
deployed to improve operational efficiency. A part
of the operational improvements include lowering
power-purchase costs by signing long-term PPAs.
Thus UP intends to sign 7GW of PPAs over the next
few years. It expects capex of Rs 40bn in FY16 and
Rs 70bn in FY17, largely driven through IPDS.
However, hurdles to implementation existDiscoms believe that implementation of UDAY will
not be without challenges. Some of the important is-
sues that need to be addressed for its success are:
Depoliticising the regulator
Like its predecessor schemes that have failed, UDAY
does not address the issue of separating state politics
from regulation – this could lead to its failure. Grant-
ed, one of the important pillars of UDAY is the need
for states to make quarterly tariff adjustments to re-
flect power purchase and fuel costs under the Fuel
FY14 (Rs bn) Debt Bond issuance*
Uttar Pradesh 535 401
Rajasthan 709 531
Tamil Nadu 329 247
Madhya Pradesh 87 65
Haryana 281 211
Total 1,941 1,456
*Bonds issued against takeover of 75% debt.
Bond issuance for top 5 loss making dis-coms as per GV estimates
and Power Purchase Adjustment (FPPA), but in the past,
such tariff adjustments were not allowed in states such
as UP and has been one of the reasons for higher losses.
To ensure that their turnaround remains sustainable, it is
necessary that discoms’ operations remain autonomous
and are not subject to political intervention. This will re-
quire an attitude change within the political class, which
has been treating them as personal fiefdoms so far.
No clarity on debt takeover: Total debt or loss-fund-
ing loans?
According to the details on UDAY made public by the
Ministry of Power, states will take over discom debt with-
out differentiating between capex debt and debt under-
taken to fund losses (classified as working capital loans
or transitional loans by banks). However, discoms are al-
ready allowed to recover interest on capex debt through
tariff – so a takeover of capex debt should ideally not be
allowed.
UDAY will lead to a bond-issuance rush – Where is
the appetite?
UDAY’s success hinges on whether the SDL bonds
against discom debt are a subscribed well. Implementa-
tion of UDAY is likely to lead to a bond-issuance rush by
states, which will require RBI’s intervention (to manage
the sheer size of this state-debt issuance). There is a risk
of asset-liability mismatch with loans likely to be convert-
ed into bonds. Taking the debt levels in PFC’s report
on SEB performance for FY14, the Rs 1.9tn debt for
top-5 loss-making states will lead to an issuance of Rs
1.4tn worth of bonds (with 75% debt taken over by
states). The appetite for this huge supply of paper
looks challenging in the current scenario.

119GROUND VIEW GROUND VIEW Annual Edition 2016 Annual Edition 2016118
Debt takeover to increase interest expenses for
UP/Rajasthan by 10-31%
Under UDAY, bond issuance is likely through State
Development Loan (SDL) bonds, which are issued
by the state government while RBI coordinates
the actual process of selling these securities. Each
state is allowed to issue securities up to a certain
limit each year. Net borrowing through SDL in
FY13-15 for UP and Rajasthan through SDLs was Rs
183bn and Rs 220bn respectively. Takeover of dis-
com debt will require RBI to increase the SDL limit
significantly for both states. In FY16, the (states’)
budgeted interest payout for UP and Rajasthan
is Rs 211bn and Rs 120bn respectively; the debt
takeover will lead to 10% and 31% increase in in-
terest cost (respectively) for the states in FY17.
Can discoms turn around?
Interest costs have been a major source of loss-
es for discoms – these contributed to 50% of UP’s
SEB losses and 100% of Rajasthan’s. UP will turn
networth positive (after the scheme is implement-
ed, including grants). However, Rajasthan will need
aggressive efforts to lower losses. Bond subscrip-
tion coupled with operational turnaround remains
crucial for both states.
Jonas Bhutta ([email protected])
Hrishikesh Bhagat ([email protected])
Rs bn Rajasthan UP
Outstanding SDL Liabilities
FY13 442 841
FY14 513 891
FY15 625 1061
Net increase in SDL bond (FY13-15) 183 220
Discom Debt (Sept16) 832 460
SDL bonds to be issued
50% 416 230
25% 208 115
Total SDL issue 624 345
% of outstanding SDL Liabilities 100% 33%
100% in SDL liability of Rajasthan and 33% for UP as per GV estimates
UP Rajasthan
Interest cost(FY16E budgeted) 211 120
Interest on account of debt takeover 21 37
% of FY16E interest cost 10% 31%
Fiscal deficit (%) -2.9% -3.0%
Fiscal deficit (including interest cost) % -3.1% -3.5%
Debt to GDP (FY16E) 28% 24%
Debt to GDP including loans (FY16E) 31% 28%
Deficit for UP to increase 20bps and Raj 50bps
Rajasthan UP
Debt (Sept 2016) 460 832
Taken over by states (75%)
FY16 Debt (50%) 230 416
FY17 Debt (25%) 115 208
State Grants to Discom
FY16 46 83
FY17 69 125
FY18 69 125
FY19 69 125
FY20 69 125
FY21 23 42
Total grants 345 624
Networth (FY14) (586) (440)
Loss (FY15) (120) (95)
Loss (FY16)- as per SEB projection (90) (70)
Loss (FY17)- as per SEB projection (60) (50)
Loss (FY18)- PC estimate (45) (38)
Loss (FY19)- PC estimate (34) (28)
Projected Networth (935) (721)
Interest savings- FY17 20.7 37.4
Interest savings- FY18 31.1 56.2
Interest savings- FY19 31.1 56.2
Interest savings- FY20 31.1 56.2
AT&C savings (assumed spread equally)
FY17 33.10 23.27
FY18 33.10 23.27
FY19 33.10 23.27
Networth (including grants) as on FY19 (376.59) 179.11
UDAY can turn UP networth positive

121GROUND VIEW GROUND VIEW Annual Edition 2016 Annual Edition 2016120
Indian specialty chemicals –Well set for accelerated value growthGround View organised a ‘Specialty Chemical Investors’ Day’ as a follow up to its detailed research on the Indian specialty chemical sector (October issue) that talked about the accelerated value growth of this industry, led by improving domestic consumption and robust export opportunity due to China’s slowdown. Participants included Mr Samir Biswas - Joint Secretary, Ministry of C&PC and sector experts from Tata Strategic Management (TSMG), Aarti Industries, Celanese Chemicals India (US-based MNC), and Archroma (EU-based MNC).
Mr Manish Panchal, Head of Chemicals, TSMG said that the Indian specialty chemicals industry is valued at about US$ 25bn and has delivered steady compounded growth of 13% over the last decade – largely driven by rising domestic consumption and steady progress in the end-user industries such as agrochemicals, polymer additives, paints & coatings, textiles, and surfactants.
TSMG estimates the Indian specialty chemicals industry to cross US$ 100bn by 2024 primarily due to ever-rising domestic consumption, increasing disposable per capita income, and changing life style in the country. Mr Panchal said, “Rapid progress (>20%) in the Indian packaging industry (currently valued at € 13.6bn) will drive growth for domestic specialised polymers. Additionally, a healthy progress in domestic construction chemicals (current market size of US$ 0.7bn), water-treatment chemicals (US$ 0.7bn), and surfactant segment (US$ 1.7bn) would drive growth for the domestic industry over the next five years.”
Although the industry has seen steady progress in the past, and is looking at accelerated growth in the future, India’s dependency on imported feed stock, lack of common infrastructure (common-effluent treatment plants, an effective green belt segregating chemical units from human habitats, a good port with a chemical storage terminal and adequate berthing facilities) and muted capacity creation have always been deterrents.
BY SURYA PATRAS P E C I A L T Y C H E M I C A L S

121GROUND VIEW GROUND VIEW Annual Edition 2016 Annual Edition 2016120
Addressing these issues, Mr Samir Biswas, Joint
Secretary, Ministry of C&PC said, “The Indian gov-
ernment, through its Make-in-India campaign, is
currently working towards attracting investments
(domestic and foreign) by providing a transparent
and investment-friendly policy and by setting up
common infrastructure such as integrated Petrole-
um, Chemicals & Petrochemical Investment Regions
(PCPIRs).” He also indicated that the government
has already taken strides in developing “reverse
SEZ” in resources-rich countries such as Iran, Mo-
zambique, and Magnolia. It has also started work on
development of a port in Iran to smoothen feedstock
supply. Such facilitation would drive growth for the
industry. Led by Make-in-India, the Indian chemicals
sector has already seen a 52% yoy jump in capex to
US$ 2.5bn in 2014 and 49% jump FDI to the tune of
US$ 4bn in FY15.
Environmental issues in China boost India’s spe-
cialty chemicals exports
Mr Rajendra Gogri, MD, Aarti Industries (one of the
leading specialty chemical players) said that the Chi-
nese slowdown (due to the country’s environmental
issues) will be an exports multiplier for the Indian
specialty chemicals industry. “Softening of Chinese
exports due to the implementation of stricter envi-
ronmental laws w.e.f. 1st January 2015 should boost
exports of the Indian specialty chemicals industry,
which traditionally has been dependent on domestic
consumptions. Such a scenario should be sustaina-
ble in the visible future,” he added.
Mr Belur Krishnamurthy Sethuram, MD, Celanese
Chemicals India, supported Mr Gogri’s view and
added, “The fact that operational costs in China
are rising and China is losing its labour-cost ad-
vantage over India will make India emerge as an
alternate source for specialty chemicals for global
peers.”
The panel discussion painted a picture of acceler-
ated value-growth for the Indian specialty-chemi-
cals industry over the next few years, led by faster
growth in the domestic consumption, multiplying
exports (with China softening), and likely consol-
idation led by the increased interest of MNCs
(leading to improvement in efficiency).
The GV conference hosted Aarti Industries,
Camlin Fine Sciences, Meghmani Organics, Fi-
neotex Chemicals, Shree Pushkar Chemicals
and Omkar Specialty Chemicals.
Aarti Industries – Differentiated products and
capex to drive growth
In order to achieve scale, it has expanded capac-
ities for its hydrogenation and ethylenation pro-
cesses. Simultaneously, it has generated demand
for by-products in various target industries in or-
der to balance co-products (isomers), which is im-
portant for a scale-up. It is currently on track with
capex worth about Rs 6bn over FY16-17, which
can strengthen its operating performance from
FY18. Additionally, the company expects to bene-
fit from the ongoing softening of Chinese exports
as it generates over 50% of its sales from exports.
Overall, the company guides for 15% annual vol-
ume growth, but sees revenue remaining muted
(due to lower product prices with lower crude pric-
Govt facilitation through ‘Make-in India’ to drive growth

123GROUND VIEW GROUND VIEW Annual Edition 2016 Annual Edition 2016122
es). It expects margin expansion of about 200bps
over the next two years.
Camlin Fine Sciences - Sees sustained growth
on value-added product offerings
Camlin – the world’s largest manufacturer of food-
grade antioxidants – is expanding its TBHQ/BHA
capacity capacity by 50%/20% by FY16. Simulta-
neously, it has started focusing on downstream
value-added products like vanillin. In vanillin,
Camlin has developed a better-quality product
(than Chinese players) at the same price (US$ 13/
kg). It has also taken one of the shutdown facilities
in China on lease for manufacturing this product.
The management expects 15-17% revenue CAGR
with a margin improvement of 200bps over FY16-
18. Additionally, it is setting up a new facility (ex-
pected commissioning by September 2017) at
Dahej SEZ for manufacturing 9000 MTPA of hydro-
quinone, 6000 MTPA of Catechol and 6000 MTPA
of vanillin with capex of Rs 2.3-2.4bn, which would
accelerate growth beyond FY17.
Meghmani Organics – Targets improving utilisa-
tion and deleveraging
Meghmani Organics – one of the leading export-
ers of pigments and manufacturers of agrochem-
ical & caustic-chlorine – expects 15-20% CAGR in
its pigment business (85% export driven) led by
sweating of assets. It foresees 3x growth in its
agro-formulation revenue and 20% growth in its
caustic-chlorine business over next three years.
With improved utilisation, the company guides at
revenues of Rs 20bn in FY18 (Rs 12.7bn in FY15)
with steady margins expansion of 100bps each
year to 20% by FY18. It is focused on improve uti-
lisation of its assets (invested Rs 6.5bn in capex
in the past 3-5 years), efficient management work-
ing capital, and deleveraging (debt is Rs 6.5bn,
expects to retire Rs 1bn annually for next three
years).
Fineotex Chemicals - Focused on specialisation
and Chinese products replacement
Fineotex Chemicals – manufacturer of a range of
textile auxiliaries (85% revenue share) and speci-
ality chemicals for construction, water treatment,
leather, and paper industries – expects steady
growth led by focus on product specialisation/
branding, replacement of Chinese products, and
optimisation in manufacturing. Its competitors in-
clude BASF, Atul Industries, and Archroma. Growth
of the market has been 10% and FCL expects it to
pick up. It is a zero-debt company.
Shree Pushkar Chemcials & Fertilisers (SPCFL)
- Forward integration and alliance with Hunts-
manto drive value
SPCFL is a manufacturer of dye intermediates
(gamma-acid, k-acid, vinyl sulphone, h-acid), acids
(sulphuric acid, oleums), cattle feed supplement
(di calcium phosphate-DCP), and fertilisers (sin-
gle super phosphate-SSP, soil conditioner). Dye
intermediates are its leading sales contributor at
78% followed by 15% from fertiliser and 7% from
DCP/sulphuric acid. In order to forward integrate
its dye intermediates operation with dye-stuff, it
has just concluded an IPO worth Rs 700mn (for
setting up of a plant for manufacturing reactive
dyes). Its forward integration initiatives are com-
plemented with its long-term manufacturing and
supplying arrangement to the tune of 1,000TPA
with Huntsman (a US-based company and a global
player in dyes and petrochemicals with a turnover
of approximately US$ 14.5bn). Hence, the compa-
ny guides for revenues worth Rs 4bn for FY17 (Rs
2.69bn in FY15) with margin of 18-20%.
Omkar Speciality Chemicals(OSC) - Change in
business mix to lead growth
OSC manufactures and sells iodine compounds,
selenium compounds, intermediates, resolving
agents, and APIs. It is in the process of chang-
ing its business mix by reducing its dependency
on iodine and focusing more on veterinary APIs,
which is the highest contributor to the company’s
revenue mix with high margins. It has a wide and
diversified customer base including Cipla, Lupin,
Amul, Sun Pharma, Evonik, DSM, Samsung, and
BASF. The company expects a Capital WIP of Rs
1.10bn, which will get commissioned in coming
quarters and drive growth over FY15-18. OSC ex-
pects FY17/18/20 sales at Rs 4.1/8.4/12.5bn from
Rs 2.65bn in FY15 and margins to expand by 300-
350bps over FY15-18 from 19.9% in FY15.
Surya Patra ([email protected])

123GROUND VIEW GROUND VIEW Annual Edition 2016 Annual Edition 2016122
BY AMOL RAOD I V E R S I F I E D
Mangalore : The serene outlier
Nestled in the Western Ghats along the Arabian Sea, Mangalore is best known for its pristine beaches, verdant scenery, and lip-smacking cuisine. The city is an important port on the western coast, catering to diverse and sizeable cargo including petrochemicals, cashew nuts, and coffee. Mangalore city and its surrounding regions also serve as an educational hub, with particular emphasis on the technical streams (engineering, medicine). A sizeable expatriate population has ensured a reasonably robust stream of remittance income for this region creating an extremely vibrant local economy. This forms the background of this Ground View visit – to examine local business dynamics and to determine how the expat income has affected the local economy.
Over the course of four days and 1,400 km, the
following themes emerged:
• Consumption of semi-discretionary products
is growing at a strong clip. Value-added dairy
products, QSR (quick-service restaurants), and
apparel are seeing robust sales. Consumption
patterns are steadily converging with those in
mini-metros and metros.
• Seasonality in consumption is slowly dwindling.
Liquidity and changing preferences are con-
tributing to lower cyclicality in sectors such as
FMCG, QSR, and jewellery.
• Organised retail, through localised players, is
growing rapidly in several small towns sur-
veyed. Convenience of shopping for groceries,
clothing, and FMCG items under one roof is a
primary driver.
• High-value discretionary items such as vehicles,
sarees, and jewellery are also seeing growth
over the low base of last year. While real estate
is registering some growth, purchases have
slowed considerably this year.

125GROUND VIEW GROUND VIEW Annual Edition 2016 Annual Edition 2016124
TOP: Cups of strawberry ice cream at Hangyo’s Hubli Plant
MID LEFT: Choco-bar ice cream coming off the fully automat-ed line at Hangyo’s Hubli plant
MID-RIGHT: Gudbud – a hot-selling flavour from the Hangyo stable
LEFT: Four-litre packs of straw-berry ice cream at Hangyo’s Hubli plant
Encouraging trends in semi-discretionary segment
Hangyo Icecreams A manufacturer of value added dairy products, gradually expanding its geographical reach
With a turnover of Rs 700mn (FY15), the com-
pany operates two facilities and manufactures
~40,000 litres of ice cream daily. It is focussed on
value-added dairy products. Its portfolio includes
ice cream, flavoured milk, curd, buttermilk, lassi,
and paneer. Hangyo also sells minuscule quantities
of branded milk from its two dairies, only after
satisfying internal requirements for its ice cream
operations.
The company has been clocking a revenue CAGR
of 20%+ over the past three years and attributes
its success to integrated manufacturing, contem-
porary product portfolio, and increasing distribu-
tion reach. With a traditional base in southern Kar-
nataka, the company has expanded into northern
Karnataka, Goa and parts of Maharashtra.
The cyclicality in consumption of ice-cream and
other products is gradually diminishing. The lean
season in consumption has reduced substantially
to just 45-60 days now vs. 4-5 months earlier –
this is usually during the coldest days of the year.
Hangyo believes this is due to increasing dispos-
able income, better affordability, and improved
availability. The company is upbeat on its pros-
pects and intends to focus only on the value-add-
ed segment. While it doesn’t have plans to be a
national player, it is keen on increasing its reach in
regional markets.
GV Tour map

125GROUND VIEW GROUND VIEW Annual Edition 2016 Annual Edition 2016124
Navami Plaza and SupermarketChain of supermarket and department stores
Operating in three locations in the Dakshin
Kannada district, Navami Plaza is a recent
entrant into the modern-trade format. Its
flagship store in Mudbidri (80kms from
Mangalore) is spread over 2,500 sq. ft. and
caters to a town of about 10,000 people
with a high floating population of tourists
and pilgrims. It has a huge 24,000 sq. ft.,
Navami Department Store, adjoining its
flagship store.
Navami Plaza (Mudbidri) has a catchment
area of ~25kms. Most consumers are
families of emigrants, hence they’re fairly
sophisticated. Apart from groceries and
FMCG products, the supermarket also
stocks meats of different varieties. Con-
sumables are stocked as per categories –
oils and soaps are stocked for two weeks.
Pulses, detergents and cosmetics are usu-
ally stocked for a month. The entire chain
uses an MIS ‘Retail Whizz’ for its opera-
tions, from stocking to billing.
The department store sells apparel, ho-
siery, and other items for personal use and
gifting, not unlike those found in metros.
Spread across three levels, it usually sees
brisk business towards the weekends –
from Friday through Sunday.
The Navami group has two more super-
markets, one each in Brahmavar (near Udi-
pi) and Mangalore. Both have been set up
recently and are doing brisk business. The
management expects to open two more
supermarkets in southern Karnataka in the
next 15-18 months and is in the process of
finalising real estate for this.
1-litre Bisleri bottles being labelled
Shri Manjunath Foods Bisleri manufacturer and
franchisee for four districts in
Karnataka
This 16-year-old company is the
sole franchisee and manufacturer
for Bisleri in four districts of south
Karnataka (Dakshin Kannada,
Udupi, Shimoga, Chikkamagaluru).
It manufactures packaged drinking
water in seven SKUs and serves
as the sole distributor of other
products of the parent (Vedica
natural spring water and Urzza
power drink). With annual sales
in excess of Rs 150mn, the
company has 75% market share
in its geographies and competes
with other national brands (Kinley,
Aqua Fina) and several local
brands. It has been growing at
~25% over the last two years and
is undertaking capex to triple its
capacity in the same location.
The company cited shortage of
potable water, increasing travel
and changing lifestyles as primary
drivers of higher consumption
of packaged drinking water.
Additionally, heightened
advertising by the parent
company is helping capitalise on
people’s health concerns, thereby
contributing to improving sales
volumes.
The 1-litre bottle is its highest
selling product, in keeping with
the national trend. The 250-
ml and 20-litre SKUs are the
most profitable, if sold within a
200-300km radius of the plant.
According to the management,
the higher-priced and premium
Vedica is also doing well, finding
favour amongst international
travellers and expatriate Indians.
500 ml Bisleri bottles being moved for packing at Sri Manjunath’s plant
Food court at the entrance of Navami Supermarket, Mudbidri

127GROUND VIEW GROUND VIEW Annual Edition 2016 Annual Edition 2016126
Discretionary consumption growing, albeit from a low base
Abharan JewellersChain of jewellery stores across south Karnataka
With a pedigree of seven decades, Abharan Jewellers are headquartered in the temple-town of Udupi with branches in four other major towns (Managlore, Shimoga, Karkala, and Kundapur). With a total turnover in excess of Rs 2bn, the chain caters to middle-income and lower-income families in the region.
Our channel checks indicated that this chain enjoys very strong brand equity despite stiff competition from brands such as Joyalukkas, Kalyan Jewellers, Bhimas (mainly originating from Kerala) because of Abharan’s economical charges, transparent trade policies, and good product finishing.
The management says that in FY15, the chain clocked a volume growth of 22% – primarily due to a fall in gold prices, which prompted consumers to buy the precious metal as a long-term investment. So far in FY16, the chain has clocked a 7% increase in offtake. Interestingly, the promoters revealed that purchase of gold and ornaments is now no longer restricted to only auspicious occasions. Many consumers in the region receive remittances, which prompts investment in gold as a store of value.
The chain is expanding its footprint at the village/taluka level in southern Karnataka, using a smaller format. With smaller stores (700-1,000 sq. ft.), the company aims to tap its strong brand equity in expanding its customer base. A pilot store of this format ‘Namma Abharan’ (translates into ‘Our Abharan’) has yielded excellent results and the management wants to set up about six such stores over the next 15-24 months.
Jewellery display at Abharan Jewellers, Udupi
Jayalaxmi Silks & TextilesLargest saree and ladies garments store in southern
Karnataka
Jayalaxmi Silks is the largest retailer of sarees in
southern Karnataka with a range spanning Rs 500-
65,000. Three fourths of its sales are to ladies, largely
for garments and inner-wear. Operating from a single
store in Udupi, it has registered a growth of 17% in
volumes over the last two years, despite the com-
petition from online retailers. Interestingly, while silk
prices have risen by 50% over the last two years, sales
of silk sarees have not fallen significantly. The man-
agement also revealed another interesting fact – the
relevance of auspicious occasions such as Diwali and
Dassera for sarees was decreasing, as purchases were
spread out over the year (a trend seen in jewellery in
this region as well).
Car dealers upbeat on new models; rebound in
FY17GV visited several dealerships of Maruti and Tata
Motors across southern Karnataka. While details are
covered extensively in our piece on the automotive
sector, most dealerships reported a growth 8-10% in
sales from FY15’s base.
All dealers were upbeat about the launch of new var-
iants over the next 24 months and expected sales
growth to touch double digits in FY17. Dealers said
customers preferred established companies and
90% of all PVs in Mangalore were from Maruti, Tata
Motors, and Hyundai’s stables.

127GROUND VIEW GROUND VIEW Annual Edition 2016 Annual Edition 2016126
GV’s interactions in Mangalore also included an influential local
politician (who wishes to remain unnamed). He shed light on
the economic and social angles of development.
He revealed that while Mangalore has traditionally exported
white and blue-collared workforce for decades, the migration
of the lowly skilled/unskilled workers is slowly dwindling. This
is because increasingly, low-income families are depending on
M-NREGA (which ensures minimum-wage for six- months every
year). With these families getting rice at Rs 1/kg and other
foodstuff at subsidised rates, their incentive to work outside
the scheme is very low. This has severely impacted agriculture
and local businesses, which require daily manpower.
While the labour shortage is temporarily met by migrant
workers from Orissa and West Bengal, the politician shed
light on a darker fallout of M-NREGA. With the availability
of subsidised food and very little productive work on hand,
the wage surplus is being increasingly diverted towards
consumption of country liquor and narcotics. Consequently,
government-appointed contractors for M-NREGA jobs often
complain about low productivity of local workers due to
inebriation and substance abuse. Additionally, the liquor and
narcotics lobbies have grown, which is convenient in the light
of the muted performance of the real-estate sector. Hence,
proliferation of alcohol and drugs is going unchecked. Even
local government authorities are aware of the negative impact
of M-NREGA but are silent due to vote-bank compulsions – in
fact, the scheme is expanding.
On the infrastructure side, despite strong power generation
and transmission capabilities, the power situation was not
comfortable since the government discom is operationally
weak. Hence, power cuts in rural areas range from 2-4 hours
every day.
Lobbying was underway to modify CRZ rules. This would boost
the local hospitality industry and help revive the local real-
estate industry to a certain degree. A promising development
is the construction of the Panvel-Edapalli highway (NH-66). Not
only is this generating decent work for local contractors, but it
is also expected to boost local businesses once commissioned
in FY18.
Amol Rao ([email protected])
Through the eyeglass – The political view

129GROUND VIEW GROUND VIEW Annual Edition 2016 Annual Edition 2016128
BY VARUN KUMAR
Innovation can happen even where you least expect it. I was watching a few live performances of Michael Jackson on YouTube and in most
performances, he had this trick – he would stand behind a white curtain and the lighting would project his shadow in such a way that it appeared huge (20 feet or more probably). He would per-form some moves for a minute or so – for the audience, especially the ones at the back, it’s not a 5 feet 10 inch tall Jackson performing, but a huge 20 feet tall MJ dancing for them. Great specta-cle! A concert is a visual and aural ex-travaganza – but he innovated with such a simple trick.
The paradox of innovation is what while it can happen in the most mundane of contexts and new ideas can theoretically come to anyone, the largest companies routinely fail to innovate. Xerox’s story is possibly the most famous of all – the company became massive in photocop-ying, so much so that its name became synonymous with the act of making a photocopy. It had a very innovative product line of desktop PC technolo-gies including graphic user interface and mouse. However, it did not pursue this line (almost seemed like these innova-tions were the babies of a few inventors and not of the corporation) and gave these off to Microsoft and Apple without hesitation.
Consider another titan – Wal-Mart – it hasn’t failed by any standards except for shareholder returns. As per Bloomberg data, over last decade, Wal-Mart’s stock gave annualised returns of 4.8% vs. S&P
500’s 7.8% and Amazon’s whopping 29% annualized returns. Amazon is an innova-tor and Wal-Mart seems to be struggling. Here’s the more interesting part – when the business isn’t innovating, especially when faced with a disruptive challenger, capital allocation decisions such as div-idends and buybacks don’t work. Wal-Mart authorised a US$ 15bn buyback in 2007 (US$ 10bn in 2004, probably a few more) – these buybacks don’t seem to have helped much. Innovation is par-amount.
What about India?
CII- ITC Centre of Excellence For Sustain-able Development recently did a study titled “How India Innovates” in 2013. The most important chart that I found is on Page 32 that detail what factors ail in-novation:
• Too much focus on existing products and services
• Too much focus on short-term financial performance
• Lack of talent.
I think one big challenge is that innova-tion, by definition, involves taking risk and it is very hard to always perfectly as-sess what is risky and what is not. At the end, if innovation fails, the investment made towards it may look like a capi-tal-allocation disaster and if it succeeds, it may look visionary. This tightrope walk is probably the inherent predicament of innovation.
Allow me to highlight a few names that possibly faced constraints but innovated anyway and reaped rewards.
The Innovators
HDFC Bank
It may be hard to believe, but even HDFC Bank was a start-up once – its growth sto-ry had the same elements as the folklore of recent tech start-ups (training sessions under trees, employees bringing their toddlers to office while working on the weekend). The bank had a few innovative tricks up its sleeve when it was building its business. When Siemens became its first corporate customer, HDFCB had an innovative idea to gain market share – why stop at funding the key customer – why not collaborate with the customer’s entire vendor-supply chain. This made for a more customer-oriented solution, as its client was assured about the financ-ing needs of its entire supply chain. This helped HDFC Bank gain market share while not many banks were taking such initiatives.
Kajaria
One of its annual reports talks about an incident when the management was confident that large tiles would be the new trend in the market and the compa-ny wanted to start innovating ahead of competitors. However, the dealers were sceptical and the company did not want to steamroll them – instead, Kajaria took some of the biggest distributors to an industry conference/event in Italy where they saw for themselves the potential, in-terest, and global trend towards bigger tiles. The company was successful in per-suading the dealers and went ahead with the bigger format, which turned out to be very successful.
The value of INNOVATION
A few examples from India Inc

129GROUND VIEW GROUND VIEW Annual Edition 2016 Annual Edition 2016128
Asian Paints:
Besides capital allocation, managerial talent, and distribution strength, Asian Paints is a leader in delighting custom-ers. Painting a home, or specifically, visualising how a particular wall/room would look with a particular shade or style is difficult – most customers have always sought and appreciated help in this direction. Asian Paints went ahead and mastered this need – its Colour Ideas Stores are designed to turn the ‘chore’ of selecting paint into a ‘pleas-urable experience’. Asian Paints offers at-home colour consultations. Even their website has online solutions where you can send pictures of your room/walls and colour choices and for a small fee, it sends you samples of how it would look with the colour of your choice. A much more elegant solution than struggling with MS Paint or Photoshop! I would think it is these customer-focused inno-vative initiatives that un-derline the company’s market dominance and hence its finan-cial performance.
Colgate:
Colgate is one of the most innovative ex-tech companies. While there are many examples from Colgate’s stable, some case studies from Harvard Business Review talk about two particular instances. One was when P&G introduced a product called Whitestrips for in-stant whitening of teeth and built a big market rapidly. Colgate launched its counter product two years later, but priced it much cheaper with better user experience. Colgate’s product gained meaningful market share very quickly against a formidable competitor. Anoth-er example is Colgate Sensitive Pro-Re-lief. By 2009, the US$ 1bn global market for sensitive toothpaste was expected to grow rapidly due to demographic changes. Colgate introduced a product in 2009 and by end of 2010, it was sell-ing in 75% of the sensitivity market glob-ally and gaining share in every market. Precisely the reason I think Colgate India stock would do well, as demand recov-
ers and operating leverage (inherent in two new plants) plays out.
Bharat Forge
The only thing Bharat Forge seemed to do well was crankshafts and connecting rods. Now, they have mastered metallur-gy of titanium – this is a big innovation (in my limited view) as it opens com-pletely new markets in a high-entry bar-rier segment (aerospace). This is more important in context of Make In India for
defence, because aerospace has always been a big component of defence by value. While 2005-12 has been a bit chal-lenging for BF due to some
aggressive expansions, the company seems to
be focussing on what matters – inno-
vative products with improved
technology.
Cummins India:
The recent Volkswagen scandal gives me intuitive comfort about Cummins’ tech advantage vs. Kirloskar Engines and others. My key takeaway from the VW scandal is that it is expensive and highly technology intensive to make die-sel engines compliant to strict emission standards – tech is a very big barrier in diesel engines. This gives Cummins an edge and the innovation that it seems to have achieved looks outward and focus-es extensively on exports. It recognises that India’s product is great in terms of
quality and cost and it will build its distri-bution around it. Sort of like a Blue Ocean Strategy – go where no market exists and create one. Quite an innovation. And this is apart from what it must have been doing on diesel-engine tech, which even VW found so cumbersome that it chose to install cheat codes instead.
Kitex Garments:
Kitex has achieved striking success in its existing business of making children wear for brands such as Mothercare. Currently it is the second largest pro-ducer of children’s apparel in the world. To try and expand its horizons, the com-pany is trying to build new businesses of selling its own private label and is exper-imenting with e-tailing licensed brands. It is going to be incredibly hard to exe-cute. But, it’s interesting that the com-pany is trying to find engines of growth that will contribute after current engines stabilise in 3-4 years.
Eicher:
Recent media reports said Siddartha Lal was relocating to London briefly to build new markets for Bullet globally. Lal was quoted as saying, “We realised that there is this enormous gap globally in the mid-weight motorcycle market. We felt we had the ingredients and the wherewithal to make the right product”. Eicher has entered Colombia and Indonesia, and hired an ex-Harley manager as head of North America. Who knows if it will suc-ceed, but success probability is definitely >0. Had it not tried, the success probabil-ity would definitely be zero.
Varun Kumar ([email protected])

131GROUND VIEW GROUND VIEW Annual Edition 2016 Annual Edition 2016130
WARREN BUFFETT and Berkshire Hathway are most known and applauded for their investing
prowess – around the folklore of the phrase “Moat”. However, little attention is paid to a VERY BIG fact – Berkshire has MANY wholly owned subsidiaries and after investing the key skill that comes into play is managing these companies (quite different from in-vestment analysis).
In that sense, Berkshire isn’t just an investment house, but a full-fledged conglomerate with Mr Buffett as the CEO. The incredible success of these wholly owned subsidiaries is a remarkable management achieve-ment, one that does not get as much attention. This management feat is no small one. Even Buffett noted the success of his wholly owned subsidiaries as early as 1997 in a report (link). http://www.berkshirehatha-way.com/1997ar/1997.html
I recently stumbled on a case study in the Harvard Business Review, highlighting this exact point – Berk-shire’s management success.
The central idea, the case study notes, is quite straight-forward, though I am sure executing it is incredibly hard – ally with great people and then give them full autonomy. Buffett follows this autonomy principle to the hilt. He had only two requirements from manag-ers – monthly financial statements and sending oper-ating cash to HQ, as HQ will take capital-allocation decisions. Beyond that, as Charles Thomas Munger (Vice-Chairman of Berkshire Hathaway Corporation) puts it, “It was delegation, just short of abdication.”
Two fundamental assumptions that make this man-agement model possible are – (1) businesses that don’t need significant attention, and (2) working with people who don’t need much oversight in an organi-sation that thrives on a significant factor – trust.
The 1998 report notes that for managers, the instruc-tions were pretty straight forward – “Just run your business as if: 1) you own 100% of it, 2) it is the only
asset in the world that you and your family have or
will ever have, and 3) you can’t sell or merge it for at
least a century”.
I would think that’s quite a clean way to solve the
agency problem though I am sure some more checks
and balances must be in place, because if this prob-
lem was so easy to tackle, everyone could have done
it.
Another strategy Berkshire followed was to minimise
corporate overheads - no analytical staff to assess
deals for example. This not only saved costs in rent,
salaries, and benefits, but also reduced wasteful ex-
penditure that might have happened because of a
large staff. Additionally, guaranteed speed in deci-
sion-making.
I recall my own experience when I was trying to build
a team for my start-up. One question I fiddled around
with was should I also re-polish my decade-old cod-
ing skills (to meddle around)? Then I decided against
it and delegated all tech to the lead engineer. My rea-
soning – (1) I am better off focusing, and (2) If I think
I can learn in six months what people have learnt in
10 years, I am seriously over-estimating myself and
insulting the intelligence of the team members.
I also thought of any typical President and Prime
Minister and realised that they possibly can’t know
everything and are yet expected to take decisions on
anything. Their success lies in hiring a good cabinet
and delegates.
All of this then boils down to the importance of pro-
moters and CEOs of companies that one invests in
— after all, every investor is delegating them with the
job of managing their investments.
Varun Kumar ([email protected])
Warren Buffett’s Not so well known skill
BY VARUN KUMAR

131GROUND VIEW GROUND VIEW Annual Edition 2016 Annual Edition 2016130
Indian Economy – Trend Indicators
Monthly Economic Indicators
Quarterly Economic Indicators
Growth Rates (%) Oct-14 Nov-14 Dec-14 Jan-15 Feb-15 Mar-15 Apr-15 May-15 Jun-15 Jul-15 Aug-15 Sep-15 Oct-15
IIP -2.7 5.2 3.6 2.8 4.8 2.5 3.0 2.5 4.2 4.1 6.3 3.6 -
PMI 51.6 53.3 54.5 52.9 51.2 52.1 51.3 52.6 51.3 52.7 52.3 51.2 50.7
Core sector 9.0 6.7 2.4 1.8 1.4 -0.1 -0.4 4.4 3.0 1.1 2.6 3.2 -
WPI 1.7 -0.2 -0.5 -0.9 -2.1 -2.3 -2.4 -2.4 -2.4 -4.1 -4.9 -4.5 -3.8
CPI 5.5 4.4 5.0 5.2 5.4 5.3 4.9 5.0 5.4 3.7 3.7 4.4 5.0
Money Supply 12.0 11.4 10.2 11.5 11.4 11.3 11.5 11.7 11.1 11.3 10.9 11.2 10.9
Deposit 12.4 12.2 10.6 11.9 11.8 11.6 11.8 12.3 11.7 11.7 11.5 11.6 11.5
Credit 10.6 10.5 10.4 10.2 9.9 10.2 12.6 10.5 9.8 9.4 9.4 9.6 9.1
Exports -5.8 7.3 -3.8 -11.2 -15.0 -21.1 -14.0 -20.2 -15.8 -10.3 -20.7 -24.3 -17.5
Imports 3.7 26.8 -4.8 -11.4 -15.7 -13.4 -7.5 -16.5 -13.4 -10.3 -9.9 -25.4 -21.2
Trade deficit (USD Bn) -13.6 -16.9 -9.4 -8.3 -6.8 -11.8 -11.0 -10.4 -10.8 -12.8 -12.5 -10.5 -9.8
Net FDI (USD Bn) 2.8 1.8 4.0 4.7 3.8 2.7 3.3 3.8 1.7 1.7 2.2 2.9 -
FII (USD Bn) 1.7 4.8 -0.4 6.6 3.8 2.0 3.1 -2.8 -2.0 -0.7 -3.5 -2.4 -
ECB (USD Bn) 2.8 3.5 0.6 2.6 2.3 2.7 7.3 2.4 2.4 3.2 2.1 0.8 -
Dollar-Rupee 61.4 62.0 63.0 61.9 61.8 62.5 63.4 63.8 63.7 64.1 66.5 65.6 65.3
Foreign Exc Res (USD Bn) 315.9 316.3 319.7 327.9 338.1 341.4 344.6 352.5 355.2 353.3 355.4 350.0 353.6
Balance of Payment (USD Bn) Q1FY14 Q2FY14 Q3FY14 Q4FY14 Q1FY15 Q2FY15 Q3FY15 Q4FY15 Q1FY16
Exports 73.9 81.2 79.8 83.7 81.7 85.3 79.0 70.8 68.0
Imports 124.4 114.5 112.9 114.3 116.3 123.9 118.3 102.5 102.2
Trade deficit -50.5 -33.3 -33.2 -30.7 -34.6 -38.6 -39.3 -31.7 -34.2
Net Invisibles 28.7 28.1 29.1 29.3 26.7 28.5 30.9 30.2 28.0
CAD -21.8 -5.2 -4.1 -1.3 -7.9 -10.1 -8.4 -1.5 -6.2
CAD (% of GDP) 4.6 1.2 0.9 0.3 1.6 2.0 1.7 0.3 1.2
Capital Account 20.6 -4.8 23.8 9.2 19.2 16.5 23.6 30.7 18.1
BoP -0.3 -10.4 19.1 7.1 11.2 6.9 13.2 30.1 11.4
GDP and its Components (YoY, %) Q2FY14 Q3FY14 Q4FY14 Q1FY15 Q2FY15 Q3FY15 Q4FY15 Q1FY16 Q2FY16
Agriculture & allied activities 3.6 3.8 4.4 2.6 2.1 (1.1) (1.4) 1.9 2.2
Industry 4.2 5.5 5.5 8.1 7.2 3.8 7.2 6.4 8.3
Mining & Quarrying 4.5 4.2 11.5 4.3 1.4 1.5 2.3 4.0 3.2
Manufacturing 3.8 5.9 4.4 8.4 7.9 3.6 8.4 7.2 9.3
Electricity, Gas & Water Supply 6.5 3.9 5.9 10.1 8.7 8.7 4.2 3.2 6.7
Services 9.7 8.3 5.6 8.4 10.2 11.1 8.0 8.6 8.0
Construction 3.5 3.8 1.2 6.5 8.7 3.1 1.4 6.9 2.6
Trade, Hotel, Transport and Communications 11.9 12.4 9.9 12.1 8.9 7.4 14.1 12.8 10.6
Finance, Insurance, Real Estate & Business Services 11.9 5.7 5.5 9.3 13.5 13.3 10.2 8.9 9.7
Community, Social & Personal Services 6.9 9.1 2.4 2.8 7.1 19.7 0.1 2.7 4.7
GDP at FC 7.5 6.6 5.3 7.4 8.4 6.8 6.1 7.1 7.4

133GROUND VIEW GROUND VIEW Annual Edition 2016 Annual Edition 2016132
Annual Economic Indicators and Forecasts
Indicators Units FY8 FY9 FY10 FY11 FY12 FY13 FY14 FY15 FY16E FY17E
Real GDP growth % 5.8 0.1 0.8 8.6 5.0 1.4 4.7 0.2 2.0 3.0
Agriculture % 9.2 4.1 10.2 8.3 6.7 0.9 -0.1 6.6 7.0 7.5
Industry % 10.3 9.4 10.0 9.2 7.1 6.2 6.0 9.4 8.9 9.4
Services % 38966 41587 45161 49185 52475 54821 91698 98271 105543 113986
Real GDP Rs Bn 967 908 953 1079 1096 1008 1517 1611 1624 1809
Real GDP US$ Bn 49864 56301 64778 77841 90097 101133 113451 126538 138638 158119
Nominal GDP Rs Bn 1237 1229 1367 1707 1881 1859 1876 2074 2133 2510
Nominal GDP US$ Bn 1138 1154 1170 1186 1202 1219 1236 1254 1271 1302
Population Mn 1087 1065 1168 1439 1565 1525 1518 1655 1678 1928
Per Capita Income US$ 4.7 8.1 3.8 9.6 8.7 7.4 6.0 2.0 -1.0 5-6
WPI (Average) % 6.4 9.0 12.4 10.4 8.3 10.2 9.5 6.0 5.0 5.0
CPI (Average) 22.1 20.5 19.2 16.2 15.8 13.6 13.5 12.0 12.0 13.0
Money Supply % 7.50 5.00 5.75 6.00 4.75 4.00 4.00 4.0 4.0 4.0
CRR % 7.75 5.00 5.00 6.75 8.50 7.50 8.00 7.50 6.75 6.75
Repo rate % 6.00 3.50 3.50 5.75 7.50 6.50 7.00 6.50 5.75 5.75
Reverse repo rate % 22.4 19.9 17.2 15.9 13.5 14.4 14.6 11.4 12.0 13.5
Bank Deposit growth % 22.3 17.5 16.9 21.5 17.0 15.0 14.3 9.5 10.0 12.0
Bank Credit growth % 1437 3370 4140 3736 5160 5209 5245 5126 5555 5534
Centre Fiscal Deficit Rs Bn 2.9 6.0 6.4 4.8 5.7 5.2 4.6 4.1 3.9 3.5
Centre Fiscal Deficit % of GDP 1681 2730 4510 4370 5098 5580 5641 5920 6349 6277
Gross Central Govt Borrowings Rs Bn 1318 2336 3984 3254 4362 4674 4536 4469 4603 4538
Net Central Govt Borrowings Rs Bn 1.5 2.4 2.9 2.1 1.9 2.0 2.5 2.4 2.0 1.5
State Fiscal Deficit % of GDP 4.4 8.4 9.3 6.9 7.6 6.9 7.1 6.6 5.9 5.0
Consolidated Fiscal Deficit % of GDP 166.2 189.0 182.4 251.1 309.8 306.6 318.6 316.7 278.0 291.9
Exports US$ Bn 28.9 13.7 -3.5 37.6 23.4 -1.0 3.9 -0.6 -12.2 5.0
YoY Growth % 257.6 308.5 300.6 381.1 499.5 502.2 466.2 460.9 416.0 438.9
Imports US$ Bn 35.1 19.7 -2.5 26.7 31.1 0.5 -7.2 -1.1 -9.7 5.5
YoY Growth % -91.5 -119.5 -118.2 -129.9 -189.8 -195.6 -147.6 -144.2 -138.0 -147.0
Trade Balance US$ Bn 75.7 91.6 80.0 84.6 111.604 107.5 115.2 116.2 118.8 121.1
Net Invisibles US$ Bn -15.7 -27.9 -38.2 -45.3 -78.2 -88.2 -32.4 -27.9 -19.2 -25.8
Current Account Deficit US$ Bn -1.3 -2.3 -2.8 -2.6 -4.2 -4.7 -1.7 -1.4 -0.9 -1.0
CAD (% of GDP) % 106.6 7.8 51.6 62.0 67.8 89.3 48.8 90.0 55.5 75.5
Capital Account Balance US$ Bn 40.3 45.8 47.4 45.6 47.9 54.4 60.5 61.2 65.0 63.0
Dollar-Rupee (Average) 40.3 45.8 47.4 45.6 47.9 54.4 60.5 61.2 65.0 60.0
Source: RBI, CSO, CGA, Ministry of Agriculture, Ministry of commerce, Bloomberg, PhillipCapital India Research

133GROUND VIEW GROUND VIEW Annual Edition 2016 Annual Edition 2016132
Note
: For
ban
ks, E
BITD
A is
pre-
prov
ision
pro
fit
CMP
Mkt
Cap
Ne
t Sal
es (R
s mn)
EB
IDTA
(Rs
mn)
PAT (
Rs m
n)EP
S (R
s)
EPS
Grow
th (%
) P
/E (x
) P
/B (x
) EV
/EBI
TDA
(x)
ROE
(%)
ROCE
(%)
Nam
e of
com
pany
Sect
orRs
Rs m
nFY
16E
FY17
EFY
16E
FY17
EFY
16E
FY17
EFY
16E
FY17
EFY
16E
FY17
EFY
16E
FY17
EFY
16E
FY17
EFY
16E
FY17
EFY
16E
FY17
EFY
16E
FY17
E
Cham
bal F
ertil
isers
Agri
Inpu
ts 6
4 2
6,67
6 1
08,3
94
108
,409
8
,288
8
,476
3
,594
3
,697
9
9
3
5.9
2.9
7
.4
7.2
1
.1
1.0
6
.9
6.6
1
4.3
13.
3 6
.7
6.8
Tata
Che
mica
ls Lt
dAg
ri In
puts
428
1
08,9
34
185
,584
1
90,0
64
24,
173
25,
159
8,9
04
9,5
93
35
38
11.
3 7
.7
12.
2 1
1.4
1.8
1
.6
6.3
5
.6
14.
6 1
4.4
9.0
9
.5
Mon
sant
o In
dia
Agri
Inpu
ts 2
,286
3
9,46
9 6
,046
7
,487
1
,330
1
,623
1
,199
1
,474
6
9 8
5 1
2.3
23.
0 3
2.9
26.
8 1
0.5
10.
9 2
9.1
23.
8 3
1.8
40.
6 2
4.6
28.
0
PI In
dustr
ies
Agri
Inpu
ts 6
43
88,
152
22,
849
27,
361
4,4
77
5,3
55
2,8
71
3,6
37
21
27
16.
7 2
6.7
30.
6 2
4.1
7.7
6
.1
19.
4 1
5.8
25.
3 2
5.3
26.
1 2
6.0
Unite
d Ph
osph
orus
Agri
Inpu
ts 4
25
182
,221
1
33,7
99
147
,892
2
6,27
6 2
8,45
2 1
3,80
9 1
5,01
1 3
2 3
5 1
7.1
8.7
1
3.2
12.
1 2
.7
2.5
7
.7
6.5
2
1.8
21.
0 1
7.7
17.
0
Coro
man
del I
ntl
Agri
Inpu
ts 1
95
56,
700
112
,382
1
21,9
27
9,2
46
11,
408
4,9
80
6,5
21
17
22
22.
9 3
0.9
11.
4 8
.7
1.9
1
.7
7.1
5
.3
16.
7 1
9.2
17.
2 1
9.8
Kave
ri Se
eds
Agri
Inpu
ts 4
17
28,
806
9,5
77
11,
809
2,2
51
2,9
52
2,1
56
3,0
14
31
44
-28.
4 3
9.8
13.
3 9
.5
3.1
2
.5
11.
8 8
.6
23.
6 2
6.5
25.
1 2
8.5
Zuar
i Agr
oche
mica
lsAg
ri In
puts
157
6
,605
5
6,59
6 n
.a.
3,0
60
n.a
. 7
30
n.a
. 1
7 n
.a.
370
.6
n.a
. 9
.0
0.8
9
.2
8.5
-
7.5
-
Ralli
s Ind
iaAg
ri In
puts
186
3
6,10
3 2
0,42
3 2
3,01
6 3
,001
3
,636
1
,668
2
,088
9
1
1 6
.1
25.
2 2
1.7
17.
3 3
.9
3.4
1
2.5
10.
1 1
8.2
19.
8 1
6.6
18.
7
Deep
ak Fe
rtilis
ers
Agri
Inpu
ts 1
55
13,
628
33,
995
n.a
. 5
,176
n
.a.
2,6
10
n.a
. 3
0 n
.a.
13.
0 n
.a.
5.2
0
.8
3.5
1
5.2
- 1
1.6
-
Tata
Mot
ors
Auto
mob
iles
417
1
,352
,738
2
,601
,404
2
,788
,829
3
85,3
26
460
,176
1
17,8
11
159
,103
3
7 4
9 -1
6.3
35.
1 1
1.4
8.4
2
.0
1.6
5
.0
4.2
1
7.2
18.
8 8
.1
9.5
Hero
Mot
oCor
pAu
tom
obile
s 2
,678
5
34,8
43
283
,370
3
25,2
11
41,
714
48,
473
30,
162
34,
800
151
1
74
18.
7 1
5.4
17.
7 1
5.4
6.7
5
.6
12.
8 1
0.8
37.
9 3
6.5
37.
4 3
6.4
Mah
indr
a CIE
Auto
mob
iles
260
8
4,04
2 6
2,11
7 7
0,08
0 7
,685
9
,580
3
,414
4
,988
1
1 1
5 4
3.1
46.
1 2
4.6
16.
8 3
.7
3.1
1
2.4
9.4
1
5.2
18.
7 1
0.9
15.
1
Baja
j Aut
oAu
tom
obile
s 2
,465
7
13,1
88
230
,020
2
67,4
16
48,
248
56,
526
36,
576
41,
720
126
1
44
16.
0 1
4.1
19.
5 1
7.1
5.6
4
.7
14.
3 1
1.8
28.
7 2
7.5
26.
1 2
5.7
Apol
lo Ty
res
Auto
mob
iles
163
8
2,94
6 1
31,8
88
149
,178
2
0,24
5 2
3,49
6 1
0,85
7 1
3,01
3 2
1 2
6 7
.6
19.
9 7
.6
6.4
1
.3
1.1
4
.4
4.0
1
8.1
18.
5 1
5.4
15.
9
Mah
indr
a & M
ahin
dra
Auto
mob
iles
1,3
69
850
,213
3
89,9
90
443
,171
4
6,60
7 5
5,37
8 3
4,60
4 4
1,75
8 5
9 7
1 1
5.9
20.
7 2
3.4
19.
4 3
.7
3.3
1
8.3
15.
3 1
6.0
17.
0 1
3.9
15.
3
Bhar
at Fo
rge
Auto
mob
iles
848
1
97,3
63
89,
056
102
,437
1
7,16
0 1
9,99
6 9
,827
1
1,63
0 4
2 5
0 3
6.9
18.
3 2
0.1
17.
0 4
.7
3.8
1
2.6
10.
9 2
3.3
22.
7 1
8.7
21.
5
Asho
k Ley
land
Auto
mob
iles
93
265
,805
1
75,3
38
212
,276
1
9,07
7 2
3,82
5 8
,908
1
2,60
5 3
4
2
80.9
4
1.5
29.
8 2
1.1
4.6
3
.8
14.
5 1
1.1
15.
3 1
8.2
12.
7 1
5.8
Mar
uti S
uzuk
iAu
tom
obile
s 4
,556
1
,376
,337
5
65,9
51
677
,653
9
6,35
3 1
13,0
46
57,
789
70,
480
191
2
33
55.
7 2
2.0
23.
8 1
9.5
4.8
4
.0
13.
9 1
1.2
20.
2 2
0.4
20.
6 2
1.0
VA Te
ch W
abag
Capi
tal G
oods
708
3
8,59
8 2
8,05
9 3
3,31
5 2
,328
2
,943
1
,265
1
,655
2
3 3
0 1
3.2
30.
8 3
0.4
23.
2 3
.8
3.4
1
6.6
13.
3 1
2.7
14.
7 1
0.8
12.
3
BHEL
Capi
tal G
oods
175
4
29,4
31
271
,342
3
15,6
27
8,0
75
38,
855
7,5
95
25,
380
3
10
-46.
9 2
34.2
5
6.5
16.
9 1
.2
1.2
3
5.8
7.8
2
.2
6.9
1
.7
5.6
Cum
min
s Ind
iaCa
pita
l Goo
ds 1
,027
2
84,6
84
50,
080
60,
405
8,5
46
10,
948
7,8
54
9,7
19
28
35
28.
6 2
3.8
36.
2 2
9.3
8.9
8
.0
33.
2 2
5.8
24.
6 2
7.3
21.
7 2
4.1
Siem
ens
Capi
tal G
oods
1,2
27
437
,013
1
03,9
75
113
,400
7
,350
8
,987
5
,559
7
,961
1
6 2
2 5
6.6
43.
2 7
8.6
54.
9 9
.4
8.6
5
6.1
44.
9 1
1.9
15.
7 9
.6
12.
8
Engi
neer
s Ind
iaCa
pita
l Goo
ds 2
27
76,
518
17,
235
18,
548
1,9
38
3,1
83
2,9
10
3,9
04
9
12
-11.
9 3
4.2
26.
3 1
9.6
2.8
2
.6
26.
0 1
5.3
10.
5 1
3.1
10.
8 1
3.6
Lars
en &
Toub
roCa
pita
l Goo
ds 1
,365
1
,270
,968
1
,037
,731
1
,259
,213
1
23,9
53
168
,246
4
5,67
6 7
2,20
8 4
9 7
7 3
.4
58.
1 2
8.0
17.
7 2
.9
2.6
1
7.1
12.
8 1
0.4
14.
6 4
.8
6.5
Alsto
m T&
DCa
pita
l Goo
ds 4
90
125
,335
4
4,30
5 5
1,43
1 4
,241
6
,267
2
,130
3
,620
8
1
4 7
6.8
70.
0 5
8.8
34.
6 8
.8
7.7
2
9.8
19.
9 1
4.9
22.
3 1
5.5
22.
3
Phill
ipC
apita
l Ind
ia C
over
age
Uni
vers
e: V
alua
tio
n Su
mm
ary

135GROUND VIEW GROUND VIEW Annual Edition 2016 Annual Edition 2016134
Phill
ipC
apita
l Ind
ia C
over
age
Uni
vers
e: V
alua
tio
n Su
mm
ary
CMP
Mkt
Cap
Ne
t Sal
es (R
s mn)
EB
IDTA
(Rs
mn)
PAT (
Rs m
n)EP
S (R
s)
EPS
Grow
th (%
) P
/E (x
) P
/B (x
) EV
/EBI
TDA
(x)
ROE
(%)
ROCE
(%)
Nam
e of
com
pany
Sect
orRs
Rs m
nFY
16E
FY17
EFY
16E
FY17
EFY
16E
FY17
EFY
16E
FY17
EFY
16E
FY17
EFY
16E
FY17
EFY
16E
FY17
EFY
16E
FY17
EFY
16E
FY17
EFY
16E
FY17
E
KEC
Inte
rnat
iona
lCa
pita
l Goo
ds 1
56
40,
106
90,
852
104
,389
6
,970
8
,527
1
,546
2
,423
6
9
1
19.2
5
6.7
25.
9 1
6.6
2.7
2
.4
8.7
7
.1
10.
6 1
4.6
9.9
1
0.8
ABB
Indi
aCa
pita
l Goo
ds 1
,174
2
48,8
12
79,
105
84,
530
6,8
19
8,3
06
3,7
95
4,6
02
18
22
66.
1 2
1.3
65.
6 5
4.1
8.2
7
.5
36.
6 3
0.0
12.
5 1
3.9
12.
1 1
3.2
Crom
pton
Gre
aves
Capi
tal G
oods
195
1
21,9
96
140
,214
1
49,9
12
6,9
50
9,2
53
2,2
53
4,0
82
4
7
22.
4 8
1.2
54.
2 2
9.9
3.1
2
.8
20.
3 1
4.8
5.7
9
.5
4.8
7
.2
Alsto
m In
dia
Capi
tal G
oods
586
3
9,40
5 2
3,41
9 2
8,47
2 1
,687
2
,385
1
,569
2
,134
2
3 3
2 1
2.5
36.
0 2
5.1
18.
5 3
.6
3.2
1
8.3
12.
2 1
4.4
17.
3 1
5.3
18.
5
Ther
max
Capi
tal G
oods
864
1
02,8
91
56,
147
60,
313
5,1
22
5,1
59
2,7
63
3,2
79
23
28
39.
9 1
8.7
37.
2 3
1.4
4.4
4
.0
20.
2 1
9.7
11.
7 1
2.7
11.
2 1
1.9
Inox
Win
dCa
pita
l Goo
ds 3
63
80,
590
46,
134
57,
390
8,3
91
10,
822
6,0
16
7,2
84
27
33
127
.1
21.
1 1
3.4
11.
1 4
.3
3.3
1
0.2
7.8
3
2.5
30.
2 2
6.0
25.
8
Volta
sCa
pita
l Goo
ds 2
93
96,
800
53,
810
61,
877
4,0
40
5,3
69
3,2
81
4,3
64
10
13
-1.4
3
3.0
29.
5 2
2.2
4.1
3
.6
24.
4 1
8.2
14.
0 1
6.4
11.
8 1
3.9
Shre
e Ce
men
tCe
men
t
11,3
56
395
,598
6
0,80
3 8
8,59
1 1
4,34
0 2
5,23
4 5
,323
1
1,14
6 2
04
320
6
6.5
57.
1 5
5.7
35.
5 6
.9
5.9
2
6.9
14.
8 1
2.4
16.
7 1
1.8
17.
1
JK C
emen
tCe
men
t 6
86
47,
958
37,
856
45,
428
5,4
95
7,8
05
1,3
24
2,7
44
19
39
6.1
1
07.3
3
6.2
17.
5 2
.8
2.5
1
3.6
9.3
7
.7
14.
3 5
.7
8.1
Heid
elbe
rgCe
men
t Ce
men
t 7
6 1
7,13
2 1
8,81
6 2
0,35
2 2
,543
3
,252
6
84
1,2
57
3
6
n.a
. 8
3.7
25.
0 1
3.6
1.8
1
.6
10.
0 7
.1
7.3
1
1.8
5.6
7
.8
OCL I
ndia
Cem
ent
494
2
8,11
4 2
5,12
1 2
9,24
5 4
,144
5
,573
1
,878
3
,025
3
3 5
3 3
8.2
61.
0 1
5.0
9.3
2
.0
1.7
6
.8
4.6
1
3.5
18.
7 1
1.1
16.
5
Dalm
ia B
hara
t Ltd
Cem
ent
749
6
0,83
1 6
6,01
0 8
1,68
2 1
3,57
9 2
0,11
9 9
54
4,1
61
12
51
940
.7
336
.0
63.
7 1
4.6
1.3
1
.2
9.2
5
.9
2.1
8
.4
4.9
7
.6
Ambu
ja C
emen
tCe
men
t 2
01
311
,621
2
31,1
95
268
,414
3
4,63
4 4
7,12
0 1
6,53
6 2
1,85
7 8
1
1 -1
3.4
32.
2 2
4.1
18.
2 2
.1
2.0
8
.4
6.0
8
.8
11.
1 1
2.9
12.
5
Ultra
tech
Cem
ent
Cem
ent
2,8
64
785
,973
2
94,8
39
352
,072
5
5,91
0 7
3,16
8 2
8,83
4 4
0,67
7 1
05
148
3
7.4
41.
1 2
7.3
19.
3 3
.7
3.1
1
5.4
11.
2 1
3.4
16.
2 1
0.1
12.
9
Man
gala
m C
emen
tCe
men
t 2
04
5,4
39
8,4
61
9,6
55
513
1
,075
-1
87
220
-7
8
n
.a.
n.a
. -2
9.0
24.
7 1
.1
1.0
2
1.3
9.6
-3
.7
4.2
0
.9
4.6
ACC
Cem
ent
1,3
58
254
,939
1
26,6
98
146
,510
1
6,15
3 2
1,85
8 1
0,38
5 1
3,93
3 5
5 7
4 -1
0.6
34.
2 2
4.6
18.
3 3
.0
2.8
1
5.3
11.
3 1
2.1
15.
3 1
0.2
12.
9
Indi
a Cem
ent
Cem
ent
91
27,
830
58,
814
65,
319
8,2
24
9,9
26
966
2
,430
3
8
n
.a.
151
.7
28.
8 1
1.5
0.8
0
.7
6.8
5
.2
2.7
6
.0
4.6
6
.4
JK La
kshm
i Cem
ent
Cem
ent
357
4
1,98
5 2
7,01
1 3
4,30
0 5
,266
7
,079
1
,905
3
,244
1
6 2
8 5
.7
70.
3 2
2.0
12.
9 2
.7
2.3
1
1.4
7.9
1
2.2
18.
1 8
.4
11.
5
Have
lls In
dia L
tdEl
ectri
cals
295
1
84,0
97
59,
749
68,
906
8,4
20
9,7
83
5,5
47
6,5
48
9
10
19.
3 1
8.1
33.
2 2
8.1
6.8
5
.8
21.
2 1
8.0
20.
5 2
0.8
21.
2 2
1.7
Finol
ex C
able
s Ltd
Elec
trica
ls 2
51
38,
350
25,
743
30,
301
2,8
68
3,8
08
2,0
36
2,7
48
13
18
15.
6 3
5.0
18.
8 1
4.0
- -
12.
7 9
.0
14.
2 1
6.7
14.
0 1
6.6
VGua
rd In
dustr
ies L
tdEl
ectri
cals
924
2
7,73
8 2
0,23
4 2
4,13
2 1
,591
1
,969
8
87
1,1
43
30
38
25.
5 2
8.8
31.
2 -
- -
17.
7 1
4.0
19.
8 2
0.9
18.
8 2
0.3
Baja
j Ele
ctrica
ls Lt
dEl
ectri
cals
218
2
1,97
2 4
6,47
9 5
2,02
5 2
,579
3
,159
8
58
1,2
19
9
12
-714
.5
42.
1 2
5.6
18.
0 -
- 1
1.6
9.3
1
1.4
14.
2 9
.7
11.
4
Stat
e Ba
nk o
f Ind
iaFin
ancia
ls 2
50
1,9
42,2
47
799
,767
9
10,4
06
486
,649
5
19,9
16
187
,534
2
20,9
97
26
35
20.
6 3
5.2
9.8
7
.2
1.3
1
.1
4.0
3
.7
10.
6 1
1.0
0.7
1
.0
Cana
ra B
ank
Finan
cials
270
1
46,7
70
107
,311
1
38,6
54
80,
092
102
,497
2
9,99
4 4
5,15
5 5
1 7
3 -9
.8
42.
8 5
.3
3.7
0
.7
0.6
1
.8
1.4
1
0.2
14.
0 0
.5
1.0
Shrir
am Tr
ansp
ort F
inFin
ancia
ls 8
80
199
,759
4
8,51
3 5
6,13
6 3
5,54
3 4
1,75
6 1
3,69
3 1
7,14
9 6
0 7
6 1
0.6
25.
2 1
4.6
11.
6 8
8.0
88.
0 5
.6
4.8
1
4.0
15.
4 2
.1
2.3
Chol
a Inv
estm
ent
Finan
cials
642
1
00,2
68
20,
449
24,
415
12,
049
14,
975
5,3
04
7,3
37
34
47
12.
5 3
8.3
18.
8 1
3.6
2.7
2
.3
8.3
6
.7
15.
6 1
8.5
2.0
2
.4

135GROUND VIEW GROUND VIEW Annual Edition 2016 Annual Edition 2016134
CMP
Mkt
Cap
Ne
t Sal
es (R
s mn)
EB
IDTA
(Rs
mn)
PAT (
Rs m
n)EP
S (R
s)
EPS
Grow
th (%
) P
/E (x
) P
/B (x
) EV
/EBI
TDA
(x)
ROE
(%)
ROCE
(%)
Nam
e of
com
pany
Sect
orRs
Rs m
nFY
16E
FY17
EFY
16E
FY17
EFY
16E
FY17
EFY
16E
FY17
EFY
16E
FY17
EFY
16E
FY17
EFY
16E
FY17
EFY
16E
FY17
EFY
16E
FY17
EFY
16E
FY17
E
ICIC
I Ban
kFin
ancia
ls 2
74
1,5
91,0
63
215
,970
2
48,4
03
226
,725
2
53,4
43
123
,255
1
40,4
35
22
25
12.
1 1
6.1
12.
7 1
0.9
1.9
1
.7
7.0
6
.3
14.
5 1
4.9
1.8
2
.7
Bank
of B
arod
a Fin
ancia
ls 1
78
409
,104
1
44,3
25
164
,453
1
08,5
08
125
,258
4
2,84
7 5
6,73
8 1
9 2
5 2
6.1
30.
9 9
.2
7.0
1
.1
1.0
3
.8
3.3
1
0.3
11.
9 0
.6
0.9
Orie
ntal
Ban
k of
Finan
cials
155
4
6,49
2 5
4,73
6 6
2,81
1 4
3,46
9 4
8,68
6 9
,776
1
6,58
6 3
3 5
5 9
6.7
69.
7 4
.8
2.8
0
.4
0.4
1
.1
1.0
7
.1
10.
9 0
.4
0.9
HDFC
Lim
ited
Finan
cials
1,2
25
1,9
32,7
30
311
,386
3
53,6
56
100
,235
1
14,4
00
69,
114
79,
030
32
38
17.
4 -
38.
0 2
.1 5
.5
4.8
1
9.3
16.
9 2
1.0
21.
1 2
.6
2.6
Andh
ra B
ank
Finan
cials
69
45,
270
49,
573
55,
968
33,
634
37,
297
9,2
08
12,
407
14
19
31.
4 3
4.7
5.0
3
.7
0.6
0
.5
1.3
1
.2
9.2
1
1.2
0.5
0
.5
Bank
of I
ndia
Fin
ancia
ls 1
31
103
,424
1
26,9
64
146
,510
8
7,47
8 1
01,8
14
20,
151
31,
557
12
27
-53.
5 1
27.2
1
0.9
4.8
0
.7
0.6
1
.2
1.0
7
.1
10.
4 0
.3
0.4
Punj
ab N
atio
nal B
ank
Finan
cials
144
2
82,3
65
177
,394
2
04,4
70
124
,506
1
38,2
11
36,
739
48,
306
20
26
20.
0 3
1.5
7.3
5
.5
0.9
0
.8
2.3
2
.0
9.4
1
1.3
0.6
0
.7
Unio
n Ba
nk
Finan
cials
173
1
18,6
52
94,
970
107
,929
6
0,82
2 6
7,75
1 2
3,55
5 3
3,61
6 3
7 5
3 3
2.2
42.
7 4
.7
3.3
0
.7
0.6
2
.0
1.8
1
2.2
15.
6 0
.6
0.8
Mah
& M
ah Fi
nanc
eFin
ancia
ls 2
34
133
,176
3
4,01
1 3
7,69
8 2
2,54
8 2
5,01
6 8
,491
1
0,61
6 1
5 1
9 2
.1
25.
0 1
5.6
12.
4 2
.1
1.9
5
.9
5.3
1
4.2
15.
9 2
.4
2.7
Shrir
am C
ity U
nion
FiFin
ancia
ls 1
,730
1
14,0
19
23,
595
28,
070
15,
493
18,
486
7,0
95
8,6
60
108
1
31
27.
1 2
2.1
16.
1 1
3.2
2.5
2
.2
7.4
6
.2
16.
3 1
7.5
3.6
3
.7
AXIS
Ban
kFin
ancia
ls 4
62
1,0
97,7
59
163
,255
1
92,6
98
159
,084
1
81,8
27
85,
465
99,
622
36
41
15.
0 1
5.4
12.
9 1
1.2
2.2
1
.9
6.9
6
.0
17.
7 1
7.8
1.7
1
.7
Indi
an B
ank
Finan
cials
131
6
2,82
2 4
8,01
4 5
6,43
8 3
3,38
5 3
8,54
6 1
1,31
9 1
5,26
0 2
5 3
2 1
7.1
29.
3 5
.3
4.1
0
.6
0.5
1
.9
1.6
8
.6
10.
4 0
.6
1.0
SKS
Micr
ofina
nce
Finan
cials
456
5
7,82
7 1
2,31
4 1
9,12
7 3
,469
5
,699
2
,440
4
,119
1
9 3
3 3
0.5
68.
8 2
3.5
13.
9 4
.5
3.4
1
6.7
10.
1 2
0.9
27.
6 4
.0
4.2
HDFC
Ban
kFin
ancia
ls 1
,083
2
,729
,941
2
64,0
87
314
,568
2
12,0
48
252
,451
1
20,8
21
145
,211
4
8 5
8 1
8.3
20.
2 2
2.5
18.
7 3
.9
3.3
1
2.9
10.
8 1
8.2
19.
0 1
.9
2.9
LIC H
ousin
g Fin
ance
Finan
cials
485
2
44,9
38
124
,490
1
47,1
47
25,
186
29,
807
16,
280
19,
248
32
38
17.
4 1
8.2
15.
1 1
2.7
2.7
2
.3
9.7
8
.2
19.
2 1
9.4
1.3
1
.3
DCB
Bank
Finan
cials
84
23,
668
6,2
49
7,7
87
3,6
34
4,5
70
2,0
94
2,6
93
7
10
9.5
2
8.6
11.
2 8
.7
1.4
1
.3
6.5
5
.2
12.
8 1
4.3
1.2
1
.2
Indu
sind
Bank
Finan
cials
943
5
58,8
90
42,
485
53,
394
39,
631
48,
893
22,
094
27,
426
38
47
12.
3 2
4.1
24.
8 2
0.0
3.4
2
.9
14.
1 1
1.4
16.
1 1
4.9
1.8
3
.0
Corp
orat
ion
bank
Finan
cials
43
43,
104
46,
373
55,
993
34,
976
42,
505
10,
776
15,
844
12
22
-30.
4 8
1.2
3.6
2
.0
0.1
0
.1
1.2
1
.0
10.
0 1
3.6
0.4
0
.6
Indi
an O
vers
eas B
ank
Finan
cials
33
56,
964
73,
446
n.a
. 4
8,07
2 n
.a.
11,
896
n.a
. 8
n
.a.
72.
2 n
.a.
3.9
n
.a.
0.5
n
.a.
1.2
n
.a.
7.1
n
.a.
0.3
n
.a.
Emam
iFM
CG 9
47
214
,882
2
8,21
6 3
4,69
7 8
,172
1
0,34
1 5
,969
7
,585
2
6 3
3 3
3.9
27.
1 3
6.0
28.
3 1
4.3
11.
7 2
7.0
20.
9 3
9.8
41.
3 3
3.8
30.
5
Mar
ico In
dustr
ies
FMCG
424
2
73,8
07
63,
524
71,
981
10,
220
11,
694
6,6
98
7,7
09
10
12
16.
8 1
5.1
40.
9 3
5.5
12.
2 9
.9
26.
6 2
2.9
29.
9 2
8.0
27.
9 2
7.0
Brita
nnia
FMCG
2,9
71
356
,502
8
8,41
8 1
02,2
37
11,
765
14,
333
8,4
09
10,
274
70
86
55.
0 2
2.2
42.
4 3
4.7
19.
8 1
4.5
30.
3 2
4.3
46.
8 4
1.7
50.
1 4
4.9
Colg
ate
FMCG
975
2
65,2
95
42,
813
49,
624
9,7
31
11,
934
6,2
53
7,6
59
46
56
106
.7
22.
5 2
1.2
17.
3 1
5.7
14.
2 2
7.1
21.
9 7
4.2
81.
8 7
7.5
86.
1
ITCFM
CG 3
46
2,7
79,9
87
386
,541
4
25,3
03
142
,239
1
57,8
63
97,
143
108
,674
1
2 1
4 5
.8
11.
9 2
8.5
25.
5 7
.9
6.9
1
8.9
16.
8 2
7.9
27.
2 2
3.7
23.
8
Godr
ej C
onsu
mer
Pro
FMCG
1,2
54
426
,960
9
2,73
3 1
06,1
30
17,
029
19,
235
11,
709
13,
278
34
39
28.
7 1
3.4
36.
4 3
2.1
8.2
6
.9
25.
6 2
2.0
22.
6 2
1.6
17.
4 1
7.8
Nestl
eFM
CG 5
,879
5
66,8
42
81,
236
99,
957
16,
018
21,
369
10,
410
12,
236
108
1
27
-12.
2 1
7.5
54.
5 4
6.3
23.
3 2
2.2
34.
9 2
6.0
42.
8 4
8.0
39.
5 4
9.1
Phill
ipC
apita
l Ind
ia C
over
age
Uni
vers
e: V
alua
tio
n Su
mm
ary

137GROUND VIEW GROUND VIEW Annual Edition 2016 Annual Edition 2016136
CMP
Mkt
Cap
Ne
t Sal
es (R
s mn)
EB
IDTA
(Rs
mn)
PAT (
Rs m
n)EP
S (R
s)
EPS
Grow
th (%
) P
/E (x
) P
/B (x
) EV
/EBI
TDA
(x)
ROE
(%)
ROCE
(%)
Nam
e of
com
pany
Sect
orRs
Rs m
nFY
16E
FY17
EFY
16E
FY17
EFY
16E
FY17
EFY
16E
FY17
EFY
16E
FY17
EFY
16E
FY17
EFY
16E
FY17
EFY
16E
FY17
EFY
16E
FY17
EFY
16E
FY17
E
Hind
usta
n Un
ileve
rFM
CG 8
33
1,8
03,3
70
323
,169
3
60,8
87
67,
438
76,
155
43,
943
49,
716
20
23
14.
0 1
3.1
41.
1 3
6.3
47.
4 4
5.5
26.
3 2
3.2
115
.2
125
.1
116
.9
127
.9
Asia
n Pa
ints
FMCG
845
8
10,1
38
158
,237
1
90,3
30
28,
120
35,
717
17,
753
22,
383
19
23
28.
1 2
6.1
45.
6 3
6.2
13.
9 1
1.6
28.
1 2
2.0
30.
4 3
2.2
31.
6 3
3.6
Baja
j Cor
pFM
CG 4
37
64,
502
9,3
85
11,
089
2,8
10
3,2
94
2,5
79
2,9
51
17
20
15.
3 1
4.4
25.
0 2
1.9
11.
9 1
0.5
22.
2 1
8.7
47.
7 4
8.2
40.
5 4
8.0
Apco
tex I
ndus
tries
FMCG
264
5
,468
4
,823
5
,918
6
47
875
3
78
515
3
6 4
9 5
3.5
36.
2 7
.3
5.3
2
.1
1.6
8
.1
5.8
2
9.2
30.
8 2
8.0
30.
0
Jubi
lant
Food
work
sFM
CG 1
,521
9
9,94
9 2
4,76
5 3
0,51
2 2
,982
4
,057
1
,245
1
,785
1
9 2
7 1
.0
43.
4 7
9.9
55.
7 1
2.5
10.
2 3
3.6
24.
6 1
5.6
18.
3 1
6.3
19.
5
Agro
Tech
Food
sFM
CG 5
73
13,
959
7,8
71
8,3
14
688
8
30
379
4
61
16
19
1.3
2
1.9
36.
9 3
0.3
4.0
3
.6
20.
4 1
6.5
10.
9 1
1.9
10.
6 1
1.7
Glax
o Sm
ithkl
ine
Cons
FMCG
5,9
95
252
,119
4
5,36
5 5
2,03
0 6
,359
5
,161
6
,558
6
,558
1
56
156
1
0.1
-0.0
3
8.4
38.
4 1
0.7
9.8
3
6.1
43.
2 2
7.8
25.
5 2
8.8
26.
5
Dabu
r Ind
ia Lt
dFM
CG 2
79
489
,921
8
8,38
0 1
01,9
67
17,
042
20,
291
13,
731
16,
058
8
9
28.
8 1
6.9
35.
6 3
0.5
11.
8 9
.7
28.
6 2
3.6
33.
1 3
1.9
30.
5 3
0.1
Adan
i Por
ts &
SEZ
Infra
struc
ture
263
5
45,1
78
70,
310
86,
162
47,
201
58,
344
26,
419
36,
357
13
18
14.
0 3
7.6
20.
6 1
5.0
4.1
3
.3
15.
1 1
2.1
20.
1 2
2.0
12.
0 1
3.7
Asho
ka B
uild
con
Infra
struc
ture
189
3
5,31
4 2
7,84
2 3
4,68
5 8
,368
1
1,27
0 1
,187
1
,693
6
9
2
3.5
42.
7 2
9.8
20.
9 1
.8
1.7
8
.7
6.5
6
.0
8.0
4
.8
6.6
NCC
Infra
struc
ture
77
42,
974
82,
975
87,
126
7,2
60
8,0
59
2,6
25
3,5
18
5
6
134
.8
34.
0 1
6.4
12.
2 1
.2
1.1
8
.5
7.3
7
.6
9.2
1
0.2
10.
8
J Kum
ar In
frapr
ojec
tsIn
frastr
uctu
re 7
47
28,
263
17,
058
22,
176
3,1
56
4,1
03
1,3
39
1,9
28
42
60
41.
9 4
4.0
18.
0 1
2.5
2.7
2
.3
10.
3 7
.9
15.
8 1
9.6
12.
9 1
5.3
GMR
Infra
struc
ture
Infra
struc
ture
16
99,
291
82,
858
81,
594
30,
672
26,
976
-27,
502
-29,
342
-5
-5
-12.
8 6
.7
-3.3
-3
.1
1.4
2
.5
17.
3 1
9.1
-41.
9 -8
0.9
0.2
-0
.8
GVK
Powe
rIn
frastr
uctu
re 9
1
4,13
4 2
9,88
5 4
8,60
5 1
8,89
7 2
8,26
4 -6
,809
-3
,136
-4
-2
3
3.8
-53.
9 -2
.1
-4.5
0
.9
1.0
1
2.9
8.5
-4
5.7
-21.
7 1
.2
3.4
KNR
Cons
tructi
onIn
frastr
uctu
re 6
05
17,
022
10,
076
12,
594
1,5
11
1,8
89
1,1
60
1,1
24
41
40
58.
9 -3
.1
14.
7 1
5.1
2.5
2
.2
11.
4 9
.2
18.
5 1
5.3
17.
4 1
4.6
MBL
Infra
struc
ture
s Ltd
In
frastr
uctu
re 2
19
9,0
74
21,
433
24,
648
2,3
58
2,7
11
705
7
83
17
19
-56.
0 1
1.1
12.
9 1
1.6
1.3
1
.2
7.0
6
.8
10.
4 1
0.5
9.9
9
.9
ITD C
emen
tatio
n In
frastr
uctu
re 1
00
15,
446
36,
304
41,
750
3,0
86
3,9
66
1,0
16
1,5
32
7
10
764
.9
50.
8 1
5.2
10.
1 2
.6
2.1
7
.7
6.1
1
7.1
20.
5 1
4.0
15.
8
PNC
Infra
tech
Ltd
Infra
struc
ture
540
2
7,69
1 1
8,73
2 2
2,47
8 2
,529
3
,035
1
,259
1
,638
2
5 3
2 -2
.6
30.
0 2
2.0
16.
9 2
.2
1.9
1
1.1
9.6
1
2.7
12.
2 1
1.8
11.
7
IRB
Infra
struc
ture
Infra
struc
ture
250
8
7,88
0 5
1,64
7 5
5,98
5 2
8,58
6 3
1,80
5 5
,031
6
,425
1
4 1
8 -7
.3
27.
7 1
7.5
13.
7 1
.7
1.4
7
.9
7.6
9
.7
10.
4 3
.4
3.6
HCL T
echn
olog
ies
IT Se
rvice
s 8
78
1,2
35,4
96
435
,467
5
03,7
92
98,
727
117
,813
7
7,60
3 9
3,53
9 5
5 6
6 6
.9
20.
7 1
6.0
13.
2 4
.3
3.6
1
2.5
10.
5 2
6.9
27.
0 2
7.3
28.
3
Min
dtre
e Lt
dIT
Serv
ices
1,4
85
124
,527
4
3,95
5 5
1,06
8 8
,239
1
0,02
5 5
,981
7
,301
7
1 8
7 1
1.3
22.
1 2
0.8
17.
0 5
.1
4.1
1
4.6
11.
5 2
4.5
24.
3 2
6.4
26.
4
Pers
isten
t Sys
tem
sIT
Serv
ices
668
5
3,42
4 2
1,72
8 2
4,84
5 4
,348
4
,997
3
,124
3
,646
3
9 4
6 7
.5
16.
7 1
7.1
14.
7 3
.2
2.8
1
1.9
10.
2 1
9.0
19.
0 1
8.2
18.
5
Tech
Mah
indr
aIT
Serv
ices
542
5
24,0
43
272
,238
3
22,1
12
43,
994
56,
779
29,
027
37,
010
30
38
19.
0 2
7.5
18.
0 1
4.1
3.3
2
.8
11.
4 8
.5
18.
5 1
9.8
19.
0 2
0.7
Wip
roIT
Serv
ices
582
1
,437
,521
5
20,9
90
576
,884
1
10,6
60
117
,652
9
0,21
1 9
8,75
1 3
7 4
0 4
.5
9.5
1
5.9
14.
5 3
.2
2.8
1
2.2
11.
3 2
0.2
19.
3 2
0.0
19.
6
KPIT
Tech
nolo
gies
IT Se
rvice
s 1
60
31,
537
32,
149
35,
749
3,0
50
4,3
70
1,8
95
2,7
75
10
15
-20.
0 4
6.4
15.
9 1
0.8
2.0
1
.7
10.
7 7
.5
12.
8 1
6.0
11.
0 1
4.3
Info
sys T
echn
olog
ies
IT Se
rvice
s 1
,079
2
,478
,403
6
11,6
31
695
,923
1
67,7
54
198
,009
1
33,0
50
156
,204
5
8 6
8 7
.9
17.
4 1
8.5
15.
8 4
.4
3.9
1
2.7
10.
5 2
3.9
24.
7 2
4.1
26.
3
Phill
ipC
apita
l Ind
ia C
over
age
Uni
vers
e: V
alua
tio
n Su
mm
ary

137GROUND VIEW GROUND VIEW Annual Edition 2016 Annual Edition 2016136
CMP
Mkt
Cap
Ne
t Sal
es (R
s mn)
EB
IDTA
(Rs
mn)
PAT (
Rs m
n)EP
S (R
s)
EPS
Grow
th (%
) P
/E (x
) P
/B (x
) EV
/EBI
TDA
(x)
ROE
(%)
ROCE
(%)
Nam
e of
com
pany
Sect
orRs
Rs m
nFY
16E
FY17
EFY
16E
FY17
EFY
16E
FY17
EFY
16E
FY17
EFY
16E
FY17
EFY
16E
FY17
EFY
16E
FY17
EFY
16E
FY17
EFY
16E
FY17
EFY
16E
FY17
E
NIIT
Tech
nolo
gies
IT Se
rvice
s 5
82
35,
538
27,
314
30,
378
4,5
70
4,9
67
2,6
45
2,9
88
44
49
132
.1
13.
0 1
3.3
11.
8 2
.3
2.0
7
.6
6.6
1
7.0
16.
8 1
7.1
16.
3
Tata
Con
sulta
ncy
IT Se
rvice
s 2
,362
4
,653
,954
1
,078
,809
1
,248
,401
3
01,2
18
330
,985
2
40,1
33
271
,170
1
23
138
2
2.2
12.
9 1
9.3
17.
1 7
.0
5.7
1
5.3
13.
8 3
6.3
33.
7 3
8.5
35.
5
Allca
rgo
Logi
stics
Logi
stics
375
4
7,40
2 6
3,63
4 7
2,95
3 5
,762
7
,150
2
,966
3
,772
2
4 3
0 2
3.7
27.
2 1
5.9
12.
5 2
.2
1.9
8
.6
6.5
1
3.7
15.
2 1
1.7
13.
4
Cont
aine
r Cor
p Of
Indi
aLo
gisti
cs 1
,420
2
76,9
12
62,
622
75,
809
13,
568
17,
531
10,
772
13,
696
55
70
2.8
2
7.1
25.
7 2
0.2
3.2
2
.9
18.
5 1
4.1
12.
6 1
4.3
12.
5 1
4.4
VRL L
ogist
ics Lt
d Lo
gisti
cs 4
37
39,
896
18,
632
21,
013
3,1
34
3,6
53
1,2
66
1,6
13
14
18
44.
6 2
7.4
31.
5 2
4.7
- -
13.
9 1
1.6
28.
4 2
8.6
16.
9 1
9.0
Jagr
an P
raka
shan
Med
ia 1
53
50,
148
20,
844
22,
253
5,7
61
6,3
07
2,8
12
3,2
11
9
10
22.
4 1
4.2
17.
3 1
5.2
3.1
2
.7
9.1
7
.8
17.
7 1
7.7
15.
3 1
4.0
Dish
TVM
edia
108
1
14,8
38
31,
773
36,
769
10,
074
12,
179
2,5
72
4,2
75
2
4
- 6
6.2
44.
6 2
6.8
-219
.7
30.
6 1
2.3
9.9
-4
92.5
1
13.9
5
9.1
60.
9
HT M
edia
Med
ia 8
3 1
9,30
6 2
4,77
5 2
7,42
3 3
,318
3
,820
2
,262
2
,626
1
0 1
1 2
5.8
16.
1 8
.5
7.4
0
.9
0.8
5
.9
4.4
1
0.2
10.
4 1
1.0
11.
4
Zee
Ente
rtain
men
tM
edia
414
3
98,0
58
56,
763
66,
309
14,
740
19,
196
9,2
93
12,
199
10
13
-4.9
3
1.3
42.
8 3
2.6
7.3
6
.6
26.
0 1
9.7
17.
2 2
0.3
19.
5 2
2.1
Hind
usta
n M
edia
Vent
Med
ia 2
89
21,
218
9,1
12
10,
147
2,1
90
2,6
28
1,6
84
2,0
70
23
28
19.
7 2
3.0
12.
6 1
0.2
2.4
1
.9
9.3
7
.1
18.
8 1
8.9
21.
3 2
1.4
DB C
orp
Limite
dM
edia
328
6
0,33
2 2
1,14
1 2
3,84
1 6
,217
7
,330
3
,524
4
,507
1
9 2
5 1
1.4
27.
9 1
7.1
13.
4 4
.1
3.6
9
.6
7.8
2
4.2
27.
0 2
1.4
24.
4
Eros
Inte
rnat
iona
lM
edia
228
2
1,37
0 1
8,24
7 2
0,03
5 4
,447
5
,265
3
,190
3
,694
3
4 4
0 2
9.1
15.
8 6
.7
5.8
1
.2
1.0
5
.5
4.5
1
7.8
17.
3 1
3.9
14.
0
Tata
Ste
elM
etal
s 2
38
230
,712
1
,282
,941
1
,298
,247
8
3,58
2 1
19,7
23
14,
344
12,
626
15
13
- -1
2.0
16.
1 1
8.3
0.7
0
.7
11.
7 8
.0
4.4
3
.9
2.8
3
.0
JSW
Ste
elM
etal
s 9
44
228
,125
4
76,1
43
548
,441
9
5,71
4 1
13,2
39
21,
707
31,
951
90
132
1
7.7
47.
2 1
0.5
7.1
0
.9
0.8
6
.2
4.9
9
.0
11.
8 6
.3
7.6
SAIL
Met
als
47
192
,875
3
84,0
33
414
,077
-1
5,67
1 -1
1,32
9 -2
6,85
9 -3
0,53
8 -7
-7
-2
23.2
1
3.7
-7.2
-6
.3
0.5
0
.5
-32.
4 -4
9.0
-6.6
-8
.1
-1.8
-1
.9
Veda
nta L
tdM
etal
s 9
4 2
79,1
26
751
,388
8
54,9
34
214
,326
2
34,9
72
66,
334
88,
469
18
24
-18.
4 3
3.4
5.3
4
.0
0.5
0
.5
4.8
4
.2
9.5
1
1.6
7.5
8
.6
Hind
usta
n Zi
ncM
etal
s 1
47
620
,699
1
55,9
76
164
,820
7
3,24
3 8
1,72
9 7
6,77
0 8
5,03
8 1
8 2
0 -6
.2
10.
8 8
.1
7.3
1
.3
1.1
3
.6
2.5
1
5.8
15.
6 1
5.4
15.
2
NALC
O M
etal
s 4
1 1
04,3
78
64,
366
66,
746
7,5
34
7,8
64
6,4
67
6,8
31
3
3
-68.
6 5
.6
16.
1 1
5.3
0.8
0
.8
7.3
8
.4
5.0
5
.2
4.5
4
.7
Jinda
l Ste
el &
Pow
erM
etal
s 9
5 8
7,19
0 2
05,6
64
230
,731
4
1,47
7 5
1,15
9 -1
8,14
8 -1
0,75
7 -2
0 -1
2 -3
86.5
-4
0.7
-4.8
-8
.1
0.4
0
.4
11.
9 9
.4
-8.6
-5
.4
3.2
1
.3
Hind
alco
Inds
Met
als
80
164
,270
1
,060
,066
1
,104
,039
9
7,20
1 1
14,5
85
10,
857
23,
009
5
11
-61.
1 1
11.9
1
5.1
7.1
0
.4
0.4
7
.4
6.0
2
.8
5.6
3
.7
4.7
Praj
Inds
.M
idca
p 8
5 1
5,07
7 1
0,83
3 1
3,92
0 1
,128
1
,803
6
96
1,1
50
4
6
52.
5 6
5.1
21.
6 1
3.1
2.3
2
.2
12.
3 7
.4
10.
8 1
6.5
8.9
1
3.9
Sint
ex In
dustr
ies
Mid
cap
104
4
6,35
2 8
3,57
7 1
04,8
60
14,
451
18,
165
6,0
21
8,5
72
14
19
9.4
4
2.4
7.7
5
.4
0.9
0
.8
6.5
4
.8
11.
5 1
4.2
7.8
9
.2
Penn
ar In
ds.
Mid
cap
57
6,8
30
15,
098
19,
470
1,5
93
2,2
35
517
8
35
4
7
44.
0 6
1.6
13.
2 8
.2
1.5
1
.3
4.8
3
.5
11.
0 1
5.6
15.
7 1
9.1
The
Byke
Hos
pita
lity
Mid
cap
166
6
,636
2
,137
2
,761
4
49
580
2
41
329
6
8
2
0.3
36.
7 2
7.5
20.
2 -
- 1
4.7
11.
2 2
0.6
23.
0 1
9.3
22.
5
Petro
net L
NGOi
l & G
as 2
38
178
,800
2
87,8
04
368
,036
1
5,93
7 1
8,78
2 8
,186
1
0,41
7 1
1 1
4 -7
.2
27.
2 2
1.8
17.
2 2
.9
2.6
1
2.7
10.
5 1
3.1
14.
9 9
.8
11.
1
Cairn
Indi
aOi
l & G
as 1
37
257
,231
1
23,0
92
124
,761
6
4,94
0 6
3,38
2 3
8,97
4 3
4,06
2 2
1 1
8 -3
6.9
-12.
6 6
.6
7.6
0
.4
0.4
3
.2
3.0
6
.5
5.7
5
.9
5.1
Phill
ipC
apita
l Ind
ia C
over
age
Uni
vers
e: V
alua
tio
n Su
mm
ary

139GROUND VIEW GROUND VIEW Annual Edition 2016 Annual Edition 2016138
CMP
Mkt
Cap
Ne
t Sal
es (R
s mn)
EB
IDTA
(Rs
mn)
PAT (
Rs m
n)EP
S (R
s)
EPS
Grow
th (%
) P
/E (x
) P
/B (x
) EV
/EBI
TDA
(x)
ROE
(%)
ROCE
(%)
Nam
e of
com
pany
Sect
orRs
Rs m
nFY
16E
FY17
EFY
16E
FY17
EFY
16E
FY17
EFY
16E
FY17
EFY
16E
FY17
EFY
16E
FY17
EFY
16E
FY17
EFY
16E
FY17
EFY
16E
FY17
EFY
16E
FY17
E
ONGC
Oil &
Gas
236
2
,015
,673
1
,575
,249
1
,847
,063
6
30,0
97
712
,597
2
77,1
27
333
,773
3
2 3
9 2
2.3
20.
4 7
.3
6.0
1
.0
0.9
3
.6
3.1
1
3.6
14.
6 1
1.7
12.
8
Oil I
ndia
Oil &
Gas
388
2
33,4
21
119
,237
1
27,2
43
58,
603
63,
358
37,
321
40,
308
62
67
39.
0 8
.0
6.3
5
.8
0.9
0
.9
3.6
3
.2
15.
2 1
4.9
11.
1 1
1.2
Guja
rat S
tate
Pet
rone
tOi
l & G
as 1
36
76,
708
12,
888
13,
563
11,
501
12,
093
5,7
46
5,9
73
10
11
24.
0 3
.9
13.
3 1
2.8
1.8
1
.7
6.8
6
.0
13.
8 1
2.9
11.
4 1
0.8
Indr
apra
stha G
asOi
l & G
as 4
80
67,
228
43,
984
48,
003
8,7
80
9,5
19
4,6
90
5,1
80
34
37
7.4
1
0.4
14.
3 1
3.0
2.8
2
.8
7.3
6
.7
21.
0 2
1.7
15.
7 1
6.3
GAIL
Oil &
Gas
359
4
55,1
30
583
,930
6
34,9
89
57,
593
70,
621
34,
491
43,
749
27
34
8.7
2
6.8
13.
2 1
0.4
1.5
1
.3
9.3
6
.9
11.
0 1
2.9
7.8
9
.3
Berg
er P
aint
sPa
ints
220
1
52,5
65
54,
368
n.a
. 6
,498
n
.a.
3,8
68
n.a
. 1
1 n
.a.
22.
0 n
.a.
19.
7 -
4.7
-
24.
0 -
23.
7 -
20.
8 -
Sun
Phar
ma
Phar
ma
729
1
,754
,894
2
79,4
49
325
,013
8
2,62
9 1
11,5
25
50,
227
72,
648
21
30
5.1
4
4.6
34.
9 2
4.2
6.0
4
.9
20.
5 1
4.8
17.
1 2
0.2
14.
0 1
7.3
Divi'
s Lab
orat
orie
sPh
arm
a 1
,136
3
01,5
32
37,
597
44,
330
14,
287
17,
067
10,
542
12,
606
40
47
22.
3 1
9.6
28.
6 2
3.9
7.1
5
.8
21.
2 1
7.5
24.
9 2
4.4
- -
Dr R
eddy
's La
bs.
Phar
ma
3,2
11
547
,511
1
57,5
90
164
,892
3
9,24
0 4
1,22
3 2
5,44
2 2
6,33
3 1
49
155
1
1.5
3.5
2
1.5
20.
8 4
.1
3.4
1
4.4
13.
4 1
8.9
16.
5 1
2.8
11.
9
Glen
mar
k Pha
rma
Phar
ma
983
2
77,4
86
81,
046
96,
561
18,
240
22,
890
10,
366
13,
905
37
49
33.
6 3
4.1
26.
8 2
0.0
5.6
4
.5
16.
0 1
2.4
21.
1 2
2.3
15.
0 1
7.3
Ipca
Labo
rato
ries
Phar
ma
786
9
9,13
3 3
0,29
5 4
0,88
4 4
,851
9
,675
1
,795
5
,460
1
4 4
4 -3
2.9
204
.2
54.
8 1
8.0
4.1
3
.4
21.
8 1
0.9
7.5
1
9.1
7.2
1
5.9
Lupi
nPh
arm
a 1
,812
8
15,9
16
14,
169
17,
805
3,1
60
4,0
60
2,0
05
2,5
20
25
31
57.
5 2
5.7
72.
6 5
7.7
11.
3 9
.5
258
.5
201
.2
16.
0 1
6.9
- -
Bioc
onPh
arm
a 4
67
93,
460
33,
866
39,
517
8,1
33
9,8
18
4,8
24
5,7
51
24
29
17.
1 1
9.2
19.
4 1
6.2
2.3
2
.1
10.
7 8
.7
12.
1 1
2.9
11.
3 -
Cadi
la H
ealth
care
Phar
ma
401
4
10,5
72
98,
900
113
,024
2
1,85
9 2
5,83
4 1
4,64
4 1
7,89
0 7
2 8
7 2
4.2
22.
2 5
.6
4.6
1
.5
1.2
1
9.4
16.
1 2
6.8
25.
5 1
9.3
20.
8
Cipl
a Ltd
Ph
arm
a 6
49
520
,854
1
4,16
9 1
7,80
5 3
,160
4
,060
2
,005
2
,520
2
5 3
1 5
7.5
25.
7 2
6.0
20.
7 4
.0
3.4
1
65.1
1
28.5
1
6.0
16.
9 -
-
Auro
bind
o Ph
arm
aPh
arm
a 8
27
482
,705
1
46,0
65
161
,473
3
3,88
7 3
9,39
9 2
0,87
7 2
4,71
4 3
6 4
2 2
7.1
18.
4 2
3.0
19.
5 6
.7
5.0
1
5.5
13.
0 2
8.9
25.
9 2
5.4
26.
9
Titan
Com
pany
Reta
il 3
78
335
,494
1
35,0
27
160
,918
1
2,96
3 1
6,09
2 9
,151
1
1,68
8 1
0 1
3 1
2.1
27.
7 3
6.7
28.
7 9
.0
7.3
2
5.2
19.
3 2
6.8
28.
1 2
7.7
30.
0
Bhar
ti In
frate
lTe
leco
m 3
91
741
,502
8
0,09
9 8
7,24
4 5
6,48
3 6
3,55
5 2
3,15
5 2
7,39
0 1
2 1
5 1
6.3
18.
3 3
1.9
27.
0 4
.5
4.7
1
3.2
11.
6 1
4.1
17.
3 1
0.7
12.
3
Idea
Cel
lula
rTe
leco
m 1
42
511
,145
3
62,3
21
412
,443
1
32,3
03
158
,472
3
6,19
5 3
0,55
6 1
0 8
1
3.4
-15.
6 1
4.1
16.
7 1
.9
1.7
7
.1
5.6
1
3.6
10.
4 7
.9
7.3
Bhar
ti Ai
rtel
Tele
com
323
1
,290
,161
9
76,6
64
1,0
93,4
93
336
,030
3
91,3
96
54,
294
79,
359
14
20
-10.
1 4
6.2
23.
8 1
6.3
1.9
1
.6
7.3
6
.0
7.8
9
.9
5.6
6
.4
Tata
Com
mun
icatio
nsTe
leco
m 4
26
121
,325
2
10,2
25
223
,566
3
3,94
8 3
7,00
7 1
,600
2
,857
6
1
0 5
0.3
78.
5 7
5.8
42.
5 2
0.4
17.
4 5
.9
5.3
2
6.9
41.
0 4
.8
5.9
Relia
nce
Com
mTe
leco
m 7
7 1
91,7
76
234
,448
n
.a.
82,
810
n.a
. 1
4,14
3 n
.a.
7
n.a
. 4
7.7
n.a
. 1
1.2
- 0
.5
- 6
.0
- 4
.8
- 4
.2
-
Coal
Indi
aUt
ilitie
s 3
42
2,1
57,3
54
778
,233
8
92,3
25
168
,777
2
11,1
80
146
,811
1
71,7
91
23
27
7.0
1
7.0
14.
7 1
2.6
4.7
4
.0
9.6
7
.2
31.
7 3
2.2
33.
5 3
4.2
NTPC
Utili
ties
133
1
,093
,761
7
77,7
30
838
,834
1
69,1
55
192
,050
8
8,48
2 9
5,76
6 1
1 1
2 -0
.3
8.2
1
2.4
11.
4 1
.3
1.2
1
1.4
10.
7 1
0.2
10.
5 6
.2
6.0
Powe
r Grid
Cor
pUt
ilitie
s 1
36
711
,496
2
06,3
78
247
,701
1
81,2
34
218
,786
6
2,46
0 7
3,24
9 1
2 1
4 2
4.3
17.
3 1
1.4
9.7
1
.7
1.5
9
.7
8.5
1
5.4
16.
0 6
.1
6.5
PTC
Indi
aUt
ilitie
s 6
6 1
9,47
7 1
36,5
21
168
,447
1
0,82
8 1
3,16
6 3
,228
3
,758
1
1 1
3 -9
.3
16.
4 6
.0
5.2
0
.6
0.5
7
.3
7.0
9
.8
10.
5 7
.9
8.1
Note
: For
ban
ks, E
BITD
A is
pre-
prov
ision
pro
fit
Phill
ipC
apita
l Ind
ia C
over
age
Uni
vers
e: V
alua
tio
n Su
mm
ary
139GROUND VIEW GROUND VIEW Annual Edition 2016 Annual Edition 2016138
Disclosures and Disclaimers
PhillipCapital (India) Pvt. Ltd. has three independent equity research groups: Institutional Equities, Institutional Equity Derivatives and Private Client Group. This report has been prepared by Institutional Equities Group. The views and opinions expressed in this document may or may not match or may be contrary at times with the views, estimates, rating, target price of the other equity research groups of PhillipCapital (India) Pvt. Ltd.
This report is issued by PhillipCapital (India) Pvt. Ltd. which is regulated by SEBI. PhillipCapital (India) Pvt. Ltd. is a subsidiary of Phillip (Mauritius) Pvt. Ltd. References to "PCIPL" in this report shall mean PhillipCapital (India) Pvt. Ltd unless otherwise stated. This report is prepared and distributed by PCIPL for information purposes only and neither the information contained herein nor any opinion expressed should be construed or deemed to be construed as solicitation or as offering advice for the purposes of the purchase or sale of any security, investment or derivatives. The information and opinions contained in the Report were considered by PCIPL to be valid when published. The report also contains information provided to PCIPL by third parties. The source of such information will usually be disclosed in the report. Whilst PCIPL has taken all reasonable steps to ensure that this information is correct, PCIPL does not offer any warranty as to the accuracy or complete-ness of such information. Any person placing reliance on the report to undertake trading does so entirely at his or her own risk and PCIPL does not accept any liability as a result. Securities and Derivatives markets may be subject to rapid and unexpected price movements and past performance is not necessarily an indication to future performance.
This report does not have regard to the specific investment objec-tives, financial situation and the particular needs of any specific person who may receive this report. Investors must undertake independent analysis with their own legal, tax and financial advisors and reach their own regarding the appropriateness of investing in any securities or investment strategies discussed or recommended in this report and should understand that statements regarding future prospects may not be realized. In no circumstances it be used or considered as an offer to sell or a solicitation of any offer to buy or sell the Securities mentioned in it. The information contained in the research reports may have been taken from trade and statistical services and other sources, which we believe are reliable. PhillipCapital (India) Pvt. Ltd. or any of its group/associate/affiliate companies do not guarantee that such information is accurate or complete and it should not be relied upon as such. Any opinions expressed reflect judgments at this date and are subject to change without notice
Important: These disclosures and disclaimers must be read in conjunction with the research report of which it forms part. Receipt and use of the research report is subject to all aspects of these disclosures and disclaimers. Additional information about the issuers and securities discussed in this research report is available on request.
Certifications: The research analyst(s) who prepared this research report hereby certifies that the views expressed in this research report accurately reflect the research analyst’s personal views about all of the subject issuers and/or securities, that the analyst have no known conflict of interest and no part of the research analyst’s compensation was, is or will be, directly or indirectly, related to the specific views or recommen-dations contained in this research report. The Research Analyst certifies that he /she or his / her family members does not own the stock(s) covered in this research report.
Independence: PhillipCapital (India) Pvt. Ltd. has not had an investment banking relationship with, and has not received any compensation for investment banking services from, the subject issuers in the past twelve (12) months, and PhillipCapital (India) Pvt. Ltd does not anticipate receiving or intend to seek compensation for investment banking services from the subject issuers in the next three (3) months.
PhillipCapital (India) Pvt. Ltd is not a market maker in the securities mentioned in this research report, although it or its affiliates may hold either long or short positions in such securities. PhillipCapital (India) Pvt. Ltd does not hold more than 1% of the shares of the company(ies) covered in this report.
Suitability and Risks: This research report is for informational purposes only and is not tailored to the specific investment objectives, financial situation or particular requirements of any individual recipient hereof. Certain securities may give rise to substantial risks and may not be suitable for certain investors. Each investor must make its own deter-mination as to the appropriateness of any securities referred to in this research report based upon the legal, tax and accounting considerations applicable to such investor and its own investment objectives or strate-gy, its financial situation and its investing experience. The value of any security may be positively or adversely affected by changes in foreign exchange or interest rates, as well as by other financial, economic or political factors. Past performance is not necessarily indicative of future performance or results.
Sources, Completeness and Accuracy: The material herein is based upon information obtained from sources that PCIPL and the research analyst believe to be reliable, but neither PCIPL nor the research analyst represents or guarantees that the information contained herein is accurate or complete and it should not be relied upon as such. Opinions expressed herein are current opinions as of the date appearing on this material and are subject to change without notice. Furthermore, PCIPL is under no obligation to update or keep the information current.
Copyright: The copyright in this research report belongs exclusively to PCIPL. All rights are reserved. Any unauthorized use or disclosure is prohibited. No reprinting or reproduction, in whole or in part, is permit-ted without the PCIPL’s prior consent, except that a recipient may reprint it for internal circulation only and only if it is reprinted in its entirety.
Caution: Risk of loss in trading in can be substantial. You should carefully consider whether trading is appropriate for you in light of your experience, objectives, financial resources and other relevant circumstances.
For U.S. persons only: This research report is a product of Phillip-Capital (India) Pvt Ltd. which is the employer of the research analyst(s) who has prepared the research report. The research analyst(s) preparing the research report is/are resident outside the United States (U.S.) and are not associated persons of any U.S. regulated broker-dealer and therefore the analyst(s) is/are not subject to supervision by a U.S. broker-dealer, and is/are not required to satisfy the regulatory licensing requirements of FINRA or required to otherwise comply with U.S. rules or regulations regarding, among other things, communications with a subject company, public appearances and trading securities held by a research analyst account.
This report is intended for distribution by PhillipCapital (India) Pvt Ltd. only to "Major Institutional Investors" as defined by Rule 15a-6(b)(4) of the U.S. Securities andExchange Act, 1934 (the Exchange Act) and interpretations thereof by U.S. Securities and Exchange Commission (SEC) in reliance on Rule 15a 6(a)(2). If the recipient of this report is not a Major Institutional Investor as specified above, then it should not act upon this report and return the same to the sender. Further, this report may not be copied, duplicated and/or transmitted onward to any U.S. person, which is not the Major Institutional Investor.
In reliance on the exemption from registration provided by Rule 15a-6 of the Exchange Act and interpretations thereof by the SEC in order to conduct certain business with Major Institutional Investors, PhillipCapi-tal (India) Pvt Ltd. has entered into an agreement with a U.S. registered broker-dealer, Marco Polo Securities Inc. ("Marco Polo").Transactions in securities discussed in this research report should be effected through Marco Polo or another U.S. registered broker dealer

PBGROUND VIEW GROUND VIEW Annual Edition 2016 Annual Edition 2016140
inh
ou
sed
esi
gn
.co
.in