debugging: locating and correcting faults and bugs dr. pedro mejia alvarez cinvestav-ipn
TRANSCRIPT

Debugging:
Locating and correcting faults and bugs
Dr. Pedro Mejia AlvarezCINVESTAV-IPN
What You Won’t Learn
how to solve all your problems the one true way to avoid all bugs Many platform specific debugging techniques

Avoiding bugs in the first place Coding style: use clear, consistent style and useful
naming standards. Document everything, from architecture and interface
specification documents to comments on code lines. Hold code reviews. Program defensively. Use/implement exception handling liberally; think
constantly about anomalous conditions. Be suspicious of cut/paste. Consider using an integrated development environment
(IDE) with dynamic syntax checking

Code reviews Primary programmer(s) for some piece of code presents and
explains that code, line by line. Audience of programmers experienced in language, code’s general
domain. Audience may also contain designers, testers, customers and others less versed in code but concerned with quality and consistency.
Review is a dialogue: audience pushes presenters to reevaluate and rationalize their implementation decisions.
Extremely useful: reviews often turn up outright errors, inconsistencies, inefficiencies and unconsidered exceptional conditions.
Also useful in familiarizing a project team with a member’s code.

Debugging
Debugging is a black art. Some things to go over, though, so they’ll be concrete in our brains:– relation to testing– why debugging is hard– types of bugs– process– techniques– tools– avoiding bugs

Debugging and testing
Testing and debugging go together like peas in a pod:– Testing finds errors; debugging localizes and repairs them.– Together these form the “testing/debugging cycle”: we test,
then debug, then repeat.– Any debugging should be followed by a reapplication of all
relevant tests, particularly regression tests. This avoids (reduces) the introduction of new bugs when debugging.
– Testing and debugging need not be done by the same people (and often should not be).

Why debugging is hard
There may be no obvious relationship between the external manifestation(s) of an error and its internal cause(s).
Symptom and cause may be in remote parts of the program. Changes (new features, bug fixes) in program may mask (or
modify) bugs. Symptom may be due to human mistake or misunderstanding
that is difficult to trace. Bug may be triggered by rare or difficult to reproduce input
sequence, program timing (threads) or other external causes. Bug may depend on other software/system state, things others
did to you systems weeks/months ago.

when you write code think about how you are going to test/debug it- lack of thought always translates into bugs
write test cases when you write your code if something should be true assert() it create functions to help visualize your data design for testing/debugging from the start test early, test often test at abstraction boundaries
Designing for Debug/Test

many bugs only happen in the uncommon case make this case more common having switches
that cause routines to fail- file open, file write, memory allocation, are all good
candidates
- Have “test drivers” which test with the uncommon data. If deeply buried, test with a debugger script
Fault Injection

Finding and Fixing Bugs
in order to create quality software you need to find your bugs- testing
- user reports
the best bugs are those that are always reproducible

Types of bugs Types of bugs (gotta love em):
– Compile time: syntax, spelling, static type mismatch.• Usually caught with compiler
– Design: flawed algorithm.• Incorrect outputs
– Program logic (if/else, loop termination, select case, etc).• Incorrect outputs
– Memory nonsense: null pointers, array bounds, bad types, leaks.• Runtime exceptions
– Interface errors between modules, threads, programs (in particular, with shared resources: sockets, files, memory, etc).
• Runtime Exceptions
– Off-nominal conditions: failure of some part of software of underlying machinery (network, etc).
• Incomplete functionality
– Deadlocks: multiple processes fighting for a resource.• Freeze ups, never ending processes

The ideal debugging process A debugging algorithm for software engineers:
– Identify test case(s) that reliably show existence of fault (when possible)
– Isolate problem to small fragment(s) of program– Correlate incorrect behavior with program logic/code error– Change the program (and check for other parts of program
where same or similar program logic may also occur)– Regression test to verify that the error has really been
removed - without inserting new errors– Update documentation when appropriate
(Not all these steps need be done by the same person!)

General Advice
try to understand as much of what is happening as possible
“it compiles” is NOT the same as “it works” when in doubt, ask. Then test the answer! Error messages are generally just a vague hint
and can be misleading. Don’t always trust the “comments/documents”,
they can be out-of-date.
What is a Debugger?
“A software tool that is used to detect the source of program or script errors, by performing step-by-step execution of application code and viewing the content of code variables.”
-MSDN

What is a Debugger? (con't)
A debugger is not an IDE– Though the two can be integrated, they are separate
entities.
A debugger loads in a program (compiled executable, or interpreted source code) and allows the user to trace through the execution.
Debuggers typically can do disassembly, stack traces, expression watches, and more.

Why use a Debugger?
No need for precognition of what the error might be.
Flexible– Allows for “live” error checking – no need to re-write
and re-compile when you realize a certain type of error may be occuring
– Dynamic
– Can view the entire relevant scope

Why people don’t use a Debugger?
With simple errors, may not want to bother with starting up the debugger environment.– Obvious error
– Simple to check using prints/asserts
Hard-to-use debugger environment Error occurs in optimized code Changes execution of program (error doesn’t
occur while running debugger)

Ways NOT to Debug Guess at what’s causing it Don’t try to understand what’s causing it Fix the symptom instead of the cause
– Special case code Blame it on someone else’s code
– Only after extensive testing/proof Blame it on the compiler/computer
– Yes, it happens, but almost never is this the real cause

Debugging techniques, 1
Execution tracing– running the program
– trace utilities
– single stepping in debugger
– hand simulation

Debugging techniques, 2
Interface checking– check procedure parameter number/type (if not enforced
by compiler) and value– defensive programming: check inputs/results from other
modules– documents assumptions about caller/callee relationships in
modules, communication protocols, etc Assertions: include range constraints or other
information with data. Skipping code: comment out suspect code, then
check if error remains.
Other Functions of a Debugger
Disassembly (in context and with live data!) Execution Tracing/Stack tracing Symbol watches

Disassembly
Most basic form of debugging Translating machine code into assembly
instructions that are more easily understood by the user.
Typically implementable as a simple lookup table No higher-level information (variable names, etc.) Relatively easy to implement.

Execution Tracing
Follows the program through the execution. Users can step through line-by-line, or use breakpoints.
Typically allows for “watches” on – registers, memory locations, symbols
Allows for tracing up the stack of runtime errors (back traces)
Allows user to trace the causes of unexpected behavior and fix them

Symbol Information
Problem – a compiler/assembler translates variable names and other symbols into internally consistent memory addresses
How does a debugger know which location is denoted by a particular symbol?
We need a “debug” executable.

Debug vs. Release Builds
Debug builds usually are not optimized Debug executables contain:
– program's symbol tables
– location of the source file
– line number tags for assembly instructions.
GCC/GDB allows debugging of optimized code.

Bug hunting with print• Weak form of debugging, but still common
• How bug hunting with print can be made more useful:– print variables other than just those you think
suspect.– print valuable statements (not just “hi\n”).– use exit() to concentrate on a part of a program.– move print through a through program to track
down a bug.

Debugging with print (continued)
• Building debugging with print into a program (more common/valuable):– print messages, variables/test results in useful places
throughout program.– use a ‘debug’ or ‘debug_level’ global flag to turn
debugging messages on or off, or change “levels”– possibly use a source file preprocessor (#ifdef) to
insert/remove debug statements.– Often part of “regression testing” so automated scripts can
test output of many things at once.

Finding Reproducible Bugs
a bug happens when there is a mismatch between what you (someone) think is happening and what is actually happening
confirm things you believe are true narrow down the causes one by one make sure you understand your program state keep a log of events and assumptions

Finding Reproducible Bugs
try explaining what should be happing- Verbalization/writing often clarifies muddled thoughts
have a friend do a quick sanity check don’t randomly change things, your actions
should have a purpose. – If you are not willing to check it into CVS with a log
that your boss may read, then you are not ready to make that change to the code.
– Think it through first, both locally and globally.

(semi) irreproducible bugs
sometimes undesired behavior only happens sporadically
tracking down these heisenbugs is hard the error could be a any level
- Circuits (e.g. bad ram chip at high memory address)
- compiler
- os
- Linker
- Irreproducible external “data” and timing

Finding HeisenBugs
Use good tools like Purify. Most common “Heisenbugs” are memory or thread related.
try to make the bug reproducible by switching platforms/libraries/compilers
insert checks for invariants and have the program stop everything when one is violated
verify each layer with small, simple tests find the smallest system which demonstrates the bug Test with “canned data”, replayed over net if needed.

Timing and Threading Bugs
ensure the functionality works for a single thread if adding a printf() removes the bug it is almost
certainly a timing/threading bug or a trashed memory bug
try using coarse grained locking to narrow down the objects involved
try keeping an event (transaction) log

Memory Bugs and Buffer Overflow
Trashing stack/heap causes often difficult to find bugs. Manifestation can be far from actual bug.
– “Free list” information generally stored just after a “malloced” chunck of data. Overwriting may not cause problem until data is “freed”, or until something else does a malloc after the free.
– Stack variables, overwriting past end, changes other variables, sometimes return address. (Buffer overflow)
– Bad “string” ops notorious, using input data can also be problematic.

An example….void myinit(int startindex, int startvalue, int length, int* vect){
int i;for(i=startindex; i< startindex+length; i++) *vect++ = startvalue++;
}
void whattheheck(){ printf("How did I ever get here????\n"); exit(2); }
int main(int argc, char**argv){
float d;int a,b[10],c, i, start,end;if(argc != 3) {printf("Usage:%s start, end\n",argv[0]);exit(-1); } start=atoi(argv[1]); end=atoi(argv[2]); /* bad style but shorter */ a=0; c=0; d=3.14159; /* bad style but shorter */ printf("Initally a %d, c %d, d %f, start %d, end %d\n",a,c,d, start,end); myinit(start,start,end,b+start); printf("finally a %d, c %d, d %f start %d, end %d \n",a,c,d, start, end); if(end>10) b[end-1]=134513723; return 0;
}

An Approach to Debugging
1. Stabilize the error2. Locate the source3. Fix the defect4. Test the fix5. Look for similar errors
Goal: Figure out why it occurs and fix it completely

1. Stabilize the Error Find a simple test case to reliably produce the
error– Narrow it to as simple a case as possible
Some errors resist this– Failure to initialize
– Pointer problems
– Timing issues

1. Stabilizing the Error Converge on the actual (limited) error
– Bad: “It crashes when I enter data”
– Better: “It crashes when I enter data in non-sorted order”
– Best: “It crashes when I enter something that needs to be first in sorted order”
Create hypothesis for cause– Then test hypothesis to see if it’s accurate

2. Locate the Source This is where good code design helps Again, hypothesize where things are going wrong
in code itself– Then, test to see if there are errors coming in there
– Simple test cases make it easier to check

When it’s Tough to Find Source
Create multiple test cases that cause same error– But, from different “directions”
Refine existing test cases to simpler ones Try to find source that encompasses all errors
– Could be multiple ones, but less likely Brainstorm for sources, and keep list to check Talk to others Take a break

Finding Error Locations Process of elimination
– Identify cases that work/failed hypotheses
– Narrow the regions of code you need to check
– Use unit tests to verify smaller sections
Process of expansion:– Be suspicious of:
• areas that previously had errors
• code that changed recently
– Expand from suspicious areas of code

Alternative to Finding Specific Source
Brute Force Debugging– “Guaranteed” to find bug
– Examples:• Rewrite code from scratch
• Automated test suite
• Full design/code review
• Fully output step-by-step status
Don’t spend more time trying to do a “quick” debug than it would take to brute-force it.

3. Fix the Defect Make sure you understand the problem
– Don’t fix only the symptom (e.g. no magic “subtract one here” fixes)
Understand what’s happening in the program, not just the place the error occurred– Understand interactions and dependencies
Save the original code– Be able to “back out” of change
Fixing the Code Change only code that you have a good reason to
change– Don’t just try things till they work
Make one change at a time

4. Check Your Fix After making the change, check that it works on
test cases that caused errors Then, make sure it still works on other cases
– Regression test
– Add the error case to the test suite

5. Look for Similar Errors
There’s a good chance similar errors occurred in other parts of program
Before moving on, think about rest of program– Similar routines, functions, copied code
– Fix those areas immediately

46
Debugging: Finding and Fixing Errors
Material for this lecture has been taken from Code Complete by Steve McConnell
47
What is Debugging?
Debugging is the process of identifying the cause of an error and correcting it.
Debugging is not a way to improve software quality. You should view debugging as a last resort - you should
be trying to develop programming habits that greatly reduce the need to find errors.
If you spend the time observing and analyzing the errors that you do make then maybe you can discover ways to avoid making those errors in the future.
48
Errors as Opportunities
Learn about the program you're working on.– Is the origin of the defect in the requirements,
specifications, design or implementation?
Learn about the kind of mistakes you make.– Can one debugging experience help to eliminate future
defects of a similar nature?

49
Errors as Opportunities
Learn about the quality of your code from the point of view of someone who has to read it.– The ability to read programs is not a well developed skill in
most programmers.– The result of this inability is also the inability to write readable
code. Learn about how you solve problems.
– Taking the time to observe and analyze how you debug can decrease the total amount of time that it takes you the next time you develop a program.

50
Errors as Opportunities
Learn about how you fix errors.– You should strive to make systematic corrections.
– This demands an accurate diagnosis of the problem and an appropriate prescription that attacks the root cause of the defect.
51
The Devil's Guide to Debugging
Find the error by guessing.– Scatter print statements randomly throughout the code.– If the print statements do not reveal the error, start making
changes until something appears to work.– Do not save the original version of the code and do not keep a
record of the changes that have been made. Debugging by superstition
– Why blame yourself when you can blame the computer, the operating system, the compiler, the data, other programmers (especially those ones who write library routines!), and best of all, the stupid users!

52
The Devil's Guide to Debugging
Don't waste time trying to understand the problem.– Why spend an hour analyzing the problem (in your head and
on paper) and evaluating possible solutions or methodologies when you can spend days trying to debug your code?
Fix the error with the most obvious fix.– For example, why try to understand why a particular case is
not handled by a supposedly general subroutine when you can make a quick fix?

53
The Scientific Method of Debugging
Gather data through repeatable experiments.– Stabilize the error, narrowing possible explanations.
Form a hypothesis that accounts for as much of the relevant data as possible.– Locate what seems to be the source of the error.

54
The Scientific Method of Debugging
Design another experiment to prove or disprove the hypothesis.– Fix the error according to hypothesis, then test the fix.
Repeat as needed.– Look for similar errors.

55
Tips for Finding Errors
Use all the data available to make your hypothesis.
Refine the test cases that produce the error.– Reproducing the error several ways helps to diagnose
the cause of the error.
– Errors often arise from a combination of factors; one test case is often not enough to find the root of the problem.

56
Tips for Finding Errors
Generate more data to generate more hypotheses.– Run more test cases to help in hypothesis development
and refinement. Use the results of negative tests.
– Negative results can eliminate parts of your search space.
– You have gained more knowledge about the program and the problem.

57
Tips for Finding Errors
Brainstorm for possible hypotheses.– Do not limit yourself to just one hypothesis; generate
several.
– Do not limit the problem solvers to just yourself; other people can bring a new perspective and experience to your problem.
– Concentration on a single line of reasoning can result in a mental logjam.

58
Tips for Finding Errors
Narrow the suspicious region of code.– Systematically eliminate parts of your program to isolate the
part that contains the defect.
– Yet another argument for modularization!
Be suspicious of modules that have had errors before.– Re-examine error-prone modules.
Check code that has recently been changed.– Compare the old and new versions of your code.

59
Tips for Finding Errors
Expand the suspicious region of the code.– Do not focus on a narrow piece of the system, even if you are
sure that the error must be in that particular section.
Integrate incrementally.– Add pieces to the system, one at a time.
– After each addition, test the system to detect errors.
– If there are errors, you know the area to focus on!
60
Tips for Finding Errors
Set a maximum time limit for quick and dirty debugging.– If you cannot find the error within your time limit,
then it has to be admitted that the error is a hard one and a quick and dirty fix is probably not appropriate.
Check for common errors.– Use code-quality checklists to stimulate your thinking
about possible errors.
61
Tips for Finding Errors
Talk to someone else about the problem.– Confessional debugging can help even by just forcing you to
organize your thoughts about the problem in a way that someone else can understand. This process may in fact be enough for you to arrive at the solution yourself without any input from others.
Take a break from the problem.– The subconscious can be a great problem solver and, of course,
food, sleep and sunlight are necessary for sustaining life functions.
– If you have debugging anxiety, stop and take a break.

62
Syntax Errors
Do not trust the line numbers in compiler messages.
Never completely trust any software tool; always understand the tool -- the more you know about software tool x, the more use it can be.
Do not trust compiler messages; particularly second messages.

63
Syntax Errors
Divide and conquer.– Separate out parts of the code and run it through the
compiler to isolate the syntax error and/or get a more reasonable error message from the compiler.
Study and understand the syntax errors peculiar to the programming language that you are using.

64
Fixing an Error
Understand the problem before you fix it. Understand the program, not just the problem.
– A study done with short programs found that programmers who achieve a global understanding of program behaviour have a better chance of modifying it successfully than programmers who focus on local behaviour, learning about the program only as they need to.
– A large program may not be understood in total, but the code in the vicinity (a few hundred lines) of the error should be understood.

65
Fixing an Error
Confirm the error diagnosis. Relax -- Never debug standing up. Save the original code.
– It is easy to forget which change in a group of changes is the most significant.
– It is always useful to be able to compare the old and new versions of code to verify all changes.
Remember that defect corrections have more than a 50 percent chance of being wrong the first time.
66
Fixing an Error
Fix the problem, not the symptom.– If you do not understand the problem, then you are not
fixing the code -- you are fixing the symptom and could be making the code worse.
– Problems with this approach include:• The fixes will not work most of the time.• The system will become unmaintainable.
– Too many special cases becomes unmanagable.
• It is a misuse of computers -- understanding the problem involves the programmer not the computer.

67
Fixing an Error
Change the code only for good reasons. Make one change at a time. Check your fix -- do regression testing. Look for similar errors.
– If you cannot figure out how to look for similar errors, then you probably do not completely understand the problem.

Bug Identification & Elimination
1 Bug reports should contain a test case, output, and the version number of the software.
2 Reproduce the bug using the same version the customer used.3 Find the root cause of the bug.4 Check if the bug still occurs with the latest version. If it does,
fix it.5 If it doesn’t, make sure it is not just masked by other changes to
the software.6 Add test cases used to reproduce the bug to the regression test
suite.7 Keep Records!

Debugging Techniques
methodology is key knowing about lots of debugging tools helps the most critical tool in your arsenal is your brain second most important tool is a debugger
– Core dumps are your friends.. Learn how to use them.
Memory debugging tools third most important Profiler fourth
Debugging Pointer and Dynamic Data Structure Problems
Pointers and explicitly allocated dynamic data structures are a central feature in many popular procedural and object-oriented languages
– Great power - especially in extreme cases (eg C/C++)
– Can be very painful to debug

Common Pointer Problems
Pointer to bogus memory Corrupt data structure segments Data sharing errors Accessing data elements of the wrong type Attempting to use memory areas after freeing
them

Pointers to Bogus Memory
Uninitialized pointers Failing to check memory allocation errors Using stomped pointers corrupted by previous memory
operations Reminder: Bogus memory access does not necessarily
trigger a memory protection fault Remedy: Add data type info to dynamic data structures Special Case: Indices above/below array space Remedy: index checks

Corrupt Data Structure Segments
Incorrect Adds/Deletes in trees/lists/etc. Stomped pointer values from previous memory
operations Remedy 1: Add type info to dynamic data structures Remedy 2: Create routines to check integrity of data
structures Remedy 3: Flag deleted memory areas

Data Sharing Errors
Often share data between logically separate program entities
Problem 1: Bogus pointer handoff Problem 2: Incorrect data format assumptions Problem 3: Multiple ownership issues Remedy 1: Type info in dynamic data Remedy 2: Owner count in memory areas Remedy 3: Flag deleted data structures Remedy 4: Think through synchronization problems in
the design stage

Accessing Elements of Wrong Type
Access data element of type x, but think you are accessing one of type y
Can be a source of frequent headaches depending on application/implementation
Remedy: Include type info in memory allocations

Accessing Data After Freeing It
Can be a source of many headaches Remedy 1: Include freed flag in memory (not a
guaranteed solution Remedy 2: Create list of “freed” memory, but do not
deallocate it. Check list when dereferencing pointers (very expensive in both time and space)
Big Brother Problem: Accessing data structure after adding it to a “free” list for quick future reuse
Remedy: Remedy 1 plus a use counter (also not a guaranteed solution)

Final Pointer Comments
Pointers are powerful, but are often a major source of program errors
Adding extra state and data structure walk routines can be a big help in debugging (degrades performance/increases memory footprint, but can be removed in release)

Debugging Multitasking Programs
Multiple process/multi-threaded code ubiquitous in modern programs
Many debuggers will work with these programs, but it is not always elegant or easy.
Fallback method: Put new processes to sleep and then attach a debugger to them before they awake.
Better solution: Read debugger documentation, find better one if it is weak in this area.

A Few Tips
Pointers and multithreading together can be extremely difficult to debug
Try to debug parts by themselves before tackling combined system
Analogous strategies to those used in pointer debugging can be a big help
Thread/process timing an important concern in the debugging process

Core Dumps
(Unix) If you run your code outside of the debugger and there is a fault a core file may be generated (depending on your system settings) where the current program state is stored.
Can debug your code post-mortem via: gdb executable-file core-file

Debug Prompts
Windows does not use core files. If you run your code outside of a debugger and a
problem occurs you will be given the option of either debugging the code or killing the executing process.

Abort Signal (Unix)
You can use the abort signal to help determine the cause of your problem
SIGBUS: Likely a dereference of a NULL pointer
SIGSEGV: Likely a dereference of a bogus pointer, an invalid write to code space, or a bad branch to data space
SIGFPE: Division by zero

Blame the Compiler
Sometimes software crashes in debugged code but not in optimized code
The tendency is to blame the compiler and de-optimize the file or function where the bug occurred
Most often the problem is in the code and is just exposed by the optimizer, typically an uninitialized global variable
Of course, sometimes it really is an optimizer bug. In that case, please submit a bug report to the compiler vendor with a nice short test program

Memory Leaks
Memory bugs– Memory corruption: dangling refs, buffer overflows
– Memory leaks• Lost objects: unreachable but not freed
• Useless objects: reachable but not used again

Memory Leaks
Memory bugs– Memory corruption: dangling refs, buffer overflows
– Memory leaks• Lost objects: unreachable but not freed
• Useless objects: reachable but not used again
Managed Languages
80% of new software in Java or C# by 2010 [Gartner] (personally TB does not believe it..) Type safety & GC eliminate many bugs
Memory Leaks
Memory bugs– Memory corruption: dangling refs, buffer overflows
– Memory leaks• Lost objects: unreachable but not freed
• Useless objects: “reachable” but not used again
Managed Languages
80% of new software in Java or C# by 2010 [Gartner] Type safety & GC eliminate many bugs
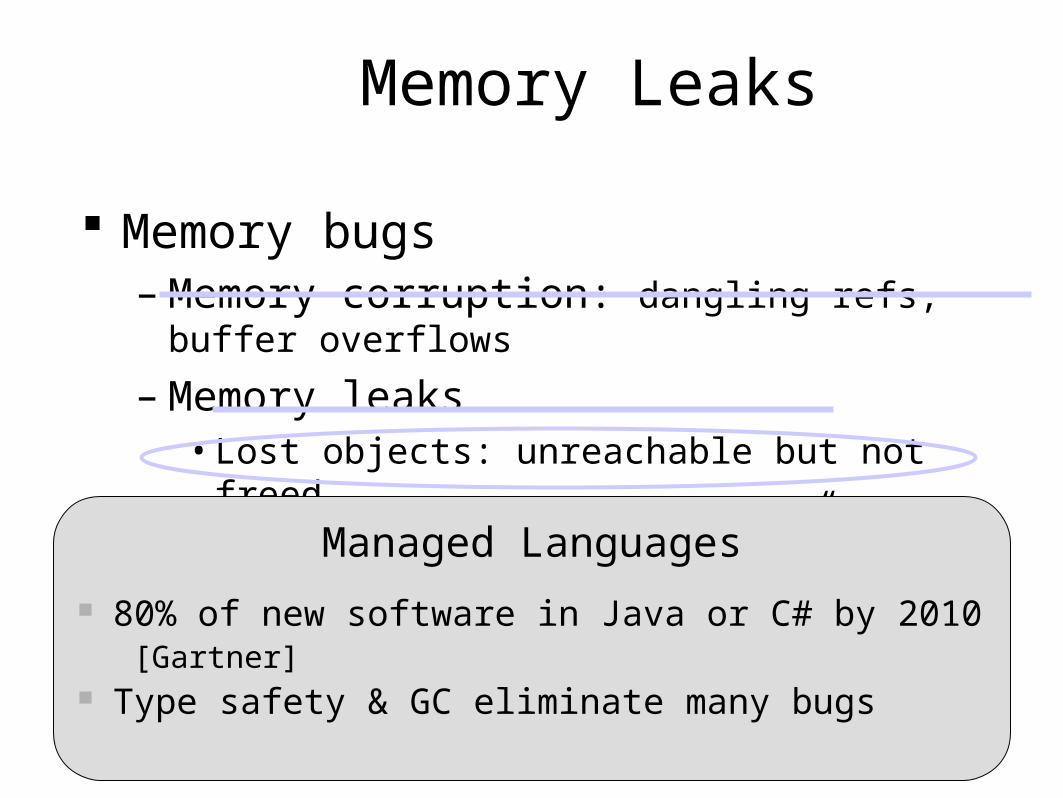
Memory Leaks
Memory bugs– Memory corruption: dangling refs, buffer overflows
– Memory leaks• Lost objects: unreachable but not freed
• Useless objects: reachable but not used again
Managed Languages
80% of new software in Java or C# by 2010 [Gartner] Type safety & GC eliminate many bugs
Leaks occur in practice in managed languages [Cork, JRockit, JProbe, LeakBot, .NET Memory Profiler]

War Stories

Nasty Problems
overwriting return address on the stack overwriting virtual function tables compiler bugs - rare but my students and
I have a talent for finding them- try -O, -O2, -Os
wrong version of a shared library gets loaded- make the runtime linker be verbose

Nasty Problems
Difference in MS “debug/development” stacks vs performance/runtime stacks
OS / library bugs- create small examples
- verify preconditions
- check that postconditions fail
static initialization problems with C++ Processor bugs

some fun (simple) bugs– In java (or whatever):
public void foo(int p, int q) {int x = p;int y = p;
}
– In perl:$foo = $cgi->param(‘foo’);if (!$foo) {webDie (“missing parameter foo!”);
}
– In C:char *glue(char *left, char sep, char *right) {char *buf = malloc(sizeof(char) *
(strlen(left) + 1 strlen(right)));sprintf(buf, “%s%c%s”, left, sep, right);return buf;
}

Tricks
write a custom assert() stub routines on which to break dump to a file instead of standard out make rand() deterministic by controlling the seed fight memory corruption with tools that use
sentinels, etc. (and if no tools do it yourself)

The Future of Debugging
better debuggers and programs to help you visualize your programs state
simple model checkers programs keep getting bigger, finding bugs is
going to get harder! Parallel/distributed debuggers as we move to
more parallel/distributed systems.