debugging a program with dbx - oracle · 2011-01-25 · 6 debugging a program with dbx • november...
TRANSCRIPT

Sun Microsystems, Inc.www.sun.com
Submit comments about this document at: http://www.sun.com/hwdocs/feedback
Debugging a Program With dbx
Sun™ Studio 11
Part No 819-3683-10November 2005, Revision A

Copyright © 2005 Sun Microsystems, Inc., 4150 Network Circle, Santa Clara, California 95054, U.S.A. All rights reserved.
U.S. Government Rights - Commercial software. Government users are subject to the Sun Microsystems, Inc. standard license agreement andapplicable provisions of the FAR and its supplements. Use is subject to license terms.
This distribution may include materials developed by third parties.
Parts of the product may be derived from Berkeley BSD systems, licensed from the University of California. UNIX is a registered trademark inthe U.S. and in other countries, exclusively licensed through X/Open Company, Ltd.
Sun, Sun Microsystems, the Sun logo, Java, and JavaHelp are trademarks or registered trademarks of Sun Microsystems, Inc. in the U.S. andother countries.All SPARC trademarks are used under license and are trademarks or registered trademarks of SPARC International, Inc. in theU.S. and other countries. Products bearing SPARC trademarks are based upon architecture developed by Sun Microsystems, Inc.
This product is covered and controlled by U.S. Export Control laws and may be subject to the export or import laws in other countries. Nuclear,missile, chemical biological weapons or nuclear maritime end uses or end users, whether direct or indirect, are strictly prohibited. Export orreexport to countries subject to U.S. embargo or to entities identified on U.S. export exclusion lists, including, but not limited to, the deniedpersons and specially designated nationals lists is strictly prohibited.
DOCUMENTATION IS PROVIDED "AS IS" AND ALL EXPRESS OR IMPLIED CONDITIONS, REPRESENTATIONS AND WARRANTIES,INCLUDING ANY IMPLIED WARRANTY OF MERCHANTABILITY, FITNESS FOR A PARTICULAR PURPOSE OR NON-INFRINGEMENT,ARE DISCLAIMED, EXCEPT TO THE EXTENT THAT SUCH DISCLAIMERS ARE HELD TO BE LEGALLY INVALID.
Copyright © 2005 Sun Microsystems, Inc., 4150 Network Circle, Santa Clara, California 95054, Etats-Unis. Tous droits réservés.
L’utilisation est soumise aux termes de la Licence.
Cette distribution peut comprendre des composants développés par des tierces parties.
Des parties de ce produit pourront être dérivées des systèmes Berkeley BSD licenciés par l’Université de Californie. UNIX est une marquedéposée aux Etats-Unis et dans d’autres pays et licenciée exclusivement par X/Open Company, Ltd.
Sun, Sun Microsystems, le logo Sun, Java, et JavaHelp sont des marques de fabrique ou des marques déposées de Sun Microsystems, Inc. auxEtats-Unis et dans d’autres pays.Toutes les marques SPARC sont utilisées sous licence et sont des marques de fabrique ou des marques déposéesde SPARC International, Inc. aux Etats-Unis et dans d’autres pays. Les produits portant les marques SPARC sont basés sur une architecturedéveloppée par Sun Microsystems, Inc.
Ce produit est soumis à la législation américaine en matière de contrôle des exportations et peut être soumis à la règlementation en vigueurdans d’autres pays dans le domaine des exportations et importations. Les utilisations, ou utilisateurs finaux, pour des armes nucléaires,desmissiles, des armes biologiques et chimiques ou du nucléaire maritime, directement ou indirectement, sont strictement interdites. Lesexportations ou réexportations vers les pays sous embargo américain, ou vers des entités figurant sur les listes d’exclusion d’exportationaméricaines, y compris, mais de manière non exhaustive, la liste de personnes qui font objet d’un ordre de ne pas participer, d’une façon directeou indirecte, aux exportations des produits ou des services qui sont régis par la législation américaine en matière de contrôle des exportations etla liste de ressortissants spécifiquement désignés, sont rigoureusement interdites.
LA DOCUMENTATION EST FOURNIE "EN L’ÉTAT" ET TOUTES AUTRES CONDITIONS, DECLARATIONS ET GARANTIES EXPRESSESOU TACITES SONT FORMELLEMENT EXCLUES, DANS LA MESURE AUTORISEE PAR LA LOI APPLICABLE, Y COMPRIS NOTAMMENTTOUTE GARANTIE IMPLICITE RELATIVE A LA QUALITE MARCHANDE, A L’APTITUDE A UNE UTILISATION PARTICULIERE OU AL’ABSENCE DE CONTREFAÇON.

Contents
Before You Begin 25
How This Book Is Organized 25
Typographic Conventions 27
Shell Prompts 28
Supported Platforms 28
Accessing Sun Studio Software and Man Pages 28
Accessing Sun Studio Documentation 31
Accessing Related Solaris Documentation 35
Resources for Developers 35
Contacting Sun Technical Support 36
Sending Your Comments 36
1. Getting Started With dbx 37
Compiling Your Code for Debugging 37
Starting dbx and Loading Your Program 38
Running Your Program in dbx 40
Debugging Your Program With dbx 41
Examining a Core File 41
Setting Breakpoints 43
Stepping Through Your Program 44
3

Looking at the Call Stack 45
Examining Variables 46
Finding Memory Access Problems and Memory Leaks 47
Quitting dbx 48
Accessing dbx Online Help 48
2. Starting dbx 49
Starting a Debugging Session 49
Debugging a Core File 50
Debugging a Core File in the Same Operating Environment 51
If Your Core File Is Truncated 51
Debugging a Mismatched Core File 52
Using the Process ID 54
The dbx Startup Sequence 55
Setting Startup Properties 56
Mapping the Compile-time Directory to the Debug-time Directory 56
Setting dbx Environment Variables 57
Creating Your Own dbx Commands 57
Compiling a Program for Debugging 57
Debugging Optimized Code 58
Code Compiled Without the -g Option 58
Shared Libraries Require the -g Option for Full dbx Support 59
Completely Stripped Programs 59
Quitting Debugging 59
Stopping a Process Execution 60
Detaching a Process From dbx 60
Killing a Program Without Terminating the Session 60
Saving and Restoring a Debugging Run 61
Using the save Command 61
4 Debugging a Program With dbx • November 2005

Saving a Series of Debugging Runs as Checkpoints 63
Restoring a Saved Run 63
Saving and Restoring Using replay 64
3. Customizing dbx 65
Using the dbx Initialization File 65
Creating a .dbxrc File 66
Initialization File Sample 66
Setting dbx Environment Variables 66
The dbx Environment Variables and the Korn Shell 72
4. Viewing and Navigating To Code 73
Navigating To Code 73
Navigating To a File 74
Navigating To Functions 74
Printing a Source Listing 75
Walking the Call Stack to Navigate To Code 76
Types of Program Locations 76
Program Scope 76
Variables That Reflect the Current Scope 77
Visiting Scope 77
Qualifying Symbols With Scope Resolution Operators 79
Backquote Operator 79
C++ Double Colon Scope Resolution Operator 79
Block Local Operator 80
Linker Names 82
Locating Symbols 82
Printing a List of Occurrences of a Symbol 82
Determining Which Symbol dbx Uses 83
Contents 5

Scope Resolution Search Path 84
Relaxing the Scope Lookup Rules 84
Viewing Variables, Members, Types, and Classes 85
Looking Up Definitions of Variables, Members, and Functions 85
Looking Up Definitions of Types and Classes 87
Debugging Information in Object files and Executables 89
Object File Loading 89
Listing Debugging Information for Modules 90
Listing Modules 91
Finding Source and Object Files 91
5. Controlling Program Execution 93
Running a Program 93
Attaching dbx to a Running Process 94
Detaching dbx From a Process 95
Stepping Through a Program 96
Single Stepping 97
Continuing Execution of a Program 97
Calling a Function 98
Using Ctrl+C to Stop a Process 100
6. Setting Breakpoints and Traces 101
Setting Breakpoints 101
Setting a stop Breakpoint at a Line of Source Code 102
Setting a stop Breakpoint in a Function 103
Setting Multiple Breaks in C++ Programs 104
Setting Data Change Breakpoints 106
Setting Filters on Breakpoints 109
Tracing Execution 112
6 Debugging a Program With dbx • November 2005

Setting a Trace 112
Controlling the Speed of a Trace 112
Directing Trace Output to a File 113
Setting a when Breakpoint at a Line 113
Setting a Breakpoint in a Shared Library 113
Listing and Clearing Breakpoints 114
Listing Breakpoints and Traces 114
Deleting Specific Breakpoints Using Handler ID Numbers 114
Enabling and Disabling Breakpoints 115
Efficiency Considerations 115
7. Using the Call Stack 117
Finding Your Place on the Stack 117
Walking the Stack and Returning Home 118
Moving Up and Down the Stack 118
Moving Up the Stack 118
Moving Down the Stack 119
Moving to a Specific Frame 119
Popping the Call Stack 119
Hiding Stack Frames 120
Displaying and Reading a Stack Trace 121
8. Evaluating and Displaying Data 123
Evaluating Variables and Expressions 123
Verifying Which Variable dbx Uses 123
Variables Outside the Scope of the Current Function 124
Printing the Value of a Variable, Expression, or Identifier 124
Printing C++ 124
Dereferencing Pointers 126
Contents 7

Monitoring Expressions 126
Turning Off Display (Undisplaying) 127
Assigning a Value to a Variable 127
Evaluating Arrays 127
Array Slicing 128
Slices 131
Strides 132
9. Using Runtime Checking 135
Capabilities of Runtime Checking 136
When to Use Runtime Checking 136
Runtime Checking Requirements 136
Limitations 137
Using Runtime Checking 137
Turning On Memory Use and Memory Leak Checking 137
Turning On Memory Access Checking 138
Turning On All Runtime Checking 138
Turning Off Runtime Checking 138
Running Your Program 139
Using Access Checking 142
Understanding the Memory Access Error Report 143
Memory Access Errors 143
Using Memory Leak Checking 144
Detecting Memory Leak Errors 145
Possible Leaks 145
Checking for Leaks 146
Understanding the Memory Leak Report 147
Fixing Memory Leaks 150
Using Memory Use Checking 150
8 Debugging a Program With dbx • November 2005

Suppressing Errors 152
Types of Suppression 152
Suppressing Error Examples 153
Default Suppressions 154
Using Suppression to Manage Errors 154
Using Runtime Checking on a Child Process 155
Using Runtime Checking on an Attached Process 159
Using Fix and Continue With Runtime Checking 160
Runtime Checking Application Programming Interface 162
Using Runtime Checking in Batch Mode 162
bcheck Syntax 163
bcheck Examples 163
Enabling Batch Mode Directly From dbx 164
Troubleshooting Tips 164
Runtime Checking’s 8 Megabyte Limit 164
Runtime Checking Errors 166
Access Errors 166
Memory Leak Errors 169
10. Fixing and Continuing 171
Using Fix and Continue 171
How Fix and Continue Operates 172
Modifying Source Using Fix and Continue 172
Fixing Your Program 173
Continuing After Fixing 173
Changing Variables After Fixing 175
Modifying a Header File 176
Fixing C++ Template Definitions 176
Contents 9

11. Debugging Multithreaded Applications 177
Understanding Multithreaded Debugging 177
Thread Information 178
Viewing the Context of Another Thread 180
Viewing the Threads List 180
Resuming Execution 181
Understanding Thread Creation Activity 181
Understanding LWP Information 182
12. Debugging Child Processes 183
Attaching to Child Processes 183
Following the exec Function 184
Following the fork Function 184
Interacting With Events 185
13. Debugging OpenMP Programs 187
How Compilers Transform OpenMP Code 188
dbx Functionality Available for OpenMP Code 189
Using Stack Traces With OpenMP Code 190
Using the dump Command on OpenMP Code 191
Execution Sequence of OpenMP Code 191
14. Working With Signals 193
Understanding Signal Events 193
Catching Signals 195
Changing the Default Signal Lists 195
Trapping the FPE Signal (Solaris Platforms Only) 196
Sending a Signal to a Program 197
Automatically Handling Signals 198
10 Debugging a Program With dbx • November 2005

15. Debugging C++ With dbx 199
Using dbx With C++ 199
Exception Handling in dbx 200
Commands for Handling Exceptions 200
Examples of Exception Handling 202
Debugging With C++ Templates 204
Template Example 205
Commands for C++ Templates 207
16. Debugging Fortran Using dbx 213
Debugging Fortran 213
Current Procedure and File 213
Uppercase Letters 214
Sample dbx Session 214
Debugging Segmentation Faults 217
Using dbx to Locate Problems 218
Locating Exceptions 219
Tracing Calls 220
Working With Arrays 221
Fortran 95 Allocatable Arrays 222
Showing Intrinsic Functions 223
Showing Complex Expressions 224
Showing Interval Expressions 225
Showing Logical Operators 226
Viewing Fortran 95 Derived Types 227
Pointer to Fortran 95 Derived Type 228
17. Debugging a Java Application With dbx 231
Using dbx With Java Code 231
Contents 11

Capabilities of dbx With Java Code 231
Limitations of dbx With Java Code 232
Environment Variables for Java Debugging 232
Starting to Debug a Java Application 233
Debugging a Class File 233
Debugging a JAR File 234
Debugging a Java Application That Has a Wrapper 235
Attaching dbx to a Running Java Application 235
Debugging a C Application or C++ Application That Embeds a JavaApplication 236
Passing Arguments to the JVM Software 236
Specifying the Location of Your Java Source Files 237
Specifying the Location of Your C Source Files or C++ Source Files 237
Specifying a Path for Class Files That Use Custom Class Loaders 237
Setting Breakpoints on Code That Has Not Yet Been Loaded by the JVMSoftware 238
Customizing Startup of the JVM Software 238
Specifying a Path Name for the JVM Software 239
Passing Run Arguments to the JVM Software 240
Specifying a Custom Wrapper for Your Java Application 240
Specifying 64-bit JVM Software 242
dbx Modes for Debugging Java Code 243
Switching from Java or JNI Mode to Native Mode 243
Switching Modes When You Interrupt Execution 244
Using dbx Commands in Java Mode 244
The Java Expression Evaluation in dbx Commands 244
Static and Dynamic Information Used by dbx Commands 245
Commands With Identical Syntax and Functionality in Java Mode and NativeMode 246
Commands With Different Syntax in Java Mode 247
12 Debugging a Program With dbx • November 2005

Commands Valid Only in Java Mode 248
18. Debugging at the Machine-Instruction Level 249
Examining the Contents of Memory 249
Using the examine or x Command 250
Using the dis Command 253
Using the listi Command 253
Stepping and Tracing at Machine-Instruction Level 255
Single Stepping at the Machine-Instruction Level 255
Tracing at the Machine-Instruction Level 256
Setting Breakpoints at the Machine-Instruction Level 257
Setting a Breakpoint at an Address 258
Using the adb Command 258
Using the regs Command 258
Platform-Specific Registers 261
x86 Register Information 262
AMD64 Register Information 264
19. Using dbx With the Korn Shell 267
ksh-88 Features Not Implemented 267
Extensions to ksh-88 268
Renamed Commands 268
Rebinding of Editing Functions 269
20. Debugging Shared Libraries 271
Dynamic Linker 271
Link Map 272
Startup Sequence and .init Sections 272
Procedure Linkage Tables 272
Fix and Continue 272
Contents 13

Setting Breakpoints in Shared Libraries 273
Setting a Breakpoint in an Explicitly Loaded Library 273
A. Modifying a Program State 275
Impacts of Running a Program Under dbx 275
Commands That Alter the State of the Program 276
assign Command 276
pop Command 277
call Command 277
print Command 277
when Command 278
fix Command 278
cont at Command 278
B. Event Management 279
Event Handlers 279
Creating Event Handlers 280
Manipulating Event Handlers 281
Using Event Counters 281
Setting Event Specifications 281
Breakpoint Event Specifications 282
Data Change Event Specifications 283
System Event Specifications 285
Execution Progress Event Specifications 288
Other Event Specifications 290
Event Specification Modifiers 293
Parsing and Ambiguity 295
Using Predefined Variables 296
Variables Valid for when Command 297
14 Debugging a Program With dbx • November 2005

Variables Valid for Specific Events 298
Setting Event Handler Examples 299
Setting a Breakpoint for Store to an Array Member 299
Implementing a Simple Trace 300
Enabling a Handler While Within a Function (in function) 300
Determining the Number of Lines Executed 300
Determining the Number of Instructions Executed by a Source Line 301
Enabling a Breakpoint After an Event Occurs 301
Resetting Application Files for replay 302
Checking Program Status 302
Catch Floating Point Exceptions 302
C. Command Reference 303
adb Command 303
assign Command 303
attach Command 304
bsearch Command 306
call Command 306
cancel Command 307
catch Command 308
check Command 308
clear Command 311
collector Command 312
collector archive Command 313
collector dbxsample Command 313
collector disable Command 314
collector enable Command 314
collector heaptrace Command 314
collector hwprofile Command 315
Contents 15

collector limit Command 315
collector mpitrace Command 316
collector pause Command 316
collector profile Command 316
collector resume Command 317
collector sample Command 317
collector show Command 318
collector status Command 318
collector store Command 318
collector synctrace Command 319
collector version Command 319
cont Command 320
dalias Command 320
dbx Command 321
dbxenv Command 324
debug Command 324
delete Command 327
detach Command 327
dis Command 328
display Command 329
down Command 330
dump Command 331
edit Command 331
examine Command 332
exception Command 334
exists Command 334
file Command 334
files Command 335
16 Debugging a Program With dbx • November 2005

fix Command 336
fixed Command 336
frame Command 337
func Command 337
funcs Command 338
gdb Command 339
handler Command 340
hide Command 340
ignore Command 341
import Command 342
intercept Command 342
java Command 343
jclasses Command 343
joff Command 344
jon Command 344
jpkgs Command 344
kill Command 345
language Command 345
line Command 346
list Command 347
listi Command 349
loadobject Command 349
loadobject -dumpelf Command 350
loadobject -exclude Command 350
loadobject -hide Command 351
loadobject -list Command 351
loadobject -load Command 352
loadobject -unload Command 352
loadobject -use Command 353
Contents 17

lwp Command 353
lwps Command 354
mmapfile Command 354
module Command 355
modules Command 356
native Command 357
next Command 357
nexti Command 359
pathmap Command 359
pop Command 361
print Command 362
proc Command 364
prog Command 365
quit Command 365
regs Command 366
replay Command 367
rerun Command 367
restore Command 368
rprint Command 368
rtc -showmap Command 369
run Command 369
runargs Command 370
save Command 371
scopes Command 372
search Command 372
showblock Command 372
showleaks Command 373
showmemuse Command 374
18 Debugging a Program With dbx • November 2005

Contents 19
source Command 374
status Command 375
step Command 375
stepi Command 377
stop Command 378
stopi Command 383
suppress Command 383
sync Command 386
syncs Command 386
thread Command 386
threads Command 388
trace Command 390
tracei Command 393
uncheck Command 394
undisplay Command 395
unhide Command 396
unintercept Command 396
unsuppress Command 397
up Command 398
use Command 399
whatis Command 399
when Command 400
wheni Command 402
where Command 403
whereami Command 404
whereis Command 404
which Command 405
whocatches Command 405
Index 407

20 Debugging a Program With dbx • November 2005
Figures
FIGURE 8-1 Example of a Two-dimensional, Rectangular Slice With a Stride of 1 131
FIGURE 8-2 Example of a Two-dimensional, Rectangular Slice With a Stride of 2 132
FIGURE 14-1 Intercepting and Cancelling the SIGINT Signal 194
21

22 Debugging a Program With dbx • November 2005

Tables
TABLE 3-1 dbx Environment Variables 67
TABLE 11-1 Thread and LWP States 179
TABLE B-1 Variables Valid for sig Event 298
TABLE B-2 Variable Valid for exit Event 299
TABLE B-3 Variable Valid for dlopen and dlclose Events 299
TABLE B-4 Variables Valid for sysin and sysout Events 299
TABLE B-5 Variable Valid for proc_gone Events 299
23

24 Debugging a Program With dbx • November 2005

Before You Begin
The dbx command-line debugger is an interactive, source-level debugging tool.Debugging a Program With dbx is intended for programmers who want to debug anapplication using dbx commands. Users of dbx need with a working knowledge ofFortran, C, or C++, and some understanding of the Solaris™ Operating System(Solaris OS), or the Linux operating system, and UNIX® commands, .
How This Book Is OrganizedDebugging a Program With dbx contains the following chapters and appendixes:
Chapter 1 gives you the basics of using dbx to debug an application.
Chapter 2 describes how to compile a program for debugging and how to start adebugging session.
Chapter 3 describes how to customize your debugging environment.
Chapter 4 tells you about visiting source files and functions; locating symbols; andlooking up variables, members, types, and classes.
Chapter 5 describes how to run a program under dbx., including how to attach to arunning program.
Chapter 6 describes how to set, clear, and list breakpoints and traces.
Chapter 7 tells you how to examine the call stack.
Chapter 8 shows you how to evaluate data; display the values of expressions,variables, and other data structures; and assign values to variables.
Chapter 9 describes how to use runtime checking to detect memory leak andmemory access errors in your program automatically.
25
Chapter 10 describes the fix and continue feature of dbx .
Chapter 11 tells you how to find information about threads.
Chapter 13 describes how to use dbx to debug OpenMP™ code.
Chapter 12 describes several dbx facilities that help you debug child processes.
Chapter 14 tells you how to use dbx to work with signals.
Chapter 15 describes dbx support of C++ templates, and the commands available forhandling C++ exceptions and how dbx handles these exceptions.
Chapter 16 introduces some of the dbx facilities you can use to debug a Fortranprogram.
Chapter 17 describes how you can use dbx to debug an application that is a mixtureof Java™ code and C JNI (Java™ Native Interface) code or C++ JNI code.
Chapter 18 tells you how to use dbx at the machine-instruction level
Chapter 19 explains the differences between ksh-88 and dbx commands.
Chapter 20 describes dbx support for program that use dynamically linked, sharedlibraries.
Appendix A focuses on dbx commands that change your program or its behaviorwhen you run it under dbx.
Appendix B tells you how to manage events in the program you are debugging.
Appendix C gives detailed syntax and functional descriptions of all of the dbxcommands.
26 Debugging a Program With dbx • November 2005

Typographic Conventions
TABLE P-1 Typeface Conventions
Typeface Meaning Examples
AaBbCc123 The names of commands, files,and directories; on-screencomputer output
Edit your .login file.Use ls -a to list all files.% You have mail.
AaBbCc123 What you type, when contrastedwith on-screen computer output
% su
Password:
AaBbCc123 Book titles, new words or terms,words to be emphasized
Read Chapter 6 in the User’s Guide.These are called class options.You must be superuser to do this.
AaBbCc123 Command-line placeholder text;replace with a real name or value
To delete a file, type rm filename.
TABLE P-2 Code Conventions
CodeSymbol Meaning Notation Code Example
[ ] Brackets contain argumentsthat are optional.
O[n] O4, O
{ } Braces contain a set of choicesfor a required option.
d{y|n} dy
| The “pipe” or “bar” symbolseparates arguments, only oneof which may be chosen.
B{dynamic|static} Bstatic
: The colon, like the comma, issometimes used to separatearguments.
Rdir[:dir] R/local/libs:/U/a
… The ellipsis indicates omissionin a series.
xinline=f1[,…fn] xinline=alpha,dos
Before You Begin 27
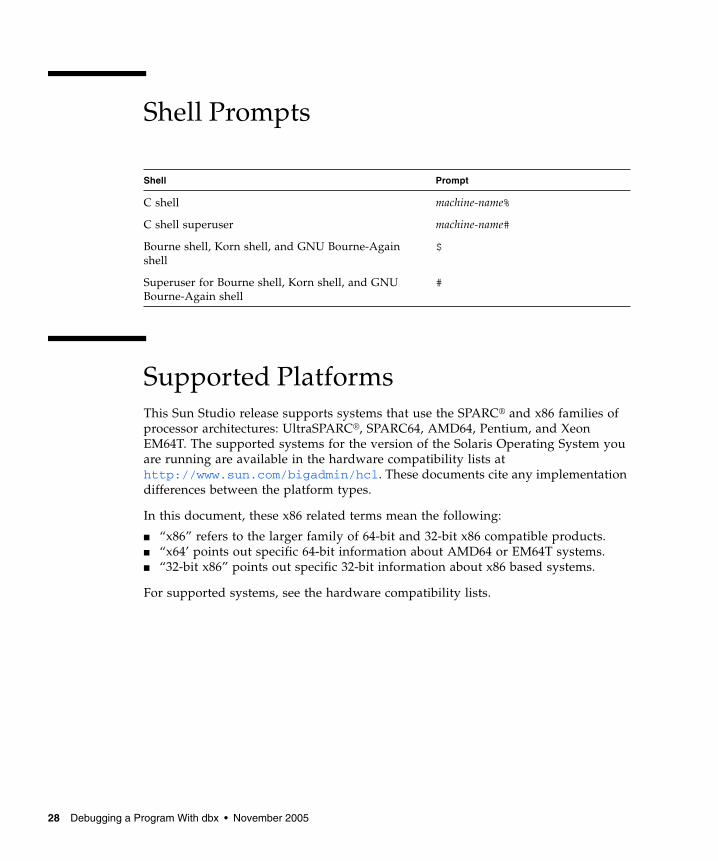
Shell Prompts
Supported PlatformsThis Sun Studio release supports systems that use the SPARC® and x86 families ofprocessor architectures: UltraSPARC®, SPARC64, AMD64, Pentium, and XeonEM64T. The supported systems for the version of the Solaris Operating System youare running are available in the hardware compatibility lists athttp://www.sun.com/bigadmin/hcl. These documents cite any implementationdifferences between the platform types.
In this document, these x86 related terms mean the following:
■ “x86” refers to the larger family of 64-bit and 32-bit x86 compatible products.■ “x64’ points out specific 64-bit information about AMD64 or EM64T systems.■ “32-bit x86” points out specific 32-bit information about x86 based systems.
For supported systems, see the hardware compatibility lists.
Shell Prompt
C shell machine-name%
C shell superuser machine-name#
Bourne shell, Korn shell, and GNU Bourne-Againshell
$
Superuser for Bourne shell, Korn shell, and GNUBourne-Again shell
#
28 Debugging a Program With dbx • November 2005

Accessing Sun Studio Software and ManPagesThe Sun Studio software and its man pages are not installed into the standard/usr/bin/ and /usr/share/man directories. To access the software, you musthave your PATH environment variable set correctly (see “Accessing the Software” onpage 29). To access the man pages, you must have your MANPATH environmentvariable set correctly (see “Accessing the Man Pages” on page 30).
For more information about the PATH variable, see the csh(1), sh(1), ksh(1), andbash(1) man pages. For more information about the MANPATH variable, see theman(1) man page. For more information about setting your PATH variable andMANPATH variable to access this release, see the installation guide or your systemadministrator.
Note – The information in this section assumes that your Sun Studio software isinstalled in the /opt directory on Solaris platforms and in the /opt/sun directoryon Linux platforms. If your software is not installed in the default directory, askyour system administrator for the equivalent path on your system.
Accessing the SoftwareUse the steps below to determine whether you need to change your PATH variable toaccess the software.
To Determine Whether You Need to Set Your PATHEnvironment Variable
1. Display the current value of the PATH variable by typing the following at acommand prompt.
% echo $PATH
Before You Begin 29

2. On Solaris platforms, review the output to find a string of paths that contain/opt/SUNWspro/bin. On Linux platforms, review the output to find a string ofpaths that contain /opt/sun/sunstudio11/bin.
If you find the path, your PATH variable is already set to access the software. If youdo not find the path, set your PATH environment variable by following theinstructions in the next procedure.
To Set Your PATH Environment Variable to Enable Access tothe Software
● On Solaris platforms, add the following path to your PATH environment variable.If you have previously installed Forte Developer software, Sun ONE Studiosoftware, or another release of Sun Studio software, add the following path beforethe paths to those installations.
/opt/SUNWspro/bin
● On Linux platforms, add the following path to your PATH environment variable.
/opt/sun/sunstudio11/bin
Accessing the Man PagesUse the following steps to determine whether you need to change your MANPATHvariable to access the man pages.
To Determine Whether You Need to Set Your MANPATHEnvironment Variable
1. Request the dbx man page by typing the following at a command prompt.
2. Review the output, if any.
If the dbx(1) man page cannot be found or if the man page displayed is not for thecurrent version of the software, follow the instructions in the next procedure to setyour MANPATH environment variable.
% man dbx
30 Debugging a Program With dbx • November 2005

To Set Your MANPATH Environment Variable to Enable Accessto the Man Pages
● On Solaris platforms, add the following path to your MANPATH environmentvariable.
/opt/SUNWspro/man
● On Linux platforms, add the following path to your MANPATH environmentvariable.
/opt/sun/sunstudio11/man
Accessing the Integrated DevelopmentEnvironmentThe Sun Studio integrated development environment (IDE) provides modules forcreating, editing, building, debugging, and analyzing the performance of a C, C++,or Fortran application.
The command to start the IDE is sunstudio. For details on this command, see thesunstudio(1) man page.
The correct operation of the IDE depends on the IDE being able to find the coreplatform. The sunstudio command looks for the core platform in two locations:
■ The command looks first in the default installation directory,/opt/netbeans/3.5V11 on Solaris platforms and/opt/sun/netbeans/3.5V11 on Linux platforms.
■ If the command does not find the core platform in the default directory, itassumes that the directory that contains the IDE and the directory that containsthe core platform are both installed in or mounted to the same location. Forexample, on Solaris platforms, if the path to the directory that contains the IDE is/foo/SUNWspro, the command looks for the core platform in/foo/netbeans/3.5V11. On Linux platforms, if the path to the directory thatcontains the IDE is /foo/sunstudio11, the command looks for the coreplatform in /foo/netbeans/3.5V11.
If the core platform is not installed or mounted to either of the locations where thesunstudio command looks for it, then each user on a client system must set theenvironment variable SPRO_NETBEANS_HOME to the location where the coreplatform is installed or mounted (/installation_directory/netbeans/3.5V11).
On Solaris platforms, each user of the IDE also must add/installation_directory/SUNWspro/bin to their $PATH in front of the path to anyother release of Forte Developer software, Sun ONE Studio software, or Sun Studio
Before You Begin 31

software. On Linux platforms, each user of the IDE also must add/installation_directory/sunstudio11/bin to their $PATH in front of the path to anyother release of Sun Studio software.
The path /installation_directory/netbeans/3.5V11/bin should not be added to theuser’s $PATH.
Accessing Sun Studio DocumentationYou can access the documentation at the following locations:
■ The documentation is available from the documentation index that is installedwith the software on your local system or network atfile:/opt/SUNWspro/docs/index.html on Solaris platforms and atfile:/opt/sun/sunstudio11/docs/index.html on Linux platforms.
If your software is not installed in the /opt directory on a Solaris platform or the/opt/sun directory on a Linux platform, ask your system administrator for theequivalent path on your system.
■ Most manuals are available from the docs.sun.comsm web site. The followingtitles are available through your installed software on Solaris platforms only:
■ Standard C++ Library Class Reference■ Standard C++ Library User’s Guide■ Tools.h++ Class Library Reference■ Tools.h++ User’s Guide
■ The release notes for both Solaris platforms and Linux platforms are availablefrom the docs.sun.com web site.
■ Online help for all components of the IDE is available through the Help menu, aswell as through Help buttons on many windows and dialog boxes, in the IDE.
The docs.sun.com web site (http://docs.sun.com) enables you to read, print,and buy Sun Microsystems manuals through the Internet. If you cannot find amanual, see the documentation index that is installed with the software on yourlocal system or network.
Note – Sun is not responsible for the availability of third-party Web sites mentionedin this document. Sun does not endorse and is not responsible or liable for anycontent, advertising, products, or other materials that are available on or throughsuch sites or resources. Sun will not be responsible or liable for any actual or allegeddamage or loss caused by or in connection with the use of or reliance on any suchcontent, goods, or services that are available on or through such sites or resources.
32 Debugging a Program With dbx • November 2005

Documentation in Accessible FormatsThe documentation is provided in accessible formats that are readable by assistivetechnologies for users with disabilities. You can find accessible versions ofdocumentation as described in the following table. If your software is not installedin the /opt directory, ask your system administrator for the equivalent path on yoursystem.
Type of Documentation Format and Location of Accessible Version
Manuals (except third-partymanuals)
HTML at http://docs.sun.com
Third-party manuals:• Standard C++ Library Class
Reference• Standard C++ Library
User’s Guide• Tools.h++ Class Library
Reference• Tools.h++ User’s Guide
HTML in the installed software on Solaris platforms throughthe documentation index atfile:/opt/SUNWspro/docs/index.html
Readmes HTML on the developer portal athttp://developers.sun.com/prodtech/cc/documentation/ss11/docs/mr/READMEs
Man pages HTML in the installed software through the documentationindex at file:/opt/SUNWspro/docs/index.html onSolaris platforms, and atfile:/opt/sun/sunstudio11/docs/index.html onLinux platforms,
Online help HTML available through the Help menu and Help buttons inthe IDE
Release notes HTML at http://docs.sun.com
Before You Begin 33

Related DocumentationFor Solaris platforms, the following table describes related documentation that isavailable at /opt/SUNWspro/docs/index.html and at http://docs.sun.com.If your software is not installed in the /opt directory, ask your system administratorfor the equivalent path on your system.
For Linux platforms, the following table describes related documentation that isavailable at file:/opt/sun/sunstudio10u1/docs/index.html and athttp://docs.sun.com. If your software is not installed in the /opt/sundirectory, ask your system administrator for the equivalent path on your system.
Document Title Description
dbx Readme Lists new features, known problems, limitations, andincompatibilities of dbx.
dbx(1) man page Describes the dbx command.
C User’s Guide Describes the Sun Studio 11 C programminglanguage compiler along with ANSI C compiler-specific information.
C++ User’s Guide Instructs you in the use of the Sun Studio 11 C++compiler and provides detailed information oncommand-line compiler options.
Fortran User’s Guide Describes the compile-time environment andcommand-line options for the Sun Studio 11 Fortrancompiler.
OpenMP API User’s Guide Summarizes the OpenMP Fortran 95, C, and C++application program interface (API) for buildingmultiprocessing applications. Sun Studio compilerssupport the OpenMP API.
Performance Analyzer Describes the performance analysis tools that areavailable with Sun Studio 11
Document Title Description
dbx Readme Lists new features, known problems, limitations, andincompatibilities of dbx.
dbx(1) man page Describes the dbx command.
Performance Analyzer Describes the performance analysis tools that areavailable with Sun Studio 11.
34 Debugging a Program With dbx • November 2005

Accessing Related SolarisDocumentationThe following table describes related documentation that is available through thedocs.sun.com web site.
Resources for DevelopersVisit http://developers.sun.com/prodtech/cc to find these frequentlyupdated resources:
■ Articles on programming techniques and best practices
■ A knowledge base of short programming tips
■ Documentation of the software, as well as corrections to the documentation that isinstalled with your software
■ Information on support levels
■ User forums
Document Collection Document Title Description
Solaris Reference ManualCollection
See the titles of man pagesections.
Provides information about theSolaris OS.
Solaris Software DeveloperCollection
Linker and Libraries Guide Describes the operations of theSolaris link-editor and runtimelinker.
Solaris Software DeveloperCollection
Multithreaded ProgrammingGuide
Covers the POSIX and Solaristhreads APIs, programmingwith synchronization objects,compiling multithreadedprograms, and finding tools formultithreaded programs.
Solaris Software DeveloperCollection
SPARC Assembly LanguageReference Manual
Describes the assembler thatruns on the SPARC architectureand translates source files thatare in assembly languageformat into object files inlinking format.
Before You Begin 35

■ Downloadable code samples
■ New technology previews
You can find additional resources for developers athttp://developers.sun.com.
Contacting Sun Technical SupportIf you have technical questions about this product that are not answered in thisdocument, go to:
http://www.sun.com/service/contacting
Sending Your CommentsSun is interested in improving its documentation and welcomes your comments andsuggestions. Submit your comments to Sun at this URL:
http://www.sun.com/hwdocs/feedback
Please include the part number of the document in the subject line of your email. Forexample, the part number for this document is 819-3683-10.
36 Debugging a Program With dbx • November 2005

CHAPTER 1
Getting Started With dbx
dbx is an interactive, source-level, command-line debugging tool. You can use it torun a program in a controlled manner and to inspect the state of a stopped program.dbx gives you complete control of the dynamic execution of a program, includingcollecting performance and memory usage data, monitoring memory access, anddetecting memory leaks.
You can use dbx to debug an application written in C, C++, or Fortran. You can also,with some limitations (see “Limitations of dbx With Java Code” on page 232), debugan application that is a mixture of Java™ code and C JNI (Java™ Native Interface)code or C++ JNI code.
This chapter gives you the basics of using dbx to debug an application. It containsthe following sections:
■ Compiling Your Code for Debugging■ Starting dbx and Loading Your Program■ Running Your Program in dbx■ Debugging Your Program With dbx■ Quitting dbx■ Accessing dbx Online Help
Compiling Your Code for DebuggingYou must prepare your program for source-level debugging with dbx by compilingit with the -g option, which is accepted by the C compiler, C++ compiler, Fortran 95compiler, and Java compiler. For more information, see “Compiling a Program forDebugging” on page 57.
37

Starting dbx and Loading Your ProgramTo start dbx, type the dbx command at a shell prompt:
To start dbx and load the program to be debugged:
To start dbx and load a program that is a mixture of Java code and C JNI code orC++ JNI code:
You can use the dbx command to start dbx and attach it to a running process byspecifying the process ID.
$ dbx
$ dbx program_name
$ dbx program_name{.class | .jar}
$ dbx - process_id
38 Debugging a Program With dbx • November 2005

If you don’t know the process ID of the process, include the pgrep command in thedbx command to find and attach to the process. For example:
For more information on the dbx command and start-up options, see “dbxCommand” on page 321 and the dbx(1) man page, or type dbx -h.
If you are already running dbx, you can load the program to be debugged, or switchfrom the program you are debugging to another program, with the debugcommand:
To load or switch to a program that includes Java code and C JNI code or C++ JNIcode:
$ dbx - ‘pgrep Freeway‘Reading -Reading ld.so.1Reading libXm.so.4Reading libgen.so.1Reading libXt.so.4Reading libX11.so.4Reading libce.so.0Reading libsocket.so.1Reading libm.so.1Reading libw.so.1Reading libc.so.1Reading libSM.so.6Reading libICE.so.6Reading libXext.so.0Reading libnsl.so.1Reading libdl.so.1Reading libmp.so.2Reading libc_psr.so.1Attached to process 1855stopped in _libc_poll at 0xfef9437c0xfef9437c: _libc_poll+0x0004:ta 0x8Current function is main 48 XtAppMainLoop(app_context);(dbx)
(dbx) debug program_name
(dbx> debug program_name{.class | .jar}
Chapter 1 Getting Started With dbx 39

If you are already running dbx, you can also use the debug command to attach dbxto a running process:
To attach dbx to a running process that includes Java™ code and C JNI (Java™
Native Interface) code or C++ JNI code:
For more information on the debug command, see “debug Command” on page 324.
Running Your Program in dbxTo run your most recently loaded program in dbx, use the run command. If youtype the run command initially without arguments, the program is run withoutarguments. To pass arguments or redirect the input or output of your program, usethe following syntax:
For example:
When you run an application that includes Java code, the run arguments are passedto the Java application, not to the JVM software. Do not include the main class nameas an argument.
If you repeat the run command without arguments, the program restarts using thearguments or redirection from the previous run command. You can reset the optionsusing the rerun command. For more information on the run command, see “runCommand” on page 369. For more information on the rerun command, see “rerunCommand” on page 367.
(dbx) debug program_name process_id
(dbx) debug program_name{.class | .jar} process_id
run [ arguments ] [ < input_file ] [ > output_file ]
(dbx) run -h -p < input > outputRunning: a.out(process id 1234)execution completed, exit code is 0(dbx)
40 Debugging a Program With dbx • November 2005

Your application may run to completion and terminate normally. If you have setbreakpoints, it will probably stop at a breakpoint. If your application contains bugs,it may stop because of a memory fault or segmentation fault.
Debugging Your Program With dbxYou are likely to be debugging your program for one of the following reasons:
■ To determine where and why it is crashing. Strategies for locating the cause of acrash include:
■ Running the program in dbx. dbx reports the location of the crash when itoccurs.
■ Examining the core file and looking at a stack trace (see “Examining a CoreFile” on page 41 and “Looking at the Call Stack” on page 45).
■ To determine why your program is giving incorrect results. Strategies include:
■ Setting breakpoints to stop execution so that you can check your program’sstate and look at the values of variables (see “Setting Breakpoints” on page 43and “Examining Variables” on page 46).
■ Stepping through your code one source line at a time to monitor how theprogram state changes (see “Stepping Through Your Program” on page 44).
■ To find a memory leak or memory management problem. Runtime checking letsyou detect runtime errors such as memory access errors and memory leak errorsand lets you monitor memory usage (see “Finding Memory Access Problems andMemory Leaks” on page 47).
Examining a Core FileTo determine where your program is crashing, you may want to examine the corefile, the memory image of your program when it crashed. You can use the wherecommand (see “where Command” on page 403) to determine where the programwas executing when it dumped core.
Note – dbx cannot tell you the state of a Java application from a core file as it canwith native code.
Chapter 1 Getting Started With dbx 41

To debug a core file, type:
or
In the following example, the program has crashed with a segmentation fault anddumped core. The user starts dbx and loads the core file. Then he uses the wherecommand to display a stack trace, which shows that the crash occurred at line 9 ofthe file foo.c.
For more information on debugging core files, see “Debugging a Core File” onpage 50. For more information on using the call stack, see “Looking at the CallStack” on page 45.
Note – If your program is dynamically linked with any shared libraries, it is best todebug the core file in the same operating environment in which it was created. Forinformation on debugging a core file that was created in a different operatingenvironment, see “Debugging a Mismatched Core File” on page 52.
$ dbx program_name core
$ dbx - core
% dbx a.out coreReading a.outcore file header read successfullyReading ld.so.1Reading libc.so.1Reading libdl.so.1Reading libc_psr.so.1program terminated by signal SEGV (no mapping at the fault address)Current function is main 9 printf("string ’%s’ is %d characters long\n", msg,strlen(msg));(dbx) where [1] strlen(0x0, 0x0, 0xff337d24, 0x7efefeff, 0x81010100,0xff0000), at0xff2b6dec=>[2] main(argc = 1, argv = 0xffbef39c), line 9 in "foo.c"(dbx)
42 Debugging a Program With dbx • November 2005

Setting BreakpointsA breakpoint is a location in your program where you want the program to stopexecuting temporarily and give control to dbx. Set breakpoints in areas of yourprogram where you suspect bugs. If your program crashes, determine where thecrash occurs and set a breakpoint just before this part of your code.
When your program stops at a breakpoint, you can then examine the state ofprogram and the values of variables. dbx allows you to set many types ofbreakpoints (see Chapter 6).
The simplest type of breakpoint is a stop breakpoint. You can set a stop breakpointto stop in a function or procedure. For example, to stop when the main function iscalled:
For more information on the stop in command, see “Setting a stop Breakpoint ina Function” on page 103 and “stop Command” on page 378.
Or you can set a stop breakpoint to stop at a particular line of source code. Forexample, to stop at line 13 in the source file t.c:
For more information on the stop at command, see “Setting a stop Breakpoint ata Line of Source Code” on page 102 and “stop Command” on page 378.
You can determine the line at which you wish to stop by using the file commandto set the current file and the list command to list the function in which you wishto stop. Then use the stop at command to set the breakpoint on the source line:
(dbx) stop in main(2) stop in main
(dbx) stop at t.c:13(3) stop at “t.c”:13
(dbx) file t.c(dbx) list main10 main(int argc, char *argv[])11 {12 char *msg = "hello world\n";13 printit(msg);14 }(dbx) stop at 13(4) stop at “t.c”:13
Chapter 1 Getting Started With dbx 43

To continue execution of your program after it has stopped at a breakpoint, use thecont command (see “Continuing Execution of a Program” on page 97 and “contCommand” on page 320).
To get a list of all current breakpoints use the status command:
Now if you run your program, it stops at the first breakpoint:
Stepping Through Your ProgramAfter you have stopped at a breakpoint, you may want to step through yourprogram one source line at a time while you compare its actual state with theexpected state. You can use the step and next commands to do so. Both commandsexecute one source line of your program, stopping when that line has completedexecution. The commands handle source lines that contain function calls differently:the step command steps into the function, while the next command steps over thefunction.
The step up command continues execution until the current function returnscontrol to the function that called it.
The step to command attempts to step into a specified function in the currentsource line, or if no function is specified, into the last function called as determinedby the assembly code for the current source line.
Some functions, notably library functions such as printf, may not have beencompiled with the -g option, so dbx cannot step into them. In such cases, step andnext perform similarly.
(dbx) status(2) stop in main(3) stop at "t.c":13
(dbx) run...stopped in main at line 12 in file "t.c"12 char *msg = "hello world\n";
44 Debugging a Program With dbx • November 2005

The following example shows the use of the step and next commands as well asthe breakpoint set in “Setting Breakpoints” on page 43.
For more information on stepping through your program, see “Stepping Through aProgram” on page 96. For more information on the step and next commands, see“step Command” on page 375 and “next Command” on page 357.
Looking at the Call StackThe call stack represents all currently active routines—those that have been calledbut have not yet returned to their respective caller. In the stack, the functions andtheir arguments are listed in the order in which they were called. A stack traceshows where in the program flow execution stopped and how execution reached thispoint. It provides the most concise description of your program’s state.
(dbx) stop at 13(3) stop at "t.c":13(dbx) runRunning: a.outstopped in main at line 13 in file "t.c"
13 printit(msg);(dbx) nextHello worldstopped in main at line 14 in file "t.c"
14 }
(dbx) runRunning: a.outstopped in main at line 13 in file "t.c"
13 printit(msg);(dbx) stepstopped in printit at line 6 in file "t.c"
6 printf("%s\n", msg);(dbx) step upHello worldprintit returnsstopped in main at line 13 in file "t.c"
13 printit(msg);(dbx)
Chapter 1 Getting Started With dbx 45

To display a stack trace, use the where command:
For functions that were compiled with the -g option, the arguments names and theirtypes are known so accurate values are displayed. For functions without debugginginformation hexadecimal numbers are displayed for the arguments. These numbersare not necessarily meaningful. For example, in the stack trace above, frame 1 showsthe contents of the SPARC input registers $i0 through $i5; only the contents ofregisters $i0 through $i1 are meaningful since only two arguments were passed toprintf in the example shown in “Stepping Through Your Program” on page 44.
You can stop in a function that was not compiled with the -g option. When you stopin such a function dbx searches down the stack for the first frame whose function iscompiled with the -g option—in this case printit()—and sets the current scope(see “Program Scope” on page 76) to it. This is denoted by the arrow symbol (=>).
For more information on the call stack, see Chapter 7.
Examining VariablesWhile a stack trace may contain enough information to fully represent the state ofyour program, you may need to see the values of more variables. The printcommand evaluates an expression and prints the value according to the type of theexpression. The following example shows several simple C expressions:
(dbx) stop in printf(dbx) run(dbx) where[1] printf(0x10938, 0x20a84, 0x0, 0x0, 0x0, 0x0), at 0xef763418
=>[2] printit(msg = 0x20a84 "hello world\n"), line 6 in "t.c"[3] main(argc = 1, argv = 0xefffe93c), line 13 in "t.c"
(dbx)
(dbx) print msgmsg = 0x20a84 "Hello world"(dbx) print msg[0]msg[0] = ’h’(dbx) print *msg*msg = ’h’(dbx) print &msg&msg = 0xefffe8b4
46 Debugging a Program With dbx • November 2005

You can track when the values of variables and expressions change using datachange breakpoints (see “Setting Data Change Breakpoints” on page 106). Forexample, to stop execution when the value of the variable count changes, type:
Finding Memory Access Problems and MemoryLeaksRuntime checking consists of two parts: memory access checking, and memory useand leak checking. Access checking checks for improper use of memory by thedebugged application. Memory use and leak checking involves keeping track of allthe outstanding heap space and then on demand or at termination of the program,scanning the available data spaces and identifying the space that has no references.
Note – Runtime checking is available only on Solaris platforms.
Memory access checking, and memory use and leak checking, are enabled with thecheck command. To turn on memory access checking only, type:
To turn on memory use and memory leak checking, type:
After turning on the types of runtime checking you want, run your program. Theprogram runs normally, but slowly because each memory access is checked forvalidity just before it occurs. If dbx detects invalid access, it displays the type andlocation of the error. You can then use dbx commands such as where to get thecurrent stack trace or print to examine variables.
Note – You cannot use runtime checking on an application that is a mixture of Javacode and C JNI code or C++ JNI code.
For detailed information on using runtime checking, see Chapter 9.
(dbx) stop change count
(dbx) check -access
(dbx) check -memuse
Chapter 1 Getting Started With dbx 47
Quitting dbxA dbx session runs from the time you start dbx until you quit dbx; you can debugany number of programs in succession during a dbx session.
To quit a dbx session, type quit at the dbx prompt.
When you start dbx and attach it to a running process using the process_id option,the process survives and continues when you quit the debugging session. dbxperforms an implicit detach before quitting the session.
For more information about quitting dbx, see “Quitting Debugging” on page 59.
Accessing dbx Online Helpdbx includes a help file that you can access with the help command:
(dbx) quit
(dbx) help
48 Debugging a Program With dbx • November 2005

CHAPTER 2
Starting dbx
This chapter explains how to start, execute, save, restore, and quit a dbx debuggingsession. It contains the following sections:
■ Starting a Debugging Session■ Setting Startup Properties■ Debugging Optimized Code■ Quitting Debugging■ Saving and Restoring a Debugging Run
Starting a Debugging SessionHow you start dbx depends on what you are debugging, where you are, what youneed dbx to do, how familiar you are with dbx, and whether or not you have set upany dbx environment variables.
The simplest way to start a dbx session is to type the dbx command at a shellprompt.
To start dbx from a shell and load a program to be debugged, type:
$ dbx
$ dbx program_name
49

To start dbx and load a program that is a mixture of Java code and C JNI code orC++ JNI code:
Sun Studio software includes two dbx binaries, a 32-bit dbx that can debug 32-bitprograms only, and a 64-bit dbx that can debug both 32-bit and 64-bit programs.When you start dbx, it determines which of its binaries to execute. On 64-bitoperating systems, the 64-bit dbx is the default. To start the 32-bit dbx on a 64-bitOS, use the dbx command with the -x exec32 option (see “Options” on page 323)or set the _DBX_EXEC_32 environment variable).
Note – On the Linux OS, the 64-bit dbx cannot debug 32-bit programs. To debug a32-bit program on the Linux OS, you must start the 32-bit dbx.
Note – When using the 32-bit dbx on a 64-bit Linux OS, do not use the debugcommand or set the follow_fork_mode environment variable to child if the resultwill be execution of a 64-bit program. Exit dbx and start the 64-bit dbx to debug a64-bit program.
For more information on the dbx command and start-up options, see “dbxCommand” on page 321 and the dbx(1) man page.
Debugging a Core FileIf the program that dumped core was dynamically linked with any shared libraries,it is best to debug the core file in the same operating environment in which it wascreated. dbx has limited support for the debugging of “mismatched” core files (forexample, core files produced on a system running a different version or patch levelof the Solaris Operating System.
Note – dbx cannot tell you the state of a Java application from a core file as it canwith native code.
$ dbx program_name{.class | .jar}
50 Debugging a Program With dbx • November 2005

Debugging a Core File in the Same OperatingEnvironmentTo debug a core file, type:
You can also debug a core file using the debug command when dbx is alreadyrunning:
You can substitute - for the program name and dbx will attempt to extract theprogram name from the core file. dbx may not find the executable if its full pathname is not available in the core file. If this happens, specify the complete path nameof the binary when you tell dbx to load the core file.
If the core file is not in the current directory, you can specify its path name (forexample, /tmp/core).
Use the where command (see “where Command” on page 403) to determine wherethe program was executing when it dumped core.
When you debug a core file, you can also evaluate variables and expressions to seethe values they had at the time the program crashed, but you cannot evaluateexpressions that make function calls. You cannot single step or set breakpoints.
If Your Core File Is TruncatedIf you have problems loading a core file, check whether you have a truncated corefile. If you have the maximum allowable size of core files set too low when the corefile is created, then dbx cannot read the resulting truncated core file. In the C shell,you can set the maximum allowable core file size using the limit command (see thelimit(1) man page). In the Bourne shell and Korn shell, use the ulimit command(see the limit(1) man page). You can change the limit on core file size in your shellstart-up file, re-source the start-up file, and then rerun the program that producedthe core file to produce a complete core file.
If the core file is incomplete, and the stack segment is missing, then stack traceinformation is not available. If the runtime linker information is missing, then thelist of loadobjects is not available. In this case, you get an error message about
$ dbx program_name core
(dbx) debug -c core program_name
Chapter 2 Starting dbx 51

librtld_db.so not being initialized. If the list of LWPs is missing, then no threadinformation, lwp information, or stack trace information is available.If you run thewhere command, you get an error saying the program was not “active.”
Debugging a Mismatched Core FileSometimes a core file is created on one system (the core-host) and you want to loadthe core file on another machine (the dbx-host) to debug it. However, two problemswith libraries may arise when you do so:
■ The shared libraries used by the program on the core-host may not be the samelibraries as those on the dbx-host. To get proper stack traces involving thelibraries, you’ll want to make these original libraries available on the dbx-host.
■ dbx uses system libraries in /usr/lib to help understand the implementationdetails of the run time linker and threads library on the system. It may also benecessary to provide these system libraries from the core-host so that dbx canunderstand the runtime linker data structures and the threads data structures.
The user libraries and system libraries can change in patches as well as major Solarisoperating environment upgrades, so this problem can even occur on the same host,if, for example, a patch was installed after the core file was collected, but beforerunning dbx on the core file.
dbx may display one or more of the following error messages when you load a“mismatched” core file:
Eliminating Shared Library Problems
To eliminate the library problems and debug a “mismatched” core file with dbx, youcan now do the following:
1. Set the dbx environment variable core_lo_pathmap to on.
2. Use the pathmap command to tell dbx where the correct libraries for the core fileare located.
3. Use the debug command to load the program and the core file.
dbx: core file read error: address 0xff3dd1bc not availabledbx: warning: could not initialize librtld_db.so.1 -- tryinglibDP_rtld_db.sodbx: cannot get thread info for 1 -- generic libthread_db.so errordbx: attempt to fetch registers failed - stack corrupteddbx: read of registers from (0xff363430) failed -- debugger servicefailed
52 Debugging a Program With dbx • November 2005

For example, assuming that the root partition of the core-host has been exportedover NFS and can be accessed via /net/core-host/ on the dbx-host machine, youwould use the following commands to load the program prog and the core fileprog.core for debugging:
If you are not exporting the root partition of the core-host, you must copy thelibraries by hand. You need not re-create the symbolic links. (For example, you neednot make a link from libc.so to libc.so.1; just make sure libc.so.1 isavailable.)
Things to Remember
Keep the following things in mind when debugging a mismatched core file:
■ The pathmap command does not recognize a pathmap for ’/’ so you cannot usethe following command:
pathmap / /net/core-host
■ The single-argument mode for the pathmap command does not work withloadobject pathnames, so use the two argument from-path to-path mode.
■ Debugging the core file is likely to work better if the dbx-host has either the sameor a more recent version of the Solaris operating environment than the core-host,though this is not always necessary.
■ The system libraries that you might need are:
■ For the runtime linker:
/usr/lib/ld.so.1
/usr/lib/librtld_db.so.1
/usr/lib/64/ld.so.1
/usr/lib/64/librtld_db.so.1
■ For the threads library, depending on which implementation of libthreadyou are using:
/usr/lib/libthread_db.so.1
/usr/lib/64/libthread_db.so.1
/usr/lib/lwp/libthread_db.so.1
/usr/lib/lwp/64/libthread_db.so.1
(dbx) dbxenv core_lo_pathmap on(dbx) pathmap /usr /net/core-host/usr(dbx) pathmap /appstuff /net/core-host/appstuff(dbx) debug prog prog.core
Chapter 2 Starting dbx 53

The /usr/lib/lwp files apply only if you are running dbx in the Solaris 8operating environment and only if you are using the alternate libthread library.
You will need the 64-bit versions of the xxx_db.so libraries if dbx is running ona 64-bit capable version of the Solaris OS since these system libraries are loadedand used as part of dbx, not as part of the target program.
The ld.so.1 libraries are part of the core file image like libc.so or any otherlibrary, so you need the 32-bit ld.so.1 library or 64-bit ld.so.1 library thatmatches the program that created the core file.
■ If you are looking at a core file from a threaded program, and the wherecommand does not display a stack, try using lwp commands. For example:.
The lack of a thread stack can indicate a problem with thread_db.so.1Therefore, you might also want to try copying the proper libthread_db.so.1library from the core-host.
Using the Process IDYou can attach a running process to dbx using the process ID as an argument to thedbx command.
To attach dbx to a running process that includes Java™ code and C JNI (Java™ NativeInterface) code or C++ JNI code:
(dbx) wherecurrent thread: t@0[1] 0x0(), at 0xffffffff(dbx) lwpso>l@1 signal SIGSEGV in _sigfillset()(dbx) lwp l@1(dbx) where=>[1] _sigfillset(), line 2 in "lo.c"
[2] _liblwp_init(0xff36291c, 0xff2f9740, ...[3] _init(0x0, 0xff3e2658, 0x1, ...
...
$ dbx program_name process_id
$ dbx program_name{.class | .jar} process_id
54 Debugging a Program With dbx • November 2005

You can also attach to a process using its process ID without knowing the name ofthe program.
Because the program name remains unknown to dbx, you cannot pass arguments tothe process in a run command.
For more information, see “Attaching dbx to a Running Process” on page 94.
The dbx Startup SequenceWhen you start dbx,if you do not specify the -S option, dbx looks for the installedstartup file, dbxrc, in the directory /installation_directory/lib. (The defaultinstallation_directory is /opt/SUNWspro on Solaris platforms and/opt/sun/sunstudio10u1 on Linux platforms.) If your Sun Studio software is notinstalled in the default directory, dbx derives the path to the dbxrc file from thepath to the dbx executable.
Then dbx searches for a .dbxrc file in the current directory, then in $HOME. You canspecify a different startup file than .dbxrc explicitly by specifying the file pathusing the -s option. For more information, see “Using the dbx Initialization File” onpage 65.
A startup file may contain any dbx command, and commonly contains alias,dbxenv, pathmap, and Korn shell function definitions. However, certain commandsrequire that a program has been loaded or a process has been attached to. All startupfiles are loaded before the program or process is loaded. The startup file may alsosource other files using the source or .(period) command. You can also use thestartup file to set other dbx options.
As dbx loads program information, it prints a series of messages, such as Readingfilename.
Once the program is finished loading, dbx is in a ready state, visiting the “main”block of the program (for C or C++: main(); for Fortran 95: MAIN()). Typically, youset a breakpoint (for example, stop in main) and then issue a run command for aC program.
$ dbx - process_id
Chapter 2 Starting dbx 55

Setting Startup PropertiesYou can use the pathmap, dbxenv, and alias commands to set startup propertiesfor your dbx sessions.
Mapping the Compile-time Directory to theDebug-time DirectoryBy default, dbx looks in the directory in which the program was compiled for thesource files associated with the program being debugged. If the source or object filesare not there or the machine you are using does not use the same path name, youmust inform dbx of their location.
If you move the source or object files, you can add their new location to the searchpath. The pathmap command creates a mapping from your current view of the filesystem to the name in the executable image. The mapping is applied to source pathsand object file paths.
Add common pathmaps to your .dbxrc file.
To establish a new mapping from the directory from to the directory to, type:
If -c is used, the mapping is applied to the current working directory as well.
The pathmap command is useful for dealing with automounted and explicit NFS-mounted file systems with different base paths on differing hosts. Use -c when youtry to correct problems due to the automounter because current working directoriesare inaccurate on automounted file systems.
The mapping of /tmp_mnt to / exists by default.
For more information, see “pathmap Command” on page 359.
(dbx) pathmap [ -c ] from to
56 Debugging a Program With dbx • November 2005

Setting dbx Environment VariablesYou can use the dbxenv command to either list or set dbx customization variables.You can place dbxenv commands in your .dbxrc file. To list variables, type:
You can also set dbx environment variables. See Chapter 3 for more informationabout the .dbxrc file and about setting these variables.
For more information, see “Setting dbx Environment Variables” on page 66 and“dbxenv Command” on page 324.
Creating Your Own dbx CommandsYou can create your own dbx commands using the kalias or dalias commands.For more information, see “dalias Command” on page 320.
Compiling a Program for DebuggingYou must prepare your program for debugging with dbx by compiling it with the -gor -g0 option.
The -g option instructs the compiler to generate debugging information duringcompilation.
For example, to compile using C++, type:
In C++, the -g option turns on debugging and turns off inlining of functions. The-g0 (zero) option turns on debugging and does not affect inlining of functions. Youcannot debug inline functions with the -g0 option. The -g0 option can significantlydecrease link time and dbx start-up time (depending on the use of inlined functionsby the program).
To compile optimized code for use with dbx, compile the source code with both the-O (uppercase letter O) and the -g options.
$ dbxenv
% CC -g example_source.cc
Chapter 2 Starting dbx 57

Debugging Optimized CodeThe dbx tool provides partial debugging support for optimized code. The extent ofthe support depends largely upon how you compiled the program.
When analyzing optimized code, you can:
■ Stop execution at the start of any function (stop in function command)■ Evaluate, display, or modify arguments■ Evaluate, display, or modify global or static variables■ Single-step from one line to another (next or step command)
However, with optimized code, dbx cannot evaluate, display, or modify localvariables.
When programs are compiled with optimization and debugging enabled at the sametime (using the -O -g options), dbx operates in a restricted mode.
The details about which compilers emit which kind of symbolic information underwhat circumstances is considered an unstable interface and is likely to change fromrelease to release.
Source line information is available, but the code for one source line might appear inseveral different places for an optimized program, so stepping through a program bysource line results in the “current line” jumping around in the source file, dependingon how the code was scheduled by the optimizer.
Tail call optimization can result in missing stack frames when the last effectiveoperation in a function is a call to another function.
Generally, symbolic information for parameters, local variables, and global variablesis available for optimized programs. Type information about structs, unions, C++classes, and the types and names of local variables, global variables, and parametersshould be available. Complete information about the location of these items in theprogram is not available for optimized programs. The C++ compiler does notprovide symbolic type information about local variables; the C compiler does.
Code Compiled Without the -g OptionWhile most debugging support requires that a program be compiled with -g, dbxstill provides the following level of support for code compiled without -g:
■ Backtrace (dbx where command)■ Calling a function (but without parameter checking)■ Checking global variables
58 Debugging a Program With dbx • November 2005

Note, however, that dbx cannot display source code unless the code was compiledwith the -g option. This restriction also applies to code that has had strip -xapplied to it.
Shared Libraries Require the -g Option for Fulldbx SupportFor full support, a shared library must also be compiled with the -g option. If youbuild a program with shared library modules that were not compiled with the -goption, you can still debug the program. However, full dbx support is not possiblebecause the information was not generated for those library modules.
Completely Stripped ProgramsThe dbx tool can debug programs that have been completely stripped. Theseprograms contain some information that can be used to debug your program, butonly externally visible functions are available. Some runtime checking works onstripped programs or load objects: memory use checking works, and access checkingworks with code stripped with strip -x but not with code stripped with strip.
Quitting DebuggingA dbx session runs from the time you start dbx until you quit dbx; you can debugany number of programs in succession during a dbx session.
To quit a dbx session, type quit at the dbx prompt.
When you start dbx and attach it to a running process using the process_id option,the process survives and continues when you quit the debugging session. dbxperforms an implicit detach before quitting the session.
(dbx) quit
Chapter 2 Starting dbx 59

Stopping a Process ExecutionYou can stop execution of a process at any time by pressing Ctrl+C without leavingdbx.
Detaching a Process From dbx
If you have attached dbx to a process, you can detach the process from dbx withoutkilling it or the dbx session by using the detach command.
To detach a process from dbx without killing the process, type:
You can detach a process and leave it in a stopped state while you temporarily applyother /proc-based debugging tools that might be blocked when dbx has exclusiveaccess. For more information, see “Detaching dbx From a Process” on page 95.
For more information on the detach command, see “detach Command” onpage 327.
Killing a Program Without Terminating theSessionThe dbx kill command terminates debugging of the current process as well askilling the process. However, kill preserves the dbx session itself leaving dbxready to debug another program.
Killing a program is a good way of eliminating the remains of a program you weredebugging without exiting dbx.
To kill a program executing in dbx, type:
For more information, see “kill Command” on page 345.
(dbx) detach
(dbx) kill
60 Debugging a Program With dbx • November 2005

Saving and Restoring a Debugging RunThe dbx tool provides three commands for saving all or part of a debugging run andreplaying it later:
■ save [-number] [filename]■ restore [filename]■ replay [-number]
Using the save CommandThe save command saves to a file all debugging commands issued from the lastrun, rerun, or debug command up to the save command. This segment of adebugging session is called a debugging run.
The save command saves more than the list of debugging commands issued. Itsaves debugging information associated with the state of the program at the start ofthe run—breakpoints, display lists, and the like. When you restore a saved run, dbxuses the information in the save-file.
You can save part of a debugging run; that is, the whole run minus a specifiednumber of commands from the last one entered. Example A shows a complete savedrun. Example B shows the same run saved, minus the last two steps.
Chapter 2 Starting dbx 61

.
If you are not sure where you want to end the run you are saving, use the historycommand to see a list of the debugging commands issued since the beginning of thesession.
Note – By default, the save command writes information to a special save-file. Ifyou want to save a debugging run to a file you can restore later, you can specify afile name with the save command. See “Saving a Series of Debugging Runs asCheckpoints” on page 63.
To save an entire debugging run up to the save command, type:
To save part of a debugging run, use the save number command, where number isthe number of commands back from the save command that you do not wantsaved.
(dbx) save
(dbx) save -number
62 Debugging a Program With dbx • November 2005

Saving a Series of Debugging Runs asCheckpointsIf you save a debugging run without specifying a file name, dbx writes theinformation to a special save-file. Each time you save, dbx overwrites this save-file.However, by giving the save command a filename argument, you can save adebugging run to a file that you can restore later, even if you have saved otherdebugging runs since the one saved to filename.
Saving a series of runs gives you a set of checkpoints, each one starting farther back inthe session. You can restore any one of these saved runs, continue, then reset dbx tothe program location and state saved in an earlier run.
To save a debugging run to a file other than the default save-file:
Restoring a Saved RunAfter saving a run, you can restore the run using the restore command. dbx usesthe information in the save-file. When you restore a run, dbx first resets the internalstate to what it was at the start of the run, then reissues each of the debuggingcommands in the saved run.
Note – The source command also reissues a set of commands stored in a file, but itdoes not reset the state of dbx; it only reissues the list of commands from the currentprogram location.
Prerequisites for an Exact Restoration of a Saved Run
For exact restoration of a saved debugging run, all the inputs to the run must beexactly the same: arguments to a run-type command, manual inputs, and file inputs.
Note – If you save a segment and then issue a run, rerun, or debug commandbefore you do a restore, restore uses the arguments to the second, post-saverun, rerun, or debug command. If those arguments are different, you might not getan exact restoration.
(dbx) save filename
Chapter 2 Starting dbx 63

To restore a saved debugging run:, type:
To restore a debugging run saved to a file other than the default save-file:, type:
Saving and Restoring Using replay
The replay command is a combination command, equivalent to issuing a save -1followed immediately by a restore. The replay command takes a negativenumber argument, which it passes to the save portion of the command. By default,the value of -number is -1, so replay works as an undo command, restoring the lastrun up until, but not including, the last command issued.
To replay the current debugging run, minus the last debugging command issued,type:
To replay the current debugging run and stop the run before a specific command,use the dbx replay command, where number is the number of commands back fromthe last debugging command.
(dbx) restore
(dbx) restore filename
(dbx) replay
(dbx) replay -number
64 Debugging a Program With dbx • November 2005

CHAPTER 3
Customizing dbx
This chapter describes the dbx environment variables you can use to customizecertain attributes of your debugging environment, and how to use the initializationfile, .dbxrc, to preserve your changes and adjustments from session to session.
This chapter is organized into the following sections:
■ Using the dbx Initialization File■ The dbx Environment Variables and the Korn Shell■ Setting dbx Environment Variables
Using the dbx Initialization FileThe dbx initialization file stores dbx commands that are executed each time youstart dbx. Typically, the file contains commands that customize your debuggingenvironment, but you can place any dbx commands in the file. If you customize dbxfrom the command line while you are debugging, those settings apply only to thecurrent debugging session.
Note – A .dbxrc file should not contain commands that execute your code.However, you can put such commands in a file, and then use the dbx sourcecommand to execute the commands in that file.
During startup, the search order is:
1. Installation directory (unless you specify the -S option to the dbx command)/installation_directory/lib/dbxrc (the default installation_directory is/opt/SUNWspro on Solaris platforms and /opt/sun/sunstudio9 on Linuxplatform). If your Sun Studio software is not installed in the defaultinstallation_directory, dbx derives the path to the dbxrc file from the path to thedbx executable.
65

2. Current directory ./.dbxrc
3. Home directory $HOME/.dbxrc
Creating a .dbxrc FileTo create a .dbxrc file that contains common customizations and aliases, type:
You can then customize the resulting file by using your text editor to uncomment theentries you want to have executed.
Initialization File SampleHere is a sample .dbxrc file:
The first line changes the default setting for the case sensitivity control:
■ dbxenv is the command used to set dbx environment variables. (For a completelist of dbx environment variables, see “Setting dbx Environment Variables” onpage 66.)
■ input_case_sensitive is the dbx environment variable that controls casesensitivity.
■ false is the setting for input_case_sensitive.
The next line is a debugging command, catch, which adds a system signal, FPE, tothe default list of signals to which dbx responds, stopping the program.
Setting dbx Environment VariablesYou can use the dbxenv command to set the dbx environment variables thatcustomize your dbx sessions.
(dbx) help .dbxrc>$HOME/.dbxrc
dbxenv input_case_sensitive falsecatch FPE
66 Debugging a Program With dbx • November 2005

To display the value of a specific variable, type:
To show all variables and their values, type:
To set the value of a variable, type:
TABLE 3-1 shows all of the dbx environment variables that you can set:
(dbx) dbxenv variable
(dbx) dbxenv
(dbx) dbxenv variable value
TABLE 3-1 dbx Environment Variables
dbx Environment Variable What the Variable Does
array_bounds_check on|off If set to on, dbx checks the array bounds.Default: on.
CLASSPATHX Lets you specify to dbx a path for Java class files thatare loaded by custom class loaders
core_lo_pathmap on|off Controls whether dbx uses pathmap settings tolocate the correct libraries for a “mismatched” corefile. Default: off.
disassembler_versionautodetect|v8|v9|v9vis
SPARC platform: Sets the version of dbx's built-indisassembler for SPARC V8, V9, or V9 with theVisual Instruction set. Default is autodetect, whichsets the mode dynamically depending on the type ofthe machine a.out is running on.
IA platforms: The valid choice is autodetect.
fix_verbose on|off Governs the printing of compilation line during afix. Default: off
follow_fork_inherit on|off When following a child, inherits or does not inheritbreakpoints. Default: off
Chapter 3 Customizing dbx 67

follow_fork_modeparent|child|both|ask
Determines which process is followed after a fork;that is, when the current process executes a fork,vfork, or fork1. If set to parent, the processfollows the parent. If set to child, it follows thechild. If set to both, it follows the child, but theparent process remains active. If set to ask, you areasked which process to follow whenever a fork isdetected. Default: parent.
follow_fork_mode_innerunset|
parent|child|both
Of relevance after a fork has been detected iffollow_fork_mode was set to ask, and you chosestop. By setting this variable, you need not usecont -follow.
input_case_sensitiveautodetect|
true|false
If set to autodetect, dbx automatically selects casesensitivity based on the language of the file: falsefor Fortran files, otherwise true. If true, casematters in variable and function names; otherwise,case is not significant.Default: autodetect.
JAVASRCPATH Specifies the directories in which dbx should look forJava source files.
jdbx_mode java| jni| native Stores the current dbx mode. It can have thefollowing settings: java, jni, or native.
jvm_invocation The jvm_invocation environment variable lets youcustomize the way the JVM™ software is started.(The terms “Java virtual machine” and “JVM” meana virtual machine for the Java™ platform.) For moreinformation, see “Customizing Startup of the JVMSoftware” on page 238.
language_modeautodetect|main|c|c++|fortran|fortran90
Governs the language used for parsing andevaluating expressions.• autodetect sets the expression language to the
language of the current file. Useful if debuggingprograms with mixed languages (default).
• main sets the expression language to the languageof the main routine in the program. Useful ifdebugging homogeneous programs.
• c, c++, c++, fortran, or fortran90 sets theexpression language to the selected language.
mt_scalable on|off When enabled, dbx will be more conservative in itsresource usage and will be able to debug processeswith upwards of 300 LWPs. The down side issignificant slowdown. Default: off.
TABLE 3-1 dbx Environment Variables (Continued)
dbx Environment Variable What the Variable Does
68 Debugging a Program With dbx • November 2005
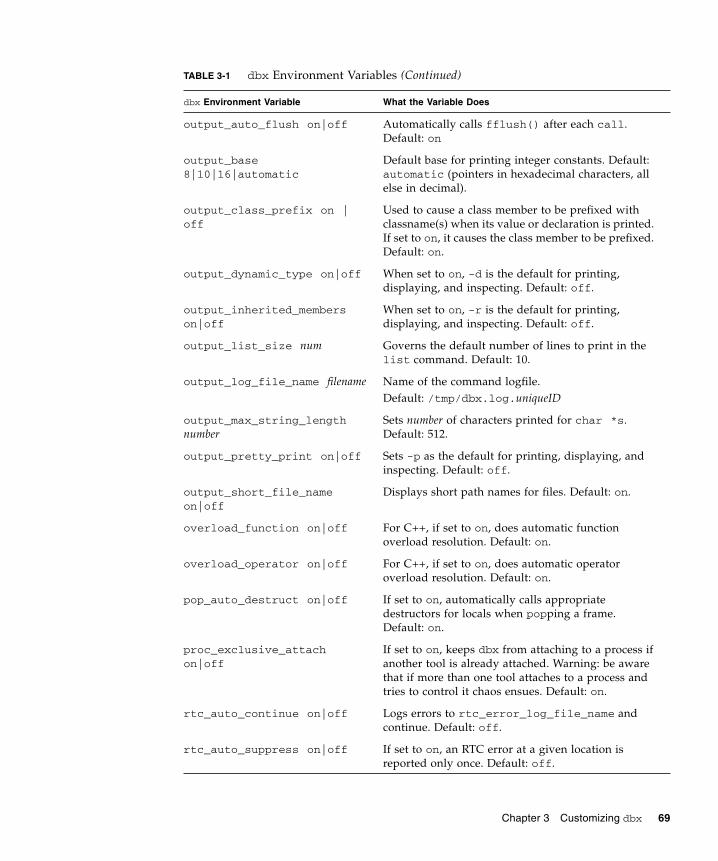
output_auto_flush on|off Automatically calls fflush() after each call.Default: on
output_base8|10|16|automatic
Default base for printing integer constants. Default:automatic (pointers in hexadecimal characters, allelse in decimal).
output_class_prefix on |off
Used to cause a class member to be prefixed withclassname(s) when its value or declaration is printed.If set to on, it causes the class member to be prefixed.Default: on.
output_dynamic_type on|off When set to on, -d is the default for printing,displaying, and inspecting. Default: off.
output_inherited_memberson|off
When set to on, -r is the default for printing,displaying, and inspecting. Default: off.
output_list_size num Governs the default number of lines to print in thelist command. Default: 10.
output_log_file_name filename Name of the command logfile.Default: /tmp/dbx.log.uniqueID
output_max_string_lengthnumber
Sets number of characters printed for char *s.Default: 512.
output_pretty_print on|off Sets -p as the default for printing, displaying, andinspecting. Default: off.
output_short_file_nameon|off
Displays short path names for files. Default: on.
overload_function on|off For C++, if set to on, does automatic functionoverload resolution. Default: on.
overload_operator on|off For C++, if set to on, does automatic operatoroverload resolution. Default: on.
pop_auto_destruct on|off If set to on, automatically calls appropriatedestructors for locals when popping a frame.Default: on.
proc_exclusive_attachon|off
If set to on, keeps dbx from attaching to a process ifanother tool is already attached. Warning: be awarethat if more than one tool attaches to a process andtries to control it chaos ensues. Default: on.
rtc_auto_continue on|off Logs errors to rtc_error_log_file_name andcontinue. Default: off.
rtc_auto_suppress on|off If set to on, an RTC error at a given location isreported only once. Default: off.
TABLE 3-1 dbx Environment Variables (Continued)
dbx Environment Variable What the Variable Does
Chapter 3 Customizing dbx 69

rtc_biu_at_exiton|off|verbose
Used when memory use checking is on explicitly orvia check -all. If the value is on, a non-verbosememory use (blocks in use) report is produced atprogram exit. If the value is verbose, a verbosememory use report is produced at program exit. Thevalue off causes no output. Default: on.
rtc_error_limit number Number of RTC errors to be reported. Default: 1000.
rtc_error_log_file_namefilename
Name of file to which RTC errors are logged ifrtc_auto_continue is set. Default:/tmp/dbx.errlog.uniqueID
rtc_error_stack on|off If set to on, stack traces show frames correspondingto RTC internal mechanisms. Default: off.
rtc_inherit on|off If set to on, enables runtime checking on childprocesses that are executed from the debuggedprogram and causes the LD_PRELOAD environmentvariable to be inherited. Default: off.
rtc_mel_at_exiton|off|verbose
Used when memory leak checking is on. If the valueis on, a non-verbose memory leak report is producedat program exit. If the value is verbose, a verbosememory leak report is produced at program exit. Thevalue off causes no output. Default: on.
run_autostart on|off If set to on with no active program, step, next,stepi, and nexti implicitly run the program andstop at the language-dependent main routine. If setto on, cont implies run when necessary.Default: off.
run_io stdio|pty Governs whether the user program’s input/output isredirected to dbx's stdio or a specific pty. The pty isprovided by run_pty. Default: stdio.
run_pty ptyname Sets the name of the pty to use when run_io is set topty. Ptys are used by graphical user interfacewrappers.
run_quick on|off If set to on, no symbolic information is loaded. Thesymbolic information can be loaded on demandusing prog -readsysms. Until then, dbx behavesas if the program being debugged is stripped.Default: off.
TABLE 3-1 dbx Environment Variables (Continued)
dbx Environment Variable What the Variable Does
70 Debugging a Program With dbx • November 2005
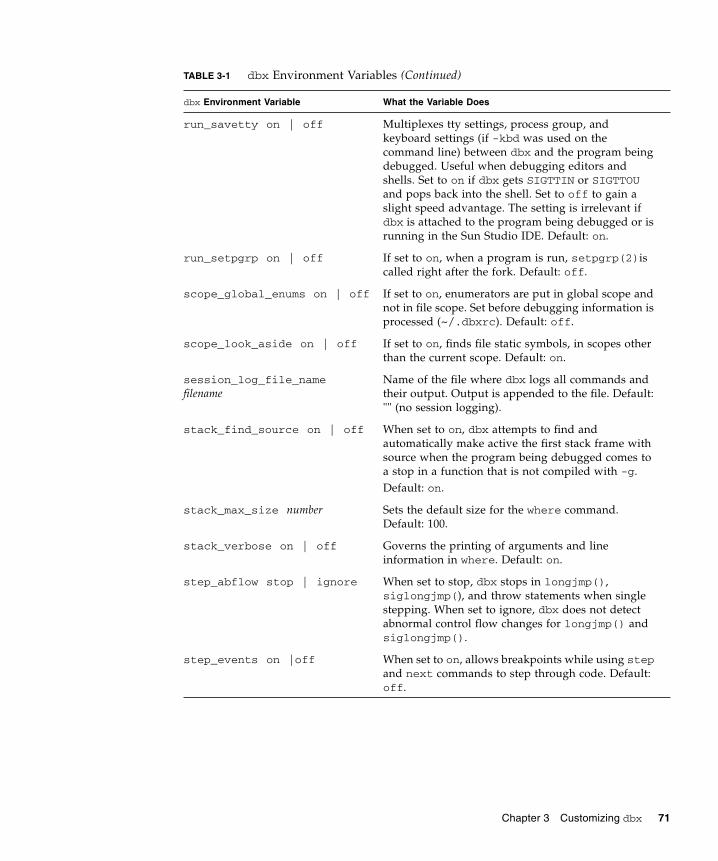
run_savetty on | off Multiplexes tty settings, process group, andkeyboard settings (if -kbd was used on thecommand line) between dbx and the program beingdebugged. Useful when debugging editors andshells. Set to on if dbx gets SIGTTIN or SIGTTOUand pops back into the shell. Set to off to gain aslight speed advantage. The setting is irrelevant ifdbx is attached to the program being debugged or isrunning in the Sun Studio IDE. Default: on.
run_setpgrp on | off If set to on, when a program is run, setpgrp(2)iscalled right after the fork. Default: off.
scope_global_enums on | off If set to on, enumerators are put in global scope andnot in file scope. Set before debugging information isprocessed (~/.dbxrc). Default: off.
scope_look_aside on | off If set to on, finds file static symbols, in scopes otherthan the current scope. Default: on.
session_log_file_namefilename
Name of the file where dbx logs all commands andtheir output. Output is appended to the file. Default:"" (no session logging).
stack_find_source on | off When set to on, dbx attempts to find andautomatically make active the first stack frame withsource when the program being debugged comes toa stop in a function that is not compiled with -g.Default: on.
stack_max_size number Sets the default size for the where command.Default: 100.
stack_verbose on | off Governs the printing of arguments and lineinformation in where. Default: on.
step_abflow stop | ignore When set to stop, dbx stops in longjmp(),siglongjmp(), and throw statements when singlestepping. When set to ignore, dbx does not detectabnormal control flow changes for longjmp() andsiglongjmp().
step_events on |off When set to on, allows breakpoints while using stepand next commands to step through code. Default:off.
TABLE 3-1 dbx Environment Variables (Continued)
dbx Environment Variable What the Variable Does
Chapter 3 Customizing dbx 71

The dbx Environment Variables and theKorn ShellEach dbx environment variable is also accessible as a ksh variable. The name of theksh variable is derived from the dbx environment variable by prefixing it withDBX_. For example dbxenv stack_verbose and echo $DBX_stack_verboseyield the same output. You can assign the value of the variable directly or with thedbxenv command.
step_granularity statement| line
Controls granularity of source line stepping. Whenset to statement the following code:a(); b();
takes the two next commands to execute. When setto line a single next command executes the code.The granularity of line is particularly useful whendealing with multiline macros. Default: statement.
suppress_startup_messagenumber
Sets the release level below which the startupmessage is not printed. Default: 3.01.
symbol_info_compressionon|off
When set to on, reads debugging information foreach include file only once. Default: on.
trace_speed number Sets the speed of tracing execution. Value is thenumber of seconds to pause between steps.Default: 0.50.
TABLE 3-1 dbx Environment Variables (Continued)
dbx Environment Variable What the Variable Does
72 Debugging a Program With dbx • November 2005

CHAPTER 4
Viewing and Navigating To Code
Each time the program you are debugging stops, dbx prints the source lineassociated with the stop location. At each program stop, dbx resets the value of thecurrent function to the function in which the program is stopped. Before the programstarts running and when it is stopped, you can move to, or navigate through,functions and files elsewhere in the program.
This chapter describes how dbx navigates to code and locates functions andsymbols. It also covers how to use commands to navigate to code or look updeclarations for identifiers, types, and classes.
This chapter is organized into the following sections
■ Navigating To Code■ Types of Program Locations■ Program Scope■ Qualifying Symbols With Scope Resolution Operators■ Locating Symbols■ Viewing Variables, Members, Types, and Classes■ Debugging Information in Object files and Executables■ Finding Source and Object Files
Navigating To CodeWhen a program is stopped, you can navigate to code elsewhere in the program.You can navigate to any function or file that is part of the program. Navigating setsthe current scope (see “Program Scope” on page 76). It is useful for determiningwhen and at what source line you want to set a stop at breakpoint.
73

Navigating To a FileYou can navigate to any file dbx recognizes as part of the program (even if a moduleor file was not compiled with the -g option). To navigate to a file:
Using the file command without arguments echoes the file name of the file you arecurrently navigating.
dbx displays the file from its first line unless you specify a line number.
For information on setting a stop at breakpoint at a line of source code, see “Settinga stop Breakpoint at a Line of Source Code” on page 102.
Navigating To FunctionsYou can use the func command to navigate to a function. To navigate to a function,type the command func followed by the function name. For example:
The func command by itself echoes the current function.
For more information, see “func Command” on page 337
(dbx) file filename
(dbx) file
(dbx) file filename ; list line_number
(dbx) func adjust_speed
74 Debugging a Program With dbx • November 2005

Selecting From a List of C++ Ambiguous Function Names
If you try to navigate to a C++ member function with an ambiguous name or anoverloaded function name, a list is displayed, showing all functions with theoverloaded name. Type the number of the function you want to navigate. If youknow which specific class a function belongs to, you can type the class name andfunction name. For example:
Choosing Among Multiple Occurrences
If multiple symbols are accessible from the same scope level, dbx prints a messagereporting the ambiguity.
In the context of the which command, choosing from the list of occurrences does notaffect the state of dbx or the program. Whichever occurrence you choose, dbx echoesthe name.
Printing a Source ListingUse the list command to print the source listing for a file or function. Once younavigate through a file, list prints number lines from the top. Once you navigatethrough a function, list prints its lines.
For detailed information on the list command, see “list Command” on page 347.
(dbx) func block::block
(dbx) func main(dbx) which C::fooMore than one identifier ’foo’.Select one of the following:0) Cancel1) ‘a.out‘t.cc‘C::foo(int)2) ‘a.out‘t.cc‘C::foo()>1‘a.out‘t.cc‘C::foo(int)
Chapter 4 Viewing and Navigating To Code 75

Walking the Call Stack to Navigate To CodeAnother way to navigate to code when a live process exists is to “walk the callstack,” using the stack commands to view functions currently on the call stack,which represent all currently active routines. Walking the stack causes the currentfunction and file to change each time you display a stack function. The stop locationis considered to be at the “bottom” of the stack, so to move away from it, use the upcommand, that is, move toward the main or begin function. Use the downcommand to move toward the current frame.
For more information on walking the call stack, see “Walking the Stack andReturning Home” on page 118.
Types of Program Locationsdbx uses three global locations to track the parts of the program you are inspecting:
■ The current address, which is used and updated by the dis command (see “disCommand” on page 328) and the examine command (see “examine Command”on page 332).
■ The current source code line, which is used and updated by the list command(see “list Command” on page 347). This line number is reset by somecommands that alter the visiting scope (see “Changing the Visiting Scope” onpage 78).
■ The current visiting scope, which is a compound variable described in the“Visiting Scope” on page 77. The visiting scope is used during expressionevaluation. It is updated by the line command, the func command, the filecommand, the list func command and the list file command.
Program ScopeA scope is a subset of the program defined in terms of the visibility of a variable orfunction. A symbol is said to be “in scope” if its name is visible at a given point ofexecution. In C, functions may have global or file-static scope; variables may haveglobal, file-static, function, or block scope.
76 Debugging a Program With dbx • November 2005

Variables That Reflect the Current ScopeThe following variables always reflect the current program counter of the currentthread or LWP, and are not affected by the various commands that change thevisiting scope:
Visiting ScopeWhen you inspect various elements of your program with dbx, you modify thevisiting scope. dbx uses the visiting scope during expression evaluation for purposessuch as resolving ambiguous symbols. For example, if you type the followingcommand, dbx uses the visiting scope to determine which i to print.
Each thread or LWP has its own visiting scope. When you switch between threads,each thread remembers its visiting scope.
Components of the Visiting Scope
Some of the components of the visiting scope are visible in the following predefinedksh variables:
$scope Scope of the current program counter
$lineno Current line number
$func Current function
$class Class to which $func belongs
$file Current source file
$loadobj Current loadobject
(dbx) print i
$vscope Language scope
$vloadobj Current visiting loadobject
$vfile Current visiting source file
$vfunc Current visiting function
$vlineno Current visiting line number
$vclass C++ class
Chapter 4 Viewing and Navigating To Code 77

All of the components of the current visiting scope stay compatible with oneanother. For example, if you visit a file that contains no functions, the currentvisiting source file is updated to the new file name and the current visiting functionis updated to NULL.
Changing the Visiting Scope
The following commands are the most common ways of changing the visiting scope:
■ func■ file■ up■ down■ frame■ list procedure
The debug command and the attach command set the initial visiting scope.
When you hit a breakpoint, dbx sets the visiting scope to the current location. If thestack_find_source environment variable (see “Setting dbx EnvironmentVariables” on page 66) is set to ON, dbx attempts to find and make active a stackframe that has source code.
When you use the up command (see “up Command” on page 398), the downcommand (“down Command” on page 330), the frame number command (see“frame Command” on page 337), or the pop command (see “pop Command” onpage 361)to change the current stack frame, dbx sets the visiting scope according tothe program counter from the new stack frame.
The line number location used by the list command (see “list Command” onpage 347) changes the visiting scope only if you use the list function or list filecommand. When the visiting scope is set, the line number location for the listcommand is set to the first line number of the visiting scope. When yousubsequently use the list command, the current line number location for the listcommand is updated, but as long as you are listing lines in the current file, thevisiting scope does not change. For example, if you type the following, dbx lists thestart of the source for my_func, and changes the visiting scope to my_func.
If you type the following, dbx lists line 127 in the current source file, and does notchange the visiting scope.
(dbx) list my_func
(dbx) list 127
78 Debugging a Program With dbx • November 2005

When you use the file command or the func command to change the current fileor the current function, the visiting scope is updated accordingly.
Qualifying Symbols With ScopeResolution OperatorsWhen using the func or file command, you might need to use scope resolutionoperators to qualify the names of the functions that you give as targets.
dbx provides three scope resolution operators with which to qualify symbols: thebackquote operator (‘), the C++ double colon operator (::), and the block localoperator (:lineno). You use them separately or, in some cases, together.
In addition to qualifying file and function names when navigating through code,symbol name qualifying is also necessary for printing and displaying out-of-scopevariables and expressions, and for displaying type and class declarations (using thewhatis command). The symbol qualifying rules are the same in all cases; thissection covers the rules for all types of symbol name qualifying.
Backquote OperatorUse the backquote character (‘) to find a variable or function of global scope:
A program can use the same function name in two different files (or compilationmodules). In this case, you must also qualify the function name to dbx so that itregisters which function you will navigate. To qualify a function name with respectto its file name, use the general purpose backquote (‘) scope resolution operator.
C++ Double Colon Scope Resolution OperatorUse the double colon operator (::) to qualify a C++ member function, a top levelfunction, or a variable with global scope with:
(dbx) print ‘item
(dbx) func ‘file_name‘function_name
Chapter 4 Viewing and Navigating To Code 79

■ An overloaded name (same name used with different argument types)■ An ambiguous name (same name used in different classes)
You might want to qualify an overloaded function name. If you do not qualify it,dbx displays an overload list so you can choose which function you will navigate. Ifyou know the function class name, you can use it with the double colon scoperesolution operator to qualify the name.
For example, if hand is the class name and draw is the function name, type:
Block Local OperatorThe block local operator (:line_number) allows you to refer specifically to a variablein a nested block. You might want to do so if you have a local variable shadowing aparameter or member name, or if you have several blocks, each with its own versionof a local variable. The line_number is the number of the first line of code within theblock for the variable of interest. When dbx qualifies a local variable with the blocklocal operator, dbx uses the line number of the first block of code, but you can useany line number within the scope in dbx expressions.
In the following example, the block local operator (:230) is combined with thebackquote operator.
(dbx) func class::function_name (args)
(dbx) func hand::draw
(dbx) stop in `animate.o`change_glyph:230`item
80 Debugging a Program With dbx • November 2005
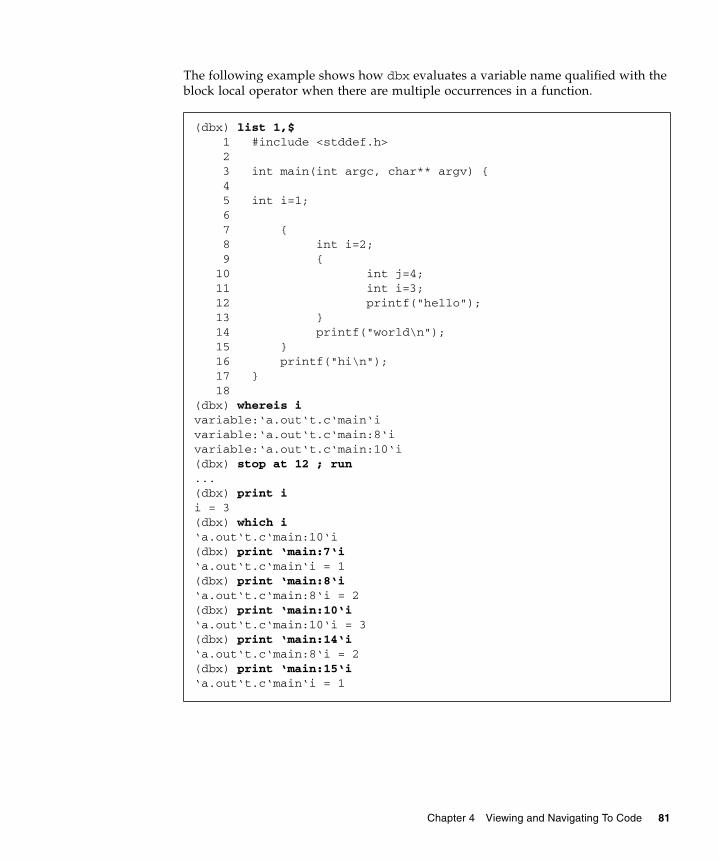
The following example shows how dbx evaluates a variable name qualified with theblock local operator when there are multiple occurrences in a function.
(dbx) list 1,$1 #include <stddef.h>23 int main(int argc, char** argv) {45 int i=1;67 {8 int i=2;9 {10 int j=4;11 int i=3;12 printf("hello");13 }14 printf("world\n");15 }16 printf("hi\n");17 }18
(dbx) whereis ivariable:‘a.out‘t.c‘main‘ivariable:‘a.out‘t.c‘main:8‘ivariable:‘a.out‘t.c‘main:10‘i(dbx) stop at 12 ; run...(dbx) print ii = 3(dbx) which i‘a.out‘t.c‘main:10‘i(dbx) print ‘main:7‘i‘a.out‘t.c‘main‘i = 1(dbx) print ‘main:8‘i‘a.out‘t.c‘main:8‘i = 2(dbx) print ‘main:10‘i‘a.out‘t.c‘main:10‘i = 3(dbx) print ‘main:14‘i‘a.out‘t.c‘main:8‘i = 2(dbx) print ‘main:15‘i‘a.out‘t.c‘main‘i = 1
Chapter 4 Viewing and Navigating To Code 81

Linker Namesdbx provides a special syntax for looking up symbols by their linker names(mangled names in C++). Prefix the symbol name with a # (pound sign) character(use the ksh escape character \ (backslash) before any $ (dollar sign) characters), asin these examples:
Locating SymbolsIn a program, the same name might refer to different types of program entities andoccur in many scopes. The dbx whereis command lists the fully qualifiedname—hence, the location—of all symbols of that name. The dbx which commandtells you which occurrence of a symbol dbx would use if you give that name in anexpression (see “which Command” on page 405).
Printing a List of Occurrences of a SymbolTo print a list of all the occurrences of a specified symbol, use whereis symbol,where symbol can be any user-defined identifier. For example:
The output includes the name of the loadable object(s) where the program definessymbol, as well as the kind of entity each object is: class, function, or variable.
Because information from the dbx symbol table is read in as it is needed, thewhereis command registers only occurrences of a symbol that are already loaded.As a debugging session gets longer, the list of occurrences can grow (see“Debugging Information in Object files and Executables” on page 89).
(dbx) stop in #.mul(dbx) whatis #\$FEcopyPc(dbx) print `foo.c`#staticvar
(dbx) whereis tableforward: `Blocks`block_draw.cc`tablefunction: `Blocks`block.cc`table::table(char*, int, int, constpoint&)class: `Blocks`block.cc`tableclass: `Blocks`main.cc`tablevariable: `libc.so.1`hsearch.c`table
82 Debugging a Program With dbx • November 2005

For more information, see “whereis Command” on page 404.
Determining Which Symbol dbx UsesThe which command tells you which symbol with a given name dbx uses if youspecify that name (without fully qualifying it) in an expression. For example:
If a specified symbol name is not in a local scope, the which command searches forthe first occurrence of the symbol along the scope resolution search path. If which findsthe name, it reports the fully qualified name.
If at any place along the search path, the search finds multiple occurrences of symbolat the same scope level, dbx prints a message in the command pane reporting theambiguity.
dbx shows the overload display, listing the ambiguous symbols names. In thecontext of the which command, choosing from the list of occurrences does not affectthe state of dbx or the program. Whichever occurrence you choose, dbx echoes thename.
The which command gives you a preview of what happens if you make symbol (inthis example, block) an argument of a command that must operate on symbol (forexample, a print command). In the case of ambiguous names, the overload displaylist indicates that dbx does not yet register which occurrence of two or more namesit uses. dbx lists the possibilities and waits for you to choose one. For moreinformation on the which command, see “which Command” on page 405.
(dbx) funcwedge::wedge(char*, int, int, const point&, load_bearing_block*)(dbx) which draw`block_draw.cc`wedge::draw(unsigned long)
(dbx) which fidMore than one identifier ’fid’.Select one of the following:0) Cancel1) `example‘file1.c‘fid2) ‘example‘file2.c‘fid
Chapter 4 Viewing and Navigating To Code 83
Scope Resolution Search PathWhen you issue a debugging command that contains an expression, the symbols inthe expression are looked up in the following order. dbx resolves the symbols as thecompiler would at the current visiting scope.
1. Within the scope of the current function using the current visiting scope (see“Visiting Scope” on page 77). If the program is stopped in a nested block, dbxsearches within that block, then in the scope of all enclosing blocks.
2. For C++ only: class members of the current function‘s class and its base class.
3. For C++ only: the current name space.
4. The parameters of the current function.
5. The immediately enclosing module, generally, the file containing the currentfunction.
6. Symbols that were made private to this shared library or executable. Thesesymbols can be created using linker scoping.
7. Global symbols for the main program, and then for shared libraries.
8. If none of the above searches are successful, dbx assumes you are referencing aprivate, or file static, variable or function in another file. dbx optionally searchesfor a file static symbol in every compilation unit depending on the value of thedbxenv setting scope_look_aside.
dbx uses whichever occurrence of the symbol it first finds along this search path.If dbx cannot find the symbol, it reports an error.
Relaxing the Scope Lookup RulesTo relax the scope lookup rules for static symbols and C++ member functions, set thedbx environment variable scope_look_aside to on:
dbxenv scope_look_aside on
or use the “double backquote” prefix:
stop in ‘‘func4 func4 may be static and not in scope
If the dbx environment variable scope_look_aside is set to on, dbx looks for:
■ Static variables defined in other files if not found in current scope. Files fromlibraries in /usr/lib are not searched.
■ C++ member functions without class qualification
84 Debugging a Program With dbx • November 2005

■ Instantiations of C++ inline member functions in other files if a member functionis not instantiated in current file.
The which command tells you which symbol dbx would choose. In the case ofambiguous names, the overload display list indicates that dbx has not yetdetermined which occurrence of two or more names it would use. dbx lists thepossibilities and waits for you to choose one.
For more information, see “func Command” on page 337.
Viewing Variables, Members, Types, andClassesThe whatis command prints the declarations or definitions of identifiers, structs,types and C++ classes, or the type of an expression. The identifiers you can look upinclude variables, functions, fields, arrays, and enumeration constants.
For more information, see “whatis Command” on page 399.
Looking Up Definitions of Variables, Members,and FunctionsTo print out the declaration of an identifier, type:
Qualify the identifier name with file and function information as needed.
For C++ programs, whatis identifier lists function template instantiations. Templatedefinitions are displayed with whatis -t identifier. See “Looking Up Definitions ofTypes and Classes” on page 87.
For Java programs, whatis identifier, lists the declaration of a class, a method in thecurrent class, a local variable in the current frame, or a field in the current class
(dbx) whatis identifier
Chapter 4 Viewing and Navigating To Code 85

To print out the member function, type:
To print out the data member, type:
On a variable, whatis tells you the variable‘s type.
On a field, whatis gives the field‘s type.
When you are stopped in a member function, you can look up the this pointer.
(dbx) whatis block::drawvoid block::draw(unsigned long pw);(dbx) whatis table::drawvoid table::draw(unsigned long pw);(dbx) whatis block::posclass point *block::pos();(dbx) whatis table::posclass point *block::pos();
(dbx) whatis block::movableint movable;
(dbx) whatis the_tableclass table *the_table;
(dbx) whatis the_table->drawvoid table::draw(unsigned long pw);
(dbx) stop in brick::draw(dbx) cont(dbx) where 1brick::draw(this = 0x48870, pw = 374752), line 124 in "block_draw.cc"(dbx) whatis thisclass brick *this;
86 Debugging a Program With dbx • November 2005
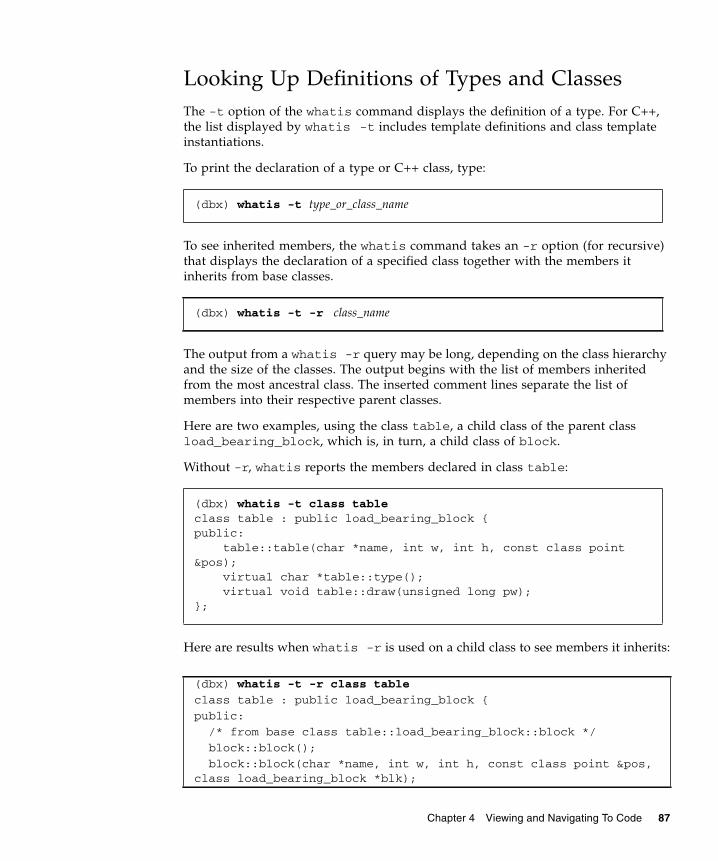
Looking Up Definitions of Types and ClassesThe -t option of the whatis command displays the definition of a type. For C++,the list displayed by whatis -t includes template definitions and class templateinstantiations.
To print the declaration of a type or C++ class, type:
To see inherited members, the whatis command takes an -r option (for recursive)that displays the declaration of a specified class together with the members itinherits from base classes.
The output from a whatis -r query may be long, depending on the class hierarchyand the size of the classes. The output begins with the list of members inheritedfrom the most ancestral class. The inserted comment lines separate the list ofmembers into their respective parent classes.
Here are two examples, using the class table, a child class of the parent classload_bearing_block, which is, in turn, a child class of block.
Without -r, whatis reports the members declared in class table:
Here are results when whatis -r is used on a child class to see members it inherits:
(dbx) whatis -t type_or_class_name
(dbx) whatis -t -r class_name
(dbx) whatis -t class tableclass table : public load_bearing_block {public: table::table(char *name, int w, int h, const class point&pos); virtual char *table::type(); virtual void table::draw(unsigned long pw);};
(dbx) whatis -t -r class table
class table : public load_bearing_block {
public:
/* from base class table::load_bearing_block::block */
block::block();
block::block(char *name, int w, int h, const class point &pos,class load_bearing_block *blk);
Chapter 4 Viewing and Navigating To Code 87

virtual char *block::type();
char *block::name();
int block::is_movable();
// deleted several members from example protected:
char *nm;
int movable;
int width;
int height;
class point position;
class load_bearing_block *supported_by;
Panel_item panel_item;
/* from base class table::load_bearing_block */
public:
load_bearing_block::load_bearing_block();
load_bearing_block::load_bearing_block(char *name, int w, inth,const class point &pos, class load_bearing_block *blk);
virtual int load_bearing_block::is_load_bearing();
virtual class list *load_bearing_block::supported_blocks();
void load_bearing_block::add_supported_block(class block &b);
void load_bearing_block::remove_supported_block(class block&b);
virtual void load_bearing_block::print_supported_blocks();
virtual void load_bearing_block::clear_top();
virtual void load_bearing_block::put_on(class block &object);
class point load_bearing_block::get_space(class block&object);
class point load_bearing_block::find_space(class block&object);
class point load_bearing_block::make_space(class block&object);
protected:
class list *support_for;
/* from class table */
public:
table::table(char *name, int w, int h, const class point &pos);
virtual char *table::type();
virtual void table::draw(unsigned long pw);
};
88 Debugging a Program With dbx • November 2005

Debugging Information in Object filesand ExecutablesGenerally, you want to compile your source files with the -g option to make yourprogram more debuggable. The -g option causes the compilers to record debugginginformation (in stabs or Dwarf format) into the object files along with the code anddata for the program.
dbx parses and loads debugging information for each object file (module) ondemand, when the information is needed. You can ask dbx to load debuginformation for any specific module, or for all modules, by using the modulecommand. See also “Finding Source and Object Files” on page 91.
Object File LoadingWhen the object (.o) files are linked together, the linker can optionally store onlysummary information into the resulting loadobject. This summary information canbe used by dbx at runtime to load the rest of the debug information from the objectfiles themselves instead of from the executable file. The resulting executable has asmaller disk-footprint, but requires that the object files be available when dbx runs.
You can override this requirement by compiling object files with the -xs option tocause all the debugging information for those object files to be put into theexecutable at link time.
If you create archive libraries (.a files) with your object files, and use the archivelibraries in your program, then dbx extracts the object files from the archive libraryas needed. The original object files are not needed at that point.
The only drawback to putting all the debugging information into the executable fileis using additional disk space. The program does not run more slowly, because thedebugging information is not loaded into the process image at run time.
The default behavior when using stabs (the default format for debugginginformation) is for the compiler to put only summary information into theexecutable.
The DWARF format doesn’t yet support object file loading.
Chapter 4 Viewing and Navigating To Code 89

Note – The DWARF format is significantly more compact than recording the sameinformation in stabs format. However, because all the information is copied into theexecutable, DWARF information can appear to be larger than stabs information.
Listing Debugging Information for ModulesThe module command and its options help you to keep track of program modulesduring the course of a debugging session. Use the module command to read indebugging information for one or all modules. Normally, dbx automatically and“lazily” reads in debugging information for modules as needed.
To read in debugging information for a module name, type:
To read in debugging information for all modules, type:
where:
To print the name of the current module, type:
(dbx) module [-f] [-q] name
(dbx) module [-f] [-q] -a
-a Specifies all modules.
-f Forces reading of debugging information, even if the file is newer thanthe executable.
-q Specifies quiet mode.
-v Specifies verbose mode, which prints language, file names, and so on.This is the default.
(dbx) module
90 Debugging a Program With dbx • November 2005

Listing ModulesThe modules command helps you keep track of modules by listing module names.
To list the names of modules containing debugging information that have alreadybeen read into dbx, type:
To list names of all program modules (whether or not they contain debugginginformation), type:
To list all program modules that contain debugging information, type:
where:
Finding Source and Object Filesdbx must know the location of the source and object code files associated with aprogram. The default directory for the object files is the directory the files were inwhen the program was last linked. The default directory for the source files is theone they were in when last compiled. If you move the source or object files, or copythem to a new location, you must either relink the program, change to the newlocation before debugging, or use the pathmap command.
dbx sometimes uses object files to load additional debugging information. Sourcefiles are used when dbx displays source code.
If you have moved the source files or object files since you compiled and linked theprogram, you can add their new location to the search path. The pathmap commandcreates a mapping from your current view of the file system to the name in theexecutable image. The mapping is applied to source paths and object file paths.
(dbx) modules [-v] -read
(dbx) modules [-v]
(dbx) modules [-v] -debug
-v Specifies verbose mode, which prints language, file names, and so on.
Chapter 4 Viewing and Navigating To Code 91
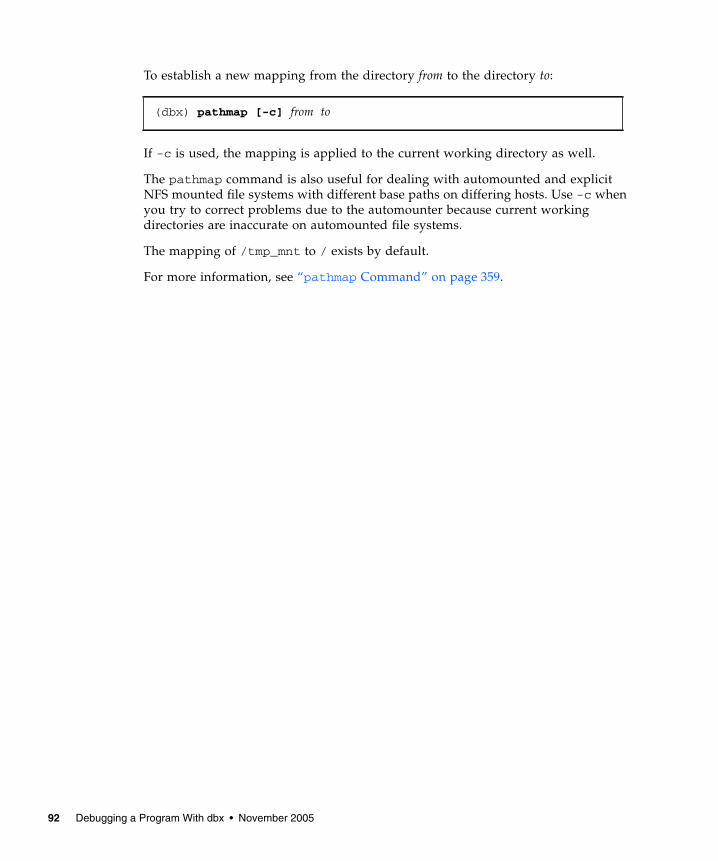
To establish a new mapping from the directory from to the directory to:
If -c is used, the mapping is applied to the current working directory as well.
The pathmap command is also useful for dealing with automounted and explicitNFS mounted file systems with different base paths on differing hosts. Use -c whenyou try to correct problems due to the automounter because current workingdirectories are inaccurate on automounted file systems.
The mapping of /tmp_mnt to / exists by default.
For more information, see “pathmap Command” on page 359.
(dbx) pathmap [-c] from to
92 Debugging a Program With dbx • November 2005

CHAPTER 5
Controlling Program Execution
The commands used for running, stepping, and continuing (run, rerun, next,step, and cont) are called process control commands. Used together with the eventmanagement commands described in Appendix B, you can control the run-timebehavior of a program as it executes under dbx.
This chapter is organized into the following sections:
■ Running a Program■ Attaching dbx to a Running Process■ Detaching dbx From a Process■ Stepping Through a Program■ Using Ctrl+C to Stop a Process
Running a ProgramWhen you first load a program into dbx, dbx navigates to the program’s “main”block (main for C, C++, and Fortran 90; MAIN for Fortran 77; the main class for Javacode). dbx waits for you to issue further commands; you can navigate through codeor use event management commands.
You can set breakpoints in the program before running it.
Note – When debugging an application that is a mixture of Java™ code and C JNI(Java™ Native Interface) code or C++ JNI code, you may want to set breakpoints incode that has not yet been loaded. For information on setting breakpoints on suchcode, see “Setting Breakpoints on Code That Has Not Yet Been Loaded by the JVMSoftware” on page 238.
Use the run command to start program execution.
93

To run a program in dbx without arguments, type:
You can optionally add command-line arguments and redirection of input andoutput.
Note – You cannot redirect the input and output of a Java application.
Output from the run command overwrites an existing file even if you have setnoclobber for the shell in which you are running dbx.
The run command without arguments restarts the program using the previousarguments and redirection. For more information, see “run Command” on page 369.The rerun command restarts the program and clears the original arguments andredirection. For more information, see “rerun Command” on page 367.
Attaching dbx to a Running ProcessYou might need to debug a program that is already running. You would attach to arunning process if:
■ You wanted to debug a running server, and you did not want to stop or kill it.
■ You wanted to debug a running program that has a graphical user interface, andyou didn’t want to restart it.
■ Your program was looping indefinitely, and you want to debug it without killingit.
You can attach dbx to a running program by using the program’s process_id numberas an argument to the dbx debug command.
Once you have debugged the program, you can then use the detach command totake the program out from the control of dbx without terminating the process.
If you quit dbx after attaching it to a running process, dbx implicitly detaches beforeterminating.
To attach dbx to a program that is running independently of dbx, you can use eitherthe attach command or the debug command.
(dbx) run
(dbx) run [arguments][ < input_file] [ > output_file]
94 Debugging a Program With dbx • November 2005
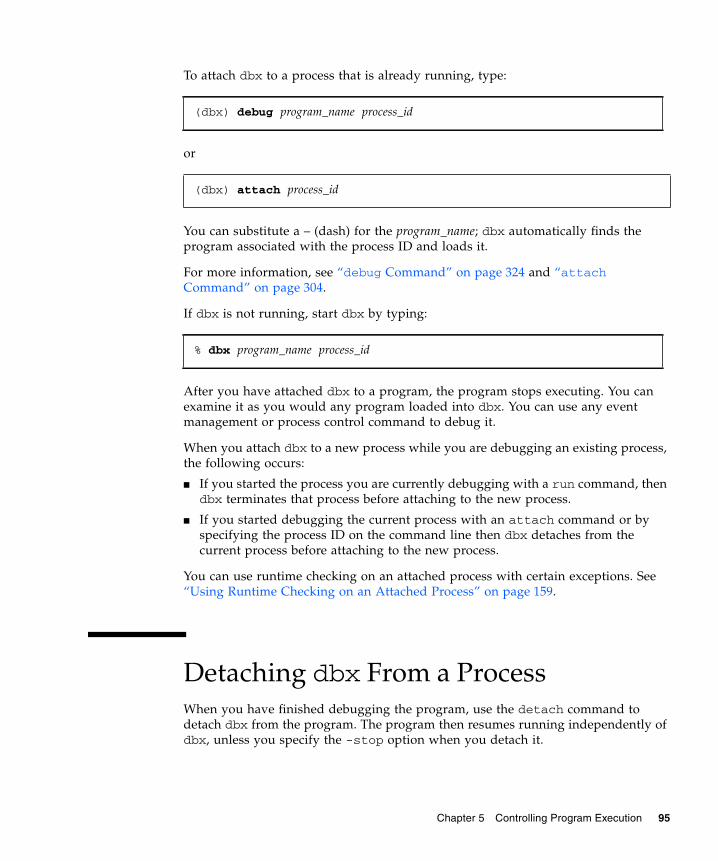
To attach dbx to a process that is already running, type:
or
You can substitute a – (dash) for the program_name; dbx automatically finds theprogram associated with the process ID and loads it.
For more information, see “debug Command” on page 324 and “attachCommand” on page 304.
If dbx is not running, start dbx by typing:
After you have attached dbx to a program, the program stops executing. You canexamine it as you would any program loaded into dbx. You can use any eventmanagement or process control command to debug it.
When you attach dbx to a new process while you are debugging an existing process,the following occurs:
■ If you started the process you are currently debugging with a run command, thendbx terminates that process before attaching to the new process.
■ If you started debugging the current process with an attach command or byspecifying the process ID on the command line then dbx detaches from thecurrent process before attaching to the new process.
You can use runtime checking on an attached process with certain exceptions. See“Using Runtime Checking on an Attached Process” on page 159.
Detaching dbx From a ProcessWhen you have finished debugging the program, use the detach command todetach dbx from the program. The program then resumes running independently ofdbx, unless you specify the -stop option when you detach it.
(dbx) debug program_name process_id
(dbx) attach process_id
% dbx program_name process_id
Chapter 5 Controlling Program Execution 95

To detach a process from running under the control of dbx:
You can detach a process and leave it in a stopped state while you temporarily applyother /proc-based debugging tools that might be blocked when dbx has exclusiveaccess. For example:
For more information, see “detach Command” on page 327.
Stepping Through a Programdbx supports two basic single-step commands: next and step, plus two variants ofstep, called step up and step to. Both the next command and the stepcommand let the program execute one source line before stopping again.
If the line executed contains a function call, the next command allows the call to beexecuted and stops at the following line (“steps over” the call). The step commandstops at the first line in a called function (“steps into” the call).
The step up command returns the program to the caller function after you havestepped into a function.
The step to command attempts to step into a specified function in the currentsource line, or if no function is specified, into the last function called as determinedby the assembly code for the current source line. The function call may not occurdue to a conditional branch, or there may be no function called in the current sourceline. In these cases, step to steps over the current source line.
(dbx) detach
(dbx) oproc=$proc # Remember the old process ID(dbx) detach -stop(dbx) /usr/proc/bin/pwdx $oproc(dbx) attach $oproc
96 Debugging a Program With dbx • November 2005

Single SteppingTo single step a specified number of lines of code, use the dbx commands next orstep followed by the number of lines [n] of code you want executed.
or
For more information on the commands, see “next Command” on page 357 and“step Command” on page 375.
The step_granularity environment variable determines the unit by which thestep command and next command step through your code (see “Setting dbxEnvironment Variables” on page 66). The unit can be either statement or line.
The step_events environment variable controls whether breakpoints are enabledduring a step (see “Setting dbx Environment Variables” on page 66).
The step_abflow environment variable controls whether dbx stops when it detectsthat an abnormal control flow change is about to happen (see “Setting dbxEnvironment Variables” on page 66). Such a control flow change can be caused by acall to siglongjmp() or longjmp() or an exception throw.
Continuing Execution of a ProgramTo continue a program, use the cont command.
The cont command has a variant, cont at line_number, which lets you specify aline other than the current program location line at which to resume programexecution. This allows you to skip over one or more lines of code that you know arecausing problems, without having to recompile.
To continue a program at a specified line, type:
(dbx) next n
(dbx) step n
(dbx) cont
(dbx) cont at 124
Chapter 5 Controlling Program Execution 97

The line number is evaluated relative to the file in which the program is stopped; theline number given must be within the scope of the current function.
Using cont at line_number with assign, you can avoid executing a line of codethat contains a call to a function that might be incorrectly computing the value ofsome variable.
To resume program execution at a specific line:
1. Use assign to give the variable a correct value.
2. Use cont at line_number to skip the line that contains the function call that wouldhave computed the value incorrectly.
Assume that a program is stopped at line 123. Line 123 calls a function,how_fast(), that computes incorrectly a variable, speed. You know what the valueof speed should be, so you assign a value to speed. Then you continue programexecution at line 124, skipping the call to how_fast().
For more information, see “cont Command” on page 320.
If you use the cont command with a when breakpoint command, the program skipsthe call to how_fast() each time the program attempts to execute line 123.
For more information on the when command, see:
■ “Setting a stop Breakpoint at a Line of Source Code” on page 102■ “Setting Breakpoints in Member Functions of Different Classes” on page 104■ “Setting Breakpoints in Member Functions of the Same Class” on page 105■ “Setting Multiple Breakpoints in Nonmember Functions” on page 105■ “when Command” on page 400
Calling a FunctionWhen a program is stopped, you can call a function using the dbx call command,which accepts values for the parameters that must be passed to the called function.
(dbx) assign speed = 180; cont at 124;
(dbx) when at 123 { assign speed = 180; cont at 124;}
98 Debugging a Program With dbx • November 2005

To call a procedure, type the name of the function and supply its parameters. Forexample:
While the parameters are optional, you must type the parentheses after thefunction_name. For example:
You can call a function explicitly, using the call command, or implicitly, byevaluating an expression containing function calls or using a conditional modifiersuch as stop in glyph -if animate().
A C++ virtual function can be called like any other function using the printcommand or call command (see “print Command” on page 362 or “callCommand” on page 306), or any other command that executes a function call.
If the source file in which the function is defined was compiled with the –g option,or if the prototype declaration is visible at the current scope, dbx checks the numberand type of arguments and issues an error message if there is a mismatch.Otherwise, dbx does not check the number of parameters and proceeds with the call.
By default, after every call command, dbx automatically calls fflush(stdout) toensure that any information stored in the I/O buffer is printed. To turn off automaticflushing, set the dbx environment variable output_auto_flush to off.
For C++, dbx handles the implicit this pointer, default arguments, and functionoverloading. The C++ overloaded functions are resolved automatically if possible. Ifany ambiguity remains (for example, functions not compiled with -g), dbx displaysa list of the overloaded names.
When you use the call command, dbx behaves as though you used the nextcommand, returning from the called function. However, if the program encounters abreakpoint in the called function, dbx stops the program at the breakpoint andissues a message. If you now type a where command, the stack trace shows that thecall originated from dbx command level.
If you continue execution, the call returns normally. If you attempt to kill, run, rerun,or debug, the command aborts as dbx tries to recover from the nesting. You can thenre-issue the command. Alternatively, you can use the command pop -c to pop allframes up to the most recent call.
(dbx) call change_glyph(1,3)
(dbx) call type_vehicle()
Chapter 5 Controlling Program Execution 99

Using Ctrl+C to Stop a ProcessYou can stop a process running in dbx by pressing Ctrl+C (^C). When you stop aprocess using ^C, dbx ignores the ^C, but the child process accepts it as a SIGINTand stops. You can then inspect the process as if it had been stopped by abreakpoint.
To resume execution after stopping a program with ^C, use the cont command. Youdo not need to use the cont optional modifier, sig signal_name, to resumeexecution. The cont command resumes the child process after cancelling thepending signal.
100 Debugging a Program With dbx • November 2005

CHAPTER 6
Setting Breakpoints and Traces
When an event occurs, dbx allows you to stop a process, execute arbitrarycommands, or print information. The simplest example of an event is a breakpoint.Examples of other events are faults, signals, system calls, calls to dlopen(), anddata changes.
A trace displays information about an event in your program, such as a change inthe value of a variable. Although a trace’s behavior is different from that of abreakpoint, traces and breakpoints share similar event handlers (see “EventHandlers” on page 279).
This chapter describes how to set, clear, and list breakpoints and traces. Forcomplete information on the event specifications you can use in setting breakpointsand traces, see “Setting Event Specifications” on page 281.
The chapter is organized into the following sections:
■ Setting Breakpoints■ Setting Filters on Breakpoints■ Tracing Execution■ Setting a when Breakpoint at a Line■ Setting a Breakpoint in a Shared Library■ Listing and Clearing Breakpoints■ Enabling and Disabling Breakpoints■ Efficiency Considerations
Setting BreakpointsIn dbx, you can use three commands to set breakpoints:
■ stop breakpoints–If the program arrives at a breakpoint created with a stopcommand, the program halts. The program cannot resume until you issue anotherdebugging command, such as cont, step, or next.
101

■ when breakpoints–If the program arrives at a breakpoint created with a whencommand, the program halts and dbx executes one or more debuggingcommands, then the program continues (unless one of the executed commands isstop).
■ trace breakpoints–If a program arrives at a breakpoint created with a tracecommand, the program halts and an event-specific trace information line isemitted, then the program continues.
The stop, when, and trace commands all take as an argument an eventspecification, which describes the event on which the breakpoint is based. Eventspecifications are discussed in detail in “Setting Event Specifications” on page 281.
To set machine-level breakpoints, use the stopi, wheni, and tracei commands(see Chapter 18).
Note – When debugging an application that is a mixture of Java™ code and C JNI(Java™ Native Interface) code or C++ JNI code, you may want to set breakpoints incode that has not yet been loaded. For information on setting breakpoints on suchcode, see “Setting Breakpoints on Code That Has Not Yet Been Loaded by the JVMSoftware” on page 238.
Setting a stop Breakpoint at a Line of SourceCodeYou can set a breakpoint at a line number, using the stop at command, where n isa source code line number and filename is an optional program file name qualifier.
For example:
If the line specified is not an executable line of source code, dbx sets the breakpointat the next executable line. If there is no executable line, dbx issues an error.
(dbx) stop at filename: n
(dbx) stop at main.cc:3
102 Debugging a Program With dbx • November 2005

You can determine the line at which you wish to stop by using the file commandto set the current file and the list command to list the function in which you wishto stop. Then use the stop at command to set the breakpoint on the source line:
For more information on specifying at an location event, see “at[filename:]line_number” on page 282.
Setting a stop Breakpoint in a FunctionYou can set a breakpoint in a function, using the stop in command:
An In Function breakpoint suspends program execution at the beginning of the firstsource line in a procedure or function.
dbx should be able to determine which variable or function you are referring toexcept when:
■ You reference an overloaded function by name only.■ You reference a function or variable with a leading `.
Consider the following set of declarations:
(dbx) file t.c(dbx) list main10 main(int argc, char *argv[])11 {12 char *msg = "hello world\n";13 printit(msg);14 }(dbx) stop at 13
(dbx) stop in function
int foo(double);int foo(int);int bar();class x {
int bar();};
Chapter 6 Setting Breakpoints and Traces 103

When you stop at a non-member function, you can type:
to set a breakpoint at the global foo(int).
To set a breakpoint at the member function you can use the command:
If you type:
dbx cannot determine whether you mean the global function foo(int) or theglobal function foo(double) and may be forced to display an overloaded menu forclarification.
If you type:
dbx cannot determine whether you mean the global function bar() or the memberfunction bar() and displays an overload menu.
For more information on specifying an in function event, see “in function” onpage 282.
Setting Multiple Breaks in C++ ProgramsYou can check for problems related to calls to members of different classes, calls toany members of a given class, or calls to overloaded top-level functions. You can usea keyword—inmember, inclass, infunction, or inobject—with a stop, when,or trace command to set multiple breaks in C++ code.
Setting Breakpoints in Member Functions of Different Classes
To set a breakpoint in each of the object-specific variants of a particular memberfunction (same member function name, different classes), use stop inmember.
stop in foo(int)
stop in x::bar()
stop in foo
stop in `bar
104 Debugging a Program With dbx • November 2005

For example, if the function draw is defined in several different classes, then to placea breakpoint in each function, type:
For more information on specifying an inmember or inmethod event, see“inmember function inmethod function” on page 283.
Setting Breakpoints in Member Functions of the Same Class
To set a breakpoint in all member functions of a specific class, use the stopinclass command.
By default, breakpoints are inserted only in the class member functions defined inthe class, not those that it might inherit from base classes. To insert breakpoints inthe functions that inherit from the base classes also, specify the -recurse option
To set a breakpoint in all member functions defined in the class shape, type:
To set a breakpoint in all member functions defined in the class shape, and also infunctions that inherit from the class, type:
For more information on specifying an inclass event, see “inclass classname [-recurse | -norecurse]” on page 283 and “stop Command” on page 378.
Due to the large number of breakpoints that may be inserted by stop inclass andother breakpoint selections, you should be sure to set the dbx environment variablestep_events to on to speed up the step and next commands (see “EfficiencyConsiderations” on page 115).
Setting Multiple Breakpoints in Nonmember Functions
To set multiple breakpoints in nonmember functions with overloaded names (samename, different type or number of arguments), use the stop infunctioncommand.
(dbx) stop inmember draw
(dbx) stop inclass shape
(dbx) stop inclass shape -recurse
Chapter 6 Setting Breakpoints and Traces 105

For example, if a C++ program has defined two versions of a function namedsort()(one that passes an int type argument and the other a float) then, to placea breakpoint in both functions, type:
For more information on specifying an infunction event, see “infunctionfunction” on page 283.
Setting Breakpoints in Objects
Set an In Object breakpoint to check the operations applied to a specific objectinstance.
By default, an In Object breakpoint suspends program execution in all nonstaticmember functions of the object’s class, including inherited ones, when called fromthe object. To set a breakpoint to suspend program execution in only nonstaticmember functions defined in the object’s class and not inherited classes, specify the-norecurse option.
To set a breakpoint in all nonstatic member functions defined in the base class ofobject foo, and in all nonstatic member functions defined in inherited classes ofobject foo, type:
To set a breakpoint in all nonstatic member functions defined in the class of objectfoo, but not those defined in inherited classes of object foo, type:
For more information on specifying an inobject event, see “inobject object-expression [-recurse | -norecurse]” on page 283 and “stop Command” onpage 378
Setting Data Change BreakpointsYou can use data change breakpoints in dbx to note when the value of a variable orexpression has changed.
(dbx) stop infunction sort [command;]
(dbx) stop inobject &foo
(dbx) stop inobject &foo -norecurse
106 Debugging a Program With dbx • November 2005

Stopping Execution When an Address Is Accessed
To stop execution when a memory address has been accessed, type:
mode specifies how the memory was accessed. It can be composed of one or all of theletters:
mode can also contain either of the following:
In both cases the program counter will point at the offending instruction. The“before” and “after” refer to the side effect.
address-expression is any expression that can be evaluated to produce an address. Ifyou give a symbolic expression, the size of the region to be watched is automaticallydeduced; you can override it by specifying byte-size-expression. You can also usenonsymbolic, typeless address expressions; in which case, the size is mandatory.
In the following example, execution will stop execution after the memory address0x4762 has been read:
In this example, execution will stop before the variable speed has be written to:
Keep these points in mind when using the stop access command:
■ The event occurs when a variable is written to even if it is the same value.
■ By default, the event occurs after execution of the instruction that wrote to thevariable. You can indicate that you want the event to occur before the instructionis executed by specifying the mode as b.
(dbx) stop access mode address-expression [, byte-size-expression]
r The memory at the specified address has been read.
w The memory has been written to.
x The memory has been executed.
a Stops the process after the access (default).
b Stops the process before the access.
(dbx) stop access r 0x4762
(dbx) stop access wb &speed
Chapter 6 Setting Breakpoints and Traces 107
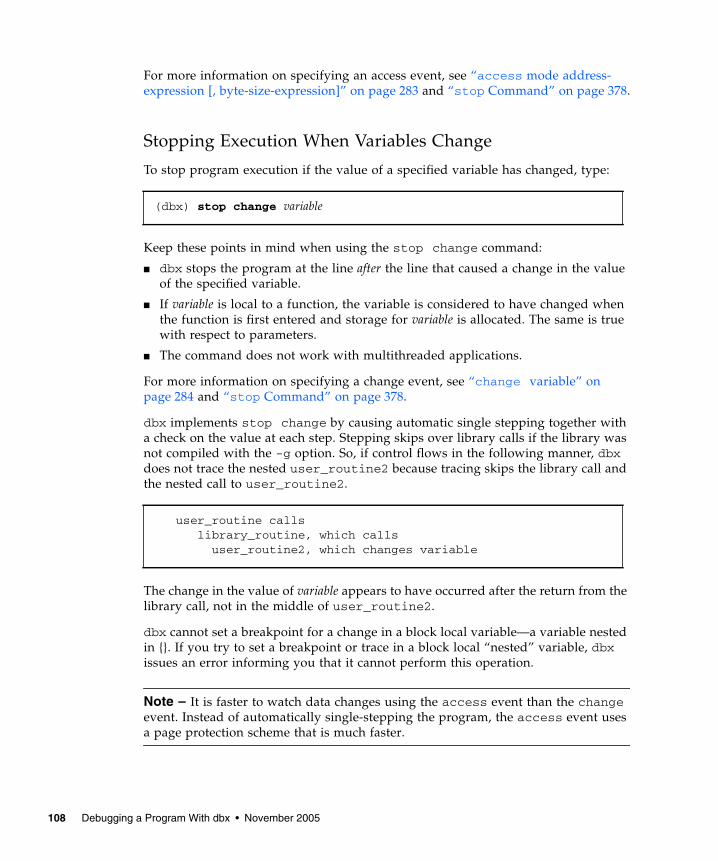
For more information on specifying an access event, see “access mode address-expression [, byte-size-expression]” on page 283 and “stop Command” on page 378.
Stopping Execution When Variables Change
To stop program execution if the value of a specified variable has changed, type:
Keep these points in mind when using the stop change command:
■ dbx stops the program at the line after the line that caused a change in the valueof the specified variable.
■ If variable is local to a function, the variable is considered to have changed whenthe function is first entered and storage for variable is allocated. The same is truewith respect to parameters.
■ The command does not work with multithreaded applications.
For more information on specifying a change event, see “change variable” onpage 284 and “stop Command” on page 378.
dbx implements stop change by causing automatic single stepping together witha check on the value at each step. Stepping skips over library calls if the library wasnot compiled with the -g option. So, if control flows in the following manner, dbxdoes not trace the nested user_routine2 because tracing skips the library call andthe nested call to user_routine2.
The change in the value of variable appears to have occurred after the return from thelibrary call, not in the middle of user_routine2.
dbx cannot set a breakpoint for a change in a block local variable—a variable nestedin {}. If you try to set a breakpoint or trace in a block local “nested” variable, dbxissues an error informing you that it cannot perform this operation.
Note – It is faster to watch data changes using the access event than the changeevent. Instead of automatically single-stepping the program, the access event usesa page protection scheme that is much faster.
(dbx) stop change variable
user_routine calls library_routine, which calls user_routine2, which changes variable
108 Debugging a Program With dbx • November 2005

Stopping Execution on a Condition
To stop program execution if a conditional statement evaluates to true, type:
The program stops executing when the condition occurs.
Keep these points in mind when using the stop cond command:
■ dbx stops the program at the line after the line that caused the condition toevaluate to true.
■ The command does not work with multithreaded applications.
For more information on specifying a condition event, see “cond condition-expression” on page 285 and “stop Command” on page 378.
Setting Filters on BreakpointsIn dbx, most of the event management commands also support an optional eventfilter modifier. The simplest filter instructs dbx to test for a condition after theprogram arrives at a breakpoint or trace handler, or after a watch condition occurs.
If this filter condition evaluates to true (non 0), the event command applies andprogram execution stops at the breakpoint. If the condition evaluates to false (0),dbx continues program execution as if the event had never happened.
To set a breakpoint that includes a filter at a line or in a function, add an optional-if condition modifier statement to the end of a stop or trace command.
The condition can be any valid expression, including function calls, returningBoolean or integer in the language current at the time the command is entered.
With a location-based breakpoint like in or at, the scope is that of the breakpointlocation. Otherwise, the scope of the condition is the scope at the time of entry, notat the time of the event. You might have to use the backquote operator (see“Backquote Operator” on page 79) to specify the scope precisely.
For example, these two filters are not the same:
(dbx) stop cond condition
stop in foo -if a>5stop cond a>5
Chapter 6 Setting Breakpoints and Traces 109
The former breaks at foo and tests the condition. The latter automatically singlesteps and tests for the condition.
Using the Return Value of a Function Call as a Filter
You can use a function call as a breakpoint filter. In this example, if the value in thestring str is abcde, then execution stops in function foo():
Using Variable Scope as a Filter
Variable scope can be used in setting a breakpoint filter. In this example, the currentscope is in function foo() and local is a local variable defined in main():
Using a Filter With a Conditional Event
New users sometimes confuse setting a conditional event command (a watch-typecommand) with using filters. Conceptually, “watching” creates a precondition thatmust be checked before each line of code executes (within the scope of the watch).But even a breakpoint command with a conditional trigger can also have a filterattached to it.
Consider this example:
This command instructs dbx to monitor the variable, speed; if the variable speed iswritten to (the “watch” part), then the -if filter goes into effect. dbx checks whetherthe new value of speed is equal to fast_enough. If it is not, the program continues,“ignoring” the stop.
In dbx syntax, the filter is represented in the form of an [-if condition] statement atthe end of the command.
(dbx) stop in foo -if !strcmp(“abcde”,str)
(dbx) stop access w &main‘local -if pr(main‘local) -in main
(dbx) stop access w &speed -if speed==fast_enough
stop in function [-if condition]
110 Debugging a Program With dbx • November 2005

If you set a breakpoint with a filter that contains function calls in a multithreadedprogram, dbx stops execution of all threads when it hits the breakpoint, and thenevaluates the condition. If the condition is met and the function is called, dbxresumes all threads for the duration of the call.
For example, you might set the following breakpoint in a multithreaded applicationwhere many threads call lookup():
dbx stops when thread t@1 calls lookup(), evaluates the condition, and callsstrcmp() resuming all threads. If dbx hits the breakpoint in another thread duringthe function call, it issues a warning such as one of the following:
In such a case, if you can ascertain that the function called in the conditionalexpression will not grab a mutex, you can use the -resumeone event specificationmodifier to force dbx to resume only the first thread in which it hit the breakpoint.For example, you might set the following breakpoint:
The -resumeone modifier does not prevent problems in all cases. For example, itwould not help if:
■ The second breakpoint on lookup() occurs in the same thread as the firstbecause the condition recursively calls lookup().
■ The thread on which the condition runs relinquishes control to another thread.
For detailed information on event modifiers, see “Event Specification Modifiers” onpage 293.
(dbx) stop in lookup -if strcmp(name, “troublesome”) == 0
event infinite loop causes missed events in the following handlers:...
Event reentrancyfirst event BPT(VID 6m TID 6, PC echo+0x8)second event BPT*VID 10, TID 10, PC echo+0x8)the following handlers will miss events:...
(dbx) stop in lookup -resumeone -if strcmp(name, “troublesome”) == 0
Chapter 6 Setting Breakpoints and Traces 111

Tracing ExecutionTracing collects information about what is happening in your program and displaysit. If a program arrives at a breakpoint created with a trace command, the programhalts and an event-specific trace information line is emitted, then the programcontinues.
A trace displays each line of source code as it is about to be executed. In all but thesimplest programs, this trace produces volumes of output.
A more useful trace applies a filter to display information about events in yourprogram. For example, you can trace each call to a function, every member functionof a given name, every function in a class, or each exit from a function. You can alsotrace changes to a variable.
Setting a TraceSet a trace by typing a trace command at the command line. The basic syntax ofthe trace command is:
For the complete syntax of the trace command, see “trace Command” on page 390.
The information a trace provides depends on the type of event associated with it (see“Setting Event Specifications” on page 281).
Controlling the Speed of a TraceOften trace output goes by too quickly. The dbx environment variable trace_speedlets you control the delay after each trace is printed. The default delay is 0.5seconds.
To set the interval in seconds between execution of each line of code during a trace,type:
trace event-specification [ modifier ]
dbxenv trace_speed number
112 Debugging a Program With dbx • November 2005

Directing Trace Output to a FileYou can direct the output of a trace to a file using the -file filename option. Forexample, the following command direct trace output to the file trace1:
To revert trace output to standard output use - for filename. Trace output is alwaysappended to filename. It is flushed whenever dbx prompts and when the applicationhas exited. The filename is always re-opened on a new run or resumption after anattach.
Setting a when Breakpoint at a LineA when breakpoint command accepts other dbx commands such as list, lettingyou write your own version of trace.
The when command operates with an implied cont command. In the exampleabove, after listing the source code at the current line, the program continuesexecuting. If you included a stop command after the list command, the programwould not continue executing.
For the complete syntax of the when command, see “when Command” on page 400.For detailed information on event modifiers, see “Event Specification Modifiers” onpage 293.
Setting a Breakpoint in a Shared Librarydbx provides full debugging support for code that uses the programmatic interfaceto the run-time linker: code that calls dlopen(), dlclose() and their associatedfunctions. The run-time linker binds and unbinds shared libraries during programexecution. Debugging support for dlopen() and dlclose() lets you step into afunction or set a breakpoint in functions in a dynamically shared library just as youcan in a library linked when the program is started.
(dbx) trace -file trace1
(dbx) when at 123 {list $lineno;}
Chapter 6 Setting Breakpoints and Traces 113

However, there are exceptions. dbx is unable to place breakpoints in loadobjects thathave not been loaded (by, for example, using dlopen():
■ You cannot set a breakpoint in a library loaded by dlopen() before that library isloaded by dlopen().
■ You cannot set a breakpoint in a filter library loaded by dlopen() until the firstfunction in it is called.
You can put the names of such loadobjects on the preload list with the loadobjectcommand (see “loadobject Command” on page 349).
dbx does not forget about a loadobject that was loaded using dlopen(). Forexample, a breakpoint set in a freshly loaded loadobject remains until the next runcommand, or even if the loadobject is unloaded with dlclose() and thensubsequently loaded with dlopen() again.
Listing and Clearing BreakpointsOften, you set more than one breakpoint or trace handler during a debuggingsession. dbx supports commands for listing and clearing them.
Listing Breakpoints and TracesTo display a list of all active breakpoints, use the status command to display IDnumbers in parentheses, which can then be used by other commands.
dbx reports multiple breakpoints set with the inmember, inclass, andinfunction keywords as a single set of breakpoints with one status ID number.
Deleting Specific Breakpoints Using Handler IDNumbersWhen you list breakpoints using the status command, dbx displays the ID numberassigned to each breakpoint when it was created. Using the delete command, youcan remove breakpoints by ID number, or use the keyword all to remove allbreakpoints currently set anywhere in the program.
114 Debugging a Program With dbx • November 2005
To delete breakpoints by ID number (in this case 3 and 5), type:
To delete all breakpoints set in the program currently loaded in dbx, type:
For more information, see “delete Command” on page 327.
Enabling and Disabling BreakpointsEach event management command (stop, trace, when) that you use to set abreakpoint creates an event handler (see “Event Handlers” on page 279). Each ofthese commands returns a number known as the handler ID (hid). You can use thehandler ID as an argument to the handler command (see “handler Command” onpage 340) to enable or disable the breakpoint.
Efficiency ConsiderationsVarious events have different degrees of overhead in respect to the execution time ofthe program being debugged. Some events, like the simplest breakpoints, havepractically no overhead. Events based on a single breakpoint have minimaloverhead.
Multiple breakpoints such as inclass, that might result in hundreds of breakpoints,have an overhead only during creation time. This is because dbx uses permanentbreakpoints; the breakpoints are retained in the process at all times and are not takenout on every stoppage and put in on every cont.
Note – In the case of step and next, by default all breakpoints are taken out beforethe process is resumed and reinserted once the step completes. If you are usingmany breakpoints or multiple breakpoints on prolific classes, the speed of step andnext slows down considerably. Use the dbx step_events environment variable tocontrol whether breakpoints are taken out and reinserted after each step or next.
(dbx) delete 3 5
(dbx) delete all
Chapter 6 Setting Breakpoints and Traces 115

The slowest events are those that utilize automatic single stepping. This might beexplicit and obvious as in the trace step command, which single steps throughevery source line. Other events, like the stop change expression or trace condvariable not only single step automatically but also have to evaluate an expression ora variable at each step.
These events are very slow, but you can often overcome the slowness by boundingthe event with a function using the -in modifier. For example:
Do not use trace -in main because the trace is effective in the functions called bymain as well. Do use it in the cases where you suspect that the lookup() functionis clobbering your variable.
trace next -in mumblestop change clobbered_variable -in lookup
116 Debugging a Program With dbx • November 2005

CHAPTER 7
Using the Call Stack
This chapter discusses how dbx uses the call stack, and how to use the where, hide,unhide, and pop commands when working with the call stack.
The call stack represents all currently active routines—routines that have been calledbut have not yet returned to their respective caller. A stack frame is a section to thecall stack allocated for use by a single function.
Because the call stack grows from higher memory (larger addresses) to lowermemory, up means going toward the caller’s frame (and eventually main()) anddown means going toward the frame of the called function (and eventually thecurrent function). The frame for the routine executing when the program stopped ata breakpoint, after a single-step, or when a fault occurs and produces a core file, is inlower memory. A caller routine, such as main(), is located in higher memory.
This chapter is organized into the following sections:
■ Finding Your Place on the Stack■ Walking the Stack and Returning Home■ Moving Up and Down the Stack■ Popping the Call Stack■ Hiding Stack Frames■ Displaying and Reading a Stack Trace
Finding Your Place on the StackUse the where command to find your current location on the stack.
where [-f] [-h] [-l] [-q] [-v] number_id
117
When debugging an application that is a mixture of Java™ code and C JNI (Java™Native Interface) code or C++ JNI code, the syntax of the where command is:
The where command is also useful for learning about the state of a program that hascrashed and produced a core file. When this occurs, you can load the core file intodbx (see “Debugging a Core File” on page 50)
For more information on the where command, see “where Command” on page 403.
Walking the Stack and Returning HomeMoving up or down the stack is referred to as “walking the stack.” When you visit afunction by moving up or down the stack, dbx displays the current function and thesource line. The location from which you start, home, is the point where the programstopped executing. From home, you can move up or down the stack using the up,down, or frame commands.
The dbx commands up and down both accept a number argument that instructs dbxto move a number of frames up or down the stack from the current frame. If numberis not specified, the default is 1. The -h option includes all hidden frames in thecount.
Moving Up and Down the StackYou can examine the local variables in functions other than the current one.
Moving Up the StackTo move up the call stack (toward main) number levels:
If you do not specify number, the default is one level. For more information, see “upCommand” on page 398.
where [-f] [-q] [-v] [ thread_id ] number_id
up [-h] [ number ]
118 Debugging a Program With dbx • November 2005

Moving Down the StackTo move down the call stack (toward the current stopping point) number levels:
If you do not specify number, the default is one level. For more information, see“down Command” on page 330.
Moving to a Specific FrameThe frame command is similar to the up and down commands. It lets you godirectly to the frame as given by numbers displayed by the where command.
The frame command without an argument displays the current frame number. Withnumber, the command lets you go directly to the frame indicated by the number. Byincluding a + (plus sign) or - (minus sign), the command lets you move an incrementof one level up (+) or down (-). If you include a plus or minus sign with a number,you can move up or down the specified number of levels. The -h option includesany hidden frames in the count.
You can also move to a specific frame using the pop command (see “Popping theCall Stack” on page 119).
Popping the Call StackYou can remove the stopped in function from the call stack, making the callingfunction the new stopped in function.
Unlike moving up or down the call stack, popping the stack changes the executionof your program. When the stopped in function is removed from the stack, it returnsyour program to its previous state, except for changes to global or static variables,external files, shared members, and similar global states.
down [-h] [ number ]
frameframe -hframe [-h] numberframe [-h] +[number]frame [-h] -[number]
Chapter 7 Using the Call Stack 119

The pop command removes one or more frames from the call stack. For example, topop five frames from the stack, type:
You can also pop to a specific frame. To pop to frame 5, type:
For more information, see “pop Command” on page 361.
Hiding Stack FramesUse the hide command to list the stack frame filters currently in effect.
To hide or delete all stack frames matching a regular expression, type:
The regular_expression matches either the function name, or the name of theloadobject, and uses sh or ksh syntax for file matching.
Use unhide to delete all stack frame filters.
Because the hide command lists the filters with numbers, you can also use theunhide command with the filter number.
pop 5
pop -f 5
hide [ regular_expression ]
unhide 0
unhide [ number | regular_expression ]
120 Debugging a Program With dbx • November 2005

Displaying and Reading a Stack TraceA stack trace shows where in the program flow execution stopped and howexecution reached this point. It provides the most concise description of yourprogram’s state.
To display a stack trace, use the where command.
For functions that were compiled with the -g option, the names and types of thearguments are known so accurate values are displayed. For functions withoutdebugging information hexadecimal numbers are displayed for the arguments.These numbers are not necessarily meaningful. When a function call is madethrough function pointer 0, the function value is shown as a low hexadecimalnumber instead of a symbolic name.
You can stop in a function that was not compiled with the -g option. When you stopin such a function dbx searches down the stack for the first frame whose function iscompiled with the -g option and sets the current scope (see “Program Scope” onpage 76) to it. This is denoted by the arrow symbol (=>).
In the following example, main() was compiled with the -g option, so the symbolicnames as well as the values of the arguments are displayed The library functionscalled by main() were not compiled with -g, so the symbolic names of thefunctions are displayed but the hexadecimal contents of the SPARC input registers$i0 through $i5 are shown for the arguments:
(dbx) where [1] _libc_poll(0xffbef3b0, 0x1, 0xffffffff, 0x0, 0x10,0xffbef604), at 0xfef9437c [2] _select(0xffbef3b8, 0xffbef580, 0xffbef500, 0xffbef584,0xffbef504, 0x4), at 0xfef4e3dc[3] _XtWaitForSomething(0x5a418, 0x0, 0x0, 0xf4240, 0x0, 0x1),
at 0xff0bdb6c[4] XtAppNextEvent(0x5a418, 0x2, 0x2, 0x0, 0xffbef708, 0x1), at
0xff0bd5ec [5] XtAppMainLoop(0x5a418, 0x0, 0x1, 0x5532d, 0x3, 0x1), at0xff0bd424=>[6] main(argc = 1, argv = 0xffbef83c), line 48 in "main.cc"
Chapter 7 Using the Call Stack 121

In this example, the program has crashed with a segmentation fault. Again onlymain() has been compiled with the -g option, so the arguments to the libraryfunctions are displayed as hexadecimal without symbolic names. The cause of thecrash is most likely the null arguments to strlen() in SPARC input registers $i0and $i1
For more examples of stack traces, see “Looking at the Call Stack” on page 45 and“Tracing Calls” on page 220.
(dbx) runRunning: Cdlib(process id 6723)
CD Library Statistics:
Titles: 1
Total time: 0:00:00 Average time: 0:00:00
signal SEGV (no mapping at the fault address) in strlen at0xff2b6c5c0xff2b6c5c: strlen+0x0080:ld [%o1], %o2Current function is main(dbx) where [1] strlen(0x0, 0x0, 0x11795, 0x7efefeff, 0x81010100,0xff339323), at 0xff2b6c5c[2] _doprnt(0x11799, 0x0, 0x0, 0x0, 0x0, 0xff00), at 0xff2fec18
[3] printf(0x11784, 0xff336264, 0xff336274, 0xff339b94,0xff331f98, 0xff00), at 0xff300780=>[4] main(argc = 1, argv = 0xffbef894), line 133 in "Cdlib.c"(dbx)
122 Debugging a Program With dbx • November 2005

CHAPTER 8
Evaluating and Displaying Data
In dbx, you can perform two types of data checking:
■ Evaluate data (print) – Spot-checks the value of an expression
■ Display data (display) – Monitors the value of an expression each time theprogram stops
This chapter is organized into the following sections:
■ Evaluating Variables and Expressions■ Assigning a Value to a Variable■ Evaluating Arrays
Evaluating Variables and ExpressionsThis section discusses how to use dbx to evaluate variables and expressions.
Verifying Which Variable dbx UsesIf you are not sure which variable dbx is evaluating, use the which command to seethe fully qualified name dbx is using.
To see other functions and files in which a variable name is defined, use thewhereis command.
For information on the commands, see “which Command” on page 405 and“whereis Command” on page 404.
123
Variables Outside the Scope of the CurrentFunctionWhen you want to evaluate or monitor a variable outside the scope of the currentfunction:
■ Qualify the name of the function. See “Qualifying Symbols With Scope ResolutionOperators” on page 79.
or
■ Visit the function by changing the current function. See “Navigating To Code” onpage 73.
Printing the Value of a Variable, Expression, orIdentifierAn expression should follow current language syntax, with the exception of themeta syntax that dbx introduces to deal with scope and arrays.
To evaluate a variable or expression in native code, type:
You can use the print command to evaluate an expression, local variable, orparameter in Java code.
For more information, see “print Command” on page 362.
Note – dbx supports the C++ dynamic_cast and typeid operators. Whenevaluating expressions with these two operators, dbx makes calls to certain rttifunctions made available by the compiler. If the source doesn’t explicitly use theoperators, those functions might not have been generated by the compiler, and dbxfails to evaluate the expression.
Printing C++In C++ an object pointer has two types, its static type (what is defined in the sourcecode) and its dynamic type (what an object was before any casts were made to it). dbxcan sometimes provide you with the information about the dynamic type of anobject.
print expression
124 Debugging a Program With dbx • November 2005

In general, when an object has a virtual function table (a vtable) in it, dbx can usethe information in the vtable to correctly determine an object’s type.
You can use the print or display command with the -r (recursive) option. dbxdisplays all the data members directly defined by a class and those inherited from abase class.
These commands also take a -d or +d option that toggles the default behavior of thedbx environment variable output_derived_type.
Using the -d flag or setting the dbx environment variable output_dynamic_typeto on when there is no process running generates a “program is not active” errormessage because it is not possible to access dynamic information when there is noprocess. An “illegal cast on class pointers” error message is generated if you try tofind a dynamic type through a virtual inheritance. (Casting from a virtual base classto a derived class is not legal in C++.)
Evaluating Unnamed Arguments in C++ Programs
C++ lets you define functions with unnamed arguments. For example:
Though you cannot use unnamed arguments elsewhere in a program, the compilerencodes unnamed arguments in a form that lets you evaluate them. The form is asfollows, where the compiler assigns an integer to %n:
To obtain the name assigned by the compiler, type the whatis command with thefunction name as its target.
For more information, see “whatis Command” on page 399.
void tester(int){};main(int, char **){ tester(1);};
_ARG%n
(dbx) whatis testervoid tester(int _ARG1);(dbx) whatis mainint main(int _ARG1, char **_ARG2);
Chapter 8 Evaluating and Displaying Data 125

To evaluate (or display) an unnamed function argument, type:
Dereferencing PointersWhen you dereference a pointer, you ask for the contents of the container to whichthe pointer points.
To dereference a pointer, dbx displays the evaluation in the command pane; in thiscase, the value pointed to by t:
Monitoring ExpressionsMonitoring the value of an expression each time the program stops is an effectivetechnique for learning how and when a particular expression or variable changes.The display command instructs dbx to monitor one or more specified expressionsor variables. Monitoring continues until you turn it off with the undisplaycommand.
To display the value of a variable or expression each time the program stops, type:
You can monitor more than one variable at a time. The display command usedwith no options prints a list of all expressions being displayed.
For more information, see “display Command” on page 329.
(dbx) print _ARG1_ARG1 = 4
(dbx) print *t*t = {a = 4}
display expression, ...
126 Debugging a Program With dbx • November 2005

Turning Off Display (Undisplaying)dbx continues to display the value of a variable you are monitoring until you turnoff display with the undisplay command. You can turn off the display of aspecified expression or turn off the display of all expressions currently beingmonitored.
To turn off the display of a particular variable or expression, type:
To turn off the display of all currently monitored variables, type:
For more information, see “undisplay Command” on page 395.
Assigning a Value to a VariableTo assign a value to a variable, type:
Evaluating ArraysYou evaluate arrays the same way you evaluate other types of variables.
Here is a sample Fortran array:
To evaluate the array, use the print command. For example:
undisplay expression
undisplay 0
assign variable = expression
integer*4 arr(1:6, 4:7)
(dbx) print arr(2,4)
Chapter 8 Evaluating and Displaying Data 127

The dbx print command lets you evaluate part of a large array. Array evaluationincludes:
■ Array Slicing – Prints any rectangular, n-dimensional box of a multidimensionalarray.
■ Array Striding – Prints certain elements only, in a fixed pattern, within thespecified slice (which may be an entire array).
You can slice an array, with or without striding. (The default stride value is 1, whichmeans print each element.)
Array SlicingArray slicing is supported in the print and display commands for C, C++, andFortran.
Array Slicing Syntax for C and C++
For each dimension of an array, the full syntax of the print command to slice thearray is:
where:
The first expression, last expression, and stride expression are optional expressionsthat should evaluate to integers.
print array-expression [first-expression .. last-expression : stride-expression]
array-expression Expression that should evaluate to an array or pointer type.
first-expression First element to be printed. Defaults to 0.
last-expression Last element to be printed. Defaults to upper bound.
stride-expression Length of the stride (the number of elements skipped isstride-expression-1). Defaults to 1.
128 Debugging a Program With dbx • November 2005

For example:
Array Slicing Syntax for Fortran
For each dimension of an array, the full syntax of the print command to slice thearray is:
where:
The first expression, last expression, and stride expression are optional expressionsthat should evaluate to integers. For an n-dimensional slice, separate the definitionof each slice with a comma.
(dbx) print arr[2..4]arr[2..4] =[2] = 2[3] = 3[4] = 4(dbx) print arr[..2]arr[0..2] =[0] = 0[1] = 1[2] = 2
(dbx) print arr[2..6:2]arr[2..6:2] =[2] = 2[4] = 4[6] = 6
print array-expression [first-expression : last-expression : stride-expression]
array-expression Expression that should evaluate to an array type.
first-expression First element in a range, also first element to be printed.Defaults to lower bound.
last-expression Last element in a range, but might not be the last element to beprinted if stride is not equal to 1. Defaults to upper bound.
stride-expression Length of the stride. Defaults to 1.
Chapter 8 Evaluating and Displaying Data 129

For example:
To specify rows and columns, type:
(dbx) print arr(2:6)arr(2:6) =(2) 2(3) 3(4) 4(5) 5(6) 6
(dbx) print arr(2:6:2)arr(2:6:2) =(2) 2(4) 4(6) 6
demo% f77 -g -silent ShoSli.fdemo% dbx a.outReading symbolic information for a.out(dbx) list 1,12
1 INTEGER*4 a(3,4), col, row2 DO row = 1,33 DO col = 1,44 a(row,col) = (row*10) + col5 END DO6 END DO7 DO row = 1, 38 WRITE(*,'(4I3)') (a(row,col),col=1,4)9 END DO10 END
(dbx) stop at 7(1) stop at "ShoSli.f":7(dbx) runRunning: a.outstopped in MAIN at line 7 in file "ShoSli.f"
7 DO row = 1, 3
130 Debugging a Program With dbx • November 2005
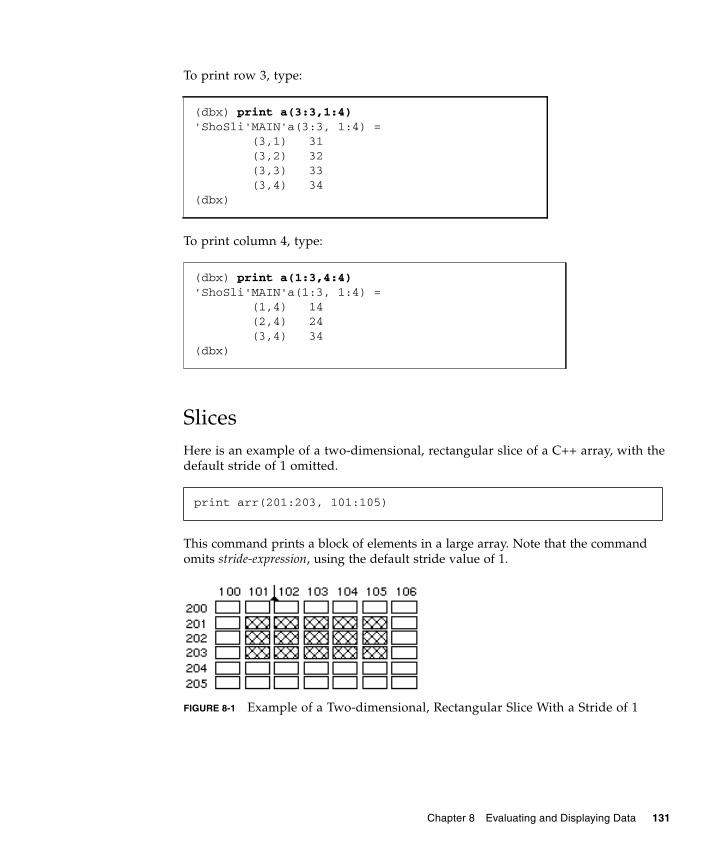
To print row 3, type:
To print column 4, type:
SlicesHere is an example of a two-dimensional, rectangular slice of a C++ array, with thedefault stride of 1 omitted.
This command prints a block of elements in a large array. Note that the commandomits stride-expression, using the default stride value of 1.
FIGURE 8-1 Example of a Two-dimensional, Rectangular Slice With a Stride of 1
(dbx) print a(3:3,1:4)'ShoSli'MAIN'a(3:3, 1:4) = (3,1) 31 (3,2) 32 (3,3) 33 (3,4) 34(dbx)
(dbx) print a(1:3,4:4)'ShoSli'MAIN'a(1:3, 1:4) = (1,4) 14 (2,4) 24 (3,4) 34(dbx)
print arr(201:203, 101:105)
Chapter 8 Evaluating and Displaying Data 131
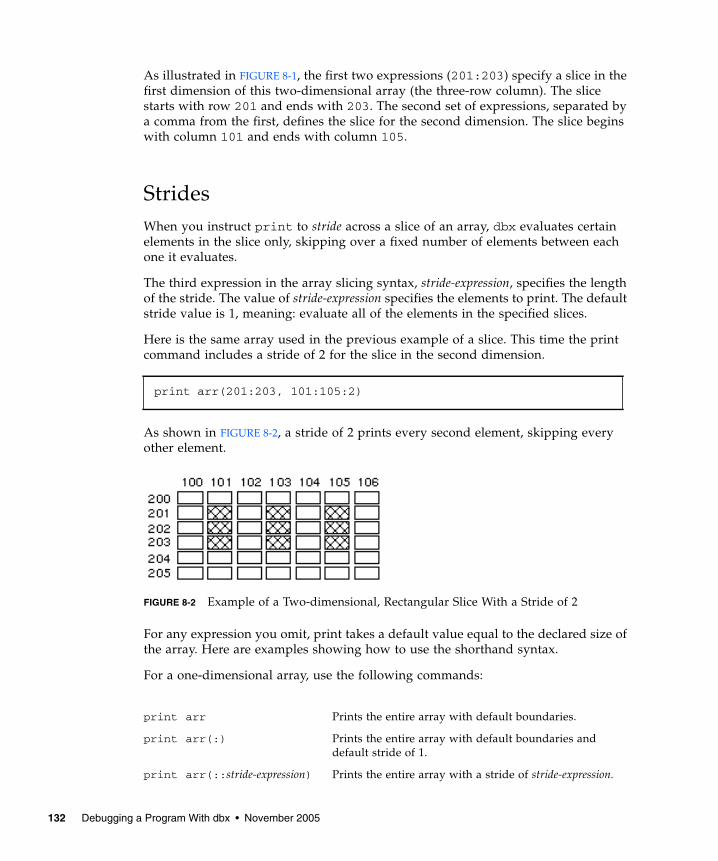
As illustrated in FIGURE 8-1, the first two expressions (201:203) specify a slice in thefirst dimension of this two-dimensional array (the three-row column). The slicestarts with row 201 and ends with 203. The second set of expressions, separated bya comma from the first, defines the slice for the second dimension. The slice beginswith column 101 and ends with column 105.
StridesWhen you instruct print to stride across a slice of an array, dbx evaluates certainelements in the slice only, skipping over a fixed number of elements between eachone it evaluates.
The third expression in the array slicing syntax, stride-expression, specifies the lengthof the stride. The value of stride-expression specifies the elements to print. The defaultstride value is 1, meaning: evaluate all of the elements in the specified slices.
Here is the same array used in the previous example of a slice. This time the printcommand includes a stride of 2 for the slice in the second dimension.
As shown in FIGURE 8-2, a stride of 2 prints every second element, skipping everyother element.
FIGURE 8-2 Example of a Two-dimensional, Rectangular Slice With a Stride of 2
For any expression you omit, print takes a default value equal to the declared size ofthe array. Here are examples showing how to use the shorthand syntax.
For a one-dimensional array, use the following commands:
print arr(201:203, 101:105:2)
print arr Prints the entire array with default boundaries.
print arr(:) Prints the entire array with default boundaries anddefault stride of 1.
print arr(::stride-expression) Prints the entire array with a stride of stride-expression.
132 Debugging a Program With dbx • November 2005

For a two-dimensional array, the following command prints the entire array.
To print every third element in the second dimension of a two-dimensional array,type:
print arr
print arr (:,::3)
Chapter 8 Evaluating and Displaying Data 133

134 Debugging a Program With dbx • November 2005

CHAPTER 9
Using Runtime Checking
Runtime checking (RTC) lets you automatically detect runtime errors, such asmemory access errors and memory leak, in a native code application during thedevelopment phase. It also lets you monitor memory usage. You cannot use runtimechecking on Java code.
The following topics are covered in this chapter:
■ Capabilities of Runtime Checking■ Using Runtime Checking■ Using Access Checking■ Using Memory Leak Checking■ Using Memory Use Checking■ Suppressing Errors■ Using Runtime Checking on a Child Process■ Using Runtime Checking on an Attached Process■ Using Fix and Continue With Runtime Checking■ Runtime Checking Application Programming Interface■ Using Runtime Checking in Batch Mode■ Troubleshooting Tips■ Runtime Checking’s 8 Megabyte Limit■ Runtime Checking Errors
Note – Runtime checking is available on platforms running the Solaris OS only. It isnot available on platforms running the Linux OS.
Note – Memory access checking is available on the Solaris OS running on SPARCplatforms only. It is not available on Solaris OS running on x86 platforms
135

Capabilities of Runtime CheckingBecause runtime checking is an integral debugging feature, you can perform alldebugging operations while using runtime checking except collecting performancedata using the Collector.
Runtime checking:
■ Detects memory access errors■ Detects memory leaks■ Collects data on memory use■ Works with all languages■ Works with multithreaded code■ Requires no recompiling, relinking, or makefile changes
Compiling with the -g flag provides source line number correlation in the runtimechecking error messages. Runtime checking can also check programs compiled withthe optimization -O flag. There are some special considerations with programs notcompiled with the -g option.
You can use runtime checking by using the check command.
When to Use Runtime CheckingOne way to avoid seeing a large number of errors at once is to use runtime checkingearlier in the development cycle—as you are developing the individual modules thatmake up your program. Write a unit test to drive each module and use runtimechecking incrementally to check one module at a time. That way, you deal with asmaller number of errors at a time. When you integrate all of the modules into thefull program, you are likely to encounter few new errors. When you reduce thenumber of errors to zero, you need to run runtime checking again only when youmake changes to a module.
Runtime Checking RequirementsTo use runtime checking, you must fulfill the following requirements:
■ Programs compiled using a Sun compiler.
■ Dynamic linking with libc.
136 Debugging a Program With dbx • November 2005

■ Use of the standard libc malloc, free, and realloc functions or allocatorsbased on those functions. Runtime checking provides an applicationprogramming interface (API) to handle other allocators. See “Runtime CheckingApplication Programming Interface” on page 162.
■ Programs that are not fully stripped; programs stripped with strip -x areacceptable.
LimitationsRuntime checking does not handle program text areas and data areas larger than 8megabytes on hardware that is not based on UltraSPARC® processors. For moreinformation, see “Runtime Checking’s 8 Megabyte Limit” on page 164.
A possible solution is to insert special files in the executable image to handleprogram text areas and data areas larger than 8 megabytes.
Using Runtime CheckingTo use runtime checking, enable the type of checking you want to use before you runthe program.
Turning On Memory Use and Memory LeakCheckingTo turn on memory use and memory leak checking, type:
When memory use checking or memory leak checking is turned on, the showblockcommand shows the details about the heap block at a given address. The detailsinclude the location of the block’s allocation and its size. For more information, see“showblock Command” on page 372.
(dbx) check -memuse
Chapter 9 Using Runtime Checking 137

Turning On Memory Access CheckingTo turn on memory access checking only, type:
Note – Memory access checking is not available on Solaris OS on x86 platforms.
Turning On All Runtime CheckingTo turn on memory leak, memory use, and memory access checking, type:
For more information, see “check Command” on page 308.
Turning Off Runtime CheckingTo turn off runtime checking entirely, type:
For detailed information, see “uncheck Command” on page 394.
(dbx) check -access
(dbx) check -all
(dbx) uncheck -all
138 Debugging a Program With dbx • November 2005

Running Your ProgramAfter turning on the types of runtime checking you want, run the program beingtested, with or without breakpoints.
The program runs normally, but slowly because each memory access is checked forvalidity just before it occurs. If dbx detects invalid access, it displays the type andlocation of the error. Control returns to you (unless the dbx environment variablertc_auto_continue is set to on (see “Setting dbx Environment Variables” onpage 66.)
You can then issue dbx commands, such as where to get the current stack trace orprint to examine variables. If the error is not a fatal error, you can continueexecution of the program with the cont command. The program continues to thenext error or breakpoint, whichever is detected first. For detailed information, see“cont Command” on page 320.
If rtc_auto_continue is set to on, runtime checking continues to find errors, andkeeps running automatically. It redirects errors to the file named by the dbxenvironment variable rtc_error_log_file_name. (See “Setting dbxEnvironment Variables” on page 66.) The default log file name is/tmp/dbx.errlog.uniqueid.
You can limit the reporting of runtime checking errors using the suppresscommand. For detailed information, see “suppress Command” on page 383.
Below is a simple example showing how to turn on memory access and memory usechecking for a program called hello.c.
% cat -n hello.c 1 #include <stdio.h> 2 #include <stdlib.h> 3 #include <string.h> 4 5 char *hello1, *hello2; 6 7 void 8 memory_use() 9 {10 hello1 = (char *)malloc(32);11 strcpy(hello1, "hello world");12 hello2 = (char *)malloc(strlen(hello1)+1);13 strcpy(hello2, hello1);14 }1516 void17 memory_leak()18 {
Chapter 9 Using Runtime Checking 139

19 char *local;20 local = (char *)malloc(32);21 strcpy(local, "hello world");22 }2324 void25 access_error()26 {27 int i,j;2829 i = j;30 }3132 int33 main()34 {35 memory_use();36 access_error();37 memory_leak();38 printf("%s\n", hello2);39 return 0;40 }
% cc -g -o hello hello.c
140 Debugging a Program With dbx • November 2005
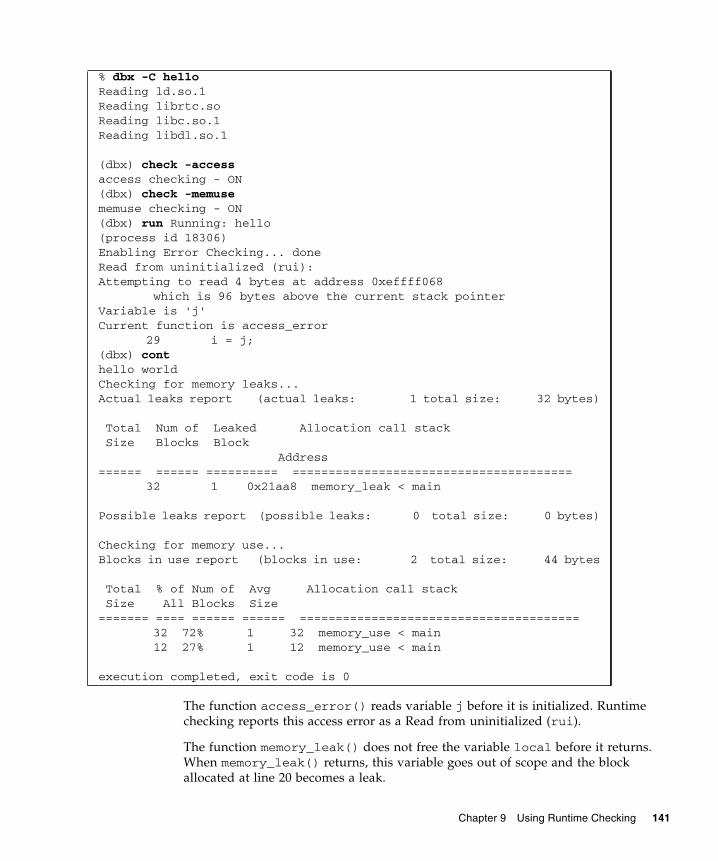
The function access_error() reads variable j before it is initialized. Runtimechecking reports this access error as a Read from uninitialized (rui).
The function memory_leak() does not free the variable local before it returns.When memory_leak() returns, this variable goes out of scope and the blockallocated at line 20 becomes a leak.
% dbx -C helloReading ld.so.1Reading librtc.soReading libc.so.1Reading libdl.so.1
(dbx) check -accessaccess checking - ON(dbx) check -memusememuse checking - ON(dbx) run Running: hello(process id 18306)Enabling Error Checking... doneRead from uninitialized (rui):Attempting to read 4 bytes at address 0xeffff068
which is 96 bytes above the current stack pointerVariable is 'j'Current function is access_error
29 i = j;(dbx) conthello worldChecking for memory leaks...Actual leaks report (actual leaks: 1 total size: 32 bytes)
Total Num of Leaked Allocation call stackSize Blocks Block
Address====== ====== ========== =======================================
32 1 0x21aa8 memory_leak < main
Possible leaks report (possible leaks: 0 total size: 0 bytes)
Checking for memory use...Blocks in use report (blocks in use: 2 total size: 44 bytes
Total % of Num of Avg Allocation call stackSize All Blocks Size
======= ==== ====== ====== ======================================= 32 72% 1 32 memory_use < main 12 27% 1 12 memory_use < main
execution completed, exit code is 0
Chapter 9 Using Runtime Checking 141

The program uses global variables hello1 and hello2, which are in scope all thetime. They both point to dynamically allocated memory, which is reported as Blocksin use (biu).
Using Access CheckingAccess checking checks whether your program accesses memory correctly bymonitoring each read, write, allocate, and free operation.
Note – Memory access checking is not available on Solaris OS on x86 platforms.
Programs might incorrectly read or write memory in a variety of ways; these arecalled memory access errors. For example, the program may reference a block ofmemory that has been deallocated through a free()call for a heap block. Or afunction might return a pointer to a local variable, and when that pointer is accessedan error would result. Access errors might result in wild pointers in the programand can cause incorrect program behavior, including wrong outputs andsegmentation violations. Some kinds of memory access errors can be very hard totrack down.
Runtime checking maintains a table that tracks the state of each block of memorybeing used by the program. Runtime checking checks each memory operationagainst the state of the block of memory it involves and then determines whether theoperation is valid. The possible memory states are:
■ Unallocated, initial state – Memory has not been allocated. It is illegal to read,write, or free this memory because it is not owned by the program.
■ Allocated, but uninitialized – Memory has been allocated to the program but notinitialized. It is legal to write to or free this memory, but is illegal to read itbecause it is uninitialized. For example, upon entering a function, stack memoryfor local variables is allocated, but uninitialized.
■ Read-only – It is legal to read, but not write or free, read-only memory.
■ Allocated and initialized – It is legal to read, write, or free allocated andinitialized memory.
Using runtime checking to find memory access errors is not unlike using a compilerto find syntax errors in your program. In both cases, a list of errors is produced, witheach error message giving the cause of the error and the location in the programwhere the error occurred. In both cases, you should fix the errors in your programstarting at the top of the error list and working your way down. One error can causeother errors in a chain reaction. The first error in the chain is, therefore, the “firstcause,” and fixing that error might also fix some subsequent errors.
142 Debugging a Program With dbx • November 2005
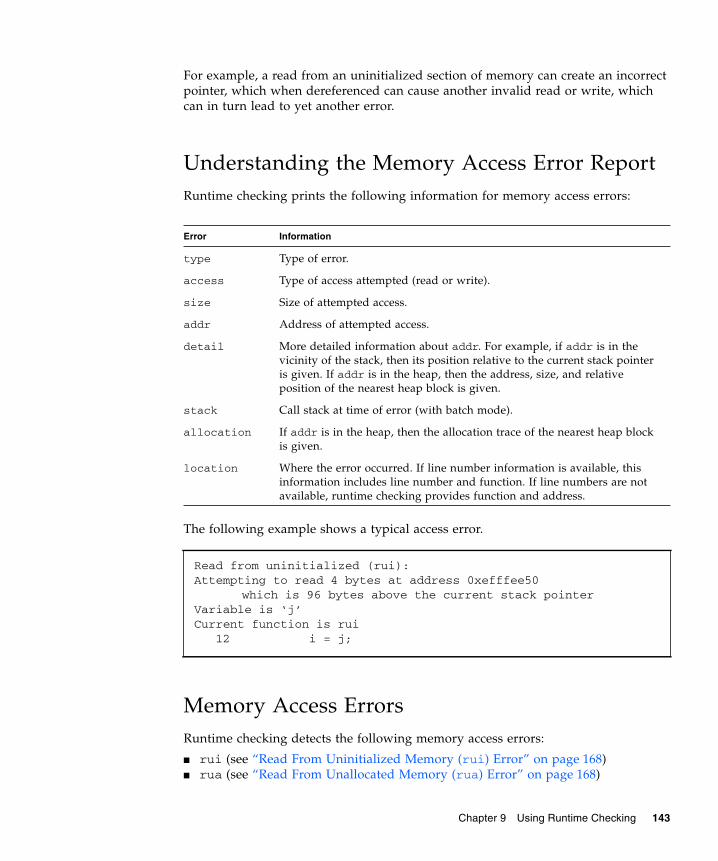
For example, a read from an uninitialized section of memory can create an incorrectpointer, which when dereferenced can cause another invalid read or write, whichcan in turn lead to yet another error.
Understanding the Memory Access Error ReportRuntime checking prints the following information for memory access errors:
The following example shows a typical access error.
Memory Access ErrorsRuntime checking detects the following memory access errors:
■ rui (see “Read From Uninitialized Memory (rui) Error” on page 168)■ rua (see “Read From Unallocated Memory (rua) Error” on page 168)
Error Information
type Type of error.
access Type of access attempted (read or write).
size Size of attempted access.
addr Address of attempted access.
detail More detailed information about addr. For example, if addr is in thevicinity of the stack, then its position relative to the current stack pointeris given. If addr is in the heap, then the address, size, and relativeposition of the nearest heap block is given.
stack Call stack at time of error (with batch mode).
allocation If addr is in the heap, then the allocation trace of the nearest heap blockis given.
location Where the error occurred. If line number information is available, thisinformation includes line number and function. If line numbers are notavailable, runtime checking provides function and address.
Read from uninitialized (rui):Attempting to read 4 bytes at address 0xefffee50
which is 96 bytes above the current stack pointerVariable is ‘j’Current function is rui 12 i = j;
Chapter 9 Using Runtime Checking 143

■ wua (see “Write to Unallocated Memory (wua) Error” on page 169)■ wro (see “Write to Read-Only Memory (wro) Error” on page 169)■ mar (see “Misaligned Read (mar) Error” on page 167)■ maw (see “Misaligned Write (maw) Error” on page 168)■ duf (see “Duplicate Free (duf) Error” on page 167)■ baf (see “Bad Free (baf) Error” on page 166)■ maf (see “Misaligned Free (maf) Error” on page 167)■ oom (see “Out of Memory (oom) Error” on page 168)
Note – Runtime checking does not perform array bounds checking and, therefore,does not report array bound violations as access errors.
Using Memory Leak CheckingA memory leak is a dynamically allocated block of memory that has no pointerspointing to it anywhere in the data space of the program. Such blocks are orphanedmemory. Because there are no pointers pointing to the blocks, programs cannotreference them, much less free them. Runtime checking finds and reports suchblocks.
Memory leaks result in increased virtual memory consumption and generally resultin memory fragmentation. This might slow down the performance of your programand the whole system.
Typically, memory leaks occur because allocated memory is not freed and you lose apointer to the allocated block. Here are some examples of memory leaks:
voidfoo(){ char *s; s = (char *) malloc(32);
strcpy(s, "hello world");
return; /* no free of s. Once foo returns, there is no *//* pointer pointing to the malloc'ed block, *//* so that block is leaked. */
}
144 Debugging a Program With dbx • November 2005
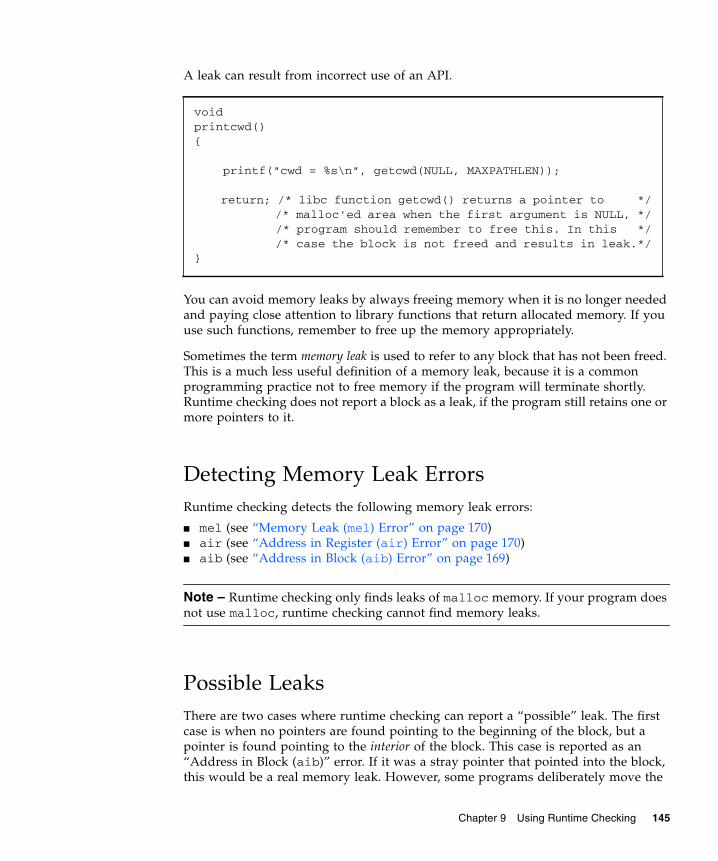
A leak can result from incorrect use of an API.
You can avoid memory leaks by always freeing memory when it is no longer neededand paying close attention to library functions that return allocated memory. If youuse such functions, remember to free up the memory appropriately.
Sometimes the term memory leak is used to refer to any block that has not been freed.This is a much less useful definition of a memory leak, because it is a commonprogramming practice not to free memory if the program will terminate shortly.Runtime checking does not report a block as a leak, if the program still retains one ormore pointers to it.
Detecting Memory Leak ErrorsRuntime checking detects the following memory leak errors:
■ mel (see “Memory Leak (mel) Error” on page 170)■ air (see “Address in Register (air) Error” on page 170)■ aib (see “Address in Block (aib) Error” on page 169)
Note – Runtime checking only finds leaks of malloc memory. If your program doesnot use malloc, runtime checking cannot find memory leaks.
Possible LeaksThere are two cases where runtime checking can report a “possible” leak. The firstcase is when no pointers are found pointing to the beginning of the block, but apointer is found pointing to the interior of the block. This case is reported as an“Address in Block (aib)” error. If it was a stray pointer that pointed into the block,this would be a real memory leak. However, some programs deliberately move the
voidprintcwd(){
printf("cwd = %s\n", getcwd(NULL, MAXPATHLEN));
return; /* libc function getcwd() returns a pointer to *//* malloc'ed area when the first argument is NULL, *//* program should remember to free this. In this *//* case the block is not freed and results in leak.*/
}
Chapter 9 Using Runtime Checking 145
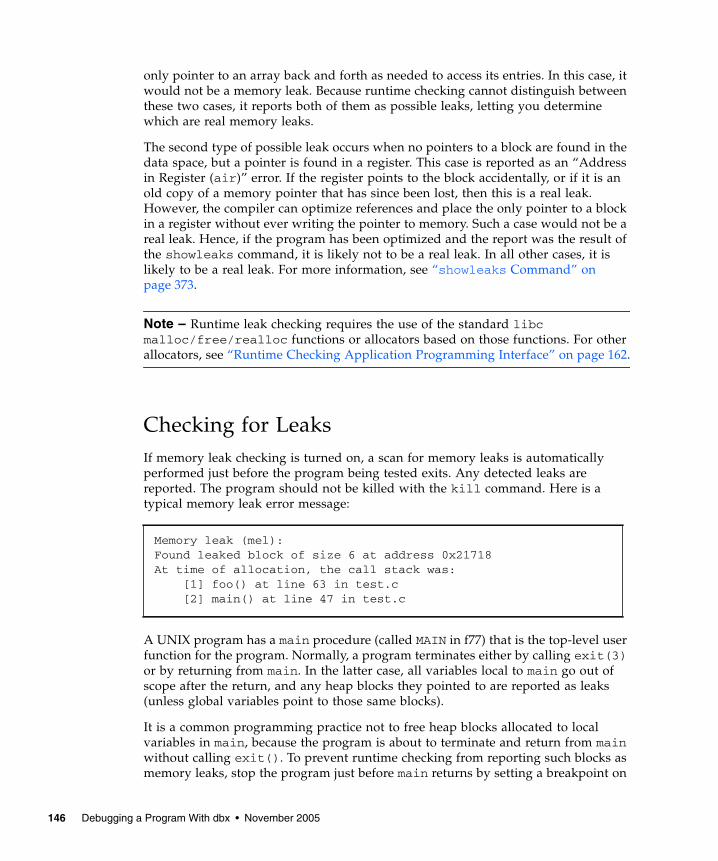
only pointer to an array back and forth as needed to access its entries. In this case, itwould not be a memory leak. Because runtime checking cannot distinguish betweenthese two cases, it reports both of them as possible leaks, letting you determinewhich are real memory leaks.
The second type of possible leak occurs when no pointers to a block are found in thedata space, but a pointer is found in a register. This case is reported as an “Addressin Register (air)” error. If the register points to the block accidentally, or if it is anold copy of a memory pointer that has since been lost, then this is a real leak.However, the compiler can optimize references and place the only pointer to a blockin a register without ever writing the pointer to memory. Such a case would not be areal leak. Hence, if the program has been optimized and the report was the result ofthe showleaks command, it is likely not to be a real leak. In all other cases, it islikely to be a real leak. For more information, see “showleaks Command” onpage 373.
Note – Runtime leak checking requires the use of the standard libcmalloc/free/realloc functions or allocators based on those functions. For otherallocators, see “Runtime Checking Application Programming Interface” on page 162.
Checking for LeaksIf memory leak checking is turned on, a scan for memory leaks is automaticallyperformed just before the program being tested exits. Any detected leaks arereported. The program should not be killed with the kill command. Here is atypical memory leak error message:
A UNIX program has a main procedure (called MAIN in f77) that is the top-level userfunction for the program. Normally, a program terminates either by calling exit(3)or by returning from main. In the latter case, all variables local to main go out ofscope after the return, and any heap blocks they pointed to are reported as leaks(unless global variables point to those same blocks).
It is a common programming practice not to free heap blocks allocated to localvariables in main, because the program is about to terminate and return from mainwithout calling exit(). To prevent runtime checking from reporting such blocks asmemory leaks, stop the program just before main returns by setting a breakpoint on
Memory leak (mel):Found leaked block of size 6 at address 0x21718At time of allocation, the call stack was: [1] foo() at line 63 in test.c [2] main() at line 47 in test.c
146 Debugging a Program With dbx • November 2005
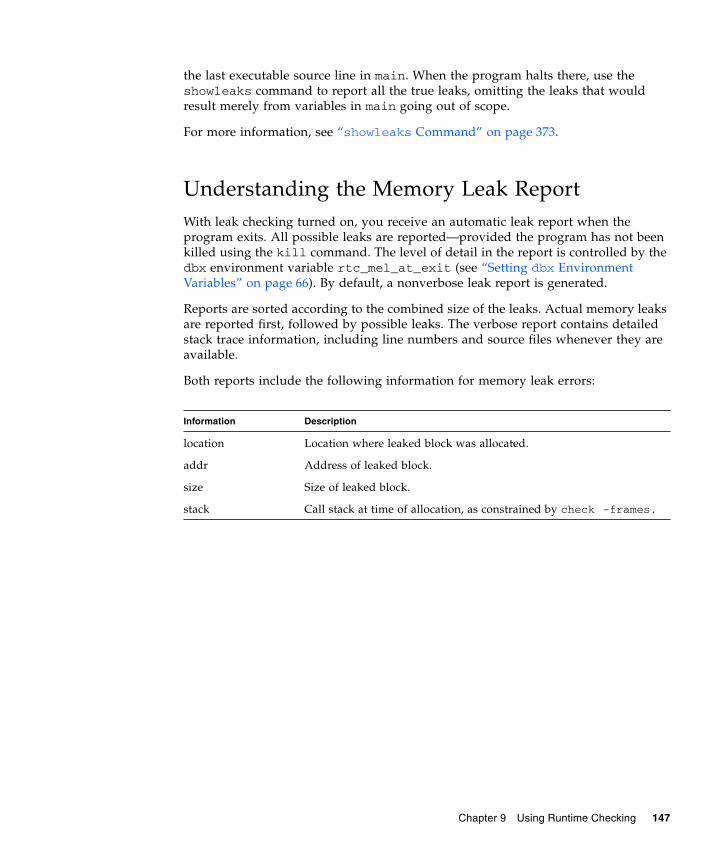
the last executable source line in main. When the program halts there, use theshowleaks command to report all the true leaks, omitting the leaks that wouldresult merely from variables in main going out of scope.
For more information, see “showleaks Command” on page 373.
Understanding the Memory Leak ReportWith leak checking turned on, you receive an automatic leak report when theprogram exits. All possible leaks are reported—provided the program has not beenkilled using the kill command. The level of detail in the report is controlled by thedbx environment variable rtc_mel_at_exit (see “Setting dbx EnvironmentVariables” on page 66). By default, a nonverbose leak report is generated.
Reports are sorted according to the combined size of the leaks. Actual memory leaksare reported first, followed by possible leaks. The verbose report contains detailedstack trace information, including line numbers and source files whenever they areavailable.
Both reports include the following information for memory leak errors:
Information Description
location Location where leaked block was allocated.
addr Address of leaked block.
size Size of leaked block.
stack Call stack at time of allocation, as constrained by check -frames.
Chapter 9 Using Runtime Checking 147
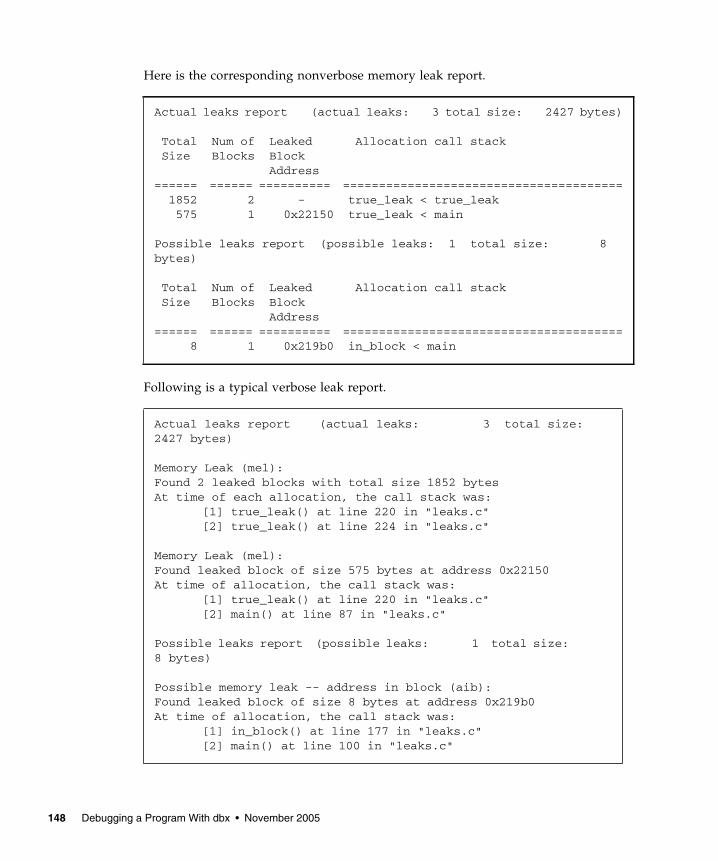
Here is the corresponding nonverbose memory leak report.
Following is a typical verbose leak report.
Actual leaks report (actual leaks: 3 total size: 2427 bytes)
Total Num of Leaked Allocation call stack Size Blocks Block Address====== ====== ========== ======================================= 1852 2 - true_leak < true_leak 575 1 0x22150 true_leak < main
Possible leaks report (possible leaks: 1 total size: 8bytes)
Total Num of Leaked Allocation call stack Size Blocks Block Address====== ====== ========== ======================================= 8 1 0x219b0 in_block < main
Actual leaks report (actual leaks: 3 total size:2427 bytes)
Memory Leak (mel):Found 2 leaked blocks with total size 1852 bytesAt time of each allocation, the call stack was:
[1] true_leak() at line 220 in "leaks.c"[2] true_leak() at line 224 in "leaks.c"
Memory Leak (mel):Found leaked block of size 575 bytes at address 0x22150At time of allocation, the call stack was:
[1] true_leak() at line 220 in "leaks.c"[2] main() at line 87 in "leaks.c"
Possible leaks report (possible leaks: 1 total size:8 bytes)
Possible memory leak -- address in block (aib):Found leaked block of size 8 bytes at address 0x219b0At time of allocation, the call stack was:
[1] in_block() at line 177 in "leaks.c"[2] main() at line 100 in "leaks.c"
148 Debugging a Program With dbx • November 2005

Generating a Leak Report
You can ask for a leak report at any time using the showleaks command, whichreports new memory leaks since the last showleaks command. For moreinformation, see “showleaks Command” on page 373.
Combining Leaks
Because the number of individual leaks can be very large, runtime checkingautomatically combines leaks allocated at the same place into a single combined leakreport. The decision to combine leaks, or report them individually, is controlled bythe number-of-frames-to-match parameter specified by the -match m optionon a check -leaks or the -m option of the showleaks command. If the call stackat the time of allocation for two or more leaks matches to m frames to the exactprogram counter level, these leaks are reported in a single combined leak report.
Consider the following three call sequences:
If all of these blocks lead to memory leaks, the value of m determines whether theleaks are reported as separate leaks or as one repeated leak. If m is 2, Blocks 1 and 2are reported as one repeated leak because the 2 stack frames above malloc() arecommon to both call sequences. Block 3 will be reported as a separate leak becausethe trace for c() does not match the other blocks. For m greater than 2, runtimechecking reports all leaks as separate leaks. (The malloc is not shown on the leakreport.)
In general, the smaller the value of m, the fewer individual leak reports and the morecombined leak reports are generated. The greater the value of m, the fewer combinedleak reports and the more individual leak reports are generated.
Block 1 Block 2 Block 3
[1] malloc [1] malloc [1] malloc
[2] d() at 0x20000 [2] d() at 0x20000 [2] d() at 0x20000
[3] c() at 0x30000 [3] c() at 0x30000 [3] c() at 0x31000
[4] b() at 0x40000 [4] b() at 0x41000 [4] b() at 0x40000
[5] a() at 0x50000 [5] a() at 0x50000 [5] a() at 0x50000
Chapter 9 Using Runtime Checking 149

Fixing Memory LeaksOnce you have obtained a memory leak report, follow these guidelines for fixing thememory leaks.
■ Most importantly, determine where the leak is. The leak report tells you theallocation trace of the leaked block, the place where the leaked block wasallocated.
■ You can then look at the execution flow of your program and see how the blockwas used. If it is obvious where the pointer was lost, the job is easy; otherwiseyou can use showleaks to narrow your leak window. By default the showleakscommand gives you the new leaks created only since the last showleakscommand. You can run showleaks repeatedly while stepping through yourprogram to narrow the window where the block was leaked.
For more information, see “showleaks Command” on page 373.
Using Memory Use CheckingMemory use checking lets you see all the heap memory in use. You can use thisinformation to get a sense of where memory is allocated in your program or whichprogram sections are using the most dynamic memory. This information can also beuseful in reducing the dynamic memory consumption of your program and mighthelp in performance tuning
Memory use checking is useful during performance tuning or to control virtualmemory use. When the program exits, a memory use report can be generated.Memory usage information can also be obtained at any time during programexecution with the showmemuse command, which causes memory usage to bedisplayed. For information, see “showmemuse Command” on page 374.
Turning on memory use checking also turns on leak checking. In addition to a leakreport at the program exit, you also get a blocks in use (biu) report. By default, anonverbose blocks in use report is generated at program exit. The level of detail inthe memory use report is controlled by the dbx environment variablertc_biu_at_exit (see “Setting dbx Environment Variables” on page 66).
150 Debugging a Program With dbx • November 2005
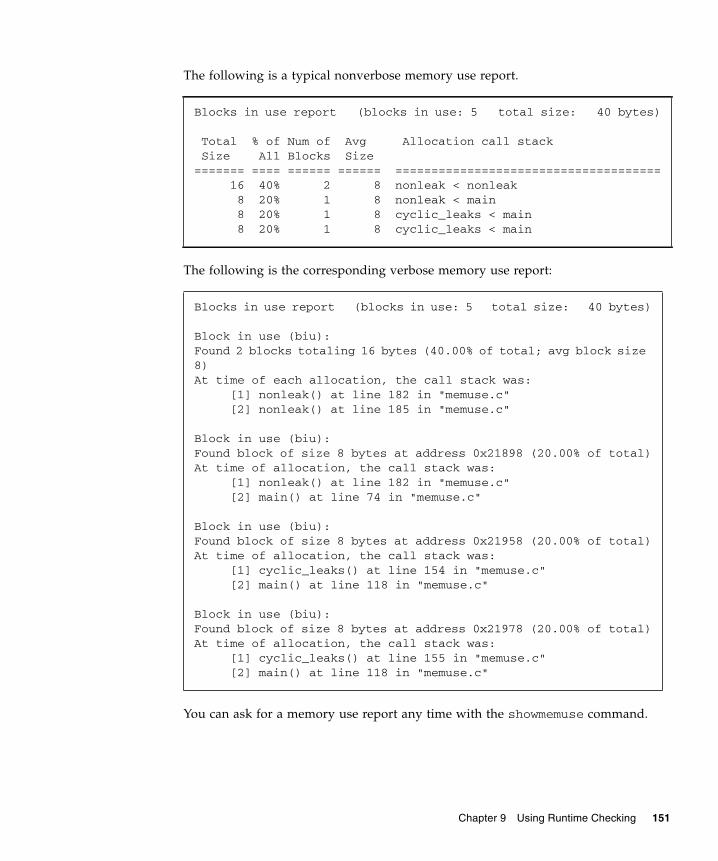
The following is a typical nonverbose memory use report.
The following is the corresponding verbose memory use report:
You can ask for a memory use report any time with the showmemuse command.
Blocks in use report (blocks in use: 5 total size: 40 bytes)
Total % of Num of Avg Allocation call stack Size All Blocks Size======= ==== ====== ====== ===================================== 16 40% 2 8 nonleak < nonleak 8 20% 1 8 nonleak < main 8 20% 1 8 cyclic_leaks < main 8 20% 1 8 cyclic_leaks < main
Blocks in use report (blocks in use: 5 total size: 40 bytes)
Block in use (biu):Found 2 blocks totaling 16 bytes (40.00% of total; avg block size8)At time of each allocation, the call stack was: [1] nonleak() at line 182 in "memuse.c" [2] nonleak() at line 185 in "memuse.c"
Block in use (biu):Found block of size 8 bytes at address 0x21898 (20.00% of total)At time of allocation, the call stack was: [1] nonleak() at line 182 in "memuse.c" [2] main() at line 74 in "memuse.c"
Block in use (biu):Found block of size 8 bytes at address 0x21958 (20.00% of total)At time of allocation, the call stack was: [1] cyclic_leaks() at line 154 in "memuse.c" [2] main() at line 118 in "memuse.c"
Block in use (biu):Found block of size 8 bytes at address 0x21978 (20.00% of total)At time of allocation, the call stack was: [1] cyclic_leaks() at line 155 in "memuse.c" [2] main() at line 118 in "memuse.c"
Chapter 9 Using Runtime Checking 151

Suppressing ErrorsRuntime checking provides a powerful error suppression facility that allows greatflexibility in limiting the number and types of errors reported. If an error occurs thatyou have suppressed, then no report is given, and the program continues as if noerror had occurred.
You can suppress errors using the suppress command (see “suppress Command”on page 383).
You can undo error suppression using the unsuppress command (see“unsuppress Command” on page 397).
Suppression is persistent across run commands within the same debug session, butnot across debug commands.
Types of SuppressionThe following types of suppression are available:
Suppression by Scope and Type
You must specify which type of error to suppress. You can specify which parts of theprogram to suppress. The options are:
Option Description
Global The default; applies to the whole program.
Load Object Applies to an entire load object, such as a shared library, or the mainprogram.
File Applies to all functions in a particular file.
Function Applies to a particular function.
Line Applies to a particular source line.
Address Applies to a particular instruction at an address.
152 Debugging a Program With dbx • November 2005
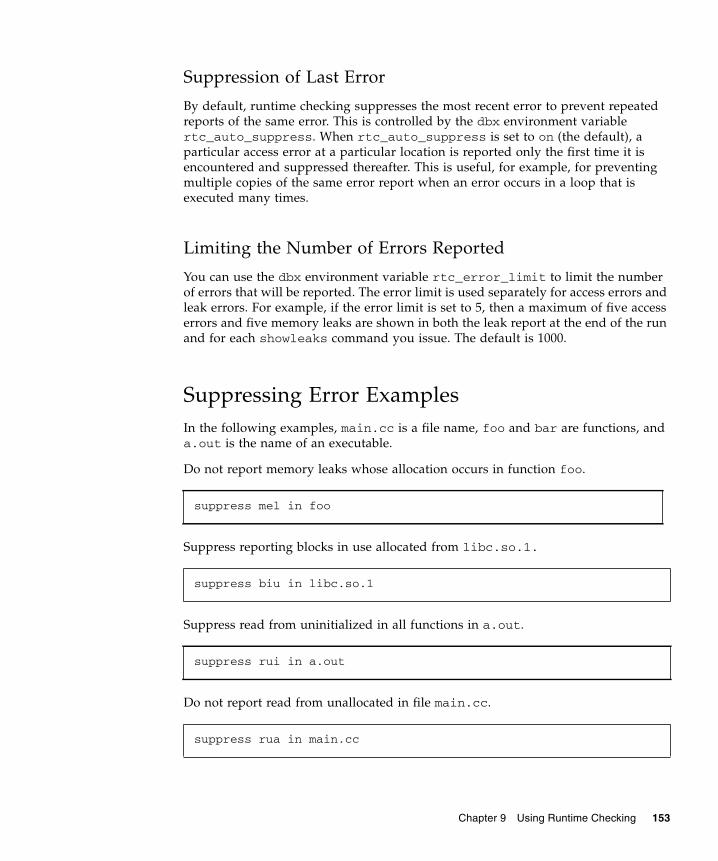
Suppression of Last Error
By default, runtime checking suppresses the most recent error to prevent repeatedreports of the same error. This is controlled by the dbx environment variablertc_auto_suppress. When rtc_auto_suppress is set to on (the default), aparticular access error at a particular location is reported only the first time it isencountered and suppressed thereafter. This is useful, for example, for preventingmultiple copies of the same error report when an error occurs in a loop that isexecuted many times.
Limiting the Number of Errors Reported
You can use the dbx environment variable rtc_error_limit to limit the numberof errors that will be reported. The error limit is used separately for access errors andleak errors. For example, if the error limit is set to 5, then a maximum of five accesserrors and five memory leaks are shown in both the leak report at the end of the runand for each showleaks command you issue. The default is 1000.
Suppressing Error ExamplesIn the following examples, main.cc is a file name, foo and bar are functions, anda.out is the name of an executable.
Do not report memory leaks whose allocation occurs in function foo.
Suppress reporting blocks in use allocated from libc.so.1.
Suppress read from uninitialized in all functions in a.out.
Do not report read from unallocated in file main.cc.
suppress mel in foo
suppress biu in libc.so.1
suppress rui in a.out
suppress rua in main.cc
Chapter 9 Using Runtime Checking 153

Suppress duplicate free at line 10 of main.cc.
Suppress reporting of all errors in function bar.
For more information, see “suppress Command” on page 383.
Default SuppressionsTo detect all errors, runtime checking does not require the program be compiledusing the -g option (symbolic). However, symbolic information is sometimes neededto guarantee the correctness of certain errors, mostly rui errors. For this reasoncertain errors, rui for a.out and rui, aib, and air for shared libraries, aresuppressed by default if no symbolic information is available. This behavior can bechanged using the -d option of the suppress and unsuppress commands.
The following command causes runtime checking to no longer suppress read fromuninitialized memory (rui) in code that does not have symbolic information(compiled without -g):
For more information, see “unsuppress Command” on page 397.
Using Suppression to Manage ErrorsFor the initial run on a large program, the large number of errors might beoverwhelming. It might be better to take a phased approach. You can do so using thesuppress command to reduce the reported errors to a manageable number, fixingjust those errors, and repeating the cycle; suppressing fewer and fewer errors witheach iteration.
For example, you could focus on a few error types at one time. The most commonerror types typically encountered are rui, rua, and wua, usually in that order. ruierrors are less serious (although they can cause more serious errors to happen later).
suppress duf at main.cc:10
suppress all in bar
unsuppress -d rui
154 Debugging a Program With dbx • November 2005

Often a program might still work correctly with these errors. rua and wua errors aremore serious because they are accesses to or from invalid memory addresses andalways indicate a coding error.
You can start by suppressing rui and rua errors. After fixing all the wua errors thatoccur, run the program again, this time suppressing only rui errors. After fixing allthe rua errors that occur, run the program again, this time with no errorssuppressed. Fix all the rui errors. Lastly, run the program a final time to ensure noerrors are left.
If you want to suppress the last reported error, use suppress -last.
Using Runtime Checking on a ChildProcessTo use runtime checking on a child process, you must have the dbx environmentvariable rtc_inherit set to on. By default, it is set to off. (See “Setting dbxEnvironment Variables” on page 66.)
dbx supports runtime checking of a child process if runtime checking is enabled forthe parent and the dbx environment variable follow_fork_mode is set to child(see “Setting dbx Environment Variables” on page 66).
When a fork happens, dbx automatically performs runtime checking on the child. Ifthe program calls exec(), the runtime checking settings of the program callingexec() are passed on to the program.
At any given time, only one process can be under runtime checking control. Thefollowing is an example.
% cat -n program1.c 1 #include <sys/types.h> 2 #include <unistd.h> 3 #include <stdio.h> 4 5 int 6 main() 7 { 8 pid_t child_pid; 9 int parent_i, parent_j;1011 parent_i = parent_j;
Chapter 9 Using Runtime Checking 155

1213 child_pid = fork();1415 if (child_pid == -1) {16 printf("parent: Fork failed\n");17 return 1;18 } else if (child_pid == 0) {19 int child_i, child_j;2021 printf("child: In child\n");22 child_i = child_j;23 if (execl("./program2", NULL) == -1) {24 printf("child: exec of program2 failed\n");25 exit(1);26 }27 } else {28 printf("parent: child's pid = %d\n", child_pid);29 }30 return 0;31 }
% cat -n program2.c 1 2 #include <stdio.h> 3 4 main() 5 { 6 int program2_i, program2_j; 7 8 printf ("program2: pid = %d\n", getpid()); 9 program2_i = program2_j; 10 11 malloc(8); 12 13 return 0; 14 }%
156 Debugging a Program With dbx • November 2005

% cc -g -o program1 program1.c % cc -g -o program2 program2.c % dbx -C program1 Reading symbolic information for program1 Reading symbolic information for rtld /usr/lib/ld.so.1 Reading symbolic information for librtc.so Reading symbolic information for libc.so.1 Reading symbolic information for libdl.so.1 Reading symbolic information for libc_psr.so.1 (dbx) check -all access checking - ON memuse checking - ON (dbx) dbxenv follow_fork_mode child (dbx) run Running: program1 (process id 3885) Enabling Error Checking... doneRTC reports first error in the parent, program1 Read from uninitialized (rui): Attempting to read 4 bytes at address 0xeffff110 which is 104 bytes above the current stack pointer Variable is 'parent_j' Current function is main 11 parent_i = parent_j;(dbx) cont dbx: warning: Fork occurred; error checking disabled in parent detaching from process 3885 Attached to process 3886Because follow_fork_mode is set to child, when the fork occurs error checking isswitched from the parent to the child process stopped in _fork at 0xef6b6040 0xef6b6040: _fork+0x0008:bgeu _fork+0x30 Current function is main 13 child_pid = fork(); parent: child's pid = 3886 (dbx) cont child: In child Read from uninitialized (rui): Attempting to read 4 bytes at address 0xeffff108 which is 96 bytes above the current stack pointerRTC reports an error in the child Variable is 'child_j' Current function is main 22 child_i = child_j;
Chapter 9 Using Runtime Checking 157

(dbx) cont dbx: process 3886 about to exec("./program2") dbx: program "./program2" just exec'ed dbx: to go back to the original program use "debug $oprog" Reading symbolic information for program2 Skipping ld.so.1, already read Skipping librtc.so, already read Skipping libc.so.1, already read Skipping libdl.so.1, already read Skipping libc_psr.so.1, already readWhen the exec of program2 occurs, the RTC settings are inherited by program2 so accessand memory use checking are enabled for that process Enabling Error Checking... done stopped in main at line 8 in file "program2.c" 8 printf ("program2: pid = %d\n", getpid());(dbx) cont program2: pid = 3886 Read from uninitialized (rui): Attempting to read 4 bytes at address 0xeffff13c which is 100 bytes above the current stack pointerRTC reports an access error in the executed program, program2 Variable is 'program2_j' Current function is main 9 program2_i = program2_j; (dbx) cont Checking for memory leaks...RTC prints a memory use and memory leak report for the process that exited while under RTCcontrol, program2Actual leaks report (actual leaks: 1 total size: 8 bytes)
Total Num of Leaked Allocation call stack Size Blocks Block
Address====== ====== ========== ====================================
8 1 0x20c50 main Possible leaks report (possible leaks: 0 total size: 0 bytes)
execution completed, exit code is 0
158 Debugging a Program With dbx • November 2005

Using Runtime Checking on an AttachedProcessRuntime checking works on an attached process with the exception that RUI cannotbe detected if the affected memory has already been allocated. However, the processmust have rtcaudit.so preloaded when it starts. If the process to which you areattaching is a 64-bit process, use the appropriate 64-bit rtcaudit.so. If the productis installed in the /opt directory,rtcaudit.so is at:
/opt/SUNWspro/lib/v9/rtcaudit.so (for 64-bit SPARC platforms)
/opt/SUNWspro/lib/amd64/rtcaudit.so (for AMD64 platforms)
/opt/SUNWspro/lib for 32-bit platforms
To preload rtcaudit.so:
Set the LD_AUDIT environment variableto preload rtcaudit.so only whenneeded; do not keep it loaded all the time. For example:
Once you attach to the process, you can enable runtime checking.
If the program you want to attach to is forked or executed from some other program,you need to set LD_AUDIT for the main program (which will fork). The setting ofLD_AUDIT is inherited across forks and execution.
The LD_AUDIT environment variable applies to both 32-bit programs and 64-bitprograms, which makes it difficult to select the correct library for a 32-bit programthat runs a 64-bit program, or a 64-bit program that runs a 32-bit program. Someversions of the Solaris OS support the LD_AUDIT_32 environment variable and theLD_AUDIT_64 environment variable, which affect only 32-bit programs and 64-bitprograms, respectively. See the Linker and Libraries Guide for the version of the SolarisOS you are running to determine if these variables are supported.
% setenv LD_AUDIT path-to-rtcaudit/rtcaudit.so
% setenv LD_AUDIT...% start-your-application% unsetenv LD_AUDIT
Chapter 9 Using Runtime Checking 159

Using Fix and Continue With RuntimeCheckingYou can use runtime checking along with fix and continue to isolate and fixprogramming errors rapidly. Fix and continue provides a powerful combination thatcan save you a lot of debugging time. Here is an example:.
% cat -n bug.c
1 #include stdio.h
2 char *s = NULL;
3
4 void
5 problem()
6 {
7 *s = 'c';
8 }
9
10 main()
11 {
12 problem();
13 return 0;
14 }
% cat -n bug-fixed.c
1 #include stdio.h
2 char *s = NULL;
3
4 void
5 problem()
6 {
7
8 s = (char *)malloc(1);
9 *s = 'c';
10 }
11
12 main()
13 {
14 problem();
15 return 0;
16 }
yourmachine46: cc -g bug.c
yourmachine47: dbx -C a.out
160 Debugging a Program With dbx • November 2005
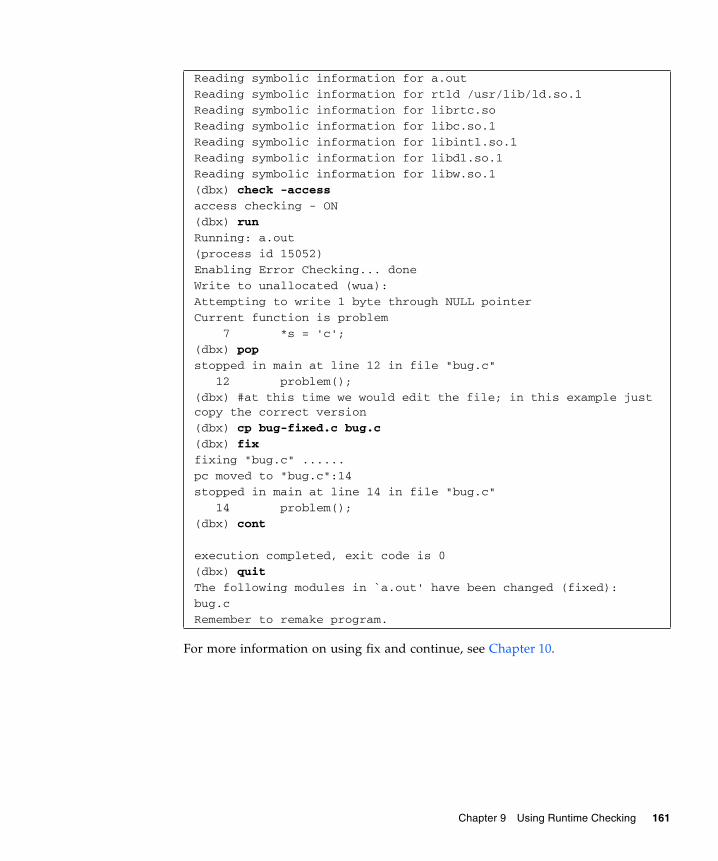
For more information on using fix and continue, see Chapter 10.
Reading symbolic information for a.out
Reading symbolic information for rtld /usr/lib/ld.so.1
Reading symbolic information for librtc.so
Reading symbolic information for libc.so.1
Reading symbolic information for libintl.so.1
Reading symbolic information for libdl.so.1
Reading symbolic information for libw.so.1
(dbx) check -access
access checking - ON
(dbx) run
Running: a.out
(process id 15052)
Enabling Error Checking... done
Write to unallocated (wua):
Attempting to write 1 byte through NULL pointer
Current function is problem
7 *s = 'c';
(dbx) pop
stopped in main at line 12 in file "bug.c"
12 problem();
(dbx) #at this time we would edit the file; in this example justcopy the correct version
(dbx) cp bug-fixed.c bug.c
(dbx) fix
fixing "bug.c" ......
pc moved to "bug.c":14
stopped in main at line 14 in file "bug.c"
14 problem();
(dbx) cont
execution completed, exit code is 0
(dbx) quit
The following modules in `a.out' have been changed (fixed):
bug.c
Remember to remake program.
Chapter 9 Using Runtime Checking 161
Runtime Checking ApplicationProgramming InterfaceBoth leak detection and access checking require that the standard heap managementroutines in the shared library libc.so be used so that runtime checking can keeptrack of all the allocations and deallocations in the program. Many applications writetheir own memory management routines either on top of the malloc() or free()function or stand-alone. When you use your own allocators (referred to as privateallocators), runtime checking cannot automatically track them; thus you do not learnof leak and memory access errors resulting from their improper use.
However, runtime checking provides an API for the use of private allocators. ThisAPI allows the private allocators the same treatment as the standard heap allocators.The API itself is provided in the header file rtc_api.h and is distributed as a partof Sun Studio software. The man page rtc_api(3x) details the runtime checkingAPI entry points.
Some minor differences might exist with runtime checking access error reportingwhen private allocators do not use the program heap. The error report will notinclude the allocation item.
Using Runtime Checking in Batch ModeThe bcheck utility is a convenient batch interface to the runtime checking feature ofdbx. It runs a program under dbx and by default, places the runtime checking erroroutput in the default file program.errs.
The bcheck utility can perform memory leak checking, memory access checking,memory use checking, or all three. Its default action is to perform only leakchecking. See the bcheck(1) man page for more details on its use.
Note – Before running the bcheck utility on a system running the 64-bit Linux OS,you must set the _DBX_EXEC_32 environment variable.
162 Debugging a Program With dbx • November 2005

bcheck SyntaxThe syntax for bcheck is:
Use the -o logfile option to specify a different name for the logfile. Use the -s scriptoption before executing the program to read in the dbx commands contained in thefile script. The script file typically contains commands like suppress and dbxenv totailor the error output of the bcheck utility.
The -q option makes the bcheck utility completely quiet, returning with the samestatus as the program. This option is useful when you want to use the bcheck utilityin scripts or makefiles.
bcheck ExamplesTo perform only leak checking on hello, type:
To perform only access checking on mach with the argument 5, type:
To perform memory use checking on cc quietly and exit with normal exit status,type:
The program does not stop when runtime errors are detected in batch mode. Allerror output is redirected to your error log file logfile. The program stops whenbreakpoints are encountered or if the program is interrupted.
In batch mode, the complete stack backtrace is generated and redirected to the errorlog file. The number of stack frames can be controlled using the dbx environmentvariable stack_max_size.
If the file logfile already exists, bcheck erases the contents of that file before itredirects the batch output to it.
bcheck [-V] [-access | -all | -leaks | -memuse] [-o logfile] [-q][-s script] program [args]
bcheck hello
bcheck -access mach 5
bcheck -memuse -q cc -c prog.c
Chapter 9 Using Runtime Checking 163

Enabling Batch Mode Directly From dbx
You can also enable a batch-like mode directly from dbx by setting the dbxenvironment variables rtc_auto_continue and rtc_error_log_file_name(see “Setting dbx Environment Variables” on page 66).
If rtc_auto_continue is set to on, runtime checking continues to find errors andkeeps running automatically. It redirects errors to the file named by the dbxenvironment variable rtc_error_log_file_name. (See “Setting dbxEnvironment Variables” on page 66.) The default log file name is/tmp/dbx.errlog.uniqueid. To redirect all errors to the terminal, set thertc_error_log_file_name environment variable to /dev/tty.
By default, rtc_auto_continue is set to off.
Troubleshooting TipsAfter error checking has been enabled for a program and the program is run, one ofthe following errors may be detected:
librtc.so and dbx version mismatch; Error checking disabled
This error can occur if you are using runtime checking on an attached process andhave set LD_AUDIT to a version of rtcaudit.so other than the one shipped withyour Sun Studio dbx image. To fix this, change the setting of LD_AUDIT.
patch area too far (8mb limitation); Access checking disabled
Runtime checking was unable to find patch space close enough to a loadobject foraccess checking to be enabled. See “Runtime Checking’s 8 Megabyte Limit” next.
Runtime Checking’s 8 Megabyte LimitThe 8 megabyte limit described below no longer applies on hardware based onUltraSPARC processors, on which dbx has the ability to invoke a trap handlerinstead of using a branch. The transfer of control to a trap handler is up to 10 timesslower but does not suffer from the 8 megabyte limit. Traps are used automatically,as necessary, as long as the hardware is based on UltraSPARC processors. You cancheck your hardware by using the system command isalist and checking that the
164 Debugging a Program With dbx • November 2005
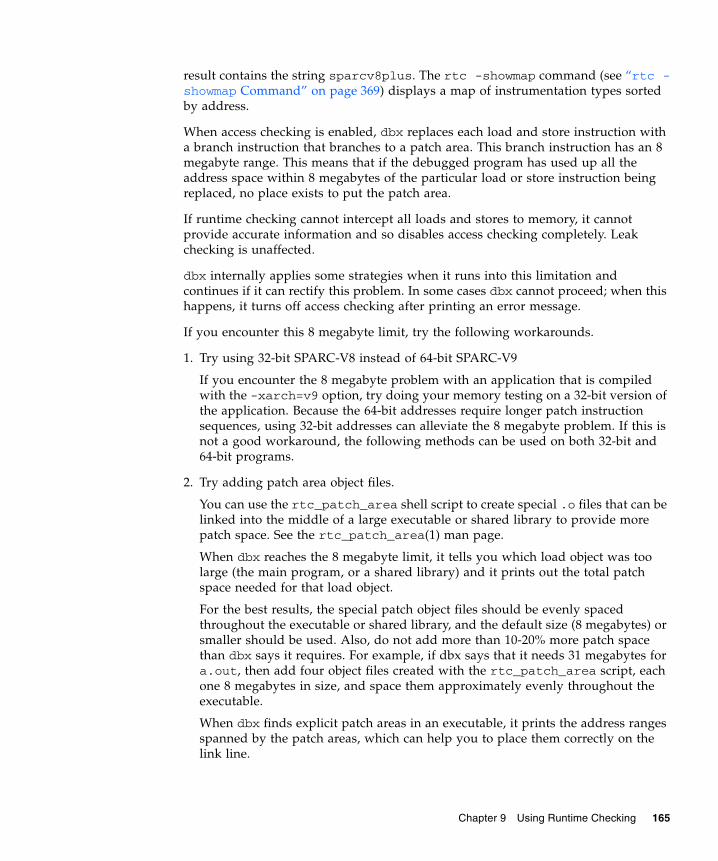
result contains the string sparcv8plus. The rtc -showmap command (see “rtc -showmap Command” on page 369) displays a map of instrumentation types sortedby address.
When access checking is enabled, dbx replaces each load and store instruction witha branch instruction that branches to a patch area. This branch instruction has an 8megabyte range. This means that if the debugged program has used up all theaddress space within 8 megabytes of the particular load or store instruction beingreplaced, no place exists to put the patch area.
If runtime checking cannot intercept all loads and stores to memory, it cannotprovide accurate information and so disables access checking completely. Leakchecking is unaffected.
dbx internally applies some strategies when it runs into this limitation andcontinues if it can rectify this problem. In some cases dbx cannot proceed; when thishappens, it turns off access checking after printing an error message.
If you encounter this 8 megabyte limit, try the following workarounds.
1. Try using 32-bit SPARC-V8 instead of 64-bit SPARC-V9
If you encounter the 8 megabyte problem with an application that is compiledwith the -xarch=v9 option, try doing your memory testing on a 32-bit version ofthe application. Because the 64-bit addresses require longer patch instructionsequences, using 32-bit addresses can alleviate the 8 megabyte problem. If this isnot a good workaround, the following methods can be used on both 32-bit and64-bit programs.
2. Try adding patch area object files.
You can use the rtc_patch_area shell script to create special .o files that can belinked into the middle of a large executable or shared library to provide morepatch space. See the rtc_patch_area(1) man page.
When dbx reaches the 8 megabyte limit, it tells you which load object was toolarge (the main program, or a shared library) and it prints out the total patchspace needed for that load object.
For the best results, the special patch object files should be evenly spacedthroughout the executable or shared library, and the default size (8 megabytes) orsmaller should be used. Also, do not add more than 10-20% more patch spacethan dbx says it requires. For example, if dbx says that it needs 31 megabytes fora.out, then add four object files created with the rtc_patch_area script, eachone 8 megabytes in size, and space them approximately evenly throughout theexecutable.
When dbx finds explicit patch areas in an executable, it prints the address rangesspanned by the patch areas, which can help you to place them correctly on thelink line.
Chapter 9 Using Runtime Checking 165

3. Try dividing the large load object into smaller load objects.
Split up the object files in your executable or your large library into smallergroups of object files. Then link them into smaller parts. If the large file is theexecutable, then split it up into a smaller executable and a series of sharedlibraries. If the large file is a shared library, then rearrange it into a set of smallerlibraries.
This technique allows dbx to find space for patch code in between the differentshared objects.
4. Try adding a “pad” .so file.
This should only be necessary if you are attaching to a process after it has startedup.
The runtime linker might place libraries so close together that patch space cannotbe created in the gaps between the libraries. When dbx starts up the executablewith runtime checking turned on, it asks the runtime linker to place an extra gapbetween the shared libraries, but when attaching to a process that was not startedby dbx with runtime checking enabled, the libraries might be too close together.
If the runtime libraries are too close together, (and if it is not possible to start theprogram using dbx) then you can try creating a shared library using thertc_patch_area script and linking it into your program between the othershared libraries. See the rtc_patch_area(1) man page for more details.
Runtime Checking ErrorsErrors reported by runtime checking generally fall in two categories. Access errorsand leaks.
Access ErrorsWhen access checking is turned on, runtime checking detects and reports thefollowing types of errors.
Bad Free (baf) Error
Problem: Attempt to free memory that has never been allocated.
Possible causes: Passing a non-heap data pointer to free() or realloc().
Example:
166 Debugging a Program With dbx • November 2005

char a[4];
char *b = &a[0];
free(b); /* Bad free (baf) */
Duplicate Free (duf) Error
Problem: Attempt to free a heap block that has already been freed.
Possible causes: Calling free() more than once with the same pointer. In C++,using the delete operator more than once on the same pointer.
Example:
char *a = (char *)malloc(1);
free(a);
free(a); /* Duplicate free (duf) */
Misaligned Free (maf) Error
Problem: Attempt to free a misaligned heap block.
Possible causes: Passing an improperly aligned pointer to free() or realloc();changing the pointer returned by malloc.
Example:
char *ptr = (char *)malloc(4);
ptr++;
free(ptr); /* Misaligned free */
Misaligned Read (mar) Error
Problem: Attempt to read data from an address without proper alignment.
Possible causes: Reading 2, 4, or 8 bytes from an address that is nothalf-word-aligned, word-aligned, or double-word-aligned, respectively.
Example:
char *s = “hello world”;
int *i = (int *)&s[1];
int j;
j = *i; /* Misaligned read (mar) */
Chapter 9 Using Runtime Checking 167

Misaligned Write (maw) Error
Problem: Attempt to write data to an address without proper alignment.
Possible causes: Writing 2, 4, or 8 bytes to an address that is not half-word-aligned,word-aligned, or double-word-aligned, respectively.
Example:
char *s = “hello world”;
int *i = (int *)&s[1];
*i = 0; /* Misaligned write (maw) */
Out of Memory (oom) Error
Problem: Attempt to allocate memory beyond physical memory available.
Cause: Program cannot obtain more memory from the system. Useful in locatingproblems that occur when the return value from malloc() is not checked for NULL,which is a common programming mistake.
Example:
char *ptr = (char *)malloc(0x7fffffff);
/* Out of Memory (oom), ptr == NULL */
Read From Unallocated Memory (rua) Error
Problem: Attempt to read from nonexistent, unallocated, or unmapped memory.
Possible causes: A stray pointer, overflowing the bounds of a heap block or accessinga heap block that has already been freed.
Example:
char c, *a = (char *)malloc(1);
c = a[1]; /* Read from unallocated memory (rua) */
Read From Uninitialized Memory (rui) Error
Problem: Attempt to read from uninitialized memory.
Possible causes: Reading local or heap data that has not been initialized.
Example:
168 Debugging a Program With dbx • November 2005
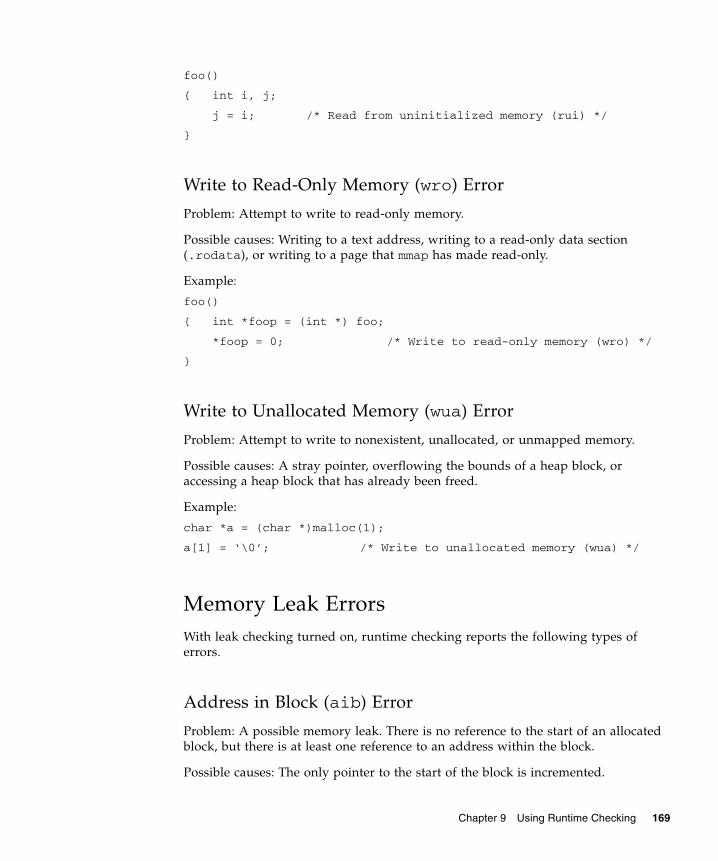
foo()
{ int i, j;
j = i; /* Read from uninitialized memory (rui) */
}
Write to Read-Only Memory (wro) Error
Problem: Attempt to write to read-only memory.
Possible causes: Writing to a text address, writing to a read-only data section(.rodata), or writing to a page that mmap has made read-only.
Example:
foo()
{ int *foop = (int *) foo;
*foop = 0; /* Write to read-only memory (wro) */
}
Write to Unallocated Memory (wua) Error
Problem: Attempt to write to nonexistent, unallocated, or unmapped memory.
Possible causes: A stray pointer, overflowing the bounds of a heap block, oraccessing a heap block that has already been freed.
Example:
char *a = (char *)malloc(1);
a[1] = ‘\0’; /* Write to unallocated memory (wua) */
Memory Leak ErrorsWith leak checking turned on, runtime checking reports the following types oferrors.
Address in Block (aib) Error
Problem: A possible memory leak. There is no reference to the start of an allocatedblock, but there is at least one reference to an address within the block.
Possible causes: The only pointer to the start of the block is incremented.
Chapter 9 Using Runtime Checking 169
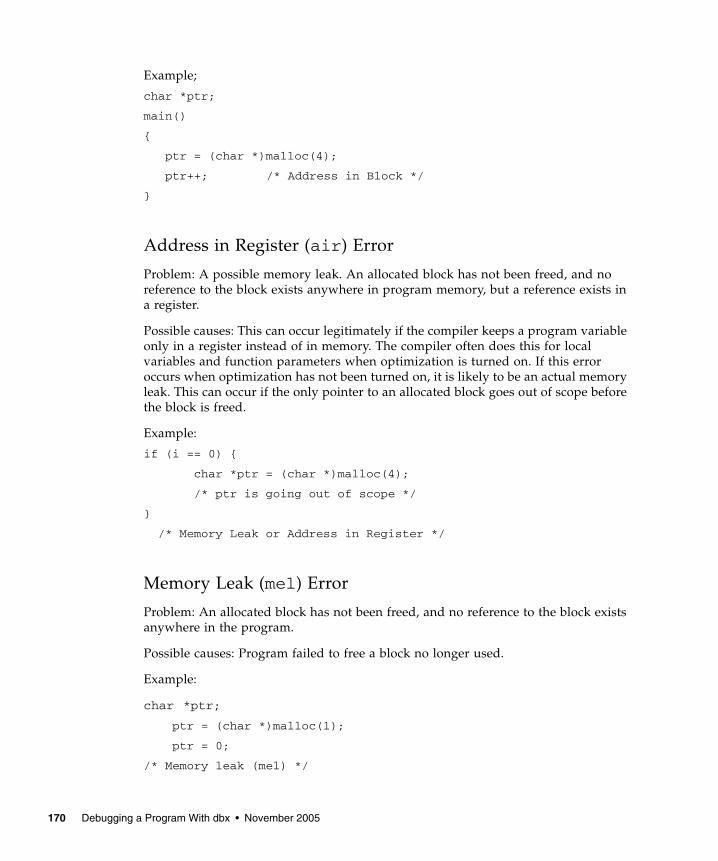
Example;
char *ptr;
main()
{
ptr = (char *)malloc(4);
ptr++; /* Address in Block */
}
Address in Register (air) Error
Problem: A possible memory leak. An allocated block has not been freed, and noreference to the block exists anywhere in program memory, but a reference exists ina register.
Possible causes: This can occur legitimately if the compiler keeps a program variableonly in a register instead of in memory. The compiler often does this for localvariables and function parameters when optimization is turned on. If this erroroccurs when optimization has not been turned on, it is likely to be an actual memoryleak. This can occur if the only pointer to an allocated block goes out of scope beforethe block is freed.
Example:
if (i == 0) {
char *ptr = (char *)malloc(4);
/* ptr is going out of scope */
}
/* Memory Leak or Address in Register */
Memory Leak (mel) Error
Problem: An allocated block has not been freed, and no reference to the block existsanywhere in the program.
Possible causes: Program failed to free a block no longer used.
Example:
char *ptr;
ptr = (char *)malloc(1);
ptr = 0;
/* Memory leak (mel) */
170 Debugging a Program With dbx • November 2005

CHAPTER 10
Fixing and Continuing
Using the fix command lets you recompile edited native source code quicklywithout stopping the debugging process. You cannot use the fix command torecompile Java code.
Note – The fix command is not available on Linux platforms.
This chapter is organized into the following sections:
■ Using Fix and Continue■ Fixing Your Program■ Changing Variables After Fixing■ Modifying a Header File■ Fixing C++ Template Definitions
Using Fix and ContinueThe fix and continue feature lets you modify and recompile a native source file andcontinue executing without rebuilding the entire program. By updating the .o filesand splicing them into your program, you don’t need to relink.
The advantages of using fix and continue are:
■ You do not have to relink the program.■ You do not have to reload the program for debugging.■ You can resume running the program from the fix location.
Note – Do not use the fix command if a build is in process.
171

How Fix and Continue OperatesBefore using the fix command you must edit the source in the editor window. (See“Modifying Source Using Fix and Continue” on page 172 for the ways you canmodify your code). After saving changes, type fix. For information on the fixcommand, see “fix Command” on page 336.
Once you have invoked the fix command, dbx calls the compiler with theappropriate compiler options. The modified files are compiled and shared object(.so) files are created. Semantic tests are done by comparing the old and new files.
The new object file is linked to your running process using the runtime linker. If thefunction on top of the stack is being fixed, the new stopped in function is thebeginning of the same line in the new function. All the breakpoints in the old file aremoved to the new file.
You can use fix and continue on files that have been compiled with or withoutdebugging information, but there are some limitations in the functionality of the fixcommand and the cont command for files originally compiled without debugginginformation. See the -g option description in “fix Command” on page 336 for moreinformation.
You can fix shared objects (.so) files, but they must be opened in a special mode.You can use either RTLD_NOW|RTLD_GLOBAL or RTLD_LAZY|RTLD_GLOBAL in thecall to the dlopen function.
Modifying Source Using Fix and ContinueYou can modify source code in the following ways when using fix and continue:
■ Add, delete, or change lines of code in functions■ Add or delete functions■ Add or delete global and static variables
Problems can occur when functions are mapped from the old file to the new file. Tominimize such problems when editing a source file:
■ Do not change the name of a function.
■ Do not add, delete, or change the type of arguments to a function.
■ Do not add, delete, or change the type of local variables in functions currentlyactive on the stack.
■ Do not make changes to the declaration of a template or to template instances.Only the body of a C++ template function definition can be modified.
If you make any of the above changes, rebuild your entire program rather than usingfix and continue.
172 Debugging a Program With dbx • November 2005

Fixing Your ProgramYou can use the fix command to relink source files after you make changes, withoutrecompiling the entire program. You can then continue execution of the program.
To fix your file:
1. Save the changes to your source.
2. Type fix at the dbx prompt.
Although you can do an unlimited number of fixes, if you have done several fixes ina row, consider rebuilding your program. The fix command changes the programimage in memory, but not on the disk. As you do more fixes, the memory image getsout of sync with what is on the disk.
The fix command does not make the changes within your executable file, but onlychanges the .o files and the memory image. Once you have finished debugging aprogram, you must rebuild your program to merge the changes into the executable.When you quit debugging, a message reminds you to rebuild your program.
If you invoke the fix command with an option other than -a and without a filename argument, only the current modified source file is fixed.
When fix is invoked, the current working directory of the file that was current atthe time of compilation is searched before executing the compilation line. Theremight be problems locating the correct directory due to a change in the file systemstructure from compilation time to debugging time. To avoid this problem, use thecommand pathmap, which creates a mapping from one path name to another.Mapping is applied to source paths and object file paths.
Continuing After FixingYou can continue executing using the cont command (see “cont Command” onpage 320).
Before resuming program execution, be aware of the following conditions thatdetermine the effect of your changes.
Changing an Executed Function
If you made changes in a function that has already executed, the changes have noeffect until:
Chapter 10 Fixing and Continuing 173

■ You run the program again■ That function is called the next time
If your modifications involve more than simple changes to variables, use the fixcommand, then the run command. Using the run command is faster because it doesnot relink the program.
Changing a Function Not Yet Called
If you have made changes in a function not yet called, the changes will be in effectwhen that function is called.
Changing a Function Currently Being Executed
If you have made changes to the function currently being executed, the impact of thefix command depends on where the change is relative to the stopped in function:
■ If the change is in code that has already been executed, the code is not re-executed. Execute the code by popping the current function off the stack (see“pop Command” on page 361) and continuing from where the changed functionis called. You need to know your code well enough to determine whether thefunction has side effects that can't be undone (for example, opening a file).
■ If the change is in code that is yet to be executed, the new code is run.
Changing a Function Presently on the Stack
If you have made changes to a function presently on the stack, but not to thestopped in function, the changed code is not used for the present call of thatfunction. When the stopped in function returns, the old versions of the function onthe stack are executed.
There are several ways to solve this problem:
■ Use the pop command to pop the stack until all changed functions are removedfrom the stack. You need to know your code to be sure that no problems arecreated.
■ Use the cont at line_number command to continue from another line.
■ Manually repair data structures (use the assign command) before continuing.
■ Rerun the program using the run command.
If there are breakpoints in modified functions on the stack, the breakpoints aremoved to the new versions of the functions. If the old versions are executed, theprogram does not stop in those functions.
174 Debugging a Program With dbx • November 2005
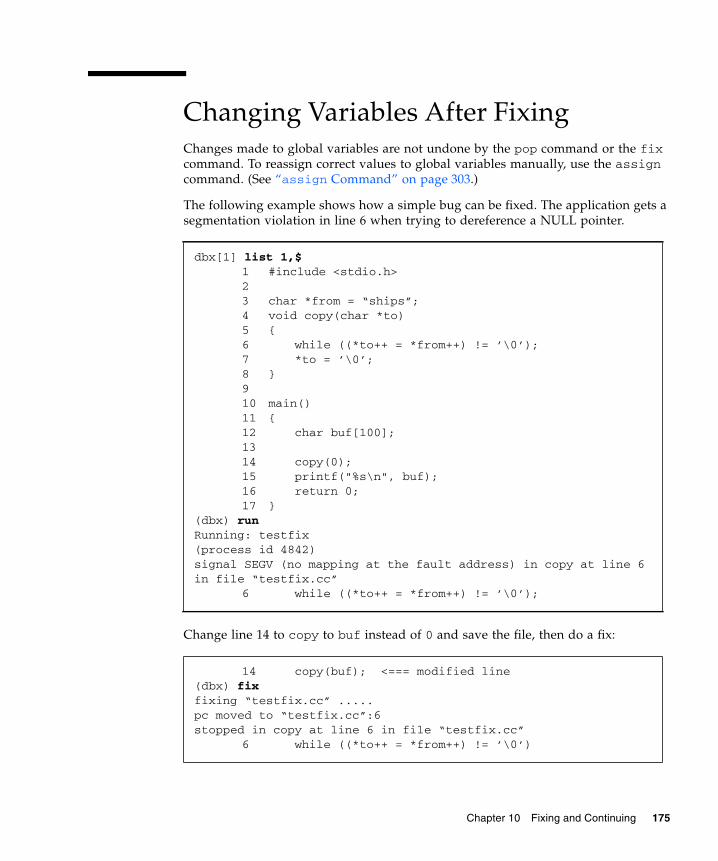
Changing Variables After FixingChanges made to global variables are not undone by the pop command or the fixcommand. To reassign correct values to global variables manually, use the assigncommand. (See “assign Command” on page 303.)
The following example shows how a simple bug can be fixed. The application gets asegmentation violation in line 6 when trying to dereference a NULL pointer.
Change line 14 to copy to buf instead of 0 and save the file, then do a fix:
dbx[1] list 1,$1 #include <stdio.h>23 char *from = “ships”;4 void copy(char *to)5 {6 while ((*to++ = *from++) != ’\0’);7 *to = ’\0’;8 }910 main()11 {12 char buf[100];1314 copy(0);15 printf("%s\n", buf);16 return 0;17 }
(dbx) runRunning: testfix(process id 4842)signal SEGV (no mapping at the fault address) in copy at line 6in file “testfix.cc”
6 while ((*to++ = *from++) != ’\0’);
14 copy(buf); <=== modified line(dbx) fixfixing “testfix.cc” .....pc moved to “testfix.cc”:6stopped in copy at line 6 in file “testfix.cc”
6 while ((*to++ = *from++) != ’\0’)
Chapter 10 Fixing and Continuing 175

If the program is continued from here, it still gets a segmentation fault because thezero-pointer is still pushed on the stack. Use the pop command to pop one frame ofthe stack:
If the program is continued from here, it runs, but does not print the correct valuebecause the global variable from has already been incremented by one. The programwould print hips and not ships. Use the assign command to restore the globalvariable and then use the cont command. Now the program prints the correct string:
Modifying a Header FileSometimes it may be necessary to modify a header (.h) file as well as a source file.To be sure that the modified header file is accessed by all source files in the programthat include it, you must give as an argument to the fix command a list of all thesource files that include that header file. If you do not include the list of source files,only the primary (current) source file is recompiled and only it includes the modifiedversion of the header file. Other source files in the program continue to include theoriginal version of that header file.
Fixing C++ Template DefinitionsC++ template definitions cannot be fixed directly. Fix the files with the templateinstances instead. You can use the -f option to override the date-checking if thetemplate definition file has not changed. For programs compiled with the Sun StudioC compiler, dbx looks for template definition .o files in the default repositorydirectory SunWS_cache. The -ptr compiler option is not supported by the fixcommand in dbx.
(dbx) popstopped in main at line 14 in file “testfix.cc” 14 copy(buf);
(dbx) assign from = from-1(dbx) contships
176 Debugging a Program With dbx • November 2005

CHAPTER 11
Debugging MultithreadedApplications
dbx can debug multithreaded applications that use either Solaris threads or POSIXthreads. With dbx, you can examine stack traces of each thread, resume all threads,step or next a specific thread, and navigate between threads.
dbx recognizes a multithreaded program by detecting whether it utilizeslibthread.so. The program uses libthread.so either by explicitly beingcompiled with -lthread or -mt, or implicitly by being compiled with -lpthread.
This chapter describes how to find information about and debug threads using thedbx thread commands.
This chapter is organized into the following sections:
■ Understanding Multithreaded Debugging■ Understanding LWP Information
Understanding MultithreadedDebuggingWhen it detects a multithreaded program, dbx tries to load libthread_db.so, aspecial system library for thread debugging located in /usr/lib.
dbx is synchronous; when any thread or lightweight process (LWP) stops, all otherthreads and LWPs sympathetically stop. This behavior is sometimes referred to asthe “stop the world” model.
Note – For information on multithreaded programming and LWPs, see the SolarisMultithreaded Programming Guide.
177

Thread InformationThe following thread information is available in dbx:
For native code, each line of information is composed of the following:
■ The * (asterisk) indicates that an event requiring user attention has occurred inthis thread. Usually this is a breakpoint.
An 'o' instead of an asterisk indicates that a dbx internal event has occurred.
■ The > (arrow) denotes the current thread.
■ t@number, the thread id, refers to a particular thread. The number is the thread_tvalue passed back by thr_create.
■ b l@number or a l@number means the thread is bound to or active on thedesignated LWP, meaning the thread is actually runnable by the operatingsystem.
■ The “Start function” of the thread as passed to thr_create. A ?() means thatthe start function is not known.
■ The thread state (See TABLE 11-1 for descriptions of the thread states.)
■ The function that the thread is currently executing.
For Java code, each line of information is composed of the following:
■ t@number, a dbx-style thread ID
■ The thread state (See TABLE 11-1 for descriptions of the thread states.)
■ The thread name in single quotation marks
■ A number indicating the thread priority
(dbx) threadst@1 a l@1 ?() running in main()t@2 ?() asleep on 0xef751450 in_swtch()t@3 b l@2 ?() running in sigwait()t@4 consumer() asleep on 0x22bb0 in _lwp_sema_wait()
*>t@5 b l@4 consumer() breakpoint in Queue_dequeue()t@6 b l@5 producer() running in _thread_start()
(dbx)
178 Debugging a Program With dbx • November 2005

TABLE 11-1 Thread and LWP States
Thread and LWP States Description
suspended The thread has been explicitly suspended.
runnable The thread is runnable and is waiting for an LWP as a computationalresource.
zombie When a detached thread exits (thr_exit)), it is in a zombie stateuntil it has rejoined through the use of thr_join().THR_DETACHED is a flag specified at thread creation time(thr_create()). A non-detached thread that exits is in a zombiestate until it has been reaped.
asleep on syncobj Thread is blocked on the given synchronization object. Dependingon what level of support libthread and libthread_db provide,syncobj might be as simple as a hexadecimal address or somethingwith more information content.
active The thread is active on an LWP, but dbx cannot access the LWP.
unknown dbx cannot determine the state.
lwpstate A bound or active thread state has the state of the LWP associatedwith it.
running LWP was running but was stopped in synchrony with some otherLWP.
syscall num LWP stopped on an entry into the given system call #.
syscall return num LWP stopped on an exit from the given system call #.
job control LWP stopped due to job control.
LWP suspended LWP is blocked in the kernel.
single stepped LWP has just completed a single step.
breakpoint LWP has just hit a breakpoint.
fault num LWP has incurred the given fault #.
signal name LWP has incurred the given signal.
process sync The process to which this LWP belongs has just started executing.
LWP death LWP is in the process of exiting.
Chapter 11 Debugging Multithreaded Applications 179

Viewing the Context of Another ThreadTo switch the viewing context to another thread, use the thread command. Thesyntax is:
To display the current thread, type:
To switch to thread thread_id, type:
For more information on the thread command, see “thread Command” onpage 386.
Viewing the Threads ListTo view the threads list, use the threads command. The syntax is:
To print the list of all known threads, type:
To print threads normally not printed (zombies), type:
For an explanation of the threads list, see “Thread Information” on page 178.
For more information on the threads command, see “threads Command” onpage 388.
thread [-blocks] [-blockedby] [-info] [-hide] [-unhide] [-suspend] [-resume] thread_id
thread
thread thread_id
threads [-all} [-mode [all|filter] [auto|manual]]
threads
threads -all
180 Debugging a Program With dbx • November 2005

Resuming ExecutionUse the cont command to resume program execution. Currently, threads usesynchronous breakpoints, so all threads resume execution.
Understanding Thread Creation ActivityYou can get an idea of how often your application creates and destroys threads byusing the thr_create event and thr_exit event as in the following example:
Here the application created three threads. Note how the threads exited in reverseorder from their creation, which might indicate that had the application had morethreads, the threads would accumulate and consume resources.
To get more interesting information, you could try the following in a differentsession:
The output shows that all three threads were created by thread t@1, which is acommon multi-threading pattern.
(dbx) trace thr_create(dbx) trace thr_exit(dbx) run
trace: thread created t@2 on l@2trace: thread created t@3 on l@3trace: thread created t@4 on l@4trace: thr_exit t@4trace: thr_exit t@3trace: thr_exit t@2
(dbx) when thr_create { echo "XXX thread $newthread created by$thread"; }XXX thread t@2 created by t@1XXX thread t@3 created by t@1XXX thread t@4 created by t@1
Chapter 11 Debugging Multithreaded Applications 181
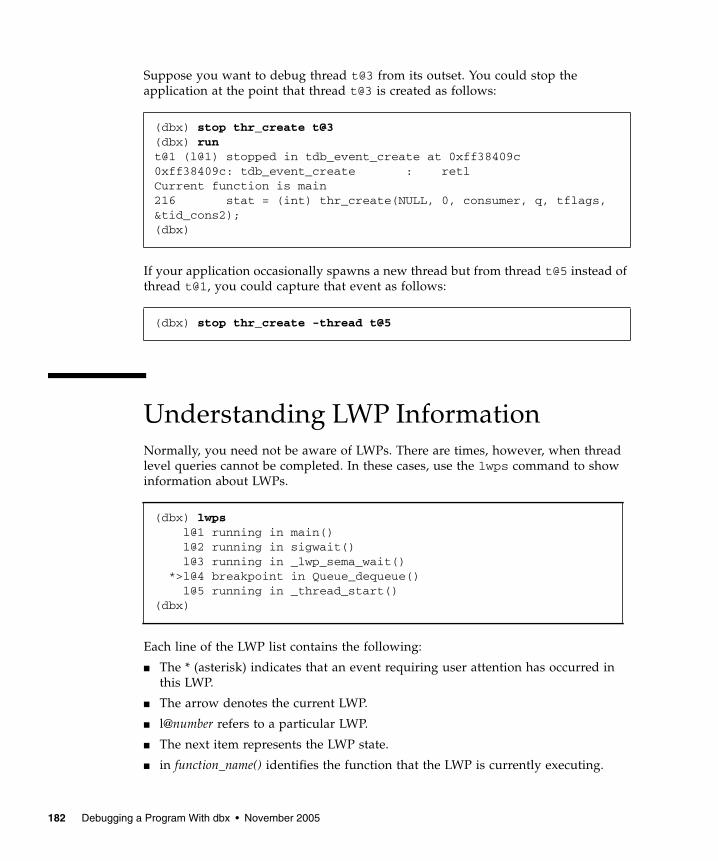
Suppose you want to debug thread t@3 from its outset. You could stop theapplication at the point that thread t@3 is created as follows:
If your application occasionally spawns a new thread but from thread t@5 instead ofthread t@1, you could capture that event as follows:
Understanding LWP InformationNormally, you need not be aware of LWPs. There are times, however, when threadlevel queries cannot be completed. In these cases, use the lwps command to showinformation about LWPs.
Each line of the LWP list contains the following:
■ The * (asterisk) indicates that an event requiring user attention has occurred inthis LWP.
■ The arrow denotes the current LWP.
■ l@number refers to a particular LWP.
■ The next item represents the LWP state.
■ in function_name() identifies the function that the LWP is currently executing.
(dbx) stop thr_create t@3(dbx) runt@1 (l@1) stopped in tdb_event_create at 0xff38409c0xff38409c: tdb_event_create : retlCurrent function is main216 stat = (int) thr_create(NULL, 0, consumer, q, tflags,&tid_cons2);(dbx)
(dbx) stop thr_create -thread t@5
(dbx) lwpsl@1 running in main()l@2 running in sigwait()l@3 running in _lwp_sema_wait()
*>l@4 breakpoint in Queue_dequeue()l@5 running in _thread_start()
(dbx)
182 Debugging a Program With dbx • November 2005

CHAPTER 12
Debugging Child Processes
This chapter describes how to debug a child process. dbx has several facilities tohelp you debug processes that create children using the fork (2) and exec (2)functions.
This chapter is organized into the following sections:
■ Attaching to Child Processes■ Following the exec Function■ Following the fork Function■ Interacting With Events
Attaching to Child ProcessesYou can attach to a running child process in one of the following ways.
■ When starting dbx:
■ From the dbx command line:
You can substitute program_name with the name - (minus sign), so that dbx finds theexecutable associated with the given process ID (process_id). After using a -, asubsequent run command or rerun command does not work because dbx does notknow the full path name of the executable.
$ dbx program_name process_id
(dbx) debug program_name process_id
183

You can also attach to a running child process using the Debugger window in theSun Studio IDE. (See “Attaching to a Process” in the dbx Debugger helpset in theIDE online help.)
Following the exec FunctionIf a child process executes a new program using the exec(2)function or one of itsvariations, the process id does not change, but the process image does. dbxautomatically takes note of a call to the exec() function and does an implicit reloadof the newly executed program.
The original name of the executable is saved in $oprog. To return to it, use debug$oprog.
Following the fork FunctionIf a child process calls the vfork(), fork(1), or fork(2) function, the process idchanges, but the process image stays the same. Depending on how the dbxenvironment variable follow_fork_mode is set, dbx does one of the following.
Parent In the traditional behavior, dbx ignores the fork and follows the parent.
Child dbx automatically switches to the forked child using the new process ID. Allconnection to and awareness of the original parent is lost.
Both This mode is available only when using dbx through the Sun Studio IDE.
Ask You are prompted to choose parent, child, both, or stop toinvestigate whenever dbx detects a fork. If you choose stop, you canexamine the state of the program, then type cont to continue; you will beprompted to select which way to proceed.
184 Debugging a Program With dbx • November 2005
Interacting With EventsAll breakpoints and other events are deleted for any exec() or fork() process.You can override the deletion for forked processes by setting the dbx environmentvariable follow_fork_inherit to on, or make the events permanent using the-perm eventspec modifier. For more information on using event specificationmodifiers, see Appendix B.
Chapter 12 Debugging Child Processes 185

186 Debugging a Program With dbx • November 2005

CHAPTER 13
Debugging OpenMP Programs
The OpenMP™ application programming interface (API) is a portable, parallelprogramming model for shared memory multiprocessor architectures, developed incollaboration with a number of computer vendors. Support for debugging Fortranand C OpenMP programs with dbx is based on the general multi-threadeddebugging features of dbx. All of the dbx commands that operate on threads andLWPs can be used for OpenMP debugging. dbx does not support asynchronousthread control in OpenMP debugging.
This chapter is organized in to the following sections:
■ How Compilers Transform OpenMP Code■ dbx Functionality Available for OpenMP Code■ Using Stack Traces With OpenMP Code■ Using the dump Command on OpenMP Code■ Execution Sequence of OpenMP Code
See the OpenMP API Users Guide for information on the directives, run-time libraryroutines, and environment variables comprising the OpenMP Version 2.0Application Program Interfaces, as implemented by the Sun Studio Fortran 95 and Ccompilers.
Note – OpenMP debugging is available only on platforms running the Solaris OS. Itis not available on Linux platforms.
187

How Compilers Transform OpenMPCodeTo better describe OpenMP debugging, it is helpful to understand how OpenMPcode is transformed by the compilers. Consider the following Fortran example:
The code in line 12 through line 18 is a parallel region. The f95 compiler convertsthis section of code to an outlined subroutine that will be called from the OpenMPruntime library. This outlined subroutine has an internally generated name, in thiscase _$d1A12.MAIN_. The f95 compiler then replaces the code for the parallelregion with a call to the OpenMP runtime library and passes the outlined subroutineas one of its arguments. The OpenMP runtime library handles all the thread-relatedissues and dispatches slave threads that execute the outlined subroutine in parallel.The C compiler works in the same way.
When debugging an OpenMP program, the outlined subroutine is treated by dbx asany other function, with the exception that you cannot explicitly set a breakpoint inthat function by using its internally generated name.
1 program example2 integer i, n3 parameter (n = 1000000)4 real sum, a(n)56 do i = 1, n7 a(i) = i*i8 end do910 sum = 01112 !$OMP PARALLEL DO DEFAULT(PRIVATE), SHARED(a, sum)1314 do i = 1, n15 sum = sum + a(i)16 end do1718 !$OMP END PARALLEL DO1920 print*, sum21 end program example
188 Debugging a Program With dbx • November 2005

dbx Functionality Available for OpenMPCodeIn addition to the usual functionality for debugging multithreaded programs, dbxallows you to do the following in an OpenMP program:
■ Single step into a parallel region. Because a parallel region is outlined and calledfrom the OpenMP runtime library, a single step of execution actually involvesseveral layers of runtime library calls that are executed by slave threads createdfor this purpose. When you single step into the parallel region, the first threadthat reaches the breakpoint causes the program to stop. This thread might be aslave thread rather than the master thread that initiated the stepping.
For example, refer to the Fortran code in“How Compilers Transform OpenMPCode” on page 188, and assume that master thread t@1 is at line 10. You singlestep into line 12, and slave threads t@2, t@3, and t@4 are created to execute theruntime library calls. Thread t@3 reaches the breakpoint first and causes theprogram execution to stop. So the single step that was initiated by threadt@1ends on thread [email protected] behavior is different from normal stepping in whichyou are usually on the same thread after the single step as before.
■ Print shared, private, and threadprivate variables. dbx can print all shared,private, and threadprivate variables. If you try to print a threadprivate variableoutside of a parallel region, the master thread’s copy is printed. The whatiscommand does not tell you whether a variable is shared, private, orthreadprivate.
Chapter 13 Debugging OpenMP Programs 189

Using Stack Traces With OpenMP CodeWhen execution is stopped in parallel region, a where command shows a stack tracethat contains the outlined subroutine as well as several runtime library calls. Usingthe Fortran example from “How Compilers Transform OpenMP Code” on page 188,and stopping execution at line 15, the where command produces the following stacktrace.
The top frame on the stack is the frame of the outlined function. Even though thecode is outlined, the source line number still maps back to 15. The other two framesare for runtime library routines.
When execution is stopped in a parallel region, a where command from a slavethread does not have a stack traceback to its parent thread, as shown in the aboveexample. A where command from the master thread, however, has a full traceback:
If the number of threads is not large, you might be able to determine how executionreached the breakpoint in a slave thread by using the threads command (see“threads Command” on page 388) to list all the threads, and then switch to eachthread to determine which one is the master thread.
[t@4 l@4]: wherecurrent thread: t@4=>[1] _$d1A12.MAIN_(), line 15 in "example.f90"[2] __mt_run_my_job_(0x45720, 0xff82ee48, 0x0, 0xff82ee58, 0x0,0x0), at 0x16860[3] __mt_SlaveFunction_(0x45720, 0x0, 0xff82ee48, 0x0, 0x455e0,0x1), at 0x1aaf0
[t@4 l@4]: thread t@1t@1 (l@1) stopped in _$d1A12.MAIN_ at line 15 in file "example.f90"15 sum = sum + a(i)[t@1 l@1]: wherecurrent thread: t@1=>[1] _$d1A12.MAIN_(), line 15 in "example.f90"[2] __mt_run_my_job_(0x41568, 0xff82ee48, 0x0, 0xff82ee58, 0x0,0x0), at 0x16860[3] __mt_MasterFunction_(0x1, 0x0, 0x6, 0x0, 0x0, 0x40d78), at0x16150[4] MAIN(), line 12 in "example.f90"
190 Debugging a Program With dbx • November 2005
Using the dump Command on OpenMPCodeWhen execution is stopped in a parallel region, a dump command may print morethan one copy of private variables. In the following example, the dump commandprints two copies of the variable i:
Two copies of variable i are printed because the outlined routine is implemented asa nested function of the hosting routine, and private variables are implemented aslocal variables of the outlined routine. Since a dump command prints all the variablesin scope, both the i in hosting routine and the i in the outlined routine aredisplayed.
Execution Sequence of OpenMP CodeWhen you are single stepping inside of a parallel region in an OpenMP program, theexecution sequence may not be the same as the source code sequence. Thisdifference in sequence occurs because the code in the parallel region is usuallytransformed and rearranged by the compiler. Single stepping in OpenMP code issimilar to single stepping in optimized code where the optimizer has usually movedcode around.
[t@1 l@1]: dumpi = 1sum = 0.0a = ARRAYi = 1000001
Chapter 13 Debugging OpenMP Programs 191

192 Debugging a Program With dbx • November 2005

CHAPTER 14
Working With Signals
This chapter describes how to use dbx to work with signals. dbx supports thecatch command, which instructs dbx to stop a program when dbx detects any ofthe signals appearing on the catch list.
The dbx commands cont, step, and next support the -sig signal_name option,which lets you resume execution of a program with the program behaving as if ithad received the signal specified in the cont -sig command.
This chapter is organized into the following sections.
■ Understanding Signal Events■ Catching Signals■ Sending a Signal to a Program■ Automatically Handling Signals
Understanding Signal EventsWhen a signal is to be delivered to a process that is being debugged, the signal isredirected to dbx by the kernel. When this happens, you usually receive a prompt.You then have two choices:
■ “Cancel” the signal when the program is resumed—the default behavior of thecont command—facilitating easy interruption and resumption with SIGINT(Control-C) as shown in FIGURE 14-1.
193

FIGURE 14-1 Intercepting and Cancelling the SIGINT Signal
■ “Forward” the signal to the process using:
signal can be either a signal name or a signal number.
In addition, if a certain signal is received frequently, you can arrange for dbx toforward the signal automatically because you do not want it displayed:
However, the signal is still forwarded to the process. A default set of signals isautomatically forwarded in this manner (see “ignore Command” on page 341).
cont -sig signal
ignore signal # “ignore”
kernel program
SIGINT
sig event
interception
SIGINT
Normal case
^C
^C
While debugging
kernel program
dbx
194 Debugging a Program With dbx • November 2005
Catching SignalsBy default, the catch list contains many of the more than 33 detectable signals. (Thenumbers depend upon the operating system and version.) You can change thedefault catch list by adding signals to or removing them from the default catch list.
Note – The list of signal names that dbx accepts includes all of those supported bythe versions of the Solaris operating environment that dbx supports. So dbx mightaccept a signal that is not supported by the version of the Solaris operatingenvironment you are running. For example, dbx might accept a signal that issupported by the Solaris 9 OS even through you are running the Solaris 7 OSt. For alist of the signals supported by the Solaris OS you are running, see thesignal(3head) man page.
To see the list of signals currently being trapped, type catch with no signalargument.
To see a list of the signals currently being ignored by dbx when the program detectsthem, type ignore with no signal argument.
Changing the Default Signal ListsYou control which signals cause the program to stop by moving the signal namesfrom one list to the other. To move signal names, supply a signal name that currentlyappears on one list as an argument to the other list.
For example, to move the QUIT and ABRT signals from the catch list to the ignorelist:
(dbx) catch
(dbx) ignore
(dbx) ignore QUIT ABRT
Chapter 14 Working With Signals 195

Trapping the FPE Signal (Solaris Platforms Only)Often programmers working with code that requires floating point calculations wantto debug exceptions generated in a program. When a floating point exception likeoverflow or divide by zero occurs, the system returns a reasonable answer as theresult for the operation that caused the exception. Returning a reasonable answerlets the program continue executing quietly. The Solaris OS implements the IEEEStandard for Binary Floating Point Arithmetic definitions of reasonable answers forexceptions.
Because a reasonable answer for floating point exceptions is returned, exceptions donot automatically trigger the signal SIGFPE. Some integer exceptions, such asdividing an integer by zero and integer overflow do, by default, trigger the signalSIGFPE.
To find the cause of an exception, you need to set up a trap handler in the programso that the exception triggers the signal SIGFPE. (See ieee_handler(3m) man pagefor an example of a trap handler.)
You can enable a trap using:
■ ieee_handler■ fpsetmask (see the fpsetmask(3c) man page)■ -ftrap compiler flag (for Fortran 95, see the f95(1) man page)
When you set up a trap handler using the ieee_handler command, the trap enablemask in the hardware floating point status register is set. This trap enable maskcauses the exception to raise the SIGFPE signal at run time.
Once you have compiled the program with the trap handler, load the program intodbx. Before you can catch the SIGFPE signal, you must add FPE to the dbx signalcatch list.
By default, FPE is on the ignore list.
Determining Where the Exception Occurred
After adding FPE to the catch list, run the program in dbx. When the exception youare trapping occurs, the SIGFPE signal is raised and dbx stops the program. Thenyou can trace the call stack using the dbx where command to help find the specificline number of the program where the exception occurs (see “where Command” onpage 403).
(dbx) catch FPE
196 Debugging a Program With dbx • November 2005

Determining the Cause of the Exception
To determine the cause of the exception, use the regs -f command to display thefloating point state register (FSR). Look at the accrued exception (aexc) and currentexception (cexc) fields of the register, which contain bits for the followingfloating-point exception conditions:
■ Invalid operand■ Overflow■ Underflow■ Division by zero■ Inexact result
For more information on the floating-point state register, see Version 8 (for V8) orVersion 9 (for V9) of The SPARC Architecture Manual. For more discussion andexamples, see the Numerical Computation Guide.
Sending a Signal to a ProgramThe dbx cont command supports the -sig signal option, which lets you resumeexecution of a program with the program behaving as if it had received the systemsignal signal.
For example, if a program has an interrupt handler for SIGINT (^C), you can type^C to stop the application and return control to dbx. If you issue a cont commandby itself to continue program execution, the interrupt handler never executes. Toexecute the interrupt handler, send the signal, SIGINT, to the program:
The step, next, and detach commands accept -sig as well.
(dbx) cont -sig int
Chapter 14 Working With Signals 197

Automatically Handling SignalsThe event management commands can also deal with signals as events. These twocommands have the same effect.
Having the signal event is more useful if you need to associate some pre-programmed action.
In this case, make sure to first move SIGCLD to the ignore list.
(dbx) stop sig signal(dbx) catch signal
(dbx) when sig SIGCLD {echo Got $sig $signame;}
(dbx) ignore SIGCLD
198 Debugging a Program With dbx • November 2005

CHAPTER 15
Debugging C++ With dbx
This chapter describes how dbx handles C++ exceptions and debugging C++templates, including a summary of commands used when completing these tasksand examples with code samples.
This chapter is organized into the following sections:
■ Using dbx With C++■ Exception Handling in dbx■ Debugging With C++ Templates
For information on compiling C++ programs, see “Compiling a Program forDebugging” on page 57.
Using dbx With C++Although this chapter concentrates on two specific aspects of debugging C++, dbxallows you full functionality when debugging your C++ programs. You can:
■ Find out about class and type definitions (see “Looking Up Definitions of Typesand Classes” on page 87)
■ Print or display inherited data members (see “Printing C++” on page 124)
■ Find out dynamic information about an object pointer (see “Printing C++” onpage 124)
■ Debug virtual functions (see “Calling a Function” on page 98)
■ Using runtime type information (see “Printing the Value of a Variable, Expression,or Identifier” on page 124)
■ Set breakpoints on all member functions of a class (see “Setting Breakpoints inMember Functions of the Same Class” on page 105)
199

■ Set breakpoints on all overloaded member functions (see “Setting Breakpoints inMember Functions of Different Classes” on page 104)
■ Set breakpoints on all overloaded nonmember functions (see “Setting MultipleBreakpoints in Nonmember Functions” on page 105)
■ Set breakpoints on all member functions of a particular object (see “SettingBreakpoints in Objects” on page 106)
■ Deal with overloaded functions or data members (see “Setting a stop Breakpointin a Function” on page 103)
Exception Handling in dbxA program stops running if an exception occurs. Exceptions signal programminganomalies, such as division by zero or array overflow. You can set up blocks to catchexceptions raised by expressions elsewhere in the code.
While debugging a program, dbx enables you to:
■ Catch unhandled exceptions before stack unwinding
■ Catch unexpected exceptions
■ Catch specific exceptions whether handled or not before stack unwinding
■ Determine where a specific exception would be caught if it occurred at aparticular point in the program
If you give a step command after stopping at a point where an exception is thrown,control is returned at the start of the first destructor executed during stackunwinding. If you step out of a destructor executed during stack unwinding,control is returned at the start of the next destructor. When all destructors have beenexecuted, a step command brings you to the catch block handling the throwing ofthe exception.
Commands for Handling Exceptions
exception [-d | +d] Command
Use the exception command to display an exception’s type at any time duringdebugging. If you use the exception command without an option, the type shownis determined by the setting of the dbx environment variableoutput_dynamic_type:
200 Debugging a Program With dbx • November 2005

■ If it is set to on, the derived type is shown.■ If it is set to off (the default), the static type is shown.
Specifying the -d or +d option overrides the setting of the environment variable:
■ If you specify -d, the derived type is shown.■ If you specify +d, the static type is shown.
For more information, see “exception Command” on page 334.
intercept [-all] [-x] [-set] [typename] Command
You can intercept, or catch, exceptions of a specific type before the stack has beenunwound. Use the intercept command with no arguments to list the types thatare being intercepted. Use -all to intercept all exceptions. Use typename to add atype to the intercept list. Use -x to exclude a particular type to the excluded list tokeep it from being intercepted. Use -set to clear both the intercept list and theexcluded list, and set the lists to intercept or exclude only throws of the specifiedtypes
For example, to intercept all types except int, you could type:
To intercept exceptions of type Error, you would type:
After intercepting too many CommonError exceptions, you could exclude theseexceptions by typing:
Typing the intercept command with no arguments would then show that theintercept list includes unhandled exceptions and unexpected exceptions, which areintercepted by default, plus exceptions of class Error except for those of classCommonError.
(dbx) intercept -all -x int
(dbx) intercept Error
(dbx) intercept -x CommonError
(dbx) intercept-unhandled -unexpected class Error -x class CommonError
Chapter 15 Debugging C++ With dbx 201

If you then realize that Error is not the class of exceptions that interests you, but you donot know the name of the exception class you are looking for, you could try interceptingall exceptions except those of class Error by typing
For more information, see “intercept Command” on page 342.
unintercept [-all] [-x] [typename] Command
Use the unintercept command to remove exception types from the intercept list orthe excluded list. Use the command with no arguments to list the types that arebeing intercepted (same as the intercept command). Use -all to remove all typesfrom the intercept list. Use typename to remove a type from the intercept list. Use -xto remove a type from the excluded list.
For more information, see “unintercept Command” on page 396.
whocatches typename Command
The whocatches command reports where an exception of typename would becaught if thrown at the current point of execution. Use this command to find outwhat would happen if an exception were thrown from the top frame of the stack.
The line number, function name, and frame number of the catch clause that wouldcatch typename are displayed. The command returns “type is unhandled” if thecatch point is in the same function that is doing the throw.
For more information, see “whocatches Command” on page 405.
Examples of Exception HandlingThis example demonstrates how exception handling is done in dbx using a sampleprogram containing exceptions. An exception of type int is thrown in the functionbar and is caught in the following catch block.
(dbx) intercept -all -x Error
1 #include <stdio.h>
2
3 class c {
4 int x;
5 public:
202 Debugging a Program With dbx • November 2005

The following transcript from the example program shows the exception handlingfeatures in dbx.
6 c(int i) { x = i; }
7 ~c() {
8 printf("destructor for c(%d)\n", x);
9 }
10 };
11
12 void bar() {
13 c c1(3);
14 throw(99);
15 }
16
17 int main() {
18 try {
19 c c2(5);
20 bar();
21 return 0;
22 }
23 catch (int i) {
24 printf("caught exception %d\n", i);
25 }
26 }
(dbx) intercept
-unhandled -unexpected
(dbx) intercept int
<dbx> intercept
-unhandled -unexpected int
(dbx) stop in bar
(2) stop in bar()
(dbx)run
Running: a.out
(process id 304)
Stopped in bar at line 13 in file “foo.cc”
13 c c1(3);
(dbx) whocatches int
int is caught at line 24, in function main (frame number 2)
(dbx) whocatches c
dbx: no runtime type info for class c (never thrown or caught)
(dbx) cont
Exception of type int is caught at line 24, in function main (framenumber 4)
stopped in _exdbg_notify_of_throw at 0xef731494
Chapter 15 Debugging C++ With dbx 203

Debugging With C++ Templatesdbx supports C++ templates. You can load programs containing class and functiontemplates into dbx and invoke any of the dbx commands on a template that youwould use on a class or function, such as:
■ Setting breakpoints at class or function template instantiations (see “stopinclass classname Command” on page 209, “stop infunction nameCommand” on page 210, and “stop in function Command” on page 210)
■ Printing a list of all class and function template instantiations (see “whereisname Command” on page 207)
■ Displaying the definitions of templates and instances (see “whatis nameCommand” on page 208)
■ Calling member template functions and function template instantiations (see“call function_name (parameters) Command” on page 210)
0xef731494: _exdbg_notify_of_throw : jmp %o7 + 0x8
Current function is bar
14 throw(99);
(dbx) step
stopped in c::~c at line 8 in file "foo.cc"
8 printf("destructor for c(%d)\n", x);
(dbx) step
destructor for c(3)
stopped in c::~c at line 9 in file "foo.cc"
9 }
(dbx) step
stopped in c::~c at line 8 in file "foo.cc"
8 printf("destructor for c(%d)\n", x);
(dbx) step
destructor for c(5)
stopped in c::~c at line 9 in file "foo.cc"
9 )
(dbx) step
stopped in main at line 24 in file "foo.cc"
24 printf("caught exception %d\n", i);
(dbx) step
caught exception 99
stopped in main at line 26 in file "foo.cc"
26 }
204 Debugging a Program With dbx • November 2005

■ Printing values of function template instantiations (“print Expressions” onpage 211)
■ Displaying the source code for function template instantiations (see “listExpressions” on page 211)
Template ExampleThe following code example shows the class template Array and its instantiationsand the function template square and its instantiations.
1 template<class C> void square(C num, C *result)
2 {
3 *result = num * num;
4 }
5
6 template<class T> class Array
7 {
8 public:
9 int getlength(void)
10 {
11 return length;
12 }
13
14 T & operator[](int i)
15 {
16 return array[i];
17 }
18
19 Array(int l)
20 {
21 length = l;
22 array = new T[length];
23 }
24
25 ~Array(void)
26 {
27 delete [] array;
28 }
29
30 private:
31 int length;
32 T *array;
33 };
Chapter 15 Debugging C++ With dbx 205

34
35 int main(void)
36 {
37 int i, j = 3;
38 square(j, &i);
39
40 double d, e = 4.1;
41 square(e, &d);
42
43 Array<int> iarray(5);
44 for (i = 0; i < iarray.getlength(); ++i)
45 {
46 iarray[i] = i;
47 }
48
49 Array<double> darray(5);
50 for (i = 0; i < darray.getlength(); ++i)
51 {
52 darray[i] = i * 2.1;
53 }
54
55 return 0;
56 }
206 Debugging a Program With dbx • November 2005
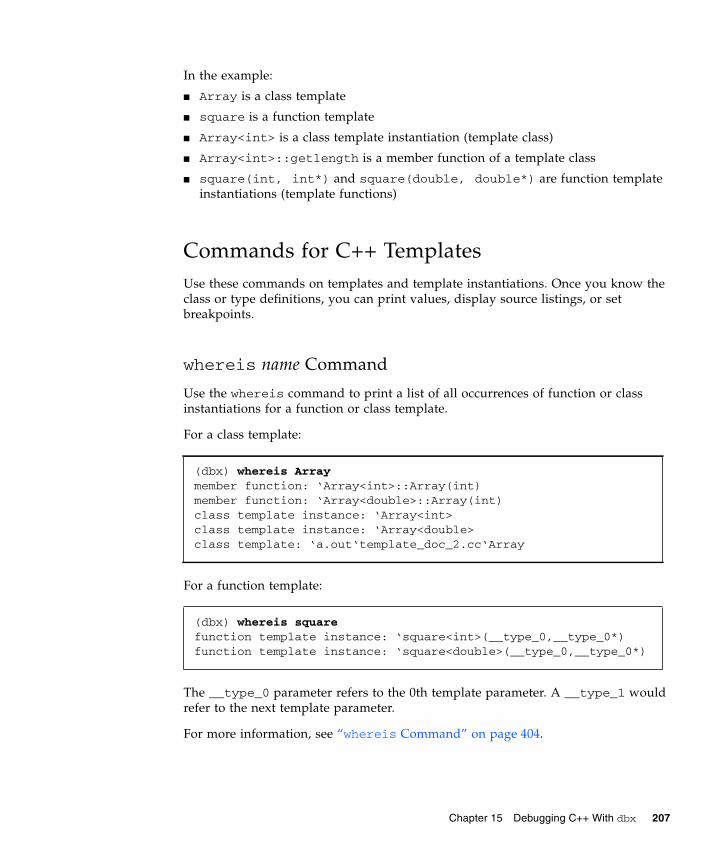
In the example:
■ Array is a class template
■ square is a function template
■ Array<int> is a class template instantiation (template class)
■ Array<int>::getlength is a member function of a template class
■ square(int, int*) and square(double, double*) are function templateinstantiations (template functions)
Commands for C++ TemplatesUse these commands on templates and template instantiations. Once you know theclass or type definitions, you can print values, display source listings, or setbreakpoints.
whereis name Command
Use the whereis command to print a list of all occurrences of function or classinstantiations for a function or class template.
For a class template:
For a function template:
The __type_0 parameter refers to the 0th template parameter. A __type_1 wouldrefer to the next template parameter.
For more information, see “whereis Command” on page 404.
(dbx) whereis Arraymember function: ‘Array<int>::Array(int)member function: ‘Array<double>::Array(int)class template instance: ‘Array<int>class template instance: ‘Array<double>class template: ‘a.out‘template_doc_2.cc‘Array
(dbx) whereis squarefunction template instance: ‘square<int>(__type_0,__type_0*)function template instance: ‘square<double>(__type_0,__type_0*)
Chapter 15 Debugging C++ With dbx 207

whatis name Command
Use the whatis command to print the definitions of function and class templatesand instantiated functions and classes.
For a class template:
For the class template’s constructors:
For a function template:
(dbx) whatis -t Arraytemplate<class T> class ArrayTo get the full template declaration, try ‘whatis -t Array<int>’;
(dbx) whatis ArrayMore than one identifier ’Array’.Select one of the following:0) Cancel1) Array<int>::Array(int)2) Array<double>::Array(int>> 1Array<int>::Array(int 1);
(dbx) whatis squareMore than one identifier ’square’.Select one of the following: 0) Cancel 1) square<int(__type_0,__type_0*) 2) square<double>(__type_0,__type_0*)> 2void square<double>(double num, double *result);
208 Debugging a Program With dbx • November 2005

For a class template instantiation:
For a function template instantiation:
For more information, see “whatis Command” on page 399.
stop inclass classname Command
To stop in all member functions of a template class:
Use the stop inclass command to set breakpoints at all member functions of aparticular template class:
For more information, see “stop Command” on page 378 and “inclass classname[-recurse | -norecurse]” on page 283.
(dbx) whatis -t Array<double>class Array<double>; {public: int Array<double>::getlength() double &Array<double>::operator [](int i); Array<double>::Array<double>(int l); Array<double>::~Array<double>();private: int length; double *array;};
(dbx) whatis square(int, int*)void square(int num, int *result);
(dbx)stop inclass Array(2) stop inclass Array
(dbx) stop inclass Array<int>(2) stop inclass Array<int>
Chapter 15 Debugging C++ With dbx 209

stop infunction name Command
Use the stop infunction command to set breakpoints at all instances of thespecified function template:
For more information, see “stop Command” on page 378 and “infunctionfunction” on page 283.
stop in function Command
Use the stop in command to set a breakpoint at a member function of a templateclass or at a template function.
For a member of a class template instantiation:
For a function instantiation:
For more information, “stop Command” on page 378 and “in function” onpage 282.
call function_name (parameters) Command
Use the call command to explicitly call a function instantiation or a memberfunction of a class template when you are stopped in scope. If dbx is unable todetermine the correct instance, it displays a numbered list of instances from whichyou can choose.
For more information, see “call Command” on page 306.
(dbx) stop infunction square(9) stop infunction square
(dbx) stop in Array<int>::Array(int l)(2) stop in Array<int>::Array(int)
(dbx) stop in square(double, double*)(6) stop in square(double, double*)
(dbx) call square(j,&i)
210 Debugging a Program With dbx • November 2005
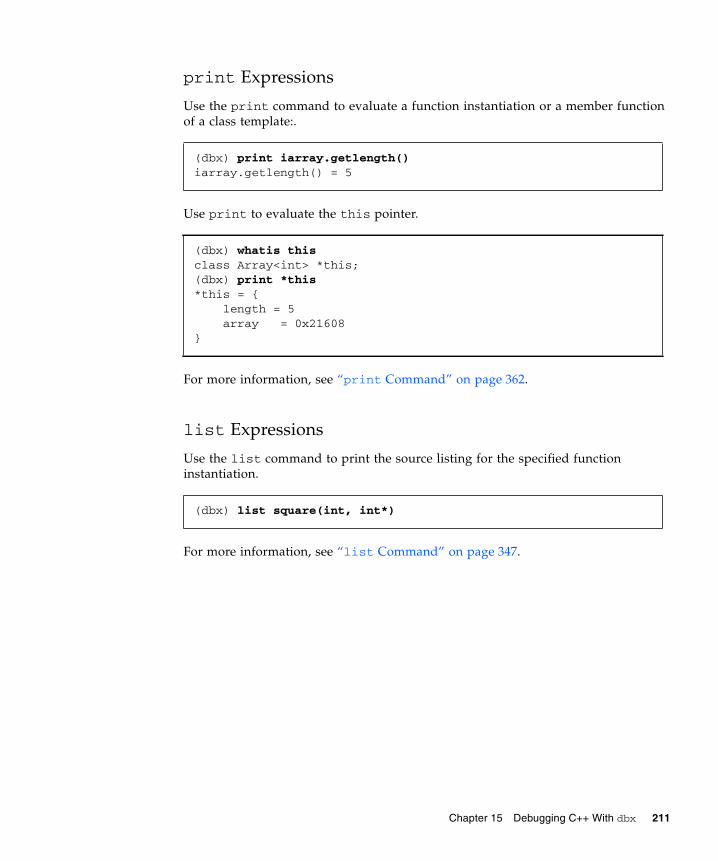
print Expressions
Use the print command to evaluate a function instantiation or a member functionof a class template:.
Use print to evaluate the this pointer.
For more information, see “print Command” on page 362.
list Expressions
Use the list command to print the source listing for the specified functioninstantiation.
For more information, see “list Command” on page 347.
(dbx) print iarray.getlength()iarray.getlength() = 5
(dbx) whatis thisclass Array<int> *this;(dbx) print *this*this = { length = 5 array = 0x21608}
(dbx) list square(int, int*)
Chapter 15 Debugging C++ With dbx 211

212 Debugging a Program With dbx • November 2005

CHAPTER 16
Debugging Fortran Using dbx
This chapter introduces dbx features you might use with Fortran. Sample requests todbx are also included to provide you with assistance when debugging Fortran codeusing dbx.
This chapter includes the following topics:
■ Debugging Fortran■ Debugging Segmentation Faults■ Locating Exceptions■ Tracing Calls■ Working With Arrays■ Showing Intrinsic Functions■ Showing Complex Expressions■ Showing Logical Operators■ Viewing Fortran 95 Derived Types■ Pointer to Fortran 95 Derived Type
Debugging FortranThe following tips and general concepts are provided to help you while debuggingFortran programs. For information on debugging Fortran OpenMP code with dbx,see Chapter 13.
Current Procedure and FileDuring a debug session, dbx defines a procedure and a source file as current.Requests to set breakpoints and to print or set variables are interpreted relative tothe current function and file. Thus, stop at 5 sets different breakpoints, dependingon which file is current.
213

Uppercase LettersIf your program has uppercase letters in any identifiers, dbx recognizes them. Youneed not provide case-sensitive or case-insensitive commands, as in some earlierversions.
Fortran 95 and dbx must be in the same case-sensitive or case-insensitive mode:
■ Compile and debug in case-insensitive mode without the -U option. The defaultvalue of the dbx input_case_sensitive environment variable is then false.
If the source has a variable named LAST, then in dbx, both the print LAST orprint last commands work. Fortran 95 and dbx consider LAST and last to bethe same, as requested.
■ Compile and debug in case-sensitive mode using -U. The default value of the dbxinput_case_sensitive environment variable is then true.
If the source has a variable named LAST and one named last, then in dbx,print last works, but print LAST does not work. Fortran 95 and dbxdistinguish between LAST and last, as requested.
Note – File or directory names are always case-sensitive in dbx, even if you have setthe dbx input_case_sensitive environment variable to false.
Sample dbx SessionThe following examples use a sample program called my_program.
Main program for debugging, a1.f:
PARAMETER ( n=2 )REAL twobytwo(2,2) / 4 *-1 /CALL mkidentity( twobytwo, n )PRINT *, determinant( twobytwo )END
214 Debugging a Program With dbx • November 2005

Subroutine for debugging, a2.f:
Function for debugging, a3.f:
1. Compile and link with the -g option.
You can do this in one or two steps.
Compile and link in one step, with -g:
Or, compile and link in separate steps:
2. Start dbx on the executable named my_program.
SUBROUTINE mkidentity ( array, m )REAL array(m,m)DO 90 i = 1, m
DO 20 j = 1, m IF ( i .EQ. j ) THEN
array(i,j) = 1. ELSE
array(i,j) = 0. END IF
20 CONTINUE90 CONTINUE
RETURNEND
REAL FUNCTION determinant ( a )REAL a(2,2)determinant = a(1,1) * a(2,2) - a(1,2) / a(2,1)RETURNEND
demo% f95 -o my_program -g a1.f a2.f a3.f
demo% f95 -c -g a1.f a2.f a3.f demo% f95 -o my_program a1.o a2.o a3.o
demo% dbx my_program Reading symbolic information…
Chapter 16 Debugging Fortran Using dbx 215

3. Set a simple breakpoint by typing stop in subnam, where subnam names asubroutine, function, or block data subprogram.
To stop at the first executable statement in a main program.
Although MAIN must be all uppercase, subnam can be uppercase or lowercase.
4. Type the run command, which runs the program in the executable files namedwhen you started dbx.
When the breakpoint is reached, dbx displays a message showing where itstopped—in this case, at line 3 of the a1.f file.
5. To print a value, type the print command.
Print value of n:
Print the matrix twobytwo; the format might vary:
Print the matrix array:
The print fails because array is not defined here—only in mkidentity.
(dbx) stop in MAIN (2) stop in MAIN
(dbx) run Running: my_program stopped in MAIN at line 3 in file "a1.f"
3 call mkidentity( twobytwo, n )
(dbx) print n n = 2
(dbx) print twobytwo twobytwo = (1,1) -1.0 (2,1) -1.0 (1,2) -1.0 (2,2) -1.0
(dbx) print arraydbx: "array" is not defined in the current scope(dbx)
216 Debugging a Program With dbx • November 2005
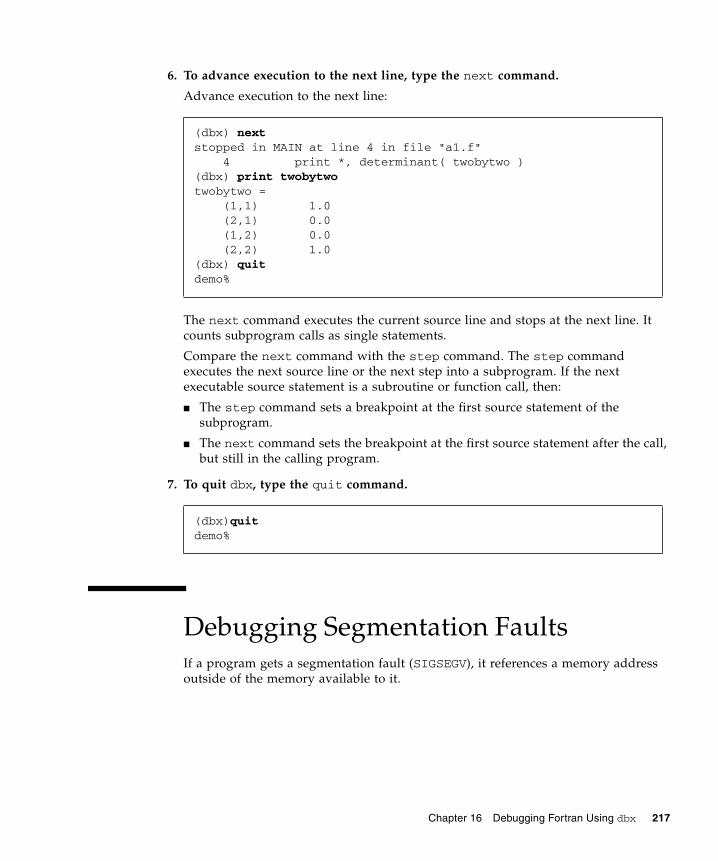
6. To advance execution to the next line, type the next command.
Advance execution to the next line:
The next command executes the current source line and stops at the next line. Itcounts subprogram calls as single statements.
Compare the next command with the step command. The step commandexecutes the next source line or the next step into a subprogram. If the nextexecutable source statement is a subroutine or function call, then:
■ The step command sets a breakpoint at the first source statement of thesubprogram.
■ The next command sets the breakpoint at the first source statement after the call,but still in the calling program.
7. To quit dbx, type the quit command.
Debugging Segmentation FaultsIf a program gets a segmentation fault (SIGSEGV), it references a memory addressoutside of the memory available to it.
(dbx) nextstopped in MAIN at line 4 in file "a1.f" 4 print *, determinant( twobytwo )(dbx) print twobytwotwobytwo = (1,1) 1.0 (2,1) 0.0 (1,2) 0.0 (2,2) 1.0(dbx) quitdemo%
(dbx)quitdemo%
Chapter 16 Debugging Fortran Using dbx 217
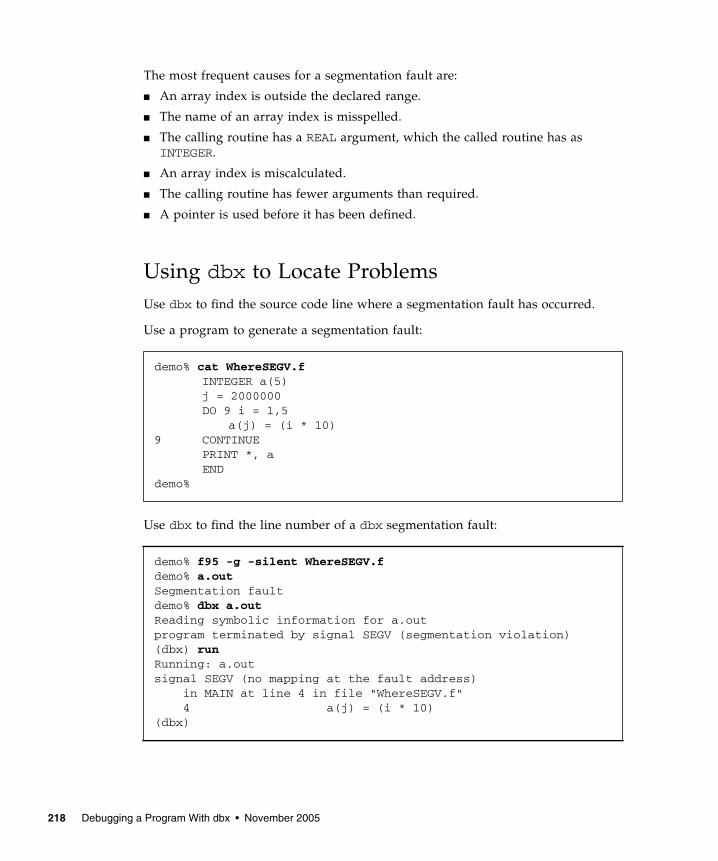
The most frequent causes for a segmentation fault are:
■ An array index is outside the declared range.
■ The name of an array index is misspelled.
■ The calling routine has a REAL argument, which the called routine has asINTEGER.
■ An array index is miscalculated.
■ The calling routine has fewer arguments than required.
■ A pointer is used before it has been defined.
Using dbx to Locate ProblemsUse dbx to find the source code line where a segmentation fault has occurred.
Use a program to generate a segmentation fault:
Use dbx to find the line number of a dbx segmentation fault:
demo% cat WhereSEGV.fINTEGER a(5)j = 2000000DO 9 i = 1,5
a(j) = (i * 10)9 CONTINUE
PRINT *, aEND
demo%
demo% f95 -g -silent WhereSEGV.fdemo% a.outSegmentation faultdemo% dbx a.outReading symbolic information for a.outprogram terminated by signal SEGV (segmentation violation)(dbx) runRunning: a.outsignal SEGV (no mapping at the fault address)
in MAIN at line 4 in file "WhereSEGV.f" 4 a(j) = (i * 10)(dbx)
218 Debugging a Program With dbx • November 2005

Locating ExceptionsIf a program gets an exception, there are many possible causes. One approach tolocating the problem is to find the line number in the source program where theexception occurred, and then look for clues there.
Compiling with -ftrap=common forces trapping on all common exceptions.
To find where an exception occurred:
demo% cat wh.f call joe(r, s) print *, r/s end subroutine joe(r,s) r = 12. s = 0. return enddemo% f95 -g -o wh -ftrap=common wh.fdemo% dbx whReading symbolic information for wh(dbx) catch FPE(dbx) runRunning: wh(process id 17970)signal FPE (floating point divide by zero) in MAIN at line 2 infile “wh.f” 2 print *, r/s(dbx)
Chapter 16 Debugging Fortran Using dbx 219

Tracing CallsSometimes a program stops with a core dump, and you need to know the sequenceof calls that led it there. This sequence is called a stack trace.
The where command shows where in the program flow execution stopped and howexecution reached this point—a stack trace of the called routines.
ShowTrace.f is a program contrived to get a core dump a few levels deep in thecall sequence—to show a stack trace.
Show the sequence of calls, starting at where the execution stopped:
Note the reverse order:demo% f77 -silent -g ShowTrace.fdemo% a.outMAIN called calc, calc called calcb.*** TERMINATING a.out*** Received signal 11 (SIGSEGV)Segmentation Fault (core dumped)quil 174% dbx a.outExecution stopped, line 23Reading symbolic information for a.out...(dbx) runcalcB called from calc, line 9Running: a.out(process id 1089)calc called from MAIN, line 3signal SEGV (no mapping at the fault address) in calcb atline 23 in file "ShowTrace.f" 23 v(j) = (i * 10)(dbx) where -V=>[1] calcb(v = ARRAY , m = 2), line 23 in "ShowTrace.f"[2] calc(a = ARRAY , m = 2, d = 0), line 9 in "ShowTrace.f"
[3] MAIN(), line 3 in "ShowTrace.f"(dbx)
220 Debugging a Program With dbx • November 2005
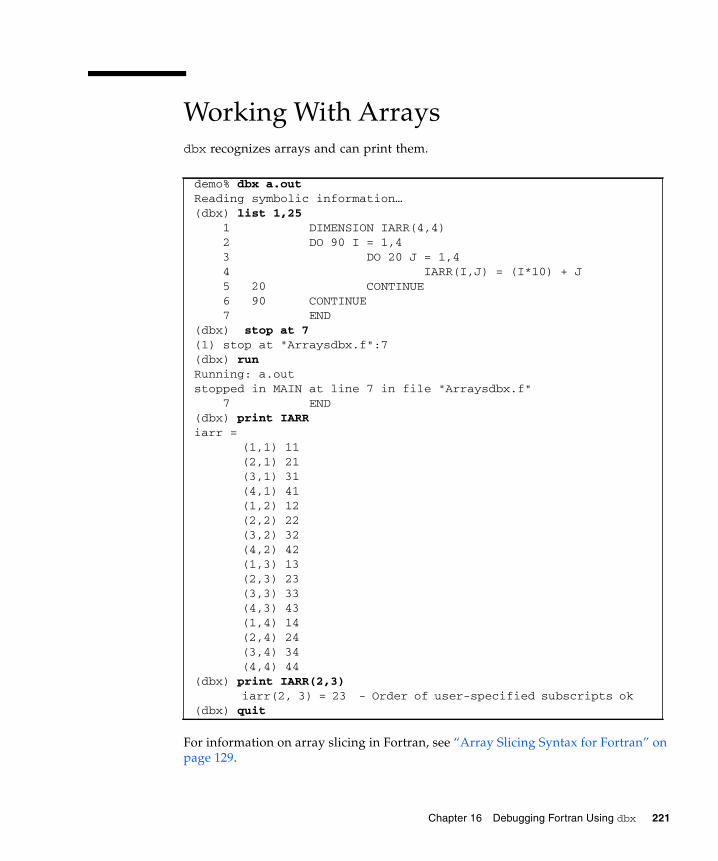
Working With Arraysdbx recognizes arrays and can print them.
For information on array slicing in Fortran, see “Array Slicing Syntax for Fortran” onpage 129.
demo% dbx a.outReading symbolic information…(dbx) list 1,25 1 DIMENSION IARR(4,4) 2 DO 90 I = 1,4 3 DO 20 J = 1,4 4 IARR(I,J) = (I*10) + J 5 20 CONTINUE 6 90 CONTINUE 7 END(dbx) stop at 7(1) stop at "Arraysdbx.f":7(dbx) runRunning: a.outstopped in MAIN at line 7 in file "Arraysdbx.f" 7 END(dbx) print IARRiarr =
(1,1) 11(2,1) 21(3,1) 31(4,1) 41(1,2) 12(2,2) 22(3,2) 32(4,2) 42(1,3) 13(2,3) 23(3,3) 33(4,3) 43(1,4) 14(2,4) 24(3,4) 34(4,4) 44
(dbx) print IARR(2,3)iarr(2, 3) = 23 - Order of user-specified subscripts ok
(dbx) quit
Chapter 16 Debugging Fortran Using dbx 221

Fortran 95 Allocatable ArraysThe following example shows how to work with allocated arrays in dbx.
demo% f95 -g Alloc.f95 demo% dbx a.out (dbx) list 1,99 1 PROGRAM TestAllocate 2 INTEGER n, status 3 INTEGER, ALLOCATABLE :: buffer(:) 4 PRINT *, 'Size?' 5 READ *, n 6 ALLOCATE( buffer(n), STAT=status )
7 IF ( status /= 0 ) STOP 'cannot allocate buffer' 8 buffer(n) = n 9 PRINT *, buffer(n) 10 DEALLOCATE( buffer, STAT=status) 11 END(dbx) stop at 6 (2) stop at "alloc.f95":6 (dbx) stop at 9 (3) stop at "alloc.f95":9 (dbx) run Running: a.out (process id 10749) Size? 1000Unknown size at line 6 stopped in main at line 6 in file "alloc.f95" 6 ALLOCATE( buffer(n), STAT=status ) (dbx) whatis buffer integer*4 , allocatable::buffer(:) (dbx) next continuing stopped in main at line 7 in file "alloc.f95"
7 IF ( status /= 0 ) STOP 'cannot allocate buffer' (dbx) whatis buffer integer*4 buffer(1:1000)Known size at line 9 (dbx) cont stopped in main at line 9 in file "alloc.f95" 9 PRINT *, buffer(n) (dbx) print nbuffer(1000) holds 1000 n = 1000 (dbx) print buffer(n) buffer(n) = 1000
222 Debugging a Program With dbx • November 2005

Showing Intrinsic Functionsdbx recognizes Fortran intrinsic functions (SPARC™ platforms and x86 platformsonly).
To show an intrinsic function in dbx, type:
demo% cat ShowIntrinsic.f INTEGER i i = -2 END(dbx) stop in MAIN(2) stop in MAIN(dbx) runRunning: shi(process id 18019)stopped in MAIN at line 2 in file "shi.f" 2 i = -2(dbx) whatis absGeneric intrinsic function: "abs"(dbx) print ii = 0(dbx) stepstopped in MAIN at line 3 in file "shi.f" 3 end(dbx) print ii = -2(dbx) print abs(1)abs(i) = 2(dbx)
Chapter 16 Debugging Fortran Using dbx 223

Showing Complex Expressionsdbx also recognizes Fortran complex expressions.
To show a complex expression in dbx, type:
demo% cat ShowComplex.f COMPLEX z z = ( 2.0, 3.0 ) ENDdemo% f95 -g ShowComplex.fdemo% dbx a.out(dbx) stop in MAIN(dbx) runRunning: a.out(process id 10953)stopped in MAIN at line 2 in file "ShowComplex.f" 2 z = ( 2.0, 3.0 )(dbx) whatis zcomplex*8 z(dbx) print zz = (0.0,0.0)(dbx) nextstopped in MAIN at line 3 in file "ShowComplex.f" 3 END(dbx) print zz = (2.0,3.0)(dbx) print z+(1.0,1.0)z+(1,1) = (3.0,4.0)(dbx) quitdemo%
224 Debugging a Program With dbx • November 2005

Showing Interval ExpressionsTo show an interval expression in dbx, type:
Note – Interval expressions are supported only for programs compiled to run onSPARC based platforms, with -xarch={sse|sse2} to run on Solaris x86 SSE/SSE2Pentium 4-compatible platforms, or with -xarch=amd64 to run on x64 platforms.
Showing Logical Operatorsdbx can locate Fortran logical operators and print them.
demo% cat ShowInterval.f95 INTERVAL v v = [ 37.1, 38.6 ] ENDdemo% f95 -g -xia ShowInterval.f95demo% dbx a.out(dbx) stop in MAIN(2) stop in MAIN(dbx) runRunning: a.out(process id 5217)stopped in MAIN at line 2 in file "ShowInterval.f95" 2 v = [ 37.1, 38.6 ](dbx) whatis vINTERVAL*16 v(dbx) print vv = [0.0,0.0](dbx) nextstopped in MAIN at line 3 in file "ShowInterval.f95" 3 END(dbx) print vv = [37.1,38.6](dbx) print v+[0.99,1.01]v+[0.99,1.01] = [38.09,39.61](dbx) quitdemo%
Chapter 16 Debugging Fortran Using dbx 225

To show logical operators in dbx, type:
demo% cat ShowLogical.f LOGICAL a, b, y, z a = .true. b = .false. y = .true. z = .false. ENDdemo% f95 -g ShowLogical.fdemo% dbx a.out(dbx) list 1,9 1 LOGICAL a, b, y, z 2 a = .true. 3 b = .false. 4 y = .true. 5 z = .false. 6 END(dbx) stop at 5(2) stop at "ShowLogical.f":5(dbx) runRunning: a.out(process id 15394)stopped in MAIN at line 5 in file "ShowLogical.f" 5 z = .false.(dbx) whatis ylogical*4 y(dbx) print a .or. ya.OR.y = true(dbx) assign z = a .or. y(dbx) print zz = true(dbx) quitdemo%
226 Debugging a Program With dbx • November 2005

Viewing Fortran 95 Derived TypesYou can show structures—Fortran 95 derived types—with dbx.
demo% f95 -g DebStruc.f95demo% dbx a.out(dbx) list 1,99
1 PROGRAM Struct ! Debug a Structure2 TYPE product3 INTEGER id4 CHARACTER*16 name5 CHARACTER*8 model6 REAL cost7 REAL price8 END TYPE product9
10 TYPE(product) :: prod11112 prod1%id = 8213 prod1%name = "Coffee Cup"14 prod1%model = "XL"15 prod1%cost = 24.016 prod1%price = 104.017 WRITE ( *, * ) prod1%name18 END
(dbx) stop at 17(2) stop at "Struct.f95":17(dbx) runRunning: a.out(process id 12326)stopped in main at line 17 in file "Struct.f95"
17 WRITE ( *, * ) prod1%name(dbx) whatis prod1product prod1(dbx) whatis -t producttype product
integer*4 idcharacter*16 namecharacter*8 modelreal*4 costreal*4 price
end type product
Chapter 16 Debugging Fortran Using dbx 227
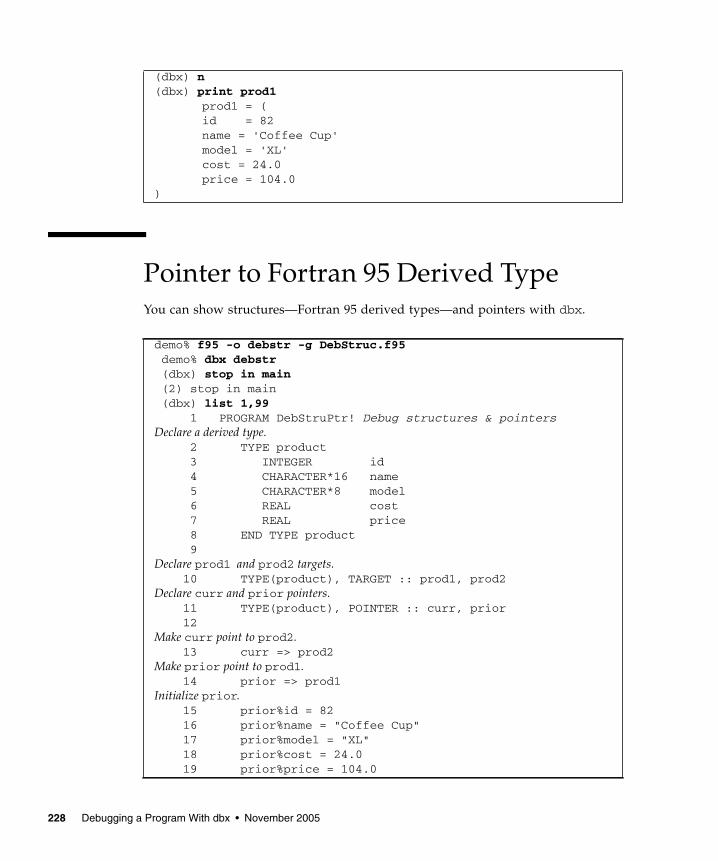
Pointer to Fortran 95 Derived TypeYou can show structures—Fortran 95 derived types—and pointers with dbx.
(dbx) n(dbx) print prod1
prod1 = (id = 82name = 'Coffee Cup'model = 'XL'cost = 24.0price = 104.0
)
demo% f95 -o debstr -g DebStruc.f95 demo% dbx debstr (dbx) stop in main (2) stop in main (dbx) list 1,99 1 PROGRAM DebStruPtr! Debug structures & pointersDeclare a derived type. 2 TYPE product 3 INTEGER id 4 CHARACTER*16 name 5 CHARACTER*8 model 6 REAL cost 7 REAL price 8 END TYPE product 9Declare prod1 and prod2 targets. 10 TYPE(product), TARGET :: prod1, prod2Declare curr and prior pointers. 11 TYPE(product), POINTER :: curr, prior 12Make curr point to prod2.
13 curr => prod2Make prior point to prod1. 14 prior => prod1Initialize prior. 15 prior%id = 82 16 prior%name = "Coffee Cup" 17 prior%model = "XL" 18 prior%cost = 24.0 19 prior%price = 104.0
228 Debugging a Program With dbx • November 2005

Above, dbx displays all fields of the derived type, including field names.
You can use structures—inquire about an item of an Fortran 95 derived type.
Set curr to prior. 20 curr = priorPrint name from curr and prior. 21 WRITE ( *, * ) curr%name, " ", prior%name 22 END PROGRAM DebStruPtr (dbx) stop at 21 (1) stop at "DebStruc.f95":21 (dbx) run Running: debstr(process id 10972)stopped in main at line 21 in file "DebStruc.f95" 21 WRITE ( *, * ) curr%name, " ", prior%name(dbx) print prod1 prod1 = (
id = 82name = "Coffee Cup"model = "XL"cost = 24.0price = 104.0
)
Ask about the variable(dbx) whatis prod1 product prod1Ask about the type (-t) (dbx) whatis -t product type product integer*4 id character*16 name character*8 model real cost real price end type product
Chapter 16 Debugging Fortran Using dbx 229

To print a pointer, type:
dbx displays the contents of a pointer, which is an address. This address can be different withevery run.(dbx) print prior prior = ( id = 82 name = ’Coffee Cup’ model = ’XL’ cost = 24.0 price = 104.0 )
230 Debugging a Program With dbx • November 2005

CHAPTER 17
Debugging a Java Application Withdbx
This chapter describes how you can use dbx to debug an application that is amixture of Java™ code and C JNI (Java™ Native Interface) code or C++ JNI code.
The chapter is organized into the following sections:
■ Using dbx With Java Code■ Environment Variables for Java Debugging■ Starting to Debug a Java Application■ Customizing Startup of the JVM Software■ dbx Modes for Debugging Java Code■ Using dbx Commands in Java Mode
Using dbx With Java CodeYou can use the Sun Studio dbx to debug mixed code (Java code and C code or C++code) running under the Solaris™ OS and the Linux OS.
Capabilities of dbx With Java CodeYou can debug several types of Java applications with dbx (see “Starting to Debug aJava Application” on page 233). Most dbx commands operate similarly on nativecode and Java code.
231

Limitations of dbx With Java Codedbx has the following limitations when debugging Java code:
■ dbx cannot tell you the state of a Java application from a core file as it can withnative code.
■ dbx cannot tell you the state of a Java application if the application is hung forsome reason and dbx is not able to make procedure calls.
■ Fix and continue, and runtime checking, do not apply to Java applications.
Environment Variables for JavaDebuggingThe following environment variables are specific to debugging a Java applicationwith dbx. You can set the JAVASRCPATH, CLASSPATHX, and jvm_invocationenvironment variables at a shell prompt before starting dbx. The setting of thejdbx_mode environment variable changes as you are debugging your application.You can change its setting with the jon command (“jon Command” on page 344)and the joff command (see “joff Command” on page 344).
jdbx_mode The jdbx_mode environment variable can have the followingsettings: java, jni, or native. For descriptions of the Java, JNI,and native modes, and how and when the mode changes, see “dbxModes for Debugging Java Code” on page 243. Default: java.
JAVASRCPATH You can use the JAVASRCPATH environment variable to specify thedirectories in which dbx should look for Java source files. Thisvariable is useful when the Java sources files are not in the samedirectory as the .class or .jar files. See “Specifying the Locationof Your Java Source Files” on page 237 for more information.
CLASSPATHX The CLASSPATHX environment variable lets you specify to dbx apath for Java class files that are loaded by custom class loaders. Formore information, see “Specifying a Path for Class Files That UseCustom Class Loaders” on page 237.
jvm_invocation The jvm_invocation environment variable lets you customize theway the JVM™ software is started. (The terms “Java virtualmachine” and “JVM” mean a virtual machine for the Java™
platform.) For more information, see See “Customizing Startup ofthe JVM Software” on page 238.
232 Debugging a Program With dbx • November 2005

Starting to Debug a Java ApplicationYou can use dbx to debug the following types of Java applications:
■ A file with a file name that ends in .class
■ A file with a file name that ends in .jar
■ A Java application that is started using a wrapper
■ A running Java application that was started in debug mode to which you attachdbx
■ A C application or C++ application that embeds a Java application using theJNI_CreateJavaVM interface
dbx recognizes that it is debugging a Java application in all of these cases.
Debugging a Class FileYou can debug a file that uses the .class file name extension using dbx as in thefollowing example.
If the class that defines the application is defined in a package, you need to includethe package path just as when running the application under the JVM software, as inthe following example.
You can also use a full path name for the class file. dbx automatically determines thepackage portion of the class path by looking in the .class file and adds theremaining portion of the full path name to the class path. For example, given thefollowing path name, dbx determines that pkg/Toy.class is the main class nameand adds /home/user/java to the class path.
(dbx) debug myclass.class
(dbx) debug java.pkg.Toy.class
(dbx) debug /home/user/java/pkg/Toy.class
Chapter 17 Debugging a Java Application With dbx 233

Debugging a JAR FileA Java application can be bundled in a JAR (Java Archive) file. You can debug a JARfile using dbx as in the following example.
When you start debugging a file that has a file name ending in .jar, dbx uses theMain_Class attribute specified in the manifest of this JAR file to determine themain class. (The main class is the class within the JAR file that is your application’sentry point. If you use a full path name or relative path name to specify the JAR file,dbx uses the directory name and prefixes it to the class path in the Main-Classattribute.
If you debug a JAR file that does not have the Main-Class attribute, you can usethe JAR URL syntax jar:<url>!/{entry} that is specified in the classJarURLConnection of the Java™ 2 Platform, Standard Edition to specify the nameof the main class, as in the following examples.
For each of these examples dbx would do the following:
■ Treat the class path specified after the ! character as the main class (for example,/myclass.class or /x/y/z.class)
■ Add the name of the JAR file ./myjar.jar, /a/b/c/d/e.jar, or/a/b/c/d.jar to the class path
■ Begin debugging the main class
Note – If you have specified a custom startup of the JVM software using thejvm_invocation environment variable (see “Customizing Startup of the JVMSoftware” on page 238)), the file name of the JAR file is not automatically added tothe class path. In this case, you must add the file name of the JAR file to the classpath when you start debugging.
(dbx) debug myjar.jar
(dbx) debug jar:myjar.jar!/myclass.class(dbx) debug jar:/a/b/c/d/e.jar!/x/y/z.class(dbx) debug jar:file:/a/b/c/d.jar!/myclass.class
234 Debugging a Program With dbx • November 2005
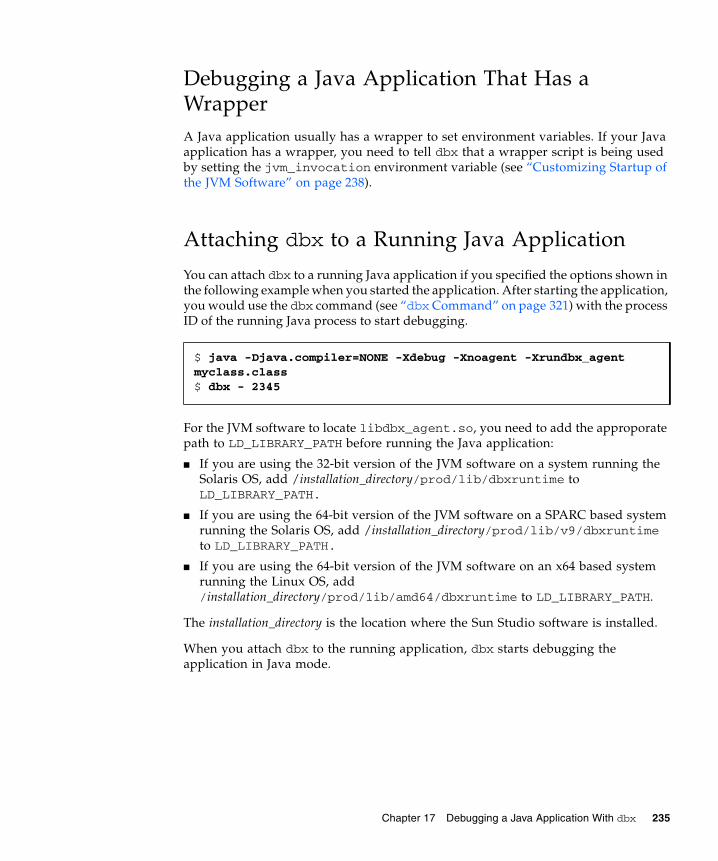
Debugging a Java Application That Has aWrapperA Java application usually has a wrapper to set environment variables. If your Javaapplication has a wrapper, you need to tell dbx that a wrapper script is being usedby setting the jvm_invocation environment variable (see “Customizing Startup ofthe JVM Software” on page 238).
Attaching dbx to a Running Java Application
You can attach dbx to a running Java application if you specified the options shown inthe following example when you started the application. After starting the application,you would use the dbx command (see “dbxCommand” on page 321) with the processID of the running Java process to start debugging.
For the JVM software to locate libdbx_agent.so, you need to add the approporatepath to LD_LIBRARY_PATH before running the Java application:
■ If you are using the 32-bit version of the JVM software on a system running theSolaris OS, add /installation_directory/prod/lib/dbxruntime toLD_LIBRARY_PATH.
■ If you are using the 64-bit version of the JVM software on a SPARC based systemrunning the Solaris OS, add /installation_directory/prod/lib/v9/dbxruntimeto LD_LIBRARY_PATH.
■ If you are using the 64-bit version of the JVM software on an x64 based systemrunning the Linux OS, add/installation_directory/prod/lib/amd64/dbxruntime to LD_LIBRARY_PATH.
The installation_directory is the location where the Sun Studio software is installed.
When you attach dbx to the running application, dbx starts debugging theapplication in Java mode.
$ java -Djava.compiler=NONE -Xdebug -Xnoagent -Xrundbx_agentmyclass.class$ dbx - 2345
Chapter 17 Debugging a Java Application With dbx 235

If your Java application requires 64-bit object libraries, include the -d64 option whenyou start the application. Then when you attach dbx to the application, dbx will usethe 64-bit JVM software on which the application is running.
Debugging a C Application or C++ ApplicationThat Embeds a Java ApplicationYou can debug a C application or C++ application that embeds a Java applicationusing the JNI_CreateJavaVM interface. The C application or C++ application muststart the Java application by specifying the following options to the JVM software:
For the JVM software to locate libdbx_agent.so, you need to add the approporatepath to LD_LIBRARY_PATH before running the Java application:
■ If you are using the 32-bit version of the JVM software on a system running theSolaris OS, add /installation_directory/prod/lib/dbxruntime toLD_LIBRARY_PATH.
■ If you are using the 64-bit version of the JVM software on a SPARC based systemrunning the Solaris OS, add /installation_directory/prod/lib/v9/dbxruntimeto LD_LIBRARY_PATH.
■ If you are using the 64-bit version of the JVM software on an x64 based systemrunning the Linux OS, add/installation_directory/prod/lib/amd64/dbxruntime to LD_LIBRARY_PATH.
The installation_directory is the location where the Sun Studio software is installed.
Passing Arguments to the JVM SoftwareWhen you use the run command in Java mode, the arguments you give are passedto the application and not to the JVM software. To pass arguments to the JVMsoftware, see “Customizing Startup of the JVM Software” on page 238.
$ java -Djava.compiler=NONE -Xdebug -Xnoagent -Xrundbx_agent -d64myclass.class$ dbx - 2345
-Xdebug -Xnoagent -Xrundbx_agent
236 Debugging a Program With dbx • November 2005

Specifying the Location of Your Java Source FilesSometimes your Java source files are not in the same directory as the .class or.jar files. You can use the $JAVASRCPATH environment variable to specify thedirectories in which dbx should look for Java source files. For exampleJAVASRCPATH=.:/mydir/mysrc:/mydir/mylibsrc:/mydir/myutils causesdbx to look in the listed directories for source files that correspond to the class filesbeing debugged.
Specifying the Location of Your C Source Files orC++ Source Filesdbx might not be able to find your C source files or C++ source files in the followingcircumstances:
■ If your source files are not in the same location as they were when you compiledthem
■ If you compiled your source files on a different system than the one on which youare running dbx and the compile directory does not have the same path name
In such cases, use the pathmap command (see “pathmap Command” on page 359)to map one path name to another so that dbx can find your files.
Specifying a Path for Class Files That Use CustomClass LoadersAn application can have custom class loaders that load class files from locations thatmight not be part of the regular class path. In such situations dbx cannot locate theclass files. The CLASSPATHX environment variable lets you specify to dbx a path forthe class files that are loaded by their custom class loaders. For example,CLASSPATHX=.:/myloader/myclass:/mydir/mycustom causes dbx to look inthe listed directories when it is trying to locate a class file.
Chapter 17 Debugging a Java Application With dbx 237
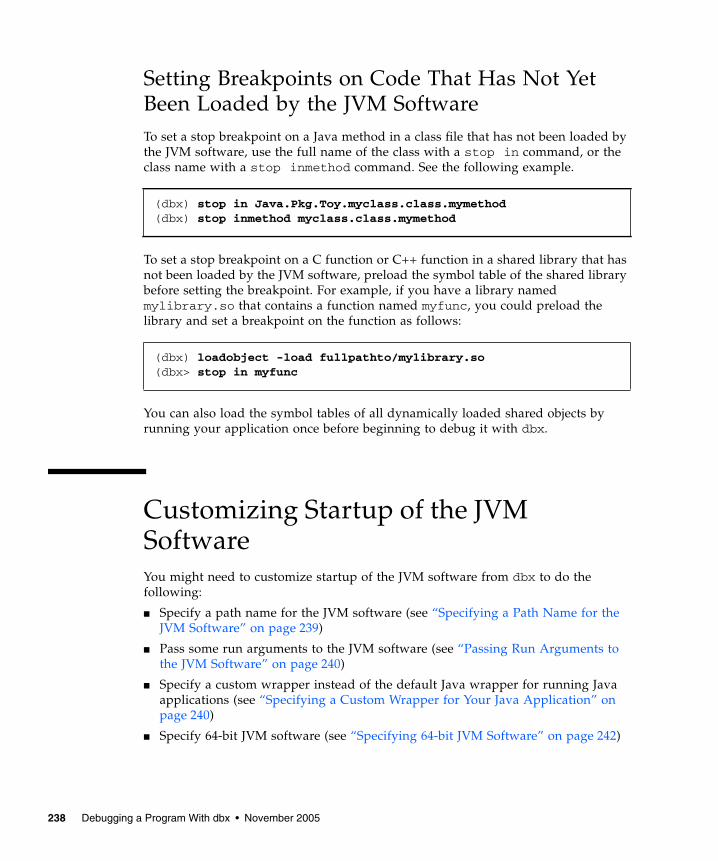
Setting Breakpoints on Code That Has Not YetBeen Loaded by the JVM SoftwareTo set a stop breakpoint on a Java method in a class file that has not been loaded bythe JVM software, use the full name of the class with a stop in command, or theclass name with a stop inmethod command. See the following example.
To set a stop breakpoint on a C function or C++ function in a shared library that hasnot been loaded by the JVM software, preload the symbol table of the shared librarybefore setting the breakpoint. For example, if you have a library namedmylibrary.so that contains a function named myfunc, you could preload thelibrary and set a breakpoint on the function as follows:
You can also load the symbol tables of all dynamically loaded shared objects byrunning your application once before beginning to debug it with dbx.
Customizing Startup of the JVMSoftwareYou might need to customize startup of the JVM software from dbx to do thefollowing:
■ Specify a path name for the JVM software (see “Specifying a Path Name for theJVM Software” on page 239)
■ Pass some run arguments to the JVM software (see “Passing Run Arguments tothe JVM Software” on page 240)
■ Specify a custom wrapper instead of the default Java wrapper for running Javaapplications (see “Specifying a Custom Wrapper for Your Java Application” onpage 240)
■ Specify 64-bit JVM software (see “Specifying 64-bit JVM Software” on page 242)
(dbx) stop in Java.Pkg.Toy.myclass.class.mymethod(dbx) stop inmethod myclass.class.mymethod
(dbx) loadobject -load fullpathto/mylibrary.so(dbx> stop in myfunc
238 Debugging a Program With dbx • November 2005

You can customize startup of the JVM software using the jvm_invocationenvironment variable. By default, when the jvm_invocation environment variableis not defined, dbx starts the JVM software as follows:
When the jvm_invocation environment variable is defined, dbx uses the value ofthe variable to start the JVM software.
You must include the -Xdebug option in the definition of the jvm_invocationenvironment variable. dbx expands -Xdebug into the internal options -Xdebug-Xnoagent -Xrundbxagent::sync.
If you do not include the -Xdebug option in the definition, as in the followingexample, dbx issues an error message.
Specifying a Path Name for the JVM SoftwareBy default, dbx starts the JVM software in your path if you do not specify a pathname for the JVM software.
To specify a path name for the JVM software, set the jvm_invocation environmentvariable to the appropriate path name, as in the following example.
This setting causes dbx to start the JVM software as follows:
java -Xdebug -Xnoagent -Xrundbx_agent:syncpid
jvm_invocation="/set/java/javasoft/sparc-S2/jdk1.2/bin/java"
dbx: Value of ‘$jvm_invocation’ must include an option to invokethe VM in debug mode
jvm_invocation="/myjava/java -Xdebug"
/myjava/java -Djava.compiler=NONE -Xdebug -Xnoagent -Xrundbx_agent:sync
Chapter 17 Debugging a Java Application With dbx 239
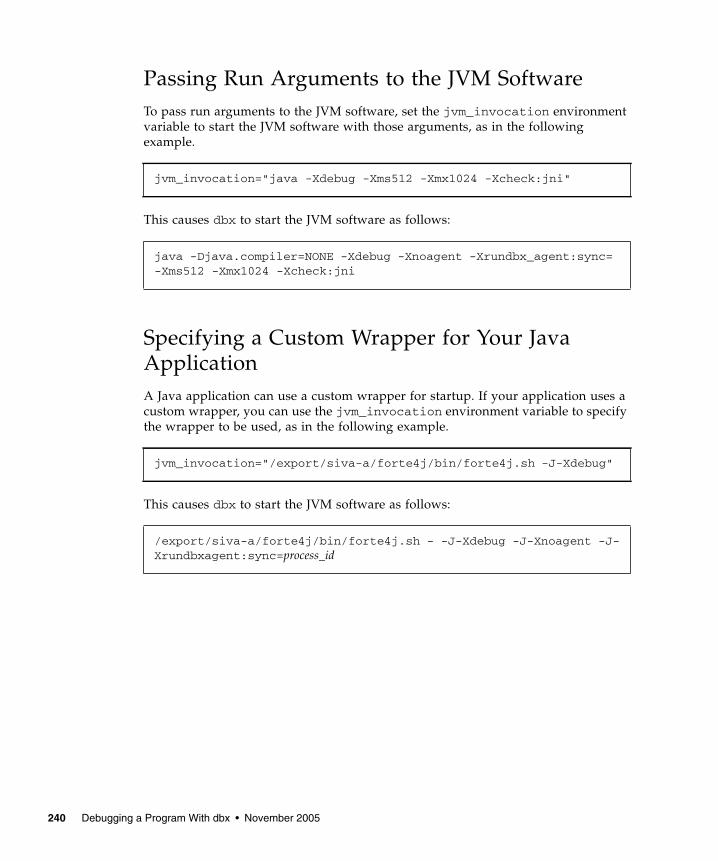
Passing Run Arguments to the JVM SoftwareTo pass run arguments to the JVM software, set the jvm_invocation environmentvariable to start the JVM software with those arguments, as in the followingexample.
This causes dbx to start the JVM software as follows:
Specifying a Custom Wrapper for Your JavaApplicationA Java application can use a custom wrapper for startup. If your application uses acustom wrapper, you can use the jvm_invocation environment variable to specifythe wrapper to be used, as in the following example.
This causes dbx to start the JVM software as follows:
jvm_invocation="java -Xdebug -Xms512 -Xmx1024 -Xcheck:jni"
java -Djava.compiler=NONE -Xdebug -Xnoagent -Xrundbx_agent:sync=-Xms512 -Xmx1024 -Xcheck:jni
jvm_invocation="/export/siva-a/forte4j/bin/forte4j.sh -J-Xdebug"
/export/siva-a/forte4j/bin/forte4j.sh - -J-Xdebug -J-Xnoagent -J-Xrundbxagent:sync=process_id
240 Debugging a Program With dbx • November 2005
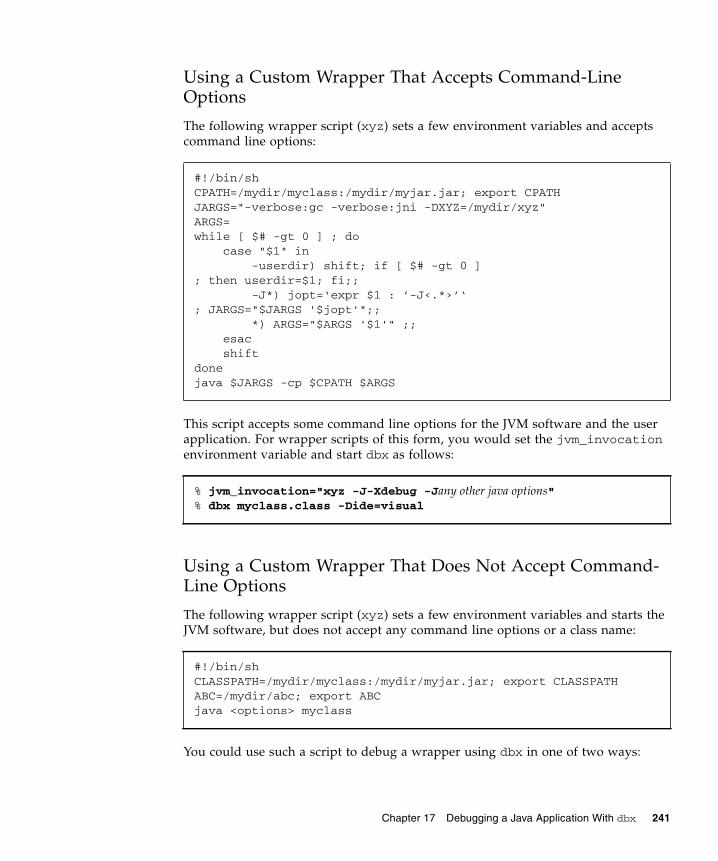
Using a Custom Wrapper That Accepts Command-LineOptions
The following wrapper script (xyz) sets a few environment variables and acceptscommand line options:
This script accepts some command line options for the JVM software and the userapplication. For wrapper scripts of this form, you would set the jvm_invocationenvironment variable and start dbx as follows:
Using a Custom Wrapper That Does Not Accept Command-Line Options
The following wrapper script (xyz) sets a few environment variables and starts theJVM software, but does not accept any command line options or a class name:
You could use such a script to debug a wrapper using dbx in one of two ways:
#!/bin/shCPATH=/mydir/myclass:/mydir/myjar.jar; export CPATHJARGS="-verbose:gc -verbose:jni -DXYZ=/mydir/xyz"ARGS=while [ $# -gt 0 ] ; do
case "$1" in-userdir) shift; if [ $# -gt 0 ]
; then userdir=$1; fi;;-J*) jopt=‘expr $1 : ’-J‹.*›’‘
; JARGS="$JARGS '$jopt'";;*) ARGS="$ARGS '$1'" ;;
esacshift
donejava $JARGS -cp $CPATH $ARGS
% jvm_invocation="xyz -J-Xdebug -Jany other java options"% dbx myclass.class -Dide=visual
#!/bin/shCLASSPATH=/mydir/myclass:/mydir/myjar.jar; export CLASSPATHABC=/mydir/abc; export ABCjava <options> myclass
Chapter 17 Debugging a Java Application With dbx 241

■ You could modify the script to start dbx from inside the wrapper script itself byadding the definition of the jvm_invocation variable to the script and startingdbx:
Once you have made this modification, you could start the debugging session byrunning the script.
■ You could modify the script slightly to accept some command line options asfollows:
Once you made this modification, you would set the jvm_invocationenvironment variable and start dbx as follows:
Specifying 64-bit JVM SoftwareIf you want dbx to start 64-bit JVM software to debug an application that requires64-bit object libraries, include the -d64 option when you set the jvm_invocationenvironment variable:
#!/bin/shCLASSPATH=/mydir/myclass:/mydir/myjar.jar; export CLASSPATHABC=/mydir/abc; export ABCjvm_invocation="java -Xdebug <options>"; export jvm_invocationdbx myclass.class
#!/bin/shCLASSPATH=/mydir/myclass:/mydir/myjar.jar; export CLASSPATHABC=/mydir/abc; export ABCJAVA_OPTIONS="$1 <options>"java $JAVA_OPTIONS $2
% jvm_invocation="xyz -Xdebug"; export jvm_invocation% dbx myclass.class
jvm_invocation="/myjava/java -Xdebug -d64"
242 Debugging a Program With dbx • November 2005

dbx Modes for Debugging Java CodeWhen debugging a Java application, dbx is in one of three modes:
■ Java mode■ JNI mode■ Native mode
When dbx is Java mode or JNI (Java Native Interface) mode, you can inspect thestate of your Java application, including JNI code, and control execution of the code.When dbx is in native mode, you can inspect the state of your C or C++ JNI code.The current mode (java, jni, native) is stored in the environment variablejdbx_mode.
In Java mode, you interact with dbx using Java syntax and dbx uses Java syntax topresent information to you. This mode is used for debugging pure Java code, or theJava code in an application that is a mixture of Java code and C JNI code or C++ JNIcode.
In JNI mode, dbx commands use native syntax and affect native code, but the outputof commands shows Java-related status as well as native status, so JNI mode is a“mixed” mode. This mode is used for debugging the native parts of an applicationthat is a mixture of Java code and C JNI code or C++ JNI code.
In native mode, dbx commands affect only a native program, and all Java-relatedfeatures are disabled. This mode is used for debugging non-Java related programs.
As you execute your Java application, dbx switches automatically between Javamode and JNI mode as appropriate. For example, when it encounters a Javabreakpoint, dbx switches into Java mode, and when you step from Java code intoJNI code, it switches into JNI mode.
Switching from Java or JNI Mode to Native Modedbx does not switch automatically into native mode. You can switch explicitly fromJava or JNI Mode to native mode with the joff command, and from native mode toJava mode with the jon command.
Chapter 17 Debugging a Java Application With dbx 243

Switching Modes When You Interrupt ExecutionIf you interrupt execution of your Java application (for example, with a control-C),dbx tries to set the mode automatically to Java/JNI mode by bringing theapplication to a safe state and suspending all threads.
If dbx cannot suspend the application and switch to Java/JNI mode, dbx switches tonative mode. You can then use the jon command to switch to Java mode so that youinspect the state of the program.
Using dbx Commands in Java ModeWhen you are using dbx to debug a mixture of Java and native code, dbx commandsfall into several categories:
■ Commands that accept the same arguments and operate the same way in Javamode or JNI mode as in native mode (see “Commands With Identical Syntax andFunctionality in Java Mode and Native Mode” on page 246).
■ Commands have arguments that are valid only in Java mode or JNI mode, as wellas arguments that are valid only in native mode (see “Commands With DifferentSyntax in Java Mode” on page 247).
■ Commands that are valid only in Java mode or JNI mode (see “Commands ValidOnly in Java Mode” on page 248).
Any commands not included in one of these categories work only in native mode.
The Java Expression Evaluation in dbxCommandsThe Java expression evaluator used in most dbx commands supports the followingconstructs:
■ All literals■ All names and field accesses■ this and super■ Array accesses■ Casts■ Conditional binary operations■ Method calls■ Other unary/binary operations■ Assignment to variables or fields
244 Debugging a Program With dbx • November 2005

■ instanceof operator■ Array length operator
The Java expression evaluator does not support the following constructs:
■ Qualified this, for example, <ClassName>.this■ Class instance creation expressions■ Array creation expressions■ String concatenation operator■ Conditional operator ? :■ Compound assignment operators, for example, x += 3
A particularly useful way of inspecting the state of your Java application is using thedisplay facility in the dbx Debugger.
Depending on precise value semantics in expressions that do more than just inspectdata is not recommended.
Static and Dynamic Information Used by dbxCommandsMuch of the information about a Java application is normally available only after theJVM software has started, and is unavailable after the Java application has finishedexecuting. However, when you debug a Java application with dbx, dbx gleans someof the information it needs from class files and JAR files that are part of the systemclass path and user class path before it starts the JVM software. This allows dbx todo better error checking on breakpoints before you run the application.
Some Java classes and their attributes might not be accessible through the class path.dbx can inspect and step through these classes, and the expression parser can accessthem, once they are loaded. However, the information it gathers is temporary and isno longer available after the JVM software terminates.
Some information that dbx needs to debug your Java application is not recordedanywhere so dbx skims Java source files to derive this information as it is debuggingyour code.
Chapter 17 Debugging a Java Application With dbx 245

Commands With Identical Syntax andFunctionality in Java Mode and Native ModeThe following dbx commands have the same syntax and perform the sameoperations in Java mode as in native mode.
Command Functionality
attach Attaches dbx to a running process, stopping execution and puttingthe program under debugging control
cont Causes the process to continue execution
dbxenv List or set dbx environment variables
delete Deletes breakpoints and other events
down Moves down the call stack (away from main)
dump Prints all variables local to a procedure or method
file Lists or changes the current file
frame Lists or changes the current stack frame number
handler Modifies event handlers (breakpoints)
import Import commands from a dbx command library
line Lists or changes the current line number
list Lists or changes the current line number
next Steps one source line (steps over calls)
pathmap Maps one path name to another for finding source files, etc.
proc Displays the status of the current process
prog Manages programs being debugged and their attributes
quit Exits dbx
rerun Runs the program with no arguments
runargs Changes the arguments of the target process
status Lists the event handlers (breakpoints)
step up Steps up and out of the current function or method
stepi Steps one machine instruction (steps into calls)
up Moves up the call stack (toward main)
whereami Displays the current source line
246 Debugging a Program With dbx • November 2005
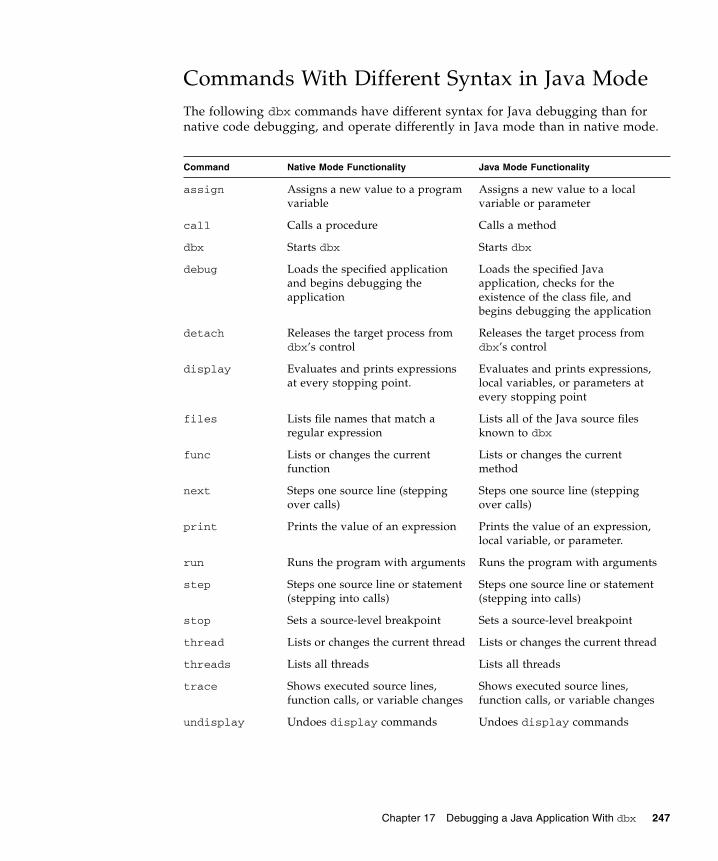
Commands With Different Syntax in Java ModeThe following dbx commands have different syntax for Java debugging than fornative code debugging, and operate differently in Java mode than in native mode.
Command Native Mode Functionality Java Mode Functionality
assign Assigns a new value to a programvariable
Assigns a new value to a localvariable or parameter
call Calls a procedure Calls a method
dbx Starts dbx Starts dbx
debug Loads the specified applicationand begins debugging theapplication
Loads the specified Javaapplication, checks for theexistence of the class file, andbegins debugging the application
detach Releases the target process fromdbx’s control
Releases the target process fromdbx’s control
display Evaluates and prints expressionsat every stopping point.
Evaluates and prints expressions,local variables, or parameters atevery stopping point
files Lists file names that match aregular expression
Lists all of the Java source filesknown to dbx
func Lists or changes the currentfunction
Lists or changes the currentmethod
next Steps one source line (steppingover calls)
Steps one source line (steppingover calls)
print Prints the value of an expression Prints the value of an expression,local variable, or parameter.
run Runs the program with arguments Runs the program with arguments
step Steps one source line or statement(stepping into calls)
Steps one source line or statement(stepping into calls)
stop Sets a source-level breakpoint Sets a source-level breakpoint
thread Lists or changes the current thread Lists or changes the current thread
threads Lists all threads Lists all threads
trace Shows executed source lines,function calls, or variable changes
Shows executed source lines,function calls, or variable changes
undisplay Undoes display commands Undoes display commands
Chapter 17 Debugging a Java Application With dbx 247

Commands Valid Only in Java ModeThe following dbx commands are valid only in Java mode or JNI mode.
whatis Prints the type of expression ordeclaration of type
Prints the declaration of anidentifier
when Executes commands when aspecified event occurs
Executes commands when aspecified event occurs
where Prints the call stack Prints the call stack
Command Functionality
java Used when dbx is in JNI mode to indicate that the Java version of aspecified command is to be executed
javaclasses Prints the names of all Java classes known to dbx when you give thecommand
joff Switches dbx from Java mode or JNI mode to native mode
jon Switches dbx from native mode to Java mode
jpkgs Prints the names of all Java packages known to dbx when you givethe command
native Used when dbx is in Java mode to indicate that the native version ofa specified command is to be executed
Command Native Mode Functionality Java Mode Functionality
248 Debugging a Program With dbx • November 2005
CHAPTER 18
Debugging at theMachine-Instruction Level
This chapter describes how to use event management and process controlcommands at the machine-instruction level, how to display the contents of memoryat specified addresses, and how to display source lines along with theircorresponding machine instructions. The next, step, stop and trace commandseach support a machine-instruction level variant: nexti, stepi, stopi, andtracei. Use the regs command to print out the contents of machine registers or theprint command to print out individual registers.
This chapter is organized into the following sections:
■ Examining the Contents of Memory■ Stepping and Tracing at Machine-Instruction Level■ Setting Breakpoints at the Machine-Instruction Level■ Using the adb Command■ Using the regs Command
Examining the Contents of MemoryUsing addresses and the examine or x command, you can examine the content ofmemory locations as well as print the assembly language instruction at each address.Using a command derived from adb(1), the assembly language debugger, you canquery for:
■ The address, using the = (equal sign) character, or,■ The contents stored at an address, using the / (slash) character.
You can print the assembly commands using the dis and listi commands. (See“Using the dis Command” on page 253 and “Using the listi Command” onpage 253.)
249

Using the examine or x CommandUse the examine command, or its alias x, to display memory contents or addresses.
Use the following syntax to display the contents of memory starting at address forcount items in format format. The default address is the next one after the last addresspreviously displayed. The default count is 1. The default format is the same as wasused in the previous examine command, or X if this is the first command given.
The syntax for the examine command is:
To display the contents of memory from address1 through address2 inclusive, informat format, type:
Display the address, instead of the contents of the address in the given format bytyping:
To print the value stored at the next address after the one last displayed byexamine, type:
To print the value of an expression, enter the expression as an address:
Addresses
The address is any expression resulting in or usable as an address. The address may bereplaced with a + (plus sign), which displays the contents of the next address in thedefault format.
examine [address] [/ [count] [format]]
examine address1, address2 [/ [format]]
examine address = [format]
examine +/ i
examine address=formatexamine address=
250 Debugging a Program With dbx • November 2005
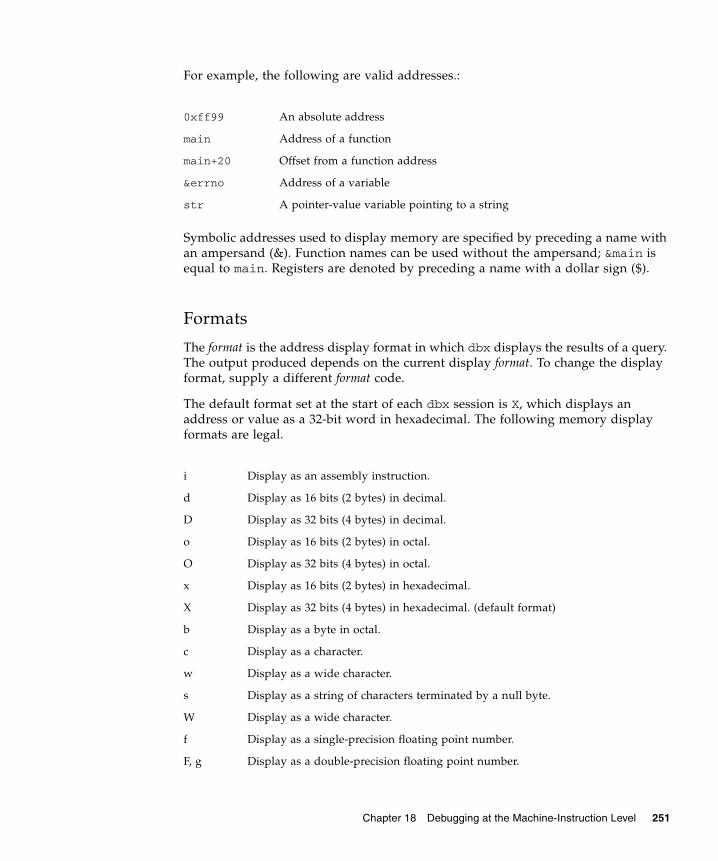
For example, the following are valid addresses.:
Symbolic addresses used to display memory are specified by preceding a name withan ampersand (&). Function names can be used without the ampersand; &main isequal to main. Registers are denoted by preceding a name with a dollar sign ($).
Formats
The format is the address display format in which dbx displays the results of a query.The output produced depends on the current display format. To change the displayformat, supply a different format code.
The default format set at the start of each dbx session is X, which displays anaddress or value as a 32-bit word in hexadecimal. The following memory displayformats are legal.
0xff99 An absolute address
main Address of a function
main+20 Offset from a function address
&errno Address of a variable
str A pointer-value variable pointing to a string
i Display as an assembly instruction.
d Display as 16 bits (2 bytes) in decimal.
D Display as 32 bits (4 bytes) in decimal.
o Display as 16 bits (2 bytes) in octal.
O Display as 32 bits (4 bytes) in octal.
x Display as 16 bits (2 bytes) in hexadecimal.
X Display as 32 bits (4 bytes) in hexadecimal. (default format)
b Display as a byte in octal.
c Display as a character.
w Display as a wide character.
s Display as a string of characters terminated by a null byte.
W Display as a wide character.
f Display as a single-precision floating point number.
F, g Display as a double-precision floating point number.
Chapter 18 Debugging at the Machine-Instruction Level 251

Count
The count is a repetition count in decimal. The increment size depends on thememory display format.
Examples of Using an Address
The following examples show how to use an address with count and format optionsto display five successive disassembled instructions starting from the currentstopping point.
For SPARC based systems:
For x86 based systems:
E Display as an extended-precision floating point number.
ld, lD Display 32 bits (4 bytes) in decimal (same as D).
lo, lO Display 32 bits (4 bytes) in octal (same as O).
lx, LX Display 32 bits (4 bytes) in hexadecimal (same as X).
Ld, LD Display 64 bits (8 bytes) in decimal.
Lo, LO Display 64 bits (8 bytes) in octal.
Lx, LX Display 64 bits (8 bytes) in hexadecimal.
(dbx) stepistopped in main at 0x108bc0x000108bc: main+0x000c: st %l0, [%fp - 0x14](dbx) x 0x108bc/5i0x000108bc: main+0x000c: st %l0, [%fp - 0x14]0x000108c0: main+0x0010: mov 0x1,%l00x000108c4: main+0x0014: or %l0,%g0, %o00x000108c8: main+0x0018: call 0x00020b90 [unresolved PLT 8:malloc]0x000108cc: main+0x001c: nop
(dbx) x &main/5i0x08048988: main : pushl %ebp0x08048989: main+0x0001: movl %esp,%ebp0x0804898b: main+0x0003: subl $0x28,%esp0x0804898e: main+0x0006: movl 0x8048ac0,%eax0x08048993: main+0x000b: movl %eax,-8(%ebp)
252 Debugging a Program With dbx • November 2005

Using the dis CommandThe dis command is equivalent to the examine command with i as the defaultdisplay format.
Here is the syntax for the dis command.
The dis command:
■ Without arguments displays 10 instructions starting at +.
■ With the address argument only, disassembles 10 instructions starting at address.
■ With the address argument and a count, disassembles count instructions starting ataddress.
■ With the address1 and address2 arguments, disassembles instructions from address1through address2.
■ With only a count, displays count instructions starting at +.
Using the listi CommandTo display source lines with their corresponding assembly instructions, use thelisti command, which is equivalent to the command list -i. See the discussionof list -i in “Printing a Source Listing” on page 75.
dis [address] [address1, address2] [/count]
Chapter 18 Debugging at the Machine-Instruction Level 253

For SPARC based systems:
For x86 based systems:
(dbx) listi 13, 14 13 i = atoi(argv[1]);0x0001083c: main+0x0014: ld [%fp + 0x48], %l00x00010840: main+0x0018: add %l0, 0x4, %l00x00010844: main+0x001c: ld [%l0], %l00x00010848: main+0x0020: or %l0, %g0, %o00x0001084c: main+0x0024: call 0x000209e8 [unresolved PLT 7:atoi]0x00010850: main+0x0028: nop0x00010854: main+0x002c: or %o0, %g0, %l00x00010858: main+0x0030: st %l0, [%fp - 0x8] 14 j = foo(i);0x0001085c: main+0x0034: ld [%fp - 0x8], %l00x00010860: main+0x0038: or %l0, %g0, %o00x00010864: main+0x003c: call foo0x00010868: main+0x0040: nop0x0001086c: main+0x0044: or %o0, %g0, %l00x00010870: main+0x0048: st %l0, [%fp - 0xc]
(dbx) listi 13, 14 13 i = atoi(argv[1]);0x080488fd: main+0x000d: movl 12(%ebp),%eax0x08048900: main+0x0010: movl 4(%eax),%eax0x08048903: main+0x0013: pushl %eax0x08048904: main+0x0014: call atoi <0x8048798>0x08048909: main+0x0019: addl $4,%esp0x0804890c: main+0x001c: movl %eax,-8(%ebp) 14 j = foo(i);0x0804890f: main+0x001f: movl -8(%ebp),%eax0x08048912: main+0x0022: pushl %eax0x08048913: main+0x0023: call foo <0x80488c0>0x08048918: main+0x0028: addl $4,%esp0x0804891b: main+0x002b: movl %eax,-12(%ebp)
254 Debugging a Program With dbx • November 2005
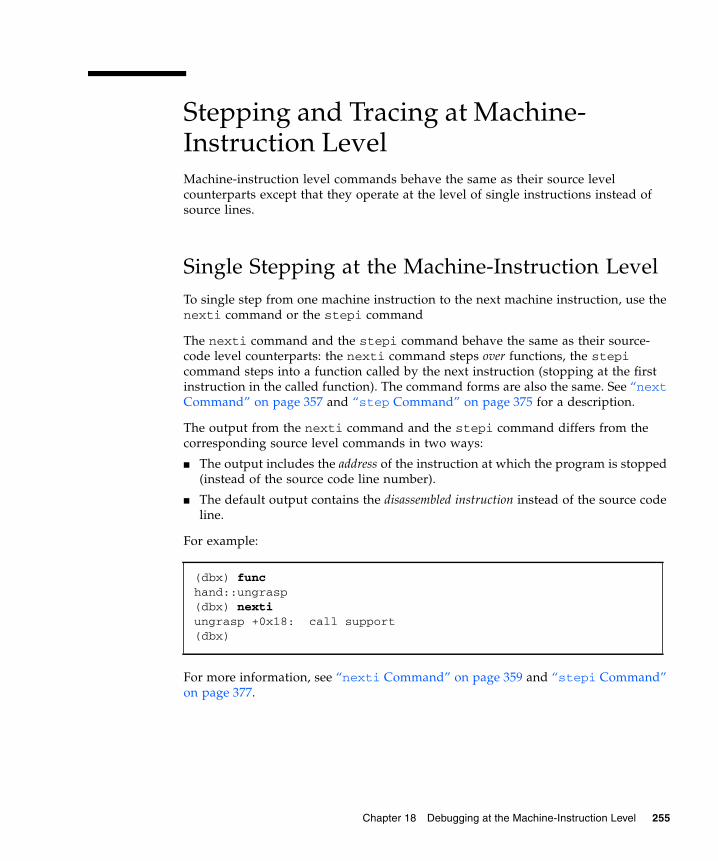
Stepping and Tracing at Machine-Instruction LevelMachine-instruction level commands behave the same as their source levelcounterparts except that they operate at the level of single instructions instead ofsource lines.
Single Stepping at the Machine-Instruction LevelTo single step from one machine instruction to the next machine instruction, use thenexti command or the stepi command
The nexti command and the stepi command behave the same as their source-code level counterparts: the nexti command steps over functions, the stepicommand steps into a function called by the next instruction (stopping at the firstinstruction in the called function). The command forms are also the same. See “nextCommand” on page 357 and “step Command” on page 375 for a description.
The output from the nexti command and the stepi command differs from thecorresponding source level commands in two ways:
■ The output includes the address of the instruction at which the program is stopped(instead of the source code line number).
■ The default output contains the disassembled instruction instead of the source codeline.
For example:
For more information, see “nexti Command” on page 359 and “stepi Command”on page 377.
(dbx) funchand::ungrasp(dbx) nextiungrasp +0x18: call support(dbx)
Chapter 18 Debugging at the Machine-Instruction Level 255

Tracing at the Machine-Instruction LevelTracing techniques at the machine-instruction level work the same as at the sourcecode level, except you use the tracei command For the tracei command, dbxexecutes a single instruction only after each check of the address being executed orthe value of the variable being traced. The tracei command produces automaticstepi-like behavior: the program advances one instruction at a time, stepping intofunction calls.
When you use the tracei command, it causes the program to stop for a momentafter each instruction while dbx checks for the address execution or the value of thevariable or expression being traced. Using the tracei command can slow executionconsiderably.
For more information on trace and its event specifications and modifiers, see“Tracing Execution” on page 112 and “tracei Command” on page 393.
Here is the general syntax for tracei:
Commonly used forms of tracei are:
For more information, see “tracei Command” on page 393.
tracei event-specification [modifier]
tracei step Trace each instruction.
tracei next Trace each instruction, but skip over calls.
tracei at address Trace the given code address.
256 Debugging a Program With dbx • November 2005

For SPARC:
Setting Breakpoints at the Machine-Instruction LevelTo set a breakpoint at the machine-instruction level, use the stopi command. Thecommand accepts any event specification, using the syntax:
Commonly used forms of the stopi command are:
For more information, see “stopi Command” on page 383.
(dbx) tracei next -in main(dbx) cont0x00010814: main+0x0004: clr %l00x00010818: main+0x0008: st %l0, [%fp - 0x8]0x0001081c: main+0x000c: call foo0x00010820: main+0x0010: nop0x00010824: main+0x0014: clr %l0........(dbx) (dbx) tracei step -in foo -if glob == 0(dbx) cont0x000107dc: foo+0x0004: mov 0x2, %l10x000107e0: foo+0x0008: sethi %hi(0x20800), %l00x000107e4: foo+0x000c: or %l0, 0x1f4, %l0 ! glob0x000107e8: foo+0x0010: st %l1, [%l0]0x000107ec: foo+0x0014: ba foo+0x1c........
stopi event-specification [modifier]
stopi [at address] [-if cond]stopi in function [-if cond]
Chapter 18 Debugging at the Machine-Instruction Level 257

Setting a Breakpoint at an AddressTo set a breakpoint at a specific address, type:
For example:
Using the adb CommandThe adb command lets you enter commands in an adb(1) syntax. You can also enteradb mode which interprets every command as adb syntax. Most adb commands aresupported.
For more information, see “adb Command” on page 303.
Using the regs CommandThe regs command lets you print the value of all the registers.
Here is the syntax for the regs command:
-f includes floating point registers (single precision). -F includes floating pointregisters (double precision).
For more information, see “regs Command” on page 366.
(dbx) stopi at address
(dbx) nextistopped in hand::ungrasp at 0x12638(dbx) stopi at &hand::ungrasp(3) stopi at &hand::ungrasp(dbx)
regs [-f][-F]
258 Debugging a Program With dbx • November 2005

For SPARC based systems:
For x64 based systems:
dbx[13] regs -Fcurrent thread: t@1current frame: [1]g0-g3 0x00000000 0x0011d000 0x00000000 0x00000000g4-g7 0x00000000 0x00000000 0x00000000 0x00020c38o0-o3 0x00000003 0x00000014 0xef7562b4 0xeffff420o4-o7 0xef752f80 0x00000003 0xeffff3d8 0x000109b8l0-l3 0x00000014 0x0000000a 0x0000000a 0x00010a88l4-l7 0xeffff438 0x00000001 0x00000007 0xef74df54i0-i3 0x00000001 0xeffff4a4 0xeffff4ac 0x00020c00i4-i7 0x00000001 0x00000000 0xeffff440 0x000108c4y 0x00000000psr 0x40400086pc 0x000109c0:main+0x4 mov 0x5, %l0npc 0x000109c4:main+0x8 st %l0, [%fp - 0x8]f0f1 +0.00000000000000e+00f2f3 +0.00000000000000e+00f4f5 +0.00000000000000e+00f6f7 +0.00000000000000e+00...
(dbx) regscurrent frame: [1]r15 0x0000000000000000r14 0x0000000000000000r13 0x0000000000000000r12 0x0000000000000000r11 0x0000000000401b58r10 0x0000000000000000r9 0x0000000000401c30r8 0x0000000000416cf0rdi 0x0000000000416cf0rsi 0x0000000000401c18rbp 0xfffffd7fffdff820rbx 0xfffffd7fff3fb190rdx 0x0000000000401b50rcx 0x0000000000401b54rax 0x0000000000416cf0trapno 0x0000000000000003err 0x0000000000000000rip 0x0000000000401709:main+0xf9movl$0x0000000000000000,0xfffffffffffffffc(%rbp)cs 0x000000000000004b
Chapter 18 Debugging at the Machine-Instruction Level 259

eflags 0x0000000000000206rsp 0xfffffd7fffdff7b0ss 0x0000000000000043fs 0x00000000000001bbgs 0x0000000000000000es 0x0000000000000000ds 0x0000000000000000fsbase 0xfffffd7fff3a2000gsbase 0xffffffff80000000(dbx) regs -Fcurrent frame: [1]r15 0x0000000000000000r14 0x0000000000000000r13 0x0000000000000000r12 0x0000000000000000r11 0x0000000000401b58r10 0x0000000000000000r9 0x0000000000401c30r8 0x0000000000416cf0rdi 0x0000000000416cf0rsi 0x0000000000401c18rbp 0xfffffd7fffdff820rbx 0xfffffd7fff3fb190rdx 0x0000000000401b50rcx 0x0000000000401b54rax 0x0000000000416cf0trapno 0x0000000000000003err 0x0000000000000000rip 0x0000000000401709:main+0xf9movl$0x0000000000000000,0xfffffffffffffffc(%rbp)cs 0x000000000000004beflags 0x0000000000000206rsp 0xfffffd7fffdff7b0ss 0x0000000000000043fs 0x00000000000001bbgs 0x0000000000000000es 0x0000000000000000ds 0x0000000000000000fsbase 0xfffffd7fff3a2000gsbase 0xffffffff80000000st0 +0.00000000000000000000e+00st1 +0.00000000000000000000e+00st2 +0.00000000000000000000e+00st3 +0.00000000000000000000e+00st4 +0.00000000000000000000e+00st5 +0.00000000000000000000e+00st6 +0.00000000000000000000e+00st7 +NaNxmm0a-xmm0d 0x00000000 0xfff80000 0x00000000 0x00000000
260 Debugging a Program With dbx • November 2005

Platform-Specific RegistersThe following tables list platform-specific register names for SPARC architecture, x86architecture, and AMD64 architecture that can be used in expressions.
SPARC Register Information
The following register information is for SPARC architecture.
xmm1a-xmm1d 0x00000000 0x00000000 0x00000000 0x00000000xmm2a-xmm2d 0x00000000 0x00000000 0x00000000 0x00000000xmm3a-xmm3d 0x00000000 0x00000000 0x00000000 0x00000000xmm4a-xmm4d 0x00000000 0x00000000 0x00000000 0x00000000xmm5a-xmm5d 0x00000000 0x00000000 0x00000000 0x00000000xmm6a-xmm6d 0x00000000 0x00000000 0x00000000 0x00000000xmm7a-xmm7d 0x00000000 0x00000000 0x00000000 0x00000000xmm8a-xmm8d 0x00000000 0x00000000 0x00000000 0x00000000xmm9a-xmm9d 0x00000000 0x00000000 0x00000000 0x00000000xmm10a-xmm10d 0x00000000 0x00000000 0x00000000 0x00000000xmm11a-xmm11d 0x00000000 0x00000000 0x00000000 0x00000000xmm12a-xmm12d 0x00000000 0x00000000 0x00000000 0x00000000xmm13a-xmm13d 0x00000000 0x00000000 0x00000000 0x00000000xmm14a-xmm14d 0x00000000 0x00000000 0x00000000 0x00000000xmm15a-xmm15d 0x00000000 0x00000000 0x00000000 0x00000000fcw-fsw 0x137f 0x0000fctw-fop 0x0000 0x0000frip 0x0000000000000000frdp 0x0000000000000000mxcsr 0x00001f80mxcr_mask 0x0000ffff(dbx)
Register Description
$g0 through $g7 Global registers
$o0 through $o7 “out” registers
$l0 through $l7 “local” registers
$i0 through $i7 “in” registers
$fp Frame pointer, equivalent to register $i6
$sp Stack pointer, equivalent to register $o6
$y Y register
Chapter 18 Debugging at the Machine-Instruction Level 261

The $f0f1 $f2f3 ... $f30f31 pairs of floating-point registers are treated as havingC “double” type (normally $fN registers are treated as C “float” type). These pairscan also be referred to as $d0 ... $d30.
The following additional registers are available on SPARC V9 and V8+ hardware:
See the SPARC Architecture Reference Manual and the SPARC Assembly LanguageReference Manual for more information on SPARC registers and addressing.
x86 Register InformationThe following register information is for x86 architecture.
$psr Processor state register
$wim Window invalid mask register
$tbr Trap base register
$pc Program counter
$npc Next program counter
$f0 through $f31 FPU “f” registers
$fsr FPU status register
$fq FPU queue
$g0g1 through $g6g7$o0o1 through $o6o7$xfsr $tstate $gsr$f32f33 $f34f35 through $f62f63 ($d32 ... $$d62)
Register Description
$gs Alternate data segment register
$fs Alternate data segment register
$es Alternate data segment register
$ds Data segment register
$edi Destination index register
$esi Source index register
$ebp Frame pointer
Register Description
262 Debugging a Program With dbx • November 2005

Commonly used registers are also aliased to their machine independent names.
Registers for the 80386 lower halves (16 bits) are:
$esp Stack pointer
$ebx General register
$edx General register
$ecx General register
$eax General register
$trapno Exception vector number
$err Error code for exception
$eip Instruction pointer
$cs Code segment register
$eflags Flags
$uesp User stack pointer
$ss Stack segment register
Register Description
$SP Stack pointer; equivalent of $uesp
$pc Program counter; equivalent of $eip
$fp Frame pointer; equivalent of $ebp
Register Description
$ax General register
$cx General register
$dx General register
$bx General register
$si Source index register
$di Destination index register
$ip Instruction pointer, lower 16 bits
$flags Flags, lower 16 bits
Register Description
Chapter 18 Debugging at the Machine-Instruction Level 263

The first four 80386 16-bit registers can be split into 8-bit parts:
Registers for the 80387 are:
AMD64 Register InformationThe following register information is for AMD64 architecture:
Register Description
$al Lower (right) half of register $ax
$ah Higher (left) half of register $ax
$cl Lower (right) half of register $cx
$ch Higher (left) half of register $cx
$dl Lower (right) half of register $dx
$dh Higher (left) half of register $dx
$bl Lower (right) half of register $bx
$bh Higher (left) half of register $bx
Register Description
$fctrl Control register
$fstat Status register
$ftag Tag register
$fip Instruction pointer offset
$fcs Code segment selector
$fopoff Operand pointer offset
$fopsel Operand pointer selector
$st0 through$st7
Data registers
Register Description
rax General purpose register - argument passing for function calls
rbx General purpose register - callee-saved
rcx General purpose register - argument passing for function calls
rdx General purpose register - argument passing for function calls
264 Debugging a Program With dbx • November 2005

rbp General purpose register - stack management/frame pointer
rsi General purpose register - argument passing for function calls
rdi General purpose register - argument passing for function calls
rsp General purpose register - stack management/stack pointer
r8 General purpose register - argument passing for function calls
r9 General purpose register - argument passing for function calls
r10 General purpose register - temporary
r11 General purpose register - temporary
r12 General purpose register - callee-saved
r13 General purpose register - callee-saved
r14 General purpose register - callee-saved
r15 General purpose register - callee-saved
rflags Flags register
rip Instruction pointer
mmx0/st0 64-bit media and floating point register
mmx1/st1 64-bit media and floating point register
mmx2/st2 64-bit media and floating point register
mmx3/st3 64-bit media and floating point register
mmx4/st4 64-bit media and floating point register
mmx5/st5 64-bit media and floating point register
mmx6/st6 64-bit media and floating point register
mmx7/st7 64-bit media and floating point register
xmm0 128-bit media register
xmm1 128-bit media register
xmm2 128-bit media register
xmm3 128-bit media register
xmm4 128-bit media register
xmm5 128-bit media register
xmm6 128-bit media register
xmm7 128-bit media register
xmm8 128-bit media register
Register Description
Chapter 18 Debugging at the Machine-Instruction Level 265

xmm9 128-bit media register
xmm10 128-bit media register
xmm11 128-bit media register
xmm12 128-bit media register
xmm13 128-bit media register
xmm14 128-bit media register
xmm15 128-bit media register
cs Segment register
os Segment register
es Segment register
fs Segment register
gs Segment register
ss Segment register
fcw fxsave and fxstor memory image control word
fsw fxsave and fxstor memory image status word
ftw fxsave and fxstor memory image tag word
fop fxsave and fxstor memory image last x87 op code
frip fxsave and fxstor memory image 64-bit offset into the codesegment
frdp fxsave and fxstor memory image 64-bit offset into the datesegment
mxcsr fxsave and fxstor memory image 128 media instruction controland status register
mxcsr_mask set bits in mxcsr_mask indicate supported feature bits in mxcsr
Register Description
266 Debugging a Program With dbx • November 2005

CHAPTER 19
Using dbx With the Korn Shell
The dbx command language is based on the syntax of the Korn Shell (ksh 88),including I/O redirection, loops, built-in arithmetic, history, and command-lineediting. This chapter lists the differences between ksh-88 and dbx commandlanguage.
If no dbx initialization file is located on startup, dbx assumes ksh mode.
This chapter is organized into the following sections:
■ ksh-88 Features Not Implemented■ Extensions to ksh-88■ Renamed Commands
ksh-88 Features Not ImplementedThe following features of ksh-88 are not implemented in dbx:
■ set -A name for assigning values to array name
■ set -o particular options: allexport bgnice gmacs markdirs noclobbernolog privileged protected viraw
■ typeset -l -u -L -R -H attributes
■ backquote (`…`) for command substitution (use $(...) instead)
■ [ [ expression ] ] compound command for expression evaluation
■ @(pattern[|pattern] …) extended pattern matching
■ co-processes (command or pipeline running in the background thatcommunicates with your program)
267

Extensions to ksh-88dbx adds the following features as extensions:
■ $[ p –> flags ] language expression■ typeset -q enables special quoting for user-defined functions■ csh-like history and alias arguments■ set +o path disables path searching■ 0xabcd C syntax for octal and hexadecimal numbers■ bind to change Emacs-mode bindings■ set -o hashall■ set -o ignore suspend■ print -e and read -e (opposite of -r, raw)■ built-in dbx commands
Renamed CommandsParticular dbx commands have been renamed to avoid conflicts with kshcommands.
■ The dbx print command retains the name print; the ksh print command hasbeen renamed kprint.
■ The ksh kill command has been merged with the dbx kill command.
■ The alias command is the ksh alias, unless in dbx compatibility mode.
■ address/format is now examine address/format.
■ /pattern is now search pattern.
■ ?pattern is now bsearch pattern.
268 Debugging a Program With dbx • November 2005
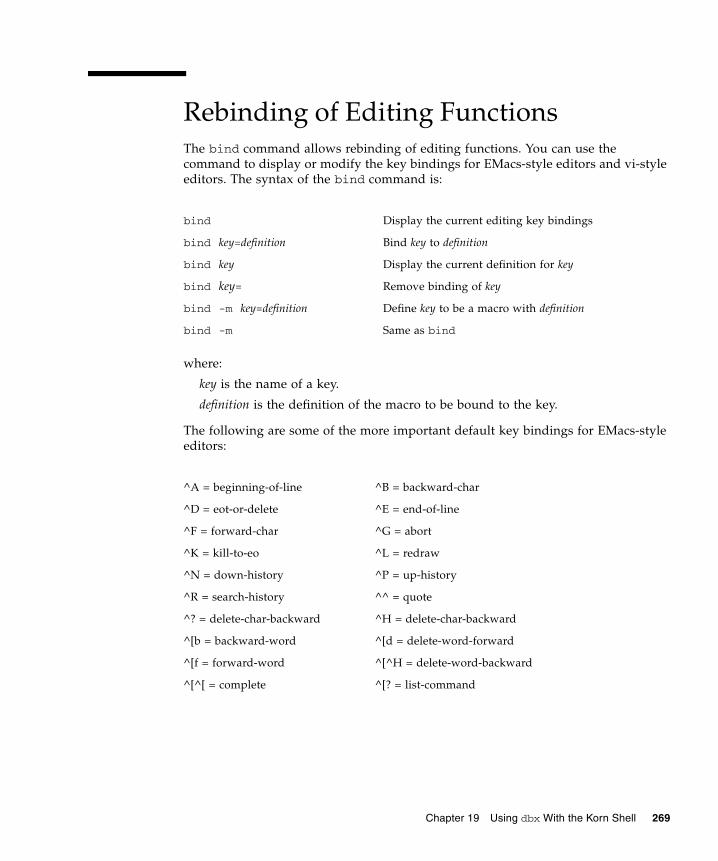
Rebinding of Editing FunctionsThe bind command allows rebinding of editing functions. You can use thecommand to display or modify the key bindings for EMacs-style editors and vi-styleeditors. The syntax of the bind command is:
where:
key is the name of a key.
definition is the definition of the macro to be bound to the key.
The following are some of the more important default key bindings for EMacs-styleeditors:
bind Display the current editing key bindings
bind key=definition Bind key to definition
bind key Display the current definition for key
bind key= Remove binding of key
bind -m key=definition Define key to be a macro with definition
bind -m Same as bind
^A = beginning-of-line ^B = backward-char
^D = eot-or-delete ^E = end-of-line
^F = forward-char ^G = abort
^K = kill-to-eo ^L = redraw
^N = down-history ^P = up-history
^R = search-history ^^ = quote
^? = delete-char-backward ^H = delete-char-backward
^[b = backward-word ^[d = delete-word-forward
^[f = forward-word ^[^H = delete-word-backward
^[^[ = complete ^[? = list-command
Chapter 19 Using dbx With the Korn Shell 269

The following are some of the more important default key bindings for vi-styleeditors:
In insert mode, the following keystrokes are special:
a = append A = append at EOL
c = change d = delete
G = go to line h = backward character
i = insert I = insert at BOL
j = next line k = previous line
l = forward line n = next match
N = prev match p = put after
P = put before r = repeat
R = replace s = substitute
u = undo x = delete character
X = delete previous character y = yank
~ = transpose case _ = last argument
* = expand = = list expansion
- = previous line + = next line
sp = forward char # = comment out command
? = search history from beginning
/ = search history from current
^? = delete character ^H = delete character
^U = kill line ^W = delete word
270 Debugging a Program With dbx • November 2005

CHAPTER 20
Debugging Shared Libraries
dbx provides full debugging support for programs that use dynamically-linked,shared libraries, provided that the libraries are compiled using the -g option.
This chapter is organized into the following sections:
■ Dynamic Linker■ Fix and Continue■ Setting Breakpoints in Shared Libraries■ Setting a Breakpoint in an Explicitly Loaded Library
Dynamic LinkerThe dynamic linker, also known as rtld, Runtime ld, or ld.so, arranges to bringshared objects (load objects) into an executing application. There are two primaryareas where rtld is active:
■ Program startup – At program startup, rtld runs first and dynamically loads allshared objects specified at link time. These are preloaded shared objects and mayinclude libc.so, libC.so, or libX.so. Use ldd(1) to find out which sharedobjects a program will load.
■ Application requests – The application uses the function calls dlopen(3) anddlclose(3) to dynamically load and unload shared objects or executables.
dbx uses the term loadobject to refer to a shared object (.so) or executable (a.out).You can use the loadobject command (see “loadobject Command” on page 349) tolist and manage symbolic information from loadobjects.
271

Link MapThe dynamic linker maintains a list of all loaded objects in a list called a link map.The link map is maintained in the memory of the program being debugged, and isindirectly accessed through librtld_db.so, a special system library for use bydebuggers.
Startup Sequence and .init SectionsA .init section is a piece of code belonging to a shared object that is executed whenthe shared object is loaded. For example, the .init section is used by the C++runtime system to call all static initializers in a .so.
The dynamic linker first maps in all the shared objects, putting them on the linkmap. Then, the dynamic linker traverses the link map and executes the .init sectionfor each shared object. The syncrtld event (see “syncrtld” on page 292) occursbetween these two phases.
Procedure Linkage TablesProcedure linkage tables (PLTs) are structures used by the rtld to facilitate callsacross shared object boundaries. For instance, calls to printf go through thisindirect table. The details of how this is done can be found in the generic andprocessor specific SVR4 ABI reference manuals.
For dbx to handle step and next commands across PLTs, it has to keep track of thePLT table of each load object. The table information is acquired at the same time asthe rtld handshake.
Fix and ContinueUsing fix and continue with shared objects loaded with dlopen() requires a changein how they are opened for fix and continue to work correctly. Use modeRTLD_NOW|RTLD_GLOBAL or RTLD_LAZY|RTLD_GLOBAL.
272 Debugging a Program With dbx • November 2005

Setting Breakpoints in Shared LibrariesTo set a breakpoint in a shared library, dbx needs to know that a program will usethat library when it runs, and dbx needs to load the symbol table for the library. Todetermine which libraries a newly-loaded program will use when it runs, dbxexecutes the program just long enough for the runtime linker to load all of thestarting libraries. dbx then reads the list of loaded libraries and kills the process. Thelibraries remain loaded and you can set breakpoints in them before rerunning theprogram for debugging.
dbx follows the same procedure for loading the libraries whether the program isloaded from the command line with the dbx command, from the dbx prompt withthe debug command, or from the dbx Debugger in the IDE.
Setting a Breakpoint in an ExplicitlyLoaded Librarydbx automatically detects that a dlopen() or a dlclose() has occurred and loadsthe symbol table of the loaded object. Once a shared object has been loaded withdlopen() you can place breakpoints in it and debug it as you would any part ofyour program.
If a shared object is unloaded using dlclose(), dbx remembers the breakpointsplaced in it and replaces them if the shared object is again loaded with dlopen(),even if the application is run again.
However, you do not need to wait for the loading of a shared object with dlopen()to place a breakpoint in it, or to navigate its functions and source code. If you knowthe name of the shared object that the program being debugged will be loading withdlopen(), you can request that dbx preload its symbol table by using theloadobject -load command:
You can now navigate the modules and functions in this loadobject and placebreakpoints in it before it has been loaded with dlopen(). Once the loadobject isloaded by your program, dbx automatically places the breakpoints.
loadobject -load /usr/java1.1/lib/libjava_g.so
Chapter 20 Debugging Shared Libraries 273

Setting a breakpoint in a dynamically linked library is subject to the followinglimitations:
■ You cannot set a breakpoint in a “filter” library loaded with dlopen() until thefirst function in it is called.
■ When a library is loaded by dlopen(), an initialization routine named _init()is called. This routine might call other routines in the library. dbx cannot placebreakpoints in the loaded library until after this initialization is completed. Inspecific terms, this means you cannot have dbx stop at _init() in a libraryloaded by dlopen().
274 Debugging a Program With dbx • November 2005

APPENDIX A
Modifying a Program State
This appendix focuses on dbx usage and commands that change your program orchange the behavior of your program when you run it under dbx, as compared torunning it without dbx. It is important to understand which commands might makemodifications to your program.
The chapter is divided into the following sections:
■ Impacts of Running a Program Under dbx■ Commands That Alter the State of the Program
Impacts of Running a Program UnderdbxYour application might behave differently when run under dbx. Although dbxstrives to minimize its impact on the program being debugged, you should be awareof the following:
■ You might have forgotten to take out a -C or disable RTC. Having the RTCsupport library librtc.so loaded into a program can cause the program tobehave differently.
■ Your dbx initialization scripts might have some environment variables set thatyou've forgotten about. The stack base starts at a different address when runningunder dbx. This is also different based on your environment and the contents ofargv[], forcing local variables to be allocated differently. If they're notinitialized, they will get different random numbers. This problem can be detectedusing runtime checking.
■ The program does not initialize memory allocated with malloc() before use; asituation similar to the previous one. This problem can be detected using runtimechecking.
275

■ dbx has to catch LWP creation and dlopen events, which might affecttiming-sensitive multithreaded applications.
■ dbx does context switching on signals, so if your application makes heavy use ofsignals, things might work differently.
■ Your program might be expecting that mmap() always returns the same baseaddress for mapped segments. Running under dbx perturbs the address spacesufficiently to make it unlikely that mmap() returns the same address as when theprogram is run without dbx. To determine if this is a problem, look at all uses ofmmap() and ensure that the address returned is used by the program, rather thana hard-coded address.
■ If the program is multithreaded, it might contain data races or be otherwisedependent upon thread scheduling. Running under dbx perturbs threadscheduling and may cause the program to execute threads in a different orderthan normal. To detect such conditions, use lock_lint.
Otherwise, determine whether running with adb or truss causes the sameproblems.
To minimize perturbations imposed by dbx, try attaching to the application while itis running in its natural environment.
Commands That Alter the State of theProgram
assign CommandThe assign command assigns the value of the expression to variable. Using it in dbxpermanently alters the value of variable.
assign variable = expression
276 Debugging a Program With dbx • November 2005

pop CommandThe pop command pops a frame or frames from the stack:
Any calls popped are re-executed upon resumption, which might result in unwantedprogram changes. pop also calls destructors for objects local to the poppedfunctions.
For more information, see “pop Command” on page 361.
call CommandWhen you use the call command in dbx, you call a procedure and the procedureperforms as specified:
The procedure could modify something in your program. dbx is making the call asif you had written it into your program source.
For more information, see “call Command” on page 306.
print CommandTo print the value of the expression(s), type:
If an expression has a function call, the same considerations apply as with the callcommand. With C++, you should also be careful of unexpected side effects causedby overloaded operators.
For more information, see “print Command” on page 362.
pop Pop current frame.
pop number Pop number frames.
pop -f number Pop frames until specified frame number.
call proc([params])
print expression, ...
Appendix A Modifying a Program State 277

when CommandThe when command has a general syntax as follows:
When the event occurs, the commands are executed.
When you get to a line or to a procedure, a command is performed. Depending uponwhich command is issued, this could alter your program state.
For more information, see “when Command” on page 400.
fix CommandYou can use the fix command to make immediate changes to your program:
Although it is a very useful tool, the fix command recompiles modified source filesand dynamically links the modified functions into the application.
Make sure to check the restrictions for fix and continue. See Chapter 10.
For more information, see “fix Command” on page 336.
cont at CommandThe cont at command alters the order in which the program runs. Execution iscontinued at line line. id is required if the program is multithreaded.
This could change the outcome of the program.
when event-specification [modifier] {command; ... }
fix
cont at line [ id ]
278 Debugging a Program With dbx • November 2005

APPENDIX B
Event Management
Event management refers to the capability of dbx to perform actions when eventstake place in the program being debugged. When an event occurs, dbx allows you tostop a process, execute arbitrary commands, or print information. The simplestexample of an event is a breakpoint (see Chapter 6). Examples of other events arefaults, signals, system calls, calls to dlopen(), and data changes (see “Setting DataChange Breakpoints” on page 106).
This appendix is organized into the following sections:
■ Event Handlers■ Creating Event Handlers■ Manipulating Event Handlers■ Using Event Counters■ Setting Event Specifications■ Event Specification Modifiers■ Parsing and Ambiguity■ Using Predefined Variables■ Setting Event Handler Examples
Event HandlersEvent management is based on the concept of a handler. The name comes from ananalogy with hardware interrupt handlers. Each event management commandtypically creates a handler, which consists of an event specification and a series ofside-effect actions. (See “Setting Event Specifications” on page 281.) The eventspecification specifies the event that will trigger the handler.
279

When the event occurs and the handler is triggered, the handler evaluates the eventaccording to any modifiers included in the event specification. (See “EventSpecification Modifiers” on page 293.) If the event meets the conditions imposed bythe modifiers, the handler’s side-effect actions are performed (that is, the handler“fires”).
An example of the association of a program event with a dbx action is setting abreakpoint on a particular line.
The most generic form of creating a handler is by using the when command.
Examples in this chapter show how you can write a command (like stop, step, orignore) in terms of when. These examples are meant to illustrate the flexibility ofwhen and the underlying handler mechanism, but they are not always exactreplacements.
Creating Event HandlersUse the commands when, stop, and trace to create event handlers. (For detailedinformation, see “when Command” on page 400, “stop Command” on page 378,and “trace Command” on page 390.)
stop is shorthand for a common when idiom.
An event-specification is used by the event management commands stop, when, andtrace to specify an event of interest. (see “Setting Event Specifications” onpage 281).
Most of the trace commands can be handcrafted using the when command, kshfunctionality, and event variables. This is especially useful if you want stylizedtracing output.
Every command returns a number known as a handler id (hid). You can access thisnumber using the predefined variable $newhandlerid.
when event-specification {action; ... }
when event-specification { stop -update; whereami; }
280 Debugging a Program With dbx • November 2005
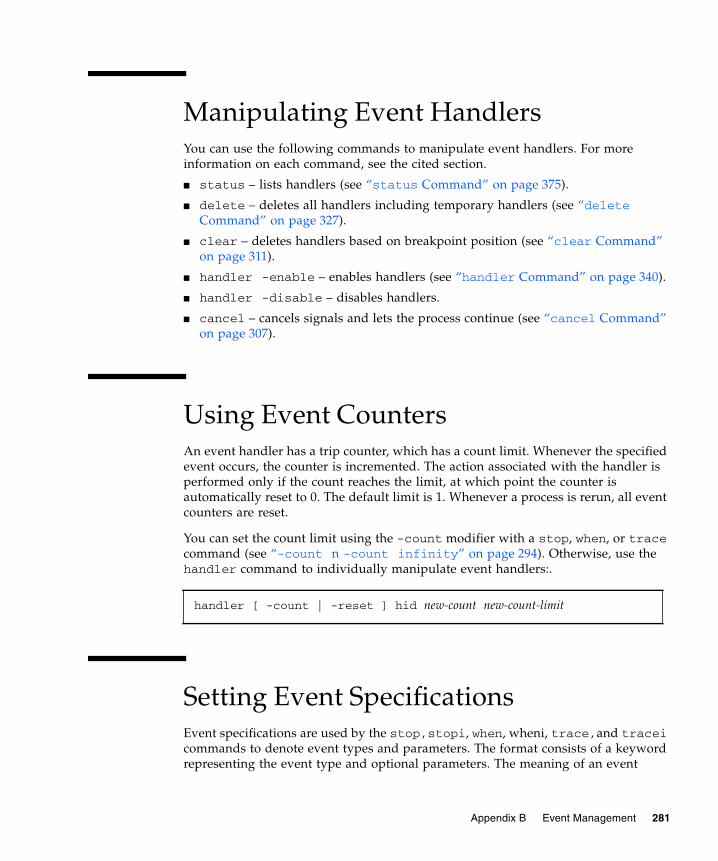
Manipulating Event HandlersYou can use the following commands to manipulate event handlers. For moreinformation on each command, see the cited section.
■ status – lists handlers (see “status Command” on page 375).
■ delete – deletes all handlers including temporary handlers (see “deleteCommand” on page 327).
■ clear – deletes handlers based on breakpoint position (see “clear Command”on page 311).
■ handler -enable – enables handlers (see “handler Command” on page 340).
■ handler -disable – disables handlers.
■ cancel – cancels signals and lets the process continue (see “cancel Command”on page 307).
Using Event CountersAn event handler has a trip counter, which has a count limit. Whenever the specifiedevent occurs, the counter is incremented. The action associated with the handler isperformed only if the count reaches the limit, at which point the counter isautomatically reset to 0. The default limit is 1. Whenever a process is rerun, all eventcounters are reset.
You can set the count limit using the -count modifier with a stop, when, or tracecommand (see “-count n -count infinity” on page 294). Otherwise, use thehandler command to individually manipulate event handlers:.
Setting Event SpecificationsEvent specifications are used by the stop,stopi, when, wheni, trace,and traceicommands to denote event types and parameters. The format consists of a keywordrepresenting the event type and optional parameters. The meaning of an event
handler [ -count | -reset ] hid new-count new-count-limit
Appendix B Event Management 281

specification is generally identical for all three commands; exceptions aredocumented in the command descriptions (see “stop Command” on page 378,“trace Command” on page 390, and “when Command” on page 400).
Breakpoint Event SpecificationsA breakpoint is a location where an action occurs, at which point the program stopsexecuting. The following are event specifications for breakpoint events.
in function
The function has been entered, and the first line is about to be executed. The firstexecutable code after the prolog is used as the actual breakpoint location. This maybe a line where a local variable is being initialized. In the case of C++ constructors,execution stops after all base class constructors have executed. If the -instrmodifier is used (see “-instr” on page 295), it is the first instruction of the functionabout to be executed. The function specification can take a formal parametersignature to help with overloaded function names or template instance specification.For example:
Note – Do not confuse in function with the -in function modifier.
at [filename:]line_number
The designated line is about to be executed. If you specify filename, then thedesignated line in the specified file is about to be executed. The file name can be thename of a source file or an object file. Although quotation marks are not required,they may be necessary if the file name contains special characters. If the designatedline is in template code, a breakpoint is placed on all instances of that template.
at address_expression
The instruction at the given address is about to be executed. This event is availableonly with the stopi command (see “stopi Command” on page 383) or with the-instr event modifier (see “-instr” on page 295).
stop in mumble(int, float, struct Node *)
282 Debugging a Program With dbx • November 2005

infunction function
Equivalent to in function for all overloaded functions named function or all templateinstantiations thereof.
inmember functioninmethod function
Equivalent to in function or the member function named function for every class.
inclass classname [-recurse | -norecurse]
Equivalent to in function for all member functions that are members of classname,but not any of the bases of classname. -norecurse is the default. If -recurse isspecified, the base classes are included.
inobject object-expression [-recurse | -norecurse]
A member function called on the specific object at the address denoted by object-expression has been called. stop inobject ox is roughly equivalent to thefollowing, but unlike inclass, bases of the dynamic type of ox are included. -recurse is the default. If -norecurse is specified, the base classes are notincluded.
Data Change Event SpecificationsThe following are event specifications for events that involve access or change to thecontents of a memory address.
access mode address-expression [, byte-size-expression]
The memory specified by address-expression has been accessed.
stop inclass dynamic_type(ox) -if this==ox
Appendix B Event Management 283

mode specifies how the memory was accessed. It can be composed of one or all of theletters:
mode can also contain either of the following:
In both cases the program counter will point at the offending instruction. The“before” and “after” refer to the side effect.
address-expression is any expression that can be evaluated to produce an address. Ifyou give a symbolic expression, the size of the region to be watched is automaticallydeduced; you can override it by specifying byte-size-expression. You can also usenonsymbolic, typeless address expressions; in which case, the size is mandatory. Forexample:
The access command has the limitation that no two matched regions may overlap.
Note – The access event specification is a replacement for the modify eventspecification. .
change variable
The value of variable has changed. The change event is roughly equivalent to:
r The memory at the specified address has been read.
w The memory has been written to.
x The memory has been executed.
a Stops the process after the access (default).
b Stops the process before the access.
stop access w 0x5678, sizeof(Complex)
when step { if [ $last_value !=$[variable]] thenstop
elselast_value=$[variable]
}
284 Debugging a Program With dbx • November 2005

This event is implemented using single-stepping. For faster performance, use theaccess event (see “access mode address-expression [, byte-size-expression]” onpage 283).
The first time variable is checked causes one event, even though no change isdetected. This first event provides access to the initial value of variable. Subsequentdetected changes in the value of variable trigger additional events.
cond condition-expression
The condition denoted by condition-expression evaluates to true. You can specify anyexpression for condition-expression, but it must evaluate to an integral type. The condevent is roughly equivalent to:
stop step -if conditional_expression
System Event SpecificationsThe following are event specifications for system events.
dlopen [ lib-path ] | dlclose [ lib-path ]
These events occur after a dlopen() or a dlclose() call succeeds. A dlopen() ordlclose() call can cause more than one library to be loaded. The list of theselibraries is always available in the predefined variable $dllist. The first shell wordin $dllist is a “+” or a “-”, indicating whether the list of libraries is being added ordeleted.
lib-path is the name of a shared library. If it is specified, the event occurs only if thegiven library was loaded or unloaded. In that case, $dlobj contains the name of thelibrary. $dllist is still available.
If lib-path begins with a /, a full string match is performed. Otherwise, only the tailsof the paths are compared.
If lib-path is not specified, then the events always occur whenever there is anydl-activity. In this case, $dlobj is empty but $dllist is valid.
Appendix B Event Management 285

fault fault
The fault event occurs when the specified fault is encountered. The faults arearchitecture-dependent. The following set of faults known to dbx is defined in theproc(4) man page.
Note – BPT, TRACE, and BOUNDS are used by dbx to implement breakpoints andsingle-stepping. Handling them might interfere with how dbx works.
These faults are taken from /sys/fault.h. fault can be any of those listed above, inuppercase or lowercase, with or without the FLT- prefix, or the actual numericalcode.
Note – The fault event is not available on Linux platforms.
lwp_exit
The lwp_exit event occurs when lwp has been exited. $lwp contains the id of theexited LWP (lightweight process) for the duration of the event handler.
Fault Description
FLTILL Illegal instruction
FLTPRIV Privileged instruction
FLTBPT* Breakpoint trap
FLTTRACE* Trace trap (single step)
FLTACCESS Memory access (such as alignment)
FLTBOUNDS Memory bounds (invalid address)
FLTIOVF Integer overflow
FLTIZDIV Integer zero divide
FLTPE Floating-point exception
FLTSTACK Irrecoverable stack fault
FLTPAGE Recoverable page fault
FLTWATCH* Watchpoint trap
FLTCPCOVF CPU performance counter overflow
286 Debugging a Program With dbx • November 2005

Note – The lwpexit event is not available on Linux platforms.
sig signal
The sig signal event occurs when the signal is first delivered to the program beingdebugged. signal can be either a decimal number or the signal name in uppercase orlowercase; the prefix is optional. This is completely independent of the catch andignore commands, although the catch command can be implemented as follows:
Note – When the sig event is received, the process has not seen it yet. Only if youcontinue the process with the specified signal is the signal forwarded to it.
sig signal sub-code
When the specified signal with the specified sub-code is first delivered to the child,the sig signal sub-code event occurs. As with signals, you can type the sub-code as adecimal number, in uppercase or lowercase; the prefix is optional.
sysin code | name
The specified system call has just been initiated, and the process has entered kernelmode.
The concept of system call supported by dbx is that provided by traps into thekernel as enumerated in /usr/include/sys/syscall.h.
This is not the same as the ABI notion of system calls. Some ABI system calls arepartially implemented in user mode and use non-ABI kernel traps. However, most ofthe generic system calls (the main exception being signal handling) are the samebetween syscall.h and the ABI.
function simple_catch {when sig $1 {
stop;echo Stopped due to $sigstr $sigwhereami
}}
Appendix B Event Management 287

Note – The sysin event is not available on Linux platforms.
Note – The list of kernel system call traps in /usr/include/sys/syscall.h ispart of a private interface in the Solaris operating environment that changes fromrelease to release. The list of trap names (codes) and trap numbers that dbx acceptsincludes all of those supported by any of the versions of the Solaris operatingenvironment that dbx supports. It is unlikely that the names supported by dbxexactly match those of any particular release of the Solaris operating environment,and some of the names in syscall.h might not be available. Any trap number(code) is accepted by dbx and works as expected, but a warning is issued if it doesnot correspond to a known system call trap.
sysout code | name
The specified system call is finished, and the process is about to return to user mode.
Note – The sysout event is not available on Linux platforms.
sysin | sysout
Without arguments, all system calls are traced. Certain dbx features, for example,the modify event and runtime checking, cause the child to execute system calls forits own purposes and show up if traced.
Execution Progress Event SpecificationsThe following are event specifications for events pertaining to execution progress.
exit exitcode
The exit event occurs when the process has exited.
288 Debugging a Program With dbx • November 2005

next
The next event is similar to the step event except that functions are not steppedinto.
returns
The returns event is a breakpoint at the return point of the current visited function.The visited function is used so that you can use the returns event specificationafter giving a number of step up commands. The returns event is always -tempand can only be created in the presence of a live process.
returns function
The returns function event executes each time the given function returns to its callsite. This is not a temporary event. The return value is not provided, but you canfind integral return values by accessing the following registers:
The event is roughly equivalent to:
step
The step event occurs when the first instruction of a source line is executed. Forexample, you can get simple tracing with:
When enabling a step event, you instruct dbx to single step automatically next timethe cont command is used.
SPARC based systems $o0
x86 based systems $eax
x64 based systems $rax, $rdx
when in func { stop returns; }
when step { echo $lineno: $line; }; cont
Appendix B Event Management 289

Note – The step (and next) events do not occur upon the termination of the stepcommand. The step command is implemented in terms of the step event roughlyas follows:
alias step="when step -temp { whereami; stop; }; cont"
Other Event SpecificationsThe following are event specifications for other types of events.
attach
dbx has successfully attached to a process.
detach
dbx has successfully detached from the program being debugged.
lastrites
The process being debugged is about to expire, which can happen for the followingreasons:
■ The _exit(2) system call has been called. (This happens either through anexplicit call or when main() returns.)
■ A terminating signal is about to be delivered.
■ The process is being killed by the kill command.
The final state of the process is usually, but not always, available when this event istriggered, giving you your last opportunity to examine the state of the process.Resuming execution after this event terminates the process.
Note – The lastrites event is not available on Linux platforms.
290 Debugging a Program With dbx • November 2005
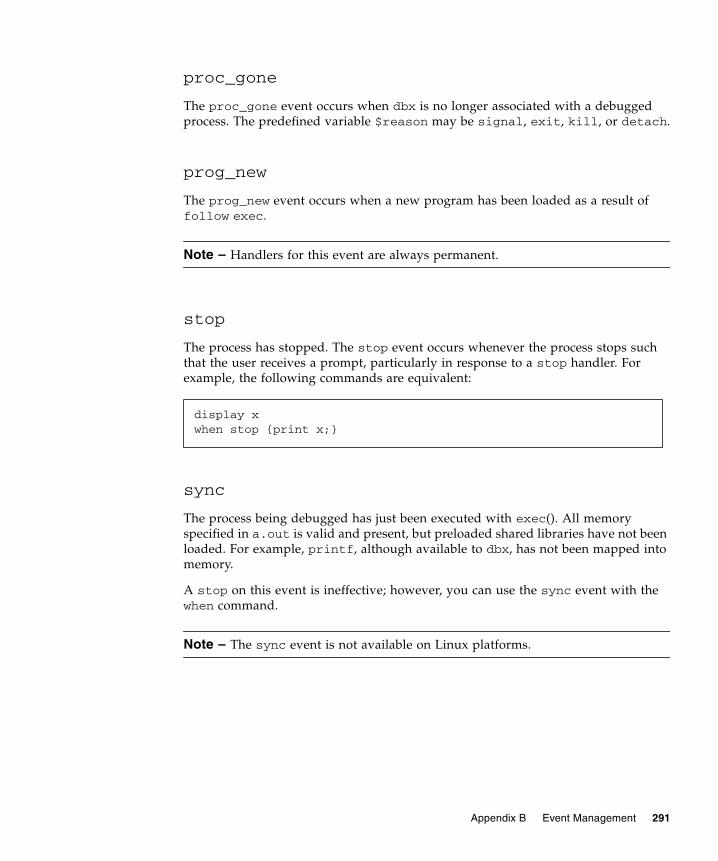
proc_gone
The proc_gone event occurs when dbx is no longer associated with a debuggedprocess. The predefined variable $reason may be signal, exit, kill, or detach.
prog_new
The prog_new event occurs when a new program has been loaded as a result offollow exec.
Note – Handlers for this event are always permanent.
stop
The process has stopped. The stop event occurs whenever the process stops suchthat the user receives a prompt, particularly in response to a stop handler. Forexample, the following commands are equivalent:
sync
The process being debugged has just been executed with exec(). All memoryspecified in a.out is valid and present, but preloaded shared libraries have not beenloaded. For example, printf, although available to dbx, has not been mapped intomemory.
A stop on this event is ineffective; however, you can use the sync event with thewhen command.
Note – The sync event is not available on Linux platforms.
display xwhen stop {print x;}
Appendix B Event Management 291

syncrtld
The syncrtld event occurs after a sync (or attach if the process being debuggedhas not yet processed shared libraries). It executes after the dynamic linker startupcode has executed and the symbol tables of all preloaded shared libraries have beenloaded, but before any code in the .init section has run.
A stop on this event is ineffective; however, you can use the syncrtld event withthe when command.
thr_create [thread_id]
The thr_create event occurs when a thread, or a thread with the specifiedthread_id, has been created. For example, in the following stop command, the threadID t@1 refers to creating thread, while the thread ID t@5 refers to the created thread.
thr_exit
The thr_exit event occurs when a thread has exited. To capture the exit of aspecific thread, use the -thread option of the stop command as follows:
throw
The throw event occurs whenever any exception that is not unhandled orunexpected is thrown by the application.
Note – The throw event is not available on Linux platforms.
throw type
If an exception type is specified with the throw event, only exceptions of that typecause the throw event to occur.
stop thr_create t@5 -thread t@1
stop thr_exit -thread t@5
292 Debugging a Program With dbx • November 2005

throw -unhandled
-unhandled is a special exception type signifying an exception that is thrown butfor which there is no handler.
throw -unexpected
-unexpected is a special exception type signifying an exception that does notsatisfy the exception specification of the function that threw it.
timer seconds
The timer event occurs when the program being debugged has been running forseconds. The timer used with this event is shared with collector command. Theresolution is in milliseconds, so a floating point value for seconds, for example0.001, is acceptable.
Event Specification ModifiersAn event specification modifier sets additional attributes of a handler, the mostcommon kind being event filters. Modifiers must appear after the keyword portionof an event specification. A modifier begins with a dash (-). The following are thevalid event specification modifiers.
-if condition
The condition is evaluated when the event specified by the event specificationoccurs. The side effect of the handler is allowed only if the condition evaluates tononzero.
If the -if modifier is used with an event that has an associated singular sourcelocation, such as in or at, condition is evaluated in the scope corresponding to thatlocation. Otherwise, qualify it with the desired scope.
Appendix B Event Management 293

-resumeone
The -resumeone modifier can be used with the -if modifier in an eventspecification for a multithreaded program, and causes only one thread to beresumed if the condition contains function calls. For more information, see “Using aFilter With a Conditional Event” on page 110.
-in function
The event triggers only if it occurs between the time the first instruction of the givenfunction is reached and the time the function returns. Recursion on the function areignored.
-disable
The -disable modifier creates the handler in the disabled state.
-count n-count infinity
The -count n and -count infinity modifiers have the handler count from 0 (see“Using Event Counters” on page 281). Each time the event occurs, the count isincremented until it reaches n. Once that happens, the handler fires and the counteris reset to zero.
Counts of all enabled handlers are reset when a program is run or rerun. Morespecifically, they are reset when the sync event occurs.
The count is reset when you begin debugging a new program with the debug -rcommand (see “debug Command” on page 324) or the attach -r command (see“attach Command” on page 304).
-temp
Creates a temporary handler. Once the event has occurred it is automatically deleted.By default, handlers are not temporary. If the handler is a counting handler, it isautomatically deleted only when the count reaches 0 (zero).
Use the delete -temp command to delete all temporary handlers.
294 Debugging a Program With dbx • November 2005

-instr
Makes the handler act at an instruction level. This event replaces the traditional 'i'suffix of most commands. It usually modifies two aspects of the event handler:
■ Any message prints assembly-level rather than source-level information.
■ The granularity of the event becomes instruction level. For instance, step-instr implies instruction-level stepping.
-thread thread_id
The action is executed only if the thread that caused the event matches thread_id. Thespecific thread you have in mind might be assigned a different thread_id from oneexecution of the program to the next.
-lwp lwp_id
The action is executed only if the thread that caused the event matches lwp_id. Theaction is executed only if the thread that caused the event matches lwp_id. Thespecific thread you have in mind might be assigned a different lwp_id from oneexecution of the program to the next.
-hidden
Hides the handler in a regular status command. Use status -h to see hiddenhandlers.
-perm
Normally all handlers are thrown away when a new program is loaded. Using the-perm modifier retains the handler across debugging sessions. A plain deletecommand does not delete a permanent handler. Use delete -p to delete apermanent handler.
Parsing and AmbiguityThe syntax for event specifications and modifiers is:
■ Keyword driven
Appendix B Event Management 295

■ Based on ksh conventions; everything is split into words delimited by spaces
Expressions can have spaces embedded in them, causing ambiguous situations. Forexample, consider the following two commands:
In the first example, even though the application might have a variable named temp,the dbx parser resolves the event specification in favor of -temp being a modifier. Inthe second example, a-temp is collectively passed to a language-specific expressionparser. There must be variables named a and temp or an error occurs. Useparentheses to force parsing.
Using Predefined VariablesCertain read-only ksh predefined variables are provided. The following variablesare always valid:
when a -tempwhen a-temp
Variable Definition
$ins Disassembly of the current instruction.
$lineno Current line number in decimal.
$vlineno Current “visiting” line number in decimal.
$line Contents of the current line.
$func Name of the current function.
$vfunc Name of the current “visiting” function.
$class Name of the class to which $func belongs.
$vclass Name of the class to which $vfunc belongs.
$file Name of the current file.
$vfile Name of the current file being visited.
$loadobj Name of the current loadable object.
$vloadobj Name of the current loadable object being visited.
$scope Scope of the current PC in back-quote notation.
$vscope Scope of the visited PC in back-quote notation.
$funcaddr Address of $func in hex.
296 Debugging a Program With dbx • November 2005

As an example, consider that whereami can be implemented as:
Variables Valid for when CommandThe following variables are valid only within the body of a when command.
$caller Name of the function calling $func.
$dllist After a dlopen or dlclose event, contains the list of load objectsjust loaded or unloaded. The first word of dllist is a “+” or a “-”depending on whether a dlopen or a dlclose has occurred.
$newhandlerid ID of the most recently created handler. This variable has anundefined value after any command that deletes handlers. Use thevariable immediately after creating a handler. dbx cannot captureall of the handler IDs for a command that creates multiple handlers.
$firedhandlers List of handler ids that caused the most recent stoppage. Thehandlers on the list are marked with “*” in the output of thestatus command.
$proc Process ID of the current process being debugged.
$lwp Lwp ID of the current LWP.
$thread Thread ID of the current thread.
$newlwp lwp ID of a newly created LWP.
$newthread Thread ID of a newly created thread.
$prog Full path name of the program being debugged.
$oprog Previous value of $prog, which is used to get back to what youwere debugging following an exec(), when $prog reverts to “-”.While $prog is expanded to a full path name, $oprog contains theprogram path as specified on the command line or to the debugcommand. If exec() is called more than once, there is no way toreturn to the original program.
$exitcode Exit status from the last run of the program. The value is an emptystring if the process has not exited.
function whereami {echo Stopped in $func at line $lineno in file $(basename $file)
echo "$lineno\t$line"}
Variable Definition
Appendix B Event Management 297

$handlerid
During the execution of the body, $handlerid is the id of the when command towhich the body belongs. These commands are equivalent:
$booting
$booting is set to true if the event occurs during the boot process. Whenever anew program is debugged, it is first run without the user’s knowledge so that thelist and location of shared libraries can be ascertained. The process is then killed.This sequence is termed booting.
While booting is occurring, all events are still available. Use this variable todistinguish the sync and the syncrtld events occurring during a debug and theones occurring during a normal run.
$newlwp is set to the lwp-id of a newly created LWP.
$newthread
Variables Valid for Specific EventsCertain variables are valid only for specific events as shown in the following tables.
when X -temp { do_stuff; }when X { do_stuff; delete $handlerid; }
TABLE B-1 Variables Valid for sig Event
Variable Description
$sig Signal number that caused the event
$sigstr Name of $sig
$sigcode Subcode of $sig if applicable
$sigcodestr Name of $sigcode
$sigsender Process ID of sender of the signal, if appropriate
298 Debugging a Program With dbx • November 2005

Setting Event Handler ExamplesThe following are some examples of setting event handlers.
Setting a Breakpoint for Store to an ArrayMemberTo set a breakpoint on array[99], type:
TABLE B-2 Variable Valid for exit Event
Variable Description
$exitcode Value of the argument passed to _exit(2) or exit(3) or thereturn value of main
TABLE B-3 Variable Valid for dlopen and dlclose Events
Variable Description
$dlobj Pathname of the load object dlopened or dlclosed
TABLE B-4 Variables Valid for sysin and sysout Events
Variable Description
$syscode System call number
$sysname System call name
TABLE B-5 Variable Valid for proc_gone Events
Variable Description
$reason One of signal, exit, kill, or detach
(dbx) stop access w &array[99](2) stop access w &array[99], 4(dbx) runRunning: watch.x2watchpoint array[99] (0x2ca88[4]) at line 22 in file "watch.c" 22 array[i] = i;
Appendix B Event Management 299

Implementing a Simple TraceTo implement a simple trace, type:
Enabling a Handler While Within a Function (infunction)To enable a handler while within a function, type:
This is equivalent to:
Determining the Number of Lines ExecutedTo see how many lines have been executed in a small program, type:
(dbx) when step { echo at line $lineno; }
<dbx> trace step -in foo
# create handler in disabled state when step -disable { echo Stepped to $line; } t=$newhandlerid # remember handler id when in foo { # when entered foo enable the trace handler -enable "$t" # arrange so that upon returning from foo, # the trace is disabled. when returns { handler -disable "$t"; }; }
(dbx) stop step -count infinity # step and stop when count=inf(2) stop step -count 0/infinity(dbx) run...(dbx) status(2) stop step -count 133/infinity
300 Debugging a Program With dbx • November 2005
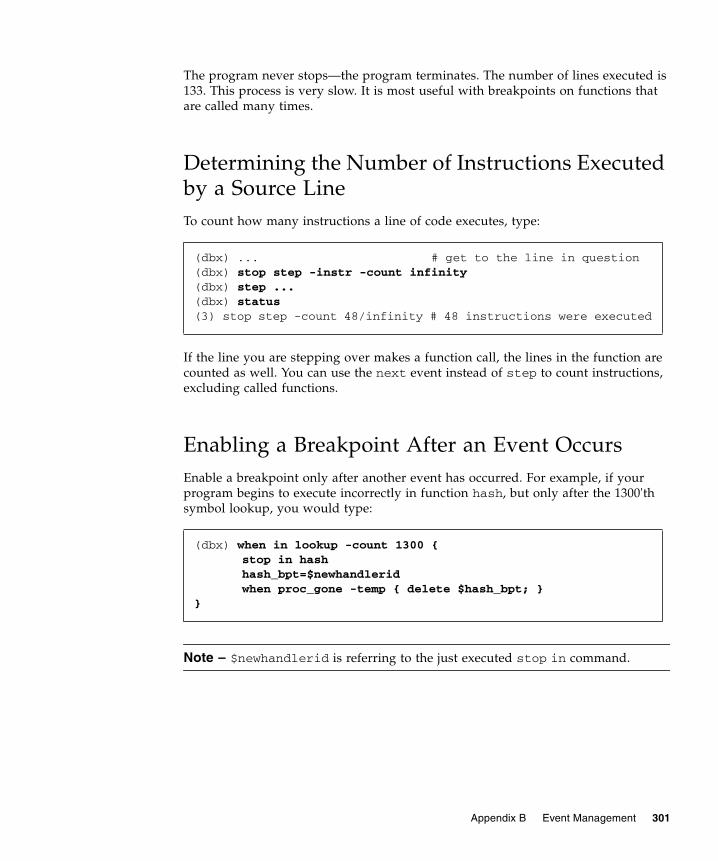
The program never stops—the program terminates. The number of lines executed is133. This process is very slow. It is most useful with breakpoints on functions thatare called many times.
Determining the Number of Instructions Executedby a Source LineTo count how many instructions a line of code executes, type:
If the line you are stepping over makes a function call, the lines in the function arecounted as well. You can use the next event instead of step to count instructions,excluding called functions.
Enabling a Breakpoint After an Event OccursEnable a breakpoint only after another event has occurred. For example, if yourprogram begins to execute incorrectly in function hash, but only after the 1300'thsymbol lookup, you would type:
Note – $newhandlerid is referring to the just executed stop in command.
(dbx) ... # get to the line in question(dbx) stop step -instr -count infinity(dbx) step ...(dbx) status(3) stop step -count 48/infinity # 48 instructions were executed
(dbx) when in lookup -count 1300 {stop in hashhash_bpt=$newhandleridwhen proc_gone -temp { delete $hash_bpt; }
}
Appendix B Event Management 301
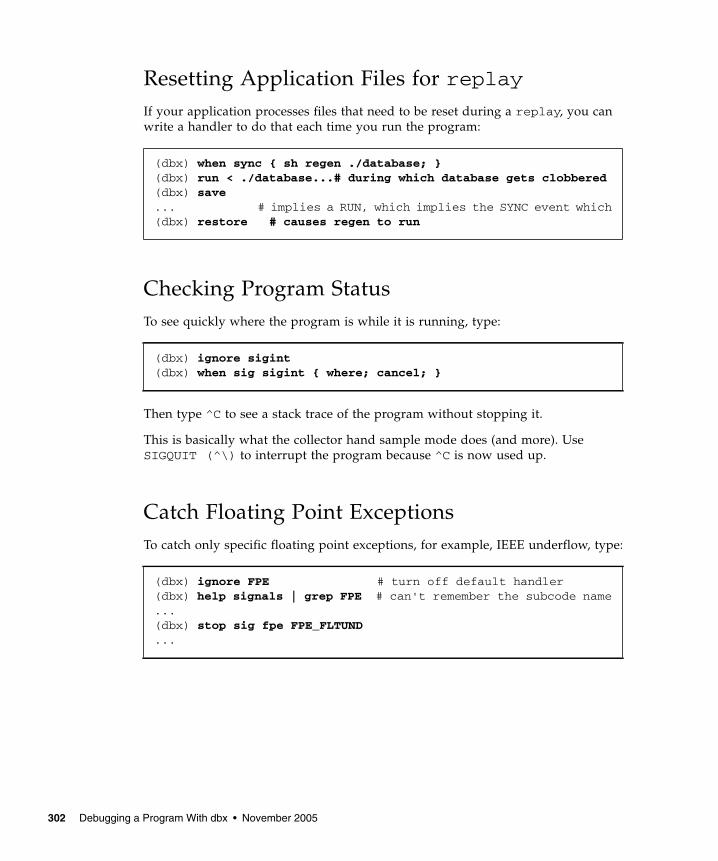
Resetting Application Files for replayIf your application processes files that need to be reset during a replay, you canwrite a handler to do that each time you run the program:
Checking Program StatusTo see quickly where the program is while it is running, type:
Then type ^C to see a stack trace of the program without stopping it.
This is basically what the collector hand sample mode does (and more). UseSIGQUIT (^\) to interrupt the program because ^C is now used up.
Catch Floating Point ExceptionsTo catch only specific floating point exceptions, for example, IEEE underflow, type:
(dbx) when sync { sh regen ./database; }(dbx) run < ./database...# during which database gets clobbered(dbx) save... # implies a RUN, which implies the SYNC event which(dbx) restore # causes regen to run
(dbx) ignore sigint(dbx) when sig sigint { where; cancel; }
(dbx) ignore FPE # turn off default handler(dbx) help signals | grep FPE # can't remember the subcode name...(dbx) stop sig fpe FPE_FLTUND...
302 Debugging a Program With dbx • November 2005

APPENDIX C
Command Reference
This appendix gives detailed syntax and functional descriptions of all of the dbxcommands.
adb CommandThe adb command executes an adb-style command or sets adb mode. It is valid onlyin native mode.
Syntax
assign CommandIn native mode, the assign command assigns a new value to a program variable. InJava mode, the assign command assigns a new value to a local variable orparameter.
adb adb-command Executes an adb-style command.
adb Sets adb mode; use $q to exit adb mode.
303

Native Mode Syntax
assign variable = expression
where:
expression is the value to be assigned to variable.
Java Mode Syntax
assign identifier = expression
where:
class_name is the name of a Java class, using either the package path (using period(.) as a qualifier; for example, test1.extra.T1.Inner) or the full path name(preceded by a pound sign (#) and using slash (/) and dollar sign ($) as qualifiers;for example, #test1/extra/T1$Inner). Enclose class_name in quotation marksif you use the $ qualifier.
expression is a valid Java expression.
field_name is the name of a field in the class.
identifier is a local variable or parameter, including this, the current classinstance variable (object_name.field_name) or a class (static) variable(class_name.field_name).
object_name is the name of a Java object.
attach CommandThe attach command attaches dbx to a running process, stopping execution andputting the program under debugging control. It has identical syntax and identicalfunctionality in native mode and Java mode.
304 Debugging a Program With dbx • November 2005

Syntax
where:
process_id is the process ID of a running process.
program_name is the path name of the running program.
To attach to a running Java process:
1. Ensure that the JVM™ software can find libdbx_agent.so by addinglibdbx_agent.so to your LD_LIBRARY_PATH. libdbx_agent.so:
■ If you are using the 32-bit version of the JVM software on a system running theSolaris OS, add /installation_directory/prod/lib/dbxruntime toLD_LIBRARY_PATH.
■ If you are using the 64-bit version of the JVM software on a SPARC based systemrunning the Solaris OS, add /installation_directory/prod/lib/v9/dbxruntimeto LD_LIBRARY_PATH.
■ If you are using the 64-bit version of the JVM software on an x64 based systemrunning the Linux OS, add/installation_directory/prod/lib/amd64/dbxruntime to LD_LIBRARY_PATH.
The installation_directory is the location where the Sun Studio software is installed.
2. Start your Java application by typing:
java -Djava.compiler=NONE -Xdebug -Xnoagent -Xrundbx_agentmyclass.class
3. Then you can attach to the process by starting dbx with the process id:
dbx -process_id
attach process_id Begin debugging the program with process ID process_id.dbx finds the program using /proc.
attach -p process_idprogram_name
Begin debugging program with process ID process_id.
attach program_nameprocess_id
Begin debugging program with process ID process_id.program may be -; dbx finds it using /proc.
attach -r ... The -r option causes dbx to retain all display, trace,when, and stop commands. With no -r option, animplicit delete all and undisplay 0 are performed.
Appendix C Command Reference 305

bsearch CommandThe bsearch command searches backward in the current source file. It is valid onlyin native mode.
Syntax
where:
string is a character string.
call CommandIn native mode, the call command calls a procedure. In Java mode, the callcommand calls a method.
Native Mode Syntax
call procedure([parameters])
where:
procedure is the name of the procedure.
parameters are the procedure’s parameters.
You can also use the call command to call a function; to see the return value usethe print command (see “print Command” on page 362).
Occasionally the called function hits a breakpoint. You can choose to continue usingthe cont command (see “cont Command” on page 320), or abort the call by usingpop -c (see “pop Command” on page 361). The latter is useful also if the calledfunction causes a segmentation fault.
bsearch string Search backward for string in the current file.
bsearch Repeat search, using the last search string.
306 Debugging a Program With dbx • November 2005

Java Mode Syntax
call [class_name.|object_name.]method_name([parameters])
where:
class_name is the name of a Java class, using either the package path (using period(.) as a qualifier for example, test1.extra.T1.Inner) or the full path name(preceded by a pound sign (#) and using slash (/) and dollar sign ($) as qualifiers;for example, #test1/extra/T1$Inner). Enclose class_name in quotation marksif you use the $ qualifier.
object_name is the name of a Java object.
method_name is the name of a Java method.
parameters are the method’s parameters.
Occasionally the called method hits a breakpoint. You can choose to continue usingthe cont command (see “cont Command” on page 320), or abort the call by usingpop -c (see “pop Command” on page 361). The latter is useful also if the calledmethod causes a segmentation fault.
cancel CommandThe cancel command cancels the current signal. It is primarily used within thebody of a when command (see “when Command” on page 400). It is valid only innative mode.
Signals are normally cancelled when dbx stops because of a signal. If a whencommand is attached to a signal event, the signal is not automatically cancelled. Thecancel command can be used to explicitly cancel the signal.
Syntax
cancel
Appendix C Command Reference 307

catch CommandThe catch command catches the given signal(s). It is valid only in native mode.
Catching a given signal causes dbx to stop the program when the process receivesthat signal. If you continue the program at that point, the signal is not processed bythe program.
Syntax
where:
number is the number of a signal.
signal is the name of a signal.
check CommandThe check command enables checking of memory access, leaks, or usage, and printsthe current status of runtime checking (RTC). It is valid only in native mode.
Note – The check command is available only on Solaris platforms.
The features of runtime checking that are enabled by this command are reset to theirinitial state by the debug command.
catch Print a list of the caught signals.
catch number number... Catch signal(s) numbered number.
catch signal signal... Catch signal(s) named by signal. SIGKILL cannot becaught or ignored.
catch $(ignore) Catch all signals.
308 Debugging a Program With dbx • November 2005

Syntax
check -access
Turn on access checking. RTC reports the following errors:
The default behavior is to stop the process after detecting each access error, whichcan be changed using the rtc_auto_continue dbx environment variable. Whenset to on access errors are logged to a file (the file name is controlled by the dbxenvironment variable rtc_error_log_file_name). See “dbxenv Command”on page 324.
By default each unique access error is only reported the first time it happens.Change this behavior using the dbx environment variable rtc_auto_suppress(the default setting of this variable is on). See “dbxenv Command” on page 324.
baf Bad free
duf Duplicate free
maf Misaligned free
mar Misaligned read
maw Misaligned write
oom Out of memory
rua Read from unallocated memory
rui Read from uninitialized memory
wro Write to read-only memory
wua Write to unallocated memory
Appendix C Command Reference 309

check -leaks [-frames n] [-match m]
Turn on leak checking. RTC reports the following errors:
With leak checking turned on, you get an automatic leak report when theprogram exits. All leaks including possible leaks are reported at that time. Bydefault, a non-verbose report is generated (controlled by the dbx environmentvariable rtc_mel_at_exit). However, you can ask for a leak report at any time(see “showleaks Command” on page 373).
-frames n implies that up to n distinct stack frames are displayed whenreporting leaks. -match m is used for combining leaks; if the call stack at thetime of allocation for two or more leaks matches n frames, then these leaks arereported in a single combined leak report.
The default value of n is 8 or the value of m (whichever is larger). Maximumvalue of n is 16. The default value of m is 3 for C++, and 2 otherwise.
check -memuse [-frames n] [-match m]
Turn on memory use (memuse) checking. check -memuse also implies check -leaks. In addition to a leak report at program exit, you also get a blocks in use(biu) report. By default a non-verbose blocks in use report is generated (controlledby the dbx environment variable rtc_biu_at_exit) At any time duringprogram execution you can see where the memory in your program has beenallocated (see “showmemuse Command” on page 374).
-frames n implies that up to n distinct stack frames will be displayed whilereporting memory use and leaks. -match m is used for combining these reports;if the call stack at the time of allocation for two or more leaks matches m frames,then these are reported in a single combined memory leak report.
The default value of n is 8 or the value of m (whichever is larger). Maximumvalue of n is 16. The default value of m is 3 for C++, and 2 otherwise. See check-leaks as well.
check -all [-frames n] [-match m]
Equivalent to check -access or check -memuse [-frames n] [-matchm]
The value of the dbx environment variable rtc_biu_at_exit is not changedwith check -all, so by default no memory use report is generated at exit. See“dbx Command” on page 321 for the description of the rtc_biu_at_exitenvironment variable.
aib Possible memory leak - only pointer points in the middle of the block
air Possible memory leak - pointer to the block exists only in register
mel Memory leak - no pointers to the block
310 Debugging a Program With dbx • November 2005

check [functions] [files] [loadobjects]
Equivalent to check -all; suppress all; unsuppress all in functions,files, and loadobjects
where:
functions is one or more function names.
files is one or more file names.
loadobjects is one or more loadobject names
You can use this to focus runtime checking on places of interest.
Note – To detect all errors, RTC does not require the program be compiled -g.However, symbolic (-g) information is sometimes needed to guarantee thecorrectness of certain errors (mostly read from uninitialized memory). For thisreason certain errors (rui for a.out and rui + aib + air for shared libraries)are suppressed if no symbolic information is available. This behavior can be changedby using suppress and unsuppress.
clear CommandThe clear command clears breakpoints. It is valid only in native mode.
Event handlers created using the stop, trace, or when command with theinclass, inmethod, or infunction argument create sets of breakpoints. If the lineyou specify in the clear command matches one of these breakpoints, only thatbreakpoint is cleared. Once cleared in this manner an individual breakpointbelonging to a set cannot be enabled again. However, disabling and then enablingthe relevant event handler will reestablish all the breakpoints.
Syntax
clear Clear all breakpoints at the current stopping point.
clear line Clear all breakpoints at line.
clear filename:line Clear all breakpoints at line in filename.
Appendix C Command Reference 311

where:
line is the number of a source code line.
filename is the name of a source code file.
collector CommandThe collector command collects performance data for analysis by thePerformance Analyzer. It is valid only in native mode.
Note – The collector command is available only on Solaris platforms.
Syntax
collector command_list Specify one or more of the collector commands
archive options Specify the mode for archiving an experiment when itterminates (see “collector archive Command” onpage 313).
dbxsample options Control the collection of samples when dbx stops the targetprocess (see “collector dbxsample Command” onpage 314).
disable Stop data collection and close the current experiment (see“collector disable Command” on page 314).
enable Enable the collector and open a new experiment (see“collector enable Command” on page 314).
heaptrace options Enable or disable collection of heap tracing data (see“collector heaptrace Command” on page 315)
hwprofile options Specify hardware counter profiling settings (see “collectorhwprofile Command” on page 315).
limit options Limit the amount of profiling data recoreded (see“collector limit Command” on page 316).
mpitrace options Enables or disables collection of MPI tracing data (see“collector mpitrace Command” on page 316).
pause Stop collecting performance data but leave experiment open(see “collector pause Command” on page 316).
312 Debugging a Program With dbx • November 2005

where:
options are the settings that can be specified with each command.
To start collecting data, type either collector enable.
To turn off data collection, type collector disable.
collector archive CommandThe collector archive command specifies the archiving mode to be used whenthe experiment terminates.
profile options Specify settings for collecting callstack profiling data (see“collector profile Command” on page 317).
resume Start performance data collection after pause (see“collector resume Command” on page 317).
sample options Specify sampling settings (see “collector sampleCommand” on page 317).
show options Show current collector settings (see “collector showCommand” on page 318).
status Inquire status about current experiment (see “collectorstatus Command” on page 318).
store options Experiment file control and settings (see “collector storeCommand” on page 319).
synctrace options Specify settings for collecting thread synchronization waittracing data (see “collector synctrace Command” onpage 319).
version Report the version of libcollector.so that would be usedto collect data (see ).
Appendix C Command Reference 313

Syntax
collector dbxsample CommandThe collector dbxsample command specifies whether or not to record a samplewhen the process is stopped by dbx.
Syntax
collector disable CommandThe collector disable command causes the data collection to stop and thecurrent experiment to be closed.
Syntax
collector disable
collector enable CommandThe collector enable command enables the collector and opens a newexperiment.
Syntax
collector enable
collector archiveon|off|copy
By default, normal archiving is used. For no archiving,specify off. To copy loadobjects into the experiment forportability, specify copy.
collector dbxsampleon|off
By default, a sample is collected when the process isstopped by dbx. To not collect a sample at this time,specify off.
314 Debugging a Program With dbx • November 2005

collector heaptrace CommandThe collector heaptrace command specifies options for collecting heap tracing(memory allocation) data.
Syntax
collector hwprofile CommandThe collector hwprofile command specifies options for collecting hardware-counter overflow profiling data.
Syntax
where:
name is the name of a hardware counter.
interval is the collection interval in milliseconds.
name2 is the name of a second hardware counter.
interval2 is the collection interval in milliseconds.
Hardware counters are system-specific, so the choice of counters available to youdepends on the system you are using. Many systems do not support hardware-counter overflow profiling. On these machines, the feature is disabled.
collector heaptraceon|off
By default, heap tracing data is not collected. To collectthis data, specify on.
collector hwprofileon|off
By default, hardware-counter overflow profile data isnot collected. To collect this data, specify on.
collector hwprofile list Print out the list of available counters.
collector hwprofilecounter name interval [ name2interval2 ]
Specify hardware counter name(s) and interval(s).
Appendix C Command Reference 315

collector limit CommandThe collector limit command specifies the experiment file size limit.
Syntax
collector limit value
where:
value, in megabytes, limits the amount of profiling data recorded. When the limitis reached, no more profiling data is recorded but the experiment remains openand sample points continue to be recorded. The default limit on the amount ofdata recorded is 2000 Mbytes.
collector mpitrace CommandThe collector heaptrace command specifies options for collecting MPI tracingdata.
Syntax
collector pause CommandThe collector pause command causes the data collection to stop but leaves thecurrent experiment open. Sample points are not recorded while the Collector ispaused. A sample is generated prior to a pause, and another sample is generatedimmediately following a resum. Data collection can be resumed with thecollector resume command (see “collector resume Command” onpage 317).
Syntax
collector pause
collector mpitraceon|off
By default, MPI tracing data is not collected. To collectthis data, specify on.
316 Debugging a Program With dbx • November 2005

collector profile CommandThe collector profile command specifies options for collecting profile data.
Syntax
collector resume CommandThe collector resume command causes the data collection to resume after apause created by the collector pause command (see “collector pauseCommand” on page 316).
Syntax
collector resume
collector sample CommandThe collector sample command specifies the sampling mode and the samplinginterval.
Syntax
collector profileon|off
Specify profile data collection mode
collector profiletimer interval
Specify profile timer period, fixed or floating point, withan optional trailing m for milliseconds or u formicroseconds.
collector sampleperiodic|manual
Specify sampling mode.
collector sampleperiod seconds
Specify sampling interval in seconds.
collector samplerecord [ name ]
Record a sample with an optional name.
Appendix C Command Reference 317

where:
seconds is the length of the sampling interval.
name is the name of the sample.
collector show CommandThe collector show command shows the settings of one or more categories ofoptions.
Syntax
collector status CommandThe collector status command inquires about the status of the currentexperiment.
Syntax
collector status
collector show all Show all settings.
collector show archive Show archive setting.
collector show profile Show callstack profiling settings.
collector showsynctrace
Show thread synchronization wait tracing settings.
collector showhwprofile
Show hardware counter data settings.
collector showheaptrace
Show heap tracing data settings.
collector show limit Show experiment size limits.
collector showmpitrace
Show MPI trace data settings.
collector show sample Show sample settings.
collector show store Show store settings.
318 Debugging a Program With dbx • November 2005

collector store CommandThe collector store command specifies the directory and file name where anexperiment is stored.
Syntax
where:
pathname is the pathname of the directory where an experiment is to be stored.
filename is the name of the experiment file
string is the name of an experiment group.
collector synctrace CommandThe collector synctrace command specifies options for collectingsynchronization wait tracing data.
Syntax
where:
microseconds is the threshold below which synchronization wait events arediscarded.
collector storedirectory pathname
Specify directory where experiment is stored.
collector storefilename filename
Specify experiment file name.
collector store groupstring
Specify experiment group name
collector synctraceon|off
By default, thread synchronization wait tracing data isnot collected. To collect this data, specify on.
collector thresholdmicroseconds
Specify threshold in microseconds. The default value is1000.
collector thresholdcalibrate
Threshold value will be automatically calculated
Appendix C Command Reference 319

collector version CommandThe collector version command reports the version of libcollector.so thatwould be used to collect data.
Syntax
collector version
cont CommandThe cont command causes the process to continue execution. It has identical syntaxand identical functionality in native mode and Java mode.
Syntax
dalias CommandThe dalias command defines a dbx-style (csh-style) alias. It is valid only in nativemode.
cont Continue execution. In an MT process all threads areresumed. Use Control-C to stop executing the program.
cont ... -sig signal Continue execution with signal signal.
cont ... id The id specifies which thread or LWP to continue.
cont at line [ id ] Continue execution at line line. id is required if theapplication is multi-threaded.
cont ... -followparent|child|both
If the dbx follow_fork_mode environment variable is setto ask, and you have chosen stop, use this option tochoose which process to follow. both is only applicable inthe Sun Studio IDE.
320 Debugging a Program With dbx • November 2005

Syntax
where:
name is the name of an alias
definition is the definition of an alias.
dbx accepts the following csh history substitution meta-syntax, which is commonlyused in aliases:
!:<n>
!-<n>
!^
!$
!*
The ! usually needs to be preceded by a backslash. For example:
dalias goto "stop at \!:1; cont; clear"
For more information, see the csh(1) man page.
dbx CommandThe dbx command starts dbx.
dalias (dbx alias) List all currently defined aliases
dalias name List the definition, if any, of alias name.
dalias name definition Define name to be an alias for definition. definition maycontain white space. A semicolon or newline terminatesthe definition.
Appendix C Command Reference 321

Native Mode Syntax
where:
program_name is the name of the program to be debugged.
process_id is the process ID of a running process.
arguments are the arguments to be passed to the program.
options are the options listed in “Options” on page 323.
Java Mode Syntax
dbx options program_name Debug program_name.
dbx options program_namecore
Debug program_name with corefile core.
dbx options program_nameprocess_id
Debug program_name with process ID process_id.
dbx options - process_id Debug process ID process_id; dbx finds the program via/proc.
dbx options - core Debug using corefile core; see also “debug Command” onpage 324.
dbx options -rprogram_name arguments
Run program_name with arguments arguments; if abnormaltermination, start debugging program_name, else just exit.
dbx optionsprogram_name{.class |.jar}
Debug program_name.
dbx optionsprogram_name{.class |.jar} process_id
Debug program_name with process ID process_id.
dbx options - process_id Debug process ID process_id; dbx finds the program using/proc.
dbx options -rprogram_name{.class |.jar} arguments
Run program_name with arguments arguments; if abnormaltermination, start debugging program_name, else just exit.
322 Debugging a Program With dbx • November 2005

where:
program_name is the name of the program to be debugged.
process_id is the process ID of a running process.
arguments are the arguments to be passed to the program (not to the JVMsoftware).
options are the options listed in “Options” on page 323.
Options
For both native mode and Java mode, options are the following options:
-c commands Execute commands before prompting for input.
-C Preload the Runtime Checking library (see “check Command” onpage 308).
-d Used with -s, removes file after reading.
-e Echo input commands.
-f Force loading of core file, even if it doesn’t match.
-h Print the usage help on dbx.
-I dir Add dir to pathmap set (see “pathmap Command” on page 359).
-k Save and restore keyboard translation state.
-q Suppress messages about reading stabs.
-r Run program; if program exits normally, exit.
-R Print the readme file on dbx.
-s file Use file instead of /current_directory/.dbxrc or $HOME/.dbxrc asthe startup file
-S Suppress reading of initialization file/installation_directory/lib/dbxrc.
-V Print the version of dbx.
-w n Skip n frames on where command.
-x exec32 Run the 32-bit dbx binary instead of the 64-bit dbx binary that runs bydefault on systems running a 64-bit OS..
-- Marks the end of the option list; use this if the program name starts witha dash.
Appendix C Command Reference 323

dbxenv CommandThe dbxenv command is used to list or set dbx environment variables. It hasidentical syntax and identical functionality in native mode and Java mode.
Syntax
where:
environment_variable is a dbx environment variable.
setting is a valid setting for that variable.
debug CommandThe debug command lists or changes the program being debugged. In native mode,it loads the specified application and begins debugging the application. In Javamode, it loads the specified Java application, checks for the existence of the class file,and begins debugging the application.
Native Mode Syntax
dbxenv Display the current settings of the dbx environmentvariables.
dbxenv environment_variablesetting
Set environment_variable to setting.
debug Print the name and arguments of the program beingdebugged.
debug program_name Begin debugging program_name with no process or core.
debug -c coreprogram_name
Begin debugging program_name with core file core.
debug -p process_idprogram_name
Begin debugging program_name with process ID process_id.
324 Debugging a Program With dbx • November 2005

where:
core is the name of a core file.
options are the options listed in“Options” on page 326.
pid is the process ID of a running process.
program_name is the path name of the program.
Leaks checking and access checking are turned off when a program is loaded withthe debug command. You can enable them with the check command (see “checkCommand” on page 308).
Java Mode Syntax
debug program_name core Begin debugging program with core file core. program_namemay be -. dbx will attempt to extract the name of theexecutable from the core file. For details, see “Debugging aCore File” on page 50.
debug program_nameprocess_id
Begin debugging program_name with process ID process_id.program_name may be -; dbx finds it using /proc
debug -f ... Force loading of a core file, even if it doesn’t match.
debug -r ... The -r option causes dbx to retain all display, trace,when, and stop commands. With no -r option, an implicitdelete all and undisplay 0 are performed.
debug -clone ... The -clone option causes another dbx process to beginexecution, permitting debugging of more than one processat a time. Valid only if running under the dbx Debugger.
debug -clone Starts another dbx process debugging nothing. Valid onlyif running in the Sun Studio IDE.
debug [options] --program_name
Start debugging program, even if program_name begins witha dash.
debug Print the name and arguments of the program beingdebugged.
debugprogram_name{.class |.jar}
Begin debugging program_name with no process.
debug -p process_idprogram_name{.class |.jar}
Begin debugging program_name with process IDprocess_id.
Appendix C Command Reference 325

where:
file_name is the name of a file.
options are the options listed in“Options” on page 326.
process_id is the process ID of a running process.
program_name is the path name of the program.
Options
debugprogram_name{.class |.jar} process_id
Begin debugging program_name with process IDprocess_id. program_name may be -; dbx finds it using/proc
debug -r ... The -r option causes dbx to retain all display, trace,when, and stop commands. With no -r option, animplicit delete all and undisplay 0 are performed.
debug -clone ... The -clone option causes another dbx process to beginexecution, permitting debugging of more than oneprocess at a time. Valid only if running in the dbxDebugger window.
debug -clone Starts another dbx process debugging nothing. Valid onlyif if running in the Sun Studio IDE.
debug [options] --program_name{.class |.jar}
Start debugging program_name, even if program_namebegins with a dash.
-c commands Execute commands before prompting for input.
-d Used with -s, removes file_name after reading.
-e Echo input commands.
-h Print the usage help on dbx.
-I directory_name Add directory_name to pathmap set (see “pathmapCommand” on page 359).
-k Save and restore keyboard translation state.
-q Suppress messages about reading stabs.
-r Run program; if program exits normally, exit.
-R Print the readme file on dbx.
-s file Use file instead of /current_directory/.dbxrc or$HOME/.dbxrc as the startup file
326 Debugging a Program With dbx • November 2005

delete CommandThe delete command deletes breakpoints and other events. It has identical syntaxand identical functionality in native mode and Java mode.
Syntax
where:
handler_id is the identifier of a handler.
detach CommandThe detach command releases the target process from dbx’s control.
-S Suppress reading of initialization file/installation_directory/lib/dbxrc.
-V Print the version of dbx.
-w n Skip n frames on where command.
-- Marks the end of the option list; use this if theprogram name starts with a dash.
delete [-h] handler_id...
Remove trace commands, when commands, or stopcommands of given handler_id(s). To remove hidden handlers,you must give the -h option.
delete [-h] 0 | all |-all
Remove all trace commands, when commands, and stopcommands excluding permanent and hidden handlers.Specifying -h removes hidden handlers as well.
delete -temp Remove all temporary handlers
delete $firedhandlers Delete all the handlers that caused the latest stoppage.
Appendix C Command Reference 327

Native Mode Syntax
where:
signal is the name of a signal.
Java Mode Syntax
dis CommandThe dis command disassembles machine instructions. It is valid only in nativemode.
Syntax
detach Detach dbx from the target, and cancel any pendingsignals.
detach -sig signal Detach while forwarding the given signal.
detach -stop Detach dbx from the target and leave the process in astopped state. This option allows temporary applicationof other /proc-based debugging tools that might beblocked due to exclusive access. For an example, see“Detaching dbx From a Process” on page 95.
detach Detach dbx from the target, and cancel any pendingsignals.
dis address [/ count] Disassemble count instructions (default is 10), starting ataddress address.
dis address1, address2 Disassemble instructions from address1 through address2.
dis Disassemble 10 instructions, starting at the value of + (see“examine Command” on page 332).
dis /count Disassemble count instructions, starting at +.
328 Debugging a Program With dbx • November 2005

where:
address is the address at which to start disassembling. The default value of addressis the address after the last address previously assembled. This value is shared bythe examine command (see “examine Command” on page 332).
address1 is the address at which to start disassembling.
address2 is the address at which to stop disassembling.
count is the number of instructions to disassemble. The default value of count is10.
display CommandIn native mode, the display command evaluates and prints expressions at everystopping point. In Java mode, the display command evaluates and printsexpressions, local variables, or parameters at every stopping point. Object referencesare expanded to one level and arrays are printed itemwise.
Native Mode Syntax
where:
expression is a valid expression.
format is the output format you want used to print the expression. For informationon valid formats, see “print Command” on page 362.
display Print the list of expressions being displayed.
display expression, ... Display the value of expressions expression, ... at everystopping point.
display[-r|+r|-d|+d|-p|+p|-L|-fformat|-Fformat|--]expression,...
See the “print Command” on page 362 for the meaningof these flags.
Appendix C Command Reference 329

Java Mode Syntax
where:
class_name is the name of a Java class, using either the package path (using period(.) as a qualifier; for example, test1.extra.T1.Inner) or the full path name(preceded by a pound sign (#) and using slash (/) and dollar sign ($) as qualifiers;for example, #test1/extra/T1$Inner). Enclose class_name in quotation marksif you use the $ qualifier.
expression is a valid Java expression.
field_name is the name of a field in the class.
format is the output format you want used to print the expression. For informationon valid formats, see “print Command” on page 362.
identifier is a local variable or parameter, including this, the current classinstance variable (object_name.field_name) or a class (static) variable(class_name.field_name).
object_name is the name of a Java object.
down CommandThe down command moves down the call stack (away from main). It has identicalsyntax and identical functionality in native mode and Java mode.
display Print the list of variables and parameters beingdisplayed.
display expression |identifier, ...
Display the value of variables and parameters identifier,... at every stopping point.
display[-r|+r|-d|+d|-p|+p|
-fformat|-Fformat|--] expression | identifier,...
See the “print Command” on page 362 for themeaning of these flags.
330 Debugging a Program With dbx • November 2005

Syntax
where:
number is a number of call stack levels.
dump CommandThe dump command prints all variables local to a procedure. It has identical syntaxand identical functionality in native mode and Java mode.
Syntax
where:
procedure is the name of a procedure.
edit CommandThe edit command invokes $EDITOR on a source file. It is valid only in nativemode.
The edit command uses $EDITOR if dbx is not running in the Sun Studio IDE.Otherwise, it sends a message to the IDE to display the appropriate file.
down Move down the call stack one level.
down number Move down the call stack number levels.
down -h [number] Move down the call stack, but don’t skip hidden frames.
dump Print all variables local to the current procedure.
dump procedure Print all variables local to procedure.
Appendix C Command Reference 331
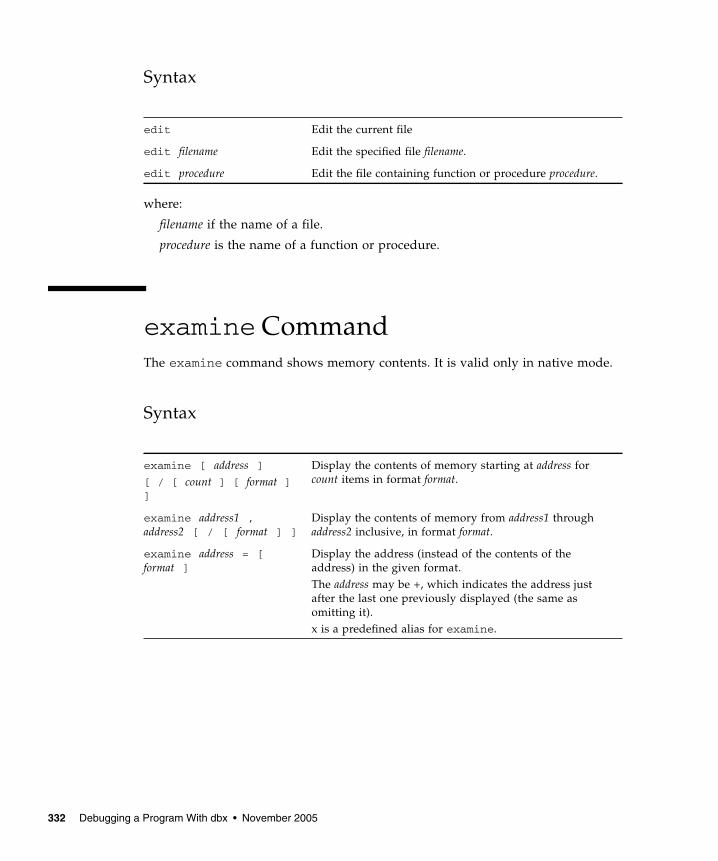
Syntax
where:
filename if the name of a file.
procedure is the name of a function or procedure.
examine CommandThe examine command shows memory contents. It is valid only in native mode.
Syntax
edit Edit the current file
edit filename Edit the specified file filename.
edit procedure Edit the file containing function or procedure procedure.
examine [ address ]
[ / [ count ] [ format ]]
Display the contents of memory starting at address forcount items in format format.
examine address1 ,address2 [ / [ format ] ]
Display the contents of memory from address1 throughaddress2 inclusive, in format format.
examine address = [format ]
Display the address (instead of the contents of theaddress) in the given format.The address may be +, which indicates the address justafter the last one previously displayed (the same asomitting it).x is a predefined alias for examine.
332 Debugging a Program With dbx • November 2005

where:
address is the address at which to start displaying memory contents. The defaultvalue of address is the address after the address whose contents were lastdisplayed. This value is shared by the dis command (see “dis Command” onpage 328).
address1 is the address at which to start displaying memory contents.
address2 is the address at which to stop displaying memory contents.
count is the number of addresses from which to display memory contents. Thedefault value of count is 1.
format is the format in which to display the contents of memory addresses. Thedefault format is X (hexadecimal) for the first examine command, and the formatspecified in the previous examine command for subsequent examinecommands. The following values are valid for format:
d,D decimal (2 or 4 bytes)
o,O octal (2 or 4 bytes)
x,X hexadecimal (2 or 4 bytes)
b octal (1 byte)
c character
w wide character
s string
W wide character string
f hex and float (4 bytes, 6 digit prec.)
F hex and float (8 bytes, 14 digit prec.)
g same as F’
E hex and float (16 bytes, 14 digit prec.)
ld,lD decimal (4 bytes, same as D)
lo,lO octal (4 bytes, same as O)
lx,lX hexadecimal (4 bytes, same as X)
Ld,LD decimal (8 bytes)
Lo,LO octal (8 bytes)
Lx,LX hexadecimal (8 bytes)
Appendix C Command Reference 333

exception CommandThe exception command prints the value of the current C++ exception. It is validonly in native mode.
Syntax
See the “print Command” on page 362 for the meaning of the -d flag.
exists CommandThe exists command checks for the existence of a symbol name. It is valid only innative mode.
Syntax
where:
name is the name of a symbol.
file CommandThe file command lists or changes the current file. It has identical syntax andidentical functionality in native mode and in Java mode.
exception [-d | +d] Prints the value of the current C++ exception, if any.
exists name Returns 0 if name is found in the current program, 1 if name is not found.
334 Debugging a Program With dbx • November 2005

Syntax
where:
filename is the name of a file.
files CommandIn native mode, the files command lists file names that match a regularexpression. In Java mode, the files command lists all of the Java source filesknown to dbx. If your Java source files are not in the same directory as the .class or.jar files, dbx might not find them unless you have set the $JAVASRCPATHenvironment variable (see “Specifying the Location of Your Java Source Files” onpage 237).
Native Mode Syntax
where:
regular_expression is a regular expression.
For example:
(dbx) files ^r
myprog:
retregs.cc
reg_sorts.cc
reg_errmsgs.cc
rhosts.cc
file Print the name of the current file.
file filename Change the current file.
files List the names of all files that contributed debugginginformation to the current program (those that were compiledwith -g).
files regular_expression List the names of all files compiled with -g that match the givenregular expression.
Appendix C Command Reference 335

Java Mode Syntax
fix CommandThe fix command recompiles modified source files and dynamically links themodified functions into the application. It is valid only in native mode. It is not validon Linux platforms.
Syntax
fixed CommandThe fixed command lists the names of all fixed files. It is valid only in native mode.
files List the names of all of the Java source files known todbx.
fix Fix the current file.
fix filename filename ... Fix filename.
fix -f Force fixing the file, even if source hasn’t been modified.
fix -a Fix all modified files.
fix -g Strip -O flags and add -g flag.
fix -c Print compilation line (may include some options addedinternally for use by dbx).
fix -n Do not execute compile/link commands (use with -v).
fix -v Verbose mode (overrides dbx fix_verbose environmentvariable setting).
fix +v Non-verbose mode (overrides dbx fix_verboseenvironment variable setting).
336 Debugging a Program With dbx • November 2005

Syntax
fixed
frame CommandThe frame command lists or changes the current stack frame number. It hasidentical syntax and identical functionality in native mode and in Java mode.
Syntax
where:
number is the number of a frame in the call stack.
func CommandIn native mode, the func command lists or changes the current function. In Javamode, the func command lists or changes the current method.
Native Mode Syntax
frame Display the frame number of the current frame.
frame [-h] number Set the current frame to frame number.
frame [-h] +[number] Go number frames up the stack; default is 1.
frame [-h] -[number] Go number frames down the stack; default is 1.
-h Go to frame, even if frame is hidden.
func Print the name of the current function.
func procedure Change the current function to the function or procedureprocedure.
Appendix C Command Reference 337
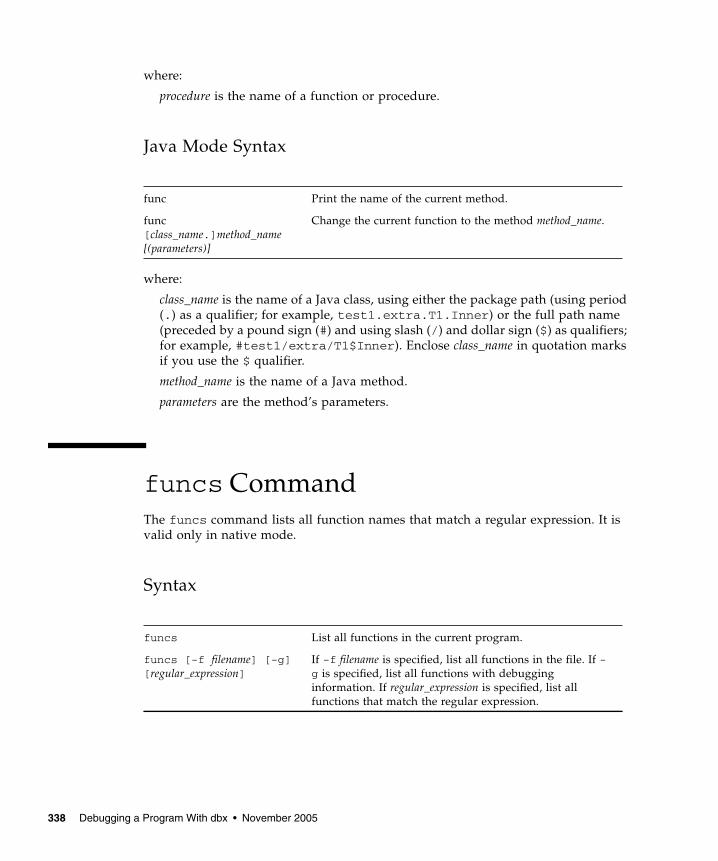
where:
procedure is the name of a function or procedure.
Java Mode Syntax
where:
class_name is the name of a Java class, using either the package path (using period(.) as a qualifier; for example, test1.extra.T1.Inner) or the full path name(preceded by a pound sign (#) and using slash (/) and dollar sign ($) as qualifiers;for example, #test1/extra/T1$Inner). Enclose class_name in quotation marksif you use the $ qualifier.
method_name is the name of a Java method.
parameters are the method’s parameters.
funcs CommandThe funcs command lists all function names that match a regular expression. It isvalid only in native mode.
Syntax
func Print the name of the current method.
func[class_name.]method_name[(parameters)]
Change the current function to the method method_name.
funcs List all functions in the current program.
funcs [-f filename] [-g][regular_expression]
If -f filename is specified, list all functions in the file. If -g is specified, list all functions with debugginginformation. If regular_expression is specified, list allfunctions that match the regular expression.
338 Debugging a Program With dbx • November 2005
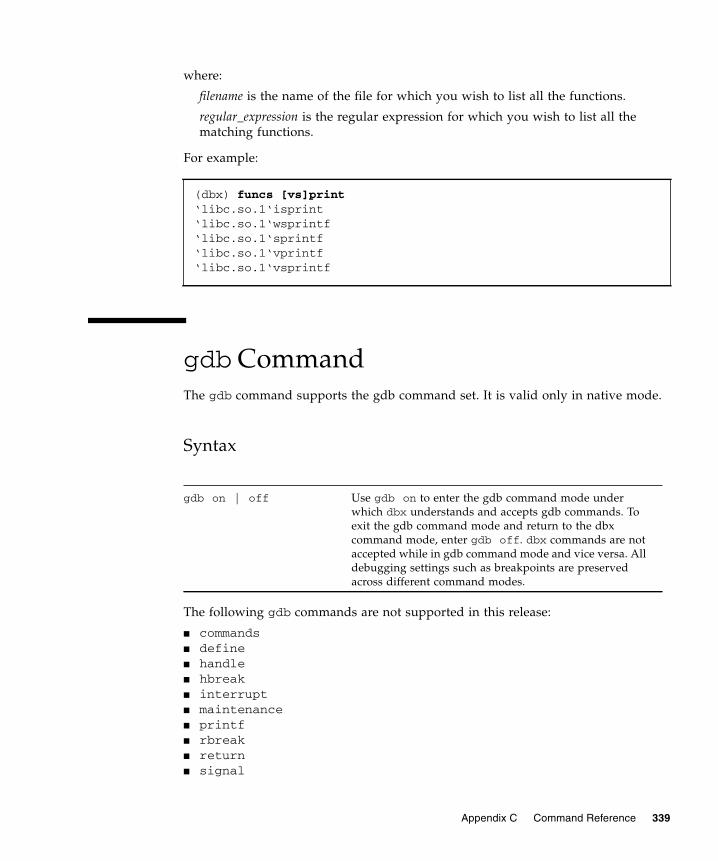
where:
filename is the name of the file for which you wish to list all the functions.
regular_expression is the regular expression for which you wish to list all thematching functions.
For example:
gdb CommandThe gdb command supports the gdb command set. It is valid only in native mode.
Syntax
The following gdb commands are not supported in this release:
■ commands■ define■ handle■ hbreak■ interrupt■ maintenance■ printf■ rbreak■ return■ signal
(dbx) funcs [vs]print‘libc.so.1‘isprint‘libc.so.1‘wsprintf‘libc.so.1‘sprintf‘libc.so.1‘vprintf‘libc.so.1‘vsprintf
gdb on | off Use gdb on to enter the gdb command mode underwhich dbx understands and accepts gdb commands. Toexit the gdb command mode and return to the dbxcommand mode, enter gdb off. dbx commands are notaccepted while in gdb command mode and vice versa. Alldebugging settings such as breakpoints are preservedacross different command modes.
Appendix C Command Reference 339

■ tcatch■ until
handler CommandThe handler command modifies event handlers (enable, disable, etc.). It hasidentical syntax and identical functionality in native mode and in Java mode.
A handler is created for each event that needs to be managed in a debuggingsession. The commands trace, stop, and when create handlers. Each of thesecommands returns a number known as the handler ID (handler_id). The handler,status, and delete commands manipulate or provide information about handlersin a generic fashion.
Syntax
where:
handler_id is the identifier of a handler.
hide CommandThe hide command hides stack frames that match a regular expression. It is validonly in native mode.
handler -enablehandler_id ...
Enable given handlers, specify handler_id as all for allhandlers.
handler -disablehandler_id ...
Disable given handlers, specify handler_id as all for allhandlers. Use $firedhandlers instead of handler_id todisable the handlers that caused the most recentstoppage.
handler -count handler_id Print value of trip counter for given handler.
handler -count handler_idnewlimit
Set new count limit for given event.
handler -reset handler_id Reset trip counter for given handler.
340 Debugging a Program With dbx • November 2005

Syntax
where:
regular_expression is a regular expression.
ignore CommandThe ignore command tells the dbx process not to catch the given signal(s). It isvalid only in native mode.
Ignoring a signal causes dbx not to stop when the process receives that kind ofsignal.
Syntax
where:
number is the number of a signal.
signal is the name of a signal.
hide List the stack frame filters currently in effect.
hide regular_expression Hide stack frames matching regular_expression. Theregular expression matches either the function name, orthe name of the loadobject, and is a sh or ksh filematching style regular expression.
ignore Print a list of the ignored signals.
ignore number... Ignore signal(s) numbered number.
ignore signal... Ignore signal(s) named by signal. SIGKILL cannot becaught or ignored.
ignore $(catch) Ignore all signals.
Appendix C Command Reference 341

import CommandThe import command imports commands from a dbx command library. It hasidentical syntax and identical functionality in native mode and in Java mode.
Syntax
where:
pathname is the pathname of a dbx command library.
intercept CommandThe intercept command throws (C++ exceptions) of the given type (C++ only). Itis valid only in native mode.
dbx stops when the type of a thrown exception matches a type on the intercept listunless the type of the exception also matches a type on the excluded list. A thrownexception for which there is no matching catch is called an “unhandled” throw. Athrown exception that doesn’t match the exception specification of the function it isthrown from is called an “unexpected” throw.
Unhandled and unexpected throws are intercepted by default.
Syntax
import pathname Import commands from the dbx command librarypathname.
intercept intercepted_typename[, intercepted_typename ...]
Add throws of type included_typename tothe intercept list.
intercept -a[ll] Add throws of all types to the interceptlist..
intercept -x excluded_typename[, excluded_typename ...]
Add throws of excluded_typename to theexcluded list.
342 Debugging a Program With dbx • November 2005

where:
included_typename and excluded_typename are exception type specifications such asList <int> or unsigned short.
java CommandThe java command is used when dbx is in JNI mode to indicate that the Javaversion of a specified command is to be executed. It causes the specified commandto use the Java expression evaluator, and when relevant, to display Java threads andstack frames.
Syntax
java command
where:
command is the command name and arguments of the command to be executed.
jclasses CommandThe jclasses command prints the names of all Java classes known to dbx whenyou give the command. It is valid only in Java mode.
Classes in your program that have not yet been loaded are not printed.
intercept -a[ll] -x excluded_typename[, excluded_typename ...]
Add all types except excluded_typename tothe intercept list.
intercept -s[et] [ intercepted_typename[, intercepted_typename ...] ][ -x excluded_typename [, excluded_typename]]
Clear both the intercept list and theexcluded list, and set the lists to interceptor exclude only throws of the specifiedtypes.
intercept List intercepted types.
Appendix C Command Reference 343

Syntax
joff CommandThe joff command switches dbx from Java mode or JNI mode to native mode.
Syntax
joff
jon CommandThe jon command switches dbx from native mode to Java mode.
Syntax
jon
jpkgs CommandThe jpkgs command prints the names of all Java packages known to dbx when yougive the command. It is valid only in Java mode.
Packages in your program that have not yet been loaded are not printed.
jclasses Print the names of all Java classes known to dbx
jclasses -a Print system classes as well as other known Java classes.
344 Debugging a Program With dbx • November 2005

Syntax
jpkgs
kill CommandThe kill command sends a signal to a process. It is valid only in native mode.
Syntax
where:
job may be a process ID or may be specified in any of the following ways:
signal is the name of a signal.
language CommandThe language command lists or changes the current source language. It is validonly in native mode.
kill -l List all known signal numbers, names, and descriptions.
kill Kill the controlled process.
kill job... Send the SIGTERM signal to the listed jobs.
kill -signal job... Send the given signal to the listed jobs.
%+ Kill the current job.
%- Kill the previous job.
%number Kill job number number.
%string Kill the job which begins with string.
%?string Kill the job which contains string.
Appendix C Command Reference 345

Syntax
where:
language is c, c++, fortran, or fortran90.
Note – c is an alias for ansic.
line CommandThe line command lists or change the current line number. It has identical syntaxand identical functionality in native mode and in Java mode.
Syntax
where:
filename is the name of the file in which to change the line number. The ““ aroundthe filename is optional.
number is the number of a line in the file.
language Print the current language mode set by the dbxlanguage_mode environment variable (see “Setting dbxEnvironment Variables” on page 66). If the languagemode is set to autodetect or main, the command alsoprints the name of the current language used for parsingand evaluating expressions.
line Display the current line number.
line number Set the current line number to number.
line "filename" Set current line number to line 1 in filename.
line "filename":number Set current line number to line number in filename.
346 Debugging a Program With dbx • November 2005

Examplesline 100
line "/root/test/test.cc":100
list CommandThe list command displays lines of a source file. It has identical syntax andidentical functionality in native mode and in Java mode.
The default number of lines listed, N, is controlled by the dbx output_list_sizeenvironment variable.
Syntax
list List N lines.
list number List line number number.
list + List next N lines.
list +n List next n lines.
list - List previous N lines.
list -n List previous n lines.
list n1,n2 List lines from n1 to n2.
list n1,+ List from n1 to n1 + N.
list n1,+n2 List from n1 to n1 + n2.
list n1,- List from n1-N to n1.
list n1,-n2 List from n1-n2 to n1
list function List the start of the source for function. list functionchanges the current scope. See “Program Scope” onpage 76 for more information.
list filename List the start of the file filename.
list filename:n List file filename from line n. Where appropriate, the linenumber may be ‘$’ which denotes the last line of the file.Comma is optional.
Appendix C Command Reference 347

where:
filename is the file name of a source code file.
function is the name of a function to display.
number is the number of a line in the source file.
n is a number of lines to display.
n1 is the number of the first line to display.
n2 is the number of the last line to display.
Options
Exampleslist // list N lines starting at current line
list +5 // list next 5 lines starting at current line
list - // list previous N lines
list -20 // list previous 20 lines
list 1000 // list line 1000
list 1000,$ // list from line 1000 to last line
list 2737 +24 // list line 2737 and next 24 lines
list 1000 -20 // list line 980 to 1000
list test.cc:33 // list source line 33 in file test.cc
list -w // list N lines around current line
list -w8 ‘test.cc‘func1 // list 8 lines around function func1
list -i 500 +10 // list source and assembly code for line
500 to line 510
-i or -instr Intermix source lines and assembly code
-w or -wn List N (or n) lines (window) around line or function. Thisoption is not allowed in combination with the ‘+’ or ‘-’syntax or when two line numbers are specified.
348 Debugging a Program With dbx • November 2005

listi CommandThe listi command displays source and disassembled instructions. It is valid onlyin native mode.
See “list Command” on page 347 for details.
loadobject CommandThe loadobject command lists and manages symbolic information fromloadobjects. It is valid only in native mode.
Syntax
loadobject command_list
-list [ regexp ] [ -a ] Show currently loaded loadobjects (see“loadobject -list Command” on page 351)
-load loadobject Load symbols for specified loadobject (see“loadobject -load Command” on page 352)
-unload [ regexp ] Unload specified loadobjects (see“loadobject -unload Command” on page 352)
-hide [ regexp ] Remove loadobject from dbx’s search algorithm (see“loadobject -hide Command” on page 351)
-use [ regexp ] Add loadobject to dbx’s search algorithm (see“loadobject -use Command” on page 353)
-dumpelf [ regexp ] Show various ELF details of the loadobject (see“loadobject -dumpelf Command” on page 350)
-exclude ex-regexp Don’t automatically load loadobjects matching ex-regexp (see “loadobject -exclude Command” onpage 350)
-exclude Show list of exclude patterns (see “loadobject-exclude Command” on page 350)
-exclude -clear Clear the ’exclude’ list of patterns (see “loadobject-exclude Command” on page 350)
Appendix C Command Reference 349

where:
regexp is a regular expression. If it is not specified the command applies to allloadobjects.
ex-regexp is not optional, it must be specified.
This command has a default alias lo.
loadobject -dumpelf CommandThe loadobject -dumpelf command shows various ELF details of the loadobject.It is valid only in native mode.
Syntax
loadobject -dumpelf [ regexp ]
where:
regexp is a regular expression. If it is not specified the command applies to allloadobjects.
This command dumps out information related to the ELF structure of the loadobjectfile on disk. The details of this output are highly subject to change. If you want toparse this output, use the Solaris OS commands dump or elfdump.
loadobject -exclude CommandThe loadobject -exclude command tells dbx not to automatically loadloadobjects matching the specified regular expression.
Syntax
loadobject -exclude ex-regexp [ -clear ]
where:
ex-regexp is a regular expression.
This command prevents dbx from automatically loading symbols for loadobjectsthat match the specified regular expression. Unlike regexp in other loadobjectsubcommands, if ex- regexp is not specified, it does not default to all. If you do notspecify ex- regexp, the command lists the excluded patterns that have been specifiedby previous loadobject -exclude commands.
350 Debugging a Program With dbx • November 2005

If you specify -clear, the list of excluded patterns is deleted.
Currently this functionality cannot be used to prevent loading of the main program,or the runtime linker. Also, using it to prevent loading of C++ runtime librariescould cause the failure of some C++ functionality.
This option should not be used with runtime checking (RTC).
loadobject -hide CommandThe loadobject -hide command removes loadobjects from dbx’s searchalgorithm.
Syntax
loadobject -hide [ regexp ]
where:
regexp is a regular expression. If it is not specified the command applies to allloadobjects.
This command removes a loadobject from the program scope, and hides its functionsand symbols from dbx. This command also resets the ’preload’ bit
loadobject -list CommandThe loadobject -list command shows currently loaded loadobjects. It is validonly in native mode.
Syntax
loadobject -list [ regexp ] [ -a]
where:
regexp is a regular expression. If it is not specified the command applies to allloadobjects.
Appendix C Command Reference 351
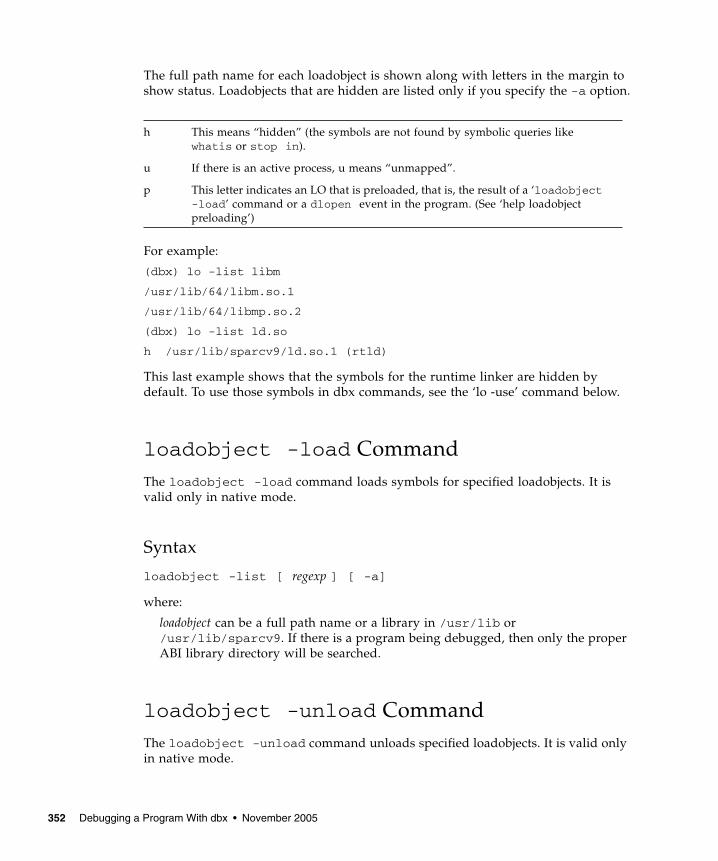
The full path name for each loadobject is shown along with letters in the margin toshow status. Loadobjects that are hidden are listed only if you specify the -a option.
For example:
(dbx) lo -list libm
/usr/lib/64/libm.so.1
/usr/lib/64/libmp.so.2
(dbx) lo -list ld.so
h /usr/lib/sparcv9/ld.so.1 (rtld)
This last example shows that the symbols for the runtime linker are hidden bydefault. To use those symbols in dbx commands, see the ‘lo -use’ command below.
loadobject -load CommandThe loadobject -load command loads symbols for specified loadobjects. It isvalid only in native mode.
Syntax
loadobject -list [ regexp ] [ -a]
where:
loadobject can be a full path name or a library in /usr/lib or/usr/lib/sparcv9. If there is a program being debugged, then only the properABI library directory will be searched.
loadobject -unload CommandThe loadobject -unload command unloads specified loadobjects. It is valid onlyin native mode.
h This means “hidden” (the symbols are not found by symbolic queries likewhatis or stop in).
u If there is an active process, u means “unmapped”.
p This letter indicates an LO that is preloaded, that is, the result of a ‘loadobject-load’ command or a dlopen event in the program. (See ‘help loadobjectpreloading’)
352 Debugging a Program With dbx • November 2005

Syntax
loadobject -unload [ regexp ]
where:
regexp is a regular expression. If it is not specified the command applies to allloadobjects.
This command unloads the symbols for any loadobjects matching the regexpsupplied on the command line. The main program loaded with the debug commandcannot be unloaded. dbx may also refuse to unload other loadobjects that might becurrently in use, or critical to the proper functioning of dbx.
loadobject -use CommandThe loadobject -use command adds loadobjects from dbx’s search algorithm. Itis valid only in native mode.
Syntax
loadobject -use [ regexp ]
where:
regexp is a regular expression. If it is not specified the command applies to allloadobjects.
lwp CommandThe lwp command lists or changes the current LWP (lightweight process). It is validonly in native mode.
Note – The lwp command is available only on Solaris platforms.
Appendix C Command Reference 353

Syntax
where:
lwp_id is the identifier of a lightweight process.
lwps CommandThe lwps command lists all LWPs (lightweight processes) in the process. It is validonly in native mode.
Note – The lwps command is available only on Solaris platforms.
Syntax
mmapfile CommandThe mmapfile command views the contents of memory mapped files that aremissing from a core dump. It is valid only in native mode.
Solaris core files do not contain any memory segments that are read-only. Executableread-only segments (that is, text) are dealt with automatically and dbx resolvesmemory accesses against these by looking into the executable and the relevantshared objects.
lwp Display current LWP.
lwp lwp_id Switch to LWP lwp_id.
lwp -info Displays the name, home, and masked signals of thecurrent lwp.
lwps List all LWPs in the current process
354 Debugging a Program With dbx • November 2005

Syntax
where:
mmapped_file is the file name of a file that was memory mapped during a coredump.
address is the starting address of the address space of the process.
length is length in bytes of the address space to be viewed.
offset is the offset in bytes to the starting address in mmapped_file.
module CommandThe module command reads debugging information for one or more modules. It isvalid only in native mode.
Syntax
where:
name is the name of a module for which to read debugging information.
-a specifies all modules.
-f forces reading of debugging information, even if the file is newer than theexecutable (use with caution!).
-v specifies verbose mode, which prints language, file names, etc.
-q specifies quiet mode.
mmapfile mmapped_fileaddress offset length
View contents of memory mapped files missing from coredump.
module [-v] Print the name of the current module.
module [-f] [-v] [-q]name
Read in debugging information for the module calledname.
module [-f] [-v] [-q]-a
Read in debugging information for all modules.
Appendix C Command Reference 355

Example
Read-only data segments typically occur when an application memory maps adatabase. For example:
caddr_t vaddr = NULL;
off_t offset = 0;
size_t = 10 * 1024;
int fd;
fd = open("../DATABASE", ...)
vaddr = mmap(vaddr, size, PROT_READ, MAP_SHARED, fd, offset);
index = (DBIndex *) vaddr;
To be able to access the database through the debugger as memory you would type:
mmapfile ../DATABASE $[vaddr] $[offset] $[size]
Then you could look at your database contents in a structured way by typing:
print *index
modules CommandThe modules command lists module names. It is valid only in native mode.
Syntax
where:
-v specifies verbose mode, which prints language, file names, etc.
modules [-v] List all modules
modules [-v] -debug List all modules containing debugging information.
modules [-v] -read List names of modules containing debugging informationthat have been read in already.
356 Debugging a Program With dbx • November 2005

native CommandThe native command is used when dbx is in Java mode to indicate that the nativeversion of a specified command is to be executed. Preceding a command with“native” results in dbx executing the command in native mode. This means thatexpressions are interpreted and displayed as C expressions or C++ expressions, andcertain other commands produce different output than they do in Java mode.
This command is useful when you are debugging Java code but you want toexamine the native environment.
Syntax
native command
where:
command is the command name and arguments of the command to be executed.
next CommandThe next command steps one source line (stepping over calls).
The dbx step_events environment variable (see “Setting dbx EnvironmentVariables” on page 66) controls whether breakpoints are enabled during a step.
Native Mode Syntax
next Step one line (step over calls). With multithreadedprograms when a function call is stepped over, all LWPs(lightweight processes) are implicitly resumed for theduration of that function call in order to avoid deadlock.Non-active threads cannot be stepped.
next n Step n lines (step over calls).
Appendix C Command Reference 357

where:
n is the number of lines to step.
signal is the name of a signal.
thread_id is a thread ID.
lwp_id is an LWP ID.
When an explicit thread_id or lwp_id is given, the deadlock avoidance measure of thegeneric next command is defeated.
See also “nexti Command” on page 359 for machine-level stepping over calls.
Note – For information on lightweight processes (LWPs), see the SolarisMultithreaded Programming Guide.
Java Mode Syntax
where:
n is the number of lines to step.
thread_id is a thread identifier.
lwpid is an LWP identifier.
When an explicit thread_id or lwpid is given, the deadlock avoidance measure of thegeneric next command is defeated.
next ... -sig signal Deliver the given signal while stepping.
next ... thread_id Step the given thread.
next ... lwp_id Step the given LWP. Will not implicitly resume all LWPswhen stepping over a function.
next Step one line (step over calls). With multithreadedprograms when a function call is stepped over, all LWPs(lightweight processes) are implicitly resumed for theduration of that function call in order to avoid deadlock.Non-active threads cannot be stepped.
next n Step n lines (step over calls).
next ... thread_id Step the given thread.
next ... lwpid Step the given LWP. Will not implicitly resume all LWPswhen stepping over a function.
358 Debugging a Program With dbx • November 2005

Note – For information on lightweight processes (LWPs), see the SolarisMultithreaded Programming Guide.threaded Programming Guide.
nexti CommandThe nexti command steps one machine instruction (stepping over calls). It is validonly in native mode.
Syntax
where:
n is the number of instructions to step.
signal is the name of a signal.
thread_id is a thread ID.
lwp_id is an LWP ID.
pathmap CommandThe pathmap command maps one path name to another for finding source files, etc.The mapping is applied to source paths, object file paths and the current workingdirectory (if you specify -c). The pathmap command has identical syntax andidentical functionality in native mode and in Java mode.
nexti Step one machine instruction (step over calls).
nexti n Step n machine instructions (step over calls).
nexti -sig signal Deliver the given signal while stepping.
nexti ... lwp_id Step the given LWP.
nexti ... thread_id Step the LWP on which the given thread is active. Willnot implicitly resume all LWPs when stepping over afunction.
Appendix C Command Reference 359

The pathmap command is useful for dealing with automounted and explicit NFSmounted filesystems with different paths on differing hosts. Specify -c when youare trying to correct problems arising due to the automounter since CWD’s areinaccurate on automounted filesystems as well. The pathmap command is alsouseful if source or build trees are moved.
pathmap /tmp_mnt / exists by default.
The pathmap command is used to find load objects for core files when the dbxenvironment variable core_lo_pathmap is set to on. Other than this case, thepathmap command has no effect on finding load objects (shared libraries). See“Debugging a Mismatched Core File” on page 52.
Syntax
where:
from and to are filepath prefixes. from refers to the filepath compiled into theexecutable or objectfile and to refers to the filepath at debug time.
from1 is filepath of the first mapping to be deleted.
from2 is filepath of the last mapping to be deleted.
index specifies the index with which the mapping is to be inserted in the list. Ifyou do not specify an index, the mapping is added to the end of the list.
index1 is the index of the first mapping to be deleted.
index2 is the index of the last mapping to be deleted.
If you specify -c, the mapping is applied to the current working directory as well.
If you specify -s, the existing mappings are listed in an output format that dbx canread.
If you specify -d, the specified mappings are deleted.
pathmap [ -c ] [-index]from to
Establish a new mapping from from to to.
pathmap [ -c ] [-index]to
Map all paths to to.
pathmap List all existing path mappings (by index)
pathmap -s The same, but the output can be read by dbx.
pathmap -d from1from2...
Delete the given mapping(s) by path.
pathmap -d index1 index2...
Delete the given mapping(s) by index.
360 Debugging a Program With dbx • November 2005

Examples(dbx) pathmap /export/home/work1 /net/mmm/export/home/work2
# maps /export/home/work1/abc/test.c to/net/mmm/export/home/work2/abc/test.c
(dbx) pathmap /export/home/newproject
# maps /export/home/work1/abc/test.c to/export/home/newproject/test.c
(dbx) pathmap
(1) -c /tmp_mnt /
(2) /export/home/work1 /net/mmm/export/home/work2
(3) /export/home/newproject
pop CommandThe pop command removes one or more frames from the call stack. It is valid onlyin native mode.
You can pop only to a frame for a function that was compiled with -g. The programcounter is reset to the beginning of the source line at the callsite. You cannot poppast a function call made by the debugger; use pop -c.
Normally a pop command calls all the C++ destructors associated with the poppedframes; you can override this behavior by setting the dbx pop_auto_destructenvironment variable to off (see “Setting dbx Environment Variables” on page 66).
Syntax
where:
number is the number of frames to pop from the stack.
pop Pop current top frame from stack
pop number Pop number frames from stack
pop -f number Pop frames from stack until specified frame number
pop -c Pop the last call made from the debugger.
Appendix C Command Reference 361
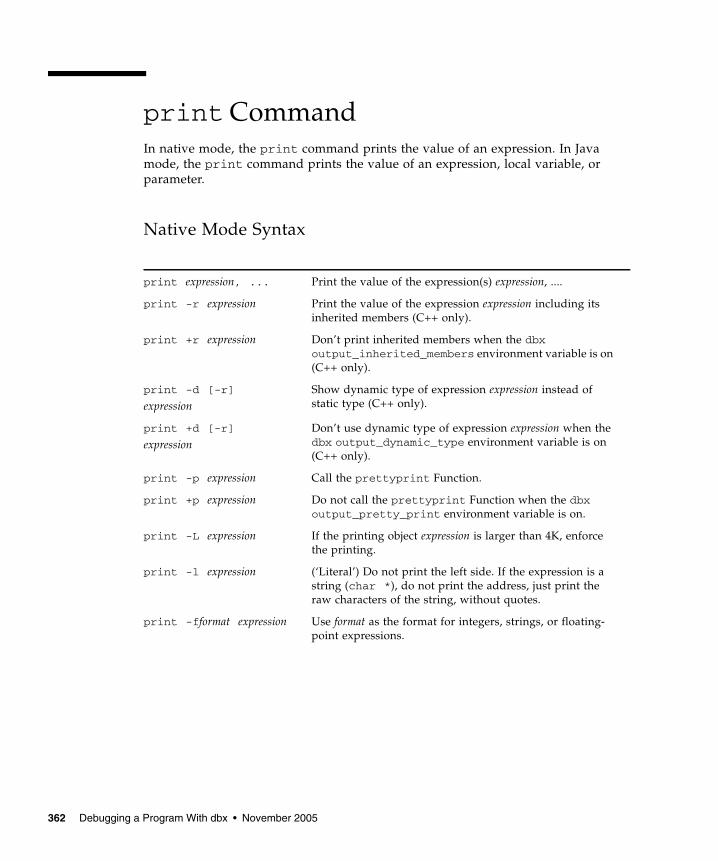
print CommandIn native mode, the print command prints the value of an expression. In Javamode, the print command prints the value of an expression, local variable, orparameter.
Native Mode Syntax
print expression, ... Print the value of the expression(s) expression, ....
print -r expression Print the value of the expression expression including itsinherited members (C++ only).
print +r expression Don’t print inherited members when the dbxoutput_inherited_members environment variable is on(C++ only).
print -d [-r]
expressionShow dynamic type of expression expression instead ofstatic type (C++ only).
print +d [-r]
expressionDon’t use dynamic type of expression expression when thedbx output_dynamic_type environment variable is on(C++ only).
print -p expression Call the prettyprint Function.
print +p expression Do not call the prettyprint Function when the dbxoutput_pretty_print environment variable is on.
print -L expression If the printing object expression is larger than 4K, enforcethe printing.
print -l expression (‘Literal’) Do not print the left side. If the expression is astring (char *), do not print the address, just print theraw characters of the string, without quotes.
print -fformat expression Use format as the format for integers, strings, or floating-point expressions.
362 Debugging a Program With dbx • November 2005

where:
expression is the expression whose value you want to print.
format is the output format you want used to print the expression. If the formatdoes not apply to the given type, the format string is silently ignored and dbxuses its built-in printing mechanism.
The allowed formats are a subset of those used by the printf(3S) command. Thefollowing restrictions apply:
■ No n conversion.■ No * for field width or precision.■ No %<digits>$ argument selection.
■ Only one conversion specification per format string.
The allowed forms are defined by the following simple grammar:
FORMAT::= CHARS % FLAGS WIDTH PREC MOD SPEC CHARS
CHARS::= <any character sequence not containing a %>
| %%
| <empty>
| CHARS CHARS
FLAGS::= + | - | <space> | # | 0 | <empty>
WIDTH::= <decimal_number> | <empty>
PREC::= . | . <decimal_number> | <empty>
MOD::= h | l | L | ll | <empty>
SPEC::= d | i | o | u | x | X | f | e | E | g | G |
c | wc | s | ws | p
If the given format string does not contain a %, dbx automatically prepends one.If the format string contains spaces, semicolons, or tabs, the entire format stringmust be surrounded by double quotes.
print -Fformat expression Use the given format but do not print the left hand side(the variable name or expression) ).
print -o expression Print the value of expression, which must be anenumeration as an ordinal value. You may also use aformat string here (-fformat). This option is ignored fornon-enumeration expressions.
print -- expression ‘--’ signals the end of flag arguments. This is useful ifexpression may start with a plus or minus (see“Program Scope” on page 76 for scope resolution rules.
Appendix C Command Reference 363

Java Mode Syntax
where:
class_name is the name of a Java class, using either the package path (using period(.) as a qualifier; for example, test1.extra.T1.Inner) or the full path name(preceded by a pound sign (#) and using slash (/) and dollar sign ($) as qualifiers;for example, #test1/extra/T1$Inner). Enclose class_name in quotation marksif you use the $ qualifier.
expression is the Java expression whose value you want to print.
field_name is the name of a field in the class.
identifier is a local variable or parameter, including this, the current classinstance variable (object_name.field_name) or a class (static) variable(class_name.field_name).
object_name is the name of a Java object.
proc CommandThe proc command displays the status of the current process. It has identical syntaxand identical functionality in native mode and in Java mode.
print expression, ... |identifier, ...
Print the value(s) of the expression(s) expression, ... oridentifier(s) identifier, ....
print -r expression |identifier
Print the value of expression or identifier including itsinherited members.
print +r expression |identifier
Don’t print inherited members when the dbxoutput_inherited_members environment variable ison.
print -d [-r]
expression | identifierShow dynamic type of expression or identifier instead ofstatic type.
print +d [-r]
expression | identifierDon’t use dynamic type of expression or identifier whenthe dbx output_dynamic_type environment variable ison.
print -- expression |identifier
‘--’ signals the end of flag arguments. This is useful ifexpression may start with a plus or minus (see“Scope” in Debugging a Program With dbx for scoperesolution rules.
364 Debugging a Program With dbx • November 2005

Syntax
prog CommandThe prog command manages programs being debugged and their attributes. It hasidentical syntax and identical functionality in native mode and Java mode.
Syntax
quit CommandThe quit command exits dbx. It has identical syntax and identical functionality innative mode and Java mode.
proc -map Show the list of loadobjects with addresses
proc -pid Show current process ID (pid)
prog -readsyms Read symbolic information which was postponed byhaving set the dbx run_quick environment variable toon.
prog -executable Prints the full path of the executable, - if the programwas attached to using -.
prog -argv Prints the whole argv, including argv[0].
prog -args Prints the argv, excluding argv[0].
prog -stdin Prints < filename or empty if stdin is used.
prog -stdout Prints > filename or >> filename or empty if stdout isused. The outputs of -args, -stdin, -stdout aredesigned so that the strings can be combined and reusedwith the run command (see “run Command” onpage 369).
Appendix C Command Reference 365

If dbx is attached to a process, the process is detached from before exiting. If thereare pending signals, they are cancelled. Use the detach command (see “detachCommand” on page 327) for fine control.
Syntax
where:
n is a return code.
regs CommandThe regs command prints the current value of registers. It is valid only in nativemode.
Syntax
regs [-f] [-F]
where:
-f includes floating-point registers (single precision) (SPARC platform only)
-F includes floating-point registers (double precision) (SPARC platform only)
Example (SPARC platform)dbx[13] regs -F
current thread: t@1
current frame: [1]
g0-g3 0x00000000 0x0011d000 0x00000000 0x00000000
g4-g7 0x00000000 0x00000000 0x00000000 0x00020c38
o0-o3 0x00000003 0x00000014 0xef7562b4 0xeffff420
o4-o7 0xef752f80 0x00000003 0xeffff3d8 0x000109b8
l0-l3 0x00000014 0x0000000a 0x0000000a 0x00010a88
quit Exit dbx with return code 0. Same as exit.
quit n Exit with return code n. Same as exit n.
366 Debugging a Program With dbx • November 2005

l4-l7 0xeffff438 0x00000001 0x00000007 0xef74df54
i0-i3 0x00000001 0xeffff4a4 0xeffff4ac 0x00020c00
i4-i7 0x00000001 0x00000000 0xeffff440 0x000108c4
y 0x00000000
psr 0x40400086
pc 0x000109c0:main+0x4mov 0x5, %l0
npc 0x000109c4:main+0x8st %l0, [%fp - 0x8]
f0f1 +0.00000000000000e+00
f2f3 +0.00000000000000e+00
f4f5 +0.00000000000000e+00
f6f7 +0.00000000000000e+00
replay CommandThe replay command replays debugging commands since the last run, rerun, ordebug command. It is valid only in native mode.
Syntax
where:
number is the number of commands not to replay.
rerun CommandThe rerun command runs the program with no arguments. It has identical syntaxand identical functionality in native mode and Java mode.
replay [-number] Replay all or all minus number commands since last runcommand, rerun command, or debug command.
Appendix C Command Reference 367

Syntax
restore CommandThe restore command restores dbx to a previously saved state. It is valid only innative mode.
Syntax
restore [filename]
where:
filename is the name of the file to which the dbx commands executed since the lastrun, rerun, or debug command were saved.
rprint CommandThe rprint command prints an expression using shell quoting rules. It is valid onlyin native mode.
Syntax
rerun Begin executing the program with no arguments
rerun arguments Begin executing the program with new arguments by the savecommand (see “save Command” on page 371).
rprint[-r|+r|-d|+d|-p|+p|-L|-l|-fformat|-Fformat|--]expression
Print the value of the expression. No special quoting rulesapply, so rprint a > b puts the value of a (if it exists)into file b (see “print Command” on page 362 for themeanings of the flags).
368 Debugging a Program With dbx • November 2005

where:
expression is the expression whose value you want to print.
format is the output format you want used to print the expression. For informationon valid formats, see “print Command” on page 362.
rtc -showmap CommandThe rtc -showmap command reports the address range of program textcategorized by instrumentation type (branches and traps). It is valid only in nativemode.
Note – The rtc -showmap command is available only on Solaris platforms.
Syntax
rtc -showmap
This command is intended for expert users, and internal debugging of dbx. Runtimechecking instruments program text for access checking. The instrumentation typecan be a branch or a trap instruction based on available resources. The rtc-showmap command reports the address range of program text categorized byinstrumentation type. This map can be used to find an optimal location for addingpatch area object files, and to avoid the automatic use of traps. See “RuntimeChecking’s 8 Megabyte Limit” on page 164 for details.
run CommandThe run command runs the program with arguments.
Use Control-C to stop executing the program.
Appendix C Command Reference 369

Native Mode Syntax
where:
arguments are the arguments to be used in running the target process.
input_file is the file name of the file from which input is to be redirected.
output_file is the file name of the file to which output is to be redirected.
Note – There is currently no way to redirect stderr using the run or runargscommand.
Java Mode Syntax
where:
arguments are the arguments to be used in running the target process. They arepassed to the Java application, not to the JVM software. Do not include the mainclass name as an argument.
You cannot redirect the input or output of a Java application with the run command.
Breakpoints you set in one run persist in subsequent runs.
runargs CommandThe runargs command changes the arguments of the target process. It has identicalsyntax and identical functionality in native mode and Java mode.
run Begin executing the program with the current arguments
run arguments Begin executing the program with new arguments.
run ... >|>> input_file Set the output redirection.
run ... < output_file Set the input redirection.
run Begin executing the program with the current arguments
run arguments Begin executing the program with new arguments.
370 Debugging a Program With dbx • November 2005

Use the debug command (see “debug Command” on page 324) with no argumentsto inspect the current arguments of the target process.
Syntax
where:
arguments are the arguments to be used in running the target process.
file is the file to which output from the target process or input to the target processis to be redirected.
save CommandThe save command saves commands to a file. It is valid only in native mode.
Syntax
where:
number is the number of commands not to save.
filename is the name of the file to save the dbx commands executed since the lastrun, rerun, or debug command.
runargs arguments Set the current arguments, to be used by the runcommand (see “run Command” on page 369).
runargs ... >|>> file Set the output redirection to be used by the runcommand.
runargs ... < file Set the input redirection to be used by the run command.
runargs Clear the current arguments.
save [-number][filename]
Save all or all minus number commands since last runcommand, rerun command, or debug command to thedefault file or filename.
Appendix C Command Reference 371

scopes CommandThe scopes command prints a list of active scopes. It is valid only in native mode.
Syntax
scopes
search CommandThe search command searches forward in the current source file. It is valid only innative mode
Syntax
where:
string is the character string for which you wish to search.
showblock CommandThe showblock command shows where the particular heap block was allocatedfrom runtime checking. It is valid only in native mode.
Note – The showblock command is available only on Solaris platforms.
search string Search forward for string in the current file.
search Repeat search, using last search string
372 Debugging a Program With dbx • November 2005

When memory use checking or memory leak checking is turned on, the showblockcommand shows the details about the heap block at the specified address. Thedetails include the location of the blocks’ allocation and its size. See “checkCommand” on page 308.
Syntax
showblock -a address
where:
address is the address of a heap block.
showleaks CommandThe showleaks command reports new memory leaks since last showleakscommand. It is valid only in native mode.
Note – The showleaks command is available only on Solaris platforms.
In the default non-verbose case, a one line report per leak record is printed. Actualleaks are reported followed by the possible leaks. Reports are sorted according to thecombined size of the leaks.
Syntax
showleaks [-a] [-m m] [-n number] [-v]
where:
-a shows all the leaks generated so far (not just the leaks since the lastshowleaks command).
-m m combines leaks; if the call stack at the time of allocation for two or moreleaks matches m frames, then these leaks are reported in a single combined leakreport. If the -m option is given, it overrides the global value of m specified withthe check command (see “check Command” on page 308)..
-n number shows up to number records in the report. The default is to show allrecords.
-v Generate verbose output. The default is to show non-verbose output.
Appendix C Command Reference 373

showmemuse CommandThe showmemuse command shows memory used since last showmemuse command.It is valid only in native mode.
Note – The showmemuse command is available only on Solaris platforms.
A one line report per “block in use” record is printed. The commands sorts thereports according to the combined size of the blocks. Any leaked blocks since the lastshowleaks command (see “showleaks Command” on page 373) are also includedin the report.
Syntax
showmemuse [-a] [-m <m>] [-n number] [-v]
where:
-a shows all the blocks in use (not just the blocks since the last showmemusecommand).
-m m combines the blocks in use reports. The default value of m is 2 or the globalvalue last given with the check command (see “check Command” on page 308).If the call stack at the time of allocation for two or more blocks matches m framesthen these blocks are reported in a single combined report. If the -m option isgiven, it overrides the global value of m.
-n number shows up to number records in the report. The default is 20.-vgenerates verbose output. The default is to show non-verbose output.
source CommandThe source command executes commands from a given file. It is valid only in nativemode.
374 Debugging a Program With dbx • November 2005

Syntax
status CommandThe status command lists event handlers (breakpoints, etc.). It has identical syntaxand identical functionality in native mode and Java mode.
Syntax
where:
handler_id is the identifier of an event handler.
Example
step CommandThe step command steps one source line or statement (stepping into calls that werecompiled with the -g option).
source filename Execute commands from file filename. $PATH is notsearched.
status Print trace, when, and stop breakpoints in effect.
status handler_id Print status for handler handler_id.
status -h Print trace, when, and stop breakpoints in effectincluding the hidden ones.
status -s The same, but the output can be read by dbx.
(dbx) status -s > bpts...(dbx) source bpts
Appendix C Command Reference 375

The dbx step_events environment variable controls whether breakpoints areenabled during a step.
The dbx step_granularity environment variable controls granularity of sourcelinestepping.
The dbx step_abflow environment variable controls whether dbx stops when itdetects that "abnormal" control flow change is about to occur. Such control flowchange can be caused by a call to siglongjmp() or longjmp() or an exceptionthrow.
Native Mode Syntax
where:
n is the number of lines to step.
signal is the name of a signal.
thread_id is a thread ID.
lwp_id is an LWP ID.
function is a function name.
step Single step one line (step into calls). With multithreadedprograms when a function call is stepped over, all threadsare implicitly resumed for the duration of that functioncall in order to avoid deadlock. Non-active threadscannot be stepped.
step n Single step n lines (step into calls).
step up Step up and out of the current function.
step ... -sig signal Deliver the given signal while stepping. If a signalhandler exists for the signal, step into it if the signalhandler was compiled with the -g option.
step ... thread_id Step the given thread. Does not apply to step up.
step ... lwp_id Step the given LWP. Does not implicitly resume all LWPswhen stepping over a function.
step to [function] Attempts to step into function called from the currentsource code line. If function is not given, attempts to stepinto the last function, helping to avoid long sequences ofstep commands and step up commands. Examples ofthe last function are:f()->s()-t()->last();
last(a() + b(c()->d()));
376 Debugging a Program With dbx • November 2005

Only when an explicit lwp_id is given, the deadlock avoidance measure of thegeneric step command is defeated.
When executing the step to command, while an attempt is made to step into thelast assemble call instruction or step into a function (if specified) in the currentsource code line, the call may not be taken due to a conditional branch. In a casewhere the call is not taken or there is no function call in the current source code line,the step to command steps over the current source code line. Take specialconsideration on user-defined operators when using the step to command.
See also “stepi Command” on page 377 for machine-level stepping.
Java Mode Syntax
stepi CommandThe stepi command steps one machine instruction (stepping into calls). It is validonly in native mode.
Syntax
step Single step one line (step into calls). With multithreadedprograms when a method call is stepped over, all threadsare implicitly resumed for the duration of that methodcall in order to avoid deadlock. Non-active threadscannot be stepped.
step n Single step n lines (step into calls).
step up Step up and out of the current method.
step ... tid Step the given thread. Does not apply to step up.
step ... lwpid Step the given LWP. Does not implicitly resume all LWPswhen stepping over a method.
stepi Single step one machine instruction (step into calls).
stepi n Single step n machine instructions (step into calls).
Appendix C Command Reference 377

where:
n is the number of instructions to step.
signal is the name of a signal.
lwp_id is an LWP ID.
thread_id is a thread ID.
stop CommandThe stop command sets a source-level breakpoint.
Syntax
The stop command has the following general syntax:
stop event-specification [ modifier ]
When the specified event occurs, the process is stopped.
Native Mode Syntax
The following specific syntaxes are some of the more important syntaxes that arevalid in native mode. For additional events, see “Setting Event Specifications” onpage 281.
stepi -sig signal Step and deliver the given signal.
stepi ... lwp_id Step the given LWP.
stepi ... thread_id Step the LWP on which the given thread is active.
stop [ -update ] Stop execution now. Only valid within the body of a whencommand.
stop -noupdate Stop execution now but do not update the Sun Studio IDEDebugger windows.
stop access modeaddress_expression [,byte_size_expression ]
Stop execution when the memory specified byaddress_expression has been accessed. See also “StoppingExecution When an Address Is Accessed” on page 107.
stop at line_number Stop execution at line_number. See also “Setting a stopBreakpoint at a Line of Source Code” on page 102.
378 Debugging a Program With dbx • November 2005

where:
line_number is the number of a source code line.
function is the name of a function.
class_name is the name of a C++ class, struct, union, or template class.
mode specifies how the memory was accessed. It can be composed of one or all ofthe letters:
mode can also contain the following:
name is the name of a C++ function.
object_expression identifies a C++ object.
variable is the name of a variable.
stop change variable Stop execution when the value of variable has changed.
stop condcondition_expression
Stop execution when the condition denoted bycondition_expression evaluates to true.
stop in function Stop execution when function is called. See also “Setting astop Breakpoint in a Function” on page 103.
stop inclass class_name[ -recurse |-norecurse]
C++ only: Set breakpoints on all member functions of a class,struct, union, or template class. -norecurese is the default.If -recurse is specified, the base classes are included. Seealso “Setting Breakpoints in Member Functions of the SameClass” on page 105.
stop infunction name C++ only: Set breakpoints on all non-member functionsname.
stop inmember name C++ only: set breakpoints on all member functions name. See“Setting Breakpoints in Member Functions of DifferentClasses” on page 104.
stop inobjectobject_expression [-recurse |-norecurse]
C++ only: set breakpoint on entry into any non-staticmethod of the class and all its base classes when called fromthe object object_expression. -recurse is the default. If-norecurse is specified, the base classes are not included.See also “Setting Breakpoints in Objects” on page 106.
r The memory at the specified address has been read.
w The memory has been written to.
x The memory has been executed.
a Stops the process after the access (default).
b Stops the process before the access.
Appendix C Command Reference 379

The following modifiers are valid in native mode.
Java Mode Syntax
The following specific syntaxes are valid in Java mode.
-ifcondition_expression
The specified event occurs only when condition_expression evaluates totrue.
-in function Execution stops only if the specified event occurs during the extent offunction.
-count number Starting at 0, each time the event occurs, the counter is incremented.When number is reached, execution stops and the counter is reset to 0.
-countinfinity
Starting at 0, each time the event occurs, the counter is incremented.Execution is not stopped.
-temp Create a temporary breakpoint that is deleted when the event occurs.
-disable Create the breakpoint in a disabled state.
-instr Do instruction level variation. For example, step becomes instructionlevel stepping, and at takes a text address for an argument instead ofa line number.
-perm Make this event permanent across debug. Certain events (likebreakpoints) are not appropriate to be made permanent. delete allwill not delete permanent handlers, use delete hid.
-hidden Hide the event from the status command. Some import modulesmay choose to use this. Use status -h to see them.
-lwp lwpid Execution stops only if the specified event occurs in the given LWP.
-thread tid Execution stops only if the specified event occurs in the given thread.
stop access modeclass_name.field_name
Stop execution when the memory specified byclass_name.field_name has been accessed.
stop at line_number Stop execution at line_number.
stop atfile_name:line_number
Stop execution at line_number in file_name.
stop changeclass_name.field_name
Stop execution when the value of field_name in class_namehas changed.
stop classload Stop execution when any class is loaded.
380 Debugging a Program With dbx • November 2005

stop classload class_name Stop execution when class_name is loaded.
stop classunload Stop execution when any class is unloaded.
stop classunloadclass_name
Stop execution when class_name is unloaded.
stop condcondition_expression
Stop execution when the condition denoted bycondition_expression evaluates to true.
stop inclass_name.method_name
Stop execution when class_name.method_name has beenentered, and the first line is about to be executed. If noparameters are specified and the method is overloaded, alist of methods is displayed.
stop inclass_name.method_name([parameters])
Stop execution when class_name.method_name has beenentered, and the first line is about to be executed.
stop inmethodclass_name.method_name
Set breakpoints on all non-member methodsclass_name.method_name.
stop inmethodclass_name.method_name([parameters])
Set breakpoints on all non-member methodsclass_name.method_name.
stop throw Stop execution when a Java exception has been thrown.
stop throw type Stop execution when a Java exception of type has beenthrown.
Appendix C Command Reference 381

where:
class_name is the name of a Java class, using either the package path (using period(.) as a qualifier; for example, test1.extra.T1.Inner) or the full path name(preceded by a pound sign (#) and using slash (/) and dollar sign ($) as qualifiers;for example, #test1/extra/T1$Inner). Enclose class_name in quotation marksif you use the $ qualifier.
condition_expression can be any expression, but it must evaluate to an integraltype.
field_name is the name of a field in the class.
file_name is the name of a file.
line_number is the number of a source code line.
method_name is the name of a Java method.
mode specifies how the memory was accessed. It can be composed of one or all ofthe letters:
mode can also contain the following:
The program counter will point at the offending instruction.
parameters are the method’s parameters.
type is a type of Java exception. -unhandled or -unexpected can be used fortype.
The following modifiers are valid in Java mode:
r The memory at the specified address has been read.
w The memory has been written to.
b Stops the process before the access.
-if condition_expression The specified event occurs only when condition_expressionevaluates to true.
-count number Starting at 0, each time the event occurs, the counter isincremented. When number is reached, execution stops andthe counter is reset to 0.
-count infinity Starting at 0, each time the event occurs, the counter isincremented. Execution is not stopped.
-temp Create a temporary breakpoint that is deleted when theevent occurs.
-disable Create the breakpoint in a disabled state.
382 Debugging a Program With dbx • November 2005

See also “stopi Command” on page 383 for setting a machine-level breakpoint.
For a list and the syntax of all events see “Setting Event Specifications” on page 281.
stopi CommandThe stopi command sets a machine-level breakpoint. It is valid only in nativemode.
Syntax
The stopi command has the following general syntax:
stopi event-specification [ modifier ]
When the specified event occurs, the process is stopped.
The following specific syntaxes are valid:
where:
address is any expression resulting in or usable as an address.
function is the name of a function.
For a list and the syntax of all events see “Setting Event Specifications” on page 281.
suppress CommandThe suppress command suppresses reporting of memory errors during runtimechecking. It is valid only in native mode.
Note – The suppress command is available only on Solaris platforms.
stopi at address Stop execution at location address.
stopi in function Stop execution when function is called.
Appendix C Command Reference 383

If the dbx rtc_auto_suppress environment variable is on, the memory error at agiven location is reported only once.
Syntax
suppress History of suppress and unsuppress commands (notincluding those specifying the -d and -reset options).
suppress -d List of errors being suppressed in functions not compiledfor debugging (default suppression). This list is perloadobject. These errors can be unsuppressed only byusing the unsuppress with the -d option.
suppress -d errors Modify the default suppressions for all loadobjects byfurther suppressing errors.
suppress -d errors inloadobjects
Modify the default suppressions in the loadobjects byfurther suppressing errors.
suppress -last At error location suppress present error.
suppress -reset Set the default suppression to the original value (startuptime)
suppress -r <id> ... Remove the unsuppress events as given by the id(s) (id(s)can be obtained with unsuppress command (see“unsuppress Command” on page 397).
suppress -r 0 | all |-all
Remove all the unsuppress events as given by theunsuppress command (see “unsuppress Command”on page 397)
suppress errors Suppress errors everywhere
suppress errors in[functions] [files][loadobjects]
Suppress errors in list of functions, list of files, and list ofloadobjects.
suppress errors at line Suppress errors at line.
suppress errors at"file":line
Suppress errors at line in file.
suppress errors addr address Suppress errors at location address.
384 Debugging a Program With dbx • November 2005

where:
address is a memory address.
errors are blank separated and can be any combination of:
file is the name of a file.
files is the names of one or more files.
functions is one or more function names.
line is the number of a source code line.
loadobjects is one or more loadobject names.
See “Suppressing Errors” on page 152 for more information on suppressing errors.
See the “unsuppress Command” on page 397 for information on unsuppressingerrors.
all All errors
aib Possible memory leak - address in block
air Possible memory leak - address in register
baf Bad free
duf Duplicate free
mel Memory leak
maf Misaligned free
mar Misaligned read
maw Misaligned write
oom Out of memory
rua Read from unallocated memory
rui Read from uninitialized memory
wro Write to read-only memory
wua Write to unallocated memory
biu Block in use (allocated memory). Though not an error, you can use biu justlike errors in the suppress commands.
Appendix C Command Reference 385

sync CommandThe sync command shows information about a given synchronization object. It isvalid only in native mode.
Note – The sync command is available only on Solaris platforms.
Syntax
where:
address is the address of the synchronization object.
syncs CommandThe syncs command lists all synchronization objects (locks). It is valid only innative mode.
Note – The syncs command is available only on Solaris platforms.
Syntax
syncs
thread CommandThe thread command lists or changes the current thread.
sync -info address Show information about the synchronization object ataddress.
386 Debugging a Program With dbx • November 2005

Native Mode Syntax
In the following variations, a missing thread_id implies the current thread.
where:
thread_id is a thread ID.
Java Mode Syntax
In the following variations, a missing thread_id implies the current thread.
thread Display current thread
thread thread_id Switch to thread thread_id.
thread -info [ thread_id ] Print everything known about the given thread.
thread -hide [ thread_id ] Hide the given (or current) thread. It will not show upin the generic threads listing.
thread -unhide [ tid ] Unhide the given (or current) thread.
thread -unhide all Unhide all threads.
thread -suspend thread_id Keep the given thread from ever running. Asuspended thread shows up with an “S” in the threadslist.
thread -resume thread_id Undo the effect of -suspend.
thread -blocks
[ thread_id ]
List all locks held by the given thread blocking otherthreads.
thread -blockedby
[ thread_id ]
Show which synchronization object the given thread isblocked by, if any.
thread Display current thread
thread thread_id Switch to thread thread_id.
thread -info [ thread_id ] Print everything known about the given thread.
thread -hide [ thread_id ] Hide the given (or current) thread. It will not show upin the generic threads listing.
thread -unhide
[ thread_id ]
Unhide the given (or current) thread.
Appendix C Command Reference 387

where:
thread_id is a dbx-style thread ID of the form t@number or the Java thread namespecified for the thread.
threads CommandThe threads command lists all threads.
Native Mode Syntax
Each line of information is composed of the following:
■ An * (asterisk) indicating that an event requiring user attention has occurred inthis thread. Usually this is a breakpoint.
An ‘o’ instead of an asterisk indicates that a dbx internal event has occurred.
■ An > (arrow) denoting the current thread.
thread -unhide all Unhide all threads.
thread -suspend thread_id Keep the given thread from ever running. A suspendedthread shows up with an “S” in the threads list.
thread -resume thread_id Undo the effect of -suspend.
thread -blocks
[ thread_id ]
Lists the Java monitor owned by thread_id.
thread -blockedby
[ thread_id ]
Lists the Java monitor on which thread_id is blocked.
threads Print the list of all known threads.
threads -all Print threads normally not printed (zombies).
threads -modeall|filter
Controls whether all threads are printed or threads arefiltered. The default is to filter threads. When filtering ison, threads that have been hidden by the thread -hidecommand are not listed.
threads -modeauto|manual
Under the dbx Debugger, enables automatic updating ofthe thread listing.
threads -mode Echo the current modes
388 Debugging a Program With dbx • November 2005
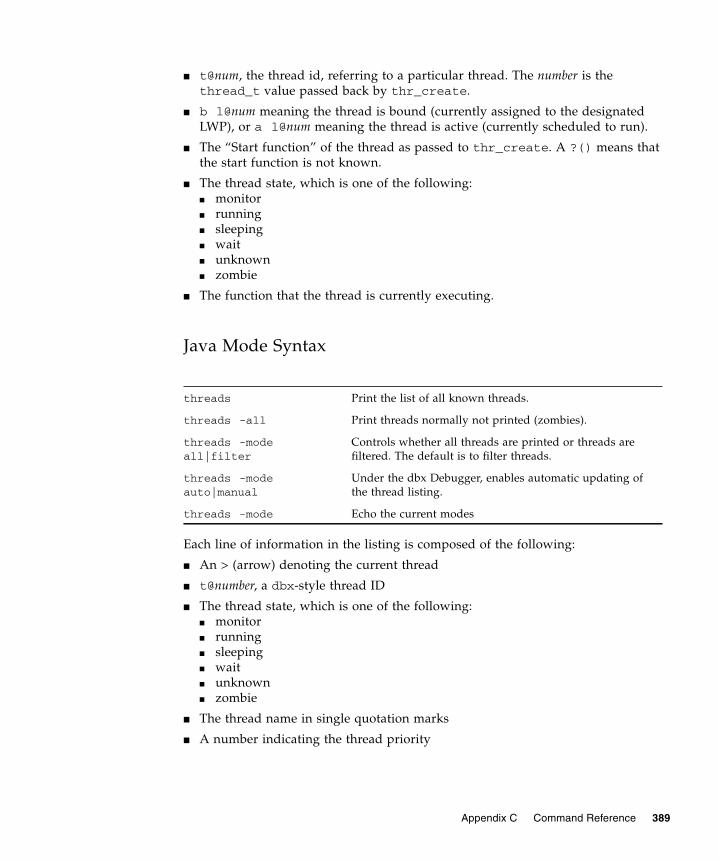
■ t@num, the thread id, referring to a particular thread. The number is thethread_t value passed back by thr_create.
■ b l@num meaning the thread is bound (currently assigned to the designatedLWP), or a l@num meaning the thread is active (currently scheduled to run).
■ The “Start function” of the thread as passed to thr_create. A ?() means thatthe start function is not known.
■ The thread state, which is one of the following:■ monitor■ running■ sleeping■ wait■ unknown■ zombie
■ The function that the thread is currently executing.
Java Mode Syntax
Each line of information in the listing is composed of the following:
■ An > (arrow) denoting the current thread
■ t@number, a dbx-style thread ID
■ The thread state, which is one of the following:■ monitor■ running■ sleeping■ wait■ unknown■ zombie
■ The thread name in single quotation marks
■ A number indicating the thread priority
threads Print the list of all known threads.
threads -all Print threads normally not printed (zombies).
threads -modeall|filter
Controls whether all threads are printed or threads arefiltered. The default is to filter threads.
threads -modeauto|manual
Under the dbx Debugger, enables automatic updating ofthe thread listing.
threads -mode Echo the current modes
Appendix C Command Reference 389

trace CommandThe trace command shows executed source lines, function calls, or variable changes.
The speed of a trace is set using the dbx trace_speed environment variable.
If dbx is in Java mode and you want to set a trace breakpoint in native code, switchto Native mode using the joff command (see “joff Command” on page 344) orprefix the trace command with native (see “native Command” on page 357).
If dbx is in JNI mode and you want to set a trace breakpoint in Java code, prefix thetrace command with java (see “java Command” on page 343).
Syntax
The trace command has the following general syntax:
trace event-specification [ modifier]
When the specified event occurs, a trace is printed.
Native Mode Syntax
The following specific syntaxes are valid in native mode:
trace -file file_name Direct all trace output to the given file_name. To reverttrace output to standard output use - for file_name. traceoutput is always appended to file_name. It is flushedwhenever dbx prompts and when the application hasexited. The filename is always re-opened on a new run orresumption after an attach.
trace step Trace each source line, function call, and return.
trace next -in
functionTrace each source line while in the given function
trace at line_number Trace given source line.
trace in function Trace calls to and returns from the given function.
trace inmember
functionTrace calls to any member function named function.
390 Debugging a Program With dbx • November 2005

where:
file_name is the name of the file to which you want trace output sent.
function is the name of a function.
line_number is the number of a source code line.
class is the name of a class.
variable is the name of a variable.
The following modifiers are valid in native mode.
trace infunctionfunction
Trace when any function named function is called.
trace inclass class Trace calls to any member function of class.
trace change variable Trace changes to the variable.
-ifcondition_expression
The specified event occurs only when condition_expression evaluates totrue.
-in function Execution stops only if the specified event occurs in function.
-count number Starting at 0, each time the event occurs, the counter is incremented.When number is reached, execution stops and the counter is reset to 0.
-countinfinity
Starting at 0, each time the event occurs, the counter is incremented.Execution is not stopped.
-temp Create a temporary breakpoint that is deleted when the event occurs.
-disable Create the breakpoint in a disabled state.
-instr Do instruction level variation. For example, step becomes instructionlevel stepping, and at takes a text address for an argument instead ofa line number.
-perm Make this event permanent across debug. Certain events (likebreakpoints) are not appropriate to be made permanent. delete allwill not delete permanent handlers, use delete hid.
-hidden Hide the event from the status command. Some import modulesmay choose to use this. Use status -h to see them.
-lwp lwpid Execution stops only if the specified event occurs in the given LWP.
-threadthread_id
Execution stops only if the specified event occurs in the given thread.
Appendix C Command Reference 391

Java Mode Syntax
The following specific syntaxes are valid in Java mode.
where:
class_name is the name of a Java class, using either the package path (using period(.) as a qualifier, for example, test1.extra.T1.Inner) or the full path name(preceded by a pound sign (#) and using slash (/) and dollar sign ($) as qualifiers,for example, #test1/extra/T1$Inner). Enclose class_name in quotation marksif you use the $ qualifier.
file_name is the name of a file.
line_number is the number of a source code line.
method_name is the name of a Java method.
parameters are the method’s parameters
trace -file file_name Direct all trace output to the given file_name. To reverttrace output to standard output use - for file_name. traceoutput is always appended to file_name. It is flushedwhenever dbx prompts and when the application hasexited. The file_name is always re-opened on a new run orresumption after an attach.
trace at line_number Trace line_number.
trace atfile_name.line_number
Trace given source file_name.line_number.
trace inclass_name.method_name
Trace calls to and returns from class_name.method_name.
trace inclass_name.method_name([parameters])
Trace calls to and returns fromclass_name.method_name([parameters]).
trace inmethodclass_name.method_name
Trace calls to and returns from any method namedclass_name.method_name is called.
trace inmethodclass_name.method_name([parameters])
Trace calls to and returns from any method namedclass_name.method_name([parameters]) is called.
392 Debugging a Program With dbx • November 2005

The following modifiers are valid in Java mode.
For a list and the syntax of all events see “Setting Event Specifications” on page 281.
tracei CommandThe tracei command shows machine instructions, function calls, or variablechanges. It is valid only in native mode.
tracei is really a shorthand for trace event-specification -instr where the-instr modifier causes tracing to happen at instruction granularity instead ofsource line granularity. When the event occurs, the printed information is indisassembly format instead of source line format.
Syntax
-if condition_expression The specified event occurs and the trace is printed onlywhen condition_expression evaluates to true.
-count number Starting at 0, each time the event occurs, the counter isincremented. When number is reached, the trace is printedand the counter is reset to 0.
-count infinity Starting at 0, each time the event occurs, the counter isincremented. Execution is not stopped.
-temp Create a temporary breakpoint that is deleted when theevent occurs and the trace is printed. If -temp is used with-count, the breakpoint is deleted only when the counter isreset to 0.
-disable Create the breakpoint in a disabled state.
tracei step Trace each machine instruction.
tracei next -in
functionTrace each instruction while in the given function.
tracei at address Trace the instruction at address.
tracei in function Trace calls to and returns from the given function.
tracei inmember function Trace calls to any member function namedfunction.
Appendix C Command Reference 393

where:
filename is the name of the file to which you want trace output sent.
function is the name of a function.
line is the number of a source code line.
class is the name of a class.
variable is the name of a variable.
See “trace Command” on page 390 for more information.
uncheck CommandThe uncheck command disables checking of memory access, leaks, or usage. It isvalid only in native mode.
Note – The uncheck command is available only on Solaris platforms.
Syntax
tracei infunctionfunction
Trace when any function named function is called.
tracei inclass class Trace calls to any member function of class.
tracei change variable Trace changes to the variable.
uncheck Print current status of checking.
uncheck -access Turn off access checking.
uncheck -leaks Turn off leak checking.
uncheck -memuse Turn off memuse checking (leak checking is turned off aswell).
uncheck -all Equivalent to uncheck -access; uncheck -memuse.
uncheck [functions] [files][loadobjects]
Equivalent to suppress all in functions files loadobjects.
394 Debugging a Program With dbx • November 2005

where:
functions is one or more function names.
files is one or more file names.
loadobjects is one or more loadobject names
See “check Command” on page 308 for information to turn on checking.
See “suppress Command” on page 383 for information on suppressing of errors.
See “Capabilities of Runtime Checking” on page 136 for an introduction to runtimechecking.
undisplay CommandThe undisplay command undoes display commands.
Native Mode Syntax
where:
expression is a valid expression.
Java Mode Syntax
undisplay expression, ... Undo a display expression command.
undisplay n, ... Undo the display commands numbered n...
undisplay 0 Undo all display commands.
undisplay expression, ...| identifier, ...
Undo a display expression, ... or displayidentifier, ... command.
undisplay n, ... Undo the display commands numbered n...
undisplay 0 Undo all display commands.
Appendix C Command Reference 395

where:
expression is a valid Java expression.
field_name is the name of a field in the class.
identifier is a local variable or parameter, including this, the current classinstance variable (object_name.field_name) or a class (static) variable(class_name.field_name).
unhide CommandThe unhide command undoes hide commands. It is valid only in native mode.
Syntax
where:
regular_expression is a regular expression.
number is the number of a stack frame filter.
The hide command (see “hide Command” on page 340) lists the filters withnumbers.
unintercept CommandThe unintercept command undoes intercept commands (C++ only). It is validonly in native mode.
unhide 0 Delete all stack frame filters
unhide regular_expression Delete stack frame filter regular_expression.
unhide number Delete stack frame filter number number.
396 Debugging a Program With dbx • November 2005

Syntax
where:
included_typename and excluded_typename are exception type specifications such asList <int> or unsigned short.
unsuppress CommandThe unsuppress command undoes suppress commands. It is valid only in nativemode.
Note – The unsuppress command is available only on Solaris platforms.
Syntax
uninterceptintercepted_typename[, intercepted_typename ... ]
Delete throws of type intercepted_typename from theintercept list.
unintercept -a[ll] Delete all throws of all types from intercept list.
unintercept -xexcluded_typename[, excluded_typename ... ]
Delete excluded_typename from excluded list.
unintercept -x -a[ll] Delete all throws of all types from the excluded list.
unintercept List intercepted types
unsuppress History of suppress and unsuppress commands (notthose specifying the -d and -reset options)
unsuppress -d List of errors being unsuppressed in functions that are notcompiled for debugging. This list is per loadobject. Anyother errors can be suppressed only by using the suppresscommand (see “suppress Command” on page 383) withthe -d option.
unsuppress -d errors Modify the default suppressions for all loadobjects byfurther unsuppressing errors.
Appendix C Command Reference 397
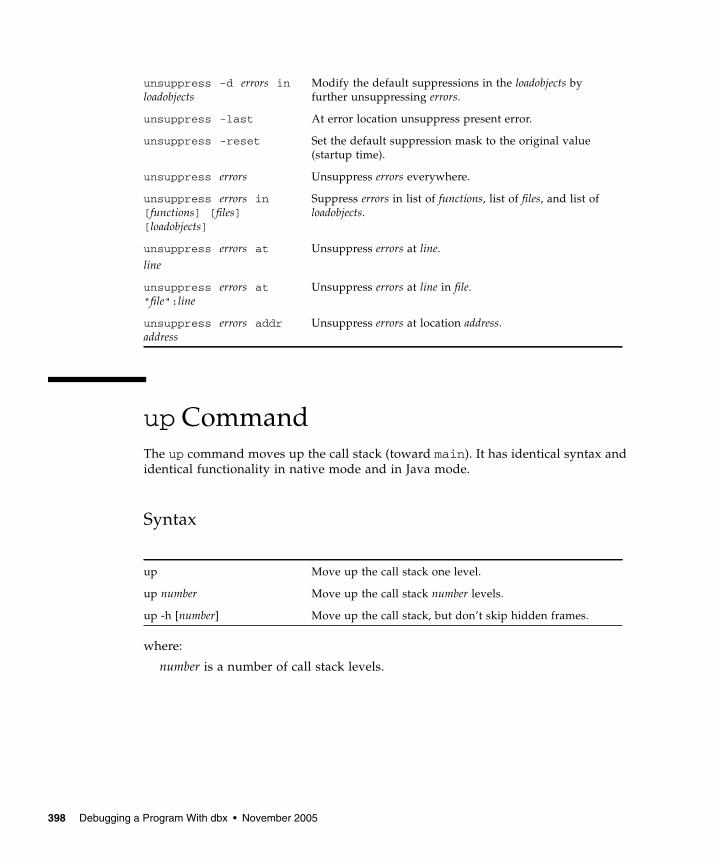
up CommandThe up command moves up the call stack (toward main). It has identical syntax andidentical functionality in native mode and in Java mode.
Syntax
where:
number is a number of call stack levels.
unsuppress -d errors inloadobjects
Modify the default suppressions in the loadobjects byfurther unsuppressing errors.
unsuppress -last At error location unsuppress present error.
unsuppress -reset Set the default suppression mask to the original value(startup time).
unsuppress errors Unsuppress errors everywhere.
unsuppress errors in[functions] [files][loadobjects]
Suppress errors in list of functions, list of files, and list ofloadobjects.
unsuppress errors at
lineUnsuppress errors at line.
unsuppress errors at"file":line
Unsuppress errors at line in file.
unsuppress errors addraddress
Unsuppress errors at location address.
up Move up the call stack one level.
up number Move up the call stack number levels.
up -h [number] Move up the call stack, but don’t skip hidden frames.
398 Debugging a Program With dbx • November 2005

use CommandThe use command lists or changes the directory search path. It is valid only innative mode.
This command is an anachronism and usage of this command is mapped to thefollowing pathmap commands:
use is equivalent to pathmap -s
use directory is equivalent to pathmap directory.
whatis CommandIn native mode, the whatis command prints the type of expression or declaration oftype. In Java mode, the whatis command prints the declaration of an identifier. Ifthe identifier is a class, it prints method information for the class, including allinherited methods.
Native Mode Syntax
whatis [-n] [-r] name Print the declaration of the non-type name.
whatis -t [-r] type Print the declaration of the type type
whatis -e [-r] [-d]expression
Print the type of the expression expression.
Appendix C Command Reference 399
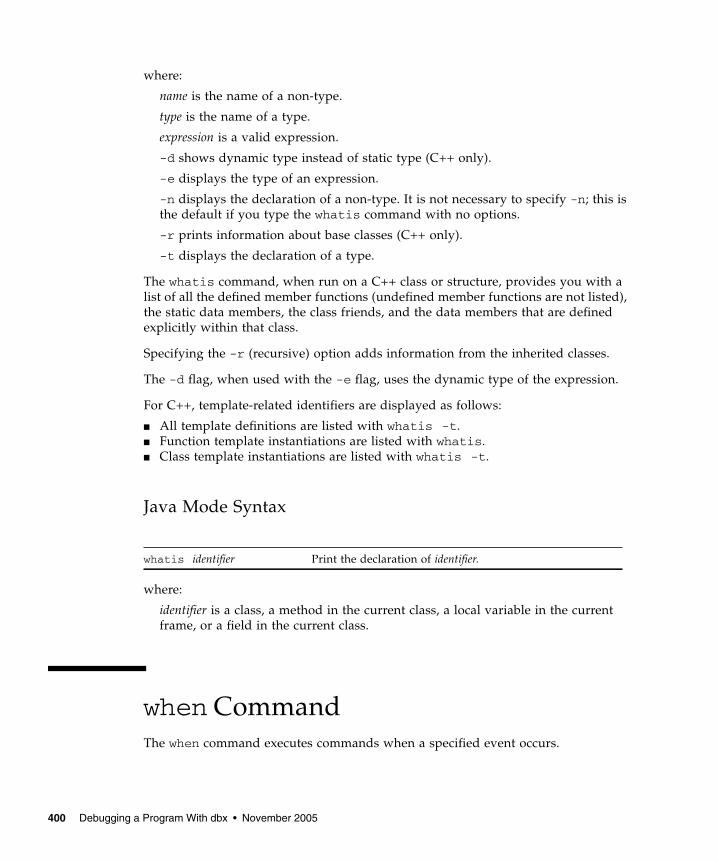
where:
name is the name of a non-type.
type is the name of a type.
expression is a valid expression.
-d shows dynamic type instead of static type (C++ only).
-e displays the type of an expression.
-n displays the declaration of a non-type. It is not necessary to specify -n; this isthe default if you type the whatis command with no options.
-r prints information about base classes (C++ only).
-t displays the declaration of a type.
The whatis command, when run on a C++ class or structure, provides you with alist of all the defined member functions (undefined member functions are not listed),the static data members, the class friends, and the data members that are definedexplicitly within that class.
Specifying the -r (recursive) option adds information from the inherited classes.
The -d flag, when used with the -e flag, uses the dynamic type of the expression.
For C++, template-related identifiers are displayed as follows:
■ All template definitions are listed with whatis -t.■ Function template instantiations are listed with whatis.■ Class template instantiations are listed with whatis -t.
Java Mode Syntax
where:
identifier is a class, a method in the current class, a local variable in the currentframe, or a field in the current class.
when CommandThe when command executes commands when a specified event occurs.
whatis identifier Print the declaration of identifier.
400 Debugging a Program With dbx • November 2005

If dbx is in Java mode and you want to set a when breakpoint in native code, switchto Native mode using the joff command (see “joff Command” on page 344) orprefix the when command with native (see “native Command” on page 357).
If dbx is in JNI mode and you want to set a when breakpoint in Java code, prefix thewhen command with java (see “java Command” on page 343).
Syntax
The when command has the following general syntax:
when event-specification [ modifier ]{ command; ... }
When the specified event occurs, the commands are executed.
Native Mode Syntax
The following specific syntaxes are valid in native mode:
where:
line_number is the number of a source code line.
command is the name of a command.
procedure is the name of a procedure.
when at line_number { command; } Execute command(s) when line_number isreached.
when in procedure { command; } Execute command(s) when procedure is called.
Appendix C Command Reference 401

Java Mode Syntax
The following specific syntaxes are valid in Java mode.
class_name is the name of a Java class, using either the package path (using period(.) as a qualifier; for example, test1.extra.T1.Inner) or the full path name(preceded by a pound sign (#) and using slash (/) and dollar sign ($) as qualifiers;for example, #test1/extra/T1$Inner). Enclose class_name in quotation marksif you use the $ qualifier.
file_name is the name of a file.
line_number is the number of a source code line.
method_name is the name of a Java method.
parameters are the method’s parameters.
For a list and the syntax of all events, see “Setting Event Specifications” on page 281.
See “wheni Command” on page 402 for executing commands on given low-levelevent.
wheni CommandThe wheni command executes commands when a given low-level event occurs. It isvalid only in native mode.
The wheni command has the following general syntax:
Syntax
wheni event-specification [ modifier ]{ command ... ; }
When the specified event occurs, the commands are executed.
when at line_number Execute command(s) when source line_number is reached.
when atfile_name.line_number
Execute command(s) when file_name.line_number isreached.
when inclass_name.method_name
Execute command(s) when class_name.method_name iscalled.
when inclass_name.method_name([parameters])
Execute command(s) whenclass_name.method_name([parameters]) is called.
402 Debugging a Program With dbx • November 2005

The following specific syntax is valid:
where:
address is any expression resulting in or usable as an address.
command is the name of a command.
For a list and the syntax of all events see “Setting Event Specifications” on page 281.
where CommandThe where command prints the call stack.
Native Mode Syntax
where:
number is a number of call stack frames.
Any of the above forms may be followed by a thread or LWP ID to obtain thetraceback for the specified entity.
wheni at address {command; }
Execute command(s) when address is reached.
where Print a procedure traceback.
where number Print the number top frames in the traceback.
where -f number Start traceback from frame number.
where -h Include hidden frames.
where -l Include library name with function name
where -q Quick traceback (only function names).
where -v Verbose traceback (include function args and line info).
Appendix C Command Reference 403

Java Mode Syntax
where:
number is a number of call stack frames.
thread_id is a dbx-style thread ID or the Java thread name specified for the thread.
whereami CommandThe whereami command displays the current source line. It is valid only in nativemode.
Syntax
whereis CommandThe whereis command prints all uses of a given name, or symbolic name of anaddress. It is valid only in native mode.
where [thread_id] Print a method traceback.
where [thread_id] number Print the number top frames in the traceback.
where -f [thread_id]number
Start traceback from frame number.
where -q [thread_id] Quick trace back (only method names).
where -v [thread_id] Verbose traceback (include method arguments and lineinformation).
whereami Display the source line corresponding to the current location(top of the stack), and the source line corresponding to thecurrent frame, if different.
whereami -instr Same as above, except that the current disassembledinstruction is printed instead of the source line.
404 Debugging a Program With dbx • November 2005
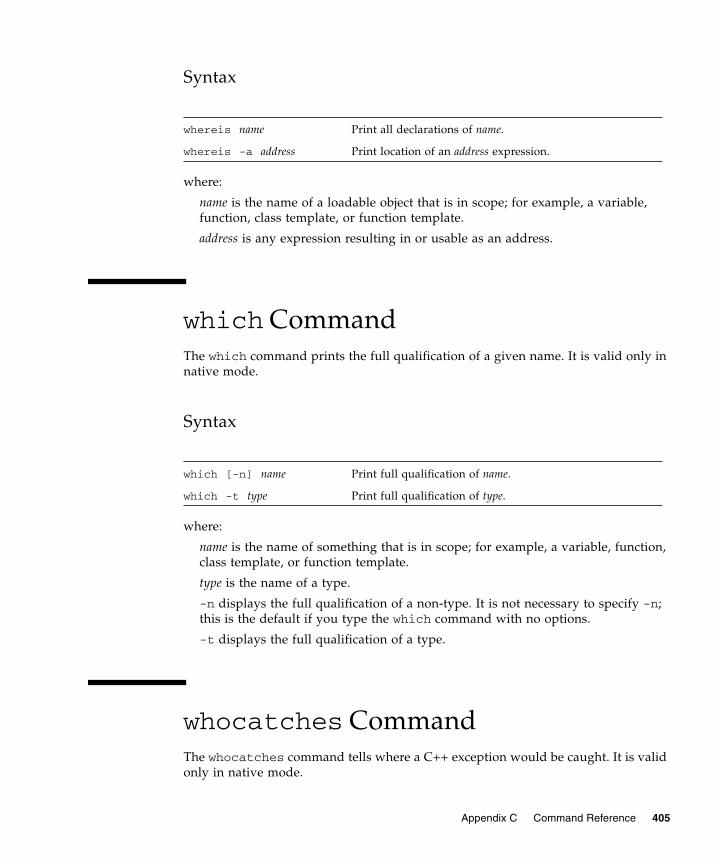
Syntax
where:
name is the name of a loadable object that is in scope; for example, a variable,function, class template, or function template.
address is any expression resulting in or usable as an address.
which CommandThe which command prints the full qualification of a given name. It is valid only innative mode.
Syntax
where:
name is the name of something that is in scope; for example, a variable, function,class template, or function template.
type is the name of a type.
-n displays the full qualification of a non-type. It is not necessary to specify -n;this is the default if you type the which command with no options.
-t displays the full qualification of a type.
whocatches CommandThe whocatches command tells where a C++ exception would be caught. It is validonly in native mode.
whereis name Print all declarations of name.
whereis -a address Print location of an address expression.
which [-n] name Print full qualification of name.
which -t type Print full qualification of type.
Appendix C Command Reference 405
Syntax
where:
type is the type of an exception.
whocatches type Tell where (if at all) an exception of type type would becaught if thrown at the current point of execution.Assume the next statement to be executed is a throw xwhere x is of type type, and display the line number,function name, and frame number of the catch clausethat would catch it.Will return "type is unhandled" if the catch point is inthe same function that is doing the throw.
406 Debugging a Program With dbx • November 2005

Index
Symbols:: (double-colon) C++ operator, 79
Aaccess checking, 142access event, 283accessible documentation, 33adb command, 258, 303adb mode, 258address
current, 76display format, 251examining contents at, 249
adjusting default dbx settings, 65alias command, 57AMD64 registers, 264array_bounds_check environment variable, 67arrays
bounds, exceeding, 218evaluating, 127Fortran, 221Fortran 95 allocatable, 222slicing, 128, 131
syntax for C and C++, 128syntax for Fortran, 129
striding, 128, 132syntax for slicing, striding, 128
assembly language debugging, 249assign command, 127, 175, 176, 276, 303assigning a value to a variable, 127, 276at event, 282
attach command, 78, 94, 304attach event, 290attached process, using runtime checking on, 159attaching
dbx to a new process while debugging anexisting process, 95
dbx to a running child process, 183dbx to a running process, 54, 94
when dbx is not already running, 95
Bbackquote operator, 79bcheck command, 163
examples, 163syntax, 163
bind command, 269block local operator, 80breakpoints
clearing, 114defined, 43, 101deleting, using handler ID, 114disabling, 115enabling, 115enabling after event occurs, 301event efficiency, 115event specifications, 282In Function, 103In Object, 106listing, 114multiple, setting in nonmember functions, 105On Value Change, 108overview, 101
407

restrictions on, 113setting
at a line, 43, 102at a member function of a template class or at
a template function, 210at all instances of a function template, 210at an address, 258at class template instantiations, 204, 209at function template instantiations, 204, 209in a function, 43, 103in a shared library, 113in an explicitly loaded library, 273in member functions of different classes, 104in member functions of the same class, 105in objects, 106in shared libraries, 273machine level, 257multiple breaks in C++ code, 104on code that has not yet been loaded by the
JVM software, 238with filters that contain function calls, 111
setting filters on, 109stop type, 101
determining when to set, 73trace type, 102when type, 102
setting at a line, 113bsearch command, 306
CC application that embeds a Java application,
debugging, 236C source files, specifying the location of, 237C++
ambiguous or overloaded functions, 75backquote operator, 79class
declarations, looking up, 85definition, looking up, 87displaying all the data members directly
defined by, 125displaying all the data members inherited
from, 125printing the declaration of, 87seeing inherited members, 87viewing, 85
compiling with the -g option, 57compiling with the -g0 option, 57
double-colon scope resolution operator, 79exception handling, 200function template instantiations, listing, 85inherited members, 87mangled names, 82object pointer types, 124printing, 124setting multiple breakpoints, 104template debugging, 204template definitions
displaying, 85fixing, 176
tracing member functions, 112unnamed arguments, 125using dbx with, 199
C++ application that embeds a Java applicationdebugging, 236
C++ source files, specifying the location of, 237call command, 98, 99, 210, 277, 306call stack, 117
defined, 117deleting
all frame filters, 120frames, 120
finding your place on, 117frame, defined, 117hiding frames, 120looking at, 45moving
down, 119to a specific frame in, 119up, 118
popping, 119, 174, 277one frame of, 176
removing the stopped in function from, 119walking, 76, 118
callinga function, 98, 99a function instantiation or a member function of
a class template, 210a procedure, 277member template functions, 204
cancel command, 307case sensitivity, Fortran, 214catch blocks, 200catch command, 195, 196, 308catch signal list, 195
408 Debugging a Program With dbx • November 2005

catching exceptions of a specific type, 201change event, 284changing
a function not yet called, 174an executed function, 173default signal lists, 195function currently being executed, 174function presently on the stack, 174variables after fixing, 175
check command, 47, 138, 308checkpoints, saving a series of debugging runs
as, 63child process
attaching dbx to, 183debugging, 183interacting with events, 185using runtime checking on, 155
choosing among multiple occurrences of asymbol, 75
class template instantiations, printing a list of, 204,207
classesdisplaying all the data members directly defined
by, 125displaying all the data members inherited
from, 125looking up declarations of, 85looking up definitions of, 87printing the declarations of, 87seeing inherited members, 87viewing, 85
CLASSPATHX environment variable, 67, 232clear command, 311clearing breakpoints, 114code compiled without -g option, 58collector archive command, 313collector command, 312collector dbxsample command, 313collector disable command, 314collector enable command, 314collector heaptrace command, 314collector hw_profile command, 315collector limit command, 315collector mpitrace command, 316collector pause command, 316collector profile command, 316
collector resume command, 317collector sample command, 317collector show command, 318collector status command, 318collector store command, 318collector synctrace command, 319collector version command, 319commands
adb, 258, 303alias, 57assign, 127, 175, 176, 276, 303attach, 94, 304bcheck, 163bind, 269bsearch, 306call, 98, 99, 210, 277, 306cancel, 307catch, 195, 196, 308check, 47, 138, 308clear, 311collector, 312collector archive, 313collector dbxsample, 313collector disable, 314collector enable, 314collector heaptrace, 314collector hw_profile, 315collector limit, 315collector mpitrace, 316collector pause, 316collector profile, 316collector resume, 317collector sample, 317collector show, 318collector status, 318collector store, 318collector synctrace, 319collector version, 319cont, 97, 139, 173, 174, 176, 181, 278, 320
limitations for files compiled withoutdebugging information, 172
dalias, 320dbx, 49, 54, 321dbxenv, 57, 67, 324debug, 51, 94, 183, 324delete, 327detach, 60, 96, 327dis, 76, 253, 328
Index 409

display, 126, 329down, 119, 330dump, 331
using on OpenMP code, 191edit, 331entering in adb(1) syntax, 258examine, 76, 250, 332exception, 200, 334exists, 334file, 74, 76, 334files, 335fix, 172, 173, 278, 336
effects of, 173limitations for files compiled without
debugging information, 172fixed, 336frame, 119, 337func, 74, 76, 337funcs, 338gdb, 339handler, 281, 340hide, 120, 340ignore, 194, 195, 341import, 342intercept, 201, 342java, 343jclasses, 343joff, 344jon, 344jpkgs, 344kill, 60, 146, 345language, 345line, 76, 346list, 75, 76, 211, 347listi, 253, 349loadobject, 349loadobject -dumpelf, 350loadobject -exclude, 350loadobject -hide, 351loadobject -list, 351loadobject -load, 352loadobject -unload, 352loadobject -use, 353lwp, 353lwps, 182, 354mmapfile, 354module, 90, 355modules, 90, 91, 356native, 357
next, 96, 357nexti, 255, 359pathmap, 56, 91, 173, 359pop, 78, 120, 176, 277, 361print, 124, 126, 128, 129, 211, 277, 362proc, 364process control, 93prog, 365quit, 365regs, 258, 366replay, 61, 64, 367rerun, 367restore, 61, 64, 368rtc -showmap, 369run, 93, 369runargs, 370save, 61, 371scopes, 372search, 372showblock, 137, 372showleaks, 146, 149, 150, 153, 373showmemuse, 150, 374source, 374status, 375step, 96, 200, 375step to, 44, 96, 377step up, 96, 376stepi, 255, 377stop, 209, 210, 378stop change, 108stop inclass, 105stop inmember, 104stopi, 257, 383suppress, 139, 152, 154, 383sync, 386syncs, 386that alter the state of your program, 276thread, 180, 386threads, 180, 388trace, 112, 390tracei, 256, 393uncheck, 138, 394undisplay, 127, 395unhide, 120, 396unintercept, 202, 396unsuppress, 152, 154, 397up, 118, 398use, 399whatis, 85, 87, 125, 208, 399
410 Debugging a Program With dbx • November 2005

when, 113, 278, 280, 400wheni, 402where, 118, 220, 403whereami, 404whereis, 82, 123, 207, 404which, 75, 83, 123, 405whocatches, 202, 405x, 250
compilers, accessing, 28compiling
optimized code, 57with the -g option, 57with the -O option, 57your code for debugging, 37
cond event, 285cont command, 97, 139, 173, 174, 176, 181, 278, 320
limitations for files compiled without debugginginformation, 172
continuing execution of a program, 97after fixing, 173at a specified line, 97, 278
controlling the speed of a trace, 112core file
debugging, 42, 50debugging mismatched, 52examining, 41
core_lo_pathmap environment variable, 67-count event specification modifier, 294creating
a .dbxrc file, 66event handlers, 280
current address, 76current procedure and file, 213customizing dbx, 65
Ddalias command, 320data change event specifications, 283data member, printing, 86dbx command, 49, 54, 321dbx commands
Java expression evaluation in, 244static and dynamic information used by when
debugging Java code, 245using in Java mode, 244valid only in Java mode, 248
with different syntax in Java mode, 247with identical syntax and functionality in Java
mode and native mode, 246dbx environment variables, 67
and the Korn shell, 72array_bounds_check, 67CLASSPATHX, 67, 232core_lo_pathmap, 67disassembler_version, 67fix_verbose, 67follow_fork_inherit, 67, 185follow_fork_mode, 68, 155, 184follow_fork_mode_inner, 68for Java debugging, 232input_case_sensitive, 68, 214JAVASRCPATH, 68, 232jdbx_mode, 68, 232jvm_invocation, 68, 232language_mode, 68mt_scalable, 68output_auto_flush, 69output_base, 69output_class_prefix, 69output_derived_type, 125output_dynamic_type, 69, 200output_inherited_members, 69output_list_size, 69output_log_file_name, 69output_max_string_length, 69output_pretty_print, 69output_short_file_name, 69overload_function, 69overload_operator, 69pop_auto_destruct, 69proc_exclusive_attach, 69rtc_auto_continue, 69, 139, 164rtc_auto_suppress, 69, 153rtc_biu_at_exit, 70, 150rtc_error_limit, 70, 153rtc_error_log_file_name, 70, 139, 164rtc_error_stack, 70rtc_inherit, 70rtc_mel_at_exit, 70run_autostart, 70run_io, 70run_pty, 70run_quick, 70run_savetty, 71run_setpgrp, 71
Index 411

scope_global_enums, 71scope_look_aside, 71, 84session_log_file_name, 71setting with the dbxenv command, 66stack_find_source, 71, 78stack_max_size, 71stack_verbose, 71step_abflow, 71step_events, 71, 115step_granularity, 72, 97suppress_startup_message, 72symbol_info_compression, 72trace_speed, 72, 112
dbx modes for debugging Java code, 242dbx, starting, 49
startup options, 323with core file name, 50with process ID only, 55
dbxenv command, 57, 67, 324.dbxrc file, 65
creating, 66sample, 66use at dbx startup, 55, 65
dbxrc file, use at dbx startup, 55, 65debug command, 51, 78, 94, 183, 324debugging
assembly language, 249child processes, 183code compiled without -g option, 58core file, 42, 50machine-instruction level, 249, 255mismatched core file, 52multithreaded programs, 177optimized code, 58
debugging informationfor a module, reading in, 90for all modules, reading in, 90
debugging runsaved
replaying, 64restoring, 63
saving, 61declarations, looking up (displaying), 85delete command, 327deleting
all call stack frame filters, 120call stack frames, 120
specific breakpoints using handler IDs, 114dereferencing a pointer, 126detach command, 60, 96, 327detach event, 290detaching
a process from dbx, 60, 95a process from dbx and leaving it in a stopped
state, 96determining
cause of floating point exception (FPE), 197location of floating point exception (FPE), 196number of instructions executed, 301number of lines executed, 300the granularity of source line stepping, 97where your program is crashing, 41which symbol dbx uses, 83
differences between Korn shell and dbxcommands, 267
dis command, 76, 253, 328-disable event specification modifier, 294disassembler_version environment
variable, 67display command, 126, 329displaying
a stack trace, 121all the data members directly defined by a
class, 125all the data members inherited from a base
class, 125an unnamed function argument, 126declarations, 85definitions of templates and instances, 204inherited members, 87source code for function template
instantiations, 205symbols, occurrences of, 82template definitions, 85the definitions of templates and instances, 208type of an exception, 200variable type, 86variables and expressions, 126
dlopen event, 285dlopen()
restrictions on breakpoints, 113setting a breakpoint, 113
documentation index, 31documentation, accessing, 31 to 34
412 Debugging a Program With dbx • November 2005

down command, 78, 119, 330dump command, 331
using on OpenMP code, 191dynamic linker, 271
Eedit command, 331enabling a breakpoint after an event occurs, 301error suppression, 152, 153
default, 154examples, 153types, 152
establishing a new mapping from directory todirectory, 56, 92
evaluatinga function instantiation or a member function of
a class template, 211an unnamed function argument, 126arrays, 127
event counters, 281event handler
hiding, 295retaining across debugging sessions, 295
event handlerscreating, 280manipulating, 281setting, examples, 299
event specification modifiers-count, 294-disable, 294-hidden, 295-if, 293-in, 294-instr, 295-lwp, 295-perm, 295-resumeone, 111, 294-temp, 294-thread, 295
event specifications, 257, 279, 280, 281access, 283at, 282attach, 290change, 284cond, 285detach, 290dlopen, 285
exit, 288fault, 286for breakpoint events, 282for data change events, 283for execution progress events, 288for other types of events, 290for system events, 285in, 282inclass, 283infunction, 283inmethod, 283inobject, 283keywords, defined, 281lastrites, 290lwp_exit, 286modifiers, 293next, 289prog_gone, 291prog_new, 291returns, 289setting, 281sig, 287step, 289stop, 291sync, 291syncrtld, 292sysin, 287sysout, 288thr_create, 181, 292thr_exit, 181, 292throw, 292, 293timer, 293using predefined variables, 296
event spedificationsinmember, 283inmethod, 283
eventsambiguity, 295child process interaction with, 185parsing, 295
event-specific variables, 297examine command, 76, 250, 332examining the contents of memory, 249exception command, 200, 334exception handling, 200
examples, 202exceptions
floating point, determining cause of, 197
Index 413

floating point, determining location of, 196in Fortran programs, locating, 219of a specific type, catching, 201removing types from intercept list, 202reporting where type would be caught, 202type of, displaying, 200
exec function, following, 184execution progress event specifications, 288exists command, 334exit event, 288experiments
limiting the size of, 316expressions
complex, Fortran, 224displaying, 126interval, Fortran, 225monitoring changes, 126monitoring the value of, 126printing the value of, 124, 277turning off the display of, 127
Ffault event, 286fflush(stdout), after dbx calls, 99field type
displaying, 86printing, 86
file command, 74, 76, 79, 334files
finding, 56, 91location of, 91navigating to, 74qualifying name, 79
files command, 335finding
object files, 56, 91source files, 56, 91your place on the call stack, 117
fix and continue, 171how it operates, 172modifying source code using, 172restrictions, 172using with runtime checking, 160using with shared objects, 272
fix command, 172, 173, 278, 336effects of, 173limitations for files compiled without debugging
information, 172fix_verbose environment variable, 67fixed command, 336fixing
C++ template definitions, 176shared objects, 172your program, 173, 278
floating point exception (FPE)catching, 302determining cause of, 197determining location of, 196
follow_fork_inherit environmentvariable, 67, 185
follow_fork_mode environment variable, 68,155, 184
follow_fork_mode_inner environmentvariable, 68
followingthe exec function, 184the fork function, 184
fork function, following, 184Fortran
allocatable arrays, 222array slicing syntax for, 129case sensitivity, 214complex expressions, 224derived types, 227interval expressions, 225intrinsic functions, 223logical operators, 226structures, 227
FPE signal, trapping, 196frame command, 78, 119, 337frame, defined, 117func command, 74, 76, 79, 337funcs command, 338function argument, unnamed
displaying, 126evaluating, 126
function template instantiationsdisplaying the source code for, 205printing a list of, 204, 207printing the values of, 205
functionsambiguous or overloaded, 75calling, 98, 99
414 Debugging a Program With dbx • November 2005

currently being executed, changing, 174executed, changing, 173instantiation
calling, 210evaluating, 211printing source listing for, 211
intrinsic, Fortran, 223looking up definitions of, 85member of a class template, calling, 210member of class template, evaluating, 211navigating to, 74not yet called, changing, 174obtaining names assigned by the compiler, 125presently on the stack, changing, 174qualifying name, 79setting breakpoints in, 103setting breakpoints in C++ code, 105
G-g compiler option, 57gdb command, 339
Hhandler command, 281, 340handler id, defined, 280handlers, 279
creating, 280enabling while within a function, 300
header file, modifying, 176-hidden event specification modifier, 295hide command, 120, 340hiding call stack frames, 120
I-if event specification modifier, 293ignore command, 194, 195, 341ignore signal list, 195import command, 342in event, 282-in event specification modifier, 294In Function breakpoint, 103In Object breakpoint, 106inclass event, 283infunction event, 283inherited members
displaying, 87seeing, 87
inmember event, 283inmethod event, 283inobject event, 283input_case_sensitive environment
variable, 68, 214instances, displaying the definitions of, 204, 208-instr event specification modifier, 295Intel registers, 262intercept command, 201, 342invocation options, 323
JJAR file, debugging, 234Java applications
attaching dbx to, 235specifying custom wrappers for, 240starting to debug, 233that require 64-bit libraries, 236types you can debug with dbx, 233with wrappers, debugging, 235
Java class file, debugging, 233Java code
capabilities of dbx with, 231dbx modes for debugging, 242limitations of dbx with, 232using dbx with, 231
java command, 343Java debugging, environment variables for, 232Java source files, specifying the location of, 237JAVASRCPATH environment variable, 68, 232jclasses command, 343jdbx_mode environment variable, 68, 232joff command, 344jon command, 344jpkgs command, 344JVM software
customizing startup of, 238passing run arguments to, 236, 240specifying 64-bit, 242specifying a path name for, 239
jvm_invocation environment variable, 68, 232
Kkey bindings for editors, displaying or
modifying, 269kill command, 60, 146, 345
Index 415

killingprogram, 60program only, 60
Korn shelldifferences from dbx, 267extensions, 268features not implemented, 267renamed commands, 268
Llanguage command, 345language_mode environment variable, 68lastrites event, 290LD_AUDIT, 159libraries
dynamically linked, setting breakpoints in, 113shared, compiling for dbx, 59
librtc.so, preloading, 159librtld_db.so, 272libthread.so, 177libthread_db.so, 177limiting the experiment size, 316line command, 76, 346link map, 272linker names, 82list command, 75, 76, 78, 211, 347listi command, 253, 349listing
all program modules that contain debugginginformation, 91
breakpoints, 114C++ function template instantiations, 85debugging information for modules, 90names of all program modules, 91names of modules containing debugging
information that have already been read intodbx, 91
signals currently being ignored, 195signals currently being trapped, 195traces, 114
loading your program, 38loadobject command, 349loadobject -dumpelf command, 350loadobject -exclude command, 350loadobject -hide command, 351loadobject -list command, 351
loadobject -load command, 352loadobject -unload command, 352loadobject -use command, 353loadobject, defined, 271looking up
definitions of classes, 87definitions of functions, 85definitions of members, 85definitions of types, 87definitions of variables, 85the this pointer, 86
lwp command, 353-lwp event specification modifier, 295lwp_exit event, 286LWPs (lightweight processes), 177
information displayed for, 182showing information about, 182
lwps command, 182, 354
Mmachine-instruction level
address, setting breakpoint at, 258AMD64 registers, 264debugging, 249Intel registers, 262printing the value of all the registers, 258setting breakpoint at address, 257single stepping, 255SPARC registers, 261tracing, 256
man pages, accessing, 28manipulating event handlers, 281MANPATH environment variable, setting, 30member functions
printing, 86setting multiple breakpoints in, 104tracing, 112
member template functions, 204members
declarations, looking up, 85looking up declarations of, 85looking up definitions of, 85viewing, 85
memoryaddress display formats, 251display modes, 249
416 Debugging a Program With dbx • November 2005

examining contents at address, 249states, 142
memory accesschecking, 142
turning on, 47, 138error report, 143errors, 143, 166
memory leakchecking, 144, 146
turning on, 47, 137, 138errors, 145, 169fixing, 150report, 147
memory use checking, 150turning on, 47, 137, 138
mmapfile command, 354modifying a header file, 176module command, 90, 355modules
all program, listing, 91containing debugging information that have
already been read into dbx, listing, 91current, printing the name of, 90listing debugging information for, 90that contain debugging information, listing, 91
modules command, 90, 91, 356monitoring the value of an expression, 126moving
down the call stack, 119to a specific frame in the call stack, 119up the call stack, 118
mt_scalable environment variable, 68multithreaded programs, debugging, 177
Nnative command, 357navigating
through functions by walking the call stack, 76to a file, 74to functions, 74
next command, 96, 357next event, 289nexti command, 255, 359
Oobject files
finding, 56, 91object pointer types, 124obtaining the function name assigned by the
compiler, 125OpenMP application programming interface, 187OpenMP code
dbx functionality available for, 189execution sequence of, 191printing shared, private, and threadprivate
variables in, 189single stepping in, 189transformation by compilers, 188using stack traces with, 190using the dump command on, 191
operatorsbackquote, 79block local, 80C++ double colon scope resolution, 79
optimized codecompiling, 57debugging, 58
output_auto_flush environment variable, 69output_base environment variable, 69output_class_prefix environment variable, 69output_derived_type environment
variable, 125output_dynamic_type environment
variable, 69, 200output_inherited_members environment
variable, 69output_list_size environment variable, 69output_log_file_name environment
variable, 69output_max_string_length environment
variable, 69output_pretty_print environment variable, 69output_short_file_name environment
variable, 69overload_function environment variable, 69overload_operator environment variable, 69
PPATH environment variable, setting, 29pathmap command, 56, 91, 173, 359
Index 417

-perm event specification modifier, 295pointers
dereferencing, 126printing, 230
pop command, 78, 120, 176, 277, 361pop_auto_destruct environment variable, 69popping
one frame of the call stack, 176the call stack, 119, 174, 277
predefined variables for event specification, 296preloading librtc.so, 159print command, 124, 126, 128, 129, 211, 277, 362printing
a list of all class and function templateinstantiations, 204, 207
a list of occurrences of a symbol, 82a pointer, 230a source listing, 75arrays, 127data member, 86field type, 86list of all known threads, 180list of threads normally not printed
(zombies), 180member functions, 86shared, private, and threadprivate variables in
OpenMP code, 189the declaration of a type or C++ class, 87the name of the current module, 90the source listing for the specified function
instantiation, 211the value of a variable or expression, 124the value of all the machine-level registers, 258the value of an expression, 277values of function template instantiations, 205variable type, 86
proc command, 364proc_exclusive_attach environment
variable, 69proc_gone event, 291procedure linkage tables, 272procedure, calling, 277process
attached, using runtime checking on, 159child
attaching dbx to, 183using runtime checking on, 155
detaching from dbx, 60, 95detaching from dbx and leaving in a stopped
state, 96running, attaching dbx to, 94, 95stopping execution, 60stopping with Ctrl+C, 100
process control commands, definition, 93prog command, 365prog_new event, 291program
continuing execution of, 97after fixing, 173at a specified line, 278
fixing, 173, 278killing, 60multithreaded
debugging, 177resuming execution of, 181
resuming execution of at a specific line, 98running, 93
under dbx, impacts of, 275with runtime checking turned on, 139
single stepping through, 97status, checking, 302stepping through, 96stopping execution
if a conditional statement evaluates totrue, 109
if the value of a specified variable haschanged, 108
stripped, 59
Qqualifying symbol names, 79quit command, 365quitting a dbx session, 59quitting dbx, 48
Rreading a stack trace, 121reading in
debugging information for a module, 90debugging information for all modules, 90
registersAMD64 architecture, 264Intel architecture, 262printing the value of, 258
418 Debugging a Program With dbx • November 2005

SPARC architecture, 261regs command, 258, 366removing
exception types from intercept list, 202the stopped in function from the call stack, 119
replay command, 61, 64, 367replaying a saved debugging run, 64reporting where an exception type would be
caught, 202rerun command, 367resetting application files for replay, 302restore command, 61, 64, 368restoring a saved debugging run, 63-resumeone event specification modifier, 111, 294resuming
execution of a multithreaded program, 181program execution at a specific line, 98
returns event, 289rtc -showmap command, 369rtc_auto_continue environment variable, 69,
139, 164rtc_auto_suppress environment variable, 69,
153rtc_biu_at_exit environment variable, 70rtc_error_limit environment variable, 70, 153rtc_error_log_file_name environment
variable, 70, 139, 164rtc_error_stack environment variable, 70rtc_inherit environment variable, 70rtc_mel_at_exit environment variable, 70rtld, 271run command, 93, 369run_autostart environment variable, 70run_io environment variable, 70run_pty environment variable, 70run_quick environment variable, 70run_savetty environment variable, 71run_setpgrp environment variable, 71runargs command, 370running a program, 40, 93
in dbx without arguments, 40, 94with runtime checking turned on, 139
runtime checking8 megabyte limit on non-UltraSPARC
processors, 165a child process, 155access checking, 142an attached process, 159application programming interface, 162error suppression, 152errors, 166fixing memory leaks, 150limitations, 137memory access
checking, 142error report, 143errors, 143, 166
memory leakchecking, 144, 146error report, 147errors, 145, 169
memory use checking, 150possible leaks, 145requirements, 136suppressing errors, 152
default, 154examples, 153
suppression of last error, 153troubleshooting tips, 164turning off, 138types of error suppression, 152using fix and continue with, 160using in batch mode, 162
directly from dbx, 164when to use, 136
Ssample .dbxrc file, 66save command, 61, 371saving
debugging run to a file, 61, 63series of debugging runs as checkpoints, 63
scopechanging the visiting, 78current, 73, 77defined, 76lookup rules, relaxing, 84visiting, 77
changing, 78components of, 77
scope resolution operators, 79scope resolution search path, 84
Index 419

scope_global_enums environment variable, 71scope_look_aside environment variable, 71, 84scopes command, 372search command, 372segmentation fault
finding line number of, 218Fortran, causes, 217generating, 218
selecting from a list of C++ ambiguous functionnames, 75
session, dbxquitting, 59starting, 49
session_log_file_name environmentvariable, 71
settinga trace, 112breakpoints
at a member function of a template class or ata template function, 210
at all instances of a function template, 210in member functions of different classes, 104in member functions of the same class, 105in objects, 106on code that has not yet been loaded by the
JVM software, 238with filters that contain function calls, 111
dbx environment variables with the dbxenvcommand, 66
filters on breakpoints, 109multiple breakpoints in nonmember
functions, 105shared libraries
compiling for dbx, 59setting breakpoints in, 273
shared objectsfixing, 172using fix and continue with, 272
shell prompts, 28showblock command, 137, 372showleaks command, 146, 149, 150, 153, 373showmemuse command, 150, 374sig event, 287signals
cancelling, 193catching, 195changing default lists, 195
forwarding, 194FPE, trapping, 196handling automatically, 198ignoring, 195listing those currently being ignored, 195listing those currently being trapped, 195names that dbx accepts, 195sending in a program, 197
single steppingat the machine-instruction level, 255through a program, 97
slicingarrays, 131C and C++ arrays, 128Fortran arrays, 129
source command, 374source files, finding, 56, 91source listing, printing, 75SPARC registers, 261specifying a path for class files that use custom class
loaders, 237stack frame, defined, 117stack trace, 220
displaying, 121example, 121, 122reading, 121using on OpenMP code, 190
stack_find_source environment variable, 71,78
stack_max_size environment variable, 71stack_verbose environment variable, 71starting dbx, 38startup options, 323status command, 375step command, 96, 200, 375step event, 289step to command, 44, 96, 377step up command, 96, 376step_abflow environment variable, 71step_events environment variable, 71, 115step_granularity environment variable, 72, 97stepi command, 255, 377stepping through a program, 44, 96stop at command, 102, 103stop change command, 108
420 Debugging a Program With dbx • November 2005

stop command, 209, 210, 378stop event, 291stop inclass command, 105stop inmember command, 104stopi command, 257, 383stopping
a process with Ctrl+C, 100in all member functions of a template class, 209process execution, 60program execution
if a conditional statement evaluates totrue, 109
if the value of a specified variable haschanged, 108
striding across slices of arrays, 132stripped programs, 59suppress command, 139, 152, 154, 383suppress_startup_message environment
variable, 72suppression of last error, 153symbol names, qualifying scope, 79symbol_info_compression environment
variable, 72symbols
choosing among multiple occurrences of, 75determining which dbx uses, 83printing a list of occurrences, 82
sync command, 386sync event, 291syncrtld event, 292syncs command, 386sysin event, 287sysout event, 288system event specifications, 285
T-temp event specification modifier, 294templates
class, 204stopping in all member functions of, 209
displaying the definitions of, 204, 208function, 204instantiations, 204
printing a list of, 204, 207looking up declarations of, 87
thr_create event, 181, 292
thr_exit event, 181, 292thread
resuming only the first in which a breakpointwas hit, 111
thread command, 180, 386thread creation, understanding, 181-thread event specification modifier, 295threads
current, displaying, 180information displayed for, 178list, viewing, 180other, switching viewing context to, 180printing list of all known, 180printing list of normally not printed
(zombies), 180switching to by thread id, 180
threads command, 180, 388throw event, 292, 293timer event, 293trace command, 112, 390trace output, directing to a file, 113trace_speed environment variable, 72, 112tracei command, 256, 393traces
controlling speed of, 112implementing, 300listing, 114setting, 112
tracing at the machine-instruction level, 256trip counters, 281troubleshooting tips, runtime checking, 164turning off
runtime checking, 138the display of a particular variable or
expression, 127the display of all currently monitored
variables, 127turning on
memory access checking, 47, 138memory leak checking, 138memory use checking, 47, 137, 138
typesdeclarations, looking up, 85derived, Fortran, 227looking up declarations of, 85looking up definitions of, 87
Index 421

printing the declaration of, 87viewing, 85
typographic conventions, 27
Uuncheck command, 138, 394undisplay command, 127, 395unhide command, 120, 396unintercept command, 202, 396unsuppress command, 152, 154, 397up command, 78, 118, 398use command, 399
Vvariable type, displaying, 86variables
assigning values to, 127, 276changing after fixing, 175declarations, looking up, 85determining which dbx is evaluating, 123displaying functions and files in which
defined, 123event specific, 297, 298examining, 46looking up declarations of, 85looking up definitions of, 85monitoring changes, 126outside of scope, 124printing the value of, 124qualifying names, 79turning off the display of, 127viewing, 85
verifying which variable dbx is evaluating, 123viewing
classes, 85members, 85the context of another thread, 180the threads list, 180types, 85variables, 85
visiting scope, 77changing, 78components of, 77
Wwalking the call stack, 76, 118whatis command, 85, 87, 125, 208, 399when breakpoint at a line, setting, 113when command, 113, 278, 280, 400wheni command, 402where command, 118, 220, 403whereami command, 404whereis command, 82, 123, 207, 404which command, 75, 83, 123, 405whocatches command, 202, 405
Xx command, 250
422 Debugging a Program With dbx • November 2005