debug interfaces for modern operating systems - …etd.dtu.dk/thesis/267375/bac10_40.pdf · debug...
TRANSCRIPT

Debug Interfaces for Modern OperatingSystems
Niklas Quarfot Nielsen
Kongens Lyngby 2010

Technical University of Denmark
DTU Informatics
Building 321, DK-2800 Kongens Lyngby, Denmark
Phone +45 45253351, Fax +45 45882673
www.imm.dtu.dk
Summary
Defects in software are unavoidable. These defects make system fail every day allover the world. These failures can vary from just being an annoyance for the user tobe life critical. For example a non-responsive media player or web browser comparedto malfunctioning space shuttle software. The discovery, tracing and fixing of defectsin software can be a very tedious and time consuming task. It is estimated thatat least half of the development time used in a software project, is used for tracingand removing bugs. A process which includes debugging. Debugging of operatingsystems can be a even more difficult and tedious task to overcome than debuggingtraditional software. Operating systems is a category of software, which interactsdirectly with the unforgiving environment of the hardware. It must protect it selfagainst misbehaving user processes and malfunctioning hardware. Operating systemsis also one of the most complicated pieces of software which runs on a computer. Thislevel of complexity combined with the harsh environment of the hardware makesit a very difficult job to debug operating systems. This thesis will investigate thepossibilities for kernel debugging, user space debugging and postmortem analysis ofkernel crashes.

ii

Preface
This report is written as a bachelor thesis at Technical University of Denmark (DTU).Readers should at least have knowledge which corresponds to a DTU computer sciencestudent at his/hers 6th semester to get full benefit from the report. Readers arenot expected to be confident with the domain of operating systems, software bugs,hardware support for debugging or user space debugging. This is covered in the reporthowever, prior knowledge to this domain will make it easier to read and understand.
Enjoy
Lyngby, June 2010
Niklas Quarfot Nielsen

iv

Acknowledgements
First of all, I want to thank Sven Karlsson for being advisor on this thesis. He hasbeen a great help in the entire phase and has been tolerant and understanding. He hasprovided constructive feedback during the report writing which has helped bringingit to its current level.
Thanks to my good friend Edward A. Cerullo, for helping me with proof reading. Hisattempt to teach me how to write reports is admirable.
Thanks to another good friend, Bo Stendahl Sørensen. He has also provided con-structive feedback on the report. He did his thesis 6 months ago and has experienceregarding report writing at DTU.
Without you, this thesis would not have been what it is today.

vi

Abstract
Defects in software are unavoidable. These can be very difficult to trace as defectsleaves infections in the program state which may spread. These infections may un-der certain circumstances trigger a fault, but may be hidden for a very long time ornever be discovered. The number of defects and their severity affects the quality ofsoftware, as reliability and correctness must be a minimum requirement. Tools andtechniques to prevent or limit the amount and severity of these defects are wanted.Operating systems are very complex software that interacts directly with the unfor-giving environment of the hardware. It must protect it self against misbehaving userprocesses and defects in hardware. This level of complexity along with the unforgiv-ing environment makes a difficult task to instrument and examine its execution andstate. FenixOS is an operating system being developed at the Technical University ofDenmark and does not incorporate any debugging infrastructure at this point in time.The possibilities for such a framework have been investigated. A debug infrastructurewhich provides remote debugging facilities, debugging of user space processes and fa-cilities to report useful information in case of system crash has been chosen for designand implementation. This gives a sufficient set of primitives for a kernel developerto ease the process of debugging operating systems. This prototype implementationcan be the foundation of a later more complete debugging infrastructure.

viii

Contents
Summary i
Preface iii
Acknowledgements v
Abstract vii
1 Introduction 1
1.1 Problem description . . . . . . . . . . . . . . . . . . . . . . . . . . . . 21.2 Structure . . . . . . . . . . . . . . . . . . . . . . . . . . . . . . . . . . 3
2 Theory 5
2.1 Software defects, infection and failure - bugs . . . . . . . . . . . . . . . 52.2 Debugging . . . . . . . . . . . . . . . . . . . . . . . . . . . . . . . . . . 82.3 Operating systems . . . . . . . . . . . . . . . . . . . . . . . . . . . . . 102.4 Bugs in operating systems . . . . . . . . . . . . . . . . . . . . . . . . . 142.5 Debugging operating systems . . . . . . . . . . . . . . . . . . . . . . . 14
3 Analysis 17
3.1 Hardware support for debugging . . . . . . . . . . . . . . . . . . . . . 173.2 Remote debugging . . . . . . . . . . . . . . . . . . . . . . . . . . . . . 233.3 Debugging interfaces for user level processes . . . . . . . . . . . . . . . 293.4 Postmortem analysis . . . . . . . . . . . . . . . . . . . . . . . . . . . . 32
4 Design 35
4.1 Problem statement . . . . . . . . . . . . . . . . . . . . . . . . . . . . . 354.2 Design proposals . . . . . . . . . . . . . . . . . . . . . . . . . . . . . . 364.3 Debug infrastructure design . . . . . . . . . . . . . . . . . . . . . . . . 37

x CONTENTS
4.4 Project management . . . . . . . . . . . . . . . . . . . . . . . . . . . . 41
5 Implementation 47
5.1 Remote debugging . . . . . . . . . . . . . . . . . . . . . . . . . . . . . 475.2 User space debugging . . . . . . . . . . . . . . . . . . . . . . . . . . . 525.3 Postmortem analysis . . . . . . . . . . . . . . . . . . . . . . . . . . . . 55
6 Evaluation 57
6.1 Remote debugging . . . . . . . . . . . . . . . . . . . . . . . . . . . . . 576.2 User space debugging . . . . . . . . . . . . . . . . . . . . . . . . . . . 646.3 Kernel and user panics . . . . . . . . . . . . . . . . . . . . . . . . . . . 676.4 Summary . . . . . . . . . . . . . . . . . . . . . . . . . . . . . . . . . . 69
7 Discussion 71
8 Conclusion 75

Chapter 1
Introduction
Human error is unavoidable and this is unfortunately applicable to software devel-opment also. It is not necessarily because developers are lazy or inattentive, butbecause the complexity of software is at such a high level the human brain can notfully manage it [Pan, 1999].
When a defect has been introduced to the code by a developer, it may trigger a faultunder certain conditions. A common term for this is software bug.
At least half of total development time for an average software project is used onlocating and removing bugs with testing and debugging [Beizer, 1990]; a processwhich is often difficult and tedious. It is an important phase in a development cycle,as the amount of bugs and their severity affects the quality and reliability of the finalproduct. In the end, this can determine whether a customer chooses your product ornot.
Operating systems are a category of software that interact directly with the hardwareof modern computer systems. They are often very complex and they provide theability to connect hundreds of different kinds of peripherals. This support are oneof the reasons for the high complexity of operating systems and they often consistof millions of lines of code. This level of complexity, along with the unforgivingenvironment of the hardware, make it an even more tedious and time consuming taskto debug operating systems than traditional application software.

2 Introduction
Tools and frameworks can be provided to ease the process of debugging software.They can cut down the time needed for tracing, locating and fixing bugs.
FenixOS is a new operating system which is being developed at the Technical Uni-versity of Denmark. It aims to be a modern operating system prepared for the fu-ture developments in hardware for many core systems. Presently, FenixOS does notprovide any debugging facilities and this complicates development of the operatingsystem.
This thesis will investigate how debugging in operating systems is done, and proposeand motivate a debugging infrastructure for FenixOS.
1.1 Problem description
A debug infrastructure is needed for FenixOS, as none is currently available. Thisdebug infrastructure must be a part of the kernel which runs directly on top ofthe hardware. To control execution of running processes and the kernel, processormanufactures must provide a set of functionalities for debugging support. Thesefunctionalities must be investigated to know what can be provided in the debuginfrastructure.
Operating systems are responsible for operation of the entire hardware system. Whendebugging operating systems, debuggers running on the same machine as the one be-ing debugged may affect its current state. This is because screen and keyboard driversmay change the state of the kernel, which may leave data examination untrustworthy.For this reason, the ability to remotely debug FenixOS and the options available forremote debugging should be investigated.
A user space debugger is a special process that has the ability to spawn or hook intoa debugged process. The debugger can control execution and examine the states ofthe debugged processes. For this to be possible, the underlying operating systemmust provide the ability for the debugger to read the memory of another processand control its execution. This should be done in a controlled manner, as normalprocesses should not be able to interferer with each other. User space debuggingshould be investigated to provide the functionality required.
Operating systems may fail with no indication of error and leave the system in a use-less state. To trace and locate a defect in FenixOS, a system is needed to give enoughinformation to tell where and why the system crashed. Postmortem techniques foranalyzing kernel crashes should be investigated.

1.2 Structure 3
In summary, the following subjects should be investigated.
• Hardware support for debugging
• Remote debugging
• Debugging interfaces for user level code
• Postmortem analysis of kernel crashes
Based on knowledge gathered, a debugging infrastructure for FenixOS should bepresented and a prototype implemented.
1.2 Structure
The report is structured as follows:
• Introduction defines the problem this thesis will investigate. To understandthe thesis, this chapter should be read by all.
• Theory covers the background material needed to understand the core conceptsof operating systems and debugging. Advanced readers who knows the domaincan skip this chapter.
• Analysis lists the alternatives and options for solving the problem defined inthe problem description. This chapter takes decisions based on listed argumen-tation and it should be read by all to understand the design chosen.
• Design will be proposed, based on the analysis. This includes overall designalong with more detailed design of subsystems. To understand rest of the report,this chapter should be read by all as new terms and definitions are mentioned.
• Implementation will contain specific details on the implementation of thedesign proposed. This chapter can be skipped if the reader does not want todelve into technical details.
• Evaluation will contain test results which should argue for the correctness ofthe chosen design and the implemented code. To determine the level of successof the thesis, this chapter should be read by all.
• Discussion will discuss the system implemented. What it lacks and how itshould be improved, and what limitations it has.
• Conclusion will be a summary and an evaluation of the entire thesis. Comparethis to the introduction to get a better overview of the success of the thesis.

4 Introduction

Chapter 2
Theory
This chapter will cover the background needed to understand the domain of thisthesis. The different sections can be read apart from each other or left out, if thereader is already confident with the domain of operating systems, software bugs anddebugging.
2.1 Software defects, infection and failure - bugs
Human error is unavoidable and this is no different for software development.
Errors or flaws in software are often called defects, which originates from the latinword defectus meaning weakened or lacked. Software defects are detected when ac-tivated and this can be experienced as system misbehavior or failure. The severityof these failures can vary from being nonsevere i.e. just being an annoyance to theuser, to be very severe i.e. life critical in for example medical, aerospace or militaryequipment.
An unfortunately long list of software related failures exists which includes loss of hun-dreds of millions of dollars or cause of death [Huckle, 2010]. For example: The radia-tion machine Therac-25 killed 6 patients because of radiation overdose of 100 times thenormal radiation caused by a overflow flaw in the controlling software [Baase, 2008]

6 Theory
Software defects are a major hindrance for the success of a software project. Somedefects may even lead to projects being completely dismissed if the defects are unre-coverable or too expensive to fix.The quality of a product is tightly bound to the amount of defects it contains. Qualityis usually a measure for a products ability to fulfill its specification and requirements.A minimum requirement must be that the product is correct and reliable. This isa requirement which does not necessarily hold if a piece of software contain manyand/or severe defects.
How are these defects introduced? Initially a programmer writes code which aretransformed into a executing program by a compiler. Defects in software must initiallybe introduced by the programmer who wrote the software or the tool which compiledthe executing program. It is usually not the intention of a developer to make defectsin his or her software, however the complexity level of software makes it extremelydifficult to fully manage.
A defect in a piece of software infects the state of it, i.e. puts it in a state the developerdid not expect. This defect may spread around the program and put multiple regionsin an infected state. This is illustrated in figure 2.1.
These infected states may cause the system to fail, produce erroneous results orbehave in an unwanted manner. A defect may be activated only under certain cir-cumstances. This defect may even be activated and not be discovered. This, alongwith the spread of infected states in a program, complicates the tracing and correc-tion of the defect tremendously. The famous quote by Dijkstra holds; ”Testing showsthe presence, not the absence of bugs”.
A common word for software defect, its infection of the program state and failure isbug. The term bug is used in many contexts and is a loose term but it is widely used.In the rest of the thesis, bug will be used as a common word for defect, infection orfailure.

2.1 Software defects, infection and failure - bugs 7
Defect
Sane state Infected state
Program state @ time 1
Program state @ time 2
Program state @ time n
Infection spreads
Figure 2.1: Defect infects the state of the program and spreads
8 Theory
2.2 Debugging
The process of eliminating software defects or limiting the amount of them is oftencalled debugging i.e. removing bugs.
As argued in the previous section, software defects are highly unwanted as they cancause annoyance, damage or even death. But how are software defects fixed?
There exists multiple options to help reducing the amount bugs. Some options worthmentioning are:
• Programming language features
• Static code analysis
• Verification
• Software engineering
• Instrumentation
Programming languages often offers features to limit the amount of bugs a developerintroduces. Type checking may prevent foolish assignments and calculations, forexample multiplying a string with an integer. A language like Ada provides customtypes such as a type for inches and a type for centimeters. These can not be mixed inany other way, before they have been converted into the same type. Some languagesprovide a way of isolating different parts of code from each other in more or lessclosed domains, which limits accidental use of unwanted procedures and variables.In a programming language like C++, this is done with abstract containers callednamespaces. Syntactical errors and obvious logical errors are often detected by thecompiler. Compilers transforms source code into executable binary files.
Static code analysis is a process where an analysis tool runs through the source codeof a program and reports potential dangerous situations before any compilation takesplace. Situations such as errors in logic where a branch or a portion of code may neverbe executed because of incorrect logic, is one example. Errors in memory where a nullpointer exception caused by a pointer that was dereferenced before it was initializedto a memory address is another example. These tools can help companies avoidshipping of products with potential flaws, and this makes static code analysis a largeindustry. These tools may prevent some flaws in the code, but it can not tell what,where or when software went wrong when software does not act as it was supposedto do.

2.2 Debugging 9
Verification exists to investigate the state space of a program, ensuring that no stateviolates the properties of the program. This is the most thorough method of detectingdefects, however when programs grow in complexity (variables and transitions tochange these), verification can become inapplicable as the state space can becomeenormous. Therefore, simplified models of the software are often verified instead. Thisis required for software in some very safety critical systems. Evaluation AssuranceLevel (EAL) is a standard for evaluating the level of reliability and security of asystem regarding to the level of testing and verification. Software with the highestEAL must be formally verified in full.
Proper software engineering can reduce common types of bugs, which originate frommisunderstanding or misinterpretation between developers. Mixing of programmingstyles regarding naming and logic, may introduce bugs which are hard to discover.Software engineering can standardise this and also ensure that software will followthe given specification. Programming style may assure that consistency checking isused. This can be done using assertions, which acts like a predicate or invariant. Ifa given condition is not true or valid, execution stops and the incident gets reported.This ensures the program is in a sane state.
A common applicable method for locating and fixing bugs is instrumentation. In-strumentation is a commonly used engineering practice for measuring and controllingsystems. This involves measuring of variables such as pressure or temperature andmeans to control such variables such as valves and circuit breaks. In computer scienceperspective, measure and control is usually of the state of the software.
When trying to fix a bug, reproducibility is a key issue. To investigate the cause ofa failure, it must be possible to reproduce the conditions that lead to it. If it is notto be reproduced, it is hard, if not impossible, to show the presence of the failure.
When the failure can be reproduced, the possible origins of the failure can be located.These should be isolated and investigated to locate the true origin of the failure.
There exists many techniques to do this, but can roughly be categorized into:
• Tracing execution / Observing
• Controlling execution / Examining
• Postmortem analysis of failed execution / Investigating
Tracing software is an effective way of observing the path the program follows to getto a certain state and to narrow the problem to a specific place in the code. It can bedone with simple printf statements or more advanced frameworks can be applied togenerate a standardized tracing [Lehey, 2005].
10 Theory
Controlling execution gives the developer a strong tool to where he or she can:
• stop execution at breakpoints and examine the current state by looking atvariable and data structure contents.
• step through the program per instruction, source code line or function basis.
Both primitives allow the developer to follow the execution and the state changes theprogram makes. Unfortunately, this often has major influence compared to normalexecution with regard to timing. Single stepping slows execution tremendously. Thiscan be a very large issue when debugging concurrent processes, as timing may differwhen debugging as compared to running in production. This can complicate thetracing of synchronization related defects such as deadlocks and race conditions.
Postmortem analysis is a method for investigating the cause of a failure. Softwarecan leave a set of information related to its state when it failed. This can be usedto backtrack the problem and provide necessary information to reproduce the failureand isolate the defect.
2.3 Operating systems
An operating system is in general a piece of software which provides an abstractionfor all underlying hardware and provides an forgiving environment for programs toexist. There exists many kinds of operating systems with different usage, designmethodologies and philosophies. Usually, an operating system consists of a kernelwhich serves user processes and distributes resources such as CPU time, memory,access to hardware, etc., to these user processes. An illustration of this is presentedin figure 2.2.
To prevent user processes from corrupting the system when they fail, privilege levelsare often provided by the processor architecture. The result of the corruption couldbe changing memory of other processes or even in the kernel. Privilege levels createsa split between software running in privileged mode (supervisor mode) and in lessprivileged mode (user mode) and this split is a central issue in the design mythologyof an operating system. Operating systems are often categorized into one of thefollowing:
• Monolithic kernel
• Micro kernel

2.3 Operating systems 11
Word Processor
Operating System
Internet Browser
Shell
...
VGA Screen
Memory
Keyboard
...
Figure 2.2: Overview of an operating system
• Exo kernel
A monolithic kernel is one large program running in supervisor mode. All kernelrelated operations are carried out in the kernel i.e. nothing kernel related runs inuser mode servers. An illustration of this structure is presented in figure 2.3.
This is the most simple approach but it has some downsides. If anything inside thekernel fails, the entire kernel fails as no surrounding environment can recover. Thestrengths of a monolithic kernels are that it is simple and can be fast, as a minimalnumber of context switches are needed to carry out system calls. System calls are theway for a user process to interact with the kernel. It works like a ordinary procedurecall, but the privilege level is changed and the kernel context is loaded. In a virtualmemory enabled system, the Memory Management Unit (MMU) needs to reload theaddress space when changing from user space to kernel space, and from one userprocess to another user process. This along with saving CPU registers and otherstate related variables are saved in a context switch. This is an expensive operation.
A micro kernel uses a different approach. As the amount of code increases, the amountof potential bugs increases [Lipow, 1982]. By having a minimal piece of software run-ning in supervisor mode which only provide the most fundamental functionality andmoving as much as possible into user space processes, the ideas is that the overall

12 Theory
Process
Kernel
Process
Process
Process
User mode
Supervisor mode
Figure 2.3: Monolithic kernel structure. Thick kernel layer as all kernel functionalityresides in one big kernel executable.
stability and security of the system should improve. The down side is the complex-ity, as the kernel related user space processes (called servers) needs to communicatebetween each other and with the kernel, reproducing and debugging bugs becomes avery difficult task. Performance can also become an issue as the amount of neededcontext switches increases tremendously when kernel operations should be carriedout.
Process #1
Kernel
Process #2
...
Process #n
User mode
Supervisor mode
Server #1
Server #2
...
Server #n
Figure 2.4: Micro kernel structure. Thin kernel layer with many user space serverswhich are invoked by the kernel and each other.
An exo kernel provides a thin layer between user processes and hardware, and itis even able to provide direct access to hardware, only taking care of isolating theprocesses from each other. This is a less common design mythology and will not becovered in depth.

2.3 Operating systems 13
2.3.1 FenixOS
FenixOS is a modern operating system developed at Technical University of Denmark,which targets future multi-core systems, and faces the problems these new parallelsystems introduce.
FenixOS is a hybrid kernel, combining the monolithic and micro kernel design method-ologies. The concept is to move as much as possible into servers running in user space,but put critical servers such as memory management into the kernel. This would re-move some of the overhead from context switching to these servers. This loses someof the strength of the micro kernel, but if these critical servers fail, the system is notlikely to be recoverable anyway.
Process #1
Kernel
Process #2
...
Process #n
User mode
Supervisor mode
Server #1
Server #n
Figure 2.5: Hybrid kernel. Bigger kernel layer than a micro kernel as critical taskssuch as virtual memory management are handled inside the kernel. Tasks which arepossible to move to user space space are done so.
FenixOS is primarily written in C++ which offers the object oriented paradigm forkernel development. This is a great strength, as operating systems tend to grow intovery large and complex systems and C++ has the ability to separate and isolatedomains and provide facilities to reuse existing code.
14 Theory
2.4 Bugs in operating systems
Operating systems are one of the most complex pieces of software which run ona computer. They often consist of several million lines of code [Leemhuis, 2009].They interact directly with hardware and must try to protect themselves againstmisbehaving hardware, faulty user programs and badly written hardware driver code- a very difficult task to fulfill unfortunately. An operating system is only surroundedby the hardware which is a rather unforgiving environment. When a fault happens,the system may just hang - leaving no indication of where the fault happened andwhat triggered it. This can make bugs in operating systems very severe. An operatingsystem may deny service for the entire system in case of a breakdown, or even exposethe system for exploitation to attackers.
Operating systems run in the most privileged level the hardware allows, and thismeans defects in operating system code may corrupt the state of all running processesand the kernel itself. Usually hardware provides some mechanisms to protect thekernel from being affected by misbehaving user processes and system libraries. Thissplit was mentioned in the operating system section and is sometimes called a privilegelevel. It can also be referred to as being a certain ring level. Ring 0 (most privileged)or one of the outer rings (less privileged). This is illustrated in figure 2.6.
When a defect leads to a security vulnerability, this may make it possible for anattacker to execute code in the privilege level of the operating system. By that time,the attacker can do what he or she wants. Evil code like worms and vira can exploitthese security holes and use them to infect a computer and spread to other computers,requiring thousands of man hours to remove them and fix the computers.
When an operating systems fails, the circumstances which lead to the failure may bevery complicated to reproduce. External input such as network data parsing, somedata sequences on a hard drive along with hundreds of other possible inputs may bevery hard, if not impossible, to reproduce.
In summary, bugs in operating systems can be very difficult to discover and track,and they can be very severe.
2.5 Debugging operating systems
There exist various ways and techniques for debugging operating systems. As men-tioned in the previous sections, one of the most time consuming tasks of debuggingis tracing the defect and observing the conditions that lead to failure.

2.5 Debugging operating systems 15
0 1 2 3
Figure 2.6: Security rings. Ring 0 is the most privileged with no restrictions (Oper-ating system). Rings 1 to 3 are restricted in the set of permitted instructions. Theseinstructions may even have different effects depending on the ring number. Usuallyrings 1 to 2 are for system libraries and ring 3 is for user processes. A system mayhave additional rings or less rings.
As with traditional software, the listed debugging method in section 2.2 also applyto debugging of operating systems. Instrumenting operating systems differs frominstrumenting traditional software, as the operating system usually is responsible forproviding an environment for such. For this reason, instrumentation of operatingsystems should be covered a bit more in depth.
Controlling execution gives developers the ability to observe the execution of theprogram while stepping through the source code. This is a powerful tool as the exactpoint in source code where the program fails can be found and the path and conditionsinvestigated. For operating systems it is usually not possible or wanted to control itself. After all where should the debugger run? Remote debugging is a way to providethis control, without the debugger interfering with the operating system execution.A downside controlling execution is that it may interfere with the normal executionanyway. Timing may be different which would lead to a successful debug run, butwill lead to faults when being run without a debugger attached. This can especiallybe an issue on parallel systems which modern operating systems usually are. Anotherissue is the security aspect. When controlling the execution of an operating system,this often requires at least reading from the system memory and sometimes writing toit. If a system is accidentally made debuggable, an attacker would be able to attacha debugger and read confidential information like password hashes, encryption keys,install backdoors or even just bring the system down.
In-kernel debuggers are debugger which are invoked on the same system, as theone being debugged. Even though they may interfere with the state of the kernel,

16 Theory
sometimes they may provide the functionality necessary to stop execution at somepoint or in case of a system crash and examine the state of the system. An exampleof such a debugger it Linux Kernel debugger called KDB.
When an operating system fails, it usually leaves the system useless and it is verydifficult to get information regarding the crash. The mentioned panics are a way oftelling the user what happened and the state of the operating system when it crashed.These panics are limited to report the most important information to the screen orserial device. Another technique is to make a core dump, which is a image of thememory along with the state of the CPUs on the time of the crash. This can later beanalyzed and the problem investigated remotely. This is called postmortem analysis.

Chapter 3
Analysis
The analysis chapter will investigate the stated problems from the problem descrip-tion. Options available to solve a given problem should be covered and a specificoption should be chosen. This option should be selected based on proper argumen-tation.
3.1 Hardware support for debugging
FenixOS is in its present state developed to run on the AMD64 architecture. This isa 64 bit architecture which extends the popular 32 bit x86 architecture with respectto address space, registers, security functionality and much more. A substantial partof the following is directly related to the AMD64 architecture and not necessaryapplicable in other architectures, even though some of the debugging facilities isbackward compatible with the x86 architecture.
To control execution of an operating system, facilities must be provided by hardware.The main concern is breakpointing and single stepping, as register and memory accessin the kernel is already possible without any extra facilities needed. On the AMD64architecture, breakpointing can be done in 2 ways:

18 Analysis
• Soft breakpoints. This is a technique where the instruction data on a givenaddress is swapped with a special instruction. This instruction data is calledan opcode. When execution reaches this instruction, an interrupt is generatedand an appropriate breakpoint handler can install the original instruction andhand control to a debug client. This is illustrated in figure 3.1 and 3.2.
• Hard breakpoints. This is a feature provided by hardware where 4 breakpointaddresses can be installed in special debug registers (DR0, DR1, DR2 and DR3).When the CPU executes an instruction, accesses memory or an I/O port whichmatches the address in one of the debug registers, an interrupt is generatedand the incident conditions written to debug register DR6. From this point anappropriate breakpoint handler determines which breakpoint was triggered andcan hand control to a debug client. This is illustrated in figure 3.3.
Debug client is here meant as an arbitrary handler, which could be a remote debuggingstub. This handler can invoke user space processes, record statistics, call a remotedebugger etc.
Instructionorginal opcode
InstructionAltered opcode
Soft breakpoint installation. Opcode is changed to special debug instruction
Figure 3.1: Soft breakpoint installation
InstructionAltered opcode
Instructionorginal opcode
1. CPU executesinstruction
2. Interrupt handleris called
Interrupt handler- restores instruction- May call remote debugger or other controlling facility- restarts instruction
3. Execution continues
Figure 3.2: Soft breakpoint triggering

3.1 Hardware support for debugging 19
Instruction
1. CPU executesinstruction
2. Instruction address matches debug register andInterrupt handler is called
Interrupt handler- May call remote debugger or other controlling facility
3. Execution continues
Figure 3.3: Hard breakpoint triggering
Soft breakpoints are not limited by the number of debug registers available on thearchitecture, however they require write access to the text segments of the kernel.Soft breakpoints are only able to trigger on instruction execution, which means thatmemory watches are not possible. Another issue is Copy-On-Write. Virtual memorysystems provide the ability to share pages between processes. This makes it extremelyfast for, for example, spawning a new process from an existing one. But the tech-nologies require that when one of processes alter data in a shared page, it must becopied into a new local one, which the process can alter. Usually, text segments of aprocess do not change. So these types of pages are usually just shared among the pro-cesses of the same program. If soft breakpoints should be supported, Copy-On-Writefunctionality should be added for text segments by the virtual memory system.
Hard breakpoints are limited by the number of breakpoints which can be installedat one time, and additional logic for recycle breakpoints needs to be created if ad-ditional breakpoints are needed. Hard breakpoints are more configurable than softbreakpoints, as you can specify an area of addresses which should trigger, and specifythe type of access like memory read and/or write.
There exists additional methods for triggering a debug exception and control execu-tion; this is single stepping. Single stepping is supported by the AMD64 architectureand triggers a debug exception (#DB) after each instruction. When entering thedebug handler, single stepping is disabled such that the debug handler is not singlestepped.
In AMD64, an additional set of debugging and performance measuring facilities hasbeen added in Model-specific registers (MSRs). For debugging, an additional way ofsingle stepping has been added. This is control transfer single stepping and providesa more coarse-grained single stepping where only jumps, interrupts and other controltransfers triggers a debug exception. This gives a quick way of locating the area

20 Analysis
which a defect may reside. The control transfer methods that trigger this kind ofsingle stepping are:
• Jumps (JMP), conditions jumps (Jcc) and conditions loops (LOOPcc)
• Subroutine calls (CALL) and return from these (RET)
• Interrupt (INT), exceptions and return from these (IRET)
• System calls (SYSCALL and SYSENTER) and return from these (SYSRET andSYSEXIT)
A new recording facility tracks the set of information which describes what happenedwhen the debug exception was triggered. The four registers are maintained by theprocessor and are listed below:
• Last branch to instruction pointer (LastBranchToIP)
• Last branch from instruction pointer (LastBranchFromIP)
• Last exception to instruction pointer (LastExceptionToIP)
• Last exception from instruction pointer (LastExceptionFromIP)
When ever a control transfer is done, it is recorded to these registers when enabled.
3.1.1 Breakpoint registers
The breakpoint registers is a crucial part of the hardware facilities for debugging, sothese will be covered more in depth.
In AMD64, there exists 4 debug address registers (DR0 to DR3) which means therecan be 4 breakpoints at a time. The addresses are virtual addresses, except for I/Obreakpoints which are I/O port numbers. These virtual addresses are not checkedfor canonical form [Adv, 2007].
To setup these breakpoints with regard to type and options, debug register DR7 mustbe setup properly. Each debug address register has a corresponding set of fields inDR7. These settings deal with:

3.1 Hardware support for debugging 21
Field name Description
BX Breakpoint X was encountered.X is 0 - 3
BS Single step was encountered
Table 3.1: DR6 debug status register
• Scope This can be local or global. Local breakpoints are only present when ex-ecuting the current task i.e. disabled when switching task. Global breakpointsreside until removed or disabled by software.
• Type This can be instruction execution, data read, data read/write or I/Oread/write.
• Length For data and I/O access, an address range can be specified that willtrigger a debug exception. This is on byte, word or double word range from thegiven address.
The different types of breakpoints have different execution properties. Instructionbreakpoints are triggered before the instruction is executed, and data and I/O break-points are triggered after instruction execution. This complicates mixed breakpointtypes which are located just after each other. But this is a well defined situation,as the different breakpointing methods have given priorities, which are handled bya debug event stack. Instruction breakpoints have lower priority than I/O and databreakpoints [Adv, 2007].
When an address matches a debug register address such as an I/O port, a data access,an instruction that has been executed or a single step, a debug exception (#DB) istriggered. To react upon this, debug register DR6 should be investigated along withthe address of the breakpoint located in DR0 - DR3.
A field for each debug address register is present along with a field for single step.This is illustrated in table 3.1. If debug register DR0 was triggered, B0 will be set to1 by the hardware, and DR1 - DR3 will be set in the same way. B0 to B3 must becleared by software when the debug handler is done.
The security is ensured by restricting all other tasks than the kernel (running inCurrent Privilege Level 0) from altering the debug registers. This ensures that userprocesses do not install breakpoints which may trigger in other processes or in thekernel as this may lead to unexpected behavior.

22 Analysis
3.1.2 User space breakpoints vs Kernel breakpoints
Installing breakpoints in user space processes are different from installing breakpointsin the kernel.
In FenixOS, the breakpoint registers are a part of the thread context. Therefore,installing breakpoints into a thread must be done in its context. When a thread isscheduled to run, it will overwrite any existing breakpoints in the debug registers.Therefore kernel breakpoints must be reinstalled when the kernel is invoked.
Furthermore, in a multicore environment each core must have synchronized break-point registers or else unpredictable results may occur.
3.1.3 Summary
AMD64 offers a range of debugging primitives which makes it possible to constructa high level debug interface. It has been chosen to use hard breakpoints to providethis interface, instead of soft breakpoints. This eases breakpoint installation andremoval. This is because soft breakpoints would require modifications of the virtualmemory system regarding Copy-On-Write, page protection, and a lot more. Hardwarebreakpoints are limited to 4 simultaneous breakpoints and watchpoints, but this hasbeen chosen over the complexity soft breakpoints introduce. The new debug facilitiesadded to AMD64 regarding control transfer single stepping and extended recordingfacilities has been chosen not to be used. It will later be shown, that the remotedebugger does not take advantage of these functionalities and leave them unused atthis point in time.

3.2 Remote debugging 23
3.2 Remote debugging
3.2.1 Debugger
The term debugger has previously been used multiple times and was briefly intro-duced in the theory chapter. A debugger is a tool which controls and investigates theexecution of a debugged program, or it can perform forensics on a crashed program.These tools can often provide a source code level overview of the progress and thestate of the program. An example session is illustrated in figure 3.4.
Figure 3.4: Example debugging session
This can not only be done from the executable binary file. Compilers transformsource code into a binary file which a machine can execute. This is a complicatedprocess of multiple iterations of transformations and optimizations, which lose moreand more details about the original code. Functions may be inlined, instructionsmay be swapped, etc. Inlined functions are inserted directly into the caller to avoidoverhead of stack setup and jumps. It requires some sort of additional information toconvert the current instruction pointer into the line of code it originates from - thisis handled by adding debugging information to the binary executable file.
There exists many different kinds of formats for adding debugging information [Eager, 2007],but one of the most common is DWARF and it is widely supported. It defines a stan-

24 Analysis
dard for the representation of source code and the connection of the source code tothe final executable file.
The debugging information is stored as tables inside the binary file. This informationincludes translation from program counter to source file and line, variable types anddata structure information. This can be used be a debugger to give a source levelview of the current state and examine variables and data structures.
3.2.1.1 Security
A debugger which is debugging a target process, will have full access to its memory,registers and other state related information. This is a considerable security issue, asprivate data such as passwords and keys may be read or manipulated by a debugger.This is usually considered harmless in a debugging environment, as the debuggeris meant to manipulate and control the debugged process. However, if a runningprocess is involuntarily attached by a debugger, problems may arise. The extentto which a debugger can control a process or a debugged operating system can belimited. Using hard breakpoints and disabling the ability to alter variables and datastructures would make it possible to ignore memory write commands from a debugger.Ignoring register writes only disables the ability to manually modify those. This isan uncommon operation. Additional security limitations could be made. Not allregisters are actually used when stepping through the program. Registers which areprimarily used are the program counter and the stack pointer to keep track of progress.Other registers could be masked and only show the most necessary information tothe debugger. Limitations could also be made for memory reads, such that onlyspecific memory ranges were allowed to be read or to restrict memory regions whereconfidential data such as password hashes and encryption keys may reside.
An example of a debugger is the open source GNU Project Debugger (GDB), whichis a full featured program debugger. GDB is compatible with many platforms in-cluding AMD64. Many debugging tools use GDB as a backend; an example is theDataDisplayDebugger(DDD) tool which gives a graphical overview of the programand the data structures in the program.
Similar to GDB is the Intel Debugger (IDB). This debugger is closed source butprovides an interface similar to GDB.

3.2 Remote debugging 25
3.2.2 Remote debugging
Remote debugging is a debugging method, where debugging is separated into a targethost and a debugger host. Without too much interference, the debugger can controland observe the target host state as it executes. This can be done by adding a smallpiece of code inside the kernel to which the debugger connects. This can be done invarious ways such as using a serial port, a high speed firewire connection or even overan Ethernet network. Remote debugging is often necessary when debugging operatingsystems. To avoid too much influence on the running code, a remote debugger hooksinto code inside the kernel, called a debugging stub. This stub is called when adebug exception happens, i.e. a breakpoint or single stepping is triggered, and awaitscommands from the remote debugger. This is illustrated in figure 3.5. GDB definesa protocol for remote debugging over serial lines, pipes and networks. This protocolis also supported by IDB. An example of such a remote debugger which uses thisprotocol is Kernel GDB (KGDB). This debugger infrastructure is incorporated intomany UNIX-like systems and provides a kernel debugger stub along with a modifiedGDB.
Debugstub
Interrupt handler
Debugger
Kernel code
1. Debug exception triggers interrupt handler
2. Debug stub is called
3. Communicationover serial line
4. When debug stub has supplied the needed informationand installed breakpoints etc., it continues execution.
Target host Debugger host
Figure 3.5: Remote debugger overview

26 Analysis
3.2.3 Communication
When remote debugging, there must be a way to communicate between the debuggerhost and the target host. This is usually done through either a local pipe whendebugging a emulated or virtual machine, a serial line, Firewire or over a network.
RS232 is often used when referring to serial ports in computers. RS232 is a maturestandard which has been relied upon since the 1960’s which defines voltage levels,timing and control over a single ended communication line. Even though serial com-munication using this standard is slow and simple, compared to modern technologieslike USB and Firewire, it is very mature, robust and easy to implement. When usinga local pipe on a emulated or virtual machine, it can be simulated as a serial port onthe target.
Firewire is an advanced high speed serial bus interface standard which offers highspeed access between multiple nodes such as computers, cameras, audio equipment,etc. Direct Memory Access is used to avoid the overhead of interrupting the operatingsystem to get attention and the ability of the operating system to move data intomemory. This means the firewire controller operates directly with the memory of theattached device. This can be exploited for debugging purposes, as a device may readand alter memory in a connected computer with very little performance loss of thetarget system [Harvey and Staff, 1991]. Unfortunately, this is also a security issue asdevices on the firewire bus may access confidential data on the attached hosts.
A serial port driver can be written with a small footprint, because of the simplicityand configuration of the port driver. This is a considerable strength, as the remotedebugging stub cannot debug itself. Both Firewire and a network solution require avery large software stack, however, it can perform at higher speeds and has greaternumber of functions. The serial COM port has been chosen for its simplicity androbustness.
3.2.4 GDB protocol
GDB provides a protocol for debugging a remote target over a serial communicationsline.
A debugger sends commands to the stub, which sends responses back to the debugger.This is done in packets which consist of:
• The initial character, which is $

3.2 Remote debugging 27
• The command or response data
• The data string, which is terminated with a #
• The a two digit checksum, which is calculated as the sum of the data modulo256. This is illustrated in equation 3.1.
checksum =
n∑
i=0
datai mod 256 (3.1)
When a command has been sent to the target and it has been correctly received,the acknowledge character ’+’ should be sent back to the debugger. If the packetcontained errors which can be detected by checksum mismatch, then the retransmitcharacter ’-’ should be sent.
A command consists of one of more leading characters, which determine the type ofcommand. This is followed by a list of parameters, which are usually split by ’,’, orin some special cases by ’;’. For example:
Listing 3.1: Example GDB packet
m f f f f f f f f a 0 c 2 1 0 0 0 , 1
Which should be interpreted as command ’m’ with parameter 1 as ffffffffa0c21000and parameter 2 as 1.
Only a subset of the available protocol are needed for a debugging stub [Fre, 2010].These commands include:
• Installation and removal of breakpoints (z0 / Z0)
• Read and write registers (g / G)
• Read and write single register (p / P)
• Read and write memory (m / M)
• Single stepping (s)
• Continuing from breakpoint or single stepping (c)
• Respond to general queries from the debugger (Thread id, capabilities etc.) (q)

28 Analysis
Character Command
z0 Breakpoint installation ImplementZ0 Breakpoint removal Implementg Read registers Implementp Read register Implementm Read memory Implements Single step Implementc Continue execution Implementq General query Implement necessary queries
Table 3.2: Protocol command subset for a more secure remote debugging stub
As discussed earlier, a debugging infrastructure can be vulnerable to attackers orto uncautious developers. It is possible to use a even smaller subset of the entireprotocol than the one listed above, if the extent for debugging is limited. In table3.2 one can see what needs to be supported by the debugging stub.
Runtime encoding
The GDB protocol provides a simple compression algorithm to minimize the dataneeded to be transmitted. This is called runtime encoding. Identical characters canbe collected if they are repeated after each other.
For example, the following data string ffffffff802000e8 is transformed into f*$802000e8.When the same character is repeated more than 3 times, data could be minimized byencoding. This is done by writing the character that should be repeated, in this casef followed by ”*”. The following character is the number of characters n + 29, whichmakes it a printable character. ”$” has the decimal value of 36. n = 36 − 29 = 7.This means that f is followed by 7 additional f’s.
3.2.5 Summary
Remote debugging has been covered in general. Some debuggers have been investi-gated and the most feasible remote debugger found was the GNU Project Debugger(GDB). It defines a debugging protocol, which has been described. To avoid too highlevel of complexity and to increase security, only a subset of the GDB protocol shouldbe implemented. The remote debugger will communicate with a kernel stub througha serial line, as this is the most simple and robust communication method known.

3.3 Debugging interfaces for user level processes 29
3.3 Debugging interfaces for user level processes
As with any other software, software running in user space will contain bugs. Thecomplexity of software increases and this makes it even more difficult to track andcorrect these bugs. Modern user space software will most likely work with parallelismin threads which introduces a new range of potential bugs, including synchronizationproblems. This includes race conditions, deadlocks, livelocks and etc. Most likelythe software will also interact with what surrounds it, such as other software and thekernel. This increases complexity which increase the potential number of defects.
For this reason, a modern operating system must provide some debugging primitivesfor making it feasible to develop software running on it. There exists many methodsand primitives which vary in different operating systems, however they can generallybe categorized into the following:
• Tracing / Observing
• Controlling / Examining
• Postmortem Analysis / Investigating
As mentioned earlier, tracing primitives can consist of bare print statements, however,they can also be provided by the kernel. This is usually in reference to a system call,which is the method for a user process to communicate with the kernel. The kernelmay track each system call with parameter values for a given user process, and thismay give a developer a good way of locating the problem.
Controlling software is usually done with a debugger. A user space debugger differsfrom the previous description of a debugger in that this kind of debugger does not havethe privilege to exploit the hardware support for debugging by itself. Neither doesit have permissions to alter other processes, as this is the core concept of processisolation. An operating system must provide an interface for this special kind ofprocesses to:
• Install breakpoints in a process. This would require either write access to thetext segment of the debugged process or access to write to its debug registers.
• Enable single stepping. This would require access to rFlags register of thedebugged process.
• Read registers of the debugged process. This is needed to locate the instructionand stack pointer which is used to determine the current position in the sourcecode.

30 Analysis
• Read and write to memory of the debugged process. This is needed to get stackinformation and to display and alter variables and data structures.
Furthermore, an infrastructure for invoking the debugger when breakpoints are en-countered in the debugged process must be provided. An illustration of a debuggingsession with such an infrastructure is illustrated in figure 3.6. An example of such aninfrastructure is ptrace, which can be found in many UNIX-like systems. This inter-face defines ways to attach a debugger to a process, single step, writing to memory,continue and a lot more [BSD, 1994].
Figure 3.6: User process debugging
Precautions should be taken, when providing these debugging features to processes.When a process is being debugged, all memory can be read by the debugger, whichmakes it vulnerable for tampering of private data. Proprietary software may be re-verse engineered, etc. For this reason, some policy should exist to only allow processesin a debugging scenario to be debugged. The traditional policy is to only allow adebugger to hook into a child process. This means that the debugged process mustbe spawned by the debugger. This is not always possible, if running servers or otherlong lasting processes should be debugged. For this reason, a process can often markit self as debuggable. Letting a debugger hook into the running process.
Newer infrastructures may use digital signature schemes to sign processes, such thatonly debuggers which have been signed with the same certificate as the process may
3.3 Debugging interfaces for user level processes 31
attach to it.
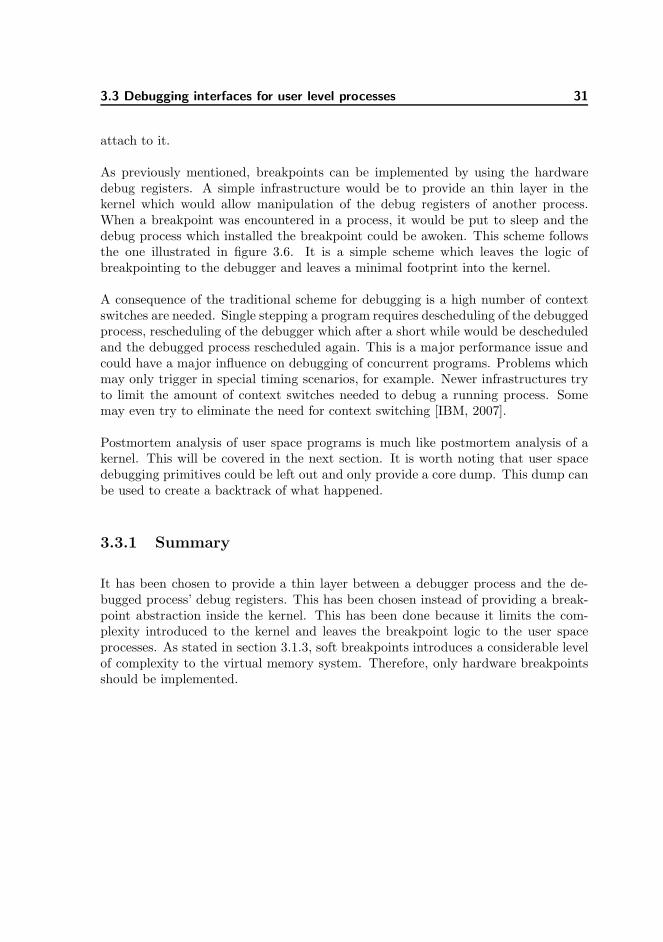
As previously mentioned, breakpoints can be implemented by using the hardwaredebug registers. A simple infrastructure would be to provide an thin layer in thekernel which would allow manipulation of the debug registers of another process.When a breakpoint was encountered in a process, it would be put to sleep and thedebug process which installed the breakpoint could be awoken. This scheme followsthe one illustrated in figure 3.6. It is a simple scheme which leaves the logic ofbreakpointing to the debugger and leaves a minimal footprint into the kernel.
A consequence of the traditional scheme for debugging is a high number of contextswitches are needed. Single stepping a program requires descheduling of the debuggedprocess, rescheduling of the debugger which after a short while would be descheduledand the debugged process rescheduled again. This is a major performance issue andcould have a major influence on debugging of concurrent programs. Problems whichmay only trigger in special timing scenarios, for example. Newer infrastructures tryto limit the amount of context switches needed to debug a running process. Somemay even try to eliminate the need for context switching [IBM, 2007].
Postmortem analysis of user space programs is much like postmortem analysis of akernel. This will be covered in the next section. It is worth noting that user spacedebugging primitives could be left out and only provide a core dump. This dump canbe used to create a backtrack of what happened.
3.3.1 Summary
It has been chosen to provide a thin layer between a debugger process and the de-bugged process’ debug registers. This has been chosen instead of providing a break-point abstraction inside the kernel. This has been done because it limits the com-plexity introduced to the kernel and leaves the breakpoint logic to the user spaceprocesses. As stated in section 3.1.3, soft breakpoints introduces a considerable levelof complexity to the virtual memory system. Therefore, only hardware breakpointsshould be implemented.

32 Analysis
3.4 Postmortem analysis
When an operating system fails, it often leaves the system in an unusable state.Sometimes even nonresponsive for keyboard inputs. To make it possible to investigatethe reason for the system crash and perform postmortem analysis, a core dump canbe created when the system fails. This is an mature technique from that time wherebatch processing was used and computer time slots had to be scheduled. When aprogram failed a print out of the memory was made and off-line analysis of the failurecould be done. Postmortem analysis has multiple strengths:
• Comparison between failures can be done. The frequency of a defect may berecorded or patterns in the core dumps can be found, which may help to locatethe problem.
• Analysis and debugging can be done offline. This can be a strength in embeddedsystems, which may not have any screen or input devices. Core dumps can evenbe sent to the manufacture, so defects can be removed in later revisions of thesoftware.
• Minimal influence on debugged software. Postmortem analysis has no or mini-mal influence compared to attaching a debugged into a process. The programwill run as normal until it crashes, where the core dump could be produced.
A core dump is a dump of the contents of the memory along with other state informa-tion, such as the cpu registers. This is saved to some non-volatile storage. A librarylike BFD can simulate memory and register access from a core dump [Fre, 2009]. Thisis illustrated in figure 3.7. To perform postmortem analysis on source level, debug-ging information must be provided as earlier described. Low level analysis can stillbe performed, however the debugger can provide more information to the developer,if it can interpret the dump file.
There exists multiple formats for these core dumps, but the most common in UNIX-like systems is the Executable and Linkable Format (ELF).
When an operating system fails, it is often necessary to tell the user and the developerwhat went wrong. This is often called a kernel panic. The purpose of this panic isto provide enough information which gives an idea of what and where the problemresides. This, along with a core dump is commonly produced when the system fails,and give developers primitives to locate and fix a potential bug.

3.4 Postmortem analysis 33
Core dump
Library(ex. BFD)
Debugg
er
get RIP
0xffff0a12
get RSP
0xffffb112
Executable file
file: main.c line: 32: *(0x00) = 1;
Figure 3.7: Example session of a core dump analysis
3.4.1 Summary
A very useful method for doing postmortem analysis is core dumping. Unfortunately,FenixOS does not provide filesystem support yet and this complicates core dumpingtremendously. Instead, a new kernel panic facility could be provided to display in-formation related to the state of the system when it crashed.

34 Analysis

Chapter 4
Design
The design chapter will purpose a design based on the choices made in the analysis.The resulting design should be at such a level that it is possible to implement aprototype.
4.1 Problem statement
A debugging infrastructure is going to be designed and a prototype will be imple-mented. The usefulness and future improvements for both are going to be evaluatedand discussed.
This debugging infrastructure will contain:
• A remote debugging stub which is debuggable with GDB over a serial line. Forsimplicity, only a single core system is supported. For security reasons, onlya subset of the GDB protocol is supported which provides the functionalitynecessary to single step, breakpoint, investigate data structures and backtrackexecution.
• An interface for user space debugging providing the primitives needed for in-stalling and removing breakpoints in a debugged process. This is done through
36 Design
Kernel
Process
Process
Process
User mode
Supervisor mode
Debug
(a) Debug infrastructure in kernel
Kernel
User mode
Supervisor mode
Debug
Process
Process
Process
(b) Debug infrastructure as user spaceserver
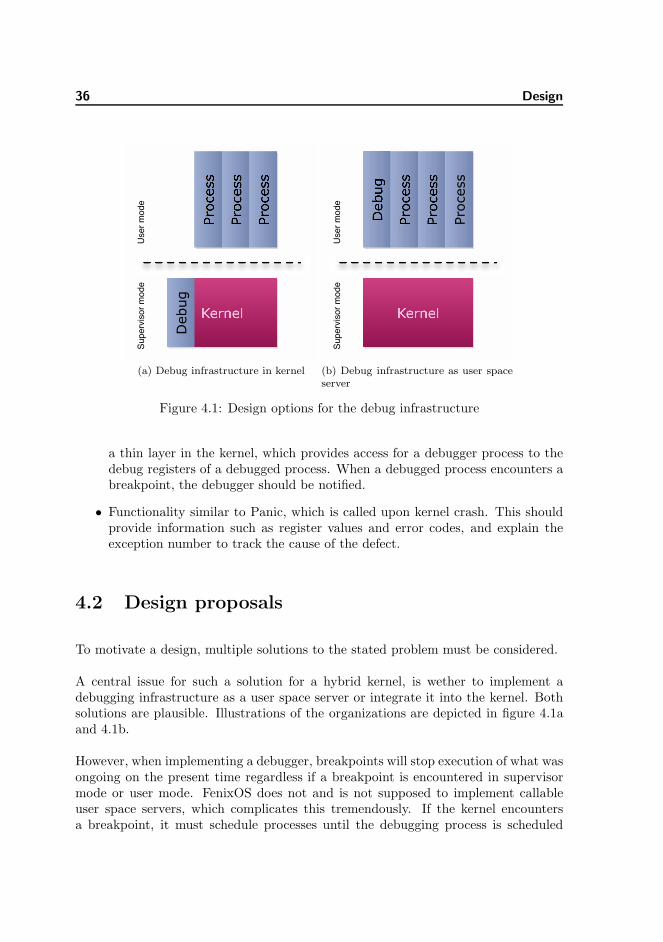
Figure 4.1: Design options for the debug infrastructure
a thin layer in the kernel, which provides access for a debugger process to thedebug registers of a debugged process. When a debugged process encounters abreakpoint, the debugger should be notified.
• Functionality similar to Panic, which is called upon kernel crash. This shouldprovide information such as register values and error codes, and explain theexception number to track the cause of the defect.
4.2 Design proposals
To motivate a design, multiple solutions to the stated problem must be considered.
A central issue for such a solution for a hybrid kernel, is wether to implement adebugging infrastructure as a user space server or integrate it into the kernel. Bothsolutions are plausible. Illustrations of the organizations are depicted in figure 4.1aand 4.1b.
However, when implementing a debugger, breakpoints will stop execution of what wasongoing on the present time regardless if a breakpoint is encountered in supervisormode or user mode. FenixOS does not and is not supposed to implement callableuser space servers, which complicates this tremendously. If the kernel encountersa breakpoint, it must schedule processes until the debugging process is scheduled

4.3 Debug infrastructure design 37
CPU
...
Thread
Remote
debugger
User debugger
interface
Syscall tracing
Unified debug
interface
...
(a) Design with a unified debug inter-face
CPU
Thread
Remote
debugger
User debugger
interface
(b) Design with low abstraction level
Figure 4.2: Design options for kernel debugging interfaces
and can take action. The kernel may have changed it state since it encountered thebreakpoint and leave data examination untrustworthy.
Another issue is, what level of abstraction that should be provided regarding debug-ging facilities inside the kernel. A unified interface to the debugging facilities couldbe one solution. This could provide a generic interface for creating high level de-bug facilities. Another alternative is to avoid this high level of abstraction and thecomplexity that this kind of infrastructure would require. This approach can exposedebugging facilities directly to for example the CPU and Thread class for breakpointinstallation and removal. Illustrations of these are depicted in 4.2a and 4.2b.
If a wider span of debugging facilities should be provided by the kernel, a unified debuginterface would be a good solution. However, in this thesis only remote debuggingand user space debugging should be provided. This makes the unified debug interfacea complex solution for this problem and adds unnecessary overhead.
The same issue arises, when designing the interface for debugging user space pro-cesses. A unified high level interface could be designed. This interface would haveto define an abstraction for breakpoints, watchpoints, single stepping, etc. Anotherapproach, is to provide a low abstraction and leave debugging logic to a user spacedebugger. The two solutions are illustrated in figure 4.3a and 4.3b.
4.3 Debug infrastructure design
The debugging infrastructure will be a part of the kernel i.e. not running as a userspace server. This is chosen for simplicity and to avoid the overhead of additionalcontext switches when debugging user space processes.

38 Design
Debugger
process
Kernel
Debugged
process
install instruction breakpoint at 0x1234
DR0 = 0x1234DR7 = 0x402
Calculate register values
(a) Debug logic incorporated in thekernel
Debugger
process
Kernel
Debugged
process
Set debug registers toDR0 = 0x1234DR7 = 0x402
(b) Debug logic incorporated inthe kernel
Figure 4.3: Design options for user space debugging interfaces
Remote debugging and user process debugging are separated into a Remote debuggingclass and the system call interface respectively. The design of the remote and userprocess debugging is illustrated in figure 4.4.
• Both interfaces can install breakpoints. The remote debugger can install andremove breakpoints per CPU basis and the user process debugging can installand remove breakpoints per thread basis.
• When a breakpoint exception is triggered in kernel mode the remote debuggeris called. If the exception is triggered in user mode the debugger debugging thecurrent thread is called.
4.3.1 Remote debugger
To separate the serial port communication and GDB protocol parsing from the de-bugger logic, the organization is as illustrated in figure 4.5.
• A generic serial port driver takes care of port initialization, reading and writingto the port. This can be done on a per string basis.
• The GDB protocol parser parses a GDB packet into a GDBcommand class. Thisclass contains the command type along with the associated parameters. Theparser also encodes packets which are going to be sent as response to the de-bugger.

4.3 Debug infrastructure design 39
CPU
Thread
BreakpointHandler
Remote debug
stub
add/remove breakpoint
calls handle routine
User process
debugging
add/remove breakpoint
put debugged process to sleepwake up debugger
Debug exception (#DB) happens
Figure 4.4: Illustration of the workings of the remote debugger and user space de-bugging
Serial port
driver
GDB protocol
parser
Remote debugger
Interacting with the surrounding systeminstalling/removing breakpoints, read memory and registers
Read and writedata to serial line
Read and writepackets
Encode/Decode packets
Figure 4.5: Organization of the remote debugger

40 Design
4.3.2 Postmortem analysis
As argued in the analysis, a core dumping facility is not going to be a part of the debuginfrastructure at this point in time because of the lack of a non-volatile storage inFenixOS. But a facility for reporting and displaying useful information regarding theconditions present while the system crashed is going to be designed and implemented.This kernel panic handler is called Oops. The design for this is illustrated in figure4.6
Oops
1. Unhandled exception happens
2. kernelPanic() is calledwhen panic happens in
the kernel
2. userPanic() is calledwhen panic happens in
a user process
3. Oops prints or logs necessary informationto investigate the circumstances of the crash
and halts execution
Figure 4.6: Illustration of the workings of the kernel panic handler
• When an unhandled exception happens in supervisor mode, the registers of thecurrent CPU are displayed on the screen. When this is done, the CPU halts toprevent further damage of the system state.
• When an unhandled exception happens in user mode, the current threads regis-ters are displayed on the screen. Execution continues, as the rest of the systemshould be in a sane state.
In both cases, a description should be found for the current exception number and itshould display the error code, if present.
4.4 Project management 41
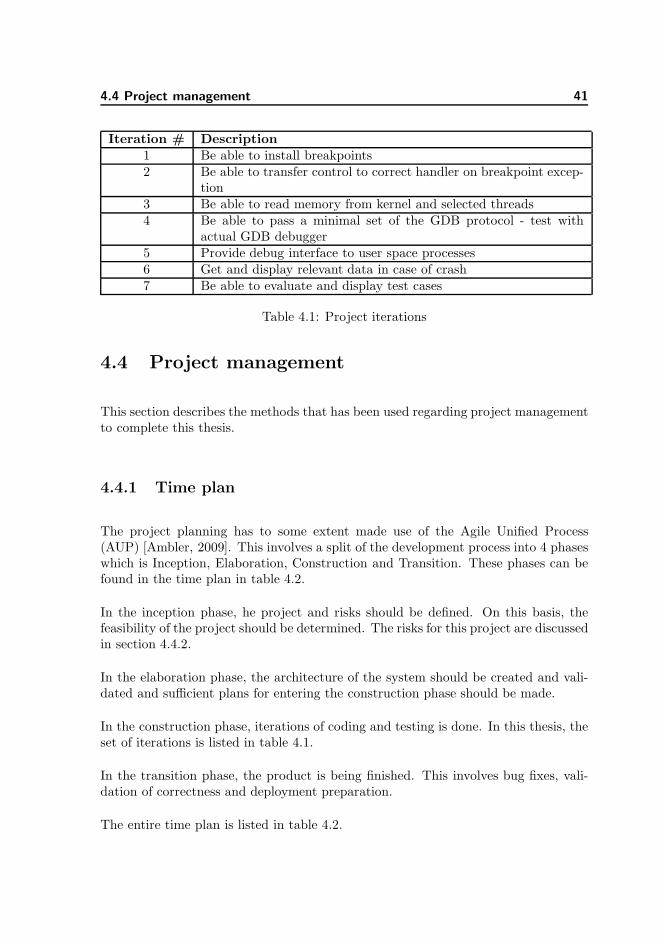
Iteration # Description
1 Be able to install breakpoints2 Be able to transfer control to correct handler on breakpoint excep-
tion3 Be able to read memory from kernel and selected threads4 Be able to pass a minimal set of the GDB protocol - test with
actual GDB debugger5 Provide debug interface to user space processes6 Get and display relevant data in case of crash7 Be able to evaluate and display test cases
Table 4.1: Project iterations
4.4 Project management
This section describes the methods that has been used regarding project managementto complete this thesis.
4.4.1 Time plan
The project planning has to some extent made use of the Agile Unified Process(AUP) [Ambler, 2009]. This involves a split of the development process into 4 phaseswhich is Inception, Elaboration, Construction and Transition. These phases can befound in the time plan in table 4.2.
In the inception phase, he project and risks should be defined. On this basis, thefeasibility of the project should be determined. The risks for this project are discussedin section 4.4.2.
In the elaboration phase, the architecture of the system should be created and vali-dated and sufficient plans for entering the construction phase should be made.
In the construction phase, iterations of coding and testing is done. In this thesis, theset of iterations is listed in table 4.1.
In the transition phase, the product is being finished. This involves bug fixes, vali-dation of correctness and deployment preparation.
The entire time plan is listed in table 4.2.

42 Design
Phase Week no. Activity
Inception 5 Lifecycle Objectives (LCO)Elaboration 6Construction 7 Lifecycle Architecture (LCA)
8 Iteration #1910 Iteration #211 Iteration #312131415 Iteration #41617 Iteration #518 Iteration #61920 Iteration #7, Initial Operational Capability (IOC)
Transistion 21 Product Release (PR)22 Report writing23 Report writing24 Report refactoring25 Report refactoring, Deliver project
Table 4.2: Project time plan

4.4 Project management 43
4.4.2 Risk analysis
Risks are rated with a severity level between 0 and 5. 5 is high-severe and 0 isnon-severe.
#1 Breakpoints can not be installed
Severity: 5There may be differences in implementations of the debug registersfrom machine to machine. This should be unlikely, because the ba-sic functionality in the debug registers dates from x86 architectureand thus backward compatible and available in long, compatibilityand protected mode. It is crucial for the project that one of thebreakpoints work
#2 BreakpointHandler can not determine breakpoint rea-
son
Severity: 4If the breakpoint handler can not determine the reason for thebreakpoint which had just occurred, it would be very hard to re-cover from that breakpoint, if not impossible. If it is not possible todetermine the reason of breakpoints, only one type of breakpointsshould be used, to recover from that one.
#3 BreakpointHandler can not recover from breakpoint
Severity: 4If the breakpoint handler can not recover, i.e. it can not restartinterrupted instruction or bring instruction to original state, it isnot possible to provide instruction break points. In that case, onlydata break points can be used. This is not supported by GDB,and remote debugging will not be possible. The ability of thebreakpoint handler to recover from a breakpoint is crucial for theproject!
#4 RDebug can not read kernel memory
Severity: 3If the remote debugger can not read from kernel memory, the in-formation provided by the remote debugger becomes very limited,as the state of kernel can not be inspected during execution. Itshould still be possible to install breakpoints and single step andinspect the flow through the kernel.

44 Design
#5 GDBParser can not communicate with GDB
Severity: 4If the GDBParser can not communicate with GDB, remote de-bugging with GDB will not be possible. A custom proof of con-cept remote debugger can be written for testing purposes, if theGDBParser fails to communicate with GDB.
#6 User space debugging can not read thread memory
Severity: 3If the User space debugging interface can not read from threadmemory, thread debuggers get very limited, as the state of thethread can not be inspected during execution. It should still bepossible to install breakpoints and single step the thread and in-spect the program flow.
#7 User space debugging can not communicate with user
space processes
Severity: 5If user space debugging can not communicate with user space pro-cesses, it is not possible to support thread debuggers. This is un-likely as a syscall interface is already present in the FenixOS kernel.
#8 User space debugging can not install breakpoints
Severity: 5If user space debugging can not install breakpoints, it is not possibleto support user space debuggers. This may be a issue, as the remotedebugger only runs and operates in kernel space and therefore doesnot test the ability of the debugger core to break point user spacethreads.
#9 Tester can not evaluate given test cases
Severity: 1If the testing framework does not work, it is not possible to provideautomatic functional testing. In this case manual testing shouldbe used instead to document the functionality and stability of thesystem. In either case, the infrastructure design will be discussedand solutions to debugging issues will be provided.

4.4 Project management 45
4.4.3 Project progress
The project time plan has evolved during the project period. Some iterations showedto be less complex than expected and other iterations showed to be quite complex.The latter has especially been the case for iteration #3 which was the implementationof the GDB protocol. The original architecture has also changed during the project.This has also had effect on the iterations, as these was created with the design asbasis. The time plan and iterations shown in table 4.2 and 4.1 are the final versions.
AUP incorporates technical documentation during the development process. This hasnot been used to an sufficient extent and could have eased the process of documentingthis report.
In general, this thesis has changed its design or architecture during the project. Thisreflects that not enough time has been used to thoroughly investigate the possibilitiesavailable before designing and implementing. The documentation phase should havebeen incorporated in the entire process but has been postponed to the last. Theconstruction phase grew as complexities and problems was found, which cut time fordocumentation and finishing the project. This is an unfortunate situation.

46 Design

Chapter 5
Implementation
This chapter will cover the technical details for the implementation of the debuginfrastructure designed in the previous chapter.
5.1 Remote debugging
The classes which relate to remote debugging are listed in table 5.1.
The remote debugger works as follows:
• When a breakpoint is encountered, a debug exception (#DB) will be triggered.This will call the interrupt handler.
• The interrupt handler looks at the exception number and determines that it is#DB. The BreakpointHandler is invoked with handleKernelBreakpoint().
• The BreakpointHandler will investigate the cause of the exception by lookingat debug status register DR6. If a breakpoint was encountered, one of B0 - B3will be set as 1. If a single step triggered the exception then BS will be 1. Ifnone of them is set - the debug exception was triggered manually with the INT

48 Implementation
Class Description
BreakpointHandler Is invoked by the interrupt handler when a breakpoint exception(#DB) occurs.
GDBParser Parses GDB packets into a GDBCommand class. Is also responsiblefor encoding data into GDB packets.
UARTDriver Initializes, reads and writes strings to a given serial port.CPU Existing abstraction of a CPU. Methods have been added to install
and remove breakpoints into a given CPU.RDebug Uses GDBParser and UARTDriver to poll for new commands from
the connected debugger. It takes action upon the received packets,installs and removes breakpoints, reads memory areas, etc.
StringHelper Is used to contain various of helper functions, such as hex to integerconversions, etc.
Table 5.1: Classes for remote debugging
BreakpointHandler
RDebug UARTDriver
write()
read()
GDBParser
encode()
handle()
parse()
CPU
addBreakpoint()
removeBreakpoint()
handleSignal()
handleKernelBreakpoint()
Figure 5.1: Class relations for remote debugging

5.1 Remote debugging 49
Handler Description
stepHandler Handles single stepping packets ”s”generalQueryHandler Handles query packets ”q”lastSignalHandler Handles last signal packets ”?”readRegistersHandler Handles register reads of all common reg-
isters packets ”g”readMemoryHandler Handles memory reads packets ”m”readRegisterHandler Handles register reads of a specified reg-
ister ”p”insertBreakpointHandler Handles breakpoint installation packets
”z0”removeBreakpointHandler Handles breakpoint removal packets ”Z0”emptyHandler A common handler for ignoring the com-
mand and responding with an emptypacket.
OKHandler A common handler for ignoring the com-mand and responding with a OK packet.
Table 5.2: Packet handlers
$3 command. This command forces an interrupt with a given number to betriggered. In either case, if the cause could be determined then call RDebug’shandleSignal() or else call handle().
• When handleSignal() is called, it starts by sending a signal packet in re-sponse to the attached debugger. For both handle() and handleSignal() theprocessLoop() will be called.
• processLoop() reads data from UARTDriver via read() and is parsed byGDBParser via parse(). This results in a GDBCommand object with a commandtype and parameter values.
• processInput() is called to take action upon this GDBCommand. Here aproper handler is called to handle the given packet. These handlers are listedin table 5.2.
The class relation mentioned is illustrated in figure 5.1.
5.1.1 Initialization
The initialization sequence is not documented very well, and has been reversed engi-neered packet-by-packet extending the handlers to provide the necessary information

50 Implementation
to the debugger.
An example of an initialization sequence is listed in listing 5.1. <-- indicates re-ceived command and --> indicates sent response. The packets are described in thetable present in table 5.3. This is an example of a GDB 7.1 initialization sequence,however it may differ between versions. Handlers for each type of packet have beenimplemented. If the response required is only OK or an empty packet, a commonOKHandler() and EmptyHandler() are used respectively.
Listing 5.1: Example GDB initialization sequence
<−− $qSupported#37−−> $#00<−− $Hg0#df−−> $OK#9a<−− $?#3 f−−> $S05#b8<−− $Hc−1#09−−> $OK#9a<−− $qC#b4−−> $OK#9a<−− $qAttached#8f−−> $OK#9a<−− $qOf f s e t s#4b−−> $Text=0;Data=0;Bss=0#04<−− $g#67−−> $000000000000000056182280 f f f f f f f f 02000000000000001900000000000000a000000000000000000000000080f f f f190000000000 f f f f 0 0 0 0 0 0 0 0 0000 0000b544208 0 f f f f f f f f 4 6020 0001 8000 0002000000000000000000000000000000000000000#16<−− $mf f f f f f f f 8 0 2 0 1 5d6 ,1#c4−−> $e8#9d<−− $mf f f f f f f f 8 0 2 0 1 5d6 ,1#c4−−> $e8#9d<−− $qSymbol : :#5b−−> $OK#9a<−− $Z0 , f f f f f f f f 8 0 2 0 0 0 e 8 ,1#0a−−> $OK#9a<−− $vCont?#49−−> $#00<−− $Hc0#db−−> $OK#9a

5.1 Remote debugging 51
Packet Description
qSupported Query packet which asks for debugging stub fea-tures. This is responded to with an empty packetwhich indicates no additional features are avail-able.
Hg0 Sets the current thread id to 0 for general oper-ations. This is ignored as kernel threads are notavailable.
? Asks how the debugger reached the present state.This is responded to with a signal number. Thissignal number uses the POSIX signal scheme,where signal 5 is the breakpoint signal.
Hc-1 Sets the current thread id for step and continueoperations. This is also ignored.
qC Asks for the current thread id. If any reply otherthan an integer is returned, it is ignored.
qAttached Asks if debugging stub is attached.qOffsets Asks for relocation offsets. This will be relevant if
the kernel had been relocated to another addressthan 0, but this is not the case for FenixOS.
g Asks for register values for all common registersmffffffff802015d6,1 Asks for 1 byte of data starting at address
0xffffffff802015d6. This is the address pointedto by the instruction pointer RIP.
qSymbol:: Indicates the debugger is ready for symbol lookups from the debugging stub.
Z0,ffffffff802000e8,1 Removes a breakpoint at address0xffffffff802000e8. This is done becausethe debugger thinks that it encountered abreakpoint.
vCont? Asks if extended continue operation is available.This is not the case and is just responded to withan empty packet.
Hc0 Sets the current thread id for step and continueoperations. This is ignored.
Table 5.3: GDB Initialization

52 Implementation
5.1.2 Breakpointing
When installing and removing breakpoints, the debugger issues ”z0” and ”Z0” packetsrespectively. When continuing execution and encountering a breakpoint, the stubmust inform the debugger. When continuing, the debugger stalls and awaits a signalpacket from the stub. This is done by handleSignal().
5.1.3 Single stepping
When enabling single stepping, the trap flag (TF) if the current processors rflags
register is set to 1. When the interrupt handler returns, single stepping will beenabled and it will trigger a debug exception after execution of the next instruction.Single stepping behaves like breakpointing, handleSignal() is called and signals tothe debugger execution has stopped. Single stepping is disabled when entering theinterrupt handler by hardware, and the trap flag (TF) is also cleared by the debuggingstub.
5.1.4 Variable and data structure examination
Variable and data structure examination is unknown to the debugging stub whichonly provides the necessary memory contents from specified memory addresses. Theinterpretation is done by the debugger, based on the debugging information present.
Notes about protocol byte order
During development of remote debugging, it was noticed that the GDB interpretstransferred data from register and memory reads in big endian. GDB was setup touse little endian, however this did not change the byte order needed when transferringdata. No documentation related to this anomaly has been found. Byte order helperfunctions has been implemented to deal with this issue.
5.2 User space debugging
The user space debugging interfaces have been implemented as a thin layer between adebugger and the debug registers of the debugged process. This moves all breakpoint-ing logic to the debugger for breakpoint setup (DR7), address installation (DR0-DR3)and breakpoint status (DR6).

5.2 User space debugging 53
An example of the syscalls of a debugger in a debugger session is illustrated in figure5.2.
Debuggerprocess
DEBUG_THREAD_TRACE
DEBUG_THREAD_READDR0
DEBUG_THREAD_WRITEDR0
DEBUG_THREAD_WRITEDR7
WAIT
Kerneltime progresses asdebugged process executes instructions.When a breakpoint is hit, debugger is awoken
DEBUG_THREAD_READRIP
DEBUG_THREAD_CONT
Figure 5.2: Example of syscall’s in a debugger session
The syscalls made are described in table 5.4.
The scheduler that FenixOS provides was not functional when this user space debug-ging was developed. For this reason, a very rough, unfair and ineffective round-robinscheduler was implemented for testing purposes. A new method has been addedto the ReadyQueue class, called rrSchedule(). This scheduling method does thefollowing:
• If a previous thread is present, add it to the end of a thread queue. This datastructure is called Debug::Queue.
• If the previous thread is not put to sleep, mark it as ready.
• Get the thread at the head of the thread queue. If this thread is sleeping or notactive, put it to the end of the thread queue. Continue until a ready thread ispresent and schedule it for execution.
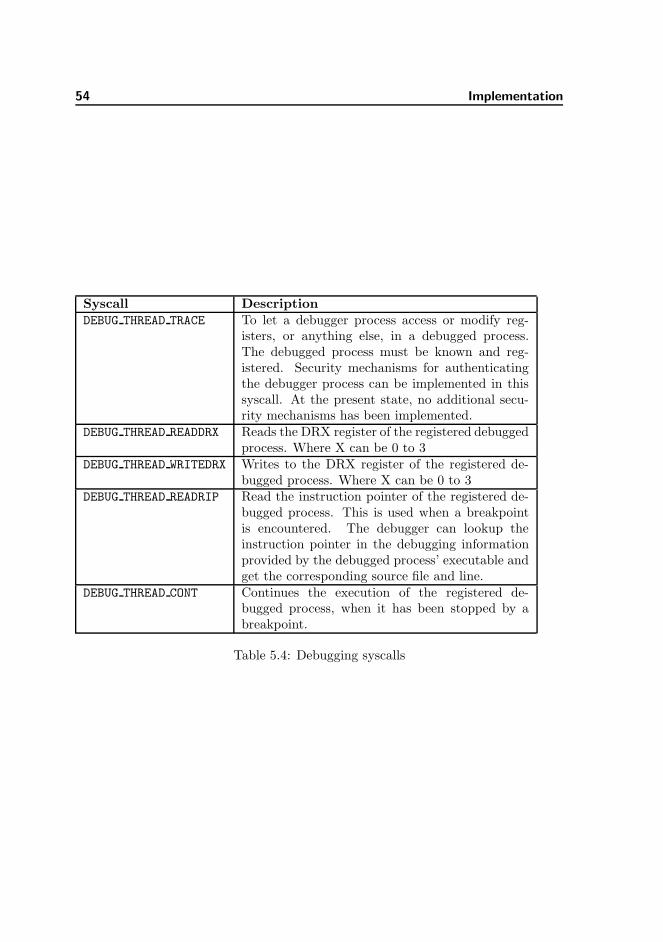
54 Implementation
Syscall Description
DEBUG THREAD TRACE To let a debugger process access or modify reg-isters, or anything else, in a debugged process.The debugged process must be known and reg-istered. Security mechanisms for authenticatingthe debugger process can be implemented in thissyscall. At the present state, no additional secu-rity mechanisms has been implemented.
DEBUG THREAD READDRX Reads the DRX register of the registered debuggedprocess. Where X can be 0 to 3
DEBUG THREAD WRITEDRX Writes to the DRX register of the registered de-bugged process. Where X can be 0 to 3
DEBUG THREAD READRIP Read the instruction pointer of the registered de-bugged process. This is used when a breakpointis encountered. The debugger can lookup theinstruction pointer in the debugging informationprovided by the debugged process’ executable andget the corresponding source file and line.
DEBUG THREAD CONT Continues the execution of the registered de-bugged process, when it has been stopped by abreakpoint.
Table 5.4: Debugging syscalls

5.3 Postmortem analysis 55
5.3 Postmortem analysis
A core dumping facility will not be implemented. However, a facility for reportinguseful information when the system crashes will be implemented.
When a interrupt or exception occurs, a handler will be called from the interruptvector. This interrupt vector is located in inthandr.s. A macro irq macro has beenmade to ensure that most of the interrupts and exceptions are handled the same way,in a sense that the handler code is wanted in C++ instead of assembler language.The macro calls an appropriate handler in InterruptRoutines.cpp based on wetherthe exception happened in user or supervisor mode and if a error code is present.
An interrupt or exception is determined as unhandled, if the interrupt number whichwas passed to one of the handlers in InterruptRoutines.cpp is not known. At thispresent state, only few interrupts or exceptions are handled. Only debug exceptionsare handled, which calls the BreakpointHandler. Prior to the Oops class whichimplements new panic methods, a simple print statement was made upon a unhandledexception.
Figure 5.3: Panic messages prior to Oops
As mentioned, the class Oops has been implemented to take care of displaying panicmessages upon unhandled exceptions or interrupts. kernelPanic() and userPanic()
is called when an unhandled interrupt or exception happens in supervisor and user

56 Implementation
mode respectively.
The following takes place, when a panic is called.
• The exception number is used as an index into an array of exception descrip-tions. This description is displayed on the screen. A message can be passedwhich will be displayed if present.
• All common register values are displayed on the screen.
• The stack pointer RSP and the instruction pointer RIP are fetched from theinterrupt stack and displayed on the screen.
The registers and interrupt stack access differ between interrupts and exceptions inuser mode and supervisor mode. In user mode, both registers and values from theinterrupt stack are available from the current thread object.
When an interrupt or exception occurs, certain values are push onto the stack [Adv, 2007][p244].This includes the stack pointer (RSP), rFlags, Code segment offset (CS) and theinstruction pointer (RIP). These are important registers display in case of failure.
In kernel mode, the registers are fetched from the current CPU and stack individu-ally. Screen dumps of user panics and kernel panics are illustrated in the evaluationchapter.

Chapter 6
Evaluation
This chapter will evaluate the implemented solution to the stated problem. This willbe done with functional tests of each component individually which should show thecorrectness of the solution. A small testing infrastructure has been made to test theGDBParser.
Environment
FenixOS is tested and run on a virtual machine. This is done to avoid damage onreal hardware, to some extent adding additional debugging facilities and control ofhardware setup. The virtual machine used in this setup is Sun VirtualBox 3.1.6 onMac OS X 10.6.
6.1 Remote debugging
VirtualBox can simulate 2 serial ports. There are multiple options:
• Read and write to pipes
• Write only to a raw file

58 Evaluation
Target Description
open serial Converts pipe into serial device. The device cre-ated will be displayed.
gdb Opens GDB with kernel image loaded and archi-tecture set.
gdbtui Opens GDB with kernel image loaded and archi-tecture set. This is with a text based user interface
Table 6.1: Debug make targets
• Read and write to device
In this setup, serial port 1 is setup as a pipe for attaching the remote debugger andserial port 2 is setup as a raw file for logging debugging information during execution.
GDB has to be compiled to target a 64 bit architecture. In this setup, GDB wascompiled against x86 64-pc-linux-gnu. If another target is used, register orderand selection may vary when GDB interprets the ”g” command. GGDB does notsupport the use of pipes directly for remote debugging, therefore a tool must be usedto convert this pipe into an emulated serial device. The tool used was socat whichopens a pipe and creates a serial device to which GDB can connect.
To ease the procedure of opening pseudo terminals and start GDB with the kernelimage loaded, additional make file targets have been made. This is illustrated intable 6.1.
When the virtual machine has been started, FenixOS will indicate it is ready forremote debugger connection. This is depicted in figure 6.1.
When the virtual machine is ready, the pipe must be converted into a serial device.This is shown in figure 6.2.
When the serial device is setup, GDB should connect. This is illustrated in figure6.3.
6.1.1 Tests
The following functional tests will be carried out:
• Breakpointing into a function

6.1 Remote debugging 59
Figure 6.1: FenixOS remote debugging test. Awaits connection from GDB
Figure 6.2: FenixOS remote debugging test. Prepare serial device

60 Evaluation
Figure 6.3: FenixOS remote debugging test. Attach debugger

6.1 Remote debugging 61
• Single step through code
• Back track execution
• Examine data structures and variables
Breakpointing
To test breakpointing, functional tests has been made. Figure 6.4 depicts a debugsession where a breakpoint is inserted atFenixOS::System::Kernel::ProcessManagement::ReadyQueue::schedule(). Ex-ecution is continued with the command ”continue” or ”c”. The breakpoint is encoun-tered and the debugger shows the current position. This is shown in figure 6.5
Figure 6.4: Functional test of breakpointing: Breakpoint is inserted
Single stepping

62 Evaluation
Figure 6.5: Functional test of breakpointing: execution continues and breakpoint isencountered

6.1 Remote debugging 63
To test single stepping, functional tests has been made. Figure 6.6 and 6.7 shows asimple test of single stepping. In the first figure, execution has reached to line 114in the Queue.hpp. A single step command is issued and execution stops at the line117. One might wonder, why 3 lines are skipped in one single step. This is becauseof the compiler optimization level used when compiling the kernel. This may inlinefunctions, instructions might be swapped and this can introduce some confusion whilestepping through the code.
Figure 6.6: Functional test of single stepping: execution has stopped and is currentlyat line 114
Back tracking
Backtracking displays a representation of the current call stack. This gives a pictureof the execution path that has been taken to get to a certain point. A backtrackcommand ”bt” has been run in figure 6.8.
Data structure examination
Data structure examination is a very important tool while debugging, as this can givea picture of the state of the program. This can help tracing infections in the stateand locate a potential defect. A screen driver object called Screen is examined infigure 6.9.
GDBParser

64 Evaluation
Figure 6.7: Functional test of single stepping: single step issued with command ”s”and now execution has stopped at line 117
A small testing environment has been created to make unit testing-like test cases [Andy Hunt, 2004].As discussed in the discussion chapter, unit tests can be difficult to apply to operatingsystems. However, testing of a protocol parser is possible and has been done. Theoutput from the test is depicted in figure 6.10 and 6.11.
6.2 User space debugging
A debugging interface for user space debugging has been implemented. To test this,two user programs has been made: a tracee which is a debugged process and a tracerwhich is a debugger process. A test scenario has been put up:
• The tracer attaches to the tracee with the DEBUG THREAD TRACE syscall. Thethread address of the tracee must be supplied as parameter.
• The tracer installs a breakpoint into the tracee with installBreakpoint().This function manipulates with the debug registers of the tracee. This break-point is a data read/write breakpoint, as this is easier to trigger as we do notknow

6.2 User space debugging 65
Figure 6.8: Functional testing of back tracking: Inside the screen driver, a back trackcommand ”bt” is issued
Figure 6.9: Functional test of data structure: Examining the Debug::screen object

66 Evaluation
Figure 6.10: Unit test of GDBparser: initialization sequence
Figure 6.11: Unit test of GDBparser: operation

6.3 Kernel and user panics 67
• The tracer waits for tracee to encounter the breakpoint and goes to sleep withWAIT syscall.
• Tracee manipulates with the variable which the breakpoint points to. Thistriggers the breakpoint and the thread goes to sleep.
• The tracer is awoken and continues execution of tracee with DEBUG THREAD CONT
syscall.
This is shown in figure 6.12. Lines starting with ”+” are written by the tracer andlines starting with ”-” are written by the tracee. The lines should related closely tothe described procedure above.
Figure 6.12: Functional test
6.3 Kernel and user panics
As with the other components, kernel and user panics are functionally tested. Totest these, an unhandled interrupt was issued manually in kernel and user moderespectively. This was done with the INT $5 assembler instruction. The results isdepicted in figure 6.13 and 6.14 respective.

68 Evaluation
Figure 6.13: Kernel panic: A kernel panic was provoked by issuing an unhandledinterrupt
Figure 6.14: Kernel panic: A user panic was provoked by issuing an unhandledinterrupt while running a process

6.4 Summary 69
6.4 Summary
The overall reliability of the implemented remote debugger is acceptable, but is stillin an immature state. It is possible to breakpoint, single step, run backtrack andexamine data structures. Some ”g” packets are determined as too long by GDB andis a sporadic defect. In GDB 7.1, the file gdb/remote.c contains remote debuggingrelated code. Line 5396 evaluates the length of the received ”g” packet against aarchitecture specific rsa->sizeof g packet variable. This variable is set to 100.This complicates register reads, as this is 328 characters of data. Runtime encodinghas helped increase the stability, but the fault is triggered sometimes anyway. Meansto extend the packet size could be investigated.
Backtracking unwinds too far and provokes a kernel panic caused by page fault.
The user space debugging interface is also very immature and needs to be extendedto provide a more complete debugging facility. At this point in time, a debuggerprocess can install and remove breakpoints in another thread, get notified when abreakpoint is encountered and start execution of the debugged thread again. Thesolution is quite robust but requires knowledge of the thread address to be traced.This can change if other sections of the executable kernel image changes size.
User and kernel panics have been implemented and works in an expected manner.An exception message is displayed on the screen along with the current registers.Unwinding the stack to produce a stack trace is not an easy task and has not beendone, as debug tables in the executable file must be parsed. This is because compilersmay leave stack creation out when making function calls and other optimizations toincrease performance.

70 Evaluation

Chapter 7
Discussion
Remote debugging
As stated, only a subset of the GDB protocol has been implemented. This limits theextent in which GDB can debug FenixOS. Data structures and variables along withthe registers can not be changed by the debugger. This is chosen by design to avoidtoo high level of complexity along with making the debugging stub more secure. Theremote debugger is written specific for AMD64 with a GDB compiled against a 64 bitLinux architecture. If GDB was compiled against another target, register selectionand order may be different and this is not handled at this present state. Usually, thisis handled by a register map.
At this present state, the remote debugger is only developed for a uni-processorsystem. In a more mature debugging infrastructure, this should be extended to dealwith multiprocessors and the problems that this introduces. One problem to dealwith, is that debug registers are setup for each processor individually. This meansthat all processor must have synchronized debug registers to avoid unpredictablebehavior. Further, when a processor encounters a breakpoint, all processors shouldbe stopped to avoid that execution continues. If execution continues on the otherprocessors, they may alter data structure and variables and make it difficult to relyon the examined data. To provide this, Advanced Configuration and Power Interface(ACPI) must be implemented, to enumerate the processors available [Hew, 2009].Synchronization methods to ensure mutual exclusion to shared data structures in the

72 Discussion
infrastructure should also be implemented to provide a safe environment for multicoredebugging.
RDebug relies highly on GDBParser and is constructed with the GDB protocol basis.If the split between RDebug and GDBParser should have any benefit, RDebug shouldhave used a generic parser interface. This interface could allow different parsers tobe used for remote debugging.
User space debugging
The user space debugging interface only provides a thin layer between a debuggerand a debugged process’ debug registers. This is a very minimalistic approach butas FenixOS process/thread framework is still very immature, this is sufficient at thispoint in time. To create a more convincing test scenario, a prototype keyboard drivercould have been implemented. This could create a test session, where a debuggercould single step another thread by pushing a specific key.
At this point in time, no additional security mechanisms has been implemented.When the process/thread framework gets extended, such security mechanisms shouldbe implemented. In traditional UNIX systems, this is done through the parent/childprocess relation or by voluntarily wait for debuggers to attach. Other mechanismslike digital signature or cryptographic systems could be used, to ensure that only aspecific process may debug a given process.
A side effect of the architecture chosen is the overhead of switching context betweenevery breakpoint or single step, when this is implemented. This is the traditional wayof doing this, but new research project tries to limit these context switches. Handlersmay be insert directly into the kernel, is one example. This avoids context switchesto the debugger process every time a debugged process encounters a breakpoint orsingle steps [Lin, 2007].
Postmortem analysis
The postmortem facilities provided is a set of panic functions, which in case of asystem crash reports necessary information regarding the state to the screen. Ain-kernel debugger like KDB could be started when a system crash occurred. Thiswould give a more flexible method of investigating the cause of the fault but wouldalso require interaction. This interaction may change the state of the kernel and leaveexamination untrustworthy.
Testing strategy
The testing strategy used, has been done by functional testing. This shows thata solution works, but does not show that it will always work. Testing in general

73
can only show the presence of faults, but more thorough testing strategies existwhich may be automated. Testing operating systems can be a difficult task, assome tests may or should crash the system. If this is disregarded, unit testing couldbe implemented. This testing strategy tests isolated parts of software individuallyand can be used to ensure that the complete product satisfies its specification. Italso helps tracing potential defects, as tests should target a small area of the entirecode [Andy Hunt, 2004]. Unit testing makes it possible to use the test driven softwaredevelopment paradigm. In this paradigm, tests are written before implementation ofactual code is done. The initial test should of course fail, however as the developerprogresses the test should pass. This introduces a very short development cycle andgives means to produce high quality code.

74 Discussion

Chapter 8
Conclusion
The domain of software defects, infections and faults have been covered to motivatethe need for debugging facilities. The complexities of debugging operating systemshave been covered and the need for an debugging infrastructure for FenixOS moti-vated. This thesis has investigated the options for remote debugging of kernel code,hardware support for debugging, user space debugging interface and postmortemanalysis. The selected options has been motivated and these choices makes basis forthe design presented. This design has been implemented in a prototype implementa-tion which enables remote debugging with GDB, debugging facilities to control userspace processes and methods for kernel panic.
The overall reliability and quality of the solution implemented is acceptable andprovides a new set of functionalities for kernel debugging FenixOS. This should helpdevelopers to decrease the amount of time spent on tracing defects and make it morepleasant job to work with kernel code.

76 Conclusion

Bibliography
[Adv, 2007] Advanced Micro Devices, Inc. AMD64 Architecture Programmeras Man-ual Volume 2: System Programming, 3.14, edition, 2007.
[Ambler, 2009] Scott W. Ambler. The Agile Unified Process (AUP). Ambysoft, 2009.
[Andy Hunt, 2004] Dave Thomas Andy Hunt. Pragmatic Unit Testing. The Prag-matic Programmers, LLC., 2004.
[Baase, 2008] Sara Baase. A Gift of Fire. Pearson Education, 3rd, edition, 2008.
[Beizer, 1990] Boris Beizer. Software Testing Techniques. Coriolis Group, 2nd, edi-tion, 1990.
[BSD, 1994] BSD. ptrace – process tracing and debugging, 1994.
[Eager, 2007] Michael J. Eager. Introduction to the DWARF Debugging Format.Eager Consulting, 2007.
[Fre, 2009] Free Software Foundation. BFD, 2009.
[Fre, 2010] Free Software Foundation. Debugging with gdb: the gnu Source-LevelDebugger for gdb, 9th, edition, 2010.
[Harvey and Staff, 1991] A. F. Harvey and Data Acquisition Division Staff. DMAFundamentals on Various PC Platforms. 1991.
[Hew, 2009] Hewlett-Packard Corporation, Intel Corporation, Microsoft Corpora-tion, Phoenix Technologies Ltd., Toshiba Corporation. Advanced Configurationand Power Interface Specification, 2009.

78 BIBLIOGRAPHY
[Huckle, 2010] Prof. Thomas Huckle. Collection of software bugs. Technical report,TU Munchen, 2010.
[IBM, 2007] IBM. Ptrace, Utrace, Uprobes: Lightweight, Dynamic Tracing of UserApps, 2007.
[Leemhuis, 2009] Thorsten Leemhuis. What’s new in Linux 2.6.32, 2009.
[Lehey, 2005] Greg Lehey. Debugging Kernel Problems, 1st, edition, 2005.
[Lin, 2007] Linux Symposium Inc. Proceedings of the Linux Symposium: VolumeOne, 2007.
[Lipow, 1982] M. Lipow. Number of Faults per Line of Code, 1982.
[Pan, 1999] Jiantao Pan. Software testing. Technical report, Carnegie Mellon Uni-versity, 1999.