debt and incomplete financial markets: a case for … · debt and incomplete financial markets: a...
TRANSCRIPT

301
Kevin D. SheeDyLondon School of Economics
Debt and Incomplete Financial Markets: A Case for Nominal GDP Targeting
ABSTRACT For many households borrowing is possible only by accept-ing a financial contract that specifies a fixed repayment stream. However, the future income that will repay this debt is uncertain, so risk can be inefficiently distributed. This paper shows that when debt contracts are written in terms of money, a monetary policy of nominal GDP targeting improves the functioning of financial markets. By insulating households’ nominal incomes from aggre-gate real shocks, this policy effectively achieves risk sharing by stabilizing the ratio of debt to income. The paper also shows that when there is price sticki-ness, the objective of improving risk sharing should still receive considerable weight in the conduct of monetary policy relative to stabilizing inflation.
A t the heart of any argument for a monetary policy strategy lies a view of what are the most important frictions or market failures that mon-
etary policy should seek to mitigate. The canonical justification for infla-tion targeting as optimal monetary policy rests on the argument that pricing frictions in goods markets are of particular concern (see, for example, Woodford 2003). With infrequent price adjustment owing to menu costs or other nominal rigidities, high or volatile inflation leads to relative price dis-tortions that impair the efficient operation of markets and that directly con-sume time and resources in the process of setting prices. Inflation targeting is the appropriate policy response to such frictions, because it is able to move the economy closer to, or even replicate, what the equilibrium would be if prices were flexible. In other words, inflation targeting is able to undo or partially circumvent the frictions created by nominal price stickiness.1
This paper argues that nominal price stickiness might not be the most serious friction that monetary policy has to contend with. While the use of
1. In addition to the theoretical case, the more practical merits of implementing inflation targeting are discussed by Bernanke and others (1999).

302 Brookings Papers on Economic Activity, Spring 2014
money as a unit of account in setting infrequently adjusted goods prices is well documented, money’s role as a unit of account in writing financial contracts is equally pervasive. Moreover, just as price stickiness means that nominal prices fail to be fully state contingent, financial contracts are typi-cally not contingent on all possible future events, an example being debt contracts that specify a fixed stream of nominal repayments.
The problem that noncontingent debt contracts raise for risk-averse households is that when they are borrowing for long periods, there will be considerable uncertainty about the future income from which the fixed debt repayments must be made. The issue is not only one of idiosyncratic uncertainty—households also do not know the future course the economy will take, which will affect their labor income. Will there be a productiv-ity slowdown, a deep and long-lasting recession, or even a “lost decade” of poor economic performance to come? Or will unforeseen technological developments or terms-of-trade movements boost future incomes and good economic management successfully steer the economy on a path of steady growth? Borrowers do not know what aggregate shocks are to come, but they must commit to a stream of contractual repayments prior to this infor-mation being revealed.
The inability to use more complex financial contracts that make repay-ments contingent on any future events means that financial markets are incomplete, in the sense that households do not have access to insurance against future risks that could affect their ability to repay debt. Financial contracts might not be fully contingent for a variety of reasons, but one explanation could be that transaction costs make it prohibitively expensive to write and enforce complicated and lengthy contracts. Since many agents, such as households, would find it difficult to issue liabilities with state-contingent repayments resembling equity or derivatives, they must instead rely on simple debt contracts if they are to borrow. Thus, in a way that is similar to the way menu costs can make prices sticky, transaction costs can render financial markets incomplete.
This paper studies the implications for optimal monetary policy of such financial-market incompleteness in the form of nominal noncontingent debt contracts. The argument can be understood in terms of which mon-etary policy strategy is able to undo or mitigate the adverse consequences of financial-market incompleteness, just as inflation targeting can be under-stood as a means of circumventing the problem of nominal price sticki-ness. For both noncontingent nominal financial contracts and nominal price stickiness, it is money’s role as a unit of account that is crucial, and in both cases, optimal monetary policy is essentially the choice of a particular
Kevin D. SheeDy 303
nominal anchor that makes money best perform its unit-of-account func-tion. But in spite of this formal similarity, the optimal nominal anchor turns out to be very different when the friction is noncontingent debt contracts rather than sticky prices.
The simplicity of noncontingent debt contracts can be seen as coming at the price of bundling together two fundamentally different transfers: a transfer of consumption from the future to the present for borrowers, but also a transfer of aggregate risk to borrowers. The future consump-tion of borrowers is paid for from the difference between their uncertain future incomes and their stream of fixed debt repayments. The more debt they have, the more their future income is effectively leveraged, leading to greater consumption risk. The flip side of borrowers’ leverage is that savers are able to hold a risk-free asset, reducing their consumption risk.
To see the sense in which this bundling together of borrowing and a transfer of risk is inefficient, consider what would happen in complete financial markets. Individuals would buy or sell state-contingent bonds (Arrow-Debreu securities) that make payoffs conditional on particular events (or, equivalently, write loan contracts with different repayments depending on what happens in the future). Risk-averse borrowers would want to sell relatively few bonds paying off in future states of the world where GDP and thus incomes are low, and sell relatively more that would pay off in good states of the world. As a result, contingent bonds paying off in bad states would be relatively expensive and those paying off in good states relatively cheap. These price differences would entice sav-ers to shift away from noncontingent bonds and take on more risk in their portfolios. Given that the economy has no risk-free technology for transfer-ring goods over time, and since aggregate risk cannot be diversified away, the efficient outcome is for risk-averse households to share aggregate risk. Complete financial markets allow this risk sharing to be unbundled from decisions about how much to borrow or save.
The efficient financial contract between risk-averse borrowers and sav-ers in an economy subject to aggregate income risk (abstracting from idio-syncratic risk) turns out to closely resemble an “equity share” in GDP. In other words, borrowers’ repayments should move in line with GDP, falling during recessions and rising during booms. This means the ratio of debt liabilities to GDP should be more stable than it would be in a world where nominal debt liabilities are fixed in value while GDP fluctuates.
With noncontingent debt contracts, monetary policy has a role to play in promoting risk sharing, because these contracts are typically denomi-nated in terms of money. Hence, the real degree of state contingency in

304 Brookings Papers on Economic Activity, Spring 2014
financial contracts depends on the conduct of monetary policy. If the incom-pleteness of financial markets were the only source of inefficiency in the economy, then the optimal monetary policy would aim to make nominally noncontingent debt contracts mimic—through variation in the real value of the monetary unit of account—the efficient financial contract that would be chosen with complete financial markets.
Since the efficient financial contract between borrowers and savers resembles an equity share in GDP, it follows that a goal of monetary policy should be to stabilize the ratio of debt liabilities to GDP. With noncontingent nominal debt liabilities, this can be achieved by having a noncontingent level of nominal income, in other words, a monetary policy that targets nominal GDP. Nominal income thus replaces nominal goods prices as the optimal nominal anchor. While the central bank cannot eliminate uncertainty about future real GDP, it can in principle make the level of future nominal GDP (and hence the nominal income of an aver-age household) perfectly predictable. Removing uncertainty about future nominal income thus alleviates the problem of the stream of nominal debt repayments being fixed.
A policy of nominal GDP targeting is generally in conflict with infla-tion targeting, because any fluctuations in real GDP would lead to fluctua-tions in inflation of the same size and in the opposite direction. Recessions would feature higher inflation and booms would feature lower inflation or even deflation. These inflation fluctuations could be helpful because they would induce variation in the real value of the monetary unit of account, making it and the noncontingent debt contracts expressed in terms of it behave more like equity. This would promote efficient risk sharing. A policy of strict inflation targeting would fix the real value of the monetary unit of account, converting nominally noncontingent debt into real non-contingent debt, which would imply an uneven and generally inefficient distribution of risk.
The inflation fluctuations that would occur with nominal GDP target-ing would entail relative-price distortions if goods prices were sticky, so the benefit of risk sharing would probably not be achieved without some cost. Whether nominal GDP targeting is preferable to inflation targeting is ultimately a quantitative question, whether the inefficiency due to the suboptimal risk sharing of noncontingent debt contracts is more important than the inefficiency caused by relative-price distortions. Using a calibrated model with both nominal debt contracts and sticky prices, optimal mon-etary policy is found to place a weight of approximately 90 percent on promoting risk sharing and 10 percent on stabilizing inflation.

Kevin D. SheeDy 305
This paper is related to a number of areas of the literature on monetary policy and financial markets. First, there is the empirical work of Bach and Stephenson (1974), Cukierman, Lennan, and Papadia (1985), and more recently, Doepke and Schneider (2006), who all document the effects of inflation in redistributing wealth between debtors and creditors. The nov-elty here is in studying the implications for optimal monetary policy in an environment where inflation fluctuations with such distributional effects may actually be desirable precisely because of the incompleteness of finan-cial markets.
The basic idea of this paper has many precedents in the history of mon-etary economics, arguably extending back at least to Bailey (1837) (a sur-vey of the literature is given in Selgin 1995). The contribution here is in the modeling and the quantitative analysis of optimal monetary policy with nominal debt contracts, not in the fundamental ideas. In the modern literature on this question, Selgin (1997) describes the ex-ante efficiency advantages of falling prices in good times and rising prices in bad times when financial contracts are noncontingent, although there is no formal modeling of the argument.2
Pescatori (2007) studies optimal monetary policy in an economy with rich and poor households, in the sense of there being an exogenously speci-fied distribution of assets among otherwise identical households. In that environment, both inflation and interest rate fluctuations have redistribu-tional effects on rich and poor households, and the central bank optimally chooses the mix between them. A related paper is that of Lee (2010), who develops a model where heterogeneous households choose less than com-plete consumption insurance because of the presence of convex transaction costs in accessing financial markets. Inflation fluctuations expose house-holds to idiosyncratic labor-income risk, because households work in spe-cific sectors of the economy, and sectoral relative prices are distorted by inflation when prices are sticky. This leads optimal monetary policy to put more weight on stabilizing inflation. In contrast to those two papers, the argument here is that inflation fluctuations can actually play a positive role in completing otherwise incomplete financial markets.
Most recently, and closest in approach to this paper, Koenig (2013) has advanced the risk-sharing argument for nominal GDP targeting in the context of a two-period model and has also studied the robustness of
2. Persson and Svensson (1989) is an early example of a model—in the context of an international portfolio allocation problem—where it is important how monetary policy affects the risk characteristics of nominal debt.

306 Brookings Papers on Economic Activity, Spring 2014
the results to the possibility of default when there are bankruptcy costs. In comparison, the model presented here is more suited to quantitative monetary policy analysis, because it brings together incomplete financial markets and all the features of the workhorse New Keynesian model in a tractable framework.
While the papers above focus on nominal debt contracts in the context of household borrowing, the idea that inflation fluctuations may have a positive role to play when financial markets are incomplete is now long established in the literature on government debt (and has also been recently applied by Allen, Carletti, and Gale [2011] in the context of the real value of the liquidity available to the banking system). Bohn (1988) developed the theory that noncontingent nominal government debt can be desirable because when combined with a suitable monetary policy, inflation can change the real value of the debt in response to fiscal shocks that would otherwise require fluctuations in distortionary tax rates.3
Quantitative analysis of optimal monetary policy of this kind was devel-oped by Chari, Christiano, and Kehoe (1991) and expanded further by Chari and Kehoe (1999). One finding was that inflation needs to be extremely volatile to complete financial markets. As a result, both Schmitt-Grohe and Uribe (2004) and Siu (2004) argued that once some nominal price rigid-ity is considered so that inflation fluctuations have a cost, the optimal policy becomes very close to strict inflation targeting. This paper shares the focus of that literature, using inflation fluctuations to complete mar-kets, but comes to a different conclusion regarding the magnitude of the required inflation fluctuations and whether the costs of those fluctuations outweigh the benefits. First, in this paper the benefits of completing mar-kets are linked to the degree of risk aversion and the degree of heteroge-neity among households, which are generally unrelated to the benefits of avoiding fluctuations in distortionary tax rates and which prove to be large in the calibrated model. Second, the earlier results assumed government debt with a very short maturity. With longer-maturity debt (in this paper,
3. There is also a literature that emphasizes the impact of monetary policy on the finan-cial positions of firms or entrepreneurs in an economy with incomplete financial markets. De Fiore, Teles, and Tristani (2011) study a flexible-price economy where there is a costly state verification problem for entrepreneurs who issue short-term nominal bonds. Andrés, Arce, and Thomas (2010) consider entrepreneurs facing a binding collateral constraint who issue short-term nominal bonds with an endogenously determined interest rate spread. Vlieghe (2010) also has entrepreneurs facing a collateral constraint, and even though they issue real bonds, monetary policy still has real effects on the wealth distribution because prices are sticky, so incomes are endogenous.

Kevin D. SheeDy 307
household debt), the costs of the inflation fluctuations needed to complete financial markets are much reduced.4
There is also a literature on household debt that emphasizes alterna-tive frictions, such as credit constraints and interest-rate spreads (Iacoviello 2005; Cúrdia and Woodford 2009; Guerrieri and Lorenzoni 2011; Egg-ertsson and Krugman 2012). Finally, the paper is related to the literature on nominal GDP targeting (Meade 1978; Bean 1983; Hall and Mankiw 1994, and more recently, Sumner 2012) but proposes a different argument in favor of that policy.
The plan of the paper is as follows. Section I sets out a basic model and identifies which monetary policies can support risk sharing when finan-cial markets are incomplete. Section II introduces a dynamic stochastic general equilibrium (DSGE) model that includes both incomplete financial markets and sticky prices, and hence a trade-off between mitigating the incompleteness of financial markets and avoiding relative-price distortions. Optimal monetary policy subject to this trade-off is studied in section III. Section IV shows how the full model can be calibrated and presents a quan-titative analysis of optimal monetary policy. Finally, section V draws some conclusions.
I. A Model of a Pure Credit Economy
The analysis begins with a simplified model that studies household bor-rowing and saving in a finite-horizon endowment economy with incom-plete financial markets. A full DSGE model with incomplete markets together with labor supply, production, and sticky prices is presented in section II.
I.A. Assumptions
The economy contains two groups of households, “borrowers” (b) and “savers” (s), each making up 50 percent of a measure-one population. Household types are indexed by t ∈ {b, s}. There are three time periods t ∈ {0, 1, 2}. All households have preferences represented by the utility function:
� E C C C(1)
1 1 1,,0
1,1
12 ,2
1
=− α
+ δ− α
+ δ− α
τ
τ−α
τ−α
τ−α
4. This point is made by Lustig, Sleet, and Yeltekin (2008) in the context of government debt.

308 Brookings Papers on Economic Activity, Spring 2014
where Ct,t is per-person consumption by households of type t at time t. All households have the same subjective discount factor d and the same coefficient of relative risk aversion a. Real GDP Yt is an exogenous endow-ment. The level of GDP in period 0 is nonstochastic, but subsequent real GDP growth rates gt = (Yt - Yt-1)/Yt-1 are uncertain. Household types are distinguished by the shares they receive of this endowment at different dates. The ratio of borrowers’ per-person incomes to per-person real GDP is denoted by the parameter yt, and hence household incomes at time t are:
Y Y Y Yt t t t t t( )= ψ = − ψ(2) , and 2 .b, s,
The income shares yt are known with certainty in period 0. Given that both household types have the same time preferences, the households labeled as borrowers will indeed choose to borrow from the savers in equilibrium when the sequence {y0, y1, y2} is increasing. In other words, borrowers are those households with initially low incomes relative to savers, while savers anticipate having a relatively low income in the future. In what follows, the analysis is simplified by assuming the particular monotonic sequence of income shares below:
E g g(3) 1 1 1 , 1, and 2.0
2
1
1
2
1
1 2[ ]( ) ( )ψ = − δ + + ψ = ψ =−α −α
It is assumed that the subjective discount factor d is sufficiently low rela-tive to expected real GDP growth so that y0 ≥ 0.
Financial markets are incomplete in the sense that only nominal bonds can be issued or held by households. It is assumed that borrowers can-not issue liabilities with state-contingent nominal payoffs, and all non-contingent bonds are denominated in terms of money. It is assumed that a single type of bond is traded at each date. Each bond issued in period 0 is a promise to repay one unit of money in period 1, and g units of money in period 2. The parameter g determines the duration, or average maturity, of the bonds (g = 0 is one-period debt, while larger values of g represent longer-term debt contracts). Each bond issued in period 1 is simply a promise to repay one unit of money in period 2. Note that in period 1, an outstanding bond from period 0 is equivalent to g newly issued bonds (old bonds are therefore counted in terms of new-bond equivalents from period 1 onwards). Households can take positive or negative positions in bonds (save or borrow) with no limit on borrowing except being able to repay in all states of the world. There is no default, and so all bonds are risk-free in nominal terms.

Kevin D. SheeDy 309
Households begin with no initial assets or debts and must leave no debts at the end of period 2. The net bond position per person of type-t house-holds at the end of period t is denoted by Bt,t, the nominal bond price is Qt at date t, and the price of goods in terms of money is Pt. The flow budget identities are:
CQ B
PY C
Q B
PY
Q B
P
C YB
P
(4) ,1
,
and ,
,00 ,0
0
,0 ,11 ,1
1
,11 ,0
1
,2 ,2,1
2
( )+ = + = ++ γ
= +
ττ
τ ττ
ττ
τ ττ
with the term (1 + gQ1) being the sum of the period-1 coupon payment from period-0 bonds and the market value of the period-2 repayment, the latter equivalent in value to g newly issued bonds. Money in this economy is sim-ply a unit of account used in writing financial contracts. Monetary policy is assumed to determine the inflation rate pt = (Pt - Pt−1) /Pt−1 at each date.
I.B. Equilibrium
Maximizing the utility function (equation 1) subject to the budget identi-ties (equation 4) implies Euler equations that must hold for both household types t ∈ {b, s} at dates t ∈ {0, 1}:
( ) , ,51 1
1
1CQ P
Q PCt t
t t
t t
tτα
ταδ
γ− +
++
−=+( )
E .
In equilibrium, the goods and bond markets must clear at all dates:
+ =C C
Yt t
t(6)2 2
;b, s,
+ =B Bt t(7)2 2
0.b, s,
In what follows, let ct,t ≡ Ct,t /Yt denote the ratios of consumption to GDP, and define the variables dt, lt, rt, and rt as follows:
E
dQ B
PYl
Q B
PY
rQ P
Q Pr
tt t
t t
tt t
t t
tt t
t t
t t t
(8)1
2
1,
1
2,
11
, and .
b, 1 b,
1
1
1
( )
( )
≡ −+ γ
≡ −
+ ≡ + γ ρ ≡
−
−
−+
310 Brookings Papers on Economic Activity, Spring 2014
As will be confirmed in equilibrium, Bb,t ≤ 0 and Bs,t ≥ 0, so dt can be interpreted as the gross debt-to-GDP ratio (the beginning-of-period value of debt liabilities per person relative to GDP), and lt as the end-of-period value of all bonds issued per person relative to GDP, referred to as the loans-to-GDP ratio. The variable rt is the ex-post real return on holding bonds between periods t - 1 and t. Note that this is not the same as the interest rate on those bonds, which refers to the ex-ante expected real return rt. Finally, it is convenient to express the equations in terms of the yield-to-maturity, denoted by jt, rather than the bond price Qt. Given the coupon payments on the bonds issued in periods 0 and 1, the price-yield relationships are:
Qj j
Qj
(9)1
1 1, and
1
1.0
0 0
2 1
1( )=
++ γ
+=
+
With the definitions (equation 8), the equations of the model are:
dr
glt
t
t
t(10)1
1;1= +
+
−
( ) ( ) ( )= − − = − + −
= =
c d l c d l
d l
t t t t t t t t(11) 2 , 2 2 ,
with 0, and 0; and
b, s,
0 2
c c
Ec r g ct t t t t(12) 1 1 ,, 1 1 , 1[ ]( )( )= δ + +τ−α
+ +−α
τ +−α
where equation 10 follows directly from equation 8, equation 11 is derived from the budget identities (equation 4) and the market-clearing condition (equation 7), and equation 12 is derived from the Euler equations (5). Finally, equation 8 and the definition of the yield-to-maturity in equation 9 imply:
rj j
j
rj
(13) 11
1
11
11
, and 11
1.1
0
1
1
0
21
2
+ = ++ π
+ γ+
+ γ+
+ = ++ π
It is assumed that the parameter restriction (equation 3) always holds in what follows.
In the case where there is no uncertainty about the path of real GDP (g1 = g–1 and g2 = g–2, where g–1 and g–2 are nonstochastic), and where there

Kevin D. SheeDy 311
are no unexpected changes in inflation (p1 = p–1 and p2 = p–2), the system of equations 10–12 and equation 13 has the following solution:
c c rg
rg
t t
( ) ( )= = + = +δ
+ = +δ
α α
(14) 1, 11
, and 11
;b, s, 11
22
( )= δ + =−αd g d(15)2
1 , and1
2; and1 2
1
2
l g g l g(16)2
1 1 , and2
1 .0
2
1
1
2
1
1 2
1( ) ( ) ( )= δ + + = δ +−α −α −α
The equilibrium interest rates (equal here to the ex-post real rates of return r–1 and r–2) are identical to what would prevail if there were a representa-tive household. The choice of income shares in equation 3 means that in the absence of shocks, borrowers and savers would have the same levels of consumption. Given the levels of income and consumption, the implied final debt-to-GDP ratio is 50 percent, and given equation 3, the debt-to-GDP and loans-to-GDP ratios at earlier dates are discounted values of the final debt-to-GDP ratio (adjusted for any real GDP growth). This steady state is independent of monetary policy. The values of the inflation rates p–1 and p–2 together with the real interest rates r–1 and r–2 determine the nominal bond yields j
–0 and j
–1.
I.C. The Complete Financial Markets Benchmark
Consider a hypothetical economy that has complete financial markets but which is otherwise identical to the economy described above. House-holds now have access to a complete set of state-contingent bonds (traded sequentially, period-by-period), denominated in real terms without loss of generality. Let F*t,t+1 denote the contingent bonds per person held between periods t and t + 1 by households of type t (the asterisk signifies complete financial markets). The prices of these securities in real terms relative to the conditional probabilities of the states at time t are denoted by Kt+1, so Et [Kt+1 F*t,t+1] is the date-t cost of the date-t + 1 payoff F*t,t+1.
In this version of the model, the flow budget identities (equation 4) are replaced by
EC K F Y Ft t t t t t(17) * * *,, 1 , 1 , ,+ = +τ + τ + τ τ

312 Brookings Papers on Economic Activity, Spring 2014
together with initial and terminal conditions F*t,0 = 0 and F*t,3 = 0. The Euler equations for maximizing utility (equation 1) subject to equation 17 are:
C
CK
C
Ct
t
t
t
t
δ
= = δ
+
−α
++
−α
(18)*
*
*
*,b, 1
b,
1s, 1
s,
which hold in all states of the world. The market-clearing condition F*b,t /2 + F*s,t /2 = 0 replaces equation 7.
To relate the economy with complete markets to its incomplete-markets equivalent, consider the following definitions of variables d*t, l*t, and r*t, which will be seen to be the equivalents of the debt-to-GDP ratio dt, the loans-to-GDP ratio lt, and the ex-post real return rt in the incomplete-markets economy (as given in equation 8):
≡ − ≡ −
+ ≡
+ +
−
E
E
dF
Yl
K F
Y
rF
K F
t
t
t
t
t t t
t
t
t
t t t
(19) * 1
2
*, * 1
2
*,
and 1 **
*.
b, 1 b, 1
b,
1 b,
Debt in an economy with complete financial markets refers to the total gross value of the contingent bonds repayable in the realized state of the world. Loans refers to the value of the whole portfolio of contin-gent bonds issued by borrowers, and the (gross) ex-post real return is the state-contingent value of the bonds repayable relative to the value of all the bonds previously issued.
The definitions in equation 19 directly imply that equation 10 must hold in terms of c*t, t, d*t, l*t , and r*t. The budget identities (equation 17) and the contingent bond-market clearing conditions imply that equation 11 holds in terms of the variables defined in equation 19. Since Et [(1 + r*t+1)Kt+1] = 1 follows from the definition in equation 19, the first-order conditions (equa-tion 18) imply that equation 12 must hold in terms of c*t,t and r*t . Hence, the block of equations 10–12 applies to both the incomplete- and complete-markets economies.
However, the first-order condition (equation 18) with complete markets has stronger implications than equation 12. It also requires
c
c
c
ct
t
t
t
=+ +(20)*
*
*
*,b, 1
b,
s, 1
s,

Kevin D. SheeDy 313
to hold in all states of the world. This equation states that consumption growth rates must always be equalized between borrowers and savers; in other words, households use complete financial markets to share risk. This is not generally an implication of the equilibrium conditions in equations 10–12 and equation 13 with incomplete financial markets. Furthermore, since a complete-markets economy has no restriction on the types of assets that households can buy and sell, equation 13 that determines the ex-post real return on a portfolio of nominal bonds is now irrelevant to determin-ing the equilibrium of the complete-markets economy. The relevant ex-post real return is now determined implicitly by the portfolio of contingent securities that ensures that the risk-sharing condition (equation 20) holds.
The complete-markets equilibrium can be obtained analytically by solv-ing the system of equations 10–12 and equation 20 (again under the param-eter restriction in equation 3). The equilibrium consumption-GDP ratios are c*t,t = 1, so there is full risk sharing between borrowers and savers; this means that all households’ consumption levels perfectly co-move in response to shocks (the consumption levels are equal owing to the param-eter restriction in equation 3). Complete financial markets therefore allo-cate consumption efficiently across states of the world, as well as over time. The equilibrium values of other variables have similar expressions to those found in the nonstochastic case (equations 14–16), except that now, uncertain outcomes are replaced by conditional expectations:
Ed g d(21) *2
1 , and * 1
2;1 1 2
1
2[ ]( )= δ + =−α
E El g g l g(22) *2
1 1 , and *2
1 .0
2
1
1
2
1
1 1 2
1[ ] [ ]( ) ( ) ( )= δ + + = δ +−α −α −α
The final debt-to-GDP ratio d*2 is nonstochastic, and earlier debt-to-GDP ratios depend only on conditional expectations of future real GDP growth rates. Since the realization of shocks in period 1 can change these condi-tional expectations, d*1 and l*1 are stochastic in general. The expressions for l*0, l*1, and d*1 can be interpreted as the present discounted values in periods 0 or 1 of a payoff proportional to the final debt-to-GDP ratio d*2, evaluated using prices of contingent securities (which are equal to households’ com-mon stochastic discount factor according to equation 18). Intuitively, the complete-markets portfolio is an equity share in future real GDP. This sup-ports risk sharing by allowing the repayments of borrowers to move exactly in line with their incomes.

314 Brookings Papers on Economic Activity, Spring 2014
Finally, observe that the complete-markets equilibrium has a particu-larly simple form in two special cases. If the utility function is logarithmic (a = 1) or real GDP follows a random walk (gt is i.i.d.), then d*t and l*t are all nonstochastic:
E
d d l l
gt
(23) *2
, * 1
2, *
2, and *
2,
where 1 .
1 2 0
2
1
1[ ]( )
= β = = β = β
β = δ + −α
The complete-markets equilibrium is entirely independent of monetary policy in all cases.
I.D. Replicating Complete Financial Markets
The block of equations 10–12 is common to the economy’s equilibrium conditions irrespective of whether financial markets are complete or not. The only difference is that the incomplete-markets economy includes equa-tion 13 as an equilibrium condition instead of equation 20 in the complete-markets economy. Since equation 13 includes the inflation rates p1 and p2, the ability of monetary policy to engineer a suitable state-contingent path for inflation means that the ex-post real returns in equation 13 can be chosen to generate the same consumption allocation as implied by the risk-sharing condition (equation 20). This is equivalent to ensuring the actual debt-to-GDP ratio dt mimics its hypothetical equilibrium value d*t in the economy with complete financial markets.
The monetary policy that replicates complete financial markets in this way turns out to be a nominal GDP target. Nominal GDP is denoted by Nt = PtYt, and its growth rate is denoted by nt = (Nt - Nt−1)/Nt−1. Since it is assumed that monetary policy can determine a state-contingent path for inflation pt, and since real GDP growth gt is exogenous, monetary policy can equally well be specified as a sequence of nominal GDP growth rates nt. Equation 13 for the ex-post real returns on nominal bonds can be written in terms of nominal GDP growth as follows:
r
g
j
nj
j
r
g
j
n(24)
1
1
1
1
11
11
, and1
1
1
1.1
1
0
1
1
0
2
2
1
2
++
= ++
+ γ+
+ γ+
++
= ++
Consider first the replication argument in either of the special cases of log utility (a = 1) or real GDP following a random walk (gt is an i.i.d. stochastic

Kevin D. SheeDy 315
process). In these special cases, the complete-markets debt-to-GDP ratios (equation 23) that monetary policy is aiming to replicate are nonstochastic. Suppose monetary policy sets a nonstochastic path for nominal GDP, that is, n1 = n–1 and n2 = n–2 for some constants n–1 and n–2. If the replication is successful, ct,t = 1, and so both households’ Euler equations (12) are satis-fied when 1 = dEt [(1 + rt+1)(1 + gt+1)-a]. With n2 = n–2 and equation 24, this requires, for t = 1:
Ej
n g
1
1
1
1
1,1
2 1 2
1[ ]( )++
=δ +
=β−α
using the definition of b from equation 23. It then follows from equation 24 that (1 + r2)/(1 + g2) = 1/b. From the complete-markets solution (equation 23) together with equation 10, (1 + r*2 )/(1 + g2) = 1/b, so this monetary policy ensures that the ex-post real return r2 on nominal bonds is identical to that on the complete-markets portfolio r*2 for all realizations of shocks. Similarly, with n1 = n–1 and the solution g/(1 + j1) = bg/(1 + n–2) from above, the Euler equation at t = 0 requires:
++ + γ
+
=+ βγ
+β
j
nj n
1
1
1
11
1
11
1,0
1
0 2
so (1 + r1)/(1 + g1) = 1/b, which coincides with (1 + r*1 )/(1 + g1) = 1/b. Therefore, r1 = r*1 and r2 = r*2 under this monetary policy, which establishes that dt = d*t and ct,t = c*t,t. A nominal GDP target with any nonstochastic rates of nominal GDP growth succeeds in replicating the complete- markets equi-librium and supporting risk sharing among borrowers and savers. The intu-ition is that if the numerator of the debt-to-GDP ratio (expressed in monetary units) is fixed because nominal debt liabilities are not state- contingent, the ratio can be stabilized by targeting the denominator (expressed in monetary units), that is, ensuring that nominal incomes are predictable.
There is one other special case in which a monetary policy that makes nominal GDP growth perfectly predictable manages to replicate complete financial markets, even when the complete-markets debt-to-GDP ratio d*1 is stochastic. This is the case where borrowers do not need to issue any new debt and do not need to refinance any existing debt after the initial time period. In the model, this corresponds to the limiting case of pure long-term bonds, where g → ∞ (g is the ratio of the period-2 and period-1 coupon payments on a bond issued in period 0). If monetary policy ensures

316 Brookings Papers on Economic Activity, Spring 2014
that (1+n1) (1+n2) = (1+n–)2 for some nonstochastic n–, then the equilibrium of the economy will coincide with the hypothetical complete-markets equi-librium. Unlike the earlier special cases, here it is not necessary that both the period 1 and 2 nominal GDP growth rates be nonstochastic; it is only necessary that the cumulated growth rate over both time periods be per-fectly predictable. Intuitively, with long-term debt, monetary policy needs only to ensure that nominal incomes are predictable when debt is actually repaid.
When g is finite, some existing debt must be repaid by borrowers in period 1, requiring them to issue some new bonds if they are to continue to borrow until period 2. This exposes them to risk coming from uncertainty about the interest rate that will prevail in period 1. A monetary policy that aims to replicate complete financial markets must then address refinancing risk as well as income risk. In general, this requires a target for nominal GDP growth that changes when shocks occur, although as will be seen, there will still be a long-run target for nominal GDP that is invariant to shocks. If the maturity parameter g is positive and finite, then the monetary policies that replicate complete financial markets are characterized by the following nominal GDP growth rates in periods 1 and 2:
EE
EE
n ng
g
n ng
g
(25) 1 11
1, and
1 11
1,
1 1
2
1
1 2
1
2 2
1 2
1
2
1
[ ][ ]
[ ][ ]
( ) ( )( )
( ) ( )( )
+ = +++
+ = +++
−α
−α
−α
−α
where n–1 and n–2 are any nonstochastic growth rates (these would be the actual nominal GDP growth rates in the absence of shocks). Note that any such monetary policy has the implication that
n n n n(26) 1 1 1 1 ,1 2 1 2( )( ) ( )( )+ + = + +
so the long-run target for nominal GDP must be nonstochastic. In the special cases of a = 1 or gt being i.i.d., which were analyzed earlier, the requirements on nominal GDP growth rates in equation 25 reduce simply to n1 = n–1 and n2 = n–2. Intuitively, the problem of refinancing risk is absent in these special cases, albeit for a different reason in each case. When real GDP growth rates are independent over time, there is no news that changes expected future real GDP growth, and thus no reason for the equilibrium real interest rate to vary over time. On the other hand, with log utility, the

Kevin D. SheeDy 317
real interest rate changes by the same amount and in the same direction as any revision to expectations of future growth. Higher real interest rates are then exactly offset by expectations of an improvement in future incomes relative to current incomes. This leaves monetary policy needing only to provide insurance against fluctuations in current incomes, and for this any predictable nominal GDP growth rate suffices.
As discussed above, in the special case of pure long-term debt (g → ∞), equation 26 is needed, but equation 25 need not hold. In the special case of pure short-term debt (g = 0), it can be shown that only the condition on n1 in equation 25 is needed, together with the restriction that n2 take on any value that is perfectly predictable in period 1.
I.E. Discussion
The importance of the arguments for nominal GDP targeting in this paper obviously depends on the plausibility of the incomplete-markets assumption in the context of household borrowing and saving. It seems reasonable to suppose that households will not find it easy to borrow by issuing Arrow-Debreu state-contingent bonds, but might there be other ways of reaching the same goal? Issuing state-contingent bonds is equiva-lent to households’ agreeing to loan contracts with financial intermediaries that specify a complete menu of state-contingent repayments. But such contracts would be much more time consuming to write, harder to under-stand, and more complicated to enforce than conventional noncontingent loan contracts, as well as making monitoring and assessment of default risk a more elaborate exercise. Moreover, unlike firms, households can-not issue securities such as equity that feature state-contingent payments but do not require a complete description of the schedule of payments in advance.
Another possibility is that even if households are restricted to non- contingent borrowing, they can hedge their exposure to future income risk by purchasing an asset with returns that are negatively correlated with GDP. But there are several pitfalls to this. First, it may be unclear which asset has a reliably negative correlation with GDP (even if “GDP securities” of the type proposed by Shiller [1993] were available, borrowers would need a short position in these). Second, the required gross positions for hedging may be very large. Third, a household already intending to borrow will need to borrow even more to buy the asset for hedging purposes, and the amount of borrowing may be limited by an initial down payment constraint and subsequent margin calls. In practice, a typical borrower does not have a significant portfolio of assets except for a house, and housing returns

318 Brookings Papers on Economic Activity, Spring 2014
probably lack the negative correlation with GDP required for hedging the relevant risks.
In spite of these difficulties, it might be argued that the case for the incomplete-markets assumption is overstated because the possibilities of renegotiation, default, and bankruptcy introduce some contingency into apparently noncontingent debt contracts. However, default and bankruptcy allow for only a crude form of contingency in extreme circumstances, and these options are not without their costs. Renegotiation is also not costless, and evidence from consumer mortgages in both the recent U.S. housing bust and the Great Depression suggests that the extent of renegotiation may be inefficiently low (White 2009; Piskorski, Seru, and Vig 2010; Ghent 2011). Furthermore, even ex-post efficient renegotiation of a contract with no contingencies written in ex-ante need not actually provide for efficient sharing of risk from an ex-ante perspective. In a more general model where the incompleteness of financial markets is endogenized, the inflation fluc-tuations induced by nominal GDP targeting may also play a role in mini-mizing the costs of contract renegotiation or default when the economy is hit by an aggregate shock.
It is also possible to assess the completeness of markets indirectly through tests of the efficient risk-sharing condition, which is equivalent to a perfect correlation between the consumption growth rates of differ-ent households. These tests are the subject of a large literature (Cochrane 1991; Nelson 1994; Attanasio and Davis 1996; Hayashi, Altonji, and Kotlikoff 1996), which has generally rejected the hypothesis of full risk sharing.
Finally, even if financial markets are incomplete, the assumption that contracts are written in terms of specifically nominal noncontingent pay-ments is important for the analysis. The evidence presented in Doepke and Schneider (2006) indicates that household balance sheets contain signifi-cant quantities of nominal liabilities and assets (for assets, it is important to account for indirect exposure via households’ ownership of firms and financial intermediaries). Furthermore, as pointed out by Shiller (1997), indexation of private debt contracts is extremely rare. This suggests that the model’s assumptions are not unrealistic.
The workings of nominal GDP targeting can also be understood from its implications for inflation and the real value of nominal liabilities. Indeed, nominal GDP targeting can be equivalently described as a policy of induc-ing a perfect negative correlation between the price level and real GDP and ensuring these variables have the same volatility. When real GDP falls, inflation increases, which reduces the real value of fixed nominal liabilities
Kevin D. SheeDy 319
in proportion to the fall in real income; when real GDP rises, the opposite takes place.
It is perhaps surprising that optimal monetary policy in a non- representative-agent model should feature inflation fluctuations, given the long tradition of regarding inflation-induced unpredictability in the real val-ues of contractual payments as one of the most consequential costs of infla-tion. As discussed by Clarida, Galí, and Gertler (1999), there is a widely held view that the difficulties this induces in long-term financial planning ought to be regarded as the most significant cost of inflation, more signifi-cant than the relative price distortions, menu costs, and deviations from the Friedman rule that have been stressed in representative-agent models. The view that unanticipated inflation leads to inefficient or inequitable redis-tributions between debtors and creditors clearly presupposes a world of incomplete markets, otherwise inflation would not have these effects. How then to reconcile this argument with the result that the incompleteness of financial markets suggests nominal GDP targeting is desirable because it supports efficient risk sharing? (Again, were markets complete, monetary policy would be irrelevant to risk sharing because all opportunities would already be exploited.)
While nominal GDP targeting does imply unpredictable inflation fluc-tuations, the resulting real transfers between debtors and creditors are not an arbitrary redistribution—they are perfectly correlated with the relevant fundamental shocks: unpredictable movements in aggregate real incomes. Since future consumption uncertainty is affected by income risk as well as risk from fluctuations in the real value of nominal contracts, long-term financial planning is not necessarily compromised by inflation fluctuations that have known correlations with the economy’s fundamentals. An effi-cient distribution of risk requires just such fluctuations, because the provi-sion of insurance is impossible without the possibility of ex-post transfers that cannot be predicted ex-ante. Unpredictable movements in inflation orthogonal to the economy’s fundamentals (such as would occur in the presence of monetary-policy shocks) are inefficient from a risk-sharing perspective, but there is no contradiction with nominal GDP targeting because such movements would only occur if policy failed to stabilize nominal GDP.
It might be objected that if debtors and creditors really wanted such contingent transfers then they would write them into the contracts they agree to, and it would be wrong for the central bank to try to second-guess their intentions. But the absence of such contingencies from observed con-tracts may simply reflect market incompleteness rather than what would be

320 Brookings Papers on Economic Activity, Spring 2014
rationally chosen in a frictionless world. Reconciling the noncontingent nature of financial contracts with complete markets is not impossible, but it would require both substantial differences in risk tolerance across house-holds and a high correlation of risk tolerance with whether a household is a saver or a borrower. With assumptions on preferences that make borrowers risk-neutral or savers extremely risk-averse, it would not be efficient to share risk, even if no frictions prevented households from writing contracts to implement it.
There are a number of problems with this alternative interpretation of the observed prevalence of noncontingent contracts. First, there is no compelling evidence to suggest that borrowers really are risk-neutral or that savers are extremely risk-averse relative to borrowers. Second, while there is evidence suggesting considerable heterogeneity in individuals’ risk tolerance (Barsky and others 1997; Cohen and Einav 2007), most of this heterogeneity is not explained by observable characteristics such as age and net worth (even though many characteristics such as these have some correlation with risk tolerance). The dispersion in risk tolerance among individuals with similar observed characteristics also suggests there should be a wide range of types of financial contract with different degrees of con-tingency if markets were complete. Risk-neutral borrowers would agree to noncontingent contracts with risk-averse savers, but contingent contracts would be offered to risk-averse borrowers.
Another problem with this interpretation based on complete markets but different risk preferences relates to the behavior of the price level over time. While nominal GDP has never been an explicit target of mon-etary policy, the implication of nominal GDP targeting—a countercyclical price level—has been largely true in the United States during the postwar period (Cooley and Ohanian, 1991), albeit with a correlation coefficient much smaller than one in absolute value, and a lower volatility relative to real GDP. Whether by accident or design, U.S. monetary policy has had some of the features of nominal GDP targeting, resulting in real values of fixed nominal payments positively co-moving with real GDP (but by less) on average. In a world of complete markets with extreme differences in risk tolerance between savers and borrowers, efficient contracts would undo the real contingency of payments brought about by the countercy-clicality of the price level, for example through indexation clauses. But as discussed in Shiller (1997), private nominal debt contracts have survived in this environment without any noticeable shift toward indexation. Fur-thermore, both the volatility of inflation and the correlation of the price level with real GDP have changed significantly over time; for example,

Kevin D. SheeDy 321
the high volatility of the 1970s may be contrasted with the “Great Mod-eration,” and the countercyclicality of the postwar price level may be contrasted with its procyclicality during the interwar period. The basic form of noncontingent nominal contracts has remained constant in spite of this change.
Finally, while the policy recommendation of this paper goes against the long tradition of citing the avoidance of redistribution between debtors and creditors as an argument for price stability, there is a similarly ancient tra-dition in monetary economics (which can be traced back at least to Bailey 1837) of arguing that money prices should co-move inversely with produc-tivity to promote “fairness” between debtors and creditors. The idea is that if money prices fall when productivity rises, those savers who receive fixed nominal incomes are able to share in the gains, while the rise in prices at a time of falling productivity helps to ameliorate the burden of repayment for borrowers. This is equivalent to stabilizing the money value of incomes, in other words, nominal GDP targeting. The intellectual history of this idea (the “productivity norm”) is thoroughly surveyed in Selgin (1995). Like the older literature, this paper places distributional questions at the heart of monetary policy analysis, but it studies policy through the lens of miti-gating inefficiencies in incomplete financial markets rather than through looser notions of fairness.
II. Incomplete Financial Markets in a Monetary DSGE Model
This section develops a model that allows optimal monetary policy with incomplete financial markets to be studied in an infinite-horizon production economy that includes price stickiness as an additional friction.
II.A. Households
In this model, there are equal numbers of two types of households, referred to as borrowers and savers (t ∈ {b, s}). A representative household of type t has preferences given by the following utility function
��
�� �
J
J
∑ ∏{ }= δ− α
−+
η
∞
τ=
τ +=
−τ +
−ατ +
+η
τ
τ
E C Ht t t
t t(27)1 1
1 ,,0
,0
1,
1,
11
where Ct,t is per-household consumption of a composite good and Ht,t is hours of labor supplied. The two types are now distinguished by their

322 Brookings Papers on Economic Activity, Spring 2014
subjective discount factors, with dt,t being the discount factor of type-t households between time t and t+1. Both types have a constant coefficient of relative risk aversion given by a, and a constant elasticity of intertem-poral substitution given by a-1. The household-specific Frisch elasticity of labor supply is ht. Each household of type t receives real income Yt,t at time t, to be specified below. The discount factor dt,t of type-t households is assumed to be the following:
C
Yc ct
t
t
(28) , where ,,,
,
1( )δ = δ
δ = ∆ ( )τ τ
τ
ττ τ
− −λ α
and where the parameters Db, Ds, and l are such that 0 < Db < Ds < ∞ and 0 < l < 1. It is assumed individual households of type t take dt,t as given, that is, they do not internalize the effect of their own consumption on the discount factor.
There are two differences compared to a representative-household model with a standard time-separable utility function. First, there is het-erogeneity in discount factors because borrowers are more impatient than savers (Db < Ds), all else equal. This is the key assumption that will give rise to borrowing and saving in equilibrium by the households that have been referred to as borrowers and savers. Second, discount factors display the marginal increasing impatience (l < 1) property of Uzawa (1968), in that the discount factor is lower when consumption is higher (relative to income), all else equal. This assumption is invoked for technical reasons because it ensures that the wealth distribution will be stationary around a well-defined nonstochastic steady state. That households take discount factors as given is assumed for simplicity and is analogous to models of “external” habits (see, for example, Abel 1990).
The composite good Ct,t is a CES aggregate (with elasticity of substitu-tion e) of a measure-one continuum of differentiated goods indexed by ı ∈ [0, 1], which is the same for both types of households. Households allo-cate spending Ct,t(ı) between goods to minimize the nominal expenditure PtCt,t required to obtain Ct,t units of the consumption aggregator:
∫ ∫( ) ( ) ( )= =
{ }
[ ] [ ]( )τ τ τ τ
ε−ε
εε−
τPC P C C Ct t
Ct t t t
t
ı ı ı ı ı(29) min d s.t. d ,ı
, ,
0,1
, ,
1
0,1
1
,
where Pt(ı) is the nominal price of good ı. Households of type t face a real wage wt,t for their labor. All households own equal (nontradable) share-holdings in a measure-one continuum of firms, with firm ı paying real

Kevin D. SheeDy 323
dividend Jt (ı). All households are assumed to face a common lump-sum tax Tt in real terms. Real disposable income for households of type t is thus
∫ ( )= + −[ ]
τ τ τY w H J Tt t t t tı ı(30) d ., , ,
0,1
II.B. Incomplete Financial Markets
The only liability that can be issued by households is a noncontingent nominal bond. The nominal bond has the following structure. One newly issued bond at time t makes a stream of coupon payments in subsequent time periods, paying 1 unit of money (a normalization) at time t + 1, then g units at t + 2, g2 units at t + 3, and so on (0 ≤ g < ∞). The geometric structure of the coupon payments means that a bond issued at time t - , is after its time-t coupon payment equivalent to a quantity g, of new date-t bonds. It therefore suffices to track the overall quantity of bonds in terms of new-bond equivalents, rather than the quantities of each vintage separately.5 The flow budget identity at time t of households of type t is:
CQ B
PY
Q B
Pt
t t
t
tt t
t
(31)1
,,,
,, 1( )+ = +
+ γτ
ττ
τ −
where Bt,t denotes the outstanding quantity of bonds (in terms of new-bond equivalents) held (or issued, if negative) by type-t households at the end of period t. The term 1 + gQt refers to the coupon payment plus the resale value of bonds acquired or issued in the past.
II.C. Firms
Firm ı ∈ [0, 1] is the monopoly producer of differentiated good ı. Goods are produced using an aggregator of labor inputs. Production of good ı is denoted by Yt(ı), firm ı’s labor usage by Ht(ı), and wt denotes the wage cost per unit of Ht(ı). The firm pays out all real profits at time t as dividends Jt(ı):
JP
PY w H Y A H
YP
PC
tt
t
t t t t t t
tt
t
t
ıı
ı ı ı ı
ıı
(32) , where ,
and .
1
1( )( )
( ) ( ) ( ) ( )
( )( )
= − =
=
+ξ
− ε
5. Woodford (2001) uses this modeling device to study long-term government debt. See Garriga, Kydland, and Šustek (2013) for a richer model of mortgage contracts.
324 Brookings Papers on Economic Activity, Spring 2014
The first equation following the definition of profits is the production function, with At denoting the common exogenous productivity level and where the parameter x determines the extent of diminishing returns to labor (x ≥ 0). The final equation in (32) is the demand function that arises from the household expenditure minimization problem (equation 33).
The labor input Ht (ı) is an aggregator of labor supplied by the two types of households. Firms receive a proportional wage-bill subsidy at rate e-1. Firms choose labor inputs Ht,t (ı) to minimize the post-subsidy cost wt Ht (ı) of obtaining a unit of the aggregate labor input Ht (ı):
w H w H w H
H H H
t tH
t t t t
t t t
t
ı
ı ı ı
(33) min 1 s.t.
2 .
ı
1b, b, s, s,
b,
1
2s,
1
2
,
( )( )( )
( ) ( ) ( )
= − ε +
=
( )
−
τ
The labor aggregator has a Cobb-Douglas functional form, implying a unit elasticity of substitution between different labor types.
II.D. Sticky Prices
Price adjustment is assumed to be staggered according to the Calvo (1983) pricing model. In each time period, there is a probability s that firm ı must continue to use its previous nominal price Pt-1(ı). If at time t a firm does receive an opportunity to change price, it sets a reset price denoted by Pt. The reset price is set to maximize the current and expected future stream of profits. Future profits conditional on continuing to charge Pt are multiplied by the probability s, that the reset price will actually remain in use peri-ods ahead, and then are discounted using the real interest rate rt.
�
�
�
� �
�
�� J
J
∏∑ ( )σ
+ρ
−
( )
+
−
+
−ε
+ +ξ
+ξ+
− ε +ξ
+=
∞
=
E P
P
w C
A
P
PC
Pt
t
t
t
t t
t
t
t
tt
(34) max 1
ˆ ˆ.
ˆ
1
1
1
1
00
II.E. Money and Monetary Policy
The economy is “cashless” in that money is not required for transac-tions, but money is used as a unit of account in writing financial contracts and in pricing goods. Monetary policy is assumed to be able to determine a path for the price level Pt.
II.F. Fiscal Policy
The only role of fiscal policy is to provide the wage-bill subsidy to firms by collecting equal amounts of a lump-sum tax from all households. It is

Kevin D. SheeDy 325
assumed that the fiscal budget is in balance, so taxes Tt are set at the level required to fund the current subsidy:6
∫ ( )( ) ( )= ε +[ ]
−T w H w Ht t t t tı ı ı(35) d .1b, b, s, s,
0,1
II.G. Market Clearing
Market clearing in goods, labor, and bond markets requires:
C C Yt t tı ı ı ı(36)1
2
1
2, for all 0,1 ;b, s, [ ]( ) ( ) ( )+ = ∈
H Ht tı ı(37) d1
2, for all b, s ;,
0,1
,∫ { }( ) = τ ∈[ ]
τ τ
B Bt t(38)1
2
1
20.b, s,+ =
II.H. Equilibrium
The derivation of the equilibrium conditions is presented in the online appendix.7 The analysis of incomplete financial markets follows the method used for the simple model in section I, while other aspects of the model are standard features of New Keynesian models with sticky prices. The consumption-to-GDP ratios are ct,t ≡ Ct,t /Yt, and the debt-to-GDP ratio dt, loans-to-GDP ratio lt, ex-post real return rt, and real interest rate rt are defined as in equation 8. The yield-to-maturity jt on the nominal bonds is defined by:
�
��
Qj
jQ
t
t
t
t
(39)1
, implying1
1 .1
1∑ ( )
= γ+
= − + γ−
=
∞
As in the simple model of section I, the analysis will also make use of an otherwise identical model where financial markets are complete, where the equivalents of d*t, l*t, and r*t are as defined in equation 19.
6. The wage-bill subsidy is a standard assumption which ensures the economy’s steady state is not distorted (Woodford 2003). A balanced-budget rule is assumed to avoid any inter-actions between fiscal policy and financial markets.
7. Online appendixes for this volume may be found at the Brookings Papers website, www.brookings.edu/bpea, under “Past Editions.”

326 Brookings Papers on Economic Activity, Spring 2014
In a steady state where exogenous productivity At is growing at a con-stant rate, there is a steady-state rate of real GDP growth g–. The steady-state consumption-GDP ratios are given by
c c(40) 1 , 1 , where1
1,b s
b s
1
b s
1
( )( )
= − θ = + θ θ ≡ − ∆ ∆+ ∆ ∆
( )
( )
−λ α
−λ α
where 0 < q < 1. The term q depends on the relative patience Db/Ds of the two household types and the utility-function parameters a and l. The steady-state discount factors and real interest rate are:
( )( )
δ = δ = δ ≡ ∆ + ∆
ρ = = +β
−
β ≡ δ +
( )−λ α
−α
( ) ( )−λ α −λ α rg
g
(41) 2 ,1
1,
where 1 ,
b s b
1
s
1 1
1
1 1
and it is assumed that g– is low enough to ensure that 0 < b < 1. In the steady state, the discount factors of the two types are aligned at d, which is effec-tively an average of the patience parameters Db and Ds. The steady-state debt ratios can be written in terms of b and q as follows:
d l(42)2 1
, and2 1
.( ) ( )
= θ− β
= βθ− β
The model can be parameterized directly with b and q rather than the two patience parameters Db and Ds (leaving a, l, and g– to be chosen sepa-rately). The term b plays the usual role of the discount factor in a repre-sentative-household economy given its relationship with the real interest rate (with an adjustment for steady-state real GDP growth). The term q quantifies the extent of heterogeneity between borrower and saver house-holds, which is related to the amount of borrowing and saving that occurs in equilibrium, and hence to the debt-to-GDP ratio in equation 42. Given equation 40, q can be interpreted as the “debt service ratio” because it is the net fraction of income transferred by borrowers to savers. As will be seen, q is a sufficient statistic for the extent of heterogeneity in the econ-omy, with q → 0 being the limiting case of a representative-household economy (Db → Ds).
Given that prices are sticky, attention is restricted to a zero-inflation steady state. Rather than specify the bond coupon parameter g directly, it is

Kevin D. SheeDy 327
convenient to set the steady-state fraction of debt that is not refinanced each period, denoted by µ. This fraction is µ = g/(1 + g–). Finally, a parameter restriction on the Frisch elasticities of borrowers and savers is imposed, which implies that the wealth distribution has no effect on aggregate labor supply (up to a first-order approximation):
(43) 1 1 , and 1 1 ,b s( ) ( ) ( ) ( )η = − θ η + θη η = + θ η − θη
where q is the steady-state debt service ratio defined in equation 40 and h is the effective aggregate Frisch elasticity of labor supply (it is assumed that h < 1/q).
III. Optimal Monetary Policy
This section studies the features of optimal monetary policy in the DSGE model with incomplete financial markets of section II. An exact analytical solution is not available in general, so this section resorts to finding the log-linear approximation of the optimal policy (the first-order perturbation around the nonstochastic steady state), which can be found analytically. The method is the familiar linear-quadratic approach whereby the appro-priate welfare function is approximated up to second-order accuracy and is minimized subject to first-order accurate approximations of the equilibrium conditions, which act as the constraints on monetary policy. Derivations of all results are found in the appendix.
The notational convention below is that variables in a sans serif font (for example, d) denote log deviations of the equivalent variables in roman letters (for example, d) from their steady-state values (log deviations of interest rates, inflation rates, and growth rates are log deviations of the cor-responding gross rates; for variables that have no steady state, the sans serif letter simply denotes the logarithm of that variable).
III.A. Constraints
Monetary policy analysis can be performed by studying just four endoge-nous variables: the “debt gap” d~t, the inflation rate pt ≡ Pt - Pt-1, the nominal bond yield jt, and the output gap Y~t. The debt gap d~t ≡ dt - d*t is the devia-tion of the actual debt-to-GDP ratio dt from the “natural debt-to-GDP ratio” d*t, that is, the debt-to-GDP ratio that would prevail with complete financial markets (* signifies complete financial markets). The natural debt-to-GDP

328 Brookings Papers on Economic Activity, Spring 2014
ratio d*t is a multiple of the discounted sum of expectations of future real GDP growth gt = Yt - Yt−1:8
�
��Et t t∑)(= − α β
=
∞
+(44) * 1 .1
d g
With complete financial markets, the consumption of borrowers and savers would co-move perfectly with each other and with real GDP (their con-sumption ratios would be c*b,t = 1 - q and c*s,t = 1 + q). Since the debt-to-GDP ratio completely describes the distribution of financial wealth when there is a representative borrower and a representative saver, the debt gap d~t is a sufficient statistic for the deviation of the consumption allocation from the risk sharing provided by complete financial markets:
c d c dt t t t
( )( )( )
( )( )( )
= − θ − βλ− θ − β
= θ − βλ+ θ − β
(45)1
1 1~
, and1
1 1~
.b, s,
A positive debt gap corresponds with the consumption of savers growing faster than that of borrowers, and a negative debt gap corresponds with the consumption of savers growing more slowly than that of borrowers.
The output gap Y~t ≡ Yt - Ŷt is the deviation of the actual level of output Yt from the natural level of output Ŷt, that is, the level of output that would prevail with fully flexible prices (ˆ signifies flexible prices).9 The growth rate gt = Ŷt - Ŷt−1 of the natural level of output is:
( ) ˆ461
1
1 1g A At t t=+ + +
+ + +
−( )−
ξ ξη
α ξ ξη
,,
which is a multiple of the exogenous growth rate of total factor productiv-ity At as in the textbook New Keynesian model.
8. Note that the natural debt-to-GDP ratio is not independent of monetary policy when monetary policy is able to affect real GDP growth.
9. The assumption (equation 43) on the Frisch elasticities of borrowers and savers ensures that the level of output with flexible prices is independent of the wealth distribution, and thus the completeness of financial markets, up to a first-order approximation. The gen-eral case is taken up in an earlier working paper (Sheedy 2014).
Kevin D. SheeDy 329
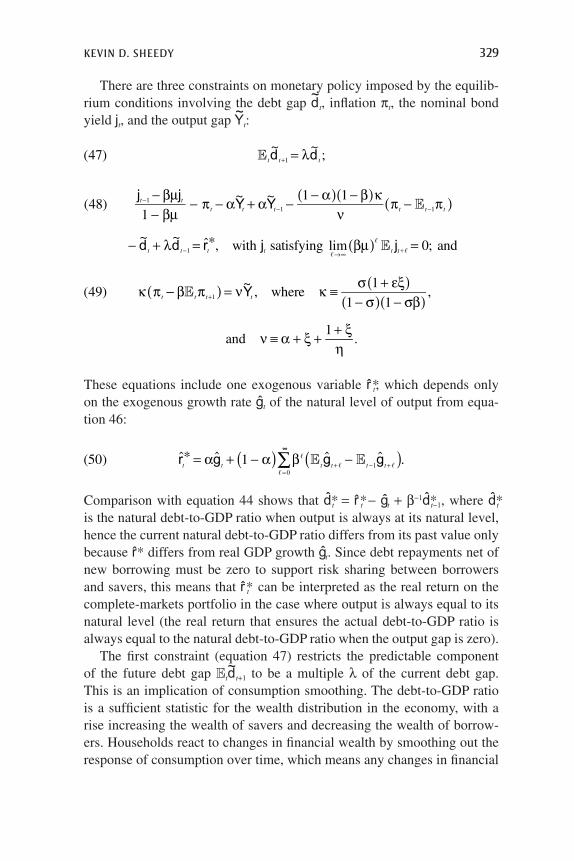
There are three constraints on monetary policy imposed by the equilib-rium conditions involving the debt gap d~t, inflation pt, the nominal bond yield jt, and the output gap Y~t:
E t t t(47)~ ~
;1 = λ+d d
j jY Y
d d r j j�
�
�
E
E
t tt t t t t t
t t t t t t
( )( ) ( )
( )
− βµ− βµ
− π − α + α − − α − β κν
π − π
− + λ = βµ =
−− −
− →∞ +
(48)1
~ ~ 1 1
~ ~ ˆ*, with satisfying lim 0; and
11 1
1
Et t t t(49)~
, where1
1 1,
and1
.
1
( )( )( )( )
κ π − β π = ν κ ≡ σ + εξ− σ − σβ
ν ≡ α + ξ + + ξη
+ Y
These equations include one exogenous variable r*t, which depends only on the exogenous growth rate gt of the natural level of output from equa-tion 46:
( ) ˆ* ˆ ˆ ˆ50 1 10
r g g gt t t t t t= + −( ) −( )+ − +=
α α β�
� ��
E E∞∞
∑ .
Comparison with equation 44 shows that d*t = r*t - gt + b-1d*t−1, where d*t is the natural debt-to-GDP ratio when output is always at its natural level, hence the current natural debt-to-GDP ratio differs from its past value only because r* differs from real GDP growth gt. Since debt repayments net of new borrowing must be zero to support risk sharing between borrowers and savers, this means that r*t can be interpreted as the real return on the complete-markets portfolio in the case where output is always equal to its natural level (the real return that ensures the actual debt-to-GDP ratio is always equal to the natural debt-to-GDP ratio when the output gap is zero).
The first constraint (equation 47) restricts the predictable component of the future debt gap Etd
~t+1 to be a multiple l of the current debt gap.
This is an implication of consumption smoothing. The debt-to-GDP ratio is a sufficient statistic for the wealth distribution in the economy, with a rise increasing the wealth of savers and decreasing the wealth of borrow-ers. Households react to changes in financial wealth by smoothing out the response of consumption over time, which means any changes in financial

330 Brookings Papers on Economic Activity, Spring 2014
wealth are persistent. This persistence is tempered by the marginal increas-ing impatience of the Uzawa discount factors (equation 28) when l < 1, ensuring stationarity of d~t.
The second constraint (equation 48) determines the unpredictable com-ponent of the debt gap d~t - Et−1d
~t = d~t - ld~t−1. The first two terms on the left-
hand side are equal to the ex-post real return rt on nominal bonds between date t - 1 and t:
tt t
t(51)1
.1= − βµ− βµ
− π−rj j
In the case of short-term debt (µ = 0), this collapses to the usual ex-post Fisher equation rt = jt−1 - pt. With longer term debt (µ > 0), a rise in the current nominal yield jt reduces the real value of existing nominal assets or liabilities. Equation 48 shows that the unpredictable component of the debt gap d~t - Et−1 d
~t depends positively on the difference between the actual
ex-post real return on nominal bonds rt and the complete-markets-portfolio real return r*t (assuming output is always at its natural level). Intuitively, if the actual real return is too high compared to the complete-markets port-folio, the debt gap rises; the opposite happens if the real return is too low. The remaining terms in the middle of the left-hand side of equation 48 are present because the debt gap d~t is defined as the deviation of dt from d*t, that is, in terms of the natural debt-to-GDP ratio associated with the actual sequence of real GDP growth rates (which equation 45 shows is what is rel-evant for risk sharing), rather than the hypothetical sequence of real GDP growth rates gt that would occur with flexible prices. These additional terms in equation 48 reflect the deviation of d*t from d*t owing to price stickiness.
The third constraint (equation 49) is the standard New Keynesian Phil-lips curve pt = bEtpt+1 + (n/k)Y~t relating current inflation to the output gap and expected future inflation. The coefficients in the Phillips curve are identical to those found in the textbook New Keynesian model (see Wood-ford 2003).10 The elasticity of real marginal cost with respect to the output gap Y~t is n, and k captures the extent of nominal and real rigidities.
The textbook New Keynesian model comprises the Phillips curve equa-tion 49 and an “IS curve,” where the IS curve is essentially a consumption Euler equation. Although the model here does not feature a representative
10. If the assumption in equation 43 is relaxed then the debt gap d~t will appear in the Phillips curve. The consequences of this are taken up in an earlier working paper (Sheedy 2014), but they are not found to be quantitatively important.

Kevin D. SheeDy 331
household, it turns out that the usual IS curve is an implication of the two equations 47 and 48 together:11
t t t t t tt t t
t t
t t t
)(= − α ρ − ρ ρ = − βµ− βµ
− π
ρ = α
+− +
+
+
(52)~ ~ ˆ , where
1,
and ˆ ˆ .
11 1
1
1
Y Yj j
g
E E E
E
The term rt = Etrt+1 is the (ex-ante) real interest rate (the expected value of the real return rt on nominal bonds from equation 51). This reduces to rt = jt - Etpt+1 in the special case of short-term debt (µ = 0), which is what is assumed in the textbook New Keynesian model. The term rt is the natural real interest rate (the ex-ante interest rate that would prevail if prices were flexible, not to be confused with the ex-post real return r*t that would prevail with complete financial markets), which also has an identical form to the textbook model. Note that the nominal yield jt is a weighted average of expectations of current and future sums of real interest rates and inflation rates:
�
� ��
Et t t t(53) 1 ,10
∑ [ ]( ) ( )= − βµ βµ ρ + π+ + +=
∞
j
where the weights on future expectations depend on b and the maturity parameter µ (the equation above uses the no-Ponzi condition in equation 48, which is necessary to rule out bubbles when µ > 0 because bonds have no terminal date).12
An implication of equation 52 is that rt = a Et gt+1. Using this, the expres-sion for the natural debt-to-GDP ratio in equation 44 can be given a more intuitive form:
��
�
�
Et t t t t(54) * 1 ,1
0 0
J
J
∑∑( )= − β β − ρ
−+ +
−
=
∞
=
d Y Y
which states that the natural debt-to-GDP ratio moves one-for-one with the ratio of the present discounted value of all current and future real GDP to current real GDP. Intuitively, financial wealth must co-move with the
11. This is because the model has the feature that the marginal propensities to consume from financial wealth are the same for borrowers and savers up to a first-order approximation.
12. With both short-term and long-term bonds satisfying the expectations theory of interest rates jt = (1 - bµ)Σ∞
,=0 (bµ),Etit+, where it is the short-term interest rate, then the usual ex-ante Fisher equation it = rt + Etpt+1 would hold.

332 Brookings Papers on Economic Activity, Spring 2014
present value of all nonfinancial income to support risk sharing between borrowers and savers; in other words, the complete-markets portfolio is an equity share in real GDP.
The three constraints in equations 47–49 leave one degree of freedom for monetary policy to affect the four endogenous variables. For simplic-ity, monetary policy can be thought of as selecting a state-contingent path for the inflation rate pt or any other nominal variable such as nominal GDP growth. Given a path for the inflation rate pt, the Phillips curve (equation 49) determines the output gap Y~t. The two equations (47 and 48) can then be solved for the debt gap d~t in terms of the inflation path and an exogenous shock ℘t that depends on the natural real GDP growth rate gt:
(55)~ ~
1
1 ,
where 1 1 ˆ .
1 10
1 10
1
01
∑
∑
∑
( ) ( )
( ) ( ) ( )( )
( ) ( )
( )( )( )
= λ −℘ − βµ − π
− αβ − µ κν
βµ − π − π
− − β κν
− π
℘ = β − α − µ −
∞
∞
∞
− − +=
− + + +=
−
=− +
d d
g
�
��
�
� ��
� �
��
E E
E E
E E
E E
t t t t t t
t t t t
t t t
t t t t
The next step in characterizing optimal monetary policy is to specify the objective function.
III.B. Objective Function
The objective function for monetary policy is taken to be the social wel-fare function with Pareto weights that support the complete-markets con-sumption allocation (meaning that the weights of borrowers and savers are proportional to (1 - q)a and (1 + q)a respectively). The social planner takes the discount factors (equation 28) as given, so there is no tension with the household decision problem where these discount factors were also taken as given. The welfare function is scaled by a function of initial output with flexible prices so that its units are percentage equivalents of initial output.
A second-order approximation of the welfare function (starting from date t0) around the nonstochastic steady state is given by the negative of the loss function,
� d Y∑ ( )( )
( ) ( )( )= β
αθ − βλ− θ − β
+αη
+ ξ + η+ εκπ + ν−
=
∞
Et
t t
tt t
t t t(56)1
2,
1
1 11
1 1
~ ~2 2
2 22 2 2
0
0
0
0

Kevin D. SheeDy 333
where terms that are independent of monetary policy are ignored. The loss function includes the squared debt-to-GDP gap d~t, which is a suffi-cient statistic for the welfare loss due to deviations from risk sharing. The coefficient is increasing in risk aversion a and the degree of heterogene-ity between borrower and saver households as measured by q. Intuitively, greater risk aversion increases the importance of the risk sharing that is obtained from complete financial markets, while greater heterogeneity between households leads to larger financial positions of borrowers and savers, so a given percentage change in financial wealth has a larger impact on consumption.
The second term in the loss function (equation 56) is the squared infla-tion rate, which is a sufficient statistic for the welfare loss due to rela-tive-price distortions. This is a well-known property of Calvo pricing. The coefficient is increasing the price elasticity of demand e, the probability of price stickiness s, and the output elasticity of marginal cost x, which affects the degree of real rigidity in the economy. The third term in the loss function is the squared output gap. This represents the losses from aggre-gate output and employment deviating from their efficient levels, and its coefficient is simply the elasticity n of real marginal cost with respect to the output gap. Both loss-function coefficients are identical to those found in the textbook New Keynesian model.
Optimal monetary policy minimizes the loss function (equation 56) sub-ject to the constraints in equations 47–49. It is assumed that the central bank is able to commit to a policy and that this commitment has been made at some date t0 far in the past.13 The model developed here has essentially added one variable (the debt gap) and one equation to the textbook three-equation and three-variable New Keynesian model; the extra variable also appears in the utility-based loss function. This provides a parsimonious and tractable framework for studying how the incompleteness of financial markets affects optimal monetary policy.
III.C. Special Case I: Complete Markets or a Representative Household
Suppose that the assumption that households can only buy or sell nomi-nal bonds is changed to allow them access to complete financial markets. All other features of the model in section II are unchanged. In this version of the model, the value of contingent debt liabilities would always equal the natural debt-to-GDP ratio, so the debt gap d~t would always be zero.
13. Time consistency issues and the discretionary policy equilibrium are studied in an earlier working paper (Sheedy 2014).

334 Brookings Papers on Economic Activity, Spring 2014
Hence d~t = 0 replaces equation 48, and equation 47 automatically holds. It follows that the task of optimal monetary policy is to minimize only the inflation and output gap terms in the loss function (equation 56). Given the Phillips curve (equation 49) with its “divine coincidence” property that stabilizing inflation is equivalent to stabilizing the out- put gap, optimal monetary policy is strict inflation targeting pt = 0. Since Y~t = 0 and d~t = 0 in this special case, the policy achieves a first-best allo-cation of resources.
Alternatively, maintain the assumption of incomplete financial markets, but consider the special case of a representative household where the dif-ference between households labeled ‘borrowers’ and those labeled ‘savers’ is eliminated. This difference is the degree of impatience represented by the parameters Db and Ds in equation 28. If Db = Ds, then equation 40 shows that this corresponds to a case where q = 0. The coefficient of the debt gap in the loss-function equation 56 is zero, so optimal monetary policy again needs only to minimize the inflation and output gap terms subject to the Phillips curve (equation 49). Strict inflation targeting is again optimal and results in a first-best allocation of resources, corresponding to the finding in the textbook New Keynesian model.
III.D. Special Case II: Fully Flexible Prices
Suppose goods prices are fully flexible, which means that s = 0 and hence k = 0 using equation 49. The coefficient of inflation in the loss func-tion (equation 56) is zero in this case, because inflation does not lead to relative-price distortions. Furthermore, the Phillips curve (equation 49) implies the output gap is zero (Y~t = 0) irrespective of the behavior of infla-tion. Consequently, the only concern of optimal monetary policy is to mini-mize the first term involving the debt gap in the loss function (equation 56). Since inflation affects the ex-post real return on nominal bonds (and thus the debt gap) through equation 48, it is feasible to obtain d~t = 0, which achieves a first-best allocation of resources.
Since inflation has a zero coefficient in the loss function (equation 56), there are generally many possible inflation paths equally consistent with d~t = 0 and thus the same zero value of the loss function. An inflation path must satisfy Σ∞
,=0 (bµ), (Etpt+, - Et−1pt+,) + ℘t = 0, which follows from equa-tion 55 with d~t = 0 and k = 0. With a zero output gap (gt = gt), the exogenous shock ℘t from equation 55 is:
( ) .57 1 1 10
℘ = − −( )( ) −( )+ − +=
∞
∑t t t t tβ α µ� �� �
�
E Eg g

Kevin D. SheeDy 335
The first part of this expression is news about the sequence of current and expected future real GDP growth rates Σ∞
,=0 b,Etgt+, (discounting using the steady-state discount factor b). This captures any change in the antici-pated stream of nonfinancial income that can be used by borrowers to service their debts.
Using the formula for the real interest rate rt = aEtgt+1, the second part of equation 57 is seen to be news about the sequence of current and expected future real interest rates Σ∞
,=0 b,+1(1 - µ,+1)Etrt+,. An increase in this term is associated with a rise in the current or anticipated future cost of continu-ing to borrow. The interest rate , periods ahead is multiplied not only by the discount factor b,+1 but also by 1 - µ,+1. The reason is that changes in (ex-ante) real interest rates affect borrowers only to the extent that existing debt is refinanced or new debt is issued, and the (steady-state) fraction of existing debt that remains un-refinanced , periods from now is µ,+1. Over-all, the terms in equation 57 capture the shock to the stream of nonfinancial income, adjusted for any mitigating changes (when a < 1) or aggravating changes (when a > 1) in real interest rates triggered by this news.
Let Nt = Pt + Yt denote the level of (log) nominal GDP. Adopting the nominal GDP target below ensures that the debt gap is zero and therefore replicates complete financial markets:
t t(58)1
1*.
( )( )
= − − µ− βµ
N d
Monetary policy should target a constant level of nominal GDP if the natu-ral debt-to-GDP ratio d*t is constant; and, if the natural debt-to-GDP ratio changes, the target for the level of nominal GDP should be adjusted in the opposite direction. In the case of short-term debt (µ = 0), this target reduces simply to Nt = -d*t, so the nominal GDP target should move one-for-one in the opposite direction to the natural debt-to-GDP ratio. Intuitively, if the nominal value of debt liabilities is completely predetermined (as it is with one-period debt), the debt-to-GDP ratio should be adjusted to the natu-ral debt-to-GDP ratio by having the denominator of the debt-to-GDP ratio (nominal GDP) move inversely with the natural debt-to-GDP ratio. With longer-maturity debt (µ > 0), the nominal GDP target does not need to adjust as much to changes in the natural debt-to-GDP ratio.
Equation 58 shows that a constant nominal GDP target is optimal when either the natural debt-to-GDP ratio d*t is constant, or when debt has a sufficiently long maturity so that no refinancing is necessary (µ = 1). To understand this, first consider the special case where real GDP follows a
336 Brookings Papers on Economic Activity, Spring 2014
random walk, so that real GDP growth gt is an i.i.d. stochastic process, with equation 44 implying that d*t = 0. Equation 57 shows that the exogenous shock ℘t is simply equal to current real GDP growth gt in this case. Fol-lowing a constant nominal GDP target implies pt = -gt, which means the inflation rate is also serially uncorrelated. The term Σ∞
,=0(bµ),Etpt+, reduces to pt, which confirms (using equation 55) that the nominal GDP target Nt = 0 is optimal.
Intuitively, if shocks to real GDP are permanent, the current percent-age change in real GDP is equal to the percentage change in the present discounted value of all current and future real GDP. (There is no change in ex-ante real interest rates because consumption smoothing calls for an equal-sized adjustment of consumption, as confirmed by the equation rt = aEtgt+1.) A constant nominal GDP target moves the price level unex-pectedly in the opposite direction to real GDP, which changes the real value of all nominal debt liabilities (of whatever maturity) by the same percent-age as the stream of real nonfinancial income, which is what is required for risk sharing.
With different dynamics of real GDP, current real GDP growth is not the same as the percentage change in the present discounted value of the stream of nonfinancial income. Now consider the case where utility is logarithmic in consumption (a = 1), where equation 57 implies ℘t = Σ∞
,=0
(bµ), (Etgt+, - Et−1gt+,). Since a constant nominal GDP target means pt = -gt, the innovation to Σ∞
,=0 (bµ), Etpt+, is equal to -℘t, so the policy succeeds in replicating complete financial markets.
To understand the intuition, suppose all debt is refinanced each period, where only unexpected inflation leads to a change in the real value of exist-ing debt (though the argument applies to any maturity of debt). The nomi-nal GDP target ensures that any surprise change in current real GDP will be matched by an equal percentage change in the real value of debt. How-ever, changes in current real GDP are not necessarily an accurate reflection of changes in the value of the stream of current and future nonfinancial income, which is what ultimately matters for the ability of borrowers to service their debts. For example, an expected recovery of real GDP follow-ing an initial negative shock means that the loss of current income over-states the fall in the present discounted value of current and future real GDP. However, such predictable variation in real GDP growth rates also leads to changes in ex-ante real interest rates, with an expected rise in real GDP increasing interest rates. In the example of the expected recovery, the position of borrowers is worsened by the higher interest rates because they must refinance their debts.

Kevin D. SheeDy 337
With logarithmic utility, the percentage-point change in the real interest rate is equal to the percentage-point change in expected real GDP growth, so with an expected recovery the higher real interest rate exactly cancels out the benefit of the higher income anticipated in the future. A constant nominal GDP target is optimal because the required adjustment of the real value of debts for risk sharing is, therefore, simply equal to the unexpected change in current real GDP. This argument applies more generally for any maturity parameter µ when utility is logarithmic. The longer the maturity of debt, the less impact changes in real interest rates will have on borrowers, because there is less refinancing, but the greater the effect of predictable inflation on the real value of existing debt. These two forces exactly cancel each other out with logarithmic utility, and a constant nominal GDP target remains optimal.
In the special case of very long maturity debt that requires no refinanc-ing (µ = 1), observe that the shock ℘t in equation 57 reduces to ℘t = Σ∞
,=0 b,(Etgt+, - Et−1gt+,). Unsurprisingly, the terms related to changes in ex-ante real interest rates are absent, because there is no refinancing risk for bor-rowers. With µ = 1, Σ∞
,=0 (bµ), Etpt+, = Σ∞,=0 b, Etpt+,, so a constant nominal
GDP target that implies pt = -gt succeeds in achieving d~t = 0.Intuitively, given debt’s long maturity, both predictable and unpredict-
able inflation have exactly the same effect on its real value. Hence, in the absence of refinancing risk, whatever the dynamics of real GDP are, infla-tion movements in the opposite direction that mirror real GDP growth ensure that the real value of debt moves one-for-one with the present dis-counted value of the stream of nonfinancial income. More generally, for 0 < µ < 1, the longer the maturity of debt, the less important is refinancing risk, and the smaller the difference between the effects of unpredictable and predictable inflation on the real value of debt. When real GDP dis-plays predictable dynamics, it is these two factors that explain why the nominal GDP target (equation 58) needs to move with the natural debt-to-GDP ratio, and thus why the adjustment of the target is smaller when µ is larger.
As discussed, when µ > 0, the optimal monetary policy is not unique because many different inflation paths can lead to the same real value of debt. Rather than a nominal GDP target (equation 58) that adjusts to changes in the natural debt-to-GDP ratio, it is often possible to find a time-invariant weighted nominal GDP target Nw,t ≡ Pt + wYt = 0 that achieves the same outcome for some relative weight w on real GDP. If real GDP growth is a stationary and invertible stochastic process that can be expressed as gt = Σ∞
,=0 J,et−, for a white-noise shock et and a sequence of coefficients {J,}

338 Brookings Papers on Economic Activity, Spring 2014
then the following monetary policy will also replicate complete financial markets:
�
��
� ��
�
t t t(59) * 0, where * 1 1 1 .*,0
0
∑
∑( )≡ + ω = ω = + α − −
β ϑ
β µ ϑ
ω=
∞
=
∞N P Y
Note that w* is equal to one (an unweighted nominal GDP target) in any of the special cases discussed above (namely, J, = 0 for all , ≥ 1, or a = 1, or µ = 1). It might be tempting to interpret equation 59 as a form of flexible inflation targeting, but it is important to note that Yt is the level of real GDP, not the output gap. It is crucial that the measure of real GDP in equation 59 is not corrected for any changes in potential output.
III.E. Special Case III: Sticky Prices and Inelastic Labor Supply
With a zero Frisch elasticity of labor supply (h = 0), equation 49 shows that n → ∞ (n is the elasticity of real marginal cost with respect to the output gap). The Phillips curve (equation 49) then implies that the output gap must be zero (Y~t = 0) even though prices are sticky. While the coef-ficient of the output gap in the loss function (equation 56) becomes large, the product of this with the squared output gap tends to zero. Thus, optimal monetary policy is concerned only with the first two terms in the loss func-tion (equation 56), the debt gap d~t and the inflation rate pt. However, there is a trade-off when stabilizing these variables because inflation that affects the real value of debt now leads to relative price distortions because prices are sticky. The optimal monetary policy subject to this trade-off is:
d dt t t t t t( ) ( )= λ − − χ ℘ π = µπ − χ − βµ ℘− −(60)~ ~
1 , and 1 ,1 12
where
(61) 11 1 1 1 1
1 1 1,
2 2 2 2
2 2
1( ) ( )( ) ( )( )( )( )( )
χ = + ε + εξ σ − θ − β − βλ − βµαθ − σ − βσ − βλ
−
and where ℘t is as given in equation 57. With sticky prices, replicating complete financial markets through variation in inflation is costly, so the central bank tolerates some deviation from full risk sharing. To the extent that c in equation 61 is less than one, a shock ℘t leads to fluctuations in the debt gap d~t. These fluctuations are persistent (the debt gap is an AR(1) process) because of the constraint in equation 47: the serial correlation of

Kevin D. SheeDy 339
the debt gap must be l. Once a nonzero debt gap arises at time t, because of consumption smoothing there is no predictable future policy action that can undo its future consequences.
Equation 60 shows that if c were equal to 1, the debt gap would be com-pletely stabilized, and if c were 0, inflation would be completely stabilized. Since 0 < c < 1, optimal monetary policy can be interpreted as a mixture of strict inflation targeting and a policy that replicates complete financial mar-kets. As the responses of d~t and pt to the shock ℘t are linearly related to c, the terms c and 1 - c can be interpreted respectively as the weights on support-ing risk sharing and avoiding relative-price distortions. Comparing equations 56 and 61, it can be seen that c is positively related to the ratio of the coef-ficients of d~2
t and p2t in the loss function divided by (1 - bl2) and (1 - bµ2).
Greater risk aversion (a) or more heterogeneity (q) and hence more bor-rowing increase the coefficient of d~2
t and thus c; a larger price elasticity of demand (e), stickier prices (s), or more real rigidities (x) increase the coefficient of p2
t and thus reduce c. The optimal trade-off is also affected by the constraints in equations 47 and 48, which explains the presence of the terms (1 - bl2) and (1 - bµ2) in the formula for c. A greater value of l increases the persistence of the debt gap, which makes fluctuations in d~t significantly more costly than suggested by the loss function coefficient alone. The parameter µ affects the link between bond yields and the debt gap. It is evident that an increase in µ leads to a higher value of c, the intu-ition for which is related to the optimal behavior of inflation. Finally, note that while the optimal policy responses depend on the stochastic process for real GDP growth (which determines the shock ℘t according to equa-tion 57), the optimal weight c does not.
Equation 60 shows that optimal monetary policy features inflation per-sistence (the optimal behavior of inflation is an AR(1) process). The opti-mal serial correlation is given by the debt maturity parameter µ, which is the steady-state fraction of un-refinanced debt in each time period. The result is that inflation should return to its average value at the same rate at which debt is refinanced. At the extremes, one-period debt (µ = 0) cor-responds to serially uncorrelated inflation, while perpetuities (g = 1, for which µ ≈ 1) correspond to near random-walk persistence of inflation.
To understand this, note that with one-period debt, the current bond yield jt disappears from the constraint (equation 48); thus, the only way that policy can affect d~t is through an unexpected change in current inflation. With longer-maturity debt, the range of policy options increases. Changes in current bond yields jt are also relevant in addition to current inflation, and the bond yield is affected by expectations of future inflation (equation 53).
340 Brookings Papers on Economic Activity, Spring 2014
This can be seen from equation 55 where the sum Σ∞,=0 (bµ), (Etpt+, - Et−1pt+,)
affects the debt gap, with µ, being the fraction of existing debt that will not have been refinanced after , time periods. It is possible to use inflation that is spread out over time to influence the debt gap when µ > 0, not only inflation surprises.
Furthermore, this ‘inflation smoothing’ is optimal because the welfare costs of inflation are convex (inflation appears in the loss function [equa-tion 56] as p2
t), so the costs of a given cumulated amount of inflation are smaller when spread out over a number of quarters or years than when all the inflation occurs in just one quarter. This is analogous to the “tax smooth-ing” argument of Barro (1979). Interestingly, the argument shows that high degrees of inflation persistence need not be interpreted as a failure of policy. In contrast with the tax smoothing analysis, it is generally not opti-mal for inflation to display random-walk or near-random-walk persistence unless debt contracts are close to perpetuities. As the maturity parameter µ is reduced and thus bµ falls significantly below one, expectations of infla-tion far in the future have a smaller effect on bond yields than inflation in the near future. The further in the future inflation is expected to occur, the less effective it is at influencing real returns and thus the debt-to-GDP ratio.
Even if optimal monetary policy places a substantial weight c on risk sharing compared to relative-price distortions, in what sense does mon-etary policy still resemble a nominal GDP target? It turns out that optimal monetary policy retains the essential feature of nominal GDP targeting in generating a negative co-movement between prices and output. However, because of the desire to smooth inflation, the central bank should not gen-erally aim to stabilize nominal GDP (or a weighted measure of nominal GDP) exactly on a quarter-by-quarter basis. Instead, optimal policy can be formulated as a long-run target for weighted nominal GDP together with the inflation smoothing rule Etpt+1 = µpt implied by equation 60. When real GDP is nonstationary, optimal monetary policy features cointegration between the price level and output. If real GDP growth is the stationary and invertible stochastic process gt = Σ∞
,=0 J,et−,, then
P Y
� ��
�
��
t t
∑
∑
( )
( )+ ω ω = χω
− βµ β µ ϑ
− µ ϑ
→ → =
∞
=
∞(62) stationary, where *1
1,
2
0
0
with w* as given in equation 59. This cointegrating relationship can be interpreted as a long-run target for weighted nominal GDP, because there is some linear combination of the price level and real output that is invariant to shocks in the long run.

Kevin D. SheeDy 341
III.F. The General Case
In the general case where labor supply is elastic (h > 0), monetary policy can also affect the output gap Y~t through the Phillips curve (equation 49), and the ex-ante real interest rate rt through the IS curve in equation 52 (implied by equations 47 and 48). This is important not only because of a concern for stabilizing the output gap, given that it appears in the loss function (equation 56), but also because the output gap affects the debt gap d~t through the constraint (equation 48). The IS curve (equation 52) implies that the output gap and the ex-ante real interest rate rt are linked by rt = aEt Y
~t+1 - aY~t + rt, where rt is the natural real interest rate. The coefficient
a of the output gap in this equation is the source of the coefficient a of Y~t in equation 48.
The solution to the optimal monetary policy problem in the general case is:
�t t t(63)~ ~
1 , where2
1 1 4, and1 2
( )( )
= λ − − χ ℘ =+ β + + + β + − β
−ενκ
ενκ
d d
( )
( )
( )( ) ( )( )
( )( )( ) ( )( )
( )( )
( )( ) ( )( )( )
( )( )
( )( )
χ = +
ε + εξ σ − θ − β − βλ − βµ
αθ − σ − βσ − βλ − + αη+ ξ + η
− βµ− βµ
ν + κ − β − βµ + αβ − µ −ν
+ β − β− βµ
ακ − µ − βµ − µνν
−
�
�
� �
�
�
(64) 1
1 1 1 1 1
1 1 1 1 11 1
11
1 1 1 1
11
1 1
;
2 2 2 2
2 2
2
2
2
2
2
1
( )65 1
1 1
1 22π µ π µ π χ βµ
ν κ β
t t t= +( ) − − −( )
×
+ −( ) −
− −� �
ββµ αβ µν
βµ ν κ α µ
� �
�
( )+ −( ) −( )( )
℘ −
+ −( )
1 1
1
t
ββµ β βµ µ β βµν
1 1 1 1 1−( )+ −( ) −( )( )+ −( ) −( )( )
� � � ℘
−( )−( )
+ −( ) −( )+ −
−t 1
21
1
1 1 1βµβµ
ν κ β βµ αβ µ�
� (( ) −( )( )
+−( )
−( )−( ) −
1
1
1
1 1
2�
�
�
ν
β ββµ
ακ µ βµµ µνν
( )−
2

342 Brookings Papers on Economic Activity, Spring 2014
As before, the debt gap d~t is described by the AR(1) process in equation 63 with autoregressive root l. The response to the shock ℘t (from equa-tion 55) is scaled by 1 - c, where c in equation 64 is a number between zero and one that indicates the extent to which monetary policy replicates full risk sharing. Inflation pt is now the ARMA(2,1) process in equation 65 with autoregressive roots µ (as before) and (satisfying 0 < < 1), and a positive moving-average root. The response of inflation to the shock ℘t is scaled by c, where a value of c of one indicates the inflation response that would replicate complete financial markets.
To understand the new aspects of the optimal monetary policy problem with elastic labor supply, note that policy can now influence three variables that have implications for the debt gap and thus the extent to which mon-etary policy supports risk sharing: inflation, the ex-ante real interest rate, and real GDP. Inflation affects the ex-post real return on nominal bonds and thus the value of existing debt, as described earlier. The ex-ante real inter-est rate affects the ongoing costs of servicing debt relative to the stream of current and future labor income (formally, the ex-ante real interest rate influences the debt gap by changing the level of the debt-to-GDP ratio con-sistent with risk sharing). Real GDP (and hence the output gap) affects the denominator of the debt-to-GDP ratio. In the solution for the debt gap d~t in equation 55, these three channels correspond to the three terms appearing after the shock ℘t.
An increase in the output gap Y~t has the effect of directly boosting real GDP growth at time t and thus reducing the debt-to-GDP ratio, but the impact on the debt gap d~t is more subtle. Since monetary policy has only a temporary influence on real GDP, extra growth now reduces overall growth in the future by exactly the same amount. Given the link between growth expectations and the debt-to-GDP ratio consistent with risk shar-ing (the natural debt-to-GDP ratio d*t in equation 54), the effect of the output gap on the debt gap actually depends on Y~t + Et[b(Y~t+1 - Y~t) + b2 (Y~t+2 - Y~t+1) + . . .], not only on Y~t. With the New Keynesian Phillips curve (equation 49), it is seen that this term is equal to (1 - b) (k/n) pt, the reciprocal of the long-run Phillips curve slope multiplied by current inflation, which explains the final term in equation 55. Since it is reason-able to assume the discount factor b is close to one, this term is negligible for all practical purposes; it is not exactly zero because future growth is discounted relative to current growth, so by bringing growth forward, there is still a small positive effect. Monetary policy therefore cannot have a sustainable impact on the burden of debt simply through its temporary effect on the level of real GDP.

Kevin D. SheeDy 343
However, it does not follow that expansionary or contractionary mon-etary policy has no effect on the debt burden beyond its implications for ex-post real returns through inflation. There remains the option of changing ex-ante real interest rates. Intuitively, expansionary monetary policy that reduces the ex-ante real interest rate is effectively a transfer from savers to borrowers, what might be labeled “financial repression,” even though the means by which monetary policy affects real interest rates is no different from the textbook New Keynesian model.
Changing ex-ante real interest rates thus provides monetary policy with an alternative to influencing the debt gap through the effect of inflation on ex-post real returns. In contrast to the latter, which is effective only while debt contracts are not refinanced, the former is effective only when refi-nancing does take place. For debt refinanced , periods after a shock at time t, the impact of monetary policy on the date-t debt burden is determined by the discounted sum of real interest gaps Et[b,+1r∼t+, + b,+2r∼t+,+1 + b,+3r∼t+,+2 + . . .] from t + , onwards, where r∼t ≡ rt - rt. Given the New Keynesian Phillips curve (equation 49) and r∼t = aEt [Y
~t+1 - Y~t] implied by the IS curve
(equation 52), these terms reduce to (ak/n)b,+1Et[pt+,+1 - pt+,]. This formula reveals that the gradient of the inflation path over time is an indicator of financial repression through ex-ante real interest rates, in contrast to the level of inflation that matters for the ex-post real return. With a (steady-state) fraction (1 - µ)µ, of debt issued prior to date t being refinanced at t + ,, the overall effect of changes in ex-ante real interest rates on the debt burden is given by the unexpected change in (ak/n)(1 - µ)b Σ∞
,=0 (bµ), Et[pt+,+1 - pt+,], which explains the penultimate term in equation 55.
This analysis shows that the more the inflation trajectory is smoothed, the smaller is the effect of monetary policy on ex-ante real interest rates, and the longer the maturity of debt, the less impact ex-ante real interest rate changes have on the debt gap. As has been seen earlier, when the maturity of debt increases, a policy of smoothing out changes in inflation is increas-ingly effective at influencing the ex-post real return on nominal debt at a low welfare cost in terms of relative price distortions (the Phillips curve in equation 49 implies that inflation smoothing also helps reduce output gap fluctuations). Significant financial repression will not be optimal with long-maturity debt, because it would require an inflation trajectory with a nonzero slope further in the future. Given the Phillips curve, the required inflation path would entail output gap fluctuations over a longer horizon, increasing the losses from following such a policy. But for short-maturity debt, where only immediate inflation surprises can affect ex-post real returns, which are much more costly than smoothed-out inflation, financial
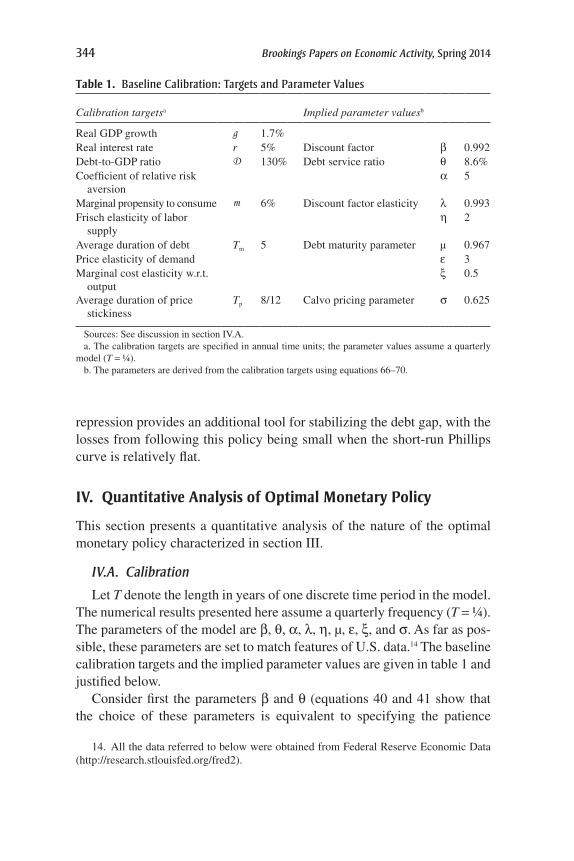
344 Brookings Papers on Economic Activity, Spring 2014
repression provides an additional tool for stabilizing the debt gap, with the losses from following this policy being small when the short-run Phillips curve is relatively flat.
IV. Quantitative Analysis of Optimal Monetary Policy
This section presents a quantitative analysis of the nature of the optimal monetary policy characterized in section III.
IV.A. Calibration
Let T denote the length in years of one discrete time period in the model. The numerical results presented here assume a quarterly frequency (T = ¼). The parameters of the model are b, q, a, l, h, µ, e, x, and s. As far as pos-sible, these parameters are set to match features of U.S. data.14 The baseline calibration targets and the implied parameter values are given in table 1 and justified below.
Consider first the parameters b and q (equations 40 and 41 show that the choice of these parameters is equivalent to specifying the patience
14. All the data referred to below were obtained from Federal Reserve Economic Data (http://research.stlouisfed.org/fred2).
Table 1. Baseline Calibration: Targets and Parameter values
Calibration targetsa Implied parameter valuesb
Real GDP growth g 1.7%Real interest rate r 5% Discount factor b 0.992Debt-to-GDP ratio D 130% Debt service ratio q 8.6%Coefficient of relative risk
aversiona 5
Marginal propensity to consume m 6% Discount factor elasticity l 0.993Frisch elasticity of labor
supplyh 2
Average duration of debt Tm 5 Debt maturity parameter µ 0.967Price elasticity of demand e 3Marginal cost elasticity w.r.t.
outputx 0.5
Average duration of price stickiness
Tp 8/12 Calvo pricing parameter s 0.625
Sources: See discussion in section IV.A.a. The calibration targets are specified in annual time units; the parameter values assume a quarterly
model (T = ¼).b. The parameters are derived from the calibration targets using equations 66–70.

Kevin D. SheeDy 345
parameters Db and Ds). These parameters are calibrated to match evidence on the average price and quantity of household debt. The “price” of debt is the average annual continuously compounded real interest rate r paid by households for loans. As seen in equation 41, the steady-state growth-adjusted real interest rate is related to b. Let g denote the average annual real growth rate of the economy. Given the length of the discrete time period in the model, 1 + r– = er T and 1 + g– = egT. Hence, using equation 41, b can be set thus:
Tβ = ( )− −r g(66) e .
From 1972 through 2011 there were average annual nominal interest rates of 8.8 percent on 30-year mortgages, 10 percent on 4-year auto loans, and 13.7 percent on 2-year personal loans, while the average annual change in the personal consumption expenditure (PCE) price index over the same period was 3.8 percent. The average credit-card interest rate between 1995 and 2011 was 14 percent. For comparison, 30-year Treasury bonds had an average yield of 7.7 percent over the periods 1977–2001 and 2006–11. The implied real interest rates are 4.2 percent on Treasury bonds, 5 percent on mortgages, 6.2 percent on auto loans, 9.9 percent on personal loans, and 12 percent on credit cards. The baseline real interest rate is set to the 5 per-cent rate on mortgages, since these constitute the bulk of household debt. The sensitivity analysis considers values of r from 4 percent up to 7 percent. Over the period 1972–2011, used to calibrate the interest rate, the average annual growth rate of real GDP per capita was 1.7 percent. Together with the baseline real interest rate of 5 percent, this implies that b ≈ 0.992 using equation 66. Since many models used for monetary policy analysis are typi-cally calibrated assuming zero real trend growth, for comparison the sensi-tivity analysis also considers values of g between 0 percent and 2 percent.
The relevant quantity variable for debt is the ratio of gross household debt to annual household income, denoted by D. This corresponds to what is defined as the loans-to-GDP ratio l
– in the model (the empirical debt
ratio being based on the amount borrowed rather than the subsequent value of loans at maturity) after adjusting for the length of one time period (T years), hence D = l
–T. Using the expression for l
– in equation 42 and
given a value of b, the equation can be solved for the implied value of the debt service ratio q:
D
T
( )θ = − ββ
(67)2 1
.
346 Brookings Papers on Economic Activity, Spring 2014
Note that in the model, all GDP is consumed, so for consistency between the data and the model’s prediction for the debt-to-GDP ratio, either the numerator of the ratio should be total gross debt (not only household debt), or the denominator should be disposable personal income or private con-sumption. Since the model is designed to represent household borrowing, and because the implications of corporate and government debt may be different, the latter approach is taken.
In the United States, as in a number of other countries, the ratio of household debt to income has grown significantly in recent decades. To focus on the implications of the levels of debt recently experienced, the model is calibrated to match average debt ratios during the five years from 2006 to 2010. The sensitivity analysis considers a wide range of possible debt ratios from 0 percent up to 200 percent. Over the period 2006–10, the average ratio of gross household debt to disposable personal income was approximately 124 percent, while the ratio of debt to private consumption was approximately 135 percent. Taking the average of these numbers, the target chosen is a model-consistent debt-to-income ratio of 130 percent, which implies (using equation 67) a debt service ratio of q ≈ 8.6 percent.
For the coefficient of relative risk aversion a, the survey evidence pre-sented by Barsky and others (1997) suggests considerable risk aversion, but most likely not in the high double-digit range for the majority of individu-als. Overall, the weight of evidence from this and other studies suggests a coefficient of relative risk aversion above one, but not significantly higher than 10. A conservative baseline value of 5 is adopted, and the sensitivity analysis considers values from zero up to 10.
One approach to calibrating the discount factor elasticity parameter l (from equation 28) is to select a value on the basis of its implications for the marginal propensity to consume from financial wealth. Let m denote the increase in per-household (annual) consumption of savers from a mar-ginal increase in their financial wealth. It can be shown that m, l, and b are related as follows:
mλ = −β
T(68)
1.
Parker (1999) presents evidence to suggest that the marginal propensity to consume from wealth lies between 4 and 5 percent (for a survey of the liter-ature on wealth and consumption, see Poterba 2000). However, it is argued by Juster and others (2006) that the marginal propensity to consume varies
Kevin D. SheeDy 347
between different forms of wealth. They find that the marginal propensity to consume is lowest for housing wealth and larger for financial wealth. Given the focus on financial wealth in this paper, the baseline calibration assumes m ≈ 6 percent, which using equation 68 implies l ≈ 0.993. The sensitivity analysis considers marginal propensities to consume from 4 to 8 percent.
The range of available evidence on the Frisch elasticity of labor supply h is discussed by Hall (2009), who concludes that a value of approxi-mately 2⁄3 is reasonable. However, both real business cycle and New Keynesian models have typically assumed Frisch elasticities significantly larger than this, often as high as 4 (see King and Rebelo 1999; Rotemberg and Woodford 1997). The baseline calibration adopted here uses a Frisch elasticity of 2, and the sensitivity analysis considers a range of values for h from completely inelastic labor supply up to 4. With the assumption (equation 43) on the differences between the Frisch elasticities of borrow-ers and savers that ensures the wealth distribution has no impact on the aggregate supply of labor, the baseline calibration amounts to setting hb ≈ 1.6 and hs ≈ 2.6.
The debt maturity parameter µ (which given µ = g/(1 + n–) stands in for the parameter g specifying the sequence of coupon payments) is set to match the average maturity of household debt contracts. In the model, the average maturity of household debt is related to the duration of the bond that is traded in incomplete financial markets. Formally, duration Tm refers to the average of the maturities (in years) of each payment made by the bond weighted by its contribution to the present value of the bond. Given the geometric sequence of nominal coupon payments parameterized by g, the bond duration (in steady state) is
� �
��
∑ ( )= γ+
=− γ
+
−
=
∞
TT
Q j
T
j1 1
1
.m
1
1
Let j denote the average annualized nominal interest rate on household debt, with 1 + j
– = ejT. In the optimal policy analysis, the steady-state rate of
inflation is zero (p– = 0), hence nominal GDP growth is n– = g–, and so µ = g/(1 + g–). It follows that g and µ can be determined by
gγ = −
µ = γ−T
TjT T(69) e 1 , and e .
m

348 Brookings Papers on Economic Activity, Spring 2014
Doepke and Schneider (2006) present evidence on the average duration of household nominal debt liabilities. Their analysis takes account of refinanc-ing and prepayment of loans. For the most recent year in their data (2004), the duration lies between 5 and 6 years, and the duration has not been less than 4 years over the entire period covered by the study (1952–2004). This suggests a baseline duration of Tm ≈ 5 years, which using equation 69 implies µ ≈ 0.967. The sensitivity analysis considers the effects of having durations as short as one quarter (one-period debt) and as long as 10 years.
There are two main strategies for calibrating the price elasticity of demand e. The direct approach draws on studies estimating consumer responses to price differences within narrow consumption categories. A price elasticity of approximately 3 is typical of estimates at the retail level (see, for example, Nevo 2001), while estimates of consumer substitution across broad con-sumption categories suggest much lower price elasticities, typically lower than one (Blundell, Pashardes, and Weber 1993). Indirect approaches esti-mate the price elasticity based on the implied markup 1/(e - 1), or as part of the estimation of a DSGE model. Rotemberg and Woodford (1997) estimate an elasticity of approximately 7.9 and point out this is consistent with mark-ups in the range of 10 to 20 percent. Since it is the price elasticity of demand that directly matters for the welfare consequences of inflation rather than its implications for markups as such, the direct approach is preferred here and the baseline value of e is set to 3. A range of values is considered in the sensitivity analysis, from the theoretical minimum elasticity of 1 up to 10.
The production function is given in equation 32. If e denotes the elas-ticity of aggregate output with respect to hours, then the elasticity x of real marginal cost with respect to output can be obtained from e using x = (1 - e)/e. A conventional value of e ≈ 2⁄3 is adopted for the baseline calibration (this would be the labor share in a model with perfect com-petition), which implies x ≈ 0.5. An important implication of x is the strength of real rigidities, which are absent in the special case of a linear production function (x = 0). The sensitivity analysis considers values of x between 0 and 1.
In the model, s is the probability of not changing price in a given time period. The probability distribution of survival times for newly set prices is (1 - s)s,, and hence the expected duration of a price spell Tp (in years) is Tp = T Σ∞
,=1 ,(1 - s)s,-1 = T/(1 - s). With data on Tp, the parameter s can be inferred from:
T
Tσ = −(70) 1 .
p

Kevin D. SheeDy 349
Following Nakamura and Steinsson (2008), the baseline duration of a price spell is taken to be 8 months (Tp ≈ 8/12), implying s ≈ 0.625. The sensitivity analysis considers average durations from 3 to 15 months.
IV.B. Results
Consider an economy hit by an unexpected permanent fall in potential output. How should monetary policy react? In the basic New Keynes-ian model with sticky prices but either complete financial markets or a representative household, the optimal monetary policy response to a total-factor-productivity shock is to keep inflation on target and allow actual output to fall in line with the loss of potential output. Using the baseline calibration from table 1 and the solution (equations 63–65) to the optimal monetary policy problem, figure 1 shows the impulse responses of the debt-to-GDP gap d~t, inflation pt, the output gap Y~t, and the bond yield jt under the optimal monetary policy and under a policy of strict inflation targeting for the 30 years following a 10 percent fall in potential output.
With strict inflation targeting, the debt-to-GDP gap rises in line with the fall in output (10 percent) because the denominator of the debt-to-GDP ratio falls while the numerator is unchanged. The effects of this shock on the wealth distribution and hence on consumption are long lasting. The serial correlation of the debt gap is equal to l ≈ 0.993, implying an average duration of approximately 36 years. Intuitively, with a marginal propen-sity to consume from financial wealth of 6 percent per year, consumption smoothing leads to persistence in the wealth distribution for far longer than typical business-cycle frequencies. Strict inflation targeting does ensure that the output gap is completely stabilized (the “divine coincidence”), and with no change in real interest rates or inflation, bond yields are completely unaffected.
The optimal monetary policy response is in complete contrast to strict inflation targeting. Optimal policy allows inflation to rise, which stabilizes nominal GDP over time in spite of the fall in real GDP. This helps to sta-bilize the debt-to-GDP ratio, moving the economy closer to the outcome with complete financial markets where borrowers would be insured against the shock and the value of debt liabilities would automatically move in line with income. The rise in the debt-to-GDP gap is very small (around 1 percent) compared to strict inflation targeting (10 percent). The rise in inflation is very persistent, lasting around two decades. The higher inflation called for is significant, but not dramatic: for the first two years, it is around 2–3 percentage points higher (at an annualized rate), for the next decade

350 Brookings Papers on Economic Activity, Spring 2014
around 1–2 percent higher, and for the decade after that, around 0–1 per-cent higher. The serial correlation of inflation is due almost entirely to the autoregressive root µ ≈ 0.967 (the other autoregressive root is ≈ 0.29, and the moving-average root is 0.41, which are much smaller and not far from canceling out as a common factor). The average duration of inflation is approximately 7 years, which is longer than typical business-cycle fre-quencies. Inflation that is spread out over time is still effective in reducing
Source: Author’s calculations.a. The shock is an unexpected permanent TFP shock that reduces the natural level of output by 10%
relative to its trend. The parameters are set in accordance with the baseline calibration from table 1.b. The debt-to-GDP gap and the output gap are reported as percentage deviations.c. Inflation and bond yields are reported as annualized percentage rates.
Percent
0
1
2
3
Percent
0
2
4
6
8
10
0
0.05
0.10
0.15
0.20
Percent
0
0.50
1.00
Percent
0.75
1.25
0.25
Inflation target
Optimal policy
5 10 15 20 25
Years
5 10 15 20 25
Years
5 10 15 20 25
Years
5 10 15 20 25
Years
Output gapb Bond yieldc
Debt-to-GDP gapb Inflationc
Figure 1. Responses to a TFP Shock, Optimal Monetary Policy vs. Strict inflation Targetinga

Kevin D. SheeDy 351
the debt-to-GDP ratio because debt liabilities have a long average maturity. It is also significantly less costly in terms of relative-price distortions to have inflation spread out over a longer time than the typical durations of stickiness of individual prices: this is the inflation-smoothing argument that drives the optimality of the autoregressive root µ.
The rise in inflation does affect the output gap for the first one or two years, but this is short-lived because the duration of the real effects of mon-etary policy through the traditional price-stickiness channel is brief com-pared to the relevant time scale of decades for the other variables. The effect is also quantitatively small because inflation is highly persistent, the rise in expected inflation closely following the rise in actual inflation, so the Phillips curve implies little impact on the output gap. Finally, nomi-nal bond yields show a persistent increase. It might seem surprising that yields do not fall as monetary policy is loosened, but the bonds in question are long-term bonds, and the effect on inflation expectations is dominant (there is a small fall in real interest rates because the rise in bond yields is less than what is implied by the higher expected inflation, but there is no significant “financial repression” effect).
The term c from equation 64 provides a precise measure of the relative importance of risk sharing versus inflation stabilization under the optimal monetary policy (the response of the debt gap is a multiple 1 - c of what it would be under strict inflation targeting, while the response of inflation is a multiple c of what it would need to be to support full risk sharing). The baseline calibration leads to a policy weight c on debt gap stabiliza-tion of approximately 89 percent and a policy weight 1 - c on inflation stabilization of 11 percent.
The baseline calibration thus implies that addressing the problem of incomplete financial markets is quantitatively the main focus of optimal monetary policy rather than other objectives such as inflation stabilization. What explains this, and how sensitive is this conclusion to the particular calibration targets? Consider the exercise of varying each calibration target individually over the ranges discussed in section IV.A, holding all other tar-gets constant. For each new target, the implied parameters are recalculated and the new policy weight c is obtained. Figure 2 plots the values of c (the optimal policy weight on risk sharing) obtained for each target.
As can be seen in figure 2, over the range of reasonable average real GDP growth rates and real interest rates there is almost no effect on the opti-mal policy weight. The results are most sensitive to the calibration targets for the average debt-to-GDP ratio and the coefficient of relative risk aver-sion. The average debt-to-GDP ratio proxies for the parameter q, which is

352 Brookings Papers on Economic Activity, Spring 2014
Source: Author’s calculations.a. The response of the debt gap under the optimal policy is 1 – χ multiplied by its response under strict
inflation targeting. Each of the calibration targets in table 1 is varied individually, holding all others at their baseline values. The baseline value of χ is 0.89.
0.5 1 1.5
0.250.5
0.75
5 6
0.250.5
0.75
0.250.5
0.75
0.250.5
0.75
0.250.5
0.75
0.250.5
0.75
0.250.5
0.75
0.250.5
0.75
0.250.5
0.75
0.250.5
0.75
50 100 150 2 4 6 8
5 6 7 1 2 3
2 4 6 8 2 4 6 8
0.2 0.4 0.6 0.8 0.4 0.6 0.8 1.0
Real GDP growth rate (g, annual percent) Real interest rate (r , annual percent)
Debt-to-GDP ratio (D, percent of annual GDP) Coefficient of relative risk aversion (α)
Marginal propensity to consume(m , annual percent) Frisch elasticity of labor supply (η)
Duration of debt (Tm, years) Price elasticity of demand (ε)
Marginal cost elasticity w.r.t. output (ξ) Duration of price stickiness (Tp, years)
Figure 2. Sensitivity Analysis for Optimal Policy Weight c on incomplete Financial Marketsa

Kevin D. SheeDy 353
related to the difference in patience between borrowers and savers. It is not surprising that an economy with less debt in relation to income has less of a concern with the incompleteness of financial markets, because in such a case the impact of shocks is felt more evenly by borrowers and savers. In the limiting case of a representative-household economy, the average debt-to-GDP ratio tends to zero, and the degree of completeness of finan-cial markets becomes irrelevant. Risk sharing receives more than half the weight in the optimal policy as long as the calibration target for the average debt-to-GDP ratio is not below 50 percent.
It is also not surprising that the results are sensitive to the coefficient of relative risk aversion. Since the only use for complete financial markets in the model is risk sharing, if households were risk-neutral then there would be no loss from these markets being absent, as long as saving and bor-rowing remained possible in incomplete financial markets. The baseline coefficient of relative risk aversion is higher than the typical value of 2 found in many macroeconomic models (although that number is usually relevant for intertemporal substitution in those models, not for attitudes to risk), but it is low compared to the values often assumed in finance models that seek to match risk premia. The optimal policy weight on risk sharing exceeds 0.5 if the coefficient of relative risk aversion exceeds 1.3, so lower degrees of risk aversion do not necessarily overturn the conclu-sions of this paper.
The next most important calibration target is the price elasticity of demand. A higher price elasticity increases the welfare costs of inflation. Welfare ultimately depends on quantities, not prices, but the price elastic-ity determines how much quantities are distorted by dispersion of relative prices. To reduce the optimal policy weight on the debt gap below one-half it is necessary to assume price elasticities in excess of 10. Such values would be outside the range typical in IO and microeconomic studies of demand, with 10 itself being at the high end of the range of values used in most macroeconomic models. The typical value of 6 often found in New Keynesian models only reduces c to approximately 71 percent.
The results are largely insensitive to the marginal propensity to consume from financial wealth, which is used to determine the parameter l in the specification of the endogenous discount factors. The Frisch elasticity of labor supply has a fairly small but not insignificant effect on the results, with the optimal policy weight on risk sharing increasing with the Frisch elasticity. A higher elasticity increases the welfare costs of shocks to wealth distribution by distorting the labor supply decisions of different households, as well as making it easier for monetary policy to influence the real value

354 Brookings Papers on Economic Activity, Spring 2014
of debt by changing the ex-ante real interest rate in addition to inflation. An elastic labor supply does mean that inflation fluctuations lead to output gap fluctuations, which increases the importance of targeting inflation, but the first two effects turn out to be more important quantitatively.
The results are somewhat more sensitive to the average duration of a price spell and the elasticity of real marginal cost with respect to output. The first of these determines the importance of nominal price rigidities. Greater nominal rigidity leads to more dispersion of relative prices from a given amount of inflation, and thus reduces the optimal policy weight on the debt gap. A higher output elasticity of marginal cost implies that the production function has greater curvature, so a given dispersion of output levels across otherwise identical firms represents a more inefficient allo-cation of resources. However, considering the range of reasonable values for the duration of price stickiness does not reduce c below 65 percent, and the range of marginal cost elasticities does not lead to any c value below 80 percent.
The effects of the calibration target for the average duration of house-hold debt are more subtle. It might be expected that the longer the maturity of household debt, the higher the optimal policy weight on risk sharing. This is because longer-term debt allows inflation to be spread out further over time, reducing the welfare costs of the inflation, yet still having an effect on the real value of debt. However, the sensitivity analysis shows that the optimal policy weight is a non-monotonic function of debt matu-rity: either very short-term or long-term debt maturities lead to high values of c, while debt of around 1.5 years maturity has the lowest value of c (approximately 75 percent).
This apparent puzzle is resolved by recalling that there are two ways monetary policy can affect risk sharing: inflation to change the ex-post real return on nominal debt, and changes in the ex-ante real interest rate (“financial repression”). As has been discussed, the first method is effective at a lower cost for long debt maturities. When labor supply is inelastic, the second method is not available, and the value of c is then indeed a strictly increasing function of debt maturity (with the value of c falling to 15 percent for the shortest-maturity debt). When the ex-ante real interest rate method is available, it is most effective compared to the first method (taking account of the costs in terms of inflation and output gap fluctua-tions) when debt maturities are short.
Finally, it is possible to calculate the magnitude of the losses from fol-lowing a policy of strict inflation targeting rather than the optimal policy described above. With strict inflation targeting, equation 55 shows that the

Kevin D. SheeDy 355
innovation to the debt gap is given by the negative of the shock ℘t, with the effect on the debt gap in subsequent periods being -l℘t, -l2℘t, and so on. The welfare loss (as an equivalent percentage of GDP) from strict inflation targeting according to the loss function (equation 56) is therefore equal to ℘2
t multiplied by the coefficient of d~2t in equation 56
divided by (1 - bl2).Using the baseline calibration, a 1-percent shock to the debt gap results
in a total loss equivalent to 0.023 percent of one year’s GDP, a 5-percent shock results in a 0.58-percent GDP loss, and a 10-percent shock results in a 2.3-percent loss. These losses are not inconsiderable for large shocks, but are negligible for small shocks. With a higher relative risk aversion of 10, the losses from the 1-percent, 5-percent, and 10-percent shocks would be 0.078 percent, 2.0 percent, and 7.8 percent of GDP, respectively. The expected loss per year is obtained by averaging these over the probability distribution of ℘t shocks occurring during a year, which can be derived from the stochastic process for real GDP using equation 55. Even though losses from large shocks are significant, fortunately the U.S. economy only rarely experiences shocks of the order of magnitude seen during the financial crisis. Using the 2.1-percent standard deviation of annual real GDP growth over the period 1972–2011 suggests that the average annual loss from strict inflation targeting would lie in the range 0.1-0.3 percent of GDP.
If the average welfare loss from the lack of risk sharing under strict inflation targeting is so small, how is it possible that concerns over risk sharing receive such a high weight relative to inflation stabilization in the optimal monetary policy? The small expected loss might suggest that there should be little willingness to pay to obtain insurance. However, note that the optimal policy only deviates significantly from inflation targeting when large shocks occur (figure 1 is drawn for a 10-percent shock to poten-tial output). The inflation fluctuations called for in a typical year are around five times smaller than those shown in figure 1 and would likely involve (annualized) inflation being not much more than 0.4 percent from its aver-age, for which the welfare losses are vanishingly small.
This means it is possible to put a high weight on replicating complete financial markets even when the expected gains from risk sharing are small because, unlike an insurance premium, a non-negligible cost of inflation fluctuations is incurred only when large shocks occur, which is also when the gains from risk sharing are large. Combined with inflation smoothing to keep down the welfare losses from relative-price distortions when nominal debt has a long average maturity, this means the benefits of greater risk

356 Brookings Papers on Economic Activity, Spring 2014
sharing from a long-term nominal GDP target can outweigh the costs even without assuming double-digit coefficients of relative risk aversion.
V. Conclusion
This paper has shown how a monetary policy of nominal GDP targeting facilitates efficient risk sharing in incomplete financial markets where con-tracts are denominated in terms of money. In an environment where risk derives from uncertainty about future real GDP, strict inflation targeting would lead to a very uneven distribution of risk, with leveraged borrowers’ consumption highly exposed to any unexpected change in their incomes when monetary policy prevented any adjustment of the real value of their liabilities. Strict inflation targeting does provide savers with a risk-free real return, but fundamentally, the economy lacks any technology that delivers risk-free real returns, so the safety of savers’ portfolios is simply the flip side of borrowers’ leverage and high levels of risk. Absent any changes in the physical investment technology available to the economy, aggregate risk cannot be annihilated, only redistributed.
That leaves the question of whether the distribution of risk is efficient. The combination of incomplete markets and strict inflation targeting implies a particularly inefficient distribution of risk when households are risk averse. If complete financial markets were available, borrowers would issue state-contingent debt where the contractual repayment was lower in a recession and higher in a boom. These securities would resemble equity shares in GDP, and they would have the effect of reducing the leverage of borrowers and hence distributing risk more evenly. In the absence of such financial markets, in particular because of the inability of households to sell such securities, a monetary policy of nominal GDP targeting could effec-tively replicate complete financial markets even when only noncontingent nominal debt was available. Nominal GDP targeting operates by stabiliz-ing the debt-to-GDP ratio. With financial contracts specifying liabilities fixed in terms of money, a policy that stabilizes the monetary value of real incomes ensures that borrowers are not forced to bear too much aggregate risk, converting nominal debt into real equity.
While the model is far too simple to apply to the recent financial crises and deep recessions experienced by a number of economies, one policy implication does resonate with the predicament of several economies faced with high levels of debt combined with stagnant or falling GDPs. Nom-inal GDP targeting is equivalent to a countercyclical price level, so the model suggests that higher inflation can be optimal in recessions. In other
Kevin D. SheeDy 357
words, while each component of the word “stagflation”—“stagnation” and “inflation”—is bad in itself, if stagnation cannot immediately be remedied, some inflation might be a good idea to compensate for the inefficiency of incomplete financial markets. And even if policymakers were reluctant to abandon inflation targeting, the model does suggest that they would have the strongest incentives to avoid deflation during recessions (a procyclical price level). Deflation would raise the real value of debt, which combined with falling real incomes would be the very opposite of the risk sharing stressed in this paper, and even worse than an unchanging inflation rate.
It is important to stress that the policy implications of the model in reces-sions are matched by equal and opposite prescriptions during an expansion. Thus, it is not just that optimal monetary policy tolerates higher inflation in a recession—it also requires lower inflation or even deflation during a period of high growth. Pursuing higher inflation in recessions without fol-lowing a symmetrical policy during an expansion is both inefficient and jeopardizes an environment of low inflation on average. Therefore, the model also argues that more should be done by central banks to “take away the punch bowl” during a boom, even were inflation to be stable.
ACKNOWLEDGMENTS I am grateful to Carlos Carvalho, Wouter den Haan, Monique Ebell, Cosmin Ilut, John Knowles, Greg Mankiw, Albert Marcet, Matthias Paustian, George Selgin, the editors, and my discussants for helpful suggestions and comments. The paper has also benefited from the comments of Brookings Panel participants and seminar participants at Banque de France, University of Cambridge, CERGE-EI, Ecole Polytech-nique, University of Lausanne, University of Maryland, National Bank of Serbia, National University of Singapore, Federal Reserve Bank of New York, University of Oxford, PUC–Rio, São Paulo School of Economics, University of Southampton, University of St. Andrews, University of Warwick, the Anglo-French-Italian Macroeconomics Workshop, Birmingham Econometrics and Macroeconomics Conference, Centre for Economic Performance Annual Con-ference, Econometric Society North American Summer Meeting, EEA Annual Congress, ESSET, ESSIM, Joint French Macro workshop, LACEA, LBS-CEPR conference “Developments in Macroeconomics and Finance,” London Macro-economics Workshop, Midwest Macro Meeting, and NBER Summer Institute in Monetary Economics. I have no relevant material or financial interests to declare regarding the content of this paper.
358 Brookings Papers on Economic Activity, Spring 2014
References
Abel, Andrew B. 1990. “Asset Prices under Habit Formation and Catching Up with the Joneses.” American Economic Review 80, no. 2: 38–42 (May).
Allen, Franklin, Elena Carletti, and Douglas Gale. 2011. “Money, Financial Stabil-ity and Efficiency.” Working Paper. New York University.
Andrés, Javier, Óscar Arce, and Carlos Thomas. 2010. “Banking Competition, Col-lateral Constraints and Optimal Monetary Policy.” Working Paper no. 1001, Bank of Spain.
Attanasio, Orazio, and Steven J. Davis. 1996. “Relative Wage Movements and the Distribution of Consumption.” Journal of Political Economy 104, no. 6: 1227–62 (December).
Bach, G. L., and James B. Stephenson. 1974. “Inflation and the Redistribution of Wealth.” Review of Economics and Statistics 56, no. 1: 1–13 (February).
Bailey, Samuel. 1837. Money and Its Vicissitudes in Value. London: Effingham Wilson.
Barro, Robert J. 1979. “On the Determination of the Public Debt.” Journal of Political Economy 87, no. 5: 940–971 (October).
Barsky, Robert B., F. Thomas Juster, Miles S. Kimball, and Matthew D. Shapiro. 1997. “Preference Parameters and Behavioral Heterogeneity: An Experimental Approach in the Health and Retirement Study.” Quarterly Journal of Economics 112, no. 2: 537–79 (May).
Bean, Charles R. 1983. “Targeting Nominal Income: An Appraisal.” Economic Journal 93: 806–19 (December).
Bernanke, Ben S., Thomas Laubach, Frederic S. Mishkin, and Adam S. Posen. 1999. Inflation Targeting: Lessons from the International Experience. Princeton University Press.
Blundell, Richard, Panos Pashardes, and Guglielmo Weber. 1993. “What Do We Learn about Consumer Demand Patterns from Micro Data?” American Economic Review 83, no. 3: 570–97 (June).
Bohn, Henning. 1988. “Why Do We Have Nominal Government Debt?” Journal of Monetary Economics 21, no. 1: 127–40 (January).
Calvo, Guillermo A. 1983. “Staggered Prices in a Utility-Maximizing Framework.” Journal of Monetary Economics 12, no. 3: 383–98 (September).
Chari, V. V., Lawrence J. Christiano, and Patick J. Kehoe. 1991. “Optimal Fiscal and Monetary Policy: Some Recent Results.” Journal of Money, Credit and Banking 23, no. 3(2): 519–39 (August).
Chari, V. V., and Patick J. Kehoe. 1999. “Optimal Fiscal and Monetary Policy.” In Handbook of Monetary Economics, vol. 1C, edited by J. B. Taylor and M. Woodford. Elsevier.
Clarida, Richard, Jordi Galí, and Mark Gertler. 1999. “The Science of Monetary Policy: A New Keynesian Perspective.” Journal of Economic Literature 37, no. 4: 1661–1707 (December).
Cochrane, John H. 1991. “A Simple Test of Consumption Insurance.” Journal of Political Economy 99, no. 5: 957–76 (October).

Kevin D. SheeDy 359
Cohen, Alma, and Liran Einav. 2007. “Estimating Risk Preferences from Deduct-ible Choice.” American Economic Review 97, no. 3: 745–88 (June).
Cooley, Thomas F., and Lee E. Ohanian. 1991. “The Cyclical Behavior of Prices.” Journal of Monetary Economics 28, no. 1: 25–60 (August).
Cukierman, Alex, Ken Lennan, and F. Papadia. 1985. “Inflation-Induced Redis-tributions via Monetary Assets in Five European Countries: 1974–1982.” In Economic Policy and National Accounting in Inflationary Conditions, edited by J. Mortensen (Volume 2 of Studies in Banking and Finance). Amsterdam: North-Holland.
Cúrdia, Vasco, and Michael Woodford. 2009. “Credit Frictions and Optimal Mon-etary Policy.” Working Paper. Columbia University.
De Fiore, Fiorella, Pedro Teles, and Oreste Tristani. 2011. “Monetary Policy and the Financing of Firms.” American Economic Journal: Macroeconomics 3, no. 4: 112–42 (October).
Doepke, Matthias, and Martin Schneider. 2006. “Inflation and the Redistribu-tion of Nominal Wealth.” Journal of Political Economy 114, no. 6: 1069–97 (December).
Eggertsson, Gauti B., and Paul Krugman. 2012. “Debt, Deleveraging, and the Liquidity Trap: A Fisher-Minsky-Koo Approach.” Quarterly Journal of Economics 127, no. 3: 1469–1513.
Garriga, Carlos, Finn E. Kydland, and Roman Sustek. 2013. “Mortgages and Monetary Policy.” Discussion paper 2013-6. London: Centre for Macro economics.
Ghent, Andra C. 2011. “Securitization and Mortgage Renegotiation: Evidence from the Great Depression.” Review of Financial Studies 24, no. 6: 1814–47.
Guerrieri, Veronica, and Guido Lorenzoni. 2011. “Credit Crises, Precautionary Saving, and the Liquidity Trap.” Working Paper no. 17583. Cambridge, Mass.: National Bureau of Economic Research.
Hall, Robert E. 2009. “Reconciling Cyclical Movements in the Marginal Value of Time and the Marginal Product of Labor.” Journal of Political Economy 117, no. 2: 281–323 (April).
Hall, Robert E., and N. Gregory Mankiw. 1994. “Nominal Income Targeting.” In Monetary Policy, edited by N. G. Mankiw. University of Chicago Press.
Hayashi, Fumio, Joseph Altonji, and Laurence Kotlikoff. 1996. “Risk-Sharing between and within Families.” Econometrica 64, no. 2: 261–94 (March).
Iacoviello, Matteo. 2005. “House Prices, Borrowing Constraints, and Monetary Policy in the Business Cycle.” American Economic Review 95, no. 3: 739–64 (June).
Juster, F. Thomas, Joseph P. Lupton, James P. Smith, and Frank Stafford. (2006), “The Decline in Household Saving and the Wealth Effect.” Review of Economics and Statistics 88, no. 1: 20–27 (February).
King, Robert G., and Sergio T. Rebelo. 1999. “Resuscitating Real Business Cycles.” In Handbook of Macroeconomics, vol. 1B, edited by J. B. Taylor and M. Woodford. Elsevier.
360 Brookings Papers on Economic Activity, Spring 2014
Koenig, Evan F. 2013. “Like a Good Neighbor: Monetary Policy, Financial Stabil-ity, and the Distribution of Risk.” International Journal of Central Banking 9, no. 2: 57–82 (June).
Lee, Jae Won. 2010. “Monetary Policy with Heterogeneous Households and Imper-fect Risk-Sharing.” Working Paper. New Brunswick, N.J.: Rutgers University.
Lustig, Hanno, Christopher Sleet, and Sevin Yeltekin. 2008. “Fiscal Hedging with Nominal Assets.” Journal of Monetary Economics 55, no. 4: 710–27 (May).
Meade, James E. 1978. “The Meaning of ‘Internal Balance.’” Economic Journal 88: 423–35 (September).
Nakamura, Emi, and Jón Steinsson. 2008. “Five Facts about Prices: A Reevaluation of Menu Cost Models.” Quarterly Journal of Economics 123, no. 4: 1415–64 (November).
Nelson, Julie A. 1994. “On Testing for Full Insurance Using Consumer Expendi-ture Survey Data.” Journal of Political Economy 102, no. 2: 384–94 (April).
Nevo, Aviv. 2001. “Measuring Market Power in the Ready-to-Eat Cereal Industry.” Econometrica 69, no. 2: 307–42 (March).
Parker, Jonathan A. 1999. “Spendthrift in America? On Two Decades of Decline in the U.S. Saving Rate.” NBER Macroeconomics Annual 14: 317–70.
Persson, Torsten, and Lars E. O. Svensson. 1989. “Exchange Rate Variability and Asset Trade.” Journal of Monetary Economics 23, no. 3: 485–509 (May).
Pescatori, Andrea. 2007. “Incomplete Markets and Households’ Exposure to Inter-est Rate and Inflation Risk: Implications for the Monetary Policy Maker.” Working Paper 07-09, Federal Reserve Bank of Cleveland.
Piskorski, Tomasz, Amit Seru, and Vikrant Vig. 2010. “Securitization and Dis-tressed Loan Renegotiation: Evidence from the Subprime Mortgage Crisis.” Journal of Financial Economics 97, no. 3: 369–97 (September).
Poterba, James M. 2000. “Stock Market Wealth and Consumption.” Journal of Economic Perspectives 14, no. 2: 99–118 (Spring).
Rotemberg, Julio J., and Michael Woodford. 1997. “An Optimization-Based Econometric Framework for the Evaluation of Monetary Policy.” NBER Macroeconomics Annual 12: 297–346.
Schmitt-Grohé, Stephanie, and Martín Uribe. 2004. “Optimal Fiscal and Monetary Policy under Sticky Prices.” Journal of Economic Theory 114, no. 2: 198–230 (February).
Selgin, George. 1995. “The “Productivity Norm” versus Zero Inflation in the His-tory of Economic Thought.” History of Political Economy 27, no. 4: 705–35 (Winter).
———. 1997. “Less than Zero: The Case for a Falling Price Level in a Growing Economy.” Hobart Paper no. 132, Institute of Economic Affairs.
Sheedy, Kevin. 2014. “Debt and Incomplete Financial Markets: A Case for Nomi-nal GDP Targeting.” CEPR Discussion Paper no. DP9843 (available at SSRN: http://ssrn.com/abstract=2444864).
Shiller, Robert J. 1993. “Macro Markets: Creating Institutions for Managing Soci-ety’s Largest Economic Risks.” Oxford University Press.
Kevin D. SheeDy 361
———. 1997. “Public Resistance to Indexation: A Puzzle.” Brookings Papers on Economic Activity, no. 1: 159–228.
Siu, Henry E. 2004. “Optimal Fiscal and Monetary Policy with Sticky Prices.” Journal of Monetary Economics 51, no. 3: 575–607 (April).
Sumner, Scott. 2012. “The Case for Nominal GDP Targeting.” Working Paper. Fairfax, Va.: Mercatus Center, George Mason University.
Uzawa, Hitofumi. 1968. “Time Preference, the Consumption Function, and Opti-mum Asset Holdings.” In Value, Capital and Growth: Papers in Honor of Sir John Hicks, edited by J. N. Wolfe. Chicago: Aldine.
Vlieghe, Gertjan W. 2010. “Imperfect Credit Markets: Implications for Monetary Policy.” Working Paper no. 385, Bank of England.
White, Michelle J. 2009. “Bankruptcy: Past Puzzles, Recent Reforms, and the Mortgage Crisis.” American Law and Economics Review 11, no. 1: 1–23.
Woodford, Michael. 2001. “Fiscal Requirements for Price Stability.” Journal of Money, Credit and Banking 33, no. 3: 669–728 (August).
———. 2003. Interest and Prices: Foundations of a Theory of Monetary Policy. Princeton University Press.
362
1. Any views expressed are my own and do not necessarily reflect the views of others on the Federal Open Market Committee. I appreciate the valuable comments I have received on these remarks from the editors.
Comments and Discussion
Comment ByJAmeS BULLARD1 Modern rationales for monetary stabilization policy rely mainly on the sticky price friction. Sticky prices are thought to prevent the market solution from being fully optimal and therefore suggest a role for monetary policy intervention. Generally speaking, leading renditions of this idea lead to the monetary policy advice that prices should be stabilized along a price level path. In this fascinating paper, Kevin Sheedy studies an alternative rationale for monetary stabilization policy. In the alternative, the friction is nonstate contingent nominal contracting (NSCNC), and it is this defect of credit markets that keeps the market solution from being fully optimal. The monetary policy advice associated with this rationale is somewhat different from that associated with sticky prices. Rather than keeping prices stable along a price level path, the advice calls for deliberate movements in the price level in order to offset shocks to the growth rate of national income—countercyclical price level movements.
Sheedy has laid out considerable intuition for the alternative rationale. I would go so far as to say that he has set the standard for future analyses in this area. The paper includes valuable commentary on an extensive related literature, and it includes a calibrated model with both sticky price and NSCNC frictions included. In the calibrated case, the more important of the two frictions is associated with nonstate contingent nominal contracting.
Is it surprising that the NSCNC friction can be more important from a policymaking perspective than the sticky price friction? Perhaps not. According to Atif Mian and Amir Sufi (2011), the ratio of household debt

Comments and DisCussion 363
to GDP in the United States was about 1.15 before debt rose in the 2000s, when it ballooned to 1.65 or more. In today’s dollars, the latter ratio would mean about $19.5 to $28 trillion in debt, comprising mostly mortgage debt. Improper functioning in these markets might be quite costly for the econ-omy, so it is certainly plausible that the nonstate contingent nominal con-tracting friction could be quite important.
My discussion is organized around three questions. First, given that some may view the model here as somewhat special, would these results hold in a model with many more heterogeneous participants interacting in a large private credit market? Based on a general equilibrium life cycle model with many period lives, the tentative answer seems to be yes, so that Sheedy’s results may have more general applicability than it might first appear. The second question is: What are some of the key issues on which future research in this area may wish to focus? And finally, what does this paper have to say in framing the ongoing global monetary policy debate on the wisdom of nominal GDP targeting?
is the moDel speCial? The Sheedy model has two types of households: relatively patient and relatively impatient. Since there are just two types of agents interacting in a credit market, there is only one set of marginal conditions that requires “repair.” The policymaker has just one tool, the price level, which in certain circumstances neatly fixes the marginal con-ditions. A natural question is whether these results would carry over to a more realistic environment with more heterogeneity in the private credit market. My tentative answer is that the results do carry over to a some-what different class of models with a greater degree of heterogeneity, and therefore that the Sheedy results have greater applicability than may be initially apparent.
One way to investigate this is to consider a stripped-down, endowment general equilibrium life-cycle economy.2 In order to stress that business cycle questions can be addressed with such a model, I will use a “quar-terly” specification, with households living 241 periods. One interpretation would be that households enter economic life around age 20, die around age 80, and are most productive in the middle period, around age 50.3 To
2. See Sheedy (2013) for a three-period overlapping-generations version of this paper.3. I have in mind a model with a long list of simplifying assumptions: identical within-
cohort agents, no population growth; inelastic labor supply; time-separable log preferences; no discounting; no capital; no default; flexible prices; no borrowing constraints; and no gov-ernment other than the central bank.
364 Brookings Papers on Economic Activity, spring 2014
this standard framework we can add the key assumption made by Sheedy, namely that loans are dispersed and repaid in the unit of account—that is, in nominal terms—and are not contingent on income realizations. This is the NSCNC friction. Agents in the economy I am describing are endowed with an identical productivity profile over their lifetime. This productivity profile begins at zero, rises to a peak at the middle period of life, and then declines to zero, exhibiting perfect symmetry. Agents can sell the produc-tivity units they have in the labor market at a competitive wage.
Such a model, which is very standard in textbooks, produces very uneven income over the life cycle. People near the beginning or end of the life cycle earn little or no labor income, while those in the middle of life earn a lot. If the productivity profile were exactly triangular, then 50 percent of the households would earn 75 percent of the income. All of these cohorts will wish to use the credit market to smooth consumption relative to income.
A second key assumption in the Sheedy paper is that there is an aggre-gate shock, and that this shock is the only source of uncertainty.4 Let us think of this as a Markov process for the aggregate gross rate of real wage growth, which can take on values of high, medium, or low with equal prob-ability and where the medium value is the average of the three possibili-ties. Real national income is then the real wage multiplied by the sum of the productivity endowments. Therefore, the growth rate of real wages is also the growth rate of real output. The policymaker completely controls the price level, which is just a unit of account in this model.5 An important within-period timing protocol is embedded: (i) nature chooses the growth rate, (ii) the policymaker chooses a price level, and (iii) households make decisions to consume and save. This timing protocol is what allows the policymaker to potentially offset incoming shocks.
The model I have described is simple, but it is interesting in light of what Sheedy teaches us about the effects of the NSCNC friction. The ver-sion I have described has 241 households, all credit market users, each with a different level of asset holding depending on their position in the life cycle. To calculate the full stochastic equilibrium, one has to keep track of the distribution of asset holdings over time, a fact that has made models in this class less intensively studied than their representative agent cousins. Yet Sheedy’s key insights apply to this model as well, even though there
4. In models like the one I am describing, it is also popular to include idiosyncratic uncertainty, but that is not necessary for the argument presented in the Sheedy paper.
5. For a two-period example along this line, see Koenig (2013).

Comments and DisCussion 365
are now many more agents and the policymaker still only has one tool, the price level.
Consider a nonstochastic balanced-growth path of the model I have described, in which the economy simply grows at the average rate forever. Assume also that the policymaker “gets out of the way” and simply sets the price level to unity every period. On this balanced growth path, consump-tion is exactly equalized across the cohorts living at a point in time. The real interest rate is exactly equal to the real output growth rate.6 The private credit market completely solves the point-in-time income inequality prob-lem. Sheedy provides some excellent intuition for results like this, which fuel the findings later: The exact consumption equality across cohorts liv-ing at a given date means all households have an “equity share” in the economy. That is, despite their very uneven incomes at a point in time, they all consume an equal fraction of national income available at that date. Equity share contracts are known to be optimal when preferences are homothetic, as they are in the economy I have described. In the stochastic case, the main idea is to replicate this equity share outcome.
CounterCyCliCal priCe-level movements. In the stochastic case, the NSCNC friction means that markets are incomplete. Households are not allowed to contract based on actual realized returns. There is no default or renegotiation—loans must be repaid. However, because of the tim-ing protocol, the policymaker can potentially provide state-contingent movements in the price level after observing the shock each period, and therefore restore the complete credit markets outcome.
The nature of this policy involves countercyclical price-level move-ments. A period associated with a high real growth shock is also a period with a lower-than-normal price level, and conversely, low growth is associ-ated with a higher-than-normal price level. This policy restores complete markets because, in the economy I have described, each cohort living at date t would consume the same amount, and this amount would be higher or lower according to whether the growth rate was particularly high or low at that date. In this sense, Sheedy’s results may have important applications in a wide class of life-cycle economies, probably the most important class of heterogeneous agent economies in macroeconomics.
The countercyclical price-level policy seems very different from one focused on not allowing the price level to deviate far from a price-level path. We might think of the price-level targeting policy here as maintaining
6. This is due to the symmetric endowment pattern combined with other simplifying assumptions.
366 Brookings Papers on Economic Activity, spring 2014
P (t) equal to unity at all times.7 As Sheedy stresses in the paper, such a policy would be inappropriate given the NSCNC friction.
DireCtions for future researCh. The Sheedy model has little to say about average inflation rates. This is important, since nominal GDP target-ing is sometimes casually discussed in a way that suggests a rationalization for higher average inflation. The Sheedy model calls for higher-than-average inflation at certain points in time, notably in bad times, but also calls for lower-than-average inflation in good times, leaving the average rate of inflation unchanged in the long run.
It is sometimes asserted in discussions of nominal GDP targeting that one can simply target nominal GDP and not worry about the decomposi-tion between real output and the price level. I do not see much support for this view in the logic behind the Sheedy analysis.8 The typical statement might be that the policymaker could target a nominal GDP aggregate gross growth rate, perhaps without knowing the exact value of the average real growth rate of the economy. This indeed succeeds in obtaining the counter-cyclical price-level movements necessary under the NSCNC friction to complete the credit market. But it does not succeed in maintaining the aver-age rate of inflation at a desirable level for the economy. In particular, such an approach would suggest that the balanced growth path with a gross real growth rate of 1.02 and a gross inflation rate of 1.02 was equally as desir-able as the balanced growth path with 1.00 and 1.04, respectively. Yet this would only be true if there were no welfare costs of inflation in the model.
The literature on the welfare cost of inflation is well established and argues for lower average inflation as opposed to higher values, all else equal. The Sheedy model does not provide any reason to choose the higher average inflation value. It only provides a reason to generate higher-than-average inflation in response to certain shocks and lower-than-average inflation in response to other shocks. I conclude from this that proper implementation of the Sheedy nominal GDP targeting strategy would require knowledge of the average real growth rate for the economy. One would have to know when real growth was “below normal” or “above nor-mal” in order to know when to generate the required price-level move-ment to maintain complete credit markets. If the policymaker did not know the average growth rate of the economy and targeted only a nominal GDP growth rate, the policymaker could end up with an average inflation rate
7. Assuming a net inflation target of zero.8. The total real output in the economy at a date t would be the real wage multiplied by
the sum of endowments, and the latter would cancel in this expression.
Comments and DisCussion 367
considerably different from the desired level. This could undo all the good done by the complete credit markets policy.
I think further research on the trade-off between the benefits of targeting a pure nominal quantity and the costs of inadvertently generating higher-than-desirable inflation could be a fruitful area of future research. I cau-tion potential researchers, however: The literature on the welfare costs of inflation tends to find that the welfare losses from higher average inflation are much larger than the welfare gains reported in Sheedy’s paper from improved monetary stabilization policy.
Many have argued that the NSCNC friction is not as compelling as it may first appear. This is because we do observe default in actual econo-mies, and because of this there is a certain state-contingency in actual con-tracting that is assumed away in models like Sheedy’s. Research along the lines of Sheedy’s that could make better contact with the issue of default could provide helpful insight. More subtly, the mere threat of default can radically shape equilibrium outcomes, even in models where no default occurs in equilibrium. For an example of how endogenous debt constraints change one’s view of potential equilibria in a life cycle setting like the one described above, see Costas Azariadis and Luisa Lambertini (2003). More research in this area would be desirable as well, especially if it could shed more and sharper light on the likely importance or unimportance of what seems to be non-state-contingent contracting in actual economies.
Finally, Sheedy’s model has no money demand, treating the role of money only as a unit of account. What Sheedy is advocating is a policy that focuses on completing the credit market and ignores households that are holding money balances as a large fraction of their wealth. The people who are in this latter situation may be hurt economically by a monetary policy sharply focused on credit markets. In the United States, some estimates suggest 10 to 15 percent of the population is unbanked, and another 10 to 15 percent may be nearly unbanked. These households tend to be poor and to use cash intensively, and they may be shut out of credit markets. Research on models that include this group may provide a better balance in assessing the best role for monetary policy.
This paper has considerable potential to sharpen the ongoing debate on nominal GDP targeting, an idea that has not often had an explicit modern macroeconomic model behind it. Those interested in studying nominal GDP targeting can proceed from the Sheedy model and study the many additional issues that could arise if policymakers adopted the idea of countercyclical price-level movements as optimal monetary policy. Others can investigate the extent to which NSCNC may or may not be as

368 Brookings Papers on Economic Activity, spring 2014
important a friction as it appears to be, perhaps because of the way credit default is conceptualized and modeled. Both types of research would likely improve our understanding of the NSCNC friction and monetary policy’s role in alleviating it.
referenCes for the BullarD Comment
Azariadis, Costas, and Luisa Lambertini. 2003. “Endogenous Debt Constraints in Life Cycle Economies.” Review of Economic Studies 70, no. 3: 1–27.
Koenig, Evan. 2013. “Like a Good Neighbor: Monetary Policy, Financial Stabil-ity, and the Distribution of Risk.” International Journal of Central Banking 9: 57–82.
Mian, Atif, and Amir Sufi. 2011. “House Prices, Home Equity–Based Borrowing, and the U.S. Household Leverage Crisis.” American Economic Review 101, no. 5: 2132–56.
Sheedy, Kevin. 2013. “Debt and Incomplete Markets: A Case for Nominal GDP Targeting.” Discussion Paper no. 1209, Centre for Economic Performance, May.
Comment ByIVÁn WeRnInG1 This paper by Kevin Sheedy argues that risk sharing should be an important goal in the conduct of monetary policy. It makes two distinct contributions in this direction. First, it presents a tractable model in which inflation affects risk sharing, applying this to derive implications for monetary policy. Nominal GDP targeting is shown to achieve optimal risk sharing in incomplete market settings with flexible prices. Second, it pits the new risk sharing goal for monetary policy against the traditional sta-bilization role. For a calibrated New Keynesian economy featuring sticky prices, the paper finds that significant weight should be placed on the risk sharing goal, affecting the reaction to technology shocks.
These ideas are important, and the effort to push standard representative- agent macroeconomic models to incorporate heterogeneous agents is laud-able and, here, accomplished very elegantly. The paper helps create a bridge between the monetary policy literature, typically divorced of risk-sharing considerations, with a literature focusing on risk sharing that is typically divorced of monetary and nominal considerations.
Sheedy definitely succeeds at making one think about risk sharing and monetary policy in a more systematic way. As a discussant, I found little to disagree with within the confines of the paper’s setting. However, I do
1. My views were enriched by exchanges with Adrien Auclert and Matt Rognlie.

Comments and DisCussion 369
believe that a few important elements are missing and that they need to be incorporated to assess the appropriateness of risk sharing as a goal for monetary policy.
I will begin by restating the main idea of risk sharing with flexible prices in a simple static model. I then incorporate heterogeneous risk exposures and idiosyncratic uncertainty, two features that I believe are crucial to any discussion of risk sharing. These may weaken the case for nominal GDP targeting in particular, although not necessarily for inflation-induced risk sharing in general. Finally, I briefly touch on elements that may affect the trade-off between risk sharing and stabilization. I conclude that, rather than being competing goals, risk sharing and stabilization may be complemen-tary ones.
risk sharing anD nominal gDp targeting. Let me reduce the argument for inflation-induced risk sharing and nominal GDP targeting to its bare essentials, within a static risk-sharing model.
Two agents, B (borrowers) and S (savers), have a common utility func-tion u(c). Income is distributed proportionally, with yB = yBY and yS = ySY, assuming that yB > yS.
Let us assume, momentarily, that a conditional transfer T(Y) is available. The planning problem is
u Y T Y u Y T YT
B B S Smax ,i
[ ]( ) ( )( ) ( )λ ψ − + λ ψ +( )
where lB and lS are Pareto weights. From now on I specialize to equal weights lB = lS = 1, since nothing of interest is lost by doing so.
The expectation above is taken over aggregate income Y. However, the maximization can be performed for each realization of aggregate income Y,
u Y T Y u Y T YT Y
B S{ }( ) ( )( ) ( )ψ − + ψ +( )
max .
The optimum equalizes consumption by setting
T Y YB S(1)2
.( ) = ψ − ψ
One can implement this optimal state-contingent transfer using nominal debt, D, and a state-contingent price level, P(s), satisfying
T YD
P Y,( )
( )=

370 Brookings Papers on Economic Activity, spring 2014
or substituting using our solution (equation 1),
iY P Y DB S
( ) =ψ − ψ
2,
a constant value for nominal spending. Optimal policy can be characterized as targeting nominal GDP.
heterogeneous exposure to aggregate risk. Following the paper, I assumed above that individual income moves in proportion with aggre-gate income—the elasticity of individual income with respect to aggregate income is unity. Consider instead
y YB B ,( )= ϕ
y Y YS B ,( )= − ϕ
for some function jB(z). The elasticity of the borrower’s income to aggre-gate income may now depart from one. By the same arguments I obtain
T Y Y YB( ) ( )= ϕ − 1
2.
This shows that, in general, T(Y) is no longer proportional to aggregate income Y. As long as T(Y) does not change signs, I can implement the transfers by T(s) = D/P(s) for some P(s) > 0. Let us assume this is the case. By implication, it is no longer the case that nominal spending Y z P(Y) is constant. Instead,
Y Y P Y DB( )( ) ( )ϕ − =1
2.
For example, if the income of borrowers is more responsive to aggregate income, so that the elasticity of jB(Y) is greater than one, then the price level P(Y) should also have an elasticity greater than one in absolute value. That is, the price level should be more responsive than nominal GDP targeting.
iDiosynCratiC unCertainty. The paper abstracts from idiosyncratic income risk. This is unfortunate, because it is well appreciated that the uncertainty households face trumps aggregate uncertainty.
To incorporate idiosyncratic uncertainty, let us assume
y Y y YBi Bi Si Siand ,= ε = ε

Comments and DisCussion 371
where eBi and eSi are idiosyncratic realizations for individual i within each respective group. The case without idiosyncratic uncertainty is now a spe-cial case where Var [e] = 0. One important example of e may be a speci-fication that captures unemployment risk, with e = 0 when the agent is unemployed.
The planning problem is
iu Y T Y u Y T Y
TB Smax .[ ]( ) ( )( ) ( )ε − + ε +
( )
The first-order condition is
u Y T Y s u Y T Y YB S[ ] [ ]( ) ( )( ) ( )′ ε − = ′ ε +ε ε(2) ,
which equalizes average marginal utility after each realization of aggregate income Y. As before, as long as T(Y) does not change signs we can imple-ment the transfers by T(s) = D/P(s) for some P(s) > 0. Let us assume this is the case.
I want to investigate whether
T s Y s( ) ( )= τ(3)
for some t. For this purpose, it is helpful to assume a homogeneous utility function u(c) = c1-s/(1 - s). Substituting the guess (equation 3) into equa-tion 2, one finds that validating the guess requires
Y YB S[ ] [ ]( ) ( )ε − τ = ε + τε−σ
ε−σ
to hold for some fixed t for all realizations of Y. This is not generally pos-sible, except in the special case where eB and eS are independent of Y. There is a large empirical literature documenting the fact that idiosyncratic uncer-tainty varies over the business cycle. When idiosyncratic shocks are not independent of aggregate ones, the optimal policy for P(Y) will not target nominal GDP.
is inflation the right tool? Idiosyncratic uncertainty also highlights how imperfect inflation—or any tool that depends only on aggregates and does not condition on idiosyncratic shocks—is for risk-sharing purposes. Other policies, such as progressive taxes or unemployment insurance ben-efits, do provide insurance against idiosyncratic uncertainty.
Equally relevant, the paper assumes that borrowers take on debt that is no-contingent and free of risk. However, as the recent crisis reminds us, both secured and unsecured consumer credit is not risk-free, and borrowers

372 Brookings Papers on Economic Activity, spring 2014
default on both forms of debt, providing a form of state contingency that is tailored to idiosyncratic conditions.
Overall, for these reasons, inflation is a relatively coarse tool for dealing with the uncertainty that households face. It may be argued, however, that once other available instruments are exhausted, there remains a residual role to be played by inflation. Knowing just how significant that role should be is crucial if one is going to have monetary policy deviate from its tradi-tional role.
GeneRAL DISCUSSIon Robert Shimer asked an empirical question: how tightly is the consumption decline during a recession linked to an individual’s debt load? He thought the individuals who experienced the largest declines in consumption might have no debt load on account of their nonparticipation in credit markets. Shimer thought that smoothing out inflation would not be very effective at helping this group of people. It seemed to him that in principle this was something one could address using existing data.
He also agreed with discussant Iván Werning that using inflation alone in the model is not going to work. As he understood the model, even the opti-mal rate of inflation was still not going to have better than a second-order benefit. If it turned out that the modeling was far off because of incomplete risk sharing, one could imagine achieving a first-order benefit from infla-tion. But which way it goes is going to depend on how consumption declines during recessions or is related to debt holdings, and Shimer acknowledged that he did not know how that works.
Johannes Wieland asked the author to clarify the trade-off between infla-tion targeting and nominal GDP targeting. He wondered if it would be bet-ter to target inflation volatility instead of GDP.
Gerald Cohen found the concept of a natural rate of debt to GDP to be rather frightening. He said he had not been able to find a theoretical justifi-cation for any particular ratio of debt to GDP. Ever since 2008, people have been talking about the economy needing to be deleveraged, but Cohen said that whenever he asked others what the optimal ratio of debt to GDP would be, they could only wave their hands or, in his view, invent a number. Peo-ple once talked about a ratio of 130 percent, but looking in retrospect today most people think that number is too high, and now a common figure is 90 percent. Cohen’s feeling was that if one is going to target an optimal ratio one ought to have a good theory behind it.

Comments and DisCussion 373
Justin Wolfers wondered why financial incompleteness existed at all. He speculated that when people obtained a mortgage they might often wonder why it was that the real value of the payoffs would be allowed to decline over the course of the mortgage. After all, one could simply write a debt contract in real terms, and if half the mortgage industry began to do that the rest would certainly follow suit.
Kevin Sheedy responded to the comments made during this brief dis-cussion. First, he pointed out that he used a 10 percent fall in potential output in his paper—certainly a huge shock but a reasonable size relative to people’s expectations of the trends prior to the financial crisis. And when he did, he found that such a shock led to only a 2-percentage-point increase in inflation over a decade. Since a shock of that magnitude is rare, Sheedy suggested that there would be little impact on inflation vola-tility. In his view, then, during a “great moderation” period there would not be any tension between targeting nominal GDP and targeting infla-tion. So the policy of nominal GDP targeting would be a good one when the economy needed it, when it was hit with really big real shocks, and when the need was not there one would not have to tolerate a lot of inflation volatility. This is key to explaining why the weight on risk sharing is so high.
Additionally, Sheedy noted, with long-term debt contracts inflation is smoothed out over time, so there is less relative price distortion and less aggregate volatility. So although the benefits of the policy may be small when one considers other factors, such as idiosyncratic risk, the costs of achieving the policy would also be relatively small. Lastly, he agreed with some discussants that financial market frictions might be entirely removed at some point in the future, but he did not believe that would occur soon. Given the prevalence of nominal debt contracts, he believed the case for nominal GDP targeting was still strong.
