debbri, hawa abdulgader (1996) plant extracts as treatment...
TRANSCRIPT

Glasgow Theses Service http://theses.gla.ac.uk/
Debbri, Hawa Abdulgader (1996) Plant extracts as treatment for diabetes mellitus. PhD thesis. http://theses.gla.ac.uk/2113/ Copyright and moral rights for this thesis are retained by the author A copy can be downloaded for personal non-commercial research or study, without prior permission or charge This thesis cannot be reproduced or quoted extensively from without first obtaining permission in writing from the Author The content must not be changed in any way or sold commercially in any format or medium without the formal permission of the Author When referring to this work, full bibliographic details including the author, title, awarding institution and date of the thesis must be given

PLANT EXTRACTS AS TREATMENT FOR DIABETES MELLITUS
A thesis submitted for the degree of Doctor of Philosophy in the Faculty of Medicine, University of Glasgow.
By
Hawa Abdulgader Debbri
Institute of Biomedical and Life Science, West Medical Building and Department of Pharmacology
University of Glasgow
July 1996

ACKNOWLEDGMENTS
I would like to extend my sincere thanks to Dr. Paul Skett my supervisor, who provided
excellent advice, encouragement and guidance throughout these three very short years.
I am extremely grateful to my family particularly to my dad and my brother Yossef, who
encourage me to do it, and who supported me in all ways they could throughout my
stay at Glasgow. Without their help, patience and unfailing moral and practical support
throughout my period of study, this work would not have been possible.
I wish to thank Professor T. Stone and Dr. D. Pollock, for kindly allowing me to
carryout this research in their department.
Furthermore, I am deeply indebted to the staff at the Department of Diabetes, Al-ffa
Hospital, Libya particularly, Dr. Ahmed (Medical Director) for offering the facilities for
the clinical aspects of this project.
I will seize this opportunity to thank Mr. Ahmed Saleh for collecting the plant samples
from the desert, and Mr. Saleh A -fitouri for sending it.
I am also very grateful to my mum taken the pain to separate the aerial parts of the plant
and drying them. I wish to express my gratitude to the patients who volunteered the
clinical trials and showed keen interest in the results.
I acknowledge financial support from the Libyan Interest Section.
Thanks to Professor J. Connolly for grinding the plant and assisting with the extractions
and Dr. J. H. Dickson for the identification of the plants
I would like to express my thanks to the members of the academic (past, present and
temporary), technical and secretarial staff in the Department of Pharmacology,
particularly to Robert Auld and Adam Ritchie.

Finally, I wish to thank all my colleagues, Naima, Salma, Shamas and Elspeth. I wish
them happiness in the future, Dr. Ali Nasr and his wife Titoha for helping me in the last
three months of my study, And many thanks to Eric for his help and generous technical
assistance.
11

TABLE OF CONTENTS
ACKNOWLEDGMENTS ..........................
TABUS OF CONTENTS ill ................................................................................................... iii
SUMMARY ................................................................................................................... ix
LIST OF FIGURES .......................................................................................................... xi
LIST OF TABLES .......................................................................................................... XV
LIST OF ABBREVIATIONS ............................................................................................ xix
1. BACKGROUND :................................................................................................... 1
1.1 DIABETES MELLITUS :............................................................................................. 1
1.2 TREATMENTS OF DIABETES MELLITUS ....................................................................
5
1.3 GLYCOGEN PHOSPHORYLASE ..................................................................................
7
1.3.1 Function and Regulation :................................................................................. 7
1.3.2 Role of L7sulin and Glricagon in control of glycogen metabolism: .................... 8
1.4 PANCREATIC HORMONEs :....................................................................................... 9
1.4.1 Insulin: ............................................................................................................ 9
1.4.1.1 Mechanism of action of insulin ................................................................... 9
1.4.2 Gbicagon ....................................................................................................... 10
1.4.2.1 Mechanism of action of glucagon ............................................................. 12
1.5 CrrocHRoME P-450: ........................................................................................... 12
1.5.1 Liver, Cylochrome P-450 and Diabelts Mellitus :........................................... 15
1.6 PLANTS USED AS HERBAL TREATMENT: ..................................................................
16
1.6.1 ARTEMISIA JUDAICA (Fancily Compositae) ................................................ 16
1.6.2 ANVILLEA CARCINI (Family. Composilae) .................................................. 16
iii

1.6.3 MARRUBI UM VULGATE L (Family. Labialae) ............................................ 17
1.7 EXPERIMENTAL MODELS OF DIABETES MELLITUS :................................................. 17
1.8 AIMS OF THE PROJECT: ..........................................................................................
19
2. MATERIALS AND METHODS ......................................................................... 20
2.1 PREPARATION OF ARTEMISIA JUDAICA EXTRACT .................................................... 20
2.1.1 Preparation of crude extract .......................................................................... 20
2.1.2 Preparation of the aqueous and ethanolic extract of Artenrisia judaica.......... 20
2.2 IN-VIVO STUDIES ............................................................................................. 22
2.2.1 EXPERIMENTAL ANIMALS ......................................................................... 22
2.2.2 Induction of diabetes mellitus........................................................................ 22
2.2.3 METABOLIC CAGES .................................................................................... 22
2.2.4 EXPERIMENTAL PROCEDURES ................................................................ 23
2.2.5 Experimental protocol ................................................................................... 23
2.2.6 Normal rat treated with Artemisia (17 Dciy experimental rein ) :..................... 24
2.2.7 Diabetic rat (17 Day experimental run): ........................................................ 24
2.2.8 Diabetic rats treated with Artemisia extract (27 day experimental run):......... 24
2.3 AssAYS ................................................................................................................ 28
2.3.1 Glucose Assay ................................................................................................ 28
2.3.2 Urine kelones and glucose .............................................................................. 29
2.4 MEASUREMENT OF OTHER PARAMETERS ................................................. 29
2.4.1 Preparation of liver microsomes .................................................................... 30
2.4.2 Protein determination .................................................................................... 31
2.4.3 CYTOCHROME P-450 ENZYME ACTIVITIES .............................................. 31
2.4.3.1 ASSAY OF ANILINE 4-HYDROXYLASE ACTIVITY ......................... 31
iv

2.4.3.2 ASSAY OF AMINOPYRINE N-DEMETHYLASE ACTIVITY .............. 33
2.4.3.3 ASSAY OF STEROID (ANDROST-4-ENE-3,17-DIONE)
METABOLISM ................................................................................................... 34
2.5 HUMAN STUDIES ............................................................................................. 35
2.5.1 Preparation ofArtemisia judaica extract ....................................................... 35
2.5.2 Subject Descriptions ...................................................................................... 35
2.6 IN-VITRO EXPERIMENTS (ISOLATED HEPATOCYTES) :............................ 36
2.6.1 Preparation of isolated hepatocytes ............................................................... 36
2.7 HEPATOCYTE CULTURE ......................................................................................... 39
2.8 ADDITION OF TEST MATERIALS ..............................................................................
39
2.8.1 Pre-incubation for androsl-4-tale 3,17-dio ne metabolism assay ..................... 39
2.8.1.1 Assay of steroid metabolism ..................................................................... 40
2.8.2 Pre-incubation for glycogen phosphorylase a activity assay ........................... 44
2.8.2.1 Glycogen phosphorylase a assay ............................................................... 45
2.9 PROTEIN ASSAY .................................................................................................... 47
2.10 CALCULATIONS AND STATISTICS: ............................................................. 47
2.11 CYTOCH ONJE P450-DEPENDENT ENZYMI; ACTIVITIES ........................................ 47
2.12 How TO CALCULATE THE VOLUME OF TILE BUFFER FOR MICROSOMB PREPARATION48
2.13 TOTAL PROTEIN (MG) ..........................................................................................
48
2.14 PROTEIN (MG/c) ................................................................................................. 48
2.15 LIVER WEIGHT AS % OF BODY WEIGHT ................................................................ 48
2.16 STEROID METABOLISING ENZYME ACTIVITIES ....................................................... 48
2.17 COUNTING NUMBER OF CELLS /I ML (IN STEROID METABOLISM) .......................... 49
2.18 CALCULATIONS OF GLYCOGEN PI IOSPI IORYLASE A ACTIVITY ................................ 49

2.19 STATISTICS ..................................................................................................... 50
2.20 REAGENTS USED ........................................................................................... 51
2.20.1 BUFFERS .................................................................................................... 51
2.2 0.2 NA SH reagent :............................................................................................. 51
2.20.3 CO-FACTOR MIXTURE FOR ENZYME ASSAYS ........................................ S2
2.21 BUFFERS AND PHYSIOLOGICAL SOLUTIONS: .......................................................... 52
2.21.1 Ca2+-Free Krebs-Henseleit sohrtion (with EGTA) -[S00rlJ ........................ 53
2.21.2 Ca2+ free Buffer (with out EG TA) [100m1]:................................................ 53
2.21.3 Collagenase buffer [100ml]:........................................................................ 53
2.21.4 Washing buffer ............................................................................................ 53
2.21.5 Buffer and radioactive mixture for glycogen phosphorylase a assay ............. 54
2.21.5.1 MOPS Buffer ......................................................................................... 54
2.21.5.2 Radioactive assay mixture ........................ :............................................. 54
2.22 - SOURCES OF HORMONES, DRUGS AND REAGENTS .............................. 55
3. IN-VIVO EXPERIMENTS .................................................................................. 57
3.1 NORMAL RATS TREATED WITH ARTEMISIA (17 DAYS): ........................................... 57
3.2 DIABETIC RATS (17 DAYS): ................................................................................... 64
3.3 DIABETIC RAT TREATED WITH ARTEMISIA (27 DAY EXPERIMENT): ......................... 71
3.4 DlscUssIOrr :......................................................................................................... 79
4. POST IN-VIVO LIVER PARAMETERS ............................................................ 81
4.1 LIVER WEIGHT AS PERCENTAGE (%) OF BODY WEIGI IT ............................................ 81
4.2 LIVER PROTEIN CONTENT: ..................................................................................... 81
4.3 ANILINE 4-HYDROXYLASE ACTIVITY: ..................................................................... 81
4.4 AmiNOPYRINE N-DEMETIHYLASE ACTIVITY: ........................................................... 85
vi

4.5 LIVER STEROID METABOLISM :............................................................................... 85
4.6 DISCUSSION OF RESULTS FOR LIVER PARAMETERS ................................................
92
5. CLINICAL EXPERIMENTS .............................................................................. 94
5.1 DISCUSSION .......................................................................................................... 97
6. IN VITRO EXPERIMENTS (ISOLATED IIEPATOCYTES) ........................... 98
6.1 ANDROST-4-ENE-3,17-DIONE METABOLISM ...........................................................
98
6.1.1 The effects of insulin and crude extracts of Ariemisia judaica ........................ 98
6.1.2 Effect of animal weight/ age .......................................................................... 98
6.1.3 Effect of different insulin preparations ......................................................... 102
6.1.4 Effect of Different Culture Media ................................................................. 102
61.5 Effect of different periods of pre-inczrbation ................................................. 109
6.1.6 Effects of Storage of Artemisia extract ......................................................... 109
6.1.7 The effect of Preincubation with Marrubium vulgare extract :.................... 115
6.1.8 The effect of Pre-incubatfon with Anviliea carcinü :.................................... 115
6.2 DISCUSSION OF STEROID METABOLISM ................................................................. 119
6.3 GLYCOGEN PHOSPHORYLASE A ........................................................................... 121
6.3.1 Effect of crude extracts of medicinal plants on the activity of glycogen
phosphorylase a in hepatocytes isolated from normal rat hepatocytes :................. 121
6.3.2 Effect of insulin and glucagon on the activity of glycogen phosphorylase a in
hepatocytes isolated from normal and S7Z diabetic rats ....................................... 12S
6.3.3 Effect of art aqueous extract of Artemisia judaica and insulin on the activity of
glycogen phosphorylase a in hepatocyles isolated from normal rat ....................... 129
6.3.4 Effect of an aqueous extract of Artemisia judaica and ghlcagon on the activity
of glycogen phosphorylase a in hepatocytes isolated from normal and diabetic rat. 131

6.3.5 The effect of an aqueous extract of Arlemisia jndaica and insulin on the
activity of glycogen phosphorylase a in hepalocytes isolated from S7Z diabetic rat. 131
6.3.6 The effect of an ethanolic extract of Artemisia judaica and insulin on the
activity of glycogen phosphorylase a in hepatocytes isolated from normal rat....... 135
6.3.7 Effect of an ethanolic extract of Artemisia judaica and insulin on the activity of
glycogen phosphorylase a in hepatocytes isolated from S7Z diabetic rat .............. 137
6.3.8 Effect of an ethanolic extract of Artemisia judaica and ghicagon on the activity
of glycogen phosphorylase a in hepatocytes isolated from normal and S7Z diabetic
rat ........................................................................................................................ 137
6.3.9 The effects of artemisinin and santonin on the activity of glycogen
phosphorylase a in hepatocytes isolated from normal rat ..................................... 137
6.4 Discussion .......................................................................................................
144
7. GENERAL DISCUSSION: ................................................................................ 147
8. REFERENCES ................................................................................................... 153

Summary:
1-The herbal extract of Artemisia has been regarded to be anti-hyperglycaemic
since olden times and is commonly used by diabetics in Libya. The present work was designed to evaluate, test and determine which fraction or component of the herb had
the hypoglycaemic effects in normal and streptozotocin-induced diabetic rats.
2-The plant extract was administered to the animals in their drinking water and body weight, food and fluid intake and urine volume were all monitored daily. Food and fluid intake and body weight gain in normal rats were not altered by treatment with the
plant extract but there was a rise in the urine glucose in the first six rats but rats 7,8 and 9 were not affected by treatment with plant. Urine volume was increased in all rats
suggesting Artemisia jzidaica is a mild diuretic.
3- The streptozotocin-induced diabetic rat model, used in this study, was
associated with the characteristic diabetic symptoms of hyperphagia, hyperglycaemia,
polydipsia, weight loss and urinary glucose excretion. When a crude aqueous extract of Artemisia was given in their drinking water, it had little effect on these symptoms after 10 days of treatment. Urine glucose was reduced in the last two days and ketones in the
urine were abolished by this treatment.
4- Diabetes mellitus is known to affect many and varied parameters in rat liver.
Insulin, biguanides and sulphonylureas are known antidiabetic diabetic treatments.
Artemisia judaica extract was tested for its effect on hepatic steroid metabolism and
glycogen phosphorylase a activity in comparison with the above drugs. Clearly
Artenzisia does act as an insulin-mimetic in these assays by reversing all the effects
produced by the administration of streptozotocin. In particular the changes in the
enzyme activities of cytochrome P-450 (2E1,2B and 2C) on androst-4-ene-3,17-dione
metabolism are all reversed by the administration of Arlemisia extract to diabetic rats. The addition of insulin and/or Artemisia extract directly to normal rat hepatocytes,
however, did not have any effect on the metabolism of androst-4-ene-3,17-dione. This is
in contrast to the results of Hussin & Skett (1988). Extracts of other plants, Anvillea

and Marnibium, similarly showed little effect on steroid metabolism in isolated
hepatocytes.
5- Insulin is known to inhibit glycogen breakdown by decreasing the activity of
glycogen phosphorylase a and counteracting the stimulatory effect of glucagon (van de
Werve and Jeanrenaud, 1987). In this study the effects of insulin on glycogen
phosphorylase a activity were confirmed as was the reported stimulatory effect of
glucagon on the same enzyme. All of the plant extracts mimicked insulin in decreasing
glycogen phosphorylase a activity. Marrubiwn and Anvillea were more potent than
Artemisia. Artemisia, Marrubium and Anvillea when added together with insulin
decreased the activity of glycogen phosphorylase a more than extracts alone and they
antagonised the effect of glucagon.
6- A start was made in separating the active ingredient(s) from the Artemisia
judaica extract. From the results of the aqueous and ethanolic extracts of Artemisia, it
is suggested that the extract contains at least two active ingredients. One which
mimicked and enhanced the effect of insulin (in the water extract) and the other (in the
ethanol extract) which antagonised the effect of glucagon.
7- The preliminary results of human studies showed that Artemisia judaica had a
potential use in treating patients with diabetes and it is suggested that Artemisia judaica
contains material capable of reducing an elevated blood sugar and improving diabetic
symptoms.
8- It can be concluded therefore from the results of the present study that
Artemisia can exhibit significant anti-diabetic effects inn-vivo and in-vitro and has an
insulin-like action. Marrubium and Anvillecr when tested on glycogen phosphorylase a
have the same action as insulin but these were not further tested due to lack of time.
These findings tend to endorse the wide use of these plants in Arab folk medicine and
show a great potential for the treatment of diabetes.

LIST OF FIGURES
FIGURE 1.1 POSTULATED MECHANISMS BY WHICI I CI IRONIC OVEREATING LEADS TO
CHRONICALLY ELEVATED PLASMA INSULIN AND DIMINSI IED CELL RESPONSIVENESS
TO INSULIN ............................................................................................................. 4
FIGURE 1.2 INSULIN ACTS VIA SECONDARY MEDIATORS OF ITS ACTION TO INIIIBIT
GLYCOGENOLYSIS AND PROMOTE GLYCOGEN SYNTHESIS IN LIVER .......................... II
FIGURE 1.3 GLUCAGON ACTS VIA SECONDARY MEDIATORS OF ITS ACTION TO ACTIVATE
GLYCOGENOLYSIS AND INHIBIT GLYCOGEN SYNTHESIS IN LIVER ............................. 13
FIGURE 2.1 EXTRACTION PROCEDURE FOR ARTCA1ISI A JUDAICA (CRUDE, AQUEOUS AND
ETHANOLIC) ......................................................................................................... 21
FIGURE 2.2 NORMAL RAT TREATED WITH ARTLABS A EXTRACT (10 DAYS) ....................
25
FIGURE 2.3 DIABETIC RAT WITZ IOUT TREATIMIENT (10 DAYS) ....................................... 26
FIGURE 2.4 DIABETIC RAT TREATED WITZ I ARTEAI/SL9 EXTRACT (10 DAYS) ...................
27
FIGURE 2.5 THE HYDROXYLATION OF ANILINE ............................................................ 32
FIGURE 2.6 N-DEMETHYLATION OF AMINOPYRINE ...................................................... 33
FIGURE 2.7 DIAGRAM OF TIE LIVER PERFUSION .......................................................... 38
FIGURE 2.8 THE PHASE 1 METABOLISM OP ANDROST-4-ENE-3,17-DIONE IN TI iE LIVER.
SPECIFIC ISOENZYMES THOUGHT TO PRODUCE TI IE VARIOUS NIETAI3OLITES ARE
GIVEN IN CAPITAL ITALICS .....................................................................................
42
FIGURE 2.9 SCHEMATIC REPRESENTATION OF ANDIZOSTENE-4-ENE-3,17-DIANE
METABOLITES SEPARATION BY ONE DIMENSIONAL TI IIN LAYER CI IROMATOGRAPI-IY43
xi

FIGURE 2.10 PROTOCOL FOR GLYCOGEN PHOSPHORYLASE ASSAY ............................... 46
FIGURE 3.1 THE EFFECT OF ARTF-VISIA JUDAICA EXTRACT ON BODY WEIGHT OF CONTROL
MALE RATS ...........................................................................................................
58
FICURE 3.2 THE EFFECT OF ARTE ISIA JUDAICA EXTRACT ON FOOD INTAKE OF CONTROL
MALE RATS ........................................................................................................... 59
FIGURE 3.3 THE EFFECT OF ARTEw1SzA JUDAICA EXTRACT ON FLIUD INTAKE OF CONTROL
MALE RATS ...........................................................................................................
60
FIGURE 3.4 THE EFFECT OF ARTEMISIA JUDAICA EXTRACT ON URINE VOLUME OF
CONTROL MALE RATS ............................................................................................
61
FIGURE 3.5 THE EFFECT OF ARTMISIA JUDAICA EXTRACT ON URINE GLUCOSE OF
CONTROL MALE RATS ............................................................................................
62
FIGURE 3.6 THE EFFECT OF STZ-INDUCED DIABETES ON BODY WEIGHT ....................... 65
FIGURE 3.7 THE EFFECT OF STZ-INDUCED DIABETES ON FOOD INTAKE ........................ 66
FIGURE 3.8 THE EFFECT OF STZ-INDUCED DIABETES ON FLUID INTAKE ........................ 67
FIGURE 3.9 THE EFFECT OF STZ-INDUCED DIABETES ON URINE VOLUME ..................... 68
FIGURE 3.10 THE EFFECT OF STZ-INDUCED DIABETES ON URINE GLUCOSE .................. 69
FIGURE 3.11 THE EFFECT OF STZ-INDUCED DIABETES AND ARTMISIA JUDAICA EXTRACT
TREATMENT ON BODY WEIGHT ..............................................................................
72
FIGURE 3.12 THE EFFECT OF STZ-INDUCED DIABETES AND ARTMISIA JUDAICA
TREATMENT ON FOOD INTAKE ............................................................................... 73
FIGURE 3.13 THE EFFECT OF STZ-INDUCED DIABETES AND ARTMISIA JUDAICA
TREATMENT ON FLUID INTAKE ............................................................................... 74
FIGURE 3.14 THE EFFECT OF STZ-INDUCED DIABETES AND ARTLAIISIA JUDAICA
(EXTRACT) TREATMENT ON URINE VOLUNIE ........................................................... 75
Xll

FIGURE 3.15 THE EFFECT OF STZ-INDUCED DIABETES AND ARTEMISIA JUDAICA EXTRACT
TREATMENT ON URINE GLUCOSE ...........................................................................
76
FIGURE 4.1 THE EFFECT OF DIABETES AND ARTEAfISIA EXTRACT TREATMENT ON LIVER
WEIGHT AS PERCENTAGE (%) OF BODY WEIGHT ..................................................... 82
FIGURE 4.2 THE EFFECTOF DIABETES AND ARTEJwSIA EXTRACT TREATMENT ON LIVER
PROTEIN CONTENT ................................................................................................
83
FIGURE 4.3 THE EFFECT OF DIABETES AND ARTEMISIA EXTRACT TREATMENT ON ANILINE
4-HYDROXYLASE ..................................................................................................
84
FIGURE 4.4 THE EFFECT OF DIABETES AND ARTFu l/S/A EXTRACT TREATMENT ON
AMINOPYRINE N-DEMETHYLASE ACTIVITY ............................................................ 86
FIGURE 4.5 THE EFFECT OF DIABETES AND ARTLAf1S/A EXTRACT TREATMENT ON LIVER
STEROID METABOLISM (7a-HYDROXYLATION OF ANDROST-4-ENE-3,17-DIONE) BY
LIVER MICROSOMES ..............................................................................................
87
FIGURE 4.6 THE EFFECT OF DIABETES AND ARTEI1IS/A EXTRACT TREATMENT ON LIVER
STEROID METABOLISM (160-HYDROXYLATION OF ANDROST-4-ENE-3,17-DIONE) BY
LIVER MICROSOMES ..............................................................................................
88
FIGURE 4.7 TIlE EFFECT OF DIABETES AND AR7'EMLSYA EXTRACT TREATMENT ON 60-
HYDROXYLATION OF ANDROST-4-ENE-3,17-DIONE ................................................ 89
FIGURE 4.8 THE EFFECT OF DIABETES AND ARTEMISZA EXTRACT TREATMENT ON 17a((3)-
HYDROXYSTEROID DEHYDROGENASE IN LIVER MICROSOMES ................................. 90
FIGURE 4.9 THE EFFECT OF DIABETES AND ARTEMISIA EXTRACT TREATMENT ON 5a-
REDUCTASE ACTIVITY IN LIVER MICROSOMES ........................................................ 91
FIGURE 5.1 EFFECT OF TREATMENT ON BLOOD GLUCOSE LEVELS ................................. 96
xiii

FIGURE 6.1 DOSE-RESPONSE CURVES OF GLYCOGEN PIIOSPHORYLASE A TO INSULIN (A)
AND EXTRACTS OF ARTEMISIA JUDAICA (B); MARRUBIUM VULGARE ® AND
ANVILLEA CARCINII (D) IN ISOLATED RAT HEPATOCYTES ...................................... 123
FicuiE 6.2 DOSE-RESPONSE CURVES OF GLYCOGEN PHOSPHORYLASE A TO GLUCAGON
(A) AND EXTRACTS OF ARTEMISIA NDAICA (B), MARRUBIUM VULGARE ® AND
ANVILLEA CARCINII (D) IN ISOLATED RAT HEPATOCYTES ..................................... 124
FIGURE 6.3 DOSE-RESPONSE CURVES OF GLYCOGEN PHOSPHORYLASE A TO INSULIN (A);
ARTENUSIN1N (B) AND sAt rrorrrN (C) .................................................................. 142 FIGURE 6.4 DOSE-RESPONSE CURVES OF GLYCOGEN PHOSPIIORYLASE A TO GLUCAGON
(A); ARTEMISININ (B) AND SANTONIN (C) ....... ............................................
143
XIV

LIST OF TABLES
TABLE 3.1: FAECES (G) WEIGHT OF NORMAL RAT TREATED WITH ART MISIA JUDAICA... 63
TABLE 3.2 FAECES (G) WEIGHT OF DIABETIC RATS ....................................................... 70
TABLE 3.3: URINE KETONE OF DIABETIC RATS TREATED WITH ARTEAIISIA .....................
77
TABLE 3.4: FAECES (G) WEIGHT OF DIABETIC RAT TREATED WITH ARTEIfISIA ...............
78
TABLE 6.1: THE EFFECT OF INSULIN AND ARTEAfI. SL4 JUDAICA ON TI iE 7a-, 60-, AND 16a-
HYDROXYLASE, 17a(ß)-HYDROXYSTEROID DEI-LYDROGENASE AND 5a-REDUCTASE
AFTER 1/2 HOUR OF PREINCUBATION IN I7TRO IN ISOLATED I IEPATOCYTES ............. 99
TABLE 6.2: THE EFFECT OF INSULIN AND ARTEJI ISYA JUDAICA ON TIE 7cc-, 60- AND 16CC-,
HYDROXYLASE, 17ac(J3)- HYDROXYSTEROID DEHYDROGENASE AND 5a-REDUCTASE
AFTER 1 HOUR OF PREINCUTATION IN 17TRO IN ISOLATED HEPATOCYTFS .............. 100
TABLE 6.3: THE EFFECT OF INSULIN AND ARTEAf1S19 JUDAICA ON THE 7a-, 60- AND 16a-,
HYDROXYLASE, 17O0ß- HYDROXYSTEROID DEI IYDROCJENASE AND SCC-REDUCTASE
AFTER 1/2 HOUR OF PREINCU13ATION IN b77R0 IN ISOLATED HFPATOCYTES............ 101
TABLE 6.4: THE EFFECT OF INSULIN AND ARTE MISIA JUDAICA ON THE 7a-, 60- AND 16a-,
HYDROXYLASE, 17a(ß)- HYDROXYSTEROID DEHYDROGENASE AND SCE-REDUCTASE
AFTER 1/2 HOUR OF PREINCUBATION IN VITRO IN ISOLATED HEPATOCYTES............ 103
TABLE 6.5: THE EFFECT OF DIFFERENT TYPES OF INSULIN ON TI-M 7a-, 60-, AND 16a-,
HYDROXYLASE, 17a((3)- HYDROXYSTEROID DEHYDROGENASE AND 5CC-REDUCTASE
OF PREINCUBATION IN VITRO IN ISOLATED I IFPATOCYTES ...................................... 104
xv

TABLE 6.6: THE EFFECT OF INSULIN AND ARTEMI SIA JUDAICA ON n IC 7a-, 60- AND 16a-,
HYDROXYLASE, 17a(ß)- HYDROXYSTEROID DEHYDROGENASE AND 5a-REDUCTASE
AFTER 1/2 HOUR OF PREINCUBATION OF HEPATOCYTES OBTAINED FROM NORMAL
RAT IN HAM'S F-10 MEDIUM ...............................................................................
107
TABLE 6.7: THE EFFECT OF INSULIN AND ARTLAd1S/A JUDAICA ON TI iE 7cL-, 60- AND 16CC-,
HYDROXYLASE, 17a(ß)- HYDROXYSTEROID DEHYDROGENASE AND SCC-REDUCTASE
AFTER 1/2 HOUR OF PREINCUBATION IN HEPATOCYTES OBTAINED FROM NORMAL RAT
IN WILLIAM's E MBDNIvt . ..................................................................................
108
TABLE 6.8: THE EFFECT OF INSULIN AND ARTE ISIA JUD. 9ICA (A 10) ON THE 7a-, 60-
AND 16a-, HYDROXYLASE, 17a(ß)- HYDROXYSTEROID DEl IYDROGENASE AND 5a-
REDUCTASE AFTER 1/2,1,2 &4 HOUR OF PREINCUIJATION IN I-IEPATOCYTES
OBTAINED FROM NORMAL RAT IN HAM'S F-10 MEDIUM ....................................... 110
TABLE 6.9: THE EFFECT OF INSULIN AND ARTCAJISIA JUDAICA (. 020) ON THE 7a-, 60-
AND 16oc-, HYDROXYLASE, 17x([3)- HYDROXYSTEROID DEIIYDROGENASE AND 5a-
REDUCTASE AFTER 1/2,1,2 &4 HOUR OF PREINCUI3ATION IN FIEPATOCYTES
OBTAINED FROM NORMAL RAT, IN HAM'S F-10 MEDIUM ..................................... 111
TABLE 6.10: THE EFFECT OF INSULIN AND ARTE I SIA JUDAICA ON TI iB 7ot-, 6(3-, AND
16a-, HYDROXYLASE, 17a((3)- HYDROXYSTEROID DEI IYDROGENASE AND 5a-
REDUCTASE AFTER 1/2,1,2 &4 HOUR OF PREINCUBATION IN HEPATOCYTES
OBTAINED FROM NORMAL RAT, IN WILLIAMS' E ................................................. 112
TABLE 6.11: THE EFFECT OF INSULIN AND ARTG1 fISY. 4 JUDAICA ON (A 10) TFHE 7a-, 613-,
AND 16a-, HYDROXYLASE, 17c ((3)- HYDROXYSTEROID DEHYDROGENASE AND 5a-
REDUCTASE AFTER 24,48 & 72 HOUR OF PREINCUTATION IN PREINCUTATION IN
VITRO IN ISOLATED HEPATOCYTES ....................................................................... 113
xvi

TABLE 6.12: THE EFFECT OF INSULIN AND ARTEAI/S%A JUDAiCA (0.20) ON TI 7oc-, 60-
AND 16a-, HYDROXYLASE, 17a(ß)- I IYDROXSTEROID DEI IYDROGENASE AND 5a-
REDUCTASE AFTER 24,48 & 72 HOUR OF PRE-INCUBATION IN PREINCUI3ATION /N
VITRO IN ISOLATED HEPATOCYTES .......................................................................
114
TABLE 6.13: THE EFFECT OF ARTFJ fis1A JUDAICA (FRESI i AND FROZEN) ON TILE 7CC-, 60-,
AND 16a-, HYDROXYLASE, 17a(ß)- 1 IYDROXYSTEROID DEIIYDROGENASE AND Sa-
REDUCTASE AFTER 1/2 HOUR OF PREINCUDATION IN PRE INCUBATION IN VITRO IN
ISOLATED HEPATOC YTE S ..................................................................................... 116
TABLE 6.14: THE EFFECT OF MARRUBIUM VULGARE ON TI iE 7a-, 6(3-, AND 16a-,
HYDROXYLASE, I7a((3)- HYDROXYSTEROID DEHYDROGENASE AND 5a-REDUCTASE
AFTER 1/2 HOUR OF PREINCUBATION IN I IFPATOCYTES ........................................ 117
TABLE 6.15: THE EFFECT OF ANVILLEA CARCIN// ON Ti IE 7c c-, 60-, AND 16a-,
HYDROXYLASE, 17a(ß)- IIYDROXYSTEROID DEI IYDROGENASE AND Sa-REDUCTASE
AFTER 1/2 HOUR OF PREINCLJI3ATION IN PREINCU13ATIONIN VITRO IN ISOLATED
HEPATOCYTES ....................................................................................................
118
TABLE 6.16: CONTROLS FOR EXPERIMENT OF NORMAL AND DIABFTIQ RAT IIEPATOCYTE
ON GLYCOGEN PHOSPI IORYLASE A ACTIVITY ........................................................ 126
TABLE 6.17: DOSE-RESPONSE EFFECT OF GLYCOGEN PI IOSPI IORYLASE A TO INSULIN
AND GLUCACON AT DIFFERENT CONCENTRATIONS IN ISOLATED NORMAL RAT
HEPATOCYTE COMPARED TO CONTROL (100%) ....................................................
127
TABLE 6.18: DOSE-RESPONSE EFFECT OF GLYCOGEN PI IOSPJ JQRYLASE A TO INSULIN
AND GLUCAGON AT DIFFERENT CONCENTRATIONS IN ISOLATED DIABETIC RAT
HEPATOCYTE COMPARED TO CONTROL (100%) ....................................................
128
xvii

TABLE 6.19: DOSE-RESPONSE EFFECT OF GLYCOGEN PI IOSPFIORYLASE A TO INSULIN AND
AQUEOUS EXTRACT OF ARTEAfISIA IN DIFFERENT CONCENTRATIONS IN ISOLATED
NORMAL RAT HEPATOCYTE COMPARED TO CONTROL (100%) ..............................
130
TABLE 6.20: DOSE-RESPONSE EFFECT OF GLYCOGEN PHOSPI-IORYLASE A TO GLUCAGON
AND OF AQUEOUS EXTRACT OF ARTEMISIA IN DIFFERENT CONCENTRATIONS IN
ISOLATED NORMAL RAT HEPATOCYTE COMPARED TO CONTROL (100%) ...............
132
TABLE 6.21: DOSE-RESPONSE EFFECT OF GLYCOGEN PI IOSPI IORYLASE A TO CLUCACON
AND AQUEOUS EXTRACT OF ARTEA11S/A IN DIFFERENT CONCENTRATIONS IN ISOLATED
DIABETIC RAT HEPATOCYTE COMPARED TO CONTROL (100%) .............................
133
TABLE 6.22: DOSE-RESPONSE EFFECT OF GLYCOGEN PI IOSPI U YLASE TO INSULIN AND
AQUEOUS EXTRACT OF ARTEMISIA IN DIFFERENT CONCENTRATIONS IN ISOLATED
DIABETIC RAT HEPATOCYTE COMPARED TO CONTROL (100%) ............................
134
TABLE 6.23: DOSE-RESPONSE EFFECT OF GLYCOGEN PI IOSPI IORYLASE A TO INSULIN AND
ETHANOLIC EXTRACT ARTE JS7A IN DIFFERENT CONCENTRATIONS IN ISOLATED
NORMAL RAT HEPATOCYTE COMPARED TO CONTROL (100%) ..............................
136
TABLE 6.24: DOSE-RESPONSE EFFECT OF GLYCOGEN PIIOSPI IORYLASE A TO INSULIN AND
ETHANOLTC EXTRACT OF ARTMISZ4 IN DIFFERENT CONCENTRATIONS IN ISOATED
DIABETIC RAT HEPATOCYTE COMPARED TO CONTROL (100%) .............................
139
TABLE 6.25: DOSE-RESPONSE EFFECT OF GLYCOGEN 11110SPI IORYLASE A TO CLUCACON
AND ETHANOLIC EXTRACT OF ARTEMISIA IN DIFFERENT CONCENTRATIONS IN
ISOLATED NORMAL RAT I-ILPATOCYTE COMPARED TO CONTROL (100%) ...............
140
TABLE 6.26: DOSE-RESPONSE EFFECT OF GLYCOGEN PI IOSPI IORYLASE A TOO LUCA CON
AND ETHANOLIC EXTRACT OF ARTEMISIA IN DIFFERENT CONCENTRATION IN
ISOLATED DIABETIC RAT HEPATOCYTE COMPARED TO CONTROL (100%) .............
141
xviii

LIST OF ABBREVIATIONS
ADP Adenosine-5'-diphosphate
ANT Adenosine-5'-monophosphate
ATP Adenosine-5'-triphospate
[Ca2+]1 Intracellular free calcium ion concentration
Cyclic AMP Cyclic adenosine 3', 5'-monophosphate
D. P. M Disintegrations per minute
DTT DL-Dithiothreitol
EDTA Ethylene diaminetetraacetic acid
EGTA Ethylene glycol-bis (ß- aminoethyl ether), N, N, N, N-
tetra-acetic acid
S Centrifugal g-force
G-6-P Glucose-6-phosphate
GIcIP Glucose-I-phosphate
HEPES N-[2-hydroxyethyl]piperazine-N'[2 ethanesulfonic
acid]
I. U International unit
IDDM Insulin- dependent diabetes mellitus
INT Iodonitrotetrazolium
INTH lodonitrotetrazolium reduced
xX

kDa Kilodalton
M. W. Molecular weight
MOPS 3-[N-Morpholino]propane sulphonic acid
NADP Nicotinamide adenine dinucleotide phosphate
(oxidized).
NADPH Nicotinamide adenine dinucleotide phosphate
(reduced)
NIDDM Non-insulin-dependent diabetes mellitus
OHase Hydroxylase
OHSD Oxosteroid oxidoreductase
PMS Phenazine methosulphate
PMSH Phenazine methosulphate reduced
Protein kinase A Cyclic AMP-dependent protein kinase
S. D. Standard deviation
Ser Serine
STZ Streptozotocin
T. L. C Thin layer chromatography
U Unit
xx

INTRODUCTION

1. BACKGROUND:
1.1 Diabetes mellitus : Diabetes mellitus may be defined as a disorder of metabolism in which a relative
or absolute deficiency or lack of effect of insulin leads to chronic hyperglycaemia with or without glucosuria.
Diabetes has probably been known to medical science longer than any other
ailment, yet, in many respects it is still poorly understood. It is characterized by
hyperglycaemia (high blood glucose) and occurs because the liver and skeletal muscle
cannot store glycogen and the tissues are unable to utilize glucose. There are two main forms of diabetes mellitus; type 1 and type 2.
Type 1 diabetes, also known as insulin dependent diabetes (IDDM), is due to an inadequate insulin secretion resulting from a large decrease in the number of beta-cells
in the islets of Langerhans (Eisenbarth, 1986) and Type 2 diabetes, or non-insulin dependent diabetes mellitus (NIDDM), is due to a lack of insulin action in target tissues
(Lillioja et al., 1988) and / or insulin resistance that leads to impaired tissue glucose
uptake and impaired suppression of hepatic glucose production (Martin et al., 1991).
IDDM is usually managed by injection of insulin and NIDDM may be controlled by
dietary means such as weight loss and diet control, However, around 50% of NIDDM
patients cannot achieve satisfactory control through diet alone and require treatment
with a class of drugs collectively referred to as oral hypoglycaemic agents (OHA)
(Kennedy et al., 1988)
Most of the pathological conditions of diabetes mellitus can be attributed to one
of the following three major effects of insulin lack (I)- Decreased utilization of glucose by the body cells, with a resultant increase in blood glucose concentration (2)-Markedly
increased mobilization of fats from the fat storage areas causing deposition of lipids in
the vascular walls due to abnormal fat metabolism and resulting atherosclerosis and
abnormal breakdown of fats leading to the formation of ketone bodies (3)- Depletion of
protein in the tissues of the body.
The overall effect is dehydration of the extracellular space, which then causes dehydration of the intracellular spaces as well (Bowman & Rand, 1983). Glucose
i

absorbed into the blood stream cannot be utilized by the body's cells due to the lack of insulin, and consequently blood glucose levels rise. In an effort to redress the situation,
glucose flows out in the urine as the kidney threshold for glucose is exceeded and
excess glucose cannot be reabsorbed. Glucose acts as an osmotic diuretic and large
quantities of water are excreted as the glucosuria worsens. This makes the individual
thirsty and the patient drinks large volumes of fluid (Watkinson et al., 1993). There is
also an increased appetite without any weight gain which is particularly evident in
IDDM where patients have a tendency to lose weight. Also, in type 1 diabetes, the excess breakdown of fat leads to the formation of
ketones bodies and organic acids leading to acidosis (Bloom et at, 1985). The liver is
supplied with massive amounts of free fatty acids (FFA). These are oxidized in the liver
to provide the energy required for glucose synthesis, simultaneously releasing large
quantities of ketone bodies into the circulation. At the same time release of amino acids from breakdown of protein or lactate production in peripheral tissues supplies the liver
with the carbon substrates essential for glucose formation. This process, which can be a
useful source of both glucose and ketone bodies for energy in times of starvation,
accelerates hyperglycaemia and ketoacidosis in severe insulin deficiency of juvenile
onset (type 1) diabetes. This ketoacidosis only occurs in IDDM individuals, where there is a severe insulin deficiency.
Acute deficiency of insulin, therefore causes a metabolic acidosis (ketosis) due
to the shift from carbohydrate to fat metabolism in diabetes (due to the absence of insulin this occurs even normally between meals when secretion of insulin is minimal, but it becomes extreme in diabetes when secretion of insulin is almost zero ). When the
body depends almost entirely on the fat for energy, the level of ketone bodies in the
body fluid rises mainly derived from the ongoing activity of the liver, which releases
them into the circulation for transport to the heart, skeletal muscle, and other tissues to
be used as an energy source. In the normal fed state, the concentration of ketone bodies
is relatively low because insulin stimulates the synthesis of fatty acids, a competing
pathway for the use of acetyl CoA. Insulin also inhibits lipolysis, thereby decreasing the
supply of fatty acids, which are a major source of acetyl CoA in the liver. Thus, when insulin concentrations are decreased, as occurs in type I diabetes or fasting, production
of ketone bodies is favoured. Severe ketosis does not develop in normal individuals
2

because only a small amount of insulin is needed to inhibit lipolysis in adipose tissue (Espinal, 1989)
NIDDM usually develops after 35 years of age and most diabetics of this type
are obese, and the hormone is often present in plasma at near-normal or even above-
normal levels, and therapy often does not require administration of insulin (Luciano,
1990). Indeed, the presence of insulin and the ability of sulphonylureas to evoke release
of the hormone are indicative of NIDDM. Because only a small amount of insulin is
needed to prevent ketone body formation, the non-insulin-dependent diabetic rarely develops ketosis. In some cases of NIDDM the plasma insulin concentrations are
actually higher than normal due to hyporesponsiveness to insulin, termed insulin
resistance. This is explained by the fact that the target cells are relatively insensitive to
the hormone. In such resistant cells, a higher concentration of insulin is needed to elicit
a response than in normal cells. In some cases of insulin resistance the concentration of insulin receptors appears to be decreased (Home, 1989).
The sequence of events coupling obesity to a diminished number of insulin
receptors is shown (Figure 1.1). Because insulin secretion is increased during food
absorption, any person diabetic or not who chronically overeats secretes, an average, increased amounts of insulin. Over time, the resulting elevation of plasma insulin induces
a reduction in the number of insulin receptors. Thus insulin itself is responsible for the
decrease in target-cell responsiveness (insulin resistance), producing a higher plasma
glucose concentration at any given plasma insulin level. The tendency toward a higher
plasma glucose concentration is small in non-diabetic overeaters because the islet cells
respond by secreting enough additional insulin to get the job done despite the reduction in available receptors. In contrast, the diabetes-prone person may also secrete additional
insulin but not enough to prevent significant hyperglycaemia
Diabetic coma is rarely seen in non-insulin-dependent diabetics, presumably
because their endogenous insulin prevents ketosis. However, a related condition,
referred to as hyperosmolar coma, can occur. It is most often observed in elderly
individuals and is usually preceded by an illness or other stressful situation that increases
the requirement for insulin. Under these circumstances, the insulin present becomes
insufficient to prevent glucosuria and excess water loss leading to a hyperosmolar
plasma.
3

EXCESSIVE OBESITY OOD INTAKE
TPLASMA GLUCOSE
Islet beta-cells TINSUUH SECRETI®N
PLASMA INSULIN
-rGL000SE UPTAKE --- -- ;
', 'INSULIN RECEPTORS (DOWN REGULATION)
''CELL RESPONSIVENESS TO INSULIN -- --!
(INSULIN RESISTANCE)
Figure 1.1 Postulated mechanisms by which chronic overeating leads to chronically elevated plasma insulin and diminished cell responsiveness to insulin (Luciano, 1986).
4

Fluid loss is compounded when vomiting is associated with the precipitating illness. As dehydration become severe, urinary output decreases in spite of the high
urinary levels of glucose. Thus renal excretion of glucose falls, and blood sugar and
serum osmolarity increase to extremely high levels, leading to loss of consciousness. Like diabetic coma, hyperosmolar coma is life threatening and is a particular grave
condition in older diabetics, who may already have compromised cardiovascular function (Joslin, 1989).
Diabetes mellitus therefore affects protein, lipid and carbohydrate metabolism
and reflects a state of impaired insulin function. The net effect of insulin in the body is to increase metabolic energy store by promoting the storage of protein, lipid and
carbohydrates (Ganong, 1989). Thus when insulin function is impaired, hyperglycaemia
results from the reduction in glucose uptake and increased rate of gluconeogenesis and hyperlipidaemia results from increased lipase activity and reduced deposition of
triglycerides. It is these dysfunctions that produce much of the pathology associated
with diabetes mellitus. Diabetics are 25 times more prone to blindness, suffer from an increased risk of myocardial infarction and increased incidence of peripheral vascular disease such as gangrene. They are also more prone to renal failure and to peripheral
neuropathy than non-diabetics.
1.2 Treatments of Diabetes Mellitus :
Type 1 (IDDM) diabetics lack insulin and their treatment is hormone
replacement therapy with insulin. Type 2 (NIDDM) diabetics, however; often do not
respond to insulin and require alternative drugs if dietary control is insufficient.
There are two main classes of oral hypoglycaemic drugs, the sulphonylureas
such as tolbutamide and glibenclamide, and the biguanides such as phenformin and
metformin. Tolbutamide and phenformin were introduced in clinical practice in 1954,
and 1957 respectively. Tolbutamide is still widely used though phenformin has been
withdrawn since 1982 as a result of the risk of lactic acidosis, (Oates el a! 1981).
However metformin which belongs to the same class as phenformin is the drug of
choice in the therapy of obese NIDDM diabetes. The use of sulphonylureas, the other
S

class of hypoglycaemic agents, is also not without its problems and side effects. They
have adverse effects including coma (Ferner and Neil, 1988) particularly in the elderly
and patient with impaired hepatic or renal function who are taking longer acting
sulfonylureas.
Sulfonylureas and metformin are valuable treatments for hyperglycaemia in
NIDDM, but they are often unable to lower glucose concentrations to within the normal
range, or to reinstate a normal pattern of glucose homeostasis (Lebovitz, 1985; Bailey
& Nattrass, 1988). Even insulin therapy does not reinstate a normal pattern of glucose homeostasis in most NIDDM patients, and over vigorous insulin treatment may carry an increased risk of atherogenesis and hypoglycaemia (Peacock & Tattarsall, 1984 ).
As a result of these numerous side effects of oral hypoglycaemic drugs, there has
been an increase in research of other potential oral hypoglycaemics and renewed for
attention to alternative medicines and natural therapies. This has stimulated a new wave
of research in traditional practices and the World Health Organization Expert
Committee on Diabetes has listed these as one of the treatment for diabetes which
should be further investigated (Watt & Wood, 1988; WHO Expert Committee, 1980).
Traditional oral hypoglycaemic plants might provide a useful source of new oral hypoglycaemic compounds for development as pharmaceutical entities, or as simple dietary adjuncts to existing therapies. The known use of plants for diabetes dates from
the Ebers papyrus of about 1550BC and many traditional plant treatments for diabetes
are used throughout the world (Bailey & Day, 1989). After the introduction of insulin
therapy, the use of traditional treatments for diabetes greatly declined in societies,
although some plant extracts are still used as prophylactics and adjuncts to conventional
medicine.
For this purpose the natives of Libya use a hot water decoction made from the
whole plants, Artemisia Juidaic , Anvillea carcinii and Marnubizmt umgare. There
appears to be no documented reports on the antidiabetic activity of Artemisia judaica,
Marrubium vulgare, and Anvillea carcinii, although there is a report on Artemisia
abyssinia which indicates that it has hypoglycemic activity (Mossa, 1985). Extracts of
Artemisia judaica have been shown to have effects on the heart (digitalis-like) (Gala el
al., 1974) and on the isolated guinea-pig ileum (Abdalla & Zarga 1987). Arlemisia
herba alba has also been used by the local populations of some Middle East countries as
6

an anthelminthic (Khaffagy et at, 1988), and also it has antidiabetic (Husni & Al-Badr,
1988, Farjou et at, 1987,1988, Al-Kazraji cat crl., 1993) and antibacterial (Hussein-
Ayuob 1990) actions. In 1986, Abdalla, found a parasympathomimetic compound in a
crude extract of Arlemisia judaica which stimulated muscarinic receptors and also
certain anticancer agents have been found (Alwan et at, 1989). Artemisinin, santonin, judaicin, and cirsimaritin have been isolated from Artenrisia sp (Khaffagy & Tosson,
1968).
In this study the anti-diabetic properties of the plants Artemisia judaica,
Anvillea carcinii and Marrubirmr vulgare L are investigated. These plants will be
discussed in detail later. It is the aim of the project to validate scientifically the use of
these plants in the treatment of diabetes. These plants have been used successfully in the
treatments of diabetes in Libya as well as other Arabic speaking countries but they have
not received much in the way of medical or scientific scrutiny.
1.3 Glycogen Phosphorylase
1.3.1 Function and Regulation:
Glycogen phosphorylase plays a central role in the mobilization of carbohydrate
in a wide variety of organisms including bacteria, fungi, plants and insects. It catalyses
the first step of the intracellular degradation of glycogen, where inorganic phosphate
(Pi) is used in the cleavage of an [al-+4] glucosidic bond to yield glucose I-phosphate
according to the equation.
(a-1,4-glucoside)n + P144(a-1,4-glucose),, _ j+ a-D-glucose 1-phosphate
(G1c1P)
Glycogen phosphorylase catalyses both the forward and the reverse reaction. Under in-
vivo conditions the phosphate concentration is usually so high that the catalyzed
reaction is in the direction of glycogen degradation.
7

Glycogen phosphorylase can exist in two forms, a and b. Inactive phosphorylase b can be activated in two ways, namely (a) by covalent alteration through phosphorylation of ser-14 at its terminal tail (giving glycogen phosphorylase a ; GPHa) in response to hormone and neural signals, and (b) allosteric binding to the activator AMP.
1.3.2 Role of Insulin and Glucagon in control of glycogen metabolism:
In the transition between the fed state and periods of short fasting, the net hepatic glucose output is determined by the reciprocal activities of glycogen synthase and glycogen phosphorylase. The regulation of the activation and inactivation of both of these enzymes has been the object of intense investigation, particularly with regard to the roles of various hormones, including insulin and glucagon.
Insulin has also been implicated as a major regulator of hepatic glucose output. Hers (1976) demonstrated that in the isolated perfused liver, insulin acts to decrease
hepatic glucose output. Miller and Larner (1973) have reported that insulin acts to
promote glycogen synthesis by a direct activation of glycogen synthase. Witters el al. (1978) found that both glucose and insulin are major regulators of hepatic glycogen
synthase and glycogen phosphorylase in hepatocytes isolated from fed rats. In 1967,
Bishop et al. demonstrated that insulin administered iii-vivo activates dog liver glycogen
synthase and inactivates phosphorylase. Glucagon reverses these changes. Several studies have suggested that control of glycogen metabolism in liver is
regulated by a cascade enzyme system that is similar to the one already established in
skeletal muscle (Krebs, 1962; Hers, 1961). Glucagon stimulates the formation of active
phosphorylase a (Sutherland & Robinson, 1951) and converts glycogen synthase from
an active form into an inactive form (Stalman & Hers, 1971). Insulin on the other hand,
converts glycogen synthase from an inactive form into an active form, both in-vivo and in-vitro (Bishop & Larner, 1967; Kreutner & Goldberg, 1967; DeWulf & Hers, 1968).
There is general agreement that insulin antagonizes the effect of glucagon on glycogen
metabolism (Beesj et al., 1995). Miller and Larner (1973) concluded, after examining the effect of insulin on hepatic glycogen synthase by use of either diabetic or glucagon-
stimulated normal rats, that insulin increases the formation of glycogen synthase with a
8

concomitant decrease in cyclic AMP-dependent glycogen synthase kinase activity. Insulin appears to interfere with glucagon action by reducing the elevated levels of
cAMP (Blackmore et al 1979).
1.4 Pancreatic Hormones:
1.4.1 Insulin:
An increase in blood glucose signals the release of insulin from the beta cells of
the pancreas. Insulin circulates in the blood, serving as first messenger to inform several
tissues that excess glucose is present. Insulin receptors, located on the plasma
membranes of insulin-responsive cells, respond to insulin binding by producing
secondary messengers that mediate insulin action and promote glucose use within these
tissues. The pancreas responds to a decrease in blood glucose with less release of insulin
but greater release of glucagon (Harris, 1992). Insulin increases glucose utilization rates in part by promoting glycogenesis and inhibiting glycogenolysis in liver (Figure 1.2).
Insulin promotes glycogen accumulation in liver by activating glycogen synthase and inactivating glycogen phosphorylase (Harris, 1992). Insulin is known to inhibit glycogen
breakdown by decreasing the activity of glycogen phosphorylase a (van de Werve &
Jeanrenaud, 1987).
1.4.1.1 Mechanism of action of insulin
The enzymatic pathway involved in glycogen synthesis and breakdown has been
characterized in most mammalian tissues. Glycogen synthesis in liver is, at least
partially, controlled by the activity of glycogen synthase, the enzyme responsible for
catalyzing the incorporation of glucose, via uridine diphosphoglucose, into glycogen
(Letoir & Cardini, 1957). The effect of insulin is to promote the activation of glycogen
synthase from a glucose-6-P-dependent to a glucose-6-P-independent form. Witter el
al. (1978) have reported that insulin acts to promote glycogen synthesis by a direct
9

activation of glycogen synthase (Figure 1.2). It has become widely accepted that insulin
promotes the arrest of glycogenolysis and the deposition of glycogen in the liver. A
partial inactivation of glycogen phosphorylase has been observed, although inconsistently, in anaesthetized rats (Stalmans el al., 1974) and much more
systematically in rhesus monkeys (Curnow el al., 1975 ).
Thus by measurement of glycogen alone, it appears that the current concepts of insulin action at the biochemical level are unable to explain all of the effects observed In-
vivo. Insulin could act by lowering the hepatic concentration of cyclic AMP. Such an
effect can be readily demonstrated with isolated liver preparations when the
concentration of the nucleotide has, been previously increased by glucagon or adrenaline (Exton el al., 1971). Whereas the inactivation of phosphorylase was a constant feature
following the administration of insulin, the activation of glycogen synthase occurred
only occasionally. The activation of synthase was only observed when phosphorylase
activity had reached a very low value (Stalmans e1 al., 1975). The activity of glycogen
phosphorylase and synthase is controlled to a great extent by phosphorylation, which in
turn is catalysed by the cAMP-dependent protein kinase (protein kinase A). Thus
changes in the level of cAMP by insulin may have a marked effect on the activity of the
glycogen phosphorylase and synthase. The same pattern of reciprocal changes in
phosphorylase and synthase has been noted in a study with anaesthetized mice treated
with glucose (Stalmans. et al., 1974). Insulin has also been implicated as a major
regulator of hepatic glucose output. The studies of Witter & Avrub (1978)
demonstrated that, in the isolated perfused liver, insulin acts to decrease hepatic glucose
output. Glycogen phosphorylase activity may, therefore, be a better measure for
insulin-like activity than glycogen synthase or glycogen concentration alone.
1.4.2 Glucagon
Even though insulin plays a central role in controlling the metabolic adjustments
between the absorptive and post-absorptive states, the secreted product of pancreatic
islet A-cells, glucagon, is also very important. It seems that glucagon secreting A-cells
and insulin secreting ß-cells, as a coupled endocrine system, is a major factor in the
regulation of fuel metabolites.
10

Inulin Insulin receptor-,
Insulin secondary Messenger"
Glycogen
UDP-g ucose
Gluc se 1-P
Gluc se 6-P
Glucose
Glucose
Figure 1.2 Insulin acts via secondary mediators of its action to inhibit glycogenolysis and promote glycogen synthesis in liver (adapted from Harris, 1992).
11

Glucagon has many effects on the same metabolic processes that are influenced by
insulin. It has the opposite effect to insulin and again the liver is the major site of action
of glucagon.
1.4.2.1 Mechanism of action of glucagon
Glucagon is released from the A-cells of the pancreas in response to low glucose
levels in the blood. One of glucagon's primary jobs during periods of low food intake
(fasting or starvation) is to mobilize liver glycogen, that is, stimulate glycogenolysis, in
order to ensure that adequate blood glucose is available to meet the needs of glucose-
dependent tissues. Glucagon circulates in the blood until it interacts with glucagon
receptors such as those located on the plasma membrane of liver cells (Figure 1.3).
Binding of glucagon to these receptors activates adenylate cyclase and triggers the
cascades that result in activation of glycogen phosphorylase and inactivation of
glycogen synthase (Harris, 1992).
1.5 Cytochrome P-450:
Cytochrome P-450 initially was reported in 1958 by Klingenberg & Garfinkel.
They noticed the presence of a carbon monoxide-binding pigment in rat liver
microsomes. The pigment displayed a maximal absorbance at a wavelength of 450 nm
upon bubbling carbon monoxide into a dithionite reduced rat liver microsomal
suspension and thus, it was called P(pigment)-450. In 1964 Omura & Sato published
spectral evidence that this pigment was a haemoprotein, a new b-type cytochrome.
Cytochrome P-450 plays an important role in the metabolism of endogenous substrates,
as well as exogenous xenobiotics. The biological effectiveness is responsible for the
hydroxylation or oxidative dealkylation of various drugs by liver microsomes (Cooper et
al.. 1965).
The cytochromes P-450 are a group of haemoproteins and are located in almost
every tissue, and in many subcellular membrane fractions including the
12

Glucagon Glucagon
cAMP
Glycogen
UDP-glucose
Gluc se 1-P
O Pyr vateGluc se 6-P
FAT Glukose
Glucose
Figure 1.3 Glucagon acts via secondary mediators of its action to activate glycogenolysis and inhibit glycogen synthesis in liver ( adapted from Harris, 1992)
13

endoplasmic reticulum (Brodie et al., 1955) and the mitochondria of the adrenal gland (Harding et al., 1964).
In mammals, cytochrome P-450 is found at varying concentration in microsomes from liver, kidney, small intestine, lung, adrenal cortex, skin, testis, placenta, and other
tissues (Omura & Sato 1964). The parenchymal cells of liver (hepatocytes) contain the
highest concentration of cytochrome P-450 although it has also been demonstrated that
the non parenchymal cells of the liver also have the capacity, though lower than the
parenchymal cells, to metabolize a wide range of drugs and chemicals (Steinberg et al., 1976). Hepatocytes contain different constitutive forms of cytochrome P. 450, some of
these forms of cytochrome P-450 varying in content on challenge of the animal with
xenobiotics. Other forms appear to respond to homeostatic control signals varying with
conditions in the body, from developmental changes to sexual development, and in
response to pathophysiological conditions such as starvation, diabetes and hypertension.
These changes all result in differential abilities of the animal to metabolize drug and
xenobiotic chemicals as well as endogenous compounds such as fatty acids and steroids
(Schenkman, 1990). The cytochrome P-450 mono-oxygenases play a central role in the
biotransformation of xenobiotics (including drugs, insecticides, pesticides, food
additives, products in smoke and pyrolysis products produced by cooking) into more
water soluble products that permit detoxication and removal from the body and
metabolism of certain xenobiotics such as benzene, acetoaminophen, halothane and
nitrosamines, to more reactive products that are toxic and / or carcinogenic (Defeng et
at, 1993).
The finding of the successful stabilization of cytochrome P-450 by glycerol
(Ichikawa & Yamano, 1967) permitted solubilization and purification experiments on
cytochrome P-450 leading to the understanding that there is a large family of these
proteins with different substrate specificity. The metabolism of xenobiotics is affected by
many factors (Paine, 1981, Gibson & Skett, 1994), one of them being hormones. It has
been established that the alteration in drug and steroid metabolism may be attributed to
endocrinological disorders and the pancreas is one whose secretions affect xenobiotic
metabolism.
14

Insulin and glucagon secreted by the islets of Langerhans in the pancreas have
been demonstrated to affect xenobiotic metabolism in experimental animals (see next section).
1.5.1 Liver, Cytochrome P-450 and Diabetes Mellitus:
The first report suggesting that diabetes mellitus may affect drug metabolism (Dixon et at, 1963) showed an overall decreased hepatic microsomal metabolism following acute treatment with the ß-cell toxin, alloxan, and that this effect was
suppressed by insulin. It was reported that activities of drug-metabolizing enzymes in
liver microsomes, such as hexobarbitone hydroxylation were markedly decreased by
alloxan-induced diabetes in male rats. A later study by Kato et at, (1971) demonstrated
that the magnitude of the difference spectum of cytochrome P-450 induced by
hexobarbital and aminopyrine was markedly decreased in male but not in female alloxan-
treated rats. This suggests that the binding capacities of cytochrome P-450 for
hexobarbital and aminopyrine, which are normally stimulated by androgen (Schenkman
et al., 1990) are decreased in the microsomes of diabetic male rats but not in female rats
and this was confirmed by other workers (Kato & Gillette, 1965; Weiner et al, 1972 ).
However, studies have shown that diabetes produces an increase in the hepatic levels of
cytochrome P-450 2E1, responsible for the increase in the microsomal metabolism of
aniline in rats (Favreau & Shenkman 1987) which means the effect of diabetes is not
always to decrease drug metabolism as documented by Dixon et al., (1963). There is an increase in the oxidation of aniline which is known to be an effective substrate for
cytochrome P-4502E1 (Defeng et at, 1993). Although the microsomal metabolism of
androgenic hormones, testosterone and androst-4-ene-3,17-dione, has been studied in
several laboratories. (Conney et al., 1973 Einarsson el al., 1974), Reinke et al. (1978)
were the first to report alterations in hepatic steroid metabolism in streptozotocin-
diabetic male rats. The diabetic state resulted in an overall decrease in the rate of
microsomal metabolism of androst-4-ene-3,17-d ione compared to the control. This was
confirmed by Skett et al. (1980). Changes in androst-4-ene-3,17-dione metabolism can be reversed by insulin treatment. If insulin action on steroid metabolism is investigated
in isolated hepatocytes, it is found that steroid metabolism is increased by insulin
15

(Hussin & Skett, 1987). Metabolism of androst-4-ene-3,17-dione metabolism can, thus, be used a measure of insulin-like activity.
1.6 Plants used as herbal treatment:
1.6.1 ARTEMISIA JUDAICA (Family Compositae)
The desert plant Artemisia judaica L. is widely used in folk medicine in the
Arabian region especially in Libya. It is commonly known by the Arabic name'Shih' and is a popular folk remedy for the treatment of diabetes mellitus in Libya. It is a genus of
aromatic and bitter plants of the family Compositae. About 400 species have been
cultivated or used by man. It is a genus with alleviating properties for gastrointestinal
colics, diarrhoea and gastrointestinal disorders and it is a popular medicine in use for a long time to treat diabetic symptoms and is sold in many markets in Tripoli, Libya.
Other uses for this plant have also been reported (Khafagy & Tosson, 1968). It has a
protective effect against carbon tetrachloride-induced hepatotoxicity (Kiso et al., 1984).
Judaicin and cirsimaritin were isolated from Arkmisia judaica (Abdalla & Zarga, 1987,
Khafagy & Tosson, 1968). Artemisia sp. is also known to be used by local populations
as an anthelminthic (Khafagy e1 al., 1971). It has been found to have anti-
arteriosclerosis & anti-thrombosis effects (Kaji el al., 1990). Judaicin is a new
sesquiterpene ketolactone, recently found to have a cardiotonic effect which did not deviate from the general frame of digitoxin action (Khafagy et a/., 1976).
Some of the biological effects of cirsimaritin have been studied besides its
antiviral and antibacterial activities, cirsimaritin has been shown to inhibit beef heart
cyclic AMP phosphodiesterase, but no information is available on the biological effects
of cirsimaritin at the tissue level (Abdalla, & Zarga, 1987).
1.6.2 AN117LLEA CARCINI (Family. Compositae)
Anvillea carcinlii is a woody desert plant with the aspect of Aslericus
graveolvns. It contain hydroxyparthenelide, astriseinolide, kaempferol and quericitine
(Elgadi, 1989). but no scientific work has been done on the pharmacology of this plant.
16

1.6.3 MARRUBIUM VULGARE L (Family. Labiatae)
The genus Marrrubium is represented by 97 species which are widely spread over the temperate and warm regions. Two species have been identified namely, Marrubium
alysson and Marrubium vulgar. Many Marrribiurn species are reported in the literature
to be used in folk medicine (Watt, 1962 ). It is used in the form of a decoction as a
remedy for diabetes, anaemia and as a diuretic. Marrubium sp. contain marrubiin, tannin, resin, volatile oil, and vitamins (Elgadi, 1990). In north Africa, the tops are used
as a flavouring agent (Lewis, 1977 ).
1.7 Experimental Models of Diabetes mellitus:
Insulin-dependent diabetes is a pathological state that affects endogenous
metabolism and also the pathways of metabolism and disposition of drugs as discussed
above. Chemical compounds that specifically damage the pancreatic islet ß-cells
constitute a class of diabetogenic agents. Among such compounds, alloxan and
streptozotocin exhibit this characteristic and are widely used to induce experimental diabetes, which closely resembles insulin-dependent diabetes mellitus (Agrawal, 1995).
The earlier extensive use of alloxan has more recently been replaced by the
streptozotocin-induced diabetes model because streptozotocin is a more selective ß-cell
toxin (Hoftiezer and Carpenter, 1973) and because its effect on the liver has been shown
to be due to its diabetogenic action since treatment with insulin could reverse the effects
seen (Favreau and Schenkman, 1987). On the other hand, alloxan has been criticized for
its overt toxicity (Hoftiezer and Carpenter 1973) which indicates that this may not be a
good model of diabetes. The dose of STZ which was used was 65mg/kg because it has
previously been shown in this laboratory to induce hyperglycaemia and hyperlipidaemia
in adult rats (Skett, 1986).
Selecting an appropriate model for testing the anti-hyperglycaemic effects of drugs is complicated by the heterogeneity of the diabetic condition and the fact that no
17

single model is entirely representative of a particular type of human diabetes (Bailey &
Flatt, 1990).
Diabetes mellitus could be induced in experimental animals by administering to
the animals streptozotocin. STZ is transported into pancreatic beta-cells through
glucose transporters in the cell membranes and attacks mitochondria. Mitochondrial
ATP generation is inhibited and the resulting high concentration of intracellular ADP
causes its degradation providing hypoxanthine, a substrate of xanthine oxidase (XOD)
whose activity is intrinsically very high in the beta-cell. The XOD-catalyzed reaction
produces uric acid and oxygen radicals, but beta-cells are inefficient in scavenging these
radicals because of their extremely low activity of superoxide dismutase. On the other hand, STZ directly activates XOD and enhances oxygen radical generation.
Consequently, the pancreatic B-cells are subjected to a high concentration of oxygen
radicals when exposed to STZ (Kawad, 1992) and, thus, leading to cellular toxicity. The
STZ-diabetic rat model was, thus chosen to represent typel diabetes mellitus.
18

1.8 Aims of the Project:
1- In 1988, Hussin et al., showed the role of insulin in the regulation of hepatic
steroid and drug metabolism. It was found that addition of insulin to cultures of adult rat hepatocytes caused a general increase in the steroid metabolizing activity of the cells. We wished to use this as a test system for the possible insulin-like effects of extracts of Artemisia judaica, Marrubium vulgar, & Auvillea carcinü. We also wished to examine if extracts of Artemisia judaica, Marnibium, & Anvillca can enhance insulin action on isolated liver cells. If we could demonstrate such effects we would continue by trying to
purify the active ingredients from the extracts.
2- To examine the effects of Arlc'misia judaica, Anvilk'a carcinil L. and Marrubiunm vtilgare on some hepatic functions that are responsible for regulating
glucose output. In particular, we wish to examine the ability of Arlemisia jrudaica,
Anvillea carcinü L. and Marrtibium vulgare to mimic insulin and attenuate glucagon
action on the liver by measuring the activity of glycogen phosphorylase a in normal and diabetic rat hepatocytes.
3- To test the effects of Artemis/a juduica extract in normal and diabetic rats in-vivo by giving it in their drinking water on diabetic related parameters i. e. body
weight, food intake, water intake, urine production, faeces production and urinary
glucose concentration.
4- To investigate the effects of Arlenri. sicr judaica on internal parameters (e. g liver weight, liver protein content, enzymatic activities of cytochrome P-450 and liver
microsomal metabolism of androst-4-ene-3,17-dione.
5- To investigate the effects of Arlemisia judaicn extract on blood glucose in
non-insulin-dependent and insulin-dependent diabetic patients, and any potential side
effects.
19

METHODS AND MATERIALS

2. MATERIALS AND METHODS 2.1 Preparation of Artemisia judaica extract
Artemisia judaica was collected in the spring from the Huon desert region of Libya and air-dried before transport to Glasgow. A voucher specimen of the plant was identified by Dr. J. H. Dickson, Department of Botany, University of Glasgow. The dried
whole plant was kept in the dark in dry conditions until extracted. Marrubium vulgare
and Anvillea carcinii were bought from markets in Libya and a voucher specimen
similarly identified by Dr. Dickson.
2.1.1 Preparation of crude extract
The whole plant (aerial parts) was crushed in a grinding machine to a fine
powder and was kept in nylon bags at room temperature until used. The powder (100g)
was mixed with 500m1 of distilled water and allowed to extract overnight at room
temperature. The resultant dark green-brown mixture was filtered through filter paper (Whatman No. 1) and the filtrate was evaporated to dryness at 40°C under reduced
pressure in a Buchi Rotavapor-R rotary evaporator. The resultant brown powder
weighed 16g. The residue was redissolved in distilled water at a concentration of 0.2g/ml and kept frozen in lml aliquots at -20°C until required (see Figure 2.1)
This was termed the crude extract. The same method was used for the
preparation of the crude extracts ofMarrubiurn vulgar' and Aiwi lea carcinil.
2.1.2 Preparation of the aqueous and ethanolic extract ofArtemisia judaica
The dried crude extract (14g), produced as above, was mixed with absolute
ethanol ( 80 ml) and allowed to stand overnight in a dark place. The resultant light
green-brown mixture was then filtered and the filtrate was evaporated to dryness at
40°C under reduced pressure. 2g of dry material was found and redissloved in absolute
20

Powdered material (100 g)
(i) Extract with 500 ml d. H20 overnight (ii) Filter
Plant residue Crude extract Evaporate in
vacuo, 40 °C
Dry Extract Redissolved at (0.2g/ml)(crude extract)
Extract with ethanol
Solution Residue
Evaporated & redissolve at
0.2g/ml ethanol
Redissolve at (0.2g/ml) dist. water
Ethanolic extract Aqueous extract
Figure 2.1 Extraction procedure for Arrlemisia jlidaica (Crude, Aqueous and ethanolic)
21

ethanol (0.2g/ml). This was termed the "ethanolic extract". The residue from the
extraction was redissolved in distilled water (0.2g ml ) (Figure 2.1).
2.2 IN VIVO STUDIES
2.2.1 EXPERIMENTAL ANIMALS
Mature male Wistar rats of approximately 250g were used throughout the study. The animals were bred in the department and housed in light (lights on 0800-2000hrs)
and temperature (19°C ± 1°C) controlled conditions. The animals had free access to food (CRM Nuts, Labsure, Croyden) and tap water throughout the experiments except
where noted.
2.2.2 Induction of diabetes mellitus
Diabetes mellitus could be induced in experimental animals by administering to the animals streptozotocin (STZ). It is considered that STZ may provide a better model for type 1 (insulin-dependent) diabetes than alloxan because of its more selective beta-
cell toxicity (Hoftiezer & Carpenter, 1973). Since STZ is unstable in solution, it was dissolved in distilled water (at 65mg/ml. ) immediately before use and then injected
intravenously (65mg/kg) into the tail vein of the rat under halothane/nitrous oxide
anaesthesia. The animals were replaced in ordinary cages and left for three days for
recovery and development of the symptoms of diabetes mellitus before use.
2.2.3 METABOLIC CAGES
The metabolism cages were supplied by Jencons of Hemel Hempstead and were
of glass construction with wire mesh floor and roof. The cages were set-up in the animal house to keep the animals in the same light and temperature conditions that they were
previously accustomed to. The cage design allows the animals easy access to measured
quantities of food and fluid with a facility to collect any crumbs or drips to allow
22

accurate measurement of the animals' consumption. The wire floor allows faeces to fall
throughout the living area to facilitate collection. Urine either falls or is deflected onto the walls of the chamber below the living area, and runs down the glass to be collected in a flask. Each cage was initially provided with l00g of food and 100mis of water
which were refreshed and replenished as required.
2.2.4 EXPERIMENTAL PROCEDURES
Normal, healthy male rats or rats made diabetic by treatment with STZ as described above were used in experiments lasting up to 27 days in total. At no time
were animals in the metabolic cages for more than 7 days continuously. The actual
experimental protocols are outlined in Figures 2.2 - 2.4. Each animal acted as its own
control being tested as control, after induction of diabetes (if appropriate) and after
treatment with the respective extracts.
2.2.5 Experimental protocol:
Every 24 hours the following parameters were measured:
1. Body weight 2. Food intake
3. Fluid intake
4. Urine volume 5. Faeces weight
A urine sample was collected and frozen until assayed for glucose and ketones
as described later.
The animals were removed from their cages for a period not exceeding 5
minutes to facilitate collection and measurement of the required parameters. Although
the animals did urinate and defaecate during this period the quantities involved were not
significant compared to the daily collection.
23

2.2.6 Normal rat treated with Artemisia (17 Day experimental run ):
Animals were weighed ( starting weight: 250-300g) and placed in the metabolic cages. The animals were allowed a 24hr run-in period to adjust to their new surroundings after which the experimental run began. Each animal was then tested under control conditions for 7 days. The animal was then removed from the metabolic cage and allowed to recover for 3 days in an ordinary animal cage. On day 11 (for animals 1-3) or day 7 (for animals 4-9) animals were supplied with the
plant extract as a decoction in their drinking water - 5ml of Arlemisia crude extract as
prepared above in 200m1 tap water (Figure 2.2).
2.2.7 Diabetic rat (17 Day experimental run):
The animals were selected and run as controls in the metabolic cages for 7 days
to ensure they exhibited a normal pattern of measured parameters. Diabetes mellitus was induced on day 7 by administration of STZ as described in Section 2.2.2, after which the
animals were kept for three days in a conventional cage to allow recovery and onset of diabetes. On day 11 the animals were replaced in the metabolic cages and the
experiment continued for a further 7 days (Figure 2.3).
2.2.8 Diabetic rats treated with Artemisia extract (27 day experimental
run):
The animals were selected and run as controls in the metabolic cages for 7 days
to ensure they exhibited a normal pattern of measured parameters. Diabetes mellitus was
induced on day 8 by administration of STZ as described above, after which the animals
were kept for three days in a conventional cage to allow recovery and onset of diabetes.
On day 11 the animals were replaced in the metabolic cages and the experiment
continued for a further 7 days. The animals were removed from the metabolic cage and
24

Metabolic cage
7days
Ordinary cage
3 days
Treatment begun
Liver
Assay
Metabolic cage
(1) (2)
(1) = Protein content
(3)
(2) = Cytochrome P-450 content
(3) = Aniline 4-hydroxylase metabolism
(4) = Aminopyrine N-demethylase metabolism
(5) = Androst-4-ene-3,17-dione metabolism
(4)
Figure 2.2 Normal rat treated with Artemisici extract (10 days).
(5)
25

Metabolic cage
7days
STZ
Ordinary cage
3 days
Metabolic cage
Liver
As
1 say
(1) (2)
(1) = Protein content
(3)
(2)=Cytochrome P-450 content
(3) = Aniline 4-hydroxylase metabolism
(4) = Aminopyrine N-demethylase metabolism
(5) = Androst-4-ene-3,17-di one metabolism
Figure 2.3 Diabetic rat without treatment (10 days).
(4) (s)
26

Metabolic cage 1 Ordinary cage
7days 3 days
STZ
Metabolic cage Ordinaiy cage Metabolic cage
7 days 3 days 7 days
Treatment begun
Animal _ sacrificed
Liver
Assay
I
(1) (2)
(1) = Protein content
(3) (4) (s)
(2)=Cytochrome P-450 content
(3) = Androst-4-ene-3,17-dione metabolism
(4) = Aniline 4-hydroxylase metabolism
(5) = Aminopyrine N-demethylase metabolism
Figure 2.4 Diabetic rat treated with Artemisia extract (10 days).
27

kept in a conventional cage for 3 days during which time they were treated with
Artemisia extract (concentration as given above). The bitter taste of Artemisia extract
meant that the animals did not drink it, so, in these cases, a more dilute solution was
used for day 19, (1 or 2ml of Artemisia extract in 200m1 of tap water) followed by a
more concentrated solution on day 20 (2.5 or 3m1 of Artemisia extract in 200m1 tap
water) and then to the normal concentration of extract on day 21 and on day 21 the
animals were returned to the metabolic cage for a final period of 7 days (Figure 2.4).
2.3 Assays
2.3.1 Glucose Assay
Urine samples were assayed for glucose using the assay kit supplied by the
Sigma Chemical Co. Ltd. which is based on a procedure similar to that described by
Carrol, et a!., (1970) based on the following reactions:
Hexokinase
Glucose + ATP -> G-6-P + ADP
G-6-PDH
G-6-P + NADP+ -*
NADPH + PMS ->
6-PG + NADPH
NADP++ PMSH
PMSH + INT -+ PMS+INTH
The analysis is based on the hexokinase (1-1K) catalyzed conversion of glucose to
glucose-6-phosphate (G-6"P). This reaction is coupled to the subsequent reduction of
28

nicotinamide adenine dinucleotide phosphate (NADP) to NADPH by the action of
glucose-6-phosphate dehydrogenase (G-6-PDH). In the presence of NADPH, phenazine
methosulphate (PMS) is reduced. The PMSH generated is then responsible for the
reduction of iodonitrotetrazolium chloride (INT) forming INTH, which is measured
colourimetrically at 520nm. The colourimetric response is proportional to the glucose
concentration. The absorbance of the sample was thus measured at 520nm in a
Shimadazu UV-240 spectrophotometer and the glucose concentration calculated from
standards supplied by Sigma
2.3.2 Urine ketones and glucose
The presence of ketones in the urine was assayed using Keto-Diabur 5000 strips
supplied by Boehringer, Mannheim, Germany which produce a colour change in the
presence of ketones.
2.4 MEASUREMENT OF OTHER PARAMETERS
After the various treatments, described above, the animals were sacrificed by
carbon dioxide asphyxiation, and their necks were broken. Immediately after cervical dislocation, the throat was cut and blood was collected by using a 10ml syringe. 5ml of blood was transferred to a lithium heparin bottle containing 100µI of Trasylol. The livers
were quickly removed from the animal as soon as possible, rinsed in ice cold phosphate buffer (pH 7.4,0.01 M with 1.15% potassium chloride added) to remove any excess blood and other foreign material , blotted dry on filter paper and weighed. At the end of
each experiment, therefore, there was urine, blood and liver material to be assayed. The
urine was assayed for glucose and ketones (see section 2.3.2), the blood for insulin and
glucagon and the liver was assayed for protein content, cytochrome P-450 content,
29

activity and the metabolism of androst-4-ene-3,17-dione, aniline and aminopyrine. All of
these assays are described below.
2.4.1 Preparation of liver microsomes
In order to measure the liver parameters, subcellular fractions needed to be
prepared. It is essential to keep the liver as cool as possible and to get the microsomes
prepared and frozen as quickly as possible to prevent damage to the tissue and its
enzymes.
The liver was homogenized in five times its weight of phosphate buffer
containing 1.15% potassium chloride (see section 2.20.1), in a Potter-Elvehjem
homogenizer with a Teflon pestle (for 1g of liver use 5m1 of buffer). The homogenate
was then centrifuged in a Sorvall refrigerated centrifuge for 15 minutes at 12500xg to
sediment the mitochondria and nuclei. The post-mitochondrial supernatant then had
calcium chloride (1M) added to it to bring the supernatant to 8mM with respect to
calcium chloride (i. e. 0.1 ml of 1M calcium chloride (BDH Chemicals) for every 12.5 ml
of supernatant). The solution was then mixed and left to stand on ice for 5 minutes. The
supernatant was then centrifuged again this time at 28000xg for 20 minutes to sediment
out the microsomes. The supernatant was poured off and the pellet resuspended in the
phosphate buffer. For every 50 volumes of the original homogenate, the sediment was
resuspended in 20m1 buffer and 5nm1 glycerol. The microsomes were then frozen at about
-70°C. The microsomes were used to measure the hepatic parameters discussed above
and described in detail below. All assays have previously been tested for linearity with
respect to time and concentration of measured compound in the range used in this
study. Enzyme assays have also been previously tested to be within the linear range for
protein concentration.
30

2.4.2 Protein determination
The method described by Lowry et al (1951) was used to determine the protein
content of the microsomes. A sample of the prepared microsomes was diluted (1: 100)
with distilled water. A reagent was made by mixing 50 parts of 4% (weight / volume)
sodium carbonate dissolved in 0.1 N sodium hydroxide (Fisons), 1 part 1% (weight /
volume) potassium tartrate (BDH Chemicals) and 1 part 0.5% (weight / volume )
CuSO4. H20 (Glasgow University Chemistry Department). This reagent must be freshly
made as it only lasts 3-4 hours. 2ml of this reagent was then added to lml of diluted
microsomes, mixed and left to stand for 10 minutes. Then 0.3 ml of IN Folin Ciocalteu
reagent (BDH Chemicals) was added, mixed and allowed to stand for 30 minutes at
room temperature. A coloured complex was formed between the alkaline copper-phenol
reagent and tyrosine and tryptophan residue of the protein. The optical density at 750nm
was determined on a Shimadzu UV-240 spectrophotometer. A standard curve was also
prepared using 0.2 to I ml aliquots of crystalline bovine serum albumin (200pg/ml,
Sigma BSA fraction IV) made up to Iml with distilled water. By comparing the optical density of the sample to the standard curve, a measure of the protein content was
established.
2.4.3 CYTOCHROME P-450 ENZYME ACTIVITIES
2.4.3.1 ASSAY OF ANILINE 4-HYDROXYLASE ACTIVITY
This assay acts as a measure predominantly of the enzyme activity of
cytochrome P4502E1, (aniline is hydroxylated to 4-aminophenol ) as follows (Gibson &
Skett, 1994) (Figure 2.5).
31

NH2 NH2
O Cytochrome P450 NADPH, 02
OH
Figure 2.5 The hydroxylation of aniline
The following was added to each test tube :
Microsome preparation ................................................................ I ml 0. IM Magnesium Chloride (BDH Chemicals) ..............................
0.1 ml 0.5M Nicotinamide (Sigma Chemical Co. Ltd. ) .............................
0.1ml
Tris buffer pH 7.4 0.05M ....................................................... 0.59ml
0.05M Aniline (BDH Chemicals) ..................................................
0. lml
Co-factor mixture ........................................................................ 0.11 ml (to start reaction. see reagent section 2.20 at the end)
The above were incubated at 37°C for 30 minutes in a shaking water bath before
the reaction was stopped by adding 1 nil of 20% trichloroacetic acid (DDH Chemicals),
which precipitated the protein present in each incubation. This was mixed well and
allowed to stand for 5 minutes at 4°C. The precipitate was then spun down in a bench
centrifuge for 15 minutes. lml of the supernatant was then taken to be assayed for 4-
aminophenol. To the lml supernatant was added lml of 1% phenol in 0.5M sodium
hydroxide solution (Fison) and mixed with Inil of sodium carbonate (4% w/v) solution (Hopkin and Williams). The solution was then mixed and the resultant solution was left
to stand for 30 minutes at room temperature before the optical density was measured at 630nm in a Shimadzu UV240 spectrophotometer. The measurement obtained was
compared to the standard curve to find the concentration of 4-aminophenol formed per
minute per mg protein (see calculations in Section 2.11)
The standard curve was prepared by using 0.2 to lml aliquots of fresh 4-
aminophenol solution (10µM) (BDH Chemicals) made up to Iml with distilled water.
32

Again the optical density was measured at 630nm and a standard curve was drawn from
the values obtained.
2.4.3.2 ASSAY OF AMINOPYRINE N-DEMETHYLASE ACTIVITY
This assay is considered to act as a general measure of the enzyme activity of
cytochromes P450 of the 2B and 2C subfamilies. N-demethylation of drugs is a common metabolic pathway and is thought to
proceed by initial hydroxylation at the alpha-carbon atom and subsequent breakdown of
the carbinolamine intermediate liberating formaldehyde (Gibson & Skett, 1994) (Figure
2.6).
ý-ýH3 Oi CH3
CH3 CH3
Aminopyrine
Cytochrome P450
NADP, 02
/C-WH ý
CH3 CH3
Unstable carbinolamine
b- Chb
/N Ch + HCHO
CFA
Monomethyl-4-aminoantipyrine
Figure 2.6 N-Demethylation of aminopyrine.
Formaldehyd
33

The following were added to each test tube : Microsome preparation ............................................................................ 1.00ml
0. IM Magnesium chloride (BDH Chemicals) ............................................. 0.1Oml
0.5M Nicotinamide (Sigma Chemical Co. Ltd) ............................................ 0.1 Oml
450mM Semicarbazide (Sigma Chemical Co. Ltd. ) ..................................... 0.1 Oml
0.5M phosphate Buffer pH 7.4 .................................................................. 0.49m1
50mM Aminopyrine (Sigma Chemical Co. Ltd. ) ........................................ 0.1Oml
Co-factor Mixture ..................................................................................... 0.11 ml
(to start the reaction, see reagent section 2.20 at the end) The above mixture was incubated at 37°C for 30 minutes in a shaking water bath
before the reaction was stopped with 1ml 20% zinc sulphate (Hopkin and Williams),
which precipitates the protein present in each incubation. This was then mixed well and left for 5 minutes. lml of saturated barium hydroxide (Hopkin and Williams) solution
was then added to precipitate out the zinc sulfate. Again this was mixed and left to stand for 5 minutes. The precipitate was then spun down in a bench centrifuge for 15 minutes. 2m1 of the supernatant was added to 1 ml of Nash reagent (see reagent section 2.20.2)
for the assay of formaldehyde. The supernatant / Nash reagent mixture was incubated
for 30 minutes at 60°C in a water bath, using a glass marble to close the mouth of tube
to cut down on evaporation. The optical density was measured at 415nm against distilled water as 'a blank. The measurement obtained was compared to the standard
curve obtained using a standard formaldehyde solution to find the concentration of formaldehyde formed per minute per mg protein (see calculations in section 2.11)
2.4.3.3 ASSAY OF STEROID (ANDROST-4-ENE-3,17-DIONE) METABOLISM
The activity of several enzymes upon the substrate androst-4-ene-3,17-dione
was studied using a technique outlined by Berg and Gustafsson in 1973. These enzymes
being 7a-, 16a- and 60-hydroxylases, 17-oxosteroid oxidoreductase and 5a-reductase.
They act on the steroid substrate to produce the various products shown in (Figure 2.8
and 2.9). A co-factor mixture was prepared in the same way as that for the assay of
34

aniline 4-hydroxylase activity. It was preincubated at 37°C for 2 minutes to allow the formation of NADPH. 1.9ml of phosphate buffer pH 7.4,1 nil microsomes, 500µg of [4- 14C]-androst-4-ene-3,17-dione (containing 0.1 tCi, dissolved in 50µl of acetone) were then added and incubated in a shaking water bath at 37°C for 10 minutes. The
metabolites formed were extracted and quantitated as described later (see Section 2.16).
2.5 HUMAN STUDIES
2.5.1 Preparation of Artemisia judaica extract
500g ofAriemisia judaica containing stems and leaflets were added to 2 litres of
tap water and were boiled for a period of 30min. After cooling to room temperature the
extract was sieved to remove stems and leaflets and stored in a refrigerator (4°C). Each
patient drank a half glass (approx. I 00ml) each eight hours.
2.5.2 Subject Descriptions
Patient (1): was a man of 43 years with mild diabetes of 5 years duration. This patient had undergone therapy with Arlemisia jzidciira and Mari*ubiuni vu/gare with a
controlled diet for approximately three years. The patient was asked to stop the
treatment with Artemisia jridaica and Mari-iibiiun wilgctl-e extract for the period of the
study.
Patient (2): was a man of 20 years who had been treated with insulin injection (40 i. u.
once daily). The patient was then given Ar"lemisiu judo ica extract as described three
times daily together with the pre-existing insulin therapy.
Patient (3): was a man of 17 years. Since being a juvenile he had been treated with
plants extracts one of them being Aricmisia judaica. He had stopped using the
Artenzisia because when he took it lie suffered from bradycardia. He had asked the
35

doctor to replace his treatment with lente insulin injection. We asked the patient to use Artemisia judaica with insulin. The patient had polyuria, polydipsia and polyphagia with insulin treatment.
Patient (4): was a man aged 24 years with diabetes of one year duration, he was treated
with diet restriction and insulin ( 30 i. u. a. m. and 20 Lu. p. m. ). This was the first time he
had used Artemisia extract but he knew that the plant is widely used by diabetics.
Patient (5): was a woman of 55 years with diabetes mellitus of eight years duration, she
used hypoglycaemic agents and Artcinisia and other plants at some times. This patient
was asked to stop the use of these plants
Patient G: was a man of 60 years with mild diabetes of 20 years duration. He had used
this plant for a long time but at irregular intervals and he did not feel any side effects.
Some history was taken as described in the results section.
Z6 IN-VITRO EXPERIMENTS (ISOLATED HEPATOCYTES):
2.6.1 Preparation of isolated hepatocytes
Hepatocytes were isolated from male rats (weight 250 - 350 g) by the
collagenase perfusion method of Seglen (1976). The reservoir, kept at 45 °C by means
of a heated water jacket, was filled with Ca2+-free butler (see Section 2.21.1) which
was oxygenated with a slow flow of pure oxygen through the apparatus. The rat was
anaesthetised (4% halothane, 800 mUmin N20,800 ml/min 02 using a Mini Boyle
anaesthetic machine), the abdomen cut open and the portal vein freed of any fat. A
thread was inserted under the portal vein and was loosely tied. The cannula (size 20
GAX 32mm length) was inserted into the hepatic portal vein at a position just before the
vein branches into the liver and the thread tied tightly around the cannula. The needle
was removed from the plastic cannula and the blood was allowed to flow back up the
cannula. The inferior vena cava was cut to reduce back pressure on the liver and the
36

cannula was attached via a silicon rubber tube to a pump providing a continuous flow of
warmed buffer (37°C). The thorax was opened and the superior vena cava was cut close to the heart to further reduce back pressure on the liver (Figure 2.7). The Cat+- free
Krebs-Henseleit buffer was allowed to pass through the liver for at least 12 min as
necessary for disruption of the tight junctions, which intimately connect the parenchymal
cells (500m1 at 40m1/min). The Ca 2+ free buffer was then changed to the Ca2+ free
buffer (without EGTA 100ml see section 2.21.2) and then Ca 2+ free buffer without EDTA containing collagenase (120 ml at a concentration of 432 units of collagenase/ml
and 4.2mM CaC12 (see section 2.21.3) and this buffer was allowed to run through for 1
min to wash the first buffer out of the system and then the collagenase buffer was
recycled for 12 - 15 min at a rate of 40mUmin. By this method of collagenase perfusion it is possible to convert the whole liver to a suspension of intact cells. At the end of the
second perfusion with collagenase the liver should look as if it is falling apart and gentle
pressure on the lobes should release the cells. At this stage the perfusion was stopped
and the liver removed from the animal. The liver capsule was removed and the cells
were stroked out into Ca2+-free Krebs-Henseleit butler . The suspension of cells was filtered through gauze (Snow flake absorbent gauze) to separate connective tissues and
undigested liver. The cells were centrifuged in a Damon-IEC refrigerated centrifuge at a
speed of less than 200 rpm (50 g) for 2 min at a temperature of 5°C. The cells were
washed 3 times in the same buffer and the upper layer was removed by suction after
centrifugation on each occasion. After the last wash the cells were resuspended in
washing buffer (see Section 2.21.4) and left on ice for lh. The number of cells was
estimated in a haemocytometer. Viability was estimated by microscopic examination, the
cells which are highly refractive are live cells and cells with a viability above 90% were
used in the experiments. The preparation was diluted to 10 million live cells / ml before
subsequent incubation at 37°C under 95% air and 5% C02 in a humidified incubator
(Forma Scientific Model 3028) for about 30 min to equilibrate the cells.
37
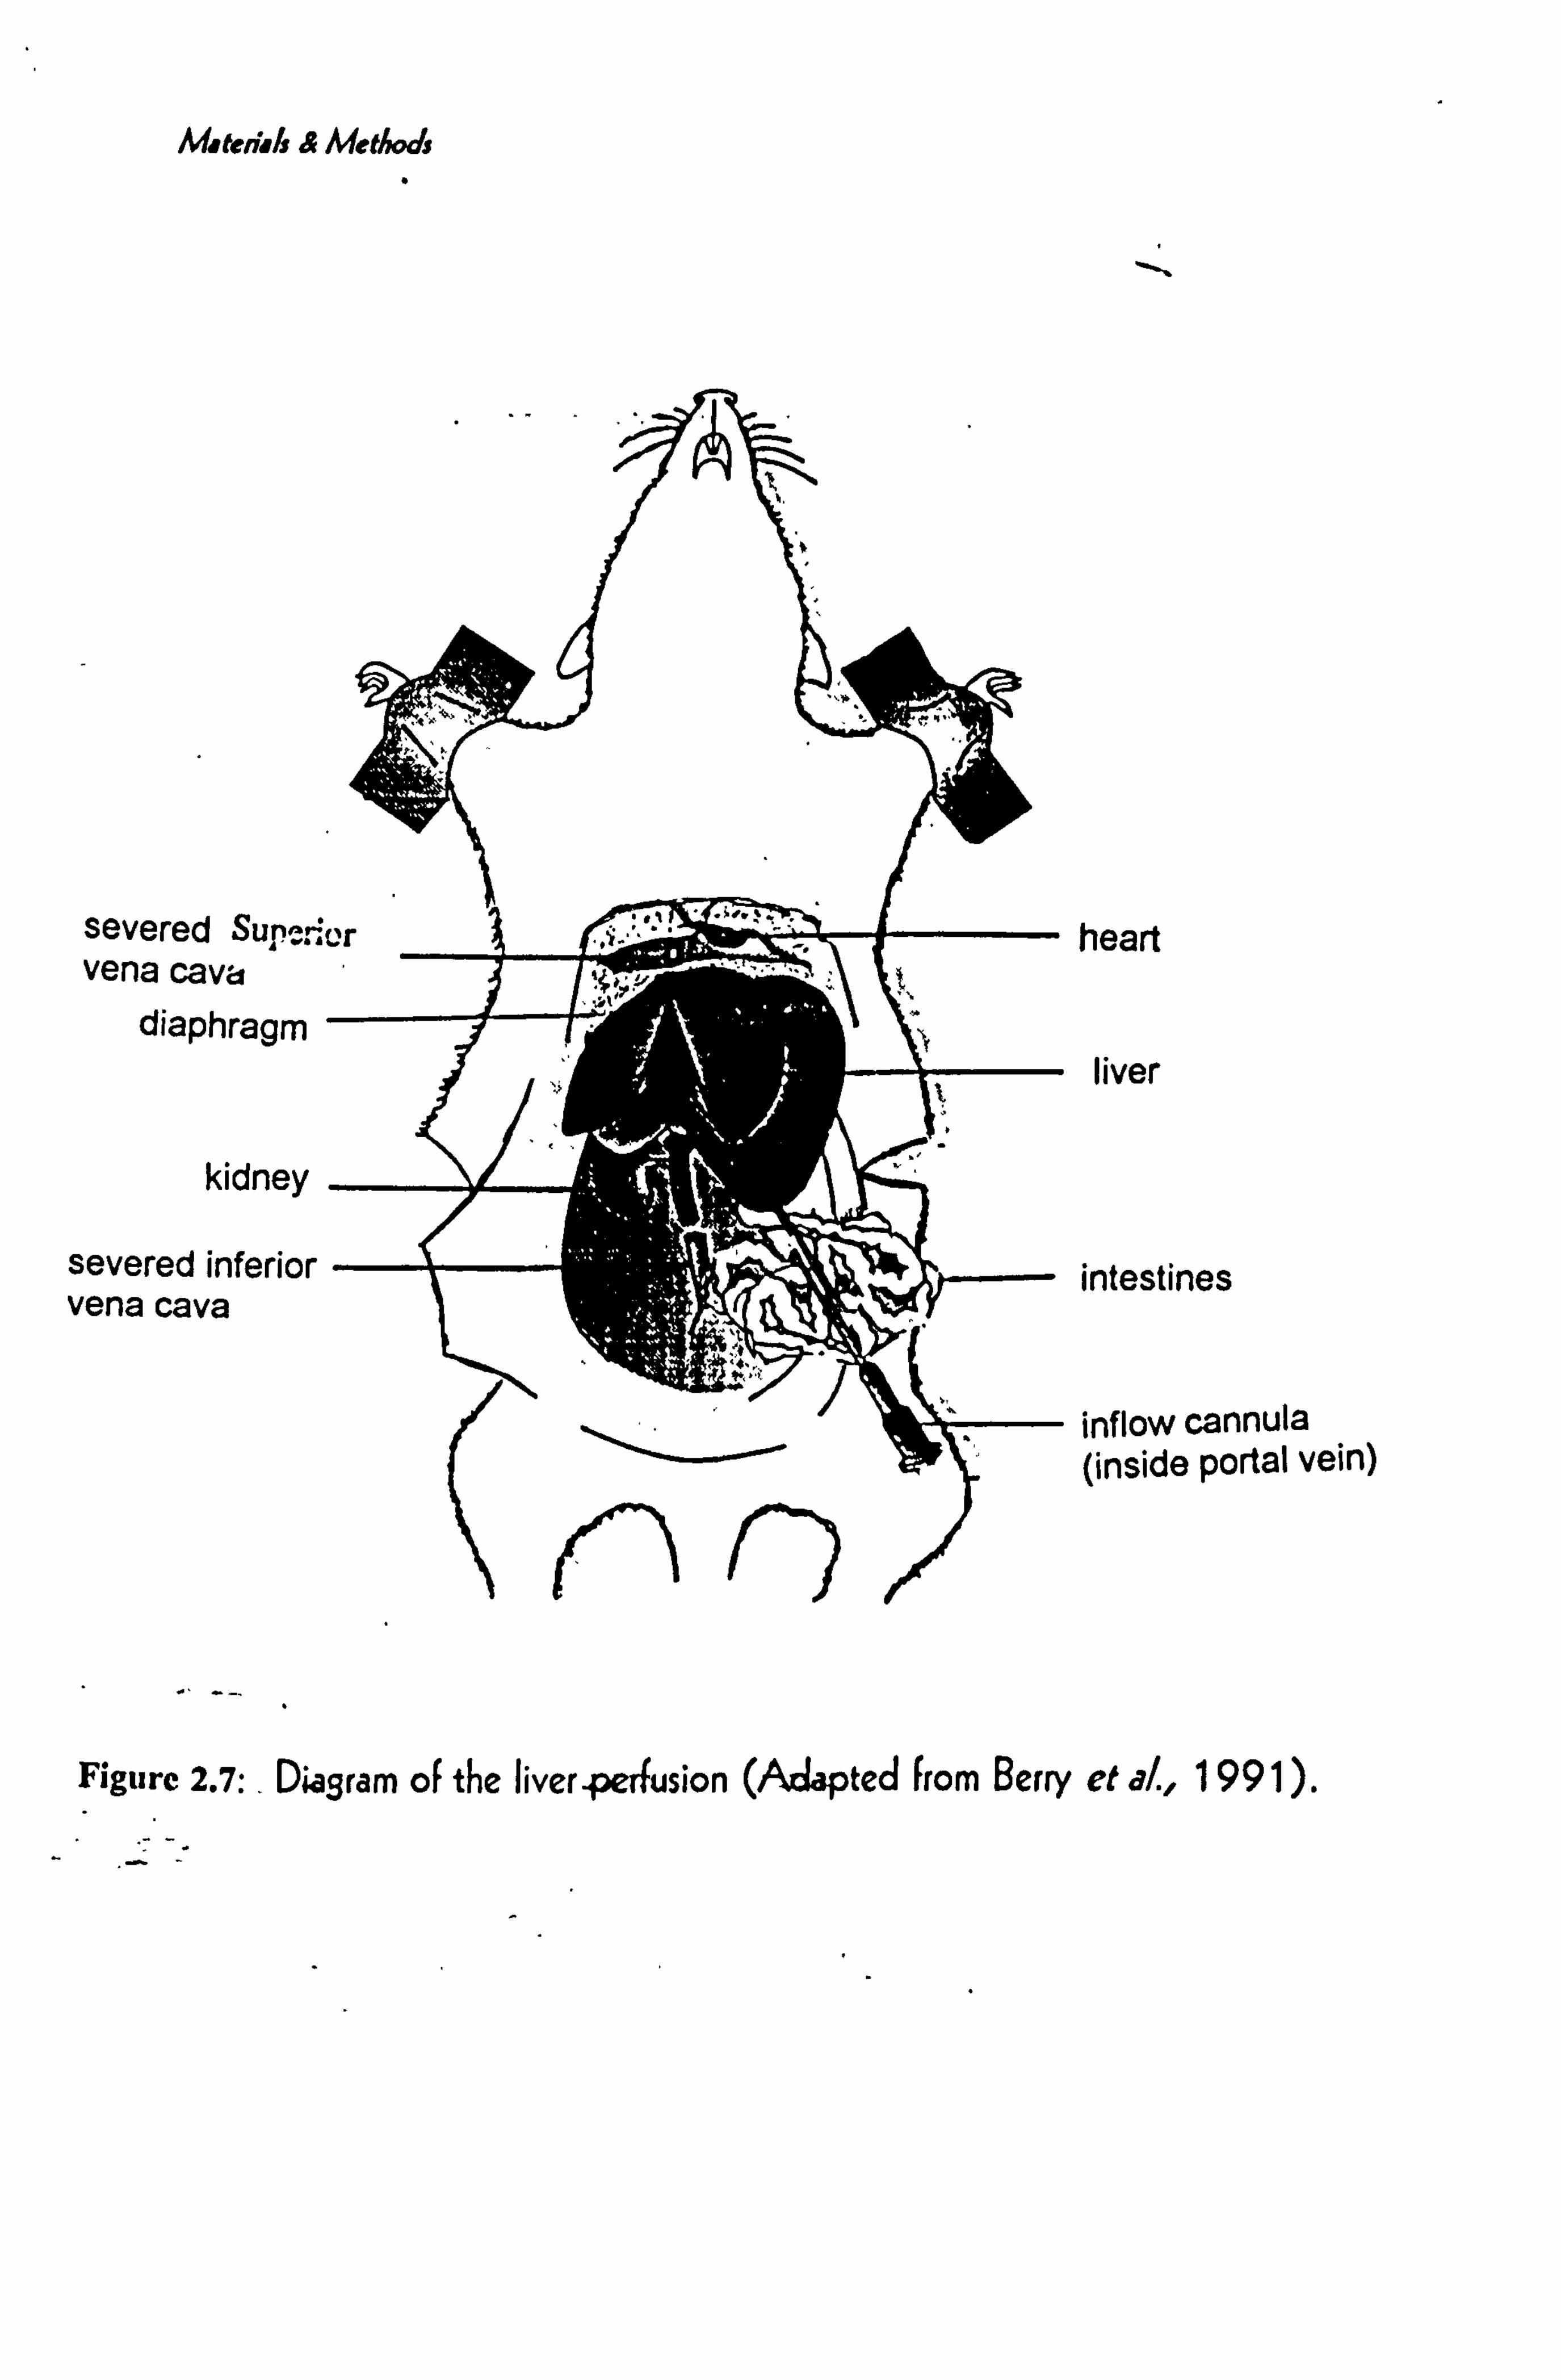
Materials & Method:
severed Suss; vena cava
diaphragm
kidney
severed inferior vena cava
heart
liver
intestines
inflow cannula (inside portal vein)
Figure 2.7:. Diagram of the liver. pedusion (Adapted from Berry et al., 1991).

2.7 Hepatocyte culture
Into separate 9 cm diameter sterile plastic petri-dishes (Nunclon, Denmark) were
placed 107 cells and 6 ml Ham's F-10 medium containing 0.1% bovine serum albumin
plus 0.05 ml of a penicillin / streptomycin mix (100u /100 pg / ml). This procedure was
carried out under sterile conditions. The petri-dishes were incubated at 37°C, under 5%C02; 95% air for up to 72 hours prior to enzyme assay.
2.8 Addition of test materials
2.8.1 Pre-incubation for androst-4-ene 3,17-dione metabolism assay:
To prepare these cultured cells for assay, the contents of the plates were
scraped into separate glass test tubes and centrifuged at a speed of less than 200 rpm
(50g) for 2 min. at a temperature of 5°C in a Damon-IEC refrigerated centrifuge. The
intact hepatocytes sedimented to the bottom of the tubes and the excess medium was
removed using a pasteur pipette. To each tube was added I ml of Ham's F-10 or
Williams' E medium (containing 0.1% BSA) . The cells are then ready for the addition
of the various extracts. If the cells were to be used directly after preparation, they were
then suspended in medium following the third wash (see Section 2.6.1 Preparation of
Hepatocytes) and used as such.
To 107 cells in 1 ml of Ham's F-10 or Williams' E medium as prepared above
was added one or more of the following:
1.10 µl insulin 10-7 M dissolved in 0.1M hydrochloric acid (giving final conc. of
10 -9 M).
39

2.10 µl insulin 10-4 M dissolved in 0. IM hydrochloric acid (giving final conc. of
10-6 M).
3.10 µl crude extract (as prepared or diluted with solvent to varying degrees. ).
4.1OpI of vehicle (0.1M HCI, ethanol or water ; to act as control)
The cells were left in the presence of the test material for 30 min. at 37°C in a
humidified incubator in an atmosphere of 5% CO2 and 95% air. After the preincubation
period of 30 min., the cells were centrifuged at a speed of less than 200 rpm (50g) for 2
min at a temperature of 5°C in a Damon-IEC refrigerated centrifuge and the medium
was removed using a pasteur pipette.
2.8.1.1 Assay of steroid metabolism
For the assay of steroid metabolism, cells, as prepared above, were resuspended
in 1 ml of fresh Ham's F-10 medium or William's E followed by the steroid substrate, 4-
[4-14C]-androstene-3,17-dione (100 µg; 0.1 pCi in 17 tl of acetone). The cells were
incubated in the C02 incubator for 30 min at 37°C. The incubations were terminated
by the addition of 0.5 ml of 0.9% NaCl (to increase the ionic strength), 5 ml of Folch
solution (CHC13 (to extract steroid) and MeOH (to precipitate protein); 2: 1 v/v) and
500 µg of unlabelled androst-4-ene-3,17 dione (dissolved in 50µI of acetone; to act as
carrier). The tubes were mixed on a rotary mixer and left to stand overnight for phase
separation. After 24 hours some tubes did not show phase separation and these were
centrifuged at 1000 rpm for 5 min at a temperature of 5°C in a Danon-IEC refrigerated
centrifuge for complete separation between the aqueous and organic phases. The lower
40

organic layer was transferred to another tube and dried at 50°C under oxygen-free
nitrogen (to prevent degradation of the metabolites by atmospheric oxygen) using a
Techne dry-block. The extract was redissolved in three drops of chloroform using an
ultra-sonic water bath for at least 20 seconds and then spotted onto silica gel thin layer
chromatography plate (Merck F-254; 20 cm x 10 cm. Individual substrate and
metabolite bands were roughly visualized by U. V. light to make sure of adequate
separation (Figure 2.9). The accurate bands were located by autoradiography. This
step needs complete darkness so the plates were put in a black bag in a closed cupboard
for about one week in contact with X-ray film X-Omat film (Kodak, France). The
radio-labeled bands were located by developing the film in X-ray developer (DX-24) (
200m1 added to 1000ml tap water) and then fixing in FX-40 solution (100ml added to
1000ml of tap water) for a few minutes. The film was then washed for 1 hour in cold
running water and dried. The developed X-ray film was then aligned with the T. L. C
plate (Figure 2.9) and the radioactive bands, which have previously been identified using
authentic standards and verified by GC-MS (Gustafsson & Stenberg, 1974), were
scraped into polythene scintillation vials and suspended in Ecoscint liquid scintillant.
Radioactivity in each sample was measured in a Packard Tri-carb Model 2000 (A)
scintillation counter and the various enzyme activities expressed as pmol metabolite
formed per min. per mg of protein was determined using the formula for calculations
and statistics (section 2.19) from the d. p. m. in each band using a custom-made
computer programme.
41

0 and ro s t-4-e n e-3,17-d i
I
17cc(p)-hydroxysterold dehvdroaenasa
&z -reductase
O- M
5a-androstane-3,17-dione
3a(C3) -hydroxystero/d dehydrogenase
OH fi
Sac-androstane-3ac(ß) -ol -17-dione
74 -hydroxylase (CVP 2A 1)
O . 'L'OH
OH 4-androstene-60-oI.
3,17-dione
4-androste ne-7ac-ol- 3,17-dione
Figure 2.8 The phase 1 metabolism of androst-4-ene-3,17-dione in the liver. Specific isoenzymes thought to produce the various metabolites are given in capital italic.
6p. hydroxylase (C VP 3A113A2)
Pone
"'SOH
4-androste ne-16a-oi- 3,17-dione
16ac -hydroxylase (CYP 2C11)
I
OH
testosterone (epitestosterone)
42

Figure 2.9 Laser scan of androstene-4-ene-3,17-dione metabolites separation by one- dimensional thin layer chromatography.
- Il-i Ft
5a-Androstane-3,17-dione
Androst-4-ene-3,17-dione (unchanged substrate)
5a-Androstane-3cx((i)-oI-17-one
Testosterone/Epitestosterone
Androst-4-ene- 16cx-o1-3,17-d inne
Androst-4-ene-6(3-o1-3,17-dione Androst-4-ene-7cx-o1-3,17-dionc
Start band
43

It is apparent from Figure 2.8 that there are six main metabolites of androst-4-
ene-3,17-dione which can be separated by this method. However, it has been shown that
3a/0-oxosteroid oxidoreductase does not metabolize the parent compound, but that
metabolism by this enzyme occurs subsequent to metabolism by 5a-reductase. Hence,
for the purpose of this study, only the activities of the enzymes metabolizing the parent
molecule were evaluated and hence the amount of metabolite produced by subsequent
metabolism of 5a-androstane-3,17-dione was not determined separately but the amount
of metabolite produced by this enzyme was added to the amount of unchanged Sa-
androstane-3,17-dione to determine the total amount of metabolite produced by the
activity of 5a-reductase.
2.8.2 Pre-incubation for glycogen phosphorylase a activity assay.
Cells prepared as outlined in Section 2.6.1 were resuspended in Krebs-Henseleit
solution (see Section 2.21.4) at a concentration of 2-3 x 10⁶ cells/ml. 2m1 aliquots of
the hepatocyte suspension were then placed in 20 ml plastic scintillation vials, gassed
with oxygen/carbon dioxide mixture (95: 5) for approximately 15 seconds and incubated
for 30 minutes at 37°C under 95% air and 5% CO2 in an incubator (Forma Scientific
Model 3028), prior to the addition of test substances.
After the pre-incubation described above, 450 pl aliquots of cells were
transferred to lml microcentrifuge tubes containing 50 pl of drugs at various
concentrations (glucagon, insulin at 10-10 - 10-6 M dissolved in 0.1 M HCI; test
compounds and crude extracts, Artemisia judaica, Marrubium ti7ilgare and Anvillea
carcinii at various concentrations from 2x10⁻¹ -2 x10⁻⁵ g/ ml H2O or vehicle
(control)) and incubated at 37°C in a dry heating block (Genesys Instruments) (Figure
2.10). The incubations were terminated after 3 minutes by dropping the tubes in liquid
nitrogen (for overall assay procedure see Figure 2.10. The tubes were then stored
frozen at -70°C until they were assayed for enzyme activity as described below (section
2.8.2.1). Duplicate incubations were made for each concentration of test substance.
44

2.8.2.1 Glycogen phosphorylase a assay
Phosphorylase a activity was determined by the filter paper assay method of Thomas et al (1968) as modified by Stalman and Hers (1975). The method assays
glycogen phosphorylase a in the 'unphysiological' direction i. e., employing the reaction between D-glucose-1-phosphate (Glc-1-P) and glycogen (i. e. in the direction of
glycogen synthesis. The principle involves the incorporation of [14C]glucose from
glucose- I -phosphate into glycogen. Caffeine is added to the assay mixture to make the
assay specific for phosphorylase a. Sodium fluoride and disodium edetate are added to
the disruption buffer to inhibit phosphorylase activity. An equal volume (500µl) of ice-cold disruption buffer (see Section 2.21.5.1)
was added to the frozen samples and allowed to thaw on ice and then shaken for about 60 seconds in an ultrasonic bath to disrupt the cells. The mixture was then centrifuged at 2,500g at 4°C for 10 min. in a Damon-IEC centrifuge (see Figure 2.10). 50µI of the
supernatant was added to 50µl of assay mixture (for composition of assay mixture see below) in a microcentrifuge tube, mixed by means of a rotary mixer and incubated in a
water bath at 37°C for 20 mins. The reaction was stopped by removing 30µI aliquots of
the mixture and spotting on paper pieces (Whatman 3MM chromatography paper, 10mm2), previously marked with the sample number in pencil, and dropped in a beaker
containing 66% (v/v) ethanol in water. Blank samples were prepared by mixing 50µl of disruption buffer with 50µl of assay mixture.
The filter paper squares were subsequently washed three times for 40 min each in the 66% ethanol on a magnetic stirrer, replacing the ethanol with a fresh mixture after
each wash. The stirring bar was screened with an aluminium mesh to prevent
disintegration of the filter papers. After the final wash, the ethanol was decanted and the
papers washed for 1 minute in acetone. The papers were allowed to dry in air and the
radioactivity of each paper measured in a Tri-Carb 2000CA scintillation counter
(Packard, Berks., England), by placing the filter papers in 20ml-plastic scintillation vials
with 2 ml of Ecoscint scintillation fluid (National Diagnostics, Manville, NJ, USA). ( for
method flowchart see Figure 2.10)
45

450 µl of hepatocyte suspension
Snap freeze 50 µl of drug Incubate at 37°C for 3 min in liquid N2
500 µl MOPS buffer
" thaw " vortex " sonicate (60 s
at 0-2°C)
50 µl of supernatant
" vortex " incubate (20 min
at 37°C) 50 µI of assay mixture pellet
j/ 30 µl
" wash 3x in 66% EtOH " rinse with acetone
--7 " air-dry COUNT
filter paper (1 cm2)
3C
Figure 2.10 Protocol for glycogen phosphorylase a assay.
Centrifuge 1(2,500 g at 4°C;
4 min)
46

The total amount of radioactivity present in the assay mixture was measured by
spotting 50µl of assay mixture onto a filter paper, allowing to dry and counting as
above.
2.9 Protein assay
The amount of protein present in the supernatant of freeze thawed cells was
measured by the Folin-phenol method (Lowry, 1951) with bovine serum albumin as a
standard (as described in section 2.4.2).
2.10 CALCULATIONS AND STATISTICS:
An outline of each calculation used in the Results is given below. Some are
taken from Gibson and Skett, (1994).
2.1 1 Cytochrome P450-Dependent Enzyme Activities
The amount of metabolite formed can be calculated by direct reference to the
standard curve.
Amount of product in incubation =X nmoles
incubation time = 30 minutes
Protein content =Y mg protein
Enzyme activity =X /30Y nmoles/min. /mg protein
47

2.12 How to calculate the volume of the buffer for microsome
preparation
liver weight (g) x5 ml of buffer
2.13 Total Protein (mg)
= volume of buffer x Protein concentration
2.14 Protein (mg/g )
=Total Protein / Liver weight
2.15 Liver weight as % of Body weight
= Liver weight x 100 / Body weight
2.16 Steroid metabolising enzyme activities
The amount of each metabolite of androst-4-dione-3,17-dione expressed as
pmole metabolite formed per minute per 106 cell or mg protein was determined using
the formula shown below:
pmol metabolite / min. /106 cell or mg of protein= Sx (Cm/Ct) x (1/t) x (1/n) x
(1/N Where
48

S= amount of substrate added (µg)
Cm = d. p. m. metabolite
Ct = d. p. m. total
MW = molecular weight of substrate (286)
t= incubation time (minutes)
n= number of cells (divided by 106)
this gives activity in nmoles product / min. / million cells
2.17 Counting number of cells / Iml (in steroid metabolism)
Using the haemocytometer:
if there are 20 cells in one large square and the viability is 80% then viable cells =
20 x 0.8 = 16 million cells/ml
If the total volume of cell suspension is 30m1, then
.. Total number of cells = 30x 16 = 480 million viable cells
:. make up to 48m1, to give
The final concentration = 480=48 = 10 million cells/lml
2.18 Calculations of glycogen phosphorylase a activity
The activity of glycogen phosphorylase a in a given sample was measured as the
amount of 14C-glucose incorporated into glycogen after subtraction of the blank values.
49

Enzyme activity is expressed as nmol of 14C-glucose 1-phosphate into
glycogen/min. /mg of protein.
ENZYME ACTIVTY=(DPMS-DPMB)/DPMTX [S] X (1/P) X (1/t) X (10,000/3)
where,
DPMS, DPMB, DPMT are the disintegrations/min. for the sample, blank and total
amount of radioactivity in the assay respectively.
[S] = substrate (GIcIP) concentration (50mM in all the assays)
P= protein conc. of the supernatant
t= incubation time (min)
Results were expressed as percentage increase in phosphorylase a activity of
appropriate control values.
2.19 STATISTICS
The means and standard deviation were calculated where appropriate. Statistical
differences were determined by the ANOVA followed by Dunnet's test and the level of
significance set at P<0.05. In many cases results were calculated as percentage of
relevant control values (as the control values could vary between cell preparations and
between experiments) to make understanding of the results easier. In these cases
statistics were performed on the untransformed data and these statistics given.
50

2.20 REAGENTS USED
2.20.1 BUFFERS
To make 1 Molar phosphate Buffer pH 7.4
Make the following solutions:
Solution A: 9.08g ofKH2PO4 (BDH Chemicals) dissolved in 1 liter of distilled water
Solution B: 11.88g of Na2HPO4.2H20 (Hopkin and Williams) dissolved in 1 liter of
distilled water
0.1M solution was prepared by adding 19.6ml of solution A to 80.4ml of solution B and
diluting to I litre. pH = 7.4
100m1 of 0.1M buffer was diluted to 1 litre and 11.5g of potassium chloride was added
to give 0.01M buffer (pH=7.4) for use in microsome preparation.
2.20.2 NASH reagent:
75g of ammonium acetate (BDH Chemicals) was dissolved in 500mI distilled
water. 1.5m1 glacial. acetic acid (M&B) and lml acetylacetone (Sigma Chemical
Co. Ltd. ) was added. This reagent is made just before it is used as it is unstable.
51

2.20.3 CO-FACTOR MIXTURE FOR ENZYME ASSAYS
For each incubation
3mg NADP+ (Sigma Chemical Co. Ltd. )
3.9 mg Trisodium Isocitrate (Sigma Chemical Co. Ltd. )
dissolved in 1001il MnC12 solution (6mg/l00m1) (BDH Chemicals)
Add I Oµl Isocitrate Dehydrogenase (Boehringer Mannheim).
Isocitrate + NADP+ -+ a-ketoglutarate+ NADPH+H+ + CO2
2.21 Buffers and physiological solutions:
Perfusion buffers were prepared from a 5xstock solution containing the
ingredients listed in 500ml of distilled water.
NaCl ............................................ 17. lg
NaHCO3 .......................................
5.25g
HEPES .......................................... 6.50g
Glucose .........................................
5.00g
KCl(10% w/v soln) ..................... 8.75m1
MgSO4.7H2o .................................
7.25m1
KH2PO4 ........................................
4.00m1
The stock solution was stored at 2 to 4°C and was not used if more than a week old.
52

2.21.1 Ca2+-Free Krebs-Henseleit solution (with EGTA) -1500m11
Ca2+-Free buffer was prepared by dissolving 1.9g EGTA in 100ml of the stock
solution that has been diluted to 450m1 with distilled water. The pH was adjusted to 7.4
with 0.1 M NaOH and the volume made up to 500ml with distilled water.
2.21.2 Ca2+ free Buffer (with out EGTA) [100mJJ:
Dilute 20m1 of stock solution to 100m1 with distilled water. Adjust pH to 7.4
with 0. IM NaOH.
2.21.3 Collagenase buffer [100mi]:
As above (section 2.21.2) but containing 4.2 mM CaC12 (0.42m1 of a IM CaC12
stock solution / 100 ml of buffer) and the pH adjusted to 7.6. Due to the high
concentration of Ca2+ precipitation of calcium salts may occur in the collagenase buffer.
This is undesirable and to avoid precipitation, the CaC12 solution was added gradually to
the solution while stirring.
2.21.4 Washing buffer
As in (section 2.21.2) without EGTA and containing 1.5 mM CaCI2 (0.75 ml of
IM CaC12in 500m1), adjusted at pH 7.4.
53

2.21.5 Buffer and radioactive mixture for glycogen phosphorylase a assay
2.21.5.1 MOPS Buffer
(g /100m1)
MOPS ........................................ 2.09
NaF ........................................... 0,84
NaEDTA ..................................... 1.12
Dithiothreitol (DTT) ................... 0.154
Dist. water .............. to .............. 100m1
Adjust pH to 6.5 with 0.1M KOH. Store at 2 to 4 °C. Discard if more than a week old.
2.21.5.2 Radioactive assay mixture
(mg/l Omi)
Caffeine ....................................................
1.00mM
Glycogen ...:..............................................
2.00%
a-D-Glucose-1 phosphate .......................... 336.3mg
a-D-[U-14Glucose-1 phosphate .................... 25.0µl
Distilled water ........................................ 10. Oml
- Dissolve the glycogen, caffeine, and unlabelled GIc1P in diluted MOPS buffer (1: 1)
with GENTLE shaking.
- Adjust pH to 6.5 with 0.1 N HCL, the labeled G1c1P added and mixed thoroughly.
Transfer 1-ml aliquots to microcentrifuge tubes and store at -20 °C. (will keep for 6
months).
54

2.22 - SOURCES OF HORMONES, DRUGS AND REAGENTS
Hormones, chemical and reagents are listed according to the manufacturer.
Sigma Chemical Co. Ltd.. St Louis MO. USA:
MOPS
DL-dithiothreitol
Caffeine
Rabbit liver glycogen type111
HEPES
Insulin (porcine)
EGTA
Streptozotocin
Bovine serum albumin (Fraction V)
4-Androstene-3,17-dione
a-D-Glucose-I -phosphate Glucose Assay Kit
Glucose / Urea Nitrogen
combined standards set Glucagon
Insulin Bovine
CuSO4. H2O
Nicotinamide
Semicarbazide
Aminopyrine
Hopkins & Williams. Essex. England:
Sodium fluoride
Disodium EDTA
British Drug Houses. Poole. Enl and
Folin-Ciocalteu' phenol reagent
glycine
55

Potassium Tartrate
Sodium Hydrosuiphite
Magnesium Chloride
Aniline
Trichloroacetic Acid
4-Aminophenol
Zinc Sulphate
Calcium Chloride
Amersham International p. l. c.. Bucks. England:
[U-14C]-D-Glucose-1 phosphate Potassium salt [4-14C] androst-4-ene-3,17-dione
Boehringer. Mannheim. Germany:
Collagenase A from Clostridium histolyticum
Keto-Diabur Test 5000 strips
GIBCO BRL Limited
Ham's F-10 Culture medium Williams' E medium Penicillin / Streptomycin
Fisons. Loughborough. England
NaCl, NaOH, KCI, MgSO4, NaHC03, KH2P04, Glucose
Kodak. France
X Ray film (X-Omat)
Devleloper (DX 24)
Fixer (FX-40)
56

RESULTS AND DISCUSSIONS

3. IN-VIVO EXPERIMENTS The tables and figures represent the results which were collected from each
experimental run and the statistical analysis of the results were from 9 normal, healthy
rats treated with Artemisia extract, 6 diabetic rats and 6 diabetic rats treated with Artemisia extract. The results, in general, are presented for individual rats as each
animal acted as its own control during the experiments.
3.1 Normal Rats treated with Artemisia (17 days):
This experiment was to see if Artemisia extract had any observable effects on healthy rats such as changes in body weight, food and fluid intake, urine volume, urine
glucose concentrations and faeces output. The results of this experiment are shown for
normal rats treated with Artenzisia extract as follows:
All 9 rats showed normal growth rate. In summary, body weight increased over
a 7-days period at a fairly constant rate of 27.2 f 7.1g before treatment and 28.2 ±
6.9g after treatment (Figure 3.1). Faeces output was not significantly different (p>0.05)
- 9.69 ± 4.74g before treatment and 6.99 ± 1.96g after treatment (Table 3.1). Food
intake did not alter significantly after introduction of the Artemisia extract except for
rats 3 and 9, which appeared to have a low food intake temporarily upon being in giving
the Artemisia extract but the feeding habit became normal after 1-2 days. Overall,
Artemisia had no measurable effect on food intake - 19.5 ± 6.75g before treatment and 22.3 ± 5.86g after treatment (Figure 3.2). Fluid intake in all 9 rats was unchanged by
treatment except in rats 4,5 and 6 where it was reduced slightly in the presence of Artemisia extract on the first day of giving Artemisia. This is probably due to a taste
factor - Artemisia extract is bitter. Overall, however, Artenzisia extract had no effect on
fluid intake - 22.4 ± 6.2ml before treatment and 24.89 ± 5.77m1 after treatment (Figure
3.3).
Urine volume significantly increased from 7.11 ± 3.16 ml to 9.3 ± 3.05ml (p<0.05) after
treatment with Artemfsia extract (Figure 3.4). This was seen in all rats but is particularly
apparent in rats 1-6 with little change in rats 7 and 8. Despite the unchanged intake of fluid as seen above, it is seen that Artemisia extract appeared to act
57

Figure 3.1 The effect ofArtenzisia judaica extract on body weight of control male rats. (T )= Start of Arlemisia treatment (note : treatment started on day 11 in
experiment 1, (a) and day 7 in experiments 2&3, (b, c)).
Results for individual rats are shown.
(o )= rat (1,4,7); (") = rat (2,5,8); (V)= rat (3,6,9)
58

a) 300 r
as E- I C9
25(
0 0 m
20(
DAYS b
400.
°1 350 I-- 2 CD
300
>- 0 250
200 p7 14 21
DAYS
400
rn 350
w
300
O
250 07 14 21
DAYS
U/I °F L1

Figure 3.2 The effect of Artemisia judaica extract on food intake of control male rats. ( 1' )= Start ofArtemisia treatment (note : treatment started on day 11 in
experiment 1, (a) and day 7 in experiments 2&3 (b, c)).
Results for individual rats are shown.
(o)= rat (1,4,7); (") = rat (2,5,8); (0) = rat (3,6,9)
59

35 a)
30
W 25
20 z p 15 0 0 10
5
0
DAYS
50 -
m 41
Y 31
z a 2( 0 0 U. 1l
DAYS
35 C)
30
a 0) 25 w Y
20 z 0 15 0 0 U- 10
5
DAYS
V1 4-r ý
UI_.
V, _.

Figure 3.3 The effect of Artemisia judaica extract on fluid intake of control male rats.
( 1' )= Start ofArtemisia treatment (note : treatment started on day 11 in
experiment 1, (A) and day 7 in experiments 2&3 (c, b)).
Results for individual rats are shown.
(o)=rat (1,4,7); (")=rat(2,5,8); (0 )=rat (3,6,9)
60

a) 35 r
31
w 2;
Fa- 2(
JV LL
1(
s
b) 40 r
E 31
W 2(
Z 1(
J LL
-1(
40 c)
35
E 30 Y 25 z 20
15 J u' 10
5
u1 DAYS
DAYS
UI 'r
DAYS

Figure 3.4 The effect of Artemisia judaica extract on urine volume of control male rats. (T)= Start ofArtemisia treatment (note : treatment started on day 11 in
experiment 1, (a) and day 7 in experiments 2&3, (b, c)):
Results for individual rats are shown.
a= rat 1, b= rat2, c= rat3, d= rat4, e= rat5, f= rat6, g= ratz, h= rat8 &i= rat9
61

14 a)
12
10 J
>8 w
g
4
2
0 b)
E W 2 D J O
W z
16 C)
.. 14 E W 12 Z)
10 J 0 >8 W Z6
4L
2
DAYS
DAYS
DAYS

d) 18=
1E
w 1e
J
w is
f
E
18
16 W
14 J 0 W 12 z
10
8 07 14
DAYS
16 fl
... 14
W 12
10
8
6
4
2
DAYS
Ul 14 DAYS
U/ I-,

12 9)
E W 1(
J
> W Z
q
12 -
v E 1( wC
J O
W z
4L
10
g
4
2 p7 14
DAYS
uiI4 DAYS
U/ 114 DAYS

Figure 3.5 The effect of Artemisia judaica extract on urine glucose of control male rats. ( 1' )= Start ofArtemisia treatment(note : treatment started on day 11 in
experiment 1, (a) and day 7 in experiments 2&3, (b, c)).
Results for individual rats are shown.
a= rat I, b= rat2, *c= rat3, d= rat4, e= rats, f= rat6, g= ratz, h= rat8 &i= rat9
62

a) 2.0, -
1.5 w0
1.0 J 0 w 0.5 z R
o. o
-o. E
6
a w4 N 0 U D
J 2
w z
a
-1
I"
14
12 C) W 10 U) O8 v
6 J
w4 z 22
0
-2
DAYS
U It DAYS
DAYS
0 ýý

0.6 d)
0.5 äi 0.4 0
0.3 J
0.2 w z 0.1
0.0
-0.1 -
e) 0.6 r 0.5
N 0.4 O
0.3 J
0.2 W Z 0.1
0.0
-0.1 '-
0.6 fl
im 0.5 cm N 0.4 0 0.3
0.2 w
0.1
0.0
-0.1
DAYS
U/ Iw DAYS
DAYS
U/ '-v

0.7
0.6
N 0.5
0 0.4
0.3
Z 0.2
0.1
0.0
-0.1
h 0.3 r
ö)
w 0.2 Cl) 0 V
0.1
w z w 0.0 D
-0.1 p7 14
DAYS i
0.3
0) 0. A
N O V
0.1 c7 w z 2 0. ( Z
-0.1
DAYS
U/ 11+ DAYS
U/ Iw

Table 3.1: Faeces (g) weight of normal rat treated with Artemisia judaica from day 11 in experiment 1 and in day 7 in experiment 2&3, (n. d. = not determined)
DAY RATZ RATZ RAT3 RAT4 RAT5 RAT6 RAT7 RATS RAT9
1 3.42 4.98 2.87 4.10 7.3 8.00 9.30 2.88 3.48
2 5.40 4.30 2.50 5.80 7.60 6.40 12.25 8.30 3.92
3 4.48 5.42 5.59 5.90 9.50 6.50 12.0 8.61 10.0
4 3.46 4.22 4.13 7.80 9.20 6.20 8.40 10.3 10.01
5 5.73 3.66 7.32 6.50 6.60 6.70 11.33 9.60 9.90
6 5.43 4.72 5.68 8.90 9.40 9.60 10.43 8.96 9.34
7 4.01 4.02 4.29 n. d. n. d. n. d. n. d. n. d. n. d.
11 5.62 6.84 6.62 4.00 5.50 5.00 8.22 12.5 12.1
12 5.13 7.86 5.30 5.50 6.50 7.00 12.7 8.61 10.0
13 5.04 7.05 5.17 4.50 5.00 7.10 5.92 6.57 8.57
14 5.14 6.8 5.22 8.4 7.4 8.5 9.95 9.03 9.73
15 5.14 6.80 5.22 5.90 5.40 8.80 6.89 7.72 6.24
16 6.08 6.29 4.87 5.50 7.30 7.50 8.65 6.87 7.79
17 4.20 6.80 4.83 n. d. n. d. n. d. 10.0 8.65 6.89
63

'as a mild diuretic There were no detectable ketones in the urine of any of the animals
whereas urine glucose concentrations were significantly increased in rats 1-6 (p<0.05)
but not in rats 7-9 (Figure 3.5).
Arlemisia extract, therefore, has little effect on normal animals except for a
slight diuresis. This is probably related to the apparent appearance of glucose in the
urine of rats treated with the extract. Analysis of a sample of Artemisia extract showed that it did indeed contain substances giving a positive reaction in the glucose assay (results not shown ). This is unlikely to be glucose itself as this would be retained in the
body and used as an energy source but, perhaps, a non-metabolisable sugar derivative
which is directly excreted in the urine and, thus, acts as an osmotic diuretic (e. g.
mannitol).
3.2 Diabetic Rats (17 days):
Before testing the effect of the Artemisia extract on diabetic rats an experiment
was carried out to determine any changes in the measured parameters in rats suffering from diabetes mellitus. Animals were monitored for a7 day period before being made diabetic so that each animal acted as its own control.
On administration of STZ a pronounced decrease in body weight of all rats was
seen especially in rat 2 (around 20g weight loss) and rat 6 (30g weight loss) (Figure
3.6). Despite this weight loss all rats had an increased food intake (hyperphagia)
(18.93±7.92g) in control animals and 37.20±8.47g in treated animals (p<0.05)) (Figure
3.7). Fluid intake significantly increased in all rats after induction of diabetes from
21.05±9.10ml to 244.40±50.84ml (p<0.05) after treatment with STZ (Figure 3.8) and
urine volume also showed a large increase in all rats from 6.21±3.18ml to 200.0±39. Oml
(p<0.05) after treatment with STZ (Figure 3.9). Faeces weight only showed an increase
from 6.48±2.30g to 14.65±3.19g (p<0.05) after induction of diabetes (Table 3.2). All
urine samples showed glycosuria (Figure 3.10) and all tested positive for ketones after
induction of diabetes.
64

Figure 3.6 The effect of STZ-induced diabetes on body weight. (T )= Treatment with STZ (65mg / kg).
Results for individual rats are shown in graphs a and b as.
o= rat (1,4); 9= rat (2,5); V= rat (3,6) from two separate
experiments ( ab)
65

320
300
280 O
260
a)
DAYS
320
300
= 280 0 Mu
260
O
240
220
b)
14
14
DAYS

Figure 3.7 The effect of STZ-induced diabetes on food intake.
( 1' )= Treatment with STZ (65mg / kg).
Results for individual rats are shown in graphs a and b as.
o= rat (1,4); "= rat (2,5); V= rat (3,6)
66

6C
50
cn 4C W
30
z a 20 0 0
10
0
-10
a)
DAYS
60
50
40
30
I::
0
-10
b)
DAYS
07 14
071w

Figure 3.8 The effect of STZ-induced diabetes on fluid intake.
(T)= Treatment with STZ (65mg / kg).
Results for individual rats are shown in graphs a and b as.
o= rat (1,4); "= rat (2,5); V= rat (3,6)
67

a) 400
350
.. 300 E
Lou
200 z
150
Zj 100 U.
50
0
b) 400
350
300
250
200
150
100
50
0
DAYS
0246ö lu II lCº iv io DAYS
0246s lu IL I`º 1° 10

Figure 3.9 The effect of STZ-induced diabetes on urine volume. (T)= Treatment with STZ (65mg / kg).
Results for individual rats are shown in graphs a and b as.
o= rat (1,4); "= rat (2,5); V= rat (3,6)
68

a) 300 I
25C
E w 20C
15C 0
Z 10C
R M 5C
C
DAYS
bl 35C
30C
E 25C w
20C
Q 15C w
100
5C
C
DAYS
U/ ýw
ýý 01

Figure 3.10 The effect of STZ-induced diabetes on urine glucose. ( 1' )= Treatment with STZ (65mg / kg).
Results for individual rats are shown in graphs a-f as.
o= rat (1,4); 9= rat (2,5); V= rat (3,6)
69

a) 6r-
r
im w 0 U"
J` C W2 Z_
C
-1
DAYS
bi E
V
C)
wq O t) 3 J
w2 Z_
0
-1
DAYS
01 14
0 14

Table 3.2 Faeces (g) of diabetic rat on day 7 STZ was given (n. d. = not determined).
DAYS RATZ RAT2 RAT3 RAT4 RAT5 RAT6
1 11.2 3.40 1.50 5.00 2.20 2.40
2 7.40 7.00 4.20 7.10 9.50 13.5
3 10.5 7.50 7.00 7.50 4.00 6.00
4 5.50 6.50 4.00 8.50 4.00 2.50
5 7.50 7.50 8.10 10.0 4.00 2.50
6 11.5 5.50 9.20 8.80 4.90 7.30
7 5.50 6.90 8.00 n. d 5.00 5.00
11 11.9 11.0 14.6 n. d. n. d. n. d.
12 10.3 15.0 16.6 14.0 12.3 18.3
13 6.00 17.0 20.0 13.5 14.0 n. d
14 13.0 13.0 14.0 21.0 16.0 13.0
15 11.0 13.5 18.5 18.0 n. d. 14.0
16 16.5 n. d. 20.0 13.4 15.0 15.0
17 18.5 n. d. 11.5 14.0 n. d. n. d.
70

3.3 Diabetic Rat treated with Artemisia (27 day experiment):
This experiment was designed to try and established the beneficial effect, if any, of Artemisia judaica in diabetic rats.
Induction of diabetes caused the same rate of weight change as seen in the
previous experiment (26.12±12.45g in control animals and -2.6±7.31g in diabetic
animals) (p<0.05) . This was associated with the other characteristics of diabetes
mellitus (i. e. polydipsia , polyuria (Figure 3.14) and hyperphagia. All animals showed
clear glycosuria and significant signs of ketosis after induction of diabetes.
Replacement of the drinking water by a crude extract of Artemisia judaica on day 17 following induction of diabetes, led to a marked inhibition of all six rats to drink
any extract solution and this led to dehydration see (Figure 3.11) and, thus, a marked decrease in body weight. This weight loss was so severe that rat 6 was sacrificed early. On day 19 the plant extract was replaced by water for 24 hours and then the dose of
extract was gradually increased to allow body weight to stabilize while continuing
treatment with Artemisia extract. Overall a small though non-significant reversal of the
weight loss caused by diabetes was seen (before treatment 26.014.5g, after treatment
with STZ -2.6±7.30g and after treatment with Artemisia extract (4.0±12.5g) (Figure
3.11). There was no improvement in food intake (before treatment with Arlemisia ; 23.2±5.84g, after treatment with STZ ; 33.27± 9.52g and after treatment with Artemisia
; 41.86±7.1g) and, indeed, food intake increased further (Figure 3.12). Urine volume
was also unchanged by Artemisia treatment (7.4812.60ml in control animals,
191.97±39.41ml after treatment with STZ and 199.57±29.21m1 with Artemisia extract
(Figure 3.14) as was the fluid intake (Figure 3.13) and faeces weight (Table 3.4).
Significant results were found for urine glucose and ketone levels. Glucose levels were
reduced on the last 2 days of Artemisia treatment (Figure 3.15) often the urine tested
negative for ketones in the animals treated with Artemisia extract (Table 3.3).
71

Figure 3.11 The effect of STZ-induced diabetes and Ariemisia judaica extract treatment on body weight.
(1) = Treatment with STZ (65mg / kg) .
(2) = Start of treatment with Artemisia extract in a and b as.
o= rat (1,4); "= rat (2,5); V= rat (3,6)
72

a) 350 r-r
E! 301 F- = C9 w
251
201
35(
30( rn
CD 251 w
ö 201 O
151
101
07 14 21 28
DAYS
7 14 21
DAYS

Figure 3.12 The effect of STZ-induced diabetes and Ariemisia judaica treatment on food intake
(1) = Treatment with STZ (65mg / kg).
(2) = Start of treatment with Artemisia extract in a and b as.
o= rat (1,4); "= rat (2,5); V= rat (3,6)
73

a) 70 r
6C
5C
4C
3C
2C
`L
0
b) 50
45-
4C
Y 3:
z 3C C Ö 2!
2C
1, °
1(
DAYS
7 i4
DAYS
14 21 28
Figure 3.13 The effect of STZ-induced diabetes and Artemisiajudaica treatment on fluid intake.
(1) = Treatment with STZ (65mg / kg).
(2) = Start of treatment with Artemisia extract in a and b as.
o= rat (1,4); "= rat (2,5); V= rat (3,6)
74

a) 500 r-r
40(
E w 30(
N Z 20(
10( U.
C
b) 400 rr
35(
30(
Y 25(
20C
15C U.
10(
5C
C
DAYS
U/ -14 41 deo
DAYS
U/I4LI cU
Figure 3.14 The effect of STZ-induced diabetes and Artemisia judaica extract treatment on urine volume.
(1) = Treatment with STZ (65mg / kg).
(2) = Start of treatment with Artemisia extract in a and b as.
o= rat (1,4); 9= rat (2,5); V= rat (3,6)
75

a) 350 r-r
300
E 25C
200
150 w
100
50
0
DAYS
hl 35C
300
E 250 w
200 J 0
> 150 w z 100
50
0
DAYS
07 14 GI co
07 i4 41 LU

Figure 3.15 The effect of STZ-induced diabetes and Artemisiajudaica extract treatment on urine glucose.
(1) = Treatment with STZ (65mg / kg).
(2) = Start of treatment with Artemisia extract in a and b as.
5. b= rat 2; c= rat 3; d= rat 4&e= rat
76

b) 6 r-r
C1 e W
O C)
W Z_
C
C) 6 r-r
I C 0)
W U) 0 C) D J
W z
DAYS
Q/ 14 41 LU
DAYS
07 -14

d) rr
c
W
O C)
W Z
e) 6 r-r
I
tm w Cl) 0J
o W Z
C
DAYS
DAYS
01 .1

Table 3.3: Urine ketone of diabetic rats treated with Artemisia judaica ( STZ was given on day 7 and treatment begun on day 17. & n. d = not determined)
Urine Ketone DAYS RATZ RAT2 RAT3 RAT4 RAT5 RAT6
1 -ve -ve -ve -ve -ve -ve
2 -ve -ve -ve -ve -ve -ve
3 -ve -ve -ve -ve -ve -ve
4 -ve -ve -ve -ve -ve -ve
5 -ve -ve -ve -ve -ve -ve
6 -ve -ve -ve -ve -ve -ve
7 -ve -ve -ve -ve -ve -ve
11 ++ ++ + n. d. +++ +++
12 +++ ++ + +++ +++ +++
13 +++ +++ ++ ++ +++ ++
14 +++ +++ +++ +++ +++ +++
15 +++ +++ +++ +++ +++ +++
16 ++ ++ +++ +++ +++ +++
17 +++ +++ ++ +++ +++ +++
21 + ++ ++ ++ ++ n. d.
22 ++ + + -ve + n. d.
23 -ve + + -ve ++ n. d.
24 -ve -ve -ve ++ -ve n. d.
25 + -ve -ve -ve -ve n. d.
26 + -ve -ve -ve + n. d.
77

Table 3.4: Faeces (g) weight of diabetic rat treated with Arlemisia judaica ( STZ was given on day 7 and treatment begun on day 17. & n. d = not determined)
Faeces Weight(g DAYS RATZ RAT2 RAT3 RAT4 RAT5
1 3.30 6.31 4.91 8.50 4.91
2 6.50 9.90 5.780 7.80 5.60
3 7.50 11.4 11.1 6.20 7.40
4 6.50 6.50 5.50 12.0 7.50
5 9.00 9.50 11.0 7.50 5.90
6 8.50 7.50 6.00 n. d n. d
7 8.50 7.50 6.00 n. d n. d
11 10.5 16.0 10.0 13.5 20.0
12 15.0 5.50 7.50 14.0 10.5
13 10.0 9.30 13.5 20.0 18.0
14 15.0 10.4 12.5 17.0 14.0
15 14.2 14.43 10.0 15.0 10.5
16 18.5 16.5 17.0 16.0 13.5
17 n. d n. d n. d n. d. n. d.
21 n. d. 16.0 18.5 19.0 n. d.
22 n. d. 11.5 14.0 15.1 n. d.
23 n. d. 11.5 13.5 13.5 n. d.
24 n. d. 16.5 15.5 16.5 n. d.
25 n. d. 19.0 16.5 17.0 n. d.
26 n. d. 16.0 24.4 14.0 n. d.
78

3.4 Discussion:
Before discussing the results obtained from the in-vivo experiments, a few
general comments concerning the overall results need to be made. One problem experienced during this project, which is common to all in-vivo experimentation, is
subject individuality which can possibly cause a wide range of variance between
experimental groups and individual animals within an experimental group. We tried to
minimise this problem by using each animal as its own control - i. e. the same animal
was assessed before treatment, after induction of diabetes and during Artemisia
treatment, as and where appropriate. One other biological variation has to be
considered, however, and that is the plant. The site from which the plant was collected
and the time of plant collection as well as the maturity of the plant at collection time
can lead to variance and different in the results. Where possible a full set of experiments
was performed with a single extraction of the plant material. Another significant limitation on the project directly related to the in-vivo
experiments was that the fluid intake in all diabetic animals was significantly reduced in
the presence ofArtemisia extract due to the bitter taste. This led to dehydration of the
animals which caused a significant decrease in the body weight in 5 rats and, indeed, one
of the rats (rat 6) was sacrificed due to excessive weight loss. This led to a modification
of the experimental schedule as described above. One of the first observations made early on in the experiments was that the
animals suffered from stress upon entry into the metabolic cages. This was manifested as
agitated behaviour, increased urine volume and glucose content (stress polyuria and
glycosuria), reductions in food and fluid intake which increased the apparent weight loss
in the rats during the first 24 hours. This problem was overcome by not taking
measurements from the rats until they had been in the metabolic cages for 24 hours.
This meant most animals had re-established a normal food and fluid consumption
patterns by the start of the recording period. The induction of diabetes with STZ was followed by a three day recovery period
to reduce the chance that any experimental compounds were producing seemingly beneficial effects simply by acting as radical scavengers and preventing or reducing the
effects of STZ. The diabetogenic effect of STZ seen in the present study is in agreement
79

with those who have previously reported a severe hyperglycaemia and glucosuria in rats (Bone, 1990, Salhanick et al., 1983).
The initial investigation ofArtemisia judaica extract in normal animals produced interesting results. Urine volume was found to increase substantially despite fluid intake
remaining at a constant level. This would suggest that Artemisia judaica is itself acting
as a mild diuretic. We were concerned about the apparent presence of glucose in the
urine of normal animals following exposure to Artemisia extract in the first 6 rats. A
possible explanation for this may be the presence of a substance in the Artemisia extract that reacts in the glucose assay but which is not re-absorbed through the kidney. Indeed,
assay of the Artemisia extract itself revealed that there is a cross-reacting substance in
the extract, the nature of which is unknown at present (giving an apparent glucose
reading of 3.49 g/l). Some preliminary ideas about the contents of the extract are discussed later. The effect noted may be similar to an osmotic diuretic (e. g. mannitol).
The effect of Artemisia extract on the STZ diabetic animals was fairly small but
included a decrease in glucose urine level in the last 2 days of treatment and a decrease
in the presence of ketones from the urine within 72 hours of the extract first being
administered. This reduced incidence and severity of ketosis would suggest that there is
an improvement in the handling or catabolism of lipids, both of which would be
beneficial in diabetes. There is, thus, some indication that a crude extract of Arlemisia
judaica can alleviate some of the symptoms of diabetes mellitus. The overall lack of dramatic effect of treatment with Artemisia extract in the in-vivo experiments could be
due to an inadequate dose of Artemisia or to the relatively short treatment period. These experiments will need to be repeated with larger doses ofArtemisia extract (if the
animals will drink it) and / or longer periods of treatment.
80

4. Post In-Vivo liver parameters At the end of the in-vivo experiments described above, the animals were
sacrificed, the liver removed and washed and microsomes prepared as described in
Materials & Methods. The following results were obtained:
4.1 Liver weight as percentage (%) of body weight
The effect of streptozotocin-diabetes and treatment with Artemisia extract on liver weight (as % of body weight) are shown in Figure 4.1. The administration of
streptozotocin caused a significant decrease in liver weight (expressed as % of body
weight) as compared to normal livers (p<0.05). An extract of Artemisia given to
streptozotocin-induced diabetic rats caused the liver weights to return to normal and, in
some instances, above normal. The same observation was seen when Arlemisia extract was given to normal rats.
4.2 Liver protein content:
The effect of streptozotocin on hepatic microsomal protein content in normal
rats and the effects of Artemisia extract in diabetic rats is shown in Figure 4.2. The
administration of streptozotocin induced a significant increase in protein content (p<0.05) whereas the extract of Artemisia given to normal rats caused a decrease in
protein content. To make sure this was an effect of Artemisia extract in-vivo and not
something interfering with the protein assay, the extract was added to microsomes in
vitro and caused no change in protein content.
4.3 Aniline 4-hydroxylase activity:
The effect of streptozotocin-induced diabetes and treatment with Artemisia
extract on aniline 4-hydroxylase activity (expressed as nmol product/min/mg protein) is
shown in Figure 4.3. The administration of streptozotocin caused a significant increase
(p<0.01) in the enzyme activity. This increase was partially reversed by the
administration of Artemisia extract to the diabetic rats but there was no significant
effect on the enzyme
81

Figure 4.1 The effect of diabetes and Artemisia extract treatment on liver weight as percentage (%) of body weight. Control = untreated; NOR + ART(VIVO) = normal rat treated with Artemisiajudaica
in-vivo; DIA + ART(VIVO) = diabetic rat treated with Artemisia judaica in-vivo, *= p<
0.05 compared to control
Results expressed as mean ± s. d. (for normal n=9 and diabetic and diabetic treated with
Arlemisla judaica n= 6)
82

NORMAL
NOR+ART(VIVO)
DIABETIC
DIA+ART(VIVO)
0.0 2.5 5.0 7.5 10.0
% OF BODY WEIGHT

Figure 4.2 The effect of diabetes and Artemisia extract treatment on liver protein content. Control = untreated; NOR + ART. (VITRO) = normal rat treated with Artemisia judaica
in-vitro; NOR + ART(VIVO) = normal rat treated with Artemisiajudaica in-vivo; DIA
+ ART(VIVO) = diabetic rat treated with Artemisia judaica in-vivo, *= p< 0.05
compared to control.
Results expressed as mean ± s. d. (for normal n=9 and diabetic and diabetic treated with
Ar/emisia judaica n= 6).
83

NORMAL
NOR+ART(VITRO)
NOR+ART(VIVO)
DIABETIC
DIA+ART(VIVO)
10 15 20
PROTEIN CONTENT (nmol/min/mg prot. )

Figure 4.3 The effect of diabetes and Artemisia extract treatment on aniline 4- hydroxylase. Control = untreated; NOR + ART. (VITRO) = normal rat treated with Artemisia judaica
in-vitro; NOR + ART(VIVO) = normal rat treated with Artemisia judaica in-vivo; DIA
+ ART(VIVO) = diabetic rat treated with Artemisia judaica in-vivo, ** = p< 0.01
compared to control rat &t= p<0.05 compared to diabetic rat.
Results expressed as mean ± s. d. (for normal n=9 and diabetic and diabetic treated with
Arlemisia judaica n= 6).
84

NORMAL
NOR+ART(VITO
NOR+ART(VIVO)
DIABETIC
DIA+ART(VIVO)
**
0.0 0.1 0.2 0.3 0.4 0.5 0.6
ENZYME ACTIVITY (nmol/min/mg)

activity when Artemisia was added directly to normal microsomes (in-vitro). Normal
rats treated with Artemisia extract showed little decrease in the enzyme activity.
4.4 Aminopyrine N-demethylase activity:
The effect of streptozotocin-induced diabetes and Artemisia extract treatment of
normal and diabetic rats on aminopyrine N-demethylase activity is shown in Figure 4.4.
The administration of streptozotocin caused a significant decrease in enzyme activity (p<0.01). This decrease was reversed by the administration of Artemisia extract to
diabetic rats. The administration of Artemisia to normal rats showed no significant
effect on the enzyme activity where as the addition of Artemisia extract directly to
normal microsomes gave a significant increase in enzyme activity (p<0.05).
4.5 Liver steroid metabolism :
The effects of streptozotocin-induced diabetes and treatment with Arlemisia
extract on the five enzymes which metabolize the steroid androst-4-ene-3,17-dione are
shown in Figures 4.5-4.9. The administration of streptozotocin induced a decrease in all
of the enzyme activities except the 7a-hydroxylase, but when Artemisia extract was
given to diabetic rats a significant increase in all enzyme activities was seen, especially
the 7a- and 60-hydroxylases (p<0.001) and the 5a-reductase (p<0.05). The addition of Artemisia extract directly to normal microsomes caused a significant change in all
enzyme activities except the 16a-hydroxylase whereas the administration of Artemisia
extract to normal rats caused a significant decrease in 17-oxosteroid oxidoreductase and
16a-hydroxylase activities but no significant change in 7a-hydroxylase and 5et-
reductase activities.
85

Figure 4.4 The effect of diabetes and Arlemisia extract treatment on aminopyrine N- demethylase activity. Control = untreated; NOR + ART. (VITRO) = normal rat treated with Artemisia judaica
in-vitro; NOR + ART(VIVO) = normal rat treated with Artemisiajudaica in-vivo; DIA
+ ART(VIVO) = diabetic rat treated with Artemisiajudaica in-vivo, *= p<0.05, **_
p< 0.01 compared to control rat & ttt = p<0.05 compared to diabetic rat.
Results expressed as mean ± s. d. (for normal n=9 and diabetic and diabetic treated with
Artemisia judaica n= 6).
86

NORMAL
NOR+ART(VITO
NOR+ART(VIVO)
DIABETIC **
DIA+ART(VIVO) ttt
0.1 0.2 0.3 0.4 0.5 0.6 0.7 0.8
ENZYME ACTIVITY (nmol/min/mg)

Figure 4.5 The effect of diabetes and Artemisia extract treatment on liver steroid metabolism (7(x-hydroxylation of androst-4-ene-3,17-dione) by liver microsomes. Control = untreated; NOR + ART. (VITRO) = normal rat treated with Artemisiajudaica
in-vitro; NOR + ART(VIVO) = normal rat treated with Artemisia judaica in-vivo; DIA
+ ART(VIVO) =diabetic rat treated with Artemisia judaica in-vivo. ** = p< 0.01, **
= p<0.001 compared to control rat & ttt = p<0.001 compared to diabetic rat.
Results expressed as mean ± s. d. (for normal n=9 and diabetic and diabetic treated with
Artemisia judaica n= 6).
87

NORMAL
NOR+ART(VITRO)
NOR+ART(V VO)
DIABETIC
DIA+ART(VIVO)
**
*** ttt
50 100 150 200 250 300 350 400
ENZYME ACTIVITY (AS % OF CONTROL)

Figure 4.6 The effect of diabetes and Artemisia extract treatment on liver steroid metabolism (160-hydroxylation of androst-4-ene-3,17-dione) by liver microsomes. Control = untreated; NOR + ART. (VITRO) = normal rat treated with Artemisia judaica
in-vitro; NOR + ART(VIVO) = normal rat treated with Artemisia judaica in-vivo; DIA
+ ART(VIVO) = diabetic rat treated with Artemisia judaica in-vivo, *= p< 0.05
compared to control.
Results expressed as mean ± s. d. (for normal n=9 and diabetic and diabetic treated with
Arlemisia judaica n= 6).
88

NORMAL
NOR+ART(VITRO)
NOR+ART(VIVO)
DIABETIC
DIA+ART(VIVO)
50 100 150 200
ENZYME ACTIVITY (AS % OF CONTROL)

Figure 4.7 The effect of diabetes and Artemisia extract treatment on (60-hydroxylation of androst-4-ene-3,17-dione by rat liver microsomes. Control = untreated; NOR + ART. (VITRO) = normal rat treated with Artemisia judaica
in-vitro; NOR + ART(VIVO) = normal rat treated with Artemisiajudaica in-vivo; DIA
+ ART(VIVO) = diabetic rat treated with Artemisia judaica in-vivo, *= p<o. o5, ** =
p< 0.01 compared to control rat & ttt = p<0.001 compared to diabetic rat.
Results expressed as mean ± s. d. (for normal n=9 and diabetic and diabetic treated with
Artemisia judaica n= 6).
89

NORMAL
NOR+ART(VITRO)
NOR+ART(VIVO)
DIABETIC
DIA+ART(VIVO)
..
**
**
*** ttt
50 100 150 200 250 300
ENZYME ACTIVITY (% of control)

Figure 4.8 The effect of diabetes and Artemisia extract treatment on 17a(ß)- hydroxysteroid dehydrogenase of androst-4-ene3,17-dione by rat liver microsomes. Control = untreated; NOR + ART. (VITRO) = normal rat treated with Artemisia judaica
in-vitro; NOR + ART(VIVO) = normal rat treated with Artemisiajudaica in-vivo; DIA
+ ART(VIVO) = diabetic rat treated with Artemisiajudaica in-vivo, *= p<o. o5, ** _
p< 0.01 compared to control rat & ttt = p<0.001 compared to diabetic rat...
Results expressed as mean ± s. d. (for normal n=9 and diabetic and diabetic treated with
Artemisia judaica n= 6).
90

NORMAL
NOR+ART(VITRO)
NOR+ART(VIVO)
DIABETIC ***
DIA+ART(VIVO) ** ttt
50 100 150 200
ENZYME ACTIVITY (AS % OF CONTROL)

Figure 4.9 The effect of diabetes and Artemisia extract treatment on 5a-reductase of androst-4-ene3,17-dione by rat liver microsomes. Control = untreated; NOR + ART. (VITRO) = normal rat treated with Artemisia judaica
in-vitro; NOR + ART(VIVO) = normal rat treated with Artemisia judaica in-vivo; DIA
+ ART(VIVO) = diabetic rat treated with Artemisia judaica in-vivo, *= p<0.05, ** _
p< 0.01 compared to control rat & ttt = p<0.001 compared to diabetic rat..
Results expressed as mean ± s. d. (for normal n=9 and diabetic and diabetic treated with
Artemisia judaica n= 6)
91

NORMAL
NOR+ART(VITRO)
NOR+ART(VIVO)
DIABETIC ***
DIA+ART(VIVO) ** ttt
50 100 150 200 250 300
ENZYME ACTIVITY (AS % OF CONTROL))

4.6 Discussion of Results for Liver Parameters
It has previously been shown that induction of the diabetic state causes a decrease in the liver weight (Rouer and Leroy, 1980), and that this may be due to a decreased plasma insulin level resulting in a decrease in hepatic lipid and glycogen
storage (Pugazhenthi and Khandelwal, 1990). This would also result in an increase in
liver protein content, since if lipid and glycogen storage was decreased and there was
therefore a decrease in liver weight, there would be an increase in the amount of protein in each gram of tissue. The results shown here are consistent with previous findings.
The change in liver weight was reversed by treatment with Artemisia extract.
It has previously been shown that the metabolism of various drugs is strikingly
altered by the diabetic state (Defeng et al., 1993). Induction of the diabetic state caused
a marked change in the enzyme activity of certain forms of cytochrome P450. These
were cytochrome P4502E1, which was increased, and the cytochromes P450 of the 2B
and 2C subfamilies, which were decreased. The induction of the diabetic state inhibits
the microsomal oxidation of drugs such as aminopyrine by a marked decreased in the
activity of the cytochromes P450 of the 2B and 2C subfamilies but increases the
oxidation of aniline (Defeng et al., 1993), which is known to be an effective substrate for cytochrome P4502E1. It is possible to measure the enzyme activity of these 3 forms
of cytochrome P450 as described by Gibson and Skett (1994). By using the assay of
aniline 4-hydroxylase activity described earlier, it is possible to measure the enzyme
activity of the 2E1 form of cytochrome P450. The assay of aminopyrine N-demethylase
used was that described by Nash in 1953 to measure the formation of formaldehyde and is a function of the enzyme activity of the 2B and 2C subfamilies of cytochrome P450.
The overall metabolism of the steroid, androst-4-ene-3,17-dione has been shown
to be decreased in diabetic animals (Reinke et al., 1978) although there are reports of
increases in some specific enzyme activities (Skett and Joels, 1985). The results
presented here are consistent with those found earlier although the increase in 7a.
hydroxylase and 5a-reductase seen in earlier work are not seen here. Artemisia extract
treatment of the diabetic animals reversed or partially reversed the effects of diabetes on
aniline, aminopyrine and androst-4-ene-3,17-dione metabolism. The addition of
Artemisia extract directly to microsomes gave some unexpected results with a
92

significant increase in aminopyrine N-demethylation and androst-4-ene-3,17-dione
metabolism indicating that some of the effects of the Artemisia extract may be direct on
the microsomal enzymes whereas the other effects may be indirect (e. g. that on aniline
metabolism). The nature of the active principles of the Artemisia extract giving these
effects is / are at present unclear.
93

5. Clinical Experiments
The following results were obtained from a small series of patients examined at the Al-
Afia Houn Hospital. Each patient was treated individually as noted and blood glucose
was assayed by the technique described in the Materials and Methods.
Patient 1"A man (43 years) with mild diabetes of 5 years duration. This patient had
undergone therapy with Artemisia judaica and Marrubium vulgare with a controlled diet for approximately three years. The patient was asked to stop his own treatment
with Artemisia judaica and Marrubium vulgare extract for the period of the study. His
blood glucose levels varied from 162-180 mg/ml before treatment with Artemisia
extract and 135-159 mg/ml after a 2-7 day period of treatment with Artemisia extract (Figure 5.1(1))
Patient 2: A man of 20 years who had been treated with insulin injection (40 Lu. once daily). The patient was then given Artemisia extract as described three times daily
together with the pre-existing insulin therapy. On insulin alone the blood glucose
concentration was 180-192 mg/ml, which fell to 160 mg/ml after 6 days treatment and 107 mg/ml after 9 days treatment with Arlemisia extract. The insulin dose was
subsequently reduced to 20 i. u. /day and the blood glucose level rose to 150-152 mg/ml (Figure 5.1 (2)).
Patient 3: A man (age 17 years) who had been treated with plant extracts (one of them being Artemisia judaica) since being a juvenile. He had stopped using the Arlemisia
because when he took it he suffered from bradycardia. He had asked the doctor to
replace his treatment with lente insulin injection. The patient was given 40 i. u. /day
insulin. We asked the patient to use Artemisia extract with insulin. The patient had
polyuria, polydipsia and polyphagia with insulin treatment alone. Blood glucose levels
varied between 180 and 210 mg/ml without Artemisia extract and declined from 200 to
158 mg/ml over a5 day treatment period with Artemisia extract (Figure S. 1(3)).
94

Patient 4: A man (aged 24 years) with diabetes of one year duration, He had been
treated with diet restriction and insulin (30 i. u. am. and 20 i. u. pm). This was the first
time he had used Artemisia extract but he knew that the plant is widely used by diabetics. Prior to taking the Artemisia extract his blood glucose levels were 231-371
mg/ml and continued to varying widely during a 10 day treatment with the extract ( 310
mg/ml on day 3 of treatment, 104 mg/ml on day 5,327 mg/ml on day 8 and 53 mg/ml on day 10) (Figure 5.1(4)).
Patient 5: A woman of 55 years with diabetes mellitus of eight years duration. She had
used hypoglycaemic agents (Daonil®) and used Artemisia and other plants at some times. This patient was asked to stop the self-administration of these plants for the duration of the study. Her blood glucose levels varied from 288-325 mg/ml before
administration of Artemisia extract and was reduced to 205 mg/ml after 2 days
treatment with the extract. Her blood glucose level continued to fall to 180 mg/ml at day 5 and 168 mg/ml on day 7 of treatment (Figure 5.1(5)).
Patient 6: A man of 60 years with mild diabetes of 20 years duration. He had used Artemisia judaica extracts for a long time but at irregular intervals and he did not feel
any side effects of the treatment. His blood glucose levels were unchanged by treatment
with Artemisia extract (174-228 mg/ml before and 170-250 mg/ml after) (Figure
5.1(6)).
95

Figure S. 1 Effect of treatment on blood glucose levels.
1= Patient(1), 2= patient(2), 3= patient(3),
4= patient(4), 5= patient(s) &6= patient(6)
96

1) 200 r
c, 150 E
00 100 7
a 13 ö 50 m
3) 250 Artemisia + Insulin (40 i. u. )
E 200 1
rn E 4) 150 Insulin (40 Lu. )
0 5 100
50
0
02468 10 12 14 16
Days
350 5)Hypoglycaemic
drug (Daonil
300 E E 250
U) 200 0 V
150 Artemisia + Hypoglycaemic drug
100 (Daonil') co 50
0 02468 10 12 14 16
Days
2) Artemisla + Insulin (40 i. u. )
200
E 150
t
Insulin (40 i. u. ) O
100 0
to 50 Artemisia + Insulin (20 i. u. )
01 ... 02468 10 12 14 16 18
Days
4)
400 Insulin (30 Lu. am & 20 Lu. pm)
., 350 C,
300 E
250
ü 200 Artemisla + Insulin
2 150 (30 Lu am & 20 i. u pi 100
50
0 02488 10 12 14 16 18 20
Days
6) 300 r
250 rn E 200 dl N
ü 150
0
.8 100 s co 50
0111fIL, 1
02468 10 12 14 16
Days
of 1 02468 10 12 14 16
Days

5.1 Discussion:
Several diabetic patients in Libya have reported benefit to their diabetic
symptoms of polyuria and polydipsia and a gain in body weight upon daily consumption
of the aqueous extract of Artemisia judaica. It is well known to most diabetic patients
and grows in several countries such as Libya , Egypt, other parts of Africa and the
Middle East as well as the United States.
Due to the long history of use of this plant and its efficacy and safety, we were
encouraged to perform an evaluation of the effects of Artemisia judaica on blood
glucose in diabetic patients and also to see whether the extract caused any side effects.
The results showed that Artemisia judaica had a potent therapeutic value in
treating some patients with diabetes as it significantly reduced blood glucose to near the
normal level (80-120 mg/ml). Patients 1,2 and 4 responded well to Ariemisia extract but patient 3 had no response after 2 weeks of treatment showing little reduction in
blood glucose levels. Patient 4 responded to Ariemisia judaica except on day 17 where
a significant increase to 317 mg/ml in blood glucose concentration was seen. Patient 6
had no response to the treatment with Artemisia extract.
The extract seemed to have no side effects except in patient 3 who still suffered
from bradycardia but all of the diabetic symptoms had disappeared .
These results suggest that Artemfsia judaica contains material capable of
reducing blood glucose and improving diabetic symptoms but this is only a small-scale
clinical trial and much more work, including a full-scale clinical trial, needs to be
performed before it can be said that Artemisia judaica extract is a worthwhile treatment
for diabetes mellitus.
97

6. In-Vitro Experiments (Isolated Hepatocytes)
6.1 Androst-4-ene-3, I7-dione Metabolism
6.1.1 The effects of insulin and crude extracts of Artemisia judatca
The assay for the metabolism of androst-4-ene-3,17-dione allows the
measurement of five different enzyme activities: the 7a-hydroxylase, 60-hydroxylase,
16c -hydroxylase, 17-oxosteroid oxidoreductase (OHSD) and the 5a-reductase. The
data in the tables are expressed as a percentage of relevant control values for each
experiment as the control values can vary depending on the animal from which the cells
were taken. To avoid this inter-experiment variation, control, and insulin-treated cells
were assayed in all experiments to compare to extract-treated cells. The results of the
first experiment (1/2 hour &1 hour) in experiment two are shown in Tables 6.1 and
6.2.
It is seen that neither insulin (at 10-6 and 10-9M) nor the crude extract of Artemisia judaica had very much effect on steroid metabolism. There were some
decreases in 5a-reductase activity with 10-9M insulin (p<0.001) and in 7a-, 6p- and
16a-hydroxylase activities with Artemisia extract and Artemisia extract with insulin (10' 6M) (p<0.05), but Artemisia extract with insulin (10'9M) had no effect on steroid
metabolism. This result is in stark contrast to those of Hussin & Skett (1986) who
found marked increases in the metabolism of androst-4-ene-3,17-dione in the presence
of insulin. The reason(s) for this discrepancy were, thus, investigated.
6.1.2 Effect of animal weight / age
The first difference noticed between the experiments described here and those of Hussin
& Skett (1986) was the age (size) of the animals used. Hussin & Skett (1986) used
smaller animals (200-250g). The experiment was, thus, repeated using the
98

Table 6.1: The effect of insulin (10-6M & 10-9M) and Arlemisia judaica (A10=0.02g/ml, A. j=0.2g/ml) on the 7a-, 60-, and 16cc-, hydroxylase, 17a(p)- hydroxysteroid dehydrogenase and 5a-reductase after 1/2 hour of preincubation in hepatocytes obtained from normal rat, p values relative to control values were obtained by ANOVA followed by Dunnet's test *= p<0.05, ***- p<0.001. Results are expressed as percentage of the relevant control and mean ± s. d., (n=5).
Enzyme Activity (expressed as % of control)
GROUP 7a-0H 6ßOH 16a-0H 17-01SD 5a-Red.
Control 100±18.14 100115.8 100±13.8 100±20.6 100±30.0
Insulin 10-6 M 85.9±19.6 96.6±15.7 85.6±15.9 102.4113.7 86.5±9.80
Insulin 10'9M 72.0±22.5 87.5±43.2 96.3±52.5 94.7±8.60 49.6±8.03***
A10 85.3±10.4 105.0±16.2 105.0±18.2 103.7±19.8 87.6±25.3
A10 + 10-6M 88.2±21.9 103.2126.3 100±28.4 92.8±25.6 85.7±27.0
A10+ 10'9M 91.6±34.7 95.4130.1 87.4±25.6 92.5±32.3 95.1±28.5
A. j 61.9±24.4* 70.9±19.9* 65.2±25.3* 99.2±38.7 84.5±42.8
A. j + I'M 66.31±13.8* 76.3±8.20* 67.95±18.5* 90.3±23.6 75.2±17.1
A. j + r9M 88.0±14.0 104.7119.9 95.1±19.9 106.9±31.6 106.0±44.4
99

Table 6.2: The effect of insulin (10,6M & 10"9M) and Artemisia judaica (A. j=0.2, A10=0.02, A100=0.002, A1000=0.0002 g/ ml) on the 7a-, 60- and 16a-, hydroxylase, 17a(ß)- hydroxysteroid dehydrogenase and 5a-reductase after 1 hour of preincubation in hepatocytes obtained from normal rat, p values relative to control values were obtained by ANOVA followed by Dunnet's test *=p<0.05. Results are expressed as percentage of the relevant control and mean f S. D, (n=5).
Enzyme Activity (expressed as % of control)
GROUP 7a-OH 600H 16a-OH 17-OHSD 5(x-Red.
Control 100±28.7 100±27.0 100±24.1 100±22.2 100±40.1
Insulin(r6M) 110.9±29.7 102.6±40.7 121.2±14.7 119.7±24.4 104.3±76.6
Insulin(r9M) 105.0±32.4 106.2±27.5 85.4±11.9 109.3±24.8 102.4±36.0
A10 107.518.50 114.41 12.7 108.8±5.68 116.0±9.26 82.91 15.4
A10 + I-6M 104.8±22.1 95.2±20.6 81.6113.9 132.0±49.1 94.2±39.8
A10 + r9M 84.1±26.3 82.1±35.3 76.0122.4 92.9±45.3 71.9±42.3
A100 132.1±10.7 135.0±4.74 116.7± 17.3 130.0±20.3 111.0±40.8
A100 + I-6M 169.7±107.2 77.96±36.0 65.3±25.8 127.6±77.3 126.2±88.4
A100+I'9M 117.3±26.1 100.9±9.03 97.0±26.1 121.9±39.3 95.9±29.5
A1000 141.5±53.1 135.4152.4 152.0±53.9 200.8-+112.8 100.1±66.7
A 1000+ 14M 100±19.6 110.6±20.5 98.2±21.0 108.6121.0 88.44: 23.6
A1000 +r9M 99.2±35.9 91.1±32.8 88.5±32.5 97.6±25.2 81.3±37.0
100

Table 6.3: The effect of insulin (10'6M & 10 9M) andArtemisiaJudaica (A. j 0.2, A10=0.02,
A100=0.002, A1000=0.0002 g/ ml) on the 7a-, 6ß- and 16oc-, hydroxylase. 170t(ß- hydroxysteroid dehydrogenase and Sat-reductase after 1/2 hour of preincubation in hepatocytes obtained from normal (weighed 200g) rat, p values relative to control values were obtained by ANOVA followed by Dunnct's test p<0.05. Results are expressed as percentage of the relevant control and meant S. D. (n-5).
Enzyme Activity (expressed as % of control)
GROUP 7a-0H 60OH 16a-OH 17-OHSD 5a-Red.
Control 100±14.2 100±6.74 100±9.00 100±11.6 100114.1
Insulin(I-6M) 142.5±31.3 122.4±44.2 147.7±48.1 155.1±60.2 154.8±76.8
Insulin(I"9M) 111.016.11 107.2±1.84 120.2±19.9 105.2±14.2 97.9±15.3
A10 169.4±30.8 119.2±58.8 133.4±75.3 94.1144.9 112.0±78.8
A10 + 1-6M 101.7±25.9 83.1±21.6 84.6±25.6 75.1±12.1 73.5±13.8
A10 + 1-9M 119.1±30.1 114.5±23.7 113.2±42.3 75.1±12.8 73.5±13.8
A100 139.9±39.4 110.3±22.6 124.7±20.9 104.916.56 100.5±15.0
A100 + 1-6M 154.8±30.6* 1423±32.5 146.9132.0 150.7±30.2 74.7±10.9
A100 + I-9M 133.3±18.8 126.1±27.9 166.5±24.2 131.3±21.3 144.2±15.0
A1000 124.5±14.7 96.1±14.2 115.4124.0 76.8±13.7 91.3±47.8
A1000+I-6M 149.1131.8 126.5±14.1 142.3±30.9 95.4±22.3 89.4111.6
A1000+1-9M 125.9±30.1 79.9±17.0 82.7125.6 97.6±10.1 94.6116.2
101

hepatocytes obtained from a 200g male rat as shown in Table 6.3. As is seen, there is
still very little effect of insulin or the Artemisia extract except that the trend towards an increase in 7a-hydroxylase activity in the presence ofArlenilsia extract has now become
significant when 10-6M insulin is added as well. The age of the animal is, thus, of little importance.
6.1.3 Effect of different insulin preparations
The next suggestion was that the insulin, as stored in aliquots in the freezer at - 20°C, had degraded. A fresh batch of insulin was made and used directly for addition. As can be seen in Table 6.4, there was still no significant effect of insulin at either
concentration. There was very little effect of the Artemisia extract except for a
significant increase in 60-hydroxylase activity in the presence of 10-9M insulin. It is
unlikely, therefore, that the insulin stability was at fault. In the experiments of Hussin &
Skett (1986), a porcine insulin preparation from Novo (Denmark) and Neulente®Zinc
insulin (Wellcome, U. K. ) was used whereas in these experiments a similar preparation from the Sigma Chemical Co. (U. K. ) was used. Could this be the difference? The
various insulin preparations and different times were tried in one experiment and the
results shown in Tables 6.5a-e. None of the insulin preparations tested had any
significant effect on androst-4-ene-3,17-dione metabolism.
6.1.4 Effect of Different Culture Media
The above experiments were performed in Ham's F"10 medium but recent
experiments in this laboratory have indicated that this is not the best medium for the
maintenance of liver-specific functions in isolated rat hepatocytes (Skett, 1994). It was,
thus, decided to test the effects of insulin and Artenmisia extract in Williams' E medium
and in Ham's F-10 in the absence of albumin (in case the insulin was binding to the
albumin and being inactivated). As shown in Tables 6.6 and 6.7, neither of these
changes altered the lack of effect of insulin or Artemisia extract. Although there were
some trends to increases and decreases, there was no significant change in the activities
measured.
102

Table 6.4: The effect of insulin (10,6M & 10'9M) and Artemisia judaica (A10=0.02 g / rnl) on the 7a-, 60- and 16a-, hydroxylase, 17a(ß)- hydroxysteroid dehydrogenase
and 5a-reductase after 1/2 hour of preincubation in hepatocytes obtained from normal
rat, p values relative to control values were obtained by ANOVA followed by Dunnet's
test (* =p<0.05). Results are expressed as percentage of the relevant control and mean ± S. D, (n=5)
Enzyme Activity (expressed as % of control)
GROUP 7(x-OH 6AOH 16a-OH 17-OIISD 5a-Red.
Control 100114.1 100±9.71 100± 15.7 10017.28 10014.94
Insulin(I6M) 116.9±41.4 90.2±14.6 99.8±14.1 95.6±3.84 93.4±21.4
Insulin(I'9M) 132.6±16.8 117.3±7.81 116.1±7.83 107.7±7.90 90.9113.7
A10 135.9±31.3 116.7±20.2 110.2±13.1 96.6±3.84 92.4±6.60
A10 + I6M 115.4±9.70 110.9±4.30 117.2±2.42 98.4±7.82 92.9±6.10
A10 + r9M 137.9±13.7* 120.7±7.85; 100.1±4.86 101.6±7.60 100.0±20.9
103

Table 6.5: The effect of different types of insulin (IP=isophane porcine insulin,
Blnew=bovin insulin new stock & BIold=bovin insulin old stock) on the 7a-, 6ß-, and
16a-, hydroxylase, 17a(ß)- hydroxysteroid dehydrogenase and Sa-reductase after
a=5min., b=l0min., c=l5min., d=20min., e=1/2hour of preincubation in hepatocytes
obtained from normal rat, p values relative to control were obtained by ANOVA
followed by Dunnet's
. Results are expressed as percentage of the relevant control and mean f S. D, (n=S)
a)
Enzyme Activity ( expressed % of control)
GROUP 7a-OH 60OH 16a-0H 17-OIISD 5a-Rcd.
Control(1/21u) 100±19.3 100±14.1 100±17.8 100126.6 100±21.5
IP (10-6M) 89.0±14.8 93.8112.2 102.3120.5 113.1±13.3 102.0122.7
Blnew, 10.6M 77.1±14.1 78.4119.5 94.0±24.3 100.5±19.0 98.4±19.9
BIold, 10.6M 76.7±22.9 80.7±24.8 92.4125.3 98.0116.3 91.6±14.9
104

b)
Enzyme Activity (expressed as % of control)
GROUP 7a-OH 600H 16a-0H 17-OIISD Sa-Red.
Control(1/2hr) 100±13.96 100±2.24 100±5.64 100±20.1 100±5.99
IP (10-6M) 106.1±11.4 80.9±9.49 75.2±3.39 89.8111.9 87.6±7.06
Blnew, 10-6M 118.8±9.94 109.0±4.61 91.1±19.5 99.5119.0 113.2±13.4
BIold, 10-6M 107.7±20.7 101.6±25.7 90.4±22.3 108.616.35 110.6±12.1
C)
Enzyme Activity (expresscd as % of control
GROUP 7a-OH 600H 16a-OH 17-OHSD Sa-Red.
Control(1/2hr) 100±14.3 100±24.5 100±21.4 100140.8 100129.8
IP (10-6M) 95.9±16.4 109.9±9.20 100.6±6.29 102.4±13.9 95.0±17.6
BInew, 106M 103.6±16.7 100.0±20.3 106.2±22.4 113.7±16.99 96.8±7.97
BIold, 10'6M 117.4±27.8 121.2±34.3 124.7±40.4 89.6±23.9 89.3±14.2
105

d)
GROUP
Control(1/2hr)
7a-OH
100±28.6
Enzyme Activity (expressed as % of control)
6ßOH 16a-0H 17-OHSD
100±23.8 100±20.7 100±20.3
5a-Red.
100±22.5
IP (10-6M) 72.99±6.46 85.5±23.9 79.75±11.9 81.3±17.9 94.8±10.1
BInew, 10'6M 82.8±22.75 87.2±22.5 73.1±18.9 81.9±8.43 88.37±17.5
BIold, 10"6M 116.3±40.6 87.8±34.6 94.9±31.5 87.0±6.42 81.5±2.95
e)
Enzyme Activity ( expressed as % of control )
GROUP 7a-OH 6ßOH 16a-0H 17-0IISD 5a-Rcd.
Control(1/21u) 100±19.3 100±14.1 100±17.8 100±26.6 100±21.5
IP (10'6M) 89.0±14.8 93.8±12.2 102.3±20.5 113.1113.3 102.0122.7
BInew, 10'6M 77.1±14.1 78.4±19,5 94.0±24.3 100.5±19.0 98.4±19.9
BIold, 10'6M 76.7±22.9 80.7±24.8 92.4±25.3 98.0116.3 91.6±14.9
106

Table 6.6: The effect of insulin (10'6M) and Artemisia judaica (A. j=0.2, A10=0.02,
A100=0.002, A1000=0.0002, A10000=0.00002 g/ ml) on the 7a-, 60- and 16a-,
hydroxylase, 17a(ß)- hydroxysteroid dehydrogenase and Sa-reductase after 1/2 hour of
preincubation in hepatocytes obtained from normal rat in Ham's F-10 medium, p values
relative to control values were obtained by ANOVA followed by Dunnet's test *P
<0.05
Results are expressed as percentage of the relevant control and mean :kS. D, (n=5).
Enzyme Activity ( expressed as % of control)
GROUP 7a-OH 6ßOH 16a-OH 17-OHSD 5a-Red.
Control 100±4.40 100±1.89 100±6.43 100±9.81 100±8.76
Insulin(f6M) 120131.3 104.5±20.6 110.8±32.2 83.4±8.60 92.9±9.98
Aj 103.7±18.3 67.2±7.99 83.4±17.7 97.0±20.1 78.0±20.5
A10 104.9±30.5 92.6±0.87 105.3±3.91 98.1113.9 86.8±2.30
A100 130.0±21.3 82.6±17.0 99.3±20.7 92.0113.9 99.8±19.7
A1000 135.6± 16.4 104.5±44.8 123.3±50.2 75.218.75 91.3±4.10
A10000 120.4t11.2* 75.4±5.20* 91.4±1.59 71.7±10.9* 89.2±8.90
A 100 + 1-6M 119.7±9.20 96.7±6.70 111.7±11.9 104.3±14.1 90.0±7.42
A. j + 1-6M 116.0±11.4 68.5±6.70* 74.6±1.40* 92.5±12.2 77.2±3.78*
107

Table 6.7: The effect of insulin (10-6M & 10-9M) and Artemisia judaica (A. j=0.2,
A10=0.02 g/ ml) on the 7a-, 60- and 16a-, hydroxylase, 17a(ß)- hydroxysteroid
dehydrogenase and 5a-reductase after 1/2 hour of preincubation in hepatocytes
obtained from normal rat in William's E medium, p values relative to control values
were obtained by ANOVA followed by Dunnet's test *P = <0.05.
Results are expressed as percentage of the relevant control and mean ± S. D, (n=5)
Enzyme Activity (expressed as % of control)
GROUP 7a-OH 60OH 16a-OH 17-0HSD 5a-Red.
Control 100127.99 100±30.1 100±27.2 100±12.1 100±7.20
Insulin(i61v1) 79.98±9.50 86.1±2.53 94.8±6.28 101.4±10.8 79.713.20
Insulin(r9M) 92.6±27.9 109.2141.3 108.7±18.8 121.2±9.68 110.211.35
A10 76.1±21.4 73.97±18.02 85.014.92 88.5±8.71 78.1±15.0
Aj 86.5±39.2 73.2±9.56* 89.0±3.64 120.8±13.4 103.4±10.6
108

6.1.5 Effect of different periods of pre-incubation
In the study of Hussin & Skett (1986), it was found that the effect of insulin
seen depended on the period during which the cells had been exposed to the hormone.
The greatest effect had been seen at '/2 hour but had disappeared at 1 hour. The timing
of the experiment could, therefore, be crucial. The effect of insulin and Artemisia
extract was tested at periods ranging from 1/2 to 72 hours. No effect of insulin was seen at any of the time points investigated (Tables 6.8-6.12). The time-dependent effects of Artemisia extract were, however, more complex. At %hr with a 10x diluted extract (0.02 g/ml), there was no effect as noted previously and this lack of effect continued
until 4 hours (with a small, though significant, reduction in 60-hydroxylase activity at 1
hour) (table 6.8). With a more concentrated extract (0.2 g/ml), there was still no effect
at 1/2hr but by 1 hour a significant elevation of 16a-hydroxylase and Sct-reductase
activity was seen (table 6.9). At 2 hours post-treatment there was a significant increase
in 7a-hydroxylase activity. All of these effects had disappeared at 4 hours. A repeat of this experiment with a different cell preparation gave substantially similar results (Table
6.10) with significant increases in 6p- and 16a-hydroxylases and 5a-reductase activities
at times after 1 hour. Extension of the period of pre-incubation with Artemisia extract
up to 72 hours did not result in any enhancement of the action of the extract and insulin
(Tables 6.11 and 6.12). There were some significant increases noted (at 24 hours with a
x10 diluted extract on 17-OHSD and 5a-reductase activities) but the most significant feature was a marked decrease in enzyme activities at 72 hours post-treatment (down to
50% of control for the 5a-reductase). The length of time during which the cells are in
contact with the Artemisia extract can, thus, have some bearing on the effects seen but
there is still no consistent effect noted.
6.1.6 Effects of Storage ofArtemisia extract
The crude aqueous extract of Ariemisia judaica was stored frozen at -20°C in
5ml aliquots. These aliquots were defrosted before addition to the cells. Could the
freeze-thawing process have inactivated the extract by destroying the active ingredient?
It was decided to test the effects of a fresh and a frozen extract in the same experiment.
109

Table 6.8: The effect of insulin (I10'6M) and Artemisia judaica (A10=0.02 g/ ml) on the 7a-, 60- and 16a-, hydroxylase, 17a(ß)- hydroxysteroid dehydrogenase and 5a- reductase after 1/2,1,2 &4 hour of preincubation in hepatocytes obtained from normal rat in Ham's F-10 medium, p values relative to control values were obtained by ANOVA followed by Dunnet's test *p <0.05. Results are expressed as percentage of the relevant control and mean ± S. D (n=5)
Enzyme Activity (as expressed of % of control)
GROUP 7a-OH 60OH 16a-0H 17-OIISD 5a-Red.
Control(1/2hr) 100±14.4 100±7.45 100±9.74 100±12.4 100±14.3
A10(1/2hr. ) 99.9±11.1 98.6±1.46 93.4±9.80 88.8±9.18 88.7116.5
Control (Ihr) 100±17.7 100114.9 100±6.28 100±5.26 100±13.3
Insulin(r6M) lhr
86.9±19.6 102.4±13.7 90.5±9.9 112±20.0 106±12.3
A10 (ihr. ) 82.34±18.3 75.8±12.8* 88.4±31.3 91.1117.6 83.5±22.5
Control (2hr. ) 100120.2 100119.2 100±23.8 100±4.80 100±22.7
A10 (2hr) 123.1±19.0 119.5±3.70 109.4110.8 113.618.25 97.6±30.7
Control (4hr. ) 100±16.9 100±8.82 100±19.5 100±10.3 100±30.9
A10 (4hr. ) 93.7114.96 121.9±18.5* 128.4±24.5 108.6±7.48 90.8±11.8
110

Table 6.9: The effect of insulin (10-6M) and Ariemisia jridaica ( A. j=0.2 g/ ml) on the
7a-, 60- and 16a-, hydroxylase, 17a(ß)- hydroxysteroid dehydrogenase and Sa-
reductase after 1/2,1,2 &4 hour of preincubation in hepatocytes obtained from normal
rat, in Ham's F-10 medium, p values relative to control values were obtained by
ANOVA followed Dunnet's test *=p<0.05, ** *=p<0.001-
Results are expressed as percentage of the relevant control and mean f S. D, (n=5)
Enzyme Activity ( expressed as % of control)
GROUP 7a-OH 600H 16a-OH 17-OIISD 5a-Red.
Control(1/2hr) 100±17.0 100±11.7 100±2.22 10018.71 100±5.21
Insulin(I4M) 1/2hr.
107.2±2.73 112.0±6.11 105.2±14.2 99.6±12.3 97.9±15.3
A j(1/2hr. ) 82.4±10.3 99.2±9.10 102.2±9.20 104.2±8.70 102.4±5.50
Control (Ihr) 100±2.50 100±12.2 100±22.7 10014.70 100±16.2
A. j (I hr. ) 102.1±11.4 114.11: 3.40 132.5±10.9* 108.718.80 128.9±15.8*
Control (2hr. ) 100±8.10 100±7.80 100±10.5 100±14.8 100117.3
Insulin(r6M) 105.5±32.4 109.2±24.8 103.2±26.5 102.5±36.0 85.4±11.9
A. j (2hr) (2hr. )
137±13.3*** 119.5±33.3 139.6±33.0* 110.8110.4 103.7±25.0
Control (4hr. ) 100±18.0 100±7.30 100±26.4 10013.13 100119.2
A. j (4hr. ) 115.0±13.6 107.8±23.3 76.7±23.3 99.3±7.00 133.7±39.6
III

Table 6.10: The effect of Insulin (10'6M) and Artemisia judaica (A. j=0.2 g/ ml) on the 7a-, 60-, and 16a-, hydroxylase, 17a(ß)- hydroxysteroid dehydrogenase and 50C- reductase after 1/2,1,2 &4 hour of preincubation in hepatocytes obtained from normal rat in William `E medium, p values relative to control values were obtained by ANOVA followed by Dunnet's' test, *=p0.05, ** *=p<0.001. Results are expressed as percentage of the relevant control and mean ± S. D, (n=5).
Enzyme Activity (expressed as % of control)
GROUP 7a-OH 6ßOH 16a-OH 17-OHSD 5a-Red.
Control(1/2hr) 100±16.8 100±12.1 10017.70 100±7.81 100±12.6
A. j(1/2hr. ) 122.7±25.2 111.1±10.4 110.7±9.80 100±6.0 123.0±17.8
Control (Ihr) 100±9.52 100±12.1 100±18.8 100±16.4 100±23.4
Insulin (ihr) 102.7123.0 110.3±11.4 100.7113.80 89±7.0 113.0±7.8
A. j (Ilu. ) 109.1±18.9 140.8±7.5*** 129.7±12.8* 113.1±18.5 126.8±18.7*
Control (2hr. ) 100±21.6 100±3.36 100±9.34 100±11.28 100±11.0
Insulin (2hr) 110.1±9.04 85.8±9.47 103.9±7.3 92.7±13.0 104.0±20.5
Aj (21u) 112.1±6.04 95.8±3.47 143.9. +4.3*** 112.7±23.5 104.0±17.5
Control (4hr. ) 100±8.17 100±21.1 100±3.0 100±21.0 100+18.0
Insulin (4hr) 10.2±16.8 85.9±14.7 112.9±9.30 121.7±19.5 100.4±6.7
A. j (4hr. ) 112.0±46.96 85.49±24.7 120.9±4.26 112.7±23.5 133.1±2.7**
112

Table 6.11: The effect of Insulin (10-6M) and Artemisiajudaica ( Al0=0.02 g/ ml) on
the 7a-, 60-, and 16a-, hydroxylase, 17a(ß)- hydroxysteroid dehydrogenase and Sa-
reductase after 24,48 & 72 hour of preincubation in hepatocytes obtained from normal
rat, p values relative to control values were obtained by ANOVA followed by Dunnet's
test * *=p<0.01 and p<0.001. Results are expressed as percentage of the relevant control and mean f S. D, (n=5).
Enzyme Activity (expressed as % of control)
GROUP 7a-OH 6AOH 16a-OH 17-OHSD Sa-Rcd.
Control(24hr) 100±20.1 100±18.1 100128.6 100112.6 100±8.16
Insulin (24hr) 116.4±5.6 100.7±15.2 101.0111.5 109.8±17.6 99.0±10.1
A10 (24hr. ) 106.0±6.57 116.7±11.3 111. ±10.9 133.8±10.9** 163.0±19.0**
Control (48hr) 100±37.8 100112.2 100±6.44 100±13.3 100±12.1
A10 (48hr. ) 80.69±23.8 127.3±4.20** 110.8±23.1 103.9±5.70 126.0±33.7
Control (72hr) 100±30.1 100±9.90 100±22.7 100±9.15 100±20.8
A10 (72hr) 66.1±28.9 55.9±7.18*** 83.2±10.5 64.0±5.50*** 51.7±11.9**
113

Table 6.12: The effect of Insulin (10'M) and Artemisia judaica ( A. j=0.2 g/ ml) on the
7a-, 60- and 16a-, hydroxylase, 17a(ß)- hydroxsteroid dehydrogenase and 5a-
reductase after 24,48 & 72 hour of preincubation in hepatocytes obtained from normal
rat, p values relative to control values were obtained by ANOVA followed by Dunnet's.
Results are expressed as percentage of the relevant control and mean ± S. D, (n=5).
Enzyme Activity (expressed as % of control)
GROUP 7a-OH 6ßOH 16a-OH 17-OIISD 5a-Red.
Control(24hr) 100112.1 100±10.5 100±11.8 100±4.30 100±16.5
Insulin (24hr) 106.1±5.60 90.5±15.8 99.5.17.20 96.4±8.58 98.5±11.3
A. j (24hr. ) 86.0±2.50 92.5±7.80 87.4.18.20 88.3±2.85 88.9±10.6
Control (48hr) 100±11.2 100±9.40 100±15.1 100113.2 100±10.7
Aj (48hr. ) 85.7±5.40 86.5±6.30 105.5±12.3 94.715.60 98.817.20
Control (721u) 100±57.1 100±16.1 100±14.7 100±1.80 10015.30
A. j (72hr) 86.3±8.70 91.4±2.90 101.3118.8 119.9±23.1 90.7±7.40
114

The results are shown in Table 6.13. There are no significant changes in any of the
enzyme activities tested with either the fresh or the frozen extract. The result of this
experiment is, thus, inconclusive.
The overall outcome of this series of experiments is disappointing. It was impossible to reproduce the results of Hussin & Skett (1986) with respect to the effects of insulin on androst-4-ene-3,17-dione metabolism. The reasons for this are unclear and require further examination. This means that the results obtained with the crude aqueous
extract of Artemisia judaica are difficult to interpret. We cannot compare the effects of the extract to that of insulin if the insulin itself is not giving the expected effect.
6.1.7 The effect of Preincubation with Marrubiun: vulgare extract :
Exposure of the hepatocytes to different concentrations of a crude aqueous
extract of Marrubium vulgare gave little change in the metabolism of androst-4-ene- 3,17-dione except at high concentration (0.2 g/ml) where a significant decrease in
enzyme activities of the 7a-, 60- and 16a-hydroxylases was seen at 1 hour and smaller
effect at 1/2 hour. (Table 6.14).
6.1.8 The effect of Pre-incubation with Anvillea carcinil :
Table 6.15 shows the effect of a crude extract of Anvillea carcinil on the
metabolism of androst-4-ene-3,17-dione in isolated rat hepatocytes. It is seen that there is no change when different concentrations ofAnvillea extract are used except that after 1 hour Anvillea extract at a concentration of 0.02 g/ml caused a significant decrease in
all enzyme activities. By 4 hours post-treatment, the effects had either disappeared or
reversed with significant increases in 17-OHSD and 5a-reductase activities (Table
6.15).
115

Table 6.13: The effect of Artemisia judaica ( A10=0.02, A, j=0.2 g/ ml) on the 7a-,
60-, and 16a-, hydroxylase, 17a(ß)- hydroxysteroid dehydrogenase and Sa-reductase
after 1/2 hour of preincubation in hepatocytes obtained from normal rat, p values
relative to control values were obtained by ANOVA followed by Dunnet's test
Results are expressed as percentage of the relevant control and mean ± S. D, (n=5)
Enzyme Activity (expressed as % of control)
GROUP 7a-OH 6ßOH 16(x-OH 17-OHSD 5a-Red.
Control 100123.5 100±29.3 100±34.8 100±24.6 100±37.8
A10 (fresh) 81.4±15.3 77.6±15.0 80.3±12.7 95.2111.1 77.4±12.7
A10 (frozen) 82.4±19.9 90.8±22.7 92.7±14.5 93.4±21.4 79.8±23.8
A. j (fresh) 86.5±17.8 119.3±32.8 95.9125.7 105.9117.5 89.4±24.0
Aj (frozen) 100±26.7 92.7±18.1 96.8±13.8 115.3±23.8 79.7117.20
116

Table 6.14: The effect of Marrubium vulgare (M=0.2, M10=0.02, M100=0.002, M1000=0.0002, M10000=0.00002 g/ ml) on the 7a-, 60-, and 16a-, hydroxylase, 17a(ß)- hydroxysteroid dehydrogenase and Sa-reductase after 1/2 hour of preincubation in hepatocytes obtained from normal rat, p values relative to control values were obtained by ANOVA followed by Dunnet's * =P<O. 05 and *** -p<0.001. Results are expressed as percentage of the relevant control and mean ± S. D, (n=5).
Enzyme Activity ( expressed as % of control )
GROUP 7a-OH 6ßOH 16a-011 17-OHSD 5a-Red.
Control(1/21ir) 100±14,1 100±14.6 100±12.7 100±11.8 100111.8
M(1/2hr. ) 91.6±11.8 63.318.60** 68.7±8.40** 101.3±17.3 120.1124.9
M10 (1/2hr. ) 100.9±25.3 100.4±13.3 110.4±10.9 103.6±13.3 102.8±10.0
M100(1/2hr) 107.6±14.71 102.918.92 110.3±11.3 110.6121.2 105.9112.8
M1000(1/2hr) 99.3±18.6 99.4±12.5 100.97±11.58 110.6124.6 90.8±1.95
M10000(I/2hr 127.9±14.8 114.814.00 129.9±6.90 128.8±28.2 118.5123.1
Control (Ihr. ) 100±42.1 100±39.8 100133.9 100±11.24 100120.5
M (I hr. ) 40.97±8.85** 26.6917.35** 22.17±2.43** 65.714.73 120.1136.3
M10 (1 fir. ) 76.6113.6 34.5813.50 34.4±9.80 86.8±16.3 110.3125.5
Control(4hr. ) 100±18.0 100±21.2 100±18.6 100113.3 100±24.7
M (4hr. ) 115.4123.97 87.6122.1 113.4118.2 121129.67 108.915.98
M10 (4hr. ) 101.3±19.8 96.6±13.8 88.2±8.25 115.6±7.90 96.3123.9
117

Table 6.15: The effect of Anvillea carcinii ( V=0.2, V10=0.02, V100=0.002, V1000=0.0002, V10000=0.00002 g/ ml) on the 7a-, 6ß-, and 16a-, hydroxylase, 17a(ß)- hydroxysteroid dehydrogenase and Sa-reductase after 1/2 hour of preincubation in hepatocytes obtained from normal rat, p values relative to control values were obtained by ANOVA followed by Dunnet's test, ** -p<0.01 and =p<0.001. Results are expressed as percentage of the relevant Control and Mean + S. D, (n=5)
Enzyme Activity ( expressed as % of control)
GROUP 7a-OH 6ßOH 16a-011 17-OIISD 5a-Red.
Control(1/2hr) 100±14.1 100±14.6 100±12,7 100±11.8 100±11.8
V(1/2hr. ) 109.8±85.4 85.4±6.30 97.8±7.85 107.6±17.1 108.4±17.7
VIO (1/2hr. ) 108.9±14.2 93.3±6.61 112.4±9.01 114.0±38.3 107.9±12.6
V100(1/2hr) 106.2±15.5 115.8117.5 111.3±13.8 113.4±23.7 105.9±12.8
V1000(1/2hr) 104.0±15.5 89.2±16.2 92.7±13.4 120.9±3.30 97.7±17.0
V10000(1/2hr 111.1±11.3 97.9±9.22 101.7±6.30 112.9±23.4 105.9±5.13
Control (Ihr. ) 100±42.1 100: 39.8 100±33.9 100±11.24 100+20.5
V (ihr. ) 86.3±20.7 88.1±23.8 87.7±20.6 101.9±29.6 85.3±18.2
VIO (ihr. ) 39.4±I2.4*** 30.0±7.81*** 32.2±3.09*** 53.2±11.4** 38.116.20***
Control(41u. ) 100±18.0 100±21.2 100±18.6 100±13.3 100±24.7
V (41u. ) 95.7±0.66 93.1±17.2 123.1±24.4 193.7±33.4** 178.8±32.7*
V10 (41w. ) 110±26.9 67.4±15.7 85.6±41.2 111.5163.9 123.9±57.3
118

6.2 Discussion of steroid metabolism In 1986, Skett found that STZ-induced diabetes mellitus could affect steroid
metabolism in the rat liver and that this effect could be reversed by insulin administration to the diabetic animals. Steroid metabolism is closely related to drug metabolism in the
rat liver by the enzymes involved and by an apparent common control mechanism, thought to be mediated via the pituitary gland (Skett et al., 1984). As it was not certain how diabetes affected liver function in this case (e. g. directly via changes in blood
insulin levels or indirectly via the pituitary gland as above), it was decided to study the
effect of insulin on androst-4-ene-3,17-dione metabolism in primary culture of rat hepatocytes. As the biological effects of insulin vary in their time of onset from very
rapid responses (seconds to minutes) to quite slow modulations of cell proliferation, that
may take hours to be expressed the experiments were conducted over a time period
ranging from 1/2 hour to 72 hours.
Androst-4-ene-3,17-dione was used as a substrate in these experiments because
it has a sex-dependent metabolism which is well characterized (Stenberg, 1976) and also because it has commonly been used in this laboratory and its metabolites are well- defined and are easily separated and its labelled and unlabelled forms are easily available. Only male rats were used in all of the experiments because it was found that the effect
of diabetes mellitus on steroid metabolism was sex-dependent i. e. only seen in the male. It was thought that diabetes interfered with the androgenic stimulation of drug
metabolism in the male (Dixon et at, 1961; Skett, 1986) and, therefore, drug
metabolism would be unaffected by the same treatment in the female (Skett, 1986). It
was decided to use the same hepatocytes approach in our studies because of the above.
It was also thought appropriate as the hepatocytes can be obtained in high yields and
one can do more and long term hormonal, studies. This is in contrast to the perfused liver where only one or two preparations may be run at one time, the technique requires
a high degree of skill and the preparations can only be kept viable for a few hours.
We used Ham's F-10 supplemented with 0.1% bovine serum albumin as a
nutrient medium because it was found that the enzyme activities were well maintained
and that steroid metabolising enzyme activities returned to control level after 2 days in
119

culture (Hussin & Skett, 1986). We used insulin 10-6M in most of the experiments because Hussein was found the maximum effect was reached at this concentration.
Insulin has, been demonstrated to affect the metabolism of androst-4-ene-3,17- dione in-vivo (Skett, 1986) and, in 1988, Hussin & Skett showed that insulin had a direct effect on steroid metabolism in rat hepatocytes by increasing the activity of all
enzymes, unlike in-vivo where selective increases in enzyme activities were seen. Insulin
(10-6M) was used in most of the experiments as Hussin & Skett (1988) had found the
maximum effect was reached at this concentration.
The initial purpose of the present study was to test if extracts of the plants, Artemisia judaica, Marrubiran vulgare and Anvil/ea carcinil, which are used as
antidiabetics in Libya, could have the same effect as insulin on hepatocytes isolated from
normal rats.
Initially, after 1/2 an hour exposure to insulin at concentrations of 10-6 and 10- 9M, Artemisia extract and Artemisia extract with insulin, there was no significant increase in any of the enzyme activities studied and, indeed, a significant decrease was found with Artemisia extract with insulin. This data is not in agreement with the results
of Hussin & Skett (1988), who found that there was a significant increase in all of the
enzyme activities at all'concentrations of insulin.
Attempts to ascertain the reason(s) for this discrepancy in the results by a close
examination of the methods of Hussin & Skett (1986: 1988) and comparison with the
techniques used in this study have proved inconclusive. Changing the pre-incubation
period, testing the preparations of insulin and extract used, changing the incubation
medium and altering the weight/age of the animals made very little difference. The basis
of the discrepancy between the results of this study and those of Russin & Skett remains
unresolved.
When we did not find any positive results with Artc'misia extract, we used other
plant extracts, from Marrubium vulgare and An villea carcinil in different concentration
and different times. Neither of these extracts caused any significant increases in enzyme
activity although, rarely, significant decreases were seen at some concentrations of
extract.
120

The assay of hepatic metabolism of androst-4-ene-3,17-dione does not, therefore, seem to be of use in detecting insulin-like activity in the system employed in
this study.
6.3 Glycogen Phosphorylase a
6.3.1 Effect of crude extracts of medicinal plants on the activity of glycogen
phosphorylase a in hepatocytes isolated from normal rat hepatocytes:
The graphs (Figure 6.1 and 6.2) and tables (Tables 6.17-6.26) show the effects
of tested compounds (insulin, glucagon and crude extracts of plants (Artemisia judaica,
Anvillea carcinii & Marrubium vulgare) on glycogen phosphorylase a activity in
isolated rat hepatocytes. In these experiments insulin and glucagon were used as
standards to compare to the activity of the crude plant extracts to see any insulin-like or
glucagon-inhibiting activity. Results are expressed as percentage change from control.
Figure 6.1 a shows that insulin had little effect on glycogen phosphorylase a activity in
hepatocytes isolated from control animals at all different concentrations except at 10-
5M, which significantly decreased the activity (p<0.001). As shown in Figures 6.1b-d ,
the presence of insulin (10-6M), which itself did not decrease enzyme activity, with
different concentrations of crude plant extracts significantly decreased the glycogen
phosphorylase a activity in virtually all cases. The plant extracts alone were less able to
decrease glycogen phosphorylase a activity although significant decreases were seen
with Artemisia extract (2x 10⁻¹ and 2x 10⁻⁴g/ml), Anvillea extract (2x 10⁻⁶ 104g/ml)
and Marrubium extract (2x 10⁻⁴g/ml). The crude plant extracts alone were never as
potent as the insulin and plant extract mixture except for the highest dose of Artemisla
121

extract. Under similar experimental conditions the presence of glucagon (10-6 - 10-
I OM) had a biphasic effect on glycogen phosphorylase a activity (Figure 6.2a). At 10-
10 - 10-9M, glucagon decreased glycogen phosphorylase a activity whereas at 10-8 -
10-7M a marked increase was seen. At 10-6M glucagon, a return to a significant
decrease was seen. If crude plant extracts alone were tested (Figures 6.2b-d), it is seen
122

Figure 6.1: Dose-response curves for the of ectinsulin and extracts of Arlemisia
judaica (b); Marrublum vulgare (c) and Anvillea carcinii (d) on glycogen
phosphorylase a (a) in isolated rat hepatocytes preincubated for 30 min in Krebs-
Ilenseleit medium and the effect of 3 min exposure to the extracts and hormone on the
enzyme activity measured, compared to basal phosphorylase activity *= p<0.05, **
p<0.01, *** - p<0.001, and t= p<0.05, tt = p<0.01, ttt = p<0.001 compared to
respective dose of extract alone, p were obtained by ANOVA followed by Dunnet's
test.
Results are expressed as mean ± s. d. (n=3).
o- Insulin, Arlemisla, Marrubhun & Anvillea alone
"- Arlemisla, Marrublum or Anvillea + insulin (10-6M)
123

a) 40
20
0
-20
-40
-60
-80
-100 ' -11 -10 -9 -8 -7 -6 -5 -4
LOG [INSULIN] (M)
C)
60
40
20
0
-20 Y
-40 .,... tt t ...
-60 -6 -5 -4 -3 -2 -1
b ) 20
I- v 10
W N
0
_ -10 """ CE tt o tt .. o x
-20 z W tt . a
-30 tt
= tt 40 ...
...
-50 -9 "8 -7 -6 -5 -4 -3 -2 -1 0
LOO CONC. (mg/ml)
J)
0
20
10
0
-10
-20
"
-30
. a0
-50
it
tt . I. ... ... t
tt "'
-60 - 6 -5 -4 -3 -2 "1 0
LOO CONC. (mg/ml) LOG CONC. (mg/ml)

Figure 6.2: Dose-response curves for the effect glucagon and extracts ofArtemisia
judaica (b); Marrtublum vulgare (c) and Anvillea carcürü (d) on glycogen
phosphorylase a (a) in isolated rat hepatocytes preincubated for 30 min. in Krebs-
i ienseleit medium and the effect of 3 min exposure to the extracts and hormone on the
enzyme activity measured, compared to basal phosphorylase activity *= p<0.05, **
p<0.01, +** - p<0,001 and t- p<0.05, tt - p<0.01, ttt = p<0.001 compared to
respective dose of extract alone, p were obtained by ANOVA followed by Dunnet's
test.
Results are expressed as mean ± s. d. (n=3).
o- Glucagon, Arlemisla, Marnibium & Auvillea alone
"- Arlc'misla, Marrubliun or Anv!! lea + glucagon (10'7M)
124

120 a)
100 W 80
60 .. Ö 40 x 20 N i 0 a
-20 w -40 ...
cxi -60 W
-80 4 ö -100
-11 -10 -9 -8 -7 LOG (GLUCAGON] (M)
c) 150 r
100
50
0
-50
. 100 L -5
-6
0
b) 60
40 ' ..
t 20 It
0
-20 tt ...
-40 t
-60 """
i -80 ..
t -100 -6 -5 4 -3 -2 -1
LOG CONC. (mg/ml)
d)
-30
-40
-50
-60
-70
-80
-90
r
-100 5 -4 .3 -2 .1 LOG CONC. (mg/ml)
tot
0
0 -4 -3 -2 -1
LOG CONC. (mg/ml)
that there is a general decrease in enzyme activity except at very high concentration of
Artemisia (2x10⁻² g/ml) or low concentrations ofMarrublum (2x10⁻⁷g/ml). This does
not fully agree with the results in the previous experiment. The reason for this is unclear
but will be discussed later. If the effects of the crude extracts are tested in the presence
of glucacon (10-7M), which increases enzyme activity, then all extracts antagonize
glucagon action (i. e. the increase in activity expected with 10-7M glucagon is not seen
and, indeed, in some cases a marked decrease in activity is observed compared to
control levels).
At this stage the crude extract of Arlemisia judaica was fractionated to give an
aqueous (water-soluble) extract and an alcoholic (ethanol-soluble) extract as described
in Materials and Methods.
6.3.2 Effect of insulin and glucagon on the activity of glycogen phosphorylase a in hepatocytes isolated from normal and STZ diabetic rats.
Tables 6.17 and 6.18 show the effect of different concentrations of insulin and
glucagon alone on glycogen phosphorylase a in normal and diabetic rats. Insulin did not
decrease enzyme activity in hepatocytes isolated from normal or diabetic rats except at
104M, which significantly increased the activity (p<0.001 & p<0.01 in cells from
normal and diabetic animals respectively). Under similar conditions, glucagon in
different concentrations significantly increased enzyme activity (p<0.001) in normal and
diabetic rats.
125

b '5
i ce
0
0
0 00
0
0
b
w° N
0
0 U
d .o H
41 M rj `! O
v 2 M 2; 0,
- f4
n -H -4
M
%0
M
-4 fi
r4 ai
44
'1'1
ä o Q x
ß x Q x
+ 0.

4. a 0
ö
c p. 0
10 CL2
. -r y
.. M
0 . Ei
03 um
oý
ä "° O .. ö
ö9öt ,Ewö tz. :3 ön ý° Ö$
° d) ä. ö
öö
Ö
O
r. 0 r= ü
° Zu
CL)
Q-w
Ei
öo üdCö
a
Ä8° M Q *ý Ion
9.4 ýp O
O Cý 41
tý O
Wl
ti
n
"
f; f4 00
I
t0 ~
"
N ä
.r n
"r
n
ono' C4 N
"
0 v, o
"
O
n N .ý

2
CC ft
H 'rC0
Q
ÖMýý
. N. 00 -i
. rte
äu
N C. i
ÖýQp
pw
8
;g -8 ý3 cn
cxa
0 II
ýM vi O
140.
-e ayö C)
o
E
U)
0 O
F, o *C
Qo ý N ~ ý
oö
l
'o r
ein M Oý ýp
x " o " Ö 7S:
ö ý3 ö
Y " °a
" N N o
h M
OOWýý ý
°ý

6.3.3 Effect of an aqueous extract ofArtemistaJudaica and insulin on the
activity of glycogen phosphorylase a in hepatocytes isolated from normal rat.
The data in Table 6.19 shows the effects of different concentrations of an aqueous
extract of Artemisia alone or in the presence of different concentrations of insulin on
glycogen phosphorylase a activity. Incubation of control rat hepatocytes with an
aqueous extract of Arlemisia in different concentrations resulted in decreased glycogen
phosphorylase a activity at concentrations of extract of 2x10-2,2x10-3,2x10⁻⁵ and
2x10⁻⁶ g/I (25%, 35%, 37%, and 51% respectively as compared to control (p<0.01))
but concentrations of 2x10⁻¹ and 2x10⁻⁴ g/l had no significant eft'ect. The result at
2x10⁻⁴ g/l looks out of place and may be a false negative as this concentration of extract
has shown effects previously (see Figure 6.2b). The highest concentration ofArtemisia
extract has, however, tended to be inactive. When the hepatocytes were incubated with
different concentrations of aqueous extract of Artemisia with insulin (104M), a
significant decrease was found at concentrations of2x10-1 g/ml (p<0.01), 2x10⁻² g/ml
(p<0.001) and 2x10⁻⁵ g/ml (p<0.001) compared to the effects of insulin or Artemisia
extract alone. At other concentrations, there was no synergistic effect of aqueous
extract of Artemisia and insulin and, indeed, at 2x10⁻⁶ g/l Arletnisia extract, insulin
inhibited the activity. Insulin alone in different concentrations (10-9-10-6NI) was less able to decrease
glycogen phosphorylase a activity in this experiment and this agrees with the results
from previous experiments. In general, a similar pattern of changes in glycogen phosphorylase a activity was
seen for the other concentrations of insulin used (10-9-10-7M) with synergistic effects
being noted (i. e. the effect of insulin plus the aqueous extract ofArtendsiajudaica being
more potent than either component alone). It is interesting to note the combinations that
have antagonistic effects, however. At the highest concentration of insulin used (10-
6M), an antagonistic effect is noted with the most potent concentration of Arlemisia
extract (2x10⁻⁶ g/I). As the concentration of insulin used falls. the antagonistic effect
shifts towards the less potent concentrations of Arlemisia extract (e. g. insulin 10'7M
and Artemisia 2x10⁻⁵ g/l; insulin 10-814 and Arlemisia 2x10⁴ g/I and insulin 10-9M
and Artemisia 2x 10⁻³ g/1). The significance of this is unclear at present.
129

C"
f3
ý ý
b.
w 8
O Z,
O C c
. E" 4w
W
C
O Q' E) w 0
{ " M
p ü
"O
10 ö q 8
1. u 4- $'S ü
v
O "
V
r ý
4)
r
Ö
O
Q O ,C
O
y
O
'ýr' di ä
.C C U
w 'Z r Zit
ä b
'g
y
-H V 0
Ä 0 r= .
ü
cý ö. E V b
.0
v
8 'äi
la
Q
F ä, x .ä > g
ýo
is
b
wo
eef
0 Q. N 0
a) 0 v
'ä)
O e+ý w

Ö
CS N
it 4
x N cj 00
N -H
y~j M Vj M
p
M
h * 4
4
4
Of
f 4
x N
N
{{ OMO vii
N Q
Ö
'ý x
ýO M
4 N 00
q '
4 4 V1
Q'i
N ý ~F{
ýp
tý ii
ýO
ý y -li N
H M
p a 00 N
O O N
ý+ x
M M
M
3e Cl,
f 4
N 2
S ýp -}{
Qý O
M M a ö 7
9 N 4
(7 N
ei
0000 Cý
an g G -
N b N N M
,..,
N
00 <t
I v1
Ö `
M
4 {
ý 4
ý
4
f 4 4 N
xN i
P,
r-
n
N N pp vpý1
Oa
I3 p
l +
:ý ýO +- nO
+ 04 :
ýp O t
of v z
oýº Oi
d Q CC -

6.3.4 Effect of an aqueous extract of Artemisia judaica and glucagon on the
activity of glycogen phosphorylase a in hepatocytes isolated from normal and diabetic rat.
Table 6.20 illustrates the significant rise in glycogen phosphorylase a activity
when different concentrations of glucagon (10-4 - 10-9 M) were added to isolated
hepatocytes.
As described above, the addition of an aqueous extract of Artemisia judaica to
the cells caused a significant fall in the activity of glycogen phosphorylase a at most
concentrations. If glucagon at concentrations of 10-6 - 10-9 M was added to the cells at
the same time as different concentrations of Artemisia extract, we found that the effect
of the glucagon could be modified. At a concentration of 10-6M, which increases
glycogen phosphorylase a by 248% of control, all concentrations of an aqueous extract
of Artemisia diminished the action of the glucagon though the activity of the glycogen
phosphorylase a was still significantly higher than their respective control. Aqueous
extracts ofArtemisia had, thus, a partial antagonistic effect on the effect (p<0.001 at all
concentrations). Similar effects were seen with glucagon at concentrations of 10-7 and
10-8 M and the same observation was seen in hepatocytes isolated from STZ diabetic
rat (Table 6.21).
6.3.5 The effect of an aqueous extract of Artemisia judaica and insulin on the
activity of glycogen phosphorylase a in hepatocytes isolated from STZ
diabetic rat.
The effect ofArtemisiajudaica and glucagon on glycogen phosphorylase a were further studied by analyzing their effects in hepatocytes isolated from diabetic rats.
Table 6.22 shows that, Artemisia extract in the concentrations range 2x10⁻² to
2x 10⁻⁶ g/ml gave no significant change in the activity but at a concentration of 2x 10⁻¹
g/ml the activity decreased to 35% of control (p<0.001).
The addition of different concentrations of aqueous extract of Artemisia judaica to
insulin (10-6M) caused a decrease at all concentrations from 2x10⁻¹ to 2x10⁻⁵ g/ml
131

ö .I -d 4)
0 0
.
Vi
rol %C-)
3 of
n v
°1 a o
"
V
°
_ ° O
w O
ö ö. aý
o
9)
p U
4
4)
V ý
°
10 cd ý
of
V) °
V
ö
U
.. " Z
V O
-4
0
°
°
1--
1"'
CC
E
Z
:j
.c 0
y
0 U
y
V ö
4
ý'f
"C V
O
ä w °
O
M
iy
E 0
9m <
g 11 w O
10 O
O
M
I
O o, IN.
"
O
_ fr
- "sý "ý
ý
y +I
Cp
'C au
a
V) O
O
p
H
O
p+
ß.
u
C
_GO
E
x
rz
°ý..,
O
>
0
II
EI
ýo r. 10 ýi
ö I 0 U 4.
V
0
AM- a aý on 0
äý
N e+f .. ý

ö * 4 i
4 4
N 4 n ON 4 N
ý Cod - -
W) -H
. -i 1 V: In I I M M
IF 4 4
4 4
x N C14 IT N 06
M -li
O ý N
f 4
ýE f O f N M
CS ~ e0i W '^ W'i
Ö
. O O ýE 4
O N { a" " N c o
N Ö ,.., -
In
ý c 7 N
CD ci 4 4 4
U x Q ; t It
w N d d M t1
-H Q Lr; cV ll: r
o y1 to V1 00 00
4 4
N ý 'CJ
Cod -H M
Ö +4 + + °P
Ü
C7 C7 C7

ö
Ct , ý, ö
o
ö
w ei 13
3e aý
M
C) b
V cd
* 0 C)
. '7
o
a
a
4)
aý
Q
0
QQ 44. 0
a) ö ' ö o
V
o V 'b vi
c
a
.ý w 4) 4) a
ö 2 0 Q,
b. Q
`. o 8 e
g c
0 °
Z 0
8 o o
c
C V a R
y
o
u -O u
I
E
c° )
II
Iý " ý, C,. ý hr ý+
a -d +I aýi
", e
E"ý
a
u O
öA
O
ä
ýn
ºý1"r
aý C
O
ý
U
II *
C
. -:
hi .ä
ö .r a 0 U v w co aý
0 a h 0 iy
to 0 U T
"M
M M

"- ip, ýý . t
40 0 0 0
ý W
00 Ö W W
ý, ý mex.. C
Is Is I *
om I,
A ~
r+ 2 ,
cn tJ ö
00
N w
N X
0 to
} } .ý
N Ci
?ý it 0
`d
Is 18 1, ö
1, Is 4. W
I 00 o W H-
oý - . N
a a .r ! -" is x n
Is 00 I. I.
- N ýa N
te r .
IF
rr In 00 Oi . 30 Is
Is I@
40 I. U.,
- ýC
--+ p O W
00 W ma y.
tW }
p, % v F-" N
Ö U
O CN W O
N Is le
Is jo
Is is

0
CO
b
di Jw
gj
0
ýtl v) ä
0 * eV
V
'° ö
ts.
E
$ "1 N
10 ö cu
° Ä v
i p
u
Y
y 9
ýj CL
p
O
o
s ý o
ä O
ä c .^ v & b 0 >r 0
R e
O 0 G: ..,
...
.ä "Q
o .ý y
8 O
äl +I V Q ö 2
4) ü
t= "b xsi g
lp
.ö
ö L
c 0 u L
4 20 A
A
O .c Q. N O irr
O u
o.. 0 t, 5-
ýu
M ý. r

2 :1 9,2 Eý ý- :, ýt1
0, .a a 2: j
0 pp U N ý Vº
} h
. A. C: a
ý. O M * `r
b ä
týir
ý. '
N
ý.
ý
00 N
N
N
ý
IM } ,
0 N N
t7
`'
0 O
- O
- O
- - . N
} } N O pÄ.
t IF
r r r
Fv4-
I. 1
W
p' O0 tý
ä . bb
ä it t
w -
t

except at a concentration of 2x 10⁻² g/ml which had no effect. Maximum effect was seen
at a concentration of 3x 10⁻³ g/ ml (32 % of control ). Insulin at a concentration of 10- 7M with different concentrations of aqueous extract ofArtemisiaJudaica decreased the
activity of the enzyme activity significantly more than insulin (10-6M) with different
concentrations of aqueous extract. Insulin (10-8M) decreased the activity significantly
with concentrations of Artemisia extract at 2x10-2,2x10-3 and 20x-5 g /ml but no
effect at a concentration of 2x 10⁻² and 2x 10⁻⁴ g/H.
6.3.6 The effect of an ethanolic extract of Artemisia judatca and insulin on the activity of glycogen phosphorylase a in hepatocytes isolated from normal
rat.
The data of Table 6.23 shows that an ethanolic extract of Artemisia judaica
alone had little effect on glycogen phosphorylase a activity except at concentrations of 2x 10⁻¹ and 2x 10⁻³ g/1 , which showed a significant fall in activity (p<0.01). The
ethanolic extract is, thus, less effective than the aqueous extract by itself.
As noticed previously, insulin had little effect on glycogen phosphorylase a
activity except in high concentration which, in this experiment, activated glycogen
phosphorylase a. The addition of insulin (10-6M) together with different concentrations of an
ethanolic extract of Artemisia gave no significant change in glycogen phosphorylase a
activity except at the lowest concentration of Artemisia extract (2x 10⁻⁵ g/1) where a
reduction was seen which was statistically significant (p<0.001). Neither insulin nor Artemisia extract at these concentrations gave any significant reduction and, thus, this indicates a synergism of effect at these concentrations on the activity of glycogen
phosphorylase a. The of ect of the ethanolic extract of Artemisia with 10-7M insulin
was to significantly decrease glycogen phosphorylase a activity (p<0.001) at all
concentrations of the ethanolic extract, the maximum decrease (63% of control) was
seen at the high concentration . Insulin (10-8 and 10-9M) together with different concentrations of the ethanolic
extract ofArtemisia gave a similar effect to that seen for insulin (10-7M) with marked
synergistic action of the two additions.
135

ö N ' ý w "~
äi
444%%%
M "ý
tV °
4) O C
td " O VQ,
YN 0 Q °
cý ä O 4 .. O 3 ý
w dJ
A V Q C
* w
w Qr
`4 O = 'd 9 i4 O E O
"
-
. ýS , it
w
H
Qo
8 t ý O � ( 0 ö Z t
I C
. E 920
u
b WI
a p O :,
(Z m
O Q < 6r
° > 0
a R
'e
i ° 6 ö
u b ý
°
y b O
R +1 O a
v ü Ä
u '°
c 'äj s ö
to
.ö
ö
c ü
9-0 eo
0
0
a)
'r.
v.. 0
"r
'a

at 't
f {
it 4
R at 0
00 j
N AH
In LQ
N c
Cý Zj M kn "i -
M N 1
4
O ß' of
4 4
f
N o. }0ý
Cý ý
a' M
t-i '7
r- M
M
Ii cl
M 'T CM
U
ýO
f 4 4
X N
N
Cý oo v1
phi I
~
M pp t 00
ºýi N M
En
4 1, C) `o M
%A M v^ V1 at. go- at. N Vý Cý h
^ M ý
V; Vl
U N
ö Ö N M of 4. '1 ... cV
"' ^ of. 4. 4
04 N N
r Ö q ts O t3
Q C V '"

6.3.7 Effect of an ethanolic extract of Artemisia judaica and insulin on the
activity of glycogen phosphorylase a in hepatocytes isolated from STZ
diabetic rat.
In the same set of cells isolated from diabetic rats, the effect of an ethanolic
extract of Artemisia judaica and insulin on glycogen phosphorylase a was studied (Table 6.24). Ethanolic extract of Artemisia judaica at 2x10⁻¹ g /ml alone and with different concentrations of insulin range (10-6 to 10-8M) and ethanolic extract of Artemisia judaica (2x 10⁻² g/ml) with insulin (10-6M and 10x 10-8 M) decreased the
enzyme activity to 49%, 73%, 27%, 67%, 48% and 23% respectively compared to
control ( p<0.001). The addition of different concentrations of insulin with different
concentrations of aqueous extract of Artemisia judaica (2x 10⁻³ to 2x 10⁻⁶ g/ ml) had
little effect on the activity of glycogen phosphorylase a.
6.3.8 Effect of an ethanolic extract of Artemisia judaica and glucagon on the
activity of glycogen phosphorylase a in hepatocytes isolated from normal and STZ diabetic rat.
As noticed above, glucagon again exhibited a significant activation of glycogen
phosphorylase a in normal and diabetic at all concentrations (see Tables 6.17 & 6.18).
The ethanolic extract of Artemisia alone had little effect on glycogen phosphorylase a
activity but completely counteracted the effects of glucagon on the activity of glycogen
phosphorylase a at all concentrations (p<0.001) in normal and diabetics (Table 6.25 &
6.26).
6.3.9 The effects of artemisinin and santonin on the activity of glycogen
phosphorylase a in hepatocytes isolated from normal rat.
As shown in Figures 6.3 and 6.4, artemisinin and santonin had no significant
effects alone on glycogen phosphorylase a activity in isolated rat hepatocytes except for
a marked increase in activity with artemisinin at high concentrations (104M) and some
small increases with santonin at various concentrations. Treatment of cells with
137

artemisinin and insulin (10-7M) gave a marked increase in glycogen phosphorylase a
activity at concentrations above 10'7M. Artemisinin, however, does appear to inhibit the
action of glucagon (10-7M) at all concentrations. The action of santonin on the effect of insulin (10-7M) is rather complex giving a stimulation of glycogen phosphorylase a
activity at low concentrations (10-9-10-8M) and an inhibition at higher concentrations (104M). Santonin at higher concentrations (10-5.10-4M) also seemed to inhibit
glucagon action on glycogen phosphorylase a activity.
138

M * C
a 10 .a 6! 0
0
Gý a o
ü `c E X40 10 ö 0
Ö b ýý
II
.. . w
1, A Ö 't t
c_ '
a 6 1 Dý
.. O
y . G.
O fý
6i
O O
x Lý
cu cu :.
0 41
Z» 3 ü
O
V O a O u
w 10 -H
rý bý Q
N V ,.
d
O
O
O
0. G v W1 O
A M

v 4
x N
W) yýj 'Lb 'L!
C, +ý d d pp N
Ö ýt v1
^;
4 4 4
N
N M N
N 00 ýL5 N In
O M Ö
^' 00
h O U r. rý ..
P4 * 4 f
4
4
XN 0 0 ^ M IT
V1 0.4 En W) H Q Cq
cli
N O
00 v1
4 V
`
Ö
x
44
n
4 4 4
N ) L cV
o ~ Ö1. i
06 M
{ 4
f
f
Y
Ö f f t3
f ft
0 IN IN

.
4ý 4J
0- w
c (L)
4
*w
O
c v O 4w 0
TO
O " R
ö
ý"
cýg E
0
2 5 w j
UO ý O
ü
.ý
. ̂ " ý+ 'Lqy
cd
O
td
ýd
a E V
t0-'
a
r' u2
aui (n y
cu
0
A
-8 O
`0
i< S c
m 0
8
O
ä
O
R ¬
y O
v
"
.G
ý
4
v
v ' M
4) b 0
121 O
0 -}I
a, I r E E
N u
g
«. b a
" ý c c
'ä v V C
E-ý c . a i
x 0
ü ,ö F2
wo ce
irr
on
O
.. n

f
0 at at ot f
f f
N AH N M
il ON 4n ei cccvvv
p C? N . -.
IT . -. 'j
p `a 00
00 ýE 'ý' 4
'F { N 06
pp O n
Ott
M N
fil In x x N ý'
N N N
o ~ - ' - 1 O, N
C1
04 ' f in
V
0 f
ei M
, E, {
4
of
W ex st M
�r
C 7 00 fl N
d 0 ON M C14 N
cli 4 4
41 4 4
4 It.
x {j 4 at boo 4
c ei, ~{{ t! ý
n 1ý 00
I n v1
Ö + 'ö +C ý Cp
ö CS. -.
Ci. r %-
y pý o 0º ý
C7 C7 ý ý

ö ö ö
v U
2 10 N
4)
V 4
*w 91
zi U
b le .a
Q O O bA
TJ a v Ö
oý l0
o
~
0
b
'E
*
c; v
o
Ixi
cad
0
II
.b p tý
Z ý +- N
N
e) {rr O
id
0 _
"0
c1
O c 4)
r. A
O
V
ul
c
., i "o 'C u
O
0 Z)
'ý o
0 r. O
3
p
"D "o
CC
c00 w
t
o .ý
E
II
U
0 c2. 6
ö
b
CC 0
Q
f4)
12 �z 4. 0
i
O
A--
.b ä
II o
y
+I 5
ezý y
ö U o -
te n, i a 0
eý -D
v '0 6ý
(L)
C N
cm
II IF
0 5 H 6ý W
10 4;
b
0 U
w°
0 0.
0 a
on 0 U
'ý
..
.,

U d
W
O x a O x a
U
d
Ot
4 st x
" m i
00 N
v1 4 4 f O N 4 4 f 1-4 N ^ . - N 4
N
c{3ý oo ýp
I Ln
- t! ý ý Ln
-H CV M M
M -i
Ö M 4 4 N
06 N -I N
IR 06 8t Ci .I " 0
N e'M
o X
N
0 M 'ý
N N
N 41 2 N Wi
N r% ^ i 06 -
N 'ý 4 4 f
N M N
- N
M ý
- I
* $ 4
x ei 4 Clq
4
i
Ö -I- `4 + rr + °S
O` ý " Ö Ö " "ý O ý ý
01 bi

Figure 6.3 Dose-response curves of glycogen phosphorylase a to insulin (a); artemisinin
(b) and santonin (c) in isolated rat hepatocytes preincubated for 30 min in Krebs-
Henseleit medium and the effect of 3 min exposure to the compounds and hormone on
the enzyme activity measured, compared to basal phosphorylase activity *= p<0.05, **
= p<0.01, *** = p<0.001 and t= p<0.05, tt = p<0.01, ttt p<0.001 compared to
respective dose of extract alone, p values were obtained by ANOVA followed by
Dunnet's test.
Results are expressed as mean ± s. d. (n=6).
°= Insulin, Artemisinin or santonin alone
9 Artemisinin or santonin + insulin (10-7M).
142

40 a)
F= U
W 20
00 x a U) O a -20 z w 0 z _
-40 U W
-60 -10
> c) 150 r
I U
100
0 2 CL 0 50 x
z w a z0 x c, W 0 aL
-50 -10
ttt
1
A
b) 200 r
F- U
W 150 U)
= 100 CL U) Oý x a 50 Z w O z Q0 x C) w 0 a
-50 -10
...
-9 -8 -7 -6 -5 -4 -3 LOG [ARTEMISININ] (M)
r
-9 -8 -7 -6 -5 -4 -3
LOG [SANTONIN] (M)
ttt ttt ffM "ff
-9 -8 -7 -6 -5 -4 -3 LOG [INSULIN] (M)

Figure 6.4 Dose-response curves of glycogen phosphorylase a to glucagon (a);
artemisinin (b) and santonin (c) in isolated rat hepatocytes preincubated for 30 min in
Krebs-Henseleit medium and the effect of 3 min exposure to the compounds and
hormone on the enzyme activity measured, compared to basal phosphorylase activity *
= p<0.05, ** = p<0.01, *** = p<0.001, and t= p<0.05, tt = p<0.01, ttt = p<0.001
compared to respective dose of extract alone. P values were obtained by ANOVA
followed by Dunnet's. Test.
Results are expressed as mean ± s. d. (n=6).
°= Insulin or Artemisinin or santonin
" Artemisinin or santonin + insulin (10-7M).
143

a) } 120
H U
100 w
80
0 s a 0 60
z 40
C9 z v 20 w 0 4 \° 0
RA"
-9 -8 -7 -6 -5 -4 -3 LOG [ARTEMISININ] (M)
*
k 0. T -10 -9 -8 -7 -6 -5 -4 -3
LOG [SANTONIN) (M)
c)
150
W U)
5 Ö 100 x a 0 x
Z w 50 a z x U W CD
b) 140
120
W 100
>- 80 Ix 0 60
co 0 40 a z 20 0 Q0 x U w -20 CD 4
40 -10
ttt AAR
0' -10 -9 -8 -7 -6 -5 -4 -3
LOG [GLUCAGON] (M)

6.4 Discussion:
The liver is an important site for insulin and glucagon action in the regulation of mammalian glucose homeostasis. Liver glycogen phosphorylase a is the rate-limiting enzyme of glycogenolysis and exists in two forms as an active a form and inactive b form (Hems & Whitton, 1980). The present investigation looked at the effects of extracts of Artemisia judaica, Anvillea carcinii, and Marrubium vulgare, which are widely used in Libyan folk medicine for the treatment of diabetes mellitus, on glycogen
phosphorylase a activity in hepatocytes isolated from control male rats to see if any of the plants contained substances which could mimic insulin or counteract the effects of
glucagon on this activity. We found that insulin in different concentrations when incubated with control
hepatocytes produced little change in glycogen phosphorylase a activity. This result is in
agreement with reports suggesting that insulin alone has little effect on glycogen
phosphorylase a activity in liver (Andrew et al., 1985). A crude extract of Artemisia
judaica alone decreased glycogen phosphorylase a activity but when insulin was added together to crude extract, the activity of glycogen phosphorylase a was decreased more
than with the extract of Artemisia alone. The same observations were seen with crude
extracts ofMarrubium vulgare or Anvillea carcinii. These three medicinal plants, thus,
contain (a) substance(s) which can act synergistically with insulin to decrease glycogen
phosphorylase a activity in the liver. This could account for some of the proposed hypoglycaemic actions of these plants.
Although the mechanism of action of the biguanides (e. g. metformin) is not
completely understood, the presence of insulin is required for metformin to exert many
of its effects (Hermann, 1979; Lucis, 1983). The plant extracts could, therefore, be said
to show a biguanide-like action, potentiating the action of insulin. In-vivo, the blood
glucose lowering capacity of metformin does not result from an increase in insulin
secretion, but is rather attributed to a combination of actions in peripheral insulin target
tissues involving both enhanced glucose metabolism and improved insulin action (Shen
& Bressier, 1977). Several in-vivo and in-vitro studies have pointed out one possible
mode of action of the drug at the cell surface - its ability to increase insulin binding to its
receptor in various cell types like erythrocytes (Holle et al., 1981), rat hepatoma cells
144

(Goldfine et al., 1984), human breast cells (Pezzino et al., 1982) and rat adipocytes (Fantus & Brosseau, 1986). Can the plant extracts tested here affect insulin binding? A
question for a future study. Recent studies have also demonstrated that metformin improves insulin-mediated [14C]-glucose incorporation into glycogen in cells isolated
from the liver and this may represent one of the mechanisms by which biguanides exerts their hypoglycemic action (Melin et al., 1990), So biguanides are known to improve the
effect of insulin in some types of diabetes and the presence of insulin is required for the biguanides to exert some of their hypoglycemic action (Muntoni, 1974). Insulin alone, in
several reports, has shown little effect on glycogen synthase or phosphorylase a in liver
cells (Andrew et al., 1985). The extracts of Artemisia judaica, Anvillea carcinil and Marrubium vulgare may, thus, have a similar mechanism of action to the biguanides
although the extracts can have some effect in the absence of insulin unlike the biguanides.
With respect to the action of glucagon on glycogen phosphorylase a activity, it
is seen that glucagon alone significantly increased glycogen phosphorylase a. However,
when glucagon was added with the crude extracts of Artemisia judaica, Anvillea
carcinii and Marrubium vulgare, the effect of glucagon was completely abolished. The
plant extracts, thus, contain (a) substance(s) which antagonises glucagon action on
glycogen phosphorylase a activity in isolated hepatocytes. This again could account for
some of their hypoglycaemic actions. Glucagon activates glycogen phosphorylase a through an elevation of
intracellular cAMP levels, which leads to the activation of a cAMP-dependent kinase
and activation of phosphorylase kinase (Sutherland & Robinson, 1979). Insulin on the
other hand reduces the glucagon-stimulated elevation of cAMP and activation of
phosphorylase (Exton et al., 1971; Siddle et al., 1973). There is general agreement
that insulin is effective in antagonizing the action of certain glycogenolytic hormones
such as glucagon and alpha1-adrenergic agonists (Andrew et al., 1985). It can therefore
be inferred from the data on glycogen phosphorylase a that the crude extracts of Artemisia judaica, Anvillea carcinii and Marrubium vulgare may have insulin-like
activity in-vitro and perhaps some of the same actions as biguanides as discussed above. As previously discussed, we found that the crude extract ofArtemisia contains a
substance which reacts in the glucose assay but is unlikely to be glucose itself. If we
145

consider the mechanism of action of glucose in liver (Stalmans et al 1990), we find that it activates glycogen synthase and inhibits glycogen phosphorylase by the following
steps: (1) glucose binds to glycogen phosphorylase as a better substrate, the glycogen
phosphorylase is dephosphorylated and inactivated (Carabaza et al., 1992). (2) The
dephosphorylation of the phosphorylase releases the inhibitory effect of active
phosphorylase on the hepatic phosphatase which now is able to activate glycogen
synthase (Carabaza et al., 1992). Glucose is thus a physiological regulator of hepatic
glycogen metabolism that promotes inactivation of glycogen phosphorylase (Stalmans et
al., 1974) and acts synergistically with insulin (Martin, et al., 1991). Could the crude
extract of Artemisia have the same action as glucose? What component of the extract
gives the effects? These are questions requiring an answer. If a first step at a fractionation is performed and the crude extract is split into an
aqueous and an alcoholic fraction as described in Materials and Methods, then it is seen
that the aqueous fraction can enhance the effects of insulin but is poor at inhibiting the
actions of glucagon whereas the alcoholic fraction completely abolishes glucagon action
and enhances to a certain extent insulin action. The glucagon-inhibiting action of the
extract, thus, resides primarily in the ethanol-soluble fraction whereas the insulin-
enhancing substance(s) are split between the water- and ethanol-soluble fractions,
although more, perhaps, in the water-soluble fraction. The water-soluble fraction has
recently been shown to contain inositol-like sugars (Professor. J. Connolly, Department
of Chemistry, University of Glasgow; personal communication) but the exact nature of
these is not known. This would fit in with the detection of a glucose-like substance in
our assays and the effects of glucose on glycogen phosphorylase a activity discussed
above.
Two compounds, artemisinin and santonin, known to be found in extracts of
Artemisia judaica (Abdalla et at, 1987), also showed activity in our assay but the
activity was the opposite of that seen with the crude extract - an increase in glycogen
phosphorylase a activity in the presence of insulin. Santonin alone also increased
glycogen phosphorylase a activity. It is unlikely, therefore, that either of these known
components of Artemisia judaica can account for the effects seen.
146

7. General discussion:
Non-insulin-dependent diabetes mellitus is one of the most frequent metabolic disorder in world. As the WHO study group stated in 1985: Its impact is often not fully
acknowledged and should attract more attention from health care professionals and
planners. Patient with this disease often do not receive optimal care resulting in impaired
quality of life, excess mortality and enormous health care costs. So the causes, effects
and treatment of diabetes mellitus have been the subject of a great deal of scientific
research over the years but despite this there is still controversy over them and the
condition and its implications are still not fully understood. Sulphonylureas or biguanides have been widely used for treatment of NIDDM over the past 30 years. In
addition to their stimulatory effect on insulin secretion, these compounds seem to
possess extra pancreatic effects (Prato et al., 1991) and this has raised questions over their effectiveness in treating symptoms other than the hyperglycaemia, which has
resulted in a failure to reduce mortality associated with diabetes. Insulin therapy should
not be used in NIDDM patient so long as blood glucose can be maintained within the
individual target range by correction of overweight, diet and or exercise but short-term insulin therapy may be necessary in some NIDDM patients during periods of illness. It is
clear, therefore, that current treatments of diabetes mellitus, particularly of the non- insulin-dependent type are not ideal and involve drugs that have no defined mechanism
of action. Even the apparently straightforward treatment of insulin-dependent diabetes
mellitus with insulin is not without its drawbacks such as the continual necessity for
injections of the hormone. Clearly work needs to continue to find alternative treatments for these conditions that have a clearer mechanism of action and are easier to
administer. Arabic folk medicine contains a number of herbal extracts said to combat the
symptoms of diabetes mellitus, chief amongst these are extracts of Artemisia judaica,
Marrubium vulgare and Anvillea carcinii. Little is known of their actions, however,
other than empirical work suggesting a reduction in serum glucose levels on taking the
extracts. Interestingly, these treatments are aqueous infusions of the herbs taken by
mouth and, thus, could represent a source of novel therapeutic agents for the treatment
of diabetes mellitus that are easier to take for the patient.
147

The study of diabetes is made complex by the fact that neither the in-vivo nor in-
vitro animal models can provide a true representation of the range of the human diabetic
conditions. The model used here, the STZ-induced diabetic rat, has been put forward as an animal model of IDDM in humans although STZ is known to produce some NIDDM
symptoms such as pronounced insulin resistance in the target tissues. Such a model may provide some evidence of action of drugs against both non-insulin- and insulin- dependent diabetes mellitus.
In order to study the potential of drugs to combat diabetes mellitus and to obtain a handle on the possible mechanisms of action of the drugs, it is necessary to look for
processes that are controlled by the hormones involved in the development of the disease - the most likely candidates being insulin and glucagon. Many processes of intermediary metabolism are controlled to a greater or lesser extent by these hormones including carbohydrate, protein and lipid metabolism. The major symptom of diabetes
mellitus is, however, a raised serum glucose level and, thus, carbohydrate metabolism could be considered as the most important regulatory process. One enzyme involved in
carbohydrate metabolism is glycogen phosphorylase a, a key enzyme in the regulation of
glycogen metabolism, has been shown to be decreased in diabetic rats (Miller et al. 1986). In STZ-diabetic liver, phosphorylase (a & total activities) were significantly lower than those seen in the normal animals. cAMP-dependent protein kinase and phosphorylase kinase activities also show substantial reduction during the fasted to
refed transition (Pugazhenthi & Khandelwal, 1991) but the enzyme activities were
restored to control values by insulin therapy (Roester & Khandelwal, 1987, Stude & Ganeas, 1989). In an in vitro study it was clearly demonstrated that, in hepatocytes
cultured in serum-free medium, insulin decreased the activity of glycogen phosphorylase (Hartmann, et al. 1987, Lawrence & Zhag, 1994) Glycogen phosphorylase a activity is,
thus, an insulin-sensitive enzyme activity and can be used to measure insulin-like
activity. In this study, extracts of Artemisia judaica, Marrubium vulgare and Anvillea
carcinii were examined for their potential anti-diabetic effects in the STZ-diabetic rat
model, on isolated rat hepatocytes using glycogen - phosphorylase a activity and
metabolism of androst-4-ene-3,17-dione (two insulin-sensitive enzyme systems) and in
diabetic human subjects. Time restraints meant that most work was concentrated on Artemisia judaica. The extract of Artemisia judaica was give to the animal in their
148

drinking water, body weight, urine volume and urine glucose and food and fluid intake
were monitored daily. In normal rat treated with Artemisia judaica food and fluid intake
and body weight were not changed by 11 days treatment with extract of Artemisia but
urine volume was found to increase suggesting that Artemisia judaica itself acting as a
mild diuretic which may be due to the presence of a glucose-like substance in the urine
of normal animals following exposure to Artemisia extract in the first 6 rats. This may be the substance in the Artemisia extract that reacts in the glucose assay which is not
reabsorbed by kidney. Assay of Artemisia extract gives glucose readings but the nature
of the actual substance is unknown at present. In diabetic rats treated with Arterrmisia judaica, diabetes was induced by
administration of STZ and was associated with the characteristic development of hyperglycaemia, hyperphagia, polydipsia and loss of body weight and after treatment
with Artemisia judaica the urine glucose level was decreased. The decrease in the
presence of ketones suggested that there is an improvement in the handling or
catabolism of lipids, both of which are beneficial in diabetes. From the results of the
present study it can be said that the extract exhibits significant anti-diabetic effects when
administered orally. Similar results were obtained from the small clinical evaluation
performed in this project. Artemisia extract treatment of the diabetic animals reversed or partially reversed
the effects of diabetes on aniline, aminopyrine and androst-4-ene-3,17-dione
metabolism. The addition of Artemisia extract directly to microsomes gave some
unexpected results with a significant increase in aminopyrine N-demethylation and
androst-4-ene-3,17-dione metabolism indicating that some of the effects of the Artemisia extract may be direct on the microsomal enzymes whereas the other effects
may be indirect (e. g. that on aniline metabolism). It is reported that the diabetic
condition, probably via generation of ketone bodies, can elevate aniline metabolism. The
fact that Artemisia treatment reverses this effect suggests again that Artemisia contains
a substance or mixture of substances that reverse the perturbation of intermediary
metabolism brought about by diabetes mellitus. Overall the in vivo experiments show that crude aqueous extracts of Artemisia
judaica had significant anti-diabetic properties both when measured as effects on serum
glucose and ketone bodies and when examining the changes in xenobiotic and steroid
149

metabolism known to occur in diabetes mellitus. These results suggested that it was
worth examining the possible mechanism of action of these extracts to try and ascertain how they achieved their effects.
It is, however, very difficult to examine the mechanism of action of drugs at the
whole animal level and, thus, a better, more controllable system was sought. One such system that has been well studied in this laboratory when looking at the action of hormones is the isolated rat hepatocyte model. Here hepatocytes are separated from the liver and kept in suspension or culture for up to 12 days. Potentially active substances
can be added to the cells at precise concentrations and for precise periods of time, thus
allowing a greater control of the experimental conditions. By measuring the activity of
some insulin-sensitive enzymes, it should be possible to examine if the herbal extracts have any insulin-like activity. To this end glycogen phosphorylase a and androst-4-ene- 3,17-dione metabolism were examined in isolated hepatocytes treated with the various
plant extracts.
In the present study Artemisia judaica, Anvillea carcinii and Marrubium
vulgare were used and tested for their ability to decrease glycogen phosphorylase a in
normal and streptozotocin-induced diabetes rat hepatocytes as a measure of their insulin-like action. In hepatocytes isolated from normal rats, a crude extract of Artemisia judaica, Anvillea carcinii and Marrubium vulgare inhibited the activity on
glycogen phosphorylase a but when insulin was added together with crude extracts of Artemisia judaica, Anvillea carcinii and Marrubium vulgare, the activity of glycogen
phosphorylase a was decreased more than with the extracts alone, These three plants, thus, contain (a) substance(s) which can act synergistically with insulin to decrease
glycogen phosphorylase a activity in the liver. If the same experiments are repeated with hepatocytes isolated from diabetic rats then it is seen that the cells are less responsive to hormones and to the plant extracts although some synergistic effects of insulin and the
plant extracts are still seen. If the crude extract of Artemisia judaica is sub-fractionated by extraction with
ethanol, it is seen that, of the two fractions, the water-soluble fraction retains insulin-like
actions whilst the alcohol-soluble fraction shows a marked glucagon antagonistic action
and little insulin-like activity. There are, thus, at least two active substances in the crude
extract of Artemisia judaica. More work needs to be done here to further fractionate
150

the extract and eventually arrive at an active fraction with one (or a limited number) of constituent(s).
It is seen that glucagon-inhibiting action of the extract, thus, residues primarily in the ethanolic-soluble fraction, whereas the insulin-enhancing substance(s) are split between the water-and ethanolic-soluble fractions, which suggested future work to
continue by trying to purify the active ingredients from the aqueous and ethanolic extracts.
The results from the androst-4-ene-3,17-dione assay were disappointing given that Hussin & Skett. (1987) had previously shown a marked effect of insulin on these
enzymes. No effect of insulin, Artemisia judaica and insulin with Artemisia extract was
seen on any steroid metabolisms enzyme activity studied and, indeed, a significant decrease was seen with Artemisia judaica and insulin. Changing the preincubation
period, changing the incubation medium, testing different types of insulin with extract
and altering the weight and age of the animals gave no different results. We did not find
any positive results with Artemisia extract or the other plant extract, Marrubium
vulgare and Anvillea carcinii in different concentration and at different times. The very limited clinical studies possible during this time period were encouraging showing that
the crude extract of Artemisia judaica appeared to reduce the amount of insulin needed to maintain a steady serum glucose level and, in some cases, could replace more
conventional anti-diabetic treatment. Much more in the way of clinical studies, including
double-blind testing of plant extracts would be necessary, however, before any definite
conclusions could be drawn about the potential of these plant extracts to be used as treatments of diabetes mellitus. In summary, this project has shown that traditional herbal treatments of diabetes
mellitus in use in Libya today (and over many years) do have some basis in scientific fact. The extracts do appear to be beneficial in diabetic patients as claimed and do have
some anti-diabetic effects in a rat model system of diabetes mellitus although the results
are not as striking in this study as they were in a previous unpublished study from this laboratory. On examining some insulin-sensitive enzymes in the isolated rat hepatocytes,
it was found that extracts of Artemisia judaica, Marrubium vulgare and Anvillea
carcinii, all contained substances that either mimicked insulin, antagonised glucagon or
acted synergistically with insulin in affecting the enzymes studied. The extracts, thus,
151

have many possible ways in which they could be acting as anti-diabetics, remembering
that these studies only involved the examination of liver enzymes.
Future work must concentrate in a number of areas; one, isolation and identification of the active principle(s) of the extracts, two, closer investigation of the
mechanism of action of the extracts on the liver to give anti-diabetic effects including
where in the cells the substances act (at the receptor, at the level of the second
messenger(s) or directly on the target enzymes) and three, do these extracts have any
potential anti-diabetic effects on any other insulin- or glucagon-sensitive tissue. A start
has been made to examine these potentially life-saving herbal plants but a great deal
more needs to be done before they can, perhaps, realise their potential as a new breed of
treatments for diabetes mellitus.
152
REFERENCES

8. REFERENCES
Abdalla, S. S. (1986). Effects of the crude extract of the medicinal plant Artemisla
judaicaL. on guinea-pig smooth muscles. Dirasat. 13,115-125.
Abdalla, S. S. & Zarg, M. H. A. (1987). Cirsimaritin, a flavone isolated from Artemisia
judaica on isolated guinea-pig ileum. Planta medica. 53,322-324
Agrawal, K. K., Pampori, N. A., & Shapiro, B. H. (1995). Thin-layer chromatographic
separation of regioselective and stereospecific androgen metabolites. Analytical
Biochemistry. 224,455-457.
Al-Jibouri, A. (1983). A Cardiophylline in Artemisia scoparia. in: Abstracts of the Third
Symposium on Scientific Research, 20-25th Baghdad, Iraq. 217-218.
Al-Khazraji, S. M., Al-Shamaony, L. A. & Twaij, H. A. (1993). Hypoglycaemic effect of Artemisia herba alba. 1. Effect of different parts and influence of solvent on hypoglycaemic activity. J. Ethnopharm. 40,163-166.
Alwan, A., Al-Gaillany, K. S., & Naji, A. (1989). Inhibition of the binding of 3H-
benzo[a] pyrene to rat liver microsomal protein by plant extract. Int. J. Crude Drug Res.
1,33-37.
Andrew, P., Thomas, P., Martin-Requero, A., & Williamson, J. R. (1985). Interactions
between insulin and a-1 adrenergic agents in the regulation of glycogen metabolism in
isolated hepatocytes. J. Biol. Chem. 260,5963-5973.
Bailey, C. J. & Flatt, P. R. (1990). 'Models for testing new hypoglycaemic drugs' in
`New anti-diabetic drugs' ed. Bailley & Flatt, pub. Smith-Gordon & Co. London.
153

Bailey, C. J. & Nattrass, M., (1988). Non insulin dependent diabetes mellitus. Treatment
with metformin. Clin. Endocrinol. Metabolism. 2,455-76.
Bailey, C. J. & Day, C. (1989). Traditional plant medicines as treatment for diabetes.
Diabetes care, 12,553- 564.
Banhnak, B. R. & Gold, A. H., (1982). Effects of alloxan diabetes on the turnover of rat liver glycogen synthase. J. Biol. Chem. 257,8775-8780.
Beesj, R., Blackmore, P. F. & Corbin, J. D. (1995). Discriminatory insulin antagonism of
stimulatory effects of various cAMP analogous on adipocyte lipolysis and hepatocyte
glycogenolysis. J. Biochemistry. 260,15781-15788.
Berg, A. & Gustafsson, J. A. (1973). Regulation of hydroxylation of Sa-androstane 3a,
1713-diol in liver microsomes from male and female rats. Journal of Biological
Chemistry. 248,6559-6567.
Berry, M. N., Edwards, M. & Barritt, G. F. (1991). Isolated hepatocytes preparation,
properties and applications. Elsevier Science Publishers, Amsterdam. 460-469.
Bishop, J. S. & Larner, J. (1967). Rapid activation-inactivation of liver uridine diphosphate glucose-glycogen transferase and phosphorylase by insulin and glucagon in-
vivo. J. Biol. Chem. 242,1354-1356.
Blackmore, P. F., Jeannet, F. A, Chan, F. M. & Exton, J. (1979). Studies on a-adrenergic
activation of hepatic glucose output. J. Biol. Chem.. 254,2828-2834.
Bloom, A. & Ireland, J. (1980). A colour atlas of diabetes. Wolf Medical Publications,
London, 34-35.
Bone, A. J. (1990). Animal models in diabetic research' in `Textbook of Diabetes' ed. Pickup 7& Williams G. Blackwell Scientific Publications, Oxford.
154

Bowman W. C. & Rand M. J. (1983). `Textbook of pharmacology' 2nd edition, Blackwell Scientific publications, Oxford, 614-678.
Brodie, B. B., Axelrod, J., Cooper J. R., Gaudette, L. E., Ladu, B. N., Mitoma, C. & Underfriend, S. (1955). Detoxication of drugs and other foreign compounds by liver
microsomes. Science 121,603-604.
Carabaza, A., Ciudad, C. J., Baque, S. & Guinovart, J. J. (1992). Glucose has to be
phosphorylated to activate glycogen synthase, but not to inactivate glycogen
phosphorylase in hepatocytes. FEBS 296,211-214.
Carrol, J. J., Smith, N& Babson, A. L. (1970). A colorimetric serum glucose determination using hexokinase and glucose-6-phosphate dehydrogenase. Biochem.
Med. 4,171-180.
Chawalit, K., Srelarvbsa, P. & Thithapardha, A. (1982). Glucagon and insulin in the
control of liver metabolism. Disphos. 10,81-86.
Clarke, B. F., & Duncan, L. J. (1979). Biguanide treatment in the management of insulin
independent (maturity onset) diabetes: Clinical experience with metformin. Res Clin.
For. 1,53-63.
Conney, A. H., Lu Y. H., Somogyi, A., West, S. & Kuntzman, R. (1973). Effect of the
cytochrome P-450's. DnigMetab. Dispos. 1,199-209
Cooper, D. Y., Levin, S. S., Narasimhulu, S., Rosenthal, 0. & Estabrook, R. W. (1965).
Photochemical action spectrum of the terminal oxidase of the mixed function oxidase
system. Science 147,400-402.
155

Curnow, R. T., Rayfield, E. J. & George, D. T. (1975). Control of hepatic glycogen
metabolism in the monkey: effect of glucose, insulin and glucagon administration. Am.
J. Physiol. 228,80-87
Defeng, W. U. & Arthur, I. (1993). Combined effects of streptozotocin induced diabetes
plus 4-methylpyrazole treatment on rat liver cytochrome P-4502E. Archives of Biochemistry and Biophysics. 302,175-182.
Dent, P., Lavoinne A., Nakielny, S., Caudwell, F. B., Watt, P& Cohen, P. (1990). The
molecular mechanism by which insulin stimulates glycogen synthesis in mammalian
skeletal muscle. Nature. 348,302-308.
Dewulf, H. & Hers, H. G. (1968). Mechanism of control of hepatic glycogenesis by
insulin. J. Biol Chem. 248,3483-3488.
Dixon, R. L., Hart, L. G., Rogers, L. A. & Fouts, J. R. (1963). The metabolism of drugs
by liver microsomes from alloxan-diabetic rats: Long term diabetes. Journal of
Pharmacology and Experimental Therapeutics 142,312-317.
Dixon, R. L., Hart, L. G. & Fouts, J. R. (1961). The metabolism of drugs by liver
microsomes from alloxan diabetic rats. Journal of Pharmacology and Experimental
Therapeutics. 133,7-11.
Einarsson, K., Gustafsson, J. A., & Stenberg, A. (1973). Neonatal imprinting of liver
microsomal hydroxylation and reduction of steroids. J. Biol. Chem. 248,4987-4997.
Einarsson, K., Gustafsson, J. A., & Hellstrom, K. (1974). Influence of clofibrate on liver
microsomal hydroxylation of cholesterol and androstenedione. Biochem. Pharmacol.
23,13-19.
Eisenbarth, A. S. (1986). Type 1 diabetes mellitus. N. Engl. J. Med, 314,1360-1368.
156

Elgadi, A. A. (1989). Usage of some plants in Libyan Folk-Medicine. vol. 2 Libyan Govt. Press, Tripoli 63-64.
Elgadi, A. A. (1990). Usages of some plants in Libyan Folk-Medicine, vol. 1, Libyan
Govt. Press, Tripoli 9-10.
Espinal, J. (1989) `Understanding Insulin Action' Ellis Horwood Ltd, Chichester 91-98.
Exton, J. H. Lewis, S. B., & Ho, R. J. (1971). The role of cyclic AMP in the interaction
of glucagon and insulin in the control of liver metabolism. Ann. NY. Acad Sci. 185,85-
100
Exton, J. H., Robinson, G. A., Sutherland, E. W. & Park, C. R. (1971). Studies on the
role of adenosine 3,5-monophosphate in the hepatic actions of glucagon and
catecholamines. Biochem. 246,6166-6177
Fahmy, I. R., Ahmed, Z. F. & Abdul Moniem, F. M. (1958). Santonin an anthelmintmic in
Artemisia herba alba. Bull. De L Institute Du Desert D Egypt. p 33.
Fantus, I. G. & Brosseau, R. (1986). Mechanism of action of metformin, insulin receptor
and postreceptor effects in-vitro and in-vivo. J C1in. Endocrinol. Metab. 60,989-905.
Farjou, I. B., AI-Anni, M. & Guirges, S. Y. (1987). J. Fac. Med. Baghdad Dept. of Pharmacology, Medical School, Baghdad University, Baghdad, Iraq. 29,2.
Farjou, I. B. & Al-Lami, A. D (1988). Effect ofArtemisia extract on blood glucose and
plasma insulin in normal and diabetic rabbits. J. Fac. Med. Baghdad 30,239-249.
Favreau, L. V. & Schenkman, J. B. (1987). Decrease in the level of a constitutive
cytochrome P-450 (RLMS) in hepatic cytochrome of diabetic rats. Biochem. Biophys.
Res. Commun. 142,623-630.
157

Favreau, L. V., Malchof , D. M., Mole, J. E. & Schenkman, J. B. (1987). Responses to
insulin by two forms of rat hepatic microsomal cytochrome P-450 that undergo major (RLM5b) elevations in diabetes. J. Biol. Chem. 262,14319-14326.
Ferner, R. E. & Neil, H. A. W. (1988). Sulphonylureas and hypoglycaemia. Bio. Med J. 296,949-950.
Galal, E. E., Kandl, A., Abdellatif, M., Khede, T. & Khafagy, S. M. (1974). Cardiac
pharmaco-toxicological studies of judaicin, isolated from Artenzisia judaica. Planta Med., 25,88-91.
Ganong, W. E. (1989). Review of Medical Physiology 14th edition Prentice-Hall
International.
Gibson, G. G. & Skett, P. (1994). Introduction to Drug Metabolism, Chapman and Hall,
London, 230-233.
Ginsberg, H. & Ravtiel, E. G. (1981). Effect of insulin therapy on insulin resistance in
type II diabetic subjects: evidence for heterogeneity. Diabetes 30,739-45.
Goldfine, I. J., Iwamoto Y., Pezzino, V. (1984). Effect of biguanides and sulfonylureas on insulin receptors in cultured cells. Diabetes Care 7,54-58.
Gustafsson, J. & Stenberg, A. D. (1974). Irreversible androgenic programming at birth
of microsomal and soluble rat liver enzymes active on androst-4-ene-3,17-dione and Sa-
androstane-3a-, 170-diol. J. Biol. Chem. 249,711-718.
Gustafsson, J. A. (1973). The formation of 16,17-dihydroxylated C19 steroids from 16- dehydro C19 steroids in liver microsomes from male and female rats. Biochemica et BiophysicaActa, 296,179-188.
158

Harding, B. W., Wong, S. H. & Nelson, D. H. (1964). Carbon monoxide-combining
substances in rat adrenal. Biochim Biophys. Add. 92,415-417.
Harris, R. A. (1994). Carbohydrate metabolism Major metabolic pathways and their
control in "Textbook of Biochemistry, " Ed. Devlin, T. M; Wilsy-Liss press, NewYork
291-358.
Hartmann, H., Probst, I., Jungermann, K& Creutzfeldt, W. (1987). Inhibition of
glycogenolysis and glycogen phosphorylase by insulin and proinsulin in rat hepatocyte
cultures. Diabetes. 36,551-555.
Hems, D. A. & Whitton, P. D. (1980). Control of hepatic glycogenolysis. Physiol. Rev.
60,1-23
Hems, D. A. & Whitton, P. D. (1973). Stimulation by vasopressin of glycogen breakdown and gluconeogenesis in the perfused rat liver. Biochem. J. 136,705-709.
Hermann, L. S. (1979). Metformin: a review of its pharmacological properties and
therapeutic use. Diabete Metab. 5,233-245.
Hers, H. G. (1976). The control of glycogen metabolism in the liver. Annu. Rev.
Biochem. 45,167-190.
Hoftiezer, V& Carpenter, A. M. (1973). Comparison of streptozotocin- and alloxan- induced diabetes in rat, including volumetric quantitation of the pancreatic islets.
Diabetologia. 9,178-184.
Holle, A, Mangel W, Dreyer, M, Kuhnan, J& Rudiger, H. W. (1981). Biguanide
treatment increase the number of insulin receptor sites on human erythrocytes. N. Engl.
J. Med. 251,353-366.
159

Holle, A., Mangelo, W. & Dreyer, M. (1986). Biguanide treatment increases the number of insulin receptor sites in human erythrocytes. N. Eng. J. Med. 305,563-568.
Home, P. (1989). `Editorial' Diabetic Med. 6,3-5
Husni, A. A., Twai, J. & Ammar Albadr, A. (1988). Hypoglycaemic activity of Artemisia Herba Alba. JEthnopharmacology. 24,123-126.
Hussein-Ayoub, S. M. (1990). Antibacterial and antifungal activities of some Libyan
aromatic plants. PlataMed. 56,644-645.
Hussin, A. H. & Skett, P. (1986). Maintenance of steroid metabolism in primary cultures of adult, rat hepatocytes in serum-free medium. Biochem. Soc. Trans. 14,914-915.
Hussin, A. H. & Skett, P. (1987). The effect of insulin on steroid metabolism in isolated
rat hepatocytes. Biochem. Pharmac. 36,3155-3159.
Hussin, A. H. & Skett, P. (1988). Lack of effect of insulin in hepatocytes isolated from
streptozotocin-diabetic male rats. Biochem. Pharmac. 37,1683-1686.
Ichikawa, Y. & Yamano, T. (1967). Reconversion of detergent- and sulphydryl reagent-
produced cytochrome P-420 to cytochrome P-450 by polyols and glutathione. Biochim.
Biophys. Acta. 131 490-497.
Joslin, E. P. (1985). `Diabetes Mellitus', 12th edition, Lea and Febiger, Philadelphia.
Kaji, T., Kaja, K., Miezi, N, Tomohiro, N., Ejiri, N. & Sakurgawa, N. (1990). Possible
mechanism of the stimulatory effect of Artemisia leaf extract on the proliferation of
cultured endothelial cells: Involvement of basic fibroblast growth factor. Chem. Pharm.
Bull. 38,2494-2497.
160

Kamataki, T., Maeda, K, Yamazoe, Y., Nagai, T. & Kata, R., (1983). Sex difference of
cytochrome P-450 in the rat: Purification, characterization and quantitation of
constitutive form of cytochrome p-450 from liver microsomes of male and female rats.
Arch. Biochem. Biophys. 225,758-770.
Kato, R. & Gillette, J. R. (1965). Sex differences in the effects of abnormal physiological
states on the metabolism of drugs by rat liver microsomes. J. Pharmac. Exp. Ther. 150,
285-291
Kato, R., & Onoda, K. (1970). Study on the regulation of the activity of drug oxidation
in rat liver microsomes by androgen and estrogen. Biochem. Pharmacol. 19,1649-
1660.
Kato, R, Taakanaka, A. & Onoda, K. (1971). Effect of adrenalectomy or alloxan
diabetes on the substrate interaction with cytochrome P-450 in the oxidation of drugs by
liver microsomes. Biochem. Pharmacol. 20,447-458.
Kawad, J. (1992). New hypotheses for the mechanisms of streptozotocin and alloxan
induced diabetes mellitus. Yakugakzi Zasshi. 112,773-791.
Kennedy, D. L., Piper, J. M. & Baum, C. (1988). Trends in use of oral hypoglycaemic
agents. Diabetes Care 11,558-562.
Khafagy, S. M. & Tosson, S., (1968). Crystallographic, optical and chromatographic
studies ofjudaicin, bitter principle of Artemisia judaica L. Planta med. 16,446-449
Khafagy, S. M., Gharbe, S. A. & Sarg, T. M. (1971). Phytochemical investigation of
Artemisia herba alba. Planta Medica 20,90-97.
Khafagy, S. M., Abdelsalam, M. A. & El-Ghazoly, M. G., (1976). A calorimetric method
for the estimation of judaicin bitter principle of Artemisia judaica. Planta medica. 30,
21-24.
161

Kiso, Y., Ogasawara, N., & Hikino, H., (1984). Antihepatotoxic principles ofArtemisia
capillaris buds. Planta med. 50,8 1.85.
Klingenberg, M& Garfinkel, P. (1958). Pigments of rat liver microsomes. Arch.
Biochem. Biophys. 75,376-386.
Krebs, E. G. & Fischer, E. H. (1962). Molecular properties and transformations of
glycogen phosphorylase in animal tissues. Adv. EnzymoL, 24,263-290.
Kreuther, W. & Goldberg, N. D. (1967). Dependence on insulin of the apparent hydrocortisone activation of hepatic glycogen synthase. Proc. Natl. Acad Sci. U. S. A.
58,1515-1519.
Kreutzberger A. & Loch M. (1985). Muscle relaxants, IV: Monoacylbutyroguanamines.
Arch. Pharm. 319,289-295.
Kupfer, D. (1980). Endogenous substrates of monooxygenases: Fatty acids and
prostaglandins. Pharmac. Ther. 11,469-496.
Lawrence, C. J. & Zhag, J. (1994). Control of glycogen synthase and phosphorylase by
amylin in rat skeletal muscle. Hormonal effects on the phosphorylation of phosphorylase
and distribution of phosphate in the synthase subunit. J. Biol. Chem. 269,11595-11600.
Lebovitz, H. E. (1985). Oral hypoglycemic agents. In The Diabetes Annual-vol. 1.
KGMM Allerti and Krall LP Eds. Amsterdam, Elsevier. 93-110.
Letoir, L. F. & Cadini, C. E., (1957). Biosynthesis of glycogen from uridine diphosphate
glucose. J. Am. Chem. Soc. 79,6340-6346.
Lewis, H. W., (1977). Medical Botany, Plants Affecting Man's Health John Wiley, New
York, 820-824.
162

Lillioja, P. (1988). Impaired glucose tolerance as a disorder of insulin action N. Eng J.
MecL, 318,1217-1225.
Lowry, O. H., Rosenbrough N. J., Farr A. L. & Randal R. J. (1951) Protein measurement
with folin phenol reagent. JBiocherrm., 193,265-275.
Lu, A. Y. H. & West, S. B. (1980). Multiplicity of mammalian microsomal cytochrome P- 450 Pharmacol. Rev. 31,277-295.
Lucis, O. J. (1983). Pharmacological update. The status of metformin in Canada. Can.
Met Assoc. J. 128,24-26.
Luciano, V. S. (1990) 'Human physiology; The mechanisms of body function'. Fourth
edition New York St. Louis San Francisco, Auckland, 513.525.
Martin, J. L., Veluaja; Ross, K., Johnson, L. N., Fleet, G. W. J., Ramsden, N. G., Bruce, I.,
Orchard, M. G. (1991). Glucose analogue inhibitors of glycogen phosphorylase: The
design of potential drugs for diabetes. Biochemistry. 30,10101-10116.
Melander, A. (1988). NIDDM treatment with sulfonylureas, in "Clinical Endocrinology
and Metabolism", Nattrass, M Hale, P. J., Eds. London, l3alliere Tindall. 443-53.
Melin, B. Cherqui, M. J. & Blivet, M. (1990). Dual effect of metformin in cultured rat hepatocytes: Potentiation of insulin action and prevention of insulin-induced resistance
Metabolism. 39,1089-1095.
Miller, T. B. & Larner, J. (1973). Mechanism of control of hepatic glycogenesis by
insulin. J. Biochem. 248,3483-3488 .
Miller, T. B. (1978). Phosphorylase activation sensitivity in hearts of diabetic rats. Ant. J.
Physiol. (Endocrinol. Metab. 9): E134-E140.
163

Miller, T. B., Garnache, A. K., Cruz, J. McPherson, R. K. & Wolleben, C. (1986).
Regulation of glycogen metabolism in primary cultures of rat hepatocytes. J. Blot. Chem. 261,785-790.
Mossa J. S. (1985). Phytochemical and biological studies on Artem/sla abyssinica an antidiabetic herb in Arabian folk medicine. Fitoterapla. 56,311-314.
Muntoni, S. (1974). Inhibition of fatty acid oxidation by biguanides. Implication for
metabolic physiopathology. Adv. lipid Res. 12,311.
Nash, T. (1953). The colorimetric estimation of formaldehyde by means of the Hantzsch
reaction. J. Biol. Chem. 55,416-422.
Oates, N. S., Shah, R. R. & Smith, R. L. (1981). Phenformin induced lactic acidosis
associated with impaired debrisoquine hydroxylation Lancel 1,837-838.
Oesch, F. & Friedberg, T. (1987). Xenobiotic metabolising enzymes are not restricted to parenchymal cells in rat liver. Mol. Pharmacol. 32,463-470.
Omura, T. & Sato, R. (1962). A new cytochrome in liver microsomes. J Biol. Chem.
237,1375-1376.
Omura, T. & Sato, R. (1964). The carbon-monoxide-binding pigment of liver
microsomes. I. Evidence for its hemeprotein nature. J. B/ol Chem. 239,2370-2378
Paine, A. J. (1981). Hepatic cytochrome P-450. Essays in Biochemistry. 17,85-121
Peacock, J. & Tattersall, R. B. (1984). The difficult choice of treatment for poorly
controlled maturity onset diabetes: Tablets of insulin. l3rMedJ. 288,1956-59.
164

Pezzino, V., Trischitta, V. & Purello, F. (1982). Effect of metformin on insulin binding
to receptors in cultured human lymphocytes and cancer cells. Diabelologia 23,131-135.
Pugazenthi, S. & Khandelwal, R. L. (1990). Insulin like effects of vanadate on hepatic
glycogen metabolism in nondiabetic and streptozotocin-induced diabetic rats. Diabetes.
39,821-827.
Pugazenthi, S. & Khandelwal, R. L. (1991). Kinases and phosphatases of hepatic
glycogen metabolism during fasted to refed transition in normal and streptozotocin-
induced diabetic rats. Biochemistry International 23,515-524.
Reinke, L. A., Stohs, S. J. & Rosenberg, H. (1978). Increased aryl hydrocarbon
hydroxylase activity in hepatic microsomes of streptozotocin diabetic female rats. Xenobiotica 8,769-778.
Roesler, W. J. & Khandelwal, R. L. (1987). Regulation of rat liver glycogen
phosphorylase concentration by in-vivo relative levels of glucagon and insulin.
Endocrinology. 121,227-232.
Rouer, L. A & Leroux, J. P. (1980). Liver microsomal cytochrome P. 450 and related
monooxygenase activities in genetically hyperglycaemic and lean streptozotocin treated
mice. Biochem. Pharmacol. 29,1959-1962.
Saihanick, A. L., Konowitz, P. & Amatruda, J. M. (1983). Potentiation of insulin action
by a sulphonylurea in primary cultures of hepatocytes in normal and diabetic rats
Diabetes 32,206-212.
Schenkman, J. B. (1990). Induction of diabetes and evaluation of the diabetic state on
cytochrome P-450 expression. Methods ill Enzymology. 206,325-331.
Schenkman, J. B., Remmer, 0. & Estabrok, R. (1967). Spectral studies of drug
interactions with hepatic microsomal cytochrome. Mol. Pharmacol. 3,113-123.
165

Seglen, P. O. (1976). Preparation of isolated rat liver cells. Methods Cell. B1o1.13,29- 83
Shen, S. W. & Bressler. R. (1977). Clinical pharmacology of oral antidiabetic agents. N. Eng. J. Med 296,493.497.
Siddle, K. & Kane-Maquire, B. (1973). The effects of glucagon and insulin on adenosine 3', 5'- cyclic monophosphate concentration in an organ culture of mature rat liver. Biochem. J. 132,765.
Shen, L. C., Villar-Palasi, C. & Laner, J. (1970). Glycogen metabolism and the
mechanism of action of cyclic AMP. Physiol. Chem. Phy. 2,536-541.
Skett, P. (1986). Sex dependent effect of streptozotocin-induced diabetes mellitus on hepatic steroid metabolism in the rat. Acta Endocrinol. 111,217-221.
Skett, P& Joels, L. A. (1985). Different effect of acute and chronic diabetes mellitus on hepatic drug metabolism in the rat. Biochemical Pharmacolog . 4,. 287-289.
Skett, P. Mode, A., Rafter, J., Sahlin, L. & Gustafsson, J. A. (1980). The efrccts of
gonadectomy and hypophysectomy on the metabolism of imipramine and lidocaine by
the liver of male and female rats. Biochemical Pharmacolol y. 29,. 2759-2762.
Skett, P. & Hussin, A. H. (1987). The effect of insulin on steroid metabolism in isolated
rat hepatocytes. Biochemical Pharmacol. 36,3155-3159.
Skett, P. Cochrane R. A. & Joels L. A. (1984). The role of androgens in the effect of diabetes mellitus on hepatic drug metabolism in the male rat. Acta
Endocrinol. (Copenh. ) 107,506-512.
166

Stalmans, W, Bollen, M, Toth, B& Gergely, P. (1990). Short - term hormonal control
of protein phosphatases involved in hepatic glycogen metabolism. Adv In. En. )m. 30,
305-327.
Stalmans, W, Dewulf, H. & Hers, H. G. (1971). The control of liver glycogen synthase
phosphatase by phosphorylase, Eur. J. Biochem. 18,582-587.
Stalmans, W. & Hers, H. G. (1973) in `The enzyme' (Boyer, P. D., ed. ) 3d edn, vol. 9,
pp. 309-361, Academic Press, New York.
Stalmans, W. & Hers, H. G. (1975). The stimulation of liver phosphorylase b by AMP,
fluoride and sulfate, A technical note. The specific determination of the a and b forms of
liver glycogen phosphorylase. Eur. JBiochem., 54,341-350.
Stalmans, W. Dewulf, H. Hue, L. & Her, H. G. (1974). The sequential inactivation of
glycogen phosphorylase and activation of glycogen synthase in liver after the
administration of glucose to mice and rats. Eur. J. Biochem. 41,127-134
Steinberg, P., LaFranconi, W. M., Wolf, C. R., Waxman, D. J. & Stowers, J. M. (1972).
Oral treatment in diabetes. Endocrinol. Metab. 1,721-760.
Stenberg, A. (1976). Developmental, diurnal and oestrous cycle-dependent changes in
the activity of liver enzymes. J. Endocr. 68,265-272.
Studer, R. K & Ganas, L. (1989). Effect of diabetes on hormone-stimulated and basal
hepatocyte calcium metabolism. Endocrinology. 125,2421-2433.
Sutherland, E. W. & Robinson, G. A. (1971). The role of cyclic AMP in the control of
carbohydrate metabolism. Diabetes 18,797
167

Thomas, J., Shlender, K. K. & Larner, J. (1968). A rapid filter paper assay for UDP-
glucose glycogen glucosyl-transferase, including an improved biosynthesis of UDP-14C
glucose. Anal. Biochem. 25,486-499.
Toshyuki, K., Kayoko, K., Nsimba, M., Tomohiro, H., Naoko, E., & Nobuo, S. (1990). Possible mechanism of the stimulatory effect of Artemisia leaf extract on the proliferation of cultured endothelial cells: Involvement of basic fibroblast growth factor. Chem. Pharm. Bull. 38,2494-2497.
Twaij, H. A., Elisha, E. E. & Khalid, R. M. (1989). Analgesic studies on some Iraqi
medicinal plants. Int. J. Crude Drug Res. 2,109-112
Van de Werne, G. & Jeanrenaud, B. (1987). Glycogen metabolism: An overview. Diabetes Metab. Rev. 3,47-78.
Van der Werve, G, Stalman, W. & Hers, H. G. (1977). The effect of insulin on the
glycogenolytic cascade and on the activity of glycogen synthase in the liver
anaesthetized rabbits. Biochem. J. 162,143-146.
Watt, J. M. & Breger-Brandwizk, M. G. (1962). The medicinal and poisonous plants of South and Eastern Africa, 2nd Ed. E and S Livingstone, Edinburgh.
Watt, J. M. & Wood, E. D. (1988). Health: Conventional and complementary
approaches. London, Ray Soc. Med., WHO Expert Committee: Diabetes Mellitus
second report Geneva, World Health Org., 1980 tech. Rep. Ser. 646.
Waxman, D. J., Morrissey, J. J. & Leblanc, G. A. (1989). Female-predominant rat hepatic P-450 forms J(IIEI and 3(IA1) are under hormonal controls distinct from those
of the sex-specific P-450 forms. Endocrinology 124,2954-2966.
168

Weiner, M., Buterbaugh, G. G. & Blake, D. A. (1972). Inhibition of hepatic drug
metabolism by cyclic 3', 5'-adenosine monophosphate. Res Commum Cliem. Pathol.
Pharmacol. 3,249-263.
Witters, L. & Avrucb, J. (1978). Insulin regulation of hepatic glycogen synthase and Phosphorylase. Biochemistry. 17,406-410.
WHO Expert Committee: Diabetes Mellitus. 2nd rep. Geneva, World health Org., 1980 Tech. rep. ser. 646)
ZaU 169 fNWZRS G( -
9; 1