deb pone.0088485 1. - wrap: warwick research archive...
TRANSCRIPT

http://wrap.warwick.ac.uk
Original citation: Casale, Francesco Paolo, Giurato, Giorgio, Nassa, Giovanni, Armond, Jonathan W., Oates, Chris J., Corá, Davide, Gamba, Andrea, Mukherjee, Sach, Weisz, Alessandro and Nicodemi, Mario. (2014) Single-cell states in the estrogen response of breast cancer cell lines. PLoS ONE , Volume 9 (Number 2). Article number e88485. ISSN 1932-6203 Permanent WRAP url: http://wrap.warwick.ac.uk/59690 Copyright and reuse: The Warwick Research Archive Portal (WRAP) makes this work of researchers of the University of Warwick available open access under the following conditions. This article is made available under the Creative Commons Attribution 3.0 (CC BY 3.0) license and may be reused according to the conditions of the license. For more details see: http://creativecommons.org/licenses/by/3.0/ A note on versions: The version presented in WRAP is the published version, or, version of record, and may be cited as it appears here. For more information, please contact the WRAP Team at: [email protected]

Single-Cell States in the Estrogen Response of BreastCancer Cell LinesFrancesco Paolo Casale1, Giorgio Giurato2, Giovanni Nassa2, Jonathan W. Armond3, Chris J. Oates3,
Davide Cora4, Andrea Gamba5, Sach Mukherjee6*, Alessandro Weisz2*, Mario Nicodemi7*
1 European Molecular Biology Laboratory, European Bioinformatics Institute, Hinxton, Cambridge, United Kingdom, 2Department of Medicine and Surgery, Laboratory of
Molecular Medicine and Genomics, University of Salerno, Baronissi, Salerno, Italy, 3Centre for Complexity Science, University of Warwick, Coventry, United Kingdom,
4 Institute for Cancer Research and Treatment (IRCC), University of Turin School of Medicine, Candiolo, Turin, Italy, 5Department of Applied Science and Technology,
University of Turin, Istituto Nazionale di Fisica Nucleare (INFN), Human Genetics Foundation (HuGeF), Torino, Italy, 6Netherlands Cancer Institute, Amsterdam, The
Netherlands, 7Department of Physics, University of Naples Federico II, CNR-Spin, Istituto Nazionale di Fisica Nucleare (INFN), Napoli, Italy
Abstract
Estrogen responsive breast cancer cell lines have been extensively studied to characterize transcriptional patterns inhormone-responsive tumors. Nevertheless, due to current technological limitations, genome-wide studies have typicallybeen limited to population averaged data. Here we obtain, for the first time, a characterization at the single-cell level of thestates and expression signatures of a hormone-starved MCF-7 cell system responding to estrogen. To do so, we employ arecently proposed model that allows for dissecting single-cell states from time-course microarray data. We show that within32 hours following stimulation, MCF-7 cells traverse, most likely, six states, with a faster early response followed by aprogressive deceleration. We also derive the genome-wide transcriptional profiles of such single-cell states and theirfunctional characterization. Our results support a scenario where estrogen promotes cell cycle progression by controllingmultiple, sequential regulatory steps, whose single-cell events are here identified.
Citation: Casale FP, Giurato G, Nassa G, Armond JW, Oates CJ, et al. (2014) Single-Cell States in the Estrogen Response of Breast Cancer Cell Lines. PLoS ONE 9(2):e88485. doi:10.1371/journal.pone.0088485
Editor: Roberto Amendola, ENEA, Italy
Received September 12, 2013; Accepted January 7, 2014; Published February 25, 2014
Copyright: � 2014 Casale et al. This is an open-access article distributed under the terms of the Creative Commons Attribution License, which permitsunrestricted use, distribution, and reproduction in any medium, provided the original author and source are credited.
Funding: The authors acknowledge funding for this work from the Italian Association for Cancer Research (http://www.airc.it/- Grant IG-13176) and the PRIN ofthe Italian Ministry for Education, University and Research (http://prin.miur.it/- Grant PRIN 2010LC747T 002) and a ‘‘Mario e Valeria Rindi’’ postdoctoral fellowshipto GN from the Italian Foundation for Cancer Research (http://www.fondazionefirc.it/). The funders had no role in study design, data collection and analysis,decision to publish, or preparation of the manuscript.
Competing Interests: The authors have declared that no competing interests exist.
* E-mail: [email protected] (SM); [email protected] (AW); [email protected] (MN)
Introduction
Cellular responses to estrogens are characterized by a
transcriptional activation and/or repression of specific subsets of
genes, whose characterization will provide essential information on
the molecular and genomic pathways of the hormone-responsive
breast cancer (BC) phenotype. To this aim, estrogen responsive
BC cell lines are useful model systems because of their deep
transcriptional similarities with ERa-expressing breast tumors
[1,2]. Their response to estrogens has, thus, been deeply studied to
try to characterize the structure of the process, and many
advancements have been made. Nevertheless, a genome-wide
quantitative analysis of the system at the single cell level is still
lacking. This is related to an intrinsic limitation of current major
time course genome-wide assays. In fact, time course data based
on technologies such as microarray and RNA-seq can only capture
population averaged expression levels. Yet, even if cells have been
perfectly synchronized at the initial time point of the time-course,
they will rapidly become a heterogeneous mixture because of the
intrinsic stochasticity of cell state transitions. As a result, while such
high-throughput techniques allow for a genome-wide character-
ization of the transformation of the population, they do not
directly provide information on the cell states and expression
signatures at the single-cell level.
To circumvent the above problems, we employ a quantitative
analysis method capable to exploit population average data, e.g.,
microarray, and to dissect the single-cell events involved in the
process. The method was previously used to investigate repro-
gramming of mouse embryonic fibroblasts into induced pluripo-
tent stem cells over four weeks [3]. Here we consider a different
biological system, a BC model, characterized by a much shorter
time scale, 32 hours.
In our approach, the dynamics of a single-cell is described, via a
Markov model, as a sequence of transitions between a network of
different single-cell states. In this way, the cell distribution over the
states and the population averaged, genome wide transcriptional
levels can be derived in terms of the single-cell state transcriptional
profiles and the transition rates across the states. Conversely, by
fitting the population data, e.g., microarray data, the single cell
states and transition rates can be obtained, thus providing a
description of the system at a single-cell level.
More precisely, in the approach used here, the single-cell
dynamics is described by a continuous time/discrete state Markov
model. Coupling this approach with the use of advanced statistical
methods and subsequent statistical analysis, we can determine, for
the first time in a quantitative manner: i) the most likely number of
single-cell states occurring in the BC estrogen-response process; ii)
the transcriptional profiles of such single-cell states and their
marker genes; iii) the key functional activities occurring in each
PLOS ONE | www.plosone.org 1 February 2014 | Volume 9 | Issue 2 | e88485

single-cell state; and iv) the cell residence times and transition rates
across the network of states. Here, in particular, we investigate the
response to estrogen of a breast cancer MCF-7 cell model. We
consider one of the largest available microarray time-course
dataset of a MCF-7 hormone-starved system exposed to estrogen
along 32 hours [4].
Cell Systems and DatasetsThe system considered here has been developed by Cicatiello
et al. [4] who reported an extensive microarray dataset consisting
in the time-course expression profiling of hormone-starved MCF-7
and ZR-75.1 model cells exposed to estrogen across 32 hours. The
microarray data, including 12 time points, were extracted for 4960
noise-filtered genes, differentially expressed during the time-course
assay [4]. In particular, a subset of 1270 genes has been shown to
share a similar transcriptional response to estrogen in the two cell
lines as described in Ref. [4]. They are referred to as common
‘‘estrogen-regulated’’ (E2R) genes. Cicatiello et al. [4] also
performed ChIP-seq experiments to identify primary targets of
ERa which led to the identification of 218 primary target genes
(below named ‘‘primary genes’’), i.e., E2R genes having an ERabinding site within 10 kb from the transcription starting site (TSS).
Finally, by matching the target sequences of transcription factors
encoded by the primary genes with the sequences of E2R genes,
11 genes encoding transcription factors (‘‘primary TF genes’’) that
affected expression levels of downstream genes were identified in
that study.
The Model
In the approach considered here [3], we assume that upon
activation a cell visits a sequence of n states (Fig. 1A). We outline
here the method considered and refer to Text S1 for further
details. In our model the transitions between the single cell states
are stochastic and described by a continuous-time Markov process.
Although more complex cases can be considered (see [3] for
technical details and discussion), for simplicity we focus here on
linear state networks, with n states. The dynamics of a cell is
defined by the transition rates, wj,jz1, between all pairs of
consecutive states j and jz1, and the single-cell states by their
expression signatures: we indicate with bij the expression of gene i
in state j. In our notation we name k the total number of genes,
i.e., i[f1,:::,kg. To be precise, since gene expressions still
fluctuates in single cells, our state expressions refer to a single-
cell average level [5,6]. In the following we also use the symbol, bjto represent the vector of the gene expressions for state j[f1,:::,ng(1A).
Fig. 1B illustrates an example of the changes occurring in a cell
population which results from the transition at the single cell level:
while all cells are synchronized in state 1 at t1~0, at t2 we see thatabout 30% of cells have transited to state 2, i.e., the probability to
find a cell in state 2 is p2(t2)^30%, while a few cells have already
reached the third state. At t3 the population is highly heteroge-
neous with about 30% of cells being in each of state 1, 2 and 3 (i.e.,
p1(t3)^p2(t3)^p3(t3)^30%). A microarray measure in such a
heterogeneous population will capture the average expression of
Figure 1. A schematic overview of the Markov model. (A) The dynamics of a single-cell is modeled as a sequence of transitions between ndifferent cell states, via a Markov model, following [3]. The transition rate of a cell from state j to state jz1 is named wj,jz1 , and the single-cell geneexpression levels in state j are named bj (i.e., bj is a vector with the state transcriptional profile): in the example, genes in red (green) are up-regulated
(down-regulated) in the corresponding state. (B) Population properties. An initially homogeneous cell population becomes heterogeneous becauseof the intrinsic stochasticity of cells which distribute over the different states. Microarray time course data record the average expression of genes attime t, x(t). The Markov model (panel a) can connect the single-cell behavior to the population behavior. As illustrated in the rightmost column of thefigure, by use of the single-cell transition rates, wj,jz1 , and state transcriptional profiles, bj , the time-dependent cell distribution across the states, pj(t),
and the predicted average transcriptional profile, xx(t), can be derived. Conversely, by fitting the microarray data, x(t), with the model predictions,xx(t), the properties of the single-cell states (the bj9s) and transition rates (wj,jz19s) can be extracted. Note that, in general, the average expressions,
x(t), are different from the state profiles, bj , as seen in the example.
doi:10.1371/journal.pone.0088485.g001
Cell States in the Estrogen Response of MCF7 Cells
PLOS ONE | www.plosone.org 2 February 2014 | Volume 9 | Issue 2 | e88485

the genes, x(t), across the single-cell states which have been
populated. Yet, the crucial point is that the average expression,
x(t), in general does not represent faithfully the single-cell state
profiles. For instance, as illustrated in the example of Fig. 1B,gene 1 is highly expressed in state 1 while its expression drops
sharply in the transition to state 2. However, the measure of its
expression on the heterogeneous population is still comparatively
high at time t2 so that information is lost in the mixture of cell
states. As we explain below, our method of analysis allows
addressing these issues and dissecting the dynamics at a single-cell
level.
The transition rates, w~ w1,2,:::,wn{1,nð Þ define univocally the
dynamics of the cell population via the master equation of the
Markov process:
dpj(t)
dt~wj{1,jpj{1(t){wj,jz1pj(t) j~1,:::,n ð1Þ
Here pj(t) indicates the fraction of cells in state j at time t (and,
in our notation, w0,1~wn,nz1~0). The master equation can be
exactly integrated and the analytic form of pj(t) can be obtained as
a function of the rates w (Text S1). The parameters, bj , of the
state expression profiles are ‘‘static’’ (i.e., they do not change over
time) representing the features of the fixed single-cell states. The
entire set of the model parameters is indicated below with
h~ w,b1,:::,bnð Þ.The population-averaged expression xxi(t; h) of gene i at time t
predicted by the model is, thus, given by:
xxi(t; h)~p1 tð Þbi1zp2 tð Þbi2z:::zpn tð Þbin i~1,:::,k
~Xnj~1
pj t;wð Þbijð2Þ
where in the last line we have explicitly shown the dependence of
the probabilities pj on the transition rates.
In general, in a linear network of n states (Fig. 1A), the model
parameters are the n{1 transition rates, wj,jz1, and nk state-
specific expression levels of the genes, bij . Suppose we have the
expression level of k genes across T time points (in our notation
xi(t) is the measured expression of gene i at time t): if the number
of the model unknown parameters, n{1znk, is less than the
number of data, kT , we can fit the data and derive the single-cell
parameters. More precisely, we can infer the model parameters, h,by fitting the measured gene expressions, x(t), with the model
predictions, xx(t; h): xi(t)~xxi(t; h) Vi[f1,:::,kg and Vt[ft1,:::,tTg.The model fitting algorithm used in our study is summarised in the
Methods section and discussed in greater detail in Text S1.
Methods
DataWe considered the microarray dataset from Cicatiello et al. [4],
deposited in the ArrayExpress database (http://www.ebi.ac.uk/
microarray-as/ae/) with accession numbers E-TABM-742 and E-
MTAB-131, consisting in time-course expression profiling of
hormone-starved MCF-7 and ZR-75.1 exposed to estrogen across
32 hours. RNA was extracted before stimulation (t~0) and at
1,2,4,6,8,12,16,20,24,28,32 hours of exposition. Data were
preprocessed as in Cicatiello et al. [4], where the procedure is
described in details. In brief, data were normalized with Quantile
[7] normalization and only genes having a detection p-value
ƒ0:05 in at least one time point were considered. To identify
differentially expressed genes we used the ILLUMINA DiffScore.
The selected genes have DiffScore ƒ{40 or §40, corresponding
to a p-value of 10{4, in at least one time point with respect to the
control (t~0). This procedure led to identify 4960 and 4106 noise-
filtered genes responding to estrogen respectively in MCF-7 and
ZR-75.1 cell lines.
We focus on transcription data as they are currently available,
but our method can be applied to consider other time-varying
data, such as epigenetic data, or important information on
chromatin organization [8–10], to directly identify state-specific
epigenetic signatures and spatial conformations along with
expression patterns (to this aim other specific models can be
associated to the present one [11,12], along with other state-
defining properties [13]).
Model FittingAs the model is characterized by a large set of parameters, a
least-squares fit can be inadequate to reliably estimate its
parameters, h [14]. Thus, we employed a maximum-a-posteriori
approach (MAP), where available prior knowledge is used to
regularize the estimation. The MAP estimate is obtained by
maximizing the posterior density p(hDxi(t)) (i.e., the probability
density over parameters h given the observed data) with respect to
the parameters. Using Bayes’ theorem the posterior can be written
as
p(hDxi(t))~p(xi(t)Dh)p(h)
p(xi(t))ð3Þ
Figure 2. The number of single-cell states in the MCF-7 response to estrogen. (A) The mean squared error of the model fit to the microarraydata decreases as function of the number of states: as expected, when the number of parameters increases, the quality of the fit improves. (B) Thecondition number is a measure of the similarity of the transcriptional profiles of the states. It increases as function of the number of states, n,highlighting that over-fitting also increases with n. A good balance between fit quality and over-fitting must be found. (C) The model posteriorprobability, derived by a Bayesian approach, has a peak at n~6, which shows that a model with six states strikes a good balance between fit-to-dataand model parsimony.doi:10.1371/journal.pone.0088485.g002
Cell States in the Estrogen Response of MCF7 Cells
PLOS ONE | www.plosone.org 3 February 2014 | Volume 9 | Issue 2 | e88485

where p(xi(t)Dh) and p(h) are the likelihood function and the prior
distribution. The first takes into account the evidence in the data
whereas the second expresses the uncertainty about model
parameters before observing the data. Our choice of the prior
distribution over model parameters takes into account the
lognormal-like distribution of gene expressions observed in
microarray and RNA-seq assays.
In particular, we considered gene-specific gaussian noise over
predicted log expression levels with variance that is proportional to
the variability over time in the data (Text S1). In this framework,
log-expression profiles are fitted with the same relative error across
different genes and the maximization of the posterior is equivalent
to the minimization of the sum of squares
RSSL hð Þ~Xip
zzi tp; h� �
{zi(tp)� �2
zlXij
logbij� �2 ð4Þ
where the sum over p runs over the microarray time points, the
sum over i over the genes, and j over the states; zzi t; hð Þ and zi(t)are the z-scores of log(xxi t; hð Þ) and log(xi(t)) respectively. The
Figure 3. The single-cell transition rates and state transcriptional profiles in the MCF-7 response to estrogen. (A) Representation of then~6 state model (chosen using our model selection methods, see Fig. 2) and its parameters, with the color code adopted in the following figures.(B) The predicted single-cell transition rates, wj,jz1 (and their inverse, the average times of transitions), between the different single-cell states. In theresponse to estrogen, the first state transition of cells appears to occur on a scale of about 2 hours, while the dynamics decelerates later on. (C) Thepredicted cell population dynamics, i.e., the fraction of cells in the different states as a function of time, pj(t). It emerges that after 32 hours (theduration of the microarray experiment) about 40% of the population has still not reached the final state. (D) Single-cell predicted transcriptionalprofiles (i.e., the bj with j[f1,:::,6g). The heat map shows the log2 fold changes with respect to the first state. Large groups of genes are seen to
change their expression from state to state. (E) Details of the state profiles (fold change) of the 11 primary transcription factor (PTF) genes identifiedin Ref. [4]. Genes highlighted in yellow (blue) are found in the microarray data to be on average up-regulated (down-regulated) after estrogen-stimulation during the time-course. As visible, a much finer expression pattern is revealed by the analysis of their expression across the single-cellstates.doi:10.1371/journal.pone.0088485.g003
Cell States in the Estrogen Response of MCF7 Cells
PLOS ONE | www.plosone.org 4 February 2014 | Volume 9 | Issue 2 | e88485

first part of eq.(4) takes into account the goodness of the fit while
the second part considers the penalty introduced by the prior. The
parameter l controls the extent of the penalization and was
calibrated over the data.
Minimization of the RSSL (4) is a hard computational task
given the high dimensionality of the data and model parameters as
well as the non-linear analytical relationship between the
population dynamics and rate parameters. We circumvented this
problem by first determining the transition rates (which are
common to the entire gene system) on a smaller subset of genes
which captures the dynamical response of the whole system [3].
To select those representative genes, we clustered z-scores of log-
transformed time-course data using k-means. Replacing each gene
within a cluster with the gene that best represents that cluster, we
obtained a less complex form for the RSSL, characterized by a
lower number of parameters. We minimized such a reduced form
to obtain transition rates and then we went on to minimize the
original RSSL with those fixed transition rates on a per-gene basis.
We considered an initial set of 256 representative genes after
checking that starting from larger initial sets does not lead to
different results in terms of population dynamics. Optimizations
were performed in MATLAB R20012b with the function lsqnonlin.
Further details concerning the identification of the initial set, the
derivation of the reduced RSSL and the inference of parameters
are given in the Text S1.
Bayesian Model SelectionTo address the selection of the number of states of the model,
we trade off fit-to-data against model complexity by employing a
quantitative Bayesian framework, which we illustrate here. First of
all, the goal of this analysis is to obtain a posterior distribution over
the models, i.e. over the number of states. Indicating with Mn the
model with n states, and considering log-transformed time-course
data, yi(t)~ log xi(t), the posterior P MnDxi(t)ð Þ can be written as
P MnDyi(t)ð Þ~ p yi(t)DMnð Þp Mnð Þp yi(t)ð Þ !p yi(t)DMnð Þ ð5Þ
where we have applied the Bayes theorem and we have considered
a flat prior over models, and p yi(t)DMnð Þ is the model marginal
likelihood. In particular, we considered normal observational noise
over yi(t) and chose weakly informative priors over model
parameters (see Text S1). Introducing the extended set of
parameters h0~ s1,b1,:::,sn,bn,wf g, where s2i is the noise variancefor gene i, the marginal likelihood can be calculated as an integral
over the parameters
p yi(t)DMnð Þ~ðdh0p(yi(t)DMn,h
0)p(h0DMn) , ð6Þ
where p(h0DMn) and p(yi(t)DMn,h0) are the prior distribution of h0
and the likelihood of the model respectively. Computing the
Figure 4. Fits to gene expression time-course data. The fit to some key genes, comprising the 11 primary transcription factors identified byCicatiello et al. [4] and other important estrogen-responsive genes [1,2], are shown: black circles represent time-course (standardized) data whilegreen lines represents the gene expression predicted by the six-state model.doi:10.1371/journal.pone.0088485.g004
Figure 5. The single-cell transition rates in the ZR-75.1 system. Results of the six-state model for time course data in hormone-starved ZR-75.1 cells responding to estrogen stimulation are shown for comparison with the MCF-7 system of Fig. 3. (A) Cell population dynamics. (B) Rates andmean times of transitions. In ZR-75.1 the response to estrogen is initially one order of magnitude faster than in MCF-7.doi:10.1371/journal.pone.0088485.g005
Cell States in the Estrogen Response of MCF7 Cells
PLOS ONE | www.plosone.org 5 February 2014 | Volume 9 | Issue 2 | e88485

marginal likelihood (6) is a hard computational task that involves
the integration over the high dimensional space of the model
parameters. As described in the following, we used a Markov chain
Monte Carlo (MCMC) algorithm known as annealed importance
sample (AIS) [15].
Annealed Importance SamplingThe integral eq.(6) is very hard to compute given the high
dimensionality of the integration domain. To perform the
integration of our marginal likelihood we considered a MCMC
algorithm known as annealed importance sampling (AIS) [15].
MCMC algorithms from statistical physics are widely used in
Bayesian Inference [16,17]. In particular, AIS combines the ideas
of ‘annealing’ and ‘importance’ sampling providing low-variance
unbiased estimators and enjoying an improved rate of conver-
gence with respect to a naive MC scheme. In the following we very
briefly outline the algorithm while for further details about the
method we refer the interested reader to [15,17,18].
For simplicity of notation, in the following do not explicitly
indicate the conditioning on the model Mn. Let
0~c0vc1v:::vcM~1 be a strictly increasing sequence of real
numbers. The annealing bridges the prior and posterior distribu-
Figure 6. Marker genes in the MCF-7 system. In each state of a six-state model, genes are ranked by their state-expression fold change withrespect to the first state. Here, only the top 50 are shown along with their ranking in the other states. For the top genes of state 2 also the rankassigned considering a maximum fold change criterion over the time course is shown for comparison (separated column). The state-based rankingcriterion highlights marker genes which would otherwise pass unnoticed.doi:10.1371/journal.pone.0088485.g006
Cell States in the Estrogen Response of MCF7 Cells
PLOS ONE | www.plosone.org 6 February 2014 | Volume 9 | Issue 2 | e88485

tions by introducing M{1 additional distributions:
pm(h)~p(yi(t)Dh)cmp(h). The inverse of c plays the role of a
temperature. Let Tm indicate the kernel of the Markov chain
having pm(h) as equilibrium distribution. Using the AIS method,
the marginal likelihood of eq.(6) can be written as
p(yi(t)DMn)&1
N
XNa~1
expXMm~1
cm{cm{1ð Þlog p yi(t)Dh(a)m
� �� �( )ð7Þ
where N is the number of parallel chain runs, h(a)1 is sampled
directly from the chosen priors whereas h(a)m with mw1 is sampled
from Tm{1(hDh(a)m{1). In order to update the model parameter
values we considered a Metropolis-within-Gibbs scheme, which
provides a faster rate of convergence with respect to a Metropolis-
Hastings approach [19]. To test convergence, we looked at the
evolution of our estimate of p yi(t)DMnð Þ while increasing the
number of parallel chains. Further details about the Gibbs
sampling, our MCMC scheme and how we tested convergence
are given in the Text S1.
State Functional SignaturesTo characterize the inferred states in terms of cell functional
activities, we first identified the set of up-regulated genes for each
state and then performed a functional enrichment analysis on
those sets. A gene was defined as up-regulated in state j if its
expression fold change between state j and state 1 is greater than
1:5. To perform the enrichment analysis, we used the standard
DAVID (Database for Annotation, Visualization and Integrated
Discoveries) software tool [20,21] where we considered the whole
set of noise-filtered genes (4960) as background and set the
significance threshold at 5% FDR.
Results
Number of StatesOur first aim was to quantify the most likely number of states
that MCF-7 cells visit across 32 hours after estrogen stimulation.
This is a model selection problem and requires finding the best
trade-off of fit-to-data against model complexity. Indeed, while
models with a few states give poor fits to the data, models with too
many states risk to overfit by introducing artifactual states not
bearing any biological information. To address the selection of the
number of states, we first empirically examine how fit quality and
overfitting depend on the number of states and second we trade off
fit-to-data against model complexity by employing a quantitative
Bayesian framework.
In the empirical analysis, we looked at the mean squared error,
i.e. the distance between the expression data and the model fitted
values, and the degree of similarity between the different states for
an n-state model as a function of n in order to monitor the fit-to-
data performance and the overfitting respectively (Fig. 2A,B).More precisely, to empirically quantify the effects of overfitting, we
recorded the condition number of the expression matrix bij , which
is a measure of the similarity of the state profiles with each other,
as a function of n (Text S1). Above six states we observe marginal
improvements in the quality of the fit and a steep increase in the
similarity of the inferred states.
To confirm this empirical observation we considered the full
Bayesian approach presented in Methods, which has been shown
to be effective and principled approach to address model selection
[17,22,23]. With this analysis we determine the posterior
distribution of models over their number of states (Fig. 2C), i.e.the probability of having a certain number of states given the
evidence in the data. While this is comparatively high for the five
or the seven state model, interestingly, the posterior probability
has a peak at six states. This suggests that a six-state model strikes a
good balance between fit-to-data and model parsimony for the
system considered here and in the following we present our
findings obtained by employing such a model.
Cell Transition Rates and Population DynamicsA pictorial representation of the six-state model is given in
Fig. 3A, where the color code used in the rest of our paper figures
is also set. Fig. 3B–E summarize its key parameters which we now
discuss: the predicted state transition rates and the single-cell state
genome-wide gene expression profiles.
We first discuss the model cell transition rates and the
corresponding population dynamics, i.e., the single-cell events
involved in the oestrogen response of the MCF-7 cells, and the
resulting population behaviour. As can be seen by the average
transition times (Fig. 3B), we find that the response of MCF-7
cells to estrogen is characterized by a faster early dynamics
followed by a progressive deceleration. In fact, the transition from
the initial state to the first intermediate state occurs with a mean
time of 2.0 hours while the successive transitions are increasingly
slower, the transition to the final state takes on average 16.5 hours.
The population of state 1 is halved after roughly 2 hours of
Figure 7. Estrogen responding genes per state. Among the entire gene set considered in the MCF-7 cell experiment, 1270 also responded inZR-75.1 cells. These are referred to as common ‘estrogen-regulated genes’ (E2R genes) in [4]. ‘Primary genes’ are their subgroup having a ERatranscription factor binding site within 10 kb around the TSS. The figures show how E2R and primary genes are responding across the single-cellstates of a six-state model. (A) Fraction of up-regulated and down-regulated E2R genes. (B) Fraction of first-responding E2R genes, i.e., of genes thatrespond for the first time in a given state. (C) and (D) show the analogous pattern of primary genes.doi:10.1371/journal.pone.0088485.g007
Cell States in the Estrogen Response of MCF7 Cells
PLOS ONE | www.plosone.org 7 February 2014 | Volume 9 | Issue 2 | e88485
exposure to estrogen, while the fraction of cells being in state 1
becomes virtually 0 after 8 hours (Fig. 3C). States 2, 3, 4 and 5
peak respectively at 2, 5, 10 and 20 hours. We find that at t~32
hours only 58% of cells have reached the sixth, final state while
36% and 6% of cells are still respectively in states 5 and 4.
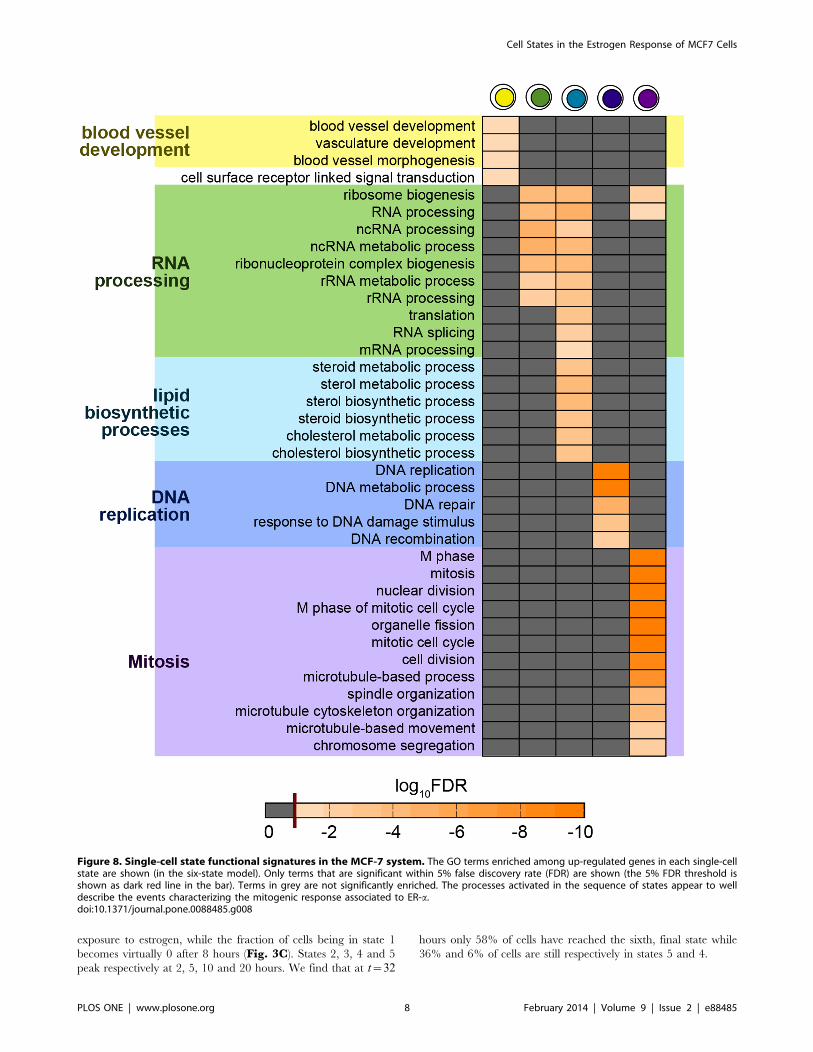
Figure 8. Single-cell state functional signatures in the MCF-7 system. The GO terms enriched among up-regulated genes in each single-cellstate are shown (in the six-state model). Only terms that are significant within 5% false discovery rate (FDR) are shown (the 5% FDR threshold isshown as dark red line in the bar). Terms in grey are not significantly enriched. The processes activated in the sequence of states appear to welldescribe the events characterizing the mitogenic response associated to ER-a.doi:10.1371/journal.pone.0088485.g008
Cell States in the Estrogen Response of MCF7 Cells
PLOS ONE | www.plosone.org 8 February 2014 | Volume 9 | Issue 2 | e88485
To provide an example of the quality of our fitting procedure, in
Fig. 4 we show the fit to 16 genes comprising the 11 primary
transcription factors identified by Cicatiello et al. [4] and other
important estrogen-responsive genes [1,2].
The ZR-75.1 cell line system. The other model of breast
cancer cells studied by Cicatiello et al. [4], ZR-75.1, is known to
share with MCF-7 a similar, yet faster transcriptional response to
estrogen, including, for example, cyclin genes and thus reflecting a
more rapid cell cycle start and progression [4,24]. We applied the
six-state model to the ZR-75.1 dataset as well and found a very
good fit, highlighting, indeed, a faster dynamics for earlier states in
ZR-75.1 in comparison to MCF-7. For instance, the first transition
takes places in only 0.3 hours rather than 2 hours (Fig. 5).
Single-Cell State Transcriptional ProfilesState-specific gene expressions, i.e., the transcriptional profiles
of the states, were determined for all the 4960 noise-filtered genes
differentially expressed during the time-course assay of Ref. [4], by
use of the fitting procedure described in the Methods section. In
Fig. 3D the fold change of the whole set of genes is shown across
the six states: in a given state, genes in red (green) are up-regulated
(down-regulated) with respect to state 1. Fig. 3D also highlights
that the states have very distinct transcriptional signatures, with a
substantial fraction of genes (around 50%) changing from up- to
down-regulated with respect to the neighboring states.
Fig. 3E collects a subgroup of genes of Fig. 3D: it shows the
details of the state profiles of the 11 primary transcription factor
(PTF) genes highlighted in Ref. [4]. In that work, it was found that
5 PTF genes (marked by a yellow background in Fig. 3E) were onaverage up-regulated after estrogen stimulation during the time-
course, whereas the other 6 (marked with a blue background) were
down-regulated. Our analysis is consistent with such an overall
observation, however, it reveals finer details of the expression
behavior of those genes across the different states, which are more
complex than either a simple up-regulation or down-regulation.
For instance, the two transcription factors E2F2 and E2F1 are
found to peak at state 2 and 5, but are otherwise down-regulated.
Marker Genes. We also identified the state-specific marker
genes. In each state, genes were ranked by their fold change with
respect to state 1. In Fig. 6 we list the top 50 ranked genes in each
state and we show for comparison also their rank in the other
states. Ranking based on the state features is different from other,
more conventional criteria. For example, for the top genes of state
2 we also show their ranks assigned with respect to their maximum
fold change across temporal expression profiles, defined as the
ratio of the maximum to the minimum expressions across the time
profile. There are some genes having a low-medium rank with
respect to the maximum fold change, but with a very high rank
using our criterion. The behaviour of a few important marker
genes are illustrated in the Discussion section below.
Primary genes. We also looked at the response of important
set of genes identified in the original paper by Cicatiello et al. [4].
In particular we considered the set of 1270 genes responding to
estrogen in both MCF-7 and ZR-75.1 cell lines (named common
‘estrogen regulated genes’ (E2R)), and its subset of 218 primary
genes (i.e., the subset having a ERa transcription factor binding
site within 10 kb of the TSS). We show the fraction of responding
up-regulated and down-regulated genes across the single-cell states
in those two sets (Fig. 7A,C). The two groups of genes have very
similar trends: the number of genes either up-regulated or down-
regulated increases in successive states, as expected, and the
fractions of down-regulated genes are almost always larger than
those of up-regulated ones. In Fig. 7B,D, we show, for the two
sets, the fraction of genes that first-respond in each state. In our
notation, a gene is ‘responding’ if it is either up-regulated or down-
regulated whereas it is ‘first-responding’ in state j if it responds in
state j but it has not responded in any previous states. More than
60% of genes have responded first in states 1 and 2 in both sets.
The characteristics of a few specific primary genes are illustrated in
the Discussion section below.
State Functional SignaturesIn order to characterize the biological functional signatures of
the predicted single-cell states, we conducted a state-specific
enrichment analysis of GO terms [25] proceeding as discussed in
Methods. The biological processes significantly enriched in the
different states (Fig. 8) are found to be strikingly well linked to the
mitogenic effects of estrogens, whose cascade can be here dissected
across the specific states. This is illustrated in the Discussion
section below. These results confirm that the inferred cellular
states capture timing and nature of known cellular responses to
estrogen and provide a more detailed view of the dynamics of
these processes.
Discussion
Current high-throughput RNA profiling techniques, such as
microarray and RNA-seq, provide the tools to study cell
transitions on a genome-wide scale. However, they return data
averaged over heterogeneous populations, hiding the possibility to
characterize expression at the single-cell level. High-throughput
single-cell assays are being currently developed but are still in their
initial stages. Thus, we considered here a general quantitative
model [3] that allows reconstructing from population-averaged
time-course data, e.g., microarray data, a genome-wide charac-
terization of the dynamics of single cells. The model describes, via
Markov processes, the scenario where cells undergo stochastic
transitions across multiple states. By fitting time-course data, the
expression signatures of the states that cells visit during their
transitions and the rates that characterize such transitions are then
derived.
Here, we have employed such an analysis method to investigate,
in particular, the estrogen response of hormone-starved MCF-7
cells, a model of breast cancer widely used to characterize the
estrogen response in breast tumors [26–28]. We considered one of
the largest available microarray dataset [4] on hormone-respon-
sive genes identified in human breast cancer cells. Our findings are
fully consistent with previous results, and we reveal new insights on
the transcriptional dynamics at the single-cell level in the response
to estrogen. Although time-course epigenetic data and other time-
course data, when available, can be included in the model [3] and
important pieces of information, such as chromatin three-
dimensional folding and organization [9], could be taken into
consideration, we here have only considered microarray time-
course data. Furthermore, in the nucleus and cytoplasm of real
cells, a number of other effects and complications arise which are
likely to play important roles on the system behavior as found in
the study of other complex fluids (see, e.g., [29–33] and ref.s
therein).
Nevertheless, in the simplified framework considered here, we
have shown that the dynamic estrogen response of MCF-7 cells
can be described using six single-cell states across the 32 hours
after stimulation. The dynamics across those states is characterized
by a faster early response to the initial stimulus, occurring on a
scale of 2 hours, followed by a progressive deceleration of the
transitions (Fig. 3B,C): at 32 hours 40% of the population is still
not in the mitotic state, which is the last state in this description.
Cell States in the Estrogen Response of MCF7 Cells
PLOS ONE | www.plosone.org 9 February 2014 | Volume 9 | Issue 2 | e88485

Our analysis has derived the genome-wide transcriptional
profiles of the states (Fig. 3D), revealing the fine details of the
expression behavior across the different states. A focal case study
has been the group of the 11 primary transcription factor (PTF)
genes highlighted in Ref. [4]. For instance, we find that E2F2 and
E2F1 peak at state 2 and 5, but are otherwise down-regulated
(Fig. 3E). In estrogen-responsive BC cell lines, these proteins are
able to promote G1-S transition [24,34] and their overexpression
causes hormone-independent proliferation and antiestrogen-resis-
tance [35]. An other example is up-regulation of the retinoic acid
receptor subtype RARA in states 2–5 with respect to state 1
(Fig. 3E). This confirms its high expression in ER-positive BC
cells, where the protein encoded by this gene has been shown to
accumulate as consequence of ER-mediated trans-activation of the
RARA-1 gene promoter [36]. The overlapping between RARA
binding sites and those of ERa throughout the genome results in
crosstalk between this two molecules leading to the regulation of
cancer-associated genes [37].
We also identified the genes marking the inferred states (Fig. 6).In our top 50 ranked state-specific marker genes, we find many
genes known to play a key role in the estrogen response, the
hormone-responsive breast cancer phenotype and tumor response
to endocrine therapy. Among all, it is worth mentioning the FOS
and MYC genes, top rank members in state 2, that are known to
promote cell replication in response to extracellular signals,
including estrogen, driving quiescent cells into the cell cycle,
activating key cell cycle genes such as cyclins D1, D2, E and A,
CDK4, E2F1 and E2F2. The same is true for TFF1 and GREB1
in state 4. The TFF1/ps2 protein is a member of the trefoil protein
family, found to be expressed in human breast carcinomas and
involved in controlling expansion or contraction of the ductular
system through its mitogenic properties. The ATF/CREB family
plays a role in breast cancer and is considered to be an effective
therapeutic target gene. Some members of this gene family are
protective against breast cancer but others such as ATF4, ATF5,
and CREB, promote breast cancer pathology. In fact, CREB can
contribute to malignancy of breast epithelia inducing transcription
of aromatases that, in turn, lead to increased estrogen levels
establishing a vicious cycle in the tissue. As an example of positive
feedback regulation, estrogen causes CREB to bind and activate
the cyclin D1 promoter [38]. By activating cyclin D1, which causes
cells to progress through the cell cycle, activation of CREB
represents a central event in phase transitions. Furthermore,
dominant negative CREB has been shown to block the
transcription of the estrogen-responsive BCL-2 gene in MCF7
cells [39]. Since this protein blocks apoptosis, this suggests an
additional role for a mid-G1 event. The few examples considered
here suggest the utility of our model in identifying genes playing a
critical role in breast cancer development and progression and the
time of their action. Moreover, we find that the model identifies
state-specific genes that would have been ignored by considering a
standard criterion as maximum fold change. This is the case of
TFAP2C, whose overexpression highlights the key role in invasive
breast cancer correlating with a poorer response to anti-hormone
therapy and reduced patient survival [40].
Our functional enrichment analysis of state-specific GO terms
provides a full characterization of the inferred states (Fig. 8). Our
findings are not only consistent with the known picture of estrogen
acting as potent mitogen, but they provide, for the first time, new
insights on the cellular functional activities at the single-cell level.
In particular, the terms enriched in state 2 are involved in
angiogenesis, which could be associated with the in vivo phenom-
enon of the ‘‘angiogenesis switch’’ [41], an alteration in the
balance of naturally occurring endothelial growth factors and
inhibitors [42]. Following the switch to an angiogenic phenotype,
endothelial cells must then proteolytically degrade the extracellular
matrix that surrounds them, migrate and proliferate, form
capillary structures, and anastamose into a vascular network that
characterizes the transition of a tumor from a dormant state to a
malignant state [43]. A variety of activities related with RNA
processing becomes enriched in state 3 and persists in state 4,
including processing of non-coding RNAs. State 4 is also
characterized by lipid metabolic and biosynthetic processes.
DNA replication, repair and recombination mark state 5, which
coincides with the S phase, while in state 6 fully fledged mitosis
related terms are enriched. The emerging picture is that state 2, 3
and 4 correspond to three subphases of the G1 phase of the cell
cycle, whereas states 5 and 6 can be more directly associated
respectively to the S phase and mitosis. The functional roles
assigned to the different predicted states are fully consistent with
previous studies on the estrogen response of MCF-7 cells, and they
match well the known intervening phases of the cell cycle. For
example, we find that more than 40% of the entire population is in
interphase between 16 and 28 h, which is precisely the time that
MCF-7 cells need to enter the S phase [4,24,44]. Moreover, in
previous studies [4] it was noticed that genes involved in mitosis
show maximal response between 28 and 32 h.
Interestingly, the single-cell states identified here are consistent
with the ratchet-like model proposed for estrogen stimulation of
cell proliferation, which foresees a permissive effect of the
hormone on multiple, sequential cell cycle restriction points
[45]. Indeed, our method allowed identification of estrogen target
genes involved in each of these transitions, providing for the first
time a genetic explanation also for the dynamics of breast cancer
cell responses to antiestrogen drugs, such as those described for the
selective estrogen receptor down-regulator ICI 182,780/Faslodex,
a pure antihormone used for treatment of these tumors [28]. In
this respect, these results identify multiple genes whose mutation
might cause perturbation of one or more cell states resulting in
estrogen-independent cell cycle progression, one of the key events
believed to cause the resistance to antihormones observed in~30%breast cancer patients undergoing these therapies.
In conclusion, we have considered a stochastic model of the
events characterizing single-cell transitions during the estrogen
response of a breast cancer model, MCF-7 cells. Our methods
allow to identify the single-cell states intervening during the
processes, by using only population-averaged time-course data,
such as microarray or bulk RNA-Seq data. Interestingly, it
recapitulates the key known biology facts about the system and, for
the first time, sheds light on the single-cell events and on the states
transversed in the process. Our approach could be similarly
applied to other cell transitions and could easily accommodate
additional data types, such as epigenetic data.
Supporting Information
Text S1 Supplementary methods section presenting ingreater detail the model, parameter estimation and theBayesian framework employed for model selection.
(PDF)
Acknowledgments
We acknowledge the Italian Association for Cancer Research, the Italian
Ministry for Education, University and Research and the Italian
Foundation for Cancer Research for support. We would also like to thank
Andrea Piccolo for helpful discussions.
Cell States in the Estrogen Response of MCF7 Cells
PLOS ONE | www.plosone.org 10 February 2014 | Volume 9 | Issue 2 | e88485

Author Contributions
Conceived and designed the experiments: FPC MN AW. Performed the
experiments: FPC GG GN. Analyzed the data: FPC. Contributed
reagents/materials/analysis tools: JWA CJO DC AG SM. Wrote the
paper: FPC GG GN SM AW MN.
References
1. Zhu Y, Wang A, Liu M, Zwart A, Lee R, et al. (2006) Estrogen receptor alpha
positive breast tumors and breast cancer cell lines share similarities in theirtranscriptome data structures. Int J Oncol 29: 1581–1589.
2. Weisz A, Basile W, Scafoglio C, Altucci L, Bresciani F, et al. (2004) Molecularidentification of eralpha-positive breast cancer cells by the expression profile of
an intrinsic set of estrogen regulated genes. J Cell Physiol 200: 440–450.
3. Armond JW, Saha K, Rana AA, Oates CJ, Jaenisch R, et al. (2014) A stochasticmodel dissects cell states in biological transition processes. Scientific reports 4:
3692.
4. Cicatiello L, Mutarelli M, Grober OMV, Paris O, Ferraro L, et al. (2010)
Estrogen receptor alpha controls a gene network in luminal-like breast cancercells comprising multiple transcription factors and microRNAs. The American
journal of pathology 176: 2113–2130.
5. Elowitz MB, Levine AJ, Siggia ED, Swain PS (2002) Stochastic Gene Expressionin a Single Cell. Science (New York, NY).
6. Taniguchi Y, Choi PJ, Li GW, Chen H, Babu M, et al. (2010) Quantifying E.coli proteome and transcriptome with single-molecule sensitivity in single cells.
Science (New York, NY) 329: 533–538.
7. Bolstad BM, Irizarry RA, Astrand M, Speed TP (2003) A comparison ofnormalization methods for high density oligonucleotide array data based on
variance and bias. Bioinformatics (Oxford, England) 19: 185–193.
8. Nicodemi M, Prisco A (2009) Thermodynamic Pathways to Genome Spatial
Organization in the Cell Nucleus. Biophys Jour 96: 2168–2177.
9. Barbieri M, Chotalia M, Fraser J, Lavitas LM, Dostie J, et al. (2012) Complexity
of chromatin folding is captured by the strings and binders switch model. Proc
Natl Acad Sci U S A 109: 16173–8.
10. Barbieri M, Scialdone A, Gamba A, Pombo A, Nicodemi M (2013) Polymer
physics, scaling and heterogeneity in the spatial organisation of chromosomes inthe cel nucleus. Soft Matter 9: 8631.
11. Nicodemi M, Panning B, Prisco A (2008) A thermodynamic switch forchromosome colocalization. Genetics 179: 717–21.
12. Scialdone A, Cataudella I, Barbieri M, Prisco A, Nicodemi M (2011)
Conformation Regulation of the X Chromosome Inactivation Center: a Model.PLoS Comput Biol 7: e1002229.
13. Nicodemi M, Prisco A (2007) Symmetry-breaking model for X-chromosomeinactivation. Phys Rev Lett 98: 108104.
14. Wilkinson DJ (2009) Stochastic modelling for quantitative description of
heterogeneous biological systems. Nature reviews Genetics 10: 122–133.
15. Neal RM (2001) Annealed importance sampling. Statistics and Computing 11:
125–139.
16. Gamerman HFLD (2006) Markov Chain Monte Carlo: Stochastic Simulation
for Bayesian Inference:2nd (Second) edition. CRC Press.
17. Vyshemirsky V, Girolami MA (2008) Bayesian ranking of biochemical system
models. Bioinformatics (Oxford, England) 24: 833–839.
18. Friel Pettitt (2005) Marginal likelihood estimation via power posteriors. J RoyalStatistical Society: 1–13.
19. Gilks W, Richardson S, Spiegelhalter D, editors (1995) Markov Chain MonteCarlo in Practice. Chapman and Hall/CRC, 1 edition.
20. Huang DW, Sherman BT, Lempicki RA (2009) Bioinformatics enrichmenttools: paths toward the comprehensive functional analysis of large gene lists.
Nucleic acids research 37: 1–13.
21. Huang DW, Sherman BT, Lempicki RA (2009) Systematic and integrativeanalysis of large gene lists using DAVID bioinformatics resources. Nature
protocols 4: 44–57.
22. Wilkinson DJ (2006) Bayesian methods in bioinformatics and computational
systems biology. Briefings in Bioinformatics 8: 109–116.
23. Brewer BJ, Bedding TR, Kjeldsen H, Stello D (2007) Bayesian Inference from
Observations of Solarlike Oscillations. The Astrophysical Journal 654: 551–557.
24. Cicatiello L, Addeo R, Altucci L, Petrizzi VB, Boccia V, et al. (2000) Theantiestrogen ICI 182,780 inhibits proliferation of human breast cancer cells by
interfering with multiple, sequential estrogen-regu- lated processes required forcell cycle completion. Molecular and Cellular Endocrinology 165: 199–209.
25. Ashburner M, Ball CA, Blake JA, Botstein D, Butler H, et al. (2000) Gene
ontology: tool for the unification of biology. The Gene Ontology Consortium.Nature genetics 25: 25–29.
26. Bourdeau V, Deschenes J, Laperriere D, Aid M, White JH, et al. (2008)Mechanisms of primary and secondary estrogen target gene regulation in breast
cancer cells. Nucleic acids research 36: 76–93.
27. Madak-Erdogan Z, Kieser KJ, Kim SH, Komm B, Katzenellenbogen JA, et al.(2008) Nuclear and extranuclear pathway inputs in the regulation of global gene
expression by estrogen receptors. Molecular endocrinology (Baltimore, Md) 22:2116–2127.
28. Ochsner SA, Steffen DL, Hilsenbeck SG, Chen ES, Watkins C, et al. (2009)
GEMS (Gene Expression MetaSignatures), a Web resource for querying meta-analysis of expression microarray datasets: 17beta-estradiol in MCF-7 cells.
Cancer research 69: 23–26.29. Cataudella V, Franzese G, Nicodemi M, Scala A, Coniglio A, et al. (1994)
Critical clusters and efficient dynamics for frustrated spin models. Phys Rev Lett72: 1541–44.
30. Tarzia M, de Candia A, Fierro A, Nicodemi M, Coniglio A, et al. (2004) Glass
transition in granular media. Europhys Lett 66: 531–537.31. Coniglio A, Nicodemi M (2000) The jamming transition of granular media. Jour
Phys: Cond Matt 12: 6601–10.32. Caglioti E, Coniglio A, Herrmann HJ, Loreto V, Nicodemi M, et al. (1998)
Segregation of granular mixtures in presence of compaction. Europhys Lett 43:
591–97.33. Nicodemi M, Jensen H (2001) Creep of superconducting vortices in the limit of
vanishing temperature: A fingerprint of off-equilibrium dynamics. Phys Rev Lett86: 4378–81.
34. Altucci L, Addeo R, Cicatiello L, Dauvois S, Parker MG, et al. (1996) 17beta-
Estradiol induces cyclin D1 gene transcription, p36D1-p34cdk4 complexactivation and p105Rb phosphorylation during mitogenic stimulation of G(1)-
arrested human breast cancer cells. Oncogene 12: 2315–2324.35. Louie MC, Zou JX, Rabinovich A, Chen HW (2004) ACTR/AIB1 functions as
an E2F1 coactivator to promote breast cancer cell proliferation and antiestrogenresistance. Molecular and cellular biology 24: 5157–5171.
36. Elgort MG, Zou A, Marschke KB, Allegretto EA (1996) Estrogen and estrogen
receptor antagonists stimulate transcription from the human retinoic acidreceptor-alpha 1 promoter via a novel sequence. Molecular endocrinology
(Baltimore, Md) 10: 477–487.37. Hua S, Kittler R, White KP (2009) Genomic antagonism between retinoic acid
and estrogen signaling in breast cancer. Cell 137: 1259–1271.
38. Castro-Rivera E, Samudio I, Safe S (2001) Estrogen regulation of cyclin D1 geneexpression in ZR-75 breast cancer cells involves multiple enhancer elements.
The Journal of biological chemistry 276: 30853–30861.39. Dong L, Wang W, Wang F, Stoner M, Reed JC, et al. (1999) Mechanisms of
transcriptional activation of bcl-2 gene expression by 17beta-estradiol in breastcancer cells. The Journal of biological chemistry 274: 32099–32107.
40. Gee JMW, Eloranta JJ, Ibbitt JC, Robertson JFR, Ellis IO, et al. (2009)
Overexpression of TFAP2C in invasive breast cancer correlates with a poorerresponse to anti-hormone therapy and reduced patient survival. The Journal of
pathology 217: 32–41.41. Naumov GN, Akslen LA, Folkman J (2006) Role of Angiogenesis in Human
Tumor Dormancy. Cell cycle (Georgetown, Tex): 1779–1787.
42. Hanahan D, Folkman J (1996) Patterns and emerging mechanisms of theangiogenic switch during tumorigenesis. Cell 86: 353–364.
43. Indraccolo S, Favaro E, Amadori A (2006) Dormant tumors awaken by a short-term angiogenic burst: the spike hypothesis. Cell cycle (Georgetown, Tex) 5:
1751–1755.44. Cicatiello L, Scafoglio C, Altucci L, Cancemi M, Natoli G, et al. (2004) A
genomic view of estrogen actions in human breast cancer cells by expression
profiling of the hormone-responsive transcriptome. Journal of molecularendocrinology 32: 719–775.
45. Stack G, Gorski J (1985) Estrogen-stimulated deoxyribonucleic acid synthesis: aratchet model for the prereplicative period. Endocrinology 117: 2017–2023.
Cell States in the Estrogen Response of MCF7 Cells
PLOS ONE | www.plosone.org 11 February 2014 | Volume 9 | Issue 2 | e88485