dealing with the rise of renewables; investing in smart ... · ,283 ,39 ,319 ,68 ,99 biomass 1,313...
TRANSCRIPT

Dealing with the rise of Renewables Investing in smart renewables
Felice Egidi Head of Regulatory&Antitrust Affairs Paris, July 2nd 2014

2
Summary
• Global Investments ($bln)
• Global Installed Capacity (GW)
• Expected growth (GW)
• RES worldwide
• New challenges for the Utility sector • Technical Variation in Italy • Demand and Market Price • EU RES Policy • Renewable Peculiarities
• Market Model
• EU Balancing Markets & RES participation • Renewable Forecast example • Closing Remarks
• System flexibility
• Back up capacity

RES worldwide Global Installed Capacity (GW) 1/3
,238 ,246 ,265 ,276
,421 ,462 ,498 ,529
,169 ,172
,179 ,187 ,26
,26 ,27
,27 ,459 ,518
,566 ,613
1,313
1,424
1,535 1,633
0
200
400
600
800
1000
1200
1400
1600
1800
2010 2011 2012 2013
TOTAL
Asia
Africa
Latin America
Europe
North America
Breakdown by area Breakdown by technology
1,005 1,035 1,063 1,084
,197 ,239
,283 ,319 ,39 ,68
,99 ,134 1,313
1,424
1,535 1,633
0
200
400
600
800
1000
1200
1400
1600
1800
2010 2011 2012 2013
TOTAL
Geo
Biomass
CSP
PV
Wind
Hydro
Source: Enerdata, WEO 2013, EER, GWEC, EWEA, EPIA, NREAP, REN 21, BNEF, EGP estimate Note: 2013 preliminary figures
3

Breakdown by technology
,262
,318 ,286
,254
0
50
100
150
200
250
300
350
2010 2011 2012 2013
TOTAL
Smart Technologies Marine
Small Hydro
Geo
Biomass
Solar
Wind
+34%
+21%
-11% -10%
RES worldwide Global Investments ($bln) 2/3
Note: Clean Energy investments includes corporate and government R&D, investment in Smart Technologies (i.e. smart grid, storage, electric vehicles, efficiency and digital energy projects) and investment in all renewable technologies Source: Bloomberg New Energy Finance, “Global Trends in Clean Energy Investment”, Jan 2014
2012 investment in clean energy are estimated to be around 286 bn$, -11% vs. 2011, but it was the second highest ever (above 2010)
Decline was mainly due to uncertainties and regulatory changes as well as CAPEX decrease, in particular for Wind and PV
4
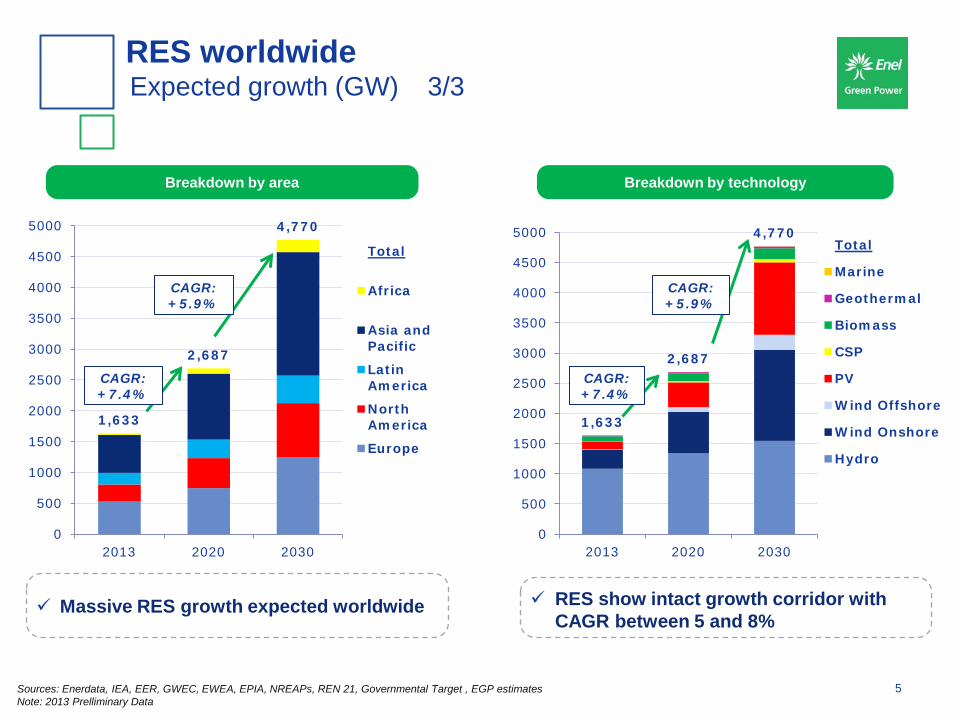
1,633
2,687
4,770
0
500
1000
1500
2000
2500
3000
3500
4000
4500
5000
2013 2020 2030
Total
Africa
Asia and Pacific
Latin America
North America
Europe
Breakdown by area
1,633
2,687
4,770
0
500
1000
1500
2000
2500
3000
3500
4000
4500
5000
2013 2020 2030
Total
Marine
Geothermal
Biomass
CSP
PV
Wind Offshore
Wind Onshore
Hydro
Sources: Enerdata, IEA, EER, GWEC, EWEA, EPIA, NREAPs, REN 21, Governmental Target , EGP estimates Note: 2013 Prelliminary Data
Breakdown by technology
CAGR: +5.9%
CAGR: +7.4%
CAGR: +5.9%
CAGR: +7.4%
RES show intact growth corridor with CAGR between 5 and 8%
Massive RES growth expected worldwide
RES worldwide Expected growth (GW) 3/3
5

New challenges for the Utility sector CAPEX demand per sector
CAPEX demand for the pan EU utility industry estimation (2013-2022)
Addressable market for traditional Utility business is shrinking due to the
expected lower demand and the growth of renewable business
About 42% of CAPEX demand are concentrated in the renewable business
* Citi Research. Note Data are illustrative for EU. 6

Significant variation during last 3 years in terms of net demand
Very important difference especially in non-working days during
peak hours with low demand level and high RES production
Technical Variation in Italy Demand and RES Production
Sources: Terna – Italian TSO -Average of hours during April -Net Demand= Demand – Solar and Wind Production (hourly base)
MWh MWh
2010 2011 2012 2010 2011 2012 h h
Net Demand (MW): Hourly Profile – April Working Days Net Demand (MW): Hourly Profile – April Non-Working Days
Progressive reduction of
Demand
Fast Ramp up due to increasing of demand and reduction of PV production
2012 – Min. PK level, less than OPK one
7

*Source: GSE / TERNA
Significant price variation in peak hours due to the reduction in demand and
the increase of renewable energy
Increasing price during the second period of off-peak due to the ramp of
thermal plants for the production in place of PV
Demand (MW): Hourly Profile – Working Day (2006 vs. 2013) Day Ahead Market Price (€/MWh): Hourly Profile (2006 vs. 2013)
8
2013 2006 2013 2006
Demand and Market Price Italian same working day in 2006 vs. 2013*

Renewable Peculiarities System flexibility 1/3
System
flexibility
System Management
• Incentives on the correct forecast (especially in a first phase of development of renewable energy) in order to ensure a more careful programming, as well as compatibility with TSO / DSO,
• Demand response measure to help balancing intermitting RES
• Aggregation of production at portfolio level
• Large and flexible balancing zones
• Adequate model for balancing responsibility duties for NP RES (e.g. higher threshold)
• Liquid ancillary services markets open to RES
System structure
• Flexible generation capacity to back up RES volatility (Capacity payments mechanism)
• Upgrade the grids in order to reduce possible congestions and transmission losses
• Develop interconnecting networks and storage to prevent the risk of short supply among Members States
• Demand side management through smart grids (Possible peak shaving)
9

Renewable Peculiarities Market model 2/3
Coupled markets
Liquid Real time markets (Intraday and Day Ahead Market close to delivery time – up to 1h)
Imbalances liability tailored to RES peculiarity
Special support for RES to reflect properly the benefits of RES comparing to other sources (in terms of climate and costs of fossil fuels production)
Liquid forward markets or long term bilateral contracts (stabilize the return of investments by hedging prices and volumes)
Demand side management (increase consumers’ responsibility)
Market
model
10

Renewable Peculiarities Back up capacity 3/3
Before the market and the system is adjusted, in order to integrate a high share of intermittent RES generation, there is the need to have a transparent capacity market
The level of required back up capacity depends on the level of the market and the system development stage
Illustrative representation of elements that influence the level of back-up capacity
11

EU Balancing Markets & RES participation Examples
SPAIN • RES are not allowed to participate
(biomass can submit for prequalification)
• RES>10 MW must be connected to CECRE(1) and can receive dispatching orders
• RES pay for imbalances
GERMANY • RES are allowed to participate to
balancing market but must be prequalified
FRANCE • RES under FIT don’t pay for
imbalances • RES are not allowed to participate
to balancing market (exceptions in some cases for run of river)
ITALY • RES are NOT allowed to participate
(DCO of AEEG proposed a future integration)
• RES don’t pay for imbalances (ongoing changes)
• Wind and PV can receive dispatching orders for security reasons
UK • RES are allowed to participate to
some services of balancing market but they must be prequalified
• Curtailments are remunerated at bidding prices
RES participation to the balancing
market
12

Renewable Forecast example Two Considerations (1/2)
Evolution of average forecast errors for Wind and PV
How the error changes from day-ahead (i.e. 24h ahead in the charts) to delivery
As delivery time approaches, the forecasting error decreases as follows:
• 6 hours ahead, error falls by 15% for wind and 6% for solar
• Hour ahead, error is roughly one third of 24-h ahead (in % terms)
Source: Pöyry, Future scenarios of the Italian electricity market: 2020 and beyond, 20 April 2012 13

Renewable Forecast example Two Considerations (2/2)
Mean absolute error as % capacity for single site and aggregated output of 4 sites
The amount of prediction errors for wind power in a geographical region
diminish as the region size increases, especially for shorter forecast horizons
Source: Tradewind, Integrating Wind Developing Europe’s power market for the large-scale integration of wind power, 2009 14

• RES plays an important role in the climate and energy security policy of EU
• The current regulatory framework, system status and market structure are not
enough to properly accommodate RES, and fundamental changes are required
• Flexible and stable regulations, as well as coherent national strategies and plans
are required to attract the necessary investments
• Finalization of internal energy markets as a crucial role
• Grid investments to secure energy supply
• Capacity markets could be necessary until the market will be adequately
designed to allow the full integration of RES
• Level playing field for RES requires a proper market design and regulations as
well as a transparent accounting of fossil fuels related costs
Closing Remarks

BACK UP

RES response to the “Energy Trilemma”
Primary energy independency
Renewable Energies
Primary energy dependency *
Conventional Energies
RES have better risk profile than traditional technologies
17 * Today, EU imports 53% of the total energy consumed

RES in a volatile world… Graphical Oil Path - 1964 – 2010
Barclays Capital Projections: 1) Demand 2009 84,6 mb/d 2) Average WTI 2009 62 $/b 3) Demand 2010 85,6 mb/d 4) Average WTI 2010 85 $/b
1964 1969
1973
1975 1978
1980
1980 HIGH
1981
1983
1985
1986
1990
1996 2000
2004
2007
OIL ROLLER COASTER RIDE
This chart tracks the relationship between oil prices and oil consumption since 1964. Global oil consumption is shown on the horizontal axis and oil prices shown on the vertical axis. So when consumption is increasing and prices are flat, the line moves straight right. And when prices are rising and demand stops growing the line moves straight up.
30 40 50 60 70 80
$100
$90
$80
$70
$60
$50
$40
$30
$20
$10
World oil consumption Million barrels a day
Pric
e of
oil*
*Average annual price of West Texas Intermediate crude oil, adjusted for inflation using the Consumer Price Index. Posted prices (not spot prices) are shown before 1983. Source: Energy Information Administration, Federal Reserve, Bureau of Labor Statistics, Rocky Mountain Institute
90
1990 Iraq invades Kuwait
End 2000 Record demand spurs a run up in prices
1982 Recessions dampen demand
1979 -1980 Iranian revolution, Iran – Iraq war
1973 The Arab oil embargo causes prices to soar
1997-1998 Asian financial crisis
Late 1960s, early 1970s Oil prices are steady and consumption grows quickly
What’s going on here? In the early 1980s, oil consumption fell. This is why the chart seems to turn around
2008
2009
2001 Sept.11 attacks
2010
High volatility...low predictability…
18
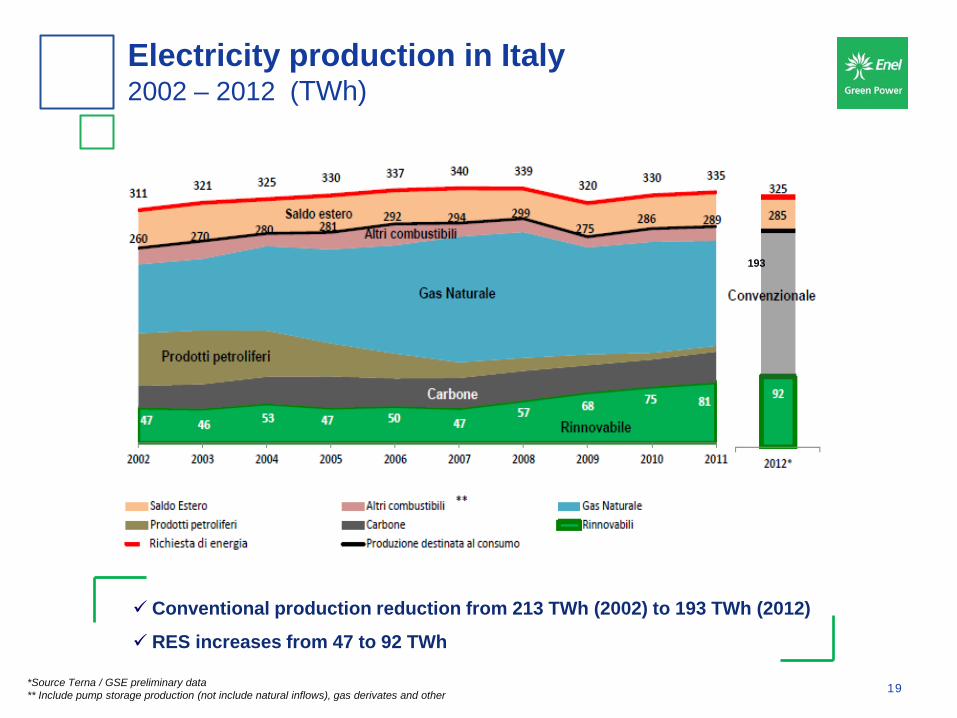
Conventional production reduction from 213 TWh (2002) to 193 TWh (2012)
RES increases from 47 to 92 TWh
*Source Terna / GSE preliminary data ** Include pump storage production (not include natural inflows), gas derivates and other
Electricity production in Italy 2002 – 2012 (TWh)
193
19

Italian Framework RES Balancing
Interconnection
• Day ahead Reduction NTC • NTC reduction in Real Time • Cooperation between TSO operators
(Downward MEAS)
• Reduction of WIND Production • Reduction of PV production
with a scheduling (RIGEDI Procedure)
• Reduction of PV production in RT (GD Tel Procedure)
RES Reduction
Ancillary Service Market
• Pumping Activation • Reduction of Not Abilitated
Unit Production • Margin Reserve acquisition
TSO Actions
Source: TERNA
20
Investments and proper regulation are required to avoid RES cuts in times of congestions

• Full guaranteed intake • Predefined remuneration
• RES integration into the newly designed market:
• Intraday markets • Smart grids • Competitive support instruments
adjusted to the technology maturity level
• Remuneration linked to market prices and costs evolution
• Gradual integration into the balancing market
• Mechanisms to control over capacity and support costs
Inception Before 2010
Take off 2010 - 2014
Consolidation From 2015
No balancing responsibility
Balancing responsibility
A low level of penetration didn’t create any impact to the system
When level of penetration increased, RES started to be gradually integrated into the market, according to each country peculiarity
A high level of RES penetration requires an adequate and more convergent market design at EU level
EU RES Policy Evolution
21
History RES regime evolve according to level of penetration, country peculiarity and EU objectives

Renewable Peculiarities Integration requirements and Market Model
RES among many other, are defined by the following peculiarities:
Level playing field for RES integration
• ZERO CO2 emissions • ZERO marginal cost • Unlimited resource (especially Wind & PV)
• High resource availability dependence
• CAPEX intensive
RES peculiarities
Requirements: • System flexibility • NEW Market Model
Barriers: • EU Market fragmentation • Unstable and incoherent
regulatory framework • Outdated market models
and infrastructure • Lack of financing
Objective
RES plays an important role in the climate and energy security policy of EU, and
therefore an adequate, predictable and stable regulatory framework is required 22

Over generation linked to Demand reduction and RES production is characterized by:
• Fast increasing of demand level during off peak hours
• Very cheap number of power plant with Flexible generation
Demand (MW): Hourly Profile – Working Day (2006 vs. 2013) Italian Grid Network
Flexible Generation
Italian Renewable Balancing Highly critical in periods with low demand and high RES production level
Source: TERNA 23

Spanish TSO (REE) has set up an specific centre to monitor and
control renewable energy (CECRE)
CECRE centralizes all dispatch instruction to wind farms, keeping
the system in a stable and safety state while maximizing renewable
energy output
In This Centre, wind farm above 10 MW are fully monitored.
Real time metering of renewable sources
Renewable monitoring example Spanish Control Centre – CECRE
24

Source: Citi Research, Bloomberg New Energy Finance
Renewable Technologies Competitiveness Solar PV Technologies: cost reduction trend
Solar PV systems cost reduction ($/W) from 1972 Solar PV systems cost reduction ($/W)
• Solar module price declines from 1972 show an overall learning rate of 22%
• Post 2008 boom showing a faster learning rate of 40
25

Source: Citi Research, October 2013; Bloomberg New Energy Finance.
Forecast for future cumulative wind installed base (GW)
Historical Wind turbine dimensions (1980-2010) Forecast for future average turbine price ($/W)
Historical average turbine costs against cumulative installed capacity (1984-2011)
Renewable Technologies Competitiveness Wind Technologies: cost reduction trend
26