deakin laboratory for the meta- analysis of … › __data › assets › pdf_file › 0007 ›...
TRANSCRIPT

What Meta-Analyses Reveal about the Replicability of Psychological Research
TD Stanley14 Evan C Carter2 and Hristos Doucouliagos3
Deakin Laboratory for the Meta-Analysis of Research Working Paper November 2017
Abstract
Can recent failures to replicate psychological research be explained by typical magnitudes of statistical power bias or heterogeneity A large survey of 12065 estimated effect sizes from 200 meta-analyses and nearly 8000 papers is used to assess these key dimensions of replicability First our survey finds that psychological research is on average afflicted with low statistical power The median of median power across these 200 areas of research is about 36 and only about 8 of studies have adequate power (using Cohenrsquos 80 convention) Second the median proportion of the observed variation among reported effect sizes attributed to heterogeneity is 74 (I2) Heterogeneity of this magnitude makes it unlikely that the typical psychological study can be closely replicated when replication is defined as study-level null hypothesis significance testing Third the good news is that we find only a small amount of average residual reporting bias allaying some of the often expressed concerns about the reach of publication bias and questionable research practices Nonetheless the low power and high heterogeneity that our survey finds fully explain recent difficulties to replicate highly-regarded psychological studies and reveal challenges for scientific progress in psychology
Key words power bias heterogeneity meta-analysis replicability psychological research
1Hendrix College Conway AR 72032 2Department of Neuroscience University of Minnesota Minneapolis MN 55455 3Department of Economics and Alfred Deakin Institute for Citizenship and Globalisation Deakin
University Burwood VIC 3125 Australia
Correspondence to TD Stanley (stanleyhendrixedu)
POWER BIAS AND HETEROGENEITY
2
Is psychology in crisis Recently there have been highly publicized failures to replicate seemingly
well-established psychological phenomenamdashthat is studies designed to be identical do not
produce statistically significant results in the same direction as the original work (eg Open
Science Collaboration 2015)1 These failed replications are especially problematic because many
regard replication as the ldquohallmark of sciencerdquo (Popper 1959) The most pessimistic interpretation
of these findings is that such high rates of failed replication invalidate psychological science
Understandably then these findings have received a large amount of attention and many authors
have offered explanations for this difficulty in replicating research in psychology (eg Open
Science Collaboration 2015 Fabrigar amp Wegener 2016 Patil Peng amp Leek 2016 Schmidt amp
Oh 2016) Despite the various opinions on the topic the frequent practice of defining replication
success in terms of null hypothesis significance testing means that three key dimensionsmdash
statistical power selective reporting bias2 and between-study heterogeneitymdashare likely to play
key roles Here we survey these three aspects of psychological research across nearly 12000
studies from 200 areas (or subjects) of empirical research to help understand what is reasonable to
expect from replication in psychology and what might be done to improve psychological science
We calculate statistical power retrospectively using meta-analytic estimates of the lsquotruersquo
effectmdasha term we use as shorthand to refer to the mean of the distribution of true effects
Specifically we examine 200 previously published meta-analytic data sets and calculate two
simple weighted averages of reported effect sizes plus one lsquobias-correctedrsquo estimate to serve as
proxies for the relevant mean of the distribution of lsquotruersquo effects We find that (1) only about one
1See the websites httpcuratescienceorg and httppsychfiledrawerorg for growing lists of replications in psychology 2 We define ldquoselective reporting biasrdquo to be as broad as possible and to encompass more specific terms like publication bias the file drawer problem and what is also called selection bias selective reporting bias p-hacking and questionable research practices See lsquoSelective reporting biasrsquo section below
POWER BIAS AND HETEROGENEITY
3
in eight studies is adequately powered (not surprising given previous work on power in
psychology Cohen 1962 Cohen 1977 Sedlmeier amp Gigerenzer 1989 Rossi 1990 Maxwell
2004 Pashler amp Wagenmakers 2012 Fraley amp Vazire 2014 Tressoldi amp Giofreacute 2015) (2) there
is typically only a small amount of selective reporting bias and (3) the variance among reported
effects due to heterogeneity is nearly three times larger than the reported sampling variance Such
substantial heterogeneity implies that attempted replication studies will frequently and correctly
produce a markedly different finding from the original study Combine this issue with chronically
low statistical power and some degree of selective reporting bias and failures to replicate in
psychology are inevitable
Our findings add further weight to the call for researchers in psychology to take statistical
power seriously (Rossi 1990 Maxwell 2004 Pashler amp Wagenmakers 2012 Fraley amp Vazire
2014 Tressoldi amp Giofreacute 2015) and to think carefully about the implications of heterogeneity for
the planning and interpretations of replications (Klein et al 2014 McShane amp Boumlckenholt 2016)
Our results highlight that meaningful replication in psychological research will likely only be
achieved through carefully planned multi-site pre-registered efforts
Reproducibility replicability and generalizability
Obviously the findings of a specific study can be verified with different levels of rigor and
generalizability We follow others in distinguishing among three related concepts concerning the
generalizability and trustworthiness of research findings (Asendorpf et al 2012 LeBel et al
2017) A study may be considered lsquoreproduciblersquo if other researchers are able to produce the exact
same results using the same data and statistical analyses Reproducibility is the reason that many
researchers make their data and codes freely available to others Reproducibility is narrower than
POWER BIAS AND HETEROGENEITY
4
replicability but it helps to identify and remove some errors from our scientific knowledge
Reproducibility is critical if results from experimental science are to be believed
Replicability means that a previous finding will be obtained in a new random sample
ldquodrawn from a multidimensional space that captures the most important facets of the research
designrdquo (Asendorpf et al 2012 p 5) A successful replication occurs when the differences in
results are insubstantial Critically replicability requires that the replication study does in fact
capture the important facets of the original studyrsquos design A replication is typically defined as an
exact replication if it is thought to capture all of these critical facets and as a conceptual replication
if these components are only similar but not quite lsquoexactrsquo For example if the latent construct being
measured by the dependent variable in both the original and the replication study is the same but
its operationalization is notably different the subsequent study would be considered a conceptual
replication Historically researchers in psychology have tended to publish more conceptual
replications than exact replications For example Makel et al (2012) found that 819 of all
replications are conceptual replications from of a random sample of 342 replications published
between 1946 and 2012
Generalizability requires further that subsequent findings are independent of unmeasured
factors (eg age gender culture) in the original study For example we would not label a finding
as generalizable if it is only replicable in studies conducted in English with samples of US college
students If our goal is to gain an understanding of human psychology in general then any result
that only exists under a very narrow set of conditions is likely to be of little practical importance
Generalizability is critical to the discussion of replicability because contextual sensitivity
(ie results are influenced by ldquohidden moderatorsrdquo) can make a replication falsely appear
unsuccessful (Van Bavel et al 2016) If a replication produces a different finding from the original
POWER BIAS AND HETEROGENEITY
5
study because the effect is contextually sensitive it need not be a ldquofailurerdquo but instead the effect
may not generalizable to the replication studyrsquos context For example if a replication study is
conducted online rather than in the laboratory as the original study was this operational choice
might produce a substantially different result However effects that can only be reproduced in the
laboratory or under only very specific and contextual sensitive conditions may ultimately be of
little genuine scientific interest
Statistically one expects that the variation between an original finding and an exact
replication will only be due to unsystematic sampling error In contrast if the context of an original
finding is not fully captured by the replication attempt or if the replication attempt is a conceptual
replication then variation between the original finding and the replication might be due to both
between-study heterogeneity and random sampling error error Below we argue that large
between-study heterogeneity is one of the main sources for the observed difficulty in replicating
psychological studies
The foregoing discussion of replicability does not provide a specific definition of
replication success although many have been proposed For example the Open Science
Collaboration (2015) compared the results of their 100 replication studies directly to the results of
the original studies using three quantitative definitions of success3 A success was claimed when
(1) the replication results matched the original results in both effect direction and statistical
significance (using the conventional α=005) (2) the effect size estimate provided by the original
study was within the 95 confidence interval of the estimate from the replication study or (3) a
meta-analytic estimate based on both the original and replication results was distinguishable from
3 The Open Science Collaboration (2015) also examined the size of the replication effects relative to the original findings and the replicating research teamrsquos subjective assessment of replication success
POWER BIAS AND HETEROGENEITY
6
zero Other researchers have suggested further ways of assessing replications (eg Braver
Thoemmes amp Rosenthal 2014 Patil Peng amp Leek 2016)
Although our analysis does not depend on any specific definition of successful replication
following the Open Science Collaboration (2015) we believe that replication success must
somehow involve the sign and significance of the reported effect size We prefer to view
replication as related to the sign and practical significance of the reported effect size rather than
its statistical significance Below we will discuss successful replication from both perspectives
However from the reactions to the Open Science Collaboration (2015) replication success is most
often viewed as the duplication the original effectrsquos direction and statistical significance This
view of lsquoreplication successrsquo is found in the popular press (Patil amp Leek 2015) in Science
(Bohannon 2015) and Nature (Baker 2015) and many subsequent scientific articles (eg Dreber
et al 2015 Lindsay 2015 van Bavel Mende-Siedlecki Brady amp Reinero 2016)
For any definition of replication success that involves both direction and significance
(whether practical or statistical) there are three governing factors for a successful replication
statistical power bias and between-study heterogeneity In the following sections we describe
how each of these relates to the replicability of a finding We then analyse a set of 200 previously
published meta-analyses to provide estimates of statistical power bias and heterogeneity and
discuss what these estimates imply for what one should expect when conducting replication in
psychology
POWER BIAS AND HETEROGENEITY
7
Statistical Power
Statistical power is the probability of finding statistically significant result if the effect in
question is truly non-zero (ie a lsquocorrect rejectionrsquo of the null hypothesis) A study is adequately
powered if it has a high probability of finding an effect when one exists and since Cohen (1965)
adequate power has been widely accepted to be 804 Psychological professional organizations
and journals have formally recognized the importance of statistical power For example the APA
Manual states ldquoWhen applying inferential statistics take seriously the statistical power
considerations associated with your tests of hypotheses [Y]ou should routinely provide
evidence that your study has sufficient power to detect effects of substantive interest (eg see
Cohen 1988)rdquo (APA 2010 p30) According to the Psychonomic Society ldquoStudies with low
statistical power produce inherently ambiguous results because they often fail to replicate Thus it
is highly desirable to have ample statistical powerrdquo (Psychonomic Society 2012 p1 emphasis
added) Moreover the past fifty years have seen many surveys and calls for greater use of
prospective power calculations in psychologymdashthat is planning research so as to ensure adequate
power to detect the effect of interest (eg Cohen 1962 Cohen 1977 Sedlmeier amp Gigerenzer
1989 Rossi 1990 Maxwell 2004 Pashler amp Wagenmakers 2012 Fraley amp Vazire 2014
Tressoldi amp Giofreacute 2015) In spite of such statements and frequent admonitions to increase power
prospective power calculations remain quite rare (Tressoldi amp Giofreacute 2015)
When successful replication is seen as being statistical significant in the same direction
low power will frequently cause replication failures First if a replication attempt itself has low
4 At this conventional 80 level the likelihood of a Type II error (or a lsquofalse negativersquo) is four times the conventional 05 probability of a Type I error (or a lsquofalse positiversquo) To some a 20 Type II error is still too high (Schmidt amp Hunter 2015) For a given application statisticians have long realized that researchers should adjust their tests and thereby the Type I and Type II errors to account for the relative costs of these two errorsmdashsee for example Ioannidis et al (2013) However the information needed to do so properly is usually beyond the researchersrsquo knowledge
POWER BIAS AND HETEROGENEITY
8
power then by definition it will not be likely to succeed because it has a low probability of reaching
statistical significance Second original studies with insufficient power will tend to be
overestimated to obtain statistical significance (Open Science Collaboration 2015) As a result
planned replications that use prospective power calculations (based on inflated effect size
estimates) are likely to underestimate the required sample size and thereby be insufficiently
powered That is low power begets low power Third if the original study has low power the
post-study odds of a statistically significant finding reflecting a true effect can be quite low
(Ioannidis 2005b) That is a basic consideration of Bayes formula proves that if the original study
had low power then a statistically significant finding will not make it likely that there is a genuine
nonzero effect (Ioannidis 2005b) In this case a replication should ldquofailrdquo because the true effect
is zero or nearly so
Statistical power is determined by sample size desired significance level α and the
magnitude of the lsquotruersquo effect investigated The first two quantities are widely known whereas the
magnitude of the lsquotruersquo effect must be estimated This raises the obvious question How can
researchers know the effect size when research is conducted for the very purpose of estimating this
effect size One option is to calculate post hoc power using the reported effect size(s)mdashthat is
using the result of a studyrsquos test of an effect to calculate the power of that test Critically post hoc
calculations are circular and tell us little beyond these studiesrsquo reported p-values (Hoenig amp
Heisey 2001 Yuan amp Maxwell 2005 Fraley amp Vazire 2014) This post hoc circularity is
especially pernicious if statistically significant estimates are preferentially reported (ie lsquoselective
reporting biasrsquo discussed below) ldquoSmall-N studies that actually produce significant results tend
to report larger effect sizes than comparable large-N studies thereby biasing their observed (post
hoc) power estimates upwardsrdquo (Fraley amp Vazire 2014 p 6 parentheses added)
POWER BIAS AND HETEROGENEITY
9
A better option is to calculate hypothetical power on the basis of arbitrarily-defined but
widely used small medium or large effect sizes Such hypothetical power has been the preferred
approach employed in several previous surveys of psychology which have shown that the typical
power to detect a medium effect in psychological research is inadequate see Maxwell (2004 p
148) and his citations to past power surveys For example two classic power surveys found that
the average power to detect a correlation of 02 to be quite low 14 (Cohen 1962) or 17
(Sedlmeier amp Gigerenzer 1989) but a more recent and slightly encouraging survey of social
psychology and personality journals finds that this power to detect a correlation of 02 has at least
doubled though it remains inadequate and typically less than 50 (Fraley amp Vazire 2014)
A third and we think more useful option is to calculate power retrospectively using an
estimate of the effect calculated from a meta-analysis This has been done previously for at least
two different fields Button et al (2013) reviewed 730 studies from 49 meta-analyses in
neuroscience and found that the average retrospective power was 21 and Ioannidis Stanley amp
Doucouliagos (2017) found that typically only 105 of economic studies have adequate power
Our survey calculates exactly this kind of retrospective power because doing so has the advantage
of using a meta-analysis and thus the entire relevant research record to assess power The potential
vicious circle of calculating power is further broken when the chosen meta-analysis methods are
resilient to selective reporting bias which is the topic to which we now turn
Selective reporting bias
The second research dimension that we survey is bias Here we use the term lsquoselective
reporting biasrsquo to refer collectively to situations in which the significance and magnitude of a
studyrsquos results have been exaggerated by choices in data collection analysis or reporting Thus
POWER BIAS AND HETEROGENEITY
10
our use of lsquoselective reporting biasrsquo encompasses more specific terms such as the file drawer
problem publication bias reporting bias p-hacking and questionable research practices (Scargle
2000 Simmons Nelson amp Simonsohn 2011 John Lowenstein amp Prelec 2012 Stanley and
Doucouliagos 2012 Stanley and Doucouliagos 2014 Simonsohn Nelson amp Simmons 2014
Wicherts et al 2016) Here we are only concerned about the aggregate effects that these various
research practices might have on the research record rather than the details of their specific
pathways Regardless of whether statistically insignificant findings are suppressed (traditionally
called lsquopublication biasrsquo or the lsquofile drawer problemrsquo) only some selected outcome measures or
comparisons are reported or whether any of a number of other questionable research practices are
employed the net effects on the research record are largely the samemdashan exaggeration of the size
and significance of reported effects
These biases are distinct from outright scientific fraud in that it is almost certainly
motivated by researchersrsquo desires to ldquogo where the data leadrdquo or by reviewersrsquo and editorsrsquo
motivations to use limited journal space for findings that move the field forward However even
well-meaning motivations can undermine the validity of research findings potentially producing
convincing evidence of a psychological effect that does not exists Selective reporting biases can
cause problems for replicability because replications may be doomed from the start if the original
reported finding is spurious or grossly inflated For this reason understanding the degree of bias
in psychology is important when assessing the credibility of research or when planning
replications
Selective reporting bias or publication bias as it is usually called is said to occur if the
dissemination of findings depends on the specifics of those findings For example findings with
statistically significant p-values or theory-consistent findings are more likely to be published
POWER BIAS AND HETEROGENEITY
11
reported and promoted than other findings As a result any review of a literature (including meta-
analysis) will tend to overestimate the evidence for an effect because such positive findings will
be overrepresented in the observed sample of reported findings
It seems quite clear that selective reporting or publication bias exists in psychology though
it is difficult to estimate its true prevalence For example several reviews have found that the
number of statistically significant results reported in psychology is larger than what should be
expected given the level of statistical power (eg Sterling 1959 Sterling Rosenbaum amp
Weinkam 1995 Fanelli 2010) In particular Bakker van Dijk amp Wicherts (2012) reviewed 13
meta-analyses in psychology and identify evidence consistent with publication bias in seven
Kuumlhberger Fritz amp Scherndl (2014) investigate a random sample of 500 studies published in 2007
and found several statistical indicators of publication bias including a persistent correlation
between sample size and effect size Quite recently Fanelli Costas and Ioannidis (2017)
corroborate the prevalence of a correlation between sample size and effect size among 430 meta-
analyses from psychology and psychiatry
An inverse correlation between the magnitude of the effect size and sample size would be
expected when there is selective reporting for statistical significance If there is a tendency for
some researchers to selectively report statistically significant findings then greater efforts will be
required by those researchers who have only small samples to work with Because small samples
produce larger standard errors correspondingly larger effects must be found to overcome these
large standard errors and obtain statistical significance With the benefit of larger samples it is
likely that the first small effect found will automatically be statistically significant When they are
not researchers who wish to report statistically significant findings will require much less
manipulation because even small effects (or biases) will be statistical significant when there are
POWER BIAS AND HETEROGENEITY
12
large samples Thus this often-observed inverse correlation between sample size and reported
effect size is an implication and therefore a confirmation of the tendency by some researchers to
selectively report statistical significant findings5
And yet still more direct evidence of publication bias has been found in psychology When
data on the intended research protocol is available Franco Malhotra amp Simonovits (2015) find
that published effects have a median p-value of 02 compared to the median unreported p-value
of 035 suggesting that statistically significant findings are selectively reported
Recently much attention has been given to selective reporting through the use of
undisclosed flexible approaches to data collection and analysis often called p-hacking or
questionable research practices (Simmons Nelson amp Simonsohn 2011 John Lowenstein amp
Prelec 2012 Wicherts et al 2016) Examples of these behaviors include analyzing data as it is
collected and stopping data collection once a desired result has been achieved deciding whether
to exclude outliers investigating experimental conditions or moderators on the basis of the results
and reporting onersquos exploratory findings as if they were the result of confirmatory research (see
5 In contrast some have suggested that small-sample studies are somehow better more able to find big effects But is it plausible to believe that small-sample psychological studies are typically conducted with more care or at a higher level of quality than large-sample studies We think not First we know that small-sample studies are less able to distinguish effects from background by the very definition of statistical power Second it is unlikely that researchers with small samples have first conducted prospective power calculations Past surveys have found that very few studies (3-5) choose their sample sizes on the basis of power calculations (Tressoldi and Giofreacute 2015) Yet such prospective power calculations with an associated 80 power level are required by the APA manual and have been accepted as critical in the field for decades Third even if these small-sample researchers believe that there are large effects to be found in their area of research they know that whatever they find (large or small) will be unreliable and ldquobuzzing with confusionrdquo (Maxwell 2004 p161) Thus by widely known standards of psychological research those who use small samples know that they are conducting low-quality less-rigorous research Fourth in contrast large labs and research programs tend to conduct larger studies ceteris paribus and they also have more resources to better design their instruments and more carefully execute their protocols Consider for example large replications efforts such as the Open Science Collaboration (2015) and (Hagger et al 2016) where the care and execution of experiments are demonstrably of higher quality and their sample sizes are larger However nothing in this paper assumes that larger studies are in any way better than smaller studies other than their demonstrably higher power Nor does our concern that small-sample studies tend to exhibit larger bias depend on small-sample studies being somehow of a lower quality (aside from statistical power) Nonetheless if some researchers have a preference for statistically significant results this alone will cause the inverse correlation between sample size and reported effect size that has often been observed
POWER BIAS AND HETEROGENEITY
13
Wicherts et al 2016 for a comprehensive list) Like publication bias it is extremely difficult to
determine the prevalence of such behaviors but several findings are of note For example John
Loewenstein amp Prelec (2012) surveyed 2000 researchers in psychology using a questionnaire-
based approach designed to correct for social desirability and found that the use of questionable
research practices may represent the norm (but see Fiedler amp Schwarz 2016) Additionally LeBel
et al (2013) created an online database PsychDisclosureorg which allows authors to disclose
whether their published articles include all the methodological details that went into the work
They found that of the authors who participated 112 had not fully reported all excluded
observations 118 had not reported all experimental conditions 453 had not reported all
measures that had been collected and 888 had not reported their data collection strategy Franco
Malhotra amp Simonovits (2015) compared recorded research intentions to the associated published
results and found that about 70 of studies did not disclose every outcome measured and 40 did
not disclose every experimental condition tested Moreover there is evidence indicating that
researchers rely on intuitions about data collection and that low statistical power can further lead
to practices which inflate their findings through bias (Erica et al 2014 Bakker et al 2016) For
the purposes of our survey the source or exact methods of selective reporting for statistical
significance is immaterial We merely wish to document any evidence of an overall tendency to
exaggerate psychological effects should it exist
Heterogeneity
The third governing factor for a successful replication is low heterogeneity As mentioned
above heterogeneity refers to variance in the reported findings that results from there being no
single lsquotruersquo effect size Rather there is a distribution of lsquotruersquo effects To compare heterogeneity
POWER BIAS AND HETEROGENEITY
14
from one area (or subject) of research to another and from one measure of empirical effect size to
another systematic reviewers often compute I2 (Higgins and Thompson 2002 pp1546-7) I2 is
the proportion (or percentage) of observed variation among reported effect sizes that cannot be
explained by the calculated standard errors associated with these reported effect sizes It is a
relative measure of the variance among reported effects that is due to differences between for
example studiesrsquo experimental methods measures population cohorts and statistical methods
relative to the total variance found among the reported effects
For most researchers I2 provides an easy to understand descriptive summary much like
R2 in regression analysis However because I2 is a relative measure of heterogeneity its magnitude
can be misleading If I2 is high (for example 09 or 90) but all studies have large samples and
high power heterogeneity in terms of effect sizes might still be low with little practical
consequence However even a small I2 can have considerable practical consequence for topics of
psychological research that are dominated by small samples and low power which has often been
found to be typical in psychology (eg Cohen 1962 Cohen 1977 Sedlmeier amp Gigerenzer 1989
Rossi 1990 Maxwell 2004 Pashler amp Wagenmakers 2012 Button et al 2013 Fraley amp Vazire
2014) Because we collect information on the random sampling variance on all of these 12065
estimated effect sizes we can also calculate heterogeneity in terms of standardized mean
differences or correlations to assess the practical consequences of the heterogeneity that our survey
finds
Importantly considerable heterogeneity has been found even in carefully conducted exact
replications in psychologymdashthose designed to minimize differences between the original study
design and the replication For example two massive efforts using pre-registered protocols in
which different teams of researchers ran the same study as closely as possible uncovered
POWER BIAS AND HETEROGENEITY
15
statistically significant amounts of heterogeneitymdashI2 = 36 (Hagger et al 2016) and 45
(Eerland et al (2016) Furthermore Klein et al (2015) reported a large-scale effort to replicate 15
findings across 36 different sites that intentionally differed in a variety of characteristics (eg
studies completed online or in the laboratory samples from the United States or elsewhere) Not
surprisingly they found significant amounts of heterogeneity in eight of the 16 effects that were
replicated (I2 = 23 to 91) however a comparison of the intra-class correlation among effects
to the intra-class correlation among sites found that very little of this heterogeneity in effect sizes
was accounted for by differences in the sites suggesting that heterogeneity was genuinely a
characteristic of the phenomena being studied Of course heterogeneity would be expected to be
higher when replications are lsquoconceptualrsquo (ie those making little attempt to duplicate all of the
relevant design characteristics of the original study) or when lsquohidden moderatorsrsquo influence
research outcomes
In the face of large heterogeneity replicability will be severely compromised For example
suppose that the true mean correlation is 02 which is roughly consistent with what past surveys
in psychology have found (Richard et al 2003) and that the standard deviation in the distribution
of true effects due to heterogeneity is approximately the same size6 Then the probability that a
replication will correctly return a medium-to-large true effect (r gt 03) or a negative or negligible
true effect (r lt 01) is 62 In other words if an original study measures an effect that is influenced
by notable heterogeneity a replication attempt of that study can appear to have failed when in
fact both accurately measure different true effects With high heterogeneity the psychological
6 These magnitudes are roughly consistent with what our survey finds to be typical among recent Psychological Bulletin meta-analyses
POWER BIAS AND HETEROGENEITY
16
effect in question is itself too variable or context sensitive regardless of bias or sample size to be
successively replicated frequently
Methods
Data collection
To assess power bias and heterogeneity in psychological research we require both effect
sizes and their standard errors over a wide range of psychological studies Since only past meta-
analyses are likely to have collected the requisite information to calculate power and because
Psychological Bulletin is the premier journal for meta-analysis in psychology we use it to define
our sampling frame We took a convenience sample of the 200 most recently published meta-
analyses (as of June 1 2016) for which we could acquire the necessary statistics Thus our unit of
analysis is a meta-analysis and all of dozens of the individual estimates therein To the extent that
Psychology Bulletin meta-analyses are representative of the population of empirical psychology
our findings will also be representative of psychological research However as an anonymous
referee points out we can only be sure that our survey is representative of the research that the
editors and reviewers of the Psychology Bulletin consider to be of top quality and relevant to
psychology We focused on the most recent issues of the Psychological Bulletin ending June 1
2016 because the topics covered in more recent issues are more likely to reflect contemporary
psychological research interests7
Before our survey of 200 meta-analyses commenced we posted a pre-analysis plan at Open
Science Framework June 1 2016 (httpsosfio4znzpwikihome) In December of 2016 we
7 As we discuss in greater detail below the findings from our survey are also consistent with past surveys of psychological research Thus these 200 meta-analyses are likely to be similarly representative as those past surveys
POWER BIAS AND HETEROGENEITY
17
filed an amended pre-analysis plan to increase the number of meta-analyses surveyed from the
originally planned 100 to 200 while keeping everything else the same We made this adjustment
to maintain a broad coverage across areas of research even though the typical meta-analysis paper
published in Psychological Bulletin contains more than 3 separate meta-analyses Our survey
satisfies the Meta-Analysis Reporting Standards (MARS)
Search strategies As noted above only meta-analysis published in Psychological Bulletin
were considered We manually searched all issues of Psychological Bulletin from 2011 to 2016
as detailed in Table B1 We began with the June 2016 issue of Psychological Bulletin and worked
backwards until we obtained the required statistics from 200 meta-analyses When necessary we
contacted authors for their data The data collection ended when 200 meta-analysis datasets with
the needed information were gathered from 61 papers published between 2011 to 2016 in the
Psychological Bulletin These 61 papers are listed in Appendix A During this period there were
115 meta-analysis papers published in Psychological Bulletin Hence we include meta-analyses
from 53 of these papers
Inclusion and exclusion criteria All the studies are in English Studies were eligible for
inclusion in our study if they provided data on the estimated effect sizes and their standard errors
either in the paper or in a supplement
We exclude four categories of meta-analyses First we exclude any meta-analysis that did
not report both effect sizes and their standard errors Consequently we also exclude systematic
reviews as opposed to meta-analyses because they typically do not fully report all effect sizes and
their standard errors Second to avoid double-counting we exclude any meta-analysis from a
POWER BIAS AND HETEROGENEITY
18
reply or comment to a published meta-analysis that was already part of our database Third we
exclude a couple of meta-analyses that used partial eta squared as the effect size Partial eta squared
cannot be used in conventional power calculations a central outcome of our survey nor can they
be converted and compared to other types of effect sizes (correlations and standardized mean
differences) used in all of the other 200 meta-analyses Fourth we exclude any meta-analysis with
fewer than 5 observations because all statistical calculations are unreliable when based on only a
handful of measures8 Appendix B presents the distribution of studies across the six-year period
included in our sample Our meta-analysis survey contains over 80 of the meta-analysis papers
published in 2015 and 2016 as a larger proportion of more recent publications report the necessary
data
Coding procedures The data used in the survey were reported by authors of published meta-
analyses in Psychological Bulletin This data was extracted by all three authors all of whom are
very experienced in data retrieval There were no disputes in coding as we used the data supplied
by authors themselves No issues of study quality arose as all the meta-analyses are published in
Psychological Bulletin and have already undergone a rigorous review process
54 of the effect sizes in our sample are reported as correlations All of our calculations
of power heterogeneity and bias are made for each of the 200 meta-analyses in the meta-analysisrsquos
originally reported measure of effect size Hence all summary calculations are independent of the
type of effect size or of the transformation of one to the other However for descriptive clarity
and simplicity meta-averages in terms of correlation are converted to standardized mean
differences (Cohenrsquos d) to be comparable to the others A minority of meta-analyses report
8 This requirement removes only two meta-analyses
POWER BIAS AND HETEROGENEITY
19
Hedgesrsquo g correction of standardized mean differences (SMD) for degrees of freedom We make
no conversion between Cohenrsquos d and Hedgesrsquo g because it does not make a practical difference
to any of our calculations
To highlight the types of meta-analytic studies included in our survey and to discuss some
of the issues that naturally arise we use two of these 61 Psychological Bulletin papers North and
Fiske (2015) ldquoModern attitudes toward older adults in the aging world A cross-cultural meta-
analysisrdquo and Williams and Tiedens (2016) ldquoThe subtle suspension of backlash A meta-analysis
of penalties for womenrsquos implicit and explicit dominance behaviorrdquo Williams and Tiedens (2016)
report six separate meta-analyses of lsquobacklashrsquo to womenrsquos dominance behavior and all six are
included in our survey of 200 meta-analyses Three of these meta-analyses concern the simple
effect of gender from dominance behavior on likability competence and lsquodownstreamrsquo outcomes
such as hireability The other three meta-analyses involve the interaction of gender and dominance
on these same three types of outcome measures Williams and Tiedens (2016) include a mix of
experimental and correlational studies but most (85) are experimental Because all six separate
meta-analyses are reported and discussed by Williams and Tiedens (2016) all six are included in
our survey
In contrast North and Fiske (2015) report only one meta-analysis of observational studies
about East-West attitudes towards older adults North and Fiske (2015) combined quantitative
outcomes involving attitude measures on ageism the aging process perceived wisdom warmth
etc as well as behavior-based measures from contact with older adults (p 999) Clearly North
and Fiske (2015) thought these different outcomes measures to be sufficiently similar or
homogeneous to be compared and treated as the same phenomenon However like most meta-
POWER BIAS AND HETEROGENEITY
20
analytic studies in psychology North and Fiske (2015) also conduct a moderator analysis that
investigated the effect of different outcomes measures among others9
It is important to note that we do not choose the level of aggregation of the meta-analyses
that are included on our survey Rather in all cases we follow the professional judgement of
experts in these specific areas of psychological research In the example of gender and dominance
research Williams and Tiedens do not judge that the effects on likeability competence and
downstream outcomes to be sufficiently homogeneous to be analyzed together It seems sensible
that any measure of likeability for example reflects the same phenomenon as any other measure
of likeability when evaluating the effects of gender and dominance Regardless the judgment
about where to draw the line is better made by those experts who have read coded summarized
and analyzed the entire relevant research literature(s)mdashWilliams and Tiedens in this case
Similarly Williams and Tiedens (2016) consider interaction effects to be too different from the
simple effects and from each other to be aggregated Because these are different psychological
phenomenon containing non-overlapping effect sizes we include these interaction studies as well
This issue is potentially important because the level of aggregation of the meta-analyses may have
implications about how much heterogeneity is found The broader more encompassing the level
of aggregation the higher one would expect heterogeneity to be
Meta-Estimates of lsquoTrue Effectrsquo
To be both conservative and robust we use three meta-estimators of lsquotruersquo effect because
the meta-estimate that one chooses might in some individual cases make a practically notable
9 Separate meta-analyses cannot be generally constructed for all reported moderator variables in these meta-analysis studies thus we do not include further subdivided moderator meta-analyses Often meta-regression is used for moderator analysis and only summary results are reported Even when separate moderator subsets are investigated it is often the case that insufficient information is reported for us to make these separations
POWER BIAS AND HETEROGENEITY
21
difference in how a given area of research is characterized We investigate three reasonable
alternative proxies for lsquotruersquo effect drawn from all the reported results in a given research subject
to be sure that our survey results are in fact robust to the chosen meta-method of estimating effect
and also to potential selective reporting bias
To be clear there is no perfect estimate of the lsquotruersquo effect size (or the mean of the
distribution of true effect sizes) when some authors reviewers or editors preferentially select
statistically significant effects (Stanley 2017 Stanley Doucouliagos amp Ioannidis 2017) With
selective reporting bias (aka publication bias the file drawer problem small-sample bias and p-
hacking) all meta-estimates are biased because the data from which they are calculated are
themselves biased to an unknowable degree However a series of statistical simulation studies
have documented how some estimators are more biased than others when there is selective
reporting bias (Stanley 2008 Moreno et al 2009 Stanley amp Doucouliagos 2014 Stanley amp
Doucouliagos 2015 Stanley Doucouliagos amp Ioannidis 2017 Stanley 2017)
Conventional meta-analysis typically estimates true effects using either lsquofixed-effectsrsquo
(FE) or a lsquorandom-effectsrsquo (RE) weighted average or both (Hedges amp Olkin 1985 Cooper amp
Hedges 1994 Stanley amp Doucouliagos 2015) The lsquofixed-effectrsquo weighted average employs
optimal weights that are the same as those used by a recently proposed unrestricted weighted least
squares (WLS) weighted average (Stanley amp Doucouliagos 2015) We prefer the unrestricted
WLS version of the conventional fixed-effect meta-analysis for inferential purposes because the
unrestricted WLS weighted average automatically accounts for heterogeneity when calculating
confidence intervals or significance tests (Stanley amp Doucouliagos 2015) This WLS estimator is
POWER BIAS AND HETEROGENEITY
22
also consistently less biased than RE when there is selective reporting bias10 The point estimates
of WLS and FE must always be exactly the same thus using WLS is exactly equivalent to using
FE in our survey11
Our second estimator exploits the importance of statistical power by over-weighting the
most precise largest studies The weighted average of the adequately powered (WAAP) uses the
same formulas as does WLS (or FE) but applies it only on those estimates found to be adequately
powered relative to WLS as the proxy for true effect WAAP is more resilient to selective reporting
biases because adequately powered studies are more reliable and require fewer questionable
research practices to achieve statistical significance Simulations show that WAAP is as good as
random-effects when there are no selective reporting biases and dominates RE when there is
selective reporting for statistical significance When half of the reported experimental results have
been selected for their statistical significance WAAP consistently reduces bias on average by
50 (Stanley Doucouliagos amp Ioannidis 2017) The weakness of WAAP is that it cannot be
computed if there are no studies with adequate power a condition found in 35 of the 200 areas
of psychological research that comprise our survey Thus Stanley Doucouliagos amp Ioannidis
(2017) propose using WLS when WAAP cannot be computed giving a WAAP-WLS weighted
10 We have chosen not to use the lsquorandom-effectsrsquo weighted average to assess power because RE is widely known to be more biased than FE and thereby WLS when there is selective reporting bias (Poole amp Greenland 1999 Sutton et al 2000 Henmi amp Copas 2010 Stanley amp Doucouliagos 2014 Stanley amp Doucouliagos 2015 Stanley Doucouliagos amp Ioannidis 2017 Stanley 2017) WLS and FE give less weight than RE to small-sample studies where selective reporting is likely to be the most severe In the aggregate giving more weight to the largest studies and less weight to small studies will reduce selective reporting bias if it is present and is statistically sensible even when it is not Besides WLS estimates remain practically as good as or better than conventional lsquorandom-effectsrsquo meta-analysis when there is no selective reporting for statistical significance (Stanley amp Doucouliagos 2015 Stanley Doucouliagos amp Ioannidis 2017) 11 For those readers who wish to know how to calculate WLSrsquos standard error or confidence interval please consult Stanley amp Doucouliagos (2015) and Stanley Doucouliagos amp Ioannidis (2017) However any basic regression routine will automatically calculate our unrestricted WLS weighted average when one uses the standardized effect size (effect size divided by it standard error) as the dependent variable and precision (1SE) as the independent variable with no intercept Nothing else is needed
POWER BIAS AND HETEROGENEITY
23
average In the below assessments of power and bias WAAP-WLS is the second approach that we
employ WAAP-WLS has the added value of forcing meta-analysts to seriously consider and
report the statistical powers found in their area of research12
WLS and WAAP-WLS passively moderate selective reporting bias In contrast simple
meta-regression models have been shown to reduce selective reporting bias more aggressively
when it is present (Stanley 2005 Stanley 2008 Moreno et al 2009 Stanley amp Doucouliagos
2014 Stanley amp Doucouliagos 2015 Stanley amp Doucouliagos 2017 Stanley Doucouliagos amp
Ioannidis 2017 Stanley 2017) The precision-effect test-precision effect estimate with standard
error (PET-PEESE) is a conditional estimate of average effect from simple WLS meta-regressions
of each estimated effect size on its standard error (PET) or alternatively on its variance
(PEESE)mdashStanley amp Doucouliagos (2014) When only statistically significant positive results
are reported selective reporting bias is known to be equal to the reported estimatersquos standard error
times the inverse Millsrsquo ratio (Stanley amp Doucouliagos 2014 p 61) The inverse Millsrsquo ratio is a
complex function of the true effect and the standard error which Stanley and Doucouliagos (2014)
approximate by a restricted polynomial function of the standard error (PEESE) When the true
effect is zero it can also be shown mathematically that this complex function collapses to a linear
relation with standard error giving PET (Stanley amp Doucouliagos 2014) A series of statistical
simulation studies documents how PET-PEESE often greatly reduces selective reporting bias and
is preferable to conventional meta-analysis methods and to the lsquotrim-and-fillrsquo publication bias
correction algorithm (Stanley 2008 Moreno et al 2009 Stanley amp Doucouliagos 2014 Stanley
amp Doucouliagos 2017 Stanley Doucouliagos amp Ioannidis 2017 Stanley 2017) PET-PEESE
provides a more aggressive approach to selective reporting bias than any simple weighted average
12 It is our belief that all meta-analyses should report typical power as one objective metric of research quality
POWER BIAS AND HETEROGENEITY
24
but it too has limitations overcorrecting for publication bias in some cases (Stanley 2017 Stanley
Doucouliagos amp Ioannidis 2017 Stanley 2017)13
To recap we calculate power and bias in a robust yet conservative manner by employing
three proxies of lsquotruersquo average effect size (1) the WLS unrestricted weighted average with point
estimates equivalent to the fixed-effect (2) the weighted average of the adequately powered
(WAAP-WLS) and (3) the PET-PEESE meta-regression reduction of selective reporting bias
Two of these approaches (WLS and WAAP-WLS) are quite lsquoconservativersquo in the sense that they
are known to overestimate true effect if there is any type of selective reporting bias lsquoConservativersquo
in this context means they give the benefit of doubt to the psychological research record as reported
and are likely to overestimate psychological researchrsquos power on average PET-PEESE on the
other hand more aggressively attempts to identify and filter out selective reporting bias thus it is
possible to underestimate true effect and thereby underestimate statistical power in some cases
(Stanley 2017) Because our survey is merely descriptive we focus on the median powers across
reported effect sizes research topics and also across these three estimation approaches to the
average true effect size The median of these three will thus be conservative and tend to
overestimate the quality of psychological research14
Assessing adequate power
13 We do not use Simonsohn Nelson amp Simmonsrsquos (2014) lsquop-curversquo correction for lsquop-hackingrsquo Recently several papers establish that the p-curve approach is biased and unreliable when there is either heterogeneity misspecification biases or when some insignificant studies are reported (Bruns amp Ioannidis 2016 McShane Boumlckenholt amp Hansen 2016 van Aert et al 2016) Such conditions are ubiquitous in the social sciences For example we find that the typical heterogeneity variance among the 200 meta-analyses that we survey is nearly 3 times larger than the corresponding random sampling variance That is 74 of the observed variation of reported research results from study to study is typically due to actual differences in the true effect (heterogeneity) or to differential bias in either case overwhelming the p-curversquos assumed pattern of p-values from sampling errors alone 14 Our overall survey results do not depend on the accuracy or validity of PET-PEESE We include PET-PEESE only for the sake of robustness to see what if any difference might result when a more aggressive approach to reducing selective reporting biased is used Below we find that it makes little difference
POWER BIAS AND HETEROGENEITY
25
With the WLS WAAP-WLS and PET-PEESE estimates of the lsquotruersquo effect for a given
area of research adequate power is easy to assess We assume the null hypotheses are two tailed
with a 5 significance level and we accept Cohenrsquos 80 as the definition of adequate power
These conventions for Type I and Type II errors imply that the lsquotruersquo effect needs to be equal to or
greater than 28 standard errors in absolute magnitude if power is to reach 80 This value of 28
is the sum of 196 and 084 where 196 is the minimum number of standard errors from zero that
an observed effect must fall to be rejected with a 5 significance level and 084 is the number of
additional standard errors that the true effect must fall from zero such that 80 of the distribution
of the observed effect is in the rejection regionmdashsee Figure 1 Hence for a study to have adequate
power its standard error needs to be smaller than the absolute value of the underlying mean lsquotruersquo
effect divided by 28 All that remains to assess adequate power retrospectively are (1) the values
of the standard error and (2) an estimate (or estimates) of the lsquotruersquo effect If the standard error of
a study is less than the absolute value of an estimate lsquotruersquo effect (from WLS WAAP-WLS or
PET-PEESE) divided by 28 we know that this study is adequately powered to detect a lsquotruersquo
effect equal or greater than this estimate Median power for a given area of research can then be
calculated from the cumulative normal probability of the difference between 196 and the absolute
value of an estimate of the true effect divided by the median standard error Because our survey
is merely descriptive we focus on the median powers across reported effect sizes areas of
research and also across these three estimation approaches to the average true effect size The
median of these estimation approaches will thus be conservative and tend to overestimate the
quality of psychological research
POWER BIAS AND HETEROGENEITY
26
Assessing residual selective reporting bias
If an area of research is selectively reporting effect size to be statistically significant in a
direction consistent with the prevailing psychological theory then the average reported effect will
on average have a larger magnitude than the true effect (whether or not prevailing psychological
theory suggests a direct or an inverse association) As before we can use these meta-averages
WLS WAAP-WLS and PET-PEESE as proxies for lsquotruersquo effect and then compare them to
average reported effect for an assessment of residual reporting bias Needless to say each reported
estimate is subject to random sampling error and will be sometimes larger and sometimes smaller
than the mean true effect Such differences cannot be regarded as lsquobiasrsquo but merely as sampling
or estimation errors However when there is a systematic trend for the unadjusted simple average
to be larger than a meta-average known to be less biased when there is selective reporting bias
then we can regard the difference between the absolute value of the simple mean and the absolute
value of WLS or WAAP-WLS as the lower limit of bias when it persists consistently over hundreds
of separate areas of research Using this approach Ioannidis Stanley amp Doucouliagos (2017) find
that the typical reported estimate in economics is twice as large or larger than either WAAP or
PET-PEESE In sharp contrast our survey of psychology finds on average only a small amount
of consistent exaggeration or overall selective reporting bias
Results
Among these 200 areas of psychological research containing 12065 estimated effect the
average effect size is 0389 expressed as the median of average standardized mean differences or
0191 as a correlation coefficient This overall effect size is nearly the same as the average of the
first 100 years of social psychology (r = 021) uncovered by Richard Bond amp Stokes-Zoota
POWER BIAS AND HETEROGENEITY
27
(2003) The typical standard error is 0104 expressed as a correlation 021 when represented by
a standardized mean difference (SMD) The p-value produced by these averages is a little larger
than the conventional 05 level Other researchers across several disciplines have found that that
p-values tend to lump up at or just below 05 (Gerber amp Malhotra 2008 Brodeur Sangnier amp
Zylberberg 2016) Contrary to recent concerns about publication bias questionable research
practices and null hypothesis significance testing we find that the typical psychological research
study is statistically insignificant at the conventional 05 level of significance
Table 1 reports the median absolute value of the average reported effect size from these
200 meta-analyses Here all effect sizes are first converted to standardized mean differences
(SMD) to be comparable However an interesting pattern emerges when these 200 meta-analyses
are divided by the types of effect sizes that are commonly reported correlation vs SMD The
typical effect size found among the 108 lsquocorrelation-basedrsquo meta-analyses in our survey (0458 in
SMD units) is 57 larger than those meta-analyses measured by SMDs (0291)15
Power
The median of the percent of reported effects that are adequately powered across these 200
areas of research are (1) 77 when the unrestricted WLS (or fixed effect) weighted average is
used to represent the mean of the true effects distribution (2) 71 when WAAP-WLS proxies for
lsquotruersquo effect and (3) 91 if PET-PEESE substitutes for true effect Figure 2 displays the
distributions of the proportion of studies that are adequately powered across these 200 areas of
15 We thank Frank Schmidt for pointing out that technically only point-biserial correlations can be converted to Cohenrsquos d Ceteris paribus other correlations will be larger than the point-biserial correlation due to the latterrsquos restricted range Thus a small part of the larger effect average effect size of lsquocorrelation-basedrsquo meta-analyses might be due to the conversion of all correlations to Cohenrsquos d Because these 108 lsquocorrelation-basedrsquo meta-analyses often contain an undisclosed mix of correlation types we cannot fully correct this small bias However as we discussed above none of our calculations of power heterogeneity or bias depend in any way on the transformation of correlations to standardized mean differences
POWER BIAS AND HETEROGENEITY
28
research Clearly underpowered studies dominate psychological research But how underpowered
are they
We also calculate the median powers for each of these 200 areas of research The typical
power of psychological research is around 36 364 based on WLS 331 based on WAAP-
WLS and 36 based on PET-PEESE16 Figure 3 shows the distribution of median powers across
these 200 areas of research Note their striking shapes The two most frequent categories are the
lowest (0-10) and the highest (over 90) Even though typical areas of research are quite
inadequately powered as measured by median power approximately one-fifth of these 200 areas
of psychological research are quite highly-powered Between 19 and 23 have average statistical
power 90 or highermdashsee Figure 3 It should not be surprising that some areas of research have
high power Aside from sample size statistical power depends on the underlying true effect size
and some psychological phenomena have large effects When WAAP-WLS is used to estimate
true effect one-third of these 200 areas of psychological research (32) have lsquolargersquo or lsquomediumrsquo
effect sizes defined as |WAAP-WLS| gt 05 SMD Even rather modest sample sizes will estimate
large effects powerfully
As before we find striking difference between correlation-based meta-analyses and SMD-
based meta-analyses Table 1 breaks down the median proportion of studies that are adequately
powered and the median power by type of effect size Those areas of psychological research that
predominately report standardized mean differences (SMDs) are highly under-powered typically
99 are underpowered compared to 67 to 76 for correlation-based meta-analyses The median
16 This is somewhat less than a recent survey Fraley amp Vazire (2014) which found a median power to detect a correlation of 02 to be 49 among top social-personality journals for the years 2006-2010 But then Fraley amp Vazire (2014) calculate prospective rather than retrospective power and their sampling frame is different than ours Thus we would expect some differences especially when considering that our median power calculations reflect both the observed effect size of each area of research and the distribution of statistical power within an area of research
POWER BIAS AND HETEROGENEITY
29
statistical power in SMD meta-analyses is between 17 to 23 For correlation-based research
typical power is nearly three times highermdash58 to 61
Residual selective reporting bias
Recall that residual reporting bias may be calculated as the difference between the absolute
value of the simple mean reported effect and the absolute value of one of our less vulnerable
proxies for true effectmdashWLS WAAP-WLS or PET-PEESE We find only small amounts of
residual reporting bias in psychological research 8 based on WLS 12 based on WAAP-WLS
and 15 based on PET-PEESE Thus our survey identifies only a small systematic exaggeration
overall
There are some important qualifications to make about this finding First all these
estimates are themselves biased and two of them consistently underestimate residual bias when
there is selective reporting (Stanley and Doucouliagos 2014 Stanley and Doucouliagos 2015
Stanley et al 2017 Stanley 2017) Second a notable proportion of psychology might still be
affected by selective reporting bias even if the median amount of exaggeration is relatively small
275 (or 55 areas of research) find evidence of some type of selective reporting or small-sample
bias using the Egger test for funnel plot asymmetry and this is likely to be an under-estimate of
the incidence of these biases because the Egger test is known to have low power (Egger et al
1997 Stanley 2008) Third we again find notable differences between types of effect sizes
reported by meta-analysts When using WLS as a proxy for the true effect we find that the simple
mean of reported SMDs is now exaggerated by 13 on average by 20 if WAAP-WLS
substitutes for true effect and by 30 relative to the median absolute value of PET-PEESE
POWER BIAS AND HETEROGENEITY
30
Heterogeneity
The median percent of the observed variation of reported effect sizes within a given area
of research that is attributed to heterogeneity (I2) is 74 This means that the variance among lsquotruersquo
effects is nearly 3 times larger than the reported sampling variance According to Pigottrsquos (2012)
guidelines for small (25) medium (50) and large (75) heterogeneity typical areas of research
have nearly lsquolargersquo excess heterogeneity Yet this level of heterogeneity appears to be the norm
for research in psychology For example van Erp et al (2017) extracted estimates of heterogeneity
from 705 meta-analyses published in Psychological Bulletin between 1990 and 2013 and found
that the median reported I2 = 7062 (interquartile range [3324 8741]) However I2 is a
relative measure of heterogeneity and does not reflect the variation in true effect as measured in
units of SMDs When our median I2 is applied to the typical area of research the standard deviation
among true effects is 0354 SMD and the standard deviation from one study to the next due to both
heterogeneity and sampling error becomes 0412 larger than the typical reported effect size 0389
lsquoExperimentalrsquo vs lsquoobservationalrsquo research
As a post hoc secondary analysis17 we examined whether the systematic differences
between SMD-based and correlation-based meta-analyses are due to experimental design
lsquoexperimentalrsquo vs lsquoobservationalrsquo Unfortunately this differentiation is not perfect Many meta-
analyses contain a mix of experimental and observational research designs at the study level For
example Williams and Tiedens (2015) meta-analysis of the effects of gender and dominance
17 Investigating these differences was not part of our pre-analysis plan Anonymous reviewers asked that we code for experimental design and report the differences
POWER BIAS AND HETEROGENEITY
31
behavior includes 97 experimental studies (85) where dominance behavior was somehow
manipulated and 17 purely observational studies
Because a substantial percent (424) of those meta-analyses that report effect sizes in
terms of SMD are lsquoobservationalrsquo and 314 of correlation-based meta-analyses are
lsquoexperimentalrsquo there is only small correlation (phi=0263 plt001) between experimental design
(1 if primarily experimental 0 elsewhere) and effect type (1 if SMD 0 for correlation) However
we do see some interesting differences in power and heterogeneity by experimental design First
there is a difference between heterogeneity as measured by I2 (plt01) The median I2 for
experimental research is 68 vs 76 for observational designs But I2 is a relative measure of
heterogeneity with a non-symmetric distribution To correct for I2rsquos nonstandard distribution we
use Abramowitz and Stegunrsquos (1964) normal approximation for the chi-square distribution applied
to the Cochran Q-test for heterogeneity Doing so causes this difference in relative heterogeneity
to be only marginally larger than statistical noise (p=045) Additionally experimental research
designs have larger sampling errors and lower power Typical sampling errors are 026 vs 019
measured as median SEs in units of SMD Table 2 reports the median proportion of studies that
are adequately powered and the median of median powers by type of research design Even though
there is only a small association between experimental design and effect type we find a similar
pattern among the typical levels of power for experimental design that we see for effect type
confirming the concerned expressed by dozens of researchers over the years that scarcely any
experimental studies are adequately powered All of these results about lsquoexperimentalrsquo vs
lsquoobservationalrsquo research designs should be interpreted with caution because as mentioned they
are conducted post hoc
POWER BIAS AND HETEROGENEITY
32
Discussion
Our survey of 12065 estimated effects sizes from nearly 8000 studies in 200 meta-
analyses reveals that the typical effect size is 0389 SMD with a median standard error of 021 We
also find low statistical power small residual selection bias and high levels of heterogeneity The
central purpose of our review is to assess the replicability of psychological research through meta-
analysis and thereby better understand recent failures to replicate Our findings implicate low
statistical power and high levels of heterogeneity as the primary causes of lsquofailedrsquo replications
however defined
We find that only a small proportion of psychological studies are adequately powered
approximately 8 and the median power is about 36 across three proxies for the mean lsquotruersquo
effect18 What does this imply about replication Our survey predicts therefore that replication
study with a typical sample size will have only a 36 chance of finding a statistically significant
effect in the same direction as some previous study and this value is exactly the same percent of
replications found to be statistically significant in the same direction by the Open Science
Collaboration (Open Science Collaboration 2015 Table 1) Thus when replication is viewed in
terms of sign and statistical significance it is no wonder that rates of replication are considered
low in psychology research
Improving replication as noted by others (eg Maxwell et al 2015) would seem to be a
matter of conducting both initial studies and replications with larger samples reducing sources of
non-sampling error (eg measurement error Stanley amp Spence 2014) and focusing on larger
18 To be more precise 36 is the median among the medians of medians
POWER BIAS AND HETEROGENEITY
33
effects Because researchers work with limited resources and knowledge these obvious
recommendations are extremely difficult to implement in most cases
More practical recommendations have centered on redefining replication success and
adjusting researchersrsquo expectations about non-significant replications For example Peng et al
(2016) examined the data from the Reproducibility Project Psychology (Open Science
Collaboration 2015) in terms of prediction intervalsmdashconfidence intervals that account for
variability in both the original and replication studymdashand found that 77 of the replication
attempts were consistent with the original findings This finding seems to be in apparent contrast
to the highly publicized result that only 36 of the replications in those data were statistically
significant but completely in accord with the less well-publicized result that meta-analytically
combining the replications with the original studies resulted in 70 statistical significance (Open
Science Collaboration 2015) Along similar lines several authors have argued for assessing
replication primarily within the context of meta-analysis (eg Braver Thoemmes amp Rosenthal
2014 Stanley amp Spence 2014 Fabrigar amp Wegener 2016) Doing so could shift the evaluation
of success vs failure of replications to a judgement about the degree of information that new data
add to our knowledge base (Peng et al 2016)
Consistent with a previous survey of heterogeneity (van Erp et al 2017) and several
findings from recent multi-site replication attempts (Hagger amp Chatzisarantis 2016 Eerland et al
2016 Klein et al 2015) our survey reveals clear evidence for high levels of heterogeneity in
research in psychology We find that heterogeneity accounts for nearly three-fourths of the
observed variation among reported effects (ie median I2 =74) When applied to the median
reported standard error (measured in terms of SMD) this high I2 implies that the typical standard
deviation of heterogeneity is equal to 0354 (again in units of SMDs) Importantly even a
POWER BIAS AND HETEROGENEITY
34
replication study with millions of subjects will remain vulnerable to heterogeneity among lsquotruersquo
effects When we apply our surveyrsquos typical heterogeneity to its typical effect size it is unlikely
that any replication will be lsquosuccessfulrsquo For example if our median effect size 0389 is the mean
of the distribution of true effects then there is a 298 probability that the largest possible
replication study will find a negligible zero or opposite-signed effect The probability is 324
that this ideal replication (ie ninfin) finds a small effect and it is 255 for a medium-sized
effectmdashusing Cohenrsquos guidelines of 02 05 and 08 Even though 0389 is considered a lsquosmallrsquo
effect by these guidelines the probability that a very large replication finds a large effect remains
non-negligible at 123 Thus it is quite likely 68 that an ideal replication will not reproduce
a small effect when the mean of the distribution true effects is equal to our median average effect
size The wide distribution of true effect sizes that our survey finds is also similar to what Open
Science Collaboration observed when attempting to replicate 100 psychological experimentmdashsee
Figure 3 in the Open Science Collaboration (2015)
No matter what the mean of the distribution of true effect sizes might be nor how large the
replication study is it is unlikely that a replication will find an effect size close to what was found
previously when there is this much heterogeneity If a lsquosuccessful replicationrsquo is defined as finding
an effect size similar to what some previous study or studies have found (say for example to
within + 01 or within + 02 SMD) then there will always be a sizeable chance of unsuccessful
replication no matter how well conducted or how large any of the studies are For example
suppose that two studies are conducted with nearly infinite sample sizes and therefore infinitesimal
sampling error Heterogeneity of the size that our survey finds implies that the probability that
these two ideal studies find effect sizes that are within +01 from one another is 158 and 311
to within +02 Indeed there remains a 50 or greater probability of a lsquofailed replicationrsquo whenever
POWER BIAS AND HETEROGENEITY
35
the acceptable difference for a successful replication is set at less than 035 SMD Needless to say
if we have less-than-ideal sample sizes the resulting added sampling error will reduce the
probability of a successful replication further Thus high heterogeneity further explains the failure
of the Open Science Collaboration (2015) to find reliable indicators of replication success
There are important caveats to these calculations of replication success that need to be
mentioned First there is a wide distribution of observed heterogeneity among these areas of
psychological researchmdashsee Figure 4 Twenty-two percent have I2s that are less than 50 while
47 have I2 values 75 or higher and one out of seven have excess heterogeneity of 90 or more
Thus successful replication will be more likely in some areas of research but much less likely in
others Second these calculations assume that the typical heterogeneity observed in this research
record is entirely heterogeneity among lsquotruersquo effects that is variation beyond the control of
researchers Because exact replication is rare in psychology some of this observed heterogeneity
will be due to variation in experimental conditions measures methods and the characteristics of
the population from which the samples are drawn Thus a careful exact replication study could
avoid a notable amount of this variation in expected effect by carefully duplicating all of the
controllable features of the experimental design execution and evaluation However those large-
scale efforts to control these controllable research dimensions still find that notable heterogeneity
remains (Hagger et al 2016 Eerland et al 2016 Klein et al 2015) Moreover if half the
observed heterogeneity variance is due to differences that are under the control of the researcher19
then our estimate of the typical standard deviation due this uncontrollable heterogeneity among
true effects would be reduced to 025 In which case the probability that the largest possible
19 The typical heterogeneity found by two large replication studies that attempted to be as exact as possible is larger than half of the median heterogeneity that our survey finds (Hagger et al 2016 Eerland et al 2016)
POWER BIAS AND HETEROGENEITY
36
replication study will find a negligible zero or opposite-signed effect declines to 22 28 for a
medium effect and it will find a large effect only about 5 of the time Even if half of the observed
heterogeneity among reported effects is under the researcherrsquos control the probability that any
replication effort successfully replicates a small effect (recall 0389 is our surveyrsquos median effect
size) remains less than 50
Conclusions
Our survey of 12065 estimated effect sizes from nearly as many studies and 8000 papers
finds that lsquofailedrsquo replicationsmdashdefined here in terms of null hypothesis significance testingmdash are
to be expected at a rate consistent with the widely publicized the Reproducibility Project
Psychology (Open Science Collaboration 2015) Like many other researchers we find that
statistical power is chronically low in research in psychology (Cohen 1962 Cohen 1977
Sedlmeier amp Gigerenzer 1989 Rossi 1990 Maxwell 2004 Pashler amp Wagenmakers 2012
Fraley amp Vazire 2014 Tressoldi amp Giofreacute 2015) Unlike this previous research however our
survey reveals a more severe challenge for replication High levels of heterogeneity are evidently
the norm in psychology (median I2 =74) As discussed above heterogeneity this large makes
successful replication difficult whether defined in terms of hypothesis testing or estimation
precision This high heterogeneity will of course be due in part to methodological differences
between the different studies in each of the 200 meta-analyses that we survey However data from
multi-site registered replication efforts further suggest that when obvious methodological
differences are removed (ie when lsquoexactrsquo replications are conducted) heterogeneity is not
reduced to negligible levels In other words it is unrealistic to believe that variance in
POWER BIAS AND HETEROGENEITY
37
psychological phenomena studied can always be tightly controlled or reduced to practically
insignificant levels
Perhaps more surprising is our finding that there is relatively small exaggeration or overall
selective reporting bias in recent psychological research This is in contrast to the view that
publication bias and questionable research practices are the primary cause of failed replications
Of course as mentioned above there are good reasons to be cautious in applying this hopeful
result to any individual area of research In particular 275 of these areas of research produce a
significant Eggerrsquos test for publication bias (or small-sample bias) and this test is known to have
low power Our survey merely implies that the effects of selective reporting bias (ie publication
bias small-sample biases p-hacking andor questionable research practices) have a less clear
pattern than is maybe assumed by some researchers and by what has been observed in other fields
(eg economics Ioannidis Stanley and Doucouliagos 2017)
In light of the typically high heterogeneity that we observed how should replications in
psychology be interpreted To begin it seems extremely likely that the p-value from any single
non-preregistered non-exact replication study will have nil informative value In the face of high
heterogeneity this is true regardless of the sample size of the replication because it is quite likely
that the replication study will correctly reflect a substantially different true effect than the original
study However individual non-preregistered non-exact replication studies may still contribute to
our collective knowledge when added to a carefully conducted meta-analysis or meta-regression
analysis Meta-analysis moves the focus away from the statistical significance of the single
replication study increases statistical power by pooling across studies allows one to accommodate
and reduce selective reporting bias and meta-regression analysis can use non-exact replications to
POWER BIAS AND HETEROGENEITY
38
help isolate and quantify methodological heterogeneity (eg Stanley amp Doucouliagos 2012
Braver Thoemmes amp Rosenthal 2014 Stanley amp Spence 2014 Fabrigar amp Wegener 2016)
Replication findings from multi-site pre-registered replications clearly offer a different
class of evidence from the single non-pre-registered non-exact replication Statistical power can
be maximized by the pooling of resources across research sites pre-registration is likely to greatly
reduce some types of selective reporting bias and heterogeneity due to obvious methodological
characteristics can be minimized through tightly-controlled study protocols Multi-site pre-
registered replication also allows researchers to directly isolate and quantify the specific
heterogeneity among true effects which remains after methodological heterogeneity is minimized
Such information can provide useful insights about the psychological phenomenon in question
thereby helping to guide and redirect future research and meta-regression analyses
The central implication of our survey is that typically-powered studies in most of areas of
psychology individually or when simply combined into a meta-analysis offer little information
about the magnitude or significance of the phenomenon they examine Our core recommendation
then is that researchers change their expectations about the ease with which convincing evidence
either for or against an effect can be claimed
POWER BIAS AND HETEROGENEITY
39
References
Abramowitz M and IA Stegun (eds) (1964) Handbook of Mathematical Functions with
Formulas Graphs and Mathematical Tables Washington DC US Department of
Commerce
American Psychological Association (2010) Manual of the American Psychological Association
6th ed Washington DC
Asendorpf J B Conner M De Fruyt F De Houwer J Denissen J J Fiedler K amp
Perugini M (2013) Recommendations for increasing replicability in psychology European
Journal of Personality 27(2) 108-119
Baker M (2015) Over half of psychology studies fail reproducibility test Nature News and
Comment August 27 doi101038nature201518248 accessed 8232017
Bakker M van Dijk A amp Wicherts J M (2012) The rules of the game called psychological
science Perspectives on Psychological Science 7(6) 543-554 doi
1011771745691612459060
Bakker M Hartgerink C H Wicherts J M amp van der Maas H L (2016) Researchersrsquo
intuitions about power in psychological research Psychological Science 27(8) 1069-1077 doi
1011770956797616647519
Bohannon J (2015) Reproducibility Many psychology papers fail replication test Science
349910ndash911
Braver SL Thoemmes FJ amp Rosenthal R (2014) Continuously cumulating meta-analysis
and replicability Perspectives on Psychological Science 9 333ndash342 doi
1011771745691614529796
Brodeur A Leacute M Sangnier M amp Zylberberg Y (2016) Star Wars The empirics strike back
American Economic Journal Applied Economics 8 1ndash32 doi 101257app20150044
Bruns S B amp Ioannidis J P A (2016) p-curve and p-hacking in observational research PLoS
ONE 11 e0149144 doi101371journal pone0149144
Button K S Ioannidis J P Mokrysz C Nosek B A Flint J Robinson E S amp Munafograve M
R (2013) Power failure why small sample size undermines the reliability of neuroscience
Nature Reviews Neuroscience 14(5) 365-376 doi101038nrn3475
Cohen J (1962) The statistical power of abnormal-social psychological research A review
Journal of Abnormal and Social Psychology 65 145ndash153
POWER BIAS AND HETEROGENEITY
40
Cohen J (1965) Some statistical issues in psychological research In (BB Wolman ed)
Handbook of Clinical Psychology New York McGraw-Hill pp 95ndash121
Cohen J (1977) Statistical power analysis for the behavioral sciences (2nd ed) New York
Academic Press
Cohen J (1992) A power primer Psychological Bulletin 112 155ndash159
Cooper H M amp Hedges LV (1994) (eds) Handbook of Research Synthesis New York Russell
Sage
Dreber A Pfeiffer T Almenberg J Isaksson S Wilson B Chen Y amp Johannesson M
(2015) Using prediction markets to estimate the reproducibility of scientific research
Proceedings of the National Academy of Sciences 112(50) 15343-47
Eerland A Sherrill A M Magliano J P Zwaan R A Arnal J D Aucoin P amp Prenoveau
J M (2016) Registered replication report Hart amp Albarraciacuten (2011) Perspectives on
Psychological Science 11(1) 158-171 doi 1011771745691615605826
Egger M Smith G D Schneider M amp Minder C (1997) Bias in meta-analysis detected by a
simple graphical test British Medical Journal 315 629ndash634 doi101136bmj3157109629
Engber D (2015) Cover Story Everything is crumbling Slate March 6 Accessed Dec 19
2016
Erica C Y Sprenger A M Thomas R P amp Dougherty M R (2014) When decision heuristics
and science collide Psychonomic Bulletin amp Review 21(2) 268-282 doi103758s13423-013-
0495-z
Fabrigar L R amp Wegener D T (2016) Conceptualizing and evaluating the replication of
research results Journal of Experimental Social Psychology 66 68-80 doi
101016jjesp201507009
Fanelli D (2010) ldquoPositiverdquo results increase down the hierarchy of the sciences PLoS One
5 e10068 doi101371journalpone0010068
Fanelli D Costas R amp Ioannidis J P (2017) Meta-assessment of bias in science Proceedings
of the National Academy of Sciences 201618569 doi101073pnas1618569114
Fiedler K amp Schwarz N (2016) Questionable research practices revisited Social Psychological
and Personality Science 7(1) 45-52 doi 1011771948550615612150
POWER BIAS AND HETEROGENEITY
41
Fraley R C amp Vazire S (2014) The n-pact factor Evaluating the quality of empirical journals
with respect to sample size and statistical power PLoS ONE 9 e109019
doi101371journalpone0109019
Fraley R C amp Marks M J (2007) The null hypothesis significance testing debate and its
implications for personality research In R W Robins R C Fraley amp R F Krueger (Eds)
Handbook of research methods in personality psychology (pp149ndash169) New York Guilford
Franco A Malhotra N amp Simonovits G (2016) Underreporting in psychology experiments
Evidence from a study registry Social Psychological and Personality Science 7(1) 8-12 doi
1011771948550615598377
Gerber A amp Malhotra N (2008) Do statistical reporting standards affect what is published
publication bias in two leading political science journals Quarterly Journal of Political
Science 3 313-326 doi 10156110000008024
Hagger M S Chatzisarantis N L D Alberts H Anggono C O Birt A Brand R amp
Cannon T (2016) A multi-lab preregistered replication of the ego-depletion effect
Perspectives on Psychological Science 11 546ndash573 doi 1011771745691616652873
Hedges L V amp Olkin I (1985) Statistical Methods for Meta-Analysis Academic Press Orlando
Henmi M amp Copas J B (2010) Confidence intervals for random effects meta-analysis and
robustness to publication bias Statistics in Medicine 29 2969ndash2983 doi 101002sim4029
Higgins J P T amp Thompson S G (2002) Quantifying heterogeneity in meta-analysis Statistics
in Medicine 21 1539ndash1558 doi 101002sim1186
Hoenig J M amp Heisey D M (2001) The abuse of power The pervasive fallacy of power
calculations for data analysis American Statistician 55 19ndash24 doi
101198000313001300339897
Inthout J Ioannidis J P A amp Borm G F (2012) Obtaining evidence by a single well-powered
trial or several modestly powered trials Statistical Methods in Medical Research
httpsmmsagepubcomcontentearly201209240962280212461098abstract (Accessed
Aug 16th 2015)
Ioannidis J P A (2005a) Contradicted and initially stronger effects in highly cited clinical
research Journal of the American Medical Association 294 218-228
doi101001jama2942218
POWER BIAS AND HETEROGENEITY
42
Ioannidis J P A (2005b) Why most published research findings are false PLoS Medicine 2
e124 doi101371journalpmed0020124
Ioannidis J P A (2013) Clarifications on the application and interpretation of the test for excess
significance and its extensions Journal of Mathematical Psychology 57 184-187 doi
101016jjmp201303002
Ioannidis J P A Hozo I and Djulbegovic B (2013) Optimal type I and type II error pairs when
the available sample size is fixed Journal of Clinical Epidemiology 66 903-910 doi
101016jjclinepi201303002
Ioannidis J P A Stanley T D amp Doucouliagos C(H) (2017) The power of bias in economics
research The Economic Journal October also as SWP Economics Series 20162
httpwwwdeakineduau__dataassetspdf_file00074777632016_1pdf Deakin University
Australia [Accessed on 27 April 2017]
John L K Loewenstein G amp Prelec D (2012) Measuring the prevalence of questionable
research practices with incentives for truth telling Psychological Science 23 524-532 doi
1011770956797611430953
Klein R A Vianello M Hasselman F Alper S Aveyard M Axt J R amp Nosek B A
(2015) Many Labs 2 Investigating variation in replicability across sample and setting
Manuscript in preparation
Kuumlhberger A Fritz A amp Scherndl T (2014) Publication bias in psychology a diagnosis based
on the correlation between effect size and sample size PloS one 9(9) e105825 doi
101371journalpone0105825
Lakens D (2015) On the challenges of drawing conclusions from p-values just below 005 Peer
J 3e1142 doi 107717peerj1142 PMID 26246976
LeBel E P Borsboom D Giner-Sorolla R Hasselman F Peters K R Ratliff K A amp
Smith C T (2013) PsychDisclosure org Grassroots support for reforming reporting standards
in psychology Perspectives on Psychological Science 8(4) 424-432 doi
1011771745691613491437
LeBel E P Vanpaemel W McCarthy R J Earp B D amp Elson M (2017) A unified
framework to quantify the trustworthiness of empirical research Advances in Methods and
Practices in Psychological Science Retrieved from httpsosfiopreprintspsyarxivuwmr8
8232017
POWER BIAS AND HETEROGENEITY
43
Lindsay D S (2015) Replication in psychological science Psychological Science 26 1827-32
Makel M C Plucker J A amp Hegarty B (2012) Replications in psychology research How
often do they really occur Perspectives on Psychological Science 7(6) 537-542
Maxwell S E (2004) The persistence of underpowered studies in psychological research causes
consequences and remedies Psychological Methods 9 147 doi 1010371082-989X92147
Maxwell S E Lau M Y amp Howard G S (2015) Is psychology suffering from a replication
crisis What does ldquofailure to replicaterdquo really mean American Psychologist 70(6) 487-498
httpdxdoiorg101037a0039400
McShane B B amp Boumlckenholt U (2016) Planning sample sizes when effect sizes are uncertain
The power-calibrated effect size approach Psychological Methods 21(1) 47 doi
101037met0000036
McShane B B Boumlckenholt U amp Hansen K T (2016) Adjusting for publication bias in meta-
analysis An evaluation of selection methods and some cautionary notes Perspectives on
Psychological Science 11 730ndash749 doi 1011771745691616662243
Miguel E amp Christensen G (2017) Transparency reproducibility and the credibility of
economics research Journal of Economic Literature IN PRESS
Moreno S G Sutton A J Ades A E Stanley T D Abrams K R Peters J L Cooper N
J (2009) Assessment of regression-based methods to adjust for publication bias through a
comprehensive simulation study BMC Medical Research Methodology 9 2 doi
1011861471-2288-9-2
Open Science Collaboration (2015) Estimating the reproducibility of psychological science
Science 349(6251) aac4716ndashaac4716 doi101126scienceaac4716
Pashler H amp Harris C (2012) Is the replicability crisis overblown Three arguments examined
Perspectives on Psychological Science 7 531ndash536 doi 1011771745691612463401
Pashler H amp Wagenmakers E J (2012) Editorsrsquo introduction to the special section on
replicability in psychological science a crisis of confidence Perspectives on Psychological
Science 7 528ndash530 doi 1011771745691612465253
Patil P and Leek JT (2015) Reporting of 36 of studies replicate in the media
httpsgithubcomjtleekreplication_paperblobgh-pagesin_the_mediamd[Online up- dated
16-September-2015 accessed 8232017]
POWER BIAS AND HETEROGENEITY
44
Patil P Peng R D amp Leek J T (2016) What should researchers expect when they replicate
studies A statistical view of replicability in psychological science Perspectives on
Psychological Science 11(4) 539-544 doi 1011771745691616646366
Pigott T (2012) Advances in meta-analysis New York NY Springer
Poole C amp Greenland S (1999) Random-effects meta-analyses are not always conservative
American Journal of Epidemiology 150 469ndash475
Popper K (1959) The logic of scientific discovery New York NY Basic Books
Psychonomic Society (2012) New Statistical Guidelines for Journals of the Psychonomic Society
httpwwwpsychonomicorgpagestatisticalguideline (Accessed March 11th 2017)
Rossi J S (1990) Statistical power of psychological research What have we gained in 20 years
Journal of Consulting and Clinical Psychology 58 646ndash656 doi1010370022-
006X585646
Richard F D Bond C F amp Stokes-Zoota J J (2003) One hundred years of social psychology
quantitatively described Review of General Psychology 7 331ndash363
Scargle J D (2000) Publication bias The ldquoFile-Drawerrdquo problem in scientific inference Journal
of Scientific Exploration 14 91ndash106
Schmidt F L amp Hunter J E (2015) Methods of meta-analysis Correcting error and bias in
research findings 3rd ed Los Angeles CA Sage
Schmidt F L amp Oh I -S (2016) The crisis of confidence in research findings in psychology Is
lack of replication the real problem Or something else Archives of Scientific Psychology 4(1)
32ndash37 httpdxdoiorg101037arc0000029
Sedlmeier P amp Gigerenzer G (1989) Do studies of statistical power have an effect on the power
of studies Psychological Bulletin 105 309ndash316
Simmons J P Nelson L D amp Simonsohn U (2011) False-positive psychology Undisclosed
flexibility in data collection and analysis allows presenting anything as significant
Psychological Science 22(11) 1359-1366 doi 1011770956797611417632
Simonsohn U Nelson L D amp Simmons J P (2014) P-curve a key to the file drawer Journal
of Experimental Psychology General 143 534-547 doi 101037a0033242
Stanley D J amp Spence J R (2014) Expectations for replications Are yours realistic
Perspectives on Psychological Science 9 305ndash318 doi 1011771745691614528518
POWER BIAS AND HETEROGENEITY
45
Stanley T D (2008) Meta-regression methods for detecting and estimating empirical effects in
the presence of publication selection Oxford Bulletin of Economics and Statistics 70103-27
doi 101111j1468-0084200700487x
Stanley T D (2017) Limitations of PET-PEESE and other meta-analysis methods Social
Psychology and Personality Science [Epub ahead of print] doi 1011771948550617693062
Stanley T D amp Doucouliagos H(C) 2014 Meta-regression approximations to reduce publication
selection bias Research Synthesis Methods 5 60-78 doi 101002jrsm1095
Stanley T D amp Doucouliagos H(C) 2015 Neither fixed nor random Weighted least squares
meta-analysis Statistics in Medicine 34 2116-27 doi 101002sim6481
Stanley T D amp Doucouliagos H(C) 2017 Neither fixed nor random Weighted least squares
meta-regression analysis Research Synthesis Methods 8 19-42 doi 101002jrsm1211
Stanley T D Doucouliagos H(C) amp Ioannidis J P A 2017 Finding the power to reduce
publication bias Statistics in Medicine [Epub ahead of print] doi 101002sim7228
Sterling T D (1959) Publication decisions and their possible effects on inferences drawn from
tests of significance Or vice versa Journal of the American Statistical Association 54 30ndash34
Sterling T D Rosenbaum W L amp Weinkam J J (1995) Publication decisions revisited The
effect of the outcome of statistical tests on the decision to publish and vice versa American
Statistician 49 108ndash112 doi 1023072684823
Sutton A J Song F Gilbody S M amp Abrams K R (2000) Modelling publication bias in
meta-analysis A review Statistical Methods in Medical Research 9 421-445 doi
101177096228020000900503
Tressoldi P E amp Giofreacute D (2015) The pervasive avoidance of prospective statistical power
Major consequences and practical solutions Frontiers in Psychology 6 726
doi103389fpsyg201500726
van Aert R C M Jelte M Wicherts J M amp van Assen M A L M (2016) Conducting meta-
analyses based on p values Reservations and recommendations for applying p-uniform and p-
curve Perspectives on Psychological Science 11 713ndash729 doi 1011771745691616650874
van Bavel JJ Mende-Siedlecki PBrada WJ and Reinero DA 2016 Contextual sensitivity
in scientific reproducibility Proceedings of the National Academy of Sciences 113 6454ndash59
POWER BIAS AND HETEROGENEITY
46
van Erp S et al (2017) Estimates of between-study heterogeneity for 705 meta-analyses reported
in Psychological Bulletin from 1990ndash2013 Journal of Open Psychology Data 5(1) p4 DOI
httpdoiorg105334jopd33
Wicherts J M Veldkamp C L Augusteijn H E Bakker M van Aert R C amp Van Assen
M A (2016) Degrees of Freedom in Planning Running Analyzing and Reporting
Psychological Studies A Checklist to Avoid p-Hacking Frontiers in Psychology 7 doi
103389fpsyg201601832
Yuan K amp Maxwell S (2005) On the post hoc power in testing mean differences Journal of
Educational and Behavioral Statistics 30 141ndash167 doi 10310210769986030002141
POWER BIAS AND HETEROGENEITY
47
Table 1 Median Statistical Power and Average Effect Sizes
Mean Proportion with Adequate Power Median Power Type of Effect
Absolute Effect Sizes WLS WAAP-WLS PET-PEESE WLS WAAP-WLS PET-PEESE
Combined (n=200)
0389 0077 0071 0091 0364 0331 0360
Correlations (n=108)
0458 0243 0328 0272 0577 0610 0607
SMDs (n=92)
0291 0013 0000 0011 0230 0171 0170
Notes The numbers reported in the table are medians Mean absolute effect sizes are reported in this table in units of standardized mean differences (SMD) regardless of whether they were reported in the meta-analysis as correlations or as SMD WLS is the unrestricted weighted least squares weighted average WAAP-WLS is the weighted average of adequately powered effect sizes (WAAP) or WLS when there are no adequately powered studies PET-PEESE is the conditional precision-effect test-precision-effect estimate with standard error meta-regression correction for publication bias Adequate power is defined as 80 following Cohen (1977)
Table 2 Median Statistical Powers by Experimental Design Proportion with Adequate Power Median Power
Experimental Design WLS WAAP-WLS PET-PEESE WLS WAAP-WLS PET-PEESE
Observational (n=113)
0278 0259 0268 0621 0613 0585
Experimental (n=87)
0032 0000 0053 0247 0232 0236
Notes The numbers reported in the table are medians WLS is the unrestricted weighted least squares weighted average WAAP-WLS is the weighted average of adequately powered effect sizes (WAAP) or WLS when there are no adequately powered studies PET-PEESE is the conditional precision-effect test-precision-effect estimate with standard error meta-regression correction for publication bias Adequate power is defined as 80 following Cohen (1977)
Figure 1 Obtaining adequate power (80)
Notes x is distributed as a standard normal distribution N(01) 196 is the critical value for testing against 0 Figure 1 merely illustrates how the standardized mean of the sampling distribution needs to 28 standard errors away from 0 for an experiment to have adequate powermdashCohenrsquos 80 We thank Stephan Bruns for producing this graph
POWER BIAS AND HETEROGENEITY
49
Figure 2 Histograms of Adequately Powered Estimates from 200 Areas of Research
Notes WLS is the unrestricted weighted least squares weighted average WAAP-WLS is the weighted average of adequately powered effect sizes (WAAP) or WLS when there are no adequately powered studies PET-PEESE is the conditional precision-effect test-precision-effect estimate with standard error meta-regression correction for publication bias Adequate power is defined as 80 following Cohen (1977)
0
20
40
60
80
100
120N
um
ber
of M
eta-
An
alys
es
0 2 4 6 8 1Proportion of Studies Adequately Powered
WLS
0
20
40
60
80
100
120
Nu
mbe
r of
Met
a-A
nal
yses
0 2 4 6 8 1Proportion of Studies Adequately Powered
WAAP-WLS
0
20
40
60
80
100
120
Nu
mbe
r of
Met
a-A
nal
yses
0 2 4 6 8 1Proportion of Studies Adequately Powered
PET-PEESE
POWER BIAS AND HETEROGENEITY
50
Figure 3 Histograms of Median Statistical Power from 200 Areas of Research
Notes WLS is the unrestricted weighted least squares weighted average WAAP-WLS is the weighted average of adequately powered effect sizes (WAAP) or WLS when there are no adequately powered studies PET-PEESE is the conditional precision-effect test-precision-effect estimate with standard error meta-regression correction for publication bias Adequate power is defined as 80 following Cohen (1977)
0
10
20
30
40
50
60N
um
ber
of M
eta-
An
alys
es
0 2 4 6 8 1Median Statistical Power
WLS
0
10
20
30
40
50
60
Nu
mbe
r of
Met
a-A
nal
yses
0 2 4 6 8 1Median Statistical Power
WAAP-WLS
0
10
20
30
40
50
60
70
Nu
mbe
r of
Met
a-A
nal
yses
0 2 4 6 8 1Median Statistical Power
PET-PEESE
Figure 4 Histograms of I2 from 200 Areas of Research
Notes I2 is the proportion of observed variation among reported effect sizes that cannot be explained by the calculated standard errors associated with these reported effect sizes It is a relative measure of heterogeneity
0
5
10
15
20
25
30
35
40
45
0 2 4 6 8 1I-squared
Num
ber o
f Met
a-A
naly
ses
POWER BIAS AND HETEROGENEITY
52
Appendix A Studies included in the meta-meta-analysis
1 Baas M Nijstad B A Boot N C amp De Dreu C K W (2016) Mad genius revisited Vulnerability to psychopathology biobehavioral approach-avoidance and creativity Psychological Bulletin 142 668-692 doi101037bul0000049 [2]
2 Balliet D Li N P Macfarlan S J amp Van Vugt M (2011) Sex differences in cooperation A meta-analytic review of social dilemmas Psychological Bulletin 137 881ndash909 doi 101037a0025354 [1]
3 Balliet D Mulder L B amp Van Lange P A M (2011) Reward punishment and cooperation A meta-analysis Psychological Bulletin 137 594-615 doi 101037a0023489 [2]
4 Balliet D Wu J amp De Dreu C K W (2014) Ingroup favoritism in cooperation A meta-analysis Psychological Bulletin 140 1556-1581 doi 101037a0037737 [1]
5 Brewin C R (2014) Episodic memory perceptual memory and their interaction Foundations for a theory of posttraumatic stress disorder Psychological Bulletin 140 69ndash97 doi 101037a0033722 [1]
6 Byron K amp Khazanchi S (2011) Rewards and creative performance A meta-analytic test of theoretically derived hypotheses Psychological Bulletin 138 809ndash830 [1]
7 Cerasoli C P amp Nicklin J M (2014) Intrinsic motivation and extrinsic incentives jointly predict performance A 40-year meta-analysis Psychological Bulletin 140 980-1008 doi 101037a0035661 [1]
8 Chaplin T M amp Aldao A (2013) Gender differences in emotion expression in children A meta-analytic review Psychological Bulletin 139 735-765 doi 101037a0030737 [4]
9 Defoe I N Dubas JS amp Figner B (2015) A meta-analysis on age differences in risky decision making Adolescents versus children and adults Psychological Bulletin 141 48ndash84 doi 101037a0038088 [4]
10 Degner J amp Dalege J (2013) The apple does not fall far from the tree or does it A meta-analysis of parentndashchild similarity in intergroup attitudes Psychological Bulletin 139 1270ndash1304 doi 101037a0031436 [1]
11 Eastwick P W Finkel E J Luchies L B amp Hunt L L (2014) The predictive validity of ideal partner preferences A review and meta-analysis Psychological Bulletin 140 623ndash 665 doi 101037a0032432 [4]
12 Else-Quest N M Higgins A Allison C amp Morton L C (2012) Gender differences in self-conscious emotional experience Psychological Bulletin 138 947ndash981 doi101037a0027930 [5]
13 Fairbairn C E amp Sayette M A (2014) A social-attributional analysis of alcohol response Psychological Bulletin 140 1361-82 doi 101037a0037563 [4]
14 Fischer P Krueger J I Greitemeyer T Vogrincic C Kastenmuumlller A Frey D Heene M Wicher M amp Kainbacher M (2011) The bystander-effect A meta-analytic review on bystander intervention in dangerous and non-dangerous emergencies Psychological Bulletin 137 517ndash537 doi 101037a0023304 [1]
POWER BIAS AND HETEROGENEITY
53
15 Fox MC Ericsson A amp Best (2011) Do procedures for verbal reporting of thinking have to be reactive A meta-analysis and recommendations for best reporting methods Psychological Bulletin 137 316 ndash344 doi 101037a0021663 [2]
16 Fox N A You K H Bowman L C Cannon E N Ferrari P F Bakermans-Kranenburg M J Vanderwert R E amp van IJzendoorn M H (2016) Assessing human mirror activity with EEG mu rhythm A meta-analysis Psychological Bulletin 142 291ndash313 doi101037bul0000031 [2]
17 Freund P A amp Kasten N (2012) How smart do you think you are A meta-analysis on the validity of self-estimates of cognitive ability Psychological Bulletin 138 296-321 doi101037a0026556 [1]
18 Grijalva E Newman D A Tay L Donnellan M B Harms P D amp Robins R W (2015) Gender differences in narcissism A meta-analytic review Psychological Bulletin 141 261-310 doi 101037a0038231 [3]
19 Haedt-Matt A A amp Keel P K (2011) Revisiting the affect regulation model of binge eating A meta-analysis of studies using ecological momentary assessment Psychological Bulletin 137 660ndash681 doi 101037a0023660 [3]
20 Harkin B Webb T L Prestwich A Conner M Kellar I Benn Y amp Sheeran P (2016) Does monitoring goal progress promote goal attainment A meta-analysis of the experimental evidence Psychological Bulletin 142 198-229 doi 101037bul0000025 [2]
21 Houben M Van Den Noortgate W amp Kuppens P (2015) The relation between short-term emotion dynamics and psychological well-being A meta-analysis Psychological Bulletin 141 901-930 doi101037a0038822 [4]
22 Johnsen T J amp Friborg O (2015) The effects of cognitive behavioral therapy as an anti-depressive treatment is falling A meta-analysis Psychological Bulletin 141 747-768 [2]
23 Karlin B Zinger J F amp Ford R (2015) The effects of feedback on energy conservation A meta-analysis Psychological Bulletin 141 1205-1227 doi 101037a0039650 [1]
24 Kim S Thibodeau R amp Jorgensen R S (2011) Shame guilt and depressive symptoms A meta-analytic review Psychological Bulletin 137 68 ndash96 doi 101037a0021466 [2]
25 Klahr A M amp Burt S A (2014) Elucidating the etiology of individual differences in parenting A meta-analysis of behavioral genetic research Psychological Bulletin 140 544ndash586 doi 101037a0034205 [6]
26 Koenig A M Eagly A H Mitchell A A amp Ristikari T (2011) Are leader stereotypes masculine A meta-analysis of three research paradigms Psychological Bulletin 137 616 ndash 642 doi 101037a0023557 [4]
27 Kredlow M A Unger L D amp Otto M W (2016) Harnessing reconsolidation to weaken fear and appetitive memories A meta-analysis of post-retrieval extinction effects Psychological Bulletin 142 314ndash336 doi 101037bul0000034 [3]
28 Kuykendall L Tay L amp Ng V (2015) Leisure engagement and subjective well-being A meta-analysis Psychological Bulletin 141 364-403 doi101037a0038508 [3]
29 Landau M J amp Kay A C (2015) Compensatory control and the appeal of a structured world Psychological Bulletin 141 694ndash722 doi 101037a0038703 [1]
30 Lee E-S Park T-Y amp Koo B (2015) Identifying organizational identification as a basis for attitudes and behaviors A meta-analytic review Psychological Bulletin 141 1049ndash1080 doi 101037bul0000012 [1]
POWER BIAS AND HETEROGENEITY
54
31 Lui P P (2015) Intergenerational cultural conflict mental health and educational outcomes among Asian and Latinoa Americans Qualitative and meta-analytic review Psychological Bulletin 141 404-446 doi101037a0038449 [3]
32 Lull R B amp Bushman B J (2015) Do sex and violence sell A meta-analytic review of the effects of sexual and violent media and ad content on memory attitudes and buying intentions Psychological Bulletin 141 1022ndash1048 doi 101037bul0000018 [6]
33 Mazei J Freund P A Huumlffmeier J amp Stuhlmacher A F (2015) A meta-analysis on gender differences in negotiation outcomes and their moderators Psychological Bulletin 141 85ndash104 doi 101037a0038184 [1]
34 Melby-Lervaringg M Lyster S A amp Hulme C (2012) Phonological skills and their role in learning to read A meta-analytic review Psychological Bulletin 138 322ndash352 doi 101037a0026744 [3]
35 Melby-Lervaringg M amp Lervaringg A (2014) Reading comprehension and its underlying components in second-language learners A meta-analysis of studies comparing first- and second-language learners Psychological Bulletin 140 409ndash433 doi 101037a0033890
[4] 36 Mendelson J L Gates J A amp Lerner M D (2016) Friendship in school-age boys with
autism spectrum disorders A meta-analytic summary and developmental process-based model Psychological Bulletin 142 601-622 doi 101037bul0000041 [2]
37 Mol S E amp Bus A G (2011) To read or not to read A meta-analysis of print exposure from infancy to early adulthood Psychological Bulletin 137 267ndash296 doi 101037a0021890 [13]
38 Orquin J L amp Kurzban R (2016) A meta-analysis of blood glucose effects on human decision making Psychological Bulletin 142 546ndash567 doi 101037bul0000035 [1]
39 Ottaviani C Verkuil B Medea B Couyoumdjian A Thayer JF Lonigro A amp Brosschot J F (2016) Physiological concomitants of perseverative cognition A systematic review and meta-analysis Psychological Bulletin 142 No 3 231ndash259 doi 101037bul0000036 [8]
40 North M S amp Fiske S T (2015) Modern attitudes toward older adults in the aging world A cross-cultural meta-analysis Psychological Bulletin 141 993ndash1021 doi 101037a0039469 [1]
41 Pahlke E Hyde J S amp Allison C M (2014) The effects of single-sex compared with coeducational schooling on studentsrsquo performance and attitudes A meta-analysis Psychological Bulletin 140 1042-1072 doi 101037a0035740 [2]
42 Pan S C amp Rickard T C (2015) Sleep and motor learning Is there room for consolidation Psychological Bulletin 141 812-834 doi 101037bul0000009 [1]
43 Phillips W J Fletcher J M Marks A D G amp Hine D W (2016) Thinking styles and decision making A meta-analysis Psychological Bulletin 142 No 3 260ndash290 doi 101037bul0000027 [4]
44 Pool E Brosch T Delplanque S amp Sander D (2016) Attentional bias for positive emotional stimuli A meta-analytic investigation Psychological Bulletin 142 No 1 79ndash106 doi 101037bul0000026 [1]
45 Randall J G Oswald F L amp Beier M E (2014) Mind-wandering cognition and performance A theory-driven meta-analysis of attention regulation Psychological Bulletin 140 1411ndash1431 doi 101037a0037428 [4]
POWER BIAS AND HETEROGENEITY
55
46 Sambrook T D amp Goslin J (2015) A neural reward prediction error revealed by a meta-analysis of ERPs using great grand averages Psychological Bulletin 141 213ndash235 doi 101037bul0000006 [4]
47 Sedlmeier P Eberth J Schwarz M Zimmermann D Haarig F Jaeger S amp Kunze S (2012) The psychological effects of meditation A meta-analysis Psychological Bulletin 138 1139ndash1171 doi 101037a0028168 [20]
48 Sheeran P Harris P R and Epton T (2014) Does heightening risk appraisals change peoplersquos intentions and behavior A meta-analysis of experimental studies Psychological Bulletin 140 511ndash543 doi 101037a0033065 [2]
49 Smith S F amp Lilienfeld S O (2015) The response modulation hypothesis of psychopathy A meta-analytic and narrative analysis Psychological Bulletin 141 1145ndash1177 doi 101037bul0000024 [1]
50 Soderberg C K Amit E Callahan S P Kochersberger A O amp Ledgerwood A (2015) The effects of psychological distance on abstraction Two meta-analyses Psychological Bulletin 141 3 525ndash548 doi101037bul0000005 [2]
51 Tannenbaum M B Hepler J Zimmerman R S Saul L Jacobs S Wilson K amp Albarraciacuten D Appealing to fear A meta-analysis of fear appeal effectiveness and theories Psychological Bulletin 141 1178ndash1204 doi101037a0039729 [1]
52 Toosi N R Babbitt L G Ambady N amp Sommers SR (2012) Dyadic interracial interactions A meta-analysis Psychological Bulletin 138 1ndash27 doi 101037a0025767 [4]
53 Vachon D D Lynam D R amp Johnson J A (2014) The (Non)relation between empathy and aggression Surprising results from a meta-analysis Psychological Bulletin 140 751ndash773 doi 101037a0035236 [1]
54 Verhage M L Schuengel C Madigan S Fearon R M P Oosterman M Cassibba R Bakermans-Kranenburg M J amp van IJzendoorn M H (2016) Narrowing the transmission gap A synthesis of three decades of research on intergenerational transmission of attachment Psychological Bulletin 142 337ndash366 doi 101037bul0000038 [2]
55 von Stumm S amp Ackerman P L (2013) Investment and intellect A review and meta-analysis Psychological Bulletin 139 841ndash869 doi 101037a0030746 [11]
56 Voyer D amp Voyer S D (2014) Gender differences in scholastic achievement A meta-analysis Psychological Bulletin 140 1174-1204 doi 101037a0036620 [6]
57 Vucasović T amp Bratko D (2015) Heritability of personality A meta-analysis of behavior genetic studies Psychological Bulletin 141 769ndash785 doi101037bul0000017 [1]
58 Wanberg C R Hamann D J Kanfer R amp Zhang Z (2016) Age and reemployment success after job loss An integrative model and meta-analysis Psychological Bulletin 142 400-426 doi 101037bul0000019 [6]
59 Weingarten E Chen Q McAdams M Yi J amp Hepler J (2016) From primed concepts to action A meta-analysis of the behavioral effects of incidentally presented words Psychological Bulletin 142 472ndash497 doi 101037bul0000030 [1]
60 Williams M J amp Tiedens L Z (2016) The subtle suspension of backlash A meta-analysis of penalties for womenrsquos implicit and explicit dominance behaviour Psychological Bulletin 142 165ndash197 doi 101037bul0000039 [6]
POWER BIAS AND HETEROGENEITY
56
61 Winer E S amp Salem T (2016) Reward devaluation Dot-probe meta-analytic evidence of avoidance of positive information in depressed persons Psychological Bulletin 142 18ndash78 doi 101037bul0000022 [6]
Notes Numbers in square brackets denote the number of meta-analyses included in the dataset
Appendix B Distribution of survey estimates
Year
No of meta-analyses published
No of meta-analyses sampled
of published meta-studies
No of estimates
of sample
2016 17 14 82 46 22 2015 22 18 82 40 19 2014 25 12 48 46 22 2013 17 3 18 16 8 2012 15 6 40 34 16 2011 19 8 42 31 15

POWER BIAS AND HETEROGENEITY
5
study because the effect is contextually sensitive it need not be a ldquofailurerdquo but instead the effect
may not generalizable to the replication studyrsquos context For example if a replication study is
conducted online rather than in the laboratory as the original study was this operational choice
might produce a substantially different result However effects that can only be reproduced in the
laboratory or under only very specific and contextual sensitive conditions may ultimately be of
little genuine scientific interest
Statistically one expects that the variation between an original finding and an exact
replication will only be due to unsystematic sampling error In contrast if the context of an original
finding is not fully captured by the replication attempt or if the replication attempt is a conceptual
replication then variation between the original finding and the replication might be due to both
between-study heterogeneity and random sampling error error Below we argue that large
between-study heterogeneity is one of the main sources for the observed difficulty in replicating
psychological studies
The foregoing discussion of replicability does not provide a specific definition of
replication success although many have been proposed For example the Open Science
Collaboration (2015) compared the results of their 100 replication studies directly to the results of
the original studies using three quantitative definitions of success3 A success was claimed when
(1) the replication results matched the original results in both effect direction and statistical
significance (using the conventional α=005) (2) the effect size estimate provided by the original
study was within the 95 confidence interval of the estimate from the replication study or (3) a
meta-analytic estimate based on both the original and replication results was distinguishable from
3 The Open Science Collaboration (2015) also examined the size of the replication effects relative to the original findings and the replicating research teamrsquos subjective assessment of replication success
POWER BIAS AND HETEROGENEITY
6
zero Other researchers have suggested further ways of assessing replications (eg Braver
Thoemmes amp Rosenthal 2014 Patil Peng amp Leek 2016)
Although our analysis does not depend on any specific definition of successful replication
following the Open Science Collaboration (2015) we believe that replication success must
somehow involve the sign and significance of the reported effect size We prefer to view
replication as related to the sign and practical significance of the reported effect size rather than
its statistical significance Below we will discuss successful replication from both perspectives
However from the reactions to the Open Science Collaboration (2015) replication success is most
often viewed as the duplication the original effectrsquos direction and statistical significance This
view of lsquoreplication successrsquo is found in the popular press (Patil amp Leek 2015) in Science
(Bohannon 2015) and Nature (Baker 2015) and many subsequent scientific articles (eg Dreber
et al 2015 Lindsay 2015 van Bavel Mende-Siedlecki Brady amp Reinero 2016)
For any definition of replication success that involves both direction and significance
(whether practical or statistical) there are three governing factors for a successful replication
statistical power bias and between-study heterogeneity In the following sections we describe
how each of these relates to the replicability of a finding We then analyse a set of 200 previously
published meta-analyses to provide estimates of statistical power bias and heterogeneity and
discuss what these estimates imply for what one should expect when conducting replication in
psychology
POWER BIAS AND HETEROGENEITY
7
Statistical Power
Statistical power is the probability of finding statistically significant result if the effect in
question is truly non-zero (ie a lsquocorrect rejectionrsquo of the null hypothesis) A study is adequately
powered if it has a high probability of finding an effect when one exists and since Cohen (1965)
adequate power has been widely accepted to be 804 Psychological professional organizations
and journals have formally recognized the importance of statistical power For example the APA
Manual states ldquoWhen applying inferential statistics take seriously the statistical power
considerations associated with your tests of hypotheses [Y]ou should routinely provide
evidence that your study has sufficient power to detect effects of substantive interest (eg see
Cohen 1988)rdquo (APA 2010 p30) According to the Psychonomic Society ldquoStudies with low
statistical power produce inherently ambiguous results because they often fail to replicate Thus it
is highly desirable to have ample statistical powerrdquo (Psychonomic Society 2012 p1 emphasis
added) Moreover the past fifty years have seen many surveys and calls for greater use of
prospective power calculations in psychologymdashthat is planning research so as to ensure adequate
power to detect the effect of interest (eg Cohen 1962 Cohen 1977 Sedlmeier amp Gigerenzer
1989 Rossi 1990 Maxwell 2004 Pashler amp Wagenmakers 2012 Fraley amp Vazire 2014
Tressoldi amp Giofreacute 2015) In spite of such statements and frequent admonitions to increase power
prospective power calculations remain quite rare (Tressoldi amp Giofreacute 2015)
When successful replication is seen as being statistical significant in the same direction
low power will frequently cause replication failures First if a replication attempt itself has low
4 At this conventional 80 level the likelihood of a Type II error (or a lsquofalse negativersquo) is four times the conventional 05 probability of a Type I error (or a lsquofalse positiversquo) To some a 20 Type II error is still too high (Schmidt amp Hunter 2015) For a given application statisticians have long realized that researchers should adjust their tests and thereby the Type I and Type II errors to account for the relative costs of these two errorsmdashsee for example Ioannidis et al (2013) However the information needed to do so properly is usually beyond the researchersrsquo knowledge
POWER BIAS AND HETEROGENEITY
8
power then by definition it will not be likely to succeed because it has a low probability of reaching
statistical significance Second original studies with insufficient power will tend to be
overestimated to obtain statistical significance (Open Science Collaboration 2015) As a result
planned replications that use prospective power calculations (based on inflated effect size
estimates) are likely to underestimate the required sample size and thereby be insufficiently
powered That is low power begets low power Third if the original study has low power the
post-study odds of a statistically significant finding reflecting a true effect can be quite low
(Ioannidis 2005b) That is a basic consideration of Bayes formula proves that if the original study
had low power then a statistically significant finding will not make it likely that there is a genuine
nonzero effect (Ioannidis 2005b) In this case a replication should ldquofailrdquo because the true effect
is zero or nearly so
Statistical power is determined by sample size desired significance level α and the
magnitude of the lsquotruersquo effect investigated The first two quantities are widely known whereas the
magnitude of the lsquotruersquo effect must be estimated This raises the obvious question How can
researchers know the effect size when research is conducted for the very purpose of estimating this
effect size One option is to calculate post hoc power using the reported effect size(s)mdashthat is
using the result of a studyrsquos test of an effect to calculate the power of that test Critically post hoc
calculations are circular and tell us little beyond these studiesrsquo reported p-values (Hoenig amp
Heisey 2001 Yuan amp Maxwell 2005 Fraley amp Vazire 2014) This post hoc circularity is
especially pernicious if statistically significant estimates are preferentially reported (ie lsquoselective
reporting biasrsquo discussed below) ldquoSmall-N studies that actually produce significant results tend
to report larger effect sizes than comparable large-N studies thereby biasing their observed (post
hoc) power estimates upwardsrdquo (Fraley amp Vazire 2014 p 6 parentheses added)
POWER BIAS AND HETEROGENEITY
9
A better option is to calculate hypothetical power on the basis of arbitrarily-defined but
widely used small medium or large effect sizes Such hypothetical power has been the preferred
approach employed in several previous surveys of psychology which have shown that the typical
power to detect a medium effect in psychological research is inadequate see Maxwell (2004 p
148) and his citations to past power surveys For example two classic power surveys found that
the average power to detect a correlation of 02 to be quite low 14 (Cohen 1962) or 17
(Sedlmeier amp Gigerenzer 1989) but a more recent and slightly encouraging survey of social
psychology and personality journals finds that this power to detect a correlation of 02 has at least
doubled though it remains inadequate and typically less than 50 (Fraley amp Vazire 2014)
A third and we think more useful option is to calculate power retrospectively using an
estimate of the effect calculated from a meta-analysis This has been done previously for at least
two different fields Button et al (2013) reviewed 730 studies from 49 meta-analyses in
neuroscience and found that the average retrospective power was 21 and Ioannidis Stanley amp
Doucouliagos (2017) found that typically only 105 of economic studies have adequate power
Our survey calculates exactly this kind of retrospective power because doing so has the advantage
of using a meta-analysis and thus the entire relevant research record to assess power The potential
vicious circle of calculating power is further broken when the chosen meta-analysis methods are
resilient to selective reporting bias which is the topic to which we now turn
Selective reporting bias
The second research dimension that we survey is bias Here we use the term lsquoselective
reporting biasrsquo to refer collectively to situations in which the significance and magnitude of a
studyrsquos results have been exaggerated by choices in data collection analysis or reporting Thus
POWER BIAS AND HETEROGENEITY
10
our use of lsquoselective reporting biasrsquo encompasses more specific terms such as the file drawer
problem publication bias reporting bias p-hacking and questionable research practices (Scargle
2000 Simmons Nelson amp Simonsohn 2011 John Lowenstein amp Prelec 2012 Stanley and
Doucouliagos 2012 Stanley and Doucouliagos 2014 Simonsohn Nelson amp Simmons 2014
Wicherts et al 2016) Here we are only concerned about the aggregate effects that these various
research practices might have on the research record rather than the details of their specific
pathways Regardless of whether statistically insignificant findings are suppressed (traditionally
called lsquopublication biasrsquo or the lsquofile drawer problemrsquo) only some selected outcome measures or
comparisons are reported or whether any of a number of other questionable research practices are
employed the net effects on the research record are largely the samemdashan exaggeration of the size
and significance of reported effects
These biases are distinct from outright scientific fraud in that it is almost certainly
motivated by researchersrsquo desires to ldquogo where the data leadrdquo or by reviewersrsquo and editorsrsquo
motivations to use limited journal space for findings that move the field forward However even
well-meaning motivations can undermine the validity of research findings potentially producing
convincing evidence of a psychological effect that does not exists Selective reporting biases can
cause problems for replicability because replications may be doomed from the start if the original
reported finding is spurious or grossly inflated For this reason understanding the degree of bias
in psychology is important when assessing the credibility of research or when planning
replications
Selective reporting bias or publication bias as it is usually called is said to occur if the
dissemination of findings depends on the specifics of those findings For example findings with
statistically significant p-values or theory-consistent findings are more likely to be published
POWER BIAS AND HETEROGENEITY
11
reported and promoted than other findings As a result any review of a literature (including meta-
analysis) will tend to overestimate the evidence for an effect because such positive findings will
be overrepresented in the observed sample of reported findings
It seems quite clear that selective reporting or publication bias exists in psychology though
it is difficult to estimate its true prevalence For example several reviews have found that the
number of statistically significant results reported in psychology is larger than what should be
expected given the level of statistical power (eg Sterling 1959 Sterling Rosenbaum amp
Weinkam 1995 Fanelli 2010) In particular Bakker van Dijk amp Wicherts (2012) reviewed 13
meta-analyses in psychology and identify evidence consistent with publication bias in seven
Kuumlhberger Fritz amp Scherndl (2014) investigate a random sample of 500 studies published in 2007
and found several statistical indicators of publication bias including a persistent correlation
between sample size and effect size Quite recently Fanelli Costas and Ioannidis (2017)
corroborate the prevalence of a correlation between sample size and effect size among 430 meta-
analyses from psychology and psychiatry
An inverse correlation between the magnitude of the effect size and sample size would be
expected when there is selective reporting for statistical significance If there is a tendency for
some researchers to selectively report statistically significant findings then greater efforts will be
required by those researchers who have only small samples to work with Because small samples
produce larger standard errors correspondingly larger effects must be found to overcome these
large standard errors and obtain statistical significance With the benefit of larger samples it is
likely that the first small effect found will automatically be statistically significant When they are
not researchers who wish to report statistically significant findings will require much less
manipulation because even small effects (or biases) will be statistical significant when there are
POWER BIAS AND HETEROGENEITY
12
large samples Thus this often-observed inverse correlation between sample size and reported
effect size is an implication and therefore a confirmation of the tendency by some researchers to
selectively report statistical significant findings5
And yet still more direct evidence of publication bias has been found in psychology When
data on the intended research protocol is available Franco Malhotra amp Simonovits (2015) find
that published effects have a median p-value of 02 compared to the median unreported p-value
of 035 suggesting that statistically significant findings are selectively reported
Recently much attention has been given to selective reporting through the use of
undisclosed flexible approaches to data collection and analysis often called p-hacking or
questionable research practices (Simmons Nelson amp Simonsohn 2011 John Lowenstein amp
Prelec 2012 Wicherts et al 2016) Examples of these behaviors include analyzing data as it is
collected and stopping data collection once a desired result has been achieved deciding whether
to exclude outliers investigating experimental conditions or moderators on the basis of the results
and reporting onersquos exploratory findings as if they were the result of confirmatory research (see
5 In contrast some have suggested that small-sample studies are somehow better more able to find big effects But is it plausible to believe that small-sample psychological studies are typically conducted with more care or at a higher level of quality than large-sample studies We think not First we know that small-sample studies are less able to distinguish effects from background by the very definition of statistical power Second it is unlikely that researchers with small samples have first conducted prospective power calculations Past surveys have found that very few studies (3-5) choose their sample sizes on the basis of power calculations (Tressoldi and Giofreacute 2015) Yet such prospective power calculations with an associated 80 power level are required by the APA manual and have been accepted as critical in the field for decades Third even if these small-sample researchers believe that there are large effects to be found in their area of research they know that whatever they find (large or small) will be unreliable and ldquobuzzing with confusionrdquo (Maxwell 2004 p161) Thus by widely known standards of psychological research those who use small samples know that they are conducting low-quality less-rigorous research Fourth in contrast large labs and research programs tend to conduct larger studies ceteris paribus and they also have more resources to better design their instruments and more carefully execute their protocols Consider for example large replications efforts such as the Open Science Collaboration (2015) and (Hagger et al 2016) where the care and execution of experiments are demonstrably of higher quality and their sample sizes are larger However nothing in this paper assumes that larger studies are in any way better than smaller studies other than their demonstrably higher power Nor does our concern that small-sample studies tend to exhibit larger bias depend on small-sample studies being somehow of a lower quality (aside from statistical power) Nonetheless if some researchers have a preference for statistically significant results this alone will cause the inverse correlation between sample size and reported effect size that has often been observed
POWER BIAS AND HETEROGENEITY
13
Wicherts et al 2016 for a comprehensive list) Like publication bias it is extremely difficult to
determine the prevalence of such behaviors but several findings are of note For example John
Loewenstein amp Prelec (2012) surveyed 2000 researchers in psychology using a questionnaire-
based approach designed to correct for social desirability and found that the use of questionable
research practices may represent the norm (but see Fiedler amp Schwarz 2016) Additionally LeBel
et al (2013) created an online database PsychDisclosureorg which allows authors to disclose
whether their published articles include all the methodological details that went into the work
They found that of the authors who participated 112 had not fully reported all excluded
observations 118 had not reported all experimental conditions 453 had not reported all
measures that had been collected and 888 had not reported their data collection strategy Franco
Malhotra amp Simonovits (2015) compared recorded research intentions to the associated published
results and found that about 70 of studies did not disclose every outcome measured and 40 did
not disclose every experimental condition tested Moreover there is evidence indicating that
researchers rely on intuitions about data collection and that low statistical power can further lead
to practices which inflate their findings through bias (Erica et al 2014 Bakker et al 2016) For
the purposes of our survey the source or exact methods of selective reporting for statistical
significance is immaterial We merely wish to document any evidence of an overall tendency to
exaggerate psychological effects should it exist
Heterogeneity
The third governing factor for a successful replication is low heterogeneity As mentioned
above heterogeneity refers to variance in the reported findings that results from there being no
single lsquotruersquo effect size Rather there is a distribution of lsquotruersquo effects To compare heterogeneity
POWER BIAS AND HETEROGENEITY
14
from one area (or subject) of research to another and from one measure of empirical effect size to
another systematic reviewers often compute I2 (Higgins and Thompson 2002 pp1546-7) I2 is
the proportion (or percentage) of observed variation among reported effect sizes that cannot be
explained by the calculated standard errors associated with these reported effect sizes It is a
relative measure of the variance among reported effects that is due to differences between for
example studiesrsquo experimental methods measures population cohorts and statistical methods
relative to the total variance found among the reported effects
For most researchers I2 provides an easy to understand descriptive summary much like
R2 in regression analysis However because I2 is a relative measure of heterogeneity its magnitude
can be misleading If I2 is high (for example 09 or 90) but all studies have large samples and
high power heterogeneity in terms of effect sizes might still be low with little practical
consequence However even a small I2 can have considerable practical consequence for topics of
psychological research that are dominated by small samples and low power which has often been
found to be typical in psychology (eg Cohen 1962 Cohen 1977 Sedlmeier amp Gigerenzer 1989
Rossi 1990 Maxwell 2004 Pashler amp Wagenmakers 2012 Button et al 2013 Fraley amp Vazire
2014) Because we collect information on the random sampling variance on all of these 12065
estimated effect sizes we can also calculate heterogeneity in terms of standardized mean
differences or correlations to assess the practical consequences of the heterogeneity that our survey
finds
Importantly considerable heterogeneity has been found even in carefully conducted exact
replications in psychologymdashthose designed to minimize differences between the original study
design and the replication For example two massive efforts using pre-registered protocols in
which different teams of researchers ran the same study as closely as possible uncovered
POWER BIAS AND HETEROGENEITY
15
statistically significant amounts of heterogeneitymdashI2 = 36 (Hagger et al 2016) and 45
(Eerland et al (2016) Furthermore Klein et al (2015) reported a large-scale effort to replicate 15
findings across 36 different sites that intentionally differed in a variety of characteristics (eg
studies completed online or in the laboratory samples from the United States or elsewhere) Not
surprisingly they found significant amounts of heterogeneity in eight of the 16 effects that were
replicated (I2 = 23 to 91) however a comparison of the intra-class correlation among effects
to the intra-class correlation among sites found that very little of this heterogeneity in effect sizes
was accounted for by differences in the sites suggesting that heterogeneity was genuinely a
characteristic of the phenomena being studied Of course heterogeneity would be expected to be
higher when replications are lsquoconceptualrsquo (ie those making little attempt to duplicate all of the
relevant design characteristics of the original study) or when lsquohidden moderatorsrsquo influence
research outcomes
In the face of large heterogeneity replicability will be severely compromised For example
suppose that the true mean correlation is 02 which is roughly consistent with what past surveys
in psychology have found (Richard et al 2003) and that the standard deviation in the distribution
of true effects due to heterogeneity is approximately the same size6 Then the probability that a
replication will correctly return a medium-to-large true effect (r gt 03) or a negative or negligible
true effect (r lt 01) is 62 In other words if an original study measures an effect that is influenced
by notable heterogeneity a replication attempt of that study can appear to have failed when in
fact both accurately measure different true effects With high heterogeneity the psychological
6 These magnitudes are roughly consistent with what our survey finds to be typical among recent Psychological Bulletin meta-analyses
POWER BIAS AND HETEROGENEITY
16
effect in question is itself too variable or context sensitive regardless of bias or sample size to be
successively replicated frequently
Methods
Data collection
To assess power bias and heterogeneity in psychological research we require both effect
sizes and their standard errors over a wide range of psychological studies Since only past meta-
analyses are likely to have collected the requisite information to calculate power and because
Psychological Bulletin is the premier journal for meta-analysis in psychology we use it to define
our sampling frame We took a convenience sample of the 200 most recently published meta-
analyses (as of June 1 2016) for which we could acquire the necessary statistics Thus our unit of
analysis is a meta-analysis and all of dozens of the individual estimates therein To the extent that
Psychology Bulletin meta-analyses are representative of the population of empirical psychology
our findings will also be representative of psychological research However as an anonymous
referee points out we can only be sure that our survey is representative of the research that the
editors and reviewers of the Psychology Bulletin consider to be of top quality and relevant to
psychology We focused on the most recent issues of the Psychological Bulletin ending June 1
2016 because the topics covered in more recent issues are more likely to reflect contemporary
psychological research interests7
Before our survey of 200 meta-analyses commenced we posted a pre-analysis plan at Open
Science Framework June 1 2016 (httpsosfio4znzpwikihome) In December of 2016 we
7 As we discuss in greater detail below the findings from our survey are also consistent with past surveys of psychological research Thus these 200 meta-analyses are likely to be similarly representative as those past surveys
POWER BIAS AND HETEROGENEITY
17
filed an amended pre-analysis plan to increase the number of meta-analyses surveyed from the
originally planned 100 to 200 while keeping everything else the same We made this adjustment
to maintain a broad coverage across areas of research even though the typical meta-analysis paper
published in Psychological Bulletin contains more than 3 separate meta-analyses Our survey
satisfies the Meta-Analysis Reporting Standards (MARS)
Search strategies As noted above only meta-analysis published in Psychological Bulletin
were considered We manually searched all issues of Psychological Bulletin from 2011 to 2016
as detailed in Table B1 We began with the June 2016 issue of Psychological Bulletin and worked
backwards until we obtained the required statistics from 200 meta-analyses When necessary we
contacted authors for their data The data collection ended when 200 meta-analysis datasets with
the needed information were gathered from 61 papers published between 2011 to 2016 in the
Psychological Bulletin These 61 papers are listed in Appendix A During this period there were
115 meta-analysis papers published in Psychological Bulletin Hence we include meta-analyses
from 53 of these papers
Inclusion and exclusion criteria All the studies are in English Studies were eligible for
inclusion in our study if they provided data on the estimated effect sizes and their standard errors
either in the paper or in a supplement
We exclude four categories of meta-analyses First we exclude any meta-analysis that did
not report both effect sizes and their standard errors Consequently we also exclude systematic
reviews as opposed to meta-analyses because they typically do not fully report all effect sizes and
their standard errors Second to avoid double-counting we exclude any meta-analysis from a
POWER BIAS AND HETEROGENEITY
18
reply or comment to a published meta-analysis that was already part of our database Third we
exclude a couple of meta-analyses that used partial eta squared as the effect size Partial eta squared
cannot be used in conventional power calculations a central outcome of our survey nor can they
be converted and compared to other types of effect sizes (correlations and standardized mean
differences) used in all of the other 200 meta-analyses Fourth we exclude any meta-analysis with
fewer than 5 observations because all statistical calculations are unreliable when based on only a
handful of measures8 Appendix B presents the distribution of studies across the six-year period
included in our sample Our meta-analysis survey contains over 80 of the meta-analysis papers
published in 2015 and 2016 as a larger proportion of more recent publications report the necessary
data
Coding procedures The data used in the survey were reported by authors of published meta-
analyses in Psychological Bulletin This data was extracted by all three authors all of whom are
very experienced in data retrieval There were no disputes in coding as we used the data supplied
by authors themselves No issues of study quality arose as all the meta-analyses are published in
Psychological Bulletin and have already undergone a rigorous review process
54 of the effect sizes in our sample are reported as correlations All of our calculations
of power heterogeneity and bias are made for each of the 200 meta-analyses in the meta-analysisrsquos
originally reported measure of effect size Hence all summary calculations are independent of the
type of effect size or of the transformation of one to the other However for descriptive clarity
and simplicity meta-averages in terms of correlation are converted to standardized mean
differences (Cohenrsquos d) to be comparable to the others A minority of meta-analyses report
8 This requirement removes only two meta-analyses
POWER BIAS AND HETEROGENEITY
19
Hedgesrsquo g correction of standardized mean differences (SMD) for degrees of freedom We make
no conversion between Cohenrsquos d and Hedgesrsquo g because it does not make a practical difference
to any of our calculations
To highlight the types of meta-analytic studies included in our survey and to discuss some
of the issues that naturally arise we use two of these 61 Psychological Bulletin papers North and
Fiske (2015) ldquoModern attitudes toward older adults in the aging world A cross-cultural meta-
analysisrdquo and Williams and Tiedens (2016) ldquoThe subtle suspension of backlash A meta-analysis
of penalties for womenrsquos implicit and explicit dominance behaviorrdquo Williams and Tiedens (2016)
report six separate meta-analyses of lsquobacklashrsquo to womenrsquos dominance behavior and all six are
included in our survey of 200 meta-analyses Three of these meta-analyses concern the simple
effect of gender from dominance behavior on likability competence and lsquodownstreamrsquo outcomes
such as hireability The other three meta-analyses involve the interaction of gender and dominance
on these same three types of outcome measures Williams and Tiedens (2016) include a mix of
experimental and correlational studies but most (85) are experimental Because all six separate
meta-analyses are reported and discussed by Williams and Tiedens (2016) all six are included in
our survey
In contrast North and Fiske (2015) report only one meta-analysis of observational studies
about East-West attitudes towards older adults North and Fiske (2015) combined quantitative
outcomes involving attitude measures on ageism the aging process perceived wisdom warmth
etc as well as behavior-based measures from contact with older adults (p 999) Clearly North
and Fiske (2015) thought these different outcomes measures to be sufficiently similar or
homogeneous to be compared and treated as the same phenomenon However like most meta-
POWER BIAS AND HETEROGENEITY
20
analytic studies in psychology North and Fiske (2015) also conduct a moderator analysis that
investigated the effect of different outcomes measures among others9
It is important to note that we do not choose the level of aggregation of the meta-analyses
that are included on our survey Rather in all cases we follow the professional judgement of
experts in these specific areas of psychological research In the example of gender and dominance
research Williams and Tiedens do not judge that the effects on likeability competence and
downstream outcomes to be sufficiently homogeneous to be analyzed together It seems sensible
that any measure of likeability for example reflects the same phenomenon as any other measure
of likeability when evaluating the effects of gender and dominance Regardless the judgment
about where to draw the line is better made by those experts who have read coded summarized
and analyzed the entire relevant research literature(s)mdashWilliams and Tiedens in this case
Similarly Williams and Tiedens (2016) consider interaction effects to be too different from the
simple effects and from each other to be aggregated Because these are different psychological
phenomenon containing non-overlapping effect sizes we include these interaction studies as well
This issue is potentially important because the level of aggregation of the meta-analyses may have
implications about how much heterogeneity is found The broader more encompassing the level
of aggregation the higher one would expect heterogeneity to be
Meta-Estimates of lsquoTrue Effectrsquo
To be both conservative and robust we use three meta-estimators of lsquotruersquo effect because
the meta-estimate that one chooses might in some individual cases make a practically notable
9 Separate meta-analyses cannot be generally constructed for all reported moderator variables in these meta-analysis studies thus we do not include further subdivided moderator meta-analyses Often meta-regression is used for moderator analysis and only summary results are reported Even when separate moderator subsets are investigated it is often the case that insufficient information is reported for us to make these separations
POWER BIAS AND HETEROGENEITY
21
difference in how a given area of research is characterized We investigate three reasonable
alternative proxies for lsquotruersquo effect drawn from all the reported results in a given research subject
to be sure that our survey results are in fact robust to the chosen meta-method of estimating effect
and also to potential selective reporting bias
To be clear there is no perfect estimate of the lsquotruersquo effect size (or the mean of the
distribution of true effect sizes) when some authors reviewers or editors preferentially select
statistically significant effects (Stanley 2017 Stanley Doucouliagos amp Ioannidis 2017) With
selective reporting bias (aka publication bias the file drawer problem small-sample bias and p-
hacking) all meta-estimates are biased because the data from which they are calculated are
themselves biased to an unknowable degree However a series of statistical simulation studies
have documented how some estimators are more biased than others when there is selective
reporting bias (Stanley 2008 Moreno et al 2009 Stanley amp Doucouliagos 2014 Stanley amp
Doucouliagos 2015 Stanley Doucouliagos amp Ioannidis 2017 Stanley 2017)
Conventional meta-analysis typically estimates true effects using either lsquofixed-effectsrsquo
(FE) or a lsquorandom-effectsrsquo (RE) weighted average or both (Hedges amp Olkin 1985 Cooper amp
Hedges 1994 Stanley amp Doucouliagos 2015) The lsquofixed-effectrsquo weighted average employs
optimal weights that are the same as those used by a recently proposed unrestricted weighted least
squares (WLS) weighted average (Stanley amp Doucouliagos 2015) We prefer the unrestricted
WLS version of the conventional fixed-effect meta-analysis for inferential purposes because the
unrestricted WLS weighted average automatically accounts for heterogeneity when calculating
confidence intervals or significance tests (Stanley amp Doucouliagos 2015) This WLS estimator is
POWER BIAS AND HETEROGENEITY
22
also consistently less biased than RE when there is selective reporting bias10 The point estimates
of WLS and FE must always be exactly the same thus using WLS is exactly equivalent to using
FE in our survey11
Our second estimator exploits the importance of statistical power by over-weighting the
most precise largest studies The weighted average of the adequately powered (WAAP) uses the
same formulas as does WLS (or FE) but applies it only on those estimates found to be adequately
powered relative to WLS as the proxy for true effect WAAP is more resilient to selective reporting
biases because adequately powered studies are more reliable and require fewer questionable
research practices to achieve statistical significance Simulations show that WAAP is as good as
random-effects when there are no selective reporting biases and dominates RE when there is
selective reporting for statistical significance When half of the reported experimental results have
been selected for their statistical significance WAAP consistently reduces bias on average by
50 (Stanley Doucouliagos amp Ioannidis 2017) The weakness of WAAP is that it cannot be
computed if there are no studies with adequate power a condition found in 35 of the 200 areas
of psychological research that comprise our survey Thus Stanley Doucouliagos amp Ioannidis
(2017) propose using WLS when WAAP cannot be computed giving a WAAP-WLS weighted
10 We have chosen not to use the lsquorandom-effectsrsquo weighted average to assess power because RE is widely known to be more biased than FE and thereby WLS when there is selective reporting bias (Poole amp Greenland 1999 Sutton et al 2000 Henmi amp Copas 2010 Stanley amp Doucouliagos 2014 Stanley amp Doucouliagos 2015 Stanley Doucouliagos amp Ioannidis 2017 Stanley 2017) WLS and FE give less weight than RE to small-sample studies where selective reporting is likely to be the most severe In the aggregate giving more weight to the largest studies and less weight to small studies will reduce selective reporting bias if it is present and is statistically sensible even when it is not Besides WLS estimates remain practically as good as or better than conventional lsquorandom-effectsrsquo meta-analysis when there is no selective reporting for statistical significance (Stanley amp Doucouliagos 2015 Stanley Doucouliagos amp Ioannidis 2017) 11 For those readers who wish to know how to calculate WLSrsquos standard error or confidence interval please consult Stanley amp Doucouliagos (2015) and Stanley Doucouliagos amp Ioannidis (2017) However any basic regression routine will automatically calculate our unrestricted WLS weighted average when one uses the standardized effect size (effect size divided by it standard error) as the dependent variable and precision (1SE) as the independent variable with no intercept Nothing else is needed
POWER BIAS AND HETEROGENEITY
23
average In the below assessments of power and bias WAAP-WLS is the second approach that we
employ WAAP-WLS has the added value of forcing meta-analysts to seriously consider and
report the statistical powers found in their area of research12
WLS and WAAP-WLS passively moderate selective reporting bias In contrast simple
meta-regression models have been shown to reduce selective reporting bias more aggressively
when it is present (Stanley 2005 Stanley 2008 Moreno et al 2009 Stanley amp Doucouliagos
2014 Stanley amp Doucouliagos 2015 Stanley amp Doucouliagos 2017 Stanley Doucouliagos amp
Ioannidis 2017 Stanley 2017) The precision-effect test-precision effect estimate with standard
error (PET-PEESE) is a conditional estimate of average effect from simple WLS meta-regressions
of each estimated effect size on its standard error (PET) or alternatively on its variance
(PEESE)mdashStanley amp Doucouliagos (2014) When only statistically significant positive results
are reported selective reporting bias is known to be equal to the reported estimatersquos standard error
times the inverse Millsrsquo ratio (Stanley amp Doucouliagos 2014 p 61) The inverse Millsrsquo ratio is a
complex function of the true effect and the standard error which Stanley and Doucouliagos (2014)
approximate by a restricted polynomial function of the standard error (PEESE) When the true
effect is zero it can also be shown mathematically that this complex function collapses to a linear
relation with standard error giving PET (Stanley amp Doucouliagos 2014) A series of statistical
simulation studies documents how PET-PEESE often greatly reduces selective reporting bias and
is preferable to conventional meta-analysis methods and to the lsquotrim-and-fillrsquo publication bias
correction algorithm (Stanley 2008 Moreno et al 2009 Stanley amp Doucouliagos 2014 Stanley
amp Doucouliagos 2017 Stanley Doucouliagos amp Ioannidis 2017 Stanley 2017) PET-PEESE
provides a more aggressive approach to selective reporting bias than any simple weighted average
12 It is our belief that all meta-analyses should report typical power as one objective metric of research quality
POWER BIAS AND HETEROGENEITY
24
but it too has limitations overcorrecting for publication bias in some cases (Stanley 2017 Stanley
Doucouliagos amp Ioannidis 2017 Stanley 2017)13
To recap we calculate power and bias in a robust yet conservative manner by employing
three proxies of lsquotruersquo average effect size (1) the WLS unrestricted weighted average with point
estimates equivalent to the fixed-effect (2) the weighted average of the adequately powered
(WAAP-WLS) and (3) the PET-PEESE meta-regression reduction of selective reporting bias
Two of these approaches (WLS and WAAP-WLS) are quite lsquoconservativersquo in the sense that they
are known to overestimate true effect if there is any type of selective reporting bias lsquoConservativersquo
in this context means they give the benefit of doubt to the psychological research record as reported
and are likely to overestimate psychological researchrsquos power on average PET-PEESE on the
other hand more aggressively attempts to identify and filter out selective reporting bias thus it is
possible to underestimate true effect and thereby underestimate statistical power in some cases
(Stanley 2017) Because our survey is merely descriptive we focus on the median powers across
reported effect sizes research topics and also across these three estimation approaches to the
average true effect size The median of these three will thus be conservative and tend to
overestimate the quality of psychological research14
Assessing adequate power
13 We do not use Simonsohn Nelson amp Simmonsrsquos (2014) lsquop-curversquo correction for lsquop-hackingrsquo Recently several papers establish that the p-curve approach is biased and unreliable when there is either heterogeneity misspecification biases or when some insignificant studies are reported (Bruns amp Ioannidis 2016 McShane Boumlckenholt amp Hansen 2016 van Aert et al 2016) Such conditions are ubiquitous in the social sciences For example we find that the typical heterogeneity variance among the 200 meta-analyses that we survey is nearly 3 times larger than the corresponding random sampling variance That is 74 of the observed variation of reported research results from study to study is typically due to actual differences in the true effect (heterogeneity) or to differential bias in either case overwhelming the p-curversquos assumed pattern of p-values from sampling errors alone 14 Our overall survey results do not depend on the accuracy or validity of PET-PEESE We include PET-PEESE only for the sake of robustness to see what if any difference might result when a more aggressive approach to reducing selective reporting biased is used Below we find that it makes little difference
POWER BIAS AND HETEROGENEITY
25
With the WLS WAAP-WLS and PET-PEESE estimates of the lsquotruersquo effect for a given
area of research adequate power is easy to assess We assume the null hypotheses are two tailed
with a 5 significance level and we accept Cohenrsquos 80 as the definition of adequate power
These conventions for Type I and Type II errors imply that the lsquotruersquo effect needs to be equal to or
greater than 28 standard errors in absolute magnitude if power is to reach 80 This value of 28
is the sum of 196 and 084 where 196 is the minimum number of standard errors from zero that
an observed effect must fall to be rejected with a 5 significance level and 084 is the number of
additional standard errors that the true effect must fall from zero such that 80 of the distribution
of the observed effect is in the rejection regionmdashsee Figure 1 Hence for a study to have adequate
power its standard error needs to be smaller than the absolute value of the underlying mean lsquotruersquo
effect divided by 28 All that remains to assess adequate power retrospectively are (1) the values
of the standard error and (2) an estimate (or estimates) of the lsquotruersquo effect If the standard error of
a study is less than the absolute value of an estimate lsquotruersquo effect (from WLS WAAP-WLS or
PET-PEESE) divided by 28 we know that this study is adequately powered to detect a lsquotruersquo
effect equal or greater than this estimate Median power for a given area of research can then be
calculated from the cumulative normal probability of the difference between 196 and the absolute
value of an estimate of the true effect divided by the median standard error Because our survey
is merely descriptive we focus on the median powers across reported effect sizes areas of
research and also across these three estimation approaches to the average true effect size The
median of these estimation approaches will thus be conservative and tend to overestimate the
quality of psychological research
POWER BIAS AND HETEROGENEITY
26
Assessing residual selective reporting bias
If an area of research is selectively reporting effect size to be statistically significant in a
direction consistent with the prevailing psychological theory then the average reported effect will
on average have a larger magnitude than the true effect (whether or not prevailing psychological
theory suggests a direct or an inverse association) As before we can use these meta-averages
WLS WAAP-WLS and PET-PEESE as proxies for lsquotruersquo effect and then compare them to
average reported effect for an assessment of residual reporting bias Needless to say each reported
estimate is subject to random sampling error and will be sometimes larger and sometimes smaller
than the mean true effect Such differences cannot be regarded as lsquobiasrsquo but merely as sampling
or estimation errors However when there is a systematic trend for the unadjusted simple average
to be larger than a meta-average known to be less biased when there is selective reporting bias
then we can regard the difference between the absolute value of the simple mean and the absolute
value of WLS or WAAP-WLS as the lower limit of bias when it persists consistently over hundreds
of separate areas of research Using this approach Ioannidis Stanley amp Doucouliagos (2017) find
that the typical reported estimate in economics is twice as large or larger than either WAAP or
PET-PEESE In sharp contrast our survey of psychology finds on average only a small amount
of consistent exaggeration or overall selective reporting bias
Results
Among these 200 areas of psychological research containing 12065 estimated effect the
average effect size is 0389 expressed as the median of average standardized mean differences or
0191 as a correlation coefficient This overall effect size is nearly the same as the average of the
first 100 years of social psychology (r = 021) uncovered by Richard Bond amp Stokes-Zoota
POWER BIAS AND HETEROGENEITY
27
(2003) The typical standard error is 0104 expressed as a correlation 021 when represented by
a standardized mean difference (SMD) The p-value produced by these averages is a little larger
than the conventional 05 level Other researchers across several disciplines have found that that
p-values tend to lump up at or just below 05 (Gerber amp Malhotra 2008 Brodeur Sangnier amp
Zylberberg 2016) Contrary to recent concerns about publication bias questionable research
practices and null hypothesis significance testing we find that the typical psychological research
study is statistically insignificant at the conventional 05 level of significance
Table 1 reports the median absolute value of the average reported effect size from these
200 meta-analyses Here all effect sizes are first converted to standardized mean differences
(SMD) to be comparable However an interesting pattern emerges when these 200 meta-analyses
are divided by the types of effect sizes that are commonly reported correlation vs SMD The
typical effect size found among the 108 lsquocorrelation-basedrsquo meta-analyses in our survey (0458 in
SMD units) is 57 larger than those meta-analyses measured by SMDs (0291)15
Power
The median of the percent of reported effects that are adequately powered across these 200
areas of research are (1) 77 when the unrestricted WLS (or fixed effect) weighted average is
used to represent the mean of the true effects distribution (2) 71 when WAAP-WLS proxies for
lsquotruersquo effect and (3) 91 if PET-PEESE substitutes for true effect Figure 2 displays the
distributions of the proportion of studies that are adequately powered across these 200 areas of
15 We thank Frank Schmidt for pointing out that technically only point-biserial correlations can be converted to Cohenrsquos d Ceteris paribus other correlations will be larger than the point-biserial correlation due to the latterrsquos restricted range Thus a small part of the larger effect average effect size of lsquocorrelation-basedrsquo meta-analyses might be due to the conversion of all correlations to Cohenrsquos d Because these 108 lsquocorrelation-basedrsquo meta-analyses often contain an undisclosed mix of correlation types we cannot fully correct this small bias However as we discussed above none of our calculations of power heterogeneity or bias depend in any way on the transformation of correlations to standardized mean differences
POWER BIAS AND HETEROGENEITY
28
research Clearly underpowered studies dominate psychological research But how underpowered
are they
We also calculate the median powers for each of these 200 areas of research The typical
power of psychological research is around 36 364 based on WLS 331 based on WAAP-
WLS and 36 based on PET-PEESE16 Figure 3 shows the distribution of median powers across
these 200 areas of research Note their striking shapes The two most frequent categories are the
lowest (0-10) and the highest (over 90) Even though typical areas of research are quite
inadequately powered as measured by median power approximately one-fifth of these 200 areas
of psychological research are quite highly-powered Between 19 and 23 have average statistical
power 90 or highermdashsee Figure 3 It should not be surprising that some areas of research have
high power Aside from sample size statistical power depends on the underlying true effect size
and some psychological phenomena have large effects When WAAP-WLS is used to estimate
true effect one-third of these 200 areas of psychological research (32) have lsquolargersquo or lsquomediumrsquo
effect sizes defined as |WAAP-WLS| gt 05 SMD Even rather modest sample sizes will estimate
large effects powerfully
As before we find striking difference between correlation-based meta-analyses and SMD-
based meta-analyses Table 1 breaks down the median proportion of studies that are adequately
powered and the median power by type of effect size Those areas of psychological research that
predominately report standardized mean differences (SMDs) are highly under-powered typically
99 are underpowered compared to 67 to 76 for correlation-based meta-analyses The median
16 This is somewhat less than a recent survey Fraley amp Vazire (2014) which found a median power to detect a correlation of 02 to be 49 among top social-personality journals for the years 2006-2010 But then Fraley amp Vazire (2014) calculate prospective rather than retrospective power and their sampling frame is different than ours Thus we would expect some differences especially when considering that our median power calculations reflect both the observed effect size of each area of research and the distribution of statistical power within an area of research
POWER BIAS AND HETEROGENEITY
29
statistical power in SMD meta-analyses is between 17 to 23 For correlation-based research
typical power is nearly three times highermdash58 to 61
Residual selective reporting bias
Recall that residual reporting bias may be calculated as the difference between the absolute
value of the simple mean reported effect and the absolute value of one of our less vulnerable
proxies for true effectmdashWLS WAAP-WLS or PET-PEESE We find only small amounts of
residual reporting bias in psychological research 8 based on WLS 12 based on WAAP-WLS
and 15 based on PET-PEESE Thus our survey identifies only a small systematic exaggeration
overall
There are some important qualifications to make about this finding First all these
estimates are themselves biased and two of them consistently underestimate residual bias when
there is selective reporting (Stanley and Doucouliagos 2014 Stanley and Doucouliagos 2015
Stanley et al 2017 Stanley 2017) Second a notable proportion of psychology might still be
affected by selective reporting bias even if the median amount of exaggeration is relatively small
275 (or 55 areas of research) find evidence of some type of selective reporting or small-sample
bias using the Egger test for funnel plot asymmetry and this is likely to be an under-estimate of
the incidence of these biases because the Egger test is known to have low power (Egger et al
1997 Stanley 2008) Third we again find notable differences between types of effect sizes
reported by meta-analysts When using WLS as a proxy for the true effect we find that the simple
mean of reported SMDs is now exaggerated by 13 on average by 20 if WAAP-WLS
substitutes for true effect and by 30 relative to the median absolute value of PET-PEESE
POWER BIAS AND HETEROGENEITY
30
Heterogeneity
The median percent of the observed variation of reported effect sizes within a given area
of research that is attributed to heterogeneity (I2) is 74 This means that the variance among lsquotruersquo
effects is nearly 3 times larger than the reported sampling variance According to Pigottrsquos (2012)
guidelines for small (25) medium (50) and large (75) heterogeneity typical areas of research
have nearly lsquolargersquo excess heterogeneity Yet this level of heterogeneity appears to be the norm
for research in psychology For example van Erp et al (2017) extracted estimates of heterogeneity
from 705 meta-analyses published in Psychological Bulletin between 1990 and 2013 and found
that the median reported I2 = 7062 (interquartile range [3324 8741]) However I2 is a
relative measure of heterogeneity and does not reflect the variation in true effect as measured in
units of SMDs When our median I2 is applied to the typical area of research the standard deviation
among true effects is 0354 SMD and the standard deviation from one study to the next due to both
heterogeneity and sampling error becomes 0412 larger than the typical reported effect size 0389
lsquoExperimentalrsquo vs lsquoobservationalrsquo research
As a post hoc secondary analysis17 we examined whether the systematic differences
between SMD-based and correlation-based meta-analyses are due to experimental design
lsquoexperimentalrsquo vs lsquoobservationalrsquo Unfortunately this differentiation is not perfect Many meta-
analyses contain a mix of experimental and observational research designs at the study level For
example Williams and Tiedens (2015) meta-analysis of the effects of gender and dominance
17 Investigating these differences was not part of our pre-analysis plan Anonymous reviewers asked that we code for experimental design and report the differences
POWER BIAS AND HETEROGENEITY
31
behavior includes 97 experimental studies (85) where dominance behavior was somehow
manipulated and 17 purely observational studies
Because a substantial percent (424) of those meta-analyses that report effect sizes in
terms of SMD are lsquoobservationalrsquo and 314 of correlation-based meta-analyses are
lsquoexperimentalrsquo there is only small correlation (phi=0263 plt001) between experimental design
(1 if primarily experimental 0 elsewhere) and effect type (1 if SMD 0 for correlation) However
we do see some interesting differences in power and heterogeneity by experimental design First
there is a difference between heterogeneity as measured by I2 (plt01) The median I2 for
experimental research is 68 vs 76 for observational designs But I2 is a relative measure of
heterogeneity with a non-symmetric distribution To correct for I2rsquos nonstandard distribution we
use Abramowitz and Stegunrsquos (1964) normal approximation for the chi-square distribution applied
to the Cochran Q-test for heterogeneity Doing so causes this difference in relative heterogeneity
to be only marginally larger than statistical noise (p=045) Additionally experimental research
designs have larger sampling errors and lower power Typical sampling errors are 026 vs 019
measured as median SEs in units of SMD Table 2 reports the median proportion of studies that
are adequately powered and the median of median powers by type of research design Even though
there is only a small association between experimental design and effect type we find a similar
pattern among the typical levels of power for experimental design that we see for effect type
confirming the concerned expressed by dozens of researchers over the years that scarcely any
experimental studies are adequately powered All of these results about lsquoexperimentalrsquo vs
lsquoobservationalrsquo research designs should be interpreted with caution because as mentioned they
are conducted post hoc
POWER BIAS AND HETEROGENEITY
32
Discussion
Our survey of 12065 estimated effects sizes from nearly 8000 studies in 200 meta-
analyses reveals that the typical effect size is 0389 SMD with a median standard error of 021 We
also find low statistical power small residual selection bias and high levels of heterogeneity The
central purpose of our review is to assess the replicability of psychological research through meta-
analysis and thereby better understand recent failures to replicate Our findings implicate low
statistical power and high levels of heterogeneity as the primary causes of lsquofailedrsquo replications
however defined
We find that only a small proportion of psychological studies are adequately powered
approximately 8 and the median power is about 36 across three proxies for the mean lsquotruersquo
effect18 What does this imply about replication Our survey predicts therefore that replication
study with a typical sample size will have only a 36 chance of finding a statistically significant
effect in the same direction as some previous study and this value is exactly the same percent of
replications found to be statistically significant in the same direction by the Open Science
Collaboration (Open Science Collaboration 2015 Table 1) Thus when replication is viewed in
terms of sign and statistical significance it is no wonder that rates of replication are considered
low in psychology research
Improving replication as noted by others (eg Maxwell et al 2015) would seem to be a
matter of conducting both initial studies and replications with larger samples reducing sources of
non-sampling error (eg measurement error Stanley amp Spence 2014) and focusing on larger
18 To be more precise 36 is the median among the medians of medians
POWER BIAS AND HETEROGENEITY
33
effects Because researchers work with limited resources and knowledge these obvious
recommendations are extremely difficult to implement in most cases
More practical recommendations have centered on redefining replication success and
adjusting researchersrsquo expectations about non-significant replications For example Peng et al
(2016) examined the data from the Reproducibility Project Psychology (Open Science
Collaboration 2015) in terms of prediction intervalsmdashconfidence intervals that account for
variability in both the original and replication studymdashand found that 77 of the replication
attempts were consistent with the original findings This finding seems to be in apparent contrast
to the highly publicized result that only 36 of the replications in those data were statistically
significant but completely in accord with the less well-publicized result that meta-analytically
combining the replications with the original studies resulted in 70 statistical significance (Open
Science Collaboration 2015) Along similar lines several authors have argued for assessing
replication primarily within the context of meta-analysis (eg Braver Thoemmes amp Rosenthal
2014 Stanley amp Spence 2014 Fabrigar amp Wegener 2016) Doing so could shift the evaluation
of success vs failure of replications to a judgement about the degree of information that new data
add to our knowledge base (Peng et al 2016)
Consistent with a previous survey of heterogeneity (van Erp et al 2017) and several
findings from recent multi-site replication attempts (Hagger amp Chatzisarantis 2016 Eerland et al
2016 Klein et al 2015) our survey reveals clear evidence for high levels of heterogeneity in
research in psychology We find that heterogeneity accounts for nearly three-fourths of the
observed variation among reported effects (ie median I2 =74) When applied to the median
reported standard error (measured in terms of SMD) this high I2 implies that the typical standard
deviation of heterogeneity is equal to 0354 (again in units of SMDs) Importantly even a
POWER BIAS AND HETEROGENEITY
34
replication study with millions of subjects will remain vulnerable to heterogeneity among lsquotruersquo
effects When we apply our surveyrsquos typical heterogeneity to its typical effect size it is unlikely
that any replication will be lsquosuccessfulrsquo For example if our median effect size 0389 is the mean
of the distribution of true effects then there is a 298 probability that the largest possible
replication study will find a negligible zero or opposite-signed effect The probability is 324
that this ideal replication (ie ninfin) finds a small effect and it is 255 for a medium-sized
effectmdashusing Cohenrsquos guidelines of 02 05 and 08 Even though 0389 is considered a lsquosmallrsquo
effect by these guidelines the probability that a very large replication finds a large effect remains
non-negligible at 123 Thus it is quite likely 68 that an ideal replication will not reproduce
a small effect when the mean of the distribution true effects is equal to our median average effect
size The wide distribution of true effect sizes that our survey finds is also similar to what Open
Science Collaboration observed when attempting to replicate 100 psychological experimentmdashsee
Figure 3 in the Open Science Collaboration (2015)
No matter what the mean of the distribution of true effect sizes might be nor how large the
replication study is it is unlikely that a replication will find an effect size close to what was found
previously when there is this much heterogeneity If a lsquosuccessful replicationrsquo is defined as finding
an effect size similar to what some previous study or studies have found (say for example to
within + 01 or within + 02 SMD) then there will always be a sizeable chance of unsuccessful
replication no matter how well conducted or how large any of the studies are For example
suppose that two studies are conducted with nearly infinite sample sizes and therefore infinitesimal
sampling error Heterogeneity of the size that our survey finds implies that the probability that
these two ideal studies find effect sizes that are within +01 from one another is 158 and 311
to within +02 Indeed there remains a 50 or greater probability of a lsquofailed replicationrsquo whenever
POWER BIAS AND HETEROGENEITY
35
the acceptable difference for a successful replication is set at less than 035 SMD Needless to say
if we have less-than-ideal sample sizes the resulting added sampling error will reduce the
probability of a successful replication further Thus high heterogeneity further explains the failure
of the Open Science Collaboration (2015) to find reliable indicators of replication success
There are important caveats to these calculations of replication success that need to be
mentioned First there is a wide distribution of observed heterogeneity among these areas of
psychological researchmdashsee Figure 4 Twenty-two percent have I2s that are less than 50 while
47 have I2 values 75 or higher and one out of seven have excess heterogeneity of 90 or more
Thus successful replication will be more likely in some areas of research but much less likely in
others Second these calculations assume that the typical heterogeneity observed in this research
record is entirely heterogeneity among lsquotruersquo effects that is variation beyond the control of
researchers Because exact replication is rare in psychology some of this observed heterogeneity
will be due to variation in experimental conditions measures methods and the characteristics of
the population from which the samples are drawn Thus a careful exact replication study could
avoid a notable amount of this variation in expected effect by carefully duplicating all of the
controllable features of the experimental design execution and evaluation However those large-
scale efforts to control these controllable research dimensions still find that notable heterogeneity
remains (Hagger et al 2016 Eerland et al 2016 Klein et al 2015) Moreover if half the
observed heterogeneity variance is due to differences that are under the control of the researcher19
then our estimate of the typical standard deviation due this uncontrollable heterogeneity among
true effects would be reduced to 025 In which case the probability that the largest possible
19 The typical heterogeneity found by two large replication studies that attempted to be as exact as possible is larger than half of the median heterogeneity that our survey finds (Hagger et al 2016 Eerland et al 2016)
POWER BIAS AND HETEROGENEITY
36
replication study will find a negligible zero or opposite-signed effect declines to 22 28 for a
medium effect and it will find a large effect only about 5 of the time Even if half of the observed
heterogeneity among reported effects is under the researcherrsquos control the probability that any
replication effort successfully replicates a small effect (recall 0389 is our surveyrsquos median effect
size) remains less than 50
Conclusions
Our survey of 12065 estimated effect sizes from nearly as many studies and 8000 papers
finds that lsquofailedrsquo replicationsmdashdefined here in terms of null hypothesis significance testingmdash are
to be expected at a rate consistent with the widely publicized the Reproducibility Project
Psychology (Open Science Collaboration 2015) Like many other researchers we find that
statistical power is chronically low in research in psychology (Cohen 1962 Cohen 1977
Sedlmeier amp Gigerenzer 1989 Rossi 1990 Maxwell 2004 Pashler amp Wagenmakers 2012
Fraley amp Vazire 2014 Tressoldi amp Giofreacute 2015) Unlike this previous research however our
survey reveals a more severe challenge for replication High levels of heterogeneity are evidently
the norm in psychology (median I2 =74) As discussed above heterogeneity this large makes
successful replication difficult whether defined in terms of hypothesis testing or estimation
precision This high heterogeneity will of course be due in part to methodological differences
between the different studies in each of the 200 meta-analyses that we survey However data from
multi-site registered replication efforts further suggest that when obvious methodological
differences are removed (ie when lsquoexactrsquo replications are conducted) heterogeneity is not
reduced to negligible levels In other words it is unrealistic to believe that variance in
POWER BIAS AND HETEROGENEITY
37
psychological phenomena studied can always be tightly controlled or reduced to practically
insignificant levels
Perhaps more surprising is our finding that there is relatively small exaggeration or overall
selective reporting bias in recent psychological research This is in contrast to the view that
publication bias and questionable research practices are the primary cause of failed replications
Of course as mentioned above there are good reasons to be cautious in applying this hopeful
result to any individual area of research In particular 275 of these areas of research produce a
significant Eggerrsquos test for publication bias (or small-sample bias) and this test is known to have
low power Our survey merely implies that the effects of selective reporting bias (ie publication
bias small-sample biases p-hacking andor questionable research practices) have a less clear
pattern than is maybe assumed by some researchers and by what has been observed in other fields
(eg economics Ioannidis Stanley and Doucouliagos 2017)
In light of the typically high heterogeneity that we observed how should replications in
psychology be interpreted To begin it seems extremely likely that the p-value from any single
non-preregistered non-exact replication study will have nil informative value In the face of high
heterogeneity this is true regardless of the sample size of the replication because it is quite likely
that the replication study will correctly reflect a substantially different true effect than the original
study However individual non-preregistered non-exact replication studies may still contribute to
our collective knowledge when added to a carefully conducted meta-analysis or meta-regression
analysis Meta-analysis moves the focus away from the statistical significance of the single
replication study increases statistical power by pooling across studies allows one to accommodate
and reduce selective reporting bias and meta-regression analysis can use non-exact replications to
POWER BIAS AND HETEROGENEITY
38
help isolate and quantify methodological heterogeneity (eg Stanley amp Doucouliagos 2012
Braver Thoemmes amp Rosenthal 2014 Stanley amp Spence 2014 Fabrigar amp Wegener 2016)
Replication findings from multi-site pre-registered replications clearly offer a different
class of evidence from the single non-pre-registered non-exact replication Statistical power can
be maximized by the pooling of resources across research sites pre-registration is likely to greatly
reduce some types of selective reporting bias and heterogeneity due to obvious methodological
characteristics can be minimized through tightly-controlled study protocols Multi-site pre-
registered replication also allows researchers to directly isolate and quantify the specific
heterogeneity among true effects which remains after methodological heterogeneity is minimized
Such information can provide useful insights about the psychological phenomenon in question
thereby helping to guide and redirect future research and meta-regression analyses
The central implication of our survey is that typically-powered studies in most of areas of
psychology individually or when simply combined into a meta-analysis offer little information
about the magnitude or significance of the phenomenon they examine Our core recommendation
then is that researchers change their expectations about the ease with which convincing evidence
either for or against an effect can be claimed
POWER BIAS AND HETEROGENEITY
39
References
Abramowitz M and IA Stegun (eds) (1964) Handbook of Mathematical Functions with
Formulas Graphs and Mathematical Tables Washington DC US Department of
Commerce
American Psychological Association (2010) Manual of the American Psychological Association
6th ed Washington DC
Asendorpf J B Conner M De Fruyt F De Houwer J Denissen J J Fiedler K amp
Perugini M (2013) Recommendations for increasing replicability in psychology European
Journal of Personality 27(2) 108-119
Baker M (2015) Over half of psychology studies fail reproducibility test Nature News and
Comment August 27 doi101038nature201518248 accessed 8232017
Bakker M van Dijk A amp Wicherts J M (2012) The rules of the game called psychological
science Perspectives on Psychological Science 7(6) 543-554 doi
1011771745691612459060
Bakker M Hartgerink C H Wicherts J M amp van der Maas H L (2016) Researchersrsquo
intuitions about power in psychological research Psychological Science 27(8) 1069-1077 doi
1011770956797616647519
Bohannon J (2015) Reproducibility Many psychology papers fail replication test Science
349910ndash911
Braver SL Thoemmes FJ amp Rosenthal R (2014) Continuously cumulating meta-analysis
and replicability Perspectives on Psychological Science 9 333ndash342 doi
1011771745691614529796
Brodeur A Leacute M Sangnier M amp Zylberberg Y (2016) Star Wars The empirics strike back
American Economic Journal Applied Economics 8 1ndash32 doi 101257app20150044
Bruns S B amp Ioannidis J P A (2016) p-curve and p-hacking in observational research PLoS
ONE 11 e0149144 doi101371journal pone0149144
Button K S Ioannidis J P Mokrysz C Nosek B A Flint J Robinson E S amp Munafograve M
R (2013) Power failure why small sample size undermines the reliability of neuroscience
Nature Reviews Neuroscience 14(5) 365-376 doi101038nrn3475
Cohen J (1962) The statistical power of abnormal-social psychological research A review
Journal of Abnormal and Social Psychology 65 145ndash153
POWER BIAS AND HETEROGENEITY
40
Cohen J (1965) Some statistical issues in psychological research In (BB Wolman ed)
Handbook of Clinical Psychology New York McGraw-Hill pp 95ndash121
Cohen J (1977) Statistical power analysis for the behavioral sciences (2nd ed) New York
Academic Press
Cohen J (1992) A power primer Psychological Bulletin 112 155ndash159
Cooper H M amp Hedges LV (1994) (eds) Handbook of Research Synthesis New York Russell
Sage
Dreber A Pfeiffer T Almenberg J Isaksson S Wilson B Chen Y amp Johannesson M
(2015) Using prediction markets to estimate the reproducibility of scientific research
Proceedings of the National Academy of Sciences 112(50) 15343-47
Eerland A Sherrill A M Magliano J P Zwaan R A Arnal J D Aucoin P amp Prenoveau
J M (2016) Registered replication report Hart amp Albarraciacuten (2011) Perspectives on
Psychological Science 11(1) 158-171 doi 1011771745691615605826
Egger M Smith G D Schneider M amp Minder C (1997) Bias in meta-analysis detected by a
simple graphical test British Medical Journal 315 629ndash634 doi101136bmj3157109629
Engber D (2015) Cover Story Everything is crumbling Slate March 6 Accessed Dec 19
2016
Erica C Y Sprenger A M Thomas R P amp Dougherty M R (2014) When decision heuristics
and science collide Psychonomic Bulletin amp Review 21(2) 268-282 doi103758s13423-013-
0495-z
Fabrigar L R amp Wegener D T (2016) Conceptualizing and evaluating the replication of
research results Journal of Experimental Social Psychology 66 68-80 doi
101016jjesp201507009
Fanelli D (2010) ldquoPositiverdquo results increase down the hierarchy of the sciences PLoS One
5 e10068 doi101371journalpone0010068
Fanelli D Costas R amp Ioannidis J P (2017) Meta-assessment of bias in science Proceedings
of the National Academy of Sciences 201618569 doi101073pnas1618569114
Fiedler K amp Schwarz N (2016) Questionable research practices revisited Social Psychological
and Personality Science 7(1) 45-52 doi 1011771948550615612150
POWER BIAS AND HETEROGENEITY
41
Fraley R C amp Vazire S (2014) The n-pact factor Evaluating the quality of empirical journals
with respect to sample size and statistical power PLoS ONE 9 e109019
doi101371journalpone0109019
Fraley R C amp Marks M J (2007) The null hypothesis significance testing debate and its
implications for personality research In R W Robins R C Fraley amp R F Krueger (Eds)
Handbook of research methods in personality psychology (pp149ndash169) New York Guilford
Franco A Malhotra N amp Simonovits G (2016) Underreporting in psychology experiments
Evidence from a study registry Social Psychological and Personality Science 7(1) 8-12 doi
1011771948550615598377
Gerber A amp Malhotra N (2008) Do statistical reporting standards affect what is published
publication bias in two leading political science journals Quarterly Journal of Political
Science 3 313-326 doi 10156110000008024
Hagger M S Chatzisarantis N L D Alberts H Anggono C O Birt A Brand R amp
Cannon T (2016) A multi-lab preregistered replication of the ego-depletion effect
Perspectives on Psychological Science 11 546ndash573 doi 1011771745691616652873
Hedges L V amp Olkin I (1985) Statistical Methods for Meta-Analysis Academic Press Orlando
Henmi M amp Copas J B (2010) Confidence intervals for random effects meta-analysis and
robustness to publication bias Statistics in Medicine 29 2969ndash2983 doi 101002sim4029
Higgins J P T amp Thompson S G (2002) Quantifying heterogeneity in meta-analysis Statistics
in Medicine 21 1539ndash1558 doi 101002sim1186
Hoenig J M amp Heisey D M (2001) The abuse of power The pervasive fallacy of power
calculations for data analysis American Statistician 55 19ndash24 doi
101198000313001300339897
Inthout J Ioannidis J P A amp Borm G F (2012) Obtaining evidence by a single well-powered
trial or several modestly powered trials Statistical Methods in Medical Research
httpsmmsagepubcomcontentearly201209240962280212461098abstract (Accessed
Aug 16th 2015)
Ioannidis J P A (2005a) Contradicted and initially stronger effects in highly cited clinical
research Journal of the American Medical Association 294 218-228
doi101001jama2942218
POWER BIAS AND HETEROGENEITY
42
Ioannidis J P A (2005b) Why most published research findings are false PLoS Medicine 2
e124 doi101371journalpmed0020124
Ioannidis J P A (2013) Clarifications on the application and interpretation of the test for excess
significance and its extensions Journal of Mathematical Psychology 57 184-187 doi
101016jjmp201303002
Ioannidis J P A Hozo I and Djulbegovic B (2013) Optimal type I and type II error pairs when
the available sample size is fixed Journal of Clinical Epidemiology 66 903-910 doi
101016jjclinepi201303002
Ioannidis J P A Stanley T D amp Doucouliagos C(H) (2017) The power of bias in economics
research The Economic Journal October also as SWP Economics Series 20162
httpwwwdeakineduau__dataassetspdf_file00074777632016_1pdf Deakin University
Australia [Accessed on 27 April 2017]
John L K Loewenstein G amp Prelec D (2012) Measuring the prevalence of questionable
research practices with incentives for truth telling Psychological Science 23 524-532 doi
1011770956797611430953
Klein R A Vianello M Hasselman F Alper S Aveyard M Axt J R amp Nosek B A
(2015) Many Labs 2 Investigating variation in replicability across sample and setting
Manuscript in preparation
Kuumlhberger A Fritz A amp Scherndl T (2014) Publication bias in psychology a diagnosis based
on the correlation between effect size and sample size PloS one 9(9) e105825 doi
101371journalpone0105825
Lakens D (2015) On the challenges of drawing conclusions from p-values just below 005 Peer
J 3e1142 doi 107717peerj1142 PMID 26246976
LeBel E P Borsboom D Giner-Sorolla R Hasselman F Peters K R Ratliff K A amp
Smith C T (2013) PsychDisclosure org Grassroots support for reforming reporting standards
in psychology Perspectives on Psychological Science 8(4) 424-432 doi
1011771745691613491437
LeBel E P Vanpaemel W McCarthy R J Earp B D amp Elson M (2017) A unified
framework to quantify the trustworthiness of empirical research Advances in Methods and
Practices in Psychological Science Retrieved from httpsosfiopreprintspsyarxivuwmr8
8232017
POWER BIAS AND HETEROGENEITY
43
Lindsay D S (2015) Replication in psychological science Psychological Science 26 1827-32
Makel M C Plucker J A amp Hegarty B (2012) Replications in psychology research How
often do they really occur Perspectives on Psychological Science 7(6) 537-542
Maxwell S E (2004) The persistence of underpowered studies in psychological research causes
consequences and remedies Psychological Methods 9 147 doi 1010371082-989X92147
Maxwell S E Lau M Y amp Howard G S (2015) Is psychology suffering from a replication
crisis What does ldquofailure to replicaterdquo really mean American Psychologist 70(6) 487-498
httpdxdoiorg101037a0039400
McShane B B amp Boumlckenholt U (2016) Planning sample sizes when effect sizes are uncertain
The power-calibrated effect size approach Psychological Methods 21(1) 47 doi
101037met0000036
McShane B B Boumlckenholt U amp Hansen K T (2016) Adjusting for publication bias in meta-
analysis An evaluation of selection methods and some cautionary notes Perspectives on
Psychological Science 11 730ndash749 doi 1011771745691616662243
Miguel E amp Christensen G (2017) Transparency reproducibility and the credibility of
economics research Journal of Economic Literature IN PRESS
Moreno S G Sutton A J Ades A E Stanley T D Abrams K R Peters J L Cooper N
J (2009) Assessment of regression-based methods to adjust for publication bias through a
comprehensive simulation study BMC Medical Research Methodology 9 2 doi
1011861471-2288-9-2
Open Science Collaboration (2015) Estimating the reproducibility of psychological science
Science 349(6251) aac4716ndashaac4716 doi101126scienceaac4716
Pashler H amp Harris C (2012) Is the replicability crisis overblown Three arguments examined
Perspectives on Psychological Science 7 531ndash536 doi 1011771745691612463401
Pashler H amp Wagenmakers E J (2012) Editorsrsquo introduction to the special section on
replicability in psychological science a crisis of confidence Perspectives on Psychological
Science 7 528ndash530 doi 1011771745691612465253
Patil P and Leek JT (2015) Reporting of 36 of studies replicate in the media
httpsgithubcomjtleekreplication_paperblobgh-pagesin_the_mediamd[Online up- dated
16-September-2015 accessed 8232017]
POWER BIAS AND HETEROGENEITY
44
Patil P Peng R D amp Leek J T (2016) What should researchers expect when they replicate
studies A statistical view of replicability in psychological science Perspectives on
Psychological Science 11(4) 539-544 doi 1011771745691616646366
Pigott T (2012) Advances in meta-analysis New York NY Springer
Poole C amp Greenland S (1999) Random-effects meta-analyses are not always conservative
American Journal of Epidemiology 150 469ndash475
Popper K (1959) The logic of scientific discovery New York NY Basic Books
Psychonomic Society (2012) New Statistical Guidelines for Journals of the Psychonomic Society
httpwwwpsychonomicorgpagestatisticalguideline (Accessed March 11th 2017)
Rossi J S (1990) Statistical power of psychological research What have we gained in 20 years
Journal of Consulting and Clinical Psychology 58 646ndash656 doi1010370022-
006X585646
Richard F D Bond C F amp Stokes-Zoota J J (2003) One hundred years of social psychology
quantitatively described Review of General Psychology 7 331ndash363
Scargle J D (2000) Publication bias The ldquoFile-Drawerrdquo problem in scientific inference Journal
of Scientific Exploration 14 91ndash106
Schmidt F L amp Hunter J E (2015) Methods of meta-analysis Correcting error and bias in
research findings 3rd ed Los Angeles CA Sage
Schmidt F L amp Oh I -S (2016) The crisis of confidence in research findings in psychology Is
lack of replication the real problem Or something else Archives of Scientific Psychology 4(1)
32ndash37 httpdxdoiorg101037arc0000029
Sedlmeier P amp Gigerenzer G (1989) Do studies of statistical power have an effect on the power
of studies Psychological Bulletin 105 309ndash316
Simmons J P Nelson L D amp Simonsohn U (2011) False-positive psychology Undisclosed
flexibility in data collection and analysis allows presenting anything as significant
Psychological Science 22(11) 1359-1366 doi 1011770956797611417632
Simonsohn U Nelson L D amp Simmons J P (2014) P-curve a key to the file drawer Journal
of Experimental Psychology General 143 534-547 doi 101037a0033242
Stanley D J amp Spence J R (2014) Expectations for replications Are yours realistic
Perspectives on Psychological Science 9 305ndash318 doi 1011771745691614528518
POWER BIAS AND HETEROGENEITY
45
Stanley T D (2008) Meta-regression methods for detecting and estimating empirical effects in
the presence of publication selection Oxford Bulletin of Economics and Statistics 70103-27
doi 101111j1468-0084200700487x
Stanley T D (2017) Limitations of PET-PEESE and other meta-analysis methods Social
Psychology and Personality Science [Epub ahead of print] doi 1011771948550617693062
Stanley T D amp Doucouliagos H(C) 2014 Meta-regression approximations to reduce publication
selection bias Research Synthesis Methods 5 60-78 doi 101002jrsm1095
Stanley T D amp Doucouliagos H(C) 2015 Neither fixed nor random Weighted least squares
meta-analysis Statistics in Medicine 34 2116-27 doi 101002sim6481
Stanley T D amp Doucouliagos H(C) 2017 Neither fixed nor random Weighted least squares
meta-regression analysis Research Synthesis Methods 8 19-42 doi 101002jrsm1211
Stanley T D Doucouliagos H(C) amp Ioannidis J P A 2017 Finding the power to reduce
publication bias Statistics in Medicine [Epub ahead of print] doi 101002sim7228
Sterling T D (1959) Publication decisions and their possible effects on inferences drawn from
tests of significance Or vice versa Journal of the American Statistical Association 54 30ndash34
Sterling T D Rosenbaum W L amp Weinkam J J (1995) Publication decisions revisited The
effect of the outcome of statistical tests on the decision to publish and vice versa American
Statistician 49 108ndash112 doi 1023072684823
Sutton A J Song F Gilbody S M amp Abrams K R (2000) Modelling publication bias in
meta-analysis A review Statistical Methods in Medical Research 9 421-445 doi
101177096228020000900503
Tressoldi P E amp Giofreacute D (2015) The pervasive avoidance of prospective statistical power
Major consequences and practical solutions Frontiers in Psychology 6 726
doi103389fpsyg201500726
van Aert R C M Jelte M Wicherts J M amp van Assen M A L M (2016) Conducting meta-
analyses based on p values Reservations and recommendations for applying p-uniform and p-
curve Perspectives on Psychological Science 11 713ndash729 doi 1011771745691616650874
van Bavel JJ Mende-Siedlecki PBrada WJ and Reinero DA 2016 Contextual sensitivity
in scientific reproducibility Proceedings of the National Academy of Sciences 113 6454ndash59
POWER BIAS AND HETEROGENEITY
46
van Erp S et al (2017) Estimates of between-study heterogeneity for 705 meta-analyses reported
in Psychological Bulletin from 1990ndash2013 Journal of Open Psychology Data 5(1) p4 DOI
httpdoiorg105334jopd33
Wicherts J M Veldkamp C L Augusteijn H E Bakker M van Aert R C amp Van Assen
M A (2016) Degrees of Freedom in Planning Running Analyzing and Reporting
Psychological Studies A Checklist to Avoid p-Hacking Frontiers in Psychology 7 doi
103389fpsyg201601832
Yuan K amp Maxwell S (2005) On the post hoc power in testing mean differences Journal of
Educational and Behavioral Statistics 30 141ndash167 doi 10310210769986030002141
POWER BIAS AND HETEROGENEITY
47
Table 1 Median Statistical Power and Average Effect Sizes
Mean Proportion with Adequate Power Median Power Type of Effect
Absolute Effect Sizes WLS WAAP-WLS PET-PEESE WLS WAAP-WLS PET-PEESE
Combined (n=200)
0389 0077 0071 0091 0364 0331 0360
Correlations (n=108)
0458 0243 0328 0272 0577 0610 0607
SMDs (n=92)
0291 0013 0000 0011 0230 0171 0170
Notes The numbers reported in the table are medians Mean absolute effect sizes are reported in this table in units of standardized mean differences (SMD) regardless of whether they were reported in the meta-analysis as correlations or as SMD WLS is the unrestricted weighted least squares weighted average WAAP-WLS is the weighted average of adequately powered effect sizes (WAAP) or WLS when there are no adequately powered studies PET-PEESE is the conditional precision-effect test-precision-effect estimate with standard error meta-regression correction for publication bias Adequate power is defined as 80 following Cohen (1977)
Table 2 Median Statistical Powers by Experimental Design Proportion with Adequate Power Median Power
Experimental Design WLS WAAP-WLS PET-PEESE WLS WAAP-WLS PET-PEESE
Observational (n=113)
0278 0259 0268 0621 0613 0585
Experimental (n=87)
0032 0000 0053 0247 0232 0236
Notes The numbers reported in the table are medians WLS is the unrestricted weighted least squares weighted average WAAP-WLS is the weighted average of adequately powered effect sizes (WAAP) or WLS when there are no adequately powered studies PET-PEESE is the conditional precision-effect test-precision-effect estimate with standard error meta-regression correction for publication bias Adequate power is defined as 80 following Cohen (1977)
Figure 1 Obtaining adequate power (80)
Notes x is distributed as a standard normal distribution N(01) 196 is the critical value for testing against 0 Figure 1 merely illustrates how the standardized mean of the sampling distribution needs to 28 standard errors away from 0 for an experiment to have adequate powermdashCohenrsquos 80 We thank Stephan Bruns for producing this graph
POWER BIAS AND HETEROGENEITY
49
Figure 2 Histograms of Adequately Powered Estimates from 200 Areas of Research
Notes WLS is the unrestricted weighted least squares weighted average WAAP-WLS is the weighted average of adequately powered effect sizes (WAAP) or WLS when there are no adequately powered studies PET-PEESE is the conditional precision-effect test-precision-effect estimate with standard error meta-regression correction for publication bias Adequate power is defined as 80 following Cohen (1977)
0
20
40
60
80
100
120N
um
ber
of M
eta-
An
alys
es
0 2 4 6 8 1Proportion of Studies Adequately Powered
WLS
0
20
40
60
80
100
120
Nu
mbe
r of
Met
a-A
nal
yses
0 2 4 6 8 1Proportion of Studies Adequately Powered
WAAP-WLS
0
20
40
60
80
100
120
Nu
mbe
r of
Met
a-A
nal
yses
0 2 4 6 8 1Proportion of Studies Adequately Powered
PET-PEESE
POWER BIAS AND HETEROGENEITY
50
Figure 3 Histograms of Median Statistical Power from 200 Areas of Research
Notes WLS is the unrestricted weighted least squares weighted average WAAP-WLS is the weighted average of adequately powered effect sizes (WAAP) or WLS when there are no adequately powered studies PET-PEESE is the conditional precision-effect test-precision-effect estimate with standard error meta-regression correction for publication bias Adequate power is defined as 80 following Cohen (1977)
0
10
20
30
40
50
60N
um
ber
of M
eta-
An
alys
es
0 2 4 6 8 1Median Statistical Power
WLS
0
10
20
30
40
50
60
Nu
mbe
r of
Met
a-A
nal
yses
0 2 4 6 8 1Median Statistical Power
WAAP-WLS
0
10
20
30
40
50
60
70
Nu
mbe
r of
Met
a-A
nal
yses
0 2 4 6 8 1Median Statistical Power
PET-PEESE
Figure 4 Histograms of I2 from 200 Areas of Research
Notes I2 is the proportion of observed variation among reported effect sizes that cannot be explained by the calculated standard errors associated with these reported effect sizes It is a relative measure of heterogeneity
0
5
10
15
20
25
30
35
40
45
0 2 4 6 8 1I-squared
Num
ber o
f Met
a-A
naly
ses
POWER BIAS AND HETEROGENEITY
52
Appendix A Studies included in the meta-meta-analysis
1 Baas M Nijstad B A Boot N C amp De Dreu C K W (2016) Mad genius revisited Vulnerability to psychopathology biobehavioral approach-avoidance and creativity Psychological Bulletin 142 668-692 doi101037bul0000049 [2]
2 Balliet D Li N P Macfarlan S J amp Van Vugt M (2011) Sex differences in cooperation A meta-analytic review of social dilemmas Psychological Bulletin 137 881ndash909 doi 101037a0025354 [1]
3 Balliet D Mulder L B amp Van Lange P A M (2011) Reward punishment and cooperation A meta-analysis Psychological Bulletin 137 594-615 doi 101037a0023489 [2]
4 Balliet D Wu J amp De Dreu C K W (2014) Ingroup favoritism in cooperation A meta-analysis Psychological Bulletin 140 1556-1581 doi 101037a0037737 [1]
5 Brewin C R (2014) Episodic memory perceptual memory and their interaction Foundations for a theory of posttraumatic stress disorder Psychological Bulletin 140 69ndash97 doi 101037a0033722 [1]
6 Byron K amp Khazanchi S (2011) Rewards and creative performance A meta-analytic test of theoretically derived hypotheses Psychological Bulletin 138 809ndash830 [1]
7 Cerasoli C P amp Nicklin J M (2014) Intrinsic motivation and extrinsic incentives jointly predict performance A 40-year meta-analysis Psychological Bulletin 140 980-1008 doi 101037a0035661 [1]
8 Chaplin T M amp Aldao A (2013) Gender differences in emotion expression in children A meta-analytic review Psychological Bulletin 139 735-765 doi 101037a0030737 [4]
9 Defoe I N Dubas JS amp Figner B (2015) A meta-analysis on age differences in risky decision making Adolescents versus children and adults Psychological Bulletin 141 48ndash84 doi 101037a0038088 [4]
10 Degner J amp Dalege J (2013) The apple does not fall far from the tree or does it A meta-analysis of parentndashchild similarity in intergroup attitudes Psychological Bulletin 139 1270ndash1304 doi 101037a0031436 [1]
11 Eastwick P W Finkel E J Luchies L B amp Hunt L L (2014) The predictive validity of ideal partner preferences A review and meta-analysis Psychological Bulletin 140 623ndash 665 doi 101037a0032432 [4]
12 Else-Quest N M Higgins A Allison C amp Morton L C (2012) Gender differences in self-conscious emotional experience Psychological Bulletin 138 947ndash981 doi101037a0027930 [5]
13 Fairbairn C E amp Sayette M A (2014) A social-attributional analysis of alcohol response Psychological Bulletin 140 1361-82 doi 101037a0037563 [4]
14 Fischer P Krueger J I Greitemeyer T Vogrincic C Kastenmuumlller A Frey D Heene M Wicher M amp Kainbacher M (2011) The bystander-effect A meta-analytic review on bystander intervention in dangerous and non-dangerous emergencies Psychological Bulletin 137 517ndash537 doi 101037a0023304 [1]
POWER BIAS AND HETEROGENEITY
53
15 Fox MC Ericsson A amp Best (2011) Do procedures for verbal reporting of thinking have to be reactive A meta-analysis and recommendations for best reporting methods Psychological Bulletin 137 316 ndash344 doi 101037a0021663 [2]
16 Fox N A You K H Bowman L C Cannon E N Ferrari P F Bakermans-Kranenburg M J Vanderwert R E amp van IJzendoorn M H (2016) Assessing human mirror activity with EEG mu rhythm A meta-analysis Psychological Bulletin 142 291ndash313 doi101037bul0000031 [2]
17 Freund P A amp Kasten N (2012) How smart do you think you are A meta-analysis on the validity of self-estimates of cognitive ability Psychological Bulletin 138 296-321 doi101037a0026556 [1]
18 Grijalva E Newman D A Tay L Donnellan M B Harms P D amp Robins R W (2015) Gender differences in narcissism A meta-analytic review Psychological Bulletin 141 261-310 doi 101037a0038231 [3]
19 Haedt-Matt A A amp Keel P K (2011) Revisiting the affect regulation model of binge eating A meta-analysis of studies using ecological momentary assessment Psychological Bulletin 137 660ndash681 doi 101037a0023660 [3]
20 Harkin B Webb T L Prestwich A Conner M Kellar I Benn Y amp Sheeran P (2016) Does monitoring goal progress promote goal attainment A meta-analysis of the experimental evidence Psychological Bulletin 142 198-229 doi 101037bul0000025 [2]
21 Houben M Van Den Noortgate W amp Kuppens P (2015) The relation between short-term emotion dynamics and psychological well-being A meta-analysis Psychological Bulletin 141 901-930 doi101037a0038822 [4]
22 Johnsen T J amp Friborg O (2015) The effects of cognitive behavioral therapy as an anti-depressive treatment is falling A meta-analysis Psychological Bulletin 141 747-768 [2]
23 Karlin B Zinger J F amp Ford R (2015) The effects of feedback on energy conservation A meta-analysis Psychological Bulletin 141 1205-1227 doi 101037a0039650 [1]
24 Kim S Thibodeau R amp Jorgensen R S (2011) Shame guilt and depressive symptoms A meta-analytic review Psychological Bulletin 137 68 ndash96 doi 101037a0021466 [2]
25 Klahr A M amp Burt S A (2014) Elucidating the etiology of individual differences in parenting A meta-analysis of behavioral genetic research Psychological Bulletin 140 544ndash586 doi 101037a0034205 [6]
26 Koenig A M Eagly A H Mitchell A A amp Ristikari T (2011) Are leader stereotypes masculine A meta-analysis of three research paradigms Psychological Bulletin 137 616 ndash 642 doi 101037a0023557 [4]
27 Kredlow M A Unger L D amp Otto M W (2016) Harnessing reconsolidation to weaken fear and appetitive memories A meta-analysis of post-retrieval extinction effects Psychological Bulletin 142 314ndash336 doi 101037bul0000034 [3]
28 Kuykendall L Tay L amp Ng V (2015) Leisure engagement and subjective well-being A meta-analysis Psychological Bulletin 141 364-403 doi101037a0038508 [3]
29 Landau M J amp Kay A C (2015) Compensatory control and the appeal of a structured world Psychological Bulletin 141 694ndash722 doi 101037a0038703 [1]
30 Lee E-S Park T-Y amp Koo B (2015) Identifying organizational identification as a basis for attitudes and behaviors A meta-analytic review Psychological Bulletin 141 1049ndash1080 doi 101037bul0000012 [1]
POWER BIAS AND HETEROGENEITY
54
31 Lui P P (2015) Intergenerational cultural conflict mental health and educational outcomes among Asian and Latinoa Americans Qualitative and meta-analytic review Psychological Bulletin 141 404-446 doi101037a0038449 [3]
32 Lull R B amp Bushman B J (2015) Do sex and violence sell A meta-analytic review of the effects of sexual and violent media and ad content on memory attitudes and buying intentions Psychological Bulletin 141 1022ndash1048 doi 101037bul0000018 [6]
33 Mazei J Freund P A Huumlffmeier J amp Stuhlmacher A F (2015) A meta-analysis on gender differences in negotiation outcomes and their moderators Psychological Bulletin 141 85ndash104 doi 101037a0038184 [1]
34 Melby-Lervaringg M Lyster S A amp Hulme C (2012) Phonological skills and their role in learning to read A meta-analytic review Psychological Bulletin 138 322ndash352 doi 101037a0026744 [3]
35 Melby-Lervaringg M amp Lervaringg A (2014) Reading comprehension and its underlying components in second-language learners A meta-analysis of studies comparing first- and second-language learners Psychological Bulletin 140 409ndash433 doi 101037a0033890
[4] 36 Mendelson J L Gates J A amp Lerner M D (2016) Friendship in school-age boys with
autism spectrum disorders A meta-analytic summary and developmental process-based model Psychological Bulletin 142 601-622 doi 101037bul0000041 [2]
37 Mol S E amp Bus A G (2011) To read or not to read A meta-analysis of print exposure from infancy to early adulthood Psychological Bulletin 137 267ndash296 doi 101037a0021890 [13]
38 Orquin J L amp Kurzban R (2016) A meta-analysis of blood glucose effects on human decision making Psychological Bulletin 142 546ndash567 doi 101037bul0000035 [1]
39 Ottaviani C Verkuil B Medea B Couyoumdjian A Thayer JF Lonigro A amp Brosschot J F (2016) Physiological concomitants of perseverative cognition A systematic review and meta-analysis Psychological Bulletin 142 No 3 231ndash259 doi 101037bul0000036 [8]
40 North M S amp Fiske S T (2015) Modern attitudes toward older adults in the aging world A cross-cultural meta-analysis Psychological Bulletin 141 993ndash1021 doi 101037a0039469 [1]
41 Pahlke E Hyde J S amp Allison C M (2014) The effects of single-sex compared with coeducational schooling on studentsrsquo performance and attitudes A meta-analysis Psychological Bulletin 140 1042-1072 doi 101037a0035740 [2]
42 Pan S C amp Rickard T C (2015) Sleep and motor learning Is there room for consolidation Psychological Bulletin 141 812-834 doi 101037bul0000009 [1]
43 Phillips W J Fletcher J M Marks A D G amp Hine D W (2016) Thinking styles and decision making A meta-analysis Psychological Bulletin 142 No 3 260ndash290 doi 101037bul0000027 [4]
44 Pool E Brosch T Delplanque S amp Sander D (2016) Attentional bias for positive emotional stimuli A meta-analytic investigation Psychological Bulletin 142 No 1 79ndash106 doi 101037bul0000026 [1]
45 Randall J G Oswald F L amp Beier M E (2014) Mind-wandering cognition and performance A theory-driven meta-analysis of attention regulation Psychological Bulletin 140 1411ndash1431 doi 101037a0037428 [4]
POWER BIAS AND HETEROGENEITY
55
46 Sambrook T D amp Goslin J (2015) A neural reward prediction error revealed by a meta-analysis of ERPs using great grand averages Psychological Bulletin 141 213ndash235 doi 101037bul0000006 [4]
47 Sedlmeier P Eberth J Schwarz M Zimmermann D Haarig F Jaeger S amp Kunze S (2012) The psychological effects of meditation A meta-analysis Psychological Bulletin 138 1139ndash1171 doi 101037a0028168 [20]
48 Sheeran P Harris P R and Epton T (2014) Does heightening risk appraisals change peoplersquos intentions and behavior A meta-analysis of experimental studies Psychological Bulletin 140 511ndash543 doi 101037a0033065 [2]
49 Smith S F amp Lilienfeld S O (2015) The response modulation hypothesis of psychopathy A meta-analytic and narrative analysis Psychological Bulletin 141 1145ndash1177 doi 101037bul0000024 [1]
50 Soderberg C K Amit E Callahan S P Kochersberger A O amp Ledgerwood A (2015) The effects of psychological distance on abstraction Two meta-analyses Psychological Bulletin 141 3 525ndash548 doi101037bul0000005 [2]
51 Tannenbaum M B Hepler J Zimmerman R S Saul L Jacobs S Wilson K amp Albarraciacuten D Appealing to fear A meta-analysis of fear appeal effectiveness and theories Psychological Bulletin 141 1178ndash1204 doi101037a0039729 [1]
52 Toosi N R Babbitt L G Ambady N amp Sommers SR (2012) Dyadic interracial interactions A meta-analysis Psychological Bulletin 138 1ndash27 doi 101037a0025767 [4]
53 Vachon D D Lynam D R amp Johnson J A (2014) The (Non)relation between empathy and aggression Surprising results from a meta-analysis Psychological Bulletin 140 751ndash773 doi 101037a0035236 [1]
54 Verhage M L Schuengel C Madigan S Fearon R M P Oosterman M Cassibba R Bakermans-Kranenburg M J amp van IJzendoorn M H (2016) Narrowing the transmission gap A synthesis of three decades of research on intergenerational transmission of attachment Psychological Bulletin 142 337ndash366 doi 101037bul0000038 [2]
55 von Stumm S amp Ackerman P L (2013) Investment and intellect A review and meta-analysis Psychological Bulletin 139 841ndash869 doi 101037a0030746 [11]
56 Voyer D amp Voyer S D (2014) Gender differences in scholastic achievement A meta-analysis Psychological Bulletin 140 1174-1204 doi 101037a0036620 [6]
57 Vucasović T amp Bratko D (2015) Heritability of personality A meta-analysis of behavior genetic studies Psychological Bulletin 141 769ndash785 doi101037bul0000017 [1]
58 Wanberg C R Hamann D J Kanfer R amp Zhang Z (2016) Age and reemployment success after job loss An integrative model and meta-analysis Psychological Bulletin 142 400-426 doi 101037bul0000019 [6]
59 Weingarten E Chen Q McAdams M Yi J amp Hepler J (2016) From primed concepts to action A meta-analysis of the behavioral effects of incidentally presented words Psychological Bulletin 142 472ndash497 doi 101037bul0000030 [1]
60 Williams M J amp Tiedens L Z (2016) The subtle suspension of backlash A meta-analysis of penalties for womenrsquos implicit and explicit dominance behaviour Psychological Bulletin 142 165ndash197 doi 101037bul0000039 [6]
POWER BIAS AND HETEROGENEITY
56
61 Winer E S amp Salem T (2016) Reward devaluation Dot-probe meta-analytic evidence of avoidance of positive information in depressed persons Psychological Bulletin 142 18ndash78 doi 101037bul0000022 [6]
Notes Numbers in square brackets denote the number of meta-analyses included in the dataset
Appendix B Distribution of survey estimates
Year
No of meta-analyses published
No of meta-analyses sampled
of published meta-studies
No of estimates
of sample
2016 17 14 82 46 22 2015 22 18 82 40 19 2014 25 12 48 46 22 2013 17 3 18 16 8 2012 15 6 40 34 16 2011 19 8 42 31 15

POWER BIAS AND HETEROGENEITY
10
our use of lsquoselective reporting biasrsquo encompasses more specific terms such as the file drawer
problem publication bias reporting bias p-hacking and questionable research practices (Scargle
2000 Simmons Nelson amp Simonsohn 2011 John Lowenstein amp Prelec 2012 Stanley and
Doucouliagos 2012 Stanley and Doucouliagos 2014 Simonsohn Nelson amp Simmons 2014
Wicherts et al 2016) Here we are only concerned about the aggregate effects that these various
research practices might have on the research record rather than the details of their specific
pathways Regardless of whether statistically insignificant findings are suppressed (traditionally
called lsquopublication biasrsquo or the lsquofile drawer problemrsquo) only some selected outcome measures or
comparisons are reported or whether any of a number of other questionable research practices are
employed the net effects on the research record are largely the samemdashan exaggeration of the size
and significance of reported effects
These biases are distinct from outright scientific fraud in that it is almost certainly
motivated by researchersrsquo desires to ldquogo where the data leadrdquo or by reviewersrsquo and editorsrsquo
motivations to use limited journal space for findings that move the field forward However even
well-meaning motivations can undermine the validity of research findings potentially producing
convincing evidence of a psychological effect that does not exists Selective reporting biases can
cause problems for replicability because replications may be doomed from the start if the original
reported finding is spurious or grossly inflated For this reason understanding the degree of bias
in psychology is important when assessing the credibility of research or when planning
replications
Selective reporting bias or publication bias as it is usually called is said to occur if the
dissemination of findings depends on the specifics of those findings For example findings with
statistically significant p-values or theory-consistent findings are more likely to be published
POWER BIAS AND HETEROGENEITY
11
reported and promoted than other findings As a result any review of a literature (including meta-
analysis) will tend to overestimate the evidence for an effect because such positive findings will
be overrepresented in the observed sample of reported findings
It seems quite clear that selective reporting or publication bias exists in psychology though
it is difficult to estimate its true prevalence For example several reviews have found that the
number of statistically significant results reported in psychology is larger than what should be
expected given the level of statistical power (eg Sterling 1959 Sterling Rosenbaum amp
Weinkam 1995 Fanelli 2010) In particular Bakker van Dijk amp Wicherts (2012) reviewed 13
meta-analyses in psychology and identify evidence consistent with publication bias in seven
Kuumlhberger Fritz amp Scherndl (2014) investigate a random sample of 500 studies published in 2007
and found several statistical indicators of publication bias including a persistent correlation
between sample size and effect size Quite recently Fanelli Costas and Ioannidis (2017)
corroborate the prevalence of a correlation between sample size and effect size among 430 meta-
analyses from psychology and psychiatry
An inverse correlation between the magnitude of the effect size and sample size would be
expected when there is selective reporting for statistical significance If there is a tendency for
some researchers to selectively report statistically significant findings then greater efforts will be
required by those researchers who have only small samples to work with Because small samples
produce larger standard errors correspondingly larger effects must be found to overcome these
large standard errors and obtain statistical significance With the benefit of larger samples it is
likely that the first small effect found will automatically be statistically significant When they are
not researchers who wish to report statistically significant findings will require much less
manipulation because even small effects (or biases) will be statistical significant when there are
POWER BIAS AND HETEROGENEITY
12
large samples Thus this often-observed inverse correlation between sample size and reported
effect size is an implication and therefore a confirmation of the tendency by some researchers to
selectively report statistical significant findings5
And yet still more direct evidence of publication bias has been found in psychology When
data on the intended research protocol is available Franco Malhotra amp Simonovits (2015) find
that published effects have a median p-value of 02 compared to the median unreported p-value
of 035 suggesting that statistically significant findings are selectively reported
Recently much attention has been given to selective reporting through the use of
undisclosed flexible approaches to data collection and analysis often called p-hacking or
questionable research practices (Simmons Nelson amp Simonsohn 2011 John Lowenstein amp
Prelec 2012 Wicherts et al 2016) Examples of these behaviors include analyzing data as it is
collected and stopping data collection once a desired result has been achieved deciding whether
to exclude outliers investigating experimental conditions or moderators on the basis of the results
and reporting onersquos exploratory findings as if they were the result of confirmatory research (see
5 In contrast some have suggested that small-sample studies are somehow better more able to find big effects But is it plausible to believe that small-sample psychological studies are typically conducted with more care or at a higher level of quality than large-sample studies We think not First we know that small-sample studies are less able to distinguish effects from background by the very definition of statistical power Second it is unlikely that researchers with small samples have first conducted prospective power calculations Past surveys have found that very few studies (3-5) choose their sample sizes on the basis of power calculations (Tressoldi and Giofreacute 2015) Yet such prospective power calculations with an associated 80 power level are required by the APA manual and have been accepted as critical in the field for decades Third even if these small-sample researchers believe that there are large effects to be found in their area of research they know that whatever they find (large or small) will be unreliable and ldquobuzzing with confusionrdquo (Maxwell 2004 p161) Thus by widely known standards of psychological research those who use small samples know that they are conducting low-quality less-rigorous research Fourth in contrast large labs and research programs tend to conduct larger studies ceteris paribus and they also have more resources to better design their instruments and more carefully execute their protocols Consider for example large replications efforts such as the Open Science Collaboration (2015) and (Hagger et al 2016) where the care and execution of experiments are demonstrably of higher quality and their sample sizes are larger However nothing in this paper assumes that larger studies are in any way better than smaller studies other than their demonstrably higher power Nor does our concern that small-sample studies tend to exhibit larger bias depend on small-sample studies being somehow of a lower quality (aside from statistical power) Nonetheless if some researchers have a preference for statistically significant results this alone will cause the inverse correlation between sample size and reported effect size that has often been observed
POWER BIAS AND HETEROGENEITY
13
Wicherts et al 2016 for a comprehensive list) Like publication bias it is extremely difficult to
determine the prevalence of such behaviors but several findings are of note For example John
Loewenstein amp Prelec (2012) surveyed 2000 researchers in psychology using a questionnaire-
based approach designed to correct for social desirability and found that the use of questionable
research practices may represent the norm (but see Fiedler amp Schwarz 2016) Additionally LeBel
et al (2013) created an online database PsychDisclosureorg which allows authors to disclose
whether their published articles include all the methodological details that went into the work
They found that of the authors who participated 112 had not fully reported all excluded
observations 118 had not reported all experimental conditions 453 had not reported all
measures that had been collected and 888 had not reported their data collection strategy Franco
Malhotra amp Simonovits (2015) compared recorded research intentions to the associated published
results and found that about 70 of studies did not disclose every outcome measured and 40 did
not disclose every experimental condition tested Moreover there is evidence indicating that
researchers rely on intuitions about data collection and that low statistical power can further lead
to practices which inflate their findings through bias (Erica et al 2014 Bakker et al 2016) For
the purposes of our survey the source or exact methods of selective reporting for statistical
significance is immaterial We merely wish to document any evidence of an overall tendency to
exaggerate psychological effects should it exist
Heterogeneity
The third governing factor for a successful replication is low heterogeneity As mentioned
above heterogeneity refers to variance in the reported findings that results from there being no
single lsquotruersquo effect size Rather there is a distribution of lsquotruersquo effects To compare heterogeneity
POWER BIAS AND HETEROGENEITY
14
from one area (or subject) of research to another and from one measure of empirical effect size to
another systematic reviewers often compute I2 (Higgins and Thompson 2002 pp1546-7) I2 is
the proportion (or percentage) of observed variation among reported effect sizes that cannot be
explained by the calculated standard errors associated with these reported effect sizes It is a
relative measure of the variance among reported effects that is due to differences between for
example studiesrsquo experimental methods measures population cohorts and statistical methods
relative to the total variance found among the reported effects
For most researchers I2 provides an easy to understand descriptive summary much like
R2 in regression analysis However because I2 is a relative measure of heterogeneity its magnitude
can be misleading If I2 is high (for example 09 or 90) but all studies have large samples and
high power heterogeneity in terms of effect sizes might still be low with little practical
consequence However even a small I2 can have considerable practical consequence for topics of
psychological research that are dominated by small samples and low power which has often been
found to be typical in psychology (eg Cohen 1962 Cohen 1977 Sedlmeier amp Gigerenzer 1989
Rossi 1990 Maxwell 2004 Pashler amp Wagenmakers 2012 Button et al 2013 Fraley amp Vazire
2014) Because we collect information on the random sampling variance on all of these 12065
estimated effect sizes we can also calculate heterogeneity in terms of standardized mean
differences or correlations to assess the practical consequences of the heterogeneity that our survey
finds
Importantly considerable heterogeneity has been found even in carefully conducted exact
replications in psychologymdashthose designed to minimize differences between the original study
design and the replication For example two massive efforts using pre-registered protocols in
which different teams of researchers ran the same study as closely as possible uncovered
POWER BIAS AND HETEROGENEITY
15
statistically significant amounts of heterogeneitymdashI2 = 36 (Hagger et al 2016) and 45
(Eerland et al (2016) Furthermore Klein et al (2015) reported a large-scale effort to replicate 15
findings across 36 different sites that intentionally differed in a variety of characteristics (eg
studies completed online or in the laboratory samples from the United States or elsewhere) Not
surprisingly they found significant amounts of heterogeneity in eight of the 16 effects that were
replicated (I2 = 23 to 91) however a comparison of the intra-class correlation among effects
to the intra-class correlation among sites found that very little of this heterogeneity in effect sizes
was accounted for by differences in the sites suggesting that heterogeneity was genuinely a
characteristic of the phenomena being studied Of course heterogeneity would be expected to be
higher when replications are lsquoconceptualrsquo (ie those making little attempt to duplicate all of the
relevant design characteristics of the original study) or when lsquohidden moderatorsrsquo influence
research outcomes
In the face of large heterogeneity replicability will be severely compromised For example
suppose that the true mean correlation is 02 which is roughly consistent with what past surveys
in psychology have found (Richard et al 2003) and that the standard deviation in the distribution
of true effects due to heterogeneity is approximately the same size6 Then the probability that a
replication will correctly return a medium-to-large true effect (r gt 03) or a negative or negligible
true effect (r lt 01) is 62 In other words if an original study measures an effect that is influenced
by notable heterogeneity a replication attempt of that study can appear to have failed when in
fact both accurately measure different true effects With high heterogeneity the psychological
6 These magnitudes are roughly consistent with what our survey finds to be typical among recent Psychological Bulletin meta-analyses
POWER BIAS AND HETEROGENEITY
16
effect in question is itself too variable or context sensitive regardless of bias or sample size to be
successively replicated frequently
Methods
Data collection
To assess power bias and heterogeneity in psychological research we require both effect
sizes and their standard errors over a wide range of psychological studies Since only past meta-
analyses are likely to have collected the requisite information to calculate power and because
Psychological Bulletin is the premier journal for meta-analysis in psychology we use it to define
our sampling frame We took a convenience sample of the 200 most recently published meta-
analyses (as of June 1 2016) for which we could acquire the necessary statistics Thus our unit of
analysis is a meta-analysis and all of dozens of the individual estimates therein To the extent that
Psychology Bulletin meta-analyses are representative of the population of empirical psychology
our findings will also be representative of psychological research However as an anonymous
referee points out we can only be sure that our survey is representative of the research that the
editors and reviewers of the Psychology Bulletin consider to be of top quality and relevant to
psychology We focused on the most recent issues of the Psychological Bulletin ending June 1
2016 because the topics covered in more recent issues are more likely to reflect contemporary
psychological research interests7
Before our survey of 200 meta-analyses commenced we posted a pre-analysis plan at Open
Science Framework June 1 2016 (httpsosfio4znzpwikihome) In December of 2016 we
7 As we discuss in greater detail below the findings from our survey are also consistent with past surveys of psychological research Thus these 200 meta-analyses are likely to be similarly representative as those past surveys
POWER BIAS AND HETEROGENEITY
17
filed an amended pre-analysis plan to increase the number of meta-analyses surveyed from the
originally planned 100 to 200 while keeping everything else the same We made this adjustment
to maintain a broad coverage across areas of research even though the typical meta-analysis paper
published in Psychological Bulletin contains more than 3 separate meta-analyses Our survey
satisfies the Meta-Analysis Reporting Standards (MARS)
Search strategies As noted above only meta-analysis published in Psychological Bulletin
were considered We manually searched all issues of Psychological Bulletin from 2011 to 2016
as detailed in Table B1 We began with the June 2016 issue of Psychological Bulletin and worked
backwards until we obtained the required statistics from 200 meta-analyses When necessary we
contacted authors for their data The data collection ended when 200 meta-analysis datasets with
the needed information were gathered from 61 papers published between 2011 to 2016 in the
Psychological Bulletin These 61 papers are listed in Appendix A During this period there were
115 meta-analysis papers published in Psychological Bulletin Hence we include meta-analyses
from 53 of these papers
Inclusion and exclusion criteria All the studies are in English Studies were eligible for
inclusion in our study if they provided data on the estimated effect sizes and their standard errors
either in the paper or in a supplement
We exclude four categories of meta-analyses First we exclude any meta-analysis that did
not report both effect sizes and their standard errors Consequently we also exclude systematic
reviews as opposed to meta-analyses because they typically do not fully report all effect sizes and
their standard errors Second to avoid double-counting we exclude any meta-analysis from a
POWER BIAS AND HETEROGENEITY
18
reply or comment to a published meta-analysis that was already part of our database Third we
exclude a couple of meta-analyses that used partial eta squared as the effect size Partial eta squared
cannot be used in conventional power calculations a central outcome of our survey nor can they
be converted and compared to other types of effect sizes (correlations and standardized mean
differences) used in all of the other 200 meta-analyses Fourth we exclude any meta-analysis with
fewer than 5 observations because all statistical calculations are unreliable when based on only a
handful of measures8 Appendix B presents the distribution of studies across the six-year period
included in our sample Our meta-analysis survey contains over 80 of the meta-analysis papers
published in 2015 and 2016 as a larger proportion of more recent publications report the necessary
data
Coding procedures The data used in the survey were reported by authors of published meta-
analyses in Psychological Bulletin This data was extracted by all three authors all of whom are
very experienced in data retrieval There were no disputes in coding as we used the data supplied
by authors themselves No issues of study quality arose as all the meta-analyses are published in
Psychological Bulletin and have already undergone a rigorous review process
54 of the effect sizes in our sample are reported as correlations All of our calculations
of power heterogeneity and bias are made for each of the 200 meta-analyses in the meta-analysisrsquos
originally reported measure of effect size Hence all summary calculations are independent of the
type of effect size or of the transformation of one to the other However for descriptive clarity
and simplicity meta-averages in terms of correlation are converted to standardized mean
differences (Cohenrsquos d) to be comparable to the others A minority of meta-analyses report
8 This requirement removes only two meta-analyses
POWER BIAS AND HETEROGENEITY
19
Hedgesrsquo g correction of standardized mean differences (SMD) for degrees of freedom We make
no conversion between Cohenrsquos d and Hedgesrsquo g because it does not make a practical difference
to any of our calculations
To highlight the types of meta-analytic studies included in our survey and to discuss some
of the issues that naturally arise we use two of these 61 Psychological Bulletin papers North and
Fiske (2015) ldquoModern attitudes toward older adults in the aging world A cross-cultural meta-
analysisrdquo and Williams and Tiedens (2016) ldquoThe subtle suspension of backlash A meta-analysis
of penalties for womenrsquos implicit and explicit dominance behaviorrdquo Williams and Tiedens (2016)
report six separate meta-analyses of lsquobacklashrsquo to womenrsquos dominance behavior and all six are
included in our survey of 200 meta-analyses Three of these meta-analyses concern the simple
effect of gender from dominance behavior on likability competence and lsquodownstreamrsquo outcomes
such as hireability The other three meta-analyses involve the interaction of gender and dominance
on these same three types of outcome measures Williams and Tiedens (2016) include a mix of
experimental and correlational studies but most (85) are experimental Because all six separate
meta-analyses are reported and discussed by Williams and Tiedens (2016) all six are included in
our survey
In contrast North and Fiske (2015) report only one meta-analysis of observational studies
about East-West attitudes towards older adults North and Fiske (2015) combined quantitative
outcomes involving attitude measures on ageism the aging process perceived wisdom warmth
etc as well as behavior-based measures from contact with older adults (p 999) Clearly North
and Fiske (2015) thought these different outcomes measures to be sufficiently similar or
homogeneous to be compared and treated as the same phenomenon However like most meta-
POWER BIAS AND HETEROGENEITY
20
analytic studies in psychology North and Fiske (2015) also conduct a moderator analysis that
investigated the effect of different outcomes measures among others9
It is important to note that we do not choose the level of aggregation of the meta-analyses
that are included on our survey Rather in all cases we follow the professional judgement of
experts in these specific areas of psychological research In the example of gender and dominance
research Williams and Tiedens do not judge that the effects on likeability competence and
downstream outcomes to be sufficiently homogeneous to be analyzed together It seems sensible
that any measure of likeability for example reflects the same phenomenon as any other measure
of likeability when evaluating the effects of gender and dominance Regardless the judgment
about where to draw the line is better made by those experts who have read coded summarized
and analyzed the entire relevant research literature(s)mdashWilliams and Tiedens in this case
Similarly Williams and Tiedens (2016) consider interaction effects to be too different from the
simple effects and from each other to be aggregated Because these are different psychological
phenomenon containing non-overlapping effect sizes we include these interaction studies as well
This issue is potentially important because the level of aggregation of the meta-analyses may have
implications about how much heterogeneity is found The broader more encompassing the level
of aggregation the higher one would expect heterogeneity to be
Meta-Estimates of lsquoTrue Effectrsquo
To be both conservative and robust we use three meta-estimators of lsquotruersquo effect because
the meta-estimate that one chooses might in some individual cases make a practically notable
9 Separate meta-analyses cannot be generally constructed for all reported moderator variables in these meta-analysis studies thus we do not include further subdivided moderator meta-analyses Often meta-regression is used for moderator analysis and only summary results are reported Even when separate moderator subsets are investigated it is often the case that insufficient information is reported for us to make these separations
POWER BIAS AND HETEROGENEITY
21
difference in how a given area of research is characterized We investigate three reasonable
alternative proxies for lsquotruersquo effect drawn from all the reported results in a given research subject
to be sure that our survey results are in fact robust to the chosen meta-method of estimating effect
and also to potential selective reporting bias
To be clear there is no perfect estimate of the lsquotruersquo effect size (or the mean of the
distribution of true effect sizes) when some authors reviewers or editors preferentially select
statistically significant effects (Stanley 2017 Stanley Doucouliagos amp Ioannidis 2017) With
selective reporting bias (aka publication bias the file drawer problem small-sample bias and p-
hacking) all meta-estimates are biased because the data from which they are calculated are
themselves biased to an unknowable degree However a series of statistical simulation studies
have documented how some estimators are more biased than others when there is selective
reporting bias (Stanley 2008 Moreno et al 2009 Stanley amp Doucouliagos 2014 Stanley amp
Doucouliagos 2015 Stanley Doucouliagos amp Ioannidis 2017 Stanley 2017)
Conventional meta-analysis typically estimates true effects using either lsquofixed-effectsrsquo
(FE) or a lsquorandom-effectsrsquo (RE) weighted average or both (Hedges amp Olkin 1985 Cooper amp
Hedges 1994 Stanley amp Doucouliagos 2015) The lsquofixed-effectrsquo weighted average employs
optimal weights that are the same as those used by a recently proposed unrestricted weighted least
squares (WLS) weighted average (Stanley amp Doucouliagos 2015) We prefer the unrestricted
WLS version of the conventional fixed-effect meta-analysis for inferential purposes because the
unrestricted WLS weighted average automatically accounts for heterogeneity when calculating
confidence intervals or significance tests (Stanley amp Doucouliagos 2015) This WLS estimator is
POWER BIAS AND HETEROGENEITY
22
also consistently less biased than RE when there is selective reporting bias10 The point estimates
of WLS and FE must always be exactly the same thus using WLS is exactly equivalent to using
FE in our survey11
Our second estimator exploits the importance of statistical power by over-weighting the
most precise largest studies The weighted average of the adequately powered (WAAP) uses the
same formulas as does WLS (or FE) but applies it only on those estimates found to be adequately
powered relative to WLS as the proxy for true effect WAAP is more resilient to selective reporting
biases because adequately powered studies are more reliable and require fewer questionable
research practices to achieve statistical significance Simulations show that WAAP is as good as
random-effects when there are no selective reporting biases and dominates RE when there is
selective reporting for statistical significance When half of the reported experimental results have
been selected for their statistical significance WAAP consistently reduces bias on average by
50 (Stanley Doucouliagos amp Ioannidis 2017) The weakness of WAAP is that it cannot be
computed if there are no studies with adequate power a condition found in 35 of the 200 areas
of psychological research that comprise our survey Thus Stanley Doucouliagos amp Ioannidis
(2017) propose using WLS when WAAP cannot be computed giving a WAAP-WLS weighted
10 We have chosen not to use the lsquorandom-effectsrsquo weighted average to assess power because RE is widely known to be more biased than FE and thereby WLS when there is selective reporting bias (Poole amp Greenland 1999 Sutton et al 2000 Henmi amp Copas 2010 Stanley amp Doucouliagos 2014 Stanley amp Doucouliagos 2015 Stanley Doucouliagos amp Ioannidis 2017 Stanley 2017) WLS and FE give less weight than RE to small-sample studies where selective reporting is likely to be the most severe In the aggregate giving more weight to the largest studies and less weight to small studies will reduce selective reporting bias if it is present and is statistically sensible even when it is not Besides WLS estimates remain practically as good as or better than conventional lsquorandom-effectsrsquo meta-analysis when there is no selective reporting for statistical significance (Stanley amp Doucouliagos 2015 Stanley Doucouliagos amp Ioannidis 2017) 11 For those readers who wish to know how to calculate WLSrsquos standard error or confidence interval please consult Stanley amp Doucouliagos (2015) and Stanley Doucouliagos amp Ioannidis (2017) However any basic regression routine will automatically calculate our unrestricted WLS weighted average when one uses the standardized effect size (effect size divided by it standard error) as the dependent variable and precision (1SE) as the independent variable with no intercept Nothing else is needed
POWER BIAS AND HETEROGENEITY
23
average In the below assessments of power and bias WAAP-WLS is the second approach that we
employ WAAP-WLS has the added value of forcing meta-analysts to seriously consider and
report the statistical powers found in their area of research12
WLS and WAAP-WLS passively moderate selective reporting bias In contrast simple
meta-regression models have been shown to reduce selective reporting bias more aggressively
when it is present (Stanley 2005 Stanley 2008 Moreno et al 2009 Stanley amp Doucouliagos
2014 Stanley amp Doucouliagos 2015 Stanley amp Doucouliagos 2017 Stanley Doucouliagos amp
Ioannidis 2017 Stanley 2017) The precision-effect test-precision effect estimate with standard
error (PET-PEESE) is a conditional estimate of average effect from simple WLS meta-regressions
of each estimated effect size on its standard error (PET) or alternatively on its variance
(PEESE)mdashStanley amp Doucouliagos (2014) When only statistically significant positive results
are reported selective reporting bias is known to be equal to the reported estimatersquos standard error
times the inverse Millsrsquo ratio (Stanley amp Doucouliagos 2014 p 61) The inverse Millsrsquo ratio is a
complex function of the true effect and the standard error which Stanley and Doucouliagos (2014)
approximate by a restricted polynomial function of the standard error (PEESE) When the true
effect is zero it can also be shown mathematically that this complex function collapses to a linear
relation with standard error giving PET (Stanley amp Doucouliagos 2014) A series of statistical
simulation studies documents how PET-PEESE often greatly reduces selective reporting bias and
is preferable to conventional meta-analysis methods and to the lsquotrim-and-fillrsquo publication bias
correction algorithm (Stanley 2008 Moreno et al 2009 Stanley amp Doucouliagos 2014 Stanley
amp Doucouliagos 2017 Stanley Doucouliagos amp Ioannidis 2017 Stanley 2017) PET-PEESE
provides a more aggressive approach to selective reporting bias than any simple weighted average
12 It is our belief that all meta-analyses should report typical power as one objective metric of research quality
POWER BIAS AND HETEROGENEITY
24
but it too has limitations overcorrecting for publication bias in some cases (Stanley 2017 Stanley
Doucouliagos amp Ioannidis 2017 Stanley 2017)13
To recap we calculate power and bias in a robust yet conservative manner by employing
three proxies of lsquotruersquo average effect size (1) the WLS unrestricted weighted average with point
estimates equivalent to the fixed-effect (2) the weighted average of the adequately powered
(WAAP-WLS) and (3) the PET-PEESE meta-regression reduction of selective reporting bias
Two of these approaches (WLS and WAAP-WLS) are quite lsquoconservativersquo in the sense that they
are known to overestimate true effect if there is any type of selective reporting bias lsquoConservativersquo
in this context means they give the benefit of doubt to the psychological research record as reported
and are likely to overestimate psychological researchrsquos power on average PET-PEESE on the
other hand more aggressively attempts to identify and filter out selective reporting bias thus it is
possible to underestimate true effect and thereby underestimate statistical power in some cases
(Stanley 2017) Because our survey is merely descriptive we focus on the median powers across
reported effect sizes research topics and also across these three estimation approaches to the
average true effect size The median of these three will thus be conservative and tend to
overestimate the quality of psychological research14
Assessing adequate power
13 We do not use Simonsohn Nelson amp Simmonsrsquos (2014) lsquop-curversquo correction for lsquop-hackingrsquo Recently several papers establish that the p-curve approach is biased and unreliable when there is either heterogeneity misspecification biases or when some insignificant studies are reported (Bruns amp Ioannidis 2016 McShane Boumlckenholt amp Hansen 2016 van Aert et al 2016) Such conditions are ubiquitous in the social sciences For example we find that the typical heterogeneity variance among the 200 meta-analyses that we survey is nearly 3 times larger than the corresponding random sampling variance That is 74 of the observed variation of reported research results from study to study is typically due to actual differences in the true effect (heterogeneity) or to differential bias in either case overwhelming the p-curversquos assumed pattern of p-values from sampling errors alone 14 Our overall survey results do not depend on the accuracy or validity of PET-PEESE We include PET-PEESE only for the sake of robustness to see what if any difference might result when a more aggressive approach to reducing selective reporting biased is used Below we find that it makes little difference
POWER BIAS AND HETEROGENEITY
25
With the WLS WAAP-WLS and PET-PEESE estimates of the lsquotruersquo effect for a given
area of research adequate power is easy to assess We assume the null hypotheses are two tailed
with a 5 significance level and we accept Cohenrsquos 80 as the definition of adequate power
These conventions for Type I and Type II errors imply that the lsquotruersquo effect needs to be equal to or
greater than 28 standard errors in absolute magnitude if power is to reach 80 This value of 28
is the sum of 196 and 084 where 196 is the minimum number of standard errors from zero that
an observed effect must fall to be rejected with a 5 significance level and 084 is the number of
additional standard errors that the true effect must fall from zero such that 80 of the distribution
of the observed effect is in the rejection regionmdashsee Figure 1 Hence for a study to have adequate
power its standard error needs to be smaller than the absolute value of the underlying mean lsquotruersquo
effect divided by 28 All that remains to assess adequate power retrospectively are (1) the values
of the standard error and (2) an estimate (or estimates) of the lsquotruersquo effect If the standard error of
a study is less than the absolute value of an estimate lsquotruersquo effect (from WLS WAAP-WLS or
PET-PEESE) divided by 28 we know that this study is adequately powered to detect a lsquotruersquo
effect equal or greater than this estimate Median power for a given area of research can then be
calculated from the cumulative normal probability of the difference between 196 and the absolute
value of an estimate of the true effect divided by the median standard error Because our survey
is merely descriptive we focus on the median powers across reported effect sizes areas of
research and also across these three estimation approaches to the average true effect size The
median of these estimation approaches will thus be conservative and tend to overestimate the
quality of psychological research
POWER BIAS AND HETEROGENEITY
26
Assessing residual selective reporting bias
If an area of research is selectively reporting effect size to be statistically significant in a
direction consistent with the prevailing psychological theory then the average reported effect will
on average have a larger magnitude than the true effect (whether or not prevailing psychological
theory suggests a direct or an inverse association) As before we can use these meta-averages
WLS WAAP-WLS and PET-PEESE as proxies for lsquotruersquo effect and then compare them to
average reported effect for an assessment of residual reporting bias Needless to say each reported
estimate is subject to random sampling error and will be sometimes larger and sometimes smaller
than the mean true effect Such differences cannot be regarded as lsquobiasrsquo but merely as sampling
or estimation errors However when there is a systematic trend for the unadjusted simple average
to be larger than a meta-average known to be less biased when there is selective reporting bias
then we can regard the difference between the absolute value of the simple mean and the absolute
value of WLS or WAAP-WLS as the lower limit of bias when it persists consistently over hundreds
of separate areas of research Using this approach Ioannidis Stanley amp Doucouliagos (2017) find
that the typical reported estimate in economics is twice as large or larger than either WAAP or
PET-PEESE In sharp contrast our survey of psychology finds on average only a small amount
of consistent exaggeration or overall selective reporting bias
Results
Among these 200 areas of psychological research containing 12065 estimated effect the
average effect size is 0389 expressed as the median of average standardized mean differences or
0191 as a correlation coefficient This overall effect size is nearly the same as the average of the
first 100 years of social psychology (r = 021) uncovered by Richard Bond amp Stokes-Zoota
POWER BIAS AND HETEROGENEITY
27
(2003) The typical standard error is 0104 expressed as a correlation 021 when represented by
a standardized mean difference (SMD) The p-value produced by these averages is a little larger
than the conventional 05 level Other researchers across several disciplines have found that that
p-values tend to lump up at or just below 05 (Gerber amp Malhotra 2008 Brodeur Sangnier amp
Zylberberg 2016) Contrary to recent concerns about publication bias questionable research
practices and null hypothesis significance testing we find that the typical psychological research
study is statistically insignificant at the conventional 05 level of significance
Table 1 reports the median absolute value of the average reported effect size from these
200 meta-analyses Here all effect sizes are first converted to standardized mean differences
(SMD) to be comparable However an interesting pattern emerges when these 200 meta-analyses
are divided by the types of effect sizes that are commonly reported correlation vs SMD The
typical effect size found among the 108 lsquocorrelation-basedrsquo meta-analyses in our survey (0458 in
SMD units) is 57 larger than those meta-analyses measured by SMDs (0291)15
Power
The median of the percent of reported effects that are adequately powered across these 200
areas of research are (1) 77 when the unrestricted WLS (or fixed effect) weighted average is
used to represent the mean of the true effects distribution (2) 71 when WAAP-WLS proxies for
lsquotruersquo effect and (3) 91 if PET-PEESE substitutes for true effect Figure 2 displays the
distributions of the proportion of studies that are adequately powered across these 200 areas of
15 We thank Frank Schmidt for pointing out that technically only point-biserial correlations can be converted to Cohenrsquos d Ceteris paribus other correlations will be larger than the point-biserial correlation due to the latterrsquos restricted range Thus a small part of the larger effect average effect size of lsquocorrelation-basedrsquo meta-analyses might be due to the conversion of all correlations to Cohenrsquos d Because these 108 lsquocorrelation-basedrsquo meta-analyses often contain an undisclosed mix of correlation types we cannot fully correct this small bias However as we discussed above none of our calculations of power heterogeneity or bias depend in any way on the transformation of correlations to standardized mean differences
POWER BIAS AND HETEROGENEITY
28
research Clearly underpowered studies dominate psychological research But how underpowered
are they
We also calculate the median powers for each of these 200 areas of research The typical
power of psychological research is around 36 364 based on WLS 331 based on WAAP-
WLS and 36 based on PET-PEESE16 Figure 3 shows the distribution of median powers across
these 200 areas of research Note their striking shapes The two most frequent categories are the
lowest (0-10) and the highest (over 90) Even though typical areas of research are quite
inadequately powered as measured by median power approximately one-fifth of these 200 areas
of psychological research are quite highly-powered Between 19 and 23 have average statistical
power 90 or highermdashsee Figure 3 It should not be surprising that some areas of research have
high power Aside from sample size statistical power depends on the underlying true effect size
and some psychological phenomena have large effects When WAAP-WLS is used to estimate
true effect one-third of these 200 areas of psychological research (32) have lsquolargersquo or lsquomediumrsquo
effect sizes defined as |WAAP-WLS| gt 05 SMD Even rather modest sample sizes will estimate
large effects powerfully
As before we find striking difference between correlation-based meta-analyses and SMD-
based meta-analyses Table 1 breaks down the median proportion of studies that are adequately
powered and the median power by type of effect size Those areas of psychological research that
predominately report standardized mean differences (SMDs) are highly under-powered typically
99 are underpowered compared to 67 to 76 for correlation-based meta-analyses The median
16 This is somewhat less than a recent survey Fraley amp Vazire (2014) which found a median power to detect a correlation of 02 to be 49 among top social-personality journals for the years 2006-2010 But then Fraley amp Vazire (2014) calculate prospective rather than retrospective power and their sampling frame is different than ours Thus we would expect some differences especially when considering that our median power calculations reflect both the observed effect size of each area of research and the distribution of statistical power within an area of research
POWER BIAS AND HETEROGENEITY
29
statistical power in SMD meta-analyses is between 17 to 23 For correlation-based research
typical power is nearly three times highermdash58 to 61
Residual selective reporting bias
Recall that residual reporting bias may be calculated as the difference between the absolute
value of the simple mean reported effect and the absolute value of one of our less vulnerable
proxies for true effectmdashWLS WAAP-WLS or PET-PEESE We find only small amounts of
residual reporting bias in psychological research 8 based on WLS 12 based on WAAP-WLS
and 15 based on PET-PEESE Thus our survey identifies only a small systematic exaggeration
overall
There are some important qualifications to make about this finding First all these
estimates are themselves biased and two of them consistently underestimate residual bias when
there is selective reporting (Stanley and Doucouliagos 2014 Stanley and Doucouliagos 2015
Stanley et al 2017 Stanley 2017) Second a notable proportion of psychology might still be
affected by selective reporting bias even if the median amount of exaggeration is relatively small
275 (or 55 areas of research) find evidence of some type of selective reporting or small-sample
bias using the Egger test for funnel plot asymmetry and this is likely to be an under-estimate of
the incidence of these biases because the Egger test is known to have low power (Egger et al
1997 Stanley 2008) Third we again find notable differences between types of effect sizes
reported by meta-analysts When using WLS as a proxy for the true effect we find that the simple
mean of reported SMDs is now exaggerated by 13 on average by 20 if WAAP-WLS
substitutes for true effect and by 30 relative to the median absolute value of PET-PEESE
POWER BIAS AND HETEROGENEITY
30
Heterogeneity
The median percent of the observed variation of reported effect sizes within a given area
of research that is attributed to heterogeneity (I2) is 74 This means that the variance among lsquotruersquo
effects is nearly 3 times larger than the reported sampling variance According to Pigottrsquos (2012)
guidelines for small (25) medium (50) and large (75) heterogeneity typical areas of research
have nearly lsquolargersquo excess heterogeneity Yet this level of heterogeneity appears to be the norm
for research in psychology For example van Erp et al (2017) extracted estimates of heterogeneity
from 705 meta-analyses published in Psychological Bulletin between 1990 and 2013 and found
that the median reported I2 = 7062 (interquartile range [3324 8741]) However I2 is a
relative measure of heterogeneity and does not reflect the variation in true effect as measured in
units of SMDs When our median I2 is applied to the typical area of research the standard deviation
among true effects is 0354 SMD and the standard deviation from one study to the next due to both
heterogeneity and sampling error becomes 0412 larger than the typical reported effect size 0389
lsquoExperimentalrsquo vs lsquoobservationalrsquo research
As a post hoc secondary analysis17 we examined whether the systematic differences
between SMD-based and correlation-based meta-analyses are due to experimental design
lsquoexperimentalrsquo vs lsquoobservationalrsquo Unfortunately this differentiation is not perfect Many meta-
analyses contain a mix of experimental and observational research designs at the study level For
example Williams and Tiedens (2015) meta-analysis of the effects of gender and dominance
17 Investigating these differences was not part of our pre-analysis plan Anonymous reviewers asked that we code for experimental design and report the differences
POWER BIAS AND HETEROGENEITY
31
behavior includes 97 experimental studies (85) where dominance behavior was somehow
manipulated and 17 purely observational studies
Because a substantial percent (424) of those meta-analyses that report effect sizes in
terms of SMD are lsquoobservationalrsquo and 314 of correlation-based meta-analyses are
lsquoexperimentalrsquo there is only small correlation (phi=0263 plt001) between experimental design
(1 if primarily experimental 0 elsewhere) and effect type (1 if SMD 0 for correlation) However
we do see some interesting differences in power and heterogeneity by experimental design First
there is a difference between heterogeneity as measured by I2 (plt01) The median I2 for
experimental research is 68 vs 76 for observational designs But I2 is a relative measure of
heterogeneity with a non-symmetric distribution To correct for I2rsquos nonstandard distribution we
use Abramowitz and Stegunrsquos (1964) normal approximation for the chi-square distribution applied
to the Cochran Q-test for heterogeneity Doing so causes this difference in relative heterogeneity
to be only marginally larger than statistical noise (p=045) Additionally experimental research
designs have larger sampling errors and lower power Typical sampling errors are 026 vs 019
measured as median SEs in units of SMD Table 2 reports the median proportion of studies that
are adequately powered and the median of median powers by type of research design Even though
there is only a small association between experimental design and effect type we find a similar
pattern among the typical levels of power for experimental design that we see for effect type
confirming the concerned expressed by dozens of researchers over the years that scarcely any
experimental studies are adequately powered All of these results about lsquoexperimentalrsquo vs
lsquoobservationalrsquo research designs should be interpreted with caution because as mentioned they
are conducted post hoc
POWER BIAS AND HETEROGENEITY
32
Discussion
Our survey of 12065 estimated effects sizes from nearly 8000 studies in 200 meta-
analyses reveals that the typical effect size is 0389 SMD with a median standard error of 021 We
also find low statistical power small residual selection bias and high levels of heterogeneity The
central purpose of our review is to assess the replicability of psychological research through meta-
analysis and thereby better understand recent failures to replicate Our findings implicate low
statistical power and high levels of heterogeneity as the primary causes of lsquofailedrsquo replications
however defined
We find that only a small proportion of psychological studies are adequately powered
approximately 8 and the median power is about 36 across three proxies for the mean lsquotruersquo
effect18 What does this imply about replication Our survey predicts therefore that replication
study with a typical sample size will have only a 36 chance of finding a statistically significant
effect in the same direction as some previous study and this value is exactly the same percent of
replications found to be statistically significant in the same direction by the Open Science
Collaboration (Open Science Collaboration 2015 Table 1) Thus when replication is viewed in
terms of sign and statistical significance it is no wonder that rates of replication are considered
low in psychology research
Improving replication as noted by others (eg Maxwell et al 2015) would seem to be a
matter of conducting both initial studies and replications with larger samples reducing sources of
non-sampling error (eg measurement error Stanley amp Spence 2014) and focusing on larger
18 To be more precise 36 is the median among the medians of medians
POWER BIAS AND HETEROGENEITY
33
effects Because researchers work with limited resources and knowledge these obvious
recommendations are extremely difficult to implement in most cases
More practical recommendations have centered on redefining replication success and
adjusting researchersrsquo expectations about non-significant replications For example Peng et al
(2016) examined the data from the Reproducibility Project Psychology (Open Science
Collaboration 2015) in terms of prediction intervalsmdashconfidence intervals that account for
variability in both the original and replication studymdashand found that 77 of the replication
attempts were consistent with the original findings This finding seems to be in apparent contrast
to the highly publicized result that only 36 of the replications in those data were statistically
significant but completely in accord with the less well-publicized result that meta-analytically
combining the replications with the original studies resulted in 70 statistical significance (Open
Science Collaboration 2015) Along similar lines several authors have argued for assessing
replication primarily within the context of meta-analysis (eg Braver Thoemmes amp Rosenthal
2014 Stanley amp Spence 2014 Fabrigar amp Wegener 2016) Doing so could shift the evaluation
of success vs failure of replications to a judgement about the degree of information that new data
add to our knowledge base (Peng et al 2016)
Consistent with a previous survey of heterogeneity (van Erp et al 2017) and several
findings from recent multi-site replication attempts (Hagger amp Chatzisarantis 2016 Eerland et al
2016 Klein et al 2015) our survey reveals clear evidence for high levels of heterogeneity in
research in psychology We find that heterogeneity accounts for nearly three-fourths of the
observed variation among reported effects (ie median I2 =74) When applied to the median
reported standard error (measured in terms of SMD) this high I2 implies that the typical standard
deviation of heterogeneity is equal to 0354 (again in units of SMDs) Importantly even a
POWER BIAS AND HETEROGENEITY
34
replication study with millions of subjects will remain vulnerable to heterogeneity among lsquotruersquo
effects When we apply our surveyrsquos typical heterogeneity to its typical effect size it is unlikely
that any replication will be lsquosuccessfulrsquo For example if our median effect size 0389 is the mean
of the distribution of true effects then there is a 298 probability that the largest possible
replication study will find a negligible zero or opposite-signed effect The probability is 324
that this ideal replication (ie ninfin) finds a small effect and it is 255 for a medium-sized
effectmdashusing Cohenrsquos guidelines of 02 05 and 08 Even though 0389 is considered a lsquosmallrsquo
effect by these guidelines the probability that a very large replication finds a large effect remains
non-negligible at 123 Thus it is quite likely 68 that an ideal replication will not reproduce
a small effect when the mean of the distribution true effects is equal to our median average effect
size The wide distribution of true effect sizes that our survey finds is also similar to what Open
Science Collaboration observed when attempting to replicate 100 psychological experimentmdashsee
Figure 3 in the Open Science Collaboration (2015)
No matter what the mean of the distribution of true effect sizes might be nor how large the
replication study is it is unlikely that a replication will find an effect size close to what was found
previously when there is this much heterogeneity If a lsquosuccessful replicationrsquo is defined as finding
an effect size similar to what some previous study or studies have found (say for example to
within + 01 or within + 02 SMD) then there will always be a sizeable chance of unsuccessful
replication no matter how well conducted or how large any of the studies are For example
suppose that two studies are conducted with nearly infinite sample sizes and therefore infinitesimal
sampling error Heterogeneity of the size that our survey finds implies that the probability that
these two ideal studies find effect sizes that are within +01 from one another is 158 and 311
to within +02 Indeed there remains a 50 or greater probability of a lsquofailed replicationrsquo whenever
POWER BIAS AND HETEROGENEITY
35
the acceptable difference for a successful replication is set at less than 035 SMD Needless to say
if we have less-than-ideal sample sizes the resulting added sampling error will reduce the
probability of a successful replication further Thus high heterogeneity further explains the failure
of the Open Science Collaboration (2015) to find reliable indicators of replication success
There are important caveats to these calculations of replication success that need to be
mentioned First there is a wide distribution of observed heterogeneity among these areas of
psychological researchmdashsee Figure 4 Twenty-two percent have I2s that are less than 50 while
47 have I2 values 75 or higher and one out of seven have excess heterogeneity of 90 or more
Thus successful replication will be more likely in some areas of research but much less likely in
others Second these calculations assume that the typical heterogeneity observed in this research
record is entirely heterogeneity among lsquotruersquo effects that is variation beyond the control of
researchers Because exact replication is rare in psychology some of this observed heterogeneity
will be due to variation in experimental conditions measures methods and the characteristics of
the population from which the samples are drawn Thus a careful exact replication study could
avoid a notable amount of this variation in expected effect by carefully duplicating all of the
controllable features of the experimental design execution and evaluation However those large-
scale efforts to control these controllable research dimensions still find that notable heterogeneity
remains (Hagger et al 2016 Eerland et al 2016 Klein et al 2015) Moreover if half the
observed heterogeneity variance is due to differences that are under the control of the researcher19
then our estimate of the typical standard deviation due this uncontrollable heterogeneity among
true effects would be reduced to 025 In which case the probability that the largest possible
19 The typical heterogeneity found by two large replication studies that attempted to be as exact as possible is larger than half of the median heterogeneity that our survey finds (Hagger et al 2016 Eerland et al 2016)
POWER BIAS AND HETEROGENEITY
36
replication study will find a negligible zero or opposite-signed effect declines to 22 28 for a
medium effect and it will find a large effect only about 5 of the time Even if half of the observed
heterogeneity among reported effects is under the researcherrsquos control the probability that any
replication effort successfully replicates a small effect (recall 0389 is our surveyrsquos median effect
size) remains less than 50
Conclusions
Our survey of 12065 estimated effect sizes from nearly as many studies and 8000 papers
finds that lsquofailedrsquo replicationsmdashdefined here in terms of null hypothesis significance testingmdash are
to be expected at a rate consistent with the widely publicized the Reproducibility Project
Psychology (Open Science Collaboration 2015) Like many other researchers we find that
statistical power is chronically low in research in psychology (Cohen 1962 Cohen 1977
Sedlmeier amp Gigerenzer 1989 Rossi 1990 Maxwell 2004 Pashler amp Wagenmakers 2012
Fraley amp Vazire 2014 Tressoldi amp Giofreacute 2015) Unlike this previous research however our
survey reveals a more severe challenge for replication High levels of heterogeneity are evidently
the norm in psychology (median I2 =74) As discussed above heterogeneity this large makes
successful replication difficult whether defined in terms of hypothesis testing or estimation
precision This high heterogeneity will of course be due in part to methodological differences
between the different studies in each of the 200 meta-analyses that we survey However data from
multi-site registered replication efforts further suggest that when obvious methodological
differences are removed (ie when lsquoexactrsquo replications are conducted) heterogeneity is not
reduced to negligible levels In other words it is unrealistic to believe that variance in
POWER BIAS AND HETEROGENEITY
37
psychological phenomena studied can always be tightly controlled or reduced to practically
insignificant levels
Perhaps more surprising is our finding that there is relatively small exaggeration or overall
selective reporting bias in recent psychological research This is in contrast to the view that
publication bias and questionable research practices are the primary cause of failed replications
Of course as mentioned above there are good reasons to be cautious in applying this hopeful
result to any individual area of research In particular 275 of these areas of research produce a
significant Eggerrsquos test for publication bias (or small-sample bias) and this test is known to have
low power Our survey merely implies that the effects of selective reporting bias (ie publication
bias small-sample biases p-hacking andor questionable research practices) have a less clear
pattern than is maybe assumed by some researchers and by what has been observed in other fields
(eg economics Ioannidis Stanley and Doucouliagos 2017)
In light of the typically high heterogeneity that we observed how should replications in
psychology be interpreted To begin it seems extremely likely that the p-value from any single
non-preregistered non-exact replication study will have nil informative value In the face of high
heterogeneity this is true regardless of the sample size of the replication because it is quite likely
that the replication study will correctly reflect a substantially different true effect than the original
study However individual non-preregistered non-exact replication studies may still contribute to
our collective knowledge when added to a carefully conducted meta-analysis or meta-regression
analysis Meta-analysis moves the focus away from the statistical significance of the single
replication study increases statistical power by pooling across studies allows one to accommodate
and reduce selective reporting bias and meta-regression analysis can use non-exact replications to
POWER BIAS AND HETEROGENEITY
38
help isolate and quantify methodological heterogeneity (eg Stanley amp Doucouliagos 2012
Braver Thoemmes amp Rosenthal 2014 Stanley amp Spence 2014 Fabrigar amp Wegener 2016)
Replication findings from multi-site pre-registered replications clearly offer a different
class of evidence from the single non-pre-registered non-exact replication Statistical power can
be maximized by the pooling of resources across research sites pre-registration is likely to greatly
reduce some types of selective reporting bias and heterogeneity due to obvious methodological
characteristics can be minimized through tightly-controlled study protocols Multi-site pre-
registered replication also allows researchers to directly isolate and quantify the specific
heterogeneity among true effects which remains after methodological heterogeneity is minimized
Such information can provide useful insights about the psychological phenomenon in question
thereby helping to guide and redirect future research and meta-regression analyses
The central implication of our survey is that typically-powered studies in most of areas of
psychology individually or when simply combined into a meta-analysis offer little information
about the magnitude or significance of the phenomenon they examine Our core recommendation
then is that researchers change their expectations about the ease with which convincing evidence
either for or against an effect can be claimed
POWER BIAS AND HETEROGENEITY
39
References
Abramowitz M and IA Stegun (eds) (1964) Handbook of Mathematical Functions with
Formulas Graphs and Mathematical Tables Washington DC US Department of
Commerce
American Psychological Association (2010) Manual of the American Psychological Association
6th ed Washington DC
Asendorpf J B Conner M De Fruyt F De Houwer J Denissen J J Fiedler K amp
Perugini M (2013) Recommendations for increasing replicability in psychology European
Journal of Personality 27(2) 108-119
Baker M (2015) Over half of psychology studies fail reproducibility test Nature News and
Comment August 27 doi101038nature201518248 accessed 8232017
Bakker M van Dijk A amp Wicherts J M (2012) The rules of the game called psychological
science Perspectives on Psychological Science 7(6) 543-554 doi
1011771745691612459060
Bakker M Hartgerink C H Wicherts J M amp van der Maas H L (2016) Researchersrsquo
intuitions about power in psychological research Psychological Science 27(8) 1069-1077 doi
1011770956797616647519
Bohannon J (2015) Reproducibility Many psychology papers fail replication test Science
349910ndash911
Braver SL Thoemmes FJ amp Rosenthal R (2014) Continuously cumulating meta-analysis
and replicability Perspectives on Psychological Science 9 333ndash342 doi
1011771745691614529796
Brodeur A Leacute M Sangnier M amp Zylberberg Y (2016) Star Wars The empirics strike back
American Economic Journal Applied Economics 8 1ndash32 doi 101257app20150044
Bruns S B amp Ioannidis J P A (2016) p-curve and p-hacking in observational research PLoS
ONE 11 e0149144 doi101371journal pone0149144
Button K S Ioannidis J P Mokrysz C Nosek B A Flint J Robinson E S amp Munafograve M
R (2013) Power failure why small sample size undermines the reliability of neuroscience
Nature Reviews Neuroscience 14(5) 365-376 doi101038nrn3475
Cohen J (1962) The statistical power of abnormal-social psychological research A review
Journal of Abnormal and Social Psychology 65 145ndash153
POWER BIAS AND HETEROGENEITY
40
Cohen J (1965) Some statistical issues in psychological research In (BB Wolman ed)
Handbook of Clinical Psychology New York McGraw-Hill pp 95ndash121
Cohen J (1977) Statistical power analysis for the behavioral sciences (2nd ed) New York
Academic Press
Cohen J (1992) A power primer Psychological Bulletin 112 155ndash159
Cooper H M amp Hedges LV (1994) (eds) Handbook of Research Synthesis New York Russell
Sage
Dreber A Pfeiffer T Almenberg J Isaksson S Wilson B Chen Y amp Johannesson M
(2015) Using prediction markets to estimate the reproducibility of scientific research
Proceedings of the National Academy of Sciences 112(50) 15343-47
Eerland A Sherrill A M Magliano J P Zwaan R A Arnal J D Aucoin P amp Prenoveau
J M (2016) Registered replication report Hart amp Albarraciacuten (2011) Perspectives on
Psychological Science 11(1) 158-171 doi 1011771745691615605826
Egger M Smith G D Schneider M amp Minder C (1997) Bias in meta-analysis detected by a
simple graphical test British Medical Journal 315 629ndash634 doi101136bmj3157109629
Engber D (2015) Cover Story Everything is crumbling Slate March 6 Accessed Dec 19
2016
Erica C Y Sprenger A M Thomas R P amp Dougherty M R (2014) When decision heuristics
and science collide Psychonomic Bulletin amp Review 21(2) 268-282 doi103758s13423-013-
0495-z
Fabrigar L R amp Wegener D T (2016) Conceptualizing and evaluating the replication of
research results Journal of Experimental Social Psychology 66 68-80 doi
101016jjesp201507009
Fanelli D (2010) ldquoPositiverdquo results increase down the hierarchy of the sciences PLoS One
5 e10068 doi101371journalpone0010068
Fanelli D Costas R amp Ioannidis J P (2017) Meta-assessment of bias in science Proceedings
of the National Academy of Sciences 201618569 doi101073pnas1618569114
Fiedler K amp Schwarz N (2016) Questionable research practices revisited Social Psychological
and Personality Science 7(1) 45-52 doi 1011771948550615612150
POWER BIAS AND HETEROGENEITY
41
Fraley R C amp Vazire S (2014) The n-pact factor Evaluating the quality of empirical journals
with respect to sample size and statistical power PLoS ONE 9 e109019
doi101371journalpone0109019
Fraley R C amp Marks M J (2007) The null hypothesis significance testing debate and its
implications for personality research In R W Robins R C Fraley amp R F Krueger (Eds)
Handbook of research methods in personality psychology (pp149ndash169) New York Guilford
Franco A Malhotra N amp Simonovits G (2016) Underreporting in psychology experiments
Evidence from a study registry Social Psychological and Personality Science 7(1) 8-12 doi
1011771948550615598377
Gerber A amp Malhotra N (2008) Do statistical reporting standards affect what is published
publication bias in two leading political science journals Quarterly Journal of Political
Science 3 313-326 doi 10156110000008024
Hagger M S Chatzisarantis N L D Alberts H Anggono C O Birt A Brand R amp
Cannon T (2016) A multi-lab preregistered replication of the ego-depletion effect
Perspectives on Psychological Science 11 546ndash573 doi 1011771745691616652873
Hedges L V amp Olkin I (1985) Statistical Methods for Meta-Analysis Academic Press Orlando
Henmi M amp Copas J B (2010) Confidence intervals for random effects meta-analysis and
robustness to publication bias Statistics in Medicine 29 2969ndash2983 doi 101002sim4029
Higgins J P T amp Thompson S G (2002) Quantifying heterogeneity in meta-analysis Statistics
in Medicine 21 1539ndash1558 doi 101002sim1186
Hoenig J M amp Heisey D M (2001) The abuse of power The pervasive fallacy of power
calculations for data analysis American Statistician 55 19ndash24 doi
101198000313001300339897
Inthout J Ioannidis J P A amp Borm G F (2012) Obtaining evidence by a single well-powered
trial or several modestly powered trials Statistical Methods in Medical Research
httpsmmsagepubcomcontentearly201209240962280212461098abstract (Accessed
Aug 16th 2015)
Ioannidis J P A (2005a) Contradicted and initially stronger effects in highly cited clinical
research Journal of the American Medical Association 294 218-228
doi101001jama2942218
POWER BIAS AND HETEROGENEITY
42
Ioannidis J P A (2005b) Why most published research findings are false PLoS Medicine 2
e124 doi101371journalpmed0020124
Ioannidis J P A (2013) Clarifications on the application and interpretation of the test for excess
significance and its extensions Journal of Mathematical Psychology 57 184-187 doi
101016jjmp201303002
Ioannidis J P A Hozo I and Djulbegovic B (2013) Optimal type I and type II error pairs when
the available sample size is fixed Journal of Clinical Epidemiology 66 903-910 doi
101016jjclinepi201303002
Ioannidis J P A Stanley T D amp Doucouliagos C(H) (2017) The power of bias in economics
research The Economic Journal October also as SWP Economics Series 20162
httpwwwdeakineduau__dataassetspdf_file00074777632016_1pdf Deakin University
Australia [Accessed on 27 April 2017]
John L K Loewenstein G amp Prelec D (2012) Measuring the prevalence of questionable
research practices with incentives for truth telling Psychological Science 23 524-532 doi
1011770956797611430953
Klein R A Vianello M Hasselman F Alper S Aveyard M Axt J R amp Nosek B A
(2015) Many Labs 2 Investigating variation in replicability across sample and setting
Manuscript in preparation
Kuumlhberger A Fritz A amp Scherndl T (2014) Publication bias in psychology a diagnosis based
on the correlation between effect size and sample size PloS one 9(9) e105825 doi
101371journalpone0105825
Lakens D (2015) On the challenges of drawing conclusions from p-values just below 005 Peer
J 3e1142 doi 107717peerj1142 PMID 26246976
LeBel E P Borsboom D Giner-Sorolla R Hasselman F Peters K R Ratliff K A amp
Smith C T (2013) PsychDisclosure org Grassroots support for reforming reporting standards
in psychology Perspectives on Psychological Science 8(4) 424-432 doi
1011771745691613491437
LeBel E P Vanpaemel W McCarthy R J Earp B D amp Elson M (2017) A unified
framework to quantify the trustworthiness of empirical research Advances in Methods and
Practices in Psychological Science Retrieved from httpsosfiopreprintspsyarxivuwmr8
8232017
POWER BIAS AND HETEROGENEITY
43
Lindsay D S (2015) Replication in psychological science Psychological Science 26 1827-32
Makel M C Plucker J A amp Hegarty B (2012) Replications in psychology research How
often do they really occur Perspectives on Psychological Science 7(6) 537-542
Maxwell S E (2004) The persistence of underpowered studies in psychological research causes
consequences and remedies Psychological Methods 9 147 doi 1010371082-989X92147
Maxwell S E Lau M Y amp Howard G S (2015) Is psychology suffering from a replication
crisis What does ldquofailure to replicaterdquo really mean American Psychologist 70(6) 487-498
httpdxdoiorg101037a0039400
McShane B B amp Boumlckenholt U (2016) Planning sample sizes when effect sizes are uncertain
The power-calibrated effect size approach Psychological Methods 21(1) 47 doi
101037met0000036
McShane B B Boumlckenholt U amp Hansen K T (2016) Adjusting for publication bias in meta-
analysis An evaluation of selection methods and some cautionary notes Perspectives on
Psychological Science 11 730ndash749 doi 1011771745691616662243
Miguel E amp Christensen G (2017) Transparency reproducibility and the credibility of
economics research Journal of Economic Literature IN PRESS
Moreno S G Sutton A J Ades A E Stanley T D Abrams K R Peters J L Cooper N
J (2009) Assessment of regression-based methods to adjust for publication bias through a
comprehensive simulation study BMC Medical Research Methodology 9 2 doi
1011861471-2288-9-2
Open Science Collaboration (2015) Estimating the reproducibility of psychological science
Science 349(6251) aac4716ndashaac4716 doi101126scienceaac4716
Pashler H amp Harris C (2012) Is the replicability crisis overblown Three arguments examined
Perspectives on Psychological Science 7 531ndash536 doi 1011771745691612463401
Pashler H amp Wagenmakers E J (2012) Editorsrsquo introduction to the special section on
replicability in psychological science a crisis of confidence Perspectives on Psychological
Science 7 528ndash530 doi 1011771745691612465253
Patil P and Leek JT (2015) Reporting of 36 of studies replicate in the media
httpsgithubcomjtleekreplication_paperblobgh-pagesin_the_mediamd[Online up- dated
16-September-2015 accessed 8232017]
POWER BIAS AND HETEROGENEITY
44
Patil P Peng R D amp Leek J T (2016) What should researchers expect when they replicate
studies A statistical view of replicability in psychological science Perspectives on
Psychological Science 11(4) 539-544 doi 1011771745691616646366
Pigott T (2012) Advances in meta-analysis New York NY Springer
Poole C amp Greenland S (1999) Random-effects meta-analyses are not always conservative
American Journal of Epidemiology 150 469ndash475
Popper K (1959) The logic of scientific discovery New York NY Basic Books
Psychonomic Society (2012) New Statistical Guidelines for Journals of the Psychonomic Society
httpwwwpsychonomicorgpagestatisticalguideline (Accessed March 11th 2017)
Rossi J S (1990) Statistical power of psychological research What have we gained in 20 years
Journal of Consulting and Clinical Psychology 58 646ndash656 doi1010370022-
006X585646
Richard F D Bond C F amp Stokes-Zoota J J (2003) One hundred years of social psychology
quantitatively described Review of General Psychology 7 331ndash363
Scargle J D (2000) Publication bias The ldquoFile-Drawerrdquo problem in scientific inference Journal
of Scientific Exploration 14 91ndash106
Schmidt F L amp Hunter J E (2015) Methods of meta-analysis Correcting error and bias in
research findings 3rd ed Los Angeles CA Sage
Schmidt F L amp Oh I -S (2016) The crisis of confidence in research findings in psychology Is
lack of replication the real problem Or something else Archives of Scientific Psychology 4(1)
32ndash37 httpdxdoiorg101037arc0000029
Sedlmeier P amp Gigerenzer G (1989) Do studies of statistical power have an effect on the power
of studies Psychological Bulletin 105 309ndash316
Simmons J P Nelson L D amp Simonsohn U (2011) False-positive psychology Undisclosed
flexibility in data collection and analysis allows presenting anything as significant
Psychological Science 22(11) 1359-1366 doi 1011770956797611417632
Simonsohn U Nelson L D amp Simmons J P (2014) P-curve a key to the file drawer Journal
of Experimental Psychology General 143 534-547 doi 101037a0033242
Stanley D J amp Spence J R (2014) Expectations for replications Are yours realistic
Perspectives on Psychological Science 9 305ndash318 doi 1011771745691614528518
POWER BIAS AND HETEROGENEITY
45
Stanley T D (2008) Meta-regression methods for detecting and estimating empirical effects in
the presence of publication selection Oxford Bulletin of Economics and Statistics 70103-27
doi 101111j1468-0084200700487x
Stanley T D (2017) Limitations of PET-PEESE and other meta-analysis methods Social
Psychology and Personality Science [Epub ahead of print] doi 1011771948550617693062
Stanley T D amp Doucouliagos H(C) 2014 Meta-regression approximations to reduce publication
selection bias Research Synthesis Methods 5 60-78 doi 101002jrsm1095
Stanley T D amp Doucouliagos H(C) 2015 Neither fixed nor random Weighted least squares
meta-analysis Statistics in Medicine 34 2116-27 doi 101002sim6481
Stanley T D amp Doucouliagos H(C) 2017 Neither fixed nor random Weighted least squares
meta-regression analysis Research Synthesis Methods 8 19-42 doi 101002jrsm1211
Stanley T D Doucouliagos H(C) amp Ioannidis J P A 2017 Finding the power to reduce
publication bias Statistics in Medicine [Epub ahead of print] doi 101002sim7228
Sterling T D (1959) Publication decisions and their possible effects on inferences drawn from
tests of significance Or vice versa Journal of the American Statistical Association 54 30ndash34
Sterling T D Rosenbaum W L amp Weinkam J J (1995) Publication decisions revisited The
effect of the outcome of statistical tests on the decision to publish and vice versa American
Statistician 49 108ndash112 doi 1023072684823
Sutton A J Song F Gilbody S M amp Abrams K R (2000) Modelling publication bias in
meta-analysis A review Statistical Methods in Medical Research 9 421-445 doi
101177096228020000900503
Tressoldi P E amp Giofreacute D (2015) The pervasive avoidance of prospective statistical power
Major consequences and practical solutions Frontiers in Psychology 6 726
doi103389fpsyg201500726
van Aert R C M Jelte M Wicherts J M amp van Assen M A L M (2016) Conducting meta-
analyses based on p values Reservations and recommendations for applying p-uniform and p-
curve Perspectives on Psychological Science 11 713ndash729 doi 1011771745691616650874
van Bavel JJ Mende-Siedlecki PBrada WJ and Reinero DA 2016 Contextual sensitivity
in scientific reproducibility Proceedings of the National Academy of Sciences 113 6454ndash59
POWER BIAS AND HETEROGENEITY
46
van Erp S et al (2017) Estimates of between-study heterogeneity for 705 meta-analyses reported
in Psychological Bulletin from 1990ndash2013 Journal of Open Psychology Data 5(1) p4 DOI
httpdoiorg105334jopd33
Wicherts J M Veldkamp C L Augusteijn H E Bakker M van Aert R C amp Van Assen
M A (2016) Degrees of Freedom in Planning Running Analyzing and Reporting
Psychological Studies A Checklist to Avoid p-Hacking Frontiers in Psychology 7 doi
103389fpsyg201601832
Yuan K amp Maxwell S (2005) On the post hoc power in testing mean differences Journal of
Educational and Behavioral Statistics 30 141ndash167 doi 10310210769986030002141
POWER BIAS AND HETEROGENEITY
47
Table 1 Median Statistical Power and Average Effect Sizes
Mean Proportion with Adequate Power Median Power Type of Effect
Absolute Effect Sizes WLS WAAP-WLS PET-PEESE WLS WAAP-WLS PET-PEESE
Combined (n=200)
0389 0077 0071 0091 0364 0331 0360
Correlations (n=108)
0458 0243 0328 0272 0577 0610 0607
SMDs (n=92)
0291 0013 0000 0011 0230 0171 0170
Notes The numbers reported in the table are medians Mean absolute effect sizes are reported in this table in units of standardized mean differences (SMD) regardless of whether they were reported in the meta-analysis as correlations or as SMD WLS is the unrestricted weighted least squares weighted average WAAP-WLS is the weighted average of adequately powered effect sizes (WAAP) or WLS when there are no adequately powered studies PET-PEESE is the conditional precision-effect test-precision-effect estimate with standard error meta-regression correction for publication bias Adequate power is defined as 80 following Cohen (1977)
Table 2 Median Statistical Powers by Experimental Design Proportion with Adequate Power Median Power
Experimental Design WLS WAAP-WLS PET-PEESE WLS WAAP-WLS PET-PEESE
Observational (n=113)
0278 0259 0268 0621 0613 0585
Experimental (n=87)
0032 0000 0053 0247 0232 0236
Notes The numbers reported in the table are medians WLS is the unrestricted weighted least squares weighted average WAAP-WLS is the weighted average of adequately powered effect sizes (WAAP) or WLS when there are no adequately powered studies PET-PEESE is the conditional precision-effect test-precision-effect estimate with standard error meta-regression correction for publication bias Adequate power is defined as 80 following Cohen (1977)
Figure 1 Obtaining adequate power (80)
Notes x is distributed as a standard normal distribution N(01) 196 is the critical value for testing against 0 Figure 1 merely illustrates how the standardized mean of the sampling distribution needs to 28 standard errors away from 0 for an experiment to have adequate powermdashCohenrsquos 80 We thank Stephan Bruns for producing this graph
POWER BIAS AND HETEROGENEITY
49
Figure 2 Histograms of Adequately Powered Estimates from 200 Areas of Research
Notes WLS is the unrestricted weighted least squares weighted average WAAP-WLS is the weighted average of adequately powered effect sizes (WAAP) or WLS when there are no adequately powered studies PET-PEESE is the conditional precision-effect test-precision-effect estimate with standard error meta-regression correction for publication bias Adequate power is defined as 80 following Cohen (1977)
0
20
40
60
80
100
120N
um
ber
of M
eta-
An
alys
es
0 2 4 6 8 1Proportion of Studies Adequately Powered
WLS
0
20
40
60
80
100
120
Nu
mbe
r of
Met
a-A
nal
yses
0 2 4 6 8 1Proportion of Studies Adequately Powered
WAAP-WLS
0
20
40
60
80
100
120
Nu
mbe
r of
Met
a-A
nal
yses
0 2 4 6 8 1Proportion of Studies Adequately Powered
PET-PEESE
POWER BIAS AND HETEROGENEITY
50
Figure 3 Histograms of Median Statistical Power from 200 Areas of Research
Notes WLS is the unrestricted weighted least squares weighted average WAAP-WLS is the weighted average of adequately powered effect sizes (WAAP) or WLS when there are no adequately powered studies PET-PEESE is the conditional precision-effect test-precision-effect estimate with standard error meta-regression correction for publication bias Adequate power is defined as 80 following Cohen (1977)
0
10
20
30
40
50
60N
um
ber
of M
eta-
An
alys
es
0 2 4 6 8 1Median Statistical Power
WLS
0
10
20
30
40
50
60
Nu
mbe
r of
Met
a-A
nal
yses
0 2 4 6 8 1Median Statistical Power
WAAP-WLS
0
10
20
30
40
50
60
70
Nu
mbe
r of
Met
a-A
nal
yses
0 2 4 6 8 1Median Statistical Power
PET-PEESE
Figure 4 Histograms of I2 from 200 Areas of Research
Notes I2 is the proportion of observed variation among reported effect sizes that cannot be explained by the calculated standard errors associated with these reported effect sizes It is a relative measure of heterogeneity
0
5
10
15
20
25
30
35
40
45
0 2 4 6 8 1I-squared
Num
ber o
f Met
a-A
naly
ses
POWER BIAS AND HETEROGENEITY
52
Appendix A Studies included in the meta-meta-analysis
1 Baas M Nijstad B A Boot N C amp De Dreu C K W (2016) Mad genius revisited Vulnerability to psychopathology biobehavioral approach-avoidance and creativity Psychological Bulletin 142 668-692 doi101037bul0000049 [2]
2 Balliet D Li N P Macfarlan S J amp Van Vugt M (2011) Sex differences in cooperation A meta-analytic review of social dilemmas Psychological Bulletin 137 881ndash909 doi 101037a0025354 [1]
3 Balliet D Mulder L B amp Van Lange P A M (2011) Reward punishment and cooperation A meta-analysis Psychological Bulletin 137 594-615 doi 101037a0023489 [2]
4 Balliet D Wu J amp De Dreu C K W (2014) Ingroup favoritism in cooperation A meta-analysis Psychological Bulletin 140 1556-1581 doi 101037a0037737 [1]
5 Brewin C R (2014) Episodic memory perceptual memory and their interaction Foundations for a theory of posttraumatic stress disorder Psychological Bulletin 140 69ndash97 doi 101037a0033722 [1]
6 Byron K amp Khazanchi S (2011) Rewards and creative performance A meta-analytic test of theoretically derived hypotheses Psychological Bulletin 138 809ndash830 [1]
7 Cerasoli C P amp Nicklin J M (2014) Intrinsic motivation and extrinsic incentives jointly predict performance A 40-year meta-analysis Psychological Bulletin 140 980-1008 doi 101037a0035661 [1]
8 Chaplin T M amp Aldao A (2013) Gender differences in emotion expression in children A meta-analytic review Psychological Bulletin 139 735-765 doi 101037a0030737 [4]
9 Defoe I N Dubas JS amp Figner B (2015) A meta-analysis on age differences in risky decision making Adolescents versus children and adults Psychological Bulletin 141 48ndash84 doi 101037a0038088 [4]
10 Degner J amp Dalege J (2013) The apple does not fall far from the tree or does it A meta-analysis of parentndashchild similarity in intergroup attitudes Psychological Bulletin 139 1270ndash1304 doi 101037a0031436 [1]
11 Eastwick P W Finkel E J Luchies L B amp Hunt L L (2014) The predictive validity of ideal partner preferences A review and meta-analysis Psychological Bulletin 140 623ndash 665 doi 101037a0032432 [4]
12 Else-Quest N M Higgins A Allison C amp Morton L C (2012) Gender differences in self-conscious emotional experience Psychological Bulletin 138 947ndash981 doi101037a0027930 [5]
13 Fairbairn C E amp Sayette M A (2014) A social-attributional analysis of alcohol response Psychological Bulletin 140 1361-82 doi 101037a0037563 [4]
14 Fischer P Krueger J I Greitemeyer T Vogrincic C Kastenmuumlller A Frey D Heene M Wicher M amp Kainbacher M (2011) The bystander-effect A meta-analytic review on bystander intervention in dangerous and non-dangerous emergencies Psychological Bulletin 137 517ndash537 doi 101037a0023304 [1]
POWER BIAS AND HETEROGENEITY
53
15 Fox MC Ericsson A amp Best (2011) Do procedures for verbal reporting of thinking have to be reactive A meta-analysis and recommendations for best reporting methods Psychological Bulletin 137 316 ndash344 doi 101037a0021663 [2]
16 Fox N A You K H Bowman L C Cannon E N Ferrari P F Bakermans-Kranenburg M J Vanderwert R E amp van IJzendoorn M H (2016) Assessing human mirror activity with EEG mu rhythm A meta-analysis Psychological Bulletin 142 291ndash313 doi101037bul0000031 [2]
17 Freund P A amp Kasten N (2012) How smart do you think you are A meta-analysis on the validity of self-estimates of cognitive ability Psychological Bulletin 138 296-321 doi101037a0026556 [1]
18 Grijalva E Newman D A Tay L Donnellan M B Harms P D amp Robins R W (2015) Gender differences in narcissism A meta-analytic review Psychological Bulletin 141 261-310 doi 101037a0038231 [3]
19 Haedt-Matt A A amp Keel P K (2011) Revisiting the affect regulation model of binge eating A meta-analysis of studies using ecological momentary assessment Psychological Bulletin 137 660ndash681 doi 101037a0023660 [3]
20 Harkin B Webb T L Prestwich A Conner M Kellar I Benn Y amp Sheeran P (2016) Does monitoring goal progress promote goal attainment A meta-analysis of the experimental evidence Psychological Bulletin 142 198-229 doi 101037bul0000025 [2]
21 Houben M Van Den Noortgate W amp Kuppens P (2015) The relation between short-term emotion dynamics and psychological well-being A meta-analysis Psychological Bulletin 141 901-930 doi101037a0038822 [4]
22 Johnsen T J amp Friborg O (2015) The effects of cognitive behavioral therapy as an anti-depressive treatment is falling A meta-analysis Psychological Bulletin 141 747-768 [2]
23 Karlin B Zinger J F amp Ford R (2015) The effects of feedback on energy conservation A meta-analysis Psychological Bulletin 141 1205-1227 doi 101037a0039650 [1]
24 Kim S Thibodeau R amp Jorgensen R S (2011) Shame guilt and depressive symptoms A meta-analytic review Psychological Bulletin 137 68 ndash96 doi 101037a0021466 [2]
25 Klahr A M amp Burt S A (2014) Elucidating the etiology of individual differences in parenting A meta-analysis of behavioral genetic research Psychological Bulletin 140 544ndash586 doi 101037a0034205 [6]
26 Koenig A M Eagly A H Mitchell A A amp Ristikari T (2011) Are leader stereotypes masculine A meta-analysis of three research paradigms Psychological Bulletin 137 616 ndash 642 doi 101037a0023557 [4]
27 Kredlow M A Unger L D amp Otto M W (2016) Harnessing reconsolidation to weaken fear and appetitive memories A meta-analysis of post-retrieval extinction effects Psychological Bulletin 142 314ndash336 doi 101037bul0000034 [3]
28 Kuykendall L Tay L amp Ng V (2015) Leisure engagement and subjective well-being A meta-analysis Psychological Bulletin 141 364-403 doi101037a0038508 [3]
29 Landau M J amp Kay A C (2015) Compensatory control and the appeal of a structured world Psychological Bulletin 141 694ndash722 doi 101037a0038703 [1]
30 Lee E-S Park T-Y amp Koo B (2015) Identifying organizational identification as a basis for attitudes and behaviors A meta-analytic review Psychological Bulletin 141 1049ndash1080 doi 101037bul0000012 [1]
POWER BIAS AND HETEROGENEITY
54
31 Lui P P (2015) Intergenerational cultural conflict mental health and educational outcomes among Asian and Latinoa Americans Qualitative and meta-analytic review Psychological Bulletin 141 404-446 doi101037a0038449 [3]
32 Lull R B amp Bushman B J (2015) Do sex and violence sell A meta-analytic review of the effects of sexual and violent media and ad content on memory attitudes and buying intentions Psychological Bulletin 141 1022ndash1048 doi 101037bul0000018 [6]
33 Mazei J Freund P A Huumlffmeier J amp Stuhlmacher A F (2015) A meta-analysis on gender differences in negotiation outcomes and their moderators Psychological Bulletin 141 85ndash104 doi 101037a0038184 [1]
34 Melby-Lervaringg M Lyster S A amp Hulme C (2012) Phonological skills and their role in learning to read A meta-analytic review Psychological Bulletin 138 322ndash352 doi 101037a0026744 [3]
35 Melby-Lervaringg M amp Lervaringg A (2014) Reading comprehension and its underlying components in second-language learners A meta-analysis of studies comparing first- and second-language learners Psychological Bulletin 140 409ndash433 doi 101037a0033890
[4] 36 Mendelson J L Gates J A amp Lerner M D (2016) Friendship in school-age boys with
autism spectrum disorders A meta-analytic summary and developmental process-based model Psychological Bulletin 142 601-622 doi 101037bul0000041 [2]
37 Mol S E amp Bus A G (2011) To read or not to read A meta-analysis of print exposure from infancy to early adulthood Psychological Bulletin 137 267ndash296 doi 101037a0021890 [13]
38 Orquin J L amp Kurzban R (2016) A meta-analysis of blood glucose effects on human decision making Psychological Bulletin 142 546ndash567 doi 101037bul0000035 [1]
39 Ottaviani C Verkuil B Medea B Couyoumdjian A Thayer JF Lonigro A amp Brosschot J F (2016) Physiological concomitants of perseverative cognition A systematic review and meta-analysis Psychological Bulletin 142 No 3 231ndash259 doi 101037bul0000036 [8]
40 North M S amp Fiske S T (2015) Modern attitudes toward older adults in the aging world A cross-cultural meta-analysis Psychological Bulletin 141 993ndash1021 doi 101037a0039469 [1]
41 Pahlke E Hyde J S amp Allison C M (2014) The effects of single-sex compared with coeducational schooling on studentsrsquo performance and attitudes A meta-analysis Psychological Bulletin 140 1042-1072 doi 101037a0035740 [2]
42 Pan S C amp Rickard T C (2015) Sleep and motor learning Is there room for consolidation Psychological Bulletin 141 812-834 doi 101037bul0000009 [1]
43 Phillips W J Fletcher J M Marks A D G amp Hine D W (2016) Thinking styles and decision making A meta-analysis Psychological Bulletin 142 No 3 260ndash290 doi 101037bul0000027 [4]
44 Pool E Brosch T Delplanque S amp Sander D (2016) Attentional bias for positive emotional stimuli A meta-analytic investigation Psychological Bulletin 142 No 1 79ndash106 doi 101037bul0000026 [1]
45 Randall J G Oswald F L amp Beier M E (2014) Mind-wandering cognition and performance A theory-driven meta-analysis of attention regulation Psychological Bulletin 140 1411ndash1431 doi 101037a0037428 [4]
POWER BIAS AND HETEROGENEITY
55
46 Sambrook T D amp Goslin J (2015) A neural reward prediction error revealed by a meta-analysis of ERPs using great grand averages Psychological Bulletin 141 213ndash235 doi 101037bul0000006 [4]
47 Sedlmeier P Eberth J Schwarz M Zimmermann D Haarig F Jaeger S amp Kunze S (2012) The psychological effects of meditation A meta-analysis Psychological Bulletin 138 1139ndash1171 doi 101037a0028168 [20]
48 Sheeran P Harris P R and Epton T (2014) Does heightening risk appraisals change peoplersquos intentions and behavior A meta-analysis of experimental studies Psychological Bulletin 140 511ndash543 doi 101037a0033065 [2]
49 Smith S F amp Lilienfeld S O (2015) The response modulation hypothesis of psychopathy A meta-analytic and narrative analysis Psychological Bulletin 141 1145ndash1177 doi 101037bul0000024 [1]
50 Soderberg C K Amit E Callahan S P Kochersberger A O amp Ledgerwood A (2015) The effects of psychological distance on abstraction Two meta-analyses Psychological Bulletin 141 3 525ndash548 doi101037bul0000005 [2]
51 Tannenbaum M B Hepler J Zimmerman R S Saul L Jacobs S Wilson K amp Albarraciacuten D Appealing to fear A meta-analysis of fear appeal effectiveness and theories Psychological Bulletin 141 1178ndash1204 doi101037a0039729 [1]
52 Toosi N R Babbitt L G Ambady N amp Sommers SR (2012) Dyadic interracial interactions A meta-analysis Psychological Bulletin 138 1ndash27 doi 101037a0025767 [4]
53 Vachon D D Lynam D R amp Johnson J A (2014) The (Non)relation between empathy and aggression Surprising results from a meta-analysis Psychological Bulletin 140 751ndash773 doi 101037a0035236 [1]
54 Verhage M L Schuengel C Madigan S Fearon R M P Oosterman M Cassibba R Bakermans-Kranenburg M J amp van IJzendoorn M H (2016) Narrowing the transmission gap A synthesis of three decades of research on intergenerational transmission of attachment Psychological Bulletin 142 337ndash366 doi 101037bul0000038 [2]
55 von Stumm S amp Ackerman P L (2013) Investment and intellect A review and meta-analysis Psychological Bulletin 139 841ndash869 doi 101037a0030746 [11]
56 Voyer D amp Voyer S D (2014) Gender differences in scholastic achievement A meta-analysis Psychological Bulletin 140 1174-1204 doi 101037a0036620 [6]
57 Vucasović T amp Bratko D (2015) Heritability of personality A meta-analysis of behavior genetic studies Psychological Bulletin 141 769ndash785 doi101037bul0000017 [1]
58 Wanberg C R Hamann D J Kanfer R amp Zhang Z (2016) Age and reemployment success after job loss An integrative model and meta-analysis Psychological Bulletin 142 400-426 doi 101037bul0000019 [6]
59 Weingarten E Chen Q McAdams M Yi J amp Hepler J (2016) From primed concepts to action A meta-analysis of the behavioral effects of incidentally presented words Psychological Bulletin 142 472ndash497 doi 101037bul0000030 [1]
60 Williams M J amp Tiedens L Z (2016) The subtle suspension of backlash A meta-analysis of penalties for womenrsquos implicit and explicit dominance behaviour Psychological Bulletin 142 165ndash197 doi 101037bul0000039 [6]
POWER BIAS AND HETEROGENEITY
56
61 Winer E S amp Salem T (2016) Reward devaluation Dot-probe meta-analytic evidence of avoidance of positive information in depressed persons Psychological Bulletin 142 18ndash78 doi 101037bul0000022 [6]
Notes Numbers in square brackets denote the number of meta-analyses included in the dataset
Appendix B Distribution of survey estimates
Year
No of meta-analyses published
No of meta-analyses sampled
of published meta-studies
No of estimates
of sample
2016 17 14 82 46 22 2015 22 18 82 40 19 2014 25 12 48 46 22 2013 17 3 18 16 8 2012 15 6 40 34 16 2011 19 8 42 31 15

POWER BIAS AND HETEROGENEITY
15
statistically significant amounts of heterogeneitymdashI2 = 36 (Hagger et al 2016) and 45
(Eerland et al (2016) Furthermore Klein et al (2015) reported a large-scale effort to replicate 15
findings across 36 different sites that intentionally differed in a variety of characteristics (eg
studies completed online or in the laboratory samples from the United States or elsewhere) Not
surprisingly they found significant amounts of heterogeneity in eight of the 16 effects that were
replicated (I2 = 23 to 91) however a comparison of the intra-class correlation among effects
to the intra-class correlation among sites found that very little of this heterogeneity in effect sizes
was accounted for by differences in the sites suggesting that heterogeneity was genuinely a
characteristic of the phenomena being studied Of course heterogeneity would be expected to be
higher when replications are lsquoconceptualrsquo (ie those making little attempt to duplicate all of the
relevant design characteristics of the original study) or when lsquohidden moderatorsrsquo influence
research outcomes
In the face of large heterogeneity replicability will be severely compromised For example
suppose that the true mean correlation is 02 which is roughly consistent with what past surveys
in psychology have found (Richard et al 2003) and that the standard deviation in the distribution
of true effects due to heterogeneity is approximately the same size6 Then the probability that a
replication will correctly return a medium-to-large true effect (r gt 03) or a negative or negligible
true effect (r lt 01) is 62 In other words if an original study measures an effect that is influenced
by notable heterogeneity a replication attempt of that study can appear to have failed when in
fact both accurately measure different true effects With high heterogeneity the psychological
6 These magnitudes are roughly consistent with what our survey finds to be typical among recent Psychological Bulletin meta-analyses
POWER BIAS AND HETEROGENEITY
16
effect in question is itself too variable or context sensitive regardless of bias or sample size to be
successively replicated frequently
Methods
Data collection
To assess power bias and heterogeneity in psychological research we require both effect
sizes and their standard errors over a wide range of psychological studies Since only past meta-
analyses are likely to have collected the requisite information to calculate power and because
Psychological Bulletin is the premier journal for meta-analysis in psychology we use it to define
our sampling frame We took a convenience sample of the 200 most recently published meta-
analyses (as of June 1 2016) for which we could acquire the necessary statistics Thus our unit of
analysis is a meta-analysis and all of dozens of the individual estimates therein To the extent that
Psychology Bulletin meta-analyses are representative of the population of empirical psychology
our findings will also be representative of psychological research However as an anonymous
referee points out we can only be sure that our survey is representative of the research that the
editors and reviewers of the Psychology Bulletin consider to be of top quality and relevant to
psychology We focused on the most recent issues of the Psychological Bulletin ending June 1
2016 because the topics covered in more recent issues are more likely to reflect contemporary
psychological research interests7
Before our survey of 200 meta-analyses commenced we posted a pre-analysis plan at Open
Science Framework June 1 2016 (httpsosfio4znzpwikihome) In December of 2016 we
7 As we discuss in greater detail below the findings from our survey are also consistent with past surveys of psychological research Thus these 200 meta-analyses are likely to be similarly representative as those past surveys
POWER BIAS AND HETEROGENEITY
17
filed an amended pre-analysis plan to increase the number of meta-analyses surveyed from the
originally planned 100 to 200 while keeping everything else the same We made this adjustment
to maintain a broad coverage across areas of research even though the typical meta-analysis paper
published in Psychological Bulletin contains more than 3 separate meta-analyses Our survey
satisfies the Meta-Analysis Reporting Standards (MARS)
Search strategies As noted above only meta-analysis published in Psychological Bulletin
were considered We manually searched all issues of Psychological Bulletin from 2011 to 2016
as detailed in Table B1 We began with the June 2016 issue of Psychological Bulletin and worked
backwards until we obtained the required statistics from 200 meta-analyses When necessary we
contacted authors for their data The data collection ended when 200 meta-analysis datasets with
the needed information were gathered from 61 papers published between 2011 to 2016 in the
Psychological Bulletin These 61 papers are listed in Appendix A During this period there were
115 meta-analysis papers published in Psychological Bulletin Hence we include meta-analyses
from 53 of these papers
Inclusion and exclusion criteria All the studies are in English Studies were eligible for
inclusion in our study if they provided data on the estimated effect sizes and their standard errors
either in the paper or in a supplement
We exclude four categories of meta-analyses First we exclude any meta-analysis that did
not report both effect sizes and their standard errors Consequently we also exclude systematic
reviews as opposed to meta-analyses because they typically do not fully report all effect sizes and
their standard errors Second to avoid double-counting we exclude any meta-analysis from a
POWER BIAS AND HETEROGENEITY
18
reply or comment to a published meta-analysis that was already part of our database Third we
exclude a couple of meta-analyses that used partial eta squared as the effect size Partial eta squared
cannot be used in conventional power calculations a central outcome of our survey nor can they
be converted and compared to other types of effect sizes (correlations and standardized mean
differences) used in all of the other 200 meta-analyses Fourth we exclude any meta-analysis with
fewer than 5 observations because all statistical calculations are unreliable when based on only a
handful of measures8 Appendix B presents the distribution of studies across the six-year period
included in our sample Our meta-analysis survey contains over 80 of the meta-analysis papers
published in 2015 and 2016 as a larger proportion of more recent publications report the necessary
data
Coding procedures The data used in the survey were reported by authors of published meta-
analyses in Psychological Bulletin This data was extracted by all three authors all of whom are
very experienced in data retrieval There were no disputes in coding as we used the data supplied
by authors themselves No issues of study quality arose as all the meta-analyses are published in
Psychological Bulletin and have already undergone a rigorous review process
54 of the effect sizes in our sample are reported as correlations All of our calculations
of power heterogeneity and bias are made for each of the 200 meta-analyses in the meta-analysisrsquos
originally reported measure of effect size Hence all summary calculations are independent of the
type of effect size or of the transformation of one to the other However for descriptive clarity
and simplicity meta-averages in terms of correlation are converted to standardized mean
differences (Cohenrsquos d) to be comparable to the others A minority of meta-analyses report
8 This requirement removes only two meta-analyses
POWER BIAS AND HETEROGENEITY
19
Hedgesrsquo g correction of standardized mean differences (SMD) for degrees of freedom We make
no conversion between Cohenrsquos d and Hedgesrsquo g because it does not make a practical difference
to any of our calculations
To highlight the types of meta-analytic studies included in our survey and to discuss some
of the issues that naturally arise we use two of these 61 Psychological Bulletin papers North and
Fiske (2015) ldquoModern attitudes toward older adults in the aging world A cross-cultural meta-
analysisrdquo and Williams and Tiedens (2016) ldquoThe subtle suspension of backlash A meta-analysis
of penalties for womenrsquos implicit and explicit dominance behaviorrdquo Williams and Tiedens (2016)
report six separate meta-analyses of lsquobacklashrsquo to womenrsquos dominance behavior and all six are
included in our survey of 200 meta-analyses Three of these meta-analyses concern the simple
effect of gender from dominance behavior on likability competence and lsquodownstreamrsquo outcomes
such as hireability The other three meta-analyses involve the interaction of gender and dominance
on these same three types of outcome measures Williams and Tiedens (2016) include a mix of
experimental and correlational studies but most (85) are experimental Because all six separate
meta-analyses are reported and discussed by Williams and Tiedens (2016) all six are included in
our survey
In contrast North and Fiske (2015) report only one meta-analysis of observational studies
about East-West attitudes towards older adults North and Fiske (2015) combined quantitative
outcomes involving attitude measures on ageism the aging process perceived wisdom warmth
etc as well as behavior-based measures from contact with older adults (p 999) Clearly North
and Fiske (2015) thought these different outcomes measures to be sufficiently similar or
homogeneous to be compared and treated as the same phenomenon However like most meta-
POWER BIAS AND HETEROGENEITY
20
analytic studies in psychology North and Fiske (2015) also conduct a moderator analysis that
investigated the effect of different outcomes measures among others9
It is important to note that we do not choose the level of aggregation of the meta-analyses
that are included on our survey Rather in all cases we follow the professional judgement of
experts in these specific areas of psychological research In the example of gender and dominance
research Williams and Tiedens do not judge that the effects on likeability competence and
downstream outcomes to be sufficiently homogeneous to be analyzed together It seems sensible
that any measure of likeability for example reflects the same phenomenon as any other measure
of likeability when evaluating the effects of gender and dominance Regardless the judgment
about where to draw the line is better made by those experts who have read coded summarized
and analyzed the entire relevant research literature(s)mdashWilliams and Tiedens in this case
Similarly Williams and Tiedens (2016) consider interaction effects to be too different from the
simple effects and from each other to be aggregated Because these are different psychological
phenomenon containing non-overlapping effect sizes we include these interaction studies as well
This issue is potentially important because the level of aggregation of the meta-analyses may have
implications about how much heterogeneity is found The broader more encompassing the level
of aggregation the higher one would expect heterogeneity to be
Meta-Estimates of lsquoTrue Effectrsquo
To be both conservative and robust we use three meta-estimators of lsquotruersquo effect because
the meta-estimate that one chooses might in some individual cases make a practically notable
9 Separate meta-analyses cannot be generally constructed for all reported moderator variables in these meta-analysis studies thus we do not include further subdivided moderator meta-analyses Often meta-regression is used for moderator analysis and only summary results are reported Even when separate moderator subsets are investigated it is often the case that insufficient information is reported for us to make these separations
POWER BIAS AND HETEROGENEITY
21
difference in how a given area of research is characterized We investigate three reasonable
alternative proxies for lsquotruersquo effect drawn from all the reported results in a given research subject
to be sure that our survey results are in fact robust to the chosen meta-method of estimating effect
and also to potential selective reporting bias
To be clear there is no perfect estimate of the lsquotruersquo effect size (or the mean of the
distribution of true effect sizes) when some authors reviewers or editors preferentially select
statistically significant effects (Stanley 2017 Stanley Doucouliagos amp Ioannidis 2017) With
selective reporting bias (aka publication bias the file drawer problem small-sample bias and p-
hacking) all meta-estimates are biased because the data from which they are calculated are
themselves biased to an unknowable degree However a series of statistical simulation studies
have documented how some estimators are more biased than others when there is selective
reporting bias (Stanley 2008 Moreno et al 2009 Stanley amp Doucouliagos 2014 Stanley amp
Doucouliagos 2015 Stanley Doucouliagos amp Ioannidis 2017 Stanley 2017)
Conventional meta-analysis typically estimates true effects using either lsquofixed-effectsrsquo
(FE) or a lsquorandom-effectsrsquo (RE) weighted average or both (Hedges amp Olkin 1985 Cooper amp
Hedges 1994 Stanley amp Doucouliagos 2015) The lsquofixed-effectrsquo weighted average employs
optimal weights that are the same as those used by a recently proposed unrestricted weighted least
squares (WLS) weighted average (Stanley amp Doucouliagos 2015) We prefer the unrestricted
WLS version of the conventional fixed-effect meta-analysis for inferential purposes because the
unrestricted WLS weighted average automatically accounts for heterogeneity when calculating
confidence intervals or significance tests (Stanley amp Doucouliagos 2015) This WLS estimator is
POWER BIAS AND HETEROGENEITY
22
also consistently less biased than RE when there is selective reporting bias10 The point estimates
of WLS and FE must always be exactly the same thus using WLS is exactly equivalent to using
FE in our survey11
Our second estimator exploits the importance of statistical power by over-weighting the
most precise largest studies The weighted average of the adequately powered (WAAP) uses the
same formulas as does WLS (or FE) but applies it only on those estimates found to be adequately
powered relative to WLS as the proxy for true effect WAAP is more resilient to selective reporting
biases because adequately powered studies are more reliable and require fewer questionable
research practices to achieve statistical significance Simulations show that WAAP is as good as
random-effects when there are no selective reporting biases and dominates RE when there is
selective reporting for statistical significance When half of the reported experimental results have
been selected for their statistical significance WAAP consistently reduces bias on average by
50 (Stanley Doucouliagos amp Ioannidis 2017) The weakness of WAAP is that it cannot be
computed if there are no studies with adequate power a condition found in 35 of the 200 areas
of psychological research that comprise our survey Thus Stanley Doucouliagos amp Ioannidis
(2017) propose using WLS when WAAP cannot be computed giving a WAAP-WLS weighted
10 We have chosen not to use the lsquorandom-effectsrsquo weighted average to assess power because RE is widely known to be more biased than FE and thereby WLS when there is selective reporting bias (Poole amp Greenland 1999 Sutton et al 2000 Henmi amp Copas 2010 Stanley amp Doucouliagos 2014 Stanley amp Doucouliagos 2015 Stanley Doucouliagos amp Ioannidis 2017 Stanley 2017) WLS and FE give less weight than RE to small-sample studies where selective reporting is likely to be the most severe In the aggregate giving more weight to the largest studies and less weight to small studies will reduce selective reporting bias if it is present and is statistically sensible even when it is not Besides WLS estimates remain practically as good as or better than conventional lsquorandom-effectsrsquo meta-analysis when there is no selective reporting for statistical significance (Stanley amp Doucouliagos 2015 Stanley Doucouliagos amp Ioannidis 2017) 11 For those readers who wish to know how to calculate WLSrsquos standard error or confidence interval please consult Stanley amp Doucouliagos (2015) and Stanley Doucouliagos amp Ioannidis (2017) However any basic regression routine will automatically calculate our unrestricted WLS weighted average when one uses the standardized effect size (effect size divided by it standard error) as the dependent variable and precision (1SE) as the independent variable with no intercept Nothing else is needed
POWER BIAS AND HETEROGENEITY
23
average In the below assessments of power and bias WAAP-WLS is the second approach that we
employ WAAP-WLS has the added value of forcing meta-analysts to seriously consider and
report the statistical powers found in their area of research12
WLS and WAAP-WLS passively moderate selective reporting bias In contrast simple
meta-regression models have been shown to reduce selective reporting bias more aggressively
when it is present (Stanley 2005 Stanley 2008 Moreno et al 2009 Stanley amp Doucouliagos
2014 Stanley amp Doucouliagos 2015 Stanley amp Doucouliagos 2017 Stanley Doucouliagos amp
Ioannidis 2017 Stanley 2017) The precision-effect test-precision effect estimate with standard
error (PET-PEESE) is a conditional estimate of average effect from simple WLS meta-regressions
of each estimated effect size on its standard error (PET) or alternatively on its variance
(PEESE)mdashStanley amp Doucouliagos (2014) When only statistically significant positive results
are reported selective reporting bias is known to be equal to the reported estimatersquos standard error
times the inverse Millsrsquo ratio (Stanley amp Doucouliagos 2014 p 61) The inverse Millsrsquo ratio is a
complex function of the true effect and the standard error which Stanley and Doucouliagos (2014)
approximate by a restricted polynomial function of the standard error (PEESE) When the true
effect is zero it can also be shown mathematically that this complex function collapses to a linear
relation with standard error giving PET (Stanley amp Doucouliagos 2014) A series of statistical
simulation studies documents how PET-PEESE often greatly reduces selective reporting bias and
is preferable to conventional meta-analysis methods and to the lsquotrim-and-fillrsquo publication bias
correction algorithm (Stanley 2008 Moreno et al 2009 Stanley amp Doucouliagos 2014 Stanley
amp Doucouliagos 2017 Stanley Doucouliagos amp Ioannidis 2017 Stanley 2017) PET-PEESE
provides a more aggressive approach to selective reporting bias than any simple weighted average
12 It is our belief that all meta-analyses should report typical power as one objective metric of research quality
POWER BIAS AND HETEROGENEITY
24
but it too has limitations overcorrecting for publication bias in some cases (Stanley 2017 Stanley
Doucouliagos amp Ioannidis 2017 Stanley 2017)13
To recap we calculate power and bias in a robust yet conservative manner by employing
three proxies of lsquotruersquo average effect size (1) the WLS unrestricted weighted average with point
estimates equivalent to the fixed-effect (2) the weighted average of the adequately powered
(WAAP-WLS) and (3) the PET-PEESE meta-regression reduction of selective reporting bias
Two of these approaches (WLS and WAAP-WLS) are quite lsquoconservativersquo in the sense that they
are known to overestimate true effect if there is any type of selective reporting bias lsquoConservativersquo
in this context means they give the benefit of doubt to the psychological research record as reported
and are likely to overestimate psychological researchrsquos power on average PET-PEESE on the
other hand more aggressively attempts to identify and filter out selective reporting bias thus it is
possible to underestimate true effect and thereby underestimate statistical power in some cases
(Stanley 2017) Because our survey is merely descriptive we focus on the median powers across
reported effect sizes research topics and also across these three estimation approaches to the
average true effect size The median of these three will thus be conservative and tend to
overestimate the quality of psychological research14
Assessing adequate power
13 We do not use Simonsohn Nelson amp Simmonsrsquos (2014) lsquop-curversquo correction for lsquop-hackingrsquo Recently several papers establish that the p-curve approach is biased and unreliable when there is either heterogeneity misspecification biases or when some insignificant studies are reported (Bruns amp Ioannidis 2016 McShane Boumlckenholt amp Hansen 2016 van Aert et al 2016) Such conditions are ubiquitous in the social sciences For example we find that the typical heterogeneity variance among the 200 meta-analyses that we survey is nearly 3 times larger than the corresponding random sampling variance That is 74 of the observed variation of reported research results from study to study is typically due to actual differences in the true effect (heterogeneity) or to differential bias in either case overwhelming the p-curversquos assumed pattern of p-values from sampling errors alone 14 Our overall survey results do not depend on the accuracy or validity of PET-PEESE We include PET-PEESE only for the sake of robustness to see what if any difference might result when a more aggressive approach to reducing selective reporting biased is used Below we find that it makes little difference
POWER BIAS AND HETEROGENEITY
25
With the WLS WAAP-WLS and PET-PEESE estimates of the lsquotruersquo effect for a given
area of research adequate power is easy to assess We assume the null hypotheses are two tailed
with a 5 significance level and we accept Cohenrsquos 80 as the definition of adequate power
These conventions for Type I and Type II errors imply that the lsquotruersquo effect needs to be equal to or
greater than 28 standard errors in absolute magnitude if power is to reach 80 This value of 28
is the sum of 196 and 084 where 196 is the minimum number of standard errors from zero that
an observed effect must fall to be rejected with a 5 significance level and 084 is the number of
additional standard errors that the true effect must fall from zero such that 80 of the distribution
of the observed effect is in the rejection regionmdashsee Figure 1 Hence for a study to have adequate
power its standard error needs to be smaller than the absolute value of the underlying mean lsquotruersquo
effect divided by 28 All that remains to assess adequate power retrospectively are (1) the values
of the standard error and (2) an estimate (or estimates) of the lsquotruersquo effect If the standard error of
a study is less than the absolute value of an estimate lsquotruersquo effect (from WLS WAAP-WLS or
PET-PEESE) divided by 28 we know that this study is adequately powered to detect a lsquotruersquo
effect equal or greater than this estimate Median power for a given area of research can then be
calculated from the cumulative normal probability of the difference between 196 and the absolute
value of an estimate of the true effect divided by the median standard error Because our survey
is merely descriptive we focus on the median powers across reported effect sizes areas of
research and also across these three estimation approaches to the average true effect size The
median of these estimation approaches will thus be conservative and tend to overestimate the
quality of psychological research
POWER BIAS AND HETEROGENEITY
26
Assessing residual selective reporting bias
If an area of research is selectively reporting effect size to be statistically significant in a
direction consistent with the prevailing psychological theory then the average reported effect will
on average have a larger magnitude than the true effect (whether or not prevailing psychological
theory suggests a direct or an inverse association) As before we can use these meta-averages
WLS WAAP-WLS and PET-PEESE as proxies for lsquotruersquo effect and then compare them to
average reported effect for an assessment of residual reporting bias Needless to say each reported
estimate is subject to random sampling error and will be sometimes larger and sometimes smaller
than the mean true effect Such differences cannot be regarded as lsquobiasrsquo but merely as sampling
or estimation errors However when there is a systematic trend for the unadjusted simple average
to be larger than a meta-average known to be less biased when there is selective reporting bias
then we can regard the difference between the absolute value of the simple mean and the absolute
value of WLS or WAAP-WLS as the lower limit of bias when it persists consistently over hundreds
of separate areas of research Using this approach Ioannidis Stanley amp Doucouliagos (2017) find
that the typical reported estimate in economics is twice as large or larger than either WAAP or
PET-PEESE In sharp contrast our survey of psychology finds on average only a small amount
of consistent exaggeration or overall selective reporting bias
Results
Among these 200 areas of psychological research containing 12065 estimated effect the
average effect size is 0389 expressed as the median of average standardized mean differences or
0191 as a correlation coefficient This overall effect size is nearly the same as the average of the
first 100 years of social psychology (r = 021) uncovered by Richard Bond amp Stokes-Zoota
POWER BIAS AND HETEROGENEITY
27
(2003) The typical standard error is 0104 expressed as a correlation 021 when represented by
a standardized mean difference (SMD) The p-value produced by these averages is a little larger
than the conventional 05 level Other researchers across several disciplines have found that that
p-values tend to lump up at or just below 05 (Gerber amp Malhotra 2008 Brodeur Sangnier amp
Zylberberg 2016) Contrary to recent concerns about publication bias questionable research
practices and null hypothesis significance testing we find that the typical psychological research
study is statistically insignificant at the conventional 05 level of significance
Table 1 reports the median absolute value of the average reported effect size from these
200 meta-analyses Here all effect sizes are first converted to standardized mean differences
(SMD) to be comparable However an interesting pattern emerges when these 200 meta-analyses
are divided by the types of effect sizes that are commonly reported correlation vs SMD The
typical effect size found among the 108 lsquocorrelation-basedrsquo meta-analyses in our survey (0458 in
SMD units) is 57 larger than those meta-analyses measured by SMDs (0291)15
Power
The median of the percent of reported effects that are adequately powered across these 200
areas of research are (1) 77 when the unrestricted WLS (or fixed effect) weighted average is
used to represent the mean of the true effects distribution (2) 71 when WAAP-WLS proxies for
lsquotruersquo effect and (3) 91 if PET-PEESE substitutes for true effect Figure 2 displays the
distributions of the proportion of studies that are adequately powered across these 200 areas of
15 We thank Frank Schmidt for pointing out that technically only point-biserial correlations can be converted to Cohenrsquos d Ceteris paribus other correlations will be larger than the point-biserial correlation due to the latterrsquos restricted range Thus a small part of the larger effect average effect size of lsquocorrelation-basedrsquo meta-analyses might be due to the conversion of all correlations to Cohenrsquos d Because these 108 lsquocorrelation-basedrsquo meta-analyses often contain an undisclosed mix of correlation types we cannot fully correct this small bias However as we discussed above none of our calculations of power heterogeneity or bias depend in any way on the transformation of correlations to standardized mean differences
POWER BIAS AND HETEROGENEITY
28
research Clearly underpowered studies dominate psychological research But how underpowered
are they
We also calculate the median powers for each of these 200 areas of research The typical
power of psychological research is around 36 364 based on WLS 331 based on WAAP-
WLS and 36 based on PET-PEESE16 Figure 3 shows the distribution of median powers across
these 200 areas of research Note their striking shapes The two most frequent categories are the
lowest (0-10) and the highest (over 90) Even though typical areas of research are quite
inadequately powered as measured by median power approximately one-fifth of these 200 areas
of psychological research are quite highly-powered Between 19 and 23 have average statistical
power 90 or highermdashsee Figure 3 It should not be surprising that some areas of research have
high power Aside from sample size statistical power depends on the underlying true effect size
and some psychological phenomena have large effects When WAAP-WLS is used to estimate
true effect one-third of these 200 areas of psychological research (32) have lsquolargersquo or lsquomediumrsquo
effect sizes defined as |WAAP-WLS| gt 05 SMD Even rather modest sample sizes will estimate
large effects powerfully
As before we find striking difference between correlation-based meta-analyses and SMD-
based meta-analyses Table 1 breaks down the median proportion of studies that are adequately
powered and the median power by type of effect size Those areas of psychological research that
predominately report standardized mean differences (SMDs) are highly under-powered typically
99 are underpowered compared to 67 to 76 for correlation-based meta-analyses The median
16 This is somewhat less than a recent survey Fraley amp Vazire (2014) which found a median power to detect a correlation of 02 to be 49 among top social-personality journals for the years 2006-2010 But then Fraley amp Vazire (2014) calculate prospective rather than retrospective power and their sampling frame is different than ours Thus we would expect some differences especially when considering that our median power calculations reflect both the observed effect size of each area of research and the distribution of statistical power within an area of research
POWER BIAS AND HETEROGENEITY
29
statistical power in SMD meta-analyses is between 17 to 23 For correlation-based research
typical power is nearly three times highermdash58 to 61
Residual selective reporting bias
Recall that residual reporting bias may be calculated as the difference between the absolute
value of the simple mean reported effect and the absolute value of one of our less vulnerable
proxies for true effectmdashWLS WAAP-WLS or PET-PEESE We find only small amounts of
residual reporting bias in psychological research 8 based on WLS 12 based on WAAP-WLS
and 15 based on PET-PEESE Thus our survey identifies only a small systematic exaggeration
overall
There are some important qualifications to make about this finding First all these
estimates are themselves biased and two of them consistently underestimate residual bias when
there is selective reporting (Stanley and Doucouliagos 2014 Stanley and Doucouliagos 2015
Stanley et al 2017 Stanley 2017) Second a notable proportion of psychology might still be
affected by selective reporting bias even if the median amount of exaggeration is relatively small
275 (or 55 areas of research) find evidence of some type of selective reporting or small-sample
bias using the Egger test for funnel plot asymmetry and this is likely to be an under-estimate of
the incidence of these biases because the Egger test is known to have low power (Egger et al
1997 Stanley 2008) Third we again find notable differences between types of effect sizes
reported by meta-analysts When using WLS as a proxy for the true effect we find that the simple
mean of reported SMDs is now exaggerated by 13 on average by 20 if WAAP-WLS
substitutes for true effect and by 30 relative to the median absolute value of PET-PEESE
POWER BIAS AND HETEROGENEITY
30
Heterogeneity
The median percent of the observed variation of reported effect sizes within a given area
of research that is attributed to heterogeneity (I2) is 74 This means that the variance among lsquotruersquo
effects is nearly 3 times larger than the reported sampling variance According to Pigottrsquos (2012)
guidelines for small (25) medium (50) and large (75) heterogeneity typical areas of research
have nearly lsquolargersquo excess heterogeneity Yet this level of heterogeneity appears to be the norm
for research in psychology For example van Erp et al (2017) extracted estimates of heterogeneity
from 705 meta-analyses published in Psychological Bulletin between 1990 and 2013 and found
that the median reported I2 = 7062 (interquartile range [3324 8741]) However I2 is a
relative measure of heterogeneity and does not reflect the variation in true effect as measured in
units of SMDs When our median I2 is applied to the typical area of research the standard deviation
among true effects is 0354 SMD and the standard deviation from one study to the next due to both
heterogeneity and sampling error becomes 0412 larger than the typical reported effect size 0389
lsquoExperimentalrsquo vs lsquoobservationalrsquo research
As a post hoc secondary analysis17 we examined whether the systematic differences
between SMD-based and correlation-based meta-analyses are due to experimental design
lsquoexperimentalrsquo vs lsquoobservationalrsquo Unfortunately this differentiation is not perfect Many meta-
analyses contain a mix of experimental and observational research designs at the study level For
example Williams and Tiedens (2015) meta-analysis of the effects of gender and dominance
17 Investigating these differences was not part of our pre-analysis plan Anonymous reviewers asked that we code for experimental design and report the differences
POWER BIAS AND HETEROGENEITY
31
behavior includes 97 experimental studies (85) where dominance behavior was somehow
manipulated and 17 purely observational studies
Because a substantial percent (424) of those meta-analyses that report effect sizes in
terms of SMD are lsquoobservationalrsquo and 314 of correlation-based meta-analyses are
lsquoexperimentalrsquo there is only small correlation (phi=0263 plt001) between experimental design
(1 if primarily experimental 0 elsewhere) and effect type (1 if SMD 0 for correlation) However
we do see some interesting differences in power and heterogeneity by experimental design First
there is a difference between heterogeneity as measured by I2 (plt01) The median I2 for
experimental research is 68 vs 76 for observational designs But I2 is a relative measure of
heterogeneity with a non-symmetric distribution To correct for I2rsquos nonstandard distribution we
use Abramowitz and Stegunrsquos (1964) normal approximation for the chi-square distribution applied
to the Cochran Q-test for heterogeneity Doing so causes this difference in relative heterogeneity
to be only marginally larger than statistical noise (p=045) Additionally experimental research
designs have larger sampling errors and lower power Typical sampling errors are 026 vs 019
measured as median SEs in units of SMD Table 2 reports the median proportion of studies that
are adequately powered and the median of median powers by type of research design Even though
there is only a small association between experimental design and effect type we find a similar
pattern among the typical levels of power for experimental design that we see for effect type
confirming the concerned expressed by dozens of researchers over the years that scarcely any
experimental studies are adequately powered All of these results about lsquoexperimentalrsquo vs
lsquoobservationalrsquo research designs should be interpreted with caution because as mentioned they
are conducted post hoc
POWER BIAS AND HETEROGENEITY
32
Discussion
Our survey of 12065 estimated effects sizes from nearly 8000 studies in 200 meta-
analyses reveals that the typical effect size is 0389 SMD with a median standard error of 021 We
also find low statistical power small residual selection bias and high levels of heterogeneity The
central purpose of our review is to assess the replicability of psychological research through meta-
analysis and thereby better understand recent failures to replicate Our findings implicate low
statistical power and high levels of heterogeneity as the primary causes of lsquofailedrsquo replications
however defined
We find that only a small proportion of psychological studies are adequately powered
approximately 8 and the median power is about 36 across three proxies for the mean lsquotruersquo
effect18 What does this imply about replication Our survey predicts therefore that replication
study with a typical sample size will have only a 36 chance of finding a statistically significant
effect in the same direction as some previous study and this value is exactly the same percent of
replications found to be statistically significant in the same direction by the Open Science
Collaboration (Open Science Collaboration 2015 Table 1) Thus when replication is viewed in
terms of sign and statistical significance it is no wonder that rates of replication are considered
low in psychology research
Improving replication as noted by others (eg Maxwell et al 2015) would seem to be a
matter of conducting both initial studies and replications with larger samples reducing sources of
non-sampling error (eg measurement error Stanley amp Spence 2014) and focusing on larger
18 To be more precise 36 is the median among the medians of medians
POWER BIAS AND HETEROGENEITY
33
effects Because researchers work with limited resources and knowledge these obvious
recommendations are extremely difficult to implement in most cases
More practical recommendations have centered on redefining replication success and
adjusting researchersrsquo expectations about non-significant replications For example Peng et al
(2016) examined the data from the Reproducibility Project Psychology (Open Science
Collaboration 2015) in terms of prediction intervalsmdashconfidence intervals that account for
variability in both the original and replication studymdashand found that 77 of the replication
attempts were consistent with the original findings This finding seems to be in apparent contrast
to the highly publicized result that only 36 of the replications in those data were statistically
significant but completely in accord with the less well-publicized result that meta-analytically
combining the replications with the original studies resulted in 70 statistical significance (Open
Science Collaboration 2015) Along similar lines several authors have argued for assessing
replication primarily within the context of meta-analysis (eg Braver Thoemmes amp Rosenthal
2014 Stanley amp Spence 2014 Fabrigar amp Wegener 2016) Doing so could shift the evaluation
of success vs failure of replications to a judgement about the degree of information that new data
add to our knowledge base (Peng et al 2016)
Consistent with a previous survey of heterogeneity (van Erp et al 2017) and several
findings from recent multi-site replication attempts (Hagger amp Chatzisarantis 2016 Eerland et al
2016 Klein et al 2015) our survey reveals clear evidence for high levels of heterogeneity in
research in psychology We find that heterogeneity accounts for nearly three-fourths of the
observed variation among reported effects (ie median I2 =74) When applied to the median
reported standard error (measured in terms of SMD) this high I2 implies that the typical standard
deviation of heterogeneity is equal to 0354 (again in units of SMDs) Importantly even a
POWER BIAS AND HETEROGENEITY
34
replication study with millions of subjects will remain vulnerable to heterogeneity among lsquotruersquo
effects When we apply our surveyrsquos typical heterogeneity to its typical effect size it is unlikely
that any replication will be lsquosuccessfulrsquo For example if our median effect size 0389 is the mean
of the distribution of true effects then there is a 298 probability that the largest possible
replication study will find a negligible zero or opposite-signed effect The probability is 324
that this ideal replication (ie ninfin) finds a small effect and it is 255 for a medium-sized
effectmdashusing Cohenrsquos guidelines of 02 05 and 08 Even though 0389 is considered a lsquosmallrsquo
effect by these guidelines the probability that a very large replication finds a large effect remains
non-negligible at 123 Thus it is quite likely 68 that an ideal replication will not reproduce
a small effect when the mean of the distribution true effects is equal to our median average effect
size The wide distribution of true effect sizes that our survey finds is also similar to what Open
Science Collaboration observed when attempting to replicate 100 psychological experimentmdashsee
Figure 3 in the Open Science Collaboration (2015)
No matter what the mean of the distribution of true effect sizes might be nor how large the
replication study is it is unlikely that a replication will find an effect size close to what was found
previously when there is this much heterogeneity If a lsquosuccessful replicationrsquo is defined as finding
an effect size similar to what some previous study or studies have found (say for example to
within + 01 or within + 02 SMD) then there will always be a sizeable chance of unsuccessful
replication no matter how well conducted or how large any of the studies are For example
suppose that two studies are conducted with nearly infinite sample sizes and therefore infinitesimal
sampling error Heterogeneity of the size that our survey finds implies that the probability that
these two ideal studies find effect sizes that are within +01 from one another is 158 and 311
to within +02 Indeed there remains a 50 or greater probability of a lsquofailed replicationrsquo whenever
POWER BIAS AND HETEROGENEITY
35
the acceptable difference for a successful replication is set at less than 035 SMD Needless to say
if we have less-than-ideal sample sizes the resulting added sampling error will reduce the
probability of a successful replication further Thus high heterogeneity further explains the failure
of the Open Science Collaboration (2015) to find reliable indicators of replication success
There are important caveats to these calculations of replication success that need to be
mentioned First there is a wide distribution of observed heterogeneity among these areas of
psychological researchmdashsee Figure 4 Twenty-two percent have I2s that are less than 50 while
47 have I2 values 75 or higher and one out of seven have excess heterogeneity of 90 or more
Thus successful replication will be more likely in some areas of research but much less likely in
others Second these calculations assume that the typical heterogeneity observed in this research
record is entirely heterogeneity among lsquotruersquo effects that is variation beyond the control of
researchers Because exact replication is rare in psychology some of this observed heterogeneity
will be due to variation in experimental conditions measures methods and the characteristics of
the population from which the samples are drawn Thus a careful exact replication study could
avoid a notable amount of this variation in expected effect by carefully duplicating all of the
controllable features of the experimental design execution and evaluation However those large-
scale efforts to control these controllable research dimensions still find that notable heterogeneity
remains (Hagger et al 2016 Eerland et al 2016 Klein et al 2015) Moreover if half the
observed heterogeneity variance is due to differences that are under the control of the researcher19
then our estimate of the typical standard deviation due this uncontrollable heterogeneity among
true effects would be reduced to 025 In which case the probability that the largest possible
19 The typical heterogeneity found by two large replication studies that attempted to be as exact as possible is larger than half of the median heterogeneity that our survey finds (Hagger et al 2016 Eerland et al 2016)
POWER BIAS AND HETEROGENEITY
36
replication study will find a negligible zero or opposite-signed effect declines to 22 28 for a
medium effect and it will find a large effect only about 5 of the time Even if half of the observed
heterogeneity among reported effects is under the researcherrsquos control the probability that any
replication effort successfully replicates a small effect (recall 0389 is our surveyrsquos median effect
size) remains less than 50
Conclusions
Our survey of 12065 estimated effect sizes from nearly as many studies and 8000 papers
finds that lsquofailedrsquo replicationsmdashdefined here in terms of null hypothesis significance testingmdash are
to be expected at a rate consistent with the widely publicized the Reproducibility Project
Psychology (Open Science Collaboration 2015) Like many other researchers we find that
statistical power is chronically low in research in psychology (Cohen 1962 Cohen 1977
Sedlmeier amp Gigerenzer 1989 Rossi 1990 Maxwell 2004 Pashler amp Wagenmakers 2012
Fraley amp Vazire 2014 Tressoldi amp Giofreacute 2015) Unlike this previous research however our
survey reveals a more severe challenge for replication High levels of heterogeneity are evidently
the norm in psychology (median I2 =74) As discussed above heterogeneity this large makes
successful replication difficult whether defined in terms of hypothesis testing or estimation
precision This high heterogeneity will of course be due in part to methodological differences
between the different studies in each of the 200 meta-analyses that we survey However data from
multi-site registered replication efforts further suggest that when obvious methodological
differences are removed (ie when lsquoexactrsquo replications are conducted) heterogeneity is not
reduced to negligible levels In other words it is unrealistic to believe that variance in
POWER BIAS AND HETEROGENEITY
37
psychological phenomena studied can always be tightly controlled or reduced to practically
insignificant levels
Perhaps more surprising is our finding that there is relatively small exaggeration or overall
selective reporting bias in recent psychological research This is in contrast to the view that
publication bias and questionable research practices are the primary cause of failed replications
Of course as mentioned above there are good reasons to be cautious in applying this hopeful
result to any individual area of research In particular 275 of these areas of research produce a
significant Eggerrsquos test for publication bias (or small-sample bias) and this test is known to have
low power Our survey merely implies that the effects of selective reporting bias (ie publication
bias small-sample biases p-hacking andor questionable research practices) have a less clear
pattern than is maybe assumed by some researchers and by what has been observed in other fields
(eg economics Ioannidis Stanley and Doucouliagos 2017)
In light of the typically high heterogeneity that we observed how should replications in
psychology be interpreted To begin it seems extremely likely that the p-value from any single
non-preregistered non-exact replication study will have nil informative value In the face of high
heterogeneity this is true regardless of the sample size of the replication because it is quite likely
that the replication study will correctly reflect a substantially different true effect than the original
study However individual non-preregistered non-exact replication studies may still contribute to
our collective knowledge when added to a carefully conducted meta-analysis or meta-regression
analysis Meta-analysis moves the focus away from the statistical significance of the single
replication study increases statistical power by pooling across studies allows one to accommodate
and reduce selective reporting bias and meta-regression analysis can use non-exact replications to
POWER BIAS AND HETEROGENEITY
38
help isolate and quantify methodological heterogeneity (eg Stanley amp Doucouliagos 2012
Braver Thoemmes amp Rosenthal 2014 Stanley amp Spence 2014 Fabrigar amp Wegener 2016)
Replication findings from multi-site pre-registered replications clearly offer a different
class of evidence from the single non-pre-registered non-exact replication Statistical power can
be maximized by the pooling of resources across research sites pre-registration is likely to greatly
reduce some types of selective reporting bias and heterogeneity due to obvious methodological
characteristics can be minimized through tightly-controlled study protocols Multi-site pre-
registered replication also allows researchers to directly isolate and quantify the specific
heterogeneity among true effects which remains after methodological heterogeneity is minimized
Such information can provide useful insights about the psychological phenomenon in question
thereby helping to guide and redirect future research and meta-regression analyses
The central implication of our survey is that typically-powered studies in most of areas of
psychology individually or when simply combined into a meta-analysis offer little information
about the magnitude or significance of the phenomenon they examine Our core recommendation
then is that researchers change their expectations about the ease with which convincing evidence
either for or against an effect can be claimed
POWER BIAS AND HETEROGENEITY
39
References
Abramowitz M and IA Stegun (eds) (1964) Handbook of Mathematical Functions with
Formulas Graphs and Mathematical Tables Washington DC US Department of
Commerce
American Psychological Association (2010) Manual of the American Psychological Association
6th ed Washington DC
Asendorpf J B Conner M De Fruyt F De Houwer J Denissen J J Fiedler K amp
Perugini M (2013) Recommendations for increasing replicability in psychology European
Journal of Personality 27(2) 108-119
Baker M (2015) Over half of psychology studies fail reproducibility test Nature News and
Comment August 27 doi101038nature201518248 accessed 8232017
Bakker M van Dijk A amp Wicherts J M (2012) The rules of the game called psychological
science Perspectives on Psychological Science 7(6) 543-554 doi
1011771745691612459060
Bakker M Hartgerink C H Wicherts J M amp van der Maas H L (2016) Researchersrsquo
intuitions about power in psychological research Psychological Science 27(8) 1069-1077 doi
1011770956797616647519
Bohannon J (2015) Reproducibility Many psychology papers fail replication test Science
349910ndash911
Braver SL Thoemmes FJ amp Rosenthal R (2014) Continuously cumulating meta-analysis
and replicability Perspectives on Psychological Science 9 333ndash342 doi
1011771745691614529796
Brodeur A Leacute M Sangnier M amp Zylberberg Y (2016) Star Wars The empirics strike back
American Economic Journal Applied Economics 8 1ndash32 doi 101257app20150044
Bruns S B amp Ioannidis J P A (2016) p-curve and p-hacking in observational research PLoS
ONE 11 e0149144 doi101371journal pone0149144
Button K S Ioannidis J P Mokrysz C Nosek B A Flint J Robinson E S amp Munafograve M
R (2013) Power failure why small sample size undermines the reliability of neuroscience
Nature Reviews Neuroscience 14(5) 365-376 doi101038nrn3475
Cohen J (1962) The statistical power of abnormal-social psychological research A review
Journal of Abnormal and Social Psychology 65 145ndash153
POWER BIAS AND HETEROGENEITY
40
Cohen J (1965) Some statistical issues in psychological research In (BB Wolman ed)
Handbook of Clinical Psychology New York McGraw-Hill pp 95ndash121
Cohen J (1977) Statistical power analysis for the behavioral sciences (2nd ed) New York
Academic Press
Cohen J (1992) A power primer Psychological Bulletin 112 155ndash159
Cooper H M amp Hedges LV (1994) (eds) Handbook of Research Synthesis New York Russell
Sage
Dreber A Pfeiffer T Almenberg J Isaksson S Wilson B Chen Y amp Johannesson M
(2015) Using prediction markets to estimate the reproducibility of scientific research
Proceedings of the National Academy of Sciences 112(50) 15343-47
Eerland A Sherrill A M Magliano J P Zwaan R A Arnal J D Aucoin P amp Prenoveau
J M (2016) Registered replication report Hart amp Albarraciacuten (2011) Perspectives on
Psychological Science 11(1) 158-171 doi 1011771745691615605826
Egger M Smith G D Schneider M amp Minder C (1997) Bias in meta-analysis detected by a
simple graphical test British Medical Journal 315 629ndash634 doi101136bmj3157109629
Engber D (2015) Cover Story Everything is crumbling Slate March 6 Accessed Dec 19
2016
Erica C Y Sprenger A M Thomas R P amp Dougherty M R (2014) When decision heuristics
and science collide Psychonomic Bulletin amp Review 21(2) 268-282 doi103758s13423-013-
0495-z
Fabrigar L R amp Wegener D T (2016) Conceptualizing and evaluating the replication of
research results Journal of Experimental Social Psychology 66 68-80 doi
101016jjesp201507009
Fanelli D (2010) ldquoPositiverdquo results increase down the hierarchy of the sciences PLoS One
5 e10068 doi101371journalpone0010068
Fanelli D Costas R amp Ioannidis J P (2017) Meta-assessment of bias in science Proceedings
of the National Academy of Sciences 201618569 doi101073pnas1618569114
Fiedler K amp Schwarz N (2016) Questionable research practices revisited Social Psychological
and Personality Science 7(1) 45-52 doi 1011771948550615612150
POWER BIAS AND HETEROGENEITY
41
Fraley R C amp Vazire S (2014) The n-pact factor Evaluating the quality of empirical journals
with respect to sample size and statistical power PLoS ONE 9 e109019
doi101371journalpone0109019
Fraley R C amp Marks M J (2007) The null hypothesis significance testing debate and its
implications for personality research In R W Robins R C Fraley amp R F Krueger (Eds)
Handbook of research methods in personality psychology (pp149ndash169) New York Guilford
Franco A Malhotra N amp Simonovits G (2016) Underreporting in psychology experiments
Evidence from a study registry Social Psychological and Personality Science 7(1) 8-12 doi
1011771948550615598377
Gerber A amp Malhotra N (2008) Do statistical reporting standards affect what is published
publication bias in two leading political science journals Quarterly Journal of Political
Science 3 313-326 doi 10156110000008024
Hagger M S Chatzisarantis N L D Alberts H Anggono C O Birt A Brand R amp
Cannon T (2016) A multi-lab preregistered replication of the ego-depletion effect
Perspectives on Psychological Science 11 546ndash573 doi 1011771745691616652873
Hedges L V amp Olkin I (1985) Statistical Methods for Meta-Analysis Academic Press Orlando
Henmi M amp Copas J B (2010) Confidence intervals for random effects meta-analysis and
robustness to publication bias Statistics in Medicine 29 2969ndash2983 doi 101002sim4029
Higgins J P T amp Thompson S G (2002) Quantifying heterogeneity in meta-analysis Statistics
in Medicine 21 1539ndash1558 doi 101002sim1186
Hoenig J M amp Heisey D M (2001) The abuse of power The pervasive fallacy of power
calculations for data analysis American Statistician 55 19ndash24 doi
101198000313001300339897
Inthout J Ioannidis J P A amp Borm G F (2012) Obtaining evidence by a single well-powered
trial or several modestly powered trials Statistical Methods in Medical Research
httpsmmsagepubcomcontentearly201209240962280212461098abstract (Accessed
Aug 16th 2015)
Ioannidis J P A (2005a) Contradicted and initially stronger effects in highly cited clinical
research Journal of the American Medical Association 294 218-228
doi101001jama2942218
POWER BIAS AND HETEROGENEITY
42
Ioannidis J P A (2005b) Why most published research findings are false PLoS Medicine 2
e124 doi101371journalpmed0020124
Ioannidis J P A (2013) Clarifications on the application and interpretation of the test for excess
significance and its extensions Journal of Mathematical Psychology 57 184-187 doi
101016jjmp201303002
Ioannidis J P A Hozo I and Djulbegovic B (2013) Optimal type I and type II error pairs when
the available sample size is fixed Journal of Clinical Epidemiology 66 903-910 doi
101016jjclinepi201303002
Ioannidis J P A Stanley T D amp Doucouliagos C(H) (2017) The power of bias in economics
research The Economic Journal October also as SWP Economics Series 20162
httpwwwdeakineduau__dataassetspdf_file00074777632016_1pdf Deakin University
Australia [Accessed on 27 April 2017]
John L K Loewenstein G amp Prelec D (2012) Measuring the prevalence of questionable
research practices with incentives for truth telling Psychological Science 23 524-532 doi
1011770956797611430953
Klein R A Vianello M Hasselman F Alper S Aveyard M Axt J R amp Nosek B A
(2015) Many Labs 2 Investigating variation in replicability across sample and setting
Manuscript in preparation
Kuumlhberger A Fritz A amp Scherndl T (2014) Publication bias in psychology a diagnosis based
on the correlation between effect size and sample size PloS one 9(9) e105825 doi
101371journalpone0105825
Lakens D (2015) On the challenges of drawing conclusions from p-values just below 005 Peer
J 3e1142 doi 107717peerj1142 PMID 26246976
LeBel E P Borsboom D Giner-Sorolla R Hasselman F Peters K R Ratliff K A amp
Smith C T (2013) PsychDisclosure org Grassroots support for reforming reporting standards
in psychology Perspectives on Psychological Science 8(4) 424-432 doi
1011771745691613491437
LeBel E P Vanpaemel W McCarthy R J Earp B D amp Elson M (2017) A unified
framework to quantify the trustworthiness of empirical research Advances in Methods and
Practices in Psychological Science Retrieved from httpsosfiopreprintspsyarxivuwmr8
8232017
POWER BIAS AND HETEROGENEITY
43
Lindsay D S (2015) Replication in psychological science Psychological Science 26 1827-32
Makel M C Plucker J A amp Hegarty B (2012) Replications in psychology research How
often do they really occur Perspectives on Psychological Science 7(6) 537-542
Maxwell S E (2004) The persistence of underpowered studies in psychological research causes
consequences and remedies Psychological Methods 9 147 doi 1010371082-989X92147
Maxwell S E Lau M Y amp Howard G S (2015) Is psychology suffering from a replication
crisis What does ldquofailure to replicaterdquo really mean American Psychologist 70(6) 487-498
httpdxdoiorg101037a0039400
McShane B B amp Boumlckenholt U (2016) Planning sample sizes when effect sizes are uncertain
The power-calibrated effect size approach Psychological Methods 21(1) 47 doi
101037met0000036
McShane B B Boumlckenholt U amp Hansen K T (2016) Adjusting for publication bias in meta-
analysis An evaluation of selection methods and some cautionary notes Perspectives on
Psychological Science 11 730ndash749 doi 1011771745691616662243
Miguel E amp Christensen G (2017) Transparency reproducibility and the credibility of
economics research Journal of Economic Literature IN PRESS
Moreno S G Sutton A J Ades A E Stanley T D Abrams K R Peters J L Cooper N
J (2009) Assessment of regression-based methods to adjust for publication bias through a
comprehensive simulation study BMC Medical Research Methodology 9 2 doi
1011861471-2288-9-2
Open Science Collaboration (2015) Estimating the reproducibility of psychological science
Science 349(6251) aac4716ndashaac4716 doi101126scienceaac4716
Pashler H amp Harris C (2012) Is the replicability crisis overblown Three arguments examined
Perspectives on Psychological Science 7 531ndash536 doi 1011771745691612463401
Pashler H amp Wagenmakers E J (2012) Editorsrsquo introduction to the special section on
replicability in psychological science a crisis of confidence Perspectives on Psychological
Science 7 528ndash530 doi 1011771745691612465253
Patil P and Leek JT (2015) Reporting of 36 of studies replicate in the media
httpsgithubcomjtleekreplication_paperblobgh-pagesin_the_mediamd[Online up- dated
16-September-2015 accessed 8232017]
POWER BIAS AND HETEROGENEITY
44
Patil P Peng R D amp Leek J T (2016) What should researchers expect when they replicate
studies A statistical view of replicability in psychological science Perspectives on
Psychological Science 11(4) 539-544 doi 1011771745691616646366
Pigott T (2012) Advances in meta-analysis New York NY Springer
Poole C amp Greenland S (1999) Random-effects meta-analyses are not always conservative
American Journal of Epidemiology 150 469ndash475
Popper K (1959) The logic of scientific discovery New York NY Basic Books
Psychonomic Society (2012) New Statistical Guidelines for Journals of the Psychonomic Society
httpwwwpsychonomicorgpagestatisticalguideline (Accessed March 11th 2017)
Rossi J S (1990) Statistical power of psychological research What have we gained in 20 years
Journal of Consulting and Clinical Psychology 58 646ndash656 doi1010370022-
006X585646
Richard F D Bond C F amp Stokes-Zoota J J (2003) One hundred years of social psychology
quantitatively described Review of General Psychology 7 331ndash363
Scargle J D (2000) Publication bias The ldquoFile-Drawerrdquo problem in scientific inference Journal
of Scientific Exploration 14 91ndash106
Schmidt F L amp Hunter J E (2015) Methods of meta-analysis Correcting error and bias in
research findings 3rd ed Los Angeles CA Sage
Schmidt F L amp Oh I -S (2016) The crisis of confidence in research findings in psychology Is
lack of replication the real problem Or something else Archives of Scientific Psychology 4(1)
32ndash37 httpdxdoiorg101037arc0000029
Sedlmeier P amp Gigerenzer G (1989) Do studies of statistical power have an effect on the power
of studies Psychological Bulletin 105 309ndash316
Simmons J P Nelson L D amp Simonsohn U (2011) False-positive psychology Undisclosed
flexibility in data collection and analysis allows presenting anything as significant
Psychological Science 22(11) 1359-1366 doi 1011770956797611417632
Simonsohn U Nelson L D amp Simmons J P (2014) P-curve a key to the file drawer Journal
of Experimental Psychology General 143 534-547 doi 101037a0033242
Stanley D J amp Spence J R (2014) Expectations for replications Are yours realistic
Perspectives on Psychological Science 9 305ndash318 doi 1011771745691614528518
POWER BIAS AND HETEROGENEITY
45
Stanley T D (2008) Meta-regression methods for detecting and estimating empirical effects in
the presence of publication selection Oxford Bulletin of Economics and Statistics 70103-27
doi 101111j1468-0084200700487x
Stanley T D (2017) Limitations of PET-PEESE and other meta-analysis methods Social
Psychology and Personality Science [Epub ahead of print] doi 1011771948550617693062
Stanley T D amp Doucouliagos H(C) 2014 Meta-regression approximations to reduce publication
selection bias Research Synthesis Methods 5 60-78 doi 101002jrsm1095
Stanley T D amp Doucouliagos H(C) 2015 Neither fixed nor random Weighted least squares
meta-analysis Statistics in Medicine 34 2116-27 doi 101002sim6481
Stanley T D amp Doucouliagos H(C) 2017 Neither fixed nor random Weighted least squares
meta-regression analysis Research Synthesis Methods 8 19-42 doi 101002jrsm1211
Stanley T D Doucouliagos H(C) amp Ioannidis J P A 2017 Finding the power to reduce
publication bias Statistics in Medicine [Epub ahead of print] doi 101002sim7228
Sterling T D (1959) Publication decisions and their possible effects on inferences drawn from
tests of significance Or vice versa Journal of the American Statistical Association 54 30ndash34
Sterling T D Rosenbaum W L amp Weinkam J J (1995) Publication decisions revisited The
effect of the outcome of statistical tests on the decision to publish and vice versa American
Statistician 49 108ndash112 doi 1023072684823
Sutton A J Song F Gilbody S M amp Abrams K R (2000) Modelling publication bias in
meta-analysis A review Statistical Methods in Medical Research 9 421-445 doi
101177096228020000900503
Tressoldi P E amp Giofreacute D (2015) The pervasive avoidance of prospective statistical power
Major consequences and practical solutions Frontiers in Psychology 6 726
doi103389fpsyg201500726
van Aert R C M Jelte M Wicherts J M amp van Assen M A L M (2016) Conducting meta-
analyses based on p values Reservations and recommendations for applying p-uniform and p-
curve Perspectives on Psychological Science 11 713ndash729 doi 1011771745691616650874
van Bavel JJ Mende-Siedlecki PBrada WJ and Reinero DA 2016 Contextual sensitivity
in scientific reproducibility Proceedings of the National Academy of Sciences 113 6454ndash59
POWER BIAS AND HETEROGENEITY
46
van Erp S et al (2017) Estimates of between-study heterogeneity for 705 meta-analyses reported
in Psychological Bulletin from 1990ndash2013 Journal of Open Psychology Data 5(1) p4 DOI
httpdoiorg105334jopd33
Wicherts J M Veldkamp C L Augusteijn H E Bakker M van Aert R C amp Van Assen
M A (2016) Degrees of Freedom in Planning Running Analyzing and Reporting
Psychological Studies A Checklist to Avoid p-Hacking Frontiers in Psychology 7 doi
103389fpsyg201601832
Yuan K amp Maxwell S (2005) On the post hoc power in testing mean differences Journal of
Educational and Behavioral Statistics 30 141ndash167 doi 10310210769986030002141
POWER BIAS AND HETEROGENEITY
47
Table 1 Median Statistical Power and Average Effect Sizes
Mean Proportion with Adequate Power Median Power Type of Effect
Absolute Effect Sizes WLS WAAP-WLS PET-PEESE WLS WAAP-WLS PET-PEESE
Combined (n=200)
0389 0077 0071 0091 0364 0331 0360
Correlations (n=108)
0458 0243 0328 0272 0577 0610 0607
SMDs (n=92)
0291 0013 0000 0011 0230 0171 0170
Notes The numbers reported in the table are medians Mean absolute effect sizes are reported in this table in units of standardized mean differences (SMD) regardless of whether they were reported in the meta-analysis as correlations or as SMD WLS is the unrestricted weighted least squares weighted average WAAP-WLS is the weighted average of adequately powered effect sizes (WAAP) or WLS when there are no adequately powered studies PET-PEESE is the conditional precision-effect test-precision-effect estimate with standard error meta-regression correction for publication bias Adequate power is defined as 80 following Cohen (1977)
Table 2 Median Statistical Powers by Experimental Design Proportion with Adequate Power Median Power
Experimental Design WLS WAAP-WLS PET-PEESE WLS WAAP-WLS PET-PEESE
Observational (n=113)
0278 0259 0268 0621 0613 0585
Experimental (n=87)
0032 0000 0053 0247 0232 0236
Notes The numbers reported in the table are medians WLS is the unrestricted weighted least squares weighted average WAAP-WLS is the weighted average of adequately powered effect sizes (WAAP) or WLS when there are no adequately powered studies PET-PEESE is the conditional precision-effect test-precision-effect estimate with standard error meta-regression correction for publication bias Adequate power is defined as 80 following Cohen (1977)
Figure 1 Obtaining adequate power (80)
Notes x is distributed as a standard normal distribution N(01) 196 is the critical value for testing against 0 Figure 1 merely illustrates how the standardized mean of the sampling distribution needs to 28 standard errors away from 0 for an experiment to have adequate powermdashCohenrsquos 80 We thank Stephan Bruns for producing this graph
POWER BIAS AND HETEROGENEITY
49
Figure 2 Histograms of Adequately Powered Estimates from 200 Areas of Research
Notes WLS is the unrestricted weighted least squares weighted average WAAP-WLS is the weighted average of adequately powered effect sizes (WAAP) or WLS when there are no adequately powered studies PET-PEESE is the conditional precision-effect test-precision-effect estimate with standard error meta-regression correction for publication bias Adequate power is defined as 80 following Cohen (1977)
0
20
40
60
80
100
120N
um
ber
of M
eta-
An
alys
es
0 2 4 6 8 1Proportion of Studies Adequately Powered
WLS
0
20
40
60
80
100
120
Nu
mbe
r of
Met
a-A
nal
yses
0 2 4 6 8 1Proportion of Studies Adequately Powered
WAAP-WLS
0
20
40
60
80
100
120
Nu
mbe
r of
Met
a-A
nal
yses
0 2 4 6 8 1Proportion of Studies Adequately Powered
PET-PEESE
POWER BIAS AND HETEROGENEITY
50
Figure 3 Histograms of Median Statistical Power from 200 Areas of Research
Notes WLS is the unrestricted weighted least squares weighted average WAAP-WLS is the weighted average of adequately powered effect sizes (WAAP) or WLS when there are no adequately powered studies PET-PEESE is the conditional precision-effect test-precision-effect estimate with standard error meta-regression correction for publication bias Adequate power is defined as 80 following Cohen (1977)
0
10
20
30
40
50
60N
um
ber
of M
eta-
An
alys
es
0 2 4 6 8 1Median Statistical Power
WLS
0
10
20
30
40
50
60
Nu
mbe
r of
Met
a-A
nal
yses
0 2 4 6 8 1Median Statistical Power
WAAP-WLS
0
10
20
30
40
50
60
70
Nu
mbe
r of
Met
a-A
nal
yses
0 2 4 6 8 1Median Statistical Power
PET-PEESE
Figure 4 Histograms of I2 from 200 Areas of Research
Notes I2 is the proportion of observed variation among reported effect sizes that cannot be explained by the calculated standard errors associated with these reported effect sizes It is a relative measure of heterogeneity
0
5
10
15
20
25
30
35
40
45
0 2 4 6 8 1I-squared
Num
ber o
f Met
a-A
naly
ses
POWER BIAS AND HETEROGENEITY
52
Appendix A Studies included in the meta-meta-analysis
1 Baas M Nijstad B A Boot N C amp De Dreu C K W (2016) Mad genius revisited Vulnerability to psychopathology biobehavioral approach-avoidance and creativity Psychological Bulletin 142 668-692 doi101037bul0000049 [2]
2 Balliet D Li N P Macfarlan S J amp Van Vugt M (2011) Sex differences in cooperation A meta-analytic review of social dilemmas Psychological Bulletin 137 881ndash909 doi 101037a0025354 [1]
3 Balliet D Mulder L B amp Van Lange P A M (2011) Reward punishment and cooperation A meta-analysis Psychological Bulletin 137 594-615 doi 101037a0023489 [2]
4 Balliet D Wu J amp De Dreu C K W (2014) Ingroup favoritism in cooperation A meta-analysis Psychological Bulletin 140 1556-1581 doi 101037a0037737 [1]
5 Brewin C R (2014) Episodic memory perceptual memory and their interaction Foundations for a theory of posttraumatic stress disorder Psychological Bulletin 140 69ndash97 doi 101037a0033722 [1]
6 Byron K amp Khazanchi S (2011) Rewards and creative performance A meta-analytic test of theoretically derived hypotheses Psychological Bulletin 138 809ndash830 [1]
7 Cerasoli C P amp Nicklin J M (2014) Intrinsic motivation and extrinsic incentives jointly predict performance A 40-year meta-analysis Psychological Bulletin 140 980-1008 doi 101037a0035661 [1]
8 Chaplin T M amp Aldao A (2013) Gender differences in emotion expression in children A meta-analytic review Psychological Bulletin 139 735-765 doi 101037a0030737 [4]
9 Defoe I N Dubas JS amp Figner B (2015) A meta-analysis on age differences in risky decision making Adolescents versus children and adults Psychological Bulletin 141 48ndash84 doi 101037a0038088 [4]
10 Degner J amp Dalege J (2013) The apple does not fall far from the tree or does it A meta-analysis of parentndashchild similarity in intergroup attitudes Psychological Bulletin 139 1270ndash1304 doi 101037a0031436 [1]
11 Eastwick P W Finkel E J Luchies L B amp Hunt L L (2014) The predictive validity of ideal partner preferences A review and meta-analysis Psychological Bulletin 140 623ndash 665 doi 101037a0032432 [4]
12 Else-Quest N M Higgins A Allison C amp Morton L C (2012) Gender differences in self-conscious emotional experience Psychological Bulletin 138 947ndash981 doi101037a0027930 [5]
13 Fairbairn C E amp Sayette M A (2014) A social-attributional analysis of alcohol response Psychological Bulletin 140 1361-82 doi 101037a0037563 [4]
14 Fischer P Krueger J I Greitemeyer T Vogrincic C Kastenmuumlller A Frey D Heene M Wicher M amp Kainbacher M (2011) The bystander-effect A meta-analytic review on bystander intervention in dangerous and non-dangerous emergencies Psychological Bulletin 137 517ndash537 doi 101037a0023304 [1]
POWER BIAS AND HETEROGENEITY
53
15 Fox MC Ericsson A amp Best (2011) Do procedures for verbal reporting of thinking have to be reactive A meta-analysis and recommendations for best reporting methods Psychological Bulletin 137 316 ndash344 doi 101037a0021663 [2]
16 Fox N A You K H Bowman L C Cannon E N Ferrari P F Bakermans-Kranenburg M J Vanderwert R E amp van IJzendoorn M H (2016) Assessing human mirror activity with EEG mu rhythm A meta-analysis Psychological Bulletin 142 291ndash313 doi101037bul0000031 [2]
17 Freund P A amp Kasten N (2012) How smart do you think you are A meta-analysis on the validity of self-estimates of cognitive ability Psychological Bulletin 138 296-321 doi101037a0026556 [1]
18 Grijalva E Newman D A Tay L Donnellan M B Harms P D amp Robins R W (2015) Gender differences in narcissism A meta-analytic review Psychological Bulletin 141 261-310 doi 101037a0038231 [3]
19 Haedt-Matt A A amp Keel P K (2011) Revisiting the affect regulation model of binge eating A meta-analysis of studies using ecological momentary assessment Psychological Bulletin 137 660ndash681 doi 101037a0023660 [3]
20 Harkin B Webb T L Prestwich A Conner M Kellar I Benn Y amp Sheeran P (2016) Does monitoring goal progress promote goal attainment A meta-analysis of the experimental evidence Psychological Bulletin 142 198-229 doi 101037bul0000025 [2]
21 Houben M Van Den Noortgate W amp Kuppens P (2015) The relation between short-term emotion dynamics and psychological well-being A meta-analysis Psychological Bulletin 141 901-930 doi101037a0038822 [4]
22 Johnsen T J amp Friborg O (2015) The effects of cognitive behavioral therapy as an anti-depressive treatment is falling A meta-analysis Psychological Bulletin 141 747-768 [2]
23 Karlin B Zinger J F amp Ford R (2015) The effects of feedback on energy conservation A meta-analysis Psychological Bulletin 141 1205-1227 doi 101037a0039650 [1]
24 Kim S Thibodeau R amp Jorgensen R S (2011) Shame guilt and depressive symptoms A meta-analytic review Psychological Bulletin 137 68 ndash96 doi 101037a0021466 [2]
25 Klahr A M amp Burt S A (2014) Elucidating the etiology of individual differences in parenting A meta-analysis of behavioral genetic research Psychological Bulletin 140 544ndash586 doi 101037a0034205 [6]
26 Koenig A M Eagly A H Mitchell A A amp Ristikari T (2011) Are leader stereotypes masculine A meta-analysis of three research paradigms Psychological Bulletin 137 616 ndash 642 doi 101037a0023557 [4]
27 Kredlow M A Unger L D amp Otto M W (2016) Harnessing reconsolidation to weaken fear and appetitive memories A meta-analysis of post-retrieval extinction effects Psychological Bulletin 142 314ndash336 doi 101037bul0000034 [3]
28 Kuykendall L Tay L amp Ng V (2015) Leisure engagement and subjective well-being A meta-analysis Psychological Bulletin 141 364-403 doi101037a0038508 [3]
29 Landau M J amp Kay A C (2015) Compensatory control and the appeal of a structured world Psychological Bulletin 141 694ndash722 doi 101037a0038703 [1]
30 Lee E-S Park T-Y amp Koo B (2015) Identifying organizational identification as a basis for attitudes and behaviors A meta-analytic review Psychological Bulletin 141 1049ndash1080 doi 101037bul0000012 [1]
POWER BIAS AND HETEROGENEITY
54
31 Lui P P (2015) Intergenerational cultural conflict mental health and educational outcomes among Asian and Latinoa Americans Qualitative and meta-analytic review Psychological Bulletin 141 404-446 doi101037a0038449 [3]
32 Lull R B amp Bushman B J (2015) Do sex and violence sell A meta-analytic review of the effects of sexual and violent media and ad content on memory attitudes and buying intentions Psychological Bulletin 141 1022ndash1048 doi 101037bul0000018 [6]
33 Mazei J Freund P A Huumlffmeier J amp Stuhlmacher A F (2015) A meta-analysis on gender differences in negotiation outcomes and their moderators Psychological Bulletin 141 85ndash104 doi 101037a0038184 [1]
34 Melby-Lervaringg M Lyster S A amp Hulme C (2012) Phonological skills and their role in learning to read A meta-analytic review Psychological Bulletin 138 322ndash352 doi 101037a0026744 [3]
35 Melby-Lervaringg M amp Lervaringg A (2014) Reading comprehension and its underlying components in second-language learners A meta-analysis of studies comparing first- and second-language learners Psychological Bulletin 140 409ndash433 doi 101037a0033890
[4] 36 Mendelson J L Gates J A amp Lerner M D (2016) Friendship in school-age boys with
autism spectrum disorders A meta-analytic summary and developmental process-based model Psychological Bulletin 142 601-622 doi 101037bul0000041 [2]
37 Mol S E amp Bus A G (2011) To read or not to read A meta-analysis of print exposure from infancy to early adulthood Psychological Bulletin 137 267ndash296 doi 101037a0021890 [13]
38 Orquin J L amp Kurzban R (2016) A meta-analysis of blood glucose effects on human decision making Psychological Bulletin 142 546ndash567 doi 101037bul0000035 [1]
39 Ottaviani C Verkuil B Medea B Couyoumdjian A Thayer JF Lonigro A amp Brosschot J F (2016) Physiological concomitants of perseverative cognition A systematic review and meta-analysis Psychological Bulletin 142 No 3 231ndash259 doi 101037bul0000036 [8]
40 North M S amp Fiske S T (2015) Modern attitudes toward older adults in the aging world A cross-cultural meta-analysis Psychological Bulletin 141 993ndash1021 doi 101037a0039469 [1]
41 Pahlke E Hyde J S amp Allison C M (2014) The effects of single-sex compared with coeducational schooling on studentsrsquo performance and attitudes A meta-analysis Psychological Bulletin 140 1042-1072 doi 101037a0035740 [2]
42 Pan S C amp Rickard T C (2015) Sleep and motor learning Is there room for consolidation Psychological Bulletin 141 812-834 doi 101037bul0000009 [1]
43 Phillips W J Fletcher J M Marks A D G amp Hine D W (2016) Thinking styles and decision making A meta-analysis Psychological Bulletin 142 No 3 260ndash290 doi 101037bul0000027 [4]
44 Pool E Brosch T Delplanque S amp Sander D (2016) Attentional bias for positive emotional stimuli A meta-analytic investigation Psychological Bulletin 142 No 1 79ndash106 doi 101037bul0000026 [1]
45 Randall J G Oswald F L amp Beier M E (2014) Mind-wandering cognition and performance A theory-driven meta-analysis of attention regulation Psychological Bulletin 140 1411ndash1431 doi 101037a0037428 [4]
POWER BIAS AND HETEROGENEITY
55
46 Sambrook T D amp Goslin J (2015) A neural reward prediction error revealed by a meta-analysis of ERPs using great grand averages Psychological Bulletin 141 213ndash235 doi 101037bul0000006 [4]
47 Sedlmeier P Eberth J Schwarz M Zimmermann D Haarig F Jaeger S amp Kunze S (2012) The psychological effects of meditation A meta-analysis Psychological Bulletin 138 1139ndash1171 doi 101037a0028168 [20]
48 Sheeran P Harris P R and Epton T (2014) Does heightening risk appraisals change peoplersquos intentions and behavior A meta-analysis of experimental studies Psychological Bulletin 140 511ndash543 doi 101037a0033065 [2]
49 Smith S F amp Lilienfeld S O (2015) The response modulation hypothesis of psychopathy A meta-analytic and narrative analysis Psychological Bulletin 141 1145ndash1177 doi 101037bul0000024 [1]
50 Soderberg C K Amit E Callahan S P Kochersberger A O amp Ledgerwood A (2015) The effects of psychological distance on abstraction Two meta-analyses Psychological Bulletin 141 3 525ndash548 doi101037bul0000005 [2]
51 Tannenbaum M B Hepler J Zimmerman R S Saul L Jacobs S Wilson K amp Albarraciacuten D Appealing to fear A meta-analysis of fear appeal effectiveness and theories Psychological Bulletin 141 1178ndash1204 doi101037a0039729 [1]
52 Toosi N R Babbitt L G Ambady N amp Sommers SR (2012) Dyadic interracial interactions A meta-analysis Psychological Bulletin 138 1ndash27 doi 101037a0025767 [4]
53 Vachon D D Lynam D R amp Johnson J A (2014) The (Non)relation between empathy and aggression Surprising results from a meta-analysis Psychological Bulletin 140 751ndash773 doi 101037a0035236 [1]
54 Verhage M L Schuengel C Madigan S Fearon R M P Oosterman M Cassibba R Bakermans-Kranenburg M J amp van IJzendoorn M H (2016) Narrowing the transmission gap A synthesis of three decades of research on intergenerational transmission of attachment Psychological Bulletin 142 337ndash366 doi 101037bul0000038 [2]
55 von Stumm S amp Ackerman P L (2013) Investment and intellect A review and meta-analysis Psychological Bulletin 139 841ndash869 doi 101037a0030746 [11]
56 Voyer D amp Voyer S D (2014) Gender differences in scholastic achievement A meta-analysis Psychological Bulletin 140 1174-1204 doi 101037a0036620 [6]
57 Vucasović T amp Bratko D (2015) Heritability of personality A meta-analysis of behavior genetic studies Psychological Bulletin 141 769ndash785 doi101037bul0000017 [1]
58 Wanberg C R Hamann D J Kanfer R amp Zhang Z (2016) Age and reemployment success after job loss An integrative model and meta-analysis Psychological Bulletin 142 400-426 doi 101037bul0000019 [6]
59 Weingarten E Chen Q McAdams M Yi J amp Hepler J (2016) From primed concepts to action A meta-analysis of the behavioral effects of incidentally presented words Psychological Bulletin 142 472ndash497 doi 101037bul0000030 [1]
60 Williams M J amp Tiedens L Z (2016) The subtle suspension of backlash A meta-analysis of penalties for womenrsquos implicit and explicit dominance behaviour Psychological Bulletin 142 165ndash197 doi 101037bul0000039 [6]
POWER BIAS AND HETEROGENEITY
56
61 Winer E S amp Salem T (2016) Reward devaluation Dot-probe meta-analytic evidence of avoidance of positive information in depressed persons Psychological Bulletin 142 18ndash78 doi 101037bul0000022 [6]
Notes Numbers in square brackets denote the number of meta-analyses included in the dataset
Appendix B Distribution of survey estimates
Year
No of meta-analyses published
No of meta-analyses sampled
of published meta-studies
No of estimates
of sample
2016 17 14 82 46 22 2015 22 18 82 40 19 2014 25 12 48 46 22 2013 17 3 18 16 8 2012 15 6 40 34 16 2011 19 8 42 31 15

POWER BIAS AND HETEROGENEITY
20
analytic studies in psychology North and Fiske (2015) also conduct a moderator analysis that
investigated the effect of different outcomes measures among others9
It is important to note that we do not choose the level of aggregation of the meta-analyses
that are included on our survey Rather in all cases we follow the professional judgement of
experts in these specific areas of psychological research In the example of gender and dominance
research Williams and Tiedens do not judge that the effects on likeability competence and
downstream outcomes to be sufficiently homogeneous to be analyzed together It seems sensible
that any measure of likeability for example reflects the same phenomenon as any other measure
of likeability when evaluating the effects of gender and dominance Regardless the judgment
about where to draw the line is better made by those experts who have read coded summarized
and analyzed the entire relevant research literature(s)mdashWilliams and Tiedens in this case
Similarly Williams and Tiedens (2016) consider interaction effects to be too different from the
simple effects and from each other to be aggregated Because these are different psychological
phenomenon containing non-overlapping effect sizes we include these interaction studies as well
This issue is potentially important because the level of aggregation of the meta-analyses may have
implications about how much heterogeneity is found The broader more encompassing the level
of aggregation the higher one would expect heterogeneity to be
Meta-Estimates of lsquoTrue Effectrsquo
To be both conservative and robust we use three meta-estimators of lsquotruersquo effect because
the meta-estimate that one chooses might in some individual cases make a practically notable
9 Separate meta-analyses cannot be generally constructed for all reported moderator variables in these meta-analysis studies thus we do not include further subdivided moderator meta-analyses Often meta-regression is used for moderator analysis and only summary results are reported Even when separate moderator subsets are investigated it is often the case that insufficient information is reported for us to make these separations
POWER BIAS AND HETEROGENEITY
21
difference in how a given area of research is characterized We investigate three reasonable
alternative proxies for lsquotruersquo effect drawn from all the reported results in a given research subject
to be sure that our survey results are in fact robust to the chosen meta-method of estimating effect
and also to potential selective reporting bias
To be clear there is no perfect estimate of the lsquotruersquo effect size (or the mean of the
distribution of true effect sizes) when some authors reviewers or editors preferentially select
statistically significant effects (Stanley 2017 Stanley Doucouliagos amp Ioannidis 2017) With
selective reporting bias (aka publication bias the file drawer problem small-sample bias and p-
hacking) all meta-estimates are biased because the data from which they are calculated are
themselves biased to an unknowable degree However a series of statistical simulation studies
have documented how some estimators are more biased than others when there is selective
reporting bias (Stanley 2008 Moreno et al 2009 Stanley amp Doucouliagos 2014 Stanley amp
Doucouliagos 2015 Stanley Doucouliagos amp Ioannidis 2017 Stanley 2017)
Conventional meta-analysis typically estimates true effects using either lsquofixed-effectsrsquo
(FE) or a lsquorandom-effectsrsquo (RE) weighted average or both (Hedges amp Olkin 1985 Cooper amp
Hedges 1994 Stanley amp Doucouliagos 2015) The lsquofixed-effectrsquo weighted average employs
optimal weights that are the same as those used by a recently proposed unrestricted weighted least
squares (WLS) weighted average (Stanley amp Doucouliagos 2015) We prefer the unrestricted
WLS version of the conventional fixed-effect meta-analysis for inferential purposes because the
unrestricted WLS weighted average automatically accounts for heterogeneity when calculating
confidence intervals or significance tests (Stanley amp Doucouliagos 2015) This WLS estimator is
POWER BIAS AND HETEROGENEITY
22
also consistently less biased than RE when there is selective reporting bias10 The point estimates
of WLS and FE must always be exactly the same thus using WLS is exactly equivalent to using
FE in our survey11
Our second estimator exploits the importance of statistical power by over-weighting the
most precise largest studies The weighted average of the adequately powered (WAAP) uses the
same formulas as does WLS (or FE) but applies it only on those estimates found to be adequately
powered relative to WLS as the proxy for true effect WAAP is more resilient to selective reporting
biases because adequately powered studies are more reliable and require fewer questionable
research practices to achieve statistical significance Simulations show that WAAP is as good as
random-effects when there are no selective reporting biases and dominates RE when there is
selective reporting for statistical significance When half of the reported experimental results have
been selected for their statistical significance WAAP consistently reduces bias on average by
50 (Stanley Doucouliagos amp Ioannidis 2017) The weakness of WAAP is that it cannot be
computed if there are no studies with adequate power a condition found in 35 of the 200 areas
of psychological research that comprise our survey Thus Stanley Doucouliagos amp Ioannidis
(2017) propose using WLS when WAAP cannot be computed giving a WAAP-WLS weighted
10 We have chosen not to use the lsquorandom-effectsrsquo weighted average to assess power because RE is widely known to be more biased than FE and thereby WLS when there is selective reporting bias (Poole amp Greenland 1999 Sutton et al 2000 Henmi amp Copas 2010 Stanley amp Doucouliagos 2014 Stanley amp Doucouliagos 2015 Stanley Doucouliagos amp Ioannidis 2017 Stanley 2017) WLS and FE give less weight than RE to small-sample studies where selective reporting is likely to be the most severe In the aggregate giving more weight to the largest studies and less weight to small studies will reduce selective reporting bias if it is present and is statistically sensible even when it is not Besides WLS estimates remain practically as good as or better than conventional lsquorandom-effectsrsquo meta-analysis when there is no selective reporting for statistical significance (Stanley amp Doucouliagos 2015 Stanley Doucouliagos amp Ioannidis 2017) 11 For those readers who wish to know how to calculate WLSrsquos standard error or confidence interval please consult Stanley amp Doucouliagos (2015) and Stanley Doucouliagos amp Ioannidis (2017) However any basic regression routine will automatically calculate our unrestricted WLS weighted average when one uses the standardized effect size (effect size divided by it standard error) as the dependent variable and precision (1SE) as the independent variable with no intercept Nothing else is needed
POWER BIAS AND HETEROGENEITY
23
average In the below assessments of power and bias WAAP-WLS is the second approach that we
employ WAAP-WLS has the added value of forcing meta-analysts to seriously consider and
report the statistical powers found in their area of research12
WLS and WAAP-WLS passively moderate selective reporting bias In contrast simple
meta-regression models have been shown to reduce selective reporting bias more aggressively
when it is present (Stanley 2005 Stanley 2008 Moreno et al 2009 Stanley amp Doucouliagos
2014 Stanley amp Doucouliagos 2015 Stanley amp Doucouliagos 2017 Stanley Doucouliagos amp
Ioannidis 2017 Stanley 2017) The precision-effect test-precision effect estimate with standard
error (PET-PEESE) is a conditional estimate of average effect from simple WLS meta-regressions
of each estimated effect size on its standard error (PET) or alternatively on its variance
(PEESE)mdashStanley amp Doucouliagos (2014) When only statistically significant positive results
are reported selective reporting bias is known to be equal to the reported estimatersquos standard error
times the inverse Millsrsquo ratio (Stanley amp Doucouliagos 2014 p 61) The inverse Millsrsquo ratio is a
complex function of the true effect and the standard error which Stanley and Doucouliagos (2014)
approximate by a restricted polynomial function of the standard error (PEESE) When the true
effect is zero it can also be shown mathematically that this complex function collapses to a linear
relation with standard error giving PET (Stanley amp Doucouliagos 2014) A series of statistical
simulation studies documents how PET-PEESE often greatly reduces selective reporting bias and
is preferable to conventional meta-analysis methods and to the lsquotrim-and-fillrsquo publication bias
correction algorithm (Stanley 2008 Moreno et al 2009 Stanley amp Doucouliagos 2014 Stanley
amp Doucouliagos 2017 Stanley Doucouliagos amp Ioannidis 2017 Stanley 2017) PET-PEESE
provides a more aggressive approach to selective reporting bias than any simple weighted average
12 It is our belief that all meta-analyses should report typical power as one objective metric of research quality
POWER BIAS AND HETEROGENEITY
24
but it too has limitations overcorrecting for publication bias in some cases (Stanley 2017 Stanley
Doucouliagos amp Ioannidis 2017 Stanley 2017)13
To recap we calculate power and bias in a robust yet conservative manner by employing
three proxies of lsquotruersquo average effect size (1) the WLS unrestricted weighted average with point
estimates equivalent to the fixed-effect (2) the weighted average of the adequately powered
(WAAP-WLS) and (3) the PET-PEESE meta-regression reduction of selective reporting bias
Two of these approaches (WLS and WAAP-WLS) are quite lsquoconservativersquo in the sense that they
are known to overestimate true effect if there is any type of selective reporting bias lsquoConservativersquo
in this context means they give the benefit of doubt to the psychological research record as reported
and are likely to overestimate psychological researchrsquos power on average PET-PEESE on the
other hand more aggressively attempts to identify and filter out selective reporting bias thus it is
possible to underestimate true effect and thereby underestimate statistical power in some cases
(Stanley 2017) Because our survey is merely descriptive we focus on the median powers across
reported effect sizes research topics and also across these three estimation approaches to the
average true effect size The median of these three will thus be conservative and tend to
overestimate the quality of psychological research14
Assessing adequate power
13 We do not use Simonsohn Nelson amp Simmonsrsquos (2014) lsquop-curversquo correction for lsquop-hackingrsquo Recently several papers establish that the p-curve approach is biased and unreliable when there is either heterogeneity misspecification biases or when some insignificant studies are reported (Bruns amp Ioannidis 2016 McShane Boumlckenholt amp Hansen 2016 van Aert et al 2016) Such conditions are ubiquitous in the social sciences For example we find that the typical heterogeneity variance among the 200 meta-analyses that we survey is nearly 3 times larger than the corresponding random sampling variance That is 74 of the observed variation of reported research results from study to study is typically due to actual differences in the true effect (heterogeneity) or to differential bias in either case overwhelming the p-curversquos assumed pattern of p-values from sampling errors alone 14 Our overall survey results do not depend on the accuracy or validity of PET-PEESE We include PET-PEESE only for the sake of robustness to see what if any difference might result when a more aggressive approach to reducing selective reporting biased is used Below we find that it makes little difference
POWER BIAS AND HETEROGENEITY
25
With the WLS WAAP-WLS and PET-PEESE estimates of the lsquotruersquo effect for a given
area of research adequate power is easy to assess We assume the null hypotheses are two tailed
with a 5 significance level and we accept Cohenrsquos 80 as the definition of adequate power
These conventions for Type I and Type II errors imply that the lsquotruersquo effect needs to be equal to or
greater than 28 standard errors in absolute magnitude if power is to reach 80 This value of 28
is the sum of 196 and 084 where 196 is the minimum number of standard errors from zero that
an observed effect must fall to be rejected with a 5 significance level and 084 is the number of
additional standard errors that the true effect must fall from zero such that 80 of the distribution
of the observed effect is in the rejection regionmdashsee Figure 1 Hence for a study to have adequate
power its standard error needs to be smaller than the absolute value of the underlying mean lsquotruersquo
effect divided by 28 All that remains to assess adequate power retrospectively are (1) the values
of the standard error and (2) an estimate (or estimates) of the lsquotruersquo effect If the standard error of
a study is less than the absolute value of an estimate lsquotruersquo effect (from WLS WAAP-WLS or
PET-PEESE) divided by 28 we know that this study is adequately powered to detect a lsquotruersquo
effect equal or greater than this estimate Median power for a given area of research can then be
calculated from the cumulative normal probability of the difference between 196 and the absolute
value of an estimate of the true effect divided by the median standard error Because our survey
is merely descriptive we focus on the median powers across reported effect sizes areas of
research and also across these three estimation approaches to the average true effect size The
median of these estimation approaches will thus be conservative and tend to overestimate the
quality of psychological research
POWER BIAS AND HETEROGENEITY
26
Assessing residual selective reporting bias
If an area of research is selectively reporting effect size to be statistically significant in a
direction consistent with the prevailing psychological theory then the average reported effect will
on average have a larger magnitude than the true effect (whether or not prevailing psychological
theory suggests a direct or an inverse association) As before we can use these meta-averages
WLS WAAP-WLS and PET-PEESE as proxies for lsquotruersquo effect and then compare them to
average reported effect for an assessment of residual reporting bias Needless to say each reported
estimate is subject to random sampling error and will be sometimes larger and sometimes smaller
than the mean true effect Such differences cannot be regarded as lsquobiasrsquo but merely as sampling
or estimation errors However when there is a systematic trend for the unadjusted simple average
to be larger than a meta-average known to be less biased when there is selective reporting bias
then we can regard the difference between the absolute value of the simple mean and the absolute
value of WLS or WAAP-WLS as the lower limit of bias when it persists consistently over hundreds
of separate areas of research Using this approach Ioannidis Stanley amp Doucouliagos (2017) find
that the typical reported estimate in economics is twice as large or larger than either WAAP or
PET-PEESE In sharp contrast our survey of psychology finds on average only a small amount
of consistent exaggeration or overall selective reporting bias
Results
Among these 200 areas of psychological research containing 12065 estimated effect the
average effect size is 0389 expressed as the median of average standardized mean differences or
0191 as a correlation coefficient This overall effect size is nearly the same as the average of the
first 100 years of social psychology (r = 021) uncovered by Richard Bond amp Stokes-Zoota
POWER BIAS AND HETEROGENEITY
27
(2003) The typical standard error is 0104 expressed as a correlation 021 when represented by
a standardized mean difference (SMD) The p-value produced by these averages is a little larger
than the conventional 05 level Other researchers across several disciplines have found that that
p-values tend to lump up at or just below 05 (Gerber amp Malhotra 2008 Brodeur Sangnier amp
Zylberberg 2016) Contrary to recent concerns about publication bias questionable research
practices and null hypothesis significance testing we find that the typical psychological research
study is statistically insignificant at the conventional 05 level of significance
Table 1 reports the median absolute value of the average reported effect size from these
200 meta-analyses Here all effect sizes are first converted to standardized mean differences
(SMD) to be comparable However an interesting pattern emerges when these 200 meta-analyses
are divided by the types of effect sizes that are commonly reported correlation vs SMD The
typical effect size found among the 108 lsquocorrelation-basedrsquo meta-analyses in our survey (0458 in
SMD units) is 57 larger than those meta-analyses measured by SMDs (0291)15
Power
The median of the percent of reported effects that are adequately powered across these 200
areas of research are (1) 77 when the unrestricted WLS (or fixed effect) weighted average is
used to represent the mean of the true effects distribution (2) 71 when WAAP-WLS proxies for
lsquotruersquo effect and (3) 91 if PET-PEESE substitutes for true effect Figure 2 displays the
distributions of the proportion of studies that are adequately powered across these 200 areas of
15 We thank Frank Schmidt for pointing out that technically only point-biserial correlations can be converted to Cohenrsquos d Ceteris paribus other correlations will be larger than the point-biserial correlation due to the latterrsquos restricted range Thus a small part of the larger effect average effect size of lsquocorrelation-basedrsquo meta-analyses might be due to the conversion of all correlations to Cohenrsquos d Because these 108 lsquocorrelation-basedrsquo meta-analyses often contain an undisclosed mix of correlation types we cannot fully correct this small bias However as we discussed above none of our calculations of power heterogeneity or bias depend in any way on the transformation of correlations to standardized mean differences
POWER BIAS AND HETEROGENEITY
28
research Clearly underpowered studies dominate psychological research But how underpowered
are they
We also calculate the median powers for each of these 200 areas of research The typical
power of psychological research is around 36 364 based on WLS 331 based on WAAP-
WLS and 36 based on PET-PEESE16 Figure 3 shows the distribution of median powers across
these 200 areas of research Note their striking shapes The two most frequent categories are the
lowest (0-10) and the highest (over 90) Even though typical areas of research are quite
inadequately powered as measured by median power approximately one-fifth of these 200 areas
of psychological research are quite highly-powered Between 19 and 23 have average statistical
power 90 or highermdashsee Figure 3 It should not be surprising that some areas of research have
high power Aside from sample size statistical power depends on the underlying true effect size
and some psychological phenomena have large effects When WAAP-WLS is used to estimate
true effect one-third of these 200 areas of psychological research (32) have lsquolargersquo or lsquomediumrsquo
effect sizes defined as |WAAP-WLS| gt 05 SMD Even rather modest sample sizes will estimate
large effects powerfully
As before we find striking difference between correlation-based meta-analyses and SMD-
based meta-analyses Table 1 breaks down the median proportion of studies that are adequately
powered and the median power by type of effect size Those areas of psychological research that
predominately report standardized mean differences (SMDs) are highly under-powered typically
99 are underpowered compared to 67 to 76 for correlation-based meta-analyses The median
16 This is somewhat less than a recent survey Fraley amp Vazire (2014) which found a median power to detect a correlation of 02 to be 49 among top social-personality journals for the years 2006-2010 But then Fraley amp Vazire (2014) calculate prospective rather than retrospective power and their sampling frame is different than ours Thus we would expect some differences especially when considering that our median power calculations reflect both the observed effect size of each area of research and the distribution of statistical power within an area of research
POWER BIAS AND HETEROGENEITY
29
statistical power in SMD meta-analyses is between 17 to 23 For correlation-based research
typical power is nearly three times highermdash58 to 61
Residual selective reporting bias
Recall that residual reporting bias may be calculated as the difference between the absolute
value of the simple mean reported effect and the absolute value of one of our less vulnerable
proxies for true effectmdashWLS WAAP-WLS or PET-PEESE We find only small amounts of
residual reporting bias in psychological research 8 based on WLS 12 based on WAAP-WLS
and 15 based on PET-PEESE Thus our survey identifies only a small systematic exaggeration
overall
There are some important qualifications to make about this finding First all these
estimates are themselves biased and two of them consistently underestimate residual bias when
there is selective reporting (Stanley and Doucouliagos 2014 Stanley and Doucouliagos 2015
Stanley et al 2017 Stanley 2017) Second a notable proportion of psychology might still be
affected by selective reporting bias even if the median amount of exaggeration is relatively small
275 (or 55 areas of research) find evidence of some type of selective reporting or small-sample
bias using the Egger test for funnel plot asymmetry and this is likely to be an under-estimate of
the incidence of these biases because the Egger test is known to have low power (Egger et al
1997 Stanley 2008) Third we again find notable differences between types of effect sizes
reported by meta-analysts When using WLS as a proxy for the true effect we find that the simple
mean of reported SMDs is now exaggerated by 13 on average by 20 if WAAP-WLS
substitutes for true effect and by 30 relative to the median absolute value of PET-PEESE
POWER BIAS AND HETEROGENEITY
30
Heterogeneity
The median percent of the observed variation of reported effect sizes within a given area
of research that is attributed to heterogeneity (I2) is 74 This means that the variance among lsquotruersquo
effects is nearly 3 times larger than the reported sampling variance According to Pigottrsquos (2012)
guidelines for small (25) medium (50) and large (75) heterogeneity typical areas of research
have nearly lsquolargersquo excess heterogeneity Yet this level of heterogeneity appears to be the norm
for research in psychology For example van Erp et al (2017) extracted estimates of heterogeneity
from 705 meta-analyses published in Psychological Bulletin between 1990 and 2013 and found
that the median reported I2 = 7062 (interquartile range [3324 8741]) However I2 is a
relative measure of heterogeneity and does not reflect the variation in true effect as measured in
units of SMDs When our median I2 is applied to the typical area of research the standard deviation
among true effects is 0354 SMD and the standard deviation from one study to the next due to both
heterogeneity and sampling error becomes 0412 larger than the typical reported effect size 0389
lsquoExperimentalrsquo vs lsquoobservationalrsquo research
As a post hoc secondary analysis17 we examined whether the systematic differences
between SMD-based and correlation-based meta-analyses are due to experimental design
lsquoexperimentalrsquo vs lsquoobservationalrsquo Unfortunately this differentiation is not perfect Many meta-
analyses contain a mix of experimental and observational research designs at the study level For
example Williams and Tiedens (2015) meta-analysis of the effects of gender and dominance
17 Investigating these differences was not part of our pre-analysis plan Anonymous reviewers asked that we code for experimental design and report the differences
POWER BIAS AND HETEROGENEITY
31
behavior includes 97 experimental studies (85) where dominance behavior was somehow
manipulated and 17 purely observational studies
Because a substantial percent (424) of those meta-analyses that report effect sizes in
terms of SMD are lsquoobservationalrsquo and 314 of correlation-based meta-analyses are
lsquoexperimentalrsquo there is only small correlation (phi=0263 plt001) between experimental design
(1 if primarily experimental 0 elsewhere) and effect type (1 if SMD 0 for correlation) However
we do see some interesting differences in power and heterogeneity by experimental design First
there is a difference between heterogeneity as measured by I2 (plt01) The median I2 for
experimental research is 68 vs 76 for observational designs But I2 is a relative measure of
heterogeneity with a non-symmetric distribution To correct for I2rsquos nonstandard distribution we
use Abramowitz and Stegunrsquos (1964) normal approximation for the chi-square distribution applied
to the Cochran Q-test for heterogeneity Doing so causes this difference in relative heterogeneity
to be only marginally larger than statistical noise (p=045) Additionally experimental research
designs have larger sampling errors and lower power Typical sampling errors are 026 vs 019
measured as median SEs in units of SMD Table 2 reports the median proportion of studies that
are adequately powered and the median of median powers by type of research design Even though
there is only a small association between experimental design and effect type we find a similar
pattern among the typical levels of power for experimental design that we see for effect type
confirming the concerned expressed by dozens of researchers over the years that scarcely any
experimental studies are adequately powered All of these results about lsquoexperimentalrsquo vs
lsquoobservationalrsquo research designs should be interpreted with caution because as mentioned they
are conducted post hoc
POWER BIAS AND HETEROGENEITY
32
Discussion
Our survey of 12065 estimated effects sizes from nearly 8000 studies in 200 meta-
analyses reveals that the typical effect size is 0389 SMD with a median standard error of 021 We
also find low statistical power small residual selection bias and high levels of heterogeneity The
central purpose of our review is to assess the replicability of psychological research through meta-
analysis and thereby better understand recent failures to replicate Our findings implicate low
statistical power and high levels of heterogeneity as the primary causes of lsquofailedrsquo replications
however defined
We find that only a small proportion of psychological studies are adequately powered
approximately 8 and the median power is about 36 across three proxies for the mean lsquotruersquo
effect18 What does this imply about replication Our survey predicts therefore that replication
study with a typical sample size will have only a 36 chance of finding a statistically significant
effect in the same direction as some previous study and this value is exactly the same percent of
replications found to be statistically significant in the same direction by the Open Science
Collaboration (Open Science Collaboration 2015 Table 1) Thus when replication is viewed in
terms of sign and statistical significance it is no wonder that rates of replication are considered
low in psychology research
Improving replication as noted by others (eg Maxwell et al 2015) would seem to be a
matter of conducting both initial studies and replications with larger samples reducing sources of
non-sampling error (eg measurement error Stanley amp Spence 2014) and focusing on larger
18 To be more precise 36 is the median among the medians of medians
POWER BIAS AND HETEROGENEITY
33
effects Because researchers work with limited resources and knowledge these obvious
recommendations are extremely difficult to implement in most cases
More practical recommendations have centered on redefining replication success and
adjusting researchersrsquo expectations about non-significant replications For example Peng et al
(2016) examined the data from the Reproducibility Project Psychology (Open Science
Collaboration 2015) in terms of prediction intervalsmdashconfidence intervals that account for
variability in both the original and replication studymdashand found that 77 of the replication
attempts were consistent with the original findings This finding seems to be in apparent contrast
to the highly publicized result that only 36 of the replications in those data were statistically
significant but completely in accord with the less well-publicized result that meta-analytically
combining the replications with the original studies resulted in 70 statistical significance (Open
Science Collaboration 2015) Along similar lines several authors have argued for assessing
replication primarily within the context of meta-analysis (eg Braver Thoemmes amp Rosenthal
2014 Stanley amp Spence 2014 Fabrigar amp Wegener 2016) Doing so could shift the evaluation
of success vs failure of replications to a judgement about the degree of information that new data
add to our knowledge base (Peng et al 2016)
Consistent with a previous survey of heterogeneity (van Erp et al 2017) and several
findings from recent multi-site replication attempts (Hagger amp Chatzisarantis 2016 Eerland et al
2016 Klein et al 2015) our survey reveals clear evidence for high levels of heterogeneity in
research in psychology We find that heterogeneity accounts for nearly three-fourths of the
observed variation among reported effects (ie median I2 =74) When applied to the median
reported standard error (measured in terms of SMD) this high I2 implies that the typical standard
deviation of heterogeneity is equal to 0354 (again in units of SMDs) Importantly even a
POWER BIAS AND HETEROGENEITY
34
replication study with millions of subjects will remain vulnerable to heterogeneity among lsquotruersquo
effects When we apply our surveyrsquos typical heterogeneity to its typical effect size it is unlikely
that any replication will be lsquosuccessfulrsquo For example if our median effect size 0389 is the mean
of the distribution of true effects then there is a 298 probability that the largest possible
replication study will find a negligible zero or opposite-signed effect The probability is 324
that this ideal replication (ie ninfin) finds a small effect and it is 255 for a medium-sized
effectmdashusing Cohenrsquos guidelines of 02 05 and 08 Even though 0389 is considered a lsquosmallrsquo
effect by these guidelines the probability that a very large replication finds a large effect remains
non-negligible at 123 Thus it is quite likely 68 that an ideal replication will not reproduce
a small effect when the mean of the distribution true effects is equal to our median average effect
size The wide distribution of true effect sizes that our survey finds is also similar to what Open
Science Collaboration observed when attempting to replicate 100 psychological experimentmdashsee
Figure 3 in the Open Science Collaboration (2015)
No matter what the mean of the distribution of true effect sizes might be nor how large the
replication study is it is unlikely that a replication will find an effect size close to what was found
previously when there is this much heterogeneity If a lsquosuccessful replicationrsquo is defined as finding
an effect size similar to what some previous study or studies have found (say for example to
within + 01 or within + 02 SMD) then there will always be a sizeable chance of unsuccessful
replication no matter how well conducted or how large any of the studies are For example
suppose that two studies are conducted with nearly infinite sample sizes and therefore infinitesimal
sampling error Heterogeneity of the size that our survey finds implies that the probability that
these two ideal studies find effect sizes that are within +01 from one another is 158 and 311
to within +02 Indeed there remains a 50 or greater probability of a lsquofailed replicationrsquo whenever
POWER BIAS AND HETEROGENEITY
35
the acceptable difference for a successful replication is set at less than 035 SMD Needless to say
if we have less-than-ideal sample sizes the resulting added sampling error will reduce the
probability of a successful replication further Thus high heterogeneity further explains the failure
of the Open Science Collaboration (2015) to find reliable indicators of replication success
There are important caveats to these calculations of replication success that need to be
mentioned First there is a wide distribution of observed heterogeneity among these areas of
psychological researchmdashsee Figure 4 Twenty-two percent have I2s that are less than 50 while
47 have I2 values 75 or higher and one out of seven have excess heterogeneity of 90 or more
Thus successful replication will be more likely in some areas of research but much less likely in
others Second these calculations assume that the typical heterogeneity observed in this research
record is entirely heterogeneity among lsquotruersquo effects that is variation beyond the control of
researchers Because exact replication is rare in psychology some of this observed heterogeneity
will be due to variation in experimental conditions measures methods and the characteristics of
the population from which the samples are drawn Thus a careful exact replication study could
avoid a notable amount of this variation in expected effect by carefully duplicating all of the
controllable features of the experimental design execution and evaluation However those large-
scale efforts to control these controllable research dimensions still find that notable heterogeneity
remains (Hagger et al 2016 Eerland et al 2016 Klein et al 2015) Moreover if half the
observed heterogeneity variance is due to differences that are under the control of the researcher19
then our estimate of the typical standard deviation due this uncontrollable heterogeneity among
true effects would be reduced to 025 In which case the probability that the largest possible
19 The typical heterogeneity found by two large replication studies that attempted to be as exact as possible is larger than half of the median heterogeneity that our survey finds (Hagger et al 2016 Eerland et al 2016)
POWER BIAS AND HETEROGENEITY
36
replication study will find a negligible zero or opposite-signed effect declines to 22 28 for a
medium effect and it will find a large effect only about 5 of the time Even if half of the observed
heterogeneity among reported effects is under the researcherrsquos control the probability that any
replication effort successfully replicates a small effect (recall 0389 is our surveyrsquos median effect
size) remains less than 50
Conclusions
Our survey of 12065 estimated effect sizes from nearly as many studies and 8000 papers
finds that lsquofailedrsquo replicationsmdashdefined here in terms of null hypothesis significance testingmdash are
to be expected at a rate consistent with the widely publicized the Reproducibility Project
Psychology (Open Science Collaboration 2015) Like many other researchers we find that
statistical power is chronically low in research in psychology (Cohen 1962 Cohen 1977
Sedlmeier amp Gigerenzer 1989 Rossi 1990 Maxwell 2004 Pashler amp Wagenmakers 2012
Fraley amp Vazire 2014 Tressoldi amp Giofreacute 2015) Unlike this previous research however our
survey reveals a more severe challenge for replication High levels of heterogeneity are evidently
the norm in psychology (median I2 =74) As discussed above heterogeneity this large makes
successful replication difficult whether defined in terms of hypothesis testing or estimation
precision This high heterogeneity will of course be due in part to methodological differences
between the different studies in each of the 200 meta-analyses that we survey However data from
multi-site registered replication efforts further suggest that when obvious methodological
differences are removed (ie when lsquoexactrsquo replications are conducted) heterogeneity is not
reduced to negligible levels In other words it is unrealistic to believe that variance in
POWER BIAS AND HETEROGENEITY
37
psychological phenomena studied can always be tightly controlled or reduced to practically
insignificant levels
Perhaps more surprising is our finding that there is relatively small exaggeration or overall
selective reporting bias in recent psychological research This is in contrast to the view that
publication bias and questionable research practices are the primary cause of failed replications
Of course as mentioned above there are good reasons to be cautious in applying this hopeful
result to any individual area of research In particular 275 of these areas of research produce a
significant Eggerrsquos test for publication bias (or small-sample bias) and this test is known to have
low power Our survey merely implies that the effects of selective reporting bias (ie publication
bias small-sample biases p-hacking andor questionable research practices) have a less clear
pattern than is maybe assumed by some researchers and by what has been observed in other fields
(eg economics Ioannidis Stanley and Doucouliagos 2017)
In light of the typically high heterogeneity that we observed how should replications in
psychology be interpreted To begin it seems extremely likely that the p-value from any single
non-preregistered non-exact replication study will have nil informative value In the face of high
heterogeneity this is true regardless of the sample size of the replication because it is quite likely
that the replication study will correctly reflect a substantially different true effect than the original
study However individual non-preregistered non-exact replication studies may still contribute to
our collective knowledge when added to a carefully conducted meta-analysis or meta-regression
analysis Meta-analysis moves the focus away from the statistical significance of the single
replication study increases statistical power by pooling across studies allows one to accommodate
and reduce selective reporting bias and meta-regression analysis can use non-exact replications to
POWER BIAS AND HETEROGENEITY
38
help isolate and quantify methodological heterogeneity (eg Stanley amp Doucouliagos 2012
Braver Thoemmes amp Rosenthal 2014 Stanley amp Spence 2014 Fabrigar amp Wegener 2016)
Replication findings from multi-site pre-registered replications clearly offer a different
class of evidence from the single non-pre-registered non-exact replication Statistical power can
be maximized by the pooling of resources across research sites pre-registration is likely to greatly
reduce some types of selective reporting bias and heterogeneity due to obvious methodological
characteristics can be minimized through tightly-controlled study protocols Multi-site pre-
registered replication also allows researchers to directly isolate and quantify the specific
heterogeneity among true effects which remains after methodological heterogeneity is minimized
Such information can provide useful insights about the psychological phenomenon in question
thereby helping to guide and redirect future research and meta-regression analyses
The central implication of our survey is that typically-powered studies in most of areas of
psychology individually or when simply combined into a meta-analysis offer little information
about the magnitude or significance of the phenomenon they examine Our core recommendation
then is that researchers change their expectations about the ease with which convincing evidence
either for or against an effect can be claimed
POWER BIAS AND HETEROGENEITY
39
References
Abramowitz M and IA Stegun (eds) (1964) Handbook of Mathematical Functions with
Formulas Graphs and Mathematical Tables Washington DC US Department of
Commerce
American Psychological Association (2010) Manual of the American Psychological Association
6th ed Washington DC
Asendorpf J B Conner M De Fruyt F De Houwer J Denissen J J Fiedler K amp
Perugini M (2013) Recommendations for increasing replicability in psychology European
Journal of Personality 27(2) 108-119
Baker M (2015) Over half of psychology studies fail reproducibility test Nature News and
Comment August 27 doi101038nature201518248 accessed 8232017
Bakker M van Dijk A amp Wicherts J M (2012) The rules of the game called psychological
science Perspectives on Psychological Science 7(6) 543-554 doi
1011771745691612459060
Bakker M Hartgerink C H Wicherts J M amp van der Maas H L (2016) Researchersrsquo
intuitions about power in psychological research Psychological Science 27(8) 1069-1077 doi
1011770956797616647519
Bohannon J (2015) Reproducibility Many psychology papers fail replication test Science
349910ndash911
Braver SL Thoemmes FJ amp Rosenthal R (2014) Continuously cumulating meta-analysis
and replicability Perspectives on Psychological Science 9 333ndash342 doi
1011771745691614529796
Brodeur A Leacute M Sangnier M amp Zylberberg Y (2016) Star Wars The empirics strike back
American Economic Journal Applied Economics 8 1ndash32 doi 101257app20150044
Bruns S B amp Ioannidis J P A (2016) p-curve and p-hacking in observational research PLoS
ONE 11 e0149144 doi101371journal pone0149144
Button K S Ioannidis J P Mokrysz C Nosek B A Flint J Robinson E S amp Munafograve M
R (2013) Power failure why small sample size undermines the reliability of neuroscience
Nature Reviews Neuroscience 14(5) 365-376 doi101038nrn3475
Cohen J (1962) The statistical power of abnormal-social psychological research A review
Journal of Abnormal and Social Psychology 65 145ndash153
POWER BIAS AND HETEROGENEITY
40
Cohen J (1965) Some statistical issues in psychological research In (BB Wolman ed)
Handbook of Clinical Psychology New York McGraw-Hill pp 95ndash121
Cohen J (1977) Statistical power analysis for the behavioral sciences (2nd ed) New York
Academic Press
Cohen J (1992) A power primer Psychological Bulletin 112 155ndash159
Cooper H M amp Hedges LV (1994) (eds) Handbook of Research Synthesis New York Russell
Sage
Dreber A Pfeiffer T Almenberg J Isaksson S Wilson B Chen Y amp Johannesson M
(2015) Using prediction markets to estimate the reproducibility of scientific research
Proceedings of the National Academy of Sciences 112(50) 15343-47
Eerland A Sherrill A M Magliano J P Zwaan R A Arnal J D Aucoin P amp Prenoveau
J M (2016) Registered replication report Hart amp Albarraciacuten (2011) Perspectives on
Psychological Science 11(1) 158-171 doi 1011771745691615605826
Egger M Smith G D Schneider M amp Minder C (1997) Bias in meta-analysis detected by a
simple graphical test British Medical Journal 315 629ndash634 doi101136bmj3157109629
Engber D (2015) Cover Story Everything is crumbling Slate March 6 Accessed Dec 19
2016
Erica C Y Sprenger A M Thomas R P amp Dougherty M R (2014) When decision heuristics
and science collide Psychonomic Bulletin amp Review 21(2) 268-282 doi103758s13423-013-
0495-z
Fabrigar L R amp Wegener D T (2016) Conceptualizing and evaluating the replication of
research results Journal of Experimental Social Psychology 66 68-80 doi
101016jjesp201507009
Fanelli D (2010) ldquoPositiverdquo results increase down the hierarchy of the sciences PLoS One
5 e10068 doi101371journalpone0010068
Fanelli D Costas R amp Ioannidis J P (2017) Meta-assessment of bias in science Proceedings
of the National Academy of Sciences 201618569 doi101073pnas1618569114
Fiedler K amp Schwarz N (2016) Questionable research practices revisited Social Psychological
and Personality Science 7(1) 45-52 doi 1011771948550615612150
POWER BIAS AND HETEROGENEITY
41
Fraley R C amp Vazire S (2014) The n-pact factor Evaluating the quality of empirical journals
with respect to sample size and statistical power PLoS ONE 9 e109019
doi101371journalpone0109019
Fraley R C amp Marks M J (2007) The null hypothesis significance testing debate and its
implications for personality research In R W Robins R C Fraley amp R F Krueger (Eds)
Handbook of research methods in personality psychology (pp149ndash169) New York Guilford
Franco A Malhotra N amp Simonovits G (2016) Underreporting in psychology experiments
Evidence from a study registry Social Psychological and Personality Science 7(1) 8-12 doi
1011771948550615598377
Gerber A amp Malhotra N (2008) Do statistical reporting standards affect what is published
publication bias in two leading political science journals Quarterly Journal of Political
Science 3 313-326 doi 10156110000008024
Hagger M S Chatzisarantis N L D Alberts H Anggono C O Birt A Brand R amp
Cannon T (2016) A multi-lab preregistered replication of the ego-depletion effect
Perspectives on Psychological Science 11 546ndash573 doi 1011771745691616652873
Hedges L V amp Olkin I (1985) Statistical Methods for Meta-Analysis Academic Press Orlando
Henmi M amp Copas J B (2010) Confidence intervals for random effects meta-analysis and
robustness to publication bias Statistics in Medicine 29 2969ndash2983 doi 101002sim4029
Higgins J P T amp Thompson S G (2002) Quantifying heterogeneity in meta-analysis Statistics
in Medicine 21 1539ndash1558 doi 101002sim1186
Hoenig J M amp Heisey D M (2001) The abuse of power The pervasive fallacy of power
calculations for data analysis American Statistician 55 19ndash24 doi
101198000313001300339897
Inthout J Ioannidis J P A amp Borm G F (2012) Obtaining evidence by a single well-powered
trial or several modestly powered trials Statistical Methods in Medical Research
httpsmmsagepubcomcontentearly201209240962280212461098abstract (Accessed
Aug 16th 2015)
Ioannidis J P A (2005a) Contradicted and initially stronger effects in highly cited clinical
research Journal of the American Medical Association 294 218-228
doi101001jama2942218
POWER BIAS AND HETEROGENEITY
42
Ioannidis J P A (2005b) Why most published research findings are false PLoS Medicine 2
e124 doi101371journalpmed0020124
Ioannidis J P A (2013) Clarifications on the application and interpretation of the test for excess
significance and its extensions Journal of Mathematical Psychology 57 184-187 doi
101016jjmp201303002
Ioannidis J P A Hozo I and Djulbegovic B (2013) Optimal type I and type II error pairs when
the available sample size is fixed Journal of Clinical Epidemiology 66 903-910 doi
101016jjclinepi201303002
Ioannidis J P A Stanley T D amp Doucouliagos C(H) (2017) The power of bias in economics
research The Economic Journal October also as SWP Economics Series 20162
httpwwwdeakineduau__dataassetspdf_file00074777632016_1pdf Deakin University
Australia [Accessed on 27 April 2017]
John L K Loewenstein G amp Prelec D (2012) Measuring the prevalence of questionable
research practices with incentives for truth telling Psychological Science 23 524-532 doi
1011770956797611430953
Klein R A Vianello M Hasselman F Alper S Aveyard M Axt J R amp Nosek B A
(2015) Many Labs 2 Investigating variation in replicability across sample and setting
Manuscript in preparation
Kuumlhberger A Fritz A amp Scherndl T (2014) Publication bias in psychology a diagnosis based
on the correlation between effect size and sample size PloS one 9(9) e105825 doi
101371journalpone0105825
Lakens D (2015) On the challenges of drawing conclusions from p-values just below 005 Peer
J 3e1142 doi 107717peerj1142 PMID 26246976
LeBel E P Borsboom D Giner-Sorolla R Hasselman F Peters K R Ratliff K A amp
Smith C T (2013) PsychDisclosure org Grassroots support for reforming reporting standards
in psychology Perspectives on Psychological Science 8(4) 424-432 doi
1011771745691613491437
LeBel E P Vanpaemel W McCarthy R J Earp B D amp Elson M (2017) A unified
framework to quantify the trustworthiness of empirical research Advances in Methods and
Practices in Psychological Science Retrieved from httpsosfiopreprintspsyarxivuwmr8
8232017
POWER BIAS AND HETEROGENEITY
43
Lindsay D S (2015) Replication in psychological science Psychological Science 26 1827-32
Makel M C Plucker J A amp Hegarty B (2012) Replications in psychology research How
often do they really occur Perspectives on Psychological Science 7(6) 537-542
Maxwell S E (2004) The persistence of underpowered studies in psychological research causes
consequences and remedies Psychological Methods 9 147 doi 1010371082-989X92147
Maxwell S E Lau M Y amp Howard G S (2015) Is psychology suffering from a replication
crisis What does ldquofailure to replicaterdquo really mean American Psychologist 70(6) 487-498
httpdxdoiorg101037a0039400
McShane B B amp Boumlckenholt U (2016) Planning sample sizes when effect sizes are uncertain
The power-calibrated effect size approach Psychological Methods 21(1) 47 doi
101037met0000036
McShane B B Boumlckenholt U amp Hansen K T (2016) Adjusting for publication bias in meta-
analysis An evaluation of selection methods and some cautionary notes Perspectives on
Psychological Science 11 730ndash749 doi 1011771745691616662243
Miguel E amp Christensen G (2017) Transparency reproducibility and the credibility of
economics research Journal of Economic Literature IN PRESS
Moreno S G Sutton A J Ades A E Stanley T D Abrams K R Peters J L Cooper N
J (2009) Assessment of regression-based methods to adjust for publication bias through a
comprehensive simulation study BMC Medical Research Methodology 9 2 doi
1011861471-2288-9-2
Open Science Collaboration (2015) Estimating the reproducibility of psychological science
Science 349(6251) aac4716ndashaac4716 doi101126scienceaac4716
Pashler H amp Harris C (2012) Is the replicability crisis overblown Three arguments examined
Perspectives on Psychological Science 7 531ndash536 doi 1011771745691612463401
Pashler H amp Wagenmakers E J (2012) Editorsrsquo introduction to the special section on
replicability in psychological science a crisis of confidence Perspectives on Psychological
Science 7 528ndash530 doi 1011771745691612465253
Patil P and Leek JT (2015) Reporting of 36 of studies replicate in the media
httpsgithubcomjtleekreplication_paperblobgh-pagesin_the_mediamd[Online up- dated
16-September-2015 accessed 8232017]
POWER BIAS AND HETEROGENEITY
44
Patil P Peng R D amp Leek J T (2016) What should researchers expect when they replicate
studies A statistical view of replicability in psychological science Perspectives on
Psychological Science 11(4) 539-544 doi 1011771745691616646366
Pigott T (2012) Advances in meta-analysis New York NY Springer
Poole C amp Greenland S (1999) Random-effects meta-analyses are not always conservative
American Journal of Epidemiology 150 469ndash475
Popper K (1959) The logic of scientific discovery New York NY Basic Books
Psychonomic Society (2012) New Statistical Guidelines for Journals of the Psychonomic Society
httpwwwpsychonomicorgpagestatisticalguideline (Accessed March 11th 2017)
Rossi J S (1990) Statistical power of psychological research What have we gained in 20 years
Journal of Consulting and Clinical Psychology 58 646ndash656 doi1010370022-
006X585646
Richard F D Bond C F amp Stokes-Zoota J J (2003) One hundred years of social psychology
quantitatively described Review of General Psychology 7 331ndash363
Scargle J D (2000) Publication bias The ldquoFile-Drawerrdquo problem in scientific inference Journal
of Scientific Exploration 14 91ndash106
Schmidt F L amp Hunter J E (2015) Methods of meta-analysis Correcting error and bias in
research findings 3rd ed Los Angeles CA Sage
Schmidt F L amp Oh I -S (2016) The crisis of confidence in research findings in psychology Is
lack of replication the real problem Or something else Archives of Scientific Psychology 4(1)
32ndash37 httpdxdoiorg101037arc0000029
Sedlmeier P amp Gigerenzer G (1989) Do studies of statistical power have an effect on the power
of studies Psychological Bulletin 105 309ndash316
Simmons J P Nelson L D amp Simonsohn U (2011) False-positive psychology Undisclosed
flexibility in data collection and analysis allows presenting anything as significant
Psychological Science 22(11) 1359-1366 doi 1011770956797611417632
Simonsohn U Nelson L D amp Simmons J P (2014) P-curve a key to the file drawer Journal
of Experimental Psychology General 143 534-547 doi 101037a0033242
Stanley D J amp Spence J R (2014) Expectations for replications Are yours realistic
Perspectives on Psychological Science 9 305ndash318 doi 1011771745691614528518
POWER BIAS AND HETEROGENEITY
45
Stanley T D (2008) Meta-regression methods for detecting and estimating empirical effects in
the presence of publication selection Oxford Bulletin of Economics and Statistics 70103-27
doi 101111j1468-0084200700487x
Stanley T D (2017) Limitations of PET-PEESE and other meta-analysis methods Social
Psychology and Personality Science [Epub ahead of print] doi 1011771948550617693062
Stanley T D amp Doucouliagos H(C) 2014 Meta-regression approximations to reduce publication
selection bias Research Synthesis Methods 5 60-78 doi 101002jrsm1095
Stanley T D amp Doucouliagos H(C) 2015 Neither fixed nor random Weighted least squares
meta-analysis Statistics in Medicine 34 2116-27 doi 101002sim6481
Stanley T D amp Doucouliagos H(C) 2017 Neither fixed nor random Weighted least squares
meta-regression analysis Research Synthesis Methods 8 19-42 doi 101002jrsm1211
Stanley T D Doucouliagos H(C) amp Ioannidis J P A 2017 Finding the power to reduce
publication bias Statistics in Medicine [Epub ahead of print] doi 101002sim7228
Sterling T D (1959) Publication decisions and their possible effects on inferences drawn from
tests of significance Or vice versa Journal of the American Statistical Association 54 30ndash34
Sterling T D Rosenbaum W L amp Weinkam J J (1995) Publication decisions revisited The
effect of the outcome of statistical tests on the decision to publish and vice versa American
Statistician 49 108ndash112 doi 1023072684823
Sutton A J Song F Gilbody S M amp Abrams K R (2000) Modelling publication bias in
meta-analysis A review Statistical Methods in Medical Research 9 421-445 doi
101177096228020000900503
Tressoldi P E amp Giofreacute D (2015) The pervasive avoidance of prospective statistical power
Major consequences and practical solutions Frontiers in Psychology 6 726
doi103389fpsyg201500726
van Aert R C M Jelte M Wicherts J M amp van Assen M A L M (2016) Conducting meta-
analyses based on p values Reservations and recommendations for applying p-uniform and p-
curve Perspectives on Psychological Science 11 713ndash729 doi 1011771745691616650874
van Bavel JJ Mende-Siedlecki PBrada WJ and Reinero DA 2016 Contextual sensitivity
in scientific reproducibility Proceedings of the National Academy of Sciences 113 6454ndash59
POWER BIAS AND HETEROGENEITY
46
van Erp S et al (2017) Estimates of between-study heterogeneity for 705 meta-analyses reported
in Psychological Bulletin from 1990ndash2013 Journal of Open Psychology Data 5(1) p4 DOI
httpdoiorg105334jopd33
Wicherts J M Veldkamp C L Augusteijn H E Bakker M van Aert R C amp Van Assen
M A (2016) Degrees of Freedom in Planning Running Analyzing and Reporting
Psychological Studies A Checklist to Avoid p-Hacking Frontiers in Psychology 7 doi
103389fpsyg201601832
Yuan K amp Maxwell S (2005) On the post hoc power in testing mean differences Journal of
Educational and Behavioral Statistics 30 141ndash167 doi 10310210769986030002141
POWER BIAS AND HETEROGENEITY
47
Table 1 Median Statistical Power and Average Effect Sizes
Mean Proportion with Adequate Power Median Power Type of Effect
Absolute Effect Sizes WLS WAAP-WLS PET-PEESE WLS WAAP-WLS PET-PEESE
Combined (n=200)
0389 0077 0071 0091 0364 0331 0360
Correlations (n=108)
0458 0243 0328 0272 0577 0610 0607
SMDs (n=92)
0291 0013 0000 0011 0230 0171 0170
Notes The numbers reported in the table are medians Mean absolute effect sizes are reported in this table in units of standardized mean differences (SMD) regardless of whether they were reported in the meta-analysis as correlations or as SMD WLS is the unrestricted weighted least squares weighted average WAAP-WLS is the weighted average of adequately powered effect sizes (WAAP) or WLS when there are no adequately powered studies PET-PEESE is the conditional precision-effect test-precision-effect estimate with standard error meta-regression correction for publication bias Adequate power is defined as 80 following Cohen (1977)
Table 2 Median Statistical Powers by Experimental Design Proportion with Adequate Power Median Power
Experimental Design WLS WAAP-WLS PET-PEESE WLS WAAP-WLS PET-PEESE
Observational (n=113)
0278 0259 0268 0621 0613 0585
Experimental (n=87)
0032 0000 0053 0247 0232 0236
Notes The numbers reported in the table are medians WLS is the unrestricted weighted least squares weighted average WAAP-WLS is the weighted average of adequately powered effect sizes (WAAP) or WLS when there are no adequately powered studies PET-PEESE is the conditional precision-effect test-precision-effect estimate with standard error meta-regression correction for publication bias Adequate power is defined as 80 following Cohen (1977)
Figure 1 Obtaining adequate power (80)
Notes x is distributed as a standard normal distribution N(01) 196 is the critical value for testing against 0 Figure 1 merely illustrates how the standardized mean of the sampling distribution needs to 28 standard errors away from 0 for an experiment to have adequate powermdashCohenrsquos 80 We thank Stephan Bruns for producing this graph
POWER BIAS AND HETEROGENEITY
49
Figure 2 Histograms of Adequately Powered Estimates from 200 Areas of Research
Notes WLS is the unrestricted weighted least squares weighted average WAAP-WLS is the weighted average of adequately powered effect sizes (WAAP) or WLS when there are no adequately powered studies PET-PEESE is the conditional precision-effect test-precision-effect estimate with standard error meta-regression correction for publication bias Adequate power is defined as 80 following Cohen (1977)
0
20
40
60
80
100
120N
um
ber
of M
eta-
An
alys
es
0 2 4 6 8 1Proportion of Studies Adequately Powered
WLS
0
20
40
60
80
100
120
Nu
mbe
r of
Met
a-A
nal
yses
0 2 4 6 8 1Proportion of Studies Adequately Powered
WAAP-WLS
0
20
40
60
80
100
120
Nu
mbe
r of
Met
a-A
nal
yses
0 2 4 6 8 1Proportion of Studies Adequately Powered
PET-PEESE
POWER BIAS AND HETEROGENEITY
50
Figure 3 Histograms of Median Statistical Power from 200 Areas of Research
Notes WLS is the unrestricted weighted least squares weighted average WAAP-WLS is the weighted average of adequately powered effect sizes (WAAP) or WLS when there are no adequately powered studies PET-PEESE is the conditional precision-effect test-precision-effect estimate with standard error meta-regression correction for publication bias Adequate power is defined as 80 following Cohen (1977)
0
10
20
30
40
50
60N
um
ber
of M
eta-
An
alys
es
0 2 4 6 8 1Median Statistical Power
WLS
0
10
20
30
40
50
60
Nu
mbe
r of
Met
a-A
nal
yses
0 2 4 6 8 1Median Statistical Power
WAAP-WLS
0
10
20
30
40
50
60
70
Nu
mbe
r of
Met
a-A
nal
yses
0 2 4 6 8 1Median Statistical Power
PET-PEESE
Figure 4 Histograms of I2 from 200 Areas of Research
Notes I2 is the proportion of observed variation among reported effect sizes that cannot be explained by the calculated standard errors associated with these reported effect sizes It is a relative measure of heterogeneity
0
5
10
15
20
25
30
35
40
45
0 2 4 6 8 1I-squared
Num
ber o
f Met
a-A
naly
ses
POWER BIAS AND HETEROGENEITY
52
Appendix A Studies included in the meta-meta-analysis
1 Baas M Nijstad B A Boot N C amp De Dreu C K W (2016) Mad genius revisited Vulnerability to psychopathology biobehavioral approach-avoidance and creativity Psychological Bulletin 142 668-692 doi101037bul0000049 [2]
2 Balliet D Li N P Macfarlan S J amp Van Vugt M (2011) Sex differences in cooperation A meta-analytic review of social dilemmas Psychological Bulletin 137 881ndash909 doi 101037a0025354 [1]
3 Balliet D Mulder L B amp Van Lange P A M (2011) Reward punishment and cooperation A meta-analysis Psychological Bulletin 137 594-615 doi 101037a0023489 [2]
4 Balliet D Wu J amp De Dreu C K W (2014) Ingroup favoritism in cooperation A meta-analysis Psychological Bulletin 140 1556-1581 doi 101037a0037737 [1]
5 Brewin C R (2014) Episodic memory perceptual memory and their interaction Foundations for a theory of posttraumatic stress disorder Psychological Bulletin 140 69ndash97 doi 101037a0033722 [1]
6 Byron K amp Khazanchi S (2011) Rewards and creative performance A meta-analytic test of theoretically derived hypotheses Psychological Bulletin 138 809ndash830 [1]
7 Cerasoli C P amp Nicklin J M (2014) Intrinsic motivation and extrinsic incentives jointly predict performance A 40-year meta-analysis Psychological Bulletin 140 980-1008 doi 101037a0035661 [1]
8 Chaplin T M amp Aldao A (2013) Gender differences in emotion expression in children A meta-analytic review Psychological Bulletin 139 735-765 doi 101037a0030737 [4]
9 Defoe I N Dubas JS amp Figner B (2015) A meta-analysis on age differences in risky decision making Adolescents versus children and adults Psychological Bulletin 141 48ndash84 doi 101037a0038088 [4]
10 Degner J amp Dalege J (2013) The apple does not fall far from the tree or does it A meta-analysis of parentndashchild similarity in intergroup attitudes Psychological Bulletin 139 1270ndash1304 doi 101037a0031436 [1]
11 Eastwick P W Finkel E J Luchies L B amp Hunt L L (2014) The predictive validity of ideal partner preferences A review and meta-analysis Psychological Bulletin 140 623ndash 665 doi 101037a0032432 [4]
12 Else-Quest N M Higgins A Allison C amp Morton L C (2012) Gender differences in self-conscious emotional experience Psychological Bulletin 138 947ndash981 doi101037a0027930 [5]
13 Fairbairn C E amp Sayette M A (2014) A social-attributional analysis of alcohol response Psychological Bulletin 140 1361-82 doi 101037a0037563 [4]
14 Fischer P Krueger J I Greitemeyer T Vogrincic C Kastenmuumlller A Frey D Heene M Wicher M amp Kainbacher M (2011) The bystander-effect A meta-analytic review on bystander intervention in dangerous and non-dangerous emergencies Psychological Bulletin 137 517ndash537 doi 101037a0023304 [1]
POWER BIAS AND HETEROGENEITY
53
15 Fox MC Ericsson A amp Best (2011) Do procedures for verbal reporting of thinking have to be reactive A meta-analysis and recommendations for best reporting methods Psychological Bulletin 137 316 ndash344 doi 101037a0021663 [2]
16 Fox N A You K H Bowman L C Cannon E N Ferrari P F Bakermans-Kranenburg M J Vanderwert R E amp van IJzendoorn M H (2016) Assessing human mirror activity with EEG mu rhythm A meta-analysis Psychological Bulletin 142 291ndash313 doi101037bul0000031 [2]
17 Freund P A amp Kasten N (2012) How smart do you think you are A meta-analysis on the validity of self-estimates of cognitive ability Psychological Bulletin 138 296-321 doi101037a0026556 [1]
18 Grijalva E Newman D A Tay L Donnellan M B Harms P D amp Robins R W (2015) Gender differences in narcissism A meta-analytic review Psychological Bulletin 141 261-310 doi 101037a0038231 [3]
19 Haedt-Matt A A amp Keel P K (2011) Revisiting the affect regulation model of binge eating A meta-analysis of studies using ecological momentary assessment Psychological Bulletin 137 660ndash681 doi 101037a0023660 [3]
20 Harkin B Webb T L Prestwich A Conner M Kellar I Benn Y amp Sheeran P (2016) Does monitoring goal progress promote goal attainment A meta-analysis of the experimental evidence Psychological Bulletin 142 198-229 doi 101037bul0000025 [2]
21 Houben M Van Den Noortgate W amp Kuppens P (2015) The relation between short-term emotion dynamics and psychological well-being A meta-analysis Psychological Bulletin 141 901-930 doi101037a0038822 [4]
22 Johnsen T J amp Friborg O (2015) The effects of cognitive behavioral therapy as an anti-depressive treatment is falling A meta-analysis Psychological Bulletin 141 747-768 [2]
23 Karlin B Zinger J F amp Ford R (2015) The effects of feedback on energy conservation A meta-analysis Psychological Bulletin 141 1205-1227 doi 101037a0039650 [1]
24 Kim S Thibodeau R amp Jorgensen R S (2011) Shame guilt and depressive symptoms A meta-analytic review Psychological Bulletin 137 68 ndash96 doi 101037a0021466 [2]
25 Klahr A M amp Burt S A (2014) Elucidating the etiology of individual differences in parenting A meta-analysis of behavioral genetic research Psychological Bulletin 140 544ndash586 doi 101037a0034205 [6]
26 Koenig A M Eagly A H Mitchell A A amp Ristikari T (2011) Are leader stereotypes masculine A meta-analysis of three research paradigms Psychological Bulletin 137 616 ndash 642 doi 101037a0023557 [4]
27 Kredlow M A Unger L D amp Otto M W (2016) Harnessing reconsolidation to weaken fear and appetitive memories A meta-analysis of post-retrieval extinction effects Psychological Bulletin 142 314ndash336 doi 101037bul0000034 [3]
28 Kuykendall L Tay L amp Ng V (2015) Leisure engagement and subjective well-being A meta-analysis Psychological Bulletin 141 364-403 doi101037a0038508 [3]
29 Landau M J amp Kay A C (2015) Compensatory control and the appeal of a structured world Psychological Bulletin 141 694ndash722 doi 101037a0038703 [1]
30 Lee E-S Park T-Y amp Koo B (2015) Identifying organizational identification as a basis for attitudes and behaviors A meta-analytic review Psychological Bulletin 141 1049ndash1080 doi 101037bul0000012 [1]
POWER BIAS AND HETEROGENEITY
54
31 Lui P P (2015) Intergenerational cultural conflict mental health and educational outcomes among Asian and Latinoa Americans Qualitative and meta-analytic review Psychological Bulletin 141 404-446 doi101037a0038449 [3]
32 Lull R B amp Bushman B J (2015) Do sex and violence sell A meta-analytic review of the effects of sexual and violent media and ad content on memory attitudes and buying intentions Psychological Bulletin 141 1022ndash1048 doi 101037bul0000018 [6]
33 Mazei J Freund P A Huumlffmeier J amp Stuhlmacher A F (2015) A meta-analysis on gender differences in negotiation outcomes and their moderators Psychological Bulletin 141 85ndash104 doi 101037a0038184 [1]
34 Melby-Lervaringg M Lyster S A amp Hulme C (2012) Phonological skills and their role in learning to read A meta-analytic review Psychological Bulletin 138 322ndash352 doi 101037a0026744 [3]
35 Melby-Lervaringg M amp Lervaringg A (2014) Reading comprehension and its underlying components in second-language learners A meta-analysis of studies comparing first- and second-language learners Psychological Bulletin 140 409ndash433 doi 101037a0033890
[4] 36 Mendelson J L Gates J A amp Lerner M D (2016) Friendship in school-age boys with
autism spectrum disorders A meta-analytic summary and developmental process-based model Psychological Bulletin 142 601-622 doi 101037bul0000041 [2]
37 Mol S E amp Bus A G (2011) To read or not to read A meta-analysis of print exposure from infancy to early adulthood Psychological Bulletin 137 267ndash296 doi 101037a0021890 [13]
38 Orquin J L amp Kurzban R (2016) A meta-analysis of blood glucose effects on human decision making Psychological Bulletin 142 546ndash567 doi 101037bul0000035 [1]
39 Ottaviani C Verkuil B Medea B Couyoumdjian A Thayer JF Lonigro A amp Brosschot J F (2016) Physiological concomitants of perseverative cognition A systematic review and meta-analysis Psychological Bulletin 142 No 3 231ndash259 doi 101037bul0000036 [8]
40 North M S amp Fiske S T (2015) Modern attitudes toward older adults in the aging world A cross-cultural meta-analysis Psychological Bulletin 141 993ndash1021 doi 101037a0039469 [1]
41 Pahlke E Hyde J S amp Allison C M (2014) The effects of single-sex compared with coeducational schooling on studentsrsquo performance and attitudes A meta-analysis Psychological Bulletin 140 1042-1072 doi 101037a0035740 [2]
42 Pan S C amp Rickard T C (2015) Sleep and motor learning Is there room for consolidation Psychological Bulletin 141 812-834 doi 101037bul0000009 [1]
43 Phillips W J Fletcher J M Marks A D G amp Hine D W (2016) Thinking styles and decision making A meta-analysis Psychological Bulletin 142 No 3 260ndash290 doi 101037bul0000027 [4]
44 Pool E Brosch T Delplanque S amp Sander D (2016) Attentional bias for positive emotional stimuli A meta-analytic investigation Psychological Bulletin 142 No 1 79ndash106 doi 101037bul0000026 [1]
45 Randall J G Oswald F L amp Beier M E (2014) Mind-wandering cognition and performance A theory-driven meta-analysis of attention regulation Psychological Bulletin 140 1411ndash1431 doi 101037a0037428 [4]
POWER BIAS AND HETEROGENEITY
55
46 Sambrook T D amp Goslin J (2015) A neural reward prediction error revealed by a meta-analysis of ERPs using great grand averages Psychological Bulletin 141 213ndash235 doi 101037bul0000006 [4]
47 Sedlmeier P Eberth J Schwarz M Zimmermann D Haarig F Jaeger S amp Kunze S (2012) The psychological effects of meditation A meta-analysis Psychological Bulletin 138 1139ndash1171 doi 101037a0028168 [20]
48 Sheeran P Harris P R and Epton T (2014) Does heightening risk appraisals change peoplersquos intentions and behavior A meta-analysis of experimental studies Psychological Bulletin 140 511ndash543 doi 101037a0033065 [2]
49 Smith S F amp Lilienfeld S O (2015) The response modulation hypothesis of psychopathy A meta-analytic and narrative analysis Psychological Bulletin 141 1145ndash1177 doi 101037bul0000024 [1]
50 Soderberg C K Amit E Callahan S P Kochersberger A O amp Ledgerwood A (2015) The effects of psychological distance on abstraction Two meta-analyses Psychological Bulletin 141 3 525ndash548 doi101037bul0000005 [2]
51 Tannenbaum M B Hepler J Zimmerman R S Saul L Jacobs S Wilson K amp Albarraciacuten D Appealing to fear A meta-analysis of fear appeal effectiveness and theories Psychological Bulletin 141 1178ndash1204 doi101037a0039729 [1]
52 Toosi N R Babbitt L G Ambady N amp Sommers SR (2012) Dyadic interracial interactions A meta-analysis Psychological Bulletin 138 1ndash27 doi 101037a0025767 [4]
53 Vachon D D Lynam D R amp Johnson J A (2014) The (Non)relation between empathy and aggression Surprising results from a meta-analysis Psychological Bulletin 140 751ndash773 doi 101037a0035236 [1]
54 Verhage M L Schuengel C Madigan S Fearon R M P Oosterman M Cassibba R Bakermans-Kranenburg M J amp van IJzendoorn M H (2016) Narrowing the transmission gap A synthesis of three decades of research on intergenerational transmission of attachment Psychological Bulletin 142 337ndash366 doi 101037bul0000038 [2]
55 von Stumm S amp Ackerman P L (2013) Investment and intellect A review and meta-analysis Psychological Bulletin 139 841ndash869 doi 101037a0030746 [11]
56 Voyer D amp Voyer S D (2014) Gender differences in scholastic achievement A meta-analysis Psychological Bulletin 140 1174-1204 doi 101037a0036620 [6]
57 Vucasović T amp Bratko D (2015) Heritability of personality A meta-analysis of behavior genetic studies Psychological Bulletin 141 769ndash785 doi101037bul0000017 [1]
58 Wanberg C R Hamann D J Kanfer R amp Zhang Z (2016) Age and reemployment success after job loss An integrative model and meta-analysis Psychological Bulletin 142 400-426 doi 101037bul0000019 [6]
59 Weingarten E Chen Q McAdams M Yi J amp Hepler J (2016) From primed concepts to action A meta-analysis of the behavioral effects of incidentally presented words Psychological Bulletin 142 472ndash497 doi 101037bul0000030 [1]
60 Williams M J amp Tiedens L Z (2016) The subtle suspension of backlash A meta-analysis of penalties for womenrsquos implicit and explicit dominance behaviour Psychological Bulletin 142 165ndash197 doi 101037bul0000039 [6]
POWER BIAS AND HETEROGENEITY
56
61 Winer E S amp Salem T (2016) Reward devaluation Dot-probe meta-analytic evidence of avoidance of positive information in depressed persons Psychological Bulletin 142 18ndash78 doi 101037bul0000022 [6]
Notes Numbers in square brackets denote the number of meta-analyses included in the dataset
Appendix B Distribution of survey estimates
Year
No of meta-analyses published
No of meta-analyses sampled
of published meta-studies
No of estimates
of sample
2016 17 14 82 46 22 2015 22 18 82 40 19 2014 25 12 48 46 22 2013 17 3 18 16 8 2012 15 6 40 34 16 2011 19 8 42 31 15

POWER BIAS AND HETEROGENEITY
25
With the WLS WAAP-WLS and PET-PEESE estimates of the lsquotruersquo effect for a given
area of research adequate power is easy to assess We assume the null hypotheses are two tailed
with a 5 significance level and we accept Cohenrsquos 80 as the definition of adequate power
These conventions for Type I and Type II errors imply that the lsquotruersquo effect needs to be equal to or
greater than 28 standard errors in absolute magnitude if power is to reach 80 This value of 28
is the sum of 196 and 084 where 196 is the minimum number of standard errors from zero that
an observed effect must fall to be rejected with a 5 significance level and 084 is the number of
additional standard errors that the true effect must fall from zero such that 80 of the distribution
of the observed effect is in the rejection regionmdashsee Figure 1 Hence for a study to have adequate
power its standard error needs to be smaller than the absolute value of the underlying mean lsquotruersquo
effect divided by 28 All that remains to assess adequate power retrospectively are (1) the values
of the standard error and (2) an estimate (or estimates) of the lsquotruersquo effect If the standard error of
a study is less than the absolute value of an estimate lsquotruersquo effect (from WLS WAAP-WLS or
PET-PEESE) divided by 28 we know that this study is adequately powered to detect a lsquotruersquo
effect equal or greater than this estimate Median power for a given area of research can then be
calculated from the cumulative normal probability of the difference between 196 and the absolute
value of an estimate of the true effect divided by the median standard error Because our survey
is merely descriptive we focus on the median powers across reported effect sizes areas of
research and also across these three estimation approaches to the average true effect size The
median of these estimation approaches will thus be conservative and tend to overestimate the
quality of psychological research
POWER BIAS AND HETEROGENEITY
26
Assessing residual selective reporting bias
If an area of research is selectively reporting effect size to be statistically significant in a
direction consistent with the prevailing psychological theory then the average reported effect will
on average have a larger magnitude than the true effect (whether or not prevailing psychological
theory suggests a direct or an inverse association) As before we can use these meta-averages
WLS WAAP-WLS and PET-PEESE as proxies for lsquotruersquo effect and then compare them to
average reported effect for an assessment of residual reporting bias Needless to say each reported
estimate is subject to random sampling error and will be sometimes larger and sometimes smaller
than the mean true effect Such differences cannot be regarded as lsquobiasrsquo but merely as sampling
or estimation errors However when there is a systematic trend for the unadjusted simple average
to be larger than a meta-average known to be less biased when there is selective reporting bias
then we can regard the difference between the absolute value of the simple mean and the absolute
value of WLS or WAAP-WLS as the lower limit of bias when it persists consistently over hundreds
of separate areas of research Using this approach Ioannidis Stanley amp Doucouliagos (2017) find
that the typical reported estimate in economics is twice as large or larger than either WAAP or
PET-PEESE In sharp contrast our survey of psychology finds on average only a small amount
of consistent exaggeration or overall selective reporting bias
Results
Among these 200 areas of psychological research containing 12065 estimated effect the
average effect size is 0389 expressed as the median of average standardized mean differences or
0191 as a correlation coefficient This overall effect size is nearly the same as the average of the
first 100 years of social psychology (r = 021) uncovered by Richard Bond amp Stokes-Zoota
POWER BIAS AND HETEROGENEITY
27
(2003) The typical standard error is 0104 expressed as a correlation 021 when represented by
a standardized mean difference (SMD) The p-value produced by these averages is a little larger
than the conventional 05 level Other researchers across several disciplines have found that that
p-values tend to lump up at or just below 05 (Gerber amp Malhotra 2008 Brodeur Sangnier amp
Zylberberg 2016) Contrary to recent concerns about publication bias questionable research
practices and null hypothesis significance testing we find that the typical psychological research
study is statistically insignificant at the conventional 05 level of significance
Table 1 reports the median absolute value of the average reported effect size from these
200 meta-analyses Here all effect sizes are first converted to standardized mean differences
(SMD) to be comparable However an interesting pattern emerges when these 200 meta-analyses
are divided by the types of effect sizes that are commonly reported correlation vs SMD The
typical effect size found among the 108 lsquocorrelation-basedrsquo meta-analyses in our survey (0458 in
SMD units) is 57 larger than those meta-analyses measured by SMDs (0291)15
Power
The median of the percent of reported effects that are adequately powered across these 200
areas of research are (1) 77 when the unrestricted WLS (or fixed effect) weighted average is
used to represent the mean of the true effects distribution (2) 71 when WAAP-WLS proxies for
lsquotruersquo effect and (3) 91 if PET-PEESE substitutes for true effect Figure 2 displays the
distributions of the proportion of studies that are adequately powered across these 200 areas of
15 We thank Frank Schmidt for pointing out that technically only point-biserial correlations can be converted to Cohenrsquos d Ceteris paribus other correlations will be larger than the point-biserial correlation due to the latterrsquos restricted range Thus a small part of the larger effect average effect size of lsquocorrelation-basedrsquo meta-analyses might be due to the conversion of all correlations to Cohenrsquos d Because these 108 lsquocorrelation-basedrsquo meta-analyses often contain an undisclosed mix of correlation types we cannot fully correct this small bias However as we discussed above none of our calculations of power heterogeneity or bias depend in any way on the transformation of correlations to standardized mean differences
POWER BIAS AND HETEROGENEITY
28
research Clearly underpowered studies dominate psychological research But how underpowered
are they
We also calculate the median powers for each of these 200 areas of research The typical
power of psychological research is around 36 364 based on WLS 331 based on WAAP-
WLS and 36 based on PET-PEESE16 Figure 3 shows the distribution of median powers across
these 200 areas of research Note their striking shapes The two most frequent categories are the
lowest (0-10) and the highest (over 90) Even though typical areas of research are quite
inadequately powered as measured by median power approximately one-fifth of these 200 areas
of psychological research are quite highly-powered Between 19 and 23 have average statistical
power 90 or highermdashsee Figure 3 It should not be surprising that some areas of research have
high power Aside from sample size statistical power depends on the underlying true effect size
and some psychological phenomena have large effects When WAAP-WLS is used to estimate
true effect one-third of these 200 areas of psychological research (32) have lsquolargersquo or lsquomediumrsquo
effect sizes defined as |WAAP-WLS| gt 05 SMD Even rather modest sample sizes will estimate
large effects powerfully
As before we find striking difference between correlation-based meta-analyses and SMD-
based meta-analyses Table 1 breaks down the median proportion of studies that are adequately
powered and the median power by type of effect size Those areas of psychological research that
predominately report standardized mean differences (SMDs) are highly under-powered typically
99 are underpowered compared to 67 to 76 for correlation-based meta-analyses The median
16 This is somewhat less than a recent survey Fraley amp Vazire (2014) which found a median power to detect a correlation of 02 to be 49 among top social-personality journals for the years 2006-2010 But then Fraley amp Vazire (2014) calculate prospective rather than retrospective power and their sampling frame is different than ours Thus we would expect some differences especially when considering that our median power calculations reflect both the observed effect size of each area of research and the distribution of statistical power within an area of research
POWER BIAS AND HETEROGENEITY
29
statistical power in SMD meta-analyses is between 17 to 23 For correlation-based research
typical power is nearly three times highermdash58 to 61
Residual selective reporting bias
Recall that residual reporting bias may be calculated as the difference between the absolute
value of the simple mean reported effect and the absolute value of one of our less vulnerable
proxies for true effectmdashWLS WAAP-WLS or PET-PEESE We find only small amounts of
residual reporting bias in psychological research 8 based on WLS 12 based on WAAP-WLS
and 15 based on PET-PEESE Thus our survey identifies only a small systematic exaggeration
overall
There are some important qualifications to make about this finding First all these
estimates are themselves biased and two of them consistently underestimate residual bias when
there is selective reporting (Stanley and Doucouliagos 2014 Stanley and Doucouliagos 2015
Stanley et al 2017 Stanley 2017) Second a notable proportion of psychology might still be
affected by selective reporting bias even if the median amount of exaggeration is relatively small
275 (or 55 areas of research) find evidence of some type of selective reporting or small-sample
bias using the Egger test for funnel plot asymmetry and this is likely to be an under-estimate of
the incidence of these biases because the Egger test is known to have low power (Egger et al
1997 Stanley 2008) Third we again find notable differences between types of effect sizes
reported by meta-analysts When using WLS as a proxy for the true effect we find that the simple
mean of reported SMDs is now exaggerated by 13 on average by 20 if WAAP-WLS
substitutes for true effect and by 30 relative to the median absolute value of PET-PEESE
POWER BIAS AND HETEROGENEITY
30
Heterogeneity
The median percent of the observed variation of reported effect sizes within a given area
of research that is attributed to heterogeneity (I2) is 74 This means that the variance among lsquotruersquo
effects is nearly 3 times larger than the reported sampling variance According to Pigottrsquos (2012)
guidelines for small (25) medium (50) and large (75) heterogeneity typical areas of research
have nearly lsquolargersquo excess heterogeneity Yet this level of heterogeneity appears to be the norm
for research in psychology For example van Erp et al (2017) extracted estimates of heterogeneity
from 705 meta-analyses published in Psychological Bulletin between 1990 and 2013 and found
that the median reported I2 = 7062 (interquartile range [3324 8741]) However I2 is a
relative measure of heterogeneity and does not reflect the variation in true effect as measured in
units of SMDs When our median I2 is applied to the typical area of research the standard deviation
among true effects is 0354 SMD and the standard deviation from one study to the next due to both
heterogeneity and sampling error becomes 0412 larger than the typical reported effect size 0389
lsquoExperimentalrsquo vs lsquoobservationalrsquo research
As a post hoc secondary analysis17 we examined whether the systematic differences
between SMD-based and correlation-based meta-analyses are due to experimental design
lsquoexperimentalrsquo vs lsquoobservationalrsquo Unfortunately this differentiation is not perfect Many meta-
analyses contain a mix of experimental and observational research designs at the study level For
example Williams and Tiedens (2015) meta-analysis of the effects of gender and dominance
17 Investigating these differences was not part of our pre-analysis plan Anonymous reviewers asked that we code for experimental design and report the differences
POWER BIAS AND HETEROGENEITY
31
behavior includes 97 experimental studies (85) where dominance behavior was somehow
manipulated and 17 purely observational studies
Because a substantial percent (424) of those meta-analyses that report effect sizes in
terms of SMD are lsquoobservationalrsquo and 314 of correlation-based meta-analyses are
lsquoexperimentalrsquo there is only small correlation (phi=0263 plt001) between experimental design
(1 if primarily experimental 0 elsewhere) and effect type (1 if SMD 0 for correlation) However
we do see some interesting differences in power and heterogeneity by experimental design First
there is a difference between heterogeneity as measured by I2 (plt01) The median I2 for
experimental research is 68 vs 76 for observational designs But I2 is a relative measure of
heterogeneity with a non-symmetric distribution To correct for I2rsquos nonstandard distribution we
use Abramowitz and Stegunrsquos (1964) normal approximation for the chi-square distribution applied
to the Cochran Q-test for heterogeneity Doing so causes this difference in relative heterogeneity
to be only marginally larger than statistical noise (p=045) Additionally experimental research
designs have larger sampling errors and lower power Typical sampling errors are 026 vs 019
measured as median SEs in units of SMD Table 2 reports the median proportion of studies that
are adequately powered and the median of median powers by type of research design Even though
there is only a small association between experimental design and effect type we find a similar
pattern among the typical levels of power for experimental design that we see for effect type
confirming the concerned expressed by dozens of researchers over the years that scarcely any
experimental studies are adequately powered All of these results about lsquoexperimentalrsquo vs
lsquoobservationalrsquo research designs should be interpreted with caution because as mentioned they
are conducted post hoc
POWER BIAS AND HETEROGENEITY
32
Discussion
Our survey of 12065 estimated effects sizes from nearly 8000 studies in 200 meta-
analyses reveals that the typical effect size is 0389 SMD with a median standard error of 021 We
also find low statistical power small residual selection bias and high levels of heterogeneity The
central purpose of our review is to assess the replicability of psychological research through meta-
analysis and thereby better understand recent failures to replicate Our findings implicate low
statistical power and high levels of heterogeneity as the primary causes of lsquofailedrsquo replications
however defined
We find that only a small proportion of psychological studies are adequately powered
approximately 8 and the median power is about 36 across three proxies for the mean lsquotruersquo
effect18 What does this imply about replication Our survey predicts therefore that replication
study with a typical sample size will have only a 36 chance of finding a statistically significant
effect in the same direction as some previous study and this value is exactly the same percent of
replications found to be statistically significant in the same direction by the Open Science
Collaboration (Open Science Collaboration 2015 Table 1) Thus when replication is viewed in
terms of sign and statistical significance it is no wonder that rates of replication are considered
low in psychology research
Improving replication as noted by others (eg Maxwell et al 2015) would seem to be a
matter of conducting both initial studies and replications with larger samples reducing sources of
non-sampling error (eg measurement error Stanley amp Spence 2014) and focusing on larger
18 To be more precise 36 is the median among the medians of medians
POWER BIAS AND HETEROGENEITY
33
effects Because researchers work with limited resources and knowledge these obvious
recommendations are extremely difficult to implement in most cases
More practical recommendations have centered on redefining replication success and
adjusting researchersrsquo expectations about non-significant replications For example Peng et al
(2016) examined the data from the Reproducibility Project Psychology (Open Science
Collaboration 2015) in terms of prediction intervalsmdashconfidence intervals that account for
variability in both the original and replication studymdashand found that 77 of the replication
attempts were consistent with the original findings This finding seems to be in apparent contrast
to the highly publicized result that only 36 of the replications in those data were statistically
significant but completely in accord with the less well-publicized result that meta-analytically
combining the replications with the original studies resulted in 70 statistical significance (Open
Science Collaboration 2015) Along similar lines several authors have argued for assessing
replication primarily within the context of meta-analysis (eg Braver Thoemmes amp Rosenthal
2014 Stanley amp Spence 2014 Fabrigar amp Wegener 2016) Doing so could shift the evaluation
of success vs failure of replications to a judgement about the degree of information that new data
add to our knowledge base (Peng et al 2016)
Consistent with a previous survey of heterogeneity (van Erp et al 2017) and several
findings from recent multi-site replication attempts (Hagger amp Chatzisarantis 2016 Eerland et al
2016 Klein et al 2015) our survey reveals clear evidence for high levels of heterogeneity in
research in psychology We find that heterogeneity accounts for nearly three-fourths of the
observed variation among reported effects (ie median I2 =74) When applied to the median
reported standard error (measured in terms of SMD) this high I2 implies that the typical standard
deviation of heterogeneity is equal to 0354 (again in units of SMDs) Importantly even a
POWER BIAS AND HETEROGENEITY
34
replication study with millions of subjects will remain vulnerable to heterogeneity among lsquotruersquo
effects When we apply our surveyrsquos typical heterogeneity to its typical effect size it is unlikely
that any replication will be lsquosuccessfulrsquo For example if our median effect size 0389 is the mean
of the distribution of true effects then there is a 298 probability that the largest possible
replication study will find a negligible zero or opposite-signed effect The probability is 324
that this ideal replication (ie ninfin) finds a small effect and it is 255 for a medium-sized
effectmdashusing Cohenrsquos guidelines of 02 05 and 08 Even though 0389 is considered a lsquosmallrsquo
effect by these guidelines the probability that a very large replication finds a large effect remains
non-negligible at 123 Thus it is quite likely 68 that an ideal replication will not reproduce
a small effect when the mean of the distribution true effects is equal to our median average effect
size The wide distribution of true effect sizes that our survey finds is also similar to what Open
Science Collaboration observed when attempting to replicate 100 psychological experimentmdashsee
Figure 3 in the Open Science Collaboration (2015)
No matter what the mean of the distribution of true effect sizes might be nor how large the
replication study is it is unlikely that a replication will find an effect size close to what was found
previously when there is this much heterogeneity If a lsquosuccessful replicationrsquo is defined as finding
an effect size similar to what some previous study or studies have found (say for example to
within + 01 or within + 02 SMD) then there will always be a sizeable chance of unsuccessful
replication no matter how well conducted or how large any of the studies are For example
suppose that two studies are conducted with nearly infinite sample sizes and therefore infinitesimal
sampling error Heterogeneity of the size that our survey finds implies that the probability that
these two ideal studies find effect sizes that are within +01 from one another is 158 and 311
to within +02 Indeed there remains a 50 or greater probability of a lsquofailed replicationrsquo whenever
POWER BIAS AND HETEROGENEITY
35
the acceptable difference for a successful replication is set at less than 035 SMD Needless to say
if we have less-than-ideal sample sizes the resulting added sampling error will reduce the
probability of a successful replication further Thus high heterogeneity further explains the failure
of the Open Science Collaboration (2015) to find reliable indicators of replication success
There are important caveats to these calculations of replication success that need to be
mentioned First there is a wide distribution of observed heterogeneity among these areas of
psychological researchmdashsee Figure 4 Twenty-two percent have I2s that are less than 50 while
47 have I2 values 75 or higher and one out of seven have excess heterogeneity of 90 or more
Thus successful replication will be more likely in some areas of research but much less likely in
others Second these calculations assume that the typical heterogeneity observed in this research
record is entirely heterogeneity among lsquotruersquo effects that is variation beyond the control of
researchers Because exact replication is rare in psychology some of this observed heterogeneity
will be due to variation in experimental conditions measures methods and the characteristics of
the population from which the samples are drawn Thus a careful exact replication study could
avoid a notable amount of this variation in expected effect by carefully duplicating all of the
controllable features of the experimental design execution and evaluation However those large-
scale efforts to control these controllable research dimensions still find that notable heterogeneity
remains (Hagger et al 2016 Eerland et al 2016 Klein et al 2015) Moreover if half the
observed heterogeneity variance is due to differences that are under the control of the researcher19
then our estimate of the typical standard deviation due this uncontrollable heterogeneity among
true effects would be reduced to 025 In which case the probability that the largest possible
19 The typical heterogeneity found by two large replication studies that attempted to be as exact as possible is larger than half of the median heterogeneity that our survey finds (Hagger et al 2016 Eerland et al 2016)
POWER BIAS AND HETEROGENEITY
36
replication study will find a negligible zero or opposite-signed effect declines to 22 28 for a
medium effect and it will find a large effect only about 5 of the time Even if half of the observed
heterogeneity among reported effects is under the researcherrsquos control the probability that any
replication effort successfully replicates a small effect (recall 0389 is our surveyrsquos median effect
size) remains less than 50
Conclusions
Our survey of 12065 estimated effect sizes from nearly as many studies and 8000 papers
finds that lsquofailedrsquo replicationsmdashdefined here in terms of null hypothesis significance testingmdash are
to be expected at a rate consistent with the widely publicized the Reproducibility Project
Psychology (Open Science Collaboration 2015) Like many other researchers we find that
statistical power is chronically low in research in psychology (Cohen 1962 Cohen 1977
Sedlmeier amp Gigerenzer 1989 Rossi 1990 Maxwell 2004 Pashler amp Wagenmakers 2012
Fraley amp Vazire 2014 Tressoldi amp Giofreacute 2015) Unlike this previous research however our
survey reveals a more severe challenge for replication High levels of heterogeneity are evidently
the norm in psychology (median I2 =74) As discussed above heterogeneity this large makes
successful replication difficult whether defined in terms of hypothesis testing or estimation
precision This high heterogeneity will of course be due in part to methodological differences
between the different studies in each of the 200 meta-analyses that we survey However data from
multi-site registered replication efforts further suggest that when obvious methodological
differences are removed (ie when lsquoexactrsquo replications are conducted) heterogeneity is not
reduced to negligible levels In other words it is unrealistic to believe that variance in
POWER BIAS AND HETEROGENEITY
37
psychological phenomena studied can always be tightly controlled or reduced to practically
insignificant levels
Perhaps more surprising is our finding that there is relatively small exaggeration or overall
selective reporting bias in recent psychological research This is in contrast to the view that
publication bias and questionable research practices are the primary cause of failed replications
Of course as mentioned above there are good reasons to be cautious in applying this hopeful
result to any individual area of research In particular 275 of these areas of research produce a
significant Eggerrsquos test for publication bias (or small-sample bias) and this test is known to have
low power Our survey merely implies that the effects of selective reporting bias (ie publication
bias small-sample biases p-hacking andor questionable research practices) have a less clear
pattern than is maybe assumed by some researchers and by what has been observed in other fields
(eg economics Ioannidis Stanley and Doucouliagos 2017)
In light of the typically high heterogeneity that we observed how should replications in
psychology be interpreted To begin it seems extremely likely that the p-value from any single
non-preregistered non-exact replication study will have nil informative value In the face of high
heterogeneity this is true regardless of the sample size of the replication because it is quite likely
that the replication study will correctly reflect a substantially different true effect than the original
study However individual non-preregistered non-exact replication studies may still contribute to
our collective knowledge when added to a carefully conducted meta-analysis or meta-regression
analysis Meta-analysis moves the focus away from the statistical significance of the single
replication study increases statistical power by pooling across studies allows one to accommodate
and reduce selective reporting bias and meta-regression analysis can use non-exact replications to
POWER BIAS AND HETEROGENEITY
38
help isolate and quantify methodological heterogeneity (eg Stanley amp Doucouliagos 2012
Braver Thoemmes amp Rosenthal 2014 Stanley amp Spence 2014 Fabrigar amp Wegener 2016)
Replication findings from multi-site pre-registered replications clearly offer a different
class of evidence from the single non-pre-registered non-exact replication Statistical power can
be maximized by the pooling of resources across research sites pre-registration is likely to greatly
reduce some types of selective reporting bias and heterogeneity due to obvious methodological
characteristics can be minimized through tightly-controlled study protocols Multi-site pre-
registered replication also allows researchers to directly isolate and quantify the specific
heterogeneity among true effects which remains after methodological heterogeneity is minimized
Such information can provide useful insights about the psychological phenomenon in question
thereby helping to guide and redirect future research and meta-regression analyses
The central implication of our survey is that typically-powered studies in most of areas of
psychology individually or when simply combined into a meta-analysis offer little information
about the magnitude or significance of the phenomenon they examine Our core recommendation
then is that researchers change their expectations about the ease with which convincing evidence
either for or against an effect can be claimed
POWER BIAS AND HETEROGENEITY
39
References
Abramowitz M and IA Stegun (eds) (1964) Handbook of Mathematical Functions with
Formulas Graphs and Mathematical Tables Washington DC US Department of
Commerce
American Psychological Association (2010) Manual of the American Psychological Association
6th ed Washington DC
Asendorpf J B Conner M De Fruyt F De Houwer J Denissen J J Fiedler K amp
Perugini M (2013) Recommendations for increasing replicability in psychology European
Journal of Personality 27(2) 108-119
Baker M (2015) Over half of psychology studies fail reproducibility test Nature News and
Comment August 27 doi101038nature201518248 accessed 8232017
Bakker M van Dijk A amp Wicherts J M (2012) The rules of the game called psychological
science Perspectives on Psychological Science 7(6) 543-554 doi
1011771745691612459060
Bakker M Hartgerink C H Wicherts J M amp van der Maas H L (2016) Researchersrsquo
intuitions about power in psychological research Psychological Science 27(8) 1069-1077 doi
1011770956797616647519
Bohannon J (2015) Reproducibility Many psychology papers fail replication test Science
349910ndash911
Braver SL Thoemmes FJ amp Rosenthal R (2014) Continuously cumulating meta-analysis
and replicability Perspectives on Psychological Science 9 333ndash342 doi
1011771745691614529796
Brodeur A Leacute M Sangnier M amp Zylberberg Y (2016) Star Wars The empirics strike back
American Economic Journal Applied Economics 8 1ndash32 doi 101257app20150044
Bruns S B amp Ioannidis J P A (2016) p-curve and p-hacking in observational research PLoS
ONE 11 e0149144 doi101371journal pone0149144
Button K S Ioannidis J P Mokrysz C Nosek B A Flint J Robinson E S amp Munafograve M
R (2013) Power failure why small sample size undermines the reliability of neuroscience
Nature Reviews Neuroscience 14(5) 365-376 doi101038nrn3475
Cohen J (1962) The statistical power of abnormal-social psychological research A review
Journal of Abnormal and Social Psychology 65 145ndash153
POWER BIAS AND HETEROGENEITY
40
Cohen J (1965) Some statistical issues in psychological research In (BB Wolman ed)
Handbook of Clinical Psychology New York McGraw-Hill pp 95ndash121
Cohen J (1977) Statistical power analysis for the behavioral sciences (2nd ed) New York
Academic Press
Cohen J (1992) A power primer Psychological Bulletin 112 155ndash159
Cooper H M amp Hedges LV (1994) (eds) Handbook of Research Synthesis New York Russell
Sage
Dreber A Pfeiffer T Almenberg J Isaksson S Wilson B Chen Y amp Johannesson M
(2015) Using prediction markets to estimate the reproducibility of scientific research
Proceedings of the National Academy of Sciences 112(50) 15343-47
Eerland A Sherrill A M Magliano J P Zwaan R A Arnal J D Aucoin P amp Prenoveau
J M (2016) Registered replication report Hart amp Albarraciacuten (2011) Perspectives on
Psychological Science 11(1) 158-171 doi 1011771745691615605826
Egger M Smith G D Schneider M amp Minder C (1997) Bias in meta-analysis detected by a
simple graphical test British Medical Journal 315 629ndash634 doi101136bmj3157109629
Engber D (2015) Cover Story Everything is crumbling Slate March 6 Accessed Dec 19
2016
Erica C Y Sprenger A M Thomas R P amp Dougherty M R (2014) When decision heuristics
and science collide Psychonomic Bulletin amp Review 21(2) 268-282 doi103758s13423-013-
0495-z
Fabrigar L R amp Wegener D T (2016) Conceptualizing and evaluating the replication of
research results Journal of Experimental Social Psychology 66 68-80 doi
101016jjesp201507009
Fanelli D (2010) ldquoPositiverdquo results increase down the hierarchy of the sciences PLoS One
5 e10068 doi101371journalpone0010068
Fanelli D Costas R amp Ioannidis J P (2017) Meta-assessment of bias in science Proceedings
of the National Academy of Sciences 201618569 doi101073pnas1618569114
Fiedler K amp Schwarz N (2016) Questionable research practices revisited Social Psychological
and Personality Science 7(1) 45-52 doi 1011771948550615612150
POWER BIAS AND HETEROGENEITY
41
Fraley R C amp Vazire S (2014) The n-pact factor Evaluating the quality of empirical journals
with respect to sample size and statistical power PLoS ONE 9 e109019
doi101371journalpone0109019
Fraley R C amp Marks M J (2007) The null hypothesis significance testing debate and its
implications for personality research In R W Robins R C Fraley amp R F Krueger (Eds)
Handbook of research methods in personality psychology (pp149ndash169) New York Guilford
Franco A Malhotra N amp Simonovits G (2016) Underreporting in psychology experiments
Evidence from a study registry Social Psychological and Personality Science 7(1) 8-12 doi
1011771948550615598377
Gerber A amp Malhotra N (2008) Do statistical reporting standards affect what is published
publication bias in two leading political science journals Quarterly Journal of Political
Science 3 313-326 doi 10156110000008024
Hagger M S Chatzisarantis N L D Alberts H Anggono C O Birt A Brand R amp
Cannon T (2016) A multi-lab preregistered replication of the ego-depletion effect
Perspectives on Psychological Science 11 546ndash573 doi 1011771745691616652873
Hedges L V amp Olkin I (1985) Statistical Methods for Meta-Analysis Academic Press Orlando
Henmi M amp Copas J B (2010) Confidence intervals for random effects meta-analysis and
robustness to publication bias Statistics in Medicine 29 2969ndash2983 doi 101002sim4029
Higgins J P T amp Thompson S G (2002) Quantifying heterogeneity in meta-analysis Statistics
in Medicine 21 1539ndash1558 doi 101002sim1186
Hoenig J M amp Heisey D M (2001) The abuse of power The pervasive fallacy of power
calculations for data analysis American Statistician 55 19ndash24 doi
101198000313001300339897
Inthout J Ioannidis J P A amp Borm G F (2012) Obtaining evidence by a single well-powered
trial or several modestly powered trials Statistical Methods in Medical Research
httpsmmsagepubcomcontentearly201209240962280212461098abstract (Accessed
Aug 16th 2015)
Ioannidis J P A (2005a) Contradicted and initially stronger effects in highly cited clinical
research Journal of the American Medical Association 294 218-228
doi101001jama2942218
POWER BIAS AND HETEROGENEITY
42
Ioannidis J P A (2005b) Why most published research findings are false PLoS Medicine 2
e124 doi101371journalpmed0020124
Ioannidis J P A (2013) Clarifications on the application and interpretation of the test for excess
significance and its extensions Journal of Mathematical Psychology 57 184-187 doi
101016jjmp201303002
Ioannidis J P A Hozo I and Djulbegovic B (2013) Optimal type I and type II error pairs when
the available sample size is fixed Journal of Clinical Epidemiology 66 903-910 doi
101016jjclinepi201303002
Ioannidis J P A Stanley T D amp Doucouliagos C(H) (2017) The power of bias in economics
research The Economic Journal October also as SWP Economics Series 20162
httpwwwdeakineduau__dataassetspdf_file00074777632016_1pdf Deakin University
Australia [Accessed on 27 April 2017]
John L K Loewenstein G amp Prelec D (2012) Measuring the prevalence of questionable
research practices with incentives for truth telling Psychological Science 23 524-532 doi
1011770956797611430953
Klein R A Vianello M Hasselman F Alper S Aveyard M Axt J R amp Nosek B A
(2015) Many Labs 2 Investigating variation in replicability across sample and setting
Manuscript in preparation
Kuumlhberger A Fritz A amp Scherndl T (2014) Publication bias in psychology a diagnosis based
on the correlation between effect size and sample size PloS one 9(9) e105825 doi
101371journalpone0105825
Lakens D (2015) On the challenges of drawing conclusions from p-values just below 005 Peer
J 3e1142 doi 107717peerj1142 PMID 26246976
LeBel E P Borsboom D Giner-Sorolla R Hasselman F Peters K R Ratliff K A amp
Smith C T (2013) PsychDisclosure org Grassroots support for reforming reporting standards
in psychology Perspectives on Psychological Science 8(4) 424-432 doi
1011771745691613491437
LeBel E P Vanpaemel W McCarthy R J Earp B D amp Elson M (2017) A unified
framework to quantify the trustworthiness of empirical research Advances in Methods and
Practices in Psychological Science Retrieved from httpsosfiopreprintspsyarxivuwmr8
8232017
POWER BIAS AND HETEROGENEITY
43
Lindsay D S (2015) Replication in psychological science Psychological Science 26 1827-32
Makel M C Plucker J A amp Hegarty B (2012) Replications in psychology research How
often do they really occur Perspectives on Psychological Science 7(6) 537-542
Maxwell S E (2004) The persistence of underpowered studies in psychological research causes
consequences and remedies Psychological Methods 9 147 doi 1010371082-989X92147
Maxwell S E Lau M Y amp Howard G S (2015) Is psychology suffering from a replication
crisis What does ldquofailure to replicaterdquo really mean American Psychologist 70(6) 487-498
httpdxdoiorg101037a0039400
McShane B B amp Boumlckenholt U (2016) Planning sample sizes when effect sizes are uncertain
The power-calibrated effect size approach Psychological Methods 21(1) 47 doi
101037met0000036
McShane B B Boumlckenholt U amp Hansen K T (2016) Adjusting for publication bias in meta-
analysis An evaluation of selection methods and some cautionary notes Perspectives on
Psychological Science 11 730ndash749 doi 1011771745691616662243
Miguel E amp Christensen G (2017) Transparency reproducibility and the credibility of
economics research Journal of Economic Literature IN PRESS
Moreno S G Sutton A J Ades A E Stanley T D Abrams K R Peters J L Cooper N
J (2009) Assessment of regression-based methods to adjust for publication bias through a
comprehensive simulation study BMC Medical Research Methodology 9 2 doi
1011861471-2288-9-2
Open Science Collaboration (2015) Estimating the reproducibility of psychological science
Science 349(6251) aac4716ndashaac4716 doi101126scienceaac4716
Pashler H amp Harris C (2012) Is the replicability crisis overblown Three arguments examined
Perspectives on Psychological Science 7 531ndash536 doi 1011771745691612463401
Pashler H amp Wagenmakers E J (2012) Editorsrsquo introduction to the special section on
replicability in psychological science a crisis of confidence Perspectives on Psychological
Science 7 528ndash530 doi 1011771745691612465253
Patil P and Leek JT (2015) Reporting of 36 of studies replicate in the media
httpsgithubcomjtleekreplication_paperblobgh-pagesin_the_mediamd[Online up- dated
16-September-2015 accessed 8232017]
POWER BIAS AND HETEROGENEITY
44
Patil P Peng R D amp Leek J T (2016) What should researchers expect when they replicate
studies A statistical view of replicability in psychological science Perspectives on
Psychological Science 11(4) 539-544 doi 1011771745691616646366
Pigott T (2012) Advances in meta-analysis New York NY Springer
Poole C amp Greenland S (1999) Random-effects meta-analyses are not always conservative
American Journal of Epidemiology 150 469ndash475
Popper K (1959) The logic of scientific discovery New York NY Basic Books
Psychonomic Society (2012) New Statistical Guidelines for Journals of the Psychonomic Society
httpwwwpsychonomicorgpagestatisticalguideline (Accessed March 11th 2017)
Rossi J S (1990) Statistical power of psychological research What have we gained in 20 years
Journal of Consulting and Clinical Psychology 58 646ndash656 doi1010370022-
006X585646
Richard F D Bond C F amp Stokes-Zoota J J (2003) One hundred years of social psychology
quantitatively described Review of General Psychology 7 331ndash363
Scargle J D (2000) Publication bias The ldquoFile-Drawerrdquo problem in scientific inference Journal
of Scientific Exploration 14 91ndash106
Schmidt F L amp Hunter J E (2015) Methods of meta-analysis Correcting error and bias in
research findings 3rd ed Los Angeles CA Sage
Schmidt F L amp Oh I -S (2016) The crisis of confidence in research findings in psychology Is
lack of replication the real problem Or something else Archives of Scientific Psychology 4(1)
32ndash37 httpdxdoiorg101037arc0000029
Sedlmeier P amp Gigerenzer G (1989) Do studies of statistical power have an effect on the power
of studies Psychological Bulletin 105 309ndash316
Simmons J P Nelson L D amp Simonsohn U (2011) False-positive psychology Undisclosed
flexibility in data collection and analysis allows presenting anything as significant
Psychological Science 22(11) 1359-1366 doi 1011770956797611417632
Simonsohn U Nelson L D amp Simmons J P (2014) P-curve a key to the file drawer Journal
of Experimental Psychology General 143 534-547 doi 101037a0033242
Stanley D J amp Spence J R (2014) Expectations for replications Are yours realistic
Perspectives on Psychological Science 9 305ndash318 doi 1011771745691614528518
POWER BIAS AND HETEROGENEITY
45
Stanley T D (2008) Meta-regression methods for detecting and estimating empirical effects in
the presence of publication selection Oxford Bulletin of Economics and Statistics 70103-27
doi 101111j1468-0084200700487x
Stanley T D (2017) Limitations of PET-PEESE and other meta-analysis methods Social
Psychology and Personality Science [Epub ahead of print] doi 1011771948550617693062
Stanley T D amp Doucouliagos H(C) 2014 Meta-regression approximations to reduce publication
selection bias Research Synthesis Methods 5 60-78 doi 101002jrsm1095
Stanley T D amp Doucouliagos H(C) 2015 Neither fixed nor random Weighted least squares
meta-analysis Statistics in Medicine 34 2116-27 doi 101002sim6481
Stanley T D amp Doucouliagos H(C) 2017 Neither fixed nor random Weighted least squares
meta-regression analysis Research Synthesis Methods 8 19-42 doi 101002jrsm1211
Stanley T D Doucouliagos H(C) amp Ioannidis J P A 2017 Finding the power to reduce
publication bias Statistics in Medicine [Epub ahead of print] doi 101002sim7228
Sterling T D (1959) Publication decisions and their possible effects on inferences drawn from
tests of significance Or vice versa Journal of the American Statistical Association 54 30ndash34
Sterling T D Rosenbaum W L amp Weinkam J J (1995) Publication decisions revisited The
effect of the outcome of statistical tests on the decision to publish and vice versa American
Statistician 49 108ndash112 doi 1023072684823
Sutton A J Song F Gilbody S M amp Abrams K R (2000) Modelling publication bias in
meta-analysis A review Statistical Methods in Medical Research 9 421-445 doi
101177096228020000900503
Tressoldi P E amp Giofreacute D (2015) The pervasive avoidance of prospective statistical power
Major consequences and practical solutions Frontiers in Psychology 6 726
doi103389fpsyg201500726
van Aert R C M Jelte M Wicherts J M amp van Assen M A L M (2016) Conducting meta-
analyses based on p values Reservations and recommendations for applying p-uniform and p-
curve Perspectives on Psychological Science 11 713ndash729 doi 1011771745691616650874
van Bavel JJ Mende-Siedlecki PBrada WJ and Reinero DA 2016 Contextual sensitivity
in scientific reproducibility Proceedings of the National Academy of Sciences 113 6454ndash59
POWER BIAS AND HETEROGENEITY
46
van Erp S et al (2017) Estimates of between-study heterogeneity for 705 meta-analyses reported
in Psychological Bulletin from 1990ndash2013 Journal of Open Psychology Data 5(1) p4 DOI
httpdoiorg105334jopd33
Wicherts J M Veldkamp C L Augusteijn H E Bakker M van Aert R C amp Van Assen
M A (2016) Degrees of Freedom in Planning Running Analyzing and Reporting
Psychological Studies A Checklist to Avoid p-Hacking Frontiers in Psychology 7 doi
103389fpsyg201601832
Yuan K amp Maxwell S (2005) On the post hoc power in testing mean differences Journal of
Educational and Behavioral Statistics 30 141ndash167 doi 10310210769986030002141
POWER BIAS AND HETEROGENEITY
47
Table 1 Median Statistical Power and Average Effect Sizes
Mean Proportion with Adequate Power Median Power Type of Effect
Absolute Effect Sizes WLS WAAP-WLS PET-PEESE WLS WAAP-WLS PET-PEESE
Combined (n=200)
0389 0077 0071 0091 0364 0331 0360
Correlations (n=108)
0458 0243 0328 0272 0577 0610 0607
SMDs (n=92)
0291 0013 0000 0011 0230 0171 0170
Notes The numbers reported in the table are medians Mean absolute effect sizes are reported in this table in units of standardized mean differences (SMD) regardless of whether they were reported in the meta-analysis as correlations or as SMD WLS is the unrestricted weighted least squares weighted average WAAP-WLS is the weighted average of adequately powered effect sizes (WAAP) or WLS when there are no adequately powered studies PET-PEESE is the conditional precision-effect test-precision-effect estimate with standard error meta-regression correction for publication bias Adequate power is defined as 80 following Cohen (1977)
Table 2 Median Statistical Powers by Experimental Design Proportion with Adequate Power Median Power
Experimental Design WLS WAAP-WLS PET-PEESE WLS WAAP-WLS PET-PEESE
Observational (n=113)
0278 0259 0268 0621 0613 0585
Experimental (n=87)
0032 0000 0053 0247 0232 0236
Notes The numbers reported in the table are medians WLS is the unrestricted weighted least squares weighted average WAAP-WLS is the weighted average of adequately powered effect sizes (WAAP) or WLS when there are no adequately powered studies PET-PEESE is the conditional precision-effect test-precision-effect estimate with standard error meta-regression correction for publication bias Adequate power is defined as 80 following Cohen (1977)
Figure 1 Obtaining adequate power (80)
Notes x is distributed as a standard normal distribution N(01) 196 is the critical value for testing against 0 Figure 1 merely illustrates how the standardized mean of the sampling distribution needs to 28 standard errors away from 0 for an experiment to have adequate powermdashCohenrsquos 80 We thank Stephan Bruns for producing this graph
POWER BIAS AND HETEROGENEITY
49
Figure 2 Histograms of Adequately Powered Estimates from 200 Areas of Research
Notes WLS is the unrestricted weighted least squares weighted average WAAP-WLS is the weighted average of adequately powered effect sizes (WAAP) or WLS when there are no adequately powered studies PET-PEESE is the conditional precision-effect test-precision-effect estimate with standard error meta-regression correction for publication bias Adequate power is defined as 80 following Cohen (1977)
0
20
40
60
80
100
120N
um
ber
of M
eta-
An
alys
es
0 2 4 6 8 1Proportion of Studies Adequately Powered
WLS
0
20
40
60
80
100
120
Nu
mbe
r of
Met
a-A
nal
yses
0 2 4 6 8 1Proportion of Studies Adequately Powered
WAAP-WLS
0
20
40
60
80
100
120
Nu
mbe
r of
Met
a-A
nal
yses
0 2 4 6 8 1Proportion of Studies Adequately Powered
PET-PEESE
POWER BIAS AND HETEROGENEITY
50
Figure 3 Histograms of Median Statistical Power from 200 Areas of Research
Notes WLS is the unrestricted weighted least squares weighted average WAAP-WLS is the weighted average of adequately powered effect sizes (WAAP) or WLS when there are no adequately powered studies PET-PEESE is the conditional precision-effect test-precision-effect estimate with standard error meta-regression correction for publication bias Adequate power is defined as 80 following Cohen (1977)
0
10
20
30
40
50
60N
um
ber
of M
eta-
An
alys
es
0 2 4 6 8 1Median Statistical Power
WLS
0
10
20
30
40
50
60
Nu
mbe
r of
Met
a-A
nal
yses
0 2 4 6 8 1Median Statistical Power
WAAP-WLS
0
10
20
30
40
50
60
70
Nu
mbe
r of
Met
a-A
nal
yses
0 2 4 6 8 1Median Statistical Power
PET-PEESE
Figure 4 Histograms of I2 from 200 Areas of Research
Notes I2 is the proportion of observed variation among reported effect sizes that cannot be explained by the calculated standard errors associated with these reported effect sizes It is a relative measure of heterogeneity
0
5
10
15
20
25
30
35
40
45
0 2 4 6 8 1I-squared
Num
ber o
f Met
a-A
naly
ses
POWER BIAS AND HETEROGENEITY
52
Appendix A Studies included in the meta-meta-analysis
1 Baas M Nijstad B A Boot N C amp De Dreu C K W (2016) Mad genius revisited Vulnerability to psychopathology biobehavioral approach-avoidance and creativity Psychological Bulletin 142 668-692 doi101037bul0000049 [2]
2 Balliet D Li N P Macfarlan S J amp Van Vugt M (2011) Sex differences in cooperation A meta-analytic review of social dilemmas Psychological Bulletin 137 881ndash909 doi 101037a0025354 [1]
3 Balliet D Mulder L B amp Van Lange P A M (2011) Reward punishment and cooperation A meta-analysis Psychological Bulletin 137 594-615 doi 101037a0023489 [2]
4 Balliet D Wu J amp De Dreu C K W (2014) Ingroup favoritism in cooperation A meta-analysis Psychological Bulletin 140 1556-1581 doi 101037a0037737 [1]
5 Brewin C R (2014) Episodic memory perceptual memory and their interaction Foundations for a theory of posttraumatic stress disorder Psychological Bulletin 140 69ndash97 doi 101037a0033722 [1]
6 Byron K amp Khazanchi S (2011) Rewards and creative performance A meta-analytic test of theoretically derived hypotheses Psychological Bulletin 138 809ndash830 [1]
7 Cerasoli C P amp Nicklin J M (2014) Intrinsic motivation and extrinsic incentives jointly predict performance A 40-year meta-analysis Psychological Bulletin 140 980-1008 doi 101037a0035661 [1]
8 Chaplin T M amp Aldao A (2013) Gender differences in emotion expression in children A meta-analytic review Psychological Bulletin 139 735-765 doi 101037a0030737 [4]
9 Defoe I N Dubas JS amp Figner B (2015) A meta-analysis on age differences in risky decision making Adolescents versus children and adults Psychological Bulletin 141 48ndash84 doi 101037a0038088 [4]
10 Degner J amp Dalege J (2013) The apple does not fall far from the tree or does it A meta-analysis of parentndashchild similarity in intergroup attitudes Psychological Bulletin 139 1270ndash1304 doi 101037a0031436 [1]
11 Eastwick P W Finkel E J Luchies L B amp Hunt L L (2014) The predictive validity of ideal partner preferences A review and meta-analysis Psychological Bulletin 140 623ndash 665 doi 101037a0032432 [4]
12 Else-Quest N M Higgins A Allison C amp Morton L C (2012) Gender differences in self-conscious emotional experience Psychological Bulletin 138 947ndash981 doi101037a0027930 [5]
13 Fairbairn C E amp Sayette M A (2014) A social-attributional analysis of alcohol response Psychological Bulletin 140 1361-82 doi 101037a0037563 [4]
14 Fischer P Krueger J I Greitemeyer T Vogrincic C Kastenmuumlller A Frey D Heene M Wicher M amp Kainbacher M (2011) The bystander-effect A meta-analytic review on bystander intervention in dangerous and non-dangerous emergencies Psychological Bulletin 137 517ndash537 doi 101037a0023304 [1]
POWER BIAS AND HETEROGENEITY
53
15 Fox MC Ericsson A amp Best (2011) Do procedures for verbal reporting of thinking have to be reactive A meta-analysis and recommendations for best reporting methods Psychological Bulletin 137 316 ndash344 doi 101037a0021663 [2]
16 Fox N A You K H Bowman L C Cannon E N Ferrari P F Bakermans-Kranenburg M J Vanderwert R E amp van IJzendoorn M H (2016) Assessing human mirror activity with EEG mu rhythm A meta-analysis Psychological Bulletin 142 291ndash313 doi101037bul0000031 [2]
17 Freund P A amp Kasten N (2012) How smart do you think you are A meta-analysis on the validity of self-estimates of cognitive ability Psychological Bulletin 138 296-321 doi101037a0026556 [1]
18 Grijalva E Newman D A Tay L Donnellan M B Harms P D amp Robins R W (2015) Gender differences in narcissism A meta-analytic review Psychological Bulletin 141 261-310 doi 101037a0038231 [3]
19 Haedt-Matt A A amp Keel P K (2011) Revisiting the affect regulation model of binge eating A meta-analysis of studies using ecological momentary assessment Psychological Bulletin 137 660ndash681 doi 101037a0023660 [3]
20 Harkin B Webb T L Prestwich A Conner M Kellar I Benn Y amp Sheeran P (2016) Does monitoring goal progress promote goal attainment A meta-analysis of the experimental evidence Psychological Bulletin 142 198-229 doi 101037bul0000025 [2]
21 Houben M Van Den Noortgate W amp Kuppens P (2015) The relation between short-term emotion dynamics and psychological well-being A meta-analysis Psychological Bulletin 141 901-930 doi101037a0038822 [4]
22 Johnsen T J amp Friborg O (2015) The effects of cognitive behavioral therapy as an anti-depressive treatment is falling A meta-analysis Psychological Bulletin 141 747-768 [2]
23 Karlin B Zinger J F amp Ford R (2015) The effects of feedback on energy conservation A meta-analysis Psychological Bulletin 141 1205-1227 doi 101037a0039650 [1]
24 Kim S Thibodeau R amp Jorgensen R S (2011) Shame guilt and depressive symptoms A meta-analytic review Psychological Bulletin 137 68 ndash96 doi 101037a0021466 [2]
25 Klahr A M amp Burt S A (2014) Elucidating the etiology of individual differences in parenting A meta-analysis of behavioral genetic research Psychological Bulletin 140 544ndash586 doi 101037a0034205 [6]
26 Koenig A M Eagly A H Mitchell A A amp Ristikari T (2011) Are leader stereotypes masculine A meta-analysis of three research paradigms Psychological Bulletin 137 616 ndash 642 doi 101037a0023557 [4]
27 Kredlow M A Unger L D amp Otto M W (2016) Harnessing reconsolidation to weaken fear and appetitive memories A meta-analysis of post-retrieval extinction effects Psychological Bulletin 142 314ndash336 doi 101037bul0000034 [3]
28 Kuykendall L Tay L amp Ng V (2015) Leisure engagement and subjective well-being A meta-analysis Psychological Bulletin 141 364-403 doi101037a0038508 [3]
29 Landau M J amp Kay A C (2015) Compensatory control and the appeal of a structured world Psychological Bulletin 141 694ndash722 doi 101037a0038703 [1]
30 Lee E-S Park T-Y amp Koo B (2015) Identifying organizational identification as a basis for attitudes and behaviors A meta-analytic review Psychological Bulletin 141 1049ndash1080 doi 101037bul0000012 [1]
POWER BIAS AND HETEROGENEITY
54
31 Lui P P (2015) Intergenerational cultural conflict mental health and educational outcomes among Asian and Latinoa Americans Qualitative and meta-analytic review Psychological Bulletin 141 404-446 doi101037a0038449 [3]
32 Lull R B amp Bushman B J (2015) Do sex and violence sell A meta-analytic review of the effects of sexual and violent media and ad content on memory attitudes and buying intentions Psychological Bulletin 141 1022ndash1048 doi 101037bul0000018 [6]
33 Mazei J Freund P A Huumlffmeier J amp Stuhlmacher A F (2015) A meta-analysis on gender differences in negotiation outcomes and their moderators Psychological Bulletin 141 85ndash104 doi 101037a0038184 [1]
34 Melby-Lervaringg M Lyster S A amp Hulme C (2012) Phonological skills and their role in learning to read A meta-analytic review Psychological Bulletin 138 322ndash352 doi 101037a0026744 [3]
35 Melby-Lervaringg M amp Lervaringg A (2014) Reading comprehension and its underlying components in second-language learners A meta-analysis of studies comparing first- and second-language learners Psychological Bulletin 140 409ndash433 doi 101037a0033890
[4] 36 Mendelson J L Gates J A amp Lerner M D (2016) Friendship in school-age boys with
autism spectrum disorders A meta-analytic summary and developmental process-based model Psychological Bulletin 142 601-622 doi 101037bul0000041 [2]
37 Mol S E amp Bus A G (2011) To read or not to read A meta-analysis of print exposure from infancy to early adulthood Psychological Bulletin 137 267ndash296 doi 101037a0021890 [13]
38 Orquin J L amp Kurzban R (2016) A meta-analysis of blood glucose effects on human decision making Psychological Bulletin 142 546ndash567 doi 101037bul0000035 [1]
39 Ottaviani C Verkuil B Medea B Couyoumdjian A Thayer JF Lonigro A amp Brosschot J F (2016) Physiological concomitants of perseverative cognition A systematic review and meta-analysis Psychological Bulletin 142 No 3 231ndash259 doi 101037bul0000036 [8]
40 North M S amp Fiske S T (2015) Modern attitudes toward older adults in the aging world A cross-cultural meta-analysis Psychological Bulletin 141 993ndash1021 doi 101037a0039469 [1]
41 Pahlke E Hyde J S amp Allison C M (2014) The effects of single-sex compared with coeducational schooling on studentsrsquo performance and attitudes A meta-analysis Psychological Bulletin 140 1042-1072 doi 101037a0035740 [2]
42 Pan S C amp Rickard T C (2015) Sleep and motor learning Is there room for consolidation Psychological Bulletin 141 812-834 doi 101037bul0000009 [1]
43 Phillips W J Fletcher J M Marks A D G amp Hine D W (2016) Thinking styles and decision making A meta-analysis Psychological Bulletin 142 No 3 260ndash290 doi 101037bul0000027 [4]
44 Pool E Brosch T Delplanque S amp Sander D (2016) Attentional bias for positive emotional stimuli A meta-analytic investigation Psychological Bulletin 142 No 1 79ndash106 doi 101037bul0000026 [1]
45 Randall J G Oswald F L amp Beier M E (2014) Mind-wandering cognition and performance A theory-driven meta-analysis of attention regulation Psychological Bulletin 140 1411ndash1431 doi 101037a0037428 [4]
POWER BIAS AND HETEROGENEITY
55
46 Sambrook T D amp Goslin J (2015) A neural reward prediction error revealed by a meta-analysis of ERPs using great grand averages Psychological Bulletin 141 213ndash235 doi 101037bul0000006 [4]
47 Sedlmeier P Eberth J Schwarz M Zimmermann D Haarig F Jaeger S amp Kunze S (2012) The psychological effects of meditation A meta-analysis Psychological Bulletin 138 1139ndash1171 doi 101037a0028168 [20]
48 Sheeran P Harris P R and Epton T (2014) Does heightening risk appraisals change peoplersquos intentions and behavior A meta-analysis of experimental studies Psychological Bulletin 140 511ndash543 doi 101037a0033065 [2]
49 Smith S F amp Lilienfeld S O (2015) The response modulation hypothesis of psychopathy A meta-analytic and narrative analysis Psychological Bulletin 141 1145ndash1177 doi 101037bul0000024 [1]
50 Soderberg C K Amit E Callahan S P Kochersberger A O amp Ledgerwood A (2015) The effects of psychological distance on abstraction Two meta-analyses Psychological Bulletin 141 3 525ndash548 doi101037bul0000005 [2]
51 Tannenbaum M B Hepler J Zimmerman R S Saul L Jacobs S Wilson K amp Albarraciacuten D Appealing to fear A meta-analysis of fear appeal effectiveness and theories Psychological Bulletin 141 1178ndash1204 doi101037a0039729 [1]
52 Toosi N R Babbitt L G Ambady N amp Sommers SR (2012) Dyadic interracial interactions A meta-analysis Psychological Bulletin 138 1ndash27 doi 101037a0025767 [4]
53 Vachon D D Lynam D R amp Johnson J A (2014) The (Non)relation between empathy and aggression Surprising results from a meta-analysis Psychological Bulletin 140 751ndash773 doi 101037a0035236 [1]
54 Verhage M L Schuengel C Madigan S Fearon R M P Oosterman M Cassibba R Bakermans-Kranenburg M J amp van IJzendoorn M H (2016) Narrowing the transmission gap A synthesis of three decades of research on intergenerational transmission of attachment Psychological Bulletin 142 337ndash366 doi 101037bul0000038 [2]
55 von Stumm S amp Ackerman P L (2013) Investment and intellect A review and meta-analysis Psychological Bulletin 139 841ndash869 doi 101037a0030746 [11]
56 Voyer D amp Voyer S D (2014) Gender differences in scholastic achievement A meta-analysis Psychological Bulletin 140 1174-1204 doi 101037a0036620 [6]
57 Vucasović T amp Bratko D (2015) Heritability of personality A meta-analysis of behavior genetic studies Psychological Bulletin 141 769ndash785 doi101037bul0000017 [1]
58 Wanberg C R Hamann D J Kanfer R amp Zhang Z (2016) Age and reemployment success after job loss An integrative model and meta-analysis Psychological Bulletin 142 400-426 doi 101037bul0000019 [6]
59 Weingarten E Chen Q McAdams M Yi J amp Hepler J (2016) From primed concepts to action A meta-analysis of the behavioral effects of incidentally presented words Psychological Bulletin 142 472ndash497 doi 101037bul0000030 [1]
60 Williams M J amp Tiedens L Z (2016) The subtle suspension of backlash A meta-analysis of penalties for womenrsquos implicit and explicit dominance behaviour Psychological Bulletin 142 165ndash197 doi 101037bul0000039 [6]
POWER BIAS AND HETEROGENEITY
56
61 Winer E S amp Salem T (2016) Reward devaluation Dot-probe meta-analytic evidence of avoidance of positive information in depressed persons Psychological Bulletin 142 18ndash78 doi 101037bul0000022 [6]
Notes Numbers in square brackets denote the number of meta-analyses included in the dataset
Appendix B Distribution of survey estimates
Year
No of meta-analyses published
No of meta-analyses sampled
of published meta-studies
No of estimates
of sample
2016 17 14 82 46 22 2015 22 18 82 40 19 2014 25 12 48 46 22 2013 17 3 18 16 8 2012 15 6 40 34 16 2011 19 8 42 31 15

POWER BIAS AND HETEROGENEITY
26
Assessing residual selective reporting bias
If an area of research is selectively reporting effect size to be statistically significant in a
direction consistent with the prevailing psychological theory then the average reported effect will
on average have a larger magnitude than the true effect (whether or not prevailing psychological
theory suggests a direct or an inverse association) As before we can use these meta-averages
WLS WAAP-WLS and PET-PEESE as proxies for lsquotruersquo effect and then compare them to
average reported effect for an assessment of residual reporting bias Needless to say each reported
estimate is subject to random sampling error and will be sometimes larger and sometimes smaller
than the mean true effect Such differences cannot be regarded as lsquobiasrsquo but merely as sampling
or estimation errors However when there is a systematic trend for the unadjusted simple average
to be larger than a meta-average known to be less biased when there is selective reporting bias
then we can regard the difference between the absolute value of the simple mean and the absolute
value of WLS or WAAP-WLS as the lower limit of bias when it persists consistently over hundreds
of separate areas of research Using this approach Ioannidis Stanley amp Doucouliagos (2017) find
that the typical reported estimate in economics is twice as large or larger than either WAAP or
PET-PEESE In sharp contrast our survey of psychology finds on average only a small amount
of consistent exaggeration or overall selective reporting bias
Results
Among these 200 areas of psychological research containing 12065 estimated effect the
average effect size is 0389 expressed as the median of average standardized mean differences or
0191 as a correlation coefficient This overall effect size is nearly the same as the average of the
first 100 years of social psychology (r = 021) uncovered by Richard Bond amp Stokes-Zoota
POWER BIAS AND HETEROGENEITY
27
(2003) The typical standard error is 0104 expressed as a correlation 021 when represented by
a standardized mean difference (SMD) The p-value produced by these averages is a little larger
than the conventional 05 level Other researchers across several disciplines have found that that
p-values tend to lump up at or just below 05 (Gerber amp Malhotra 2008 Brodeur Sangnier amp
Zylberberg 2016) Contrary to recent concerns about publication bias questionable research
practices and null hypothesis significance testing we find that the typical psychological research
study is statistically insignificant at the conventional 05 level of significance
Table 1 reports the median absolute value of the average reported effect size from these
200 meta-analyses Here all effect sizes are first converted to standardized mean differences
(SMD) to be comparable However an interesting pattern emerges when these 200 meta-analyses
are divided by the types of effect sizes that are commonly reported correlation vs SMD The
typical effect size found among the 108 lsquocorrelation-basedrsquo meta-analyses in our survey (0458 in
SMD units) is 57 larger than those meta-analyses measured by SMDs (0291)15
Power
The median of the percent of reported effects that are adequately powered across these 200
areas of research are (1) 77 when the unrestricted WLS (or fixed effect) weighted average is
used to represent the mean of the true effects distribution (2) 71 when WAAP-WLS proxies for
lsquotruersquo effect and (3) 91 if PET-PEESE substitutes for true effect Figure 2 displays the
distributions of the proportion of studies that are adequately powered across these 200 areas of
15 We thank Frank Schmidt for pointing out that technically only point-biserial correlations can be converted to Cohenrsquos d Ceteris paribus other correlations will be larger than the point-biserial correlation due to the latterrsquos restricted range Thus a small part of the larger effect average effect size of lsquocorrelation-basedrsquo meta-analyses might be due to the conversion of all correlations to Cohenrsquos d Because these 108 lsquocorrelation-basedrsquo meta-analyses often contain an undisclosed mix of correlation types we cannot fully correct this small bias However as we discussed above none of our calculations of power heterogeneity or bias depend in any way on the transformation of correlations to standardized mean differences
POWER BIAS AND HETEROGENEITY
28
research Clearly underpowered studies dominate psychological research But how underpowered
are they
We also calculate the median powers for each of these 200 areas of research The typical
power of psychological research is around 36 364 based on WLS 331 based on WAAP-
WLS and 36 based on PET-PEESE16 Figure 3 shows the distribution of median powers across
these 200 areas of research Note their striking shapes The two most frequent categories are the
lowest (0-10) and the highest (over 90) Even though typical areas of research are quite
inadequately powered as measured by median power approximately one-fifth of these 200 areas
of psychological research are quite highly-powered Between 19 and 23 have average statistical
power 90 or highermdashsee Figure 3 It should not be surprising that some areas of research have
high power Aside from sample size statistical power depends on the underlying true effect size
and some psychological phenomena have large effects When WAAP-WLS is used to estimate
true effect one-third of these 200 areas of psychological research (32) have lsquolargersquo or lsquomediumrsquo
effect sizes defined as |WAAP-WLS| gt 05 SMD Even rather modest sample sizes will estimate
large effects powerfully
As before we find striking difference between correlation-based meta-analyses and SMD-
based meta-analyses Table 1 breaks down the median proportion of studies that are adequately
powered and the median power by type of effect size Those areas of psychological research that
predominately report standardized mean differences (SMDs) are highly under-powered typically
99 are underpowered compared to 67 to 76 for correlation-based meta-analyses The median
16 This is somewhat less than a recent survey Fraley amp Vazire (2014) which found a median power to detect a correlation of 02 to be 49 among top social-personality journals for the years 2006-2010 But then Fraley amp Vazire (2014) calculate prospective rather than retrospective power and their sampling frame is different than ours Thus we would expect some differences especially when considering that our median power calculations reflect both the observed effect size of each area of research and the distribution of statistical power within an area of research
POWER BIAS AND HETEROGENEITY
29
statistical power in SMD meta-analyses is between 17 to 23 For correlation-based research
typical power is nearly three times highermdash58 to 61
Residual selective reporting bias
Recall that residual reporting bias may be calculated as the difference between the absolute
value of the simple mean reported effect and the absolute value of one of our less vulnerable
proxies for true effectmdashWLS WAAP-WLS or PET-PEESE We find only small amounts of
residual reporting bias in psychological research 8 based on WLS 12 based on WAAP-WLS
and 15 based on PET-PEESE Thus our survey identifies only a small systematic exaggeration
overall
There are some important qualifications to make about this finding First all these
estimates are themselves biased and two of them consistently underestimate residual bias when
there is selective reporting (Stanley and Doucouliagos 2014 Stanley and Doucouliagos 2015
Stanley et al 2017 Stanley 2017) Second a notable proportion of psychology might still be
affected by selective reporting bias even if the median amount of exaggeration is relatively small
275 (or 55 areas of research) find evidence of some type of selective reporting or small-sample
bias using the Egger test for funnel plot asymmetry and this is likely to be an under-estimate of
the incidence of these biases because the Egger test is known to have low power (Egger et al
1997 Stanley 2008) Third we again find notable differences between types of effect sizes
reported by meta-analysts When using WLS as a proxy for the true effect we find that the simple
mean of reported SMDs is now exaggerated by 13 on average by 20 if WAAP-WLS
substitutes for true effect and by 30 relative to the median absolute value of PET-PEESE
POWER BIAS AND HETEROGENEITY
30
Heterogeneity
The median percent of the observed variation of reported effect sizes within a given area
of research that is attributed to heterogeneity (I2) is 74 This means that the variance among lsquotruersquo
effects is nearly 3 times larger than the reported sampling variance According to Pigottrsquos (2012)
guidelines for small (25) medium (50) and large (75) heterogeneity typical areas of research
have nearly lsquolargersquo excess heterogeneity Yet this level of heterogeneity appears to be the norm
for research in psychology For example van Erp et al (2017) extracted estimates of heterogeneity
from 705 meta-analyses published in Psychological Bulletin between 1990 and 2013 and found
that the median reported I2 = 7062 (interquartile range [3324 8741]) However I2 is a
relative measure of heterogeneity and does not reflect the variation in true effect as measured in
units of SMDs When our median I2 is applied to the typical area of research the standard deviation
among true effects is 0354 SMD and the standard deviation from one study to the next due to both
heterogeneity and sampling error becomes 0412 larger than the typical reported effect size 0389
lsquoExperimentalrsquo vs lsquoobservationalrsquo research
As a post hoc secondary analysis17 we examined whether the systematic differences
between SMD-based and correlation-based meta-analyses are due to experimental design
lsquoexperimentalrsquo vs lsquoobservationalrsquo Unfortunately this differentiation is not perfect Many meta-
analyses contain a mix of experimental and observational research designs at the study level For
example Williams and Tiedens (2015) meta-analysis of the effects of gender and dominance
17 Investigating these differences was not part of our pre-analysis plan Anonymous reviewers asked that we code for experimental design and report the differences
POWER BIAS AND HETEROGENEITY
31
behavior includes 97 experimental studies (85) where dominance behavior was somehow
manipulated and 17 purely observational studies
Because a substantial percent (424) of those meta-analyses that report effect sizes in
terms of SMD are lsquoobservationalrsquo and 314 of correlation-based meta-analyses are
lsquoexperimentalrsquo there is only small correlation (phi=0263 plt001) between experimental design
(1 if primarily experimental 0 elsewhere) and effect type (1 if SMD 0 for correlation) However
we do see some interesting differences in power and heterogeneity by experimental design First
there is a difference between heterogeneity as measured by I2 (plt01) The median I2 for
experimental research is 68 vs 76 for observational designs But I2 is a relative measure of
heterogeneity with a non-symmetric distribution To correct for I2rsquos nonstandard distribution we
use Abramowitz and Stegunrsquos (1964) normal approximation for the chi-square distribution applied
to the Cochran Q-test for heterogeneity Doing so causes this difference in relative heterogeneity
to be only marginally larger than statistical noise (p=045) Additionally experimental research
designs have larger sampling errors and lower power Typical sampling errors are 026 vs 019
measured as median SEs in units of SMD Table 2 reports the median proportion of studies that
are adequately powered and the median of median powers by type of research design Even though
there is only a small association between experimental design and effect type we find a similar
pattern among the typical levels of power for experimental design that we see for effect type
confirming the concerned expressed by dozens of researchers over the years that scarcely any
experimental studies are adequately powered All of these results about lsquoexperimentalrsquo vs
lsquoobservationalrsquo research designs should be interpreted with caution because as mentioned they
are conducted post hoc
POWER BIAS AND HETEROGENEITY
32
Discussion
Our survey of 12065 estimated effects sizes from nearly 8000 studies in 200 meta-
analyses reveals that the typical effect size is 0389 SMD with a median standard error of 021 We
also find low statistical power small residual selection bias and high levels of heterogeneity The
central purpose of our review is to assess the replicability of psychological research through meta-
analysis and thereby better understand recent failures to replicate Our findings implicate low
statistical power and high levels of heterogeneity as the primary causes of lsquofailedrsquo replications
however defined
We find that only a small proportion of psychological studies are adequately powered
approximately 8 and the median power is about 36 across three proxies for the mean lsquotruersquo
effect18 What does this imply about replication Our survey predicts therefore that replication
study with a typical sample size will have only a 36 chance of finding a statistically significant
effect in the same direction as some previous study and this value is exactly the same percent of
replications found to be statistically significant in the same direction by the Open Science
Collaboration (Open Science Collaboration 2015 Table 1) Thus when replication is viewed in
terms of sign and statistical significance it is no wonder that rates of replication are considered
low in psychology research
Improving replication as noted by others (eg Maxwell et al 2015) would seem to be a
matter of conducting both initial studies and replications with larger samples reducing sources of
non-sampling error (eg measurement error Stanley amp Spence 2014) and focusing on larger
18 To be more precise 36 is the median among the medians of medians
POWER BIAS AND HETEROGENEITY
33
effects Because researchers work with limited resources and knowledge these obvious
recommendations are extremely difficult to implement in most cases
More practical recommendations have centered on redefining replication success and
adjusting researchersrsquo expectations about non-significant replications For example Peng et al
(2016) examined the data from the Reproducibility Project Psychology (Open Science
Collaboration 2015) in terms of prediction intervalsmdashconfidence intervals that account for
variability in both the original and replication studymdashand found that 77 of the replication
attempts were consistent with the original findings This finding seems to be in apparent contrast
to the highly publicized result that only 36 of the replications in those data were statistically
significant but completely in accord with the less well-publicized result that meta-analytically
combining the replications with the original studies resulted in 70 statistical significance (Open
Science Collaboration 2015) Along similar lines several authors have argued for assessing
replication primarily within the context of meta-analysis (eg Braver Thoemmes amp Rosenthal
2014 Stanley amp Spence 2014 Fabrigar amp Wegener 2016) Doing so could shift the evaluation
of success vs failure of replications to a judgement about the degree of information that new data
add to our knowledge base (Peng et al 2016)
Consistent with a previous survey of heterogeneity (van Erp et al 2017) and several
findings from recent multi-site replication attempts (Hagger amp Chatzisarantis 2016 Eerland et al
2016 Klein et al 2015) our survey reveals clear evidence for high levels of heterogeneity in
research in psychology We find that heterogeneity accounts for nearly three-fourths of the
observed variation among reported effects (ie median I2 =74) When applied to the median
reported standard error (measured in terms of SMD) this high I2 implies that the typical standard
deviation of heterogeneity is equal to 0354 (again in units of SMDs) Importantly even a
POWER BIAS AND HETEROGENEITY
34
replication study with millions of subjects will remain vulnerable to heterogeneity among lsquotruersquo
effects When we apply our surveyrsquos typical heterogeneity to its typical effect size it is unlikely
that any replication will be lsquosuccessfulrsquo For example if our median effect size 0389 is the mean
of the distribution of true effects then there is a 298 probability that the largest possible
replication study will find a negligible zero or opposite-signed effect The probability is 324
that this ideal replication (ie ninfin) finds a small effect and it is 255 for a medium-sized
effectmdashusing Cohenrsquos guidelines of 02 05 and 08 Even though 0389 is considered a lsquosmallrsquo
effect by these guidelines the probability that a very large replication finds a large effect remains
non-negligible at 123 Thus it is quite likely 68 that an ideal replication will not reproduce
a small effect when the mean of the distribution true effects is equal to our median average effect
size The wide distribution of true effect sizes that our survey finds is also similar to what Open
Science Collaboration observed when attempting to replicate 100 psychological experimentmdashsee
Figure 3 in the Open Science Collaboration (2015)
No matter what the mean of the distribution of true effect sizes might be nor how large the
replication study is it is unlikely that a replication will find an effect size close to what was found
previously when there is this much heterogeneity If a lsquosuccessful replicationrsquo is defined as finding
an effect size similar to what some previous study or studies have found (say for example to
within + 01 or within + 02 SMD) then there will always be a sizeable chance of unsuccessful
replication no matter how well conducted or how large any of the studies are For example
suppose that two studies are conducted with nearly infinite sample sizes and therefore infinitesimal
sampling error Heterogeneity of the size that our survey finds implies that the probability that
these two ideal studies find effect sizes that are within +01 from one another is 158 and 311
to within +02 Indeed there remains a 50 or greater probability of a lsquofailed replicationrsquo whenever
POWER BIAS AND HETEROGENEITY
35
the acceptable difference for a successful replication is set at less than 035 SMD Needless to say
if we have less-than-ideal sample sizes the resulting added sampling error will reduce the
probability of a successful replication further Thus high heterogeneity further explains the failure
of the Open Science Collaboration (2015) to find reliable indicators of replication success
There are important caveats to these calculations of replication success that need to be
mentioned First there is a wide distribution of observed heterogeneity among these areas of
psychological researchmdashsee Figure 4 Twenty-two percent have I2s that are less than 50 while
47 have I2 values 75 or higher and one out of seven have excess heterogeneity of 90 or more
Thus successful replication will be more likely in some areas of research but much less likely in
others Second these calculations assume that the typical heterogeneity observed in this research
record is entirely heterogeneity among lsquotruersquo effects that is variation beyond the control of
researchers Because exact replication is rare in psychology some of this observed heterogeneity
will be due to variation in experimental conditions measures methods and the characteristics of
the population from which the samples are drawn Thus a careful exact replication study could
avoid a notable amount of this variation in expected effect by carefully duplicating all of the
controllable features of the experimental design execution and evaluation However those large-
scale efforts to control these controllable research dimensions still find that notable heterogeneity
remains (Hagger et al 2016 Eerland et al 2016 Klein et al 2015) Moreover if half the
observed heterogeneity variance is due to differences that are under the control of the researcher19
then our estimate of the typical standard deviation due this uncontrollable heterogeneity among
true effects would be reduced to 025 In which case the probability that the largest possible
19 The typical heterogeneity found by two large replication studies that attempted to be as exact as possible is larger than half of the median heterogeneity that our survey finds (Hagger et al 2016 Eerland et al 2016)
POWER BIAS AND HETEROGENEITY
36
replication study will find a negligible zero or opposite-signed effect declines to 22 28 for a
medium effect and it will find a large effect only about 5 of the time Even if half of the observed
heterogeneity among reported effects is under the researcherrsquos control the probability that any
replication effort successfully replicates a small effect (recall 0389 is our surveyrsquos median effect
size) remains less than 50
Conclusions
Our survey of 12065 estimated effect sizes from nearly as many studies and 8000 papers
finds that lsquofailedrsquo replicationsmdashdefined here in terms of null hypothesis significance testingmdash are
to be expected at a rate consistent with the widely publicized the Reproducibility Project
Psychology (Open Science Collaboration 2015) Like many other researchers we find that
statistical power is chronically low in research in psychology (Cohen 1962 Cohen 1977
Sedlmeier amp Gigerenzer 1989 Rossi 1990 Maxwell 2004 Pashler amp Wagenmakers 2012
Fraley amp Vazire 2014 Tressoldi amp Giofreacute 2015) Unlike this previous research however our
survey reveals a more severe challenge for replication High levels of heterogeneity are evidently
the norm in psychology (median I2 =74) As discussed above heterogeneity this large makes
successful replication difficult whether defined in terms of hypothesis testing or estimation
precision This high heterogeneity will of course be due in part to methodological differences
between the different studies in each of the 200 meta-analyses that we survey However data from
multi-site registered replication efforts further suggest that when obvious methodological
differences are removed (ie when lsquoexactrsquo replications are conducted) heterogeneity is not
reduced to negligible levels In other words it is unrealistic to believe that variance in
POWER BIAS AND HETEROGENEITY
37
psychological phenomena studied can always be tightly controlled or reduced to practically
insignificant levels
Perhaps more surprising is our finding that there is relatively small exaggeration or overall
selective reporting bias in recent psychological research This is in contrast to the view that
publication bias and questionable research practices are the primary cause of failed replications
Of course as mentioned above there are good reasons to be cautious in applying this hopeful
result to any individual area of research In particular 275 of these areas of research produce a
significant Eggerrsquos test for publication bias (or small-sample bias) and this test is known to have
low power Our survey merely implies that the effects of selective reporting bias (ie publication
bias small-sample biases p-hacking andor questionable research practices) have a less clear
pattern than is maybe assumed by some researchers and by what has been observed in other fields
(eg economics Ioannidis Stanley and Doucouliagos 2017)
In light of the typically high heterogeneity that we observed how should replications in
psychology be interpreted To begin it seems extremely likely that the p-value from any single
non-preregistered non-exact replication study will have nil informative value In the face of high
heterogeneity this is true regardless of the sample size of the replication because it is quite likely
that the replication study will correctly reflect a substantially different true effect than the original
study However individual non-preregistered non-exact replication studies may still contribute to
our collective knowledge when added to a carefully conducted meta-analysis or meta-regression
analysis Meta-analysis moves the focus away from the statistical significance of the single
replication study increases statistical power by pooling across studies allows one to accommodate
and reduce selective reporting bias and meta-regression analysis can use non-exact replications to
POWER BIAS AND HETEROGENEITY
38
help isolate and quantify methodological heterogeneity (eg Stanley amp Doucouliagos 2012
Braver Thoemmes amp Rosenthal 2014 Stanley amp Spence 2014 Fabrigar amp Wegener 2016)
Replication findings from multi-site pre-registered replications clearly offer a different
class of evidence from the single non-pre-registered non-exact replication Statistical power can
be maximized by the pooling of resources across research sites pre-registration is likely to greatly
reduce some types of selective reporting bias and heterogeneity due to obvious methodological
characteristics can be minimized through tightly-controlled study protocols Multi-site pre-
registered replication also allows researchers to directly isolate and quantify the specific
heterogeneity among true effects which remains after methodological heterogeneity is minimized
Such information can provide useful insights about the psychological phenomenon in question
thereby helping to guide and redirect future research and meta-regression analyses
The central implication of our survey is that typically-powered studies in most of areas of
psychology individually or when simply combined into a meta-analysis offer little information
about the magnitude or significance of the phenomenon they examine Our core recommendation
then is that researchers change their expectations about the ease with which convincing evidence
either for or against an effect can be claimed
POWER BIAS AND HETEROGENEITY
39
References
Abramowitz M and IA Stegun (eds) (1964) Handbook of Mathematical Functions with
Formulas Graphs and Mathematical Tables Washington DC US Department of
Commerce
American Psychological Association (2010) Manual of the American Psychological Association
6th ed Washington DC
Asendorpf J B Conner M De Fruyt F De Houwer J Denissen J J Fiedler K amp
Perugini M (2013) Recommendations for increasing replicability in psychology European
Journal of Personality 27(2) 108-119
Baker M (2015) Over half of psychology studies fail reproducibility test Nature News and
Comment August 27 doi101038nature201518248 accessed 8232017
Bakker M van Dijk A amp Wicherts J M (2012) The rules of the game called psychological
science Perspectives on Psychological Science 7(6) 543-554 doi
1011771745691612459060
Bakker M Hartgerink C H Wicherts J M amp van der Maas H L (2016) Researchersrsquo
intuitions about power in psychological research Psychological Science 27(8) 1069-1077 doi
1011770956797616647519
Bohannon J (2015) Reproducibility Many psychology papers fail replication test Science
349910ndash911
Braver SL Thoemmes FJ amp Rosenthal R (2014) Continuously cumulating meta-analysis
and replicability Perspectives on Psychological Science 9 333ndash342 doi
1011771745691614529796
Brodeur A Leacute M Sangnier M amp Zylberberg Y (2016) Star Wars The empirics strike back
American Economic Journal Applied Economics 8 1ndash32 doi 101257app20150044
Bruns S B amp Ioannidis J P A (2016) p-curve and p-hacking in observational research PLoS
ONE 11 e0149144 doi101371journal pone0149144
Button K S Ioannidis J P Mokrysz C Nosek B A Flint J Robinson E S amp Munafograve M
R (2013) Power failure why small sample size undermines the reliability of neuroscience
Nature Reviews Neuroscience 14(5) 365-376 doi101038nrn3475
Cohen J (1962) The statistical power of abnormal-social psychological research A review
Journal of Abnormal and Social Psychology 65 145ndash153
POWER BIAS AND HETEROGENEITY
40
Cohen J (1965) Some statistical issues in psychological research In (BB Wolman ed)
Handbook of Clinical Psychology New York McGraw-Hill pp 95ndash121
Cohen J (1977) Statistical power analysis for the behavioral sciences (2nd ed) New York
Academic Press
Cohen J (1992) A power primer Psychological Bulletin 112 155ndash159
Cooper H M amp Hedges LV (1994) (eds) Handbook of Research Synthesis New York Russell
Sage
Dreber A Pfeiffer T Almenberg J Isaksson S Wilson B Chen Y amp Johannesson M
(2015) Using prediction markets to estimate the reproducibility of scientific research
Proceedings of the National Academy of Sciences 112(50) 15343-47
Eerland A Sherrill A M Magliano J P Zwaan R A Arnal J D Aucoin P amp Prenoveau
J M (2016) Registered replication report Hart amp Albarraciacuten (2011) Perspectives on
Psychological Science 11(1) 158-171 doi 1011771745691615605826
Egger M Smith G D Schneider M amp Minder C (1997) Bias in meta-analysis detected by a
simple graphical test British Medical Journal 315 629ndash634 doi101136bmj3157109629
Engber D (2015) Cover Story Everything is crumbling Slate March 6 Accessed Dec 19
2016
Erica C Y Sprenger A M Thomas R P amp Dougherty M R (2014) When decision heuristics
and science collide Psychonomic Bulletin amp Review 21(2) 268-282 doi103758s13423-013-
0495-z
Fabrigar L R amp Wegener D T (2016) Conceptualizing and evaluating the replication of
research results Journal of Experimental Social Psychology 66 68-80 doi
101016jjesp201507009
Fanelli D (2010) ldquoPositiverdquo results increase down the hierarchy of the sciences PLoS One
5 e10068 doi101371journalpone0010068
Fanelli D Costas R amp Ioannidis J P (2017) Meta-assessment of bias in science Proceedings
of the National Academy of Sciences 201618569 doi101073pnas1618569114
Fiedler K amp Schwarz N (2016) Questionable research practices revisited Social Psychological
and Personality Science 7(1) 45-52 doi 1011771948550615612150
POWER BIAS AND HETEROGENEITY
41
Fraley R C amp Vazire S (2014) The n-pact factor Evaluating the quality of empirical journals
with respect to sample size and statistical power PLoS ONE 9 e109019
doi101371journalpone0109019
Fraley R C amp Marks M J (2007) The null hypothesis significance testing debate and its
implications for personality research In R W Robins R C Fraley amp R F Krueger (Eds)
Handbook of research methods in personality psychology (pp149ndash169) New York Guilford
Franco A Malhotra N amp Simonovits G (2016) Underreporting in psychology experiments
Evidence from a study registry Social Psychological and Personality Science 7(1) 8-12 doi
1011771948550615598377
Gerber A amp Malhotra N (2008) Do statistical reporting standards affect what is published
publication bias in two leading political science journals Quarterly Journal of Political
Science 3 313-326 doi 10156110000008024
Hagger M S Chatzisarantis N L D Alberts H Anggono C O Birt A Brand R amp
Cannon T (2016) A multi-lab preregistered replication of the ego-depletion effect
Perspectives on Psychological Science 11 546ndash573 doi 1011771745691616652873
Hedges L V amp Olkin I (1985) Statistical Methods for Meta-Analysis Academic Press Orlando
Henmi M amp Copas J B (2010) Confidence intervals for random effects meta-analysis and
robustness to publication bias Statistics in Medicine 29 2969ndash2983 doi 101002sim4029
Higgins J P T amp Thompson S G (2002) Quantifying heterogeneity in meta-analysis Statistics
in Medicine 21 1539ndash1558 doi 101002sim1186
Hoenig J M amp Heisey D M (2001) The abuse of power The pervasive fallacy of power
calculations for data analysis American Statistician 55 19ndash24 doi
101198000313001300339897
Inthout J Ioannidis J P A amp Borm G F (2012) Obtaining evidence by a single well-powered
trial or several modestly powered trials Statistical Methods in Medical Research
httpsmmsagepubcomcontentearly201209240962280212461098abstract (Accessed
Aug 16th 2015)
Ioannidis J P A (2005a) Contradicted and initially stronger effects in highly cited clinical
research Journal of the American Medical Association 294 218-228
doi101001jama2942218
POWER BIAS AND HETEROGENEITY
42
Ioannidis J P A (2005b) Why most published research findings are false PLoS Medicine 2
e124 doi101371journalpmed0020124
Ioannidis J P A (2013) Clarifications on the application and interpretation of the test for excess
significance and its extensions Journal of Mathematical Psychology 57 184-187 doi
101016jjmp201303002
Ioannidis J P A Hozo I and Djulbegovic B (2013) Optimal type I and type II error pairs when
the available sample size is fixed Journal of Clinical Epidemiology 66 903-910 doi
101016jjclinepi201303002
Ioannidis J P A Stanley T D amp Doucouliagos C(H) (2017) The power of bias in economics
research The Economic Journal October also as SWP Economics Series 20162
httpwwwdeakineduau__dataassetspdf_file00074777632016_1pdf Deakin University
Australia [Accessed on 27 April 2017]
John L K Loewenstein G amp Prelec D (2012) Measuring the prevalence of questionable
research practices with incentives for truth telling Psychological Science 23 524-532 doi
1011770956797611430953
Klein R A Vianello M Hasselman F Alper S Aveyard M Axt J R amp Nosek B A
(2015) Many Labs 2 Investigating variation in replicability across sample and setting
Manuscript in preparation
Kuumlhberger A Fritz A amp Scherndl T (2014) Publication bias in psychology a diagnosis based
on the correlation between effect size and sample size PloS one 9(9) e105825 doi
101371journalpone0105825
Lakens D (2015) On the challenges of drawing conclusions from p-values just below 005 Peer
J 3e1142 doi 107717peerj1142 PMID 26246976
LeBel E P Borsboom D Giner-Sorolla R Hasselman F Peters K R Ratliff K A amp
Smith C T (2013) PsychDisclosure org Grassroots support for reforming reporting standards
in psychology Perspectives on Psychological Science 8(4) 424-432 doi
1011771745691613491437
LeBel E P Vanpaemel W McCarthy R J Earp B D amp Elson M (2017) A unified
framework to quantify the trustworthiness of empirical research Advances in Methods and
Practices in Psychological Science Retrieved from httpsosfiopreprintspsyarxivuwmr8
8232017
POWER BIAS AND HETEROGENEITY
43
Lindsay D S (2015) Replication in psychological science Psychological Science 26 1827-32
Makel M C Plucker J A amp Hegarty B (2012) Replications in psychology research How
often do they really occur Perspectives on Psychological Science 7(6) 537-542
Maxwell S E (2004) The persistence of underpowered studies in psychological research causes
consequences and remedies Psychological Methods 9 147 doi 1010371082-989X92147
Maxwell S E Lau M Y amp Howard G S (2015) Is psychology suffering from a replication
crisis What does ldquofailure to replicaterdquo really mean American Psychologist 70(6) 487-498
httpdxdoiorg101037a0039400
McShane B B amp Boumlckenholt U (2016) Planning sample sizes when effect sizes are uncertain
The power-calibrated effect size approach Psychological Methods 21(1) 47 doi
101037met0000036
McShane B B Boumlckenholt U amp Hansen K T (2016) Adjusting for publication bias in meta-
analysis An evaluation of selection methods and some cautionary notes Perspectives on
Psychological Science 11 730ndash749 doi 1011771745691616662243
Miguel E amp Christensen G (2017) Transparency reproducibility and the credibility of
economics research Journal of Economic Literature IN PRESS
Moreno S G Sutton A J Ades A E Stanley T D Abrams K R Peters J L Cooper N
J (2009) Assessment of regression-based methods to adjust for publication bias through a
comprehensive simulation study BMC Medical Research Methodology 9 2 doi
1011861471-2288-9-2
Open Science Collaboration (2015) Estimating the reproducibility of psychological science
Science 349(6251) aac4716ndashaac4716 doi101126scienceaac4716
Pashler H amp Harris C (2012) Is the replicability crisis overblown Three arguments examined
Perspectives on Psychological Science 7 531ndash536 doi 1011771745691612463401
Pashler H amp Wagenmakers E J (2012) Editorsrsquo introduction to the special section on
replicability in psychological science a crisis of confidence Perspectives on Psychological
Science 7 528ndash530 doi 1011771745691612465253
Patil P and Leek JT (2015) Reporting of 36 of studies replicate in the media
httpsgithubcomjtleekreplication_paperblobgh-pagesin_the_mediamd[Online up- dated
16-September-2015 accessed 8232017]
POWER BIAS AND HETEROGENEITY
44
Patil P Peng R D amp Leek J T (2016) What should researchers expect when they replicate
studies A statistical view of replicability in psychological science Perspectives on
Psychological Science 11(4) 539-544 doi 1011771745691616646366
Pigott T (2012) Advances in meta-analysis New York NY Springer
Poole C amp Greenland S (1999) Random-effects meta-analyses are not always conservative
American Journal of Epidemiology 150 469ndash475
Popper K (1959) The logic of scientific discovery New York NY Basic Books
Psychonomic Society (2012) New Statistical Guidelines for Journals of the Psychonomic Society
httpwwwpsychonomicorgpagestatisticalguideline (Accessed March 11th 2017)
Rossi J S (1990) Statistical power of psychological research What have we gained in 20 years
Journal of Consulting and Clinical Psychology 58 646ndash656 doi1010370022-
006X585646
Richard F D Bond C F amp Stokes-Zoota J J (2003) One hundred years of social psychology
quantitatively described Review of General Psychology 7 331ndash363
Scargle J D (2000) Publication bias The ldquoFile-Drawerrdquo problem in scientific inference Journal
of Scientific Exploration 14 91ndash106
Schmidt F L amp Hunter J E (2015) Methods of meta-analysis Correcting error and bias in
research findings 3rd ed Los Angeles CA Sage
Schmidt F L amp Oh I -S (2016) The crisis of confidence in research findings in psychology Is
lack of replication the real problem Or something else Archives of Scientific Psychology 4(1)
32ndash37 httpdxdoiorg101037arc0000029
Sedlmeier P amp Gigerenzer G (1989) Do studies of statistical power have an effect on the power
of studies Psychological Bulletin 105 309ndash316
Simmons J P Nelson L D amp Simonsohn U (2011) False-positive psychology Undisclosed
flexibility in data collection and analysis allows presenting anything as significant
Psychological Science 22(11) 1359-1366 doi 1011770956797611417632
Simonsohn U Nelson L D amp Simmons J P (2014) P-curve a key to the file drawer Journal
of Experimental Psychology General 143 534-547 doi 101037a0033242
Stanley D J amp Spence J R (2014) Expectations for replications Are yours realistic
Perspectives on Psychological Science 9 305ndash318 doi 1011771745691614528518
POWER BIAS AND HETEROGENEITY
45
Stanley T D (2008) Meta-regression methods for detecting and estimating empirical effects in
the presence of publication selection Oxford Bulletin of Economics and Statistics 70103-27
doi 101111j1468-0084200700487x
Stanley T D (2017) Limitations of PET-PEESE and other meta-analysis methods Social
Psychology and Personality Science [Epub ahead of print] doi 1011771948550617693062
Stanley T D amp Doucouliagos H(C) 2014 Meta-regression approximations to reduce publication
selection bias Research Synthesis Methods 5 60-78 doi 101002jrsm1095
Stanley T D amp Doucouliagos H(C) 2015 Neither fixed nor random Weighted least squares
meta-analysis Statistics in Medicine 34 2116-27 doi 101002sim6481
Stanley T D amp Doucouliagos H(C) 2017 Neither fixed nor random Weighted least squares
meta-regression analysis Research Synthesis Methods 8 19-42 doi 101002jrsm1211
Stanley T D Doucouliagos H(C) amp Ioannidis J P A 2017 Finding the power to reduce
publication bias Statistics in Medicine [Epub ahead of print] doi 101002sim7228
Sterling T D (1959) Publication decisions and their possible effects on inferences drawn from
tests of significance Or vice versa Journal of the American Statistical Association 54 30ndash34
Sterling T D Rosenbaum W L amp Weinkam J J (1995) Publication decisions revisited The
effect of the outcome of statistical tests on the decision to publish and vice versa American
Statistician 49 108ndash112 doi 1023072684823
Sutton A J Song F Gilbody S M amp Abrams K R (2000) Modelling publication bias in
meta-analysis A review Statistical Methods in Medical Research 9 421-445 doi
101177096228020000900503
Tressoldi P E amp Giofreacute D (2015) The pervasive avoidance of prospective statistical power
Major consequences and practical solutions Frontiers in Psychology 6 726
doi103389fpsyg201500726
van Aert R C M Jelte M Wicherts J M amp van Assen M A L M (2016) Conducting meta-
analyses based on p values Reservations and recommendations for applying p-uniform and p-
curve Perspectives on Psychological Science 11 713ndash729 doi 1011771745691616650874
van Bavel JJ Mende-Siedlecki PBrada WJ and Reinero DA 2016 Contextual sensitivity
in scientific reproducibility Proceedings of the National Academy of Sciences 113 6454ndash59
POWER BIAS AND HETEROGENEITY
46
van Erp S et al (2017) Estimates of between-study heterogeneity for 705 meta-analyses reported
in Psychological Bulletin from 1990ndash2013 Journal of Open Psychology Data 5(1) p4 DOI
httpdoiorg105334jopd33
Wicherts J M Veldkamp C L Augusteijn H E Bakker M van Aert R C amp Van Assen
M A (2016) Degrees of Freedom in Planning Running Analyzing and Reporting
Psychological Studies A Checklist to Avoid p-Hacking Frontiers in Psychology 7 doi
103389fpsyg201601832
Yuan K amp Maxwell S (2005) On the post hoc power in testing mean differences Journal of
Educational and Behavioral Statistics 30 141ndash167 doi 10310210769986030002141
POWER BIAS AND HETEROGENEITY
47
Table 1 Median Statistical Power and Average Effect Sizes
Mean Proportion with Adequate Power Median Power Type of Effect
Absolute Effect Sizes WLS WAAP-WLS PET-PEESE WLS WAAP-WLS PET-PEESE
Combined (n=200)
0389 0077 0071 0091 0364 0331 0360
Correlations (n=108)
0458 0243 0328 0272 0577 0610 0607
SMDs (n=92)
0291 0013 0000 0011 0230 0171 0170
Notes The numbers reported in the table are medians Mean absolute effect sizes are reported in this table in units of standardized mean differences (SMD) regardless of whether they were reported in the meta-analysis as correlations or as SMD WLS is the unrestricted weighted least squares weighted average WAAP-WLS is the weighted average of adequately powered effect sizes (WAAP) or WLS when there are no adequately powered studies PET-PEESE is the conditional precision-effect test-precision-effect estimate with standard error meta-regression correction for publication bias Adequate power is defined as 80 following Cohen (1977)
Table 2 Median Statistical Powers by Experimental Design Proportion with Adequate Power Median Power
Experimental Design WLS WAAP-WLS PET-PEESE WLS WAAP-WLS PET-PEESE
Observational (n=113)
0278 0259 0268 0621 0613 0585
Experimental (n=87)
0032 0000 0053 0247 0232 0236
Notes The numbers reported in the table are medians WLS is the unrestricted weighted least squares weighted average WAAP-WLS is the weighted average of adequately powered effect sizes (WAAP) or WLS when there are no adequately powered studies PET-PEESE is the conditional precision-effect test-precision-effect estimate with standard error meta-regression correction for publication bias Adequate power is defined as 80 following Cohen (1977)
Figure 1 Obtaining adequate power (80)
Notes x is distributed as a standard normal distribution N(01) 196 is the critical value for testing against 0 Figure 1 merely illustrates how the standardized mean of the sampling distribution needs to 28 standard errors away from 0 for an experiment to have adequate powermdashCohenrsquos 80 We thank Stephan Bruns for producing this graph
POWER BIAS AND HETEROGENEITY
49
Figure 2 Histograms of Adequately Powered Estimates from 200 Areas of Research
Notes WLS is the unrestricted weighted least squares weighted average WAAP-WLS is the weighted average of adequately powered effect sizes (WAAP) or WLS when there are no adequately powered studies PET-PEESE is the conditional precision-effect test-precision-effect estimate with standard error meta-regression correction for publication bias Adequate power is defined as 80 following Cohen (1977)
0
20
40
60
80
100
120N
um
ber
of M
eta-
An
alys
es
0 2 4 6 8 1Proportion of Studies Adequately Powered
WLS
0
20
40
60
80
100
120
Nu
mbe
r of
Met
a-A
nal
yses
0 2 4 6 8 1Proportion of Studies Adequately Powered
WAAP-WLS
0
20
40
60
80
100
120
Nu
mbe
r of
Met
a-A
nal
yses
0 2 4 6 8 1Proportion of Studies Adequately Powered
PET-PEESE
POWER BIAS AND HETEROGENEITY
50
Figure 3 Histograms of Median Statistical Power from 200 Areas of Research
Notes WLS is the unrestricted weighted least squares weighted average WAAP-WLS is the weighted average of adequately powered effect sizes (WAAP) or WLS when there are no adequately powered studies PET-PEESE is the conditional precision-effect test-precision-effect estimate with standard error meta-regression correction for publication bias Adequate power is defined as 80 following Cohen (1977)
0
10
20
30
40
50
60N
um
ber
of M
eta-
An
alys
es
0 2 4 6 8 1Median Statistical Power
WLS
0
10
20
30
40
50
60
Nu
mbe
r of
Met
a-A
nal
yses
0 2 4 6 8 1Median Statistical Power
WAAP-WLS
0
10
20
30
40
50
60
70
Nu
mbe
r of
Met
a-A
nal
yses
0 2 4 6 8 1Median Statistical Power
PET-PEESE
Figure 4 Histograms of I2 from 200 Areas of Research
Notes I2 is the proportion of observed variation among reported effect sizes that cannot be explained by the calculated standard errors associated with these reported effect sizes It is a relative measure of heterogeneity
0
5
10
15
20
25
30
35
40
45
0 2 4 6 8 1I-squared
Num
ber o
f Met
a-A
naly
ses
POWER BIAS AND HETEROGENEITY
52
Appendix A Studies included in the meta-meta-analysis
1 Baas M Nijstad B A Boot N C amp De Dreu C K W (2016) Mad genius revisited Vulnerability to psychopathology biobehavioral approach-avoidance and creativity Psychological Bulletin 142 668-692 doi101037bul0000049 [2]
2 Balliet D Li N P Macfarlan S J amp Van Vugt M (2011) Sex differences in cooperation A meta-analytic review of social dilemmas Psychological Bulletin 137 881ndash909 doi 101037a0025354 [1]
3 Balliet D Mulder L B amp Van Lange P A M (2011) Reward punishment and cooperation A meta-analysis Psychological Bulletin 137 594-615 doi 101037a0023489 [2]
4 Balliet D Wu J amp De Dreu C K W (2014) Ingroup favoritism in cooperation A meta-analysis Psychological Bulletin 140 1556-1581 doi 101037a0037737 [1]
5 Brewin C R (2014) Episodic memory perceptual memory and their interaction Foundations for a theory of posttraumatic stress disorder Psychological Bulletin 140 69ndash97 doi 101037a0033722 [1]
6 Byron K amp Khazanchi S (2011) Rewards and creative performance A meta-analytic test of theoretically derived hypotheses Psychological Bulletin 138 809ndash830 [1]
7 Cerasoli C P amp Nicklin J M (2014) Intrinsic motivation and extrinsic incentives jointly predict performance A 40-year meta-analysis Psychological Bulletin 140 980-1008 doi 101037a0035661 [1]
8 Chaplin T M amp Aldao A (2013) Gender differences in emotion expression in children A meta-analytic review Psychological Bulletin 139 735-765 doi 101037a0030737 [4]
9 Defoe I N Dubas JS amp Figner B (2015) A meta-analysis on age differences in risky decision making Adolescents versus children and adults Psychological Bulletin 141 48ndash84 doi 101037a0038088 [4]
10 Degner J amp Dalege J (2013) The apple does not fall far from the tree or does it A meta-analysis of parentndashchild similarity in intergroup attitudes Psychological Bulletin 139 1270ndash1304 doi 101037a0031436 [1]
11 Eastwick P W Finkel E J Luchies L B amp Hunt L L (2014) The predictive validity of ideal partner preferences A review and meta-analysis Psychological Bulletin 140 623ndash 665 doi 101037a0032432 [4]
12 Else-Quest N M Higgins A Allison C amp Morton L C (2012) Gender differences in self-conscious emotional experience Psychological Bulletin 138 947ndash981 doi101037a0027930 [5]
13 Fairbairn C E amp Sayette M A (2014) A social-attributional analysis of alcohol response Psychological Bulletin 140 1361-82 doi 101037a0037563 [4]
14 Fischer P Krueger J I Greitemeyer T Vogrincic C Kastenmuumlller A Frey D Heene M Wicher M amp Kainbacher M (2011) The bystander-effect A meta-analytic review on bystander intervention in dangerous and non-dangerous emergencies Psychological Bulletin 137 517ndash537 doi 101037a0023304 [1]
POWER BIAS AND HETEROGENEITY
53
15 Fox MC Ericsson A amp Best (2011) Do procedures for verbal reporting of thinking have to be reactive A meta-analysis and recommendations for best reporting methods Psychological Bulletin 137 316 ndash344 doi 101037a0021663 [2]
16 Fox N A You K H Bowman L C Cannon E N Ferrari P F Bakermans-Kranenburg M J Vanderwert R E amp van IJzendoorn M H (2016) Assessing human mirror activity with EEG mu rhythm A meta-analysis Psychological Bulletin 142 291ndash313 doi101037bul0000031 [2]
17 Freund P A amp Kasten N (2012) How smart do you think you are A meta-analysis on the validity of self-estimates of cognitive ability Psychological Bulletin 138 296-321 doi101037a0026556 [1]
18 Grijalva E Newman D A Tay L Donnellan M B Harms P D amp Robins R W (2015) Gender differences in narcissism A meta-analytic review Psychological Bulletin 141 261-310 doi 101037a0038231 [3]
19 Haedt-Matt A A amp Keel P K (2011) Revisiting the affect regulation model of binge eating A meta-analysis of studies using ecological momentary assessment Psychological Bulletin 137 660ndash681 doi 101037a0023660 [3]
20 Harkin B Webb T L Prestwich A Conner M Kellar I Benn Y amp Sheeran P (2016) Does monitoring goal progress promote goal attainment A meta-analysis of the experimental evidence Psychological Bulletin 142 198-229 doi 101037bul0000025 [2]
21 Houben M Van Den Noortgate W amp Kuppens P (2015) The relation between short-term emotion dynamics and psychological well-being A meta-analysis Psychological Bulletin 141 901-930 doi101037a0038822 [4]
22 Johnsen T J amp Friborg O (2015) The effects of cognitive behavioral therapy as an anti-depressive treatment is falling A meta-analysis Psychological Bulletin 141 747-768 [2]
23 Karlin B Zinger J F amp Ford R (2015) The effects of feedback on energy conservation A meta-analysis Psychological Bulletin 141 1205-1227 doi 101037a0039650 [1]
24 Kim S Thibodeau R amp Jorgensen R S (2011) Shame guilt and depressive symptoms A meta-analytic review Psychological Bulletin 137 68 ndash96 doi 101037a0021466 [2]
25 Klahr A M amp Burt S A (2014) Elucidating the etiology of individual differences in parenting A meta-analysis of behavioral genetic research Psychological Bulletin 140 544ndash586 doi 101037a0034205 [6]
26 Koenig A M Eagly A H Mitchell A A amp Ristikari T (2011) Are leader stereotypes masculine A meta-analysis of three research paradigms Psychological Bulletin 137 616 ndash 642 doi 101037a0023557 [4]
27 Kredlow M A Unger L D amp Otto M W (2016) Harnessing reconsolidation to weaken fear and appetitive memories A meta-analysis of post-retrieval extinction effects Psychological Bulletin 142 314ndash336 doi 101037bul0000034 [3]
28 Kuykendall L Tay L amp Ng V (2015) Leisure engagement and subjective well-being A meta-analysis Psychological Bulletin 141 364-403 doi101037a0038508 [3]
29 Landau M J amp Kay A C (2015) Compensatory control and the appeal of a structured world Psychological Bulletin 141 694ndash722 doi 101037a0038703 [1]
30 Lee E-S Park T-Y amp Koo B (2015) Identifying organizational identification as a basis for attitudes and behaviors A meta-analytic review Psychological Bulletin 141 1049ndash1080 doi 101037bul0000012 [1]
POWER BIAS AND HETEROGENEITY
54
31 Lui P P (2015) Intergenerational cultural conflict mental health and educational outcomes among Asian and Latinoa Americans Qualitative and meta-analytic review Psychological Bulletin 141 404-446 doi101037a0038449 [3]
32 Lull R B amp Bushman B J (2015) Do sex and violence sell A meta-analytic review of the effects of sexual and violent media and ad content on memory attitudes and buying intentions Psychological Bulletin 141 1022ndash1048 doi 101037bul0000018 [6]
33 Mazei J Freund P A Huumlffmeier J amp Stuhlmacher A F (2015) A meta-analysis on gender differences in negotiation outcomes and their moderators Psychological Bulletin 141 85ndash104 doi 101037a0038184 [1]
34 Melby-Lervaringg M Lyster S A amp Hulme C (2012) Phonological skills and their role in learning to read A meta-analytic review Psychological Bulletin 138 322ndash352 doi 101037a0026744 [3]
35 Melby-Lervaringg M amp Lervaringg A (2014) Reading comprehension and its underlying components in second-language learners A meta-analysis of studies comparing first- and second-language learners Psychological Bulletin 140 409ndash433 doi 101037a0033890
[4] 36 Mendelson J L Gates J A amp Lerner M D (2016) Friendship in school-age boys with
autism spectrum disorders A meta-analytic summary and developmental process-based model Psychological Bulletin 142 601-622 doi 101037bul0000041 [2]
37 Mol S E amp Bus A G (2011) To read or not to read A meta-analysis of print exposure from infancy to early adulthood Psychological Bulletin 137 267ndash296 doi 101037a0021890 [13]
38 Orquin J L amp Kurzban R (2016) A meta-analysis of blood glucose effects on human decision making Psychological Bulletin 142 546ndash567 doi 101037bul0000035 [1]
39 Ottaviani C Verkuil B Medea B Couyoumdjian A Thayer JF Lonigro A amp Brosschot J F (2016) Physiological concomitants of perseverative cognition A systematic review and meta-analysis Psychological Bulletin 142 No 3 231ndash259 doi 101037bul0000036 [8]
40 North M S amp Fiske S T (2015) Modern attitudes toward older adults in the aging world A cross-cultural meta-analysis Psychological Bulletin 141 993ndash1021 doi 101037a0039469 [1]
41 Pahlke E Hyde J S amp Allison C M (2014) The effects of single-sex compared with coeducational schooling on studentsrsquo performance and attitudes A meta-analysis Psychological Bulletin 140 1042-1072 doi 101037a0035740 [2]
42 Pan S C amp Rickard T C (2015) Sleep and motor learning Is there room for consolidation Psychological Bulletin 141 812-834 doi 101037bul0000009 [1]
43 Phillips W J Fletcher J M Marks A D G amp Hine D W (2016) Thinking styles and decision making A meta-analysis Psychological Bulletin 142 No 3 260ndash290 doi 101037bul0000027 [4]
44 Pool E Brosch T Delplanque S amp Sander D (2016) Attentional bias for positive emotional stimuli A meta-analytic investigation Psychological Bulletin 142 No 1 79ndash106 doi 101037bul0000026 [1]
45 Randall J G Oswald F L amp Beier M E (2014) Mind-wandering cognition and performance A theory-driven meta-analysis of attention regulation Psychological Bulletin 140 1411ndash1431 doi 101037a0037428 [4]
POWER BIAS AND HETEROGENEITY
55
46 Sambrook T D amp Goslin J (2015) A neural reward prediction error revealed by a meta-analysis of ERPs using great grand averages Psychological Bulletin 141 213ndash235 doi 101037bul0000006 [4]
47 Sedlmeier P Eberth J Schwarz M Zimmermann D Haarig F Jaeger S amp Kunze S (2012) The psychological effects of meditation A meta-analysis Psychological Bulletin 138 1139ndash1171 doi 101037a0028168 [20]
48 Sheeran P Harris P R and Epton T (2014) Does heightening risk appraisals change peoplersquos intentions and behavior A meta-analysis of experimental studies Psychological Bulletin 140 511ndash543 doi 101037a0033065 [2]
49 Smith S F amp Lilienfeld S O (2015) The response modulation hypothesis of psychopathy A meta-analytic and narrative analysis Psychological Bulletin 141 1145ndash1177 doi 101037bul0000024 [1]
50 Soderberg C K Amit E Callahan S P Kochersberger A O amp Ledgerwood A (2015) The effects of psychological distance on abstraction Two meta-analyses Psychological Bulletin 141 3 525ndash548 doi101037bul0000005 [2]
51 Tannenbaum M B Hepler J Zimmerman R S Saul L Jacobs S Wilson K amp Albarraciacuten D Appealing to fear A meta-analysis of fear appeal effectiveness and theories Psychological Bulletin 141 1178ndash1204 doi101037a0039729 [1]
52 Toosi N R Babbitt L G Ambady N amp Sommers SR (2012) Dyadic interracial interactions A meta-analysis Psychological Bulletin 138 1ndash27 doi 101037a0025767 [4]
53 Vachon D D Lynam D R amp Johnson J A (2014) The (Non)relation between empathy and aggression Surprising results from a meta-analysis Psychological Bulletin 140 751ndash773 doi 101037a0035236 [1]
54 Verhage M L Schuengel C Madigan S Fearon R M P Oosterman M Cassibba R Bakermans-Kranenburg M J amp van IJzendoorn M H (2016) Narrowing the transmission gap A synthesis of three decades of research on intergenerational transmission of attachment Psychological Bulletin 142 337ndash366 doi 101037bul0000038 [2]
55 von Stumm S amp Ackerman P L (2013) Investment and intellect A review and meta-analysis Psychological Bulletin 139 841ndash869 doi 101037a0030746 [11]
56 Voyer D amp Voyer S D (2014) Gender differences in scholastic achievement A meta-analysis Psychological Bulletin 140 1174-1204 doi 101037a0036620 [6]
57 Vucasović T amp Bratko D (2015) Heritability of personality A meta-analysis of behavior genetic studies Psychological Bulletin 141 769ndash785 doi101037bul0000017 [1]
58 Wanberg C R Hamann D J Kanfer R amp Zhang Z (2016) Age and reemployment success after job loss An integrative model and meta-analysis Psychological Bulletin 142 400-426 doi 101037bul0000019 [6]
59 Weingarten E Chen Q McAdams M Yi J amp Hepler J (2016) From primed concepts to action A meta-analysis of the behavioral effects of incidentally presented words Psychological Bulletin 142 472ndash497 doi 101037bul0000030 [1]
60 Williams M J amp Tiedens L Z (2016) The subtle suspension of backlash A meta-analysis of penalties for womenrsquos implicit and explicit dominance behaviour Psychological Bulletin 142 165ndash197 doi 101037bul0000039 [6]
POWER BIAS AND HETEROGENEITY
56
61 Winer E S amp Salem T (2016) Reward devaluation Dot-probe meta-analytic evidence of avoidance of positive information in depressed persons Psychological Bulletin 142 18ndash78 doi 101037bul0000022 [6]
Notes Numbers in square brackets denote the number of meta-analyses included in the dataset
Appendix B Distribution of survey estimates
Year
No of meta-analyses published
No of meta-analyses sampled
of published meta-studies
No of estimates
of sample
2016 17 14 82 46 22 2015 22 18 82 40 19 2014 25 12 48 46 22 2013 17 3 18 16 8 2012 15 6 40 34 16 2011 19 8 42 31 15
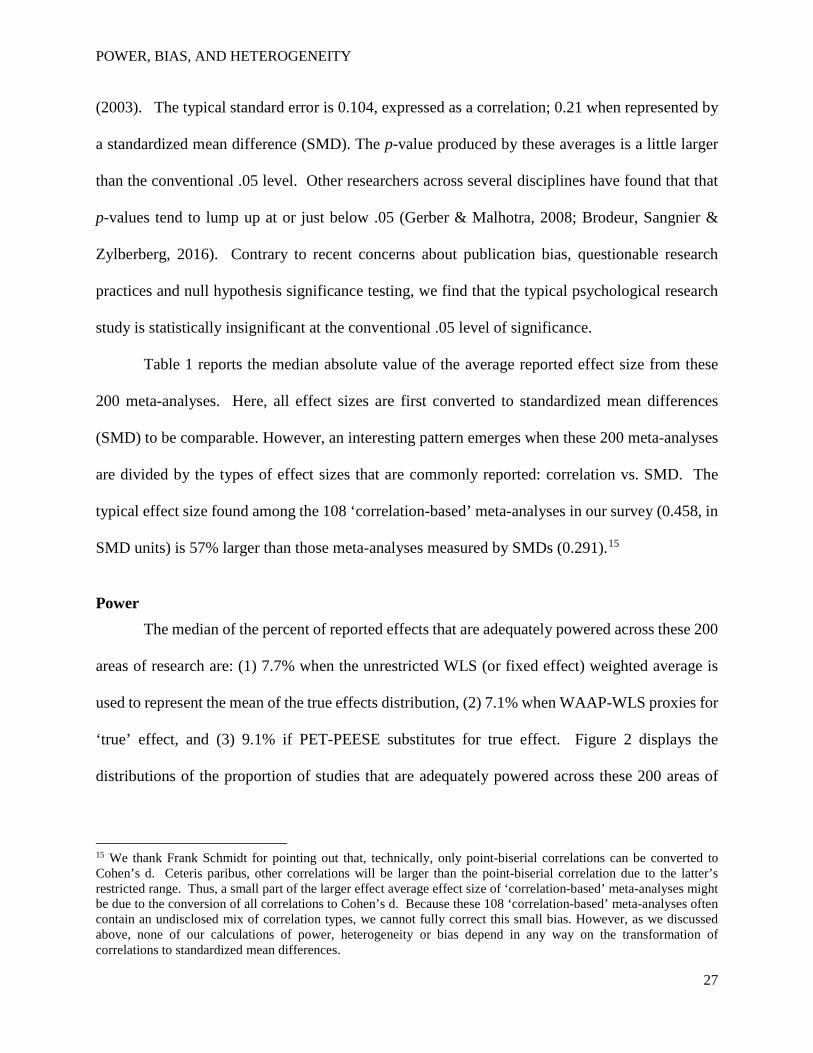
POWER BIAS AND HETEROGENEITY
30
Heterogeneity
The median percent of the observed variation of reported effect sizes within a given area
of research that is attributed to heterogeneity (I2) is 74 This means that the variance among lsquotruersquo
effects is nearly 3 times larger than the reported sampling variance According to Pigottrsquos (2012)
guidelines for small (25) medium (50) and large (75) heterogeneity typical areas of research
have nearly lsquolargersquo excess heterogeneity Yet this level of heterogeneity appears to be the norm
for research in psychology For example van Erp et al (2017) extracted estimates of heterogeneity
from 705 meta-analyses published in Psychological Bulletin between 1990 and 2013 and found
that the median reported I2 = 7062 (interquartile range [3324 8741]) However I2 is a
relative measure of heterogeneity and does not reflect the variation in true effect as measured in
units of SMDs When our median I2 is applied to the typical area of research the standard deviation
among true effects is 0354 SMD and the standard deviation from one study to the next due to both
heterogeneity and sampling error becomes 0412 larger than the typical reported effect size 0389
lsquoExperimentalrsquo vs lsquoobservationalrsquo research
As a post hoc secondary analysis17 we examined whether the systematic differences
between SMD-based and correlation-based meta-analyses are due to experimental design
lsquoexperimentalrsquo vs lsquoobservationalrsquo Unfortunately this differentiation is not perfect Many meta-
analyses contain a mix of experimental and observational research designs at the study level For
example Williams and Tiedens (2015) meta-analysis of the effects of gender and dominance
17 Investigating these differences was not part of our pre-analysis plan Anonymous reviewers asked that we code for experimental design and report the differences
POWER BIAS AND HETEROGENEITY
31
behavior includes 97 experimental studies (85) where dominance behavior was somehow
manipulated and 17 purely observational studies
Because a substantial percent (424) of those meta-analyses that report effect sizes in
terms of SMD are lsquoobservationalrsquo and 314 of correlation-based meta-analyses are
lsquoexperimentalrsquo there is only small correlation (phi=0263 plt001) between experimental design
(1 if primarily experimental 0 elsewhere) and effect type (1 if SMD 0 for correlation) However
we do see some interesting differences in power and heterogeneity by experimental design First
there is a difference between heterogeneity as measured by I2 (plt01) The median I2 for
experimental research is 68 vs 76 for observational designs But I2 is a relative measure of
heterogeneity with a non-symmetric distribution To correct for I2rsquos nonstandard distribution we
use Abramowitz and Stegunrsquos (1964) normal approximation for the chi-square distribution applied
to the Cochran Q-test for heterogeneity Doing so causes this difference in relative heterogeneity
to be only marginally larger than statistical noise (p=045) Additionally experimental research
designs have larger sampling errors and lower power Typical sampling errors are 026 vs 019
measured as median SEs in units of SMD Table 2 reports the median proportion of studies that
are adequately powered and the median of median powers by type of research design Even though
there is only a small association between experimental design and effect type we find a similar
pattern among the typical levels of power for experimental design that we see for effect type
confirming the concerned expressed by dozens of researchers over the years that scarcely any
experimental studies are adequately powered All of these results about lsquoexperimentalrsquo vs
lsquoobservationalrsquo research designs should be interpreted with caution because as mentioned they
are conducted post hoc
POWER BIAS AND HETEROGENEITY
32
Discussion
Our survey of 12065 estimated effects sizes from nearly 8000 studies in 200 meta-
analyses reveals that the typical effect size is 0389 SMD with a median standard error of 021 We
also find low statistical power small residual selection bias and high levels of heterogeneity The
central purpose of our review is to assess the replicability of psychological research through meta-
analysis and thereby better understand recent failures to replicate Our findings implicate low
statistical power and high levels of heterogeneity as the primary causes of lsquofailedrsquo replications
however defined
We find that only a small proportion of psychological studies are adequately powered
approximately 8 and the median power is about 36 across three proxies for the mean lsquotruersquo
effect18 What does this imply about replication Our survey predicts therefore that replication
study with a typical sample size will have only a 36 chance of finding a statistically significant
effect in the same direction as some previous study and this value is exactly the same percent of
replications found to be statistically significant in the same direction by the Open Science
Collaboration (Open Science Collaboration 2015 Table 1) Thus when replication is viewed in
terms of sign and statistical significance it is no wonder that rates of replication are considered
low in psychology research
Improving replication as noted by others (eg Maxwell et al 2015) would seem to be a
matter of conducting both initial studies and replications with larger samples reducing sources of
non-sampling error (eg measurement error Stanley amp Spence 2014) and focusing on larger
18 To be more precise 36 is the median among the medians of medians
POWER BIAS AND HETEROGENEITY
33
effects Because researchers work with limited resources and knowledge these obvious
recommendations are extremely difficult to implement in most cases
More practical recommendations have centered on redefining replication success and
adjusting researchersrsquo expectations about non-significant replications For example Peng et al
(2016) examined the data from the Reproducibility Project Psychology (Open Science
Collaboration 2015) in terms of prediction intervalsmdashconfidence intervals that account for
variability in both the original and replication studymdashand found that 77 of the replication
attempts were consistent with the original findings This finding seems to be in apparent contrast
to the highly publicized result that only 36 of the replications in those data were statistically
significant but completely in accord with the less well-publicized result that meta-analytically
combining the replications with the original studies resulted in 70 statistical significance (Open
Science Collaboration 2015) Along similar lines several authors have argued for assessing
replication primarily within the context of meta-analysis (eg Braver Thoemmes amp Rosenthal
2014 Stanley amp Spence 2014 Fabrigar amp Wegener 2016) Doing so could shift the evaluation
of success vs failure of replications to a judgement about the degree of information that new data
add to our knowledge base (Peng et al 2016)
Consistent with a previous survey of heterogeneity (van Erp et al 2017) and several
findings from recent multi-site replication attempts (Hagger amp Chatzisarantis 2016 Eerland et al
2016 Klein et al 2015) our survey reveals clear evidence for high levels of heterogeneity in
research in psychology We find that heterogeneity accounts for nearly three-fourths of the
observed variation among reported effects (ie median I2 =74) When applied to the median
reported standard error (measured in terms of SMD) this high I2 implies that the typical standard
deviation of heterogeneity is equal to 0354 (again in units of SMDs) Importantly even a
POWER BIAS AND HETEROGENEITY
34
replication study with millions of subjects will remain vulnerable to heterogeneity among lsquotruersquo
effects When we apply our surveyrsquos typical heterogeneity to its typical effect size it is unlikely
that any replication will be lsquosuccessfulrsquo For example if our median effect size 0389 is the mean
of the distribution of true effects then there is a 298 probability that the largest possible
replication study will find a negligible zero or opposite-signed effect The probability is 324
that this ideal replication (ie ninfin) finds a small effect and it is 255 for a medium-sized
effectmdashusing Cohenrsquos guidelines of 02 05 and 08 Even though 0389 is considered a lsquosmallrsquo
effect by these guidelines the probability that a very large replication finds a large effect remains
non-negligible at 123 Thus it is quite likely 68 that an ideal replication will not reproduce
a small effect when the mean of the distribution true effects is equal to our median average effect
size The wide distribution of true effect sizes that our survey finds is also similar to what Open
Science Collaboration observed when attempting to replicate 100 psychological experimentmdashsee
Figure 3 in the Open Science Collaboration (2015)
No matter what the mean of the distribution of true effect sizes might be nor how large the
replication study is it is unlikely that a replication will find an effect size close to what was found
previously when there is this much heterogeneity If a lsquosuccessful replicationrsquo is defined as finding
an effect size similar to what some previous study or studies have found (say for example to
within + 01 or within + 02 SMD) then there will always be a sizeable chance of unsuccessful
replication no matter how well conducted or how large any of the studies are For example
suppose that two studies are conducted with nearly infinite sample sizes and therefore infinitesimal
sampling error Heterogeneity of the size that our survey finds implies that the probability that
these two ideal studies find effect sizes that are within +01 from one another is 158 and 311
to within +02 Indeed there remains a 50 or greater probability of a lsquofailed replicationrsquo whenever
POWER BIAS AND HETEROGENEITY
35
the acceptable difference for a successful replication is set at less than 035 SMD Needless to say
if we have less-than-ideal sample sizes the resulting added sampling error will reduce the
probability of a successful replication further Thus high heterogeneity further explains the failure
of the Open Science Collaboration (2015) to find reliable indicators of replication success
There are important caveats to these calculations of replication success that need to be
mentioned First there is a wide distribution of observed heterogeneity among these areas of
psychological researchmdashsee Figure 4 Twenty-two percent have I2s that are less than 50 while
47 have I2 values 75 or higher and one out of seven have excess heterogeneity of 90 or more
Thus successful replication will be more likely in some areas of research but much less likely in
others Second these calculations assume that the typical heterogeneity observed in this research
record is entirely heterogeneity among lsquotruersquo effects that is variation beyond the control of
researchers Because exact replication is rare in psychology some of this observed heterogeneity
will be due to variation in experimental conditions measures methods and the characteristics of
the population from which the samples are drawn Thus a careful exact replication study could
avoid a notable amount of this variation in expected effect by carefully duplicating all of the
controllable features of the experimental design execution and evaluation However those large-
scale efforts to control these controllable research dimensions still find that notable heterogeneity
remains (Hagger et al 2016 Eerland et al 2016 Klein et al 2015) Moreover if half the
observed heterogeneity variance is due to differences that are under the control of the researcher19
then our estimate of the typical standard deviation due this uncontrollable heterogeneity among
true effects would be reduced to 025 In which case the probability that the largest possible
19 The typical heterogeneity found by two large replication studies that attempted to be as exact as possible is larger than half of the median heterogeneity that our survey finds (Hagger et al 2016 Eerland et al 2016)
POWER BIAS AND HETEROGENEITY
36
replication study will find a negligible zero or opposite-signed effect declines to 22 28 for a
medium effect and it will find a large effect only about 5 of the time Even if half of the observed
heterogeneity among reported effects is under the researcherrsquos control the probability that any
replication effort successfully replicates a small effect (recall 0389 is our surveyrsquos median effect
size) remains less than 50
Conclusions
Our survey of 12065 estimated effect sizes from nearly as many studies and 8000 papers
finds that lsquofailedrsquo replicationsmdashdefined here in terms of null hypothesis significance testingmdash are
to be expected at a rate consistent with the widely publicized the Reproducibility Project
Psychology (Open Science Collaboration 2015) Like many other researchers we find that
statistical power is chronically low in research in psychology (Cohen 1962 Cohen 1977
Sedlmeier amp Gigerenzer 1989 Rossi 1990 Maxwell 2004 Pashler amp Wagenmakers 2012
Fraley amp Vazire 2014 Tressoldi amp Giofreacute 2015) Unlike this previous research however our
survey reveals a more severe challenge for replication High levels of heterogeneity are evidently
the norm in psychology (median I2 =74) As discussed above heterogeneity this large makes
successful replication difficult whether defined in terms of hypothesis testing or estimation
precision This high heterogeneity will of course be due in part to methodological differences
between the different studies in each of the 200 meta-analyses that we survey However data from
multi-site registered replication efforts further suggest that when obvious methodological
differences are removed (ie when lsquoexactrsquo replications are conducted) heterogeneity is not
reduced to negligible levels In other words it is unrealistic to believe that variance in
POWER BIAS AND HETEROGENEITY
37
psychological phenomena studied can always be tightly controlled or reduced to practically
insignificant levels
Perhaps more surprising is our finding that there is relatively small exaggeration or overall
selective reporting bias in recent psychological research This is in contrast to the view that
publication bias and questionable research practices are the primary cause of failed replications
Of course as mentioned above there are good reasons to be cautious in applying this hopeful
result to any individual area of research In particular 275 of these areas of research produce a
significant Eggerrsquos test for publication bias (or small-sample bias) and this test is known to have
low power Our survey merely implies that the effects of selective reporting bias (ie publication
bias small-sample biases p-hacking andor questionable research practices) have a less clear
pattern than is maybe assumed by some researchers and by what has been observed in other fields
(eg economics Ioannidis Stanley and Doucouliagos 2017)
In light of the typically high heterogeneity that we observed how should replications in
psychology be interpreted To begin it seems extremely likely that the p-value from any single
non-preregistered non-exact replication study will have nil informative value In the face of high
heterogeneity this is true regardless of the sample size of the replication because it is quite likely
that the replication study will correctly reflect a substantially different true effect than the original
study However individual non-preregistered non-exact replication studies may still contribute to
our collective knowledge when added to a carefully conducted meta-analysis or meta-regression
analysis Meta-analysis moves the focus away from the statistical significance of the single
replication study increases statistical power by pooling across studies allows one to accommodate
and reduce selective reporting bias and meta-regression analysis can use non-exact replications to
POWER BIAS AND HETEROGENEITY
38
help isolate and quantify methodological heterogeneity (eg Stanley amp Doucouliagos 2012
Braver Thoemmes amp Rosenthal 2014 Stanley amp Spence 2014 Fabrigar amp Wegener 2016)
Replication findings from multi-site pre-registered replications clearly offer a different
class of evidence from the single non-pre-registered non-exact replication Statistical power can
be maximized by the pooling of resources across research sites pre-registration is likely to greatly
reduce some types of selective reporting bias and heterogeneity due to obvious methodological
characteristics can be minimized through tightly-controlled study protocols Multi-site pre-
registered replication also allows researchers to directly isolate and quantify the specific
heterogeneity among true effects which remains after methodological heterogeneity is minimized
Such information can provide useful insights about the psychological phenomenon in question
thereby helping to guide and redirect future research and meta-regression analyses
The central implication of our survey is that typically-powered studies in most of areas of
psychology individually or when simply combined into a meta-analysis offer little information
about the magnitude or significance of the phenomenon they examine Our core recommendation
then is that researchers change their expectations about the ease with which convincing evidence
either for or against an effect can be claimed
POWER BIAS AND HETEROGENEITY
39
References
Abramowitz M and IA Stegun (eds) (1964) Handbook of Mathematical Functions with
Formulas Graphs and Mathematical Tables Washington DC US Department of
Commerce
American Psychological Association (2010) Manual of the American Psychological Association
6th ed Washington DC
Asendorpf J B Conner M De Fruyt F De Houwer J Denissen J J Fiedler K amp
Perugini M (2013) Recommendations for increasing replicability in psychology European
Journal of Personality 27(2) 108-119
Baker M (2015) Over half of psychology studies fail reproducibility test Nature News and
Comment August 27 doi101038nature201518248 accessed 8232017
Bakker M van Dijk A amp Wicherts J M (2012) The rules of the game called psychological
science Perspectives on Psychological Science 7(6) 543-554 doi
1011771745691612459060
Bakker M Hartgerink C H Wicherts J M amp van der Maas H L (2016) Researchersrsquo
intuitions about power in psychological research Psychological Science 27(8) 1069-1077 doi
1011770956797616647519
Bohannon J (2015) Reproducibility Many psychology papers fail replication test Science
349910ndash911
Braver SL Thoemmes FJ amp Rosenthal R (2014) Continuously cumulating meta-analysis
and replicability Perspectives on Psychological Science 9 333ndash342 doi
1011771745691614529796
Brodeur A Leacute M Sangnier M amp Zylberberg Y (2016) Star Wars The empirics strike back
American Economic Journal Applied Economics 8 1ndash32 doi 101257app20150044
Bruns S B amp Ioannidis J P A (2016) p-curve and p-hacking in observational research PLoS
ONE 11 e0149144 doi101371journal pone0149144
Button K S Ioannidis J P Mokrysz C Nosek B A Flint J Robinson E S amp Munafograve M
R (2013) Power failure why small sample size undermines the reliability of neuroscience
Nature Reviews Neuroscience 14(5) 365-376 doi101038nrn3475
Cohen J (1962) The statistical power of abnormal-social psychological research A review
Journal of Abnormal and Social Psychology 65 145ndash153
POWER BIAS AND HETEROGENEITY
40
Cohen J (1965) Some statistical issues in psychological research In (BB Wolman ed)
Handbook of Clinical Psychology New York McGraw-Hill pp 95ndash121
Cohen J (1977) Statistical power analysis for the behavioral sciences (2nd ed) New York
Academic Press
Cohen J (1992) A power primer Psychological Bulletin 112 155ndash159
Cooper H M amp Hedges LV (1994) (eds) Handbook of Research Synthesis New York Russell
Sage
Dreber A Pfeiffer T Almenberg J Isaksson S Wilson B Chen Y amp Johannesson M
(2015) Using prediction markets to estimate the reproducibility of scientific research
Proceedings of the National Academy of Sciences 112(50) 15343-47
Eerland A Sherrill A M Magliano J P Zwaan R A Arnal J D Aucoin P amp Prenoveau
J M (2016) Registered replication report Hart amp Albarraciacuten (2011) Perspectives on
Psychological Science 11(1) 158-171 doi 1011771745691615605826
Egger M Smith G D Schneider M amp Minder C (1997) Bias in meta-analysis detected by a
simple graphical test British Medical Journal 315 629ndash634 doi101136bmj3157109629
Engber D (2015) Cover Story Everything is crumbling Slate March 6 Accessed Dec 19
2016
Erica C Y Sprenger A M Thomas R P amp Dougherty M R (2014) When decision heuristics
and science collide Psychonomic Bulletin amp Review 21(2) 268-282 doi103758s13423-013-
0495-z
Fabrigar L R amp Wegener D T (2016) Conceptualizing and evaluating the replication of
research results Journal of Experimental Social Psychology 66 68-80 doi
101016jjesp201507009
Fanelli D (2010) ldquoPositiverdquo results increase down the hierarchy of the sciences PLoS One
5 e10068 doi101371journalpone0010068
Fanelli D Costas R amp Ioannidis J P (2017) Meta-assessment of bias in science Proceedings
of the National Academy of Sciences 201618569 doi101073pnas1618569114
Fiedler K amp Schwarz N (2016) Questionable research practices revisited Social Psychological
and Personality Science 7(1) 45-52 doi 1011771948550615612150
POWER BIAS AND HETEROGENEITY
41
Fraley R C amp Vazire S (2014) The n-pact factor Evaluating the quality of empirical journals
with respect to sample size and statistical power PLoS ONE 9 e109019
doi101371journalpone0109019
Fraley R C amp Marks M J (2007) The null hypothesis significance testing debate and its
implications for personality research In R W Robins R C Fraley amp R F Krueger (Eds)
Handbook of research methods in personality psychology (pp149ndash169) New York Guilford
Franco A Malhotra N amp Simonovits G (2016) Underreporting in psychology experiments
Evidence from a study registry Social Psychological and Personality Science 7(1) 8-12 doi
1011771948550615598377
Gerber A amp Malhotra N (2008) Do statistical reporting standards affect what is published
publication bias in two leading political science journals Quarterly Journal of Political
Science 3 313-326 doi 10156110000008024
Hagger M S Chatzisarantis N L D Alberts H Anggono C O Birt A Brand R amp
Cannon T (2016) A multi-lab preregistered replication of the ego-depletion effect
Perspectives on Psychological Science 11 546ndash573 doi 1011771745691616652873
Hedges L V amp Olkin I (1985) Statistical Methods for Meta-Analysis Academic Press Orlando
Henmi M amp Copas J B (2010) Confidence intervals for random effects meta-analysis and
robustness to publication bias Statistics in Medicine 29 2969ndash2983 doi 101002sim4029
Higgins J P T amp Thompson S G (2002) Quantifying heterogeneity in meta-analysis Statistics
in Medicine 21 1539ndash1558 doi 101002sim1186
Hoenig J M amp Heisey D M (2001) The abuse of power The pervasive fallacy of power
calculations for data analysis American Statistician 55 19ndash24 doi
101198000313001300339897
Inthout J Ioannidis J P A amp Borm G F (2012) Obtaining evidence by a single well-powered
trial or several modestly powered trials Statistical Methods in Medical Research
httpsmmsagepubcomcontentearly201209240962280212461098abstract (Accessed
Aug 16th 2015)
Ioannidis J P A (2005a) Contradicted and initially stronger effects in highly cited clinical
research Journal of the American Medical Association 294 218-228
doi101001jama2942218
POWER BIAS AND HETEROGENEITY
42
Ioannidis J P A (2005b) Why most published research findings are false PLoS Medicine 2
e124 doi101371journalpmed0020124
Ioannidis J P A (2013) Clarifications on the application and interpretation of the test for excess
significance and its extensions Journal of Mathematical Psychology 57 184-187 doi
101016jjmp201303002
Ioannidis J P A Hozo I and Djulbegovic B (2013) Optimal type I and type II error pairs when
the available sample size is fixed Journal of Clinical Epidemiology 66 903-910 doi
101016jjclinepi201303002
Ioannidis J P A Stanley T D amp Doucouliagos C(H) (2017) The power of bias in economics
research The Economic Journal October also as SWP Economics Series 20162
httpwwwdeakineduau__dataassetspdf_file00074777632016_1pdf Deakin University
Australia [Accessed on 27 April 2017]
John L K Loewenstein G amp Prelec D (2012) Measuring the prevalence of questionable
research practices with incentives for truth telling Psychological Science 23 524-532 doi
1011770956797611430953
Klein R A Vianello M Hasselman F Alper S Aveyard M Axt J R amp Nosek B A
(2015) Many Labs 2 Investigating variation in replicability across sample and setting
Manuscript in preparation
Kuumlhberger A Fritz A amp Scherndl T (2014) Publication bias in psychology a diagnosis based
on the correlation between effect size and sample size PloS one 9(9) e105825 doi
101371journalpone0105825
Lakens D (2015) On the challenges of drawing conclusions from p-values just below 005 Peer
J 3e1142 doi 107717peerj1142 PMID 26246976
LeBel E P Borsboom D Giner-Sorolla R Hasselman F Peters K R Ratliff K A amp
Smith C T (2013) PsychDisclosure org Grassroots support for reforming reporting standards
in psychology Perspectives on Psychological Science 8(4) 424-432 doi
1011771745691613491437
LeBel E P Vanpaemel W McCarthy R J Earp B D amp Elson M (2017) A unified
framework to quantify the trustworthiness of empirical research Advances in Methods and
Practices in Psychological Science Retrieved from httpsosfiopreprintspsyarxivuwmr8
8232017
POWER BIAS AND HETEROGENEITY
43
Lindsay D S (2015) Replication in psychological science Psychological Science 26 1827-32
Makel M C Plucker J A amp Hegarty B (2012) Replications in psychology research How
often do they really occur Perspectives on Psychological Science 7(6) 537-542
Maxwell S E (2004) The persistence of underpowered studies in psychological research causes
consequences and remedies Psychological Methods 9 147 doi 1010371082-989X92147
Maxwell S E Lau M Y amp Howard G S (2015) Is psychology suffering from a replication
crisis What does ldquofailure to replicaterdquo really mean American Psychologist 70(6) 487-498
httpdxdoiorg101037a0039400
McShane B B amp Boumlckenholt U (2016) Planning sample sizes when effect sizes are uncertain
The power-calibrated effect size approach Psychological Methods 21(1) 47 doi
101037met0000036
McShane B B Boumlckenholt U amp Hansen K T (2016) Adjusting for publication bias in meta-
analysis An evaluation of selection methods and some cautionary notes Perspectives on
Psychological Science 11 730ndash749 doi 1011771745691616662243
Miguel E amp Christensen G (2017) Transparency reproducibility and the credibility of
economics research Journal of Economic Literature IN PRESS
Moreno S G Sutton A J Ades A E Stanley T D Abrams K R Peters J L Cooper N
J (2009) Assessment of regression-based methods to adjust for publication bias through a
comprehensive simulation study BMC Medical Research Methodology 9 2 doi
1011861471-2288-9-2
Open Science Collaboration (2015) Estimating the reproducibility of psychological science
Science 349(6251) aac4716ndashaac4716 doi101126scienceaac4716
Pashler H amp Harris C (2012) Is the replicability crisis overblown Three arguments examined
Perspectives on Psychological Science 7 531ndash536 doi 1011771745691612463401
Pashler H amp Wagenmakers E J (2012) Editorsrsquo introduction to the special section on
replicability in psychological science a crisis of confidence Perspectives on Psychological
Science 7 528ndash530 doi 1011771745691612465253
Patil P and Leek JT (2015) Reporting of 36 of studies replicate in the media
httpsgithubcomjtleekreplication_paperblobgh-pagesin_the_mediamd[Online up- dated
16-September-2015 accessed 8232017]
POWER BIAS AND HETEROGENEITY
44
Patil P Peng R D amp Leek J T (2016) What should researchers expect when they replicate
studies A statistical view of replicability in psychological science Perspectives on
Psychological Science 11(4) 539-544 doi 1011771745691616646366
Pigott T (2012) Advances in meta-analysis New York NY Springer
Poole C amp Greenland S (1999) Random-effects meta-analyses are not always conservative
American Journal of Epidemiology 150 469ndash475
Popper K (1959) The logic of scientific discovery New York NY Basic Books
Psychonomic Society (2012) New Statistical Guidelines for Journals of the Psychonomic Society
httpwwwpsychonomicorgpagestatisticalguideline (Accessed March 11th 2017)
Rossi J S (1990) Statistical power of psychological research What have we gained in 20 years
Journal of Consulting and Clinical Psychology 58 646ndash656 doi1010370022-
006X585646
Richard F D Bond C F amp Stokes-Zoota J J (2003) One hundred years of social psychology
quantitatively described Review of General Psychology 7 331ndash363
Scargle J D (2000) Publication bias The ldquoFile-Drawerrdquo problem in scientific inference Journal
of Scientific Exploration 14 91ndash106
Schmidt F L amp Hunter J E (2015) Methods of meta-analysis Correcting error and bias in
research findings 3rd ed Los Angeles CA Sage
Schmidt F L amp Oh I -S (2016) The crisis of confidence in research findings in psychology Is
lack of replication the real problem Or something else Archives of Scientific Psychology 4(1)
32ndash37 httpdxdoiorg101037arc0000029
Sedlmeier P amp Gigerenzer G (1989) Do studies of statistical power have an effect on the power
of studies Psychological Bulletin 105 309ndash316
Simmons J P Nelson L D amp Simonsohn U (2011) False-positive psychology Undisclosed
flexibility in data collection and analysis allows presenting anything as significant
Psychological Science 22(11) 1359-1366 doi 1011770956797611417632
Simonsohn U Nelson L D amp Simmons J P (2014) P-curve a key to the file drawer Journal
of Experimental Psychology General 143 534-547 doi 101037a0033242
Stanley D J amp Spence J R (2014) Expectations for replications Are yours realistic
Perspectives on Psychological Science 9 305ndash318 doi 1011771745691614528518
POWER BIAS AND HETEROGENEITY
45
Stanley T D (2008) Meta-regression methods for detecting and estimating empirical effects in
the presence of publication selection Oxford Bulletin of Economics and Statistics 70103-27
doi 101111j1468-0084200700487x
Stanley T D (2017) Limitations of PET-PEESE and other meta-analysis methods Social
Psychology and Personality Science [Epub ahead of print] doi 1011771948550617693062
Stanley T D amp Doucouliagos H(C) 2014 Meta-regression approximations to reduce publication
selection bias Research Synthesis Methods 5 60-78 doi 101002jrsm1095
Stanley T D amp Doucouliagos H(C) 2015 Neither fixed nor random Weighted least squares
meta-analysis Statistics in Medicine 34 2116-27 doi 101002sim6481
Stanley T D amp Doucouliagos H(C) 2017 Neither fixed nor random Weighted least squares
meta-regression analysis Research Synthesis Methods 8 19-42 doi 101002jrsm1211
Stanley T D Doucouliagos H(C) amp Ioannidis J P A 2017 Finding the power to reduce
publication bias Statistics in Medicine [Epub ahead of print] doi 101002sim7228
Sterling T D (1959) Publication decisions and their possible effects on inferences drawn from
tests of significance Or vice versa Journal of the American Statistical Association 54 30ndash34
Sterling T D Rosenbaum W L amp Weinkam J J (1995) Publication decisions revisited The
effect of the outcome of statistical tests on the decision to publish and vice versa American
Statistician 49 108ndash112 doi 1023072684823
Sutton A J Song F Gilbody S M amp Abrams K R (2000) Modelling publication bias in
meta-analysis A review Statistical Methods in Medical Research 9 421-445 doi
101177096228020000900503
Tressoldi P E amp Giofreacute D (2015) The pervasive avoidance of prospective statistical power
Major consequences and practical solutions Frontiers in Psychology 6 726
doi103389fpsyg201500726
van Aert R C M Jelte M Wicherts J M amp van Assen M A L M (2016) Conducting meta-
analyses based on p values Reservations and recommendations for applying p-uniform and p-
curve Perspectives on Psychological Science 11 713ndash729 doi 1011771745691616650874
van Bavel JJ Mende-Siedlecki PBrada WJ and Reinero DA 2016 Contextual sensitivity
in scientific reproducibility Proceedings of the National Academy of Sciences 113 6454ndash59
POWER BIAS AND HETEROGENEITY
46
van Erp S et al (2017) Estimates of between-study heterogeneity for 705 meta-analyses reported
in Psychological Bulletin from 1990ndash2013 Journal of Open Psychology Data 5(1) p4 DOI
httpdoiorg105334jopd33
Wicherts J M Veldkamp C L Augusteijn H E Bakker M van Aert R C amp Van Assen
M A (2016) Degrees of Freedom in Planning Running Analyzing and Reporting
Psychological Studies A Checklist to Avoid p-Hacking Frontiers in Psychology 7 doi
103389fpsyg201601832
Yuan K amp Maxwell S (2005) On the post hoc power in testing mean differences Journal of
Educational and Behavioral Statistics 30 141ndash167 doi 10310210769986030002141
POWER BIAS AND HETEROGENEITY
47
Table 1 Median Statistical Power and Average Effect Sizes
Mean Proportion with Adequate Power Median Power Type of Effect
Absolute Effect Sizes WLS WAAP-WLS PET-PEESE WLS WAAP-WLS PET-PEESE
Combined (n=200)
0389 0077 0071 0091 0364 0331 0360
Correlations (n=108)
0458 0243 0328 0272 0577 0610 0607
SMDs (n=92)
0291 0013 0000 0011 0230 0171 0170
Notes The numbers reported in the table are medians Mean absolute effect sizes are reported in this table in units of standardized mean differences (SMD) regardless of whether they were reported in the meta-analysis as correlations or as SMD WLS is the unrestricted weighted least squares weighted average WAAP-WLS is the weighted average of adequately powered effect sizes (WAAP) or WLS when there are no adequately powered studies PET-PEESE is the conditional precision-effect test-precision-effect estimate with standard error meta-regression correction for publication bias Adequate power is defined as 80 following Cohen (1977)
Table 2 Median Statistical Powers by Experimental Design Proportion with Adequate Power Median Power
Experimental Design WLS WAAP-WLS PET-PEESE WLS WAAP-WLS PET-PEESE
Observational (n=113)
0278 0259 0268 0621 0613 0585
Experimental (n=87)
0032 0000 0053 0247 0232 0236
Notes The numbers reported in the table are medians WLS is the unrestricted weighted least squares weighted average WAAP-WLS is the weighted average of adequately powered effect sizes (WAAP) or WLS when there are no adequately powered studies PET-PEESE is the conditional precision-effect test-precision-effect estimate with standard error meta-regression correction for publication bias Adequate power is defined as 80 following Cohen (1977)
Figure 1 Obtaining adequate power (80)
Notes x is distributed as a standard normal distribution N(01) 196 is the critical value for testing against 0 Figure 1 merely illustrates how the standardized mean of the sampling distribution needs to 28 standard errors away from 0 for an experiment to have adequate powermdashCohenrsquos 80 We thank Stephan Bruns for producing this graph
POWER BIAS AND HETEROGENEITY
49
Figure 2 Histograms of Adequately Powered Estimates from 200 Areas of Research
Notes WLS is the unrestricted weighted least squares weighted average WAAP-WLS is the weighted average of adequately powered effect sizes (WAAP) or WLS when there are no adequately powered studies PET-PEESE is the conditional precision-effect test-precision-effect estimate with standard error meta-regression correction for publication bias Adequate power is defined as 80 following Cohen (1977)
0
20
40
60
80
100
120N
um
ber
of M
eta-
An
alys
es
0 2 4 6 8 1Proportion of Studies Adequately Powered
WLS
0
20
40
60
80
100
120
Nu
mbe
r of
Met
a-A
nal
yses
0 2 4 6 8 1Proportion of Studies Adequately Powered
WAAP-WLS
0
20
40
60
80
100
120
Nu
mbe
r of
Met
a-A
nal
yses
0 2 4 6 8 1Proportion of Studies Adequately Powered
PET-PEESE
POWER BIAS AND HETEROGENEITY
50
Figure 3 Histograms of Median Statistical Power from 200 Areas of Research
Notes WLS is the unrestricted weighted least squares weighted average WAAP-WLS is the weighted average of adequately powered effect sizes (WAAP) or WLS when there are no adequately powered studies PET-PEESE is the conditional precision-effect test-precision-effect estimate with standard error meta-regression correction for publication bias Adequate power is defined as 80 following Cohen (1977)
0
10
20
30
40
50
60N
um
ber
of M
eta-
An
alys
es
0 2 4 6 8 1Median Statistical Power
WLS
0
10
20
30
40
50
60
Nu
mbe
r of
Met
a-A
nal
yses
0 2 4 6 8 1Median Statistical Power
WAAP-WLS
0
10
20
30
40
50
60
70
Nu
mbe
r of
Met
a-A
nal
yses
0 2 4 6 8 1Median Statistical Power
PET-PEESE
Figure 4 Histograms of I2 from 200 Areas of Research
Notes I2 is the proportion of observed variation among reported effect sizes that cannot be explained by the calculated standard errors associated with these reported effect sizes It is a relative measure of heterogeneity
0
5
10
15
20
25
30
35
40
45
0 2 4 6 8 1I-squared
Num
ber o
f Met
a-A
naly
ses
POWER BIAS AND HETEROGENEITY
52
Appendix A Studies included in the meta-meta-analysis
1 Baas M Nijstad B A Boot N C amp De Dreu C K W (2016) Mad genius revisited Vulnerability to psychopathology biobehavioral approach-avoidance and creativity Psychological Bulletin 142 668-692 doi101037bul0000049 [2]
2 Balliet D Li N P Macfarlan S J amp Van Vugt M (2011) Sex differences in cooperation A meta-analytic review of social dilemmas Psychological Bulletin 137 881ndash909 doi 101037a0025354 [1]
3 Balliet D Mulder L B amp Van Lange P A M (2011) Reward punishment and cooperation A meta-analysis Psychological Bulletin 137 594-615 doi 101037a0023489 [2]
4 Balliet D Wu J amp De Dreu C K W (2014) Ingroup favoritism in cooperation A meta-analysis Psychological Bulletin 140 1556-1581 doi 101037a0037737 [1]
5 Brewin C R (2014) Episodic memory perceptual memory and their interaction Foundations for a theory of posttraumatic stress disorder Psychological Bulletin 140 69ndash97 doi 101037a0033722 [1]
6 Byron K amp Khazanchi S (2011) Rewards and creative performance A meta-analytic test of theoretically derived hypotheses Psychological Bulletin 138 809ndash830 [1]
7 Cerasoli C P amp Nicklin J M (2014) Intrinsic motivation and extrinsic incentives jointly predict performance A 40-year meta-analysis Psychological Bulletin 140 980-1008 doi 101037a0035661 [1]
8 Chaplin T M amp Aldao A (2013) Gender differences in emotion expression in children A meta-analytic review Psychological Bulletin 139 735-765 doi 101037a0030737 [4]
9 Defoe I N Dubas JS amp Figner B (2015) A meta-analysis on age differences in risky decision making Adolescents versus children and adults Psychological Bulletin 141 48ndash84 doi 101037a0038088 [4]
10 Degner J amp Dalege J (2013) The apple does not fall far from the tree or does it A meta-analysis of parentndashchild similarity in intergroup attitudes Psychological Bulletin 139 1270ndash1304 doi 101037a0031436 [1]
11 Eastwick P W Finkel E J Luchies L B amp Hunt L L (2014) The predictive validity of ideal partner preferences A review and meta-analysis Psychological Bulletin 140 623ndash 665 doi 101037a0032432 [4]
12 Else-Quest N M Higgins A Allison C amp Morton L C (2012) Gender differences in self-conscious emotional experience Psychological Bulletin 138 947ndash981 doi101037a0027930 [5]
13 Fairbairn C E amp Sayette M A (2014) A social-attributional analysis of alcohol response Psychological Bulletin 140 1361-82 doi 101037a0037563 [4]
14 Fischer P Krueger J I Greitemeyer T Vogrincic C Kastenmuumlller A Frey D Heene M Wicher M amp Kainbacher M (2011) The bystander-effect A meta-analytic review on bystander intervention in dangerous and non-dangerous emergencies Psychological Bulletin 137 517ndash537 doi 101037a0023304 [1]
POWER BIAS AND HETEROGENEITY
53
15 Fox MC Ericsson A amp Best (2011) Do procedures for verbal reporting of thinking have to be reactive A meta-analysis and recommendations for best reporting methods Psychological Bulletin 137 316 ndash344 doi 101037a0021663 [2]
16 Fox N A You K H Bowman L C Cannon E N Ferrari P F Bakermans-Kranenburg M J Vanderwert R E amp van IJzendoorn M H (2016) Assessing human mirror activity with EEG mu rhythm A meta-analysis Psychological Bulletin 142 291ndash313 doi101037bul0000031 [2]
17 Freund P A amp Kasten N (2012) How smart do you think you are A meta-analysis on the validity of self-estimates of cognitive ability Psychological Bulletin 138 296-321 doi101037a0026556 [1]
18 Grijalva E Newman D A Tay L Donnellan M B Harms P D amp Robins R W (2015) Gender differences in narcissism A meta-analytic review Psychological Bulletin 141 261-310 doi 101037a0038231 [3]
19 Haedt-Matt A A amp Keel P K (2011) Revisiting the affect regulation model of binge eating A meta-analysis of studies using ecological momentary assessment Psychological Bulletin 137 660ndash681 doi 101037a0023660 [3]
20 Harkin B Webb T L Prestwich A Conner M Kellar I Benn Y amp Sheeran P (2016) Does monitoring goal progress promote goal attainment A meta-analysis of the experimental evidence Psychological Bulletin 142 198-229 doi 101037bul0000025 [2]
21 Houben M Van Den Noortgate W amp Kuppens P (2015) The relation between short-term emotion dynamics and psychological well-being A meta-analysis Psychological Bulletin 141 901-930 doi101037a0038822 [4]
22 Johnsen T J amp Friborg O (2015) The effects of cognitive behavioral therapy as an anti-depressive treatment is falling A meta-analysis Psychological Bulletin 141 747-768 [2]
23 Karlin B Zinger J F amp Ford R (2015) The effects of feedback on energy conservation A meta-analysis Psychological Bulletin 141 1205-1227 doi 101037a0039650 [1]
24 Kim S Thibodeau R amp Jorgensen R S (2011) Shame guilt and depressive symptoms A meta-analytic review Psychological Bulletin 137 68 ndash96 doi 101037a0021466 [2]
25 Klahr A M amp Burt S A (2014) Elucidating the etiology of individual differences in parenting A meta-analysis of behavioral genetic research Psychological Bulletin 140 544ndash586 doi 101037a0034205 [6]
26 Koenig A M Eagly A H Mitchell A A amp Ristikari T (2011) Are leader stereotypes masculine A meta-analysis of three research paradigms Psychological Bulletin 137 616 ndash 642 doi 101037a0023557 [4]
27 Kredlow M A Unger L D amp Otto M W (2016) Harnessing reconsolidation to weaken fear and appetitive memories A meta-analysis of post-retrieval extinction effects Psychological Bulletin 142 314ndash336 doi 101037bul0000034 [3]
28 Kuykendall L Tay L amp Ng V (2015) Leisure engagement and subjective well-being A meta-analysis Psychological Bulletin 141 364-403 doi101037a0038508 [3]
29 Landau M J amp Kay A C (2015) Compensatory control and the appeal of a structured world Psychological Bulletin 141 694ndash722 doi 101037a0038703 [1]
30 Lee E-S Park T-Y amp Koo B (2015) Identifying organizational identification as a basis for attitudes and behaviors A meta-analytic review Psychological Bulletin 141 1049ndash1080 doi 101037bul0000012 [1]
POWER BIAS AND HETEROGENEITY
54
31 Lui P P (2015) Intergenerational cultural conflict mental health and educational outcomes among Asian and Latinoa Americans Qualitative and meta-analytic review Psychological Bulletin 141 404-446 doi101037a0038449 [3]
32 Lull R B amp Bushman B J (2015) Do sex and violence sell A meta-analytic review of the effects of sexual and violent media and ad content on memory attitudes and buying intentions Psychological Bulletin 141 1022ndash1048 doi 101037bul0000018 [6]
33 Mazei J Freund P A Huumlffmeier J amp Stuhlmacher A F (2015) A meta-analysis on gender differences in negotiation outcomes and their moderators Psychological Bulletin 141 85ndash104 doi 101037a0038184 [1]
34 Melby-Lervaringg M Lyster S A amp Hulme C (2012) Phonological skills and their role in learning to read A meta-analytic review Psychological Bulletin 138 322ndash352 doi 101037a0026744 [3]
35 Melby-Lervaringg M amp Lervaringg A (2014) Reading comprehension and its underlying components in second-language learners A meta-analysis of studies comparing first- and second-language learners Psychological Bulletin 140 409ndash433 doi 101037a0033890
[4] 36 Mendelson J L Gates J A amp Lerner M D (2016) Friendship in school-age boys with
autism spectrum disorders A meta-analytic summary and developmental process-based model Psychological Bulletin 142 601-622 doi 101037bul0000041 [2]
37 Mol S E amp Bus A G (2011) To read or not to read A meta-analysis of print exposure from infancy to early adulthood Psychological Bulletin 137 267ndash296 doi 101037a0021890 [13]
38 Orquin J L amp Kurzban R (2016) A meta-analysis of blood glucose effects on human decision making Psychological Bulletin 142 546ndash567 doi 101037bul0000035 [1]
39 Ottaviani C Verkuil B Medea B Couyoumdjian A Thayer JF Lonigro A amp Brosschot J F (2016) Physiological concomitants of perseverative cognition A systematic review and meta-analysis Psychological Bulletin 142 No 3 231ndash259 doi 101037bul0000036 [8]
40 North M S amp Fiske S T (2015) Modern attitudes toward older adults in the aging world A cross-cultural meta-analysis Psychological Bulletin 141 993ndash1021 doi 101037a0039469 [1]
41 Pahlke E Hyde J S amp Allison C M (2014) The effects of single-sex compared with coeducational schooling on studentsrsquo performance and attitudes A meta-analysis Psychological Bulletin 140 1042-1072 doi 101037a0035740 [2]
42 Pan S C amp Rickard T C (2015) Sleep and motor learning Is there room for consolidation Psychological Bulletin 141 812-834 doi 101037bul0000009 [1]
43 Phillips W J Fletcher J M Marks A D G amp Hine D W (2016) Thinking styles and decision making A meta-analysis Psychological Bulletin 142 No 3 260ndash290 doi 101037bul0000027 [4]
44 Pool E Brosch T Delplanque S amp Sander D (2016) Attentional bias for positive emotional stimuli A meta-analytic investigation Psychological Bulletin 142 No 1 79ndash106 doi 101037bul0000026 [1]
45 Randall J G Oswald F L amp Beier M E (2014) Mind-wandering cognition and performance A theory-driven meta-analysis of attention regulation Psychological Bulletin 140 1411ndash1431 doi 101037a0037428 [4]
POWER BIAS AND HETEROGENEITY
55
46 Sambrook T D amp Goslin J (2015) A neural reward prediction error revealed by a meta-analysis of ERPs using great grand averages Psychological Bulletin 141 213ndash235 doi 101037bul0000006 [4]
47 Sedlmeier P Eberth J Schwarz M Zimmermann D Haarig F Jaeger S amp Kunze S (2012) The psychological effects of meditation A meta-analysis Psychological Bulletin 138 1139ndash1171 doi 101037a0028168 [20]
48 Sheeran P Harris P R and Epton T (2014) Does heightening risk appraisals change peoplersquos intentions and behavior A meta-analysis of experimental studies Psychological Bulletin 140 511ndash543 doi 101037a0033065 [2]
49 Smith S F amp Lilienfeld S O (2015) The response modulation hypothesis of psychopathy A meta-analytic and narrative analysis Psychological Bulletin 141 1145ndash1177 doi 101037bul0000024 [1]
50 Soderberg C K Amit E Callahan S P Kochersberger A O amp Ledgerwood A (2015) The effects of psychological distance on abstraction Two meta-analyses Psychological Bulletin 141 3 525ndash548 doi101037bul0000005 [2]
51 Tannenbaum M B Hepler J Zimmerman R S Saul L Jacobs S Wilson K amp Albarraciacuten D Appealing to fear A meta-analysis of fear appeal effectiveness and theories Psychological Bulletin 141 1178ndash1204 doi101037a0039729 [1]
52 Toosi N R Babbitt L G Ambady N amp Sommers SR (2012) Dyadic interracial interactions A meta-analysis Psychological Bulletin 138 1ndash27 doi 101037a0025767 [4]
53 Vachon D D Lynam D R amp Johnson J A (2014) The (Non)relation between empathy and aggression Surprising results from a meta-analysis Psychological Bulletin 140 751ndash773 doi 101037a0035236 [1]
54 Verhage M L Schuengel C Madigan S Fearon R M P Oosterman M Cassibba R Bakermans-Kranenburg M J amp van IJzendoorn M H (2016) Narrowing the transmission gap A synthesis of three decades of research on intergenerational transmission of attachment Psychological Bulletin 142 337ndash366 doi 101037bul0000038 [2]
55 von Stumm S amp Ackerman P L (2013) Investment and intellect A review and meta-analysis Psychological Bulletin 139 841ndash869 doi 101037a0030746 [11]
56 Voyer D amp Voyer S D (2014) Gender differences in scholastic achievement A meta-analysis Psychological Bulletin 140 1174-1204 doi 101037a0036620 [6]
57 Vucasović T amp Bratko D (2015) Heritability of personality A meta-analysis of behavior genetic studies Psychological Bulletin 141 769ndash785 doi101037bul0000017 [1]
58 Wanberg C R Hamann D J Kanfer R amp Zhang Z (2016) Age and reemployment success after job loss An integrative model and meta-analysis Psychological Bulletin 142 400-426 doi 101037bul0000019 [6]
59 Weingarten E Chen Q McAdams M Yi J amp Hepler J (2016) From primed concepts to action A meta-analysis of the behavioral effects of incidentally presented words Psychological Bulletin 142 472ndash497 doi 101037bul0000030 [1]
60 Williams M J amp Tiedens L Z (2016) The subtle suspension of backlash A meta-analysis of penalties for womenrsquos implicit and explicit dominance behaviour Psychological Bulletin 142 165ndash197 doi 101037bul0000039 [6]
POWER BIAS AND HETEROGENEITY
56
61 Winer E S amp Salem T (2016) Reward devaluation Dot-probe meta-analytic evidence of avoidance of positive information in depressed persons Psychological Bulletin 142 18ndash78 doi 101037bul0000022 [6]
Notes Numbers in square brackets denote the number of meta-analyses included in the dataset
Appendix B Distribution of survey estimates
Year
No of meta-analyses published
No of meta-analyses sampled
of published meta-studies
No of estimates
of sample
2016 17 14 82 46 22 2015 22 18 82 40 19 2014 25 12 48 46 22 2013 17 3 18 16 8 2012 15 6 40 34 16 2011 19 8 42 31 15

POWER BIAS AND HETEROGENEITY
35
the acceptable difference for a successful replication is set at less than 035 SMD Needless to say
if we have less-than-ideal sample sizes the resulting added sampling error will reduce the
probability of a successful replication further Thus high heterogeneity further explains the failure
of the Open Science Collaboration (2015) to find reliable indicators of replication success
There are important caveats to these calculations of replication success that need to be
mentioned First there is a wide distribution of observed heterogeneity among these areas of
psychological researchmdashsee Figure 4 Twenty-two percent have I2s that are less than 50 while
47 have I2 values 75 or higher and one out of seven have excess heterogeneity of 90 or more
Thus successful replication will be more likely in some areas of research but much less likely in
others Second these calculations assume that the typical heterogeneity observed in this research
record is entirely heterogeneity among lsquotruersquo effects that is variation beyond the control of
researchers Because exact replication is rare in psychology some of this observed heterogeneity
will be due to variation in experimental conditions measures methods and the characteristics of
the population from which the samples are drawn Thus a careful exact replication study could
avoid a notable amount of this variation in expected effect by carefully duplicating all of the
controllable features of the experimental design execution and evaluation However those large-
scale efforts to control these controllable research dimensions still find that notable heterogeneity
remains (Hagger et al 2016 Eerland et al 2016 Klein et al 2015) Moreover if half the
observed heterogeneity variance is due to differences that are under the control of the researcher19
then our estimate of the typical standard deviation due this uncontrollable heterogeneity among
true effects would be reduced to 025 In which case the probability that the largest possible
19 The typical heterogeneity found by two large replication studies that attempted to be as exact as possible is larger than half of the median heterogeneity that our survey finds (Hagger et al 2016 Eerland et al 2016)
POWER BIAS AND HETEROGENEITY
36
replication study will find a negligible zero or opposite-signed effect declines to 22 28 for a
medium effect and it will find a large effect only about 5 of the time Even if half of the observed
heterogeneity among reported effects is under the researcherrsquos control the probability that any
replication effort successfully replicates a small effect (recall 0389 is our surveyrsquos median effect
size) remains less than 50
Conclusions
Our survey of 12065 estimated effect sizes from nearly as many studies and 8000 papers
finds that lsquofailedrsquo replicationsmdashdefined here in terms of null hypothesis significance testingmdash are
to be expected at a rate consistent with the widely publicized the Reproducibility Project
Psychology (Open Science Collaboration 2015) Like many other researchers we find that
statistical power is chronically low in research in psychology (Cohen 1962 Cohen 1977
Sedlmeier amp Gigerenzer 1989 Rossi 1990 Maxwell 2004 Pashler amp Wagenmakers 2012
Fraley amp Vazire 2014 Tressoldi amp Giofreacute 2015) Unlike this previous research however our
survey reveals a more severe challenge for replication High levels of heterogeneity are evidently
the norm in psychology (median I2 =74) As discussed above heterogeneity this large makes
successful replication difficult whether defined in terms of hypothesis testing or estimation
precision This high heterogeneity will of course be due in part to methodological differences
between the different studies in each of the 200 meta-analyses that we survey However data from
multi-site registered replication efforts further suggest that when obvious methodological
differences are removed (ie when lsquoexactrsquo replications are conducted) heterogeneity is not
reduced to negligible levels In other words it is unrealistic to believe that variance in
POWER BIAS AND HETEROGENEITY
37
psychological phenomena studied can always be tightly controlled or reduced to practically
insignificant levels
Perhaps more surprising is our finding that there is relatively small exaggeration or overall
selective reporting bias in recent psychological research This is in contrast to the view that
publication bias and questionable research practices are the primary cause of failed replications
Of course as mentioned above there are good reasons to be cautious in applying this hopeful
result to any individual area of research In particular 275 of these areas of research produce a
significant Eggerrsquos test for publication bias (or small-sample bias) and this test is known to have
low power Our survey merely implies that the effects of selective reporting bias (ie publication
bias small-sample biases p-hacking andor questionable research practices) have a less clear
pattern than is maybe assumed by some researchers and by what has been observed in other fields
(eg economics Ioannidis Stanley and Doucouliagos 2017)
In light of the typically high heterogeneity that we observed how should replications in
psychology be interpreted To begin it seems extremely likely that the p-value from any single
non-preregistered non-exact replication study will have nil informative value In the face of high
heterogeneity this is true regardless of the sample size of the replication because it is quite likely
that the replication study will correctly reflect a substantially different true effect than the original
study However individual non-preregistered non-exact replication studies may still contribute to
our collective knowledge when added to a carefully conducted meta-analysis or meta-regression
analysis Meta-analysis moves the focus away from the statistical significance of the single
replication study increases statistical power by pooling across studies allows one to accommodate
and reduce selective reporting bias and meta-regression analysis can use non-exact replications to
POWER BIAS AND HETEROGENEITY
38
help isolate and quantify methodological heterogeneity (eg Stanley amp Doucouliagos 2012
Braver Thoemmes amp Rosenthal 2014 Stanley amp Spence 2014 Fabrigar amp Wegener 2016)
Replication findings from multi-site pre-registered replications clearly offer a different
class of evidence from the single non-pre-registered non-exact replication Statistical power can
be maximized by the pooling of resources across research sites pre-registration is likely to greatly
reduce some types of selective reporting bias and heterogeneity due to obvious methodological
characteristics can be minimized through tightly-controlled study protocols Multi-site pre-
registered replication also allows researchers to directly isolate and quantify the specific
heterogeneity among true effects which remains after methodological heterogeneity is minimized
Such information can provide useful insights about the psychological phenomenon in question
thereby helping to guide and redirect future research and meta-regression analyses
The central implication of our survey is that typically-powered studies in most of areas of
psychology individually or when simply combined into a meta-analysis offer little information
about the magnitude or significance of the phenomenon they examine Our core recommendation
then is that researchers change their expectations about the ease with which convincing evidence
either for or against an effect can be claimed
POWER BIAS AND HETEROGENEITY
39
References
Abramowitz M and IA Stegun (eds) (1964) Handbook of Mathematical Functions with
Formulas Graphs and Mathematical Tables Washington DC US Department of
Commerce
American Psychological Association (2010) Manual of the American Psychological Association
6th ed Washington DC
Asendorpf J B Conner M De Fruyt F De Houwer J Denissen J J Fiedler K amp
Perugini M (2013) Recommendations for increasing replicability in psychology European
Journal of Personality 27(2) 108-119
Baker M (2015) Over half of psychology studies fail reproducibility test Nature News and
Comment August 27 doi101038nature201518248 accessed 8232017
Bakker M van Dijk A amp Wicherts J M (2012) The rules of the game called psychological
science Perspectives on Psychological Science 7(6) 543-554 doi
1011771745691612459060
Bakker M Hartgerink C H Wicherts J M amp van der Maas H L (2016) Researchersrsquo
intuitions about power in psychological research Psychological Science 27(8) 1069-1077 doi
1011770956797616647519
Bohannon J (2015) Reproducibility Many psychology papers fail replication test Science
349910ndash911
Braver SL Thoemmes FJ amp Rosenthal R (2014) Continuously cumulating meta-analysis
and replicability Perspectives on Psychological Science 9 333ndash342 doi
1011771745691614529796
Brodeur A Leacute M Sangnier M amp Zylberberg Y (2016) Star Wars The empirics strike back
American Economic Journal Applied Economics 8 1ndash32 doi 101257app20150044
Bruns S B amp Ioannidis J P A (2016) p-curve and p-hacking in observational research PLoS
ONE 11 e0149144 doi101371journal pone0149144
Button K S Ioannidis J P Mokrysz C Nosek B A Flint J Robinson E S amp Munafograve M
R (2013) Power failure why small sample size undermines the reliability of neuroscience
Nature Reviews Neuroscience 14(5) 365-376 doi101038nrn3475
Cohen J (1962) The statistical power of abnormal-social psychological research A review
Journal of Abnormal and Social Psychology 65 145ndash153
POWER BIAS AND HETEROGENEITY
40
Cohen J (1965) Some statistical issues in psychological research In (BB Wolman ed)
Handbook of Clinical Psychology New York McGraw-Hill pp 95ndash121
Cohen J (1977) Statistical power analysis for the behavioral sciences (2nd ed) New York
Academic Press
Cohen J (1992) A power primer Psychological Bulletin 112 155ndash159
Cooper H M amp Hedges LV (1994) (eds) Handbook of Research Synthesis New York Russell
Sage
Dreber A Pfeiffer T Almenberg J Isaksson S Wilson B Chen Y amp Johannesson M
(2015) Using prediction markets to estimate the reproducibility of scientific research
Proceedings of the National Academy of Sciences 112(50) 15343-47
Eerland A Sherrill A M Magliano J P Zwaan R A Arnal J D Aucoin P amp Prenoveau
J M (2016) Registered replication report Hart amp Albarraciacuten (2011) Perspectives on
Psychological Science 11(1) 158-171 doi 1011771745691615605826
Egger M Smith G D Schneider M amp Minder C (1997) Bias in meta-analysis detected by a
simple graphical test British Medical Journal 315 629ndash634 doi101136bmj3157109629
Engber D (2015) Cover Story Everything is crumbling Slate March 6 Accessed Dec 19
2016
Erica C Y Sprenger A M Thomas R P amp Dougherty M R (2014) When decision heuristics
and science collide Psychonomic Bulletin amp Review 21(2) 268-282 doi103758s13423-013-
0495-z
Fabrigar L R amp Wegener D T (2016) Conceptualizing and evaluating the replication of
research results Journal of Experimental Social Psychology 66 68-80 doi
101016jjesp201507009
Fanelli D (2010) ldquoPositiverdquo results increase down the hierarchy of the sciences PLoS One
5 e10068 doi101371journalpone0010068
Fanelli D Costas R amp Ioannidis J P (2017) Meta-assessment of bias in science Proceedings
of the National Academy of Sciences 201618569 doi101073pnas1618569114
Fiedler K amp Schwarz N (2016) Questionable research practices revisited Social Psychological
and Personality Science 7(1) 45-52 doi 1011771948550615612150
POWER BIAS AND HETEROGENEITY
41
Fraley R C amp Vazire S (2014) The n-pact factor Evaluating the quality of empirical journals
with respect to sample size and statistical power PLoS ONE 9 e109019
doi101371journalpone0109019
Fraley R C amp Marks M J (2007) The null hypothesis significance testing debate and its
implications for personality research In R W Robins R C Fraley amp R F Krueger (Eds)
Handbook of research methods in personality psychology (pp149ndash169) New York Guilford
Franco A Malhotra N amp Simonovits G (2016) Underreporting in psychology experiments
Evidence from a study registry Social Psychological and Personality Science 7(1) 8-12 doi
1011771948550615598377
Gerber A amp Malhotra N (2008) Do statistical reporting standards affect what is published
publication bias in two leading political science journals Quarterly Journal of Political
Science 3 313-326 doi 10156110000008024
Hagger M S Chatzisarantis N L D Alberts H Anggono C O Birt A Brand R amp
Cannon T (2016) A multi-lab preregistered replication of the ego-depletion effect
Perspectives on Psychological Science 11 546ndash573 doi 1011771745691616652873
Hedges L V amp Olkin I (1985) Statistical Methods for Meta-Analysis Academic Press Orlando
Henmi M amp Copas J B (2010) Confidence intervals for random effects meta-analysis and
robustness to publication bias Statistics in Medicine 29 2969ndash2983 doi 101002sim4029
Higgins J P T amp Thompson S G (2002) Quantifying heterogeneity in meta-analysis Statistics
in Medicine 21 1539ndash1558 doi 101002sim1186
Hoenig J M amp Heisey D M (2001) The abuse of power The pervasive fallacy of power
calculations for data analysis American Statistician 55 19ndash24 doi
101198000313001300339897
Inthout J Ioannidis J P A amp Borm G F (2012) Obtaining evidence by a single well-powered
trial or several modestly powered trials Statistical Methods in Medical Research
httpsmmsagepubcomcontentearly201209240962280212461098abstract (Accessed
Aug 16th 2015)
Ioannidis J P A (2005a) Contradicted and initially stronger effects in highly cited clinical
research Journal of the American Medical Association 294 218-228
doi101001jama2942218
POWER BIAS AND HETEROGENEITY
42
Ioannidis J P A (2005b) Why most published research findings are false PLoS Medicine 2
e124 doi101371journalpmed0020124
Ioannidis J P A (2013) Clarifications on the application and interpretation of the test for excess
significance and its extensions Journal of Mathematical Psychology 57 184-187 doi
101016jjmp201303002
Ioannidis J P A Hozo I and Djulbegovic B (2013) Optimal type I and type II error pairs when
the available sample size is fixed Journal of Clinical Epidemiology 66 903-910 doi
101016jjclinepi201303002
Ioannidis J P A Stanley T D amp Doucouliagos C(H) (2017) The power of bias in economics
research The Economic Journal October also as SWP Economics Series 20162
httpwwwdeakineduau__dataassetspdf_file00074777632016_1pdf Deakin University
Australia [Accessed on 27 April 2017]
John L K Loewenstein G amp Prelec D (2012) Measuring the prevalence of questionable
research practices with incentives for truth telling Psychological Science 23 524-532 doi
1011770956797611430953
Klein R A Vianello M Hasselman F Alper S Aveyard M Axt J R amp Nosek B A
(2015) Many Labs 2 Investigating variation in replicability across sample and setting
Manuscript in preparation
Kuumlhberger A Fritz A amp Scherndl T (2014) Publication bias in psychology a diagnosis based
on the correlation between effect size and sample size PloS one 9(9) e105825 doi
101371journalpone0105825
Lakens D (2015) On the challenges of drawing conclusions from p-values just below 005 Peer
J 3e1142 doi 107717peerj1142 PMID 26246976
LeBel E P Borsboom D Giner-Sorolla R Hasselman F Peters K R Ratliff K A amp
Smith C T (2013) PsychDisclosure org Grassroots support for reforming reporting standards
in psychology Perspectives on Psychological Science 8(4) 424-432 doi
1011771745691613491437
LeBel E P Vanpaemel W McCarthy R J Earp B D amp Elson M (2017) A unified
framework to quantify the trustworthiness of empirical research Advances in Methods and
Practices in Psychological Science Retrieved from httpsosfiopreprintspsyarxivuwmr8
8232017
POWER BIAS AND HETEROGENEITY
43
Lindsay D S (2015) Replication in psychological science Psychological Science 26 1827-32
Makel M C Plucker J A amp Hegarty B (2012) Replications in psychology research How
often do they really occur Perspectives on Psychological Science 7(6) 537-542
Maxwell S E (2004) The persistence of underpowered studies in psychological research causes
consequences and remedies Psychological Methods 9 147 doi 1010371082-989X92147
Maxwell S E Lau M Y amp Howard G S (2015) Is psychology suffering from a replication
crisis What does ldquofailure to replicaterdquo really mean American Psychologist 70(6) 487-498
httpdxdoiorg101037a0039400
McShane B B amp Boumlckenholt U (2016) Planning sample sizes when effect sizes are uncertain
The power-calibrated effect size approach Psychological Methods 21(1) 47 doi
101037met0000036
McShane B B Boumlckenholt U amp Hansen K T (2016) Adjusting for publication bias in meta-
analysis An evaluation of selection methods and some cautionary notes Perspectives on
Psychological Science 11 730ndash749 doi 1011771745691616662243
Miguel E amp Christensen G (2017) Transparency reproducibility and the credibility of
economics research Journal of Economic Literature IN PRESS
Moreno S G Sutton A J Ades A E Stanley T D Abrams K R Peters J L Cooper N
J (2009) Assessment of regression-based methods to adjust for publication bias through a
comprehensive simulation study BMC Medical Research Methodology 9 2 doi
1011861471-2288-9-2
Open Science Collaboration (2015) Estimating the reproducibility of psychological science
Science 349(6251) aac4716ndashaac4716 doi101126scienceaac4716
Pashler H amp Harris C (2012) Is the replicability crisis overblown Three arguments examined
Perspectives on Psychological Science 7 531ndash536 doi 1011771745691612463401
Pashler H amp Wagenmakers E J (2012) Editorsrsquo introduction to the special section on
replicability in psychological science a crisis of confidence Perspectives on Psychological
Science 7 528ndash530 doi 1011771745691612465253
Patil P and Leek JT (2015) Reporting of 36 of studies replicate in the media
httpsgithubcomjtleekreplication_paperblobgh-pagesin_the_mediamd[Online up- dated
16-September-2015 accessed 8232017]
POWER BIAS AND HETEROGENEITY
44
Patil P Peng R D amp Leek J T (2016) What should researchers expect when they replicate
studies A statistical view of replicability in psychological science Perspectives on
Psychological Science 11(4) 539-544 doi 1011771745691616646366
Pigott T (2012) Advances in meta-analysis New York NY Springer
Poole C amp Greenland S (1999) Random-effects meta-analyses are not always conservative
American Journal of Epidemiology 150 469ndash475
Popper K (1959) The logic of scientific discovery New York NY Basic Books
Psychonomic Society (2012) New Statistical Guidelines for Journals of the Psychonomic Society
httpwwwpsychonomicorgpagestatisticalguideline (Accessed March 11th 2017)
Rossi J S (1990) Statistical power of psychological research What have we gained in 20 years
Journal of Consulting and Clinical Psychology 58 646ndash656 doi1010370022-
006X585646
Richard F D Bond C F amp Stokes-Zoota J J (2003) One hundred years of social psychology
quantitatively described Review of General Psychology 7 331ndash363
Scargle J D (2000) Publication bias The ldquoFile-Drawerrdquo problem in scientific inference Journal
of Scientific Exploration 14 91ndash106
Schmidt F L amp Hunter J E (2015) Methods of meta-analysis Correcting error and bias in
research findings 3rd ed Los Angeles CA Sage
Schmidt F L amp Oh I -S (2016) The crisis of confidence in research findings in psychology Is
lack of replication the real problem Or something else Archives of Scientific Psychology 4(1)
32ndash37 httpdxdoiorg101037arc0000029
Sedlmeier P amp Gigerenzer G (1989) Do studies of statistical power have an effect on the power
of studies Psychological Bulletin 105 309ndash316
Simmons J P Nelson L D amp Simonsohn U (2011) False-positive psychology Undisclosed
flexibility in data collection and analysis allows presenting anything as significant
Psychological Science 22(11) 1359-1366 doi 1011770956797611417632
Simonsohn U Nelson L D amp Simmons J P (2014) P-curve a key to the file drawer Journal
of Experimental Psychology General 143 534-547 doi 101037a0033242
Stanley D J amp Spence J R (2014) Expectations for replications Are yours realistic
Perspectives on Psychological Science 9 305ndash318 doi 1011771745691614528518
POWER BIAS AND HETEROGENEITY
45
Stanley T D (2008) Meta-regression methods for detecting and estimating empirical effects in
the presence of publication selection Oxford Bulletin of Economics and Statistics 70103-27
doi 101111j1468-0084200700487x
Stanley T D (2017) Limitations of PET-PEESE and other meta-analysis methods Social
Psychology and Personality Science [Epub ahead of print] doi 1011771948550617693062
Stanley T D amp Doucouliagos H(C) 2014 Meta-regression approximations to reduce publication
selection bias Research Synthesis Methods 5 60-78 doi 101002jrsm1095
Stanley T D amp Doucouliagos H(C) 2015 Neither fixed nor random Weighted least squares
meta-analysis Statistics in Medicine 34 2116-27 doi 101002sim6481
Stanley T D amp Doucouliagos H(C) 2017 Neither fixed nor random Weighted least squares
meta-regression analysis Research Synthesis Methods 8 19-42 doi 101002jrsm1211
Stanley T D Doucouliagos H(C) amp Ioannidis J P A 2017 Finding the power to reduce
publication bias Statistics in Medicine [Epub ahead of print] doi 101002sim7228
Sterling T D (1959) Publication decisions and their possible effects on inferences drawn from
tests of significance Or vice versa Journal of the American Statistical Association 54 30ndash34
Sterling T D Rosenbaum W L amp Weinkam J J (1995) Publication decisions revisited The
effect of the outcome of statistical tests on the decision to publish and vice versa American
Statistician 49 108ndash112 doi 1023072684823
Sutton A J Song F Gilbody S M amp Abrams K R (2000) Modelling publication bias in
meta-analysis A review Statistical Methods in Medical Research 9 421-445 doi
101177096228020000900503
Tressoldi P E amp Giofreacute D (2015) The pervasive avoidance of prospective statistical power
Major consequences and practical solutions Frontiers in Psychology 6 726
doi103389fpsyg201500726
van Aert R C M Jelte M Wicherts J M amp van Assen M A L M (2016) Conducting meta-
analyses based on p values Reservations and recommendations for applying p-uniform and p-
curve Perspectives on Psychological Science 11 713ndash729 doi 1011771745691616650874
van Bavel JJ Mende-Siedlecki PBrada WJ and Reinero DA 2016 Contextual sensitivity
in scientific reproducibility Proceedings of the National Academy of Sciences 113 6454ndash59
POWER BIAS AND HETEROGENEITY
46
van Erp S et al (2017) Estimates of between-study heterogeneity for 705 meta-analyses reported
in Psychological Bulletin from 1990ndash2013 Journal of Open Psychology Data 5(1) p4 DOI
httpdoiorg105334jopd33
Wicherts J M Veldkamp C L Augusteijn H E Bakker M van Aert R C amp Van Assen
M A (2016) Degrees of Freedom in Planning Running Analyzing and Reporting
Psychological Studies A Checklist to Avoid p-Hacking Frontiers in Psychology 7 doi
103389fpsyg201601832
Yuan K amp Maxwell S (2005) On the post hoc power in testing mean differences Journal of
Educational and Behavioral Statistics 30 141ndash167 doi 10310210769986030002141
POWER BIAS AND HETEROGENEITY
47
Table 1 Median Statistical Power and Average Effect Sizes
Mean Proportion with Adequate Power Median Power Type of Effect
Absolute Effect Sizes WLS WAAP-WLS PET-PEESE WLS WAAP-WLS PET-PEESE
Combined (n=200)
0389 0077 0071 0091 0364 0331 0360
Correlations (n=108)
0458 0243 0328 0272 0577 0610 0607
SMDs (n=92)
0291 0013 0000 0011 0230 0171 0170
Notes The numbers reported in the table are medians Mean absolute effect sizes are reported in this table in units of standardized mean differences (SMD) regardless of whether they were reported in the meta-analysis as correlations or as SMD WLS is the unrestricted weighted least squares weighted average WAAP-WLS is the weighted average of adequately powered effect sizes (WAAP) or WLS when there are no adequately powered studies PET-PEESE is the conditional precision-effect test-precision-effect estimate with standard error meta-regression correction for publication bias Adequate power is defined as 80 following Cohen (1977)
Table 2 Median Statistical Powers by Experimental Design Proportion with Adequate Power Median Power
Experimental Design WLS WAAP-WLS PET-PEESE WLS WAAP-WLS PET-PEESE
Observational (n=113)
0278 0259 0268 0621 0613 0585
Experimental (n=87)
0032 0000 0053 0247 0232 0236
Notes The numbers reported in the table are medians WLS is the unrestricted weighted least squares weighted average WAAP-WLS is the weighted average of adequately powered effect sizes (WAAP) or WLS when there are no adequately powered studies PET-PEESE is the conditional precision-effect test-precision-effect estimate with standard error meta-regression correction for publication bias Adequate power is defined as 80 following Cohen (1977)
Figure 1 Obtaining adequate power (80)
Notes x is distributed as a standard normal distribution N(01) 196 is the critical value for testing against 0 Figure 1 merely illustrates how the standardized mean of the sampling distribution needs to 28 standard errors away from 0 for an experiment to have adequate powermdashCohenrsquos 80 We thank Stephan Bruns for producing this graph
POWER BIAS AND HETEROGENEITY
49
Figure 2 Histograms of Adequately Powered Estimates from 200 Areas of Research
Notes WLS is the unrestricted weighted least squares weighted average WAAP-WLS is the weighted average of adequately powered effect sizes (WAAP) or WLS when there are no adequately powered studies PET-PEESE is the conditional precision-effect test-precision-effect estimate with standard error meta-regression correction for publication bias Adequate power is defined as 80 following Cohen (1977)
0
20
40
60
80
100
120N
um
ber
of M
eta-
An
alys
es
0 2 4 6 8 1Proportion of Studies Adequately Powered
WLS
0
20
40
60
80
100
120
Nu
mbe
r of
Met
a-A
nal
yses
0 2 4 6 8 1Proportion of Studies Adequately Powered
WAAP-WLS
0
20
40
60
80
100
120
Nu
mbe
r of
Met
a-A
nal
yses
0 2 4 6 8 1Proportion of Studies Adequately Powered
PET-PEESE
POWER BIAS AND HETEROGENEITY
50
Figure 3 Histograms of Median Statistical Power from 200 Areas of Research
Notes WLS is the unrestricted weighted least squares weighted average WAAP-WLS is the weighted average of adequately powered effect sizes (WAAP) or WLS when there are no adequately powered studies PET-PEESE is the conditional precision-effect test-precision-effect estimate with standard error meta-regression correction for publication bias Adequate power is defined as 80 following Cohen (1977)
0
10
20
30
40
50
60N
um
ber
of M
eta-
An
alys
es
0 2 4 6 8 1Median Statistical Power
WLS
0
10
20
30
40
50
60
Nu
mbe
r of
Met
a-A
nal
yses
0 2 4 6 8 1Median Statistical Power
WAAP-WLS
0
10
20
30
40
50
60
70
Nu
mbe
r of
Met
a-A
nal
yses
0 2 4 6 8 1Median Statistical Power
PET-PEESE
Figure 4 Histograms of I2 from 200 Areas of Research
Notes I2 is the proportion of observed variation among reported effect sizes that cannot be explained by the calculated standard errors associated with these reported effect sizes It is a relative measure of heterogeneity
0
5
10
15
20
25
30
35
40
45
0 2 4 6 8 1I-squared
Num
ber o
f Met
a-A
naly
ses
POWER BIAS AND HETEROGENEITY
52
Appendix A Studies included in the meta-meta-analysis
1 Baas M Nijstad B A Boot N C amp De Dreu C K W (2016) Mad genius revisited Vulnerability to psychopathology biobehavioral approach-avoidance and creativity Psychological Bulletin 142 668-692 doi101037bul0000049 [2]
2 Balliet D Li N P Macfarlan S J amp Van Vugt M (2011) Sex differences in cooperation A meta-analytic review of social dilemmas Psychological Bulletin 137 881ndash909 doi 101037a0025354 [1]
3 Balliet D Mulder L B amp Van Lange P A M (2011) Reward punishment and cooperation A meta-analysis Psychological Bulletin 137 594-615 doi 101037a0023489 [2]
4 Balliet D Wu J amp De Dreu C K W (2014) Ingroup favoritism in cooperation A meta-analysis Psychological Bulletin 140 1556-1581 doi 101037a0037737 [1]
5 Brewin C R (2014) Episodic memory perceptual memory and their interaction Foundations for a theory of posttraumatic stress disorder Psychological Bulletin 140 69ndash97 doi 101037a0033722 [1]
6 Byron K amp Khazanchi S (2011) Rewards and creative performance A meta-analytic test of theoretically derived hypotheses Psychological Bulletin 138 809ndash830 [1]
7 Cerasoli C P amp Nicklin J M (2014) Intrinsic motivation and extrinsic incentives jointly predict performance A 40-year meta-analysis Psychological Bulletin 140 980-1008 doi 101037a0035661 [1]
8 Chaplin T M amp Aldao A (2013) Gender differences in emotion expression in children A meta-analytic review Psychological Bulletin 139 735-765 doi 101037a0030737 [4]
9 Defoe I N Dubas JS amp Figner B (2015) A meta-analysis on age differences in risky decision making Adolescents versus children and adults Psychological Bulletin 141 48ndash84 doi 101037a0038088 [4]
10 Degner J amp Dalege J (2013) The apple does not fall far from the tree or does it A meta-analysis of parentndashchild similarity in intergroup attitudes Psychological Bulletin 139 1270ndash1304 doi 101037a0031436 [1]
11 Eastwick P W Finkel E J Luchies L B amp Hunt L L (2014) The predictive validity of ideal partner preferences A review and meta-analysis Psychological Bulletin 140 623ndash 665 doi 101037a0032432 [4]
12 Else-Quest N M Higgins A Allison C amp Morton L C (2012) Gender differences in self-conscious emotional experience Psychological Bulletin 138 947ndash981 doi101037a0027930 [5]
13 Fairbairn C E amp Sayette M A (2014) A social-attributional analysis of alcohol response Psychological Bulletin 140 1361-82 doi 101037a0037563 [4]
14 Fischer P Krueger J I Greitemeyer T Vogrincic C Kastenmuumlller A Frey D Heene M Wicher M amp Kainbacher M (2011) The bystander-effect A meta-analytic review on bystander intervention in dangerous and non-dangerous emergencies Psychological Bulletin 137 517ndash537 doi 101037a0023304 [1]
POWER BIAS AND HETEROGENEITY
53
15 Fox MC Ericsson A amp Best (2011) Do procedures for verbal reporting of thinking have to be reactive A meta-analysis and recommendations for best reporting methods Psychological Bulletin 137 316 ndash344 doi 101037a0021663 [2]
16 Fox N A You K H Bowman L C Cannon E N Ferrari P F Bakermans-Kranenburg M J Vanderwert R E amp van IJzendoorn M H (2016) Assessing human mirror activity with EEG mu rhythm A meta-analysis Psychological Bulletin 142 291ndash313 doi101037bul0000031 [2]
17 Freund P A amp Kasten N (2012) How smart do you think you are A meta-analysis on the validity of self-estimates of cognitive ability Psychological Bulletin 138 296-321 doi101037a0026556 [1]
18 Grijalva E Newman D A Tay L Donnellan M B Harms P D amp Robins R W (2015) Gender differences in narcissism A meta-analytic review Psychological Bulletin 141 261-310 doi 101037a0038231 [3]
19 Haedt-Matt A A amp Keel P K (2011) Revisiting the affect regulation model of binge eating A meta-analysis of studies using ecological momentary assessment Psychological Bulletin 137 660ndash681 doi 101037a0023660 [3]
20 Harkin B Webb T L Prestwich A Conner M Kellar I Benn Y amp Sheeran P (2016) Does monitoring goal progress promote goal attainment A meta-analysis of the experimental evidence Psychological Bulletin 142 198-229 doi 101037bul0000025 [2]
21 Houben M Van Den Noortgate W amp Kuppens P (2015) The relation between short-term emotion dynamics and psychological well-being A meta-analysis Psychological Bulletin 141 901-930 doi101037a0038822 [4]
22 Johnsen T J amp Friborg O (2015) The effects of cognitive behavioral therapy as an anti-depressive treatment is falling A meta-analysis Psychological Bulletin 141 747-768 [2]
23 Karlin B Zinger J F amp Ford R (2015) The effects of feedback on energy conservation A meta-analysis Psychological Bulletin 141 1205-1227 doi 101037a0039650 [1]
24 Kim S Thibodeau R amp Jorgensen R S (2011) Shame guilt and depressive symptoms A meta-analytic review Psychological Bulletin 137 68 ndash96 doi 101037a0021466 [2]
25 Klahr A M amp Burt S A (2014) Elucidating the etiology of individual differences in parenting A meta-analysis of behavioral genetic research Psychological Bulletin 140 544ndash586 doi 101037a0034205 [6]
26 Koenig A M Eagly A H Mitchell A A amp Ristikari T (2011) Are leader stereotypes masculine A meta-analysis of three research paradigms Psychological Bulletin 137 616 ndash 642 doi 101037a0023557 [4]
27 Kredlow M A Unger L D amp Otto M W (2016) Harnessing reconsolidation to weaken fear and appetitive memories A meta-analysis of post-retrieval extinction effects Psychological Bulletin 142 314ndash336 doi 101037bul0000034 [3]
28 Kuykendall L Tay L amp Ng V (2015) Leisure engagement and subjective well-being A meta-analysis Psychological Bulletin 141 364-403 doi101037a0038508 [3]
29 Landau M J amp Kay A C (2015) Compensatory control and the appeal of a structured world Psychological Bulletin 141 694ndash722 doi 101037a0038703 [1]
30 Lee E-S Park T-Y amp Koo B (2015) Identifying organizational identification as a basis for attitudes and behaviors A meta-analytic review Psychological Bulletin 141 1049ndash1080 doi 101037bul0000012 [1]
POWER BIAS AND HETEROGENEITY
54
31 Lui P P (2015) Intergenerational cultural conflict mental health and educational outcomes among Asian and Latinoa Americans Qualitative and meta-analytic review Psychological Bulletin 141 404-446 doi101037a0038449 [3]
32 Lull R B amp Bushman B J (2015) Do sex and violence sell A meta-analytic review of the effects of sexual and violent media and ad content on memory attitudes and buying intentions Psychological Bulletin 141 1022ndash1048 doi 101037bul0000018 [6]
33 Mazei J Freund P A Huumlffmeier J amp Stuhlmacher A F (2015) A meta-analysis on gender differences in negotiation outcomes and their moderators Psychological Bulletin 141 85ndash104 doi 101037a0038184 [1]
34 Melby-Lervaringg M Lyster S A amp Hulme C (2012) Phonological skills and their role in learning to read A meta-analytic review Psychological Bulletin 138 322ndash352 doi 101037a0026744 [3]
35 Melby-Lervaringg M amp Lervaringg A (2014) Reading comprehension and its underlying components in second-language learners A meta-analysis of studies comparing first- and second-language learners Psychological Bulletin 140 409ndash433 doi 101037a0033890
[4] 36 Mendelson J L Gates J A amp Lerner M D (2016) Friendship in school-age boys with
autism spectrum disorders A meta-analytic summary and developmental process-based model Psychological Bulletin 142 601-622 doi 101037bul0000041 [2]
37 Mol S E amp Bus A G (2011) To read or not to read A meta-analysis of print exposure from infancy to early adulthood Psychological Bulletin 137 267ndash296 doi 101037a0021890 [13]
38 Orquin J L amp Kurzban R (2016) A meta-analysis of blood glucose effects on human decision making Psychological Bulletin 142 546ndash567 doi 101037bul0000035 [1]
39 Ottaviani C Verkuil B Medea B Couyoumdjian A Thayer JF Lonigro A amp Brosschot J F (2016) Physiological concomitants of perseverative cognition A systematic review and meta-analysis Psychological Bulletin 142 No 3 231ndash259 doi 101037bul0000036 [8]
40 North M S amp Fiske S T (2015) Modern attitudes toward older adults in the aging world A cross-cultural meta-analysis Psychological Bulletin 141 993ndash1021 doi 101037a0039469 [1]
41 Pahlke E Hyde J S amp Allison C M (2014) The effects of single-sex compared with coeducational schooling on studentsrsquo performance and attitudes A meta-analysis Psychological Bulletin 140 1042-1072 doi 101037a0035740 [2]
42 Pan S C amp Rickard T C (2015) Sleep and motor learning Is there room for consolidation Psychological Bulletin 141 812-834 doi 101037bul0000009 [1]
43 Phillips W J Fletcher J M Marks A D G amp Hine D W (2016) Thinking styles and decision making A meta-analysis Psychological Bulletin 142 No 3 260ndash290 doi 101037bul0000027 [4]
44 Pool E Brosch T Delplanque S amp Sander D (2016) Attentional bias for positive emotional stimuli A meta-analytic investigation Psychological Bulletin 142 No 1 79ndash106 doi 101037bul0000026 [1]
45 Randall J G Oswald F L amp Beier M E (2014) Mind-wandering cognition and performance A theory-driven meta-analysis of attention regulation Psychological Bulletin 140 1411ndash1431 doi 101037a0037428 [4]
POWER BIAS AND HETEROGENEITY
55
46 Sambrook T D amp Goslin J (2015) A neural reward prediction error revealed by a meta-analysis of ERPs using great grand averages Psychological Bulletin 141 213ndash235 doi 101037bul0000006 [4]
47 Sedlmeier P Eberth J Schwarz M Zimmermann D Haarig F Jaeger S amp Kunze S (2012) The psychological effects of meditation A meta-analysis Psychological Bulletin 138 1139ndash1171 doi 101037a0028168 [20]
48 Sheeran P Harris P R and Epton T (2014) Does heightening risk appraisals change peoplersquos intentions and behavior A meta-analysis of experimental studies Psychological Bulletin 140 511ndash543 doi 101037a0033065 [2]
49 Smith S F amp Lilienfeld S O (2015) The response modulation hypothesis of psychopathy A meta-analytic and narrative analysis Psychological Bulletin 141 1145ndash1177 doi 101037bul0000024 [1]
50 Soderberg C K Amit E Callahan S P Kochersberger A O amp Ledgerwood A (2015) The effects of psychological distance on abstraction Two meta-analyses Psychological Bulletin 141 3 525ndash548 doi101037bul0000005 [2]
51 Tannenbaum M B Hepler J Zimmerman R S Saul L Jacobs S Wilson K amp Albarraciacuten D Appealing to fear A meta-analysis of fear appeal effectiveness and theories Psychological Bulletin 141 1178ndash1204 doi101037a0039729 [1]
52 Toosi N R Babbitt L G Ambady N amp Sommers SR (2012) Dyadic interracial interactions A meta-analysis Psychological Bulletin 138 1ndash27 doi 101037a0025767 [4]
53 Vachon D D Lynam D R amp Johnson J A (2014) The (Non)relation between empathy and aggression Surprising results from a meta-analysis Psychological Bulletin 140 751ndash773 doi 101037a0035236 [1]
54 Verhage M L Schuengel C Madigan S Fearon R M P Oosterman M Cassibba R Bakermans-Kranenburg M J amp van IJzendoorn M H (2016) Narrowing the transmission gap A synthesis of three decades of research on intergenerational transmission of attachment Psychological Bulletin 142 337ndash366 doi 101037bul0000038 [2]
55 von Stumm S amp Ackerman P L (2013) Investment and intellect A review and meta-analysis Psychological Bulletin 139 841ndash869 doi 101037a0030746 [11]
56 Voyer D amp Voyer S D (2014) Gender differences in scholastic achievement A meta-analysis Psychological Bulletin 140 1174-1204 doi 101037a0036620 [6]
57 Vucasović T amp Bratko D (2015) Heritability of personality A meta-analysis of behavior genetic studies Psychological Bulletin 141 769ndash785 doi101037bul0000017 [1]
58 Wanberg C R Hamann D J Kanfer R amp Zhang Z (2016) Age and reemployment success after job loss An integrative model and meta-analysis Psychological Bulletin 142 400-426 doi 101037bul0000019 [6]
59 Weingarten E Chen Q McAdams M Yi J amp Hepler J (2016) From primed concepts to action A meta-analysis of the behavioral effects of incidentally presented words Psychological Bulletin 142 472ndash497 doi 101037bul0000030 [1]
60 Williams M J amp Tiedens L Z (2016) The subtle suspension of backlash A meta-analysis of penalties for womenrsquos implicit and explicit dominance behaviour Psychological Bulletin 142 165ndash197 doi 101037bul0000039 [6]
POWER BIAS AND HETEROGENEITY
56
61 Winer E S amp Salem T (2016) Reward devaluation Dot-probe meta-analytic evidence of avoidance of positive information in depressed persons Psychological Bulletin 142 18ndash78 doi 101037bul0000022 [6]
Notes Numbers in square brackets denote the number of meta-analyses included in the dataset
Appendix B Distribution of survey estimates
Year
No of meta-analyses published
No of meta-analyses sampled
of published meta-studies
No of estimates
of sample
2016 17 14 82 46 22 2015 22 18 82 40 19 2014 25 12 48 46 22 2013 17 3 18 16 8 2012 15 6 40 34 16 2011 19 8 42 31 15

POWER BIAS AND HETEROGENEITY
40
Cohen J (1965) Some statistical issues in psychological research In (BB Wolman ed)
Handbook of Clinical Psychology New York McGraw-Hill pp 95ndash121
Cohen J (1977) Statistical power analysis for the behavioral sciences (2nd ed) New York
Academic Press
Cohen J (1992) A power primer Psychological Bulletin 112 155ndash159
Cooper H M amp Hedges LV (1994) (eds) Handbook of Research Synthesis New York Russell
Sage
Dreber A Pfeiffer T Almenberg J Isaksson S Wilson B Chen Y amp Johannesson M
(2015) Using prediction markets to estimate the reproducibility of scientific research
Proceedings of the National Academy of Sciences 112(50) 15343-47
Eerland A Sherrill A M Magliano J P Zwaan R A Arnal J D Aucoin P amp Prenoveau
J M (2016) Registered replication report Hart amp Albarraciacuten (2011) Perspectives on
Psychological Science 11(1) 158-171 doi 1011771745691615605826
Egger M Smith G D Schneider M amp Minder C (1997) Bias in meta-analysis detected by a
simple graphical test British Medical Journal 315 629ndash634 doi101136bmj3157109629
Engber D (2015) Cover Story Everything is crumbling Slate March 6 Accessed Dec 19
2016
Erica C Y Sprenger A M Thomas R P amp Dougherty M R (2014) When decision heuristics
and science collide Psychonomic Bulletin amp Review 21(2) 268-282 doi103758s13423-013-
0495-z
Fabrigar L R amp Wegener D T (2016) Conceptualizing and evaluating the replication of
research results Journal of Experimental Social Psychology 66 68-80 doi
101016jjesp201507009
Fanelli D (2010) ldquoPositiverdquo results increase down the hierarchy of the sciences PLoS One
5 e10068 doi101371journalpone0010068
Fanelli D Costas R amp Ioannidis J P (2017) Meta-assessment of bias in science Proceedings
of the National Academy of Sciences 201618569 doi101073pnas1618569114
Fiedler K amp Schwarz N (2016) Questionable research practices revisited Social Psychological
and Personality Science 7(1) 45-52 doi 1011771948550615612150
POWER BIAS AND HETEROGENEITY
41
Fraley R C amp Vazire S (2014) The n-pact factor Evaluating the quality of empirical journals
with respect to sample size and statistical power PLoS ONE 9 e109019
doi101371journalpone0109019
Fraley R C amp Marks M J (2007) The null hypothesis significance testing debate and its
implications for personality research In R W Robins R C Fraley amp R F Krueger (Eds)
Handbook of research methods in personality psychology (pp149ndash169) New York Guilford
Franco A Malhotra N amp Simonovits G (2016) Underreporting in psychology experiments
Evidence from a study registry Social Psychological and Personality Science 7(1) 8-12 doi
1011771948550615598377
Gerber A amp Malhotra N (2008) Do statistical reporting standards affect what is published
publication bias in two leading political science journals Quarterly Journal of Political
Science 3 313-326 doi 10156110000008024
Hagger M S Chatzisarantis N L D Alberts H Anggono C O Birt A Brand R amp
Cannon T (2016) A multi-lab preregistered replication of the ego-depletion effect
Perspectives on Psychological Science 11 546ndash573 doi 1011771745691616652873
Hedges L V amp Olkin I (1985) Statistical Methods for Meta-Analysis Academic Press Orlando
Henmi M amp Copas J B (2010) Confidence intervals for random effects meta-analysis and
robustness to publication bias Statistics in Medicine 29 2969ndash2983 doi 101002sim4029
Higgins J P T amp Thompson S G (2002) Quantifying heterogeneity in meta-analysis Statistics
in Medicine 21 1539ndash1558 doi 101002sim1186
Hoenig J M amp Heisey D M (2001) The abuse of power The pervasive fallacy of power
calculations for data analysis American Statistician 55 19ndash24 doi
101198000313001300339897
Inthout J Ioannidis J P A amp Borm G F (2012) Obtaining evidence by a single well-powered
trial or several modestly powered trials Statistical Methods in Medical Research
httpsmmsagepubcomcontentearly201209240962280212461098abstract (Accessed
Aug 16th 2015)
Ioannidis J P A (2005a) Contradicted and initially stronger effects in highly cited clinical
research Journal of the American Medical Association 294 218-228
doi101001jama2942218
POWER BIAS AND HETEROGENEITY
42
Ioannidis J P A (2005b) Why most published research findings are false PLoS Medicine 2
e124 doi101371journalpmed0020124
Ioannidis J P A (2013) Clarifications on the application and interpretation of the test for excess
significance and its extensions Journal of Mathematical Psychology 57 184-187 doi
101016jjmp201303002
Ioannidis J P A Hozo I and Djulbegovic B (2013) Optimal type I and type II error pairs when
the available sample size is fixed Journal of Clinical Epidemiology 66 903-910 doi
101016jjclinepi201303002
Ioannidis J P A Stanley T D amp Doucouliagos C(H) (2017) The power of bias in economics
research The Economic Journal October also as SWP Economics Series 20162
httpwwwdeakineduau__dataassetspdf_file00074777632016_1pdf Deakin University
Australia [Accessed on 27 April 2017]
John L K Loewenstein G amp Prelec D (2012) Measuring the prevalence of questionable
research practices with incentives for truth telling Psychological Science 23 524-532 doi
1011770956797611430953
Klein R A Vianello M Hasselman F Alper S Aveyard M Axt J R amp Nosek B A
(2015) Many Labs 2 Investigating variation in replicability across sample and setting
Manuscript in preparation
Kuumlhberger A Fritz A amp Scherndl T (2014) Publication bias in psychology a diagnosis based
on the correlation between effect size and sample size PloS one 9(9) e105825 doi
101371journalpone0105825
Lakens D (2015) On the challenges of drawing conclusions from p-values just below 005 Peer
J 3e1142 doi 107717peerj1142 PMID 26246976
LeBel E P Borsboom D Giner-Sorolla R Hasselman F Peters K R Ratliff K A amp
Smith C T (2013) PsychDisclosure org Grassroots support for reforming reporting standards
in psychology Perspectives on Psychological Science 8(4) 424-432 doi
1011771745691613491437
LeBel E P Vanpaemel W McCarthy R J Earp B D amp Elson M (2017) A unified
framework to quantify the trustworthiness of empirical research Advances in Methods and
Practices in Psychological Science Retrieved from httpsosfiopreprintspsyarxivuwmr8
8232017
POWER BIAS AND HETEROGENEITY
43
Lindsay D S (2015) Replication in psychological science Psychological Science 26 1827-32
Makel M C Plucker J A amp Hegarty B (2012) Replications in psychology research How
often do they really occur Perspectives on Psychological Science 7(6) 537-542
Maxwell S E (2004) The persistence of underpowered studies in psychological research causes
consequences and remedies Psychological Methods 9 147 doi 1010371082-989X92147
Maxwell S E Lau M Y amp Howard G S (2015) Is psychology suffering from a replication
crisis What does ldquofailure to replicaterdquo really mean American Psychologist 70(6) 487-498
httpdxdoiorg101037a0039400
McShane B B amp Boumlckenholt U (2016) Planning sample sizes when effect sizes are uncertain
The power-calibrated effect size approach Psychological Methods 21(1) 47 doi
101037met0000036
McShane B B Boumlckenholt U amp Hansen K T (2016) Adjusting for publication bias in meta-
analysis An evaluation of selection methods and some cautionary notes Perspectives on
Psychological Science 11 730ndash749 doi 1011771745691616662243
Miguel E amp Christensen G (2017) Transparency reproducibility and the credibility of
economics research Journal of Economic Literature IN PRESS
Moreno S G Sutton A J Ades A E Stanley T D Abrams K R Peters J L Cooper N
J (2009) Assessment of regression-based methods to adjust for publication bias through a
comprehensive simulation study BMC Medical Research Methodology 9 2 doi
1011861471-2288-9-2
Open Science Collaboration (2015) Estimating the reproducibility of psychological science
Science 349(6251) aac4716ndashaac4716 doi101126scienceaac4716
Pashler H amp Harris C (2012) Is the replicability crisis overblown Three arguments examined
Perspectives on Psychological Science 7 531ndash536 doi 1011771745691612463401
Pashler H amp Wagenmakers E J (2012) Editorsrsquo introduction to the special section on
replicability in psychological science a crisis of confidence Perspectives on Psychological
Science 7 528ndash530 doi 1011771745691612465253
Patil P and Leek JT (2015) Reporting of 36 of studies replicate in the media
httpsgithubcomjtleekreplication_paperblobgh-pagesin_the_mediamd[Online up- dated
16-September-2015 accessed 8232017]
POWER BIAS AND HETEROGENEITY
44
Patil P Peng R D amp Leek J T (2016) What should researchers expect when they replicate
studies A statistical view of replicability in psychological science Perspectives on
Psychological Science 11(4) 539-544 doi 1011771745691616646366
Pigott T (2012) Advances in meta-analysis New York NY Springer
Poole C amp Greenland S (1999) Random-effects meta-analyses are not always conservative
American Journal of Epidemiology 150 469ndash475
Popper K (1959) The logic of scientific discovery New York NY Basic Books
Psychonomic Society (2012) New Statistical Guidelines for Journals of the Psychonomic Society
httpwwwpsychonomicorgpagestatisticalguideline (Accessed March 11th 2017)
Rossi J S (1990) Statistical power of psychological research What have we gained in 20 years
Journal of Consulting and Clinical Psychology 58 646ndash656 doi1010370022-
006X585646
Richard F D Bond C F amp Stokes-Zoota J J (2003) One hundred years of social psychology
quantitatively described Review of General Psychology 7 331ndash363
Scargle J D (2000) Publication bias The ldquoFile-Drawerrdquo problem in scientific inference Journal
of Scientific Exploration 14 91ndash106
Schmidt F L amp Hunter J E (2015) Methods of meta-analysis Correcting error and bias in
research findings 3rd ed Los Angeles CA Sage
Schmidt F L amp Oh I -S (2016) The crisis of confidence in research findings in psychology Is
lack of replication the real problem Or something else Archives of Scientific Psychology 4(1)
32ndash37 httpdxdoiorg101037arc0000029
Sedlmeier P amp Gigerenzer G (1989) Do studies of statistical power have an effect on the power
of studies Psychological Bulletin 105 309ndash316
Simmons J P Nelson L D amp Simonsohn U (2011) False-positive psychology Undisclosed
flexibility in data collection and analysis allows presenting anything as significant
Psychological Science 22(11) 1359-1366 doi 1011770956797611417632
Simonsohn U Nelson L D amp Simmons J P (2014) P-curve a key to the file drawer Journal
of Experimental Psychology General 143 534-547 doi 101037a0033242
Stanley D J amp Spence J R (2014) Expectations for replications Are yours realistic
Perspectives on Psychological Science 9 305ndash318 doi 1011771745691614528518
POWER BIAS AND HETEROGENEITY
45
Stanley T D (2008) Meta-regression methods for detecting and estimating empirical effects in
the presence of publication selection Oxford Bulletin of Economics and Statistics 70103-27
doi 101111j1468-0084200700487x
Stanley T D (2017) Limitations of PET-PEESE and other meta-analysis methods Social
Psychology and Personality Science [Epub ahead of print] doi 1011771948550617693062
Stanley T D amp Doucouliagos H(C) 2014 Meta-regression approximations to reduce publication
selection bias Research Synthesis Methods 5 60-78 doi 101002jrsm1095
Stanley T D amp Doucouliagos H(C) 2015 Neither fixed nor random Weighted least squares
meta-analysis Statistics in Medicine 34 2116-27 doi 101002sim6481
Stanley T D amp Doucouliagos H(C) 2017 Neither fixed nor random Weighted least squares
meta-regression analysis Research Synthesis Methods 8 19-42 doi 101002jrsm1211
Stanley T D Doucouliagos H(C) amp Ioannidis J P A 2017 Finding the power to reduce
publication bias Statistics in Medicine [Epub ahead of print] doi 101002sim7228
Sterling T D (1959) Publication decisions and their possible effects on inferences drawn from
tests of significance Or vice versa Journal of the American Statistical Association 54 30ndash34
Sterling T D Rosenbaum W L amp Weinkam J J (1995) Publication decisions revisited The
effect of the outcome of statistical tests on the decision to publish and vice versa American
Statistician 49 108ndash112 doi 1023072684823
Sutton A J Song F Gilbody S M amp Abrams K R (2000) Modelling publication bias in
meta-analysis A review Statistical Methods in Medical Research 9 421-445 doi
101177096228020000900503
Tressoldi P E amp Giofreacute D (2015) The pervasive avoidance of prospective statistical power
Major consequences and practical solutions Frontiers in Psychology 6 726
doi103389fpsyg201500726
van Aert R C M Jelte M Wicherts J M amp van Assen M A L M (2016) Conducting meta-
analyses based on p values Reservations and recommendations for applying p-uniform and p-
curve Perspectives on Psychological Science 11 713ndash729 doi 1011771745691616650874
van Bavel JJ Mende-Siedlecki PBrada WJ and Reinero DA 2016 Contextual sensitivity
in scientific reproducibility Proceedings of the National Academy of Sciences 113 6454ndash59
POWER BIAS AND HETEROGENEITY
46
van Erp S et al (2017) Estimates of between-study heterogeneity for 705 meta-analyses reported
in Psychological Bulletin from 1990ndash2013 Journal of Open Psychology Data 5(1) p4 DOI
httpdoiorg105334jopd33
Wicherts J M Veldkamp C L Augusteijn H E Bakker M van Aert R C amp Van Assen
M A (2016) Degrees of Freedom in Planning Running Analyzing and Reporting
Psychological Studies A Checklist to Avoid p-Hacking Frontiers in Psychology 7 doi
103389fpsyg201601832
Yuan K amp Maxwell S (2005) On the post hoc power in testing mean differences Journal of
Educational and Behavioral Statistics 30 141ndash167 doi 10310210769986030002141
POWER BIAS AND HETEROGENEITY
47
Table 1 Median Statistical Power and Average Effect Sizes
Mean Proportion with Adequate Power Median Power Type of Effect
Absolute Effect Sizes WLS WAAP-WLS PET-PEESE WLS WAAP-WLS PET-PEESE
Combined (n=200)
0389 0077 0071 0091 0364 0331 0360
Correlations (n=108)
0458 0243 0328 0272 0577 0610 0607
SMDs (n=92)
0291 0013 0000 0011 0230 0171 0170
Notes The numbers reported in the table are medians Mean absolute effect sizes are reported in this table in units of standardized mean differences (SMD) regardless of whether they were reported in the meta-analysis as correlations or as SMD WLS is the unrestricted weighted least squares weighted average WAAP-WLS is the weighted average of adequately powered effect sizes (WAAP) or WLS when there are no adequately powered studies PET-PEESE is the conditional precision-effect test-precision-effect estimate with standard error meta-regression correction for publication bias Adequate power is defined as 80 following Cohen (1977)
Table 2 Median Statistical Powers by Experimental Design Proportion with Adequate Power Median Power
Experimental Design WLS WAAP-WLS PET-PEESE WLS WAAP-WLS PET-PEESE
Observational (n=113)
0278 0259 0268 0621 0613 0585
Experimental (n=87)
0032 0000 0053 0247 0232 0236
Notes The numbers reported in the table are medians WLS is the unrestricted weighted least squares weighted average WAAP-WLS is the weighted average of adequately powered effect sizes (WAAP) or WLS when there are no adequately powered studies PET-PEESE is the conditional precision-effect test-precision-effect estimate with standard error meta-regression correction for publication bias Adequate power is defined as 80 following Cohen (1977)
Figure 1 Obtaining adequate power (80)
Notes x is distributed as a standard normal distribution N(01) 196 is the critical value for testing against 0 Figure 1 merely illustrates how the standardized mean of the sampling distribution needs to 28 standard errors away from 0 for an experiment to have adequate powermdashCohenrsquos 80 We thank Stephan Bruns for producing this graph
POWER BIAS AND HETEROGENEITY
49
Figure 2 Histograms of Adequately Powered Estimates from 200 Areas of Research
Notes WLS is the unrestricted weighted least squares weighted average WAAP-WLS is the weighted average of adequately powered effect sizes (WAAP) or WLS when there are no adequately powered studies PET-PEESE is the conditional precision-effect test-precision-effect estimate with standard error meta-regression correction for publication bias Adequate power is defined as 80 following Cohen (1977)
0
20
40
60
80
100
120N
um
ber
of M
eta-
An
alys
es
0 2 4 6 8 1Proportion of Studies Adequately Powered
WLS
0
20
40
60
80
100
120
Nu
mbe
r of
Met
a-A
nal
yses
0 2 4 6 8 1Proportion of Studies Adequately Powered
WAAP-WLS
0
20
40
60
80
100
120
Nu
mbe
r of
Met
a-A
nal
yses
0 2 4 6 8 1Proportion of Studies Adequately Powered
PET-PEESE
POWER BIAS AND HETEROGENEITY
50
Figure 3 Histograms of Median Statistical Power from 200 Areas of Research
Notes WLS is the unrestricted weighted least squares weighted average WAAP-WLS is the weighted average of adequately powered effect sizes (WAAP) or WLS when there are no adequately powered studies PET-PEESE is the conditional precision-effect test-precision-effect estimate with standard error meta-regression correction for publication bias Adequate power is defined as 80 following Cohen (1977)
0
10
20
30
40
50
60N
um
ber
of M
eta-
An
alys
es
0 2 4 6 8 1Median Statistical Power
WLS
0
10
20
30
40
50
60
Nu
mbe
r of
Met
a-A
nal
yses
0 2 4 6 8 1Median Statistical Power
WAAP-WLS
0
10
20
30
40
50
60
70
Nu
mbe
r of
Met
a-A
nal
yses
0 2 4 6 8 1Median Statistical Power
PET-PEESE
Figure 4 Histograms of I2 from 200 Areas of Research
Notes I2 is the proportion of observed variation among reported effect sizes that cannot be explained by the calculated standard errors associated with these reported effect sizes It is a relative measure of heterogeneity
0
5
10
15
20
25
30
35
40
45
0 2 4 6 8 1I-squared
Num
ber o
f Met
a-A
naly
ses
POWER BIAS AND HETEROGENEITY
52
Appendix A Studies included in the meta-meta-analysis
1 Baas M Nijstad B A Boot N C amp De Dreu C K W (2016) Mad genius revisited Vulnerability to psychopathology biobehavioral approach-avoidance and creativity Psychological Bulletin 142 668-692 doi101037bul0000049 [2]
2 Balliet D Li N P Macfarlan S J amp Van Vugt M (2011) Sex differences in cooperation A meta-analytic review of social dilemmas Psychological Bulletin 137 881ndash909 doi 101037a0025354 [1]
3 Balliet D Mulder L B amp Van Lange P A M (2011) Reward punishment and cooperation A meta-analysis Psychological Bulletin 137 594-615 doi 101037a0023489 [2]
4 Balliet D Wu J amp De Dreu C K W (2014) Ingroup favoritism in cooperation A meta-analysis Psychological Bulletin 140 1556-1581 doi 101037a0037737 [1]
5 Brewin C R (2014) Episodic memory perceptual memory and their interaction Foundations for a theory of posttraumatic stress disorder Psychological Bulletin 140 69ndash97 doi 101037a0033722 [1]
6 Byron K amp Khazanchi S (2011) Rewards and creative performance A meta-analytic test of theoretically derived hypotheses Psychological Bulletin 138 809ndash830 [1]
7 Cerasoli C P amp Nicklin J M (2014) Intrinsic motivation and extrinsic incentives jointly predict performance A 40-year meta-analysis Psychological Bulletin 140 980-1008 doi 101037a0035661 [1]
8 Chaplin T M amp Aldao A (2013) Gender differences in emotion expression in children A meta-analytic review Psychological Bulletin 139 735-765 doi 101037a0030737 [4]
9 Defoe I N Dubas JS amp Figner B (2015) A meta-analysis on age differences in risky decision making Adolescents versus children and adults Psychological Bulletin 141 48ndash84 doi 101037a0038088 [4]
10 Degner J amp Dalege J (2013) The apple does not fall far from the tree or does it A meta-analysis of parentndashchild similarity in intergroup attitudes Psychological Bulletin 139 1270ndash1304 doi 101037a0031436 [1]
11 Eastwick P W Finkel E J Luchies L B amp Hunt L L (2014) The predictive validity of ideal partner preferences A review and meta-analysis Psychological Bulletin 140 623ndash 665 doi 101037a0032432 [4]
12 Else-Quest N M Higgins A Allison C amp Morton L C (2012) Gender differences in self-conscious emotional experience Psychological Bulletin 138 947ndash981 doi101037a0027930 [5]
13 Fairbairn C E amp Sayette M A (2014) A social-attributional analysis of alcohol response Psychological Bulletin 140 1361-82 doi 101037a0037563 [4]
14 Fischer P Krueger J I Greitemeyer T Vogrincic C Kastenmuumlller A Frey D Heene M Wicher M amp Kainbacher M (2011) The bystander-effect A meta-analytic review on bystander intervention in dangerous and non-dangerous emergencies Psychological Bulletin 137 517ndash537 doi 101037a0023304 [1]
POWER BIAS AND HETEROGENEITY
53
15 Fox MC Ericsson A amp Best (2011) Do procedures for verbal reporting of thinking have to be reactive A meta-analysis and recommendations for best reporting methods Psychological Bulletin 137 316 ndash344 doi 101037a0021663 [2]
16 Fox N A You K H Bowman L C Cannon E N Ferrari P F Bakermans-Kranenburg M J Vanderwert R E amp van IJzendoorn M H (2016) Assessing human mirror activity with EEG mu rhythm A meta-analysis Psychological Bulletin 142 291ndash313 doi101037bul0000031 [2]
17 Freund P A amp Kasten N (2012) How smart do you think you are A meta-analysis on the validity of self-estimates of cognitive ability Psychological Bulletin 138 296-321 doi101037a0026556 [1]
18 Grijalva E Newman D A Tay L Donnellan M B Harms P D amp Robins R W (2015) Gender differences in narcissism A meta-analytic review Psychological Bulletin 141 261-310 doi 101037a0038231 [3]
19 Haedt-Matt A A amp Keel P K (2011) Revisiting the affect regulation model of binge eating A meta-analysis of studies using ecological momentary assessment Psychological Bulletin 137 660ndash681 doi 101037a0023660 [3]
20 Harkin B Webb T L Prestwich A Conner M Kellar I Benn Y amp Sheeran P (2016) Does monitoring goal progress promote goal attainment A meta-analysis of the experimental evidence Psychological Bulletin 142 198-229 doi 101037bul0000025 [2]
21 Houben M Van Den Noortgate W amp Kuppens P (2015) The relation between short-term emotion dynamics and psychological well-being A meta-analysis Psychological Bulletin 141 901-930 doi101037a0038822 [4]
22 Johnsen T J amp Friborg O (2015) The effects of cognitive behavioral therapy as an anti-depressive treatment is falling A meta-analysis Psychological Bulletin 141 747-768 [2]
23 Karlin B Zinger J F amp Ford R (2015) The effects of feedback on energy conservation A meta-analysis Psychological Bulletin 141 1205-1227 doi 101037a0039650 [1]
24 Kim S Thibodeau R amp Jorgensen R S (2011) Shame guilt and depressive symptoms A meta-analytic review Psychological Bulletin 137 68 ndash96 doi 101037a0021466 [2]
25 Klahr A M amp Burt S A (2014) Elucidating the etiology of individual differences in parenting A meta-analysis of behavioral genetic research Psychological Bulletin 140 544ndash586 doi 101037a0034205 [6]
26 Koenig A M Eagly A H Mitchell A A amp Ristikari T (2011) Are leader stereotypes masculine A meta-analysis of three research paradigms Psychological Bulletin 137 616 ndash 642 doi 101037a0023557 [4]
27 Kredlow M A Unger L D amp Otto M W (2016) Harnessing reconsolidation to weaken fear and appetitive memories A meta-analysis of post-retrieval extinction effects Psychological Bulletin 142 314ndash336 doi 101037bul0000034 [3]
28 Kuykendall L Tay L amp Ng V (2015) Leisure engagement and subjective well-being A meta-analysis Psychological Bulletin 141 364-403 doi101037a0038508 [3]
29 Landau M J amp Kay A C (2015) Compensatory control and the appeal of a structured world Psychological Bulletin 141 694ndash722 doi 101037a0038703 [1]
30 Lee E-S Park T-Y amp Koo B (2015) Identifying organizational identification as a basis for attitudes and behaviors A meta-analytic review Psychological Bulletin 141 1049ndash1080 doi 101037bul0000012 [1]
POWER BIAS AND HETEROGENEITY
54
31 Lui P P (2015) Intergenerational cultural conflict mental health and educational outcomes among Asian and Latinoa Americans Qualitative and meta-analytic review Psychological Bulletin 141 404-446 doi101037a0038449 [3]
32 Lull R B amp Bushman B J (2015) Do sex and violence sell A meta-analytic review of the effects of sexual and violent media and ad content on memory attitudes and buying intentions Psychological Bulletin 141 1022ndash1048 doi 101037bul0000018 [6]
33 Mazei J Freund P A Huumlffmeier J amp Stuhlmacher A F (2015) A meta-analysis on gender differences in negotiation outcomes and their moderators Psychological Bulletin 141 85ndash104 doi 101037a0038184 [1]
34 Melby-Lervaringg M Lyster S A amp Hulme C (2012) Phonological skills and their role in learning to read A meta-analytic review Psychological Bulletin 138 322ndash352 doi 101037a0026744 [3]
35 Melby-Lervaringg M amp Lervaringg A (2014) Reading comprehension and its underlying components in second-language learners A meta-analysis of studies comparing first- and second-language learners Psychological Bulletin 140 409ndash433 doi 101037a0033890
[4] 36 Mendelson J L Gates J A amp Lerner M D (2016) Friendship in school-age boys with
autism spectrum disorders A meta-analytic summary and developmental process-based model Psychological Bulletin 142 601-622 doi 101037bul0000041 [2]
37 Mol S E amp Bus A G (2011) To read or not to read A meta-analysis of print exposure from infancy to early adulthood Psychological Bulletin 137 267ndash296 doi 101037a0021890 [13]
38 Orquin J L amp Kurzban R (2016) A meta-analysis of blood glucose effects on human decision making Psychological Bulletin 142 546ndash567 doi 101037bul0000035 [1]
39 Ottaviani C Verkuil B Medea B Couyoumdjian A Thayer JF Lonigro A amp Brosschot J F (2016) Physiological concomitants of perseverative cognition A systematic review and meta-analysis Psychological Bulletin 142 No 3 231ndash259 doi 101037bul0000036 [8]
40 North M S amp Fiske S T (2015) Modern attitudes toward older adults in the aging world A cross-cultural meta-analysis Psychological Bulletin 141 993ndash1021 doi 101037a0039469 [1]
41 Pahlke E Hyde J S amp Allison C M (2014) The effects of single-sex compared with coeducational schooling on studentsrsquo performance and attitudes A meta-analysis Psychological Bulletin 140 1042-1072 doi 101037a0035740 [2]
42 Pan S C amp Rickard T C (2015) Sleep and motor learning Is there room for consolidation Psychological Bulletin 141 812-834 doi 101037bul0000009 [1]
43 Phillips W J Fletcher J M Marks A D G amp Hine D W (2016) Thinking styles and decision making A meta-analysis Psychological Bulletin 142 No 3 260ndash290 doi 101037bul0000027 [4]
44 Pool E Brosch T Delplanque S amp Sander D (2016) Attentional bias for positive emotional stimuli A meta-analytic investigation Psychological Bulletin 142 No 1 79ndash106 doi 101037bul0000026 [1]
45 Randall J G Oswald F L amp Beier M E (2014) Mind-wandering cognition and performance A theory-driven meta-analysis of attention regulation Psychological Bulletin 140 1411ndash1431 doi 101037a0037428 [4]
POWER BIAS AND HETEROGENEITY
55
46 Sambrook T D amp Goslin J (2015) A neural reward prediction error revealed by a meta-analysis of ERPs using great grand averages Psychological Bulletin 141 213ndash235 doi 101037bul0000006 [4]
47 Sedlmeier P Eberth J Schwarz M Zimmermann D Haarig F Jaeger S amp Kunze S (2012) The psychological effects of meditation A meta-analysis Psychological Bulletin 138 1139ndash1171 doi 101037a0028168 [20]
48 Sheeran P Harris P R and Epton T (2014) Does heightening risk appraisals change peoplersquos intentions and behavior A meta-analysis of experimental studies Psychological Bulletin 140 511ndash543 doi 101037a0033065 [2]
49 Smith S F amp Lilienfeld S O (2015) The response modulation hypothesis of psychopathy A meta-analytic and narrative analysis Psychological Bulletin 141 1145ndash1177 doi 101037bul0000024 [1]
50 Soderberg C K Amit E Callahan S P Kochersberger A O amp Ledgerwood A (2015) The effects of psychological distance on abstraction Two meta-analyses Psychological Bulletin 141 3 525ndash548 doi101037bul0000005 [2]
51 Tannenbaum M B Hepler J Zimmerman R S Saul L Jacobs S Wilson K amp Albarraciacuten D Appealing to fear A meta-analysis of fear appeal effectiveness and theories Psychological Bulletin 141 1178ndash1204 doi101037a0039729 [1]
52 Toosi N R Babbitt L G Ambady N amp Sommers SR (2012) Dyadic interracial interactions A meta-analysis Psychological Bulletin 138 1ndash27 doi 101037a0025767 [4]
53 Vachon D D Lynam D R amp Johnson J A (2014) The (Non)relation between empathy and aggression Surprising results from a meta-analysis Psychological Bulletin 140 751ndash773 doi 101037a0035236 [1]
54 Verhage M L Schuengel C Madigan S Fearon R M P Oosterman M Cassibba R Bakermans-Kranenburg M J amp van IJzendoorn M H (2016) Narrowing the transmission gap A synthesis of three decades of research on intergenerational transmission of attachment Psychological Bulletin 142 337ndash366 doi 101037bul0000038 [2]
55 von Stumm S amp Ackerman P L (2013) Investment and intellect A review and meta-analysis Psychological Bulletin 139 841ndash869 doi 101037a0030746 [11]
56 Voyer D amp Voyer S D (2014) Gender differences in scholastic achievement A meta-analysis Psychological Bulletin 140 1174-1204 doi 101037a0036620 [6]
57 Vucasović T amp Bratko D (2015) Heritability of personality A meta-analysis of behavior genetic studies Psychological Bulletin 141 769ndash785 doi101037bul0000017 [1]
58 Wanberg C R Hamann D J Kanfer R amp Zhang Z (2016) Age and reemployment success after job loss An integrative model and meta-analysis Psychological Bulletin 142 400-426 doi 101037bul0000019 [6]
59 Weingarten E Chen Q McAdams M Yi J amp Hepler J (2016) From primed concepts to action A meta-analysis of the behavioral effects of incidentally presented words Psychological Bulletin 142 472ndash497 doi 101037bul0000030 [1]
60 Williams M J amp Tiedens L Z (2016) The subtle suspension of backlash A meta-analysis of penalties for womenrsquos implicit and explicit dominance behaviour Psychological Bulletin 142 165ndash197 doi 101037bul0000039 [6]
POWER BIAS AND HETEROGENEITY
56
61 Winer E S amp Salem T (2016) Reward devaluation Dot-probe meta-analytic evidence of avoidance of positive information in depressed persons Psychological Bulletin 142 18ndash78 doi 101037bul0000022 [6]
Notes Numbers in square brackets denote the number of meta-analyses included in the dataset
Appendix B Distribution of survey estimates
Year
No of meta-analyses published
No of meta-analyses sampled
of published meta-studies
No of estimates
of sample
2016 17 14 82 46 22 2015 22 18 82 40 19 2014 25 12 48 46 22 2013 17 3 18 16 8 2012 15 6 40 34 16 2011 19 8 42 31 15

POWER BIAS AND HETEROGENEITY
45
Stanley T D (2008) Meta-regression methods for detecting and estimating empirical effects in
the presence of publication selection Oxford Bulletin of Economics and Statistics 70103-27
doi 101111j1468-0084200700487x
Stanley T D (2017) Limitations of PET-PEESE and other meta-analysis methods Social
Psychology and Personality Science [Epub ahead of print] doi 1011771948550617693062
Stanley T D amp Doucouliagos H(C) 2014 Meta-regression approximations to reduce publication
selection bias Research Synthesis Methods 5 60-78 doi 101002jrsm1095
Stanley T D amp Doucouliagos H(C) 2015 Neither fixed nor random Weighted least squares
meta-analysis Statistics in Medicine 34 2116-27 doi 101002sim6481
Stanley T D amp Doucouliagos H(C) 2017 Neither fixed nor random Weighted least squares
meta-regression analysis Research Synthesis Methods 8 19-42 doi 101002jrsm1211
Stanley T D Doucouliagos H(C) amp Ioannidis J P A 2017 Finding the power to reduce
publication bias Statistics in Medicine [Epub ahead of print] doi 101002sim7228
Sterling T D (1959) Publication decisions and their possible effects on inferences drawn from
tests of significance Or vice versa Journal of the American Statistical Association 54 30ndash34
Sterling T D Rosenbaum W L amp Weinkam J J (1995) Publication decisions revisited The
effect of the outcome of statistical tests on the decision to publish and vice versa American
Statistician 49 108ndash112 doi 1023072684823
Sutton A J Song F Gilbody S M amp Abrams K R (2000) Modelling publication bias in
meta-analysis A review Statistical Methods in Medical Research 9 421-445 doi
101177096228020000900503
Tressoldi P E amp Giofreacute D (2015) The pervasive avoidance of prospective statistical power
Major consequences and practical solutions Frontiers in Psychology 6 726
doi103389fpsyg201500726
van Aert R C M Jelte M Wicherts J M amp van Assen M A L M (2016) Conducting meta-
analyses based on p values Reservations and recommendations for applying p-uniform and p-
curve Perspectives on Psychological Science 11 713ndash729 doi 1011771745691616650874
van Bavel JJ Mende-Siedlecki PBrada WJ and Reinero DA 2016 Contextual sensitivity
in scientific reproducibility Proceedings of the National Academy of Sciences 113 6454ndash59
POWER BIAS AND HETEROGENEITY
46
van Erp S et al (2017) Estimates of between-study heterogeneity for 705 meta-analyses reported
in Psychological Bulletin from 1990ndash2013 Journal of Open Psychology Data 5(1) p4 DOI
httpdoiorg105334jopd33
Wicherts J M Veldkamp C L Augusteijn H E Bakker M van Aert R C amp Van Assen
M A (2016) Degrees of Freedom in Planning Running Analyzing and Reporting
Psychological Studies A Checklist to Avoid p-Hacking Frontiers in Psychology 7 doi
103389fpsyg201601832
Yuan K amp Maxwell S (2005) On the post hoc power in testing mean differences Journal of
Educational and Behavioral Statistics 30 141ndash167 doi 10310210769986030002141
POWER BIAS AND HETEROGENEITY
47
Table 1 Median Statistical Power and Average Effect Sizes
Mean Proportion with Adequate Power Median Power Type of Effect
Absolute Effect Sizes WLS WAAP-WLS PET-PEESE WLS WAAP-WLS PET-PEESE
Combined (n=200)
0389 0077 0071 0091 0364 0331 0360
Correlations (n=108)
0458 0243 0328 0272 0577 0610 0607
SMDs (n=92)
0291 0013 0000 0011 0230 0171 0170
Notes The numbers reported in the table are medians Mean absolute effect sizes are reported in this table in units of standardized mean differences (SMD) regardless of whether they were reported in the meta-analysis as correlations or as SMD WLS is the unrestricted weighted least squares weighted average WAAP-WLS is the weighted average of adequately powered effect sizes (WAAP) or WLS when there are no adequately powered studies PET-PEESE is the conditional precision-effect test-precision-effect estimate with standard error meta-regression correction for publication bias Adequate power is defined as 80 following Cohen (1977)
Table 2 Median Statistical Powers by Experimental Design Proportion with Adequate Power Median Power
Experimental Design WLS WAAP-WLS PET-PEESE WLS WAAP-WLS PET-PEESE
Observational (n=113)
0278 0259 0268 0621 0613 0585
Experimental (n=87)
0032 0000 0053 0247 0232 0236
Notes The numbers reported in the table are medians WLS is the unrestricted weighted least squares weighted average WAAP-WLS is the weighted average of adequately powered effect sizes (WAAP) or WLS when there are no adequately powered studies PET-PEESE is the conditional precision-effect test-precision-effect estimate with standard error meta-regression correction for publication bias Adequate power is defined as 80 following Cohen (1977)
Figure 1 Obtaining adequate power (80)
Notes x is distributed as a standard normal distribution N(01) 196 is the critical value for testing against 0 Figure 1 merely illustrates how the standardized mean of the sampling distribution needs to 28 standard errors away from 0 for an experiment to have adequate powermdashCohenrsquos 80 We thank Stephan Bruns for producing this graph
POWER BIAS AND HETEROGENEITY
49
Figure 2 Histograms of Adequately Powered Estimates from 200 Areas of Research
Notes WLS is the unrestricted weighted least squares weighted average WAAP-WLS is the weighted average of adequately powered effect sizes (WAAP) or WLS when there are no adequately powered studies PET-PEESE is the conditional precision-effect test-precision-effect estimate with standard error meta-regression correction for publication bias Adequate power is defined as 80 following Cohen (1977)
0
20
40
60
80
100
120N
um
ber
of M
eta-
An
alys
es
0 2 4 6 8 1Proportion of Studies Adequately Powered
WLS
0
20
40
60
80
100
120
Nu
mbe
r of
Met
a-A
nal
yses
0 2 4 6 8 1Proportion of Studies Adequately Powered
WAAP-WLS
0
20
40
60
80
100
120
Nu
mbe
r of
Met
a-A
nal
yses
0 2 4 6 8 1Proportion of Studies Adequately Powered
PET-PEESE
POWER BIAS AND HETEROGENEITY
50
Figure 3 Histograms of Median Statistical Power from 200 Areas of Research
Notes WLS is the unrestricted weighted least squares weighted average WAAP-WLS is the weighted average of adequately powered effect sizes (WAAP) or WLS when there are no adequately powered studies PET-PEESE is the conditional precision-effect test-precision-effect estimate with standard error meta-regression correction for publication bias Adequate power is defined as 80 following Cohen (1977)
0
10
20
30
40
50
60N
um
ber
of M
eta-
An
alys
es
0 2 4 6 8 1Median Statistical Power
WLS
0
10
20
30
40
50
60
Nu
mbe
r of
Met
a-A
nal
yses
0 2 4 6 8 1Median Statistical Power
WAAP-WLS
0
10
20
30
40
50
60
70
Nu
mbe
r of
Met
a-A
nal
yses
0 2 4 6 8 1Median Statistical Power
PET-PEESE
Figure 4 Histograms of I2 from 200 Areas of Research
Notes I2 is the proportion of observed variation among reported effect sizes that cannot be explained by the calculated standard errors associated with these reported effect sizes It is a relative measure of heterogeneity
0
5
10
15
20
25
30
35
40
45
0 2 4 6 8 1I-squared
Num
ber o
f Met
a-A
naly
ses
POWER BIAS AND HETEROGENEITY
52
Appendix A Studies included in the meta-meta-analysis
1 Baas M Nijstad B A Boot N C amp De Dreu C K W (2016) Mad genius revisited Vulnerability to psychopathology biobehavioral approach-avoidance and creativity Psychological Bulletin 142 668-692 doi101037bul0000049 [2]
2 Balliet D Li N P Macfarlan S J amp Van Vugt M (2011) Sex differences in cooperation A meta-analytic review of social dilemmas Psychological Bulletin 137 881ndash909 doi 101037a0025354 [1]
3 Balliet D Mulder L B amp Van Lange P A M (2011) Reward punishment and cooperation A meta-analysis Psychological Bulletin 137 594-615 doi 101037a0023489 [2]
4 Balliet D Wu J amp De Dreu C K W (2014) Ingroup favoritism in cooperation A meta-analysis Psychological Bulletin 140 1556-1581 doi 101037a0037737 [1]
5 Brewin C R (2014) Episodic memory perceptual memory and their interaction Foundations for a theory of posttraumatic stress disorder Psychological Bulletin 140 69ndash97 doi 101037a0033722 [1]
6 Byron K amp Khazanchi S (2011) Rewards and creative performance A meta-analytic test of theoretically derived hypotheses Psychological Bulletin 138 809ndash830 [1]
7 Cerasoli C P amp Nicklin J M (2014) Intrinsic motivation and extrinsic incentives jointly predict performance A 40-year meta-analysis Psychological Bulletin 140 980-1008 doi 101037a0035661 [1]
8 Chaplin T M amp Aldao A (2013) Gender differences in emotion expression in children A meta-analytic review Psychological Bulletin 139 735-765 doi 101037a0030737 [4]
9 Defoe I N Dubas JS amp Figner B (2015) A meta-analysis on age differences in risky decision making Adolescents versus children and adults Psychological Bulletin 141 48ndash84 doi 101037a0038088 [4]
10 Degner J amp Dalege J (2013) The apple does not fall far from the tree or does it A meta-analysis of parentndashchild similarity in intergroup attitudes Psychological Bulletin 139 1270ndash1304 doi 101037a0031436 [1]
11 Eastwick P W Finkel E J Luchies L B amp Hunt L L (2014) The predictive validity of ideal partner preferences A review and meta-analysis Psychological Bulletin 140 623ndash 665 doi 101037a0032432 [4]
12 Else-Quest N M Higgins A Allison C amp Morton L C (2012) Gender differences in self-conscious emotional experience Psychological Bulletin 138 947ndash981 doi101037a0027930 [5]
13 Fairbairn C E amp Sayette M A (2014) A social-attributional analysis of alcohol response Psychological Bulletin 140 1361-82 doi 101037a0037563 [4]
14 Fischer P Krueger J I Greitemeyer T Vogrincic C Kastenmuumlller A Frey D Heene M Wicher M amp Kainbacher M (2011) The bystander-effect A meta-analytic review on bystander intervention in dangerous and non-dangerous emergencies Psychological Bulletin 137 517ndash537 doi 101037a0023304 [1]
POWER BIAS AND HETEROGENEITY
53
15 Fox MC Ericsson A amp Best (2011) Do procedures for verbal reporting of thinking have to be reactive A meta-analysis and recommendations for best reporting methods Psychological Bulletin 137 316 ndash344 doi 101037a0021663 [2]
16 Fox N A You K H Bowman L C Cannon E N Ferrari P F Bakermans-Kranenburg M J Vanderwert R E amp van IJzendoorn M H (2016) Assessing human mirror activity with EEG mu rhythm A meta-analysis Psychological Bulletin 142 291ndash313 doi101037bul0000031 [2]
17 Freund P A amp Kasten N (2012) How smart do you think you are A meta-analysis on the validity of self-estimates of cognitive ability Psychological Bulletin 138 296-321 doi101037a0026556 [1]
18 Grijalva E Newman D A Tay L Donnellan M B Harms P D amp Robins R W (2015) Gender differences in narcissism A meta-analytic review Psychological Bulletin 141 261-310 doi 101037a0038231 [3]
19 Haedt-Matt A A amp Keel P K (2011) Revisiting the affect regulation model of binge eating A meta-analysis of studies using ecological momentary assessment Psychological Bulletin 137 660ndash681 doi 101037a0023660 [3]
20 Harkin B Webb T L Prestwich A Conner M Kellar I Benn Y amp Sheeran P (2016) Does monitoring goal progress promote goal attainment A meta-analysis of the experimental evidence Psychological Bulletin 142 198-229 doi 101037bul0000025 [2]
21 Houben M Van Den Noortgate W amp Kuppens P (2015) The relation between short-term emotion dynamics and psychological well-being A meta-analysis Psychological Bulletin 141 901-930 doi101037a0038822 [4]
22 Johnsen T J amp Friborg O (2015) The effects of cognitive behavioral therapy as an anti-depressive treatment is falling A meta-analysis Psychological Bulletin 141 747-768 [2]
23 Karlin B Zinger J F amp Ford R (2015) The effects of feedback on energy conservation A meta-analysis Psychological Bulletin 141 1205-1227 doi 101037a0039650 [1]
24 Kim S Thibodeau R amp Jorgensen R S (2011) Shame guilt and depressive symptoms A meta-analytic review Psychological Bulletin 137 68 ndash96 doi 101037a0021466 [2]
25 Klahr A M amp Burt S A (2014) Elucidating the etiology of individual differences in parenting A meta-analysis of behavioral genetic research Psychological Bulletin 140 544ndash586 doi 101037a0034205 [6]
26 Koenig A M Eagly A H Mitchell A A amp Ristikari T (2011) Are leader stereotypes masculine A meta-analysis of three research paradigms Psychological Bulletin 137 616 ndash 642 doi 101037a0023557 [4]
27 Kredlow M A Unger L D amp Otto M W (2016) Harnessing reconsolidation to weaken fear and appetitive memories A meta-analysis of post-retrieval extinction effects Psychological Bulletin 142 314ndash336 doi 101037bul0000034 [3]
28 Kuykendall L Tay L amp Ng V (2015) Leisure engagement and subjective well-being A meta-analysis Psychological Bulletin 141 364-403 doi101037a0038508 [3]
29 Landau M J amp Kay A C (2015) Compensatory control and the appeal of a structured world Psychological Bulletin 141 694ndash722 doi 101037a0038703 [1]
30 Lee E-S Park T-Y amp Koo B (2015) Identifying organizational identification as a basis for attitudes and behaviors A meta-analytic review Psychological Bulletin 141 1049ndash1080 doi 101037bul0000012 [1]
POWER BIAS AND HETEROGENEITY
54
31 Lui P P (2015) Intergenerational cultural conflict mental health and educational outcomes among Asian and Latinoa Americans Qualitative and meta-analytic review Psychological Bulletin 141 404-446 doi101037a0038449 [3]
32 Lull R B amp Bushman B J (2015) Do sex and violence sell A meta-analytic review of the effects of sexual and violent media and ad content on memory attitudes and buying intentions Psychological Bulletin 141 1022ndash1048 doi 101037bul0000018 [6]
33 Mazei J Freund P A Huumlffmeier J amp Stuhlmacher A F (2015) A meta-analysis on gender differences in negotiation outcomes and their moderators Psychological Bulletin 141 85ndash104 doi 101037a0038184 [1]
34 Melby-Lervaringg M Lyster S A amp Hulme C (2012) Phonological skills and their role in learning to read A meta-analytic review Psychological Bulletin 138 322ndash352 doi 101037a0026744 [3]
35 Melby-Lervaringg M amp Lervaringg A (2014) Reading comprehension and its underlying components in second-language learners A meta-analysis of studies comparing first- and second-language learners Psychological Bulletin 140 409ndash433 doi 101037a0033890
[4] 36 Mendelson J L Gates J A amp Lerner M D (2016) Friendship in school-age boys with
autism spectrum disorders A meta-analytic summary and developmental process-based model Psychological Bulletin 142 601-622 doi 101037bul0000041 [2]
37 Mol S E amp Bus A G (2011) To read or not to read A meta-analysis of print exposure from infancy to early adulthood Psychological Bulletin 137 267ndash296 doi 101037a0021890 [13]
38 Orquin J L amp Kurzban R (2016) A meta-analysis of blood glucose effects on human decision making Psychological Bulletin 142 546ndash567 doi 101037bul0000035 [1]
39 Ottaviani C Verkuil B Medea B Couyoumdjian A Thayer JF Lonigro A amp Brosschot J F (2016) Physiological concomitants of perseverative cognition A systematic review and meta-analysis Psychological Bulletin 142 No 3 231ndash259 doi 101037bul0000036 [8]
40 North M S amp Fiske S T (2015) Modern attitudes toward older adults in the aging world A cross-cultural meta-analysis Psychological Bulletin 141 993ndash1021 doi 101037a0039469 [1]
41 Pahlke E Hyde J S amp Allison C M (2014) The effects of single-sex compared with coeducational schooling on studentsrsquo performance and attitudes A meta-analysis Psychological Bulletin 140 1042-1072 doi 101037a0035740 [2]
42 Pan S C amp Rickard T C (2015) Sleep and motor learning Is there room for consolidation Psychological Bulletin 141 812-834 doi 101037bul0000009 [1]
43 Phillips W J Fletcher J M Marks A D G amp Hine D W (2016) Thinking styles and decision making A meta-analysis Psychological Bulletin 142 No 3 260ndash290 doi 101037bul0000027 [4]
44 Pool E Brosch T Delplanque S amp Sander D (2016) Attentional bias for positive emotional stimuli A meta-analytic investigation Psychological Bulletin 142 No 1 79ndash106 doi 101037bul0000026 [1]
45 Randall J G Oswald F L amp Beier M E (2014) Mind-wandering cognition and performance A theory-driven meta-analysis of attention regulation Psychological Bulletin 140 1411ndash1431 doi 101037a0037428 [4]
POWER BIAS AND HETEROGENEITY
55
46 Sambrook T D amp Goslin J (2015) A neural reward prediction error revealed by a meta-analysis of ERPs using great grand averages Psychological Bulletin 141 213ndash235 doi 101037bul0000006 [4]
47 Sedlmeier P Eberth J Schwarz M Zimmermann D Haarig F Jaeger S amp Kunze S (2012) The psychological effects of meditation A meta-analysis Psychological Bulletin 138 1139ndash1171 doi 101037a0028168 [20]
48 Sheeran P Harris P R and Epton T (2014) Does heightening risk appraisals change peoplersquos intentions and behavior A meta-analysis of experimental studies Psychological Bulletin 140 511ndash543 doi 101037a0033065 [2]
49 Smith S F amp Lilienfeld S O (2015) The response modulation hypothesis of psychopathy A meta-analytic and narrative analysis Psychological Bulletin 141 1145ndash1177 doi 101037bul0000024 [1]
50 Soderberg C K Amit E Callahan S P Kochersberger A O amp Ledgerwood A (2015) The effects of psychological distance on abstraction Two meta-analyses Psychological Bulletin 141 3 525ndash548 doi101037bul0000005 [2]
51 Tannenbaum M B Hepler J Zimmerman R S Saul L Jacobs S Wilson K amp Albarraciacuten D Appealing to fear A meta-analysis of fear appeal effectiveness and theories Psychological Bulletin 141 1178ndash1204 doi101037a0039729 [1]
52 Toosi N R Babbitt L G Ambady N amp Sommers SR (2012) Dyadic interracial interactions A meta-analysis Psychological Bulletin 138 1ndash27 doi 101037a0025767 [4]
53 Vachon D D Lynam D R amp Johnson J A (2014) The (Non)relation between empathy and aggression Surprising results from a meta-analysis Psychological Bulletin 140 751ndash773 doi 101037a0035236 [1]
54 Verhage M L Schuengel C Madigan S Fearon R M P Oosterman M Cassibba R Bakermans-Kranenburg M J amp van IJzendoorn M H (2016) Narrowing the transmission gap A synthesis of three decades of research on intergenerational transmission of attachment Psychological Bulletin 142 337ndash366 doi 101037bul0000038 [2]
55 von Stumm S amp Ackerman P L (2013) Investment and intellect A review and meta-analysis Psychological Bulletin 139 841ndash869 doi 101037a0030746 [11]
56 Voyer D amp Voyer S D (2014) Gender differences in scholastic achievement A meta-analysis Psychological Bulletin 140 1174-1204 doi 101037a0036620 [6]
57 Vucasović T amp Bratko D (2015) Heritability of personality A meta-analysis of behavior genetic studies Psychological Bulletin 141 769ndash785 doi101037bul0000017 [1]
58 Wanberg C R Hamann D J Kanfer R amp Zhang Z (2016) Age and reemployment success after job loss An integrative model and meta-analysis Psychological Bulletin 142 400-426 doi 101037bul0000019 [6]
59 Weingarten E Chen Q McAdams M Yi J amp Hepler J (2016) From primed concepts to action A meta-analysis of the behavioral effects of incidentally presented words Psychological Bulletin 142 472ndash497 doi 101037bul0000030 [1]
60 Williams M J amp Tiedens L Z (2016) The subtle suspension of backlash A meta-analysis of penalties for womenrsquos implicit and explicit dominance behaviour Psychological Bulletin 142 165ndash197 doi 101037bul0000039 [6]
POWER BIAS AND HETEROGENEITY
56
61 Winer E S amp Salem T (2016) Reward devaluation Dot-probe meta-analytic evidence of avoidance of positive information in depressed persons Psychological Bulletin 142 18ndash78 doi 101037bul0000022 [6]
Notes Numbers in square brackets denote the number of meta-analyses included in the dataset
Appendix B Distribution of survey estimates
Year
No of meta-analyses published
No of meta-analyses sampled
of published meta-studies
No of estimates
of sample
2016 17 14 82 46 22 2015 22 18 82 40 19 2014 25 12 48 46 22 2013 17 3 18 16 8 2012 15 6 40 34 16 2011 19 8 42 31 15

POWER BIAS AND HETEROGENEITY
47
Table 1 Median Statistical Power and Average Effect Sizes
Mean Proportion with Adequate Power Median Power Type of Effect
Absolute Effect Sizes WLS WAAP-WLS PET-PEESE WLS WAAP-WLS PET-PEESE
Combined (n=200)
0389 0077 0071 0091 0364 0331 0360
Correlations (n=108)
0458 0243 0328 0272 0577 0610 0607
SMDs (n=92)
0291 0013 0000 0011 0230 0171 0170
Notes The numbers reported in the table are medians Mean absolute effect sizes are reported in this table in units of standardized mean differences (SMD) regardless of whether they were reported in the meta-analysis as correlations or as SMD WLS is the unrestricted weighted least squares weighted average WAAP-WLS is the weighted average of adequately powered effect sizes (WAAP) or WLS when there are no adequately powered studies PET-PEESE is the conditional precision-effect test-precision-effect estimate with standard error meta-regression correction for publication bias Adequate power is defined as 80 following Cohen (1977)
Table 2 Median Statistical Powers by Experimental Design Proportion with Adequate Power Median Power
Experimental Design WLS WAAP-WLS PET-PEESE WLS WAAP-WLS PET-PEESE
Observational (n=113)
0278 0259 0268 0621 0613 0585
Experimental (n=87)
0032 0000 0053 0247 0232 0236
Notes The numbers reported in the table are medians WLS is the unrestricted weighted least squares weighted average WAAP-WLS is the weighted average of adequately powered effect sizes (WAAP) or WLS when there are no adequately powered studies PET-PEESE is the conditional precision-effect test-precision-effect estimate with standard error meta-regression correction for publication bias Adequate power is defined as 80 following Cohen (1977)
Figure 1 Obtaining adequate power (80)
Notes x is distributed as a standard normal distribution N(01) 196 is the critical value for testing against 0 Figure 1 merely illustrates how the standardized mean of the sampling distribution needs to 28 standard errors away from 0 for an experiment to have adequate powermdashCohenrsquos 80 We thank Stephan Bruns for producing this graph
POWER BIAS AND HETEROGENEITY
49
Figure 2 Histograms of Adequately Powered Estimates from 200 Areas of Research
Notes WLS is the unrestricted weighted least squares weighted average WAAP-WLS is the weighted average of adequately powered effect sizes (WAAP) or WLS when there are no adequately powered studies PET-PEESE is the conditional precision-effect test-precision-effect estimate with standard error meta-regression correction for publication bias Adequate power is defined as 80 following Cohen (1977)
0
20
40
60
80
100
120N
um
ber
of M
eta-
An
alys
es
0 2 4 6 8 1Proportion of Studies Adequately Powered
WLS
0
20
40
60
80
100
120
Nu
mbe
r of
Met
a-A
nal
yses
0 2 4 6 8 1Proportion of Studies Adequately Powered
WAAP-WLS
0
20
40
60
80
100
120
Nu
mbe
r of
Met
a-A
nal
yses
0 2 4 6 8 1Proportion of Studies Adequately Powered
PET-PEESE
POWER BIAS AND HETEROGENEITY
50
Figure 3 Histograms of Median Statistical Power from 200 Areas of Research
Notes WLS is the unrestricted weighted least squares weighted average WAAP-WLS is the weighted average of adequately powered effect sizes (WAAP) or WLS when there are no adequately powered studies PET-PEESE is the conditional precision-effect test-precision-effect estimate with standard error meta-regression correction for publication bias Adequate power is defined as 80 following Cohen (1977)
0
10
20
30
40
50
60N
um
ber
of M
eta-
An
alys
es
0 2 4 6 8 1Median Statistical Power
WLS
0
10
20
30
40
50
60
Nu
mbe
r of
Met
a-A
nal
yses
0 2 4 6 8 1Median Statistical Power
WAAP-WLS
0
10
20
30
40
50
60
70
Nu
mbe
r of
Met
a-A
nal
yses
0 2 4 6 8 1Median Statistical Power
PET-PEESE
Figure 4 Histograms of I2 from 200 Areas of Research
Notes I2 is the proportion of observed variation among reported effect sizes that cannot be explained by the calculated standard errors associated with these reported effect sizes It is a relative measure of heterogeneity
0
5
10
15
20
25
30
35
40
45
0 2 4 6 8 1I-squared
Num
ber o
f Met
a-A
naly
ses
POWER BIAS AND HETEROGENEITY
52
Appendix A Studies included in the meta-meta-analysis
1 Baas M Nijstad B A Boot N C amp De Dreu C K W (2016) Mad genius revisited Vulnerability to psychopathology biobehavioral approach-avoidance and creativity Psychological Bulletin 142 668-692 doi101037bul0000049 [2]
2 Balliet D Li N P Macfarlan S J amp Van Vugt M (2011) Sex differences in cooperation A meta-analytic review of social dilemmas Psychological Bulletin 137 881ndash909 doi 101037a0025354 [1]
3 Balliet D Mulder L B amp Van Lange P A M (2011) Reward punishment and cooperation A meta-analysis Psychological Bulletin 137 594-615 doi 101037a0023489 [2]
4 Balliet D Wu J amp De Dreu C K W (2014) Ingroup favoritism in cooperation A meta-analysis Psychological Bulletin 140 1556-1581 doi 101037a0037737 [1]
5 Brewin C R (2014) Episodic memory perceptual memory and their interaction Foundations for a theory of posttraumatic stress disorder Psychological Bulletin 140 69ndash97 doi 101037a0033722 [1]
6 Byron K amp Khazanchi S (2011) Rewards and creative performance A meta-analytic test of theoretically derived hypotheses Psychological Bulletin 138 809ndash830 [1]
7 Cerasoli C P amp Nicklin J M (2014) Intrinsic motivation and extrinsic incentives jointly predict performance A 40-year meta-analysis Psychological Bulletin 140 980-1008 doi 101037a0035661 [1]
8 Chaplin T M amp Aldao A (2013) Gender differences in emotion expression in children A meta-analytic review Psychological Bulletin 139 735-765 doi 101037a0030737 [4]
9 Defoe I N Dubas JS amp Figner B (2015) A meta-analysis on age differences in risky decision making Adolescents versus children and adults Psychological Bulletin 141 48ndash84 doi 101037a0038088 [4]
10 Degner J amp Dalege J (2013) The apple does not fall far from the tree or does it A meta-analysis of parentndashchild similarity in intergroup attitudes Psychological Bulletin 139 1270ndash1304 doi 101037a0031436 [1]
11 Eastwick P W Finkel E J Luchies L B amp Hunt L L (2014) The predictive validity of ideal partner preferences A review and meta-analysis Psychological Bulletin 140 623ndash 665 doi 101037a0032432 [4]
12 Else-Quest N M Higgins A Allison C amp Morton L C (2012) Gender differences in self-conscious emotional experience Psychological Bulletin 138 947ndash981 doi101037a0027930 [5]
13 Fairbairn C E amp Sayette M A (2014) A social-attributional analysis of alcohol response Psychological Bulletin 140 1361-82 doi 101037a0037563 [4]
14 Fischer P Krueger J I Greitemeyer T Vogrincic C Kastenmuumlller A Frey D Heene M Wicher M amp Kainbacher M (2011) The bystander-effect A meta-analytic review on bystander intervention in dangerous and non-dangerous emergencies Psychological Bulletin 137 517ndash537 doi 101037a0023304 [1]
POWER BIAS AND HETEROGENEITY
53
15 Fox MC Ericsson A amp Best (2011) Do procedures for verbal reporting of thinking have to be reactive A meta-analysis and recommendations for best reporting methods Psychological Bulletin 137 316 ndash344 doi 101037a0021663 [2]
16 Fox N A You K H Bowman L C Cannon E N Ferrari P F Bakermans-Kranenburg M J Vanderwert R E amp van IJzendoorn M H (2016) Assessing human mirror activity with EEG mu rhythm A meta-analysis Psychological Bulletin 142 291ndash313 doi101037bul0000031 [2]
17 Freund P A amp Kasten N (2012) How smart do you think you are A meta-analysis on the validity of self-estimates of cognitive ability Psychological Bulletin 138 296-321 doi101037a0026556 [1]
18 Grijalva E Newman D A Tay L Donnellan M B Harms P D amp Robins R W (2015) Gender differences in narcissism A meta-analytic review Psychological Bulletin 141 261-310 doi 101037a0038231 [3]
19 Haedt-Matt A A amp Keel P K (2011) Revisiting the affect regulation model of binge eating A meta-analysis of studies using ecological momentary assessment Psychological Bulletin 137 660ndash681 doi 101037a0023660 [3]
20 Harkin B Webb T L Prestwich A Conner M Kellar I Benn Y amp Sheeran P (2016) Does monitoring goal progress promote goal attainment A meta-analysis of the experimental evidence Psychological Bulletin 142 198-229 doi 101037bul0000025 [2]
21 Houben M Van Den Noortgate W amp Kuppens P (2015) The relation between short-term emotion dynamics and psychological well-being A meta-analysis Psychological Bulletin 141 901-930 doi101037a0038822 [4]
22 Johnsen T J amp Friborg O (2015) The effects of cognitive behavioral therapy as an anti-depressive treatment is falling A meta-analysis Psychological Bulletin 141 747-768 [2]
23 Karlin B Zinger J F amp Ford R (2015) The effects of feedback on energy conservation A meta-analysis Psychological Bulletin 141 1205-1227 doi 101037a0039650 [1]
24 Kim S Thibodeau R amp Jorgensen R S (2011) Shame guilt and depressive symptoms A meta-analytic review Psychological Bulletin 137 68 ndash96 doi 101037a0021466 [2]
25 Klahr A M amp Burt S A (2014) Elucidating the etiology of individual differences in parenting A meta-analysis of behavioral genetic research Psychological Bulletin 140 544ndash586 doi 101037a0034205 [6]
26 Koenig A M Eagly A H Mitchell A A amp Ristikari T (2011) Are leader stereotypes masculine A meta-analysis of three research paradigms Psychological Bulletin 137 616 ndash 642 doi 101037a0023557 [4]
27 Kredlow M A Unger L D amp Otto M W (2016) Harnessing reconsolidation to weaken fear and appetitive memories A meta-analysis of post-retrieval extinction effects Psychological Bulletin 142 314ndash336 doi 101037bul0000034 [3]
28 Kuykendall L Tay L amp Ng V (2015) Leisure engagement and subjective well-being A meta-analysis Psychological Bulletin 141 364-403 doi101037a0038508 [3]
29 Landau M J amp Kay A C (2015) Compensatory control and the appeal of a structured world Psychological Bulletin 141 694ndash722 doi 101037a0038703 [1]
30 Lee E-S Park T-Y amp Koo B (2015) Identifying organizational identification as a basis for attitudes and behaviors A meta-analytic review Psychological Bulletin 141 1049ndash1080 doi 101037bul0000012 [1]
POWER BIAS AND HETEROGENEITY
54
31 Lui P P (2015) Intergenerational cultural conflict mental health and educational outcomes among Asian and Latinoa Americans Qualitative and meta-analytic review Psychological Bulletin 141 404-446 doi101037a0038449 [3]
32 Lull R B amp Bushman B J (2015) Do sex and violence sell A meta-analytic review of the effects of sexual and violent media and ad content on memory attitudes and buying intentions Psychological Bulletin 141 1022ndash1048 doi 101037bul0000018 [6]
33 Mazei J Freund P A Huumlffmeier J amp Stuhlmacher A F (2015) A meta-analysis on gender differences in negotiation outcomes and their moderators Psychological Bulletin 141 85ndash104 doi 101037a0038184 [1]
34 Melby-Lervaringg M Lyster S A amp Hulme C (2012) Phonological skills and their role in learning to read A meta-analytic review Psychological Bulletin 138 322ndash352 doi 101037a0026744 [3]
35 Melby-Lervaringg M amp Lervaringg A (2014) Reading comprehension and its underlying components in second-language learners A meta-analysis of studies comparing first- and second-language learners Psychological Bulletin 140 409ndash433 doi 101037a0033890
[4] 36 Mendelson J L Gates J A amp Lerner M D (2016) Friendship in school-age boys with
autism spectrum disorders A meta-analytic summary and developmental process-based model Psychological Bulletin 142 601-622 doi 101037bul0000041 [2]
37 Mol S E amp Bus A G (2011) To read or not to read A meta-analysis of print exposure from infancy to early adulthood Psychological Bulletin 137 267ndash296 doi 101037a0021890 [13]
38 Orquin J L amp Kurzban R (2016) A meta-analysis of blood glucose effects on human decision making Psychological Bulletin 142 546ndash567 doi 101037bul0000035 [1]
39 Ottaviani C Verkuil B Medea B Couyoumdjian A Thayer JF Lonigro A amp Brosschot J F (2016) Physiological concomitants of perseverative cognition A systematic review and meta-analysis Psychological Bulletin 142 No 3 231ndash259 doi 101037bul0000036 [8]
40 North M S amp Fiske S T (2015) Modern attitudes toward older adults in the aging world A cross-cultural meta-analysis Psychological Bulletin 141 993ndash1021 doi 101037a0039469 [1]
41 Pahlke E Hyde J S amp Allison C M (2014) The effects of single-sex compared with coeducational schooling on studentsrsquo performance and attitudes A meta-analysis Psychological Bulletin 140 1042-1072 doi 101037a0035740 [2]
42 Pan S C amp Rickard T C (2015) Sleep and motor learning Is there room for consolidation Psychological Bulletin 141 812-834 doi 101037bul0000009 [1]
43 Phillips W J Fletcher J M Marks A D G amp Hine D W (2016) Thinking styles and decision making A meta-analysis Psychological Bulletin 142 No 3 260ndash290 doi 101037bul0000027 [4]
44 Pool E Brosch T Delplanque S amp Sander D (2016) Attentional bias for positive emotional stimuli A meta-analytic investigation Psychological Bulletin 142 No 1 79ndash106 doi 101037bul0000026 [1]
45 Randall J G Oswald F L amp Beier M E (2014) Mind-wandering cognition and performance A theory-driven meta-analysis of attention regulation Psychological Bulletin 140 1411ndash1431 doi 101037a0037428 [4]
POWER BIAS AND HETEROGENEITY
55
46 Sambrook T D amp Goslin J (2015) A neural reward prediction error revealed by a meta-analysis of ERPs using great grand averages Psychological Bulletin 141 213ndash235 doi 101037bul0000006 [4]
47 Sedlmeier P Eberth J Schwarz M Zimmermann D Haarig F Jaeger S amp Kunze S (2012) The psychological effects of meditation A meta-analysis Psychological Bulletin 138 1139ndash1171 doi 101037a0028168 [20]
48 Sheeran P Harris P R and Epton T (2014) Does heightening risk appraisals change peoplersquos intentions and behavior A meta-analysis of experimental studies Psychological Bulletin 140 511ndash543 doi 101037a0033065 [2]
49 Smith S F amp Lilienfeld S O (2015) The response modulation hypothesis of psychopathy A meta-analytic and narrative analysis Psychological Bulletin 141 1145ndash1177 doi 101037bul0000024 [1]
50 Soderberg C K Amit E Callahan S P Kochersberger A O amp Ledgerwood A (2015) The effects of psychological distance on abstraction Two meta-analyses Psychological Bulletin 141 3 525ndash548 doi101037bul0000005 [2]
51 Tannenbaum M B Hepler J Zimmerman R S Saul L Jacobs S Wilson K amp Albarraciacuten D Appealing to fear A meta-analysis of fear appeal effectiveness and theories Psychological Bulletin 141 1178ndash1204 doi101037a0039729 [1]
52 Toosi N R Babbitt L G Ambady N amp Sommers SR (2012) Dyadic interracial interactions A meta-analysis Psychological Bulletin 138 1ndash27 doi 101037a0025767 [4]
53 Vachon D D Lynam D R amp Johnson J A (2014) The (Non)relation between empathy and aggression Surprising results from a meta-analysis Psychological Bulletin 140 751ndash773 doi 101037a0035236 [1]
54 Verhage M L Schuengel C Madigan S Fearon R M P Oosterman M Cassibba R Bakermans-Kranenburg M J amp van IJzendoorn M H (2016) Narrowing the transmission gap A synthesis of three decades of research on intergenerational transmission of attachment Psychological Bulletin 142 337ndash366 doi 101037bul0000038 [2]
55 von Stumm S amp Ackerman P L (2013) Investment and intellect A review and meta-analysis Psychological Bulletin 139 841ndash869 doi 101037a0030746 [11]
56 Voyer D amp Voyer S D (2014) Gender differences in scholastic achievement A meta-analysis Psychological Bulletin 140 1174-1204 doi 101037a0036620 [6]
57 Vucasović T amp Bratko D (2015) Heritability of personality A meta-analysis of behavior genetic studies Psychological Bulletin 141 769ndash785 doi101037bul0000017 [1]
58 Wanberg C R Hamann D J Kanfer R amp Zhang Z (2016) Age and reemployment success after job loss An integrative model and meta-analysis Psychological Bulletin 142 400-426 doi 101037bul0000019 [6]
59 Weingarten E Chen Q McAdams M Yi J amp Hepler J (2016) From primed concepts to action A meta-analysis of the behavioral effects of incidentally presented words Psychological Bulletin 142 472ndash497 doi 101037bul0000030 [1]
60 Williams M J amp Tiedens L Z (2016) The subtle suspension of backlash A meta-analysis of penalties for womenrsquos implicit and explicit dominance behaviour Psychological Bulletin 142 165ndash197 doi 101037bul0000039 [6]
POWER BIAS AND HETEROGENEITY
56
61 Winer E S amp Salem T (2016) Reward devaluation Dot-probe meta-analytic evidence of avoidance of positive information in depressed persons Psychological Bulletin 142 18ndash78 doi 101037bul0000022 [6]
Notes Numbers in square brackets denote the number of meta-analyses included in the dataset
Appendix B Distribution of survey estimates
Year
No of meta-analyses published
No of meta-analyses sampled
of published meta-studies
No of estimates
of sample
2016 17 14 82 46 22 2015 22 18 82 40 19 2014 25 12 48 46 22 2013 17 3 18 16 8 2012 15 6 40 34 16 2011 19 8 42 31 15

POWER BIAS AND HETEROGENEITY
50
Figure 3 Histograms of Median Statistical Power from 200 Areas of Research
Notes WLS is the unrestricted weighted least squares weighted average WAAP-WLS is the weighted average of adequately powered effect sizes (WAAP) or WLS when there are no adequately powered studies PET-PEESE is the conditional precision-effect test-precision-effect estimate with standard error meta-regression correction for publication bias Adequate power is defined as 80 following Cohen (1977)
0
10
20
30
40
50
60N
um
ber
of M
eta-
An
alys
es
0 2 4 6 8 1Median Statistical Power
WLS
0
10
20
30
40
50
60
Nu
mbe
r of
Met
a-A
nal
yses
0 2 4 6 8 1Median Statistical Power
WAAP-WLS
0
10
20
30
40
50
60
70
Nu
mbe
r of
Met
a-A
nal
yses
0 2 4 6 8 1Median Statistical Power
PET-PEESE
Figure 4 Histograms of I2 from 200 Areas of Research
Notes I2 is the proportion of observed variation among reported effect sizes that cannot be explained by the calculated standard errors associated with these reported effect sizes It is a relative measure of heterogeneity
0
5
10
15
20
25
30
35
40
45
0 2 4 6 8 1I-squared
Num
ber o
f Met
a-A
naly
ses
POWER BIAS AND HETEROGENEITY
52
Appendix A Studies included in the meta-meta-analysis
1 Baas M Nijstad B A Boot N C amp De Dreu C K W (2016) Mad genius revisited Vulnerability to psychopathology biobehavioral approach-avoidance and creativity Psychological Bulletin 142 668-692 doi101037bul0000049 [2]
2 Balliet D Li N P Macfarlan S J amp Van Vugt M (2011) Sex differences in cooperation A meta-analytic review of social dilemmas Psychological Bulletin 137 881ndash909 doi 101037a0025354 [1]
3 Balliet D Mulder L B amp Van Lange P A M (2011) Reward punishment and cooperation A meta-analysis Psychological Bulletin 137 594-615 doi 101037a0023489 [2]
4 Balliet D Wu J amp De Dreu C K W (2014) Ingroup favoritism in cooperation A meta-analysis Psychological Bulletin 140 1556-1581 doi 101037a0037737 [1]
5 Brewin C R (2014) Episodic memory perceptual memory and their interaction Foundations for a theory of posttraumatic stress disorder Psychological Bulletin 140 69ndash97 doi 101037a0033722 [1]
6 Byron K amp Khazanchi S (2011) Rewards and creative performance A meta-analytic test of theoretically derived hypotheses Psychological Bulletin 138 809ndash830 [1]
7 Cerasoli C P amp Nicklin J M (2014) Intrinsic motivation and extrinsic incentives jointly predict performance A 40-year meta-analysis Psychological Bulletin 140 980-1008 doi 101037a0035661 [1]
8 Chaplin T M amp Aldao A (2013) Gender differences in emotion expression in children A meta-analytic review Psychological Bulletin 139 735-765 doi 101037a0030737 [4]
9 Defoe I N Dubas JS amp Figner B (2015) A meta-analysis on age differences in risky decision making Adolescents versus children and adults Psychological Bulletin 141 48ndash84 doi 101037a0038088 [4]
10 Degner J amp Dalege J (2013) The apple does not fall far from the tree or does it A meta-analysis of parentndashchild similarity in intergroup attitudes Psychological Bulletin 139 1270ndash1304 doi 101037a0031436 [1]
11 Eastwick P W Finkel E J Luchies L B amp Hunt L L (2014) The predictive validity of ideal partner preferences A review and meta-analysis Psychological Bulletin 140 623ndash 665 doi 101037a0032432 [4]
12 Else-Quest N M Higgins A Allison C amp Morton L C (2012) Gender differences in self-conscious emotional experience Psychological Bulletin 138 947ndash981 doi101037a0027930 [5]
13 Fairbairn C E amp Sayette M A (2014) A social-attributional analysis of alcohol response Psychological Bulletin 140 1361-82 doi 101037a0037563 [4]
14 Fischer P Krueger J I Greitemeyer T Vogrincic C Kastenmuumlller A Frey D Heene M Wicher M amp Kainbacher M (2011) The bystander-effect A meta-analytic review on bystander intervention in dangerous and non-dangerous emergencies Psychological Bulletin 137 517ndash537 doi 101037a0023304 [1]
POWER BIAS AND HETEROGENEITY
53
15 Fox MC Ericsson A amp Best (2011) Do procedures for verbal reporting of thinking have to be reactive A meta-analysis and recommendations for best reporting methods Psychological Bulletin 137 316 ndash344 doi 101037a0021663 [2]
16 Fox N A You K H Bowman L C Cannon E N Ferrari P F Bakermans-Kranenburg M J Vanderwert R E amp van IJzendoorn M H (2016) Assessing human mirror activity with EEG mu rhythm A meta-analysis Psychological Bulletin 142 291ndash313 doi101037bul0000031 [2]
17 Freund P A amp Kasten N (2012) How smart do you think you are A meta-analysis on the validity of self-estimates of cognitive ability Psychological Bulletin 138 296-321 doi101037a0026556 [1]
18 Grijalva E Newman D A Tay L Donnellan M B Harms P D amp Robins R W (2015) Gender differences in narcissism A meta-analytic review Psychological Bulletin 141 261-310 doi 101037a0038231 [3]
19 Haedt-Matt A A amp Keel P K (2011) Revisiting the affect regulation model of binge eating A meta-analysis of studies using ecological momentary assessment Psychological Bulletin 137 660ndash681 doi 101037a0023660 [3]
20 Harkin B Webb T L Prestwich A Conner M Kellar I Benn Y amp Sheeran P (2016) Does monitoring goal progress promote goal attainment A meta-analysis of the experimental evidence Psychological Bulletin 142 198-229 doi 101037bul0000025 [2]
21 Houben M Van Den Noortgate W amp Kuppens P (2015) The relation between short-term emotion dynamics and psychological well-being A meta-analysis Psychological Bulletin 141 901-930 doi101037a0038822 [4]
22 Johnsen T J amp Friborg O (2015) The effects of cognitive behavioral therapy as an anti-depressive treatment is falling A meta-analysis Psychological Bulletin 141 747-768 [2]
23 Karlin B Zinger J F amp Ford R (2015) The effects of feedback on energy conservation A meta-analysis Psychological Bulletin 141 1205-1227 doi 101037a0039650 [1]
24 Kim S Thibodeau R amp Jorgensen R S (2011) Shame guilt and depressive symptoms A meta-analytic review Psychological Bulletin 137 68 ndash96 doi 101037a0021466 [2]
25 Klahr A M amp Burt S A (2014) Elucidating the etiology of individual differences in parenting A meta-analysis of behavioral genetic research Psychological Bulletin 140 544ndash586 doi 101037a0034205 [6]
26 Koenig A M Eagly A H Mitchell A A amp Ristikari T (2011) Are leader stereotypes masculine A meta-analysis of three research paradigms Psychological Bulletin 137 616 ndash 642 doi 101037a0023557 [4]
27 Kredlow M A Unger L D amp Otto M W (2016) Harnessing reconsolidation to weaken fear and appetitive memories A meta-analysis of post-retrieval extinction effects Psychological Bulletin 142 314ndash336 doi 101037bul0000034 [3]
28 Kuykendall L Tay L amp Ng V (2015) Leisure engagement and subjective well-being A meta-analysis Psychological Bulletin 141 364-403 doi101037a0038508 [3]
29 Landau M J amp Kay A C (2015) Compensatory control and the appeal of a structured world Psychological Bulletin 141 694ndash722 doi 101037a0038703 [1]
30 Lee E-S Park T-Y amp Koo B (2015) Identifying organizational identification as a basis for attitudes and behaviors A meta-analytic review Psychological Bulletin 141 1049ndash1080 doi 101037bul0000012 [1]
POWER BIAS AND HETEROGENEITY
54
31 Lui P P (2015) Intergenerational cultural conflict mental health and educational outcomes among Asian and Latinoa Americans Qualitative and meta-analytic review Psychological Bulletin 141 404-446 doi101037a0038449 [3]
32 Lull R B amp Bushman B J (2015) Do sex and violence sell A meta-analytic review of the effects of sexual and violent media and ad content on memory attitudes and buying intentions Psychological Bulletin 141 1022ndash1048 doi 101037bul0000018 [6]
33 Mazei J Freund P A Huumlffmeier J amp Stuhlmacher A F (2015) A meta-analysis on gender differences in negotiation outcomes and their moderators Psychological Bulletin 141 85ndash104 doi 101037a0038184 [1]
34 Melby-Lervaringg M Lyster S A amp Hulme C (2012) Phonological skills and their role in learning to read A meta-analytic review Psychological Bulletin 138 322ndash352 doi 101037a0026744 [3]
35 Melby-Lervaringg M amp Lervaringg A (2014) Reading comprehension and its underlying components in second-language learners A meta-analysis of studies comparing first- and second-language learners Psychological Bulletin 140 409ndash433 doi 101037a0033890
[4] 36 Mendelson J L Gates J A amp Lerner M D (2016) Friendship in school-age boys with
autism spectrum disorders A meta-analytic summary and developmental process-based model Psychological Bulletin 142 601-622 doi 101037bul0000041 [2]
37 Mol S E amp Bus A G (2011) To read or not to read A meta-analysis of print exposure from infancy to early adulthood Psychological Bulletin 137 267ndash296 doi 101037a0021890 [13]
38 Orquin J L amp Kurzban R (2016) A meta-analysis of blood glucose effects on human decision making Psychological Bulletin 142 546ndash567 doi 101037bul0000035 [1]
39 Ottaviani C Verkuil B Medea B Couyoumdjian A Thayer JF Lonigro A amp Brosschot J F (2016) Physiological concomitants of perseverative cognition A systematic review and meta-analysis Psychological Bulletin 142 No 3 231ndash259 doi 101037bul0000036 [8]
40 North M S amp Fiske S T (2015) Modern attitudes toward older adults in the aging world A cross-cultural meta-analysis Psychological Bulletin 141 993ndash1021 doi 101037a0039469 [1]
41 Pahlke E Hyde J S amp Allison C M (2014) The effects of single-sex compared with coeducational schooling on studentsrsquo performance and attitudes A meta-analysis Psychological Bulletin 140 1042-1072 doi 101037a0035740 [2]
42 Pan S C amp Rickard T C (2015) Sleep and motor learning Is there room for consolidation Psychological Bulletin 141 812-834 doi 101037bul0000009 [1]
43 Phillips W J Fletcher J M Marks A D G amp Hine D W (2016) Thinking styles and decision making A meta-analysis Psychological Bulletin 142 No 3 260ndash290 doi 101037bul0000027 [4]
44 Pool E Brosch T Delplanque S amp Sander D (2016) Attentional bias for positive emotional stimuli A meta-analytic investigation Psychological Bulletin 142 No 1 79ndash106 doi 101037bul0000026 [1]
45 Randall J G Oswald F L amp Beier M E (2014) Mind-wandering cognition and performance A theory-driven meta-analysis of attention regulation Psychological Bulletin 140 1411ndash1431 doi 101037a0037428 [4]
POWER BIAS AND HETEROGENEITY
55
46 Sambrook T D amp Goslin J (2015) A neural reward prediction error revealed by a meta-analysis of ERPs using great grand averages Psychological Bulletin 141 213ndash235 doi 101037bul0000006 [4]
47 Sedlmeier P Eberth J Schwarz M Zimmermann D Haarig F Jaeger S amp Kunze S (2012) The psychological effects of meditation A meta-analysis Psychological Bulletin 138 1139ndash1171 doi 101037a0028168 [20]
48 Sheeran P Harris P R and Epton T (2014) Does heightening risk appraisals change peoplersquos intentions and behavior A meta-analysis of experimental studies Psychological Bulletin 140 511ndash543 doi 101037a0033065 [2]
49 Smith S F amp Lilienfeld S O (2015) The response modulation hypothesis of psychopathy A meta-analytic and narrative analysis Psychological Bulletin 141 1145ndash1177 doi 101037bul0000024 [1]
50 Soderberg C K Amit E Callahan S P Kochersberger A O amp Ledgerwood A (2015) The effects of psychological distance on abstraction Two meta-analyses Psychological Bulletin 141 3 525ndash548 doi101037bul0000005 [2]
51 Tannenbaum M B Hepler J Zimmerman R S Saul L Jacobs S Wilson K amp Albarraciacuten D Appealing to fear A meta-analysis of fear appeal effectiveness and theories Psychological Bulletin 141 1178ndash1204 doi101037a0039729 [1]
52 Toosi N R Babbitt L G Ambady N amp Sommers SR (2012) Dyadic interracial interactions A meta-analysis Psychological Bulletin 138 1ndash27 doi 101037a0025767 [4]
53 Vachon D D Lynam D R amp Johnson J A (2014) The (Non)relation between empathy and aggression Surprising results from a meta-analysis Psychological Bulletin 140 751ndash773 doi 101037a0035236 [1]
54 Verhage M L Schuengel C Madigan S Fearon R M P Oosterman M Cassibba R Bakermans-Kranenburg M J amp van IJzendoorn M H (2016) Narrowing the transmission gap A synthesis of three decades of research on intergenerational transmission of attachment Psychological Bulletin 142 337ndash366 doi 101037bul0000038 [2]
55 von Stumm S amp Ackerman P L (2013) Investment and intellect A review and meta-analysis Psychological Bulletin 139 841ndash869 doi 101037a0030746 [11]
56 Voyer D amp Voyer S D (2014) Gender differences in scholastic achievement A meta-analysis Psychological Bulletin 140 1174-1204 doi 101037a0036620 [6]
57 Vucasović T amp Bratko D (2015) Heritability of personality A meta-analysis of behavior genetic studies Psychological Bulletin 141 769ndash785 doi101037bul0000017 [1]
58 Wanberg C R Hamann D J Kanfer R amp Zhang Z (2016) Age and reemployment success after job loss An integrative model and meta-analysis Psychological Bulletin 142 400-426 doi 101037bul0000019 [6]
59 Weingarten E Chen Q McAdams M Yi J amp Hepler J (2016) From primed concepts to action A meta-analysis of the behavioral effects of incidentally presented words Psychological Bulletin 142 472ndash497 doi 101037bul0000030 [1]
60 Williams M J amp Tiedens L Z (2016) The subtle suspension of backlash A meta-analysis of penalties for womenrsquos implicit and explicit dominance behaviour Psychological Bulletin 142 165ndash197 doi 101037bul0000039 [6]
POWER BIAS AND HETEROGENEITY
56
61 Winer E S amp Salem T (2016) Reward devaluation Dot-probe meta-analytic evidence of avoidance of positive information in depressed persons Psychological Bulletin 142 18ndash78 doi 101037bul0000022 [6]
Notes Numbers in square brackets denote the number of meta-analyses included in the dataset
Appendix B Distribution of survey estimates
Year
No of meta-analyses published
No of meta-analyses sampled
of published meta-studies
No of estimates
of sample
2016 17 14 82 46 22 2015 22 18 82 40 19 2014 25 12 48 46 22 2013 17 3 18 16 8 2012 15 6 40 34 16 2011 19 8 42 31 15
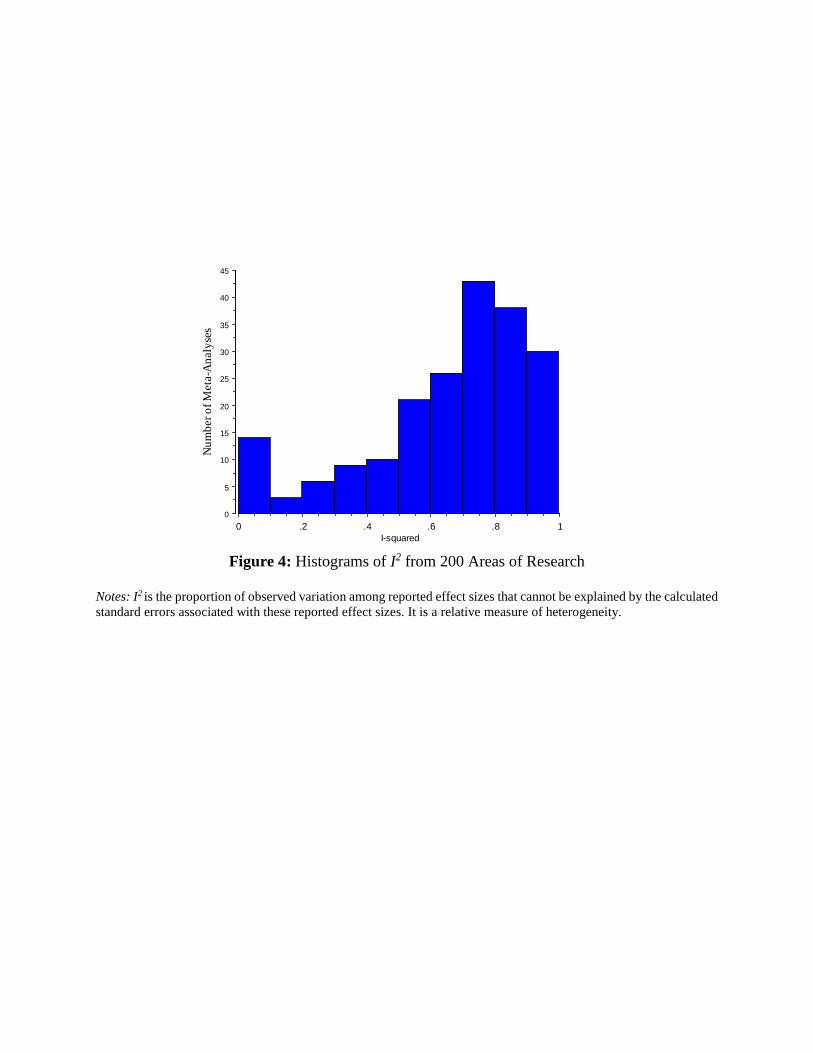

POWER BIAS AND HETEROGENEITY
54
31 Lui P P (2015) Intergenerational cultural conflict mental health and educational outcomes among Asian and Latinoa Americans Qualitative and meta-analytic review Psychological Bulletin 141 404-446 doi101037a0038449 [3]
32 Lull R B amp Bushman B J (2015) Do sex and violence sell A meta-analytic review of the effects of sexual and violent media and ad content on memory attitudes and buying intentions Psychological Bulletin 141 1022ndash1048 doi 101037bul0000018 [6]
33 Mazei J Freund P A Huumlffmeier J amp Stuhlmacher A F (2015) A meta-analysis on gender differences in negotiation outcomes and their moderators Psychological Bulletin 141 85ndash104 doi 101037a0038184 [1]
34 Melby-Lervaringg M Lyster S A amp Hulme C (2012) Phonological skills and their role in learning to read A meta-analytic review Psychological Bulletin 138 322ndash352 doi 101037a0026744 [3]
35 Melby-Lervaringg M amp Lervaringg A (2014) Reading comprehension and its underlying components in second-language learners A meta-analysis of studies comparing first- and second-language learners Psychological Bulletin 140 409ndash433 doi 101037a0033890
[4] 36 Mendelson J L Gates J A amp Lerner M D (2016) Friendship in school-age boys with
autism spectrum disorders A meta-analytic summary and developmental process-based model Psychological Bulletin 142 601-622 doi 101037bul0000041 [2]
37 Mol S E amp Bus A G (2011) To read or not to read A meta-analysis of print exposure from infancy to early adulthood Psychological Bulletin 137 267ndash296 doi 101037a0021890 [13]
38 Orquin J L amp Kurzban R (2016) A meta-analysis of blood glucose effects on human decision making Psychological Bulletin 142 546ndash567 doi 101037bul0000035 [1]
39 Ottaviani C Verkuil B Medea B Couyoumdjian A Thayer JF Lonigro A amp Brosschot J F (2016) Physiological concomitants of perseverative cognition A systematic review and meta-analysis Psychological Bulletin 142 No 3 231ndash259 doi 101037bul0000036 [8]
40 North M S amp Fiske S T (2015) Modern attitudes toward older adults in the aging world A cross-cultural meta-analysis Psychological Bulletin 141 993ndash1021 doi 101037a0039469 [1]
41 Pahlke E Hyde J S amp Allison C M (2014) The effects of single-sex compared with coeducational schooling on studentsrsquo performance and attitudes A meta-analysis Psychological Bulletin 140 1042-1072 doi 101037a0035740 [2]
42 Pan S C amp Rickard T C (2015) Sleep and motor learning Is there room for consolidation Psychological Bulletin 141 812-834 doi 101037bul0000009 [1]
43 Phillips W J Fletcher J M Marks A D G amp Hine D W (2016) Thinking styles and decision making A meta-analysis Psychological Bulletin 142 No 3 260ndash290 doi 101037bul0000027 [4]
44 Pool E Brosch T Delplanque S amp Sander D (2016) Attentional bias for positive emotional stimuli A meta-analytic investigation Psychological Bulletin 142 No 1 79ndash106 doi 101037bul0000026 [1]
45 Randall J G Oswald F L amp Beier M E (2014) Mind-wandering cognition and performance A theory-driven meta-analysis of attention regulation Psychological Bulletin 140 1411ndash1431 doi 101037a0037428 [4]
POWER BIAS AND HETEROGENEITY
55
46 Sambrook T D amp Goslin J (2015) A neural reward prediction error revealed by a meta-analysis of ERPs using great grand averages Psychological Bulletin 141 213ndash235 doi 101037bul0000006 [4]
47 Sedlmeier P Eberth J Schwarz M Zimmermann D Haarig F Jaeger S amp Kunze S (2012) The psychological effects of meditation A meta-analysis Psychological Bulletin 138 1139ndash1171 doi 101037a0028168 [20]
48 Sheeran P Harris P R and Epton T (2014) Does heightening risk appraisals change peoplersquos intentions and behavior A meta-analysis of experimental studies Psychological Bulletin 140 511ndash543 doi 101037a0033065 [2]
49 Smith S F amp Lilienfeld S O (2015) The response modulation hypothesis of psychopathy A meta-analytic and narrative analysis Psychological Bulletin 141 1145ndash1177 doi 101037bul0000024 [1]
50 Soderberg C K Amit E Callahan S P Kochersberger A O amp Ledgerwood A (2015) The effects of psychological distance on abstraction Two meta-analyses Psychological Bulletin 141 3 525ndash548 doi101037bul0000005 [2]
51 Tannenbaum M B Hepler J Zimmerman R S Saul L Jacobs S Wilson K amp Albarraciacuten D Appealing to fear A meta-analysis of fear appeal effectiveness and theories Psychological Bulletin 141 1178ndash1204 doi101037a0039729 [1]
52 Toosi N R Babbitt L G Ambady N amp Sommers SR (2012) Dyadic interracial interactions A meta-analysis Psychological Bulletin 138 1ndash27 doi 101037a0025767 [4]
53 Vachon D D Lynam D R amp Johnson J A (2014) The (Non)relation between empathy and aggression Surprising results from a meta-analysis Psychological Bulletin 140 751ndash773 doi 101037a0035236 [1]
54 Verhage M L Schuengel C Madigan S Fearon R M P Oosterman M Cassibba R Bakermans-Kranenburg M J amp van IJzendoorn M H (2016) Narrowing the transmission gap A synthesis of three decades of research on intergenerational transmission of attachment Psychological Bulletin 142 337ndash366 doi 101037bul0000038 [2]
55 von Stumm S amp Ackerman P L (2013) Investment and intellect A review and meta-analysis Psychological Bulletin 139 841ndash869 doi 101037a0030746 [11]
56 Voyer D amp Voyer S D (2014) Gender differences in scholastic achievement A meta-analysis Psychological Bulletin 140 1174-1204 doi 101037a0036620 [6]
57 Vucasović T amp Bratko D (2015) Heritability of personality A meta-analysis of behavior genetic studies Psychological Bulletin 141 769ndash785 doi101037bul0000017 [1]
58 Wanberg C R Hamann D J Kanfer R amp Zhang Z (2016) Age and reemployment success after job loss An integrative model and meta-analysis Psychological Bulletin 142 400-426 doi 101037bul0000019 [6]
59 Weingarten E Chen Q McAdams M Yi J amp Hepler J (2016) From primed concepts to action A meta-analysis of the behavioral effects of incidentally presented words Psychological Bulletin 142 472ndash497 doi 101037bul0000030 [1]
60 Williams M J amp Tiedens L Z (2016) The subtle suspension of backlash A meta-analysis of penalties for womenrsquos implicit and explicit dominance behaviour Psychological Bulletin 142 165ndash197 doi 101037bul0000039 [6]
POWER BIAS AND HETEROGENEITY
56
61 Winer E S amp Salem T (2016) Reward devaluation Dot-probe meta-analytic evidence of avoidance of positive information in depressed persons Psychological Bulletin 142 18ndash78 doi 101037bul0000022 [6]
Notes Numbers in square brackets denote the number of meta-analyses included in the dataset
Appendix B Distribution of survey estimates
Year
No of meta-analyses published
No of meta-analyses sampled
of published meta-studies
No of estimates
of sample
2016 17 14 82 46 22 2015 22 18 82 40 19 2014 25 12 48 46 22 2013 17 3 18 16 8 2012 15 6 40 34 16 2011 19 8 42 31 15
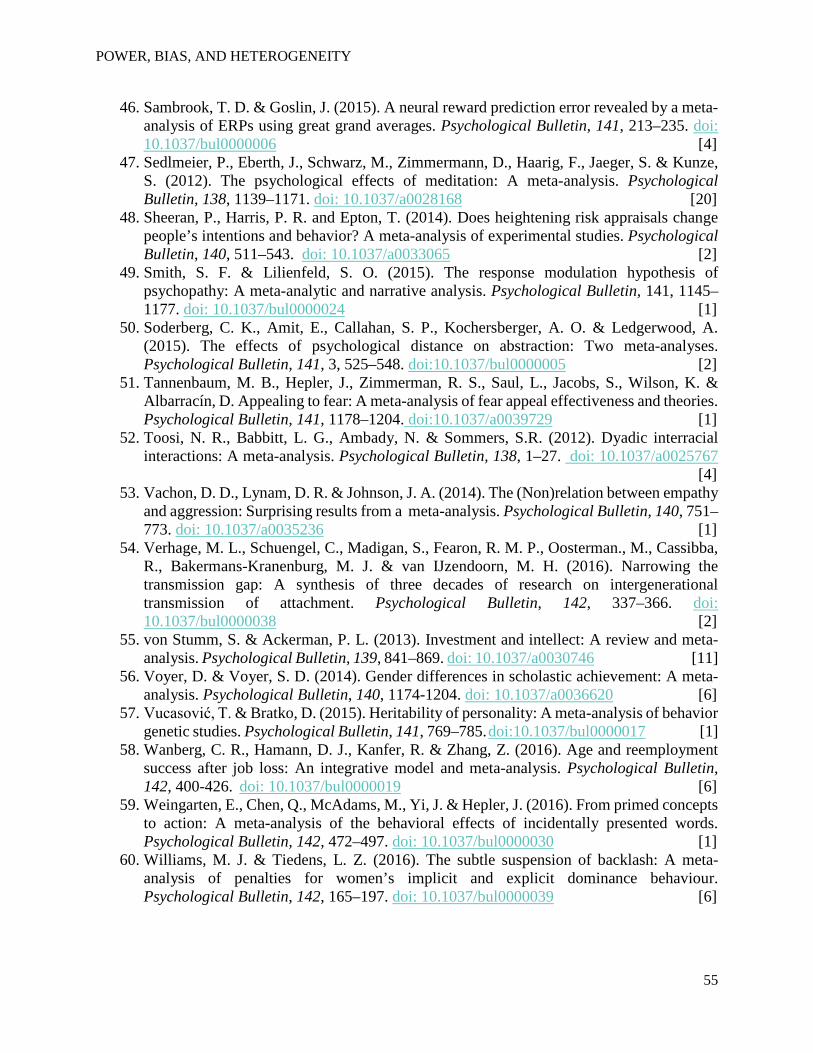
POWER BIAS AND HETEROGENEITY
56
61 Winer E S amp Salem T (2016) Reward devaluation Dot-probe meta-analytic evidence of avoidance of positive information in depressed persons Psychological Bulletin 142 18ndash78 doi 101037bul0000022 [6]
Notes Numbers in square brackets denote the number of meta-analyses included in the dataset
Appendix B Distribution of survey estimates
Year
No of meta-analyses published
No of meta-analyses sampled
of published meta-studies
No of estimates
of sample
2016 17 14 82 46 22 2015 22 18 82 40 19 2014 25 12 48 46 22 2013 17 3 18 16 8 2012 15 6 40 34 16 2011 19 8 42 31 15