dddd - fs.fed.us 1 = welldated classic fire scars. 2 ... table 8-patch analysis for 1893 fire...
TRANSCRIPT

1390 1400 1410 1420 1430 1440 1450 1460 1470 1460 1490 1500 1510 1520 1530 1540 1550 1560 1570 1580 1590 1600 1610 1620 1630 1640 1650 1660 1670 1660 1690 1700 1710 1720 1730 1740 1750 1760 1770 1760 1790 1600 1610 1620 1630 1640 1650 1860 1670 1990 1890 1900 1910 1920 1930 1940
D
D
ED DDDD D
D
H
DDH DDDDDDDDHH DH
DDHH HHH HH H
Key to origin date codes and scar types D s Douglar-flr
23 H = Western hemlock
2 1 = Welldated classic fire scars. 2 = Well-dated seers coverlng
2 over 25% ring circumference.
3 3 = Well-dated smaller scars of
probable flre origin.
2 L I
23
33
2 222 2
2
122223333 i
133 3
2 1 3
Figure 1 l-Histogram of all origin dates and scar dates at intensive sites in the Cook-Ouentin study area.
Forty-six stumps were sampled within a 4-ha area at four adjacent sites in a stand on a south slope at about 850 m elevation in the northeast sector of the Cook-Quentin study area. We expected this area to have experienced frequent fire. In the interval between 1400 and 1940, eighteen decades (33 percent) had at least one well-dated probable fire scar (fig. 11). Douglas-fir origin dates were present in 13 decades (24 percent). Between 1800 and 1940, there were four positive fire scars and 10 dec- ades with well-dated fire-related scars, ir dicating a possible mean fire interval of about 14 years during the 1800-1940 period.
53

Intensive-sampling results indicated that the complexity of the fire record observed at this site increased as a function of the number of tree-ring histories obtained at a site. The original sample of four stumps in this area recorded four major fires. Another five major fires were discovered after sampling 42 additional stumps.
Deer study area-An intensive sample was used to evaluate the effect of sample intensity on number of fires detected. In the Deer study area, a sample of 20 trees from four adjacent sites in a 6-ha area was taken in an old-growth stand that had been clearcut on a gentle northeast slope at 1100 m elevation. Previous sampling in the area indicated that the stand had a narrow distribution of ages and had experi- enced one fire.
All but one Douglas-fir origin date in this intensive sample occurred between 1560 and 1590. This narrow age range is likely the result of one major fire, as indicated by the original sample of four stumps in this stand. Additional sampling revealed that western hemlock was established 50 to 100 years after the last Douglas-fir origin date. A few scars of uncertain origin were recorded, but we found no conclusive evi- dence of low-severity fire in this stand. Increasing the number of samples taken at this site did not show an increase in the complexity of the fire record we observed.
Patch Characteristics and Fire-Severity Analysis
Cook-Quentin study area-A map was constructed to depict the complex mosaic of patches that resulted from three levels of stand disturbance by a 1893 fire in the Cook-Quentin study area (fig. 12). Extensive corridors of low-mortality stands ex- tended through a matrix of stands thinned by a medium-severity fire. Patches from high-mortality fire also occurred within this matrix. Of the total area burned by the fire, 53 percent was medium mortality, 18 percent was high mortality, and 29 per- cent was low mortality.
Patches created in this area by the 1893 fire were numerous and irregular (table 8). The patch-irregularity index (ratio of the perimeter of the patch divided by the peri- meter of a circle with the same area) was 1.52 for low-mortality patches and 1.33 for high-mortality patches. Both low- and high-mortality patches had high densities of edge.
54

r
0
KEY
q Hlgh Rre mortality
IEI] Medium Rre mortality
q Low Rre mortality
L
@ Oldest orlgln date(s) at site
+ Orlgln date(s) - not oldest q Orlgln date(s) and acar date(s)
A Scar date(s) only
0 No record of MS fire at site
n* nt A
Scale: 1 Km
0 0
0
96 0
0
0
0
0
0 -. Figure 12-Fire-mortality patches for 1893 fire episode in the Cook-Quentin study area.
55

Table 8-Patch analysis for 1893 fire episode in the Cook-Quentin study area
Patch type Area
Fire area
Mean patch Edge density irregularity Total
index edge Type 1a Type 2b
km2 percent km km per km2
Low mortality 1 .Ol 29 l.! 2 19.9 5.7 19.7
Medium mortality -1.88 53 - - - -
High mortality 0.62 18 1.33 18.1 5.2 29.2
Total 3.51
- = Not determined for medium mortality patches. a Total edge per total fire area. ’ Total edge per total patch type area.
Small patches dominated the size distribution of high-mortality patches created by the 1893 fire (fig. 13). Ninety-six percent of the high-mortality patches were less than 10 ha and covered 68 percent of the high-mortality area. Although 72 percent of the medium-mortality patches were less than IO ha, they accounted for only 5 percent of the area of medium mortality. Likewise, 70 percent of low-mortality patches were less than 10 ha but accounted for only 19 percent of the area. Nineteen percent of all patches were truncated by the boundary of the study area. Aerial photograph ana- lysis of boundaries of patches extending beyond study-area boundaries indicated that truncation does not markedly affect the patch-size distribution.
The patch distribution for the 1800-1900 period in the Cook-Quentin study area repre- sented the cumulative high, medium, and low mortality from all the fires during that period (fig. 14). Extensive patches and corridors of low-mortality areas formed a complex patch mosaic. Many high-mortality patches of variable size existed amid a medium-mortality matrix that covered 42 percent of the study area (table 9).
56

80
It _m 70 0
!2 6’3-1 :2
.g 50
E, 40
$2 a 30 II I
20
10
0 1 I 20
10
0
~10 20 30 40 50 60 70 80 90 loo 110 120 130 <lO 20 30 40 50 60 70 80 90 100 110 120 130
Patch size class (hectares) Patch size class (hectares)
High-mortal&y patches 100
90
80
2 m 70 u - 60 .!Y
In 50 .E
5 40
E 30 a
Medium-mortality patches
Low-mortality patches
Percent of patcher
Percent of aresln
p 70 u 0, 60 IN g 50
‘i 40
g30 0.
20
10
0
-A0 20 30 40 50 60 70 80 90 100 110 120 130 140
Patch size class (hectares)
Figure 13---Patch-size distribution for 1893 fire episode in the Cobk-Quentin study area.

Figure 14-Fire-mortality patches for 1800-1900 in the Cook- Quentin study area.
58

Table 9-Patch-analysis summary for 1800-1900 fires in the Cook-Quentin study area
Patch type Area
Fire area
Mean patch Edge density irregularity Total
index edge Type la Type 2b
km2 percent km km per km2
Low mortality 6.01 31 1.49 10.5 0.54 1.75
Medium mortality 8.24 42 - - - -
High mortality 5.30 27 1.45 94.8 4.85 17.89
Total 19.55
- = Not determined for medium mortality patches. a Total edge per total fire area. b Total edge per total patch type area.
The average irregularity index for the high-mortality patches was 1.45 and 1.49 for low-mortality patches. The total perimeter and edge density were about equal for low- and high-mortality patches. Small patches dominated the size distribution of patches as in the 1893 fire; 88 percent of high-mortality patches were less than I0 ha and accounted for 31 percent of the high-mortality area (fig. 15). Ninety-six percent of the high-mortality patches were less than 30 ha and accounted for 53 percent of the area. Two large patches (about 105 ha each) accounted for 39 percent of the area. Similar patch-size distributions existed for medium- and low-mortality patches.
Deer study area-Fires in 1800-1900 burned only 59 percent of the Deer study area, forming larger and less complex patches than in the Cook-Quentin study area (fig. 16). Much of the Deer study area burned at low severity in this period (table 10). Patch-size distribution was similar in many respects to the Cook-Quentin study area, but we found fewer patches less than 10 ha (fig. 17). Although 62 percent of high- mortality patches were less than 10 ha, they accounted for 17 percent of the high- mortality area. Eighty-nine percent of the high-mortality patches were less than 30 ha and accounted for 61 percent of the area. Similar patterns were observed for medium- mortality patches, Low-mortality patches less than 10 ha were frequent but occupied only 6 percent of the area. The shape of high-mortality patches was somewhat less irregular than in the Cook-Quentin study area. Low-mortality patches formed the matrix in the Deer study area; therefore, they had a higher irregularity index than in the Cook-Quentin study area.
(Text continues on page 64.)
59

High-mortality patches Medium-mortallty patches
'""1 a Pewem of palches
* 8o
i-4 70
3
Q) 2 60
.g 50
E g
40
& 30 a
20
90
10
0 I
Percent of wea In
Percent of palches
Percent of .rem In patches
w co 70 B a60 .!J .E 50
E 40
ti & 30 a
20
10
0
Patch size c&s (hectares) Patch size class (hectares)
Low-mortallty patches
Percent of palcher
PelCenl of ama In
8 m 70- u Q 60- .! z 50,
‘i 40- 0 $ 30- n
20 -
10
0 cl0 20 30 40 50 60 70 80 90 100 110 120 130
Patch size class (hectares)
Figure 15-Patch-size distribution for 1800-1900 in the Cook-Quentin study area.

8 High-morlallly patch N
q Medium-mortality parch
A
Scale: 1 Km
q Low-morlalily patch
..’ ‘. , :. . . . . . ,i ;...
Y . i .-.;. ‘- ;.: . . . . ..~
Figure 16-Fire mortality patches for 1800-1900 in the Deer study area.
61

Table 10-Patch-analysis summary for 1800-1900 fires in the Deer study area
Patch type Area
Fire area
Mean patch Edge density irregularity Total
index edge Type 1a Type 2b
km2 percent km km per km2
Low mortality 5.02
Medium mortality 3.64
43
32
1.52 51.0 4.4 19.2
High mortality 2.28 25 1.32 39.1 3.4 17.1
Total 11.54
- = Not determined for medium mortality patches. ’ Total edge per total fire area. * Total edge per total patch type area.
62

High-mortality patches Medium-mortality patches
Percent of patches
Percent of area In patches
Percent of petchea
Percent of area In patches
aI60 .s
aJ 60 .p! In u-2
.E 50 .c 50
E 8 40 E 8 40
& 30 z a
30 a
20 20
10 10
0 0
<lO 20 30 40 50 60 70 80 90 loo 110 120 130 <lO 20 30 40 50 60 70 80 90 100 110 120 130
Patch size class (hectares) Parch size class (hectares)
Low-mortality patches
Percent of patcher
Percent of mea In patches
ii 60 .!i z 50
E 8
40
& 30 a
20
cl0 20 30 40 SO 60 70 80 90 100 110 120 130 140
Patch size class (hectares)
Figure 17-Patch-size distribution for 1800-1900 in the Deer study area.
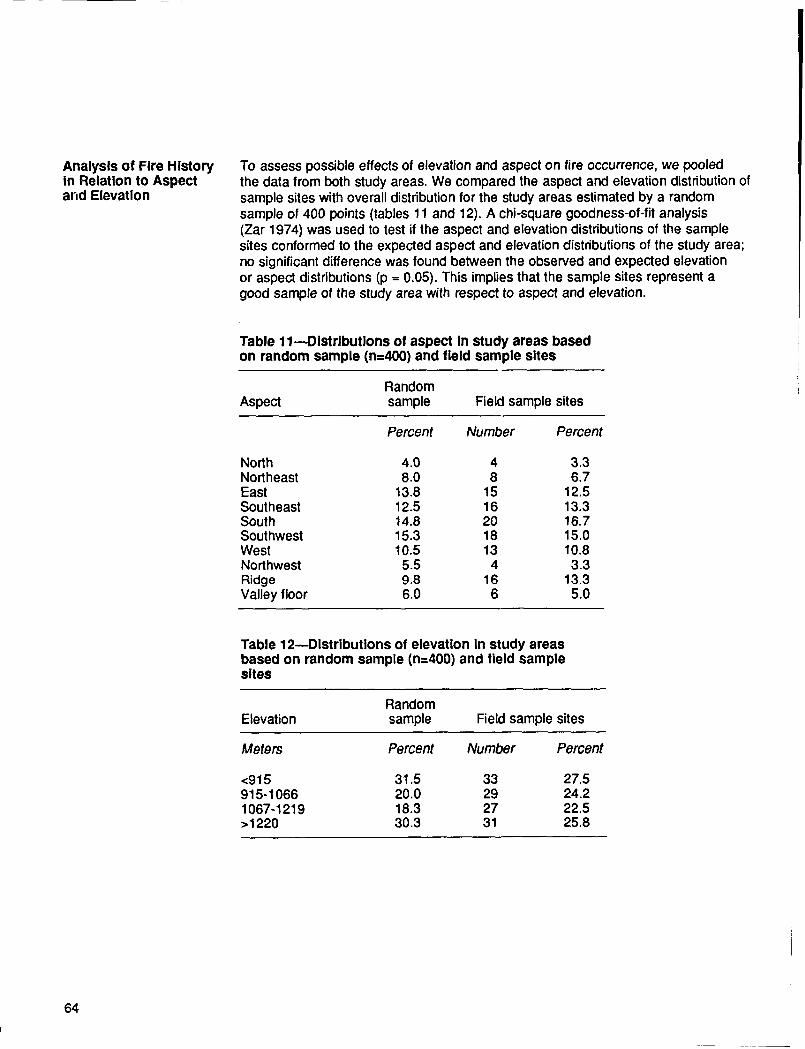
Analysis of Fire History in Relation to Aspect and Elevation
To assess possible effects of elevation and aspect on fire occurrence, we pooled the data from both study areas. We compared the aspect and elevation distribution of sample sites with overall distribution for the study areas estimated by a random sample of 400 points (tables 11 and 12). A M-square goodness-of-fit analysis (Zar 1974) was used to test if the aspect and elevation distributions of the sample sites conformed to the expected aspect and elevation distributions of the study area; no significant difference was found between the observed and expected elevation or aspect distributions (p = 0.05). This implies that the sample sites represent a good sample of the study area with respect to aspect and elevation.
Table 11--Distributions of aspect In study areas based on random sample (n=400) and field sample sites
Aspect
North Northeast East Southeast South Southwest West Northwest Ridge Valley floor
Random sample
Percent
4.0 8.0
13.8 12.5 14.8 15.3 10.5 5.5 9.8 6.0
Field sample sites
Number Percent
4 3.3 8 6.7
15 12.5 16 13.3 20 16.7 18 15.0 13 10.8 4 3.3
16 13.3 6 5.0
Table 12-Distributions of elevation In study areas based on random sample (N=400) and field sample sites
Elevation
Meters
<915 915-1066 1067-1219 >1220
Random sample
Percent
31.5 20.0 18.3 30.3
Field sample sites
Number Percent
33 27.5 29 24.2 27 22.5 31 25.8
64

Although apparent differences existed in various measures of site fire history that are dependent on aspect, low sample size in many aspect categories made these relations impossible to assess statistically (table 11). Site fire history is somewhat dependent on elevation (table 13). A single-factor analysis of variance and Newman- Keuls multiple range test (Zar 1974) revealed that the mean number of age classes and low-severity fires were significantly different (p = 0.05) between sites above and below 915 m elevation. The average fire frequencies for all fires and for only mod- erate and severe fires were significantly different between sites above and below 1067 m. In general, more age classes and more fires occurred at low elevations than at high elevations in the study areas.
Table 13-Analysis of fire history for both study areas in relation to aspect and elevation
Mean fire frequency
Position Age Low-severity class fires All fires
Moderate and high severity fires
Aspect: North Northeast East Southeast South Southwest West Northwest Ridge Valley floor
Elevation (meters): <915 915-1066 1067-1219 >1220
__-_ Mean number _ _ _ _ - - _ _ - _ - Years _ _ _ _ _ _ _ _ _
1.50 .75 242 311 1.88 .50 230 257 1.40 .53 210 250 1.88 1.13 120 179 2.05 1.05 174 221 1.94 .56 176 192 1.92 .85 183 270 2.75 1.25 99 125 1.81 .25 143 152 1.67 1 .00 172 281
2.49 1.42 90 151 1.83 .76 130 178 1.30 .37 254 300 1.71 .35 226 247
65

Discussion Because the objective of this study was to provide an extensive sample of fire fre- quency and severity in the two study areas, a high sample density was more impor- tant than high precision with rigorous dendrochronological techniques applied to a small number of trees. The sampling for the original reconnaissance study (with a sample density of about seven trees per km2) revealed a complex forest history, but the sample was inadequate for describing important aspects of fire history in the area. The resolution of the fire record was significantly increased by additional sampling in the two study areas. Sample density was increased to 14.7 trees per km2, one of the highest sampling densities for fire history studies reported in the literature (table 14). Nevertheless, because of the complexity of the fire regime, impor- tant aspects of the fire history still could not be addressed. Results from intensive sites indicate that even higher sampling densities than used in the study can yield a more complete fire record on some sites. On sites with one or two fires recorded in even-aged stands, little is gained by more intensive sampling.
In the central-western Cascade Range of Oregon, both frequent low- to moderate- severity fires and stand-replacement fires recurring at intervals of 6 to 800 years have been important. The relative importance of fires for each type is unknown. Results of this study and the work of Means (1981) and Stewart (1986) indicate that frequent, noncatastrophic fire was widespread in the central-western Cascade Range.
Comparison of the Fire History of the Two Study Areas
Many similarities exist in the fire history of the two study areas. During the last 300 years, only the 1834 fire in the Cook-Quentin study area burned more than one-third of either study area. Because all fires in the study areas extended beyond the area boundaries, the total area influenced by each fire was not determined. Fire was wide- spread during many fire episodes. The 1800 fire burned in both study areas. The 1849 and 1841 fires in the Cook-Quentin study area may be equivalent to the 1850 and 1838 fires in the Deer study area. Many of these fire episodes were also noted by Stewart (1984) in a study area 7 km to the northwest of the Cook-Quentin study area. In both study areas, fire was conspicuously absent between 1580 and 1650- a period bracketed by fairly high fire activity.
Table 14-Sampling densities of selected fire history studies
Study Trees sampled
no. per km2
Origin and probable fire scar dates Study area
no. per km2 km2
Morrison and Swanson (this study)
Hemstrom and Franklin (1982)
Tande (1979) Kilgore and Taylor (1979)
Arno (1976) Heinselman (1973)
13.8 19.8 39
1.3 1.3 770 8.1 9.6 432
12.1 36.6 14.5 ;:
2 0.9 3480
66

High Moderate Low Unburned
Fire-mortality class
Figure l&-Comparison of fire-severity distribution for patches created from fire during 1800-1900 in both study areas. DR = Deer and CQ = Cook-Quentin study areas.
Several fairly widespread fires burned through both study areas during 1490-1580. The number of fires and coincidence in dates between study areas during this period are difficult to determine because of the paucity of scar data, but at least three major fire episodes occurred in each study area during this interval. These fires mark the origin of much of the old-growth forest in the study areas. A few Douglas-fir stumps with origin dates between 1150 and 1220 are scattered through both study areas. Individual trees and scattered stands of similar age were found in other parts of the initial reconnaissance study area, indicating that fire activity was widespread during this period.
Although many similarities exist between the fire history of the two study areas, sub- stantial differences demonstrate significant heterogeneity in the fire history of the central-western Cascade Range. For instance, between 1500 and 1910 the natural fire rotation for the Cook-Quentin study area is 95 years compared to 149 years for the Deer study area. Based on calculated average fire frequencies of 96 years for the Cook-Quentin study area and 241 years for the Deer study area, the occurrence of fire appeared to be 2.4 times more frequent in the Cook-Quentin study area.
The 1800-1900 fires caused low mortality in the majority of the Deer study area, al- though the Cook-Quentin study area experienced mainly moderate mortality (fig. 18). Because some evidence showed more extensive fires of higher severity in both study areas before 1800 and the fire-seventy distribution may differ considerably from one fire to another, the distribution of fire severity cannot be assumed to remain constant through time.
67

The fire regime of the Cook-Quentin study area was characterized by fairly frequent,medium- to low-severity fires that have occasionally crowned out and createdpatches of even-aged stands; more commonly, these fires have thinned the pre-existing stand. The stands that have developed after these fires are generally multi-aged with an average of more than two age classes of early seral tree species.Regeneration from more than four fires was found at 16 percent of the sites.
Fire in the Deer study area was less frequent on the whole. Small fires of mediumto low severity occurred periodically in upper elevation areas and larger, stand-replacement fires occurred infrequently. Most of this study area burned at leastonce during three fire episodes in 1480 to 1580.
Although the two study areas are in close proximity, some significant environmental,climatic, and physiographic differences may explain contrasts in their fire history.Because the Deer study area is at a higher elevation than the Cook-Quentin studyarea, it has a colder and wetter climate that may have lead to less frequent fires.Fuels under these conditions in the Deer Creek area may rarely be conducive tocarrying fire. Fewer microsites of hot, dry fuels may exist in the relatively gentletopography of this area as compared to the Cook-Quentin study area. On the otherhand, this gentle topography may facilitate the spread of large, stand-replacementfires when rare favorable climatic conditions prevail. This combination of factorswould result in infrequent, but extensive stand-replacement fires observed in thelower elevations of the Deer study area.
In upper elevations of the Deer study area, lightning ignitions and exposure to desic-cating east winds may be frequent; the resulting fires usually do not spread farbecause of the numerous nonforest wet areas. These factors could lead to morefrequent, but less intense fires in the upper elevation parts of the Deer study area.
The complex topography of the Cook-Quentin study area forms many potential fireboundaries such as stream bottoms, sharp ridgetops, and changes in aspect andvegetation type. In this irregular landscape, great variation occurs in fuel ignitionpotential, rate of combustion, and rate of fire spread. Wind patterns are also highlyirregular in complex topography. These factors alter fire behavior, producing patchyfires of variable severity.
Fire regime was expected to vary with aspect and elevation. In the data from bothstudy areas, the low sample size and high variation in several aspect categoriesmade it impossible to test for significant differences in fire history with respect toaspect. Low elevation sites burned more frequently than higher elevation sites,mostly as a result of more frequent low-severity fires.
In both study areas, the fire record shows great variability from site to site. Somesites burned every 20 years, although others were fire-free for 500 years. Thisvariability is not explained by a simple analysis of aspect and elevation. A morecomplete analysis of topographic position, slope, aspect, and elevation may revealrelations between fire history and site characteristics that are not apparent here.
68

Fire History Scenariosfor Old-growth StandInitiation
Much of the forest of both study areas may be characterized as old-growth Douglas-fir similar to old-growth stands found elsewhere in the western Cascade Range(Franklin and others 1981, Franklin and Spies 1983). The circumstances surroundingthe establishment and growth of these stands provide insight into the dynamics ofold-growth stand development and maintenance.
We propose three scenarios to explain the origin of these old-growth stands. Eachscenario would produce a distinctive signature in the forest age structure and tree-ring record, and examples of each can be found in the old-growth forests of theCascade Range.
In one scenario, the fire regime consists of large, stand-replacement fires recurringevery 200 to 400+ years. In this scenario, a fire might cause a pattern of moderateage-spread of Douglas-fir trees in some stands because of slow restocking, causedby lack of seed source, brush establishment, and other factors. Site-to-site uniformityin age structure with some variation related to distance from seed source would beexpected. Fire scars on remnant trees from such an event would yield coincidentdates. Subsequent development of such a stand would be controlled by intertreecompetition and mortality from disease, windthrow, and other processes of very localextent. Release of late seral trees in small gaps created by the above processeswould be an important aspect of stand development. Some fire-sensitive, late seraltrees would approach the age of the Douglas-fir trees. Some of the fires and standsdescribed by Hemstrom and Franklin (1982) and Juday (1977) may represent ex-amples of this scenario.
In a second scenario, fire regime is characterized by a large catastrophic firefollowed by several reburns within a period of 50 years and then a long fire-freeinterval. The age distribution of Douglas-fir trees would be extended as a result ofvery slow restocking and patchy burning by the subsequent fires. In this case, thefire-scar record would yield some evidence of these reburns, and more site-to-sitevariation in age structure would be expected. Subsequent development of standsoriginating under this scenario would be similar to that described in the first sce-nario, except that the early development would be marked by substantial mortalityin areas that were reburned. Establishment of fire-sensitive species would postdatethe last reburn, creating more age spread between these trees and Douglas-firs thatmay have survived. Examples of this pattern are found in the Tillamook, Yacolt, andSeven-Mile Burns. Many of the old-growth stands within the Deer study area appearto have resulted from such a scenario.
In a third scenario, old-growth stands would result from a fire regime of multiple,patchy fires of varying severity recurring every 20 to 100 years. Narrow age spreadof Douglas-fir trees in stand replacement patches would be caused by rapid regenera-tion made possible by abundant surrounding seed source. Very wide age spread ofDouglas-fir trees within other stands would result from repeated low- and moderate-severity burns and subsequent regeneration. Development of such a stand would becontrolled to a large extent by the thinning effects of low- and moderate-severityburns. Intertree competition and mortality from disease, windthrow, and other small-scale disturbances would also play important but diminished roles. Fire-sensitivespecies would be less abundant and markedly younger in such stands compared to
69

stands operating under the first two senarios. Establishment of new Douglas-fir treesin gaps created by thinning fires would be an important aspect of stand development.A complex fire-scar record extending over many centuries would be a signature ofthis scenario. Most of the old-growth stands in the Cook-Quentin study area appearto have resulted from such a scenario.
Key to evaluating the fires that controlled establishment of old-growth stands was thefire-scar record found in the few trees older than 450 years. Evaluation of this infor-mation in the two study areas and in the large reconnaissance study area suggestedthat examples of each scenario may be found in the central-western Cascade Range.The first two scenarios were more prevalent in the rolling upland areas, and the thirdscenario was more prevalent in more dissected topography.
Persistence ofOld-Growth Forestsin the Natural FireRegime
Many old-growth stands in both study areas have persisted through low- to moderate-severity fire. At 8 percent of the sites in the two study areas with old-growth trees(over 200 years old), a forest canopy persisted and stand-replacement fires wereabsent for at least 750 years. At 95 percent of the old-growth sites in the Cook-Quentin study area, a forest canopy persisted through low- to moderate-severity fires.In the Deer study area, a forest canopy remained through low- to moderate-severityfire at 52 percent of the sites with old-growth trees. This persistence of old-growthforest conditions despite repeated under burns has been observed elsewhere in thePacific Northwest (Juday 1977; Means 1981; Stewart 1984, 1986; Yamaguchi 1986).
The physical characteristics of old-growth Douglas-fir stands explains their ability towithstand repeated fires. The height of the trees and the concentration of foliage inthe upper 50 percent of the bole (above 25 m in height) make crown fires less prob-able because sufficient heat cannot easily reach the canopy to ignite the crowns.Where a fuel ladder is present, the crowns may ignite in patches. Thick bark andextensive root mass in mineral soil are other fire-resistant characteristics of old-growth Douglas-fir trees.
Little attention has been given to the role of under burns in old-growth Douglas-firecosystems. These fires influenced succession in some areas by periodically re-moving fire-sensitive, late-seral species, and they may be one factor in the longtimelag before dominance is attained by climax species. Under burns undoubtedlyadded complexity to the structure of some old-growth Douglas-fir forests. On manysites in the study areas, new early seral trees established after low- to moderate-severity fires. These new trees grew in canopy openings in the thinned old-growthforest and lived to develop old-growth characteristics while their predecessors stillform a significant component of the stand. Live old-growth trees, large snags, largelogs, and high structural complexity may have been sustained in many sites fornearly 1,000 years under the natural fire regime. This pattern is radically differentfrom the classic concept of cycles of complete stand destruction and a sequence ofstand development in which old-growth stands occupy a site only a small percentageof the time (for example, 33 percent of the time, assuming a 300-year fire rotationand 200 years to achieve old-growth conditions). Although much of the Deer studyarea approximates this classic model, much of the Cook-Quentin study area fits themodel of sustained old-growth conditions, based on the criteria of the Old-GrowthDefinition Task group (1986) and Franklin and Spies (1983).
70

Human Influence on the Aboriginal ignition of forests in the western Cascade Range through intentional orFire Record accidental means is probable, but poorly documented. The Kalapuya Indians inten-
tionally burned grasslands of the Willamette Valley each fall (Burke 1979). Burke alsonotes that fire escape from aboriginal campfires was a probable cause of forest-fireignition. Aboriginal huckleberry drying on smouldering fires probably resulted inperiodic ignition of surrounding forests.3 Archeological investigations in the MiddleFork of the Willamette River indicate that aboriginal burning may have been signifi-cant (Winkler 1984; Paul Baxter, personal communication4) . Willamette NationalForest archaeologists5 have uncovered two aboriginal occupation sites in the Cook-Quentin study area and eight sites in the Deer study area, with numerous sites insurrounding areas.
Burke (1979) postulates that forest fire incidence increased during the Euro-Americansettlement period (1850-1910) because fires were started by trappers, miners, sheep-herders, explorers, and others. During this period, however, the average natural firerotation for both study areas was 213 years compared to 127 years for the 1750-1810 period. Fire was, thus, 1.7 times more prevalent during the aboriginal influenceperiod than during the Euro-American settlement period. But, during the short intervalfrom 1810 to 1850, when aboriginal populations were in decline from disease (Burke1979, Dicken and Dicken 1979) and when settlers had not yet entered the area inlarge numbers, the average natural fire rotation for both areas was 72 years. Light-ning may be responsible for igniting most of the fires during this period of low humaninfluence. The short timespan of each of these three periods combined with the ran-domness of fire occurrence may be responsible for the observed variation betweenperiods. Annual precipitation recorded by dendroclimatological reconstruction(Graumlich 1985) provides no evidence of a precipitation anomaly to explain thisvariation in the natural fire rotation between 1750 and 1910.
Kilgore and Taylor (1979) report a similar decrease in fire incidence in sequoia-mixedconifer forests of the western Sierra Nevada Mountains in the last half of the 1800’s.Regular, intentional, aboriginal burning of the Sierran forests is documented. Theysuggest that aboriginal people were a significant ignition source in parts of theSierras and that the dramatic decrease of aboriginal populations in the last halfof the 1800’s may be responsible for a decline in fire frequency.
Lightning is an ample cause of ignition of fires documented in this study. Burke(1979) documents the equivalent of 0.6 lightning ignited fires per year per km2 for1910-77, and certainly more undetected ignitions occurred. This rate of ignition issufficient to account for all fires documented in the study.
3 Personal communication, Don Minore, 1988, PacificNorthwest Research Station, Forestry Sciences Laboratory,3200 S.W. Jefferson Way, Corvallis, OR 97331.
4 Personal communication, Paul Baxter, 1988, Heritage Re-search Assoc., 1997 Garden Avenue, Eugene, OR 97403.
5 Personal communication, Jim Cox, 1988, Pacific NorthwestRegion, Mt. Baker-Snoqualmie National Forest, 1022 FirstAvenue, Seattle, WA 98104.
71
Although several very small fires were caused by humans or lightning, no major fireshave occurred in the study areas since 1910 (Burke 1979). Fire suppression effortsmay have successfully reduced fire spread, but the length of record is too short to tellif major wildfires have been eliminated from this landscape.
Conclusions andImplications
The two areas studied in the central-western Cascade Range exhibited significantdifferences and similarities in their fire regimes. Fires were less frequent, larger, andmore severe in the Deer study area than in the Cook-Quentin study area. The inci-dence of fire in both study areas was similar, averaging 15 years between firesduring the 1796-1893 interval and 32 years between fires during the 1515-1893interval. Many coincident dates of fire episodes between the two study areas indi-cated that fires were widespread.
The natural fire rotation between 1500 and 1910 for the Cook-Quentin study areawas 95 years and 149 years for the Deer study area. The average site fire frequencywas also less for the Cook-Quentin study area (96 years) than for the Deer studyarea (239 years). The natural fire rotation for the two areas as a whole was 119years, and the average fire frequency for the sites was 168 years. Differences be-tween fire regimes in the two study areas were, in part, because of differences inelevation and in topographic irregularity. The fire regimes of these study areas fit thegeneral regional pattern where relatively infrequent, stand-replacement fires are typi-cal in cold, wet climates and where more frequent, less severe fires are more com-mon in warmer, drier areas. Data from the larger area of reconnaissance study,however, suggest that the Cook-Quentin study area is more representative of thecentral-western Cascade Range than the Deer study area. These values may under-estimate fire frequency for two reasons. Early fires were poorly recorded because oftree mortality in later fires. Low-severity burns were also poorly recorded, and firesoccurring at less than five sample sites were not included in the analysis. Thesefactors biased our estimates toward a longer natural fire rotation and lower averagefire frequency at each site.
The incidence of fire was highly variable from site to site. Some sites burned every20 years on the average, and other sites burned once every 400 years. The fireregime has been apparently uniform for the last 600 years, except for some 50- to100-year periods of low fire activity.
Old-growth forests in these study areas may have originated from a sequence of firesof variable severity. Old-growth forest conditions were sustained in parts of thesestudy areas for many centuries despite repeated fires.
Human influence on the fire history is difficult to determine for the study areas. Thehighest fire frequency in both study areas was during a period of least human influ-ence. Native people may have been responsible for some fire ignition. No major fireshave occurred in either study area since 1893. Similar fire-free periods occurred inthe past, possibly caused by climatic conditions or chance; the current fire-free periodcould be attributed to these factors or fire suppression.
72

Interest is rising in the influence of natural and human-created patches on the forestlandscape (Franklin and Forman 1987, Harris 1984). To evaluate how patches fromharvesting affect the dynamics of forest ecosystems, scientists, land managers, andothers should consider the landscape pattern in the primeval landscape. Fires in theCook-Quentin and Deer study areas during the 1800’s created patches of high mor-tality ranging from less than 0.2 ha to about 100 ha, but 86 percent of these patcheswere less than 16 ha, the average size of a clearcut on Forest Service land in theregion. Although a few large patches influenced more area, patches smaller than anaverage clearcut covered a large portion of the landscape. Although elsewhere in thePacific Northwest, fires are known to have created some large, stand replacementpatches, it is not known whether small or large patches are predominant. To an im-portant extent, the scale of analysis determines the patch-size distribution and thedensity of stand edge that are discerned.
The patch-size distribution, the density o edge, and the dynamics of age-classpatches in natural and managed forests influence the following: output of the sedi-ment and streamflow from watersheds; the abundance and diversity of wildlife (Blackand Thomas 1978, Thomas and others 1978, Welty 1982); effects of secondary dis-turbances, such as windthrow; and effects of interactions between patches in standdevelopment. Fire suppression and possibly decline in aboriginal ignition greatly dimi-nished the contrast between adjacent patches from the late 1800’s until logging be-gan in the 1950’s. Just before logging, all of the edges in these study areas occurredbetween mature and old-growth stands, and contrast between patches was minor.Before 1900, contrast between patches created by fire and the surrounding forestwas moderated by the presence of snags, logs, and remnant trees in fire-createdpatches. Today, contrasts between clearcut patches and remnant forests are morepronounced because these structural elements are scarce in clearcuts and second-growth stands.
Acknowledgments This report is partly from work that led to Morrison’s master’s professional paper in1984 at the University of Washington. James Agee (National Park Service - Universityof Washington Cooperative Studies Unit) provided invaluable advice during the anal-ysis phase of the project. This help, as well as his review of the draft manuscript, isgreatly appreciated. A. McKee, J. Franklin, M. Hemstrom, T. Spies, and J. Meansprovided helpful suggestions and stimulating discussion during several phases of thestudy; P. Teensma assisted in data collection at several sites and reviewed the draftmanuscript. Funding for this study was provided by the National Science Foundation(Grant No. BRS-8508356 and BRS-8514325) and the USDA Forest Service, PacificNorthwest Research Station (Cooperative Agreement No. 84-355).
I English Equivalents 1 square kilometer (km2) = 0.39 square mile1 hectare (ha) = 2.47 acres1 millimeter (mm) = 0.039 inch1 centimeter (cm) = 0.39 inch1 meter (m) = 1.09 yards
73

References Arno, S.F. 1976. The historical role of fire on the Bitterroot National Forest. Res.Pap. INT-187. Ogden, UT: U.S. Department of Agriculture, Forest Service, Inter-mountain Forest and Range Experiment Station. 29 p.
Arno, S.F. 1982. Classifying forest succession on four habitat types in westernMontana. In: Means, Joseph E., ed. Forest succession and stand developmentresearch in the Northwest: Proceedings of a symposium; 1981 March 26;Corvallis, OR. Corvallis, OR: Forest Research Laboratory. Oregon StateUniversity: 54-62.
Arno, S.F.; Sneck, K.M. 1977. A method for determining fire history in coniferousforests of the mountain West. Gen. Tech Rep. INT-42. Ogden, UT: U.S. Depart-ment of Agriculture, Forest Service, Intermountain Forest and Range ExperimentStation. 28 p.
Atzet, Thomas; Wheeler, David; Gripp, Russell. 1986. Fire and forestry insouthwest Oregon. Fir Report. Corvallis, OR: Oregon State University. 9(4): 4-7.
Black, H., Jr.; Thomas, J.W. 1978. Forest and range wildlife habitat management:ecological principles and management systems. In: Proceedings of the workshopon nongame bird habitat management in the coniferous forests of the WesternUnited States. Gen. Tech. Rep. PNW-64. Portland, OR: U.S. Department ofAgriculture, Forest Service, Pacific Northwest Forest and Range ExperimentStation: 47-55.
Boone, RD.; Cromack, K., Jr.; Sollins, P. 1982. Changes in soil carbon levelsthrough a forest mortality wave induced by Phellinus weiri. Bulletin of the Eco-logical Society of America. 63(2): 181. Abstract.
Burke, Constance J. 1979. Historic fires in the central western Cascades, Oregon.Corvallis, OR: Oregon State University. 130 p. M.S. thesis.
Childs, T.W.; Shea, K.R. 1967. Annual losses from diseases in Pacific Northwestforests. Resour. Bull. PNWQO. Portland, OR: U.S. Department of Agriculture,Forest Service, Pacific Northwest Forest and Range Experiment Station. 19 p.
Cook, S.A. 1982. Stand development in the presence of a pathogen, Phellinus weirii.In: Means, Joseph E., ed. Forest successsion and stand development research inthe Northwest: Proceedings of a symposium; 1981 March 26; Corvallis, OR.Corvallis, OR: Forest Research Laboratory. Oregon State University: 159-163.
Craighead, F.C. 1927. Abnormalities in annual rings resulting from fires. Journal ofForestry. 25(7): 840-842.
Dicken, S.N.; Dicken, E.F. 1979. The making of Oregon. Portland, OR: OregonHistorical Society. 208 p.
Dieterich, J.H. 1980. Chimney Spring forest fire history. Res. Pap. RM-220. FortCollins, CO: U.S. Department of Agriculture, Forest Service, Rocky MountainForest and Range Experiment Station. 8 p.
I 74

Dyrness, C.T.; Franklin, Jerry F.; Moir, W.H. 1974. A preliminary classification offorest communities in the central portion of the western Cascades in Oregon.Conif. For. Biome Bull. 7. Seattle: University of Washington. 248 p.
Franklin, J.F.; Cromack, K., Jr.; Denison, W. [and others]. 1981. Ecologicalcharacteristics of old-growth Douglas-fir forests. Gen. Tech. Rep. PNW-118.Portland, OR: U.S. Department of Agriculture, Forest Service, Pacific NorthwestForest and Range Experiment Station. 48 p.
Franklin, Jerry F.; Dyrness, C.T. 1973. Natural vegetation of Oregon andWashington. Gen. Tech. Rep. PNW8. Portland, OR: U.S. Department ofAgriculture, Forest Service, Pacific Northwest Forest and Range ExperimentStation. 417 p.
Franklin, Jerry F.; Forman, Richard T.T. 1987. Creating landscape patterns bycutting: ecological consequences and principles. Landscape Ecology. 1(1): 5-18.
Franklin, Jerry F.; Spies, T.A. 1984. Characteristics of old-growth Douglas-firforests. In: Proceedings, SAF national convention; 1983 October 16-20; Portland,OR. Washington, DC: Society of American Foresters: 328-334.
Gratkowski, H.J. 1956. Windthrow around staggered settings in old-growth Douglas-fir. Forest Science. 2: 60-74.
Graumllch, Lisa. 1965. Long-term records of temperature and precipitation in thePacific Northwest derived from tree rings. Seattle, WA: University of Washington.198 p. Ph.D. Dissertation.
Harris, Larry D. 1984. The fragmented forest. Chicago, IL: The University of ChicagoPress. 211 p.
Heinselman, M.L. 1973. Fire in the virgin forests of the Boundary Waters CanoeArea, Minnesota. Quaternary Research. 3(3): 329-382.
Hemstrom, Miles A.: Franklin, J.F. 1982. Fire and other disturbances of the forestsin Mount Rainier National Park. Quaternary Research. 18: 32-51.
Hickman, James C. 1976. Non-forest vegetation of the central western CascadeMountains of Oregon. Northwest Science. 50(3): 145-155.
Hitchcock, C. Leo; Cronquist, Arthur. 1973. Flora of the Pacific Northwest: anillustrated manual. Seattle, WA: University of Washington Press. 730 p.
Juday, Glenn Patrlck. 1977. The location, composition, and structure of old-growthforests of the Oregon Coast Range. Corvallis, OR: Oregon State University. 140 p.Ph.D. dissertation,
Keen, F.P. 1937. Climatic cycles in eastern Oregon as indicated by tree rings.Monthly Weather Review. 65(5): 175-188.
75

Kilgore, B.M.; Taylor, D. 1979. Fire history of a sequoia-mixed conifer forest.Ecology. 60(1): 129-142.
Lynott, R.E.; Cramer, O.P. 1966. Detailed analysis of the 1962 Columbus Daywindstorm in Oregon and Washington. Monthly Weather Review. 94: 105-117.
Martin, R.E.; Robinson, D.D.; and Schaeffer, W.H. 1976. Fire in the PacificNorthwest--perspectives and problems. In: Proceedings, 15th annual Tall Tim-bers Fire Ecology Conference, Tallahassee, FL: Tall Timbers Research Station.15: 1-23.
Means, Joseph E. 1981. Development history of dry coniferous forests in the centralwestern Cascade Range of Oregon. In: Proceedings of Forest succession andstand development research; 1981 March 26; Corvallis, OR. Corvallis: ForestResearch Laboratory, Oregon State University: 142-158.
Morris, William G. 1934. Forest fires in western Oregon and western Washington.Oregon Historical Quarterly. 35: 313-339.
Morrison, Peter H. 1975. Ecological and geomorphological consequences of massmovements in the Alder Creek watershed and implications for forest land manage-ment. Eugene, OR: University of Oregon 102 p. B.A. thesis.
Old-Growth Definition Task Group. 1966. Interim definitions for old-growth Douglas-fir and mixed-conifer forests in the Pacific Northwest and California. Res. NotePNW-447. Portland, OR: U.S. Department of Agriculture, Forest Service, PacificNorthwest Research Station. 7 p.
Orr, P.W. 1963. Windthrown timber survey in the Pacific Northwest, 1962. Portland,OR: U.S. Department of Agriculture, Forest Service, Insect and Disease ControlBranch, Division of Timber Management, Pacific Northwest Region. 22 p.
Plummer, F.G. 1903. Central portion of the Cascade Range Forest Reserve. In:Forest conditions in the Cascade Range Forest Reserve. Prof. Pap. 9, Ser. H.Forestry 6. Washington, DC: U.S. Department of the Interior, Geological Survey:71-146.
Romme, William. 1980. Fire history terminology: Report of the ad hoc committee In:Stokes, M.A., Dieterich, J. H., tech. coords. Proceedings of the Fire History Work-shop. Oct. 20-24, 1980. Tucson, AZ. Gen. Tech. Rep. RM-81. Fort Collins, CO:U.S. Department of Agriculture, Forest Service, Rocky Mountain Forest and RangeExperiment Station 142 p.
Rudlnsky, J.A., ed. 1979. Forest insect survey and control: a syllabus. Corvallis, OR:Oregon State University Book Store Inc. Oregon State University. 391 p.
Stewart, Glenn H. 1984. Forest structure and regeneration in the Tsuga heterophylla-Abies amabilis transition zone, central western Cascades, Oregon. Corvallis, OR:Oregon State University. 150 p. Ph.D. dissertation.
76

Stewart, Glenn H. 1986. Population dynamics of a montane conifer forest westernCascade Range, Oregon, USA. Ecology. 67: 534-544.
Tande, G.F. 1979. Fire history and vegetation pattern of coniferous forests in JasperNational Park, Alberta. Canadian Journal of Botany 57: 1912-1931.
Thomas, J.W.; Maser, C.; Rodlek, J.E. 1978. Edges-their interspersion, resultingdiversity and its measurement. In: Proceedings of the workshop on nongame birdhabitat management in the coniferous forests of the Western United States: Feb.7-9, 1977, Gen. Tech. Rep. PNW-64. Portland, OR: U.S. Department of Agricul-ture, Forest Service, Pacific Northwest Forest and Range Experiment Station:91-100.
Waring, R.H.; Holbo, H.R.; Bueb, R.P.; Fredriksen, R.L. 1978. Documentation ofmeteorological data from the Coniferous Forest Biome primary station in Oregon.Gen. Tech. Rep. PNW-73. Portland, OR: U.S. Department of Agriculture, ForestService, Pacific Northwest Forest and Range Experiment Station. 23 p.
Welty, J.C. 1978. The life of birds. New York: CBS College Publishing. 754 p.
Wickman, Boyd E.; Mason, Richard R.; Thompson, C.G. 1973. Major outbreaks ofthe Douglas-fir tussock moth in Oregon and California. Gen. Tech. Rep. PNW-5.Portland, OR: U.S. Department of Agriculture, Forest Service, Pacific NorthwestForest and Range Experiment Station, 18 p.
Winkler, Carol J. 1984. A site location analysis for the Middle Fork of the WillametteRiver watershed. Eugene, OR: University of Oregon. 63 p. M.S. thesis.
Yamaguchi, David K. 1986. The development of old-growth Douglas-fir forestsnortheast of Mount St. Helens, Washington, following an 1480 eruption. Seattle:University of Washington. 100 p. Ph.D. dissertation.
Zackrisson, Olle. 1986. Forest fire history: ecological significance and datingproblems in the north Swedish boreal forest. In: Stokes, M.A.; Dieterich, J.H., tech.coords. Proceedings of the Fire History Workshop; 1980 October 20-24; Tucson,AZ. Gen. Tech. Rep. RM-81. Fort Collins, CO: U.S. Department of Agriculture,Forest Service, Rocky Mountain Forest and Range Experiment Station: 120-125.
Zar, Jerrold H. 1974. Biostatistical analysis. Englewood Cliffs, NJ: Prentice-Hall.620 p.
Zobel, Donald B.; McKee, Arthur; Hawk, Glenn M.; Dyrness, C.T. 1976.Relationship of environment to composition, structure, and diversity of forestcommunities of the central western Cascades of Oregon. Ecological Monographs.46(2): 135-156.
77

This page left blank intentionally

, ._.-2
Morrison, Peter H.; Swanson, Frederick J. 1990. Fire history and pattern in aCascade Range landscape. Gen. Tech. Rep. PNW-GTR-2-54. Portland, OR:U.S. Department of Agriculture, Forest Service. Pacific Northwest ResearchStation. 77 p. -
Fire history from years 1150 to 1985 was reconstructed by analyzing forest stands intwo 1940-hectare areas in the central-western Cascade Range of Oregon. Serving asrecords for major fires episodes, these stands revealed a highly variable fire regime.The steeper, more dissected, lower elevation Cook-Quentin study area experiencedmore frequent fires (natural fire rotation = 95 years) that were commonly low to mod-erate in severity. The Deer study area, with its cooler, moister conditions and gentlertopography, had a regime of less frequent (natural fire rotation = 149 years), predomi-nantly stand-replacement fires. Fires created a complex mosaic of stands with vari-able date and severity of last burn. Fire-created forest patches originating in 1800-1900 are mostly less than 10 hectares. Since 1900, very little of the study areasburned, possibly because of fire suppression. Old-growth forest conditions havepersisted on some sites through numerous fires and over many centuries.
Keywords: History (fire), patch dynamics, old-growth forest, wildfire fire ecology.
The Forest Service of the U.S. Department ofAgriculture is dedicated to the principle of multipleuse management of the Nation’s forest resourcesfor sustained yields of wood, water, forage, wildlife,and recreation. Through forestry research,cooperation with the States and private forestowners, and management of the National Forestsand National Grasslands, it strives-as directed byCongress-to provide increasingly greater serviceto a growing Nation.
The U.S. Department of Agriculture is an EqualOpportunity Employer. Applicants for all Departmentprograms will be given equal consideration withoutregard to age, race, color, sex, religion, or nationalorigin.
Pacific Northwest Research Station319 S.W. Pine St.P.O. Box 3890Portland, Oregon 97208-3890

U.S. Department of Agriculture BULK RATE
Pacific Northwest Research Station POSTAGE +FEES PAID
319 SW. Pine Street USDA-FSP.O. Box 3890 PERMIT No. G-40Portland, 0regon 97208
Official BusinessPenalty for Private Use, $300