dcd intelligence presentation istanbul - december 2014_np
TRANSCRIPT
Darran Blatch
Lead Consultant
DCD Intelligence
Market Dynamics in the Turkish
Data Center Sector
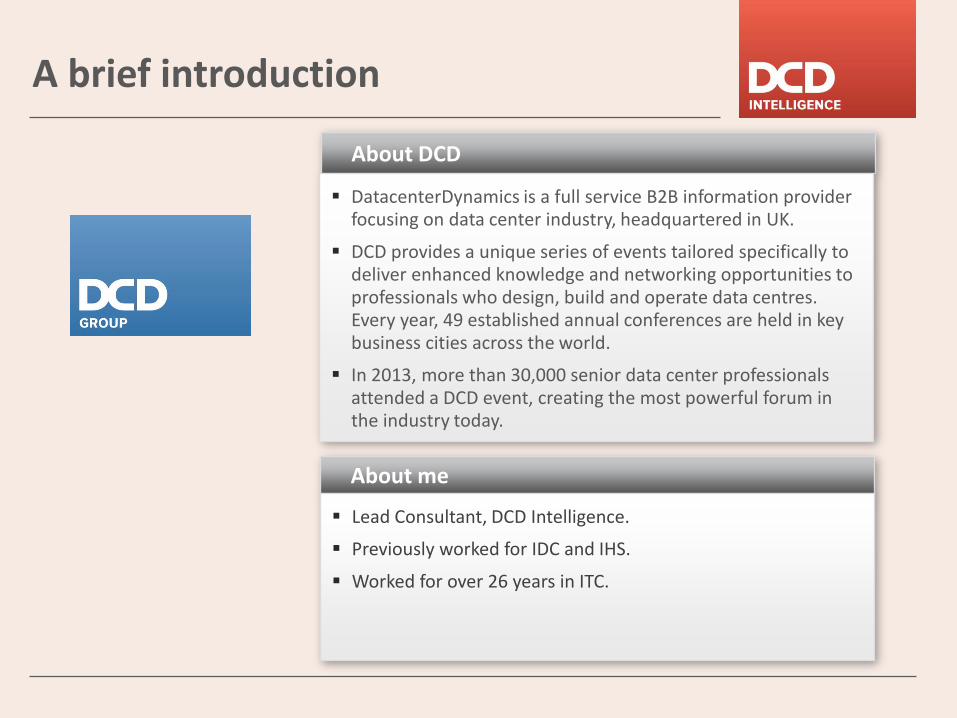
A brief introduction
About DCD
DatacenterDynamics is a full service B2B information provider focusing on data center industry, headquartered in UK.
DCD provides a unique series of events tailored specifically to deliver enhanced knowledge and networking opportunities to professionals who design, build and operate data centres. Every year, 49 established annual conferences are held in key business cities across the world.
In 2013, more than 30,000 senior data center professionals attended a DCD event, creating the most powerful forum in the industry today.
About me
Lead Consultant, DCD Intelligence.
Previously worked for IDC and IHS.
Worked for over 26 years in ITC.
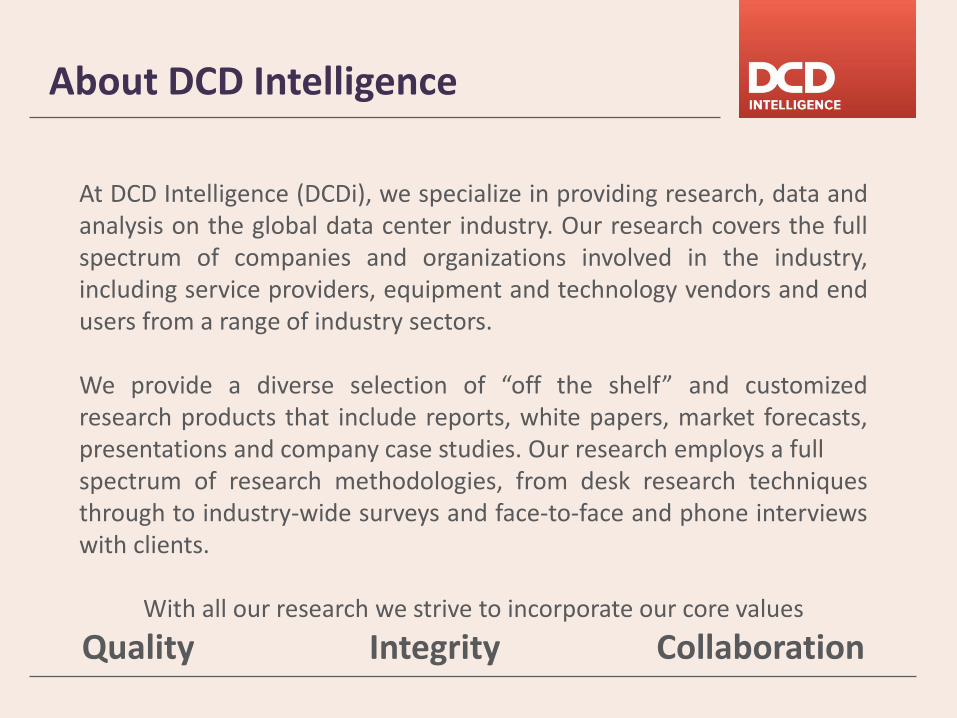
At DCD Intelligence (DCDi), we specialize in providing research, data and analysis on the global data center industry. Our research covers the full spectrum of companies and organizations involved in the industry, including service providers, equipment and technology vendors and end users from a range of industry sectors. We provide a diverse selection of “off the shelf” and customized research products that include reports, white papers, market forecasts, presentations and company case studies. Our research employs a full spectrum of research methodologies, from desk research techniques through to industry-wide surveys and face-to-face and phone interviews with clients.
With all our research we strive to incorporate our core values
Quality Integrity Collaboration
About DCD Intelligence
2011
2012
2014
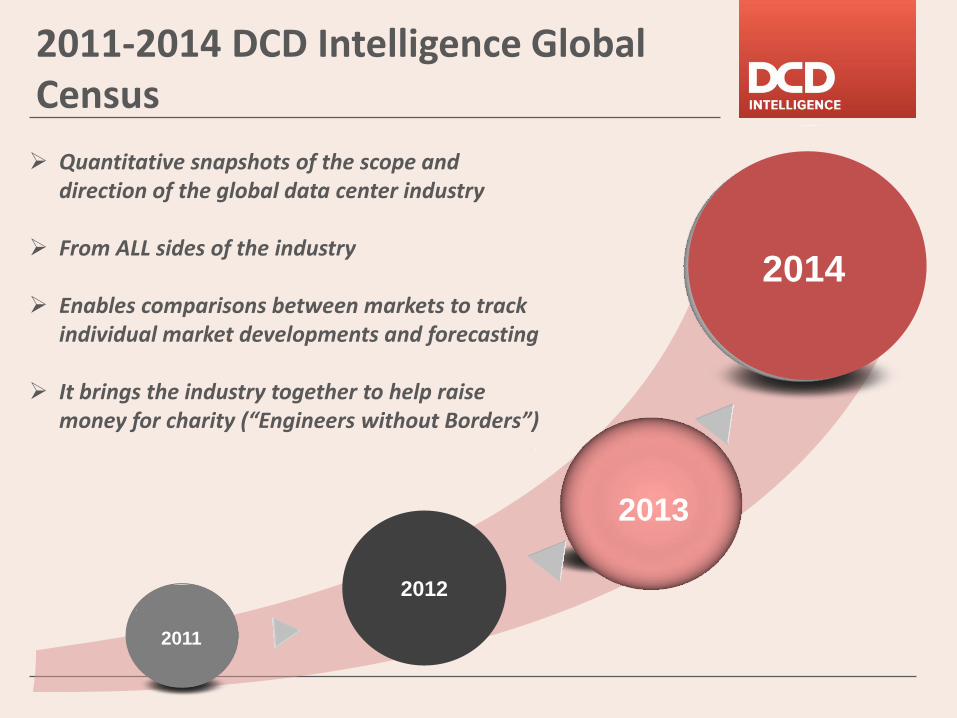
2011-2014 DCD Intelligence Global Census
Quantitative snapshots of the scope and direction of the global data center industry
From ALL sides of the industry
Enables comparisons between markets to track individual market developments and forecasting
It brings the industry together to help raise money for charity (“Engineers without Borders”)
2013

A snapshot of data centers today

In 2007 the number of data centers globally was roughly the same as the
number of oil fields (c. 70,000)
In 2014 the number of data centers globally is roughly the same as the number of branded gas
stations in all of the G7 nations combined (c. 200,000)
In seven years the number of data centers has almost trebled
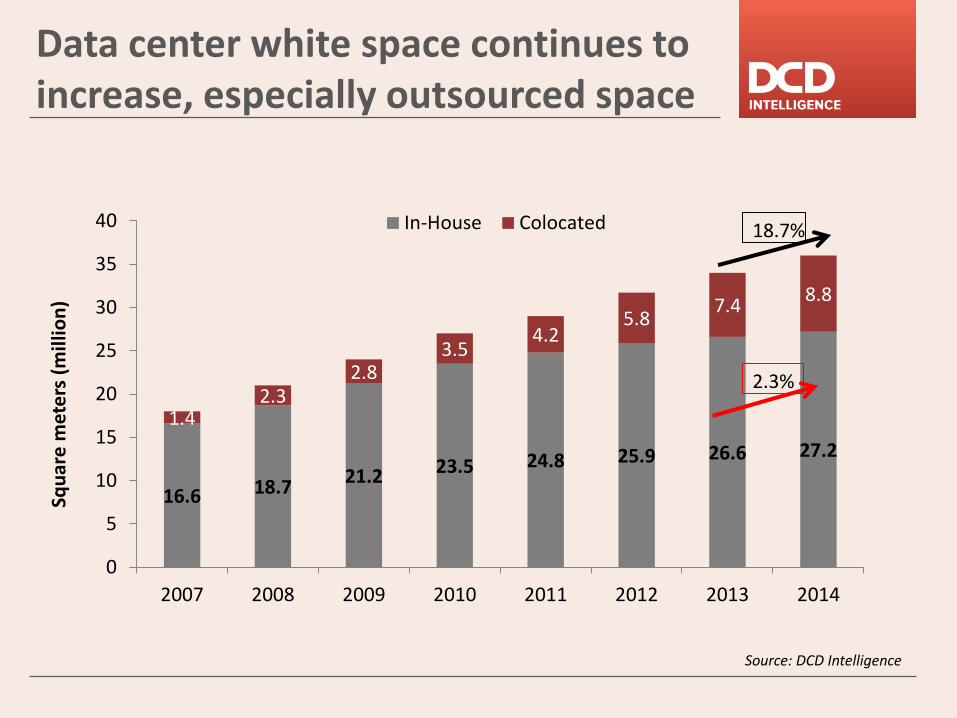
Data center white space continues to increase, especially outsourced space
Source: DCD Intelligence
Squ
are
met
ers
(m
illio
n)
18.7%
16.6 18.7 21.2 23.5 24.8 25.9 26.6 27.2
1.4 2.3
2.8 3.5
4.2 5.8
7.4 8.8
0
5
10
15
20
25
30
35
40
2007 2008 2009 2010 2011 2012 2013 2014
In-House Colocated
2.3%

(*) derived from BP Statistical Review of World Energy 2013 (**) Based on Census 2013 population projections of maximum stated capacity including end user reporting of outsourced footprint
Data centers 375 TWh**
China 3,500 TWh(*) USA 4,250 TWh(*)
Japan 1,100 TWh(*)
UK 360 TWh(*)
India 1,050 TWh(*)
If the data center industry was a country, it would be the 11th largest electricity consumer
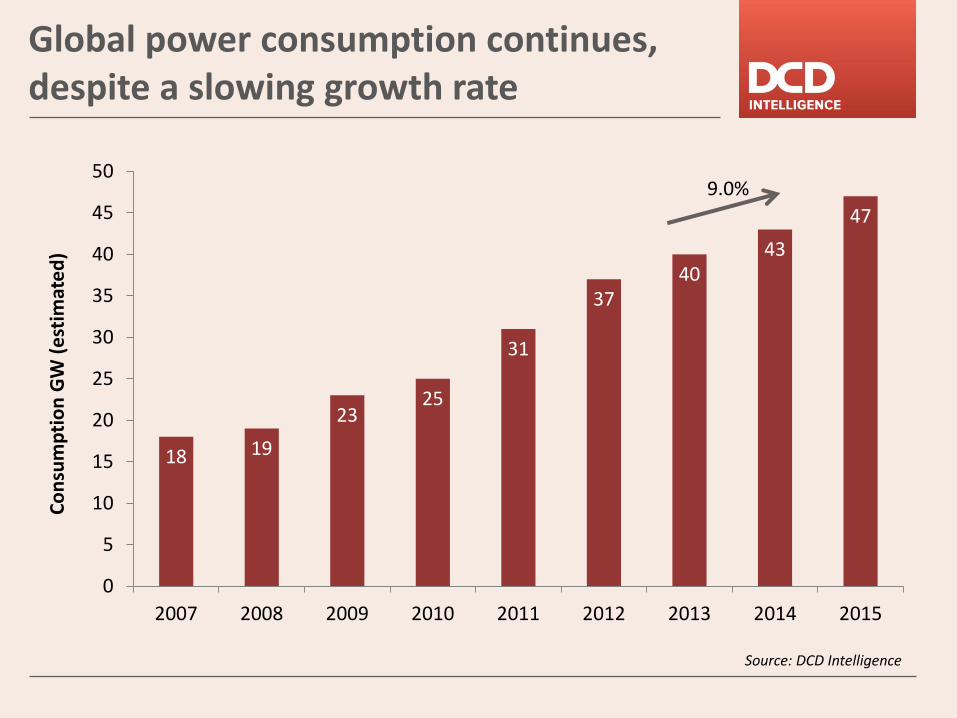
Global power consumption continues, despite a slowing growth rate
Source: DCD Intelligence
9.0%
18 19
23 25
31
37 40
43
47
0
5
10
15
20
25
30
35
40
45
50
2007 2008 2009 2010 2011 2012 2013 2014 2015
Co
nsu
mp
tio
n G
W (
est
imat
ed
)
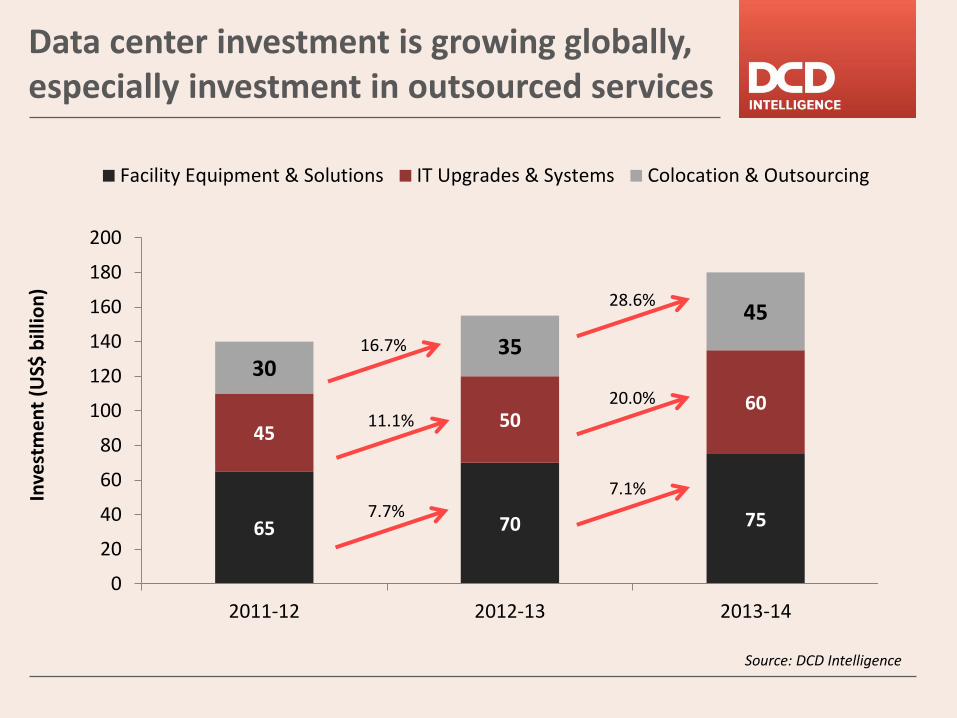
Data center investment is growing globally, especially investment in outsourced services
Source: DCD Intelligence
Inve
stm
en
t (U
S$ b
illio
n)
65 70 75
45 50
60
30 35
45
0
20
40
60
80
100
120
140
160
180
200
2011-12 2012-13 2013-14
Facility Equipment & Solutions IT Upgrades & Systems Colocation & Outsourcing
11.1%
28.6%
16.7%
20.0%
7.7% 7.1%
What is driving the demand for data centers?

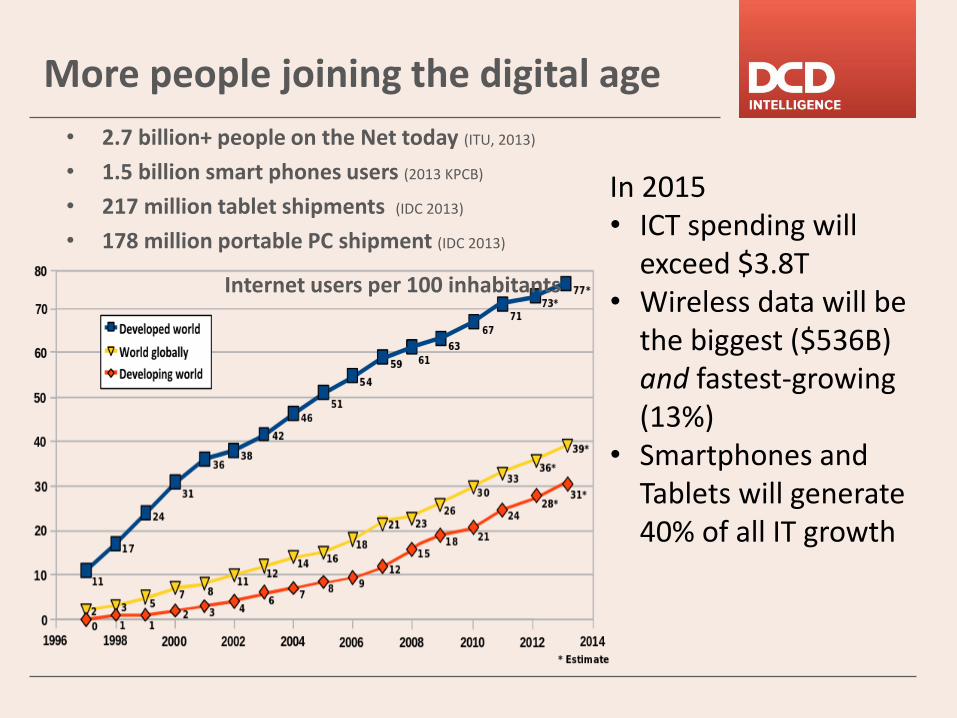
• 2.7 billion+ people on the Net today (ITU, 2013)
• 1.5 billion smart phones users (2013 KPCB)
• 217 million tablet shipments (IDC 2013)
• 178 million portable PC shipment (IDC 2013)
More people joining the digital age
Internet users per 100 inhabitants
In 2015 • ICT spending will
exceed $3.8T • Wireless data will be
the biggest ($536B) and fastest-growing (13%)
• Smartphones and Tablets will generate 40% of all IT growth
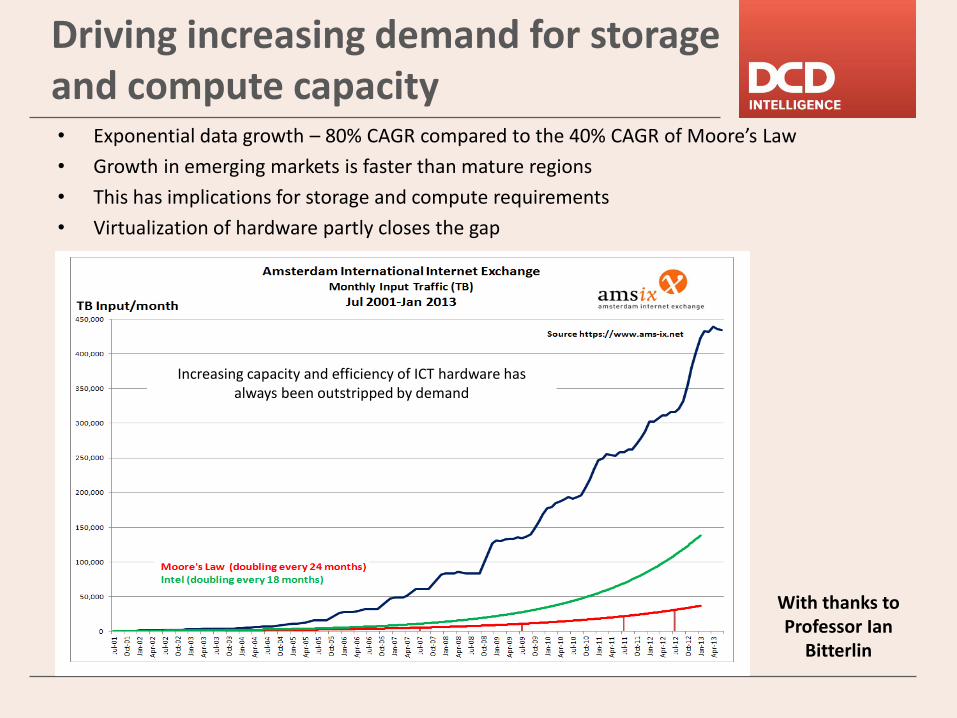
Increasing capacity and efficiency of ICT hardware has always been outstripped by demand
Driving increasing demand for storage and compute capacity • Exponential data growth – 80% CAGR compared to the 40% CAGR of Moore’s Law
• Growth in emerging markets is faster than mature regions
• This has implications for storage and compute requirements
• Virtualization of hardware partly closes the gap
With thanks to Professor Ian
Bitterlin
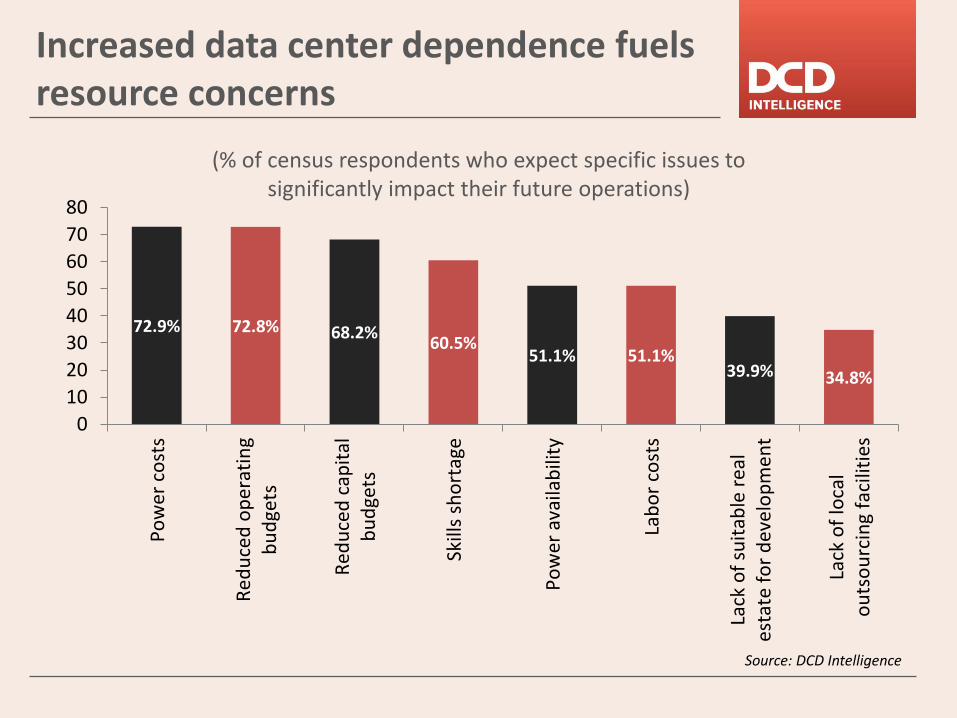
Increased data center dependence fuels resource concerns
72.9% 72.8% 68.2% 60.5%
51.1% 51.1% 39.9% 34.8%
0
10
20
30
40
50
60
70
80
Po
wer
co
sts
Re
du
ced
op
erat
ing
bu
dge
ts
Red
uce
d c
apit
alb
ud
gets
Skill
s sh
ort
age
Po
wer
ava
ilab
ility
Lab
or
cost
s
Lack
of
suit
able
rea
les
tate
fo
r d
eve
lop
me
nt
Lack
of
loca
lo
uts
ou
rcin
g fa
cilit
ies
Source: DCD Intelligence
(% of census respondents who expect specific issues to significantly impact their future operations)

Turkey data center market metrics

Turkey: data center space, 2011-14 (square metres)
Source: DCD Intelligence
Square metres
2011 2012 2013 2014 % average
y-o-y increase
In-house 416,350 425,220 430,700 436,150 1.6%
Colocated & third party
133,650 144,780 159,300 173,850 9.2%
Total 550,000 570,000 590,000 610,000 3.5%

Turkey: power consumption, 2011-13 (MW)
Source: DCD Intelligence
5.1%
3.0%
Growth of around 4% in 2014 (to 880 MW)
780
820
845
740
760
780
800
820
840
860
2011 2012 2013
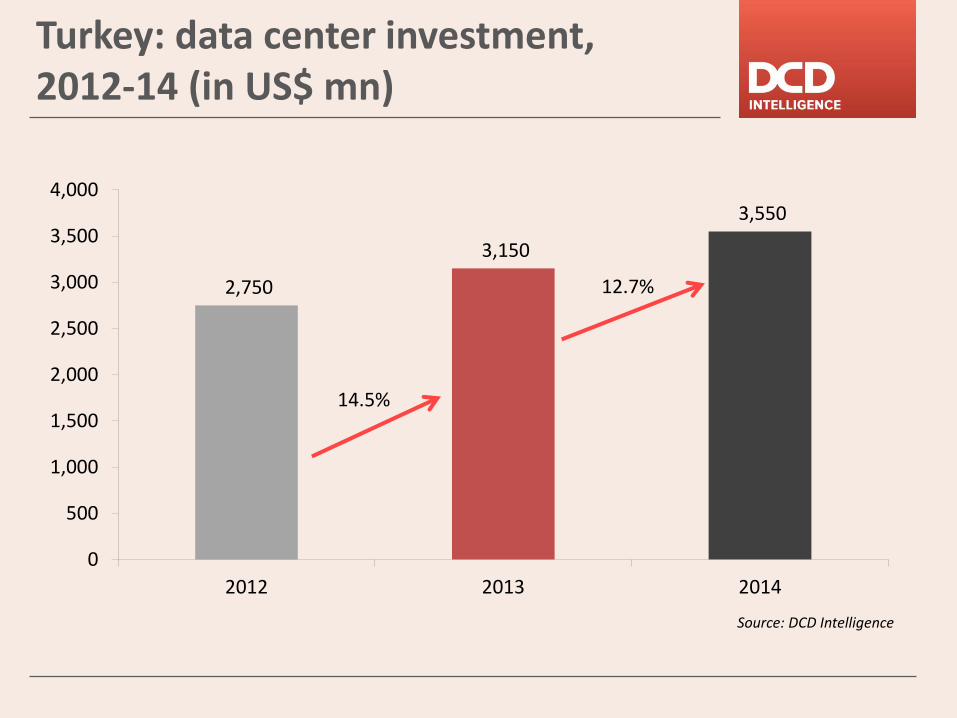
Turkey: data center investment, 2012-14 (in US$ mn)
Source: DCD Intelligence
14.5%
12.7% 2,750
3,150
3,550
0
500
1,000
1,500
2,000
2,500
3,000
3,500
4,000
2012 2013 2014
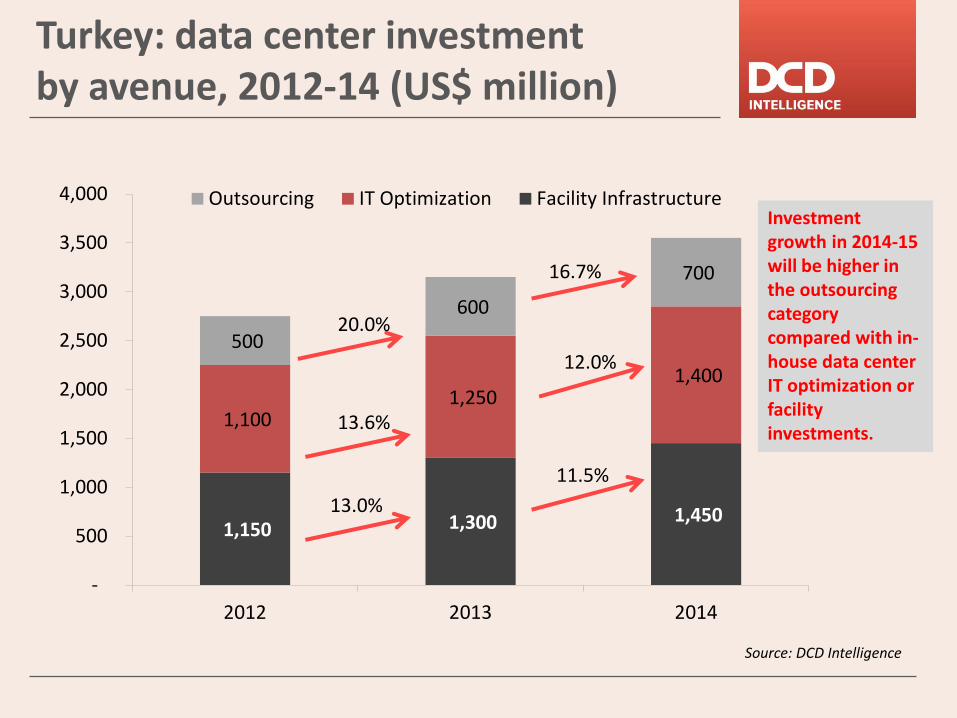
Turkey: data center investment by avenue, 2012-14 (US$ million)
Source: DCD Intelligence
20.0%
13.6%
13.0%
Investment growth in 2014-15 will be higher in the outsourcing category compared with in-house data center IT optimization or facility investments.
16.7%
12.0%
11.5%
1,150 1,300 1,450
1,100 1,250
1,400
500
600
700
-
500
1,000
1,500
2,000
2,500
3,000
3,500
4,000
2012 2013 2014
Outsourcing IT Optimization Facility Infrastructure
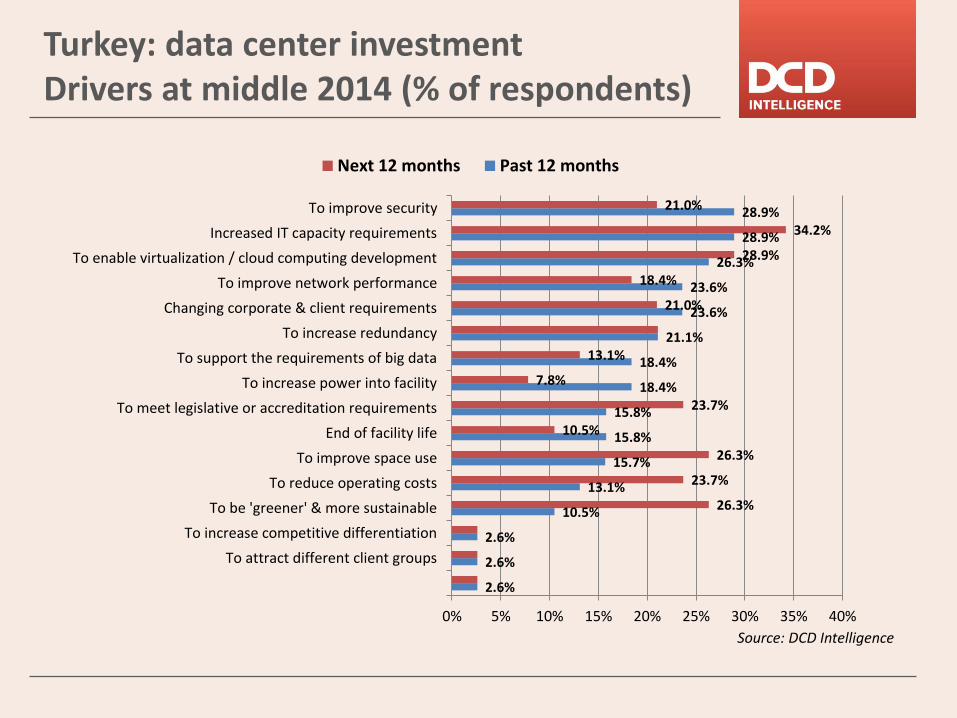
Turkey: data center investment Drivers at middle 2014 (% of respondents)
Source: DCD Intelligence
2.6%
2.6%
2.6%
10.5%
13.1%
15.7%
15.8%
15.8%
18.4%
18.4%
21.1%
23.6%
23.6%
26.3%
28.9%
28.9%
26.3%
23.7%
26.3%
10.5%
23.7%
7.8%
13.1%
21.0%
18.4%
28.9%
34.2%
21.0%
0% 5% 10% 15% 20% 25% 30% 35% 40%
To attract different client groups
To increase competitive differentiation
To be 'greener' & more sustainable
To reduce operating costs
To improve space use
End of facility life
To meet legislative or accreditation requirements
To increase power into facility
To support the requirements of big data
To increase redundancy
Changing corporate & client requirements
To improve network performance
To enable virtualization / cloud computing development
Increased IT capacity requirements
To improve security
Next 12 months Past 12 months
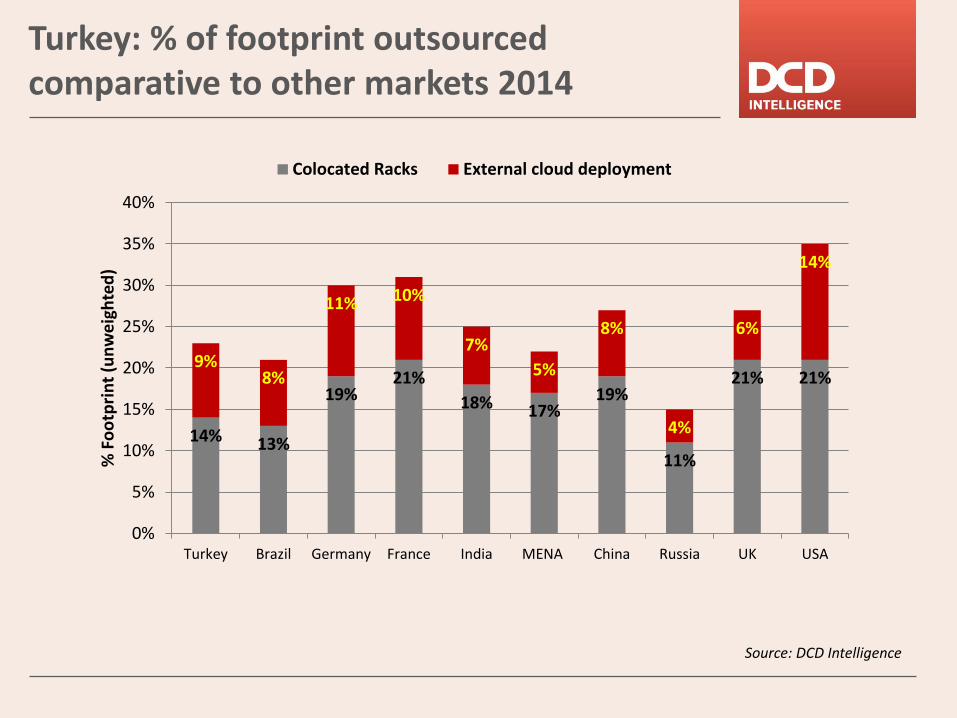
Turkey: % of footprint outsourced comparative to other markets 2014
Source: DCD Intelligence
14% 13%
19% 21%
18% 17% 19%
11%
21% 21% 9%
8%
11% 10%
7%
5%
8%
4%
6%
14%
0%
5%
10%
15%
20%
25%
30%
35%
40%
Turkey Brazil Germany France India MENA China Russia UK USA
% F
oo
tpri
nt
(un
we
igh
ted
)
Colocated Racks External cloud deployment
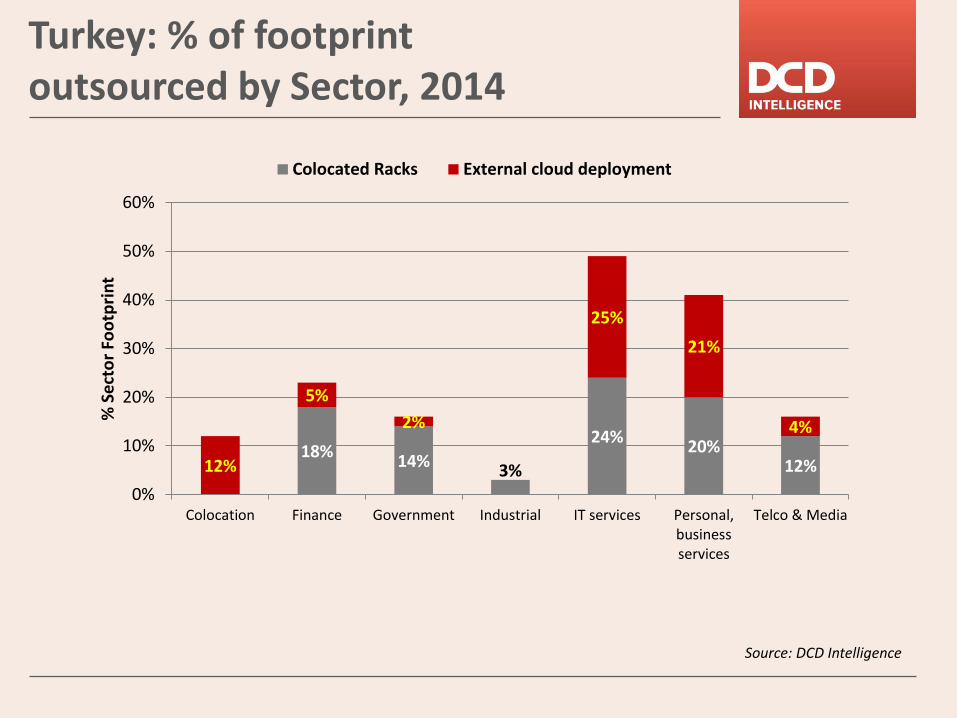
Turkey: % of footprint outsourced by Sector, 2014
Source: DCD Intelligence
18% 14%
3%
24% 20%
12% 12%
5%
2%
25%
21%
4%
0%
10%
20%
30%
40%
50%
60%
Colocation Finance Government Industrial IT services Personal,businessservices
Telco & Media
% S
ect
or
Foo
tpri
nt
Colocated Racks External cloud deployment
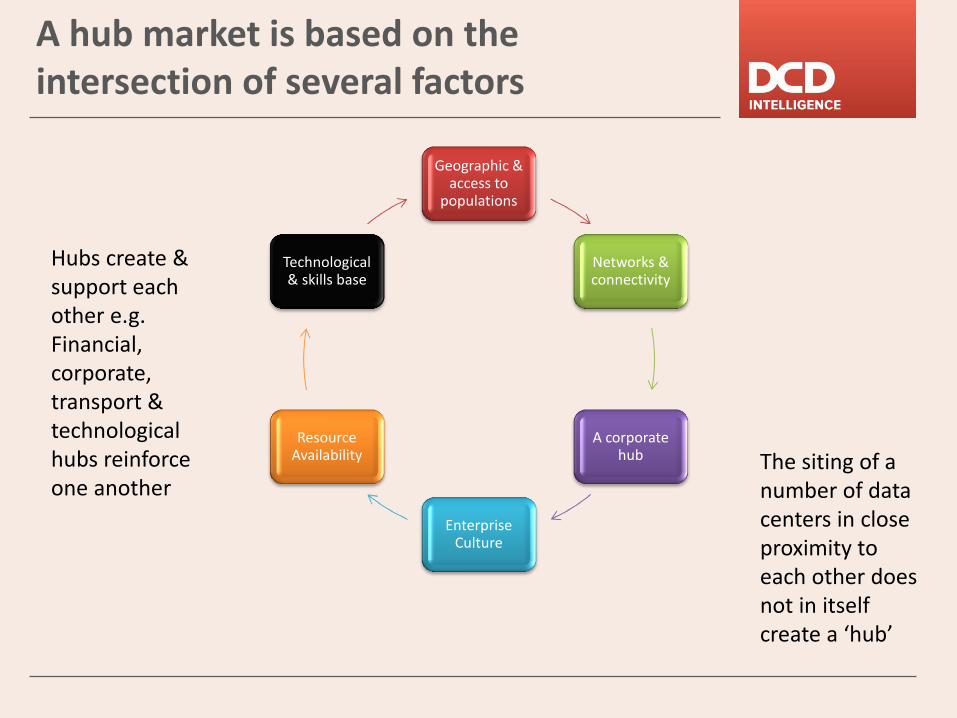
A hub market is based on the intersection of several factors
Geographic & access to
populations
Networks & connectivity
A corporate hub
Enterprise Culture
Resource Availability
Technological & skills base
Hubs create & support each other e.g. Financial, corporate, transport & technological hubs reinforce one another
The siting of a number of data centers in close proximity to each other does not in itself create a ‘hub’
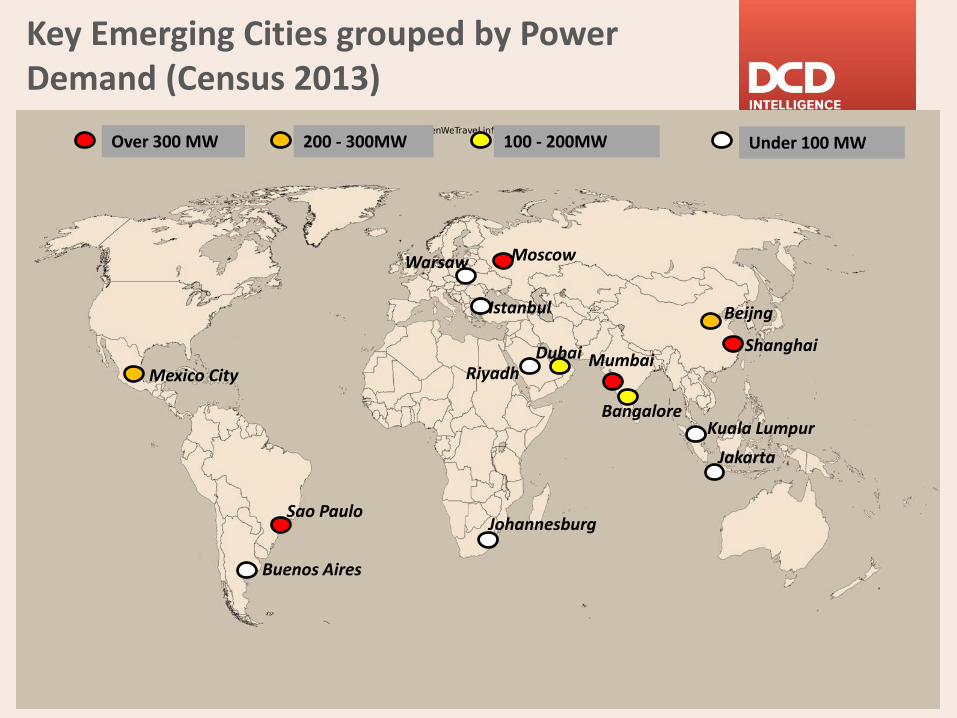
Key Emerging Cities grouped by Power Demand (Census 2013)
Shanghai
Jakarta
Dubai
Sao Paulo
Moscow
Riyadh Mexico City Mumbai
Johannesburg
Bangalore Kuala Lumpur
Beijng
Warsaw
Buenos Aires
Istanbul
Over 300 MW 100 - 200MW 200 - 300MW Under 100 MW

Emerging City Concerns about Availability of Capital:
15% 16%
11%
23%
17%
9% 6%
14%
17%
9% 13%
16%
12%
7% 9%
0%
5%
10%
15%
20%
25%
Bangalore
Beijing
Buenos Aires
Dubai
Istanbul
Jakarta
Johannesburg
KualaLumpur
Mexico City
Moscow
Mumbai
Riyadh
Sao Paulo
Shanghai
Warsaw
% indicating significant concern about CAPEX shortage
% Fearing that shortage of capital will have significant impact on their operation over the next 12 to 18 months
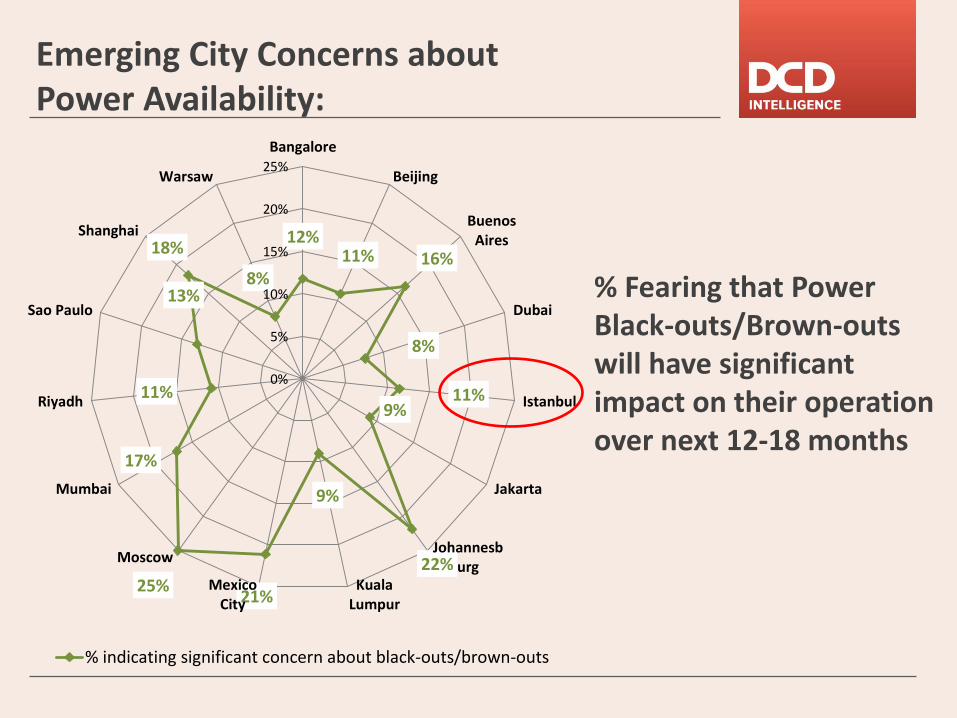
Emerging City Concerns about Power Availability:
12% 11% 16%
8%
11% 9%
22%
9%
21% 25%
17%
11%
13%
18%
8%
0%
5%
10%
15%
20%
25%
Bangalore
Beijing
BuenosAires
Dubai
Istanbul
Jakarta
Johannesburg
KualaLumpur
MexicoCity
Moscow
Mumbai
Riyadh
Sao Paulo
Shanghai
Warsaw
% indicating significant concern about black-outs/brown-outs
% Fearing that Power Black-outs/Brown-outs will have significant impact on their operation over next 12-18 months
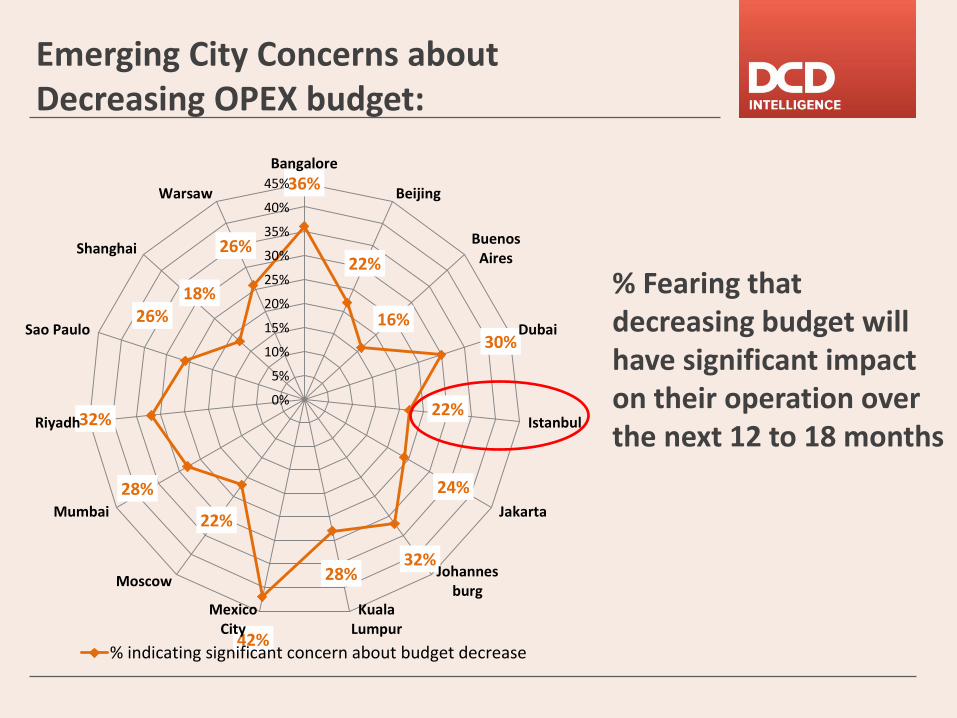
Emerging City Concerns about Decreasing OPEX budget:
36%
22%
16% 30%
22%
24%
32% 28%
42%
22%
28%
32%
26% 18%
26%
0%
5%
10%
15%
20%
25%
30%
35%
40%
45%
Bangalore
Beijing
BuenosAires
Dubai
Istanbul
Jakarta
Johannesburg
KualaLumpur
MexicoCity
Moscow
Mumbai
Riyadh
Sao Paulo
Shanghai
Warsaw
% indicating significant concern about budget decrease
% Fearing that decreasing budget will have significant impact on their operation over the next 12 to 18 months

Emerging City Concerns about Power Costs:
22%
35%
33%
22%
29%
42%
50%
31%
43%
7%
42%
22%
33% 20%
14%
0%
5%
10%
15%
20%
25%
30%
35%
40%
45%
50%
Bangalore
Beijing
BuenosAires
Dubai
Istanbul
Jakarta
Johannesburg
KualaLumpur
MexicoCity
Moscow
Mumbai
Riyadh
Sao Paulo
Shanghai
Warsaw
% indicating significant concern about power costs
% Fearing that Power Costs will have significant impact on their operation over the next 12 to 18 months
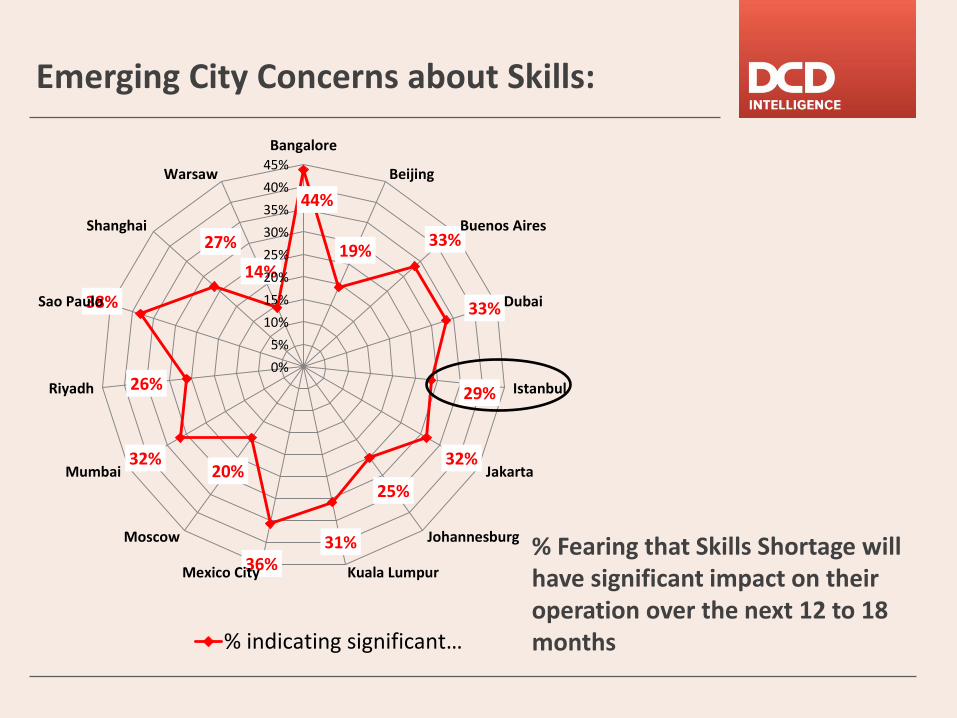
Emerging City Concerns about Skills:
44%
19% 33%
33%
29%
32%
25%
31% 36%
20% 32%
26%
38%
27%
14%
0%
5%
10%
15%
20%
25%
30%
35%
40%
45%
Bangalore
Beijing
Buenos Aires
Dubai
Istanbul
Jakarta
Johannesburg
Kuala LumpurMexico City
Moscow
Mumbai
Riyadh
Sao Paulo
Shanghai
Warsaw
% indicating significant…
% Fearing that Skills Shortage will have significant impact on their operation over the next 12 to 18 months
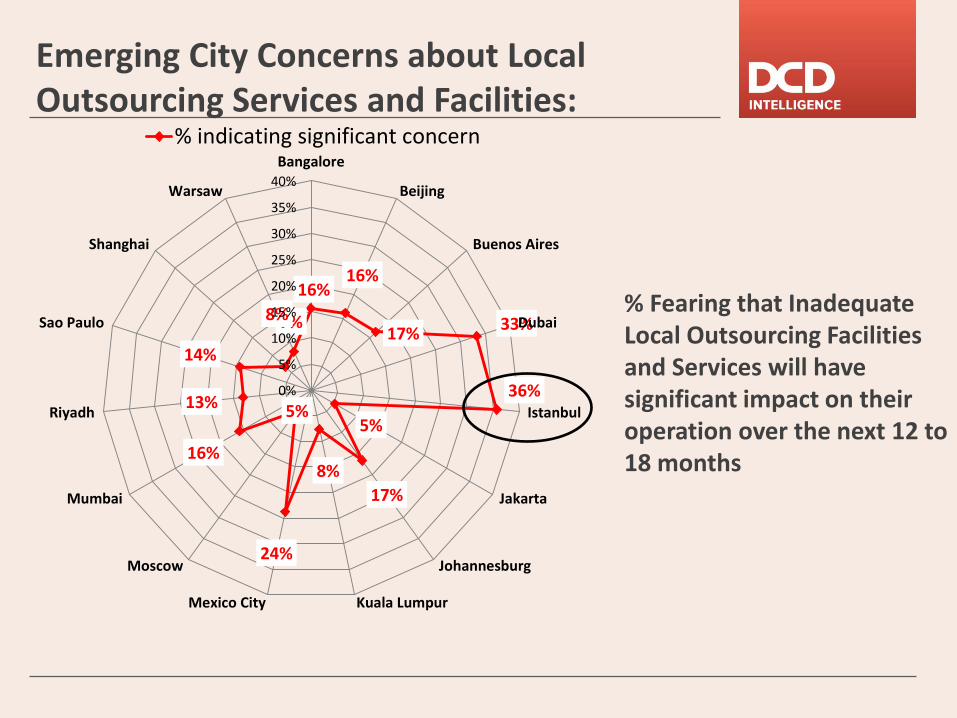
Emerging City Concerns about Local Outsourcing Services and Facilities:
16% 16%
17% 33%
36%
5%
17%
8%
24%
5%
16%
13%
14%
7% 8%
0%
5%
10%
15%
20%
25%
30%
35%
40%
Bangalore
Beijing
Buenos Aires
Dubai
Istanbul
Jakarta
Johannesburg
Kuala LumpurMexico City
Moscow
Mumbai
Riyadh
Sao Paulo
Shanghai
Warsaw
% indicating significant concern
% Fearing that Inadequate Local Outsourcing Facilities and Services will have significant impact on their operation over the next 12 to 18 months
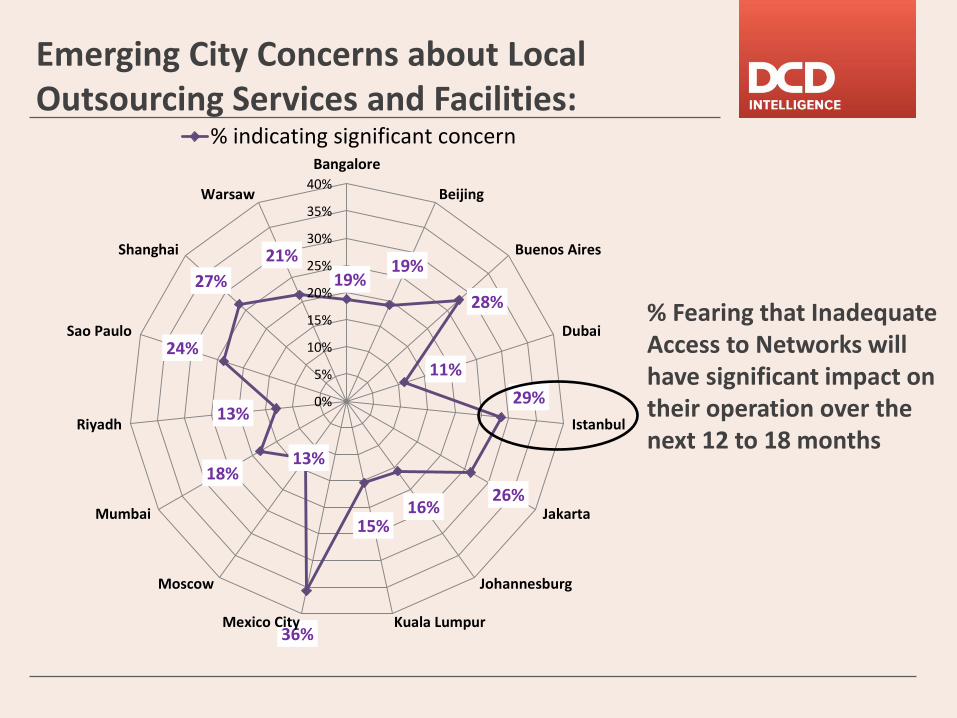
Emerging City Concerns about Local Outsourcing Services and Facilities:
19% 19%
28%
11%
29%
26% 16%
15%
36%
13% 18%
13%
24%
27%
21%
0%
5%
10%
15%
20%
25%
30%
35%
40%
Bangalore
Beijing
Buenos Aires
Dubai
Istanbul
Jakarta
Johannesburg
Kuala LumpurMexico City
Moscow
Mumbai
Riyadh
Sao Paulo
Shanghai
Warsaw
% indicating significant concern
% Fearing that Inadequate Access to Networks will have significant impact on their operation over the next 12 to 18 months
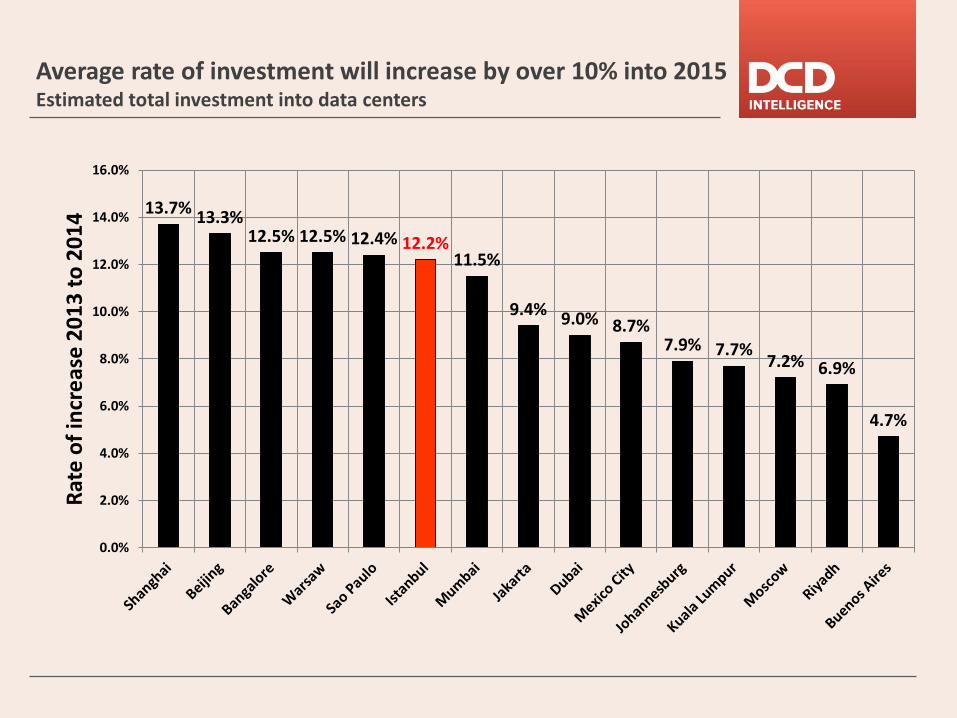
Average rate of investment will increase by over 10% into 2015 Estimated total investment into data centers
13.7% 13.3%
12.5% 12.5% 12.4% 12.2% 11.5%
9.4% 9.0% 8.7%
7.9% 7.7% 7.2% 6.9%
4.7%
0.0%
2.0%
4.0%
6.0%
8.0%
10.0%
12.0%
14.0%
16.0%
Rat
e o
f in
cre
ase
20
13
to
20
14
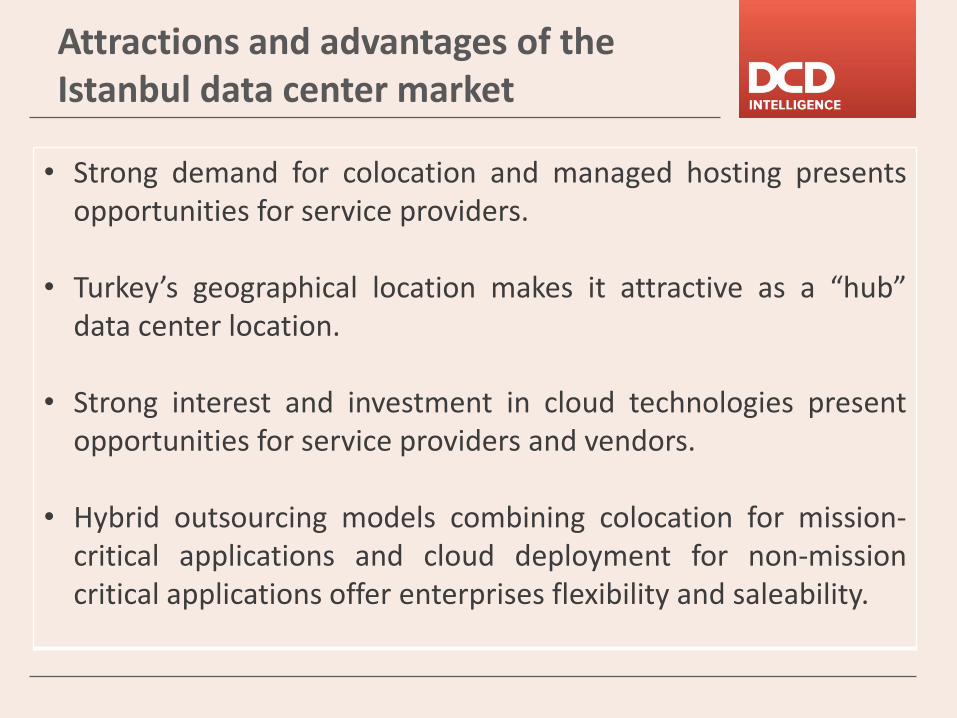
Attractions and advantages of the Istanbul data center market • Strong demand for colocation and managed hosting presents
opportunities for service providers.
• Turkey’s geographical location makes it attractive as a “hub” data center location.
• Strong interest and investment in cloud technologies present opportunities for service providers and vendors.
• Hybrid outsourcing models combining colocation for mission-critical applications and cloud deployment for non-mission critical applications offer enterprises flexibility and saleability.
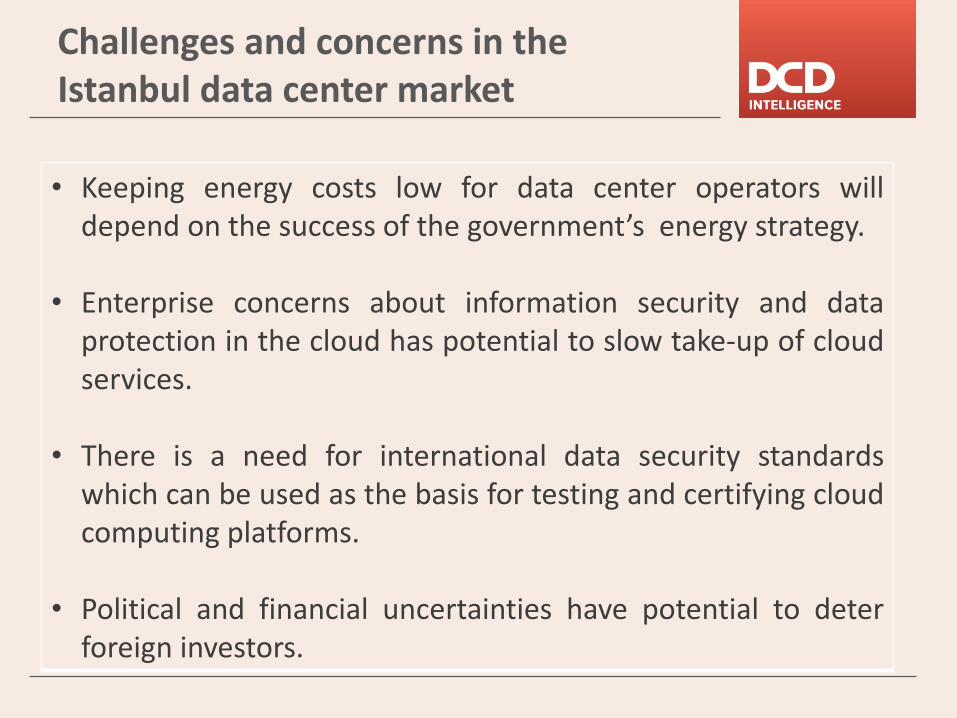
Challenges and concerns in the Istanbul data center market • Keeping energy costs low for data center operators will
depend on the success of the government’s energy strategy. • Enterprise concerns about information security and data
protection in the cloud has potential to slow take-up of cloud services.
• There is a need for international data security standards which can be used as the basis for testing and certifying cloud computing platforms.
• Political and financial uncertainties have potential to deter foreign investors.