day-lighting analysis and report of room 32-d463 in the...
TRANSCRIPT

Day-lighting Analysis and Report of Room 32-D463 in the MIT Stata Center
Authors: Christopher Pechacek, SMArchS Candidate Tom Weathers, MArch Candidate Jessica Sundberg, BSAD Candidate
14 December 2006
1 of 28

Table of Contents
Introduction 3Diagnostic 4 Techniques and Assumptions 4 Material Characteristics 5
Illumination 6 Glare and Contrast 12 Color Rendering 13
Concept (Performance Objectives) 14 Illumination 14 Glare and Contrast 15 Color Rendering 16
Solar Gains 16Proposal 17
Illumination 17 Glare and Contrast 23 Color Rendering 24
Solar Gains 24Evaluation 25
Illumination 25 Glare and Contrast 26 Color Rendering 26
Solar Gains 27Conclusion 27Appendix Table of Contents 28
2 of 28

INTRODUCTION
The Day-lighting project began with a commission by the professor to study the lighting conditions of the new MIT Stata Center (Building 32). Each group of students was to analyze the lighting conditions of a room of their choice, and propose some intervention to improve the lighting. Budget and the Institute’s likelihood of approval were not taken into consideration as factors.
The Stata Center, designed by star architect Frank Gehry, offers the MIT community a collection of unique spaces formed by the juxtaposition of irregular volumes and voids. Occupants of the Stata Center enjoy the notoriety of inhabiting a star architects creation, but suffer the repercussions of living in an extensively glazed building with few means of controlling daylight. The focus of this study is a conference room on the fourth floor of the Dreyfus wing (32-D463). The room is framed by angular painted walls and tall slender window wells that rise in accordance with the external building shape; a tapered star. The ceiling is a generous 50 feet above the floor creating a voluminous cavity. Unfortunately these proportions inhibit the upper cavity of the space from contributing any significant reflectance to day-lighting distribution at task plane 30” above the floor. This investigation begins with a thorough diagnosis of the environmental and building parameters that affect day-lighting in this space, then a concept for improving delighting is posited, and finally that concept is tested and honed with the use of graphical, analytical, and digital analysis tools.
To begin our diagnostic, we obtained building plans from the MIT Facilities Management Department website. These drawings were available in AutoCAD and Adobe Portable Document File format. The AutoCAD drawings were too simple for our analysis, so we chose to use the Adobe PDF drawings instead. The Facilities Management Department indicated by phone and e-mail that no other drawings exist due to the documentation methods used by Frank Gehry and Associates.
Using an overlay technique in AutoCAD, we imported the Adobe image files and created rough floor plans. Scaling these to known dimensions, we were able to produce drawings of reasonable dimensional accuracy. Vertical projections were made by stacking plans of the fourth, fifth, and sixth floors. The vertical (mostly angled) planes were added to create the effect of a three-dimensional model of the space.
The room’s orientation was provided on the drawings and upon visual inspection, the drawing appeared to be accurate in this regard. Roughly, the room faces south towards an open space created by buildings 16, 26, 56, and 57. Field measurements taken with basic survey equipment demonstrated that the masking effect of adjacent buildings was limited to approximately 10° above the horizon.
Windows size and orientation were easily measured from the 3D drawings whose generation is described above, and these formed the basis for daylight factor calculations as well as simulations as described later in this report. The masking effect of these windows was calculated using AutoCAD drawings, a protractor, and sunpath charts and is described later in this report.
We visited the space between 11:00 AM and 2:00 PM on the 26th of October, 2006 under intermediate sky conditions. Field measurements were taken of illumination levels (using a luxmeter) first with daylight-only and then both electric lights and daylight. The
3 of 28

method is described later in this report. Similarly, measurements were taken of the illumination of the exterior sky vault from which Daylight Factors were calculated.
Visual inspection of the space revealed that its primary function is as a classroom. Though, while visiting the space we noticed it is also used for other types of informal meetings. Pictures were taken with digital cameras and used to validate the accuracy of interior renderings. They also demonstrated basic shifts in color rendering based on electric and daylight-only lighting sources.
4 of 28

DIAGNOSTIC
Techniques and Assumptions
Certain basic assumptions were made as the project progressed. For instance, we assumed that any design solution would include manually operated window blinds. The existing, automatically controlled window blinds were inoperable due to some mechanical failure. We surmised this was due to the geometry of the windows. Their long, narrow shape allows for binding of the automatic blind system as it raises or lowers the window blinds.
We also assumed that the room’s function would remain static. So, we did not consider uses other than instructional or illumination levels associated with them.
The sky was intermediate on the day of our field survey, however we assumed that the CIE overcast sky would be the limiting condition. For brighter skies, the use of manual blinds could be employed to control excessive glare.
We assumed that the windows must remain useful for views to the exterior, and so decided to maintain an unobstructed zone from 7’-0” AFF (above finished floor). This constraint would limit our design options as documented later in this report.
Based on the field measurements, we knew that the surrounding buildings mask the southern horizon at an average of 10°. This seemed to us rather minor, so we assumed minimal interference or reflected contribution of daylight from adjacent structures.
Because this space is used primarily for instructional purposes, we assumed that any intervention need not be optimized for the extremes of winter and summer, but should make some reasonable accommodation of extremes experienced in the fall and spring.
The comfort of students was our primary concern, so we assumed any intervention must optimize their experience of the environment of the room. A standard writing height is 30” AFF as noted by the AIA’s Architectural Graphic Standards recommendations regarding ergonomics. We assumed that the view to the whiteboard is of utmost importance, so mitigating glare on that surface is one of the main goals of this project.
Material Characteristics
The interior of the room is basically composed of three finish material types. First, double paned glazed windows were the smallest, but provided the most impact on the others due to their transparency. Second, the walls are painted gypsum board. Third, the floors are a type of raised flooring with carpet tile covers. The most important measurement in terms of the materials was their individual reflectance or transmittance. We approximated these by measuring the illuminance onto and from the surface using a luxmeter. To measure reflectance, we held the luxmeter a small distance away from the plane of measurement and took readings in both directions- facing towards and away from the plane. We then took a ratio of these two readings and formed a percentage that is reflected.
Wall Paint (85% reflection) Floor Covering (83% absorption) (17%reflective)
5 of 28

Window transmittance was calculated as the ratio of the luminances of a patch of blue sky as measured with a luminance meter pointed directly at the sky (outside) and through the window (inside).
Windows (78% transmission)
These measures were then incorporated into our Ecotect model of the space, which was created from the AutoCAD 3D model described above.
Illumination
A series of methods were used to diagnose the illumination levels for the classroom. All assumed a 30” AFF (above finished floor) working height. The windows were partially obscured by light-blocking window blinds, and so our diagnostic assumes that only the lower 50% of the windows are effective for capturing daylight.
The first method used was calculating daylight factors based on field measurements. The sky was “intermediate” on the day of the field measurements and measured about 8,000 lux (an average of 10 measurements taken on 30 second intervals). Interior illumination measurements were taken on a 24” grid facilitated by a serendipitous floor tile layout. The full range of daylight measures was 0.01% to 25%, but within the teaching/learning zone of the classroom they generally were 1-2%.
We repeated the measurements on a grid half as dense for the room using both electric and daylight. This resulted in a map recording total illumination levels and is included in the appendix.
Floor Plan with Measured Daylight Factors Shown (Compare to Ecotect Simulation)
6 of 28

Floor Plan with Measured Illuminance Shown (Compare to Ecotect Simulation)
Next, the US Green Building Council’s LEED 2.2 daylight factor calculation was used to verify the measured daylight factor calculations. This is a simple tool which does not take into account characteristics of the room’s interior. The following is a summary of the LEED 2.2 daylight factor for the room “as is” and with the only 50% of the window unobstructed.
Window 1 Window 1 Window 2 Window 2 Window 3 Window 3 Vision Daylight Vision Daylight Vision Daylight
Window 24.33 sf 12.15 sf 23.06 sf 11.53 sf 23.60 sf 11.80 sf Area [sf] Floor Area 994.20 sf 994.20 sf 994.20 sf 994.20 sf 994.20 sf 994.20 sf [sf] Window Geometry Factor
0.1 0.1 0.1 0.1 0.1 0.1
Actual Tvis 0.78 0.78 0.78 0.78 0.78 0.78 Minimum Tvis
0.4 0.4 0.4 0.4 0.4 0.4
Window Height Factor
0.8 0.8 0.8 0.8 0.8 0.8
Glazing Factor
.0038 .0019 .0036 .0018 .0037 .0019
LEED 2.2 Glazing Factor Calculations
7 of 28

Taken as a percentage, the sum of the glazing factors for the 6 windows in their “as is” configuration is approximately 1.67%.
Third, the split flux method is considered. This method is location-specific, so a specific point is chosen close to the front of the teaching/learning zone. A CIE Protractor 2 for Vertical Windows is used.
20’-0” AFF
Height and Angle* when Window Blinds are Fully Raised
10’-0” AFF 19° Elev.
Height and Angle* when Window Blinds are Partially Raised 2’-6” AFF
2’-6” AFF 0° Elev.
0’-0” AFF
17° Elev.
36° Elev.
39° Elev.
SECTION THROUGH TYPICAL WINDOW
Angles for Initial Sky Component of Long Windows
WINDOW 3
WINDOW 2
WINDOW 1
Floor Plan with Correction Factor Angles
8 of 28

Wdw 1 (0°)
Wdw 1 (30°)
Wdw 1 (60°)
Wdw 2 (0°)
Wdw 2 (30°)
Wdw 2 (60°)
Wdw 3 (0°)
Wdw 3 (30°)
Wdw 3 (60°)
iSC 1.0 1.0 1.0 1.0 1.0 1.0 1.30 1.30 1.30 CF 0.0 0.0 0.0 0.10 0.12 0.08 0.02 0.03 0.05 SC 0.00 0.00 0.00 0.10 0.12 0.08 0.03 0.03 0.07 Sky Components (iSC x CF) for Windows (“Wdw”) 1-3 at 0-60°
Window Area [sf] 124.22 Window Shade Area [sf] 124.22 Floor Area [sf] 994.20 Walls and Ceiling [sf] 5,180.41 Total Interior Surface Area [sf] 6,423.05 Average Reflectance 0.85 ρ above mid-height 0.85 ρ below mid-height 0.56 Coefficient 35.00 IRC 2.61 Internally Reflected Coefficients (IRC)
Maintenance Factor (MF) 0.90 Glass Factor (GF) 1.00 Framing Factor (FF) 0.85 Other Variables
Using the formula [SC+(IRCxMF)](GF*FF), daylight factors of between 2.00 and 2.05 are achieved at between 0° and 60°.
The final diagnostic test applied is Ecotect and Radiance software, used to simulate daylight factor values for the space. A simple model was constructed in AutoCAD and imported into Ecotect. While true to the space in plan, in section it simplified the geometries into regular, orthogonal walls and ceilings. The relative height of the ceiling is similar to that of the space studied. The Daylight Factor results closely match those of data collected on-site and predicted by the two calculation methods above. Additionally, the illumination results are close to those predicted. So, we assumed this model is accurate enough for use in design simulations.
9 of 28

Ecotect: Daylight Factor in Existing Space (Compare to Field Measurements)
10 of 28

Radiance: Illuminance in Existing Space (Compare to Field Measurements)
11 of 28

Glare
Our initial luminance readings recorded ratios of 1:7 around the window wells and 1:3.5 at the whiteboard. The two main tools for teaching and learning within this space were the whiteboard and the projection screen, both located on the same wall, so glare occurring at the back of the room, such as in window wells, was not considered problematic. In fact, the contrast of luminance at the window wells helped accent the architecture of the space. Mitigating contrast on the whiteboard was a key issue for making this room function well as a classroom.
12 of 28

Color Rendering
The electric lighting and daylight-only conditions produced subtle differences in the color rendering effect of our chosen space.
Photos: Daylight Only (Left) and Electric Light and Daylight (Right)
Quantitatively, one can conclude that under daylight-only conditions, the room appears to have more true color rendering. The subtle hues of blue in the carpet are readily apparent. However, when the electric lights are turned on, the carpet appears more purple. The wood furniture appears to benefit from the electric light, leading one to conclude that the electric lights probably have a distinct red-shift in their spectrum.
Qualitatively, it is difficult to compare the two based on photos alone because the illumination level is very different. Using a simple technique in Adobe Photoshop, the brightness levels can be evened out to better compare the color rendering of the space.
13 of 28

Photoshop: Brightness Corrected Daylight Only (Left) and Electric Light and Daylight (Right) In the daylight-only photo, the color rendering is more true and vivid. The electric lighting photo is distinctly redder and less vivid.
CONCEPT (PERFORMANCE OBJECTIVES)
Illumination
To derive optimal illumination levels in the room, we first divided the room into several zones based on usage patterns. We then assigned criteria to these areas based on references and subjective design intentions. This formed our “lighting program.”
The first zone encountered is the entry/transition zone that spans from the room’s main doors to the adjacent teaching/learning zone. To facilitate safe exiting in the event of an emergency, NFPA 101, 7.8.1.3, requires 1 footcandle (or 10 lux) be provided in this space. Additionally, our subjective design intent was to keep this space darker than the teaching/learning zone to reduce distractions.
The next and most important zone is the teaching/learning zone. This occupies the center of the space and is by far the largest area considered in this project. Based on research in the IESNA Handbook for Lighting Design, we determined that 500-700 lux was optimal for classrooms. To reduce dependence on electric light, we decided to maximize the contribution of daylight. As a result, additional factors such as controlling sun patches and creating an even distribution of daylight in the space must be included in the lighting program. Transmitting and distributing the daylight deep in the space becomes an important design objective. Evenness is also important, so we set a goal of 25% variation in illumination from daylight. Additionally, controlling unwanted heat from direct solar radiation (heat gains) will have to be considered.
Finally, the zones behind (to the south of) the teaching learning zone are used for ancillary functions. The architect’s design included a clear intention to interrupt the room’s unique geometry with three light-filled window tunnels. We chose to maintain this
14 of 28

subjective design intention. Variations in lighting levels were considered acceptable in this space, so we set no firm objective for illumination. Additionally, we decided that any design interventions must maintain a clear visual path to the outdoors below 7’-0”.
Glare
Glare is an issue for most spaces in the Stata Center. Quantifying glare is an issue of great contention within the lighting profession. Various techniques exist for predicting when glare is disabling or discomforting: the Commission Internationale de L’Eclairage glare index (CGI), S.K. Guth’s Visual Comfort Probability (VCP), and the British Glare Index (BGI) based on research by R.G. Hopkinson and P. Pertherbridge, to name a few. A blog found at the Ecotect website (http://squ1.com/node/1356) noted that radiance software can perform a glare analysis on a linux based computer system, but that the results were unreliable. In light of this dilemma, we opted to use an approximate visual comfort parameter offered by Marilyne Anderson, where a luminance ratio of 1:3 in the ergorama is the limiting factor for visual comfort. We assumed that a ratio 1:3 for the entire visual range would be a conservative goal.
15 of 28

Color Rendering
Color Rendering was not a main objective of this project, but could certainly be improved through intentional introduction of daylight into the space. As noted previously in the diagnostic portion of this report, when controlled for brightness, the color rendering is truly better in daylight-only conditions than in the electric light conditions now experienced.
Solar Heat Gains
Daylight harvesting can be an effective way to offset energy otherwise used to light and cool a space, however the daylight must be collected in a manner that prevents creation of additional unwanted cooling loads. This project addresses this issue by limiting direct solar access to the space, especially during peak cooling seasons. Additionally, sunlight may be used to help heat the space during peak heating seasons.
A US Department of Energy (DoE) weather file for Boston was acquired from the DoE website (http://www.eere.energy.gov/buildings/energyplus/cfm/weather_data.cfm) and imported into Ecotect for analysis (see below). By visual inspection, it is clear that cooling is a major energy demand between May and September. Conversely, heating is more important between September and May. Making an informed decision, we decide to limit sunlight penetration in the summer and early autumn (before 22 September).
16 of 28

Department of Energy Weather Data for Boston
PROPOSAL
Illumination
We learned in day-lighting class that the highest portions of windows are the most effective at harvesting daylight, especially when that light must reach deep into a space. So, our going-in assumption was that the window blind system must be removed. The users probably found the influx of daylight through these windows to be overpowering, thus explaining why the non-functional window blinds were permanently kept half-shut. Our design must address this issue to be successful.
Our first step was to calculate the entrance limit to determine what parts of the sky the room could “see” if the window blinds were removed completely.
17 of 28

Plan of Daylight Entrance Limit Angles
Elevations of Daylight Entrance Limit Angles
When overlaid on a sunchart (http://solardat.uoregon.edu/SunChartProgram.html) for the Boston area, the results (below) indicate that the windows allow for the entrance of sunlight during most of the year at most times of the day over the course of the entire year. The 10° elevation is masked to account for nearby buildings.
18 of 28

Masking Effect of the Windows on Sunlight Penetration
Previously, we decided that we would like to limit sunlight penetration during summer and autumn days until about 22 September. According to the sun path chart, this corresponds to a limit angle of 40° above the horizon. An effective sun protection device should exclude sun light penetration at higher angles, and permit it at lower angles.
The diagram below presents the optimal masking of direct sunlight for this project based on the 40° limit angle.
19 of 28

Optimal Sunlight Masking for Project
Given the masking results above, several options and variations of options were produced to test interventions. Our lighting program served as an evaluation tool when determining if these options are viable solutions.
Our first intervention was to remove the existing window blinds altogether. As can be seen from the radiance simulation, results include an increase in the daylight available, but also a very uneven distribution of this light.
20 of 28

Our next intervention was to move the windows. Currently, they are located at the outside extreme ends of the three tunnel-like features. So, all direct solar radiation striking this façade also strikes the windows, resulting in increased interior solar gains on the interior of the space. This intervention places them on the interior-side of the tunnels, and allows the tunnels themselves to provide some shading for the windows. Architecturally, it creates an opportunity to use the exterior-side of the tunnel space for our intervention devices. A Radiance simulation produced no material impact on daylight penetration following this intervention. So, this strategy is carried forward into all future experiments discussed in this report.
A series of experiments were then undertaken to see how different interventions would optimize the contribution of daylight into this space. The following descriptions address only selected experiments. A more comprehensive analysis of the different interventions considered is included in the appendix of this report.
As stated previously, we chose to keep the lowest 7’-0” of the windows unobstructed. So, we tested replacing the glazing above 7’-0” with a translucent material. This approached failed to meet our performance criteria because it diffused the light coming in from the highest portion of the window, but still allowed direct solar penetration at the lowest part of the window. This resulted in an exaggerated gradient of daylight illumination and therefore is undesirable. The results of this experiment are documented in the appendix.
21 of 28

Next, we proposed a couple strategies, each a variation on similar themes. One included a series of exterior louvers and a horizontal light shelf. These were assumed to be a highly reflective material. The system was proportioned to exclude light angles higher than 45° above the 7’-0” clear-zone.
Section Diagram: Proposed Intervention Including a Simple Light Shelf and Louvers
The results of this experiment are documented in the appendix. This approach was rejected because it did not adequately diffuse and redirect light deeper into the space.
Our most successful intervention involved two simple mirrored light shelves. These were spaced roughly evenly in the tunnels (see section diagram). This approach was further refined through the introduction of mirrored louvers on the southeast window to limit glare. This refinement resulted in a minor reduction of daylight illuminance, but this was a worthwhile tradeoff given the substantial reduction in glare. See the evaluation section of this report for results of simulations on this proposal.
22 of 28

Section Diagram: Proposed Intervention Including Two Light Shelves
Electric Lighting was considered to be beyond the scope of this report. However, it should be noted that the chosen intervention described above produced an average illumination of around 300 lux over the target work area. The existing configuration produced only around 100 lux in the same work area. So, approximately 200 lux of electric illumination was eliminated by this strategy.
Glare and Contrast
The same interventions tested for illumination were tested for glare impact at the whiteboard. Radiance modeling helped map luminance on a virtual whiteboard for predicating contrast ratios of each solution. A base model was first tested to validate the potential results from this tool. The base test matched the initial luminance meter measurements of the space, lending sufficient credibility to radiance modeling. The optimization of both glare reduction and illumination were competing goals that lead to a glare solution focused on one problematic window facing the Southeast.
23 of 28

The following luminance maps show highlights of intense luminance leading to glare occurring on the right side of the whiteboard, which confirmed our suspicion that the southeast window well was the leading culprit of glare. The ideal solution involved a series of light reflecting louvers to block direct sunlight from hitting the window well surface and illuminating the whiteboard. The redirected light is sent upwards toward the higher portions of wall were diffusion is less likely to cause glare on the whiteboard. An extensive summary of glare tests is included in the appendix.
9am 12 Noon 3pm
Color Rendering
See Evaluation below for a more comprehensive discussion of this topic. In general, our proposal was to increase daylight into the space, and thus produce better color rendering.
Solar Heat Gains
As noted previously in this report, the design concept accounted for solar heat gains by specifically excluding light entering at angles 40-45° above the horizon. This corresponds with the portion of the year when cooling demands inside buildings are most intense. Alternately, our proposal allows for light to enter at angles below 40-45°. This allows the room to harvest solar heat during those periods, potentially offsetting demand for heating. The amount of solar heat to be gained may be reduced by user preference, because we intentionally have allowed for the use of manual blinds to
24 of 28

control unwanted light and glare at the user’s preference. In this case, we thought it more important to accommodate the user’s needs because of the function of the space.
EVALUATION
Illumination
The solution ultimately selected as “best” among the various experiments offers several key advantages. One is a distinctly uniform light level (285-330 lux on 26 Oct at 1100h) in the teaching/learning zone. In addition to providing this free light, this solution also limits solar heat gain and provides protection against glare.
Our target illumination level was between 500-700 lux, and on this account, this solution is inadequate. A more ambitious intervention that re-shaped the façade could have probably achieved this goal under certain sky conditions.
We learned several things about daylight illumination from these experiments. First, the ceiling plane is an important contributor to the transport and diffusion of daylight in the target space. The space we selected has a very high, irregularly shaped ceiling plane which makes it useless for transporting and distributing daylight. The two-light-shelves proposal was probably successful because of inter-reflections between the top and bottom sides of the horizontal surfaces—these may have compensated for the lack of a ceiling.
Second, we learned that very complex systems don’t always yield good results. The more times light reflects before it reaches the target area, the less will be available in that area. Our more complex proposals (see appendix) resulted in generally poor daylight distributions. However, this may also be due to the crude nature of our model and insufficient rendering time.
25 of 28

Radiance: Illumination Levels of Selected Intervention
Glare
Our target glare ratio was 1:3, and we found this easy to achieve by blocking direct sunlight, but difficult to integrate with our other goal of increased illumination deep in the space. The process became a negotiation between these two competing goals. The serendipitous intensification of glare from one window well (the southeast) lead us to a solution that treated that window differently from the rest.
Color Rendering
The effect of our proposal on the color rendering of the space was not quantifiable in time for this report. However, as noted previously in this report, better color rendering was demonstrably achievable through an increase in the brightness of the space due to daylight. As we learned in day-lighting class, daylight contains an even spectrum that best renders colors visible to the eye. Because illumination is cumulative, a substantial increase in the amount of daylight in the space can offset some electric illumination, especially during daylight hours. So, we can infer that increasing the amount of daylight in the space would result in better color rendering.
26 of 28
Solar Heat Gains
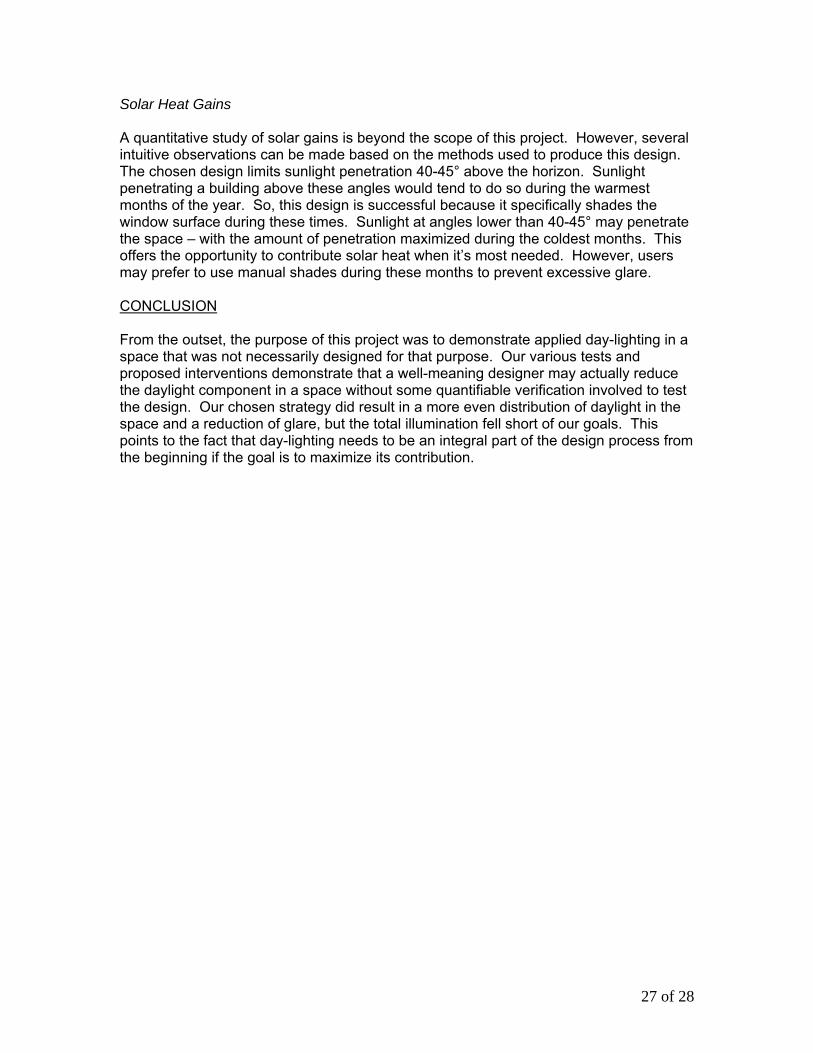
A quantitative study of solar gains is beyond the scope of this project. However, several intuitive observations can be made based on the methods used to produce this design. The chosen design limits sunlight penetration 40-45° above the horizon. Sunlight penetrating a building above these angles would tend to do so during the warmest months of the year. So, this design is successful because it specifically shades the window surface during these times. Sunlight at angles lower than 40-45° may penetrate the space – with the amount of penetration maximized during the coldest months. This offers the opportunity to contribute solar heat when it’s most needed. However, users may prefer to use manual shades during these months to prevent excessive glare.
CONCLUSION
From the outset, the purpose of this project was to demonstrate applied day-lighting in a space that was not necessarily designed for that purpose. Our various tests and proposed interventions demonstrate that a well-meaning designer may actually reduce the daylight component in a space without some quantifiable verification involved to test the design. Our chosen strategy did result in a more even distribution of daylight in the space and a reduction of glare, but the total illumination fell short of our goals. This points to the fact that day-lighting needs to be an integral part of the design process from the beginning if the goal is to maximize its contribution.
27 of 28

Appendix Table of Contents
Experiments Illumination (pg) Glare (pg) Existing Conditions 1 12
10’ Windows, Curved Louvers 12 20’ Windows, Moved In 2 12 20’ Windows, 1 Light Shelf 3 20’ Windows, 2 Light Shelves 4 13 20’ Windows, Curved Louvers 12
(1/2) 20’ Windows, Curved Louvers 13
(full height) 20’ Windows, Curved Louvers, ½ 13
Height, All Windows 2 Light Shelves, Curved Louvers, 5 14½ Height, Variations 2 Light Shelves, Curved Louvers, 13Full Height, SE Window
2 Light Shelves, Curved Louvers 8 13All Windows (full height) 2 Light Shelves, Curved Louvers, 14½ Height, Soffit Variations
2 Light Shelves, Mixed Louvers 13 Exterior Louvers 9
Exterior Louvers, 1 Light Shelf 10 Translucent Panels 11
28 of 28

Ecotect and Radiance Simulations Trials Existing Condition Simulations
Room Configuration: Shades drawn to 10’-0” AFF. All other materials and characteristics set to match existing conditions.
Radiance Settings Max E (lux): 600 Calc. Type: Natural Light (only) Sky: CIE Overcast Sky Illuminance: 7,566 lux Calc. Precision: High Window Cleanliness: Average Date/Time: 26 Oct 06 @ 1100h Analysis Grid: 2’-6” AFF Indirect Refl ections: 3 Material Settings Walls/Ceiling: r=85%, a=15% Windows: t=78% Carpet: a=83%, r=17%
Radiance/Ecotect: Interior Illumination Analysis
Actual Measured Conditions (Daylight Only) Actual Measured Conditions (Electric & Daylight)
Radiance: Simulation of Daylighting Effect CIE Overcast Sky Ecotect: Exterior View
1

Ecotect and Radiance Simulations Trials Design Experiment Simulation #1
Room Configuration: Windows open to full height (20’-0” AFF). Windows moved to interior of “tun-nels.” Material settings adjusted.
Radiance Settings Max E (lux): 600 Calc. Type: Natural Light (only) Sky: CIE Overcast Sky Illuminance: 7,566 lux Calc. Precision: High Window Cleanliness: Average Date/Time: 26 Oct 06 @ 1100h Analysis Grid: 2’-6” AFF Indirect Refl ections: 3 Material Settings Walls/Ceiling: r=85%, a=15% Windows: t=92% Flooring: a=53%, r=47%
Radiance/Ecotect: Interior Illumination Analysis
Ecotect: Exterior View
Radiance: Simulation of Daylighting Effect CIE Overcast Sky
2

Ecotect and Radiance Simulations Trials Design Experiment Simulation #2
Room Configuration: Windows open to full height (20’-0” AFF). Windows moved to interior of “tun-nels.” Material settings adjusted. One light shelf (mirrored) added ~6’-8” from top of windows.
Radiance Settings Max E (lux): 600 Calc. Type: Natural Light (only) Sky: CIE Overcast Sky Illuminance: 7,566 lux Calc. Precision: High Window Cleanliness: Average Date/Time: 26 Oct 06 @ 1100h Analysis Grid: 2’-6” AFF Indirect Refl ections: 3 Material Settings Walls/Ceiling: r=85%, a=15% Windows: t=92% Flooring: a=53%, r=47%
Radiance/Ecotect: Interior Illumination Analysis
Ecotect: Exterior View
Radiance: Simulation of Daylighting Effect CIE Overcast Sky
3

Ecotect and Radiance Simulations Trials Design Experiment Simulation #3
Room Configuration: Windows open to full height (20’-0” AFF). Windows moved to interior of “tun-nels.” Material settings adjusted. Two light shelves (mirrored) added (see diagram below).
Radiance Settings Max E (lux): 600 Calc. Type: Natural Light (only) Sky: CIE Overcast Sky Illuminance: 7,566 lux Calc. Precision: High Window Cleanliness: Average Date/Time: 26 Oct 06 @ 1100h Analysis Grid: 2’-6” AFF Indirect Reflections:3 Material Settings Walls/Ceiling: r=85%, a=15% Windows: t=92% Flooring: a=53%, r=47%
Radiance/Ecotect: Interior Illumination Analysis
Ecotect: Exterior View
Section Drawing Showing Proposed Modifications 4

Radiance: Simulation of Daylighing Effect Radiance: Simulation of Daylighting Effect CIE Overcast Sky Intermediate Sky Condition
22 Jun @ 1100h 22 Sep @ 1100h
22 Dec @ 1100h 22 Mar @ 1100h 5
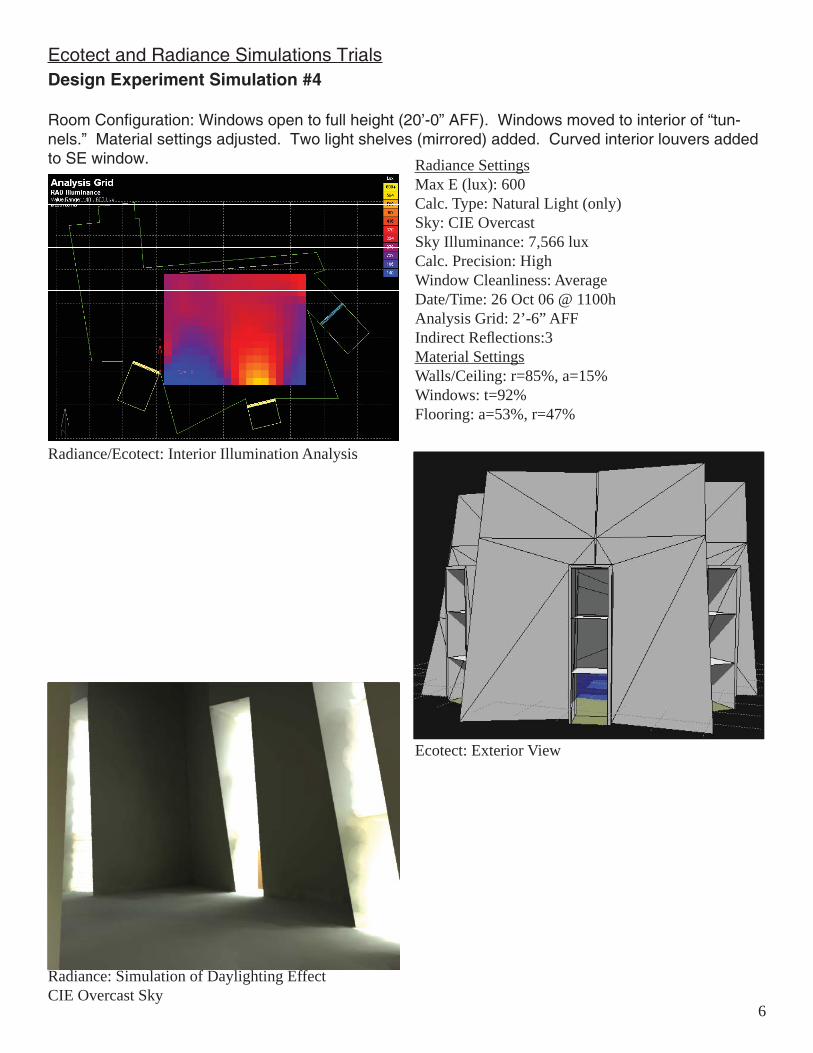
Ecotect and Radiance Simulations Trials Design Experiment Simulation #4
Room Configuration: Windows open to full height (20’-0” AFF). Windows moved to interior of “tun-nels.” Material settings adjusted. Two light shelves (mirrored) added. Curved interior louvers added to SE window. Radiance Settings
Max E (lux): 600 Calc. Type: Natural Light (only) Sky: CIE Overcast Sky Illuminance: 7,566 lux Calc. Precision: High Window Cleanliness: Average Date/Time: 26 Oct 06 @ 1100h Analysis Grid: 2’-6” AFF Indirect Reflections:3 Material Settings Walls/Ceiling: r=85%, a=15% Windows: t=92% Flooring: a=53%, r=47%
Radiance/Ecotect: Interior Illumination Analysis
Ecotect: Exterior View
Radiance: Simulation of Daylighting Effect CIE Overcast Sky
6

Radiance: Simulation of Daylighting Effect CIE Overcast Sky 6 Indirect Reflections Quality: High
7

Ecotect and Radiance Simulations Trials Design Experiment Simulation #5
Room Configuration: Windows open to full height (20’-0” AFF). Windows moved to interior of “tun-nels.” Material settings adjusted. Two light shelves (mirrored) added. Full height curved interior louvers added to all 3 windows. Radiance Settings
Max E (lux): 600 Calc. Type: Natural Light (only) Sky: CIE Overcast Sky Illuminance: 7,566 lux Calc. Precision: High Window Cleanliness: Average Date/Time: 26 Oct 06 @ 1100h Analysis Grid: 2’-6” AFF Indirect Reflections:3 Material Settings Walls/Ceiling: r=85%, a=15% Windows: t=92% Flooring: a=53%, r=47%
Radiance Simulation Imported into Ecotect
Ecotect: Exterior View
Radiance: Simulation of Daylighting Effect CIE Overcast Sky
8

Ecotect and Radiance Simulations Trials Design Experiment Simulation #6
Room Configuration: Windows open to full height (20’-0” AFF). Windows moved to interior of “tun-nels.” Material settings adjusted. Two light shelf (mirrored) added. Add straight mirrored louvers to upper 2/3 of windows on exterior of building.
Radiance Settings Max E (lux): 600 Calc. Type: Natural Light (only) Sky: CIE Overcast Sky Illuminance: 7,566 lux Calc. Precision: High Window Cleanliness: Average Date/Time: 26 Oct 06 @ 1100h Analysis Grid: 2’-6” AFF Indirect Reflections:3 Material Settings Walls/Ceiling: r=85%, a=15% Windows: t=92% Flooring: a=53%, r=47%
Radiance Simulation Imported into Ecotect
Ecotect: Exterior View of Proposed Changes
Radiance: Simulation of Daylighting Effect CIE Overcast Sky
9

Radiance Simulation Imported into Ecotect
Ecotect and Radiance Simulations Trials Design Experiment Simulation #7
Room Configuration: Windows open to full height (20’-0” AFF). Windows moved to interior of “tun-nels.” Material settings adjusted. Add straight mirrored louvers to upper 2/3 of windows on exterior of building. Add one low mirrored light shelf @ 7’-0” AFF.
Radiance Settings Max E (lux): 600 Calc. Type: Natural Light (only) Sky: CIE Overcast Sky Illuminance: 7,566 lux Calc. Precision: High Window Cleanliness: Average Date/Time: 26 Oct 06 @ 1100h Analysis Grid: 2’-6” AFF Indirect Reflections:3 Material Settings Walls/Ceiling: r=85%, a=15% Windows: t=92% Flooring: a=53%, r=47%
CIE Overcast Sky
Section Drawing Showing Proposed Modifications
Radiance Simulation of Daylighing Effect
10
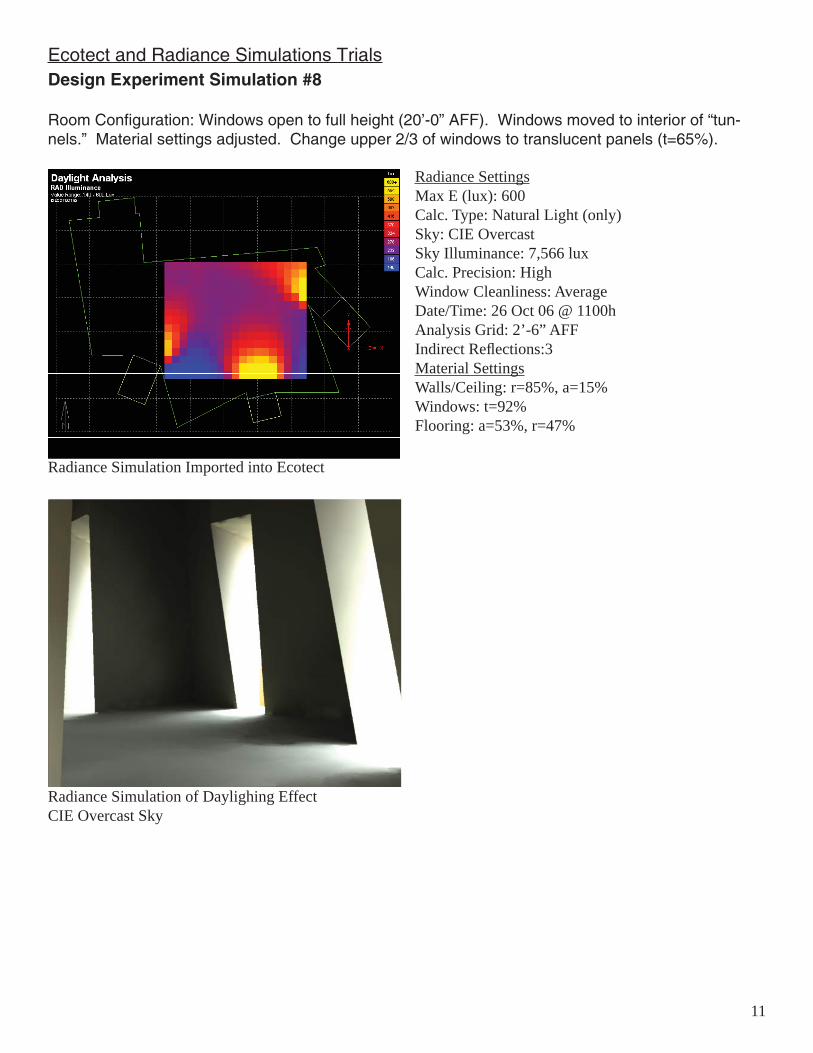
Ecotect and Radiance Simulations Trials Design Experiment Simulation #8
Room Configuration: Windows open to full height (20’-0” AFF). Windows moved to interior of “tun-nels.” Material settings adjusted. Change upper 2/3 of windows to translucent panels (t=65%).
Radiance Simulation Imported into Ecotect
Radiance Settings Max E (lux): 600 Calc. Type: Natural Light (only) Sky: CIE Overcast Sky Illuminance: 7,566 lux Calc. Precision: High Window Cleanliness: Average Date/Time: 26 Oct 06 @ 1100h Analysis Grid: 2’-6” AFF Indirect Reflections:3 Material Settings Walls/Ceiling: r=85%, a=15% Windows: t=92% Flooring: a=53%, r=47%
Radiance Simulation of Daylighing Effect CIE Overcast Sky
11

TTTrrraaannn
sssmmmiiitttttt
aaannnccce
eeRR
eeffllee
ccttiivv
iitty y
AAbbssoo
rrppttiioo
n n
Glare Sudy Ecotect Model and Radiance Luminance Mapping
Environmental Parameters:
Date & Time of Test: 11am October 26 Sky: CIE overcast Wall / Ceiling
Sy Value: 7566 lux Windows Window Cleanliness: Average Carpet
0 85% 15% 78% - -
0 17% 87%
Window Height Window Setback From
Façade
Luminance Mapping Front (North) Wall
SW S SE Base Scenario None NA
Tests 1 3' NA
2 3' NA
3 3' NA
Extension of a mirrored window soffit into room
Transmittance only through bottom 10' of
windows
Transmittance only through bottom 10' of
windows
Transmittance through full 20'
of windows
Transmittance through full 20'
of windows
Light-shelves (drawn by window
location)
Curvec Mirrored Louvers (drawn by window
location)
Luminance Maps are scaled to a maximum Luminance of 180 cd/m2
Page 12

TTTrrraaannn
sssmmmiiitttttt
aaannnccce
eeRR
eeffllee
ccttiivv
iitty y
AAbbssoo
rrppttiioo
n n
Glare Sudy Ecotect Model and Radiance Luminance Mapping
Environmental Parameters:
Date & Time of Test: 11am October 26 Sky: CIE overcast Wall / Ceiling
Sy Value: 7566 lux Windows Window Cleanliness: Average Carpet
Window Height Window Setback From
Façade
Luminance Mapping Front (North) Wall
SW S SE
Extension of a mirrored window soffit into room
Light-shelves (drawn by window
location)
Curvec Mirrored Louvers (drawn by window
location)
4 3' NA
5 3' NA
6 3' NA
7 3' NA
8 3' NA
1/3 spacing
1/3 spacing
1/3 spacing
1/3 spacing
1/3 spacing
Transmittance through full 20'
of windows
Transmittance through full 20'
of windows
Transmittance through full 20'
of windows
Transmittance through full 20'
of windows
Transmittance through full 20'
of windows
1/3 spacing
Luminance Maps are scaled to a maximum Luminance of 180 cd/m2
0 85% 15% 78% - -
0 17% 87%
Page 13

TTTrrraaannn
sssmmmiiitttttt
aaannnccce
eeRR
eeffllee
ccttiivv
iitty y
AAbbssoo
rrppttiioo
n n
9
10
11
12
Glare Sudy Ecotect Model and Radiance Luminance Mapping
Environmental Parameters:
Date & Time of Test: 11am October 26 0 85% 15%
78% - -0 17% 87%
Sky: CIE overcast Wall / Ceiling Sy Value: 7566 lux Windows
Window Cleanliness: Average Carpet
Window Height Window Setback From
Façade
SW S SE
Curvec Mirrored Louvers (drawn by window
location)
Light-shelves (drawn by window
location)
Extension of a mirrored window soffit into room
Luminance Mapping Front (North) Wall
Transmittance through full 20'
of windows
3' 1/3 spacing
NA
1/3 spacing
1/3 spacing
Transmittance through full 20'
of windows
3' 1/3 spacing
NA
1/3 spacing
1/3 spacing
Transmittance 3' NA through full 20'
of windows 2/3 spacing
1/3 spacing
Transmittance 3' 3' through full 20'
of windows 2/3 spacing
1/3 spacing
Transmittance through full 20'
of windows
3' 1/3 spacing
3'
1/3 spacing
1/3 spacing
Luminance Maps are scaled to a maximum Luminance of 180 cd/m2
Page 14
13