day 4+5: data analysis & graphing in excel udm msc course in education & development 2013...
TRANSCRIPT

Day 4+5: Data analysis & Graphing in Excel
U D M M SC C O U R S E I N E D U C AT I O N & D E V E L O P M E N T 2 0 1 3
N i c h o l a s S p a u l l @ g m a i l . c o m – w w w. n i c s p a u l l . c o m / t e a c h i n g

Practicals (Day 4 and 5)
How to get pivot tables in Excel How to create pivot-charts
Given that this section is very important and useful I will give you two screencasts that I’ve prepared covering the content. That way if you don’t follow something in the lecture you can always re-watch the screencase.
Watch the screencast “A Basic Introduction to SACMEQ in Excel.” (This is available online. See point number three on this website: http://resep.sun.ac.za/index.php/training/ but it is only a low quality version. I will give you the 200MB video during class)
Watch the screencast “An introduction to graphing in Excel.” http://www.youtube.com/watch?v=1azdCMEn1NA#t=1709

SACMEQ Data
SACMEQ III 2007 Grade 6 numeracy and literacy
Using pivot tables to calculate measures of: Preschool attendance by quintile Average reading and maths scores by gender Textbook access by quintile and province
Aims Using pivot tables to extract meaning from data Using conditional formatting
For the screeI have given you the dataset that is used in the screencasts: “SACMEQ III SA – intro to pivot tables”,
this is so that you can follow the screencasts using the exact same dataset. However, given that Mozambique is not in this dataset I have given you another dataset
“SACMEQ III All country BASIC” which has Mozambique in it. Follow the screencasts with the
South African data then use the Mozambican data set.
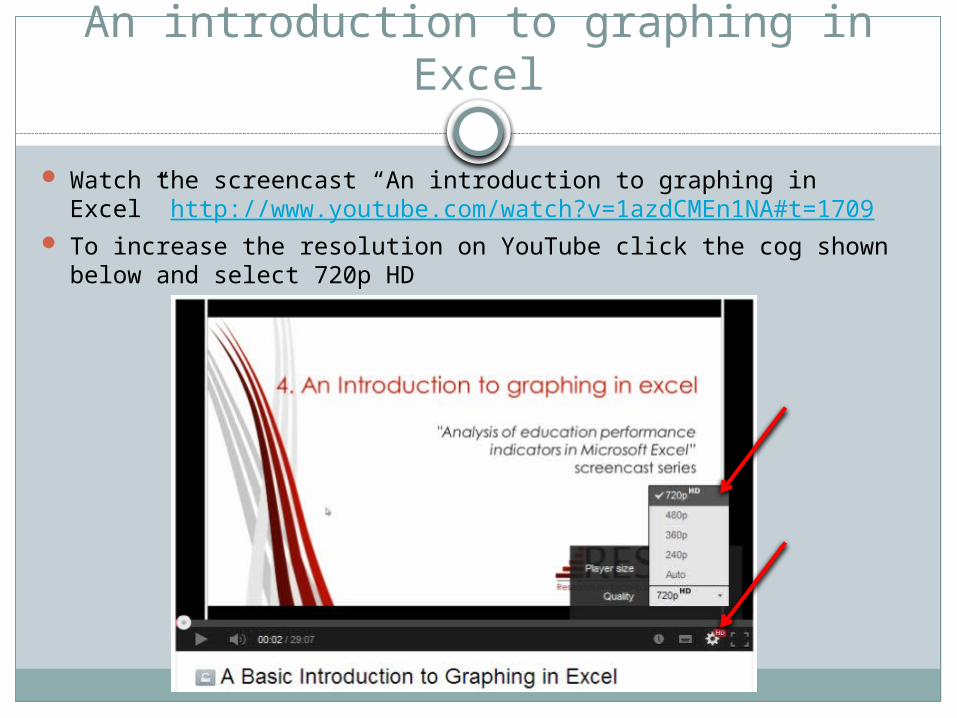
An introduction to graphing in Excel
Watch the screencast “An introduction to graphing in Excel” http://www.youtube.com/watch?v=1azdCMEn1NA#t=1709
To increase the resolution on YouTube click the cog shown below and select 720p HD
Tutorial quiz 5
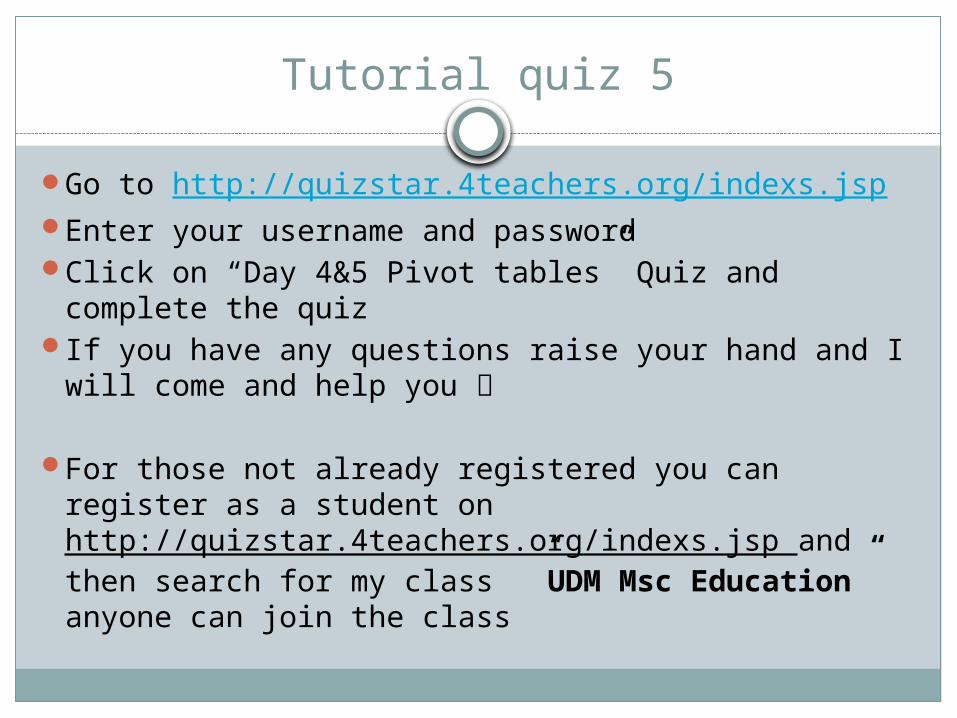
Go to http://quizstar.4teachers.org/indexs.jsp Enter your username and passwordClick on “Day 4&5 Pivot tables” Quiz and complete
the quizIf you have any questions raise your hand and I will
come and help you
For those not already registered you can register as a student on http://quizstar.4teachers.org/indexs.jsp and then search for my class ”UDM Msc Education” anyone can join the class

Review of material for the test
We will go through the content that will be in the test and we can revise the sections which students are not completely comfortable with.

Course assessment
At the end of the course I will create an online test that is very similar to the quizes we have been doing during the course. This will be a timed-test and you will have three hours to complete the test.
I will give your more details two weeks before the test so that you can prepare.