david walsh electro-optic development for short bunch length monitoring david walsh, astec steven...
TRANSCRIPT

David Walsh
Electro-Optic development for short bunch length monitoring
David Walsh, ASTeCSteven Jamison, Edward Snedden,
Allan Gillespie, Thibaut Lefevre
David Walsh
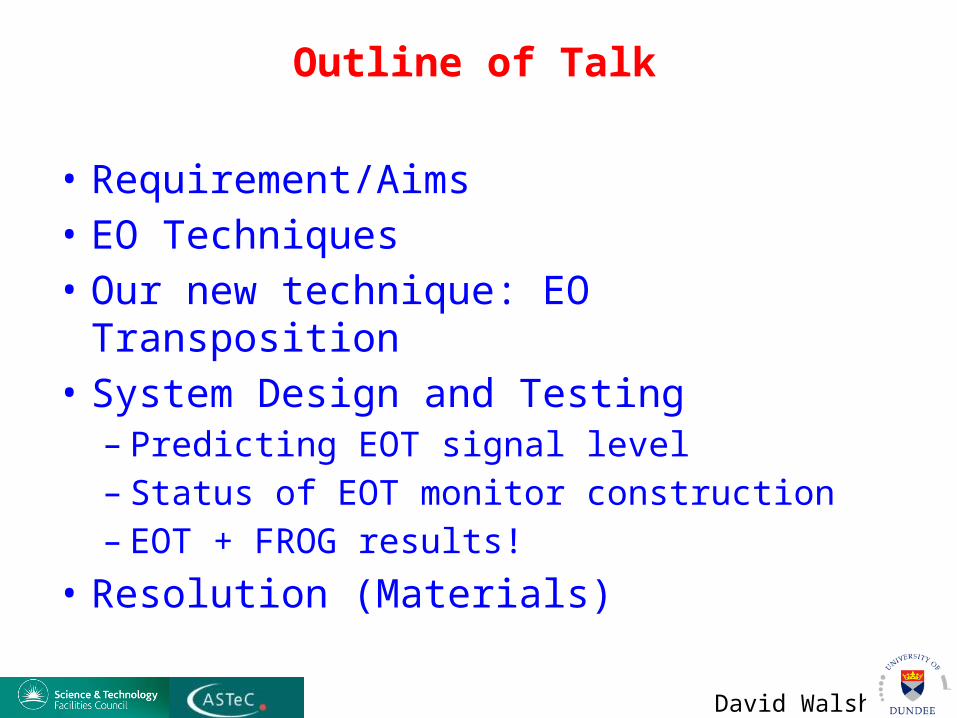
Outline of Talk
• Requirement/Aims• EO Techniques• Our new technique: EO Transposition• System Design and Testing
– Predicting EOT signal level– Status of EOT monitor construction– EOT + FROG results!
• Resolution (Materials)

David Walsh
Requirement and Aims
CLIC project targets• Non-invasive• Single shot• Diagnostic target resolution ~20fs rms (Bunches ~150fs rms)
EO diagnostics: (encoding of Coulomb field into a laser field)Advantages• Scales well with high beam energy
– Particle methods get impractical (size, beam dumps)
• Non-destructive– Bunches can still be used– Live feedback
Challenges• Unreliability, maintenance and cost of suitable ultrashort pulse laser systems• Temporal resolution
We aim to improve on the resolution and the robustness of EO diagnostics
David Walsh
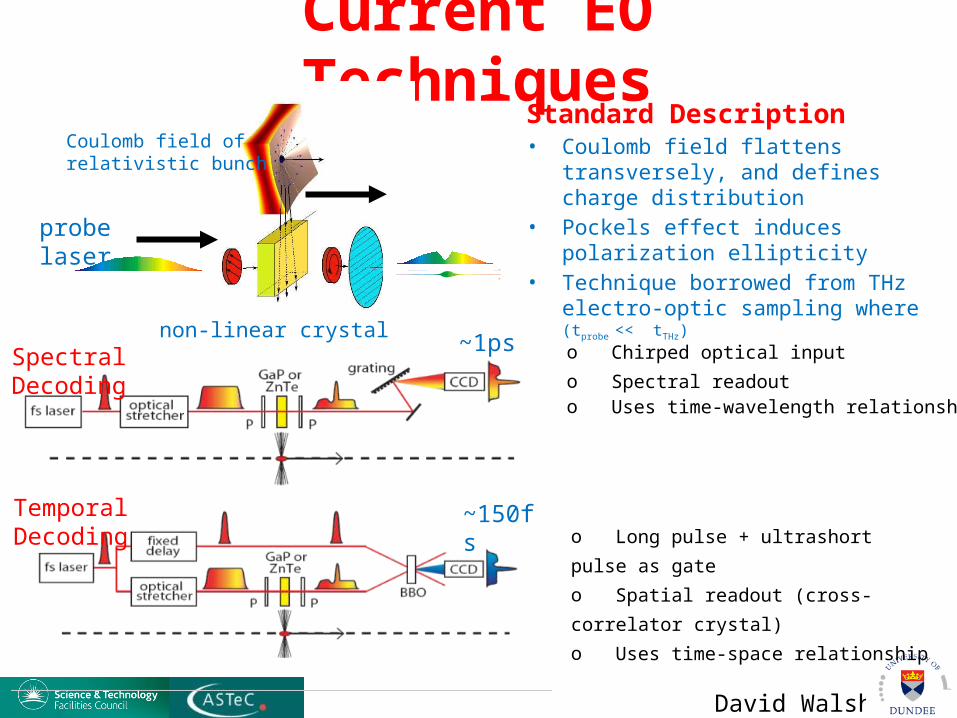
Current EO TechniquesCoulomb field of relativistic bunch
probe laser
non-linear crystal
Standard Description• Coulomb field flattens transversely, and
defines charge distribution• Pockels effect induces polarization ellipticity• Technique borrowed from THz electro-optic
sampling where (tprobe << tTHz)
Spectral Decoding o Chirped optical input o Spectral readouto Uses time-wavelength relationship
~1ps
Temporal Decodingo Long pulse + ultrashort pulse as gateo Spatial readout (cross-correlator crystal)o Uses time-space relationship
~150fs

David Walsh
Physics of EO TranspositionMore Rigorous Description – nonlinear frequency mixing
S.P. Jamison Opt. Lett. v31 no.11 p1753
EOT pulse
t
ECoulomb field Optical field in
t t
E E~50fs
Tim
e D
omai
n
Inte
nsity
Inte
nsity
ν
few mm
tens μm
820nm
Coulomb field EOT spectrum
circa 20nmIn
tens
ity
~820nmOptical field
ν ν
Freq
uenc
y D
omai
n
David Walsh
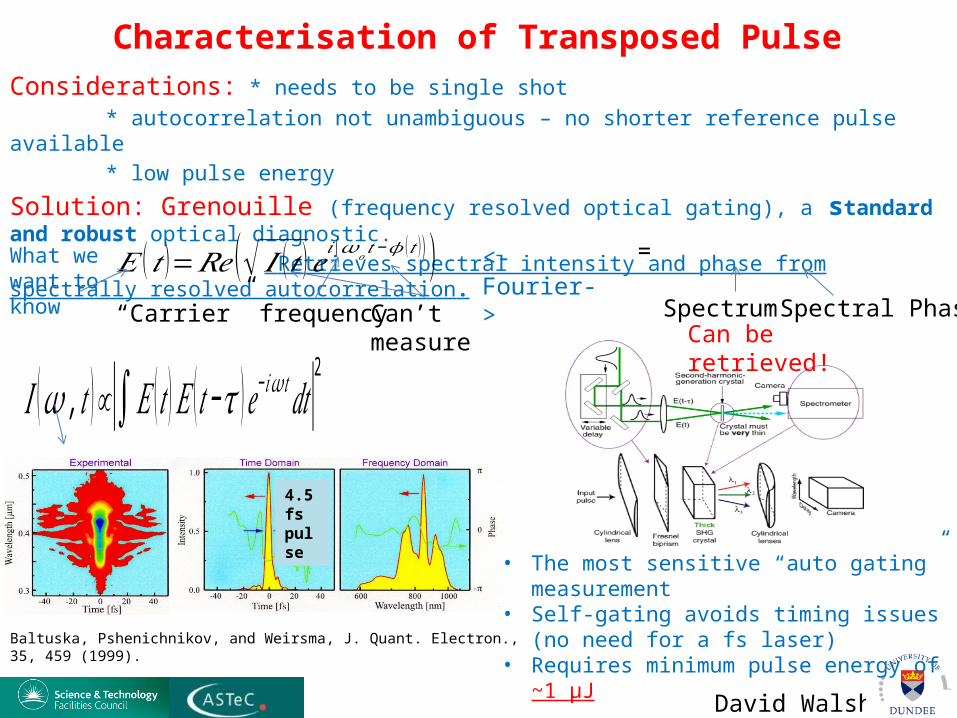
Characterisation of Transposed PulseConsiderations: * needs to be single shot
* autocorrelation not unambiguous – no shorter reference pulse available* low pulse energy
Solution: Grenouille (frequency resolved optical gating), a standard and robust optical diagnostic. Retrieves spectral intensity and phase from spectrally resolved autocorrelation.
=
Spectrum Spectral Phase
• The most sensitive “auto gating” measurement• Self-gating avoids timing issues (no need for a fs
laser)• Requires minimum pulse energy of ~1 μJ
𝐸 (𝑡 )=𝑅𝑒 (√ 𝐼 (𝑡 )𝑒𝑖 (𝜔𝑜 𝑡−𝜙 (𝑡 )) )“Carrier” frequency Can’t measure
What we want to know
<-Fourier->
Can be retrieved!
𝐼 (𝜔 , 𝑡 )∝|∫ 𝐸 (𝑡 )𝐸 (𝑡−𝜏 )𝑒− 𝑖𝜔𝑡 𝑑𝑡|2
4.5 fspulse
Baltuska, Pshenichnikov, and Weirsma, J. Quant. Electron., 35, 459 (1999).

David Walsh
NanosecondLaser System
Stretcher Comp-ressor
BBO DIYGRENOUILLE
Generation
1000x Amplification(NCOPCPA)
Measurement
Coulomb field
GaP
¼λ plate& polariser
Beamdump
Beamdump
Pulse Evolution
time
ampl
itud
e
nano
seco
nd p
robe
“tra
nspo
sed
puls
e”
stre
tche
d
ampl
ified
reco
mpr
esse
d
532nm10mJ10ns
~800nm10ns1mJ
1. Nanosecond laser derived single frequency probe brings reliability2. “Electro-Optic Transposition” of probe encodes temporal profile3. Non-collinear optical parametric chirped pulse amplification (NCOPCPA)
amplifies signal4. Full spectral amplitude and phase measured via FROG5. Coulomb field, and hence bunch profile, calculated via time-reversed
propagation of pulse
EO Transposition System
David Walsh
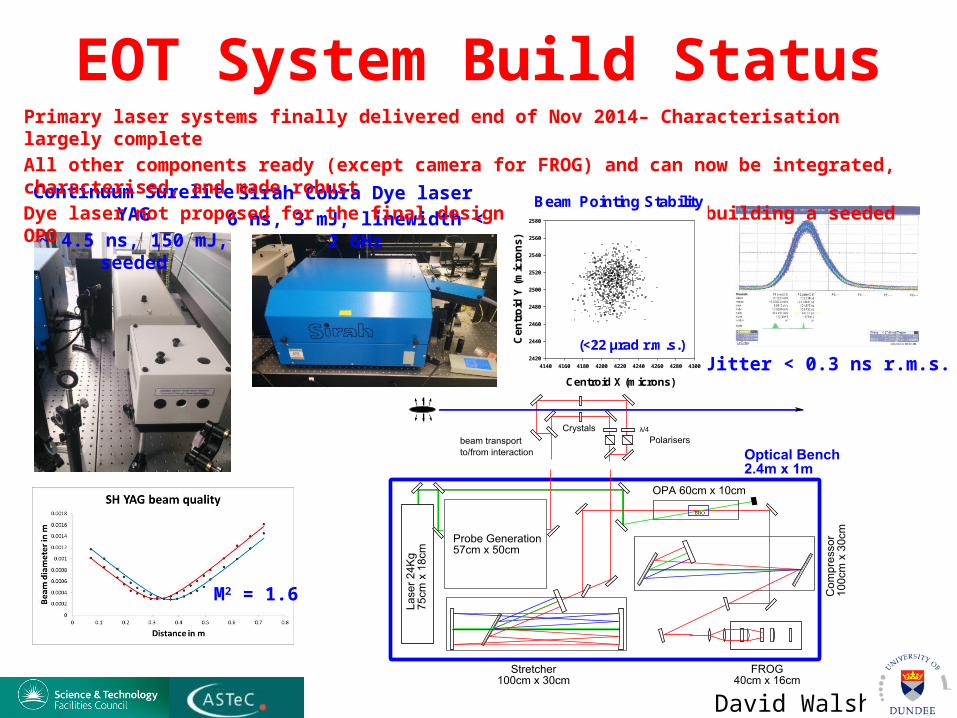
EOT System Build Status
Sirah Cobra Dye laser6 ns, 3 mJ, linewidth < 2 GHz
Continuum Surelite YAG~ 4.5 ns, 150 mJ, seeded
Jitter < 0.3 ns r.m.s.
M2 = 1.6
Primary laser systems finally delivered end of Nov 2014– Characterisation largely completeAll other components ready (except camera for FROG) and can now be integrated, characterised, and made robustDye laser not proposed for the final design – possibility of building a seeded OPO
Beam Pointing Stability
Centroid X (microns)
4140 4160 4180 4200 4220 4240 4260 4280 4300
Cen
tro
id Y
(m
icro
ns)
2420
2440
2460
2480
2500
2520
2540
2560
2580
(<22 µrad r.m.s.)

David Walsh
Characterisation of EO Transposition
Δν ~44GHzΔ t ~10ps FWHM
Femtosecond laser-based test bed
Femtosecond laser pulse spectrally filtered to produce narrow bandwidth probe
Auston switch THz source mimics Coulomb field.Well-characterised spectral and temporal profile.
Switchable diagnostics – Balanced sampling, Crossed Sampling, and Autocorrelation (spectrally resolved!)

David Walsh
Experimental System
Balanceddetectors
Autocorrelator
CrossedPolariserAndSpectrometerPmt &
Lock-in
4-f filter
THz Source and interaction point
David Walsh
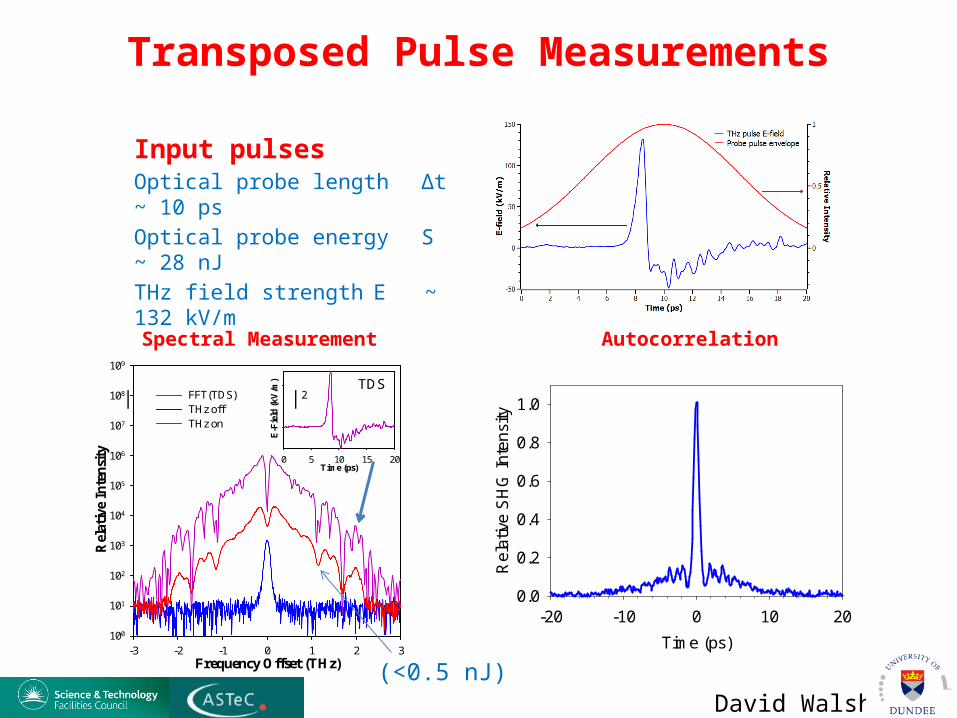
Input pulsesOptical probe length Δt ~ 10 psOptical probe energy S ~ 28 nJTHz field strength E ~ 132 kV/m
Frequency Offset (THz)-3 -2 -1 0 1 2 3
Rel
ativ
e In
ten
sity
100
101
102
103
104
105
106
107
108
109
FFT(TDS)THz off THz on
Time (ps)0 5 10 15 20
E-F
ield
(k
V/m
) TDS| |2
Transposed Pulse Measurements
Autocorrelation of Filtered Probe with THz ON
Time (ps)
-20 -10 0 10 20
Rel
ativ
e S
HG
Inte
nsity
0.0
0.2
0.4
0.6
0.8
1.0
Spectral Measurement Autocorrelation
(<0.5 nJ)
David Walsh
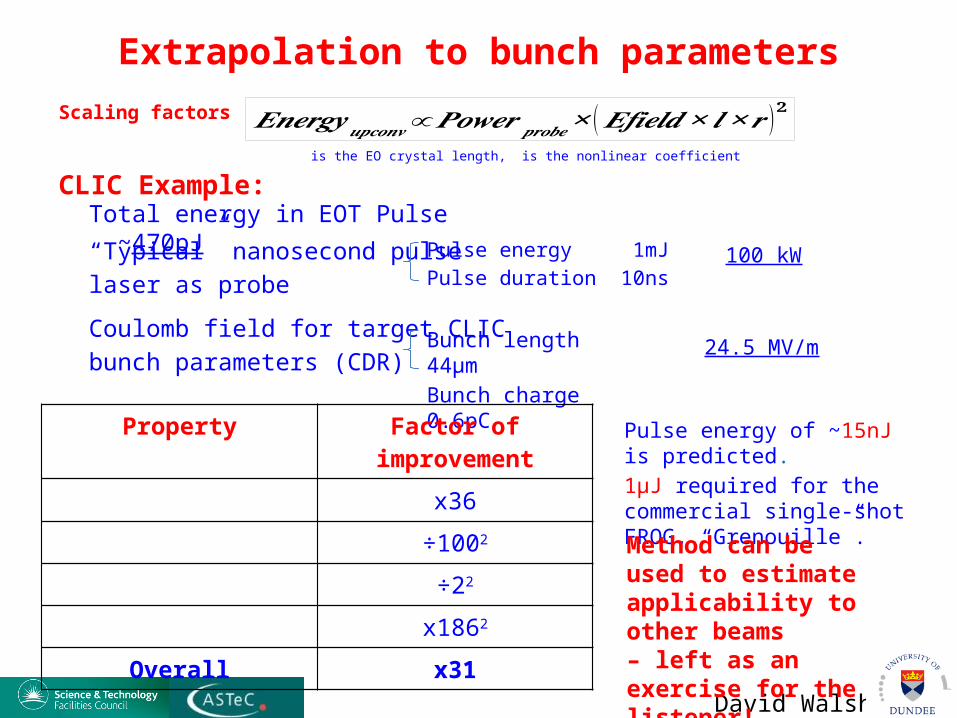
Scaling factors 𝑬𝒏𝒆𝒓𝒈𝒚 𝒖𝒑𝒄𝒐𝒏𝒗∝𝑷𝒐𝒘𝒆𝒓 𝒑𝒓𝒐𝒃𝒆× (𝑬𝒇𝒊𝒆𝒍𝒅× 𝒍×𝒓 )𝟐
Pulse energy of ~15nJ is predicted.1μJ required for the commercial single-shot FROG, “Grenouille”.
is the EO crystal length, is the nonlinear coefficientCLIC Example:
Pulse energy 1mJPulse duration 10ns
“Typical” nanosecond pulselaser as probe
Coulomb field for target CLICbunch parameters (CDR)
Bunch length 44μmBunch charge 0.6pC
Property Factor of improvement
x36÷1002
÷22
x1862
Overall x31
24.5 MV/m
100 kW
Extrapolation to bunch parameters
Method can be used to estimate applicability to other beams– left as an exercise for the listener!
Total energy in EOT Pulse ~470pJ
David Walsh
E-field
Time (ps)-2 -1 0 1 2 3
Ele
ctr
ic F
ield
-0.2
0.0
0.2
0.4
0.6
0.8
1.0
TDS - E-field
FROG - (Intensity)1/2 x cos(Phase)
Intensity
Time (ps)-3 -2 -1 0 1 2 3
Inte
ns
ity
0.0
0.2
0.4
0.6
0.8
1.0
Ph
as
e
-1pi
0pi
1pi
2pi
TDS - |E-field|2
FROG - Intensity envelopeFROG - Phase
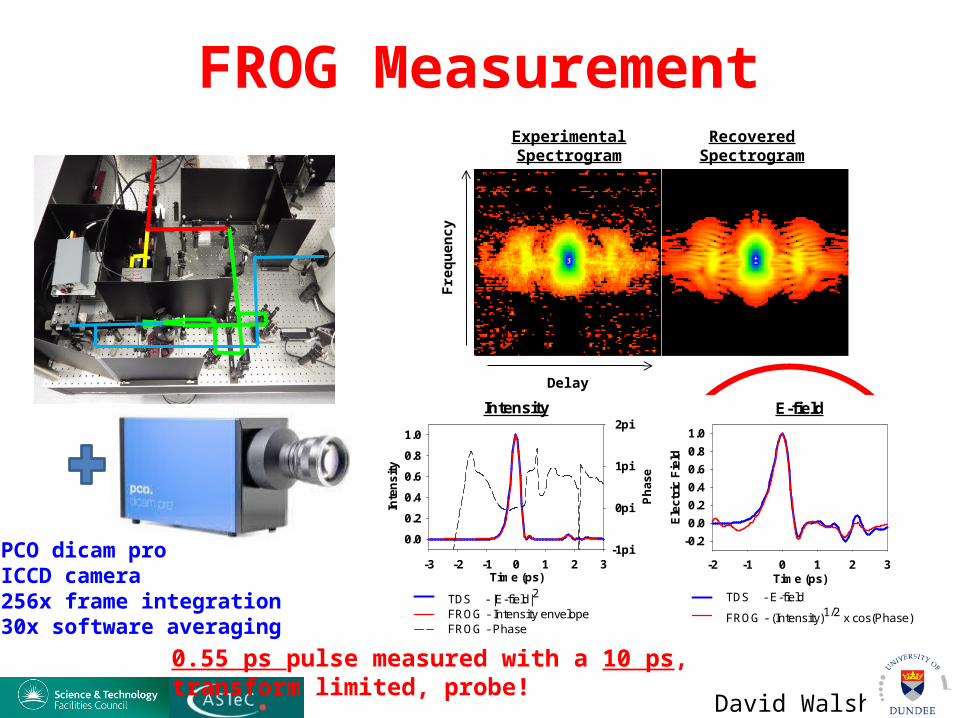
FROG Measurement
Delay
Fre
qu
ency
Experimental Spectrogram
Recovered Spectrogram
0.55 ps pulse measured with a 10 ps, transform limited, probe!
PCO dicam proICCD camera256x frame integration30x software averaging

David Walsh
Wavelength (nm)
796 798 800 802 804 806
Inte
nsi
ty
Del
ay (6
0 ps
win
dow
)New THz Measurement Scheme
This looks like a spectrogram!
(an absolute phase FROG!)This is a FROG where both SFG and DFG mechanisms are present and spectrally overlap, a FROG algorithm was modified to account for this.Essentially, the interference pattern between SFG and DFG in the trace reveals the absolute phase.
Theory extended to optical pulsesand is being published (on Arxiv now)arXiv:1501.04864 [physics.optics]

David Walsh
Temporal ResolutionEO transposition scheme is now limited by materials:• Phase matching and absorption bands in ZnTe/GaP.• Other materials are of interest, such as DAST or poled polymers, but there are questions
over the lifetime in accelerator environments.
Collaborative effort with MAPS group at the University of Dundee on development of novel EO materials• Potential to produce an enhancement of nonlinear processes through metallic
nanoparticles.• THz field induced second harmonic TFISH enhancement being investigated.• Surface nonlinear effects…
A key property of the EO Transposition scheme may be exploited• FROG (Grenouille) retrieves the spectral amplitude and phase• At frequencies away from absorptions etc. the spectrum should still be faithfully retrieved• Potential to run two, “tried and tested”, crystals with complementary response functions
side by side to record FULL spectral information!
David Walsh
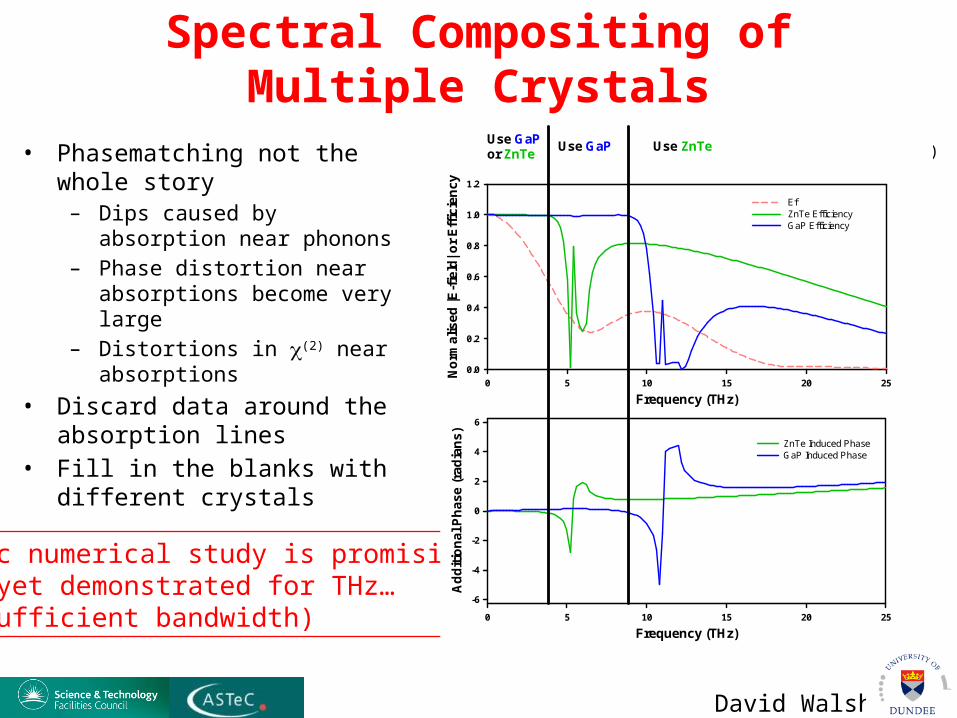
Spectral Compositing of Multiple Crystals
Frequency (THz)0 5 10 15 20 25
Ad
dit
ion
al P
has
e (r
adia
ns)
-6
-4
-2
0
2
4
6
ZnTe Induced PhaseGaP Induced Phase
Frequency (THz)0 5 10 15 20 25
No
rmal
ised
|E-f
ield
| or
Eff
icie
ncy
0.0
0.2
0.4
0.6
0.8
1.0
1.2
EfZnTe Efficiency GaP Efficiency
Use GaPUse GaPor ZnTe
Use ZnTe• Phasematching not the whole story– Dips caused by absorption near
phonons– Phase distortion near absorptions
become very large– Distortions in c(2) near absorptions
• Discard data around the absorption lines
• Fill in the blanks with different crystals
(10 mm thicknesses)
Basic numerical study is promising.Not yet demonstrated for THz…(insufficient bandwidth)

David Walsh
Thank you for your attention

David Walsh
Chirped Pulse Optical Parametric Amplification
Frequency (THz)300 320 340 360 380 400
Eff
icie
ncy
0.0
0.2
0.4
0.6
0.8
1.0
Ph
ase
-1pi
0pi
1pi
Rel
ativ
e S
pec
tral
In
ten
sity
0
1
2
Efficiency Phase ChangeUnamplified Amplified
• Very small Phase and Amplitude distortions can be calculated (and so can be removed)
• Bandwidth very broad >50THz• Tested using stand-ins for pump and signal – picosecond laser system and
Ti:Sapphire laserPulse spectrum maintained
Heavily attenuated800nm, 50fs pulse
20mm BBOθ = 23.81α = 2.25
532nm, ~300MW/cm2
optic axisθ
α
Photodiode orSpectrometer
Gain of >1000x verified
Pump derived from 50ps pulse laser
David Walsh
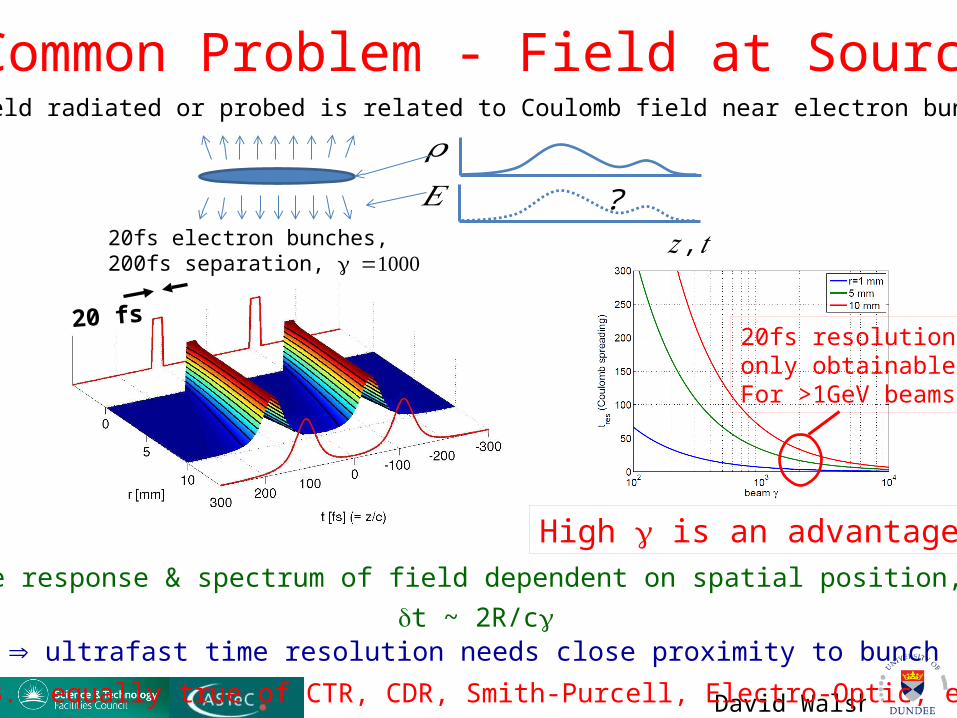
Time response & spectrum of field dependent on spatial position, R:dt ~ 2R/cg
ultrafast time resolution needs close proximity to bunch
(N.B. equally true of CTR, CDR, Smith-Purcell, Electro-Optic, etc.)
Common Problem - Field at Source
20 fs
Field radiated or probed is related to Coulomb field near electron bunch
20fs electron bunches, 200fs separation, =1000g
𝜌𝐸 ?
𝑧 , 𝑡
High g is an advantage!
20fs resolution only obtainable For >1GeV beams

David Walsh
LATTE LabThe Laboratory forLaser, Terahertz and Terawatt Experimentsin accelerator applications
Lab overview
Longitudinal Profile Monitor CLIC-UK project
UV diagnostics and novel EO materials
TW laser system: to be commissioned. Output available in lab
High power, adjustable temporal profile and polarisation state THz sources >1 MV/m
Core laser sources (lockable to RF):Ti:Sapphire - 81 MHz, <50 fs, 400 mW or 1 kHz, <50 fs, >1 mJOPA - 1 kHz, 570 nm to 12 µm, 1 µJ to 270µJ (λ dependent)
David Walsh
Stretcher and Compressor Design
GVD = 5.6x10⁶ fs2
Calculations indicate nanosecondlevel jitter has negligible effect
Pulse Properties Peak Power
532nm Pump10mJ, 10ns
Gaussian temporal profile
1x10⁶ W
800nm EO TranspostionSignal
Amplified signal energy > 1 μJ, ~50 fs 20x106 W
As above but stretchedGVD = 5.6x10⁶ fs2 > 1 μJ, ~310 ps 3.2x10³ W
>Pump! Not possible
Conjugate Stretcher and Compressor designs1m
1m
0.5m
All gratingsG=1200 lines/mmΘdeviation~15°
OK, will not distort