david noel david kelly noel kelly civil -04'00' · see attachment a for existing...
TRANSCRIPT
DAVIDNOELKELLYCIVIL
David Noel Kelly 2015.09.29 16:54:45 -04'00'

TABLE OF CONTENTS
Stormwater Management Summary Checklist for Stormwater Report Illicit Discharge Statement Existing Conditions Analysis .................................................................................................. Attachment A Existing Drainage Exhibit ............................................................................................................. Runoff Curve Numbers ................................................................................................................. Hydraflow Hydrographs Model ................................................................................................... Existing Conditions Hydrograph Summary Chart .................................................................... Individual Hydrographs for 100 year storm .......................................................................... Proposed Conditions Analysis ............................................................................................... Attachment B Proposed Drainage Exhibit ........................................................................................................... Runoff Curve Numbers ................................................................................................................. Hydraflow Hydrographs Model ................................................................................................... Proposed Conditions Hydrograph Summary Chart ............................................................. Individual Hydrographs for 100 year storm ...................................................................... Subsurface Recharge System ................................................................................................... Attachment C Required Recharge Calculations and Drain Down Time Calculations ................................. Cultec Design Calculator and Stage Storage Calculator ...................................................... Recharge Pond Stage Storage Calculator ............................................................................ Rational Method Pipe Sizing ................................................................................................. Attachment D Pipe Sizing Exhibit ............................................................................................................. Rational Method Pipe Sizing Calculations .......................................................................... Manning Calculator for each pipe ............................................................................................... TSS Removal ........................................................................................................................... Attachment E TSS Removal Worksheets .................................................................................................. Water Quality Calculations ................................................................................................ Provided Water Quality Volumes ................................................................................................ Contech Water Quality Calculations ........................................................................................... Stormwater Maintenance System Operation and Maintenance Plan ....................................... Operation and Maintenance Worksheet ...................................................................................... BMP Location Map ....................................................................................................................... Miscellaneous ............................................................................................................................ Attachment F Required Recharge Volume .......................................................................................................... Infiltration Rates ............................................................................................................................ NRCS Soils Maps ............................................................................................................................. Site Specific Soils information … ................................................................................................... USGS Location Map… ....................................................................................................................
Page 1
INTRODUCTION
The purpose of this report is to analyze the pre-development and post-development drainage conditions for the proposed project and to demonstrate that the project will have no negative impacts on the surrounding properties and resource areas. The design incorporates multiple management practices. The project as designed is complaint with the Massachusetts Department of Environmental Protection Stormwater Management Standards, The town of Ashland Conservation Commission Stormwater Management By-Law and Regulations, and the Town of Ashland Wetlands Protection By-Law and Regulations.
PROJECT DESCRIPTION The project consists of a 398 unit Apartment Complex
to be constructed on approximately 30 Acres of the 200 plus Acre mixed use development known as Ashland Station. The proposed project will replace the previously approved “Jefferson at Ashland Station” that consisted of 500 Units on approximately the same 30 Acres.
The proposed development will include 9 3.5 story Apartment Buildings, 21 detached garage buildings with 168 car spaces, 548 surface parking stalls, a clubhouse amenity facility, a playground, a dog run, and a recycle center. Utilities including natural gas, electricity, and sewer will be serviced from the existing MTBA access road. A state of the art drainage system will be installed to match existing drainage patterns and decrease
RELATION TO PREVIOUS PROJECTS

Page 2
As stated in the introduction the current project replaces the 500 unit Jefferson At Ashland Station. The primary difference of this 398 unit proposal is that the current proposal does not propose to utilize a park wide storm water management system. The current design will utilize on site best management practices. In order to prepare this storm water management report we have reviewed “Stormwater Management Report, Jefferson at Ashland Station, An Apartment Community, by Allen & Major Associates, Inc., for JPI Development L.P. last dated April 2007. This report will be referenced as the (“2007 SWM Report”) This report chose three analysis points that are similar to those reviewed in the referenced report. These include runoff that enters High Street and eventually enters the Sudbury River to the North of the site (Sudbury River), runoff that flows across MTBA road and enters the existing wetland system located north of the project and just south and east of the MTBA parking lot (Northerly Wetlands), and runoff that crosses MBTA road and enters the wetland system just to the south and east of proposed site and south of the Nyanza Superfund Site(Easterly Wetlands)
EXISTING SITE
The 30+/- Acre site is located on the west side of MBTA Road Exhibit and located in the Rail Transit Overlay Overlay District “E”. The site currently consists of wooded areas with elevations ranging from 258 to 358. A review of the NRCS soils maps show that the majority of the site consists Paxton fine Sandy Loam that is rate as hydrologic soil group(HSG) D. The area of the site closest to MTBA roadway consists of Narraganset Silt Loam that is HSG A. In addition to reviewing the soils maps the test holes, borings, and percolation testing provided in the 2007 SWM has also been reviewed. The

Page 3
soil testing is consistent with the NRCS mapping. The NRCS mapping and relevant portions of the 2007 SWM geotechnical information can be viewed in Attachment E. As stated above the existing stormwater catchment areas and design points have been chosen based on the 2007 SWM Report. Approximately 67 Acres have been analyzed for pre and post runoff conditions. Three Design Points have been chosen. Approximately 19.5 Acres currently runs off the North and West of the Site toward High Street and eventually enters the Sudbury River to the North and West of the Site. 33.2 Acres currently drains across MBTA road, enters the wetland area North of the site and South East of the MBTA parking lot. This wetland drains to Chemical Brook, a stone ditch that runs along the rail road tracks, and exists Ashland Station through an existing 36” pipe that goes under the CSX railway. Approximately 13.7 Acres Cross MTBA Raodway and enter the wetlands system located to the South and East. Runoff that enters this wetland travels around the Nyanza Superfund Site, and ultimately crosses Megunko Road, combines with Chemical Brook and enters the 36” culvert that crosses the CSX rail line. See Attachment A for existing conditions drainage maps and runoff calculations.
PROPOSED SITE
The proposed project will entail constructing 398 Apartment units in 9 3.5 Apartment Buildings, 21 detached garage buildings with 168 car spaces, 548 surface parking stalls, a clubhouse amenity facility, a playground, a dog run, and a recycle center. A stormwater management system has been designed to comply with Massachusetts Department of Environmental Protection Standards for stormwater management.

Page 4
The Stormwater management system will incorporate many Best Management Practices (BMPs), which will include multiple deep sump catch basins, 2 proprietary water quality devices, 9 subsurface recharge chambers, 1 stommwater management pond, an operations and maintenance program designed to treat, recharge, and detain all of the runoff generated from the proposed development of the site. See Proposed Conditions Drainage Exhibit in Attachment B.
STORMWATER MANAGEMENT STANDARDS The following is a discussion of the Massachusetts Stormwater Management Standards STANDARD 1: NO NEW UNTREATED DISCHARGES
The proposed project has been designed for no new untreated discharges from the site. The proposed pavement areas will be treated by proprietary water quality devices or biofilter swales.
STANDARD 2: PEAK RATE ATTENUATION Existing and developed sites were modeled using Hydraflow Hydrographs 10 computer program by AutoCAD Civil 3D 2013. This computer software uses the TR55/TR20 tabular method of computing peak flows, hydrograph addition, and pond routing. The curve numbers for the existing conditions analysis were determined using soil survey maps which show hydrologic group A and D soils. See soil survey map in Attachment F. As can be seen from the summary chart below, the peak flows from the design storm on the site will be reduced as a result of this project. Peak flow mitigation is provided within the stormwater management pond The entire TR55 analysis is included in Attachment A (existing conditions) and B (proposed conditions) of this report.

Page 5
Peak Runoff Chart (To High Street and The Sudbury River)
Storm Existing Proposed Difference (yr, inches) (cfs) (cfs) (cfs)
2,3.1 17.68 11.13 -6.55 10,4.5 33.15 21.65 -11.5 25,5.3 45.86 28.01 -17.85 50,5.9 52.35 32.89 -19.46 100,6.5 61.55 37.84 -23.71
Peak Runoff Chart (To Northerly Wetlands)
Storm Existing Proposed Difference (yr, inches) (cfs) (cfs) (cfs)
2,3.1 10.12 5.31 -4.81 10,4.5 27.66 23.49 -4.17 25,5.3 44.74 39.08 -5.66 50,5.9 54.05 51.49 -2.56 100,6.5 67.68 64.52 -3.16
Peak Runoff Chart (To Easterly Wetlands)
Storm Existing Proposed Difference (yr, inches) (cfs) (cfs) (cfs)
2,3.1 0.836 0.956 0.12 10,4.5 4.195 4.632 0.437 25,5.3 8.745 8.186 -0.559 50,5.9 11.50 11.41 -0.09
100,6.5 15.86 15.02 -0.84

Page 6
STANDARD 3: RECHARGE
The project site contains hydrologic group A and B soils according to the NRCS soil maps and confirmed by on site soil testing by others. Based on DEP guidelines for recharge, the required recharge volume for hydrologic group A soils is 0.6” and the required recharge volume for Group D soil is 0.1”. The project complies with the DEP guidelines for the Static Method that requires the total required recharge volume be provided below the lowest overflow and drain down within 72 hours after a rain event. The total impervious area on the proposed site is 543,985 s.f. and will require 11,024 cu.ft. of recharge volume. The dedicated recharge volume has been provided in the 9 subsurface recharge basins and one recharge pond totaling 12,543 cu.ft of dedicated recharge volume. See Attachment C for detailed calculations and recharge volumes
STANDARD 4: STORMWATER QUALITY Stormwater runoff from the site will be enhanced by means of a number of Best Management Practices (BMP’s), which have been designed to comply with the DEP Stormwater Management Guidelines. In order to achieve a Total Suspended Solids (TSS) removal rate of 80%, the following BMP’s will be incorporated: o Pavement sweeping and maintenance program o 2 ea. Proprietary Water Quality Devices o Deep Sump Catch Basins o Constructed Wetland Water Quality Pond with
Sediment Forebay. o Infiltration basins including 9 subsurface and one
surface basin. The total TSS removal is expected to be greater than 80%. See TSS Removal in Attachment E.

Page 7
STANDARD 5: Land Uses with Higher Potential Pollutant Loads (LUHPPL’s)
The proposed project is considered a land use with higher potential pollutant loads due to 1,000 average daily traffic trips. The proposed use is not an industrial use and is not subject to a NPDES Multi-Sector General Permit.
STANDARD 6: CRITICAL AREAS
The site is not in an active public water supply, surface water protection area, nor groundwater protection area, and is not in an area of critical environmental concern.
STANDARD 7: REDEVELOPMENT
The proposed project constitutes both redevelopment and new development.
STANDARD 8: CONSTRUCTION PERIOD POLLUTION PREVENTION AND EROSION CONTROL
A construction phasing plan will be established when a site contractor is consulted. At that time a construction phasing plan and the associated Stormwater Pollution Prevention Plan will be prepared and submitted to the Town of Framingham and the EPA.
STANDARD 9: OPERATIONS AND MAINTENANCE PLAN
The Stormwater Management System Operation and Maintenance Plan and Long Term Pollution Prevention Plan, Operations and Maintenance Log, and BMP Location Map are provided in Attachment D.
Page 8
STANDARD 10: ILLICIT DISCHARGES
An Illicit Discharge Statement is attached and can be found it the Table of Contents. The Long Term Pollution Prevention Plan can be found in Attachment D.
HYDROLOGY AND HYDRAULICS:
Hydraulics: The on-site drainage systems were designed by means of the Rational Method. The drainage system was designed based on a 25-year recurrence interval. The Rational Method is based on the following formula: Q=CiA Where: Q = Peak Rate of Runoff in Cubic Feet per Second C = Coefficient of Runoff i = Rainfall Intensity in Inches per Hour (A value 7.0 inches per hour was used per TP-40) A = Drainage Area in Acres
The values that have been used in the Rational Method formula to calculate the peak rate of runoff for this project are as follows: C= Runoff Coefficients:
For our analysis, we used the following runoff coefficients: C = 0.90 for paved areas and C = 0.40 for grass, woods, and landscaping areas.
Tc = Time of Concentration
Page 9
Considering the fact that almost the whole site is paved, a Time of Concentration of 5 minutes has been used to determine rainfall intensity. This will give conservative estimates for peak runoff.
A = Drainage Area
Drainage divide lines were determined by using Site Topographic Maps and the proposed grading plan prepared by this office. Existing watershed boundaries were verified by existing topographic information and by field inspection.
Storm drains were designed using the Manning formula. Q = 1.49R2/3 A S1/2 n Where Q = Capacity of Pipe flowing full in cubic feet per second. R = Hydraulic radius n = Manning’s Resistance Coefficient (For our computation, we used n = .011 for HDPE) A = Cross sectional area of the pipe in square feet S = Slope of the pipe in feet per feet
The entire Rational Method and Manning’s Calculation is included in Attachment D.
CONCLUSION
An extensive stormwater management system has been designed for the project. The stormwater management system has been designed to comply with current (DEP) standards and will incorporate a number of Best

Page 10
Management Practices (“BMP’s”) that will ensure that the runoff will be treated prior to leaving the site. The construction of the stormwater management system will ensure that stormwater runoff from this site will be of high quality and that there will be no adverse impacts on surrounding properties or resource areas.

swcheck.doc • 04/01/08 Stormwater Report Checklist • Page 1 of 8
Massachusetts Department of Environmental ProtectionBureau of Resource Protection - Wetlands Program
Checklist for Stormwater ReportA. Introduction
Important: When filling out forms on the computer, use only the tab key to move your cursor - do not use the return key.
A Stormwater Report must be submitted with the Notice of Intent permit application to document compliance with the Stormwater Management Standards. The following checklist is NOT a substitute for the Stormwater Report (which should provide more substantive and detailed information) but is offered here as a tool to help the applicant organize their Stormwater Management documentation for their Report and for the reviewer to assess this information in a consistent format. As noted in the Checklist, the Stormwater Report must contain the engineering computations and supporting information set forth in Volume 3 of the Massachusetts Stormwater Handbook. The Stormwater Report must be prepared and certified by a Registered Professional Engineer (RPE) licensed in the Commonwealth.
The Stormwater Report must include: � The Stormwater Checklist completed and stamped by a Registered Professional Engineer (see
page 2) that certifies that the Stormwater Report contains all required submittals.1 This Checklist is to be used as the cover for the completed Stormwater Report.
� Applicant/Project Name � Project Address � Name of Firm and Registered Professional Engineer that prepared the Report � Long-Term Pollution Prevention Plan required by Standards 4-6 � Construction Period Pollution Prevention and Erosion and Sedimentation Control Plan required
by Standard 82
� Operation and Maintenance Plan required by Standard 9
In addition to all plans and supporting information, the Stormwater Report must include a brief narrative describing stormwater management practices, including environmentally sensitive site design and LID techniques, along with a diagram depicting runoff through the proposed BMP treatment train. Plans are required to show existing and proposed conditions, identify all wetland resource areas, NRCS soil types, critical areas, Land Uses with Higher Potential Pollutant Loads (LUHPPL), and any areas on the site where infiltration rate is greater than 2.4 inches per hour. The Plans shall identify the drainage areas for both existing and proposed conditions at a scale that enables verification of supporting calculations.
As noted in the Checklist, the Stormwater Management Report shall document compliance with each of the Stormwater Management Standards as provided in the Massachusetts Stormwater Handbook. The soils evaluation and calculations shall be done using the methodologies set forth in Volume 3 of the Massachusetts Stormwater Handbook.
To ensure that the Stormwater Report is complete, applicants are required to fill in the Stormwater Report Checklist by checking the box to indicate that the specified information has been included in the Stormwater Report. If any of the information specified in the checklist has not been submitted, the applicant must provide an explanation. The completed Stormwater Report Checklist and Certification must be submitted with the Stormwater Report.
1 The Stormwater Report may also include the Illicit Discharge Compliance Statement required by Standard 10. If not included inthe Stormwater Report, the Illicit Discharge Compliance Statement must be submitted prior to the discharge of stormwater runoff to the post-construction best management practices.
2 For some complex projects, it may not be possible to include the Construction Period Erosion and Sedimentation Control Plan inthe Stormwater Report. In that event, the issuing authority has the discretion to issue an Order of Conditions that approves theproject and includes a condition requiring the proponent to submit the Construction Period Erosion and Sedimentation Control Planbefore commencing any land disturbance activity on the site.

swcheck.doc • 04/01/08 Stormwater Report Checklist • Page 2 of 8
Massachusetts Department of Environmental ProtectionBureau of Resource Protection - Wetlands Program
Checklist for Stormwater ReportB. Stormwater Checklist and Certification The following checklist is intended to serve as a guide for applicants as to the elements that ordinarily need to be addressed in a complete Stormwater Report. The checklist is also intended to provide conservation commissions and other reviewing authorities with a summary of the components necessary for a comprehensive Stormwater Report that addresses the ten Stormwater Standards.
Note: Because stormwater requirements vary from project to project, it is possible that a complete Stormwater Report may not include information on some of the subjects specified in the Checklist. If it is determined that a specific item does not apply to the project under review, please note that the item is not applicable (N.A.) and provide the reasons for that determination.
A complete checklist must include the Certification set forth below signed by the Registered Professional Engineer who prepared the Stormwater Report.
Registered Professional Engineer’s Certification I have reviewed the Stormwater Report, including the soil evaluation, computations, Long-term Pollution Prevention Plan, the Construction Period Erosion and Sedimentation Control Plan (if included), the Long-term Post-Construction Operation and Maintenance Plan, the Illicit Discharge Compliance Statement (if included) and the plans showing the stormwater management system, and have determined that they have been prepared in accordance with the requirements of the Stormwater Management Standards as further elaborated by the Massachusetts Stormwater Handbook. I have also determined that the information presented in the Stormwater Checklist is accurate and that the information presented in the Stormwater Report accurately reflects conditions at the site as of the date of this permit application.
Registered Professional Engineer Block and Signature
Signature and Date
ChecklistProject Type: Is the application for new development, redevelopment, or a mix of new and redevelopment?
New development
Redevelopment
Mix of New Development and Redevelopment
DAVIDNOELKELLYCIVIL
David Noel Kelly 2015.09.29 16:56:00 -04'00'

swcheck.doc • 04/01/08 Stormwater Report Checklist • Page 3 of 8
Massachusetts Department of Environmental ProtectionBureau of Resource Protection - Wetlands Program
Checklist for Stormwater ReportChecklist (continued)
LID Measures: Stormwater Standards require LID measures to be considered. Document what environmentally sensitive design and LID Techniques were considered during the planning and design of the project:
No disturbance to any Wetland Resource Areas
Site Design Practices (e.g. clustered development, reduced frontage setbacks)
Reduced Impervious Area (Redevelopment Only)
Minimizing disturbance to existing trees and shrubs
LID Site Design Credit Requested:
Credit 1
Credit 2
Credit 3
Use of “country drainage” versus curb and gutter conveyance and pipe
Bioretention Cells (includes Rain Gardens)
Constructed Stormwater Wetlands (includes Gravel Wetlands designs)
Treebox Filter
Water Quality Swale
Grass Channel
Green Roof
Other (describe):
Standard 1: No New Untreated Discharges
No new untreated discharges
Outlets have been designed so there is no erosion or scour to wetlands and waters of the Commonwealth
Supporting calculations specified in Volume 3 of the Massachusetts Stormwater Handbook included.

swcheck.doc • 04/01/08 Stormwater Report Checklist • Page 4 of 8
Massachusetts Department of Environmental ProtectionBureau of Resource Protection - Wetlands Program
Checklist for Stormwater ReportChecklist (continued)
Standard 2: Peak Rate Attenuation
Standard 2 waiver requested because the project is located in land subject to coastal storm flowage and stormwater discharge is to a wetland subject to coastal flooding.
Evaluation provided to determine whether off-site flooding increases during the 100-year 24-hour storm.
Calculations provided to show that post-development peak discharge rates do not exceed pre-development rates for the 2-year and 10-year 24-hour storms. If evaluation shows that off-site flooding increases during the 100-year 24-hour storm, calculations are also provided to show that post-development peak discharge rates do not exceed pre-development rates for the 100-year 24-hour storm.
Standard 3: Recharge
Soil Analysis provided.
Required Recharge Volume calculation provided.
Required Recharge volume reduced through use of the LID site Design Credits.
Sizing the infiltration, BMPs is based on the following method: Check the method used.
Static Simple Dynamic Dynamic Field1
Runoff from all impervious areas at the site discharging to the infiltration BMP.
Runoff from all impervious areas at the site is not discharging to the infiltration BMP and calculations are provided showing that the drainage area contributing runoff to the infiltration BMPs is sufficient to generate the required recharge volume.
Recharge BMPs have been sized to infiltrate the Required Recharge Volume.
Recharge BMPs have been sized to infiltrate the Required Recharge Volume only to the maximum extent practicable for the following reason:
Site is comprised solely of C and D soils and/or bedrock at the land surface
M.G.L. c. 21E sites pursuant to 310 CMR 40.0000
Solid Waste Landfill pursuant to 310 CMR 19.000
Project is otherwise subject to Stormwater Management Standards only to the maximum extent practicable.
Calculations showing that the infiltration BMPs will drain in 72 hours are provided.
Property includes a M.G.L. c. 21E site or a solid waste landfill and a mounding analysis is included.
1 80% TSS removal is required prior to discharge to infiltration BMP if Dynamic Field method is used.
swcheck.doc • 04/01/08 Stormwater Report Checklist • Page 5 of 8
Massachusetts Department of Environmental ProtectionBureau of Resource Protection - Wetlands Program
Checklist for Stormwater ReportChecklist (continued)
Standard 3: Recharge (continued)
The infiltration BMP is used to attenuate peak flows during storms greater than or equal to the 10-year 24-hour storm and separation to seasonal high groundwater is less than 4 feet and a mounding analysis is provided.
Documentation is provided showing that infiltration BMPs do not adversely impact nearby wetland resource areas.
Standard 4: Water Quality
The Long-Term Pollution Prevention Plan typically includes the following: � Good housekeeping practices; � Provisions for storing materials and waste products inside or under cover; � Vehicle washing controls; � Requirements for routine inspections and maintenance of stormwater BMPs; � Spill prevention and response plans; � Provisions for maintenance of lawns, gardens, and other landscaped areas; � Requirements for storage and use of fertilizers, herbicides, and pesticides; � Pet waste management provisions; � Provisions for operation and management of septic systems; � Provisions for solid waste management; � Snow disposal and plowing plans relative to Wetland Resource Areas; � Winter Road Salt and/or Sand Use and Storage restrictions; � Street sweeping schedules; � Provisions for prevention of illicit discharges to the stormwater management system; � Documentation that Stormwater BMPs are designed to provide for shutdown and containment in the
event of a spill or discharges to or near critical areas or from LUHPPL; � Training for staff or personnel involved with implementing Long-Term Pollution Prevention Plan; � List of Emergency contacts for implementing Long-Term Pollution Prevention Plan.
A Long-Term Pollution Prevention Plan is attached to Stormwater Report and is included as an attachment to the Wetlands Notice of Intent.
Treatment BMPs subject to the 44% TSS removal pretreatment requirement and the one inch rule for calculating the water quality volume are included, and discharge:
is within the Zone II or Interim Wellhead Protection Area
is near or to other critical areas
is within soils with a rapid infiltration rate (greater than 2.4 inches per hour)
involves runoff from land uses with higher potential pollutant loads.
The Required Water Quality Volume is reduced through use of the LID site Design Credits.
Calculations documenting that the treatment train meets the 80% TSS removal requirement and, if applicable, the 44% TSS removal pretreatment requirement, are provided.
swcheck.doc • 04/01/08 Stormwater Report Checklist • Page 6 of 8
Massachusetts Department of Environmental ProtectionBureau of Resource Protection - Wetlands Program
Checklist for Stormwater ReportChecklist (continued)
Standard 4: Water Quality (continued)
The BMP is sized (and calculations provided) based on:
The ½” or 1” Water Quality Volume or
The equivalent flow rate associated with the Water Quality Volume and documentation is provided showing that the BMP treats the required water quality volume.
The applicant proposes to use proprietary BMPs, and documentation supporting use of proprietary BMP and proposed TSS removal rate is provided. This documentation may be in the form of the propriety BMP checklist found in Volume 2, Chapter 4 of the Massachusetts Stormwater Handbook and submitting copies of the TARP Report, STEP Report, and/or other third party studies verifying performance of the proprietary BMPs.
A TMDL exists that indicates a need to reduce pollutants other than TSS and documentation showing that the BMPs selected are consistent with the TMDL is provided.
Standard 5: Land Uses With Higher Potential Pollutant Loads (LUHPPLs)
The NPDES Multi-Sector General Permit covers the land use and the Stormwater Pollution Prevention Plan (SWPPP) has been included with the Stormwater Report.
The NPDES Multi-Sector General Permit covers the land use and the SWPPP will be submitted priorto the discharge of stormwater to the post-construction stormwater BMPs.
The NPDES Multi-Sector General Permit does not cover the land use.
LUHPPLs are located at the site and industry specific source control and pollution prevention measures have been proposed to reduce or eliminate the exposure of LUHPPLs to rain, snow, snow melt and runoff, and been included in the long term Pollution Prevention Plan.
All exposure has been eliminated.
All exposure has not been eliminated and all BMPs selected are on MassDEP LUHPPL list.
The LUHPPL has the potential to generate runoff with moderate to higher concentrations of oil and grease (e.g. all parking lots with >1000 vehicle trips per day) and the treatment train includes an oil grit separator, a filtering bioretention area, a sand filter or equivalent.
Standard 6: Critical Areas
The discharge is near or to a critical area and the treatment train includes only BMPs that MassDEP has approved for stormwater discharges to or near that particular class of critical area.
Critical areas and BMPs are identified in the Stormwater Report.
swcheck.doc • 04/01/08 Stormwater Report Checklist • Page 7 of 8
Massachusetts Department of Environmental ProtectionBureau of Resource Protection - Wetlands Program
Checklist for Stormwater ReportChecklist (continued)
Standard 7: Redevelopments and Other Projects Subject to the Standards only to the maximum extent practicable
The project is subject to the Stormwater Management Standards only to the maximum Extent Practicable as a:
Limited Project
Small Residential Projects: 5-9 single family houses or 5-9 units in a multi-family development provided there is no discharge that may potentially affect a critical area.
Small Residential Projects: 2-4 single family houses or 2-4 units in a multi-family development with a discharge to a critical area
Marina and/or boatyard provided the hull painting, service and maintenance areas are protected from exposure to rain, snow, snow melt and runoff
Bike Path and/or Foot Path
Redevelopment Project
Redevelopment portion of mix of new and redevelopment.
Certain standards are not fully met (Standard No. 1, 8, 9, and 10 must always be fully met) and an explanation of why these standards are not met is contained in the Stormwater Report.
The project involves redevelopment and a description of all measures that have been taken to improve existing conditions is provided in the Stormwater Report. The redevelopment checklist found in Volume 2 Chapter 3 of the Massachusetts Stormwater Handbook may be used to document that the proposed stormwater management system (a) complies with Standards 2, 3 and the pretreatment and structural BMP requirements of Standards 4-6 to the maximum extent practicable and (b) improves existing conditions.
Standard 8: Construction Period Pollution Prevention and Erosion and Sedimentation Control
A Construction Period Pollution Prevention and Erosion and Sedimentation Control Plan must include the following information:
� Narrative; � Construction Period Operation and Maintenance Plan; � Names of Persons or Entity Responsible for Plan Compliance; � Construction Period Pollution Prevention Measures; � Erosion and Sedimentation Control Plan Drawings; � Detail drawings and specifications for erosion control BMPs, including sizing calculations; � Vegetation Planning; � Site Development Plan; � Construction Sequencing Plan; � Sequencing of Erosion and Sedimentation Controls; � Operation and Maintenance of Erosion and Sedimentation Controls; � Inspection Schedule; � Maintenance Schedule; � Inspection and Maintenance Log Form.
A Construction Period Pollution Prevention and Erosion and Sedimentation Control Plan containing the information set forth above has been included in the Stormwater Report.
swcheck.doc • 04/01/08 Stormwater Report Checklist • Page 8 of 8
Massachusetts Department of Environmental ProtectionBureau of Resource Protection - Wetlands Program
Checklist for Stormwater ReportChecklist (continued)
Standard 8: Construction Period Pollution Prevention and Erosion and Sedimentation Control(continued)
The project is highly complex and information is included in the Stormwater Report that explains why it is not possible to submit the Construction Period Pollution Prevention and Erosion and Sedimentation Control Plan with the application. A Construction Period Pollution Prevention and Erosion and Sedimentation Control has not been included in the Stormwater Report but will be submitted before land disturbance begins.
The project is not covered by a NPDES Construction General Permit.
The project is covered by a NPDES Construction General Permit and a copy of the SWPPP is in the Stormwater Report.
The project is covered by a NPDES Construction General Permit but no SWPPP been submitted. The SWPPP will be submitted BEFORE land disturbance begins.
Standard 9: Operation and Maintenance Plan
The Post Construction Operation and Maintenance Plan is included in the Stormwater Report and includes the following information:
Name of the stormwater management system owners;
Party responsible for operation and maintenance;
Schedule for implementation of routine and non-routine maintenance tasks;
Plan showing the location of all stormwater BMPs maintenance access areas;
Description and delineation of public safety features;
Estimated operation and maintenance budget; and
Operation and Maintenance Log Form.
The responsible party is not the owner of the parcel where the BMP is located and the Stormwater Report includes the following submissions:
A copy of the legal instrument (deed, homeowner’s association, utility trust or other legal entity) that establishes the terms of and legal responsibility for the operation and maintenance of the project site stormwater BMPs;
A plan and easement deed that allows site access for the legal entity to operate and maintain BMP functions.
Standard 10: Prohibition of Illicit Discharges
The Long-Term Pollution Prevention Plan includes measures to prevent illicit discharges;
An Illicit Discharge Compliance Statement is attached;
NO Illicit Discharge Compliance Statement is attached but will be submitted prior to the discharge of any stormwater to post-construction BMPs.
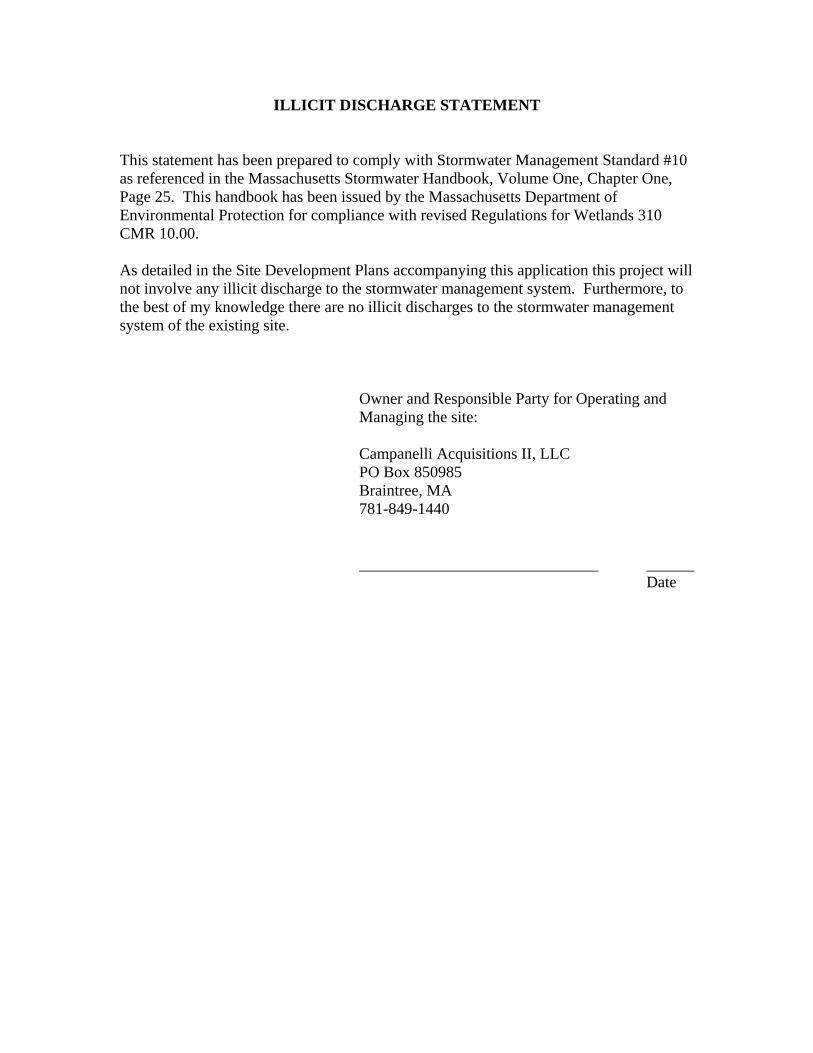
ILLICIT DISCHARGE STATEMENT This statement has been prepared to comply with Stormwater Management Standard #10 as referenced in the Massachusetts Stormwater Handbook, Volume One, Chapter One, Page 25. This handbook has been issued by the Massachusetts Department of Environmental Protection for compliance with revised Regulations for Wetlands 310 CMR 10.00. As detailed in the Site Development Plans accompanying this application this project will not involve any illicit discharge to the stormwater management system. Furthermore, to the best of my knowledge there are no illicit discharges to the stormwater management system of the existing site.
Owner and Responsible Party for Operating and Managing the site:
Campanelli Acquisitions II, LLC PO Box 850985 Braintree, MA 781-849-1440 Date


KELLY ENGINEERING GROUP, INC. Zero Campanelli Drive-Braintree-MA 02184 Phone 781 843 4333
Attachment A
Existing Conditions

EXISTINGDRAINAGE
EXHIBITASHLAND
ASHLAND, MA
CAMPANELLI COMPANIES
A-1

Runoff Curve Number and Runoff
Name: Campanelli Ashland By: GH Date: 09/23/15Location : MBTA Road, Ashland MADescription: Existing Conditions - To High St. Culvert
Circle One: Pre or Post
Runoff Curve Number (CN): Surface Description Soil Name; hydrologic group; hydrologic condition CN s.f. Product of
CN x Area
Woods Hydrologic Group A; Good Condition 30 0 0Woods Hydrologic Group D; Good Condition 77 505460 3.9E+07Grass Hydrologic Group A; Good Condition 39 0 0Grass Hydrologic Group D; Good Condition 80 0 0Roof 98 0 0Paved 98 0 0
Totals = 505460.00 3.9E+07Acres = 11.6037649
CN or C (weighted) = total product/total area = 77.0
Reference: Urban Hydrology for Small WatershedsTechnical Release 55, Soil Conservation ServiceU.S. Department of Agriculture, June 1986
A-2

Runoff Curve Number and Runoff
Name: Campanelli Ashland By: GH Date: 09/23/15Location : MBTA Road, Ashland MADescription: Existing Conditions - To High St. Drainage System
Circle One: Pre or Post
Runoff Curve Number (CN): Surface Description Soil Name; hydrologic group; hydrologic condition CN s.f. Product of
CN x Area
Woods Hydrologic Group A; Good Condition 30 0 0Woods Hydrologic Group D; Good Condition 77 363607 2.8E+07Grass Hydrologic Group A; Good Condition 39 0 0Grass Hydrologic Group D; Good Condition 80 0 0Roof 98 0 0Paved 98 0 0
Totals = 363607.00 2.8E+07Acres = 8.34726814
CN or C (weighted) = total product/total area = 77.0
Reference: Urban Hydrology for Small WatershedsTechnical Release 55, Soil Conservation ServiceU.S. Department of Agriculture, June 1986
A-3

Runoff Curve Number and Runoff
Name: Campanelli Ashland By: GH Date: 09/23/15Location : MBTA Road, Ashland MADescription: Existing Conditions - To MBTA Rd. CB-1
Circle One: Pre or Post
Runoff Curve Number (CN): Surface Description Soil Name; hydrologic group; hydrologic condition CN s.f. Product of
CN x Area
Woods Hydrologic Group A; Good Condition 30 64665 1939950Woods Hydrologic Group D; Good Condition 77 478404 3.7E+07Grass Hydrologic Group A; Good Condition 39 0 0Grass Hydrologic Group D; Good Condition 80 0 0Roof 98 0 0Paved 98 0 0
Totals = 543069.00 3.9E+07Acres = 12.4671488
CN or C (weighted) = total product/total area = 71.4
Reference: Urban Hydrology for Small WatershedsTechnical Release 55, Soil Conservation ServiceU.S. Department of Agriculture, June 1986
A-4

Runoff Curve Number and Runoff
Name: Campanelli Ashland By: GH Date: 09/23/15Location : MBTA Road, Ashland MADescription: Existing Conditions - To MBTA Rd. Culvert
Circle One: Pre or Post
Runoff Curve Number (CN): Surface Description Soil Name; hydrologic group; hydrologic condition CN s.f. Product of
CN x Area
Woods Hydrologic Group A; Good Condition 30 312403 9372090Woods Hydrologic Group D; Good Condition 77 416587 3.2E+07Grass Hydrologic Group A; Good Condition 39 0 0Grass Hydrologic Group D; Good Condition 80 0 0Roof 98 0 0Paved 98 0 0
Totals = 728990.00 4.1E+07Acres = 16.7353076
CN or C (weighted) = total product/total area = 56.9
Reference: Urban Hydrology for Small WatershedsTechnical Release 55, Soil Conservation ServiceU.S. Department of Agriculture, June 1986
A-5

Runoff Curve Number and Runoff
Name: Campanelli Ashland By: GH Date: 09/23/15Location : MBTA Road, Ashland MADescription: Existing Conditions - To MBTA Rd. CB-2
Circle One: Pre or Post
Runoff Curve Number (CN): Surface Description Soil Name; hydrologic group; hydrologic condition CN s.f. Product of
CN x Area
Woods Hydrologic Group A; Good Condition 30 97996 2939880Woods Hydrologic Group D; Good Condition 77 77788 5989676Grass Hydrologic Group A; Good Condition 39 0 0Grass Hydrologic Group D; Good Condition 80 0 0Roof 98 0 0Paved 98 0 0
Totals = 175784.00 8929556Acres = 4.03544536
CN or C (weighted) = total product/total area = 50.8
Reference: Urban Hydrology for Small WatershedsTechnical Release 55, Soil Conservation ServiceU.S. Department of Agriculture, June 1986
A-6

Runoff Curve Number and Runoff
Name: Campanelli Ashland By: GH Date: 09/23/15Location : MBTA Road, Ashland MADescription: Existing Conditions - To MBTA Rd. CB-3
Circle One: Pre or Post
Runoff Curve Number (CN): Surface Description Soil Name; hydrologic group; hydrologic condition CN s.f. Product of
CN x Area
Woods Hydrologic Group A; Good Condition 30 138868 4166040Woods Hydrologic Group D; Good Condition 77 173901 1.3E+07Grass Hydrologic Group A; Good Condition 39 0 0Grass Hydrologic Group D; Good Condition 80 0 0Roof 98 0 0Paved 98 0 0
Totals = 312769.00 1.8E+07Acres = 7.18018825
CN or C (weighted) = total product/total area = 56.1
Reference: Urban Hydrology for Small WatershedsTechnical Release 55, Soil Conservation ServiceU.S. Department of Agriculture, June 1986
A-7
Runoff Curve Number and Runoff
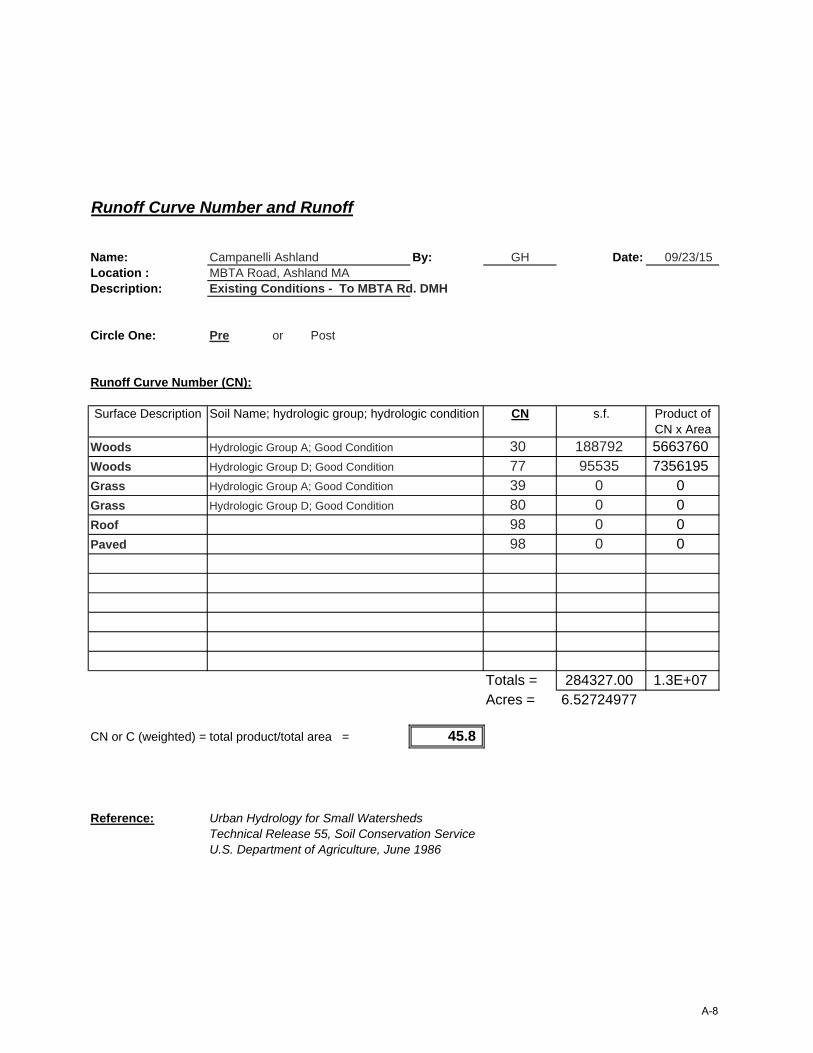
Name: Campanelli Ashland By: GH Date: 09/23/15Location : MBTA Road, Ashland MADescription: Existing Conditions - To MBTA Rd. DMH
Circle One: Pre or Post
Runoff Curve Number (CN): Surface Description Soil Name; hydrologic group; hydrologic condition CN s.f. Product of
CN x Area
Woods Hydrologic Group A; Good Condition 30 188792 5663760Woods Hydrologic Group D; Good Condition 77 95535 7356195Grass Hydrologic Group A; Good Condition 39 0 0Grass Hydrologic Group D; Good Condition 80 0 0Roof 98 0 0Paved 98 0 0
Totals = 284327.00 1.3E+07Acres = 6.52724977
CN or C (weighted) = total product/total area = 45.8
Reference: Urban Hydrology for Small WatershedsTechnical Release 55, Soil Conservation ServiceU.S. Department of Agriculture, June 1986
A-8

1 2 3 4 5 6 7
8
9
10
Watershed Model SchematicHydraflow Hydrographs Extension for AutoCAD® Civil 3D® 2013 by Autodesk, Inc. v10
Project: Pre-Existing Conditions.gpw Wednesday, 09 / 23 / 2015
Hyd. Origin Description
Legend
1 SCS Runoff TO HIGH ST. CULVERT
2 SCS Runoff HIGH ST. DRAINAGE SYSTEM
3 SCS Runoff MBTA RD. CB-1
4 SCS Runoff MBTA RD. CULVERT
5 SCS Runoff MBTA RD. CB-2
6 SCS Runoff MBTA RD. CB-3
7 SCS Runoff MBTA RD. DMH
8 Combine TO SUDBURY RIVER
9 Combine TO NORTHERLY WETLANDS
10 Combine TO EASTERLY WETLANDS
A-9
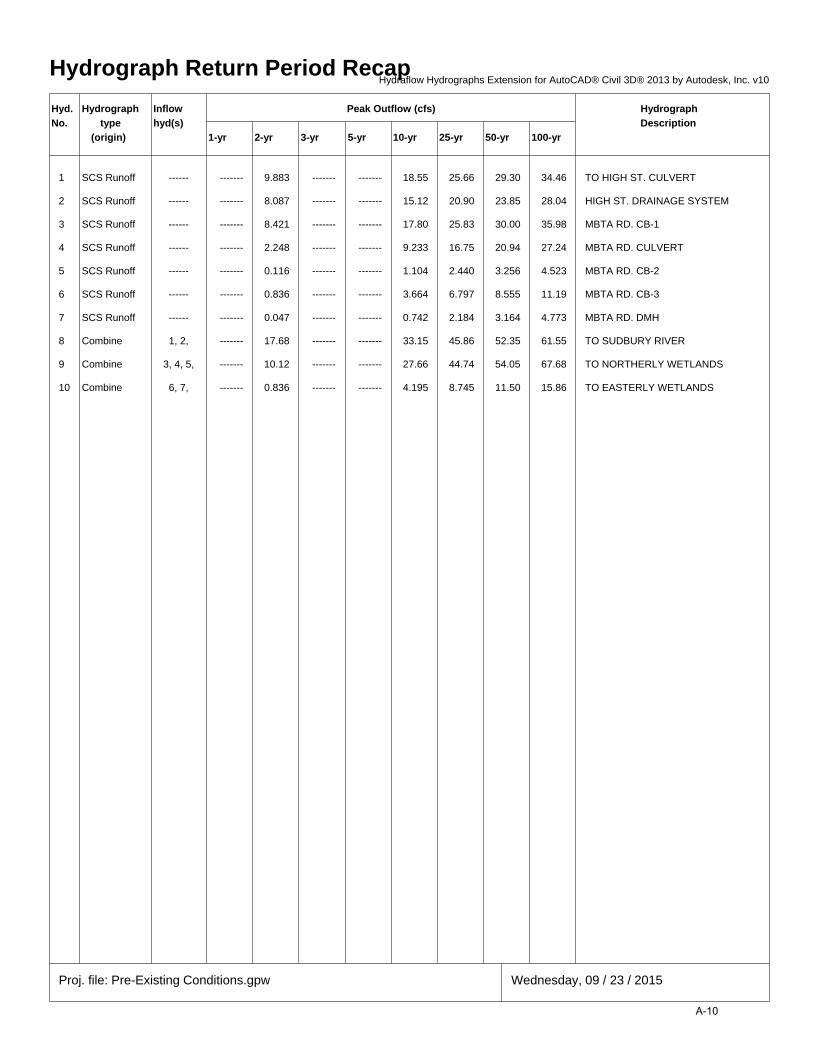
Hydrograph Return Period Recap
Hyd. Hydrograph Inflow Peak Outflow (cfs) Hydrograph
No. type hyd(s) Description
(origin) 1-yr 2-yr 3-yr 5-yr 10-yr 25-yr 50-yr 100-yr
1 SCS Runoff ------ ------- 9.883 ------- ------- 18.55 25.66 29.30 34.46 TO HIGH ST. CULVERT
2 SCS Runoff ------ ------- 8.087 ------- ------- 15.12 20.90 23.85 28.04 HIGH ST. DRAINAGE SYSTEM
3 SCS Runoff ------ ------- 8.421 ------- ------- 17.80 25.83 30.00 35.98 MBTA RD. CB-1
4 SCS Runoff ------ ------- 2.248 ------- ------- 9.233 16.75 20.94 27.24 MBTA RD. CULVERT
5 SCS Runoff ------ ------- 0.116 ------- ------- 1.104 2.440 3.256 4.523 MBTA RD. CB-2
6 SCS Runoff ------ ------- 0.836 ------- ------- 3.664 6.797 8.555 11.19 MBTA RD. CB-3
7 SCS Runoff ------ ------- 0.047 ------- ------- 0.742 2.184 3.164 4.773 MBTA RD. DMH
8 Combine 1, 2, ------- 17.68 ------- ------- 33.15 45.86 52.35 61.55 TO SUDBURY RIVER
9 Combine 3, 4, 5, ------- 10.12 ------- ------- 27.66 44.74 54.05 67.68 TO NORTHERLY WETLANDS
10 Combine 6, 7, ------- 0.836 ------- ------- 4.195 8.745 11.50 15.86 TO EASTERLY WETLANDS
Proj. file: Pre-Existing Conditions.gpw Wednesday, 09 / 23 / 2015
Hydraflow Hydrographs Extension for AutoCAD® Civil 3D® 2013 by Autodesk, Inc. v10
A-10

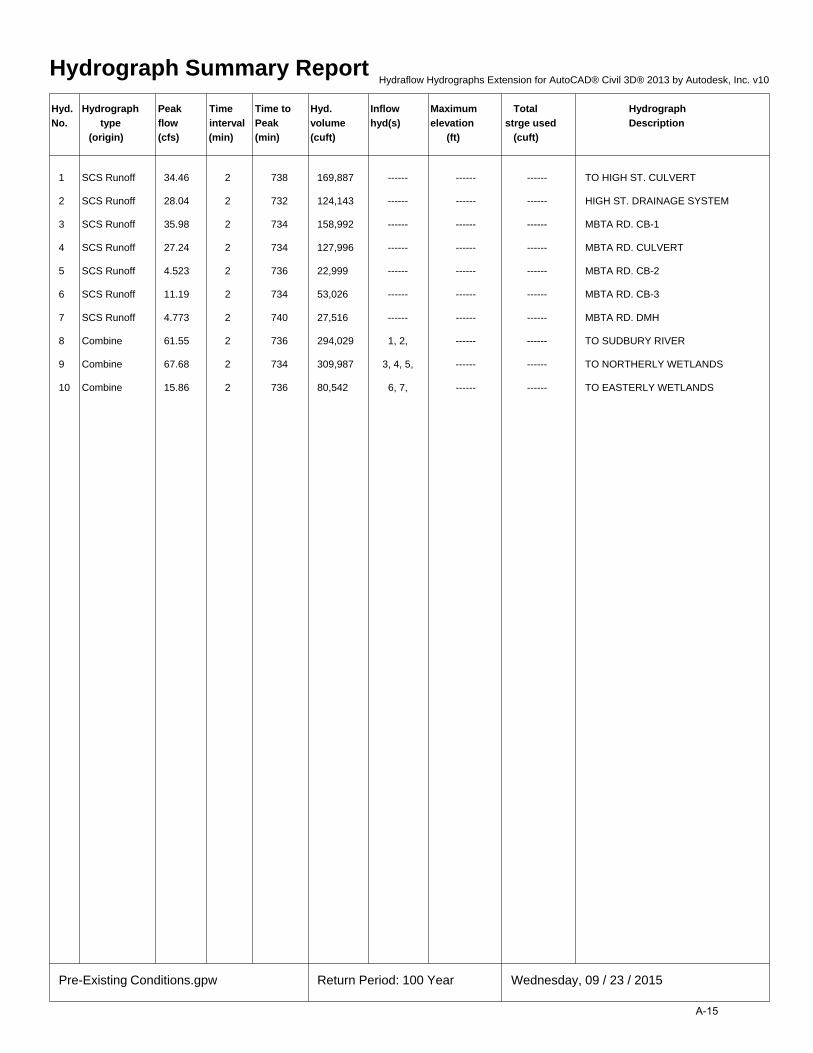
Hydrograph Summary Report
Hyd. Hydrograph Peak Time Time to Hyd. Inflow Maximum Total Hydrograph
No. type flow interval Peak volume hyd(s) elevation strge used Description
(origin) (cfs) (min) (min) (cuft) (ft) (cuft)
1 SCS Runoff 9.883 2 738 50,247 ------ ------ ------ TO HIGH ST. CULVERT
2 SCS Runoff 8.087 2 734 36,717 ------ ------ ------ HIGH ST. DRAINAGE SYSTEM
3 SCS Runoff 8.421 2 736 40,663 ------ ------ ------ MBTA RD. CB-1
4 SCS Runoff 2.248 2 746 18,620 ------ ------ ------ MBTA RD. CULVERT
5 SCS Runoff 0.116 2 758 2,134 ------ ------ ------ MBTA RD. CB-2
6 SCS Runoff 0.836 2 748 7,360 ------ ------ ------ MBTA RD. CB-3
7 SCS Runoff 0.047 2 916 1,298 ------ ------ ------ MBTA RD. DMH
8 Combine 17.68 2 736 86,964 1, 2, ------ ------ TO SUDBURY RIVER
9 Combine 10.12 2 738 61,417 3, 4, 5, ------ ------ TO NORTHERLY WETLANDS
10 Combine 0.836 2 748 8,659 6, 7, ------ ------ TO EASTERLY WETLANDS
Pre-Existing Conditions.gpw Return Period: 2 Year Wednesday, 09 / 23 / 2015
Hydraflow Hydrographs Extension for AutoCAD® Civil 3D® 2013 by Autodesk, Inc. v10
A-11

Hydrograph Summary Report
Hyd. Hydrograph Peak Time Time to Hyd. Inflow Maximum Total Hydrograph
No. type flow interval Peak volume hyd(s) elevation strge used Description
(origin) (cfs) (min) (min) (cuft) (ft) (cuft)
1 SCS Runoff 18.55 2 738 91,662 ------ ------ ------ TO HIGH ST. CULVERT
2 SCS Runoff 15.12 2 734 66,981 ------ ------ ------ HIGH ST. DRAINAGE SYSTEM
3 SCS Runoff 17.80 2 734 80,365 ------ ------ ------ MBTA RD. CB-1
4 SCS Runoff 9.233 2 738 51,260 ------ ------ ------ MBTA RD. CULVERT
5 SCS Runoff 1.104 2 744 7,855 ------ ------ ------ MBTA RD. CB-2
6 SCS Runoff 3.664 2 738 20,864 ------ ------ ------ MBTA RD. CB-3
7 SCS Runoff 0.742 2 750 7,715 ------ ------ ------ MBTA RD. DMH
8 Combine 33.15 2 736 158,642 1, 2, ------ ------ TO SUDBURY RIVER
9 Combine 27.66 2 736 139,479 3, 4, 5, ------ ------ TO NORTHERLY WETLANDS
10 Combine 4.195 2 742 28,579 6, 7, ------ ------ TO EASTERLY WETLANDS
Pre-Existing Conditions.gpw Return Period: 10 Year Wednesday, 09 / 23 / 2015
Hydraflow Hydrographs Extension for AutoCAD® Civil 3D® 2013 by Autodesk, Inc. v10
A-12

Hydrograph Summary Report
Hyd. Hydrograph Peak Time Time to Hyd. Inflow Maximum Total Hydrograph
No. type flow interval Peak volume hyd(s) elevation strge used Description
(origin) (cfs) (min) (min) (cuft) (ft) (cuft)
1 SCS Runoff 25.66 2 738 126,320 ------ ------ ------ TO HIGH ST. CULVERT
2 SCS Runoff 20.90 2 734 92,307 ------ ------ ------ HIGH ST. DRAINAGE SYSTEM
3 SCS Runoff 25.83 2 734 114,793 ------ ------ ------ MBTA RD. CB-1
4 SCS Runoff 16.75 2 736 83,455 ------ ------ ------ MBTA RD. CULVERT
5 SCS Runoff 2.440 2 740 14,035 ------ ------ ------ MBTA RD. CB-2
6 SCS Runoff 6.797 2 736 34,315 ------ ------ ------ MBTA RD. CB-3
7 SCS Runoff 2.184 2 744 15,538 ------ ------ ------ MBTA RD. DMH
8 Combine 45.86 2 736 218,627 1, 2, ------ ------ TO SUDBURY RIVER
9 Combine 44.74 2 734 212,283 3, 4, 5, ------ ------ TO NORTHERLY WETLANDS
10 Combine 8.745 2 738 49,853 6, 7, ------ ------ TO EASTERLY WETLANDS
Pre-Existing Conditions.gpw Return Period: 25 Year Wednesday, 09 / 23 / 2015
Hydraflow Hydrographs Extension for AutoCAD® Civil 3D® 2013 by Autodesk, Inc. v10
A-13

Hydrograph Summary Report
Hyd. Hydrograph Peak Time Time to Hyd. Inflow Maximum Total Hydrograph
No. type flow interval Peak volume hyd(s) elevation strge used Description
(origin) (cfs) (min) (min) (cuft) (ft) (cuft)
1 SCS Runoff 29.30 2 738 144,257 ------ ------ ------ TO HIGH ST. CULVERT
2 SCS Runoff 23.85 2 734 105,414 ------ ------ ------ HIGH ST. DRAINAGE SYSTEM
3 SCS Runoff 30.00 2 734 132,889 ------ ------ ------ MBTA RD. CB-1
4 SCS Runoff 20.94 2 736 101,328 ------ ------ ------ MBTA RD. CULVERT
5 SCS Runoff 3.256 2 738 17,587 ------ ------ ------ MBTA RD. CB-2
6 SCS Runoff 8.555 2 736 41,813 ------ ------ ------ MBTA RD. CB-3
7 SCS Runoff 3.164 2 742 20,217 ------ ------ ------ MBTA RD. DMH
8 Combine 52.35 2 736 249,672 1, 2, ------ ------ TO SUDBURY RIVER
9 Combine 54.05 2 734 251,804 3, 4, 5, ------ ------ TO NORTHERLY WETLANDS
10 Combine 11.50 2 736 62,030 6, 7, ------ ------ TO EASTERLY WETLANDS
Pre-Existing Conditions.gpw Return Period: 50 Year Wednesday, 09 / 23 / 2015
Hydraflow Hydrographs Extension for AutoCAD® Civil 3D® 2013 by Autodesk, Inc. v10
A-14
Hydrograph Summary Report
Hyd. Hydrograph Peak Time Time to Hyd. Inflow Maximum Total Hydrograph
No. type flow interval Peak volume hyd(s) elevation strge used Description
(origin) (cfs) (min) (min) (cuft) (ft) (cuft)
1 SCS Runoff 34.46 2 738 169,887 ------ ------ ------ TO HIGH ST. CULVERT
2 SCS Runoff 28.04 2 732 124,143 ------ ------ ------ HIGH ST. DRAINAGE SYSTEM
3 SCS Runoff 35.98 2 734 158,992 ------ ------ ------ MBTA RD. CB-1
4 SCS Runoff 27.24 2 734 127,996 ------ ------ ------ MBTA RD. CULVERT
5 SCS Runoff 4.523 2 736 22,999 ------ ------ ------ MBTA RD. CB-2
6 SCS Runoff 11.19 2 734 53,026 ------ ------ ------ MBTA RD. CB-3
7 SCS Runoff 4.773 2 740 27,516 ------ ------ ------ MBTA RD. DMH
8 Combine 61.55 2 736 294,029 1, 2, ------ ------ TO SUDBURY RIVER
9 Combine 67.68 2 734 309,987 3, 4, 5, ------ ------ TO NORTHERLY WETLANDS
10 Combine 15.86 2 736 80,542 6, 7, ------ ------ TO EASTERLY WETLANDS
Pre-Existing Conditions.gpw Return Period: 100 Year Wednesday, 09 / 23 / 2015
Hydraflow Hydrographs Extension for AutoCAD® Civil 3D® 2013 by Autodesk, Inc. v10
A-15

Hydrograph ReportHydraflow Hydrographs Extension for AutoCAD® Civil 3D® 2013 by Autodesk, Inc. v10 Wednesday, 09 / 23 / 2015
Hyd. No. 1
TO HIGH ST. CULVERT
Hydrograph type = SCS Runoff Peak discharge = 34.46 cfsStorm frequency = 100 yrs Time to peak = 12.30 hrsTime interval = 2 min Hyd. volume = 169,887 cuftDrainage area = 11.604 ac Curve number = 77Basin Slope = 0.0 % Hydraulic length = 0 ftTc method = TR55 Time of conc. (Tc) = 24.70 minTotal precip. = 6.70 in Distribution = Type IIIStorm duration = 24 hrs Shape factor = 484
0 2 4 6 8 10 12 14 16 18 20 22 24 26
Q (cfs)
0.00 0.00
5.00 5.00
10.00 10.00
15.00 15.00
20.00 20.00
25.00 25.00
30.00 30.00
35.00 35.00
Q (cfs)
Time (hrs)
TO HIGH ST. CULVERTHyd. No. 1 -- 100 Year
Hyd No. 1
A-16
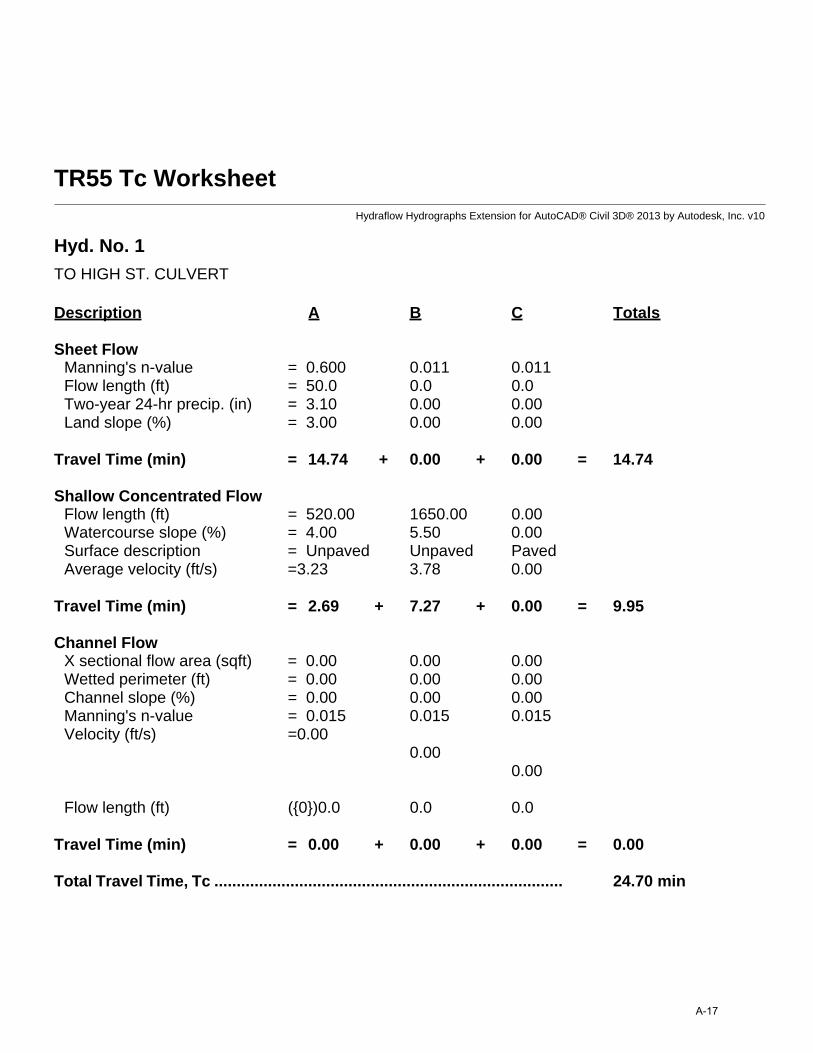
TR55 Tc WorksheetHydraflow Hydrographs Extension for AutoCAD® Civil 3D® 2013 by Autodesk, Inc. v10
Hyd. No. 1
TO HIGH ST. CULVERT
Description A B C Totals
Sheet FlowManning's n-value = 0.600 0.011 0.011Flow length (ft) = 50.0 0.0 0.0Two-year 24-hr precip. (in) = 3.10 0.00 0.00Land slope (%) = 3.00 0.00 0.00
Travel Time (min) = 14.74 + 0.00 + 0.00 = 14.74
Shallow Concentrated FlowFlow length (ft) = 520.00 1650.00 0.00Watercourse slope (%) = 4.00 5.50 0.00Surface description = Unpaved Unpaved PavedAverage velocity (ft/s) =3.23 3.78 0.00
Travel Time (min) = 2.69 + 7.27 + 0.00 = 9.95
Channel FlowX sectional flow area (sqft) = 0.00 0.00 0.00Wetted perimeter (ft) = 0.00 0.00 0.00Channel slope (%) = 0.00 0.00 0.00Manning's n-value = 0.015 0.015 0.015Velocity (ft/s) =0.00
0.000.00
Flow length (ft) ({0})0.0 0.0 0.0
Travel Time (min) = 0.00 + 0.00 + 0.00 = 0.00
Total Travel Time, Tc .............................................................................. 24.70 min
A-17

Hydrograph ReportHydraflow Hydrographs Extension for AutoCAD® Civil 3D® 2013 by Autodesk, Inc. v10 Wednesday, 09 / 23 / 2015
Hyd. No. 2
HIGH ST. DRAINAGE SYSTEM
Hydrograph type = SCS Runoff Peak discharge = 28.04 cfsStorm frequency = 100 yrs Time to peak = 12.20 hrsTime interval = 2 min Hyd. volume = 124,143 cuftDrainage area = 8.347 ac Curve number = 77Basin Slope = 0.0 % Hydraulic length = 0 ftTc method = TR55 Time of conc. (Tc) = 18.50 minTotal precip. = 6.70 in Distribution = Type IIIStorm duration = 24 hrs Shape factor = 484
0 2 4 6 8 10 12 14 16 18 20 22 24 26
Q (cfs)
0.00 0.00
5.00 5.00
10.00 10.00
15.00 15.00
20.00 20.00
25.00 25.00
30.00 30.00
Q (cfs)
Time (hrs)
HIGH ST. DRAINAGE SYSTEMHyd. No. 2 -- 100 Year
Hyd No. 2
A-18
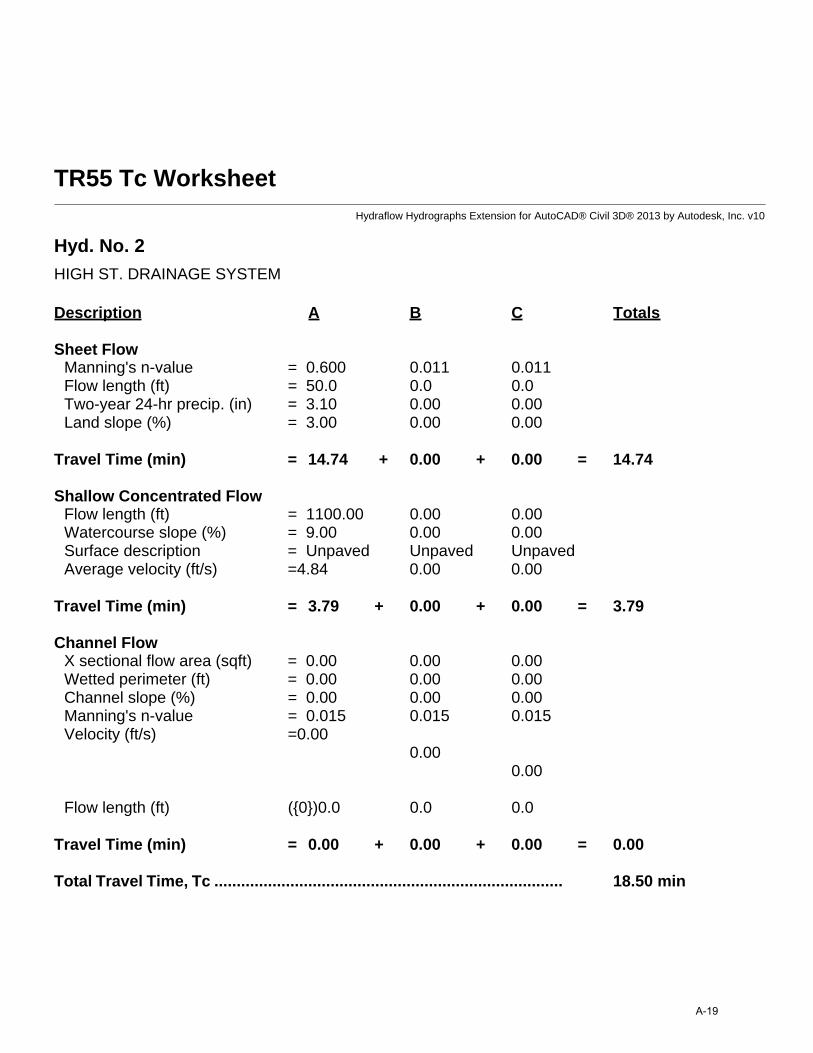
TR55 Tc WorksheetHydraflow Hydrographs Extension for AutoCAD® Civil 3D® 2013 by Autodesk, Inc. v10
Hyd. No. 2
HIGH ST. DRAINAGE SYSTEM
Description A B C Totals
Sheet FlowManning's n-value = 0.600 0.011 0.011Flow length (ft) = 50.0 0.0 0.0Two-year 24-hr precip. (in) = 3.10 0.00 0.00Land slope (%) = 3.00 0.00 0.00
Travel Time (min) = 14.74 + 0.00 + 0.00 = 14.74
Shallow Concentrated FlowFlow length (ft) = 1100.00 0.00 0.00Watercourse slope (%) = 9.00 0.00 0.00Surface description = Unpaved Unpaved UnpavedAverage velocity (ft/s) =4.84 0.00 0.00
Travel Time (min) = 3.79 + 0.00 + 0.00 = 3.79
Channel FlowX sectional flow area (sqft) = 0.00 0.00 0.00Wetted perimeter (ft) = 0.00 0.00 0.00Channel slope (%) = 0.00 0.00 0.00Manning's n-value = 0.015 0.015 0.015Velocity (ft/s) =0.00
0.000.00
Flow length (ft) ({0})0.0 0.0 0.0
Travel Time (min) = 0.00 + 0.00 + 0.00 = 0.00
Total Travel Time, Tc .............................................................................. 18.50 min
A-19

Hydrograph ReportHydraflow Hydrographs Extension for AutoCAD® Civil 3D® 2013 by Autodesk, Inc. v10 Wednesday, 09 / 23 / 2015
Hyd. No. 3
MBTA RD. CB-1
Hydrograph type = SCS Runoff Peak discharge = 35.98 cfsStorm frequency = 100 yrs Time to peak = 12.23 hrsTime interval = 2 min Hyd. volume = 158,992 cuftDrainage area = 12.467 ac Curve number = 71.4Basin Slope = 0.0 % Hydraulic length = 0 ftTc method = TR55 Time of conc. (Tc) = 18.10 minTotal precip. = 6.70 in Distribution = Type IIIStorm duration = 24 hrs Shape factor = 484
0 2 4 6 8 10 12 14 16 18 20 22 24 26
Q (cfs)
0.00 0.00
10.00 10.00
20.00 20.00
30.00 30.00
40.00 40.00
Q (cfs)
Time (hrs)
MBTA RD. CB-1Hyd. No. 3 -- 100 Year
Hyd No. 3
A-20
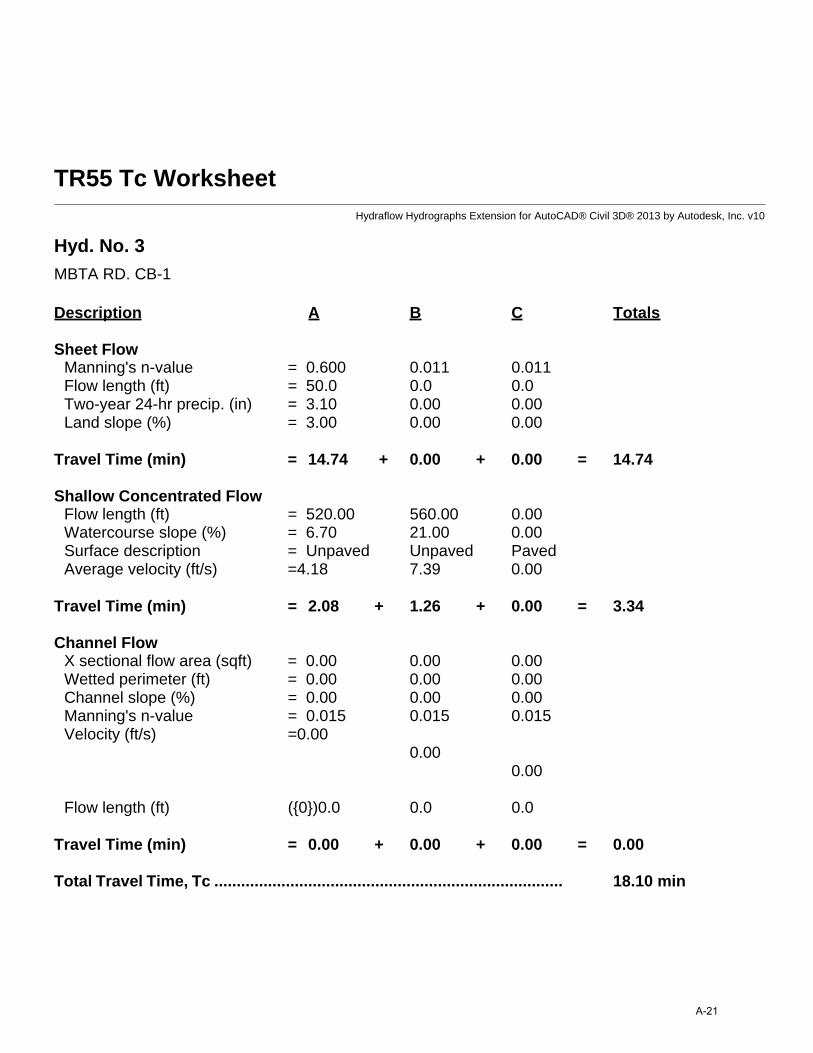
TR55 Tc WorksheetHydraflow Hydrographs Extension for AutoCAD® Civil 3D® 2013 by Autodesk, Inc. v10
Hyd. No. 3
MBTA RD. CB-1
Description A B C Totals
Sheet FlowManning's n-value = 0.600 0.011 0.011Flow length (ft) = 50.0 0.0 0.0Two-year 24-hr precip. (in) = 3.10 0.00 0.00Land slope (%) = 3.00 0.00 0.00
Travel Time (min) = 14.74 + 0.00 + 0.00 = 14.74
Shallow Concentrated FlowFlow length (ft) = 520.00 560.00 0.00Watercourse slope (%) = 6.70 21.00 0.00Surface description = Unpaved Unpaved PavedAverage velocity (ft/s) =4.18 7.39 0.00
Travel Time (min) = 2.08 + 1.26 + 0.00 = 3.34
Channel FlowX sectional flow area (sqft) = 0.00 0.00 0.00Wetted perimeter (ft) = 0.00 0.00 0.00Channel slope (%) = 0.00 0.00 0.00Manning's n-value = 0.015 0.015 0.015Velocity (ft/s) =0.00
0.000.00
Flow length (ft) ({0})0.0 0.0 0.0
Travel Time (min) = 0.00 + 0.00 + 0.00 = 0.00
Total Travel Time, Tc .............................................................................. 18.10 min
A-21
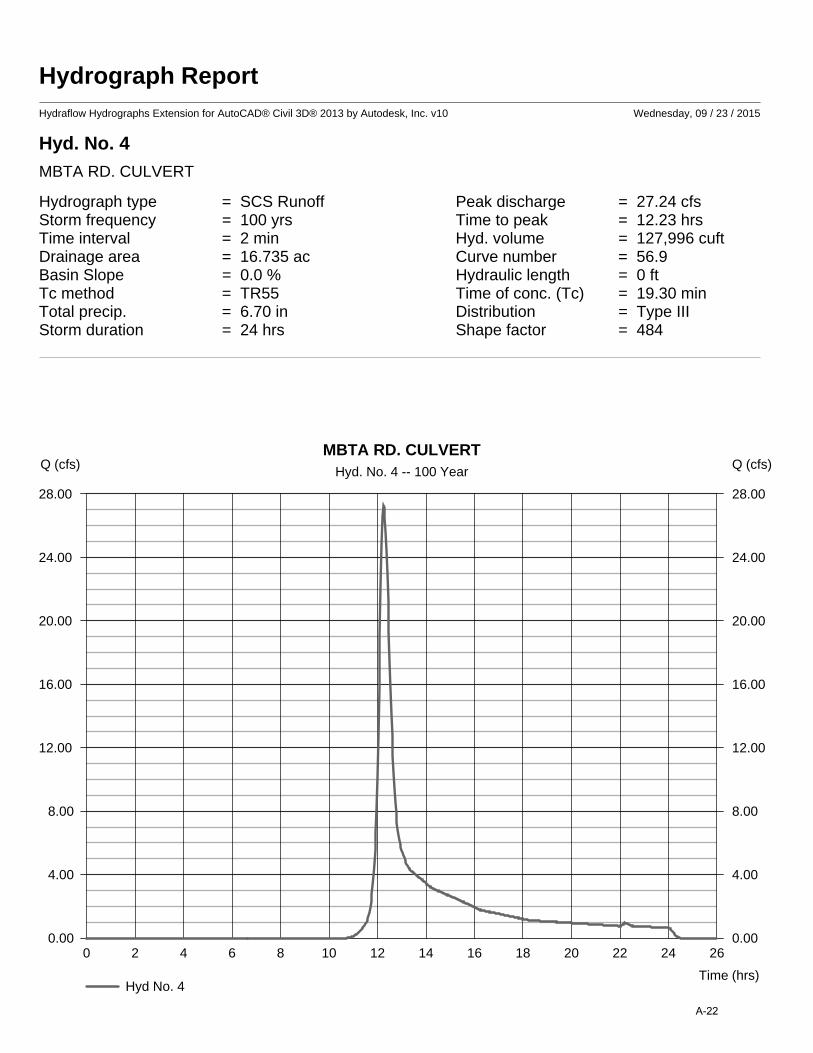
Hydrograph ReportHydraflow Hydrographs Extension for AutoCAD® Civil 3D® 2013 by Autodesk, Inc. v10 Wednesday, 09 / 23 / 2015
Hyd. No. 4
MBTA RD. CULVERT
Hydrograph type = SCS Runoff Peak discharge = 27.24 cfsStorm frequency = 100 yrs Time to peak = 12.23 hrsTime interval = 2 min Hyd. volume = 127,996 cuftDrainage area = 16.735 ac Curve number = 56.9Basin Slope = 0.0 % Hydraulic length = 0 ftTc method = TR55 Time of conc. (Tc) = 19.30 minTotal precip. = 6.70 in Distribution = Type IIIStorm duration = 24 hrs Shape factor = 484
0 2 4 6 8 10 12 14 16 18 20 22 24 26
Q (cfs)
0.00 0.00
4.00 4.00
8.00 8.00
12.00 12.00
16.00 16.00
20.00 20.00
24.00 24.00
28.00 28.00
Q (cfs)
Time (hrs)
MBTA RD. CULVERTHyd. No. 4 -- 100 Year
Hyd No. 4
A-22
TR55 Tc WorksheetHydraflow Hydrographs Extension for AutoCAD® Civil 3D® 2013 by Autodesk, Inc. v10
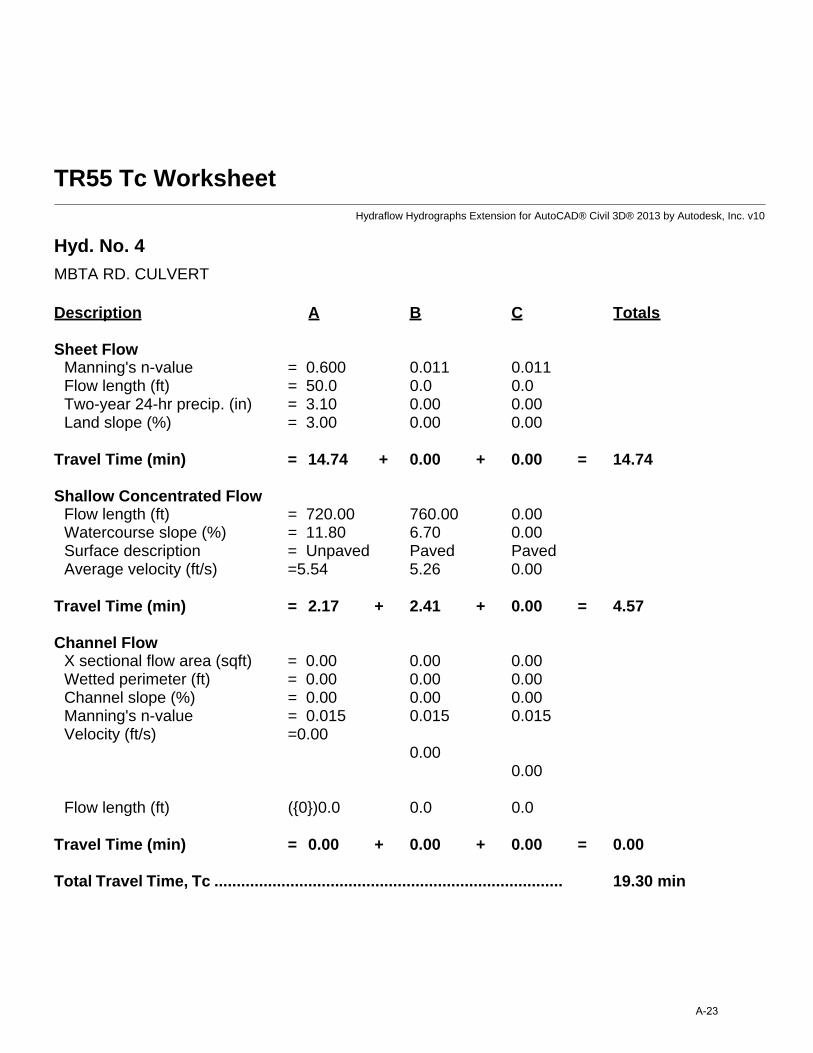
Hyd. No. 4
MBTA RD. CULVERT
Description A B C Totals
Sheet FlowManning's n-value = 0.600 0.011 0.011Flow length (ft) = 50.0 0.0 0.0Two-year 24-hr precip. (in) = 3.10 0.00 0.00Land slope (%) = 3.00 0.00 0.00
Travel Time (min) = 14.74 + 0.00 + 0.00 = 14.74
Shallow Concentrated FlowFlow length (ft) = 720.00 760.00 0.00Watercourse slope (%) = 11.80 6.70 0.00Surface description = Unpaved Paved PavedAverage velocity (ft/s) =5.54 5.26 0.00
Travel Time (min) = 2.17 + 2.41 + 0.00 = 4.57
Channel FlowX sectional flow area (sqft) = 0.00 0.00 0.00Wetted perimeter (ft) = 0.00 0.00 0.00Channel slope (%) = 0.00 0.00 0.00Manning's n-value = 0.015 0.015 0.015Velocity (ft/s) =0.00
0.000.00
Flow length (ft) ({0})0.0 0.0 0.0
Travel Time (min) = 0.00 + 0.00 + 0.00 = 0.00
Total Travel Time, Tc .............................................................................. 19.30 min
A-23

Hydrograph ReportHydraflow Hydrographs Extension for AutoCAD® Civil 3D® 2013 by Autodesk, Inc. v10 Wednesday, 09 / 23 / 2015
Hyd. No. 5
MBTA RD. CB-2
Hydrograph type = SCS Runoff Peak discharge = 4.523 cfsStorm frequency = 100 yrs Time to peak = 12.27 hrsTime interval = 2 min Hyd. volume = 22,999 cuftDrainage area = 4.035 ac Curve number = 50.8Basin Slope = 0.0 % Hydraulic length = 0 ftTc method = TR55 Time of conc. (Tc) = 19.70 minTotal precip. = 6.70 in Distribution = Type IIIStorm duration = 24 hrs Shape factor = 484
0 2 4 6 8 10 12 14 16 18 20 22 24 26
Q (cfs)
0.00 0.00
1.00 1.00
2.00 2.00
3.00 3.00
4.00 4.00
5.00 5.00
Q (cfs)
Time (hrs)
MBTA RD. CB-2Hyd. No. 5 -- 100 Year
Hyd No. 5
A-24

TR55 Tc WorksheetHydraflow Hydrographs Extension for AutoCAD® Civil 3D® 2013 by Autodesk, Inc. v10
Hyd. No. 5
MBTA RD. CB-2
Description A B C Totals
Sheet FlowManning's n-value = 0.600 0.011 0.011Flow length (ft) = 50.0 0.0 0.0Two-year 24-hr precip. (in) = 3.10 0.00 0.00Land slope (%) = 3.00 0.00 0.00
Travel Time (min) = 14.74 + 0.00 + 0.00 = 14.74
Shallow Concentrated FlowFlow length (ft) = 750.00 515.00 0.00Watercourse slope (%) = 12.00 3.80 0.00Surface description = Unpaved Unpaved PavedAverage velocity (ft/s) =5.59 3.15 0.00
Travel Time (min) = 2.24 + 2.73 + 0.00 = 4.97
Channel FlowX sectional flow area (sqft) = 0.00 0.00 0.00Wetted perimeter (ft) = 0.00 0.00 0.00Channel slope (%) = 0.00 0.00 0.00Manning's n-value = 0.015 0.015 0.015Velocity (ft/s) =0.00
0.000.00
Flow length (ft) ({0})0.0 0.0 0.0
Travel Time (min) = 0.00 + 0.00 + 0.00 = 0.00
Total Travel Time, Tc .............................................................................. 19.70 min
A-25

Hydrograph ReportHydraflow Hydrographs Extension for AutoCAD® Civil 3D® 2013 by Autodesk, Inc. v10 Wednesday, 09 / 23 / 2015
Hyd. No. 6
MBTA RD. CB-3
Hydrograph type = SCS Runoff Peak discharge = 11.19 cfsStorm frequency = 100 yrs Time to peak = 12.23 hrsTime interval = 2 min Hyd. volume = 53,026 cuftDrainage area = 7.180 ac Curve number = 56.1Basin Slope = 0.0 % Hydraulic length = 0 ftTc method = TR55 Time of conc. (Tc) = 18.10 minTotal precip. = 6.70 in Distribution = Type IIIStorm duration = 24 hrs Shape factor = 484
0 2 4 6 8 10 12 14 16 18 20 22 24 26
Q (cfs)
0.00 0.00
2.00 2.00
4.00 4.00
6.00 6.00
8.00 8.00
10.00 10.00
12.00 12.00
Q (cfs)
Time (hrs)
MBTA RD. CB-3Hyd. No. 6 -- 100 Year
Hyd No. 6
A-26

TR55 Tc WorksheetHydraflow Hydrographs Extension for AutoCAD® Civil 3D® 2013 by Autodesk, Inc. v10
Hyd. No. 6
MBTA RD. CB-3
Description A B C Totals
Sheet FlowManning's n-value = 0.600 0.011 0.011Flow length (ft) = 50.0 0.0 0.0Two-year 24-hr precip. (in) = 3.10 0.00 0.00Land slope (%) = 3.00 0.00 0.00
Travel Time (min) = 14.74 + 0.00 + 0.00 = 14.74
Shallow Concentrated FlowFlow length (ft) = 1030.00 0.00 0.00Watercourse slope (%) = 10.00 0.00 0.00Surface description = Unpaved Paved PavedAverage velocity (ft/s) =5.10 0.00 0.00
Travel Time (min) = 3.36 + 0.00 + 0.00 = 3.36
Channel FlowX sectional flow area (sqft) = 0.00 0.00 0.00Wetted perimeter (ft) = 0.00 0.00 0.00Channel slope (%) = 0.00 0.00 0.00Manning's n-value = 0.015 0.015 0.015Velocity (ft/s) =0.00
0.000.00
Flow length (ft) ({0})0.0 0.0 0.0
Travel Time (min) = 0.00 + 0.00 + 0.00 = 0.00
Total Travel Time, Tc .............................................................................. 18.10 min
A-27
Hydrograph ReportHydraflow Hydrographs Extension for AutoCAD® Civil 3D® 2013 by Autodesk, Inc. v10 Wednesday, 09 / 23 / 2015
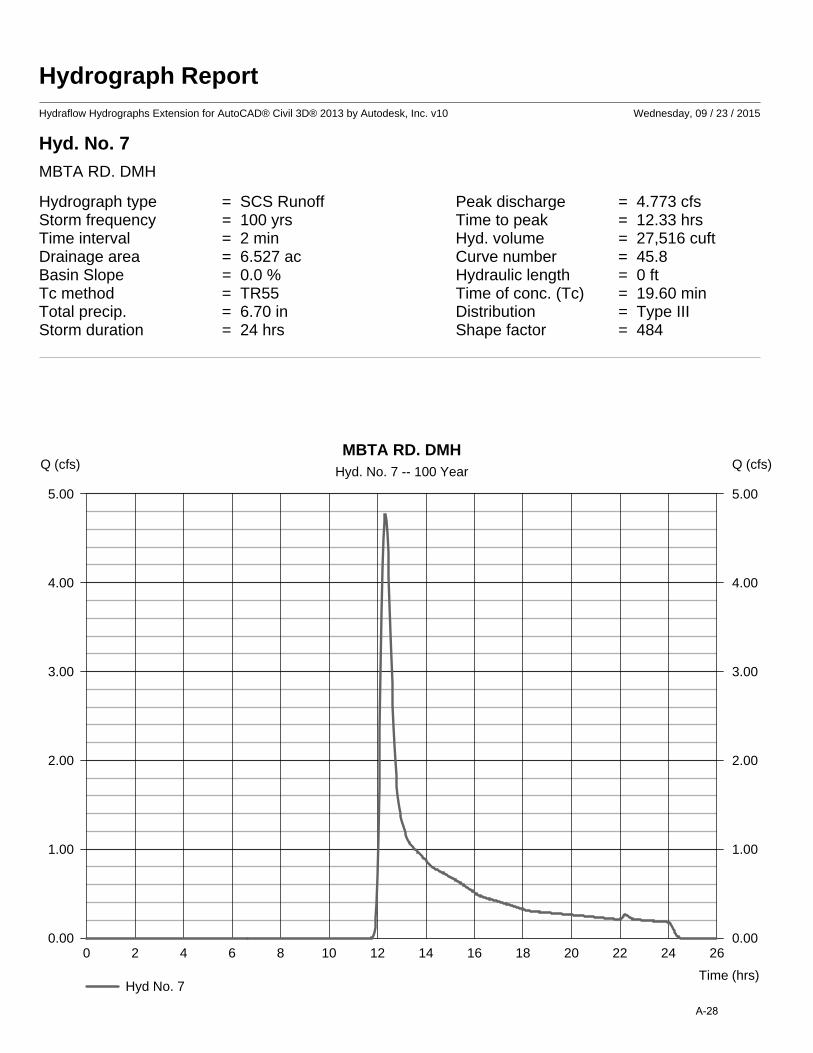
Hyd. No. 7
MBTA RD. DMH
Hydrograph type = SCS Runoff Peak discharge = 4.773 cfsStorm frequency = 100 yrs Time to peak = 12.33 hrsTime interval = 2 min Hyd. volume = 27,516 cuftDrainage area = 6.527 ac Curve number = 45.8Basin Slope = 0.0 % Hydraulic length = 0 ftTc method = TR55 Time of conc. (Tc) = 19.60 minTotal precip. = 6.70 in Distribution = Type IIIStorm duration = 24 hrs Shape factor = 484
0 2 4 6 8 10 12 14 16 18 20 22 24 26
Q (cfs)
0.00 0.00
1.00 1.00
2.00 2.00
3.00 3.00
4.00 4.00
5.00 5.00
Q (cfs)
Time (hrs)
MBTA RD. DMHHyd. No. 7 -- 100 Year
Hyd No. 7
A-28

TR55 Tc WorksheetHydraflow Hydrographs Extension for AutoCAD® Civil 3D® 2013 by Autodesk, Inc. v10
Hyd. No. 7
MBTA RD. DMH
Description A B C Totals
Sheet FlowManning's n-value = 0.600 0.011 0.011Flow length (ft) = 50.0 0.0 0.0Two-year 24-hr precip. (in) = 3.10 0.00 0.00Land slope (%) = 3.00 0.00 0.00
Travel Time (min) = 14.74 + 0.00 + 0.00 = 14.74
Shallow Concentrated FlowFlow length (ft) = 860.00 610.00 0.00Watercourse slope (%) = 11.00 8.20 0.00Surface description = Unpaved Unpaved PavedAverage velocity (ft/s) =5.35 4.62 0.00
Travel Time (min) = 2.68 + 2.20 + 0.00 = 4.88
Channel FlowX sectional flow area (sqft) = 0.00 0.00 0.00Wetted perimeter (ft) = 0.00 0.00 0.00Channel slope (%) = 0.00 0.00 0.00Manning's n-value = 0.015 0.015 0.015Velocity (ft/s) =0.00
0.000.00
Flow length (ft) ({0})0.0 0.0 0.0
Travel Time (min) = 0.00 + 0.00 + 0.00 = 0.00
Total Travel Time, Tc .............................................................................. 19.60 min
A-29

Hydrograph ReportHydraflow Hydrographs Extension for AutoCAD® Civil 3D® 2013 by Autodesk, Inc. v10 Wednesday, 09 / 23 / 2015
Hyd. No. 8
TO SUDBURY RIVER
Hydrograph type = Combine Peak discharge = 61.55 cfsStorm frequency = 100 yrs Time to peak = 12.27 hrsTime interval = 2 min Hyd. volume = 294,029 cuftInflow hyds. = 1, 2 Contrib. drain. area = 19.951 ac
0 2 4 6 8 10 12 14 16 18 20 22 24 26
Q (cfs)
0.00 0.00
10.00 10.00
20.00 20.00
30.00 30.00
40.00 40.00
50.00 50.00
60.00 60.00
70.00 70.00
Q (cfs)
Time (hrs)
TO SUDBURY RIVERHyd. No. 8 -- 100 Year
Hyd No. 8 Hyd No. 1 Hyd No. 2
A-30
Hydrograph ReportHydraflow Hydrographs Extension for AutoCAD® Civil 3D® 2013 by Autodesk, Inc. v10 Wednesday, 09 / 23 / 2015
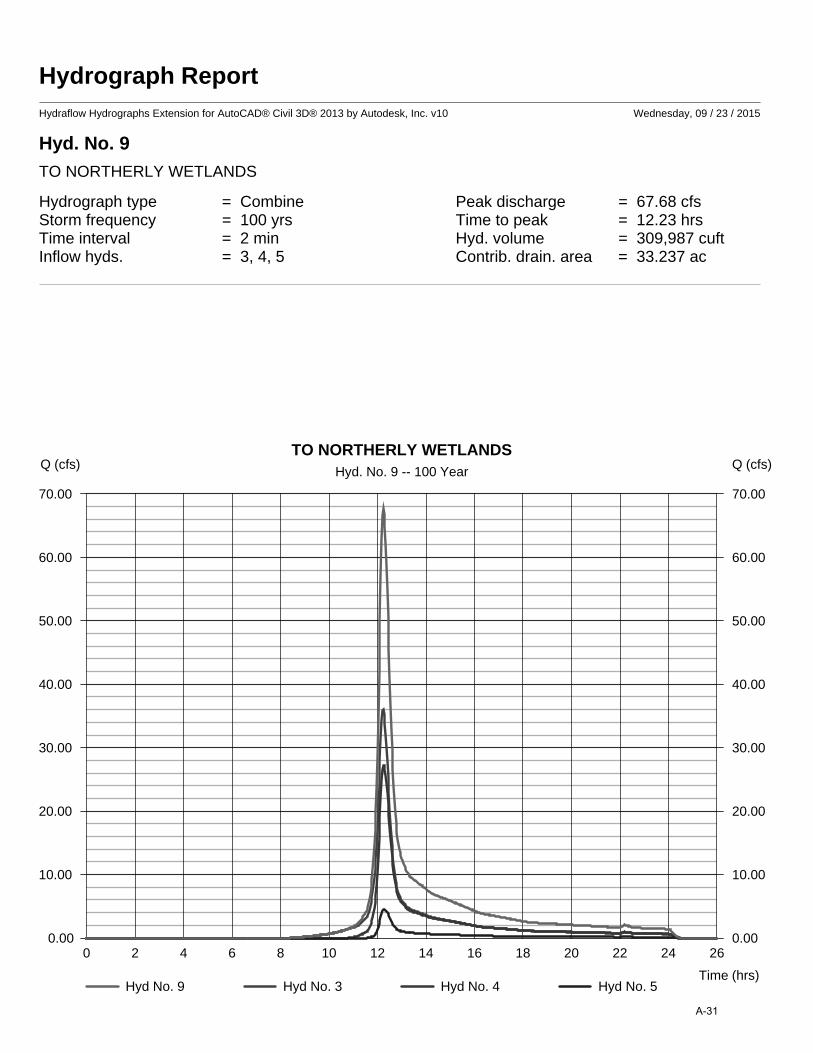
Hyd. No. 9
TO NORTHERLY WETLANDS
Hydrograph type = Combine Peak discharge = 67.68 cfsStorm frequency = 100 yrs Time to peak = 12.23 hrsTime interval = 2 min Hyd. volume = 309,987 cuftInflow hyds. = 3, 4, 5 Contrib. drain. area = 33.237 ac
0 2 4 6 8 10 12 14 16 18 20 22 24 26
Q (cfs)
0.00 0.00
10.00 10.00
20.00 20.00
30.00 30.00
40.00 40.00
50.00 50.00
60.00 60.00
70.00 70.00
Q (cfs)
Time (hrs)
TO NORTHERLY WETLANDSHyd. No. 9 -- 100 Year
Hyd No. 9 Hyd No. 3 Hyd No. 4 Hyd No. 5
A-31
Hydrograph ReportHydraflow Hydrographs Extension for AutoCAD® Civil 3D® 2013 by Autodesk, Inc. v10 Wednesday, 09 / 23 / 2015
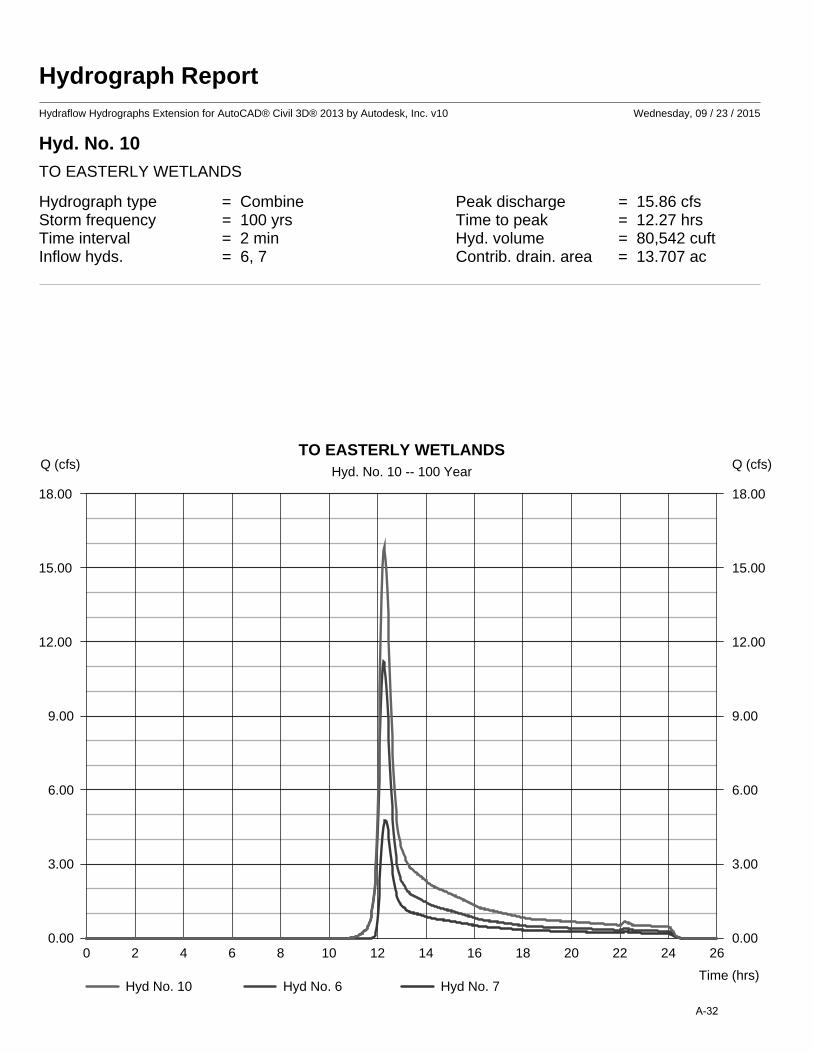
Hyd. No. 10
TO EASTERLY WETLANDS
Hydrograph type = Combine Peak discharge = 15.86 cfsStorm frequency = 100 yrs Time to peak = 12.27 hrsTime interval = 2 min Hyd. volume = 80,542 cuftInflow hyds. = 6, 7 Contrib. drain. area = 13.707 ac
0 2 4 6 8 10 12 14 16 18 20 22 24 26
Q (cfs)
0.00 0.00
3.00 3.00
6.00 6.00
9.00 9.00
12.00 12.00
15.00 15.00
18.00 18.00
Q (cfs)
Time (hrs)
TO EASTERLY WETLANDSHyd. No. 10 -- 100 Year
Hyd No. 10 Hyd No. 6 Hyd No. 7
A-32


KELLY ENGINEERING GROUP, INC. Zero Campanelli Drive-Braintree-MA 02184 Phone 781 843 4333
Attachment B
Proposed Conditions

PROPOSEDDRAINAGE
EXHIBITTRANSIT APARTMENTS
ASHLAND, MA
ASHLAND RAIL
B - 1

Runoff Curve Number and Runoff
Name: Campanelli Ashland By: bgl Date: 09/28/15Location : MBTA Road, Ashland MADescription: Proposed Conditions - To High St. Culvert
Circle One: Pre or Post
Runoff Curve Number (CN): Surface Description Soil Name; hydrologic group; hydrologic condition CN s.f. Product of
CN x Area
Woods Hydrologic Group A; Good Condition 30 0 0Woods Hydrologic Group D; Good Condition 77 431352 3.3E+07Grass Hydrologic Group A; Good Condition 39 0 0Grass Hydrologic Group D; Good Condition 80 23971 1917680Roof 98 0 0Paved 98 18253 1788794
Totals = 473576.00 3.7E+07Acres = 10.871809
CN or C (weighted) = total product/total area = 78.0
Reference: Urban Hydrology for Small WatershedsTechnical Release 55, Soil Conservation ServiceU.S. Department of Agriculture, June 1986
B - 2
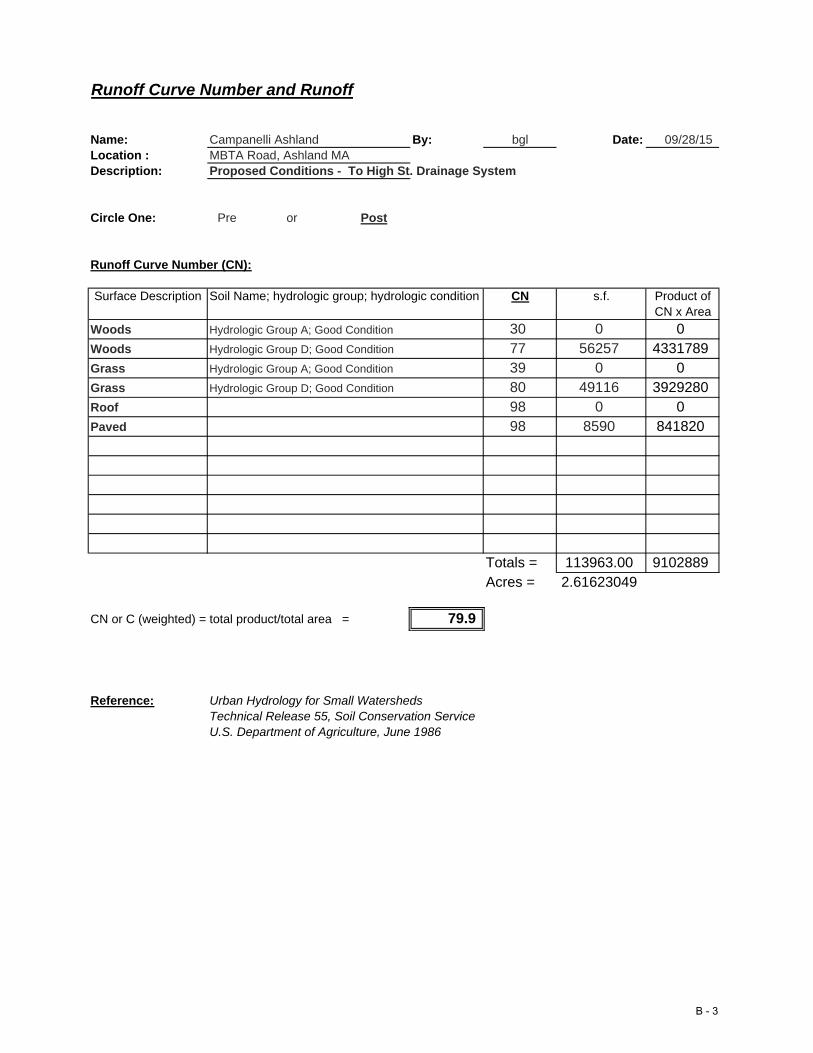
Runoff Curve Number and Runoff
Name: Campanelli Ashland By: bgl Date: 09/28/15Location : MBTA Road, Ashland MADescription: Proposed Conditions - To High St. Drainage System
Circle One: Pre or Post
Runoff Curve Number (CN): Surface Description Soil Name; hydrologic group; hydrologic condition CN s.f. Product of
CN x Area
Woods Hydrologic Group A; Good Condition 30 0 0Woods Hydrologic Group D; Good Condition 77 56257 4331789Grass Hydrologic Group A; Good Condition 39 0 0Grass Hydrologic Group D; Good Condition 80 49116 3929280Roof 98 0 0Paved 98 8590 841820
Totals = 113963.00 9102889Acres = 2.61623049
CN or C (weighted) = total product/total area = 79.9
Reference: Urban Hydrology for Small WatershedsTechnical Release 55, Soil Conservation ServiceU.S. Department of Agriculture, June 1986
B - 3
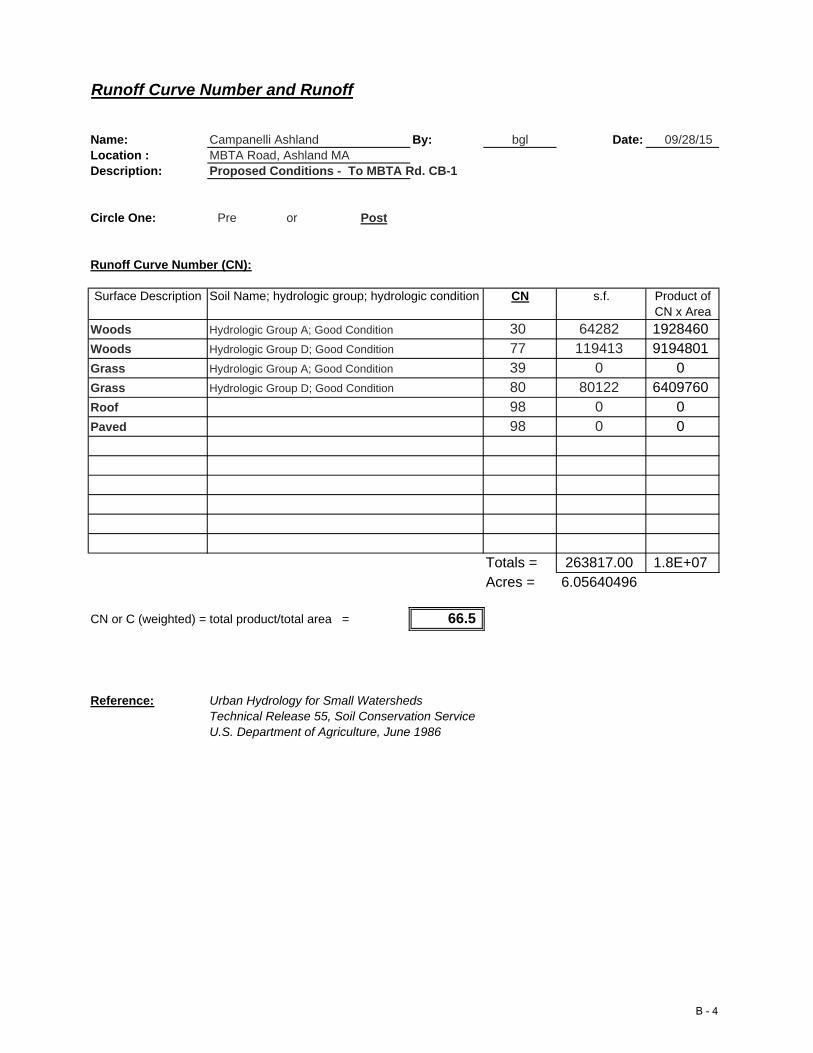
Runoff Curve Number and Runoff
Name: Campanelli Ashland By: bgl Date: 09/28/15Location : MBTA Road, Ashland MADescription: Proposed Conditions - To MBTA Rd. CB-1
Circle One: Pre or Post
Runoff Curve Number (CN): Surface Description Soil Name; hydrologic group; hydrologic condition CN s.f. Product of
CN x Area
Woods Hydrologic Group A; Good Condition 30 64282 1928460Woods Hydrologic Group D; Good Condition 77 119413 9194801Grass Hydrologic Group A; Good Condition 39 0 0Grass Hydrologic Group D; Good Condition 80 80122 6409760Roof 98 0 0Paved 98 0 0
Totals = 263817.00 1.8E+07Acres = 6.05640496
CN or C (weighted) = total product/total area = 66.5
Reference: Urban Hydrology for Small WatershedsTechnical Release 55, Soil Conservation ServiceU.S. Department of Agriculture, June 1986
B - 4

Runoff Curve Number and Runoff
Name: Campanelli Ashland By: bgl Date: 09/28/15Location : MBTA Road, Ashland MADescription: Proposed Conditions - To MBTA Rd. Culvert
Circle One: Pre or Post
Runoff Curve Number (CN): Surface Description Soil Name; hydrologic group; hydrologic condition CN s.f. Product of
CN x Area
Woods Hydrologic Group A; Good Condition 30 78082 2342460Woods Hydrologic Group D; Good Condition 77 1651 127127Grass Hydrologic Group A; Good Condition 39 39847 1554033Grass Hydrologic Group D; Good Condition 80 1805 144400Roof 98 0 0Paved 98 0 0
Totals = 121385.00 4168020Acres = 2.78661616
CN or C (weighted) = total product/total area = 34.3
Reference: Urban Hydrology for Small WatershedsTechnical Release 55, Soil Conservation ServiceU.S. Department of Agriculture, June 1986
B - 5

Runoff Curve Number and Runoff
Name: Campanelli Ashland By: bgl Date: 09/28/15Location : MBTA Road, Ashland MADescription: Proposed Conditions - To MBTA Rd. CB-2
Circle One: Pre or Post
Runoff Curve Number (CN): Surface Description Soil Name; hydrologic group; hydrologic condition CN s.f. Product of
CN x Area
Woods Hydrologic Group A; Good Condition 30 0 0Woods Hydrologic Group D; Good Condition 77 0 0Grass Hydrologic Group A; Good Condition 39 7321 285519Grass Hydrologic Group D; Good Condition 80 0 0Roof 98 0 0Paved 98 0 0
Totals = 7321.00 285519Acres = 0.16806703
CN or C (weighted) = total product/total area = 39.0
Reference: Urban Hydrology for Small WatershedsTechnical Release 55, Soil Conservation ServiceU.S. Department of Agriculture, June 1986
B - 6

Runoff Curve Number and Runoff
Name: Campanelli Ashland By: bgl Date: 09/28/15Location : MBTA Road, Ashland MADescription: Proposed Conditions - To MBTA Rd. CB-3
Circle One: Pre or Post
Runoff Curve Number (CN): Surface Description Soil Name; hydrologic group; hydrologic condition CN s.f. Product of
CN x Area
Woods Hydrologic Group A; Good Condition 30 108960 3268800Woods Hydrologic Group D; Good Condition 77 173431 1.3E+07Grass Hydrologic Group A; Good Condition 39 9709 378651Grass Hydrologic Group D; Good Condition 80 0 0Roof 98 0 0Paved 98 0 0
Totals = 292100.00 1.7E+07Acres = 6.7056933
CN or C (weighted) = total product/total area = 58.2
Reference: Urban Hydrology for Small WatershedsTechnical Release 55, Soil Conservation ServiceU.S. Department of Agriculture, June 1986
B - 7

Runoff Curve Number and Runoff
Name: Campanelli Ashland By: bgl Date: 09/28/15Location : MBTA Road, Ashland MADescription: Proposed Conditions - To MBTA Rd. DMH
Circle One: Pre or Post
Runoff Curve Number (CN): Surface Description Soil Name; hydrologic group; hydrologic condition CN s.f. Product of
CN x Area
Woods Hydrologic Group A; Good Condition 30 188792 5663760Woods Hydrologic Group D; Good Condition 77 95535 7356195Grass Hydrologic Group A; Good Condition 39 0 0Grass Hydrologic Group D; Good Condition 80 0 0Roof 98 0 0Paved 98 0 0
Totals = 284327.00 1.3E+07Acres = 6.52724977
CN or C (weighted) = total product/total area = 45.8
Reference: Urban Hydrology for Small WatershedsTechnical Release 55, Soil Conservation ServiceU.S. Department of Agriculture, June 1986
B - 8
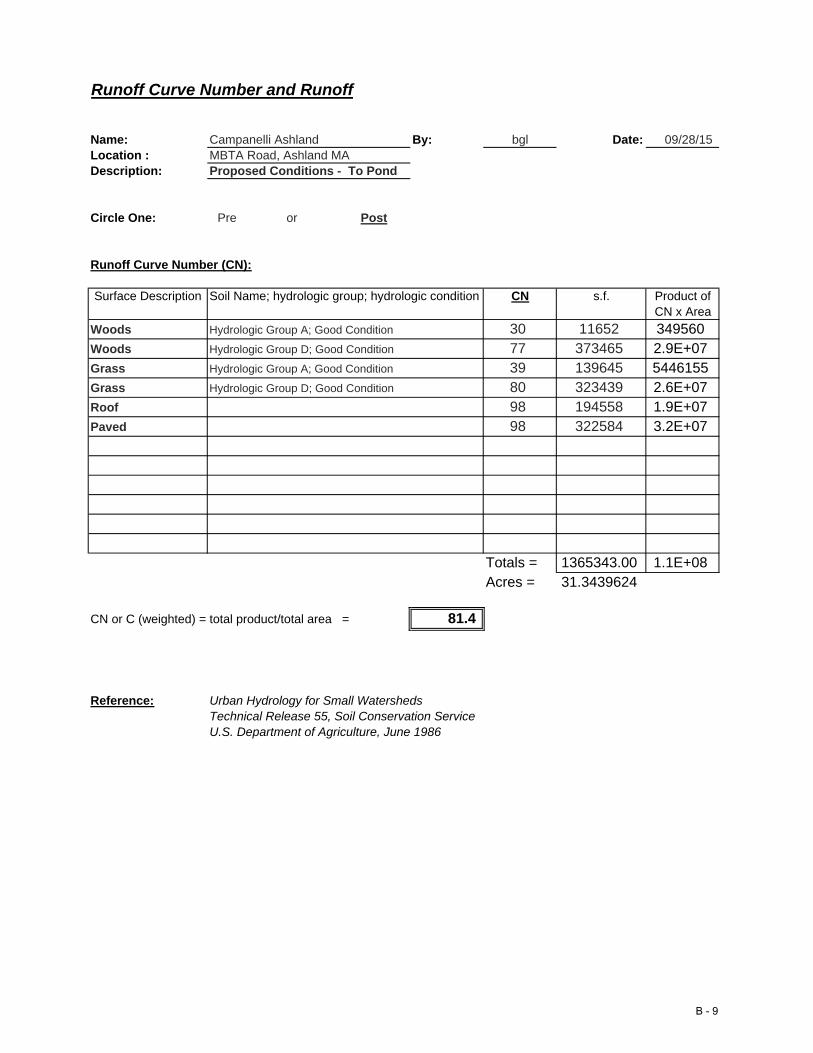
Runoff Curve Number and Runoff
Name: Campanelli Ashland By: bgl Date: 09/28/15Location : MBTA Road, Ashland MADescription: Proposed Conditions - To Pond
Circle One: Pre or Post
Runoff Curve Number (CN): Surface Description Soil Name; hydrologic group; hydrologic condition CN s.f. Product of
CN x Area
Woods Hydrologic Group A; Good Condition 30 11652 349560Woods Hydrologic Group D; Good Condition 77 373465 2.9E+07Grass Hydrologic Group A; Good Condition 39 139645 5446155Grass Hydrologic Group D; Good Condition 80 323439 2.6E+07Roof 98 194558 1.9E+07Paved 98 322584 3.2E+07
Totals = 1365343.00 1.1E+08Acres = 31.3439624
CN or C (weighted) = total product/total area = 81.4
Reference: Urban Hydrology for Small WatershedsTechnical Release 55, Soil Conservation ServiceU.S. Department of Agriculture, June 1986
B - 9
1 2 3 4 5
6 7
8
9
10 11 12
13
14
15
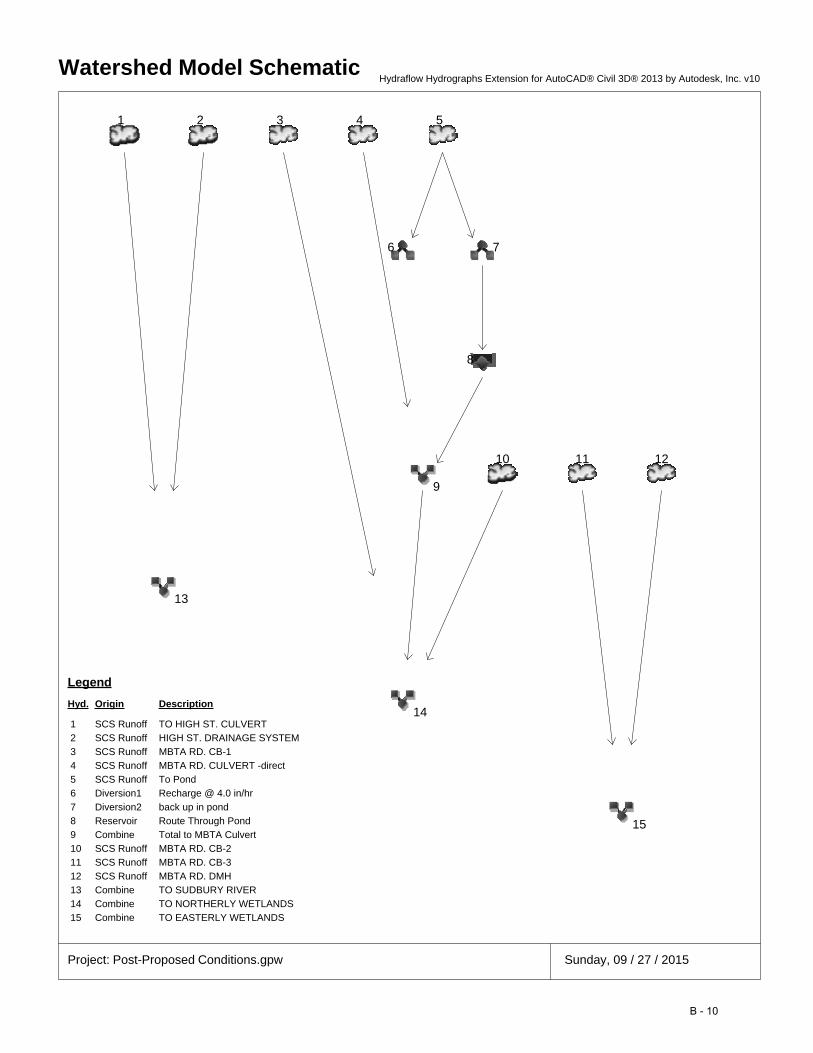
Watershed Model SchematicHydraflow Hydrographs Extension for AutoCAD® Civil 3D® 2013 by Autodesk, Inc. v10
Project: Post-Proposed Conditions.gpw Sunday, 09 / 27 / 2015
Hyd. Origin Description
Legend
1 SCS Runoff TO HIGH ST. CULVERT
2 SCS Runoff HIGH ST. DRAINAGE SYSTEM
3 SCS Runoff MBTA RD. CB-1
4 SCS Runoff MBTA RD. CULVERT -direct
5 SCS Runoff To Pond
6 Diversion1 Recharge @ 4.0 in/hr
7 Diversion2 back up in pond
8 Reservoir Route Through Pond
9 Combine Total to MBTA Culvert
10 SCS Runoff MBTA RD. CB-2
11 SCS Runoff MBTA RD. CB-3
12 SCS Runoff MBTA RD. DMH
13 Combine TO SUDBURY RIVER
14 Combine TO NORTHERLY WETLANDS
15 Combine TO EASTERLY WETLANDS
B - 10

Hydrograph Return Period Recap
Hyd. Hydrograph Inflow Peak Outflow (cfs) Hydrograph
No. type hyd(s) Description
(origin) 1-yr 2-yr 3-yr 5-yr 10-yr 25-yr 50-yr 100-yr
1 SCS Runoff ------ ------- 9.204 ------- ------- 18.05 23.42 27.53 31.68 TO HIGH ST. CULVERT
2 SCS Runoff ------ ------- 3.609 ------- ------- 6.822 8.745 10.21 11.68 HIGH ST. DRAINAGE SYSTEM
3 SCS Runoff ------ ------- 2.624 ------- ------- 7.111 10.09 12.45 14.89 MBTA RD. CB-1
4 SCS Runoff ------ ------- 0.000 ------- ------- 0.012 0.039 0.079 0.242 MBTA RD. CULVERT -direct
5 SCS Runoff ------ ------- 36.26 ------- ------- 66.50 84.53 98.27 112.09 To Pond
6 Diversion1 5 ------- 1.050 ------- ------- 1.050 1.050 1.050 1.050 Recharge @ 4.0 in/hr
7 Diversion2 5 ------- 35.21 ------- ------- 65.45 83.48 97.22 111.04 back up in pond
8 Reservoir 7 ------- 4.727 ------- ------- 21.04 34.84 45.76 57.14 Route Through Pond
9 Combine 4, 8 ------- 4.727 ------- ------- 21.04 34.84 45.83 57.37 Total to MBTA Culvert
10 SCS Runoff ------ ------- 0.000 ------- ------- 0.002 0.011 0.024 0.044 MBTA RD. CB-2
11 SCS Runoff ------ ------- 0.956 ------- ------- 4.156 6.644 8.688 10.90 MBTA RD. CB-3
12 SCS Runoff ------ ------- 0.035 ------- ------- 0.742 1.833 2.956 4.292 MBTA RD. DMH
13 Combine 1, 2, ------- 11.13 ------- ------- 21.65 28.01 32.89 37.84 TO SUDBURY RIVER
14 Combine 3, 9, 10, ------- 5.310 ------- ------- 23.49 39.08 51.49 64.52 TO NORTHERLY WETLANDS
15 Combine 11, 12, ------- 0.956 ------- ------- 4.632 8.186 11.41 15.02 TO EASTERLY WETLANDS
Proj. file: Post-Proposed Conditions.gpw Sunday, 09 / 27 / 2015
Hydraflow Hydrographs Extension for AutoCAD® Civil 3D® 2013 by Autodesk, Inc. v10
B - 11
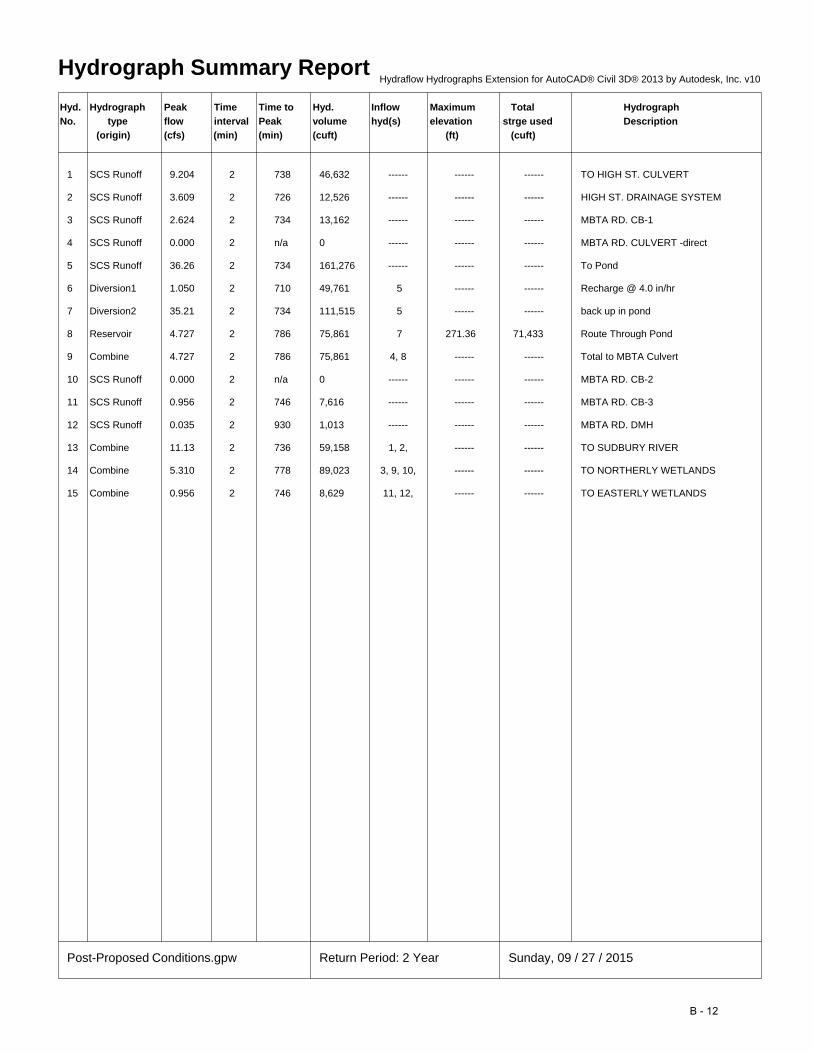
Hydrograph Summary Report
Hyd. Hydrograph Peak Time Time to Hyd. Inflow Maximum Total Hydrograph
No. type flow interval Peak volume hyd(s) elevation strge used Description
(origin) (cfs) (min) (min) (cuft) (ft) (cuft)
1 SCS Runoff 9.204 2 738 46,632 ------ ------ ------ TO HIGH ST. CULVERT
2 SCS Runoff 3.609 2 726 12,526 ------ ------ ------ HIGH ST. DRAINAGE SYSTEM
3 SCS Runoff 2.624 2 734 13,162 ------ ------ ------ MBTA RD. CB-1
4 SCS Runoff 0.000 2 n/a 0 ------ ------ ------ MBTA RD. CULVERT -direct
5 SCS Runoff 36.26 2 734 161,276 ------ ------ ------ To Pond
6 Diversion1 1.050 2 710 49,761 5 ------ ------ Recharge @ 4.0 in/hr
7 Diversion2 35.21 2 734 111,515 5 ------ ------ back up in pond
8 Reservoir 4.727 2 786 75,861 7 271.36 71,433 Route Through Pond
9 Combine 4.727 2 786 75,861 4, 8 ------ ------ Total to MBTA Culvert
10 SCS Runoff 0.000 2 n/a 0 ------ ------ ------ MBTA RD. CB-2
11 SCS Runoff 0.956 2 746 7,616 ------ ------ ------ MBTA RD. CB-3
12 SCS Runoff 0.035 2 930 1,013 ------ ------ ------ MBTA RD. DMH
13 Combine 11.13 2 736 59,158 1, 2, ------ ------ TO SUDBURY RIVER
14 Combine 5.310 2 778 89,023 3, 9, 10, ------ ------ TO NORTHERLY WETLANDS
15 Combine 0.956 2 746 8,629 11, 12, ------ ------ TO EASTERLY WETLANDS
Post-Proposed Conditions.gpw Return Period: 2 Year Sunday, 09 / 27 / 2015
Hydraflow Hydrographs Extension for AutoCAD® Civil 3D® 2013 by Autodesk, Inc. v10
B - 12

Hydrograph Summary Report
Hyd. Hydrograph Peak Time Time to Hyd. Inflow Maximum Total Hydrograph
No. type flow interval Peak volume hyd(s) elevation strge used Description
(origin) (cfs) (min) (min) (cuft) (ft) (cuft)
1 SCS Runoff 18.05 2 738 89,057 ------ ------ ------ TO HIGH ST. CULVERT
2 SCS Runoff 6.822 2 726 23,294 ------ ------ ------ HIGH ST. DRAINAGE SYSTEM
3 SCS Runoff 7.111 2 732 30,649 ------ ------ ------ MBTA RD. CB-1
4 SCS Runoff 0.012 2 1326 228 ------ ------ ------ MBTA RD. CULVERT -direct
5 SCS Runoff 66.50 2 734 293,891 ------ ------ ------ To Pond
6 Diversion1 1.050 2 732 58,441 5 ------ ------ Recharge @ 4.0 in/hr
7 Diversion2 65.45 2 734 235,451 5 ------ ------ back up in pond
8 Reservoir 21.04 2 758 199,779 7 272.48 120,493 Route Through Pond
9 Combine 21.04 2 758 200,007 4, 8 ------ ------ Total to MBTA Culvert
10 SCS Runoff 0.002 2 888 66 ------ ------ ------ MBTA RD. CB-2
11 SCS Runoff 4.156 2 738 22,299 ------ ------ ------ MBTA RD. CB-3
12 SCS Runoff 0.742 2 750 7,715 ------ ------ ------ MBTA RD. DMH
13 Combine 21.65 2 736 112,351 1, 2, ------ ------ TO SUDBURY RIVER
14 Combine 23.49 2 756 230,722 3, 9, 10, ------ ------ TO NORTHERLY WETLANDS
15 Combine 4.632 2 740 30,013 11, 12, ------ ------ TO EASTERLY WETLANDS
Post-Proposed Conditions.gpw Return Period: 10 Year Sunday, 09 / 27 / 2015
Hydraflow Hydrographs Extension for AutoCAD® Civil 3D® 2013 by Autodesk, Inc. v10
B - 13

Hydrograph Summary Report
Hyd. Hydrograph Peak Time Time to Hyd. Inflow Maximum Total Hydrograph
No. type flow interval Peak volume hyd(s) elevation strge used Description
(origin) (cfs) (min) (min) (cuft) (ft) (cuft)
1 SCS Runoff 23.42 2 738 115,288 ------ ------ ------ TO HIGH ST. CULVERT
2 SCS Runoff 8.745 2 726 29,881 ------ ------ ------ HIGH ST. DRAINAGE SYSTEM
3 SCS Runoff 10.09 2 732 42,328 ------ ------ ------ MBTA RD. CB-1
4 SCS Runoff 0.039 2 898 1,059 ------ ------ ------ MBTA RD. CULVERT -direct
5 SCS Runoff 84.53 2 732 374,376 ------ ------ ------ To Pond
6 Diversion1 1.050 2 726 60,972 5 ------ ------ Recharge @ 4.0 in/hr
7 Diversion2 83.48 2 732 313,404 5 ------ ------ back up in pond
8 Reservoir 34.84 2 754 277,725 7 273.04 145,174 Route Through Pond
9 Combine 34.84 2 754 278,784 4, 8 ------ ------ Total to MBTA Culvert
10 SCS Runoff 0.011 2 752 157 ------ ------ ------ MBTA RD. CB-2
11 SCS Runoff 6.644 2 736 32,897 ------ ------ ------ MBTA RD. CB-3
12 SCS Runoff 1.833 2 744 13,797 ------ ------ ------ MBTA RD. DMH
13 Combine 28.01 2 736 145,169 1, 2, ------ ------ TO SUDBURY RIVER
14 Combine 39.08 2 752 321,269 3, 9, 10, ------ ------ TO NORTHERLY WETLANDS
15 Combine 8.186 2 738 46,694 11, 12, ------ ------ TO EASTERLY WETLANDS
Post-Proposed Conditions.gpw Return Period: 25 Year Sunday, 09 / 27 / 2015
Hydraflow Hydrographs Extension for AutoCAD® Civil 3D® 2013 by Autodesk, Inc. v10
B - 14

Hydrograph Summary Report
Hyd. Hydrograph Peak Time Time to Hyd. Inflow Maximum Total Hydrograph
No. type flow interval Peak volume hyd(s) elevation strge used Description
(origin) (cfs) (min) (min) (cuft) (ft) (cuft)
1 SCS Runoff 27.53 2 738 135,585 ------ ------ ------ TO HIGH ST. CULVERT
2 SCS Runoff 10.21 2 726 34,955 ------ ------ ------ HIGH ST. DRAINAGE SYSTEM
3 SCS Runoff 12.45 2 732 51,666 ------ ------ ------ MBTA RD. CB-1
4 SCS Runoff 0.079 2 820 2,041 ------ ------ ------ MBTA RD. CULVERT -direct
5 SCS Runoff 98.27 2 732 436,170 ------ ------ ------ To Pond
6 Diversion1 1.050 2 724 62,681 5 ------ ------ Recharge @ 4.0 in/hr
7 Diversion2 97.22 2 732 373,489 5 ------ ------ back up in pond
8 Reservoir 45.76 2 752 337,807 7 273.45 163,075 Route Through Pond
9 Combine 45.83 2 752 339,848 4, 8 ------ ------ Total to MBTA Culvert
10 SCS Runoff 0.024 2 748 248 ------ ------ ------ MBTA RD. CB-2
11 SCS Runoff 8.688 2 736 41,646 ------ ------ ------ MBTA RD. CB-3
12 SCS Runoff 2.956 2 742 19,247 ------ ------ ------ MBTA RD. DMH
13 Combine 32.89 2 734 170,541 1, 2, ------ ------ TO SUDBURY RIVER
14 Combine 51.49 2 750 391,762 3, 9, 10, ------ ------ TO NORTHERLY WETLANDS
15 Combine 11.41 2 736 60,892 11, 12, ------ ------ TO EASTERLY WETLANDS
Post-Proposed Conditions.gpw Return Period: 50 Year Sunday, 09 / 27 / 2015
Hydraflow Hydrographs Extension for AutoCAD® Civil 3D® 2013 by Autodesk, Inc. v10
B - 15

Hydrograph Summary Report
Hyd. Hydrograph Peak Time Time to Hyd. Inflow Maximum Total Hydrograph
No. type flow interval Peak volume hyd(s) elevation strge used Description
(origin) (cfs) (min) (min) (cuft) (ft) (cuft)
1 SCS Runoff 31.68 2 738 156,294 ------ ------ ------ TO HIGH ST. CULVERT
2 SCS Runoff 11.68 2 726 40,118 ------ ------ ------ HIGH ST. DRAINAGE SYSTEM
3 SCS Runoff 14.89 2 732 61,405 ------ ------ ------ MBTA RD. CB-1
4 SCS Runoff 0.242 2 746 3,302 ------ ------ ------ MBTA RD. CULVERT -direct
5 SCS Runoff 112.09 2 732 498,897 ------ ------ ------ To Pond
6 Diversion1 1.050 2 722 64,295 5 ------ ------ Recharge @ 4.0 in/hr
7 Diversion2 111.04 2 732 434,602 5 ------ ------ back up in pond
8 Reservoir 57.14 2 750 398,917 7 273.84 180,057 Route Through Pond
9 Combine 57.37 2 750 402,219 4, 8 ------ ------ Total to MBTA Culvert
10 SCS Runoff 0.044 2 744 355 ------ ------ ------ MBTA RD. CB-2
11 SCS Runoff 10.90 2 734 50,968 ------ ------ ------ MBTA RD. CB-3
12 SCS Runoff 4.292 2 740 25,348 ------ ------ ------ MBTA RD. DMH
13 Combine 37.84 2 734 196,412 1, 2, ------ ------ TO SUDBURY RIVER
14 Combine 64.52 2 748 463,979 3, 9, 10, ------ ------ TO NORTHERLY WETLANDS
15 Combine 15.02 2 736 76,317 11, 12, ------ ------ TO EASTERLY WETLANDS
Post-Proposed Conditions.gpw Return Period: 100 Year Sunday, 09 / 27 / 2015
Hydraflow Hydrographs Extension for AutoCAD® Civil 3D® 2013 by Autodesk, Inc. v10
B - 16

Hydrograph ReportHydraflow Hydrographs Extension for AutoCAD® Civil 3D® 2013 by Autodesk, Inc. v10 Sunday, 09 / 27 / 2015
Hyd. No. 1
TO HIGH ST. CULVERT
Hydrograph type = SCS Runoff Peak discharge = 9.204 cfsStorm frequency = 2 yrs Time to peak = 738 minTime interval = 2 min Hyd. volume = 46,632 cuftDrainage area = 10.870 ac Curve number = 78Basin Slope = 0.0 % Hydraulic length = 0 ftTc method = TR55 Time of conc. (Tc) = 24.69 minTotal precip. = 3.10 in Distribution = Type IIIStorm duration = 24 hrs Shape factor = 484
0 120 240 360 480 600 720 840 960 1080 1200 1320 1440 1560
Q (cfs)
0.00 0.00
2.00 2.00
4.00 4.00
6.00 6.00
8.00 8.00
10.00 10.00
Q (cfs)
Time (min)
TO HIGH ST. CULVERTHyd. No. 1 -- 2 Year
Hyd No. 1
B - 17
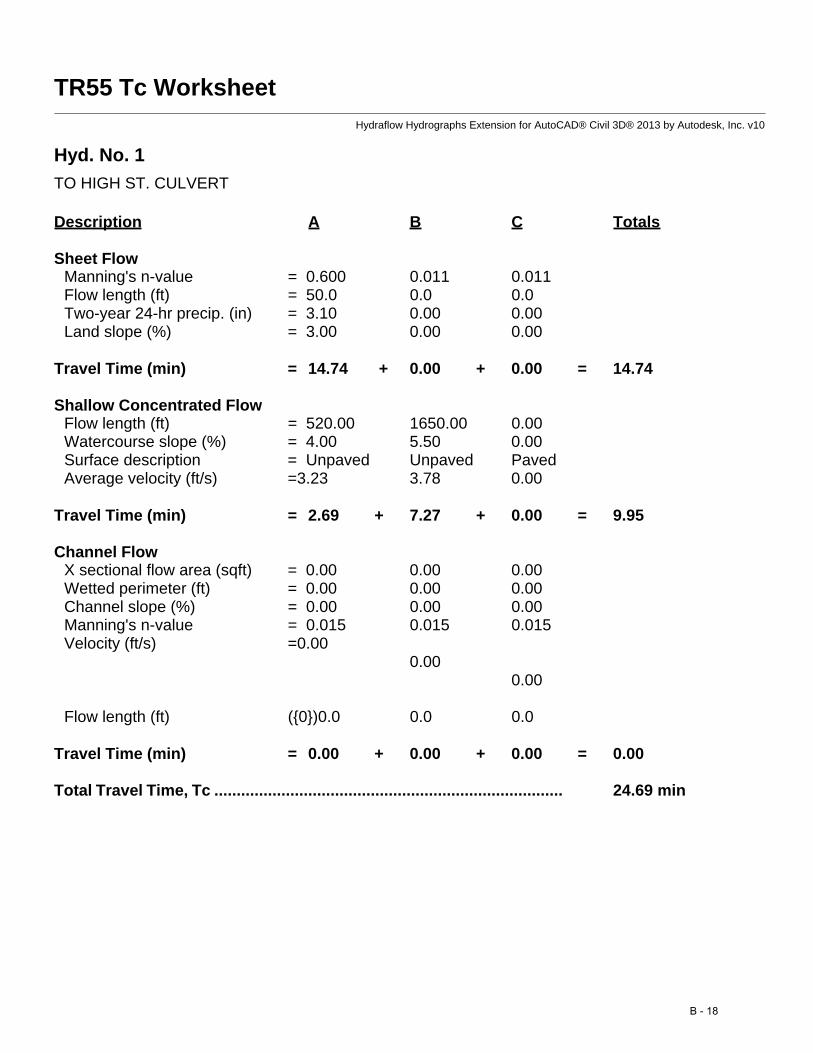
TR55 Tc WorksheetHydraflow Hydrographs Extension for AutoCAD® Civil 3D® 2013 by Autodesk, Inc. v10
Hyd. No. 1
TO HIGH ST. CULVERT
Description A B C Totals
Sheet FlowManning's n-value = 0.600 0.011 0.011Flow length (ft) = 50.0 0.0 0.0Two-year 24-hr precip. (in) = 3.10 0.00 0.00Land slope (%) = 3.00 0.00 0.00
Travel Time (min) = 14.74 + 0.00 + 0.00 = 14.74
Shallow Concentrated FlowFlow length (ft) = 520.00 1650.00 0.00Watercourse slope (%) = 4.00 5.50 0.00Surface description = Unpaved Unpaved PavedAverage velocity (ft/s) =3.23 3.78 0.00
Travel Time (min) = 2.69 + 7.27 + 0.00 = 9.95
Channel FlowX sectional flow area (sqft) = 0.00 0.00 0.00Wetted perimeter (ft) = 0.00 0.00 0.00Channel slope (%) = 0.00 0.00 0.00Manning's n-value = 0.015 0.015 0.015Velocity (ft/s) =0.00
0.000.00
Flow length (ft) ({0})0.0 0.0 0.0
Travel Time (min) = 0.00 + 0.00 + 0.00 = 0.00
Total Travel Time, Tc .............................................................................. 24.69 min
B - 18

Hydrograph ReportHydraflow Hydrographs Extension for AutoCAD® Civil 3D® 2013 by Autodesk, Inc. v10 Sunday, 09 / 27 / 2015
Hyd. No. 2
HIGH ST. DRAINAGE SYSTEM
Hydrograph type = SCS Runoff Peak discharge = 3.609 cfsStorm frequency = 2 yrs Time to peak = 726 minTime interval = 2 min Hyd. volume = 12,526 cuftDrainage area = 2.616 ac Curve number = 79.9Basin Slope = 0.0 % Hydraulic length = 0 ftTc method = TR55 Time of conc. (Tc) = 6.90 minTotal precip. = 3.10 in Distribution = Type IIIStorm duration = 24 hrs Shape factor = 484
0 120 240 360 480 600 720 840 960 1080 1200 1320 1440 1560
Q (cfs)
0.00 0.00
1.00 1.00
2.00 2.00
3.00 3.00
4.00 4.00
Q (cfs)
Time (min)
HIGH ST. DRAINAGE SYSTEMHyd. No. 2 -- 2 Year
Hyd No. 2
B - 19
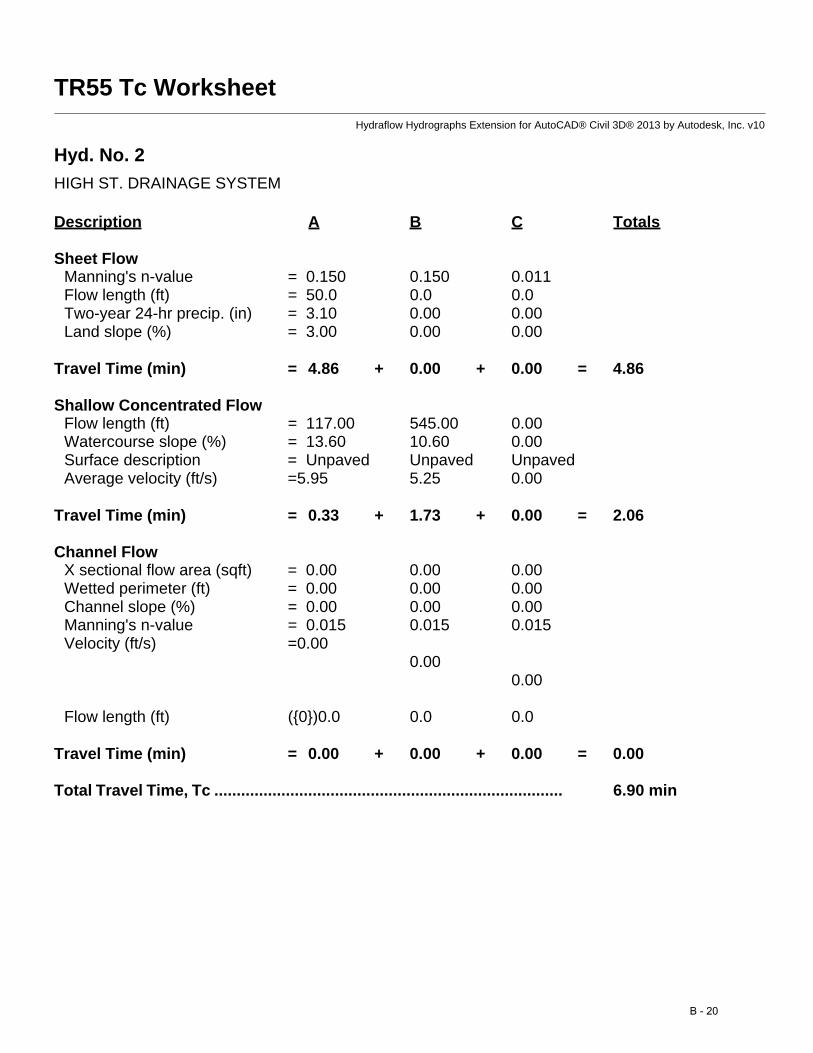
TR55 Tc WorksheetHydraflow Hydrographs Extension for AutoCAD® Civil 3D® 2013 by Autodesk, Inc. v10
Hyd. No. 2
HIGH ST. DRAINAGE SYSTEM
Description A B C Totals
Sheet FlowManning's n-value = 0.150 0.150 0.011Flow length (ft) = 50.0 0.0 0.0Two-year 24-hr precip. (in) = 3.10 0.00 0.00Land slope (%) = 3.00 0.00 0.00
Travel Time (min) = 4.86 + 0.00 + 0.00 = 4.86
Shallow Concentrated FlowFlow length (ft) = 117.00 545.00 0.00Watercourse slope (%) = 13.60 10.60 0.00Surface description = Unpaved Unpaved UnpavedAverage velocity (ft/s) =5.95 5.25 0.00
Travel Time (min) = 0.33 + 1.73 + 0.00 = 2.06
Channel FlowX sectional flow area (sqft) = 0.00 0.00 0.00Wetted perimeter (ft) = 0.00 0.00 0.00Channel slope (%) = 0.00 0.00 0.00Manning's n-value = 0.015 0.015 0.015Velocity (ft/s) =0.00
0.000.00
Flow length (ft) ({0})0.0 0.0 0.0
Travel Time (min) = 0.00 + 0.00 + 0.00 = 0.00
Total Travel Time, Tc .............................................................................. 6.90 min
B - 20

Hydrograph ReportHydraflow Hydrographs Extension for AutoCAD® Civil 3D® 2013 by Autodesk, Inc. v10 Sunday, 09 / 27 / 2015
Hyd. No. 3
MBTA RD. CB-1
Hydrograph type = SCS Runoff Peak discharge = 2.624 cfsStorm frequency = 2 yrs Time to peak = 734 minTime interval = 2 min Hyd. volume = 13,162 cuftDrainage area = 6.056 ac Curve number = 66.5Basin Slope = 0.0 % Hydraulic length = 0 ftTc method = TR55 Time of conc. (Tc) = 13.60 minTotal precip. = 3.10 in Distribution = Type IIIStorm duration = 24 hrs Shape factor = 484
0 120 240 360 480 600 720 840 960 1080 1200 1320 1440 1560
Q (cfs)
0.00 0.00
1.00 1.00
2.00 2.00
3.00 3.00
Q (cfs)
Time (min)
MBTA RD. CB-1Hyd. No. 3 -- 2 Year
Hyd No. 3
B - 21

TR55 Tc WorksheetHydraflow Hydrographs Extension for AutoCAD® Civil 3D® 2013 by Autodesk, Inc. v10
Hyd. No. 3
MBTA RD. CB-1
Description A B C Totals
Sheet FlowManning's n-value = 0.150 0.150 0.600Flow length (ft) = 10.0 72.0 41.0Two-year 24-hr precip. (in) = 3.10 3.10 3.10Land slope (%) = 2.00 50.00 17.00
Travel Time (min) = 1.58 + 2.11 + 6.28 = 9.97
Shallow Concentrated FlowFlow length (ft) = 2133.00 0.00 0.00Watercourse slope (%) = 37.00 0.00 0.00Surface description = Unpaved Unpaved PavedAverage velocity (ft/s) =9.81 0.00 0.00
Travel Time (min) = 3.62 + 0.00 + 0.00 = 3.62
Channel FlowX sectional flow area (sqft) = 0.00 0.00 0.00Wetted perimeter (ft) = 0.00 0.00 0.00Channel slope (%) = 0.00 0.00 0.00Manning's n-value = 0.015 0.015 0.015Velocity (ft/s) =0.00
0.000.00
Flow length (ft) ({0})0.0 0.0 0.0
Travel Time (min) = 0.00 + 0.00 + 0.00 = 0.00
Total Travel Time, Tc .............................................................................. 13.60 min
B - 22
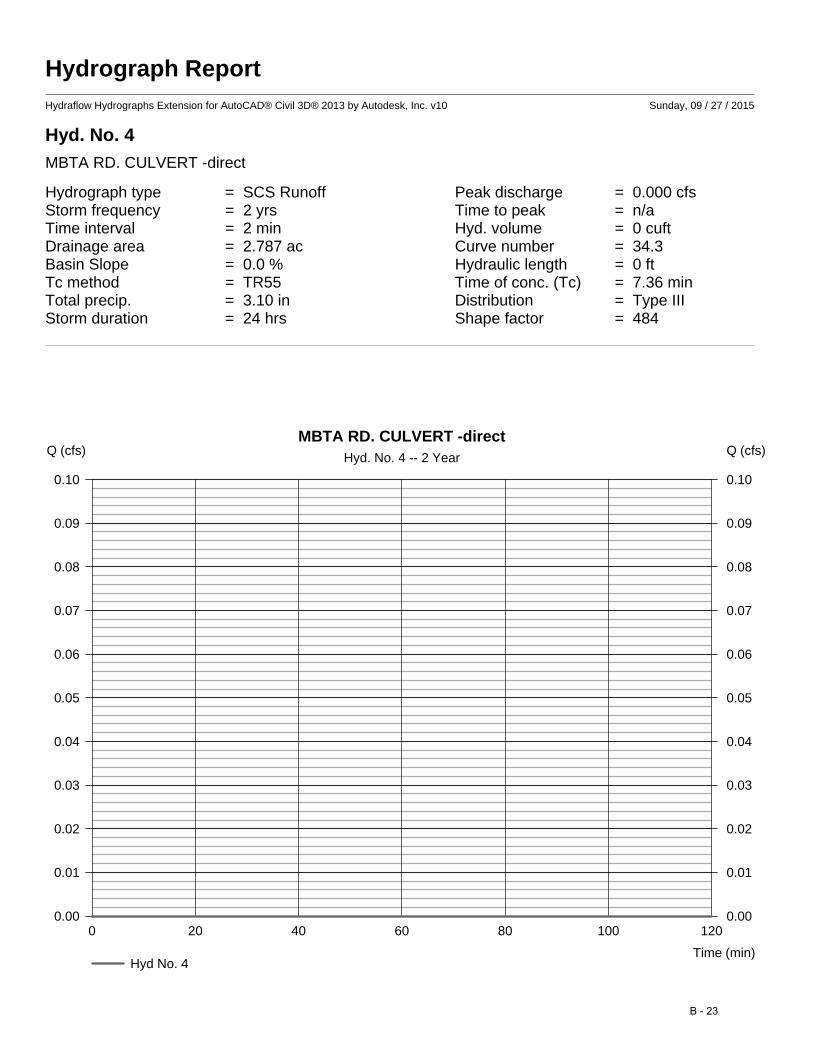
Hydrograph ReportHydraflow Hydrographs Extension for AutoCAD® Civil 3D® 2013 by Autodesk, Inc. v10 Sunday, 09 / 27 / 2015
Hyd. No. 4
MBTA RD. CULVERT -direct
Hydrograph type = SCS Runoff Peak discharge = 0.000 cfsStorm frequency = 2 yrs Time to peak = n/aTime interval = 2 min Hyd. volume = 0 cuftDrainage area = 2.787 ac Curve number = 34.3Basin Slope = 0.0 % Hydraulic length = 0 ftTc method = TR55 Time of conc. (Tc) = 7.36 minTotal precip. = 3.10 in Distribution = Type IIIStorm duration = 24 hrs Shape factor = 484
0 20 40 60 80 100 120
Q (cfs)
0.00 0.00
0.01 0.01
0.02 0.02
0.03 0.03
0.04 0.04
0.05 0.05
0.06 0.06
0.07 0.07
0.08 0.08
0.09 0.09
0.10 0.10
Q (cfs)
Time (min)
MBTA RD. CULVERT -directHyd. No. 4 -- 2 Year
Hyd No. 4
B - 23
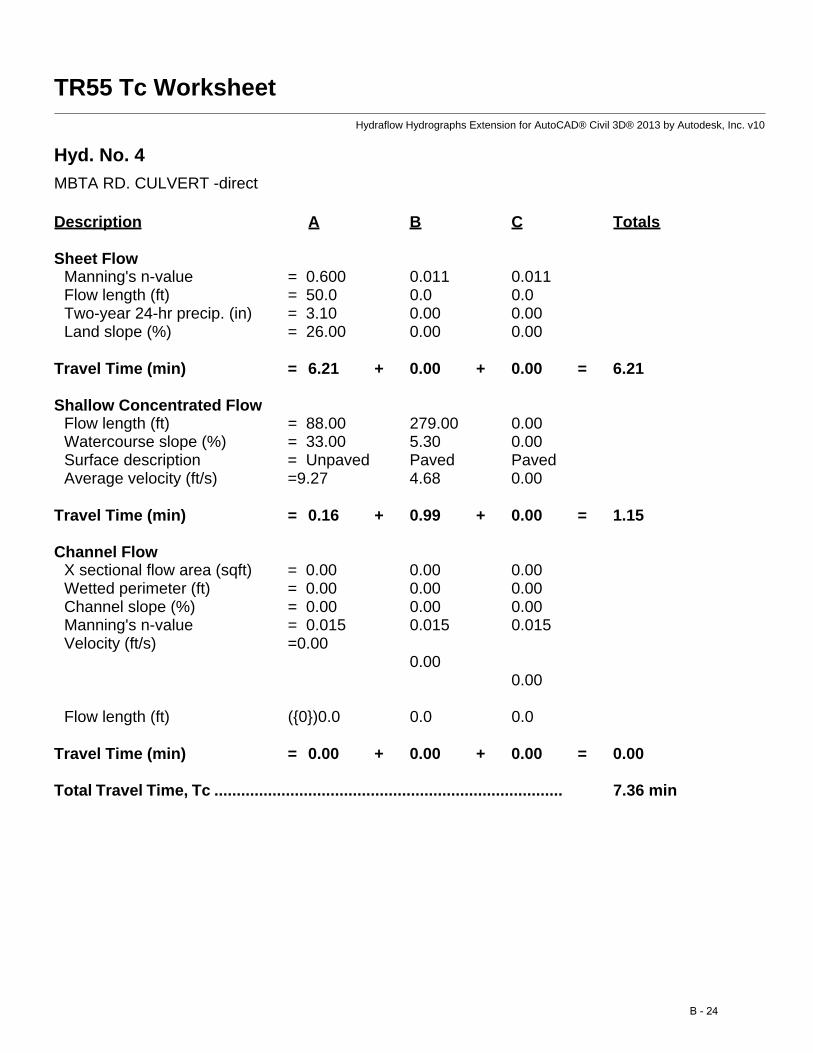
TR55 Tc WorksheetHydraflow Hydrographs Extension for AutoCAD® Civil 3D® 2013 by Autodesk, Inc. v10
Hyd. No. 4
MBTA RD. CULVERT -direct
Description A B C Totals
Sheet FlowManning's n-value = 0.600 0.011 0.011Flow length (ft) = 50.0 0.0 0.0Two-year 24-hr precip. (in) = 3.10 0.00 0.00Land slope (%) = 26.00 0.00 0.00
Travel Time (min) = 6.21 + 0.00 + 0.00 = 6.21
Shallow Concentrated FlowFlow length (ft) = 88.00 279.00 0.00Watercourse slope (%) = 33.00 5.30 0.00Surface description = Unpaved Paved PavedAverage velocity (ft/s) =9.27 4.68 0.00
Travel Time (min) = 0.16 + 0.99 + 0.00 = 1.15
Channel FlowX sectional flow area (sqft) = 0.00 0.00 0.00Wetted perimeter (ft) = 0.00 0.00 0.00Channel slope (%) = 0.00 0.00 0.00Manning's n-value = 0.015 0.015 0.015Velocity (ft/s) =0.00
0.000.00
Flow length (ft) ({0})0.0 0.0 0.0
Travel Time (min) = 0.00 + 0.00 + 0.00 = 0.00
Total Travel Time, Tc .............................................................................. 7.36 min
B - 24

Hydrograph ReportHydraflow Hydrographs Extension for AutoCAD® Civil 3D® 2013 by Autodesk, Inc. v10 Sunday, 09 / 27 / 2015
Hyd. No. 5
To Pond
Hydrograph type = SCS Runoff Peak discharge = 36.26 cfsStorm frequency = 2 yrs Time to peak = 734 minTime interval = 2 min Hyd. volume = 161,276 cuftDrainage area = 31.343 ac Curve number = 81.4Basin Slope = 0.0 % Hydraulic length = 0 ftTc method = TR55 Time of conc. (Tc) = 19.52 minTotal precip. = 3.10 in Distribution = Type IIIStorm duration = 24 hrs Shape factor = 484
0 120 240 360 480 600 720 840 960 1080 1200 1320 1440 1560
Q (cfs)
0.00 0.00
10.00 10.00
20.00 20.00
30.00 30.00
40.00 40.00
Q (cfs)
Time (min)
To PondHyd. No. 5 -- 2 Year
Hyd No. 5
B - 25
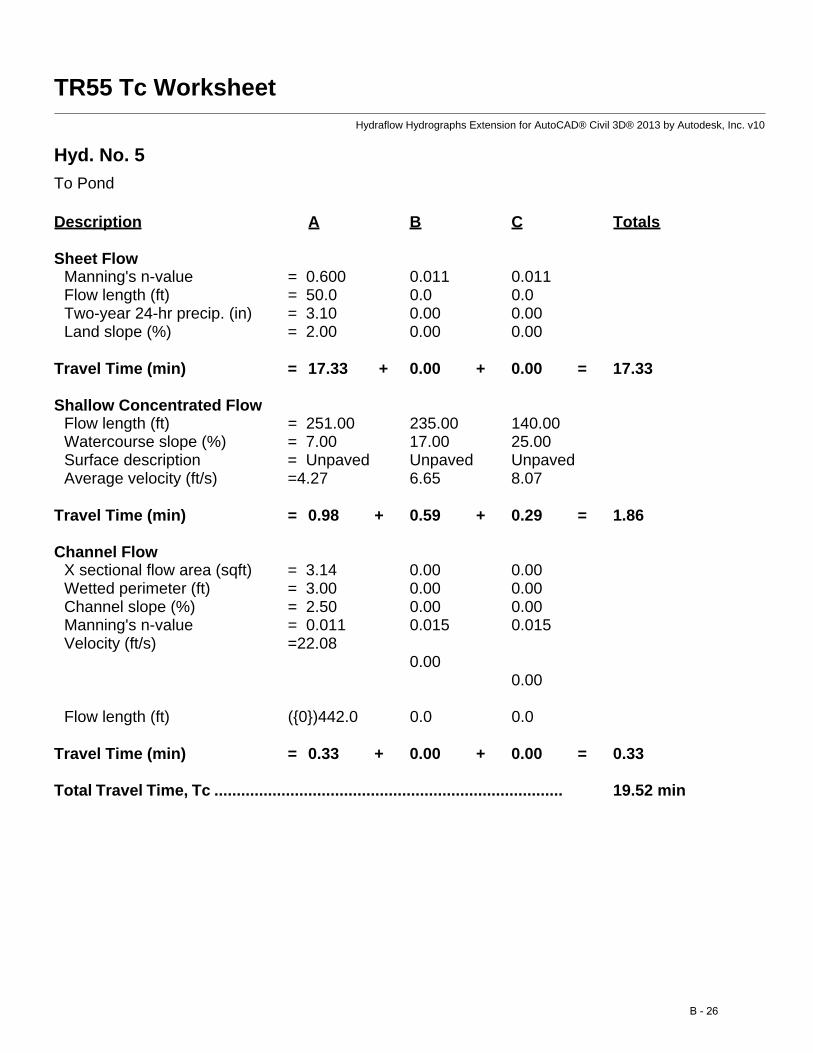
TR55 Tc WorksheetHydraflow Hydrographs Extension for AutoCAD® Civil 3D® 2013 by Autodesk, Inc. v10
Hyd. No. 5
To Pond
Description A B C Totals
Sheet FlowManning's n-value = 0.600 0.011 0.011Flow length (ft) = 50.0 0.0 0.0Two-year 24-hr precip. (in) = 3.10 0.00 0.00Land slope (%) = 2.00 0.00 0.00
Travel Time (min) = 17.33 + 0.00 + 0.00 = 17.33
Shallow Concentrated FlowFlow length (ft) = 251.00 235.00 140.00Watercourse slope (%) = 7.00 17.00 25.00Surface description = Unpaved Unpaved UnpavedAverage velocity (ft/s) =4.27 6.65 8.07
Travel Time (min) = 0.98 + 0.59 + 0.29 = 1.86
Channel FlowX sectional flow area (sqft) = 3.14 0.00 0.00Wetted perimeter (ft) = 3.00 0.00 0.00Channel slope (%) = 2.50 0.00 0.00Manning's n-value = 0.011 0.015 0.015Velocity (ft/s) =22.08
0.000.00
Flow length (ft) ({0})442.0 0.0 0.0
Travel Time (min) = 0.33 + 0.00 + 0.00 = 0.33
Total Travel Time, Tc .............................................................................. 19.52 min
B - 26
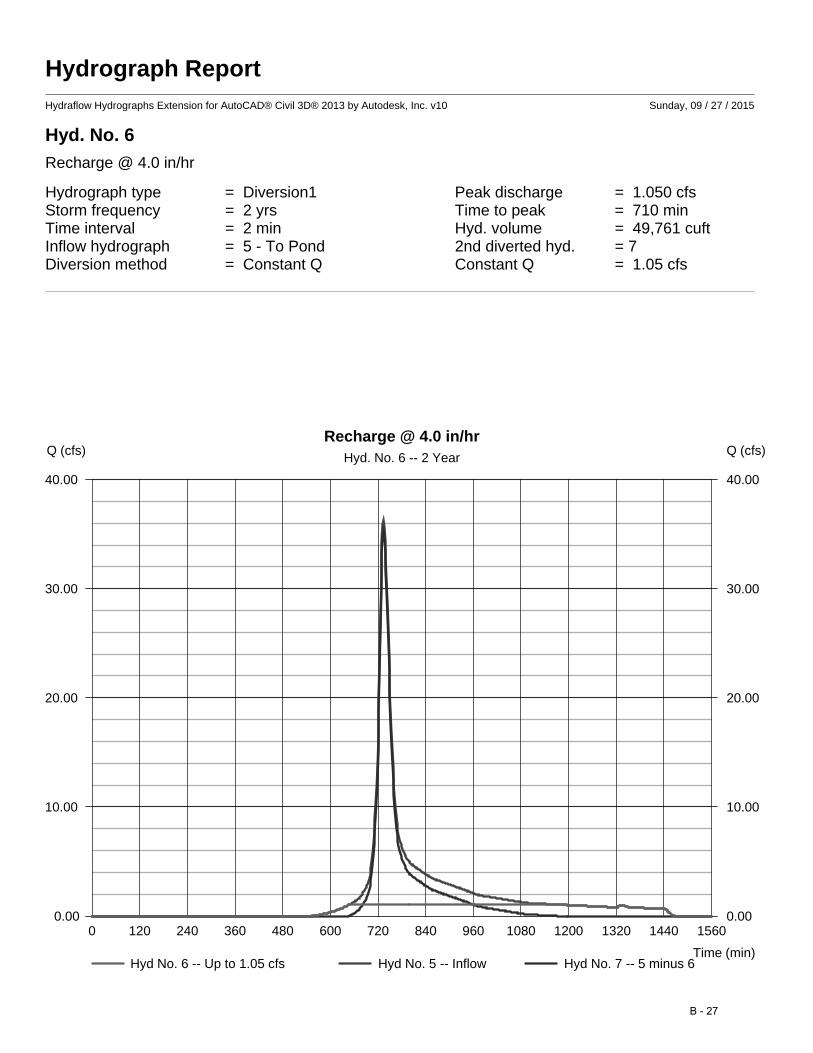
Hydrograph ReportHydraflow Hydrographs Extension for AutoCAD® Civil 3D® 2013 by Autodesk, Inc. v10 Sunday, 09 / 27 / 2015
Hyd. No. 6
Recharge @ 4.0 in/hr
Hydrograph type = Diversion1 Peak discharge = 1.050 cfsStorm frequency = 2 yrs Time to peak = 710 minTime interval = 2 min Hyd. volume = 49,761 cuftInflow hydrograph = 5 - To Pond 2nd diverted hyd. = 7Diversion method = Constant Q Constant Q = 1.05 cfs
0 120 240 360 480 600 720 840 960 1080 1200 1320 1440 1560
Q (cfs)
0.00 0.00
10.00 10.00
20.00 20.00
30.00 30.00
40.00 40.00
Q (cfs)
Time (min)
Recharge @ 4.0 in/hrHyd. No. 6 -- 2 Year
Hyd No. 6 -- Up to 1.05 cfs Hyd No. 5 -- Inflow Hyd No. 7 -- 5 minus 6
B - 27
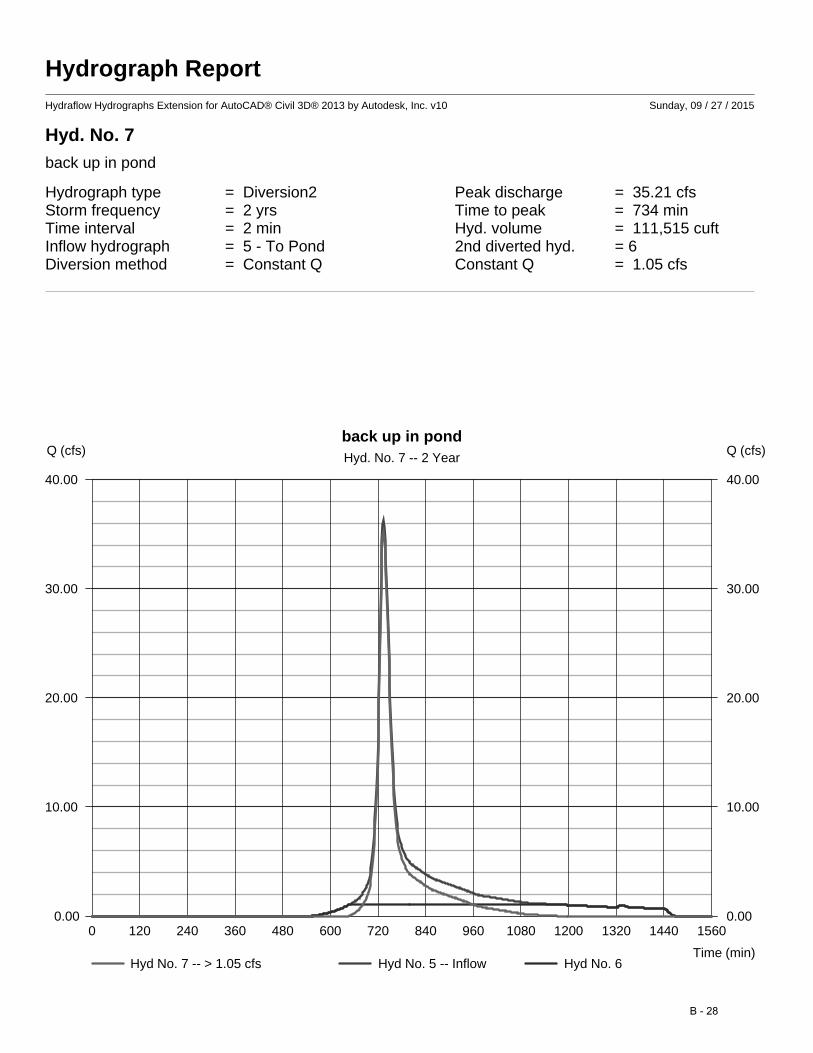
Hydrograph ReportHydraflow Hydrographs Extension for AutoCAD® Civil 3D® 2013 by Autodesk, Inc. v10 Sunday, 09 / 27 / 2015
Hyd. No. 7
back up in pond
Hydrograph type = Diversion2 Peak discharge = 35.21 cfsStorm frequency = 2 yrs Time to peak = 734 minTime interval = 2 min Hyd. volume = 111,515 cuftInflow hydrograph = 5 - To Pond 2nd diverted hyd. = 6Diversion method = Constant Q Constant Q = 1.05 cfs
0 120 240 360 480 600 720 840 960 1080 1200 1320 1440 1560
Q (cfs)
0.00 0.00
10.00 10.00
20.00 20.00
30.00 30.00
40.00 40.00
Q (cfs)
Time (min)
back up in pondHyd. No. 7 -- 2 Year
Hyd No. 7 -- > 1.05 cfs Hyd No. 5 -- Inflow Hyd No. 6
B - 28
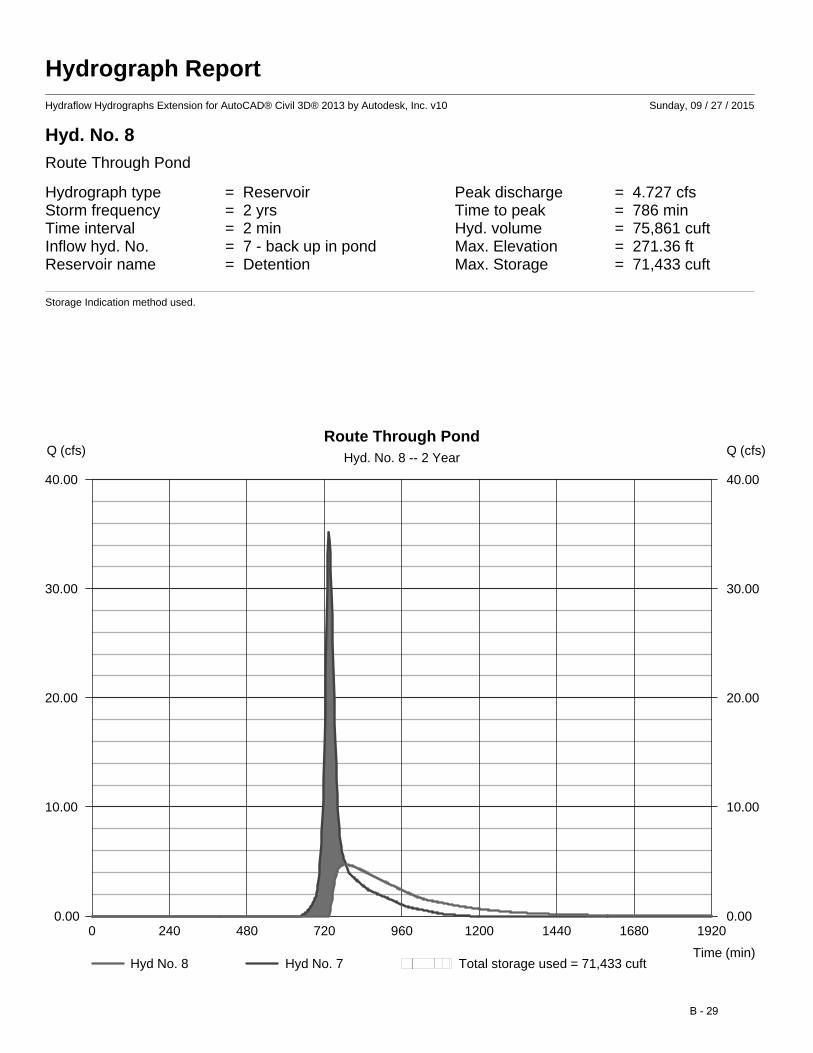
Hydrograph ReportHydraflow Hydrographs Extension for AutoCAD® Civil 3D® 2013 by Autodesk, Inc. v10 Sunday, 09 / 27 / 2015
Hyd. No. 8
Route Through Pond
Hydrograph type = Reservoir Peak discharge = 4.727 cfsStorm frequency = 2 yrs Time to peak = 786 minTime interval = 2 min Hyd. volume = 75,861 cuftInflow hyd. No. = 7 - back up in pond Max. Elevation = 271.36 ftReservoir name = Detention Max. Storage = 71,433 cuft
Storage Indication method used.
0 240 480 720 960 1200 1440 1680 1920
Q (cfs)
0.00 0.00
10.00 10.00
20.00 20.00
30.00 30.00
40.00 40.00
Q (cfs)
Time (min)
Route Through PondHyd. No. 8 -- 2 Year
Hyd No. 8 Hyd No. 7 Total storage used = 71,433 cuft
B - 29

Pond ReportHydraflow Hydrographs Extension for AutoCAD® Civil 3D® 2013 by Autodesk, Inc. v10 Sunday, 09 / 27 / 2015
Pond No. 1 - Detention
Pond DataContours -User-defined contour areas. Conic method used for volume calculation. Begining Elevation = 268.00 ft
Stage / Storage TableStage (ft) Elevation (ft) Contour area (sqft) Incr. Storage (cuft) Total storage (cuft)
0.00 268.00 11,426 0 00.80 268.80 12,609 9,609 9,6092.40 270.40 16,375 23,119 32,7292.60 270.60 39,500 5,420 38,1486.00 274.00 48,396 149,153 187,301
Culvert / Orifice Structures Weir Structures
[A] [B] [C] [PrfRsr] [A] [B] [C] [D]
Rise (in) = 10.00 12.00 0.00 0.00
Span (in) = 10.00 12.00 0.00 0.00
No. Barrels = 2 2 0 0
Invert El. (ft) = 268.80 270.50 0.00 0.00
Length (ft) = 1.00 0.00 0.00 0.00
Slope (%) = 1.00 0.00 0.00 n/a
N-Value = .013 .013 .013 n/a
Orifice Coeff. = 0.60 0.60 0.60 0.60
Multi-Stage = n/a No No No
Crest Len (ft) = 0.00 4.00 0.00 0.00
Crest El. (ft) = 271.00 272.00 0.00 0.00
Weir Coeff. = 3.03 3.33 3.33 3.33
Weir Type = 100 degV Rect --- ---
Multi-Stage = Yes No No No
Exfil.(in/hr) = 0.000 (by Contour)
TW Elev. (ft) = 0.00
Note: Culvert/Orifice outflows are analyzed under inlet (ic) and outlet (oc) control. Weir risers checked for orifice conditions (ic) and submergence (s).
Stage / Storage / Discharge TableStage Storage Elevation Clv A Clv B Clv C PrfRsr Wr A Wr B Wr C Wr D Exfil User Totalft cuft ft cfs cfs cfs cfs cfs cfs cfs cfs cfs cfs cfs
0.00 0 268.00 0.00 0.00 --- --- --- 0.00 --- --- --- --- 0.0000.80 9,609 268.80 0.00 0.00 --- --- --- 0.00 --- --- --- --- 0.0002.40 32,729 270.40 0.00 0.00 --- --- --- 0.00 --- --- --- --- 0.0002.60 38,148 270.60 0.00 0.09 ic --- --- --- 0.00 --- --- --- --- 0.0886.00 187,301 274.00 11.43 ic 13.10 ic --- --- 11.42 s 37.67 --- --- --- --- 62.19
B - 30
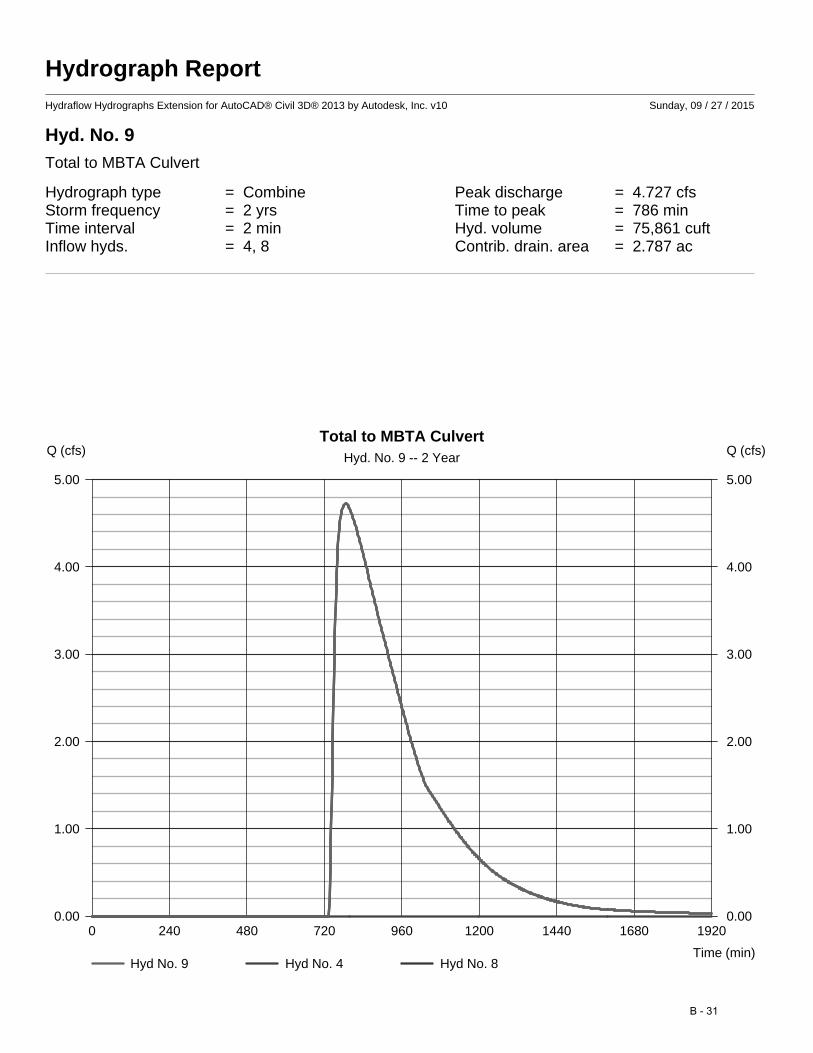
Hydrograph ReportHydraflow Hydrographs Extension for AutoCAD® Civil 3D® 2013 by Autodesk, Inc. v10 Sunday, 09 / 27 / 2015
Hyd. No. 9
Total to MBTA Culvert
Hydrograph type = Combine Peak discharge = 4.727 cfsStorm frequency = 2 yrs Time to peak = 786 minTime interval = 2 min Hyd. volume = 75,861 cuftInflow hyds. = 4, 8 Contrib. drain. area = 2.787 ac
0 240 480 720 960 1200 1440 1680 1920
Q (cfs)
0.00 0.00
1.00 1.00
2.00 2.00
3.00 3.00
4.00 4.00
5.00 5.00
Q (cfs)
Time (min)
Total to MBTA CulvertHyd. No. 9 -- 2 Year
Hyd No. 9 Hyd No. 4 Hyd No. 8
B - 31
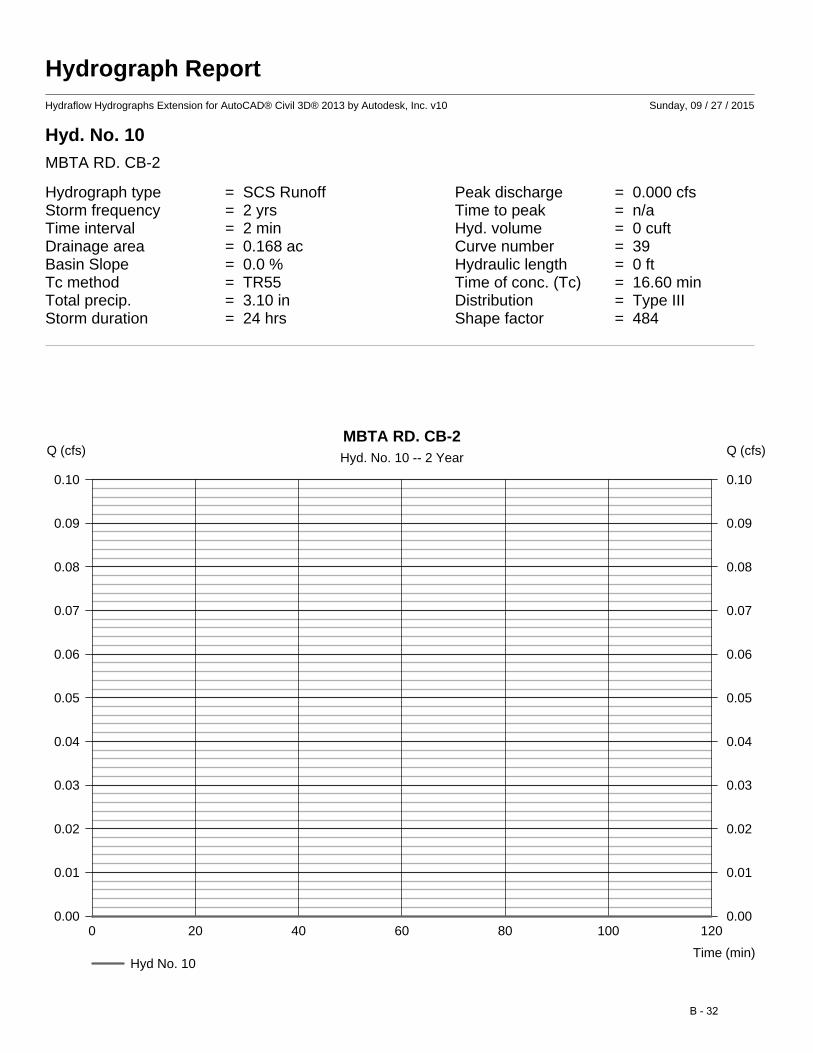
Hydrograph ReportHydraflow Hydrographs Extension for AutoCAD® Civil 3D® 2013 by Autodesk, Inc. v10 Sunday, 09 / 27 / 2015
Hyd. No. 10
MBTA RD. CB-2
Hydrograph type = SCS Runoff Peak discharge = 0.000 cfsStorm frequency = 2 yrs Time to peak = n/aTime interval = 2 min Hyd. volume = 0 cuftDrainage area = 0.168 ac Curve number = 39Basin Slope = 0.0 % Hydraulic length = 0 ftTc method = TR55 Time of conc. (Tc) = 16.60 minTotal precip. = 3.10 in Distribution = Type IIIStorm duration = 24 hrs Shape factor = 484
0 20 40 60 80 100 120
Q (cfs)
0.00 0.00
0.01 0.01
0.02 0.02
0.03 0.03
0.04 0.04
0.05 0.05
0.06 0.06
0.07 0.07
0.08 0.08
0.09 0.09
0.10 0.10
Q (cfs)
Time (min)
MBTA RD. CB-2Hyd. No. 10 -- 2 Year
Hyd No. 10
B - 32

TR55 Tc WorksheetHydraflow Hydrographs Extension for AutoCAD® Civil 3D® 2013 by Autodesk, Inc. v10
Hyd. No. 10
MBTA RD. CB-2
Description A B C Totals
Sheet FlowManning's n-value = 0.600 0.011 0.011Flow length (ft) = 50.0 0.0 0.0Two-year 24-hr precip. (in) = 3.10 0.00 0.00Land slope (%) = 5.40 0.00 0.00
Travel Time (min) = 11.65 + 0.00 + 0.00 = 11.65
Shallow Concentrated FlowFlow length (ft) = 750.00 515.00 0.00Watercourse slope (%) = 12.00 3.80 0.00Surface description = Unpaved Unpaved PavedAverage velocity (ft/s) =5.59 3.15 0.00
Travel Time (min) = 2.24 + 2.73 + 0.00 = 4.97
Channel FlowX sectional flow area (sqft) = 0.00 0.00 0.00Wetted perimeter (ft) = 0.00 0.00 0.00Channel slope (%) = 0.00 0.00 0.00Manning's n-value = 0.015 0.015 0.015Velocity (ft/s) =0.00
0.000.00
Flow length (ft) ({0})0.0 0.0 0.0
Travel Time (min) = 0.00 + 0.00 + 0.00 = 0.00
Total Travel Time, Tc .............................................................................. 16.60 min
B - 33

Hydrograph ReportHydraflow Hydrographs Extension for AutoCAD® Civil 3D® 2013 by Autodesk, Inc. v10 Sunday, 09 / 27 / 2015
Hyd. No. 11
MBTA RD. CB-3
Hydrograph type = SCS Runoff Peak discharge = 0.956 cfsStorm frequency = 2 yrs Time to peak = 746 minTime interval = 2 min Hyd. volume = 7,616 cuftDrainage area = 6.706 ac Curve number = 58.2Basin Slope = 0.0 % Hydraulic length = 0 ftTc method = TR55 Time of conc. (Tc) = 18.10 minTotal precip. = 3.10 in Distribution = Type IIIStorm duration = 24 hrs Shape factor = 484
0 120 240 360 480 600 720 840 960 1080 1200 1320 1440 1560
Q (cfs)
0.00 0.00
0.10 0.10
0.20 0.20
0.30 0.30
0.40 0.40
0.50 0.50
0.60 0.60
0.70 0.70
0.80 0.80
0.90 0.90
1.00 1.00
Q (cfs)
Time (min)
MBTA RD. CB-3Hyd. No. 11 -- 2 Year
Hyd No. 11
B - 34

TR55 Tc WorksheetHydraflow Hydrographs Extension for AutoCAD® Civil 3D® 2013 by Autodesk, Inc. v10
Hyd. No. 11
MBTA RD. CB-3
Description A B C Totals
Sheet FlowManning's n-value = 0.600 0.011 0.011Flow length (ft) = 50.0 0.0 0.0Two-year 24-hr precip. (in) = 3.10 0.00 0.00Land slope (%) = 3.00 0.00 0.00
Travel Time (min) = 14.74 + 0.00 + 0.00 = 14.74
Shallow Concentrated FlowFlow length (ft) = 1030.00 0.00 0.00Watercourse slope (%) = 10.00 0.00 0.00Surface description = Unpaved Paved PavedAverage velocity (ft/s) =5.10 0.00 0.00
Travel Time (min) = 3.36 + 0.00 + 0.00 = 3.36
Channel FlowX sectional flow area (sqft) = 0.00 0.00 0.00Wetted perimeter (ft) = 0.00 0.00 0.00Channel slope (%) = 0.00 0.00 0.00Manning's n-value = 0.015 0.015 0.015Velocity (ft/s) =0.00
0.000.00
Flow length (ft) ({0})0.0 0.0 0.0
Travel Time (min) = 0.00 + 0.00 + 0.00 = 0.00
Total Travel Time, Tc .............................................................................. 18.10 min
B - 35

Hydrograph ReportHydraflow Hydrographs Extension for AutoCAD® Civil 3D® 2013 by Autodesk, Inc. v10 Sunday, 09 / 27 / 2015
Hyd. No. 12
MBTA RD. DMH
Hydrograph type = SCS Runoff Peak discharge = 0.035 cfsStorm frequency = 2 yrs Time to peak = 930 minTime interval = 2 min Hyd. volume = 1,013 cuftDrainage area = 6.527 ac Curve number = 45.8Basin Slope = 0.0 % Hydraulic length = 0 ftTc method = TR55 Time of conc. (Tc) = 19.60 minTotal precip. = 3.10 in Distribution = Type IIIStorm duration = 24 hrs Shape factor = 484
0 120 240 360 480 600 720 840 960 1080 1200 1320 1440 1560
Q (cfs)
0.00 0.00
0.01 0.01
0.02 0.02
0.03 0.03
0.04 0.04
0.05 0.05
0.06 0.06
0.07 0.07
0.08 0.08
0.09 0.09
0.10 0.10
Q (cfs)
Time (min)
MBTA RD. DMHHyd. No. 12 -- 2 Year
Hyd No. 12
B - 36

TR55 Tc WorksheetHydraflow Hydrographs Extension for AutoCAD® Civil 3D® 2013 by Autodesk, Inc. v10
Hyd. No. 12
MBTA RD. DMH
Description A B C Totals
Sheet FlowManning's n-value = 0.600 0.011 0.011Flow length (ft) = 50.0 0.0 0.0Two-year 24-hr precip. (in) = 3.10 0.00 0.00Land slope (%) = 3.00 0.00 0.00
Travel Time (min) = 14.74 + 0.00 + 0.00 = 14.74
Shallow Concentrated FlowFlow length (ft) = 860.00 610.00 0.00Watercourse slope (%) = 11.00 8.20 0.00Surface description = Unpaved Unpaved PavedAverage velocity (ft/s) =5.35 4.62 0.00
Travel Time (min) = 2.68 + 2.20 + 0.00 = 4.88
Channel FlowX sectional flow area (sqft) = 0.00 0.00 0.00Wetted perimeter (ft) = 0.00 0.00 0.00Channel slope (%) = 0.00 0.00 0.00Manning's n-value = 0.015 0.015 0.015Velocity (ft/s) =0.00
0.000.00
Flow length (ft) ({0})0.0 0.0 0.0
Travel Time (min) = 0.00 + 0.00 + 0.00 = 0.00
Total Travel Time, Tc .............................................................................. 19.60 min
B - 37
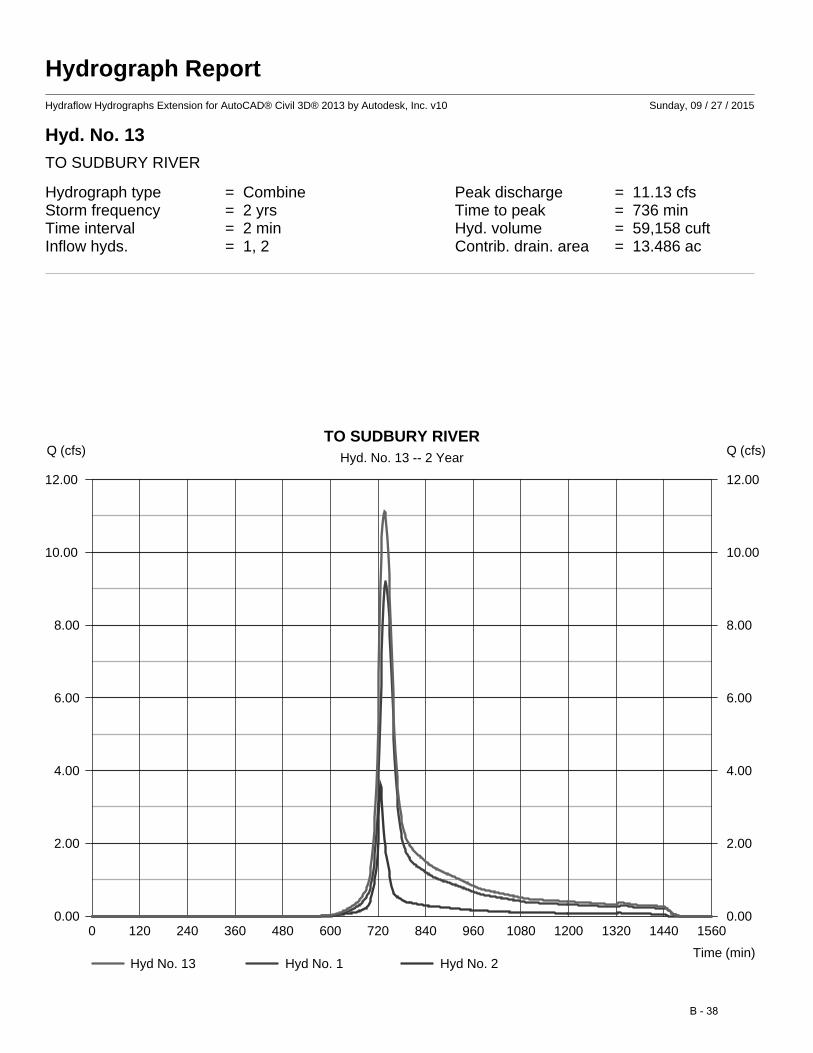
Hydrograph ReportHydraflow Hydrographs Extension for AutoCAD® Civil 3D® 2013 by Autodesk, Inc. v10 Sunday, 09 / 27 / 2015
Hyd. No. 13
TO SUDBURY RIVER
Hydrograph type = Combine Peak discharge = 11.13 cfsStorm frequency = 2 yrs Time to peak = 736 minTime interval = 2 min Hyd. volume = 59,158 cuftInflow hyds. = 1, 2 Contrib. drain. area = 13.486 ac
0 120 240 360 480 600 720 840 960 1080 1200 1320 1440 1560
Q (cfs)
0.00 0.00
2.00 2.00
4.00 4.00
6.00 6.00
8.00 8.00
10.00 10.00
12.00 12.00
Q (cfs)
Time (min)
TO SUDBURY RIVERHyd. No. 13 -- 2 Year
Hyd No. 13 Hyd No. 1 Hyd No. 2
B - 38

Hydrograph ReportHydraflow Hydrographs Extension for AutoCAD® Civil 3D® 2013 by Autodesk, Inc. v10 Sunday, 09 / 27 / 2015
Hyd. No. 14
TO NORTHERLY WETLANDS
Hydrograph type = Combine Peak discharge = 5.310 cfsStorm frequency = 2 yrs Time to peak = 778 minTime interval = 2 min Hyd. volume = 89,023 cuftInflow hyds. = 3, 9, 10 Contrib. drain. area = 6.224 ac
0 120 240 360 480 600 720 840 960 1080 1200 1320 1440 1560 1680 1800
Q (cfs)
0.00 0.00
1.00 1.00
2.00 2.00
3.00 3.00
4.00 4.00
5.00 5.00
6.00 6.00
Q (cfs)
Time (min)
TO NORTHERLY WETLANDSHyd. No. 14 -- 2 Year
Hyd No. 14 Hyd No. 3 Hyd No. 9 Hyd No. 10
B - 39

Hydrograph ReportHydraflow Hydrographs Extension for AutoCAD® Civil 3D® 2013 by Autodesk, Inc. v10 Sunday, 09 / 27 / 2015
Hyd. No. 1
TO HIGH ST. CULVERT
Hydrograph type = SCS Runoff Peak discharge = 31.68 cfsStorm frequency = 100 yrs Time to peak = 738 minTime interval = 2 min Hyd. volume = 156,294 cuftDrainage area = 10.870 ac Curve number = 78Basin Slope = 0.0 % Hydraulic length = 0 ftTc method = TR55 Time of conc. (Tc) = 24.69 minTotal precip. = 6.50 in Distribution = Type IIIStorm duration = 24 hrs Shape factor = 484
0 120 240 360 480 600 720 840 960 1080 1200 1320 1440 1560
Q (cfs)
0.00 0.00
5.00 5.00
10.00 10.00
15.00 15.00
20.00 20.00
25.00 25.00
30.00 30.00
35.00 35.00
Q (cfs)
Time (min)
TO HIGH ST. CULVERTHyd. No. 1 -- 100 Year
Hyd No. 1
B - 40
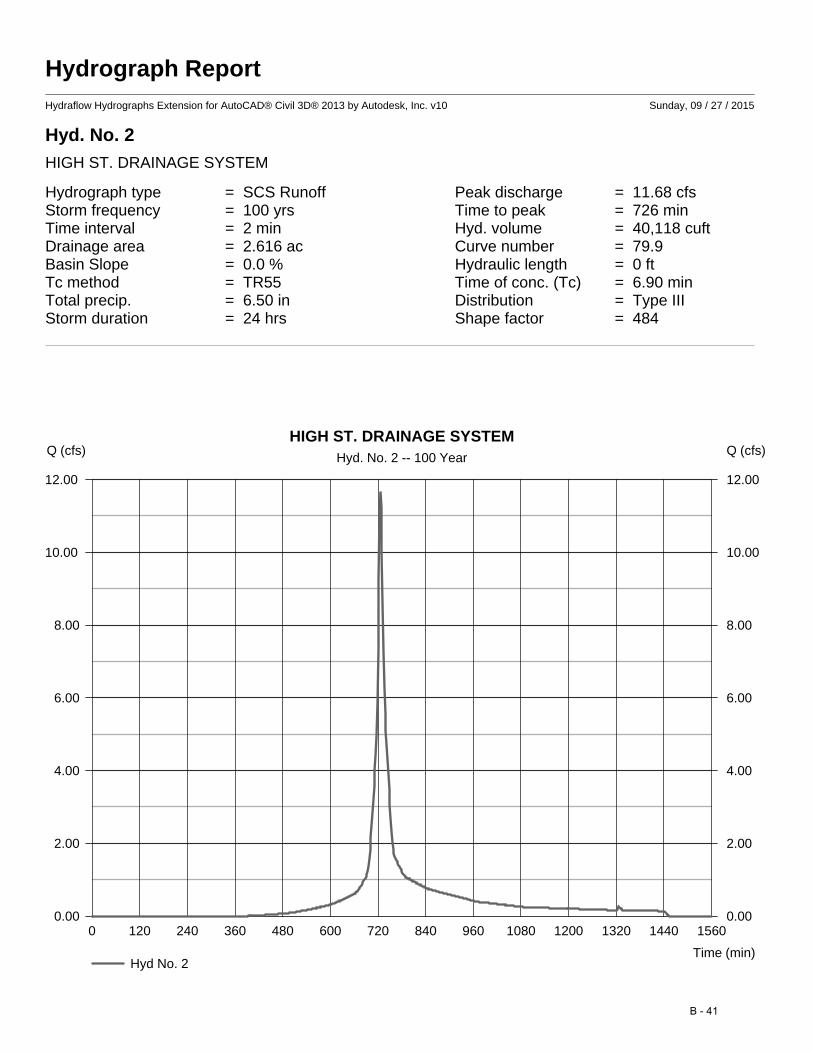
Hydrograph ReportHydraflow Hydrographs Extension for AutoCAD® Civil 3D® 2013 by Autodesk, Inc. v10 Sunday, 09 / 27 / 2015
Hyd. No. 2
HIGH ST. DRAINAGE SYSTEM
Hydrograph type = SCS Runoff Peak discharge = 11.68 cfsStorm frequency = 100 yrs Time to peak = 726 minTime interval = 2 min Hyd. volume = 40,118 cuftDrainage area = 2.616 ac Curve number = 79.9Basin Slope = 0.0 % Hydraulic length = 0 ftTc method = TR55 Time of conc. (Tc) = 6.90 minTotal precip. = 6.50 in Distribution = Type IIIStorm duration = 24 hrs Shape factor = 484
0 120 240 360 480 600 720 840 960 1080 1200 1320 1440 1560
Q (cfs)
0.00 0.00
2.00 2.00
4.00 4.00
6.00 6.00
8.00 8.00
10.00 10.00
12.00 12.00
Q (cfs)
Time (min)
HIGH ST. DRAINAGE SYSTEMHyd. No. 2 -- 100 Year
Hyd No. 2
B - 41

Hydrograph ReportHydraflow Hydrographs Extension for AutoCAD® Civil 3D® 2013 by Autodesk, Inc. v10 Sunday, 09 / 27 / 2015
Hyd. No. 3
MBTA RD. CB-1
Hydrograph type = SCS Runoff Peak discharge = 14.89 cfsStorm frequency = 100 yrs Time to peak = 732 minTime interval = 2 min Hyd. volume = 61,405 cuftDrainage area = 6.056 ac Curve number = 66.5Basin Slope = 0.0 % Hydraulic length = 0 ftTc method = TR55 Time of conc. (Tc) = 13.60 minTotal precip. = 6.50 in Distribution = Type IIIStorm duration = 24 hrs Shape factor = 484
0 120 240 360 480 600 720 840 960 1080 1200 1320 1440 1560
Q (cfs)
0.00 0.00
3.00 3.00
6.00 6.00
9.00 9.00
12.00 12.00
15.00 15.00
Q (cfs)
Time (min)
MBTA RD. CB-1Hyd. No. 3 -- 100 Year
Hyd No. 3
B - 42

Hydrograph ReportHydraflow Hydrographs Extension for AutoCAD® Civil 3D® 2013 by Autodesk, Inc. v10 Sunday, 09 / 27 / 2015
Hyd. No. 4
MBTA RD. CULVERT -direct
Hydrograph type = SCS Runoff Peak discharge = 0.242 cfsStorm frequency = 100 yrs Time to peak = 746 minTime interval = 2 min Hyd. volume = 3,302 cuftDrainage area = 2.787 ac Curve number = 34.3Basin Slope = 0.0 % Hydraulic length = 0 ftTc method = TR55 Time of conc. (Tc) = 7.36 minTotal precip. = 6.50 in Distribution = Type IIIStorm duration = 24 hrs Shape factor = 484
0 120 240 360 480 600 720 840 960 1080 1200 1320 1440 1560
Q (cfs)
0.00 0.00
0.05 0.05
0.10 0.10
0.15 0.15
0.20 0.20
0.25 0.25
0.30 0.30
0.35 0.35
0.40 0.40
0.45 0.45
0.50 0.50
Q (cfs)
Time (min)
MBTA RD. CULVERT -directHyd. No. 4 -- 100 Year
Hyd No. 4
B - 43

Hydrograph ReportHydraflow Hydrographs Extension for AutoCAD® Civil 3D® 2013 by Autodesk, Inc. v10 Sunday, 09 / 27 / 2015
Hyd. No. 5
To Pond
Hydrograph type = SCS Runoff Peak discharge = 112.09 cfsStorm frequency = 100 yrs Time to peak = 732 minTime interval = 2 min Hyd. volume = 498,897 cuftDrainage area = 31.343 ac Curve number = 81.4Basin Slope = 0.0 % Hydraulic length = 0 ftTc method = TR55 Time of conc. (Tc) = 19.52 minTotal precip. = 6.50 in Distribution = Type IIIStorm duration = 24 hrs Shape factor = 484
0 120 240 360 480 600 720 840 960 1080 1200 1320 1440 1560
Q (cfs)
0.00 0.00
20.00 20.00
40.00 40.00
60.00 60.00
80.00 80.00
100.00 100.00
120.00 120.00
Q (cfs)
Time (min)
To PondHyd. No. 5 -- 100 Year
Hyd No. 5
B - 44

Hydrograph ReportHydraflow Hydrographs Extension for AutoCAD® Civil 3D® 2013 by Autodesk, Inc. v10 Sunday, 09 / 27 / 2015
Hyd. No. 6
Recharge @ 4.0 in/hr
Hydrograph type = Diversion1 Peak discharge = 1.050 cfsStorm frequency = 100 yrs Time to peak = 722 minTime interval = 2 min Hyd. volume = 64,295 cuftInflow hydrograph = 5 - To Pond 2nd diverted hyd. = 7Diversion method = Constant Q Constant Q = 1.05 cfs
0 120 240 360 480 600 720 840 960 1080 1200 1320 1440 1560
Q (cfs)
0.00 0.00
20.00 20.00
40.00 40.00
60.00 60.00
80.00 80.00
100.00 100.00
120.00 120.00
Q (cfs)
Time (min)
Recharge @ 4.0 in/hrHyd. No. 6 -- 100 Year
Hyd No. 6 -- Up to 1.05 cfs Hyd No. 5 -- Inflow Hyd No. 7 -- 5 minus 6
B - 45
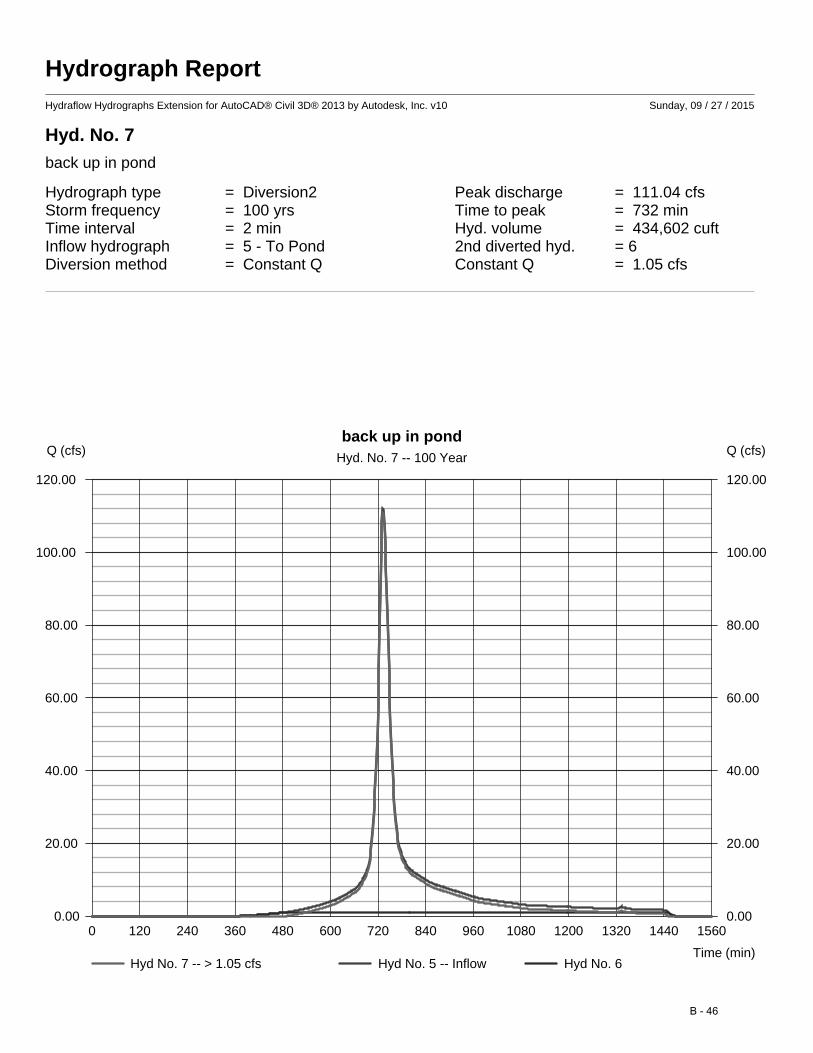
Hydrograph ReportHydraflow Hydrographs Extension for AutoCAD® Civil 3D® 2013 by Autodesk, Inc. v10 Sunday, 09 / 27 / 2015
Hyd. No. 7
back up in pond
Hydrograph type = Diversion2 Peak discharge = 111.04 cfsStorm frequency = 100 yrs Time to peak = 732 minTime interval = 2 min Hyd. volume = 434,602 cuftInflow hydrograph = 5 - To Pond 2nd diverted hyd. = 6Diversion method = Constant Q Constant Q = 1.05 cfs
0 120 240 360 480 600 720 840 960 1080 1200 1320 1440 1560
Q (cfs)
0.00 0.00
20.00 20.00
40.00 40.00
60.00 60.00
80.00 80.00
100.00 100.00
120.00 120.00
Q (cfs)
Time (min)
back up in pondHyd. No. 7 -- 100 Year
Hyd No. 7 -- > 1.05 cfs Hyd No. 5 -- Inflow Hyd No. 6
B - 46

Hydrograph ReportHydraflow Hydrographs Extension for AutoCAD® Civil 3D® 2013 by Autodesk, Inc. v10 Sunday, 09 / 27 / 2015
Hyd. No. 8
Route Through Pond
Hydrograph type = Reservoir Peak discharge = 57.14 cfsStorm frequency = 100 yrs Time to peak = 750 minTime interval = 2 min Hyd. volume = 398,917 cuftInflow hyd. No. = 7 - back up in pond Max. Elevation = 273.84 ftReservoir name = Detention Max. Storage = 180,057 cuft
Storage Indication method used.
0 120 240 360 480 600 720 840 960 1080 1200 1320 1440 1560 1680
Q (cfs)
0.00 0.00
20.00 20.00
40.00 40.00
60.00 60.00
80.00 80.00
100.00 100.00
120.00 120.00
Q (cfs)
Time (min)
Route Through PondHyd. No. 8 -- 100 Year
Hyd No. 8 Hyd No. 7 Total storage used = 180,057 cuft
B - 47

Hydrograph ReportHydraflow Hydrographs Extension for AutoCAD® Civil 3D® 2013 by Autodesk, Inc. v10 Sunday, 09 / 27 / 2015
Hyd. No. 9
Total to MBTA Culvert
Hydrograph type = Combine Peak discharge = 57.37 cfsStorm frequency = 100 yrs Time to peak = 750 minTime interval = 2 min Hyd. volume = 402,219 cuftInflow hyds. = 4, 8 Contrib. drain. area = 2.787 ac
0 120 240 360 480 600 720 840 960 1080 1200 1320 1440 1560 1680
Q (cfs)
0.00 0.00
10.00 10.00
20.00 20.00
30.00 30.00
40.00 40.00
50.00 50.00
60.00 60.00
Q (cfs)
Time (min)
Total to MBTA CulvertHyd. No. 9 -- 100 Year
Hyd No. 9 Hyd No. 4 Hyd No. 8
B - 48
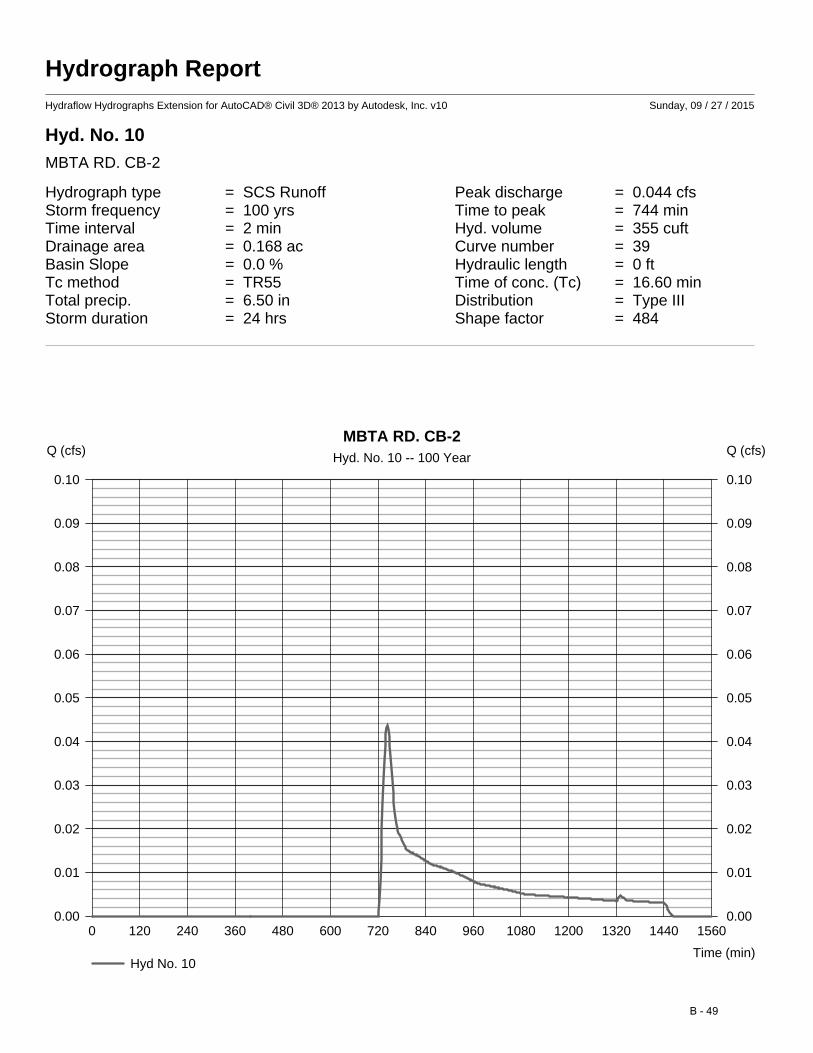
Hydrograph ReportHydraflow Hydrographs Extension for AutoCAD® Civil 3D® 2013 by Autodesk, Inc. v10 Sunday, 09 / 27 / 2015
Hyd. No. 10
MBTA RD. CB-2
Hydrograph type = SCS Runoff Peak discharge = 0.044 cfsStorm frequency = 100 yrs Time to peak = 744 minTime interval = 2 min Hyd. volume = 355 cuftDrainage area = 0.168 ac Curve number = 39Basin Slope = 0.0 % Hydraulic length = 0 ftTc method = TR55 Time of conc. (Tc) = 16.60 minTotal precip. = 6.50 in Distribution = Type IIIStorm duration = 24 hrs Shape factor = 484
0 120 240 360 480 600 720 840 960 1080 1200 1320 1440 1560
Q (cfs)
0.00 0.00
0.01 0.01
0.02 0.02
0.03 0.03
0.04 0.04
0.05 0.05
0.06 0.06
0.07 0.07
0.08 0.08
0.09 0.09
0.10 0.10
Q (cfs)
Time (min)
MBTA RD. CB-2Hyd. No. 10 -- 100 Year
Hyd No. 10
B - 49

Hydrograph ReportHydraflow Hydrographs Extension for AutoCAD® Civil 3D® 2013 by Autodesk, Inc. v10 Sunday, 09 / 27 / 2015
Hyd. No. 11
MBTA RD. CB-3
Hydrograph type = SCS Runoff Peak discharge = 10.90 cfsStorm frequency = 100 yrs Time to peak = 734 minTime interval = 2 min Hyd. volume = 50,968 cuftDrainage area = 6.706 ac Curve number = 58.2Basin Slope = 0.0 % Hydraulic length = 0 ftTc method = TR55 Time of conc. (Tc) = 18.10 minTotal precip. = 6.50 in Distribution = Type IIIStorm duration = 24 hrs Shape factor = 484
0 120 240 360 480 600 720 840 960 1080 1200 1320 1440 1560
Q (cfs)
0.00 0.00
2.00 2.00
4.00 4.00
6.00 6.00
8.00 8.00
10.00 10.00
12.00 12.00
Q (cfs)
Time (min)
MBTA RD. CB-3Hyd. No. 11 -- 100 Year
Hyd No. 11
B - 50

Hydrograph ReportHydraflow Hydrographs Extension for AutoCAD® Civil 3D® 2013 by Autodesk, Inc. v10 Sunday, 09 / 27 / 2015
Hyd. No. 12
MBTA RD. DMH
Hydrograph type = SCS Runoff Peak discharge = 4.292 cfsStorm frequency = 100 yrs Time to peak = 740 minTime interval = 2 min Hyd. volume = 25,348 cuftDrainage area = 6.527 ac Curve number = 45.8Basin Slope = 0.0 % Hydraulic length = 0 ftTc method = TR55 Time of conc. (Tc) = 19.60 minTotal precip. = 6.50 in Distribution = Type IIIStorm duration = 24 hrs Shape factor = 484
0 120 240 360 480 600 720 840 960 1080 1200 1320 1440 1560
Q (cfs)
0.00 0.00
1.00 1.00
2.00 2.00
3.00 3.00
4.00 4.00
5.00 5.00
Q (cfs)
Time (min)
MBTA RD. DMHHyd. No. 12 -- 100 Year
Hyd No. 12
B - 51

Hydrograph ReportHydraflow Hydrographs Extension for AutoCAD® Civil 3D® 2013 by Autodesk, Inc. v10 Sunday, 09 / 27 / 2015
Hyd. No. 13
TO SUDBURY RIVER
Hydrograph type = Combine Peak discharge = 37.84 cfsStorm frequency = 100 yrs Time to peak = 734 minTime interval = 2 min Hyd. volume = 196,412 cuftInflow hyds. = 1, 2 Contrib. drain. area = 13.486 ac
0 120 240 360 480 600 720 840 960 1080 1200 1320 1440 1560
Q (cfs)
0.00 0.00
10.00 10.00
20.00 20.00
30.00 30.00
40.00 40.00
Q (cfs)
Time (min)
TO SUDBURY RIVERHyd. No. 13 -- 100 Year
Hyd No. 13 Hyd No. 1 Hyd No. 2
B - 52

Hydrograph ReportHydraflow Hydrographs Extension for AutoCAD® Civil 3D® 2013 by Autodesk, Inc. v10 Sunday, 09 / 27 / 2015
Hyd. No. 14
TO NORTHERLY WETLANDS
Hydrograph type = Combine Peak discharge = 64.52 cfsStorm frequency = 100 yrs Time to peak = 748 minTime interval = 2 min Hyd. volume = 463,979 cuftInflow hyds. = 3, 9, 10 Contrib. drain. area = 6.224 ac
0 120 240 360 480 600 720 840 960 1080 1200 1320 1440 1560
Q (cfs)
0.00 0.00
10.00 10.00
20.00 20.00
30.00 30.00
40.00 40.00
50.00 50.00
60.00 60.00
70.00 70.00
Q (cfs)
Time (min)
TO NORTHERLY WETLANDSHyd. No. 14 -- 100 Year
Hyd No. 14 Hyd No. 3 Hyd No. 9 Hyd No. 10
B - 53

Hydrograph ReportHydraflow Hydrographs Extension for AutoCAD® Civil 3D® 2013 by Autodesk, Inc. v10 Sunday, 09 / 27 / 2015
Hyd. No. 15
TO EASTERLY WETLANDS
Hydrograph type = Combine Peak discharge = 15.02 cfsStorm frequency = 100 yrs Time to peak = 736 minTime interval = 2 min Hyd. volume = 76,317 cuftInflow hyds. = 11, 12 Contrib. drain. area = 13.233 ac
0 120 240 360 480 600 720 840 960 1080 1200 1320 1440 1560
Q (cfs)
0.00 0.00
3.00 3.00
6.00 6.00
9.00 9.00
12.00 12.00
15.00 15.00
18.00 18.00
Q (cfs)
Time (min)
TO EASTERLY WETLANDSHyd. No. 15 -- 100 Year
Hyd No. 15 Hyd No. 11 Hyd No. 12
B - 54

Hydraflow Rainfall ReportHydraflow Hydrographs Extension for AutoCAD® Civil 3D® 2013 by Autodesk, Inc. v10 Sunday, 09 / 27 / 2015
Return Intensity-Duration-Frequency Equation Coefficients (FHA)Period
(Yrs) B D E (N/A)
1 0.0000 0.0000 0.0000 --------
2 42.4120 9.2500 0.7886 --------
3 0.0000 0.0000 0.0000 --------
5 56.7673 11.0000 0.7948 --------
10 67.9290 12.0000 0.8012 --------
25 85.5668 13.2500 0.8118 --------
50 97.8027 13.7500 0.8148 --------
100 112.8269 14.5000 0.8222 --------
File name: Sample.IDF
Intensity = B / (Tc + D)^E
Return Intensity Values (in/hr)Period
(Yrs) 5 min 10 15 20 25 30 35 40 45 50 55 60
1 0.00 0.00 0.00 0.00 0.00 0.00 0.00 0.00 0.00 0.00 0.00 0.00
2 5.22 4.12 3.43 2.96 2.61 2.35 2.14 1.96 1.82 1.70 1.59 1.50
3 0.00 0.00 0.00 0.00 0.00 0.00 0.00 0.00 0.00 0.00 0.00 0.00
5 6.27 5.05 4.26 3.70 3.29 2.97 2.71 2.49 2.32 2.16 2.03 1.92
10 7.02 5.71 4.84 4.23 3.76 3.40 3.11 2.87 2.66 2.49 2.34 2.21
25 8.10 6.65 5.68 4.98 4.44 4.02 3.68 3.39 3.16 2.95 2.78 2.62
50 8.98 7.40 6.34 5.56 4.97 4.50 4.12 3.81 3.54 3.31 3.11 2.94
100 9.81 8.13 6.98 6.14 5.49 4.98 4.56 4.22 3.92 3.67 3.45 3.26
Tc = time in minutes. Values may exceed 60.
Rainfall Precipitation Table (in)
Precip. file name: Sample.pcp
StormDistribution 1-yr 2-yr 3-yr 5-yr 10-yr 25-yr 50-yr 100-yr
SCS 24-hour 2.50 3.10 0.00 3.30 4.50 5.30 5.90 6.50
SCS 6-Hr 0.00 0.00 0.00 0.00 0.00 0.00 0.00 0.00
Huff-1st 0.00 0.00 0.00 2.75 0.00 0.00 0.00 0.00
Huff-2nd 0.00 0.00 0.00 0.00 0.00 0.00 0.00 0.00
Huff-3rd 0.00 0.00 0.00 0.00 0.00 0.00 0.00 0.00
Huff-4th 0.00 0.00 0.00 0.00 0.00 0.00 0.00 0.00
Huff-Indy 0.00 0.00 0.00 2.75 0.00 0.00 0.00 0.00
Custom 0.00 0.00 0.00 2.80 0.00 0.00 0.00 0.00
B - 55

KELLY ENGINEERING GROUP, INC. Zero Campanelli Drive-Braintree-MA 02184 Phone 781 843 4333
Attachment C
Recharge Systems

Required Recharge Volume Total Impervious Area on site = 543,985 s.f. 155,778 s.f. within Group A Soils 388,207 s.f. within Group D Soils Group A Required Volume = .6 * 155,778 * 1/12 = 7,789 cu ft. Group D Required Volume = .1 * 388,207 * 1/12 = 3,235 cu .ft. Total Volume Required = 11,024 cu. ft. Provided:
1) 9 ea. Cultec subsurface recharge systems. Each system has 16 chambers. 6 Systems in D soils with a dedicated recharge volume of 265 cu.ft. = 1,590 cu.ft. 3 Systems in A soils with a dedicated recharge volume of 448 cu.ft = 1,344 cu.ft Total in Recharge Chambers: = 2,934 See attached Cultec Calculator and details for additional information.
2) Volume in Stormwater Management Pond = 9,609 cu. ft.
See attached Stage Storage calculation:
Total Provided = 12,543cu.ft. Drain Down Time: 72 hour drain down time is required Group D soils = .09 in/hr Group A soils = 4.0 in/hr Cultech Systems: Each system is 62.5’ x 8.33’ = 521 s.f. Group D soils: 521 s.f. *.09 in/hr *1/12 = 3.91 cu.ft./hr 265 cu.ft /3.91 cu.ft/hr = 67 hours Group A soils: 521 s.f. * 4.0 in/hr *1/12 = 173.7 447 cu.ft/ 173.7 = 2.6 hours Recharge Pond: 12,609 s.f * 4 in/hr *1/12 = 4,203 cu.ft/ hr = 1.17 CFS 12,609 cu.ft/ 4,203 cu.ft./hr = 3.0 hours
C-1

Prepared For: Project Information: Engineer: Calculations Performed By:Name Name Ashland Name NameCompany Name Street Address Company Name Company NameStreet Address City Street Address Street AddressCity State Zip City CityState Zip State Zip State ZipPhone Date: Phone PhoneFax Fax FaxEmail Email Email
Input Given Parameters Chamber SpecificationsUnit of Measure English 12.5 inchesSelect Model 36.00 inches
8.00 feetStone Porosity 40.0% 7.50 feetNumber of Header Systems 1 Header 14.00 cu. feetStone Depth Above Chamber 6 inches 28.81 cu. feetStone Depth Below Chamber 6 inches
Workable Bed Depth 10.00 feet 2.96 feetMax. Bed Width 10.00 feet 8.33 feetStorage Volume Required 500.00 cu. feet 560.88 cu. feet
Materials List
Contactor 100HD Stormwater System by CULTEC, Inc.
17 pieces 1 pieces16 pieces 162.67 sq. yards2 pieces 8.33 feet0 pieces 31.02 cu. yards
14 pieces 57.07 cu. yards
Bed Detail
Number of Rows Wide 2 piecesNumber of Chambers Long 8 pieces
Chamber Row Width 6.33 feetChamber Row Length 60.50 feet
Bed Width 8.33 feetBed Length 62.50 feet
Bed Area Required 520.83 sq. feet
Bed detail for reference only. Not project specific. Not to scale. Use CULTEC StormGenie to output project specific detail.
Image for visual reference only.May not reflect selected model.
HeightWidthLength
Installed LengthBare Chamber Volume
Installed Chamber Volume
Approx. Unit Count - not for construction
Actual Number of Chambers RequiredStarter Chambers
Intermediate Chambers
Contactor 100HD
HVLV SFCx2
Bed DepthBed Width
Storage Volume Provided
(mm/dd)
Stone
CULTEC No. 410™ Filter FabricCULTEC No. 20L Polyethylene Liner
End Chambers Volume of Excavation
CULTEC, Inc.P.O. Box 280, Brookfield, CT 06804 USA Phone: 203-775-4416 - Fax: 203-775-1462 - www.cultec.com
Copyright 1996-2012 CULTEC, Inc. - All rights reservedCULTEC SDC v. 2012-02
C-2

Project Name: Name Date:
Cross Section Detail
3 inches8 inches6 inches
12.5 inches6 inches
24.5 inches35.5 inches
Conceptual graphic only. Not job specific.
A 6.0 inchesB 12.5 inches Contactor 100HD Stormwater SystemC 6.0 inches 225.79 cu. feetD 8.0 inches 0.10 cu. feetE 14.0 feet 334.99 cu. feetF 36.0 inches 560.88 cu. feetG 3.33 feet
Breakdown of Storage Provided by
Stone BelowChamber Height
Stone Above95% Compacted Fill
(mm/dd)
Contactor 100HD
Bed Depth
Pavement
Total Storage ProvidedStone
Feed ConnectorsChambers
Depth of Stone Base
Effective Depth
Center to Center SpacingChamber Width
Max. Depth of Cover Allowed Above Crown of ChamberDepth of 95% Compacted FillDepth of Stone Above Units
Chamber Height
CULTEC, Inc.P.O. Box 280, Brookfield, CT 06804 USA Phone: 203-775-4416 - Fax: 203-775-1462 - www.cultec.com
Copyright 1996-2012 CULTEC, Inc. - All rights reservedCULTEC SDC v. 2012-02
C-3

CULTEC, Inc.P.O. Box 280Brookfield, CT 06804
Phone: 203-775-4416Fax: 203-775-1462www.cultec.com
Number of chambers - 16 Given:Stone Void - 0.40Base of Stone Elevation - 1.00Stone Border Lenth 136.00
Width 0.90
Height of System (in)
Chamber Ht (in)
Incremental
Chamber (ft3)
cumulative storage per chamber alone
(ft3)
cumulative storage per chamber alone
(m3)
Incremental
Stone (ft3)
Incremental Chamber &
Stone (ft3)
Cumulative Storage per
Chamber (ft3)
Cumulative Storage for
System (ft3)
Elevation Stone BorderCummulative stone border
Total System
24.5 0.000 0.83 0.83 28.81 461.02 3.04 4.08 99.96 560.9823.5 0.000 0.83 0.83 27.98 447.69 2.96 4.08 95.88 543.5722.5 0.000 0.83 0.83 27.15 434.35 2.88 4.08 91.8 526.1521.5 0.000 0.83 0.83 26.31 421.02 2.79 4.08 87.72 508.7420.5 0.000 0.83 0.83 25.48 407.69 2.71 4.08 83.64 491.3319.5 0.000 0.83 0.83 24.65 394.35 2.63 4.08 79.56 473.9118.5 12.5 0.000 0.42 0.42 23.81 381.02 2.54 2.04 75.48 456.5018 12 0.068 13.995 0.396 0.81 0.87 23.40 374.35 2.50 4.08 73.44 447.79 Dedicated storage for blds 4-917 11 0.503 13.928 0.394 0.63 1.13 22.52 360.37 2.42 4.08 69.36 429.7316 10 0.825 13.425 0.380 0.50 1.33 21.39 342.21 2.33 4.08 65.28 407.4915 9 1.043 12.600 0.357 0.42 1.46 20.06 320.96 2.25 4.08 61.2 382.1614 8 1.193 11.558 0.327 0.36 1.55 18.60 297.62 2.17 4.08 57.12 354.7413 7 1.305 10.365 0.294 0.31 1.62 17.05 272.84 2.08 4.08 53.04 325.8812 6 1.380 9.060 0.257 0.28 1.66 15.44 246.98 2.00 4.08 48.96 295.9411 5 1.440 7.680 0.217 0.26 1.70 13.77 220.39 1.92 4.08 44.88 265.27 Dedicated storage for blds 1-310 4 1.523 6.240 0.177 0.22 1.75 12.08 193.24 1.83 4.08 40.8 234.049 3 1.523 4.718 0.134 0.22 1.75 10.33 165.29 1.75 4.08 36.72 202.018 2 1.523 3.195 0.090 0.22 1.75 8.58 137.34 1.67 4.08 32.64 169.987 1 1.673 1.673 0.047 0.16 1.84 6.84 109.39 1.58 4.08 28.56 137.956 0.000 0.83 0.83 5.00 80.00 1.50 4.08 24.48 104.485 0.000 0.83 0.83 4.17 66.67 1.42 4.08 20.4 87.074 0.000 0.83 0.83 3.33 53.33 1.33 4.08 16.32 69.653 0.000 0.83 0.83 2.50 40.00 1.25 4.08 12.24 52.242 0.000 0.83 0.83 1.67 26.67 1.17 4.08 8.16 34.831 0.000 0.83 0.83 0.83 13.33 1.08 4.08 4.08 17.41
TOTALS 13.995 14.82 28.81 28.81 461.02 560.98
CULTEC Contactor 100HD Incremental Storage Volumes
6" stone base6" stone above units40" center to center
Created on: 9/29/2015 Copyright 2008 CULTEC, Inc. All Rights Reserved
C-4

Pond ReportHydraflow Hydrographs Extension for AutoCAD® Civil 3D® 2013 by Autodesk, Inc. v10 Monday, 09 / 28 / 2015
Pond No. 1 - DetentionPond DataContours -User-defined contour areas. Conic method used for volume calculation. Begining Elevation = 268.00 ft
Stage / Storage TableStage (ft) Elevation (ft) Contour area (sqft) Incr. Storage (cuft) Total storage (cuft)
0.00 268.00 11,426 0 00.80 268.80 12,609 9,609 9,6092.40 270.40 16,375 23,119 32,7292.60 270.60 39,500 5,420 38,1486.00 274.00 48,396 149,153 187,301
Culvert / Orifice Structures Weir Structures
[A] [B] [C] [PrfRsr] [A] [B] [C] [D]Rise (in) = 10.00 12.00 0.00 0.00Span (in) = 10.00 12.00 0.00 0.00No. Barrels = 2 2 0 0Invert El. (ft) = 268.80 270.50 0.00 0.00Length (ft) = 1.00 0.00 0.00 0.00Slope (%) = 1.00 0.00 0.00 n/aN-Value = .013 .013 .013 n/aOrifice Coeff. = 0.60 0.60 0.60 0.60Multi-Stage = n/a No No No
Crest Len (ft) = 0.00 4.00 0.00 0.00Crest El. (ft) = 271.00 272.00 0.00 0.00Weir Coeff. = 3.03 3.33 3.33 3.33Weir Type = 100 degV Rect --- ---Multi-Stage = Yes No No No
Exfil.(in/hr) = 0.000 (by Contour)TW Elev. (ft) = 0.00
Note: Culvert/Orifice outflows are analyzed under inlet (ic) and outlet (oc) control. Weir risers checked for orifice conditions (ic) and submergence (s).
Stage / Storage / Discharge TableStage Storage Elevation Clv A Clv B Clv C PrfRsr Wr A Wr B Wr C Wr D Exfil User Totalft cuft ft cfs cfs cfs cfs cfs cfs cfs cfs cfs cfs cfs
0.00 0 268.00 0.00 0.00 --- --- --- 0.00 --- --- --- --- 0.0000.80 9,609 268.80 0.00 0.00 --- --- --- 0.00 --- --- --- --- 0.0002.40 32,729 270.40 0.00 0.00 --- --- --- 0.00 --- --- --- --- 0.0002.60 38,148 270.60 0.00 0.09 ic --- --- --- 0.00 --- --- --- --- 0.0886.00 187,301 274.00 11.43 ic 13.10 ic --- --- 11.42 s 37.67 --- --- --- --- 62.19
C-5
0.80 268.80 12,609 9,609 9,609
dedicated torecharge

Massachusetts Stormwater Handbook
Volume 3: Documenting Compliance with the Massachusetts Stormwater Management Standards
Chapter 1 Page 22
Table 2.3.3. 1982 Rawls Rates18
18 Rawls, Brakensiek and Saxton, 1982
Texture Class NRCS Hydrologic Soil Group (HSG)
Infiltration Rate Inches/Hour
Sand A 8.27 Loamy Sand A 2.41 Sandy Loam B 1.02 Loam B 0.52 Silt Loam C 0.27 Sandy Clay Loam C 0.17 Clay Loam D 0.09 Silty Clay Loam D 0.06 Sandy Clay D 0.05 Silty Clay D 0.04 Clay D 0.02
C-6


KELLY ENGINEERING GROUP, INC. Zero Campanelli Drive-Braintree-MA 02184 Phone 781 843 4333
Attachment D
Pipe Sizing
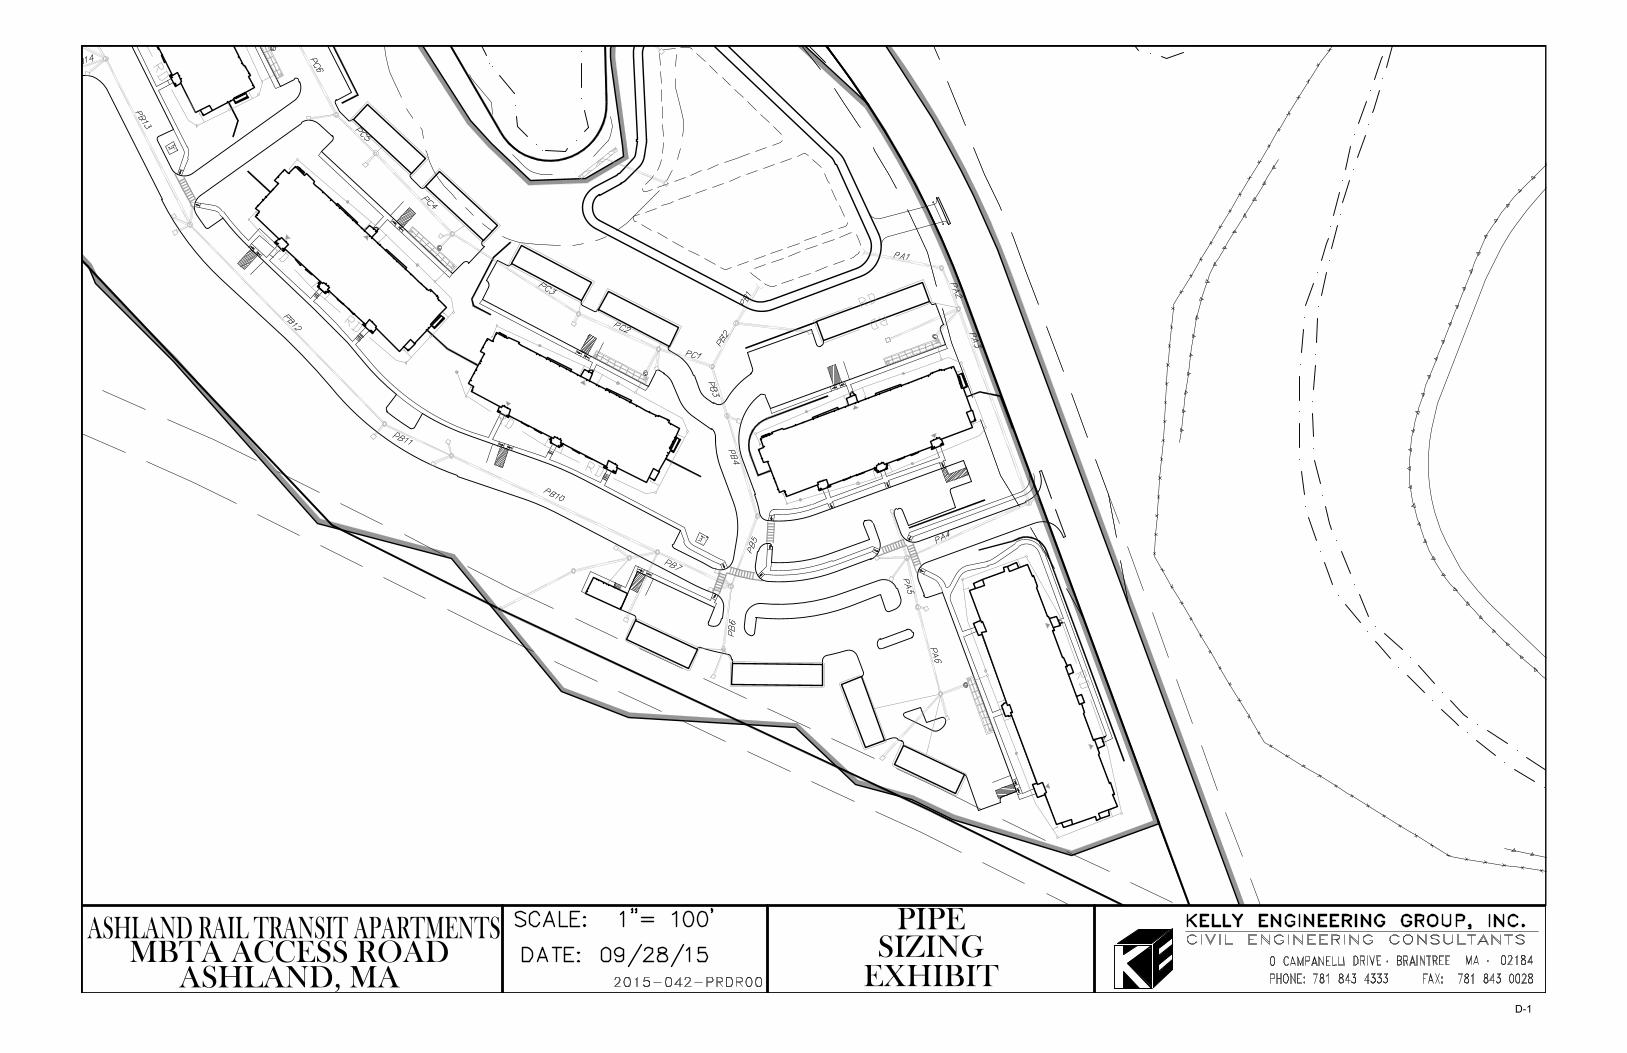
PIPESIZING
EXHIBITMBTA ACCESS ROAD
ASHLAND, MAD-1

PIPESIZING
EXHIBITMBTA ACCESS ROAD
ASHLAND, MAD-2

Ashland Rail Transit Apartments 2015‐042Ashland, MA 9/28/2015
Rational Method Calculations
i=6.5 in/hr (25 year storm)Pipe Run A DMH A1 ‐ A6
PA1 PA2 PA3 PA4 PA5 PA6Node Area (s.f.) 0 34,229 14,237 21,668 17,462 164,459Green area 0 7234 7234 5722 2,130 123,439Impervious area 0 26,995 7,003 15,946 15,332 41,020C 0.00 0.79 0.65 0.77 0.84 0.52Node Area (AC) 0.79 0.33 0.50 0.40 3.78Q=CiA (Node) 4.06 1.37 2.48 2.19 12.88
Total Area (s.f.) 252055 252055 217826 203589 181921 164459Total Area (AC) 5.79 5.79 5.00 4.67 4.18 3.78Q=CiA (Total) 22.98 22.98 18.92 17.55 15.06 12.88
Pipe Run D DMH D1 ‐ D5PD1 PD2 PD3 PD4 PD5
Node Area (s.f.) 21,566 35,005 0 15,658 10,717Green area 3519 13036 0 21969 3,796Impervious area 18,047 21,969 0 10,506 6,921C 0.82 0.71 0.00 1.17 0.72Node Area (AC) 0.50 0.80 0.00 0.36 0.25Q=CiA (Node) 2.63 3.73 0.00 2.72 1.16
Total Area (s.f.) 82946 61380 26375 26375 10717Total Area (AC) 1.90 1.41 0.61 0.61 0.25Q=CiA (Total) 10.24 7.61 3.88 3.88 1.16
Pipe Run C DMH C1 ‐ C17PC1 PC2 PC3 PC4 PC5 PC6 PC7 PC8 PC9 PC10 PC11 PC12 PC13 PC14 PC15 PC16 PC17
Node Area (s.f.) 32,905 9,008 35,579 6,382 12,738 34,105 5,708 6,648 0 37589 8436 0 49306 3643 0 19379 52,444Green area 9876 2227 9971 807 4,925 11,747 0 858 0 11487 0 0 17269 0 0 4691 14,589Impervious area 23,029 6,781 25,608 5,575 7,813 22,358 5,708 5,790 0 26,102 8,436 0 32,037 3,643 0 14,688 37,855C 0.75 0.78 0.76 0.84 0.71 0.73 0.90 0.84 0.00 0.75 0.90 0.00 0.72 0.90 0.00 0.78 0.76Node Area (AC) 0.76 0.21 0.82 0.15 0.29 0.78 0.13 0.15 0.00 0.86 0.19 0.00 1.13 0.08 0.00 0.44 1.20Q=CiA (Node) 3.68 1.04 4.03 0.80 1.34 3.70 0.77 0.83 0.00 4.19 1.13 0.00 5.33 0.49 0.00 2.25 5.95
Total Area (s.f.) 313870 280965 271957 236378 229996 217258 183153 177445 170797 170797 133208 124772 124772 75466 71823 71823 52444Total Area (AC) 7.21 6.45 6.24 5.43 5.28 4.99 4.20 4.07 3.92 3.92 3.06 2.86 2.86 1.73 1.65 1.65 1.20Q=CiA (Total) 35.55 31.87 30.83 26.79 26.00 24.65 20.95 20.18 19.35 19.35 15.16 14.03 14.03 8.70 8.21 8.21 5.95
Pipe Run B DMH B1 ‐ B24PB1 **PB2 PB3 PB4 PB5 PB7 PB10 PB11 PB12 *PB13 PB14 PB17 PB18 PB19 PB20 PB21 PB23
Node Area (s.f.) 2,995 0 14,995 0 78901 157207 26605 104531 40428 13270 34,453 40068 40247 13301 9288 32851 26409Green area 0 0 9873 0 61485 156487 8904 104531 28016 7833 34,453 22392 20001 2621 1775 32851 11627Impervious area 2,995 0 5,122 0 17,416 720 17,701 0 12,412 5,437 0 17,676 20,246 10,680 7,513 0 14,782C 0.90 0.00 0.57 0.00 0.51 0.40 0.73 0.40 0.55 0.60 0.40 0.62 0.65 0.80 0.80 0.40 0.68Node Area (AC) 0.07 0.00 0.34 0.00 1.81 3.61 0.61 2.40 0.93 0.30 0.79 0.92 0.92 0.31 0.21 0.75 0.61Q=CiA (Node) 0.40 0.00 1.28 0.00 6.01 9.44 2.91 6.24 3.34 1.20 2.06 3.71 3.91 1.59 1.11 1.96 2.68
Total Area (s.f.) 1032365 1029370 715500 700505 700505 621604 464397 437792 333261 292833 196617 162164 122096 81849 68548 59260 26409Total Area (AC) 23.70 23.63 16.43 16.08 16.08 14.27 10.66 10.05 7.65 6.72 4.51 3.72 2.80 1.88 1.57 1.36 0.61Q=CiA (Total) 93.63 93.23 57.67 56.40 56.40 50.39 40.95 38.04 31.80 28.46 17.02 14.97 11.26 7.35 5.75 4.64 2.68
*PB13 ‐ Flow from PD1 enters network**PB2 ‐ Flow from PC1 enters network
Note PB1 = pipe out from Drain Manhole #B1
D-3

Channel ReportHydraflow Express Extension for Autodesk® AutoCAD® Civil 3D® by Autodesk, Inc. Tuesday, Sep 29 2015
PA1
CircularDiameter (ft) = 2.00
Invert Elev (ft) = 100.00Slope (%) = 5.00N-Value = 0.011
CalculationsCompute by: Known QKnown Q (cfs) = 22.98
HighlightedDepth (ft) = 0.86Q (cfs) = 22.98Area (sqft) = 1.30Velocity (ft/s) = 17.67Wetted Perim (ft) = 2.87Crit Depth, Yc (ft) = 1.71Top Width (ft) = 1.98EGL (ft) = 5.71
0 1 2 3 4
Elev (ft) Depth (ft)Section
99.50 -0.50
100.00 0.00
100.50 0.50
101.00 1.00
101.50 1.50
102.00 2.00
102.50 2.50
103.00 3.00
Reach (ft)
Channel ReportHydraflow Express Extension for Autodesk® AutoCAD® Civil 3D® by Autodesk, Inc. Tuesday, Sep 29 2015
PA2
CircularDiameter (ft) = 2.00
Invert Elev (ft) = 100.00Slope (%) = 3.00N-Value = 0.011
CalculationsCompute by: Known QKnown Q (cfs) = 22.98
HighlightedDepth (ft) = 1.00Q (cfs) = 22.98Area (sqft) = 1.58Velocity (ft/s) = 14.55Wetted Perim (ft) = 3.15Crit Depth, Yc (ft) = 1.71Top Width (ft) = 2.00EGL (ft) = 4.29
0 1 2 3 4
Elev (ft) Depth (ft)Section
99.50 -0.50
100.00 0.00
100.50 0.50
101.00 1.00
101.50 1.50
102.00 2.00
102.50 2.50
103.00 3.00
Reach (ft)
Channel ReportHydraflow Express Extension for Autodesk® AutoCAD® Civil 3D® by Autodesk, Inc. Tuesday, Sep 29 2015
PA3
CircularDiameter (ft) = 1.50
Invert Elev (ft) = 100.00Slope (%) = 2.30N-Value = 0.011
CalculationsCompute by: Known QKnown Q (cfs) = 18.92
HighlightedDepth (ft) = 1.24Q (cfs) = 18.92Area (sqft) = 1.56Velocity (ft/s) = 12.10Wetted Perim (ft) = 3.43Crit Depth, Yc (ft) = 1.46Top Width (ft) = 1.13EGL (ft) = 3.52
0 1 2 3
Elev (ft) Section
99.50
100.00
100.50
101.00
101.50
102.00
Reach (ft)
Channel ReportHydraflow Express Extension for Autodesk® AutoCAD® Civil 3D® by Autodesk, Inc. Tuesday, Sep 29 2015
PA4
CircularDiameter (ft) = 1.50
Invert Elev (ft) = 100.00Slope (%) = 4.10N-Value = 0.011
CalculationsCompute by: Known QKnown Q (cfs) = 17.55
HighlightedDepth (ft) = 0.93Q (cfs) = 17.55Area (sqft) = 1.15Velocity (ft/s) = 15.22Wetted Perim (ft) = 2.72Crit Depth, Yc (ft) = 1.45Top Width (ft) = 1.46EGL (ft) = 4.53
0 1 2 3
Elev (ft) Section
99.50
100.00
100.50
101.00
101.50
102.00
Reach (ft)
D-4
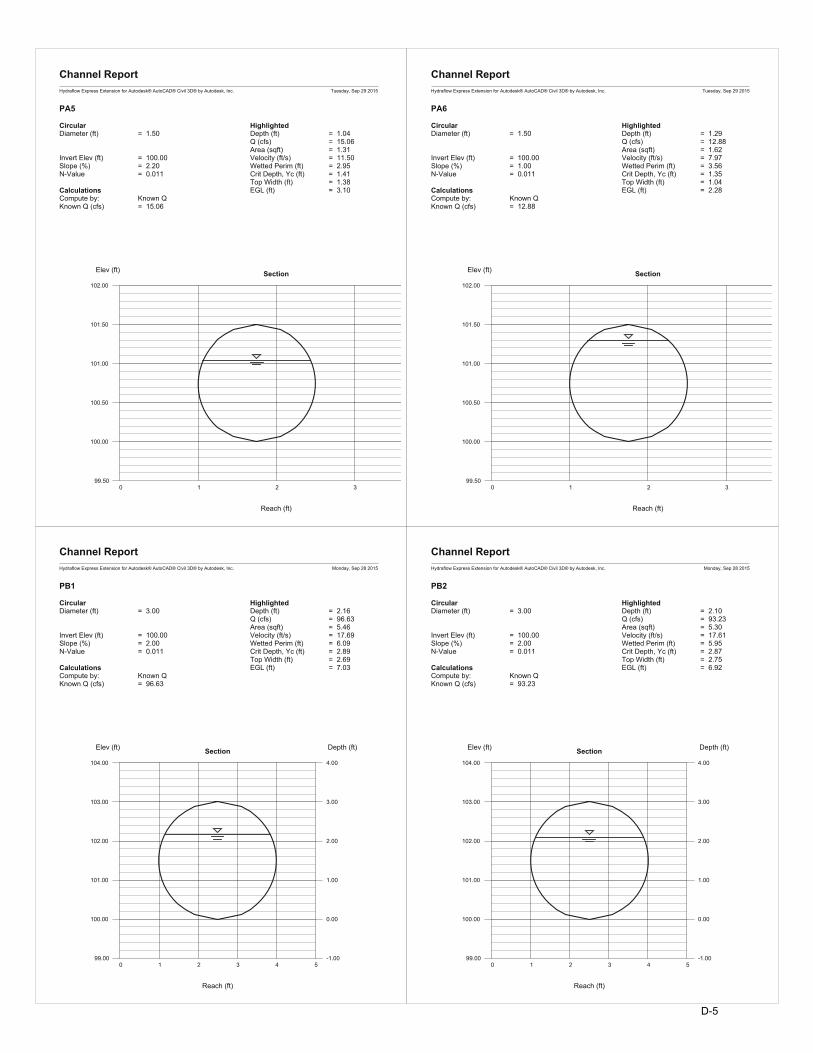
Channel ReportHydraflow Express Extension for Autodesk® AutoCAD® Civil 3D® by Autodesk, Inc. Tuesday, Sep 29 2015
PA5
CircularDiameter (ft) = 1.50
Invert Elev (ft) = 100.00Slope (%) = 2.20N-Value = 0.011
CalculationsCompute by: Known QKnown Q (cfs) = 15.06
HighlightedDepth (ft) = 1.04Q (cfs) = 15.06Area (sqft) = 1.31Velocity (ft/s) = 11.50Wetted Perim (ft) = 2.95Crit Depth, Yc (ft) = 1.41Top Width (ft) = 1.38EGL (ft) = 3.10
0 1 2 3
Elev (ft) Section
99.50
100.00
100.50
101.00
101.50
102.00
Reach (ft)
Channel ReportHydraflow Express Extension for Autodesk® AutoCAD® Civil 3D® by Autodesk, Inc. Tuesday, Sep 29 2015
PA6
CircularDiameter (ft) = 1.50
Invert Elev (ft) = 100.00Slope (%) = 1.00N-Value = 0.011
CalculationsCompute by: Known QKnown Q (cfs) = 12.88
HighlightedDepth (ft) = 1.29Q (cfs) = 12.88Area (sqft) = 1.62Velocity (ft/s) = 7.97Wetted Perim (ft) = 3.56Crit Depth, Yc (ft) = 1.35Top Width (ft) = 1.04EGL (ft) = 2.28
0 1 2 3
Elev (ft) Section
99.50
100.00
100.50
101.00
101.50
102.00
Reach (ft)
Channel ReportHydraflow Express Extension for Autodesk® AutoCAD® Civil 3D® by Autodesk, Inc. Monday, Sep 28 2015
PB1
CircularDiameter (ft) = 3.00
Invert Elev (ft) = 100.00Slope (%) = 2.00N-Value = 0.011
CalculationsCompute by: Known QKnown Q (cfs) = 96.63
HighlightedDepth (ft) = 2.16Q (cfs) = 96.63Area (sqft) = 5.46Velocity (ft/s) = 17.69Wetted Perim (ft) = 6.09Crit Depth, Yc (ft) = 2.89Top Width (ft) = 2.69EGL (ft) = 7.03
0 1 2 3 4 5
Elev (ft) Depth (ft)Section
99.00 -1.00
100.00 0.00
101.00 1.00
102.00 2.00
103.00 3.00
104.00 4.00
Reach (ft)
Channel ReportHydraflow Express Extension for Autodesk® AutoCAD® Civil 3D® by Autodesk, Inc. Monday, Sep 28 2015
PB2
CircularDiameter (ft) = 3.00
Invert Elev (ft) = 100.00Slope (%) = 2.00N-Value = 0.011
CalculationsCompute by: Known QKnown Q (cfs) = 93.23
HighlightedDepth (ft) = 2.10Q (cfs) = 93.23Area (sqft) = 5.30Velocity (ft/s) = 17.61Wetted Perim (ft) = 5.95Crit Depth, Yc (ft) = 2.87Top Width (ft) = 2.75EGL (ft) = 6.92
0 1 2 3 4 5
Elev (ft) Depth (ft)Section
99.00 -1.00
100.00 0.00
101.00 1.00
102.00 2.00
103.00 3.00
104.00 4.00
Reach (ft)
D-5

Channel ReportHydraflow Express Extension for Autodesk® AutoCAD® Civil 3D® by Autodesk, Inc. Monday, Sep 28 2015
PB3
CircularDiameter (ft) = 2.50
Invert Elev (ft) = 100.00Slope (%) = 2.00N-Value = 0.011
CalculationsCompute by: Known QKnown Q (cfs) = 57.67
HighlightedDepth (ft) = 1.76Q (cfs) = 57.67Area (sqft) = 3.70Velocity (ft/s) = 15.57Wetted Perim (ft) = 4.99Crit Depth, Yc (ft) = 2.38Top Width (ft) = 2.28EGL (ft) = 5.53
0 1 2 3 4 5
Elev (ft) Section
99.50
100.00
100.50
101.00
101.50
102.00
102.50
103.00
Reach (ft)
Channel ReportHydraflow Express Extension for Autodesk® AutoCAD® Civil 3D® by Autodesk, Inc. Monday, Sep 28 2015
PB4
CircularDiameter (ft) = 2.50
Invert Elev (ft) = 100.00Slope (%) = 2.00N-Value = 0.011
CalculationsCompute by: Known QKnown Q (cfs) = 56.40
HighlightedDepth (ft) = 1.73Q (cfs) = 56.40Area (sqft) = 3.62Velocity (ft/s) = 15.56Wetted Perim (ft) = 4.91Crit Depth, Yc (ft) = 2.37Top Width (ft) = 2.31EGL (ft) = 5.49
0 1 2 3 4 5
Elev (ft) Section
99.50
100.00
100.50
101.00
101.50
102.00
102.50
103.00
Reach (ft)
Channel ReportHydraflow Express Extension for Autodesk® AutoCAD® Civil 3D® by Autodesk, Inc. Monday, Sep 28 2015
PB5
CircularDiameter (ft) = 2.50
Invert Elev (ft) = 100.00Slope (%) = 2.00N-Value = 0.011
CalculationsCompute by: Known QKnown Q (cfs) = 56.40
HighlightedDepth (ft) = 1.73Q (cfs) = 56.40Area (sqft) = 3.62Velocity (ft/s) = 15.56Wetted Perim (ft) = 4.91Crit Depth, Yc (ft) = 2.37Top Width (ft) = 2.31EGL (ft) = 5.49
0 1 2 3 4 5
Elev (ft) Section
99.50
100.00
100.50
101.00
101.50
102.00
102.50
103.00
Reach (ft)
Channel ReportHydraflow Express Extension for Autodesk® AutoCAD® Civil 3D® by Autodesk, Inc. Monday, Sep 28 2015
PB7
CircularDiameter (ft) = 2.50
Invert Elev (ft) = 100.00Slope (%) = 1.30N-Value = 0.011
CalculationsCompute by: Known QKnown Q (cfs) = 50.39
HighlightedDepth (ft) = 1.88Q (cfs) = 50.39Area (sqft) = 3.96Velocity (ft/s) = 12.72Wetted Perim (ft) = 5.25Crit Depth, Yc (ft) = 2.31Top Width (ft) = 2.16EGL (ft) = 4.39
0 1 2 3 4 5
Elev (ft) Section
99.50
100.00
100.50
101.00
101.50
102.00
102.50
103.00
Reach (ft)
D-6

Channel ReportHydraflow Express Extension for Autodesk® AutoCAD® Civil 3D® by Autodesk, Inc. Monday, Sep 28 2015
PB10
CircularDiameter (ft) = 2.00
Invert Elev (ft) = 100.00Slope (%) = 4.60N-Value = 0.011
CalculationsCompute by: Known QKnown Q (cfs) = 40.95
HighlightedDepth (ft) = 1.25Q (cfs) = 40.95Area (sqft) = 2.07Velocity (ft/s) = 19.80Wetted Perim (ft) = 3.65Crit Depth, Yc (ft) = 1.96Top Width (ft) = 1.94EGL (ft) = 7.34
0 1 2 3 4
Elev (ft) Depth (ft)Section
99.50 -0.50
100.00 0.00
100.50 0.50
101.00 1.00
101.50 1.50
102.00 2.00
102.50 2.50
103.00 3.00
Reach (ft)
Channel ReportHydraflow Express Extension for Autodesk® AutoCAD® Civil 3D® by Autodesk, Inc. Monday, Sep 28 2015
PB11
CircularDiameter (ft) = 2.00
Invert Elev (ft) = 100.00Slope (%) = 4.60N-Value = 0.011
CalculationsCompute by: Known QKnown Q (cfs) = 38.04
HighlightedDepth (ft) = 1.19Q (cfs) = 38.04Area (sqft) = 1.95Velocity (ft/s) = 19.46Wetted Perim (ft) = 3.53Crit Depth, Yc (ft) = 1.95Top Width (ft) = 1.96EGL (ft) = 7.08
0 1 2 3 4
Elev (ft) Depth (ft)Section
99.50 -0.50
100.00 0.00
100.50 0.50
101.00 1.00
101.50 1.50
102.00 2.00
102.50 2.50
103.00 3.00
Reach (ft)
Channel ReportHydraflow Express Extension for Autodesk® AutoCAD® Civil 3D® by Autodesk, Inc. Monday, Sep 28 2015
PB12
CircularDiameter (ft) = 2.00
Invert Elev (ft) = 100.00Slope (%) = 2.80N-Value = 0.011
CalculationsCompute by: Known QKnown Q (cfs) = 31.80
HighlightedDepth (ft) = 1.25Q (cfs) = 31.80Area (sqft) = 2.07Velocity (ft/s) = 15.37Wetted Perim (ft) = 3.65Crit Depth, Yc (ft) = 1.89Top Width (ft) = 1.94EGL (ft) = 4.92
0 1 2 3 4
Elev (ft) Depth (ft)Section
99.50 -0.50
100.00 0.00
100.50 0.50
101.00 1.00
101.50 1.50
102.00 2.00
102.50 2.50
103.00 3.00
Reach (ft)
Channel ReportHydraflow Express Extension for Autodesk® AutoCAD® Civil 3D® by Autodesk, Inc. Monday, Sep 28 2015
PB13
CircularDiameter (ft) = 2.00
Invert Elev (ft) = 100.00Slope (%) = 3.40N-Value = 0.011
CalculationsCompute by: Known QKnown Q (cfs) = 28.46
HighlightedDepth (ft) = 1.09Q (cfs) = 28.46Area (sqft) = 1.76Velocity (ft/s) = 16.18Wetted Perim (ft) = 3.33Crit Depth, Yc (ft) = 1.84Top Width (ft) = 1.99EGL (ft) = 5.16
0 1 2 3 4
Elev (ft) Depth (ft)Section
99.50 -0.50
100.00 0.00
100.50 0.50
101.00 1.00
101.50 1.50
102.00 2.00
102.50 2.50
103.00 3.00
Reach (ft)
D-7

Channel ReportHydraflow Express Extension for Autodesk® AutoCAD® Civil 3D® by Autodesk, Inc. Tuesday, Sep 29 2015
PB14
CircularDiameter (ft) = 1.50
Invert Elev (ft) = 100.00Slope (%) = 1.70N-Value = 0.011
CalculationsCompute by: Known QKnown Q (cfs) = 17.03
HighlightedDepth (ft) = 1.32Q (cfs) = 17.03Area (sqft) = 1.65Velocity (ft/s) = 10.34Wetted Perim (ft) = 3.65Crit Depth, Yc (ft) = 1.44Top Width (ft) = 0.97EGL (ft) = 2.98
0 1 2 3
Elev (ft) Section
99.50
100.00
100.50
101.00
101.50
102.00
Reach (ft)
Channel ReportHydraflow Express Extension for Autodesk® AutoCAD® Civil 3D® by Autodesk, Inc. Tuesday, Sep 29 2015
PB17
CircularDiameter (ft) = 1.50
Invert Elev (ft) = 100.00Slope (%) = 7.10N-Value = 0.011
CalculationsCompute by: Known QKnown Q (cfs) = 14.97
HighlightedDepth (ft) = 0.71Q (cfs) = 14.97Area (sqft) = 0.83Velocity (ft/s) = 18.11Wetted Perim (ft) = 2.28Crit Depth, Yc (ft) = 1.41Top Width (ft) = 1.50EGL (ft) = 5.81
0 1 2 3
Elev (ft) Section
99.50
100.00
100.50
101.00
101.50
102.00
Reach (ft)
Channel ReportHydraflow Express Extension for Autodesk® AutoCAD® Civil 3D® by Autodesk, Inc. Tuesday, Sep 29 2015
PB18
CircularDiameter (ft) = 1.50
Invert Elev (ft) = 100.00Slope (%) = 2.20N-Value = 0.011
CalculationsCompute by: Known QKnown Q (cfs) = 11.26
HighlightedDepth (ft) = 0.85Q (cfs) = 11.26Area (sqft) = 1.03Velocity (ft/s) = 10.89Wetted Perim (ft) = 2.56Crit Depth, Yc (ft) = 1.29Top Width (ft) = 1.49EGL (ft) = 2.69
0 1 2 3
Elev (ft) Section
99.50
100.00
100.50
101.00
101.50
102.00
Reach (ft)
Channel ReportHydraflow Express Extension for Autodesk® AutoCAD® Civil 3D® by Autodesk, Inc. Tuesday, Sep 29 2015
PB19
CircularDiameter (ft) = 1.25
Invert Elev (ft) = 100.00Slope (%) = 1.30N-Value = 0.011
CalculationsCompute by: Known QKnown Q (cfs) = 7.35
HighlightedDepth (ft) = 0.88Q (cfs) = 7.350Area (sqft) = 0.93Velocity (ft/s) = 7.94Wetted Perim (ft) = 2.49Crit Depth, Yc (ft) = 1.08Top Width (ft) = 1.14EGL (ft) = 1.86
0 1 2 3
Elev (ft) Section
99.50
100.00
100.50
101.00
101.50
102.00
Reach (ft)
D-8

Channel ReportHydraflow Express Extension for Autodesk® AutoCAD® Civil 3D® by Autodesk, Inc. Tuesday, Sep 29 2015
PB20
CircularDiameter (ft) = 1.00
Invert Elev (ft) = 100.00Slope (%) = 2.40N-Value = 0.011
CalculationsCompute by: Known QKnown Q (cfs) = 5.75
HighlightedDepth (ft) = 0.73Q (cfs) = 5.750Area (sqft) = 0.61Velocity (ft/s) = 9.35Wetted Perim (ft) = 2.05Crit Depth, Yc (ft) = 0.95Top Width (ft) = 0.89EGL (ft) = 2.09
0 1 2 3
Elev (ft) Depth (ft)Section
99.50 -0.50
100.00 0.00
100.50 0.50
101.00 1.00
101.50 1.50
102.00 2.00
Reach (ft)
Channel ReportHydraflow Express Extension for Autodesk® AutoCAD® Civil 3D® by Autodesk, Inc. Tuesday, Sep 29 2015
PB21
CircularDiameter (ft) = 1.00
Invert Elev (ft) = 100.00Slope (%) = 1.10N-Value = 0.011
CalculationsCompute by: Known QKnown Q (cfs) = 4.64
HighlightedDepth (ft) = 0.88Q (cfs) = 4.640Area (sqft) = 0.73Velocity (ft/s) = 6.34Wetted Perim (ft) = 2.44Crit Depth, Yc (ft) = 0.90Top Width (ft) = 0.65EGL (ft) = 1.50
0 1 2 3
Elev (ft) Depth (ft)Section
99.50 -0.50
100.00 0.00
100.50 0.50
101.00 1.00
101.50 1.50
102.00 2.00
Reach (ft)
Channel ReportHydraflow Express Extension for Autodesk® AutoCAD® Civil 3D® by Autodesk, Inc. Tuesday, Sep 29 2015
PB23
CircularDiameter (ft) = 1.00
Invert Elev (ft) = 100.00Slope (%) = 1.00N-Value = 0.011
CalculationsCompute by: Known QKnown Q (cfs) = 2.68
HighlightedDepth (ft) = 0.58Q (cfs) = 2.680Area (sqft) = 0.47Velocity (ft/s) = 5.65Wetted Perim (ft) = 1.73Crit Depth, Yc (ft) = 0.71Top Width (ft) = 0.99EGL (ft) = 1.08
0 1 2 3
Elev (ft) Depth (ft)Section
99.50 -0.50
100.00 0.00
100.50 0.50
101.00 1.00
101.50 1.50
102.00 2.00
Reach (ft)
Channel ReportHydraflow Express Extension for Autodesk® AutoCAD® Civil 3D® by Autodesk, Inc. Tuesday, Sep 29 2015
PC1
CircularDiameter (ft) = 2.50
Invert Elev (ft) = 100.00Slope (%) = 2.00N-Value = 0.011
CalculationsCompute by: Known QKnown Q (cfs) = 35.55
HighlightedDepth (ft) = 1.28Q (cfs) = 35.55Area (sqft) = 2.53Velocity (ft/s) = 14.05Wetted Perim (ft) = 3.99Crit Depth, Yc (ft) = 2.03Top Width (ft) = 2.50EGL (ft) = 4.35
0 1 2 3 4 5
Elev (ft) Section
99.50
100.00
100.50
101.00
101.50
102.00
102.50
103.00
Reach (ft)
D-9

Channel ReportHydraflow Express Extension for Autodesk® AutoCAD® Civil 3D® by Autodesk, Inc. Tuesday, Sep 29 2015
PC2
CircularDiameter (ft) = 2.50
Invert Elev (ft) = 100.00Slope (%) = 1.10N-Value = 0.011
CalculationsCompute by: Known QKnown Q (cfs) = 31.87
HighlightedDepth (ft) = 1.43Q (cfs) = 31.87Area (sqft) = 2.92Velocity (ft/s) = 10.92Wetted Perim (ft) = 4.30Crit Depth, Yc (ft) = 1.92Top Width (ft) = 2.47EGL (ft) = 3.29
0 1 2 3 4 5
Elev (ft) Section
99.50
100.00
100.50
101.00
101.50
102.00
102.50
103.00
Reach (ft)
Channel ReportHydraflow Express Extension for Autodesk® AutoCAD® Civil 3D® by Autodesk, Inc. Tuesday, Sep 29 2015
PC3
CircularDiameter (ft) = 2.00
Invert Elev (ft) = 100.00Slope (%) = 6.40N-Value = 0.011
CalculationsCompute by: Known QKnown Q (cfs) = 30.83
HighlightedDepth (ft) = 0.95Q (cfs) = 30.83Area (sqft) = 1.48Velocity (ft/s) = 20.84Wetted Perim (ft) = 3.05Crit Depth, Yc (ft) = 1.88Top Width (ft) = 2.00EGL (ft) = 7.70
0 1 2 3 4
Elev (ft) Depth (ft)Section
99.50 -0.50
100.00 0.00
100.50 0.50
101.00 1.00
101.50 1.50
102.00 2.00
102.50 2.50
103.00 3.00
Reach (ft)
Channel ReportHydraflow Express Extension for Autodesk® AutoCAD® Civil 3D® by Autodesk, Inc. Tuesday, Sep 29 2015
PC4
CircularDiameter (ft) = 2.00
Invert Elev (ft) = 100.00Slope (%) = 0.90N-Value = 0.011
CalculationsCompute by: Known QKnown Q (cfs) = 26.79
HighlightedDepth (ft) = 1.77Q (cfs) = 26.79Area (sqft) = 2.94Velocity (ft/s) = 9.11Wetted Perim (ft) = 4.90Crit Depth, Yc (ft) = 1.81Top Width (ft) = 1.28EGL (ft) = 3.06
0 1 2 3 4
Elev (ft) Depth (ft)Section
99.50 -0.50
100.00 0.00
100.50 0.50
101.00 1.00
101.50 1.50
102.00 2.00
102.50 2.50
103.00 3.00
Reach (ft)
Channel ReportHydraflow Express Extension for Autodesk® AutoCAD® Civil 3D® by Autodesk, Inc. Tuesday, Sep 29 2015
PC5
CircularDiameter (ft) = 2.00
Invert Elev (ft) = 100.00Slope (%) = 3.00N-Value = 0.011
CalculationsCompute by: Known QKnown Q (cfs) = 26.00
HighlightedDepth (ft) = 1.07Q (cfs) = 26.00Area (sqft) = 1.72Velocity (ft/s) = 15.13Wetted Perim (ft) = 3.29Crit Depth, Yc (ft) = 1.79Top Width (ft) = 1.99EGL (ft) = 4.63
0 1 2 3 4
Elev (ft) Depth (ft)Section
99.50 -0.50
100.00 0.00
100.50 0.50
101.00 1.00
101.50 1.50
102.00 2.00
102.50 2.50
103.00 3.00
Reach (ft)
D-10

Channel ReportHydraflow Express Extension for Autodesk® AutoCAD® Civil 3D® by Autodesk, Inc. Tuesday, Sep 29 2015
PC6
CircularDiameter (ft) = 2.00
Invert Elev (ft) = 100.00Slope (%) = 2.40N-Value = 0.011
CalculationsCompute by: Known QKnown Q (cfs) = 24.65
HighlightedDepth (ft) = 1.11Q (cfs) = 24.65Area (sqft) = 1.80Velocity (ft/s) = 13.71Wetted Perim (ft) = 3.37Crit Depth, Yc (ft) = 1.76Top Width (ft) = 1.99EGL (ft) = 4.03
0 1 2 3 4
Elev (ft) Depth (ft)Section
99.50 -0.50
100.00 0.00
100.50 0.50
101.00 1.00
101.50 1.50
102.00 2.00
102.50 2.50
103.00 3.00
Reach (ft)
Channel ReportHydraflow Express Extension for Autodesk® AutoCAD® Civil 3D® by Autodesk, Inc. Tuesday, Sep 29 2015
PC7
CircularDiameter (ft) = 2.00
Invert Elev (ft) = 100.00Slope (%) = 1.00N-Value = 0.011
CalculationsCompute by: Known QKnown Q (cfs) = 20.95
HighlightedDepth (ft) = 1.34Q (cfs) = 20.95Area (sqft) = 2.24Velocity (ft/s) = 9.35Wetted Perim (ft) = 3.84Crit Depth, Yc (ft) = 1.64Top Width (ft) = 1.88EGL (ft) = 2.70
0 1 2 3 4
Elev (ft) Depth (ft)Section
99.50 -0.50
100.00 0.00
100.50 0.50
101.00 1.00
101.50 1.50
102.00 2.00
102.50 2.50
103.00 3.00
Reach (ft)
Channel ReportHydraflow Express Extension for Autodesk® AutoCAD® Civil 3D® by Autodesk, Inc. Tuesday, Sep 29 2015
PC8
CircularDiameter (ft) = 2.00
Invert Elev (ft) = 100.00Slope (%) = 1.00N-Value = 0.011
CalculationsCompute by: Known QKnown Q (cfs) = 20.18
HighlightedDepth (ft) = 1.30Q (cfs) = 20.18Area (sqft) = 2.17Velocity (ft/s) = 9.30Wetted Perim (ft) = 3.76Crit Depth, Yc (ft) = 1.62Top Width (ft) = 1.91EGL (ft) = 2.64
0 1 2 3 4
Elev (ft) Depth (ft)Section
99.50 -0.50
100.00 0.00
100.50 0.50
101.00 1.00
101.50 1.50
102.00 2.00
102.50 2.50
103.00 3.00
Reach (ft)
Channel ReportHydraflow Express Extension for Autodesk® AutoCAD® Civil 3D® by Autodesk, Inc. Tuesday, Sep 29 2015
PC9
CircularDiameter (ft) = 2.00
Invert Elev (ft) = 100.00Slope (%) = 1.00N-Value = 0.011
CalculationsCompute by: Known QKnown Q (cfs) = 19.35
HighlightedDepth (ft) = 1.27Q (cfs) = 19.35Area (sqft) = 2.11Velocity (ft/s) = 9.19Wetted Perim (ft) = 3.69Crit Depth, Yc (ft) = 1.59Top Width (ft) = 1.93EGL (ft) = 2.58
0 1 2 3 4
Elev (ft) Depth (ft)Section
99.50 -0.50
100.00 0.00
100.50 0.50
101.00 1.00
101.50 1.50
102.00 2.00
102.50 2.50
103.00 3.00
Reach (ft)
D-11
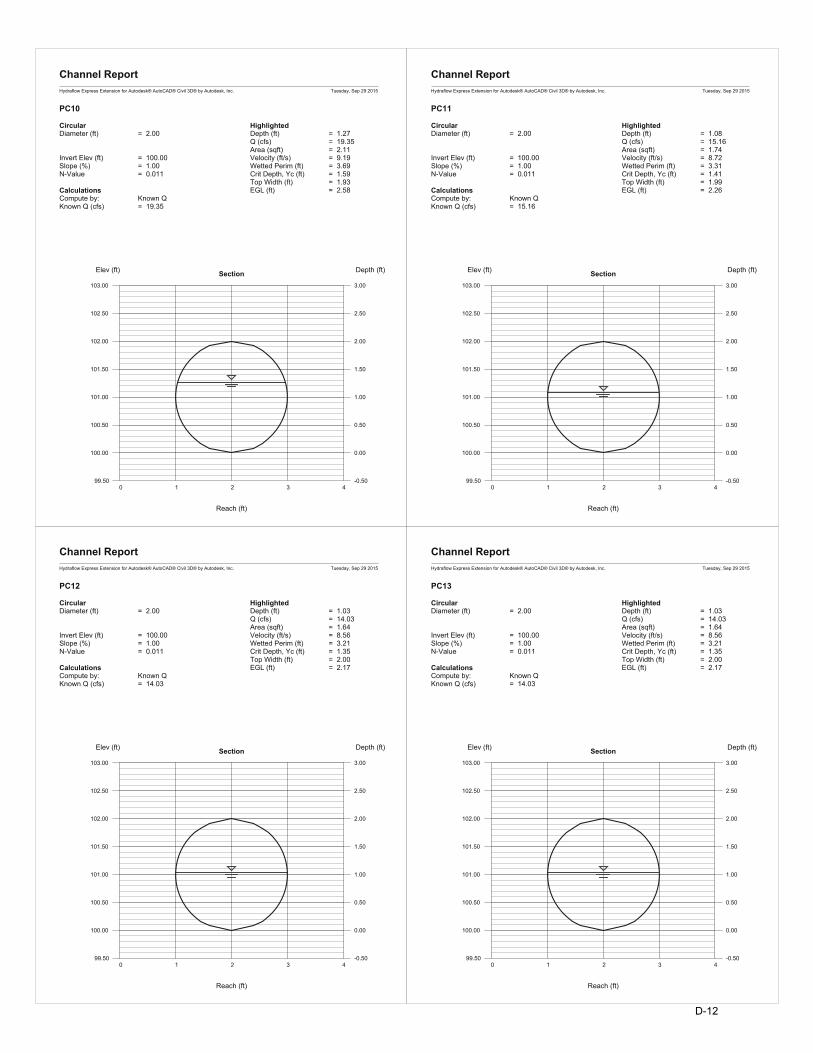
Channel ReportHydraflow Express Extension for Autodesk® AutoCAD® Civil 3D® by Autodesk, Inc. Tuesday, Sep 29 2015
PC10
CircularDiameter (ft) = 2.00
Invert Elev (ft) = 100.00Slope (%) = 1.00N-Value = 0.011
CalculationsCompute by: Known QKnown Q (cfs) = 19.35
HighlightedDepth (ft) = 1.27Q (cfs) = 19.35Area (sqft) = 2.11Velocity (ft/s) = 9.19Wetted Perim (ft) = 3.69Crit Depth, Yc (ft) = 1.59Top Width (ft) = 1.93EGL (ft) = 2.58
0 1 2 3 4
Elev (ft) Depth (ft)Section
99.50 -0.50
100.00 0.00
100.50 0.50
101.00 1.00
101.50 1.50
102.00 2.00
102.50 2.50
103.00 3.00
Reach (ft)
Channel ReportHydraflow Express Extension for Autodesk® AutoCAD® Civil 3D® by Autodesk, Inc. Tuesday, Sep 29 2015
PC11
CircularDiameter (ft) = 2.00
Invert Elev (ft) = 100.00Slope (%) = 1.00N-Value = 0.011
CalculationsCompute by: Known QKnown Q (cfs) = 15.16
HighlightedDepth (ft) = 1.08Q (cfs) = 15.16Area (sqft) = 1.74Velocity (ft/s) = 8.72Wetted Perim (ft) = 3.31Crit Depth, Yc (ft) = 1.41Top Width (ft) = 1.99EGL (ft) = 2.26
0 1 2 3 4
Elev (ft) Depth (ft)Section
99.50 -0.50
100.00 0.00
100.50 0.50
101.00 1.00
101.50 1.50
102.00 2.00
102.50 2.50
103.00 3.00
Reach (ft)
Channel ReportHydraflow Express Extension for Autodesk® AutoCAD® Civil 3D® by Autodesk, Inc. Tuesday, Sep 29 2015
PC12
CircularDiameter (ft) = 2.00
Invert Elev (ft) = 100.00Slope (%) = 1.00N-Value = 0.011
CalculationsCompute by: Known QKnown Q (cfs) = 14.03
HighlightedDepth (ft) = 1.03Q (cfs) = 14.03Area (sqft) = 1.64Velocity (ft/s) = 8.56Wetted Perim (ft) = 3.21Crit Depth, Yc (ft) = 1.35Top Width (ft) = 2.00EGL (ft) = 2.17
0 1 2 3 4
Elev (ft) Depth (ft)Section
99.50 -0.50
100.00 0.00
100.50 0.50
101.00 1.00
101.50 1.50
102.00 2.00
102.50 2.50
103.00 3.00
Reach (ft)
Channel ReportHydraflow Express Extension for Autodesk® AutoCAD® Civil 3D® by Autodesk, Inc. Tuesday, Sep 29 2015
PC13
CircularDiameter (ft) = 2.00
Invert Elev (ft) = 100.00Slope (%) = 1.00N-Value = 0.011
CalculationsCompute by: Known QKnown Q (cfs) = 14.03
HighlightedDepth (ft) = 1.03Q (cfs) = 14.03Area (sqft) = 1.64Velocity (ft/s) = 8.56Wetted Perim (ft) = 3.21Crit Depth, Yc (ft) = 1.35Top Width (ft) = 2.00EGL (ft) = 2.17
0 1 2 3 4
Elev (ft) Depth (ft)Section
99.50 -0.50
100.00 0.00
100.50 0.50
101.00 1.00
101.50 1.50
102.00 2.00
102.50 2.50
103.00 3.00
Reach (ft)
D-12

Channel ReportHydraflow Express Extension for Autodesk® AutoCAD® Civil 3D® by Autodesk, Inc. Tuesday, Sep 29 2015
PC14
CircularDiameter (ft) = 1.50
Invert Elev (ft) = 100.00Slope (%) = 1.00N-Value = 0.011
CalculationsCompute by: Known QKnown Q (cfs) = 8.70
HighlightedDepth (ft) = 0.93Q (cfs) = 8.700Area (sqft) = 1.15Velocity (ft/s) = 7.55Wetted Perim (ft) = 2.72Crit Depth, Yc (ft) = 1.15Top Width (ft) = 1.46EGL (ft) = 1.82
0 1 2 3
Elev (ft) Section
99.50
100.00
100.50
101.00
101.50
102.00
Reach (ft)
Channel ReportHydraflow Express Extension for Autodesk® AutoCAD® Civil 3D® by Autodesk, Inc. Tuesday, Sep 29 2015
PC15
CircularDiameter (ft) = 1.25
Invert Elev (ft) = 100.00Slope (%) = 5.60N-Value = 0.011
CalculationsCompute by: Known QKnown Q (cfs) = 8.21
HighlightedDepth (ft) = 0.60Q (cfs) = 8.210Area (sqft) = 0.59Velocity (ft/s) = 14.02Wetted Perim (ft) = 1.92Crit Depth, Yc (ft) = 1.13Top Width (ft) = 1.25EGL (ft) = 3.66
0 1 2 3
Elev (ft) Section
99.50
100.00
100.50
101.00
101.50
102.00
Reach (ft)
Channel ReportHydraflow Express Extension for Autodesk® AutoCAD® Civil 3D® by Autodesk, Inc. Tuesday, Sep 29 2015
PC16
CircularDiameter (ft) = 1.25
Invert Elev (ft) = 100.00Slope (%) = 3.40N-Value = 0.011
CalculationsCompute by: Known QKnown Q (cfs) = 8.21
HighlightedDepth (ft) = 0.69Q (cfs) = 8.210Area (sqft) = 0.69Velocity (ft/s) = 11.82Wetted Perim (ft) = 2.09Crit Depth, Yc (ft) = 1.13Top Width (ft) = 1.24EGL (ft) = 2.86
0 1 2 3
Elev (ft) Section
99.50
100.00
100.50
101.00
101.50
102.00
Reach (ft)
Channel ReportHydraflow Express Extension for Autodesk® AutoCAD® Civil 3D® by Autodesk, Inc. Tuesday, Sep 29 2015
PC17
CircularDiameter (ft) = 1.25
Invert Elev (ft) = 100.00Slope (%) = 1.00N-Value = 0.011
CalculationsCompute by: Known QKnown Q (cfs) = 5.95
HighlightedDepth (ft) = 0.84Q (cfs) = 5.950Area (sqft) = 0.88Velocity (ft/s) = 6.77Wetted Perim (ft) = 2.41Crit Depth, Yc (ft) = 0.99Top Width (ft) = 1.17EGL (ft) = 1.55
0 1 2 3
Elev (ft) Section
99.50
100.00
100.50
101.00
101.50
102.00
Reach (ft)
D-13
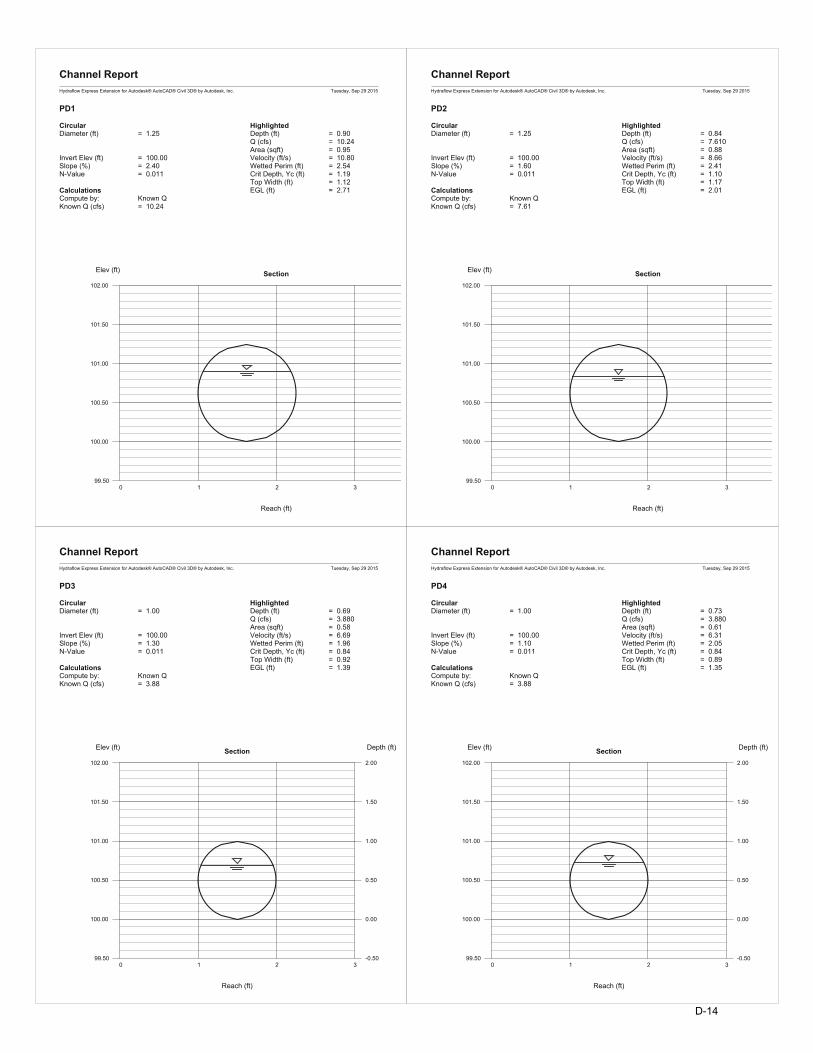
Channel ReportHydraflow Express Extension for Autodesk® AutoCAD® Civil 3D® by Autodesk, Inc. Tuesday, Sep 29 2015
PD1
CircularDiameter (ft) = 1.25
Invert Elev (ft) = 100.00Slope (%) = 2.40N-Value = 0.011
CalculationsCompute by: Known QKnown Q (cfs) = 10.24
HighlightedDepth (ft) = 0.90Q (cfs) = 10.24Area (sqft) = 0.95Velocity (ft/s) = 10.80Wetted Perim (ft) = 2.54Crit Depth, Yc (ft) = 1.19Top Width (ft) = 1.12EGL (ft) = 2.71
0 1 2 3
Elev (ft) Section
99.50
100.00
100.50
101.00
101.50
102.00
Reach (ft)
Channel ReportHydraflow Express Extension for Autodesk® AutoCAD® Civil 3D® by Autodesk, Inc. Tuesday, Sep 29 2015
PD2
CircularDiameter (ft) = 1.25
Invert Elev (ft) = 100.00Slope (%) = 1.60N-Value = 0.011
CalculationsCompute by: Known QKnown Q (cfs) = 7.61
HighlightedDepth (ft) = 0.84Q (cfs) = 7.610Area (sqft) = 0.88Velocity (ft/s) = 8.66Wetted Perim (ft) = 2.41Crit Depth, Yc (ft) = 1.10Top Width (ft) = 1.17EGL (ft) = 2.01
0 1 2 3
Elev (ft) Section
99.50
100.00
100.50
101.00
101.50
102.00
Reach (ft)
Channel ReportHydraflow Express Extension for Autodesk® AutoCAD® Civil 3D® by Autodesk, Inc. Tuesday, Sep 29 2015
PD3
CircularDiameter (ft) = 1.00
Invert Elev (ft) = 100.00Slope (%) = 1.30N-Value = 0.011
CalculationsCompute by: Known QKnown Q (cfs) = 3.88
HighlightedDepth (ft) = 0.69Q (cfs) = 3.880Area (sqft) = 0.58Velocity (ft/s) = 6.69Wetted Perim (ft) = 1.96Crit Depth, Yc (ft) = 0.84Top Width (ft) = 0.92EGL (ft) = 1.39
0 1 2 3
Elev (ft) Depth (ft)Section
99.50 -0.50
100.00 0.00
100.50 0.50
101.00 1.00
101.50 1.50
102.00 2.00
Reach (ft)
Channel ReportHydraflow Express Extension for Autodesk® AutoCAD® Civil 3D® by Autodesk, Inc. Tuesday, Sep 29 2015
PD4
CircularDiameter (ft) = 1.00
Invert Elev (ft) = 100.00Slope (%) = 1.10N-Value = 0.011
CalculationsCompute by: Known QKnown Q (cfs) = 3.88
HighlightedDepth (ft) = 0.73Q (cfs) = 3.880Area (sqft) = 0.61Velocity (ft/s) = 6.31Wetted Perim (ft) = 2.05Crit Depth, Yc (ft) = 0.84Top Width (ft) = 0.89EGL (ft) = 1.35
0 1 2 3
Elev (ft) Depth (ft)Section
99.50 -0.50
100.00 0.00
100.50 0.50
101.00 1.00
101.50 1.50
102.00 2.00
Reach (ft)
D-14

Channel ReportHydraflow Express Extension for Autodesk® AutoCAD® Civil 3D® by Autodesk, Inc. Tuesday, Sep 29 2015
PD5
CircularDiameter (ft) = 1.00
Invert Elev (ft) = 100.00Slope (%) = 3.60N-Value = 0.011
CalculationsCompute by: Known QKnown Q (cfs) = 1.16
HighlightedDepth (ft) = 0.26Q (cfs) = 1.160Area (sqft) = 0.16Velocity (ft/s) = 7.07Wetted Perim (ft) = 1.07Crit Depth, Yc (ft) = 0.46Top Width (ft) = 0.88EGL (ft) = 1.04
0 1 2 3
Elev (ft) Depth (ft)Section
99.50 -0.50
100.00 0.00
100.50 0.50
101.00 1.00
101.50 1.50
102.00 2.00
Reach (ft)
D-15

KELLY ENGINEERING GROUP, INC. Zero Campanelli Drive-Braintree-MA 02184 Phone 781 843 4333
Attachment E TSS Removal

V
INSTRUCTIONS: Version 1, Automated: Mar. 4, 2008
1. In BMP Column, click on Blue Cell to Activate Drop Down Menu2. Select BMP from Drop Down Menu3. After BMP is selected, TSS Removal and other Columns are automatically completed.
Location:
B C D E FTSS Removal Starting TSS Amount Remaining
BMP1 Rate1Load* Removed (C*D) Load (D-E)
Street Sweeping - 5% 0.05 1.00 0.05 0.95
Deep Sump and Hooded Catch Basin 0.25 0.95 0.24 0.71
Constructed Stormwater Wetland 0.80 0.71 0.57 0.14
Infiltration Basin 0.80 0.14 0.11 0.03
0.00 0.03 0.00 0.03
Total TSS Removal = 97%
Separate Form Needs to be Completed for Each Outlet or BMP Train
Project: 2015-042
Prepared By:Kelly Engineering Group,Inc. *Equals remaining load from previous BMP (E)
Date: 9/25/2015 which enters the BMP
TS
S R
emo
val
Cal
cula
tio
n W
ork
shee
t
Stormwater Management Pond
Non-automated TSS Calculation Sheetmust be used if Proprietary BMP Proposed1. From MassDEP Stormwater Handbook Vol. 1 Mass. Dept. of Environmental Protection
E - 1

1” WATER QUALITY VOLUME (STORMWATWER MANAGEMENT POND) Paved area(including sidewalks) = 322,584 s.f. Required Water Quality Volume = 322,584 s.f. x 1”/12 = 26,882 cu.ft. Volume provided in Sediment Forebay = 3,600 cu. ft. Volume provided in Water Quality Forebay = 24,243 cu. ft. Total Provided Water Quality Volume = 27,843 cu. ft. *See Calculations by Contech for Water Quality Volume for other paved not routed to stormwater pond.
E - 2

Pond ReportHydraflow Hydrographs Extension for AutoCAD® Civil 3D® 2013 by Autodesk, Inc. v10 Monday, 09 / 28 / 2015
Pond No. 2 - Water Quality
Pond DataContours -User-defined contour areas. Conic method used for volume calculation. Begining Elevation = 269.00 ft
Stage / Storage TableStage (ft) Elevation (ft) Contour area (sqft) Incr. Storage (cuft) Total storage (cuft)
0.00 269.00 14,943 0 01.00 270.00 16,573 15,749 15,7491.50 270.50 17,409 8,494 24,243
Culvert / Orifice Structures Weir Structures
[A] [B] [C] [PrfRsr] [A] [B] [C] [D]
Rise (in) = 0.00 0.00 0.00 0.00
Span (in) = 0.00 0.00 0.00 0.00
No. Barrels = 0 0 0 0
Invert El. (ft) = 0.00 0.00 0.00 0.00
Length (ft) = 0.00 0.00 0.00 0.00
Slope (%) = 0.00 0.00 0.00 n/a
N-Value = .000 .000 .000 n/a
Orifice Coeff. = 0.00 0.00 0.00 0.00
Multi-Stage = n/a No No No
Crest Len (ft) = 0.00 0.00 0.00 0.00
Crest El. (ft) = 0.00 0.00 0.00 0.00
Weir Coeff. = 0.00 0.00 0.00 0.00
Weir Type = --- --- --- ---
Multi-Stage = No No No No
Exfil.(in/hr) = 0.000 (by Wet area)
TW Elev. (ft) = 0.00
Note: Culvert/Orifice outflows are analyzed under inlet (ic) and outlet (oc) control. Weir risers checked for orifice conditions (ic) and submergence (s).
Stage / Storage / Discharge TableStage Storage Elevation Clv A Clv B Clv C PrfRsr Wr A Wr B Wr C Wr D Exfil User Totalft cuft ft cfs cfs cfs cfs cfs cfs cfs cfs cfs cfs cfs
0.00 0 269.00 --- --- --- --- --- --- --- --- --- --- 0.0001.00 15,749 270.00 --- --- --- --- --- --- --- --- --- --- 0.0001.50 24,243 270.50 --- --- --- --- --- --- --- --- --- --- 0.000
E - 3
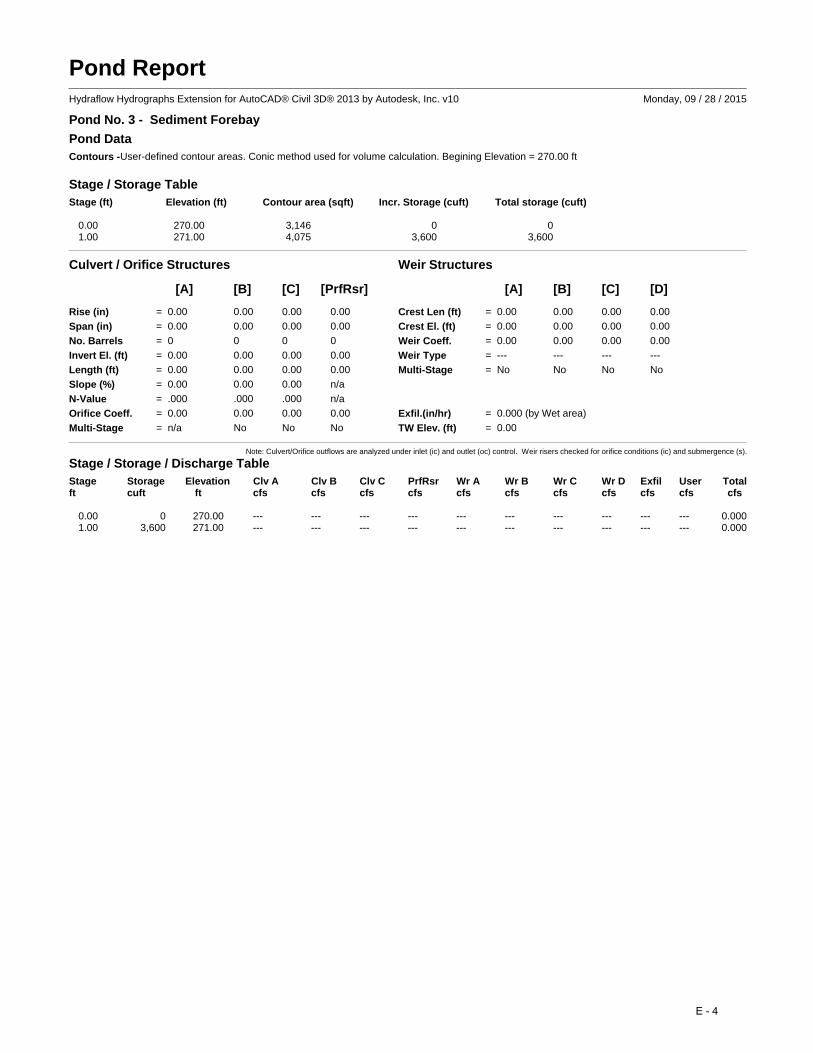
Pond ReportHydraflow Hydrographs Extension for AutoCAD® Civil 3D® 2013 by Autodesk, Inc. v10 Monday, 09 / 28 / 2015
Pond No. 3 - Sediment Forebay
Pond DataContours -User-defined contour areas. Conic method used for volume calculation. Begining Elevation = 270.00 ft
Stage / Storage TableStage (ft) Elevation (ft) Contour area (sqft) Incr. Storage (cuft) Total storage (cuft)
0.00 270.00 3,146 0 01.00 271.00 4,075 3,600 3,600
Culvert / Orifice Structures Weir Structures
[A] [B] [C] [PrfRsr] [A] [B] [C] [D]
Rise (in) = 0.00 0.00 0.00 0.00
Span (in) = 0.00 0.00 0.00 0.00
No. Barrels = 0 0 0 0
Invert El. (ft) = 0.00 0.00 0.00 0.00
Length (ft) = 0.00 0.00 0.00 0.00
Slope (%) = 0.00 0.00 0.00 n/a
N-Value = .000 .000 .000 n/a
Orifice Coeff. = 0.00 0.00 0.00 0.00
Multi-Stage = n/a No No No
Crest Len (ft) = 0.00 0.00 0.00 0.00
Crest El. (ft) = 0.00 0.00 0.00 0.00
Weir Coeff. = 0.00 0.00 0.00 0.00
Weir Type = --- --- --- ---
Multi-Stage = No No No No
Exfil.(in/hr) = 0.000 (by Wet area)
TW Elev. (ft) = 0.00
Note: Culvert/Orifice outflows are analyzed under inlet (ic) and outlet (oc) control. Weir risers checked for orifice conditions (ic) and submergence (s).
Stage / Storage / Discharge TableStage Storage Elevation Clv A Clv B Clv C PrfRsr Wr A Wr B Wr C Wr D Exfil User Totalft cuft ft cfs cfs cfs cfs cfs cfs cfs cfs cfs cfs cfs
0.00 0 270.00 --- --- --- --- --- --- --- --- --- --- 0.0001.00 3,600 271.00 --- --- --- --- --- --- --- --- --- --- 0.000
E - 4
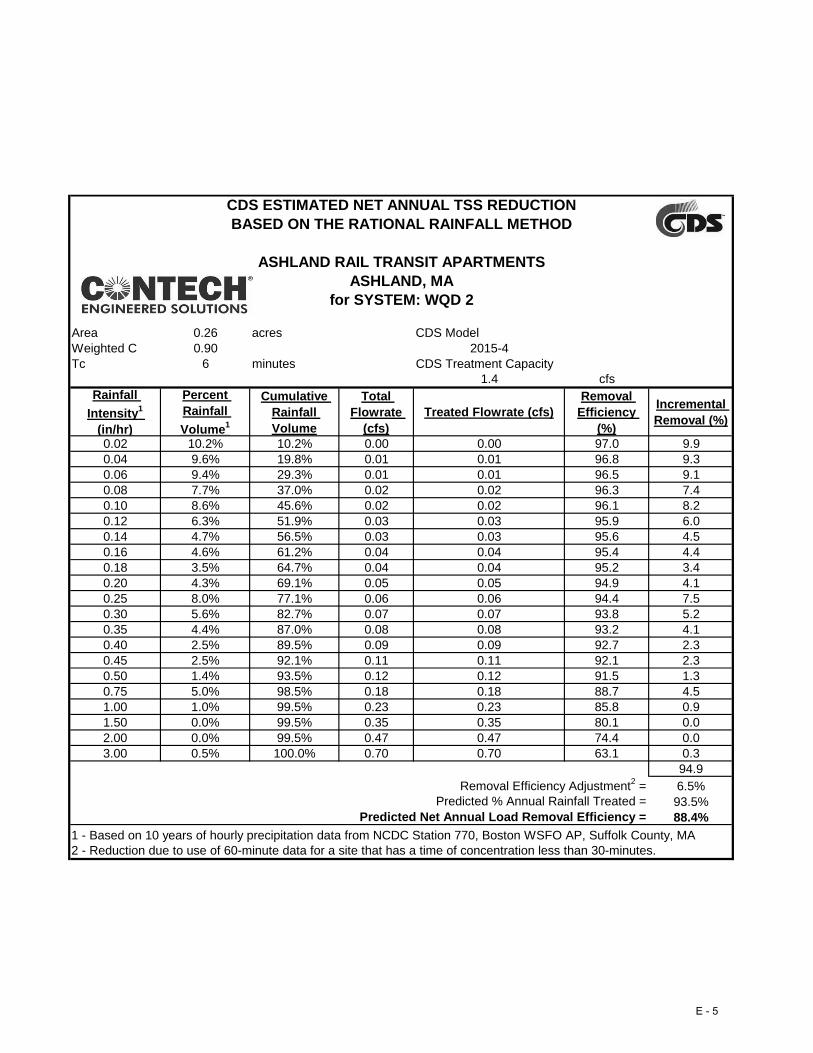
Area 0.26 acres CDS ModelWeighted C 0.90 2015-4 50 micronsTc 6 minutes CDS Treatment Capacity 0.7 cfs
1.4 cfsRainfall
Intensity1
(in/hr)
Percent Rainfall
Volume1
Cumulative Rainfall Volume
Total Flowrate
(cfs)Treated Flowrate (cfs)
Removal Efficiency
(%)
Incremental Removal (%)
0.02 10.2% 10.2% 0.00 0.00 97.0 9.90.04 9.6% 19.8% 0.01 0.01 96.8 9.30.06 9.4% 29.3% 0.01 0.01 96.5 9.10.08 7.7% 37.0% 0.02 0.02 96.3 7.40.10 8.6% 45.6% 0.02 0.02 96.1 8.20.12 6.3% 51.9% 0.03 0.03 95.9 6.00.14 4.7% 56.5% 0.03 0.03 95.6 4.50.16 4.6% 61.2% 0.04 0.04 95.4 4.40.18 3.5% 64.7% 0.04 0.04 95.2 3.40.20 4.3% 69.1% 0.05 0.05 94.9 4.10.25 8.0% 77.1% 0.06 0.06 94.4 7.50.30 5.6% 82.7% 0.07 0.07 93.8 5.20.35 4.4% 87.0% 0.08 0.08 93.2 4.10.40 2.5% 89.5% 0.09 0.09 92.7 2.30.45 2.5% 92.1% 0.11 0.11 92.1 2.30.50 1.4% 93.5% 0.12 0.12 91.5 1.30.75 5.0% 98.5% 0.18 0.18 88.7 4.51.00 1.0% 99.5% 0.23 0.23 85.8 0.91.50 0.0% 99.5% 0.35 0.35 80.1 0.02.00 0.0% 99.5% 0.47 0.47 74.4 0.03.00 0.5% 100.0% 0.70 0.70 63.1 0.3
94.96.5%93.5%88.4%
1 - Based on 10 years of hourly precipitation data from NCDC Station 770, Boston WSFO AP, Suffolk County, MA2 - Reduction due to use of 60-minute data for a site that has a time of concentration less than 30-minutes.
Predicted Net Annual Load Removal Efficiency =
BASED ON AN AVERAGE PARTICLE SIZE OF 50 MICRONS
Removal Efficiency Adjustment2 = Predicted % Annual Rainfall Treated =
BASED ON THE RATIONAL RAINFALL METHOD
for SYSTEM: WQD 2
CDS ESTIMATED NET ANNUAL TSS REDUCTION
ASHLAND RAIL TRANSIT APARTMENTSASHLAND, MA
E - 5

Area 0.36 acres CDS ModelWeighted C 0.90 2015-4 50 micronsTc 6 minutes CDS Treatment Capacity 0.7 cfs
1.4 cfsRainfall
Intensity1
(in/hr)
Percent Rainfall
Volume1
Cumulative Rainfall Volume
Total Flowrate
(cfs)Treated Flowrate (cfs)
Removal Efficiency
(%)
Incremental Removal (%)
0.02 10.2% 10.2% 0.01 0.01 96.9 9.90.04 9.6% 19.8% 0.01 0.01 96.6 9.30.06 9.4% 29.3% 0.02 0.02 96.3 9.10.08 7.7% 37.0% 0.03 0.03 96.0 7.40.10 8.6% 45.6% 0.03 0.03 95.6 8.20.12 6.3% 51.9% 0.04 0.04 95.3 6.00.14 4.7% 56.5% 0.05 0.05 95.0 4.40.16 4.6% 61.2% 0.05 0.05 94.7 4.40.18 3.5% 64.7% 0.06 0.06 94.4 3.30.20 4.3% 69.1% 0.06 0.06 94.1 4.10.25 8.0% 77.1% 0.08 0.08 93.3 7.50.30 5.6% 82.7% 0.10 0.10 92.5 5.20.35 4.4% 87.0% 0.11 0.11 91.7 4.00.40 2.5% 89.5% 0.13 0.13 90.9 2.30.45 2.5% 92.1% 0.15 0.15 90.1 2.30.50 1.4% 93.5% 0.16 0.16 89.3 1.20.75 5.0% 98.5% 0.24 0.24 85.4 4.31.00 1.0% 99.5% 0.32 0.32 81.5 0.81.50 0.0% 99.5% 0.49 0.49 73.6 0.02.00 0.0% 99.5% 0.65 0.65 65.7 0.03.00 0.5% 100.0% 0.97 0.97 49.9 0.2
94.06.5%93.5%87.5%
1 - Based on 10 years of hourly precipitation data from NCDC Station 770, Boston WSFO AP, Suffolk County, MA2 - Reduction due to use of 60-minute data for a site that has a time of concentration less than 30-minutes.
Predicted Net Annual Load Removal Efficiency =
BASED ON AN AVERAGE PARTICLE SIZE OF 50 MICRONS
Removal Efficiency Adjustment2 = Predicted % Annual Rainfall Treated =
BASED ON THE RATIONAL RAINFALL METHOD
for SYSTEM: WQD 1
CDS ESTIMATED NET ANNUAL TSS REDUCTION
ASHLAND RAIL TRANSIT APARTMENTSASHLAND, MA
E - 6

Page 1 of 1
Project: Ashland Rail Transit ApartmentsLocation: Ashland, MAPrepared For: Kelly Engineering Group
Purpose:
Reference:
Given:Structure
NameImpv.
(acres)
A
(miles2)
tc
(min)
tc
(hr)WQV (in)
WQD1 0.36 0.0005658 6.0 0.100 1.00WQD2 0.26 0.0004062 6.0 0.100 1.00
Procedure:
Structure Name qu (csm/in.)WQD1 774.00WQD2 774.00
where:
A = impervious surface drainage area (in square miles)WQV = water quality volume in watershed inches (1.0" in this case)
Structure Name Q1 (cfs)WQD1 0.44WQD2 0.31
qu = the unit peak discharge, in csm/in.
To calculate the water quality flow rate (WQF) over a given site area. In this situation the WQF is derived from the first 1.0" of runoff.
Massachusetts Dept. of Environmental Protection Wetlands Program / United States Department of Agriculture Natural Resources Conservation Service TR-55 Manual
Determine unit peak discharge using Figure 1 or 2. Figure 2 is in tabular form so is preferred. Using the tc, read the unit peak discharge (qu) from Figure 1 or Table in Figure 2. qu is
expressed in the following units: cfs/mi2/watershed inches (csm/in).
1. Compute Q Rate using the following equation:
Q1 = (qu) (A) (WQV)
Q1 = flow fate associated with first 1.0" of runoff
E - 7

1
ASHLAND RAIL TRANSIT APARTMENTS STORMWATER MANAGEMENT SYSTEM OPERATION AND MAINTENANCE PLAN
& LONG-TERM POLLUTION PREVENTION PLAN
09/28/15
Prepared by:
KELLY ENGINEERING GROUP, INC. Zero Campanelli Drive
Braintree, Massachusetts 02184
OWNER AND RESPONSIBLE PARTY: Campanelli Acquisitions II, LLC PO Box 850985 Braintree, MA 02185 Note: If ownership of this property changes then the new owner becomes the responsible party. The Owner may assign responsibility to a tenant on the property.
E - 8

2
Introduction Considerable time, effort and cost has been spent in the design and construction of the stormwater management system for this development. The stormwater management system consists of a number of Best Management Practices (BMP’s). These BMP’s combine to ensure that storm runoff from the site will not damage the sensitive environmental resources surrounding the site. In order to ensure that these BMP’s operate as designed it is very important that the procedures in this operation and maintenance plan be followed. Most of these operation procedures require observation and measurement; however, at certain times more extensive maintenance measures may be needed. The following is an itemization of each of these BMP’s and their maintenance needs. The party responsible for maintenance should contract with a maintenance organization capable of performing the more extensive measures such as pumping of catch basin sumps, etc. BMP No. 1 – Paved Road Surface/Parking Lot Area: • Regularly pick up and remove litter from the parking lot area, landscaped islands and perimeter
landscaped areas and water quality areas. • The paved area is to be swept a minimum of two times per year, at least once during April and again
during September with a high efficiency vacuum sweeper or a regenerative air sweeper. If a mechanical sweeper is used, the paved area is to be swept a minimum of once a month.
BMP No. 2 - Deep Sump Catch Basins: • Basins are to be inspected 4 times per year.
1. Verify that tees are secure and free-flowing. 2. Measure depth of sediment below water line.
• Basins are to be cleaned whenever sediment and hydrocarbons are observed. Basins are to be cleaned
a minimum of twice per year. One of these cleanings shall occur before April 15th of each year and one shall occur before September 15th of each year. Basins may be cleaned either using a clamshell or a vacuum pump.
• All liquid shall be pumped from the sump of each basin at least once per year. • All sediments and hydrocarbons should be properly handled and disposed of, in accordance with local,
state and federal guidelines and regulations. Note: See catch basin detail for explanation of terms. BMP No. 3 – Contech Water Quality Inlets: • Basins are to be inspected 4 times per year by owner or designee.
1. Verify that tees are secure and free-flowing. 2. Measure depth of sediment below water line.
• Basins are to be cleaned whenever 18” of sediment and hydrocarbons are observed. Basins are to be
cleaned a minimum of twice per year. One of these cleanings shall occur before April 15th of each year and one shall occur before September 15th of each year. Basins may be cleaned either using a clamshell or a vacuum pump.
E - 9

3
• All liquid shall be pumped from the sump of each basin at least once per year. • All sediments and hydrocarbons shall be properly handled and disposed of, in accordance with local,
state and federal guidelines and regulations. If any problems are encountered with the Contech Units, contact the manufacturer. BMP No. 4 - Subsurface Recharge: The inlet pipe and observation basin shall be inspected 4 times a year. Any accumulated debris shall
be removed. Inspect recharge facilities following a rainfall event greater than 2.5 inches in a 24 hour period. If standing water is observed for more than 48 hours following a storm event, immediately retain a
qualified professional to assess whether infiltration function has been lost and develop recommended corrective actions.
BMP No. 5 – Constructed Stormwater Wetland & Level Spreaders: • On a regular basis, as required by growing conditions, those portions of the side slopes that are planted
with grass shall be mowed and otherwise maintained in such a manner as to maintain a dense cover of grass. Any area of erosion or other conditions of slope instability shall be corrected at the time they occur.
• Inlet and outlet structures.
On a regular basis, the inlet pipe and outlet structure shall be checked for debris and removed as necessary to ensure unobstructed flow of water through the water quality pond. Impoundment embankments and outlet structures should be inspected at least once annually by a qualified professional for structural integrity and for any conditions which could adversely affect their function.
• Recharge Pond.
Inspect recharge pond once per year and following a rainfall event greater than 2.5 inches in a 24 hour period. Remove sediment annually. If standing water is observed for more than 48 hours following a storm event, immediately retain a qualified professional to assess whether infiltration function has been lost and develop recommended corrective actions.
Snow Removal: • There shall be no plowing or stock piling of snow within all resource areas and any area subject to the
jurisdiction of local and state regulations without the prior written permission from state or local approving authority.
• Road salts and de-icing materials shall be stored on impervious pads and covered to protect from wind and precipitation.
• No de-icing materials shall be stored nor used within all resource areas and any area subject to the jurisdiction of local and state regulations without the prior written permission from state or local approving authority.
• No de-icing materials shall be stored within Zone I, Zone II, Zone A, and 200 feet from a river or estuary.
E - 10

4
Storage and Use of Chemicals: • No pesticides, herbicides, nor insecticides shall be stored nor used within all resource areas and any
area subject to the jurisdiction of local and state regulations without the prior written permission from state or local approving authority.
• Chemical storage on site shall be limited. Any chemicals that must be stored shall be stored in a secure area in accordance with Local and State regulations.
Hazardous Waste: • Containment – In the event of a discharge or spill of oil or another hazardous material, outlets to
stormwater management systems shall be plugged so that hazardous material do not enter resource areas.
• Reporting - In the event of a discharge or spill of oil or another hazardous material, responsible facility personnel, oil spill and/or hazardous material removal organizations, federal, state, and local regulatory agencies, the Town of Ashland Board of Health, fire and police departments, and the EPA National Response Center 1-800-424-8802 shall be rapidly notified.
• Hazardous Waste – All hazardous waste materials will be disposed of in the manner specified by local, state and/or federal regulations and by the manufacturer of such products.
• There shall be no illicit discharges to the stormwater management system. Material and Waste Storage, Handling and Management: • All waste materials will be collected and stored in a securely lidded metal dumpster from a solid waste
management company licensed to do business by the state and the town. The dumpster will comply with all local and state solid waste management regulations.
Training for Long Term Pollution Prevention Plan: • All staff or personnel involved and responsible for implementing the Stormwater Management System
Operations and Maintenance Plan and the Long-Term Pollution Prevention Plan shall be properly trained as required under the DEP Stormwater Management Regulations. Training shall be documented with records kept with other stormwater maintenance records.
Operation and maintenance of septic systems: • Septic systems shall be properly maintained according to manufacturer’s specifications. Pet Waste Management: • Pooper-scooper laws for pets shall be followed. • Never dump pet waste into storm drains, catch basins, or the drainage system. • Pet waste shall be scooped up and disposed of properly in the garbage. Lawn and Garden activities: • There shall be no exterior storage of fertilizers, pesticides, herbicides, or insecticides. No pesticides,
herbicides, nor insecticides shall be stored nor used within any resource areas its buffers, and any area subject to the jurisdiction of local and state regulations without the prior written permission from state or local approving authority.
• Fertilizers and pesticides shall be applied properly, sparingly, and outside any resource areas and its
E - 11

5
buffers. To reduce the impact of fertilizers, consider the following tips; • Don’t fertilize before a rain storm. • Consider using organic fertilizers. They release nutrients more slowly. • Test soils before applying fertilizers. Some soils may not need fertilizers. A standard soil test costs
$9.00. (Call the UMass Extension Soil Testing Lab at 413-545-2311 or download a soil test order form at http://www.umass.edu/plsoils/soiltest/.)
E - 12

Ashland Rail Transit Apartments PROJECT LOCATION: Ashland Rail Transit Apartments, Ashland, MA STORMWATER ANAGEMENT BEST MANAGEMENT PRACTICES - INSPECTION SCHEDULE AND EVALUATION CHECKLIST
Best Management Practice
Inspection Frequency (1)
Date I Inspector Minimum Maintenance and Key Items to Check (1)
Cleaning/Repair Needed yes__ no__ (list items)
Date of Cleaning/Repair
Performed By
Street Sweeping 4x per year Vacuum sweeper
Deep Sump and Hooded Catch Basins
4x per year Remove sediment 1x per year or if >6”
Detention Pond Sediment Forebay Constructed Wetland Recharge ponds Level Spreaders
2x per year first year, annually thereafter
Inspect inlets, vegetated, overflow discharge pipes, drain time less than 4
days
CDS water Quality device
2x per year Per manufacturer Requirements
Subsurface Recharge Systems
2x per year Inspect after 2.5” rain in 24 hours, drain time less than 3 days
(1) Refer to the Operation and Maintenance Plan for recommendations regarding frequency of inspections and maintenance of specific BMP's.
recommendations regarding frequency for inspection and maintenance of specific BMPs.
Stormwater Control Manager/Environmental Monitor: Stamp/Signature
E - 13

BMPLOCATION
MAPTRANSIT APARTMENTS
ASHLAND, MA
ASHLAND RAIL
E - 14


KELLY ENGINEERING GROUP, INC. Zero Campanelli Drive-Braintree-MA 02184 Phone 781 843 4333
Attachment F
Miscellaneous

Massachusetts Stormwater Handbook
Volume 3: Documenting Compliance with the Massachusetts Stormwater Management Standards
Chapter 1 Page 16
Attention must be given to ensure consistency in units. In particular, the Target Depth Factors must be converted to feet.
NRCS HYDROLOGIC
SOIL TYPE
APPROX. SOIL TEXTURE
TARGET DEPTH FACTOR (F)
A sand 0.6-inch B loam 0.35-inch C silty loam 0.25-inch D clay 0.1-inch
Table 2.3.2: Recharge Target Depth by Hydrologic Soil Group
When a site contains multiple Hydrologic Soil Groups, determine the Required Recharge Volume for each impervious area by Hydrologic Soil Group and then add the volumes together. Example: Assume a ten (10) acre site. 5.0 acres are proposed to be developed for a retail use. A section of the entrance roadway is to be bridged over a stream that is classified as land under water. As such, the bridging is subject to the Wetlands Protection Act Regulations, and the Stormwater Management Standards apply to stormwater runoff from all proposed roads, parking areas, and rooftops. Of the 5.0 acres proposed to be developed, 2 acres of impervious surfaces are proposed atop Hydrologic Soil Group (HSG) “A” soils, 1 acre of impervious surfaces atop HSG “B” soil, 1.5 acres of impervious surfaces atop HSG “C” soil, and 0.5 acres are proposed to be landscaped area. The remaining 5.0 acres, located on HSG “A” soil, are proposed to remain forested. Determine the Required Recharge Volume. Solution: The Required Recharge Volume is determined only for the impervious surfaces. The 5.0-acre forested area and the 0.5-acre landscaped area are not impervious areas. Although converted from forest, landscaped area is pervious area for purposes of Standard 3. Use Equation (1) to determine the Required Recharge Volume for each Hydrologic Soil Group covered by impervious area. Add together the Required Recharge Volumes determined for each HSG.
Rv = F x impervious area Rv = [(FHSG “A”) (Area1)] + [(FHSG “B”) (Area2)] + [(FHSG “C”)(Area3)] + [(FHSG “D”)(Area4)] Equation (2) Rv = [(0.6-in/12)(2 acres)] + [(0.35-in/12)(1 acre)] + [(0.25-in/12)(1.5 acres)] + [(0.1-in/12)(0 acres)] Rv = 0.1605 acre-feet Rv = 0.1605 acre-feet x 43560 square feet/acre-feet = 6,991 cubic feet or 258.9 cubic yards
F - 1
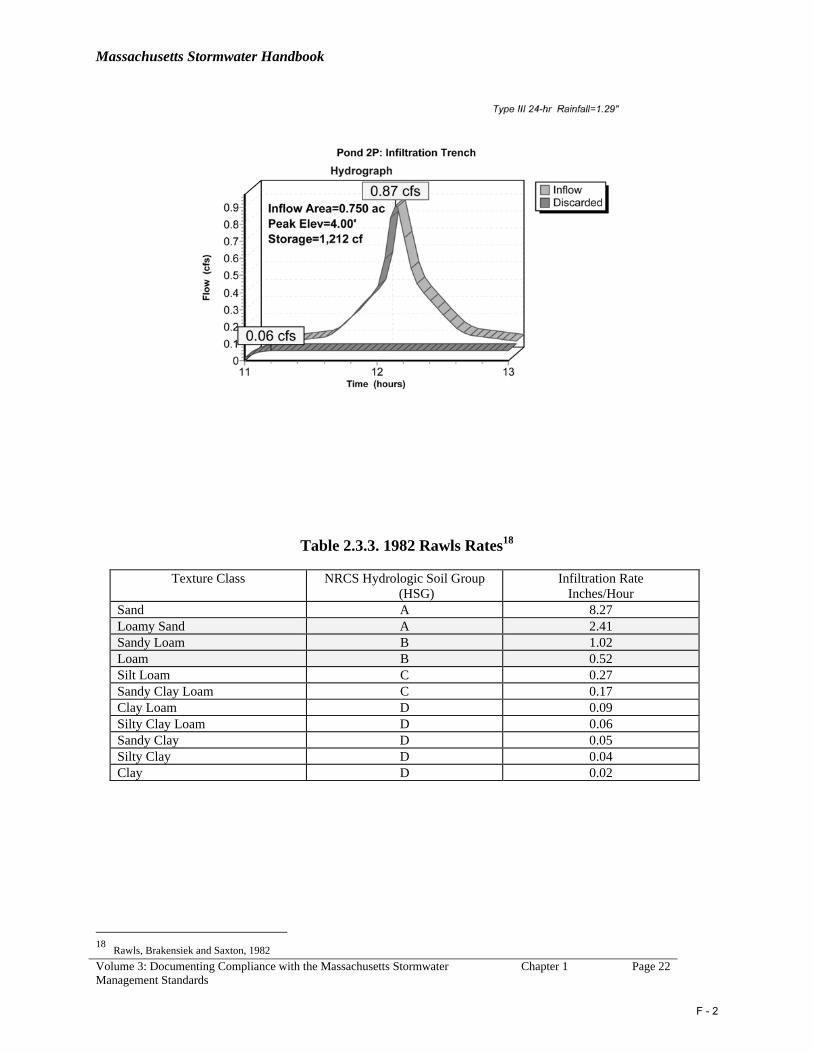
Massachusetts Stormwater Handbook
Volume 3: Documenting Compliance with the Massachusetts Stormwater Management Standards
Chapter 1 Page 22
Table 2.3.3. 1982 Rawls Rates18
18 Rawls, Brakensiek and Saxton, 1982
Texture Class NRCS Hydrologic Soil Group (HSG)
Infiltration Rate Inches/Hour
Sand A 8.27 Loamy Sand A 2.41 Sandy Loam B 1.02 Loam B 0.52 Silt Loam C 0.27 Sandy Clay Loam C 0.17 Clay Loam D 0.09 Silty Clay Loam D 0.06 Sandy Clay D 0.05 Silty Clay D 0.04 Clay D 0.02
F - 2

Hydrologic Soil Group—Middlesex County, Massachusetts
Natural ResourcesConservation Service
Web Soil SurveyNational Cooperative Soil Survey
5/18/2015Page 1 of 5
4680
300
4680
600
4680
900
4681
200
4681
500
4681
800
4682
100
4682
400
4680
300
4680
600
4680
900
4681
200
4681
500
4681
800
4682
100
4682
400
294100 294400 294700 295000 295300 295600 295900 296200 296500 296800 297100 297400
294100 294400 294700 295000 295300 295600 295900 296200 296500 296800 297100 297400
42° 16' 4'' N71
° 2
9' 5
1'' W
42° 16' 4'' N
71° 2
7' 1
9'' W
42° 14' 51'' N
71° 2
9' 5
1'' W
42° 14' 51'' N
71° 2
7' 1
9'' W
N
Map projection: Web Mercator Corner coordinates: WGS84 Edge tics: UTM Zone 19N WGS840 500 1000 2000 3000
Feet0 200 400 800 1200
MetersMap Scale: 1:15,900 if printed on A landscape (11" x 8.5") sheet.
F - 3

MAP LEGEND MAP INFORMATION
Area of Interest (AOI)Area of Interest (AOI)
SoilsSoil Rating Polygons
A
A/D
B
B/D
C
C/D
D
Not rated or not available
Soil Rating LinesA
A/D
B
B/D
C
C/D
D
Not rated or not available
Soil Rating PointsA
A/D
B
B/D
C
C/D
D
Not rated or not available
Water FeaturesStreams and Canals
TransportationRails
Interstate Highways
US Routes
Major Roads
Local Roads
BackgroundAerial Photography
The soil surveys that comprise your AOI were mapped at 1:25,000.
Please rely on the bar scale on each map sheet for mapmeasurements.
Source of Map: Natural Resources Conservation ServiceWeb Soil Survey URL: http://websoilsurvey.nrcs.usda.govCoordinate System: Web Mercator (EPSG:3857)
Maps from the Web Soil Survey are based on the Web Mercatorprojection, which preserves direction and shape but distortsdistance and area. A projection that preserves area, such as theAlbers equal-area conic projection, should be used if more accuratecalculations of distance or area are required.
This product is generated from the USDA-NRCS certified data as ofthe version date(s) listed below.
Soil Survey Area: Middlesex County, MassachusettsSurvey Area Data: Version 14, Sep 19, 2014
Soil map units are labeled (as space allows) for map scales 1:50,000or larger.
Date(s) aerial images were photographed: Sep 12, 2014—Sep28, 2014
The orthophoto or other base map on which the soil lines werecompiled and digitized probably differs from the backgroundimagery displayed on these maps. As a result, some minor shiftingof map unit boundaries may be evident.
Hydrologic Soil Group—Middlesex County, Massachusetts
Natural ResourcesConservation Service
Web Soil SurveyNational Cooperative Soil Survey
5/18/2015Page 2 of 5
F - 4

Hydrologic Soil Group
Hydrologic Soil Group— Summary by Map Unit — Middlesex County, Massachusetts (MA017)
Map unit symbol Map unit name Rating Acres in AOI Percent of AOI
1 Water 19.6 1.7%
6A Scarboro mucky finesandy loam, 0 to 3percent slopes
A/D 17.3 1.5%
30B Raynham silt loam, 0 to 5percent slopes
C/D 1.5 0.1%
32B Wareham loamy finesand, 0 to 5 percentslopes
A/D 3.2 0.3%
51A Swansea muck, 0 to 1percent slopes
B/D 3.7 0.3%
52A Freetown muck, 0 to 1percent slopes
A/D 26.4 2.2%
53A Freetown muck, ponded,0 to 1 percent slopesMLRA 144A
A/D 38.1 3.2%
71B Ridgebury fine sandyloam, 3 to 8 percentslopes, extremelystony
D 22.0 1.9%
73B Whitman fine sandyloam, 0 to 5 percentslopes, extremelystony
D 51.1 4.3%
104C Hollis-Rock outcrop-Charlton complex, 3 to15 percent slopes
A 9.5 0.8%
106C Narragansett-Hollis-Rock outcrop complex,3 to 15 percent slopes
A 25.7 2.2%
106D Narragansett-Hollis-Rock outcrop complex,15 to 25 percentslopes
A 3.6 0.3%
253B Hinckley loamy sand, 3to 8 percent slopes
A 10.0 0.8%
254B Merrimac fine sandyloam, 3 to 8 percentslopes
A 15.5 1.3%
260B Sudbury fine sandyloam, 3 to 8 percentslopes
B 32.6 2.7%
305B Paxton fine sandy loam,3 to 8 percent slopes
C 21.3 1.8%
Hydrologic Soil Group—Middlesex County, Massachusetts
Natural ResourcesConservation Service
Web Soil SurveyNational Cooperative Soil Survey
5/18/2015Page 3 of 5
F - 5

Hydrologic Soil Group— Summary by Map Unit — Middlesex County, Massachusetts (MA017)
Map unit symbol Map unit name Rating Acres in AOI Percent of AOI
305C Paxton fine sandy loam,8 to 15 percent slopes
D 12.2 1.0%
307B Paxton fine sandy loam,3 to 8 percent slopes,extremely stony
D 25.0 2.1%
307C Paxton fine sandy loam,8 to 15 percent slopes,extremely stony
D 30.6 2.6%
307D Paxton fine sandy loam,15 to 25 percentslopes, extremelystony
D 52.5 4.4%
310B Woodbridge fine sandyloam, 3 to 8 percentslopes
C/D 81.3 6.8%
312B Woodbridge fine sandyloam, 0 to 8 percentslopes, extremelystony
C/D 76.6 6.4%
317B Scituate fine sandy loam,3 to 8 percent slopes,extremely stony
D 7.4 0.6%
335B Rainbow silt loam, 3 to 8percent slopes
C/D 11.0 0.9%
336B Rainbow silt loam, 3 to 8percent slopes, verystony
C/D 40.5 3.4%
415B Narragansett silt loam, 3to 8 percent slopes
A 32.1 2.7%
416B Narragansett silt loam, 3to 8 percent slopes,very stony
A 155.7 13.1%
416C Narragansett silt loam, 8to 15 percent slopes,very stony
A 48.3 4.1%
416D Narragansett silt loam,15 to 25 percentslopes, very stony
A 14.9 1.3%
422C Canton fine sandy loam,8 to 15 percent slopes,extremely stony
A 0.6 0.1%
626B Merrimac-Urban landcomplex, 0 to 8percent slopes
A 58.8 4.9%
653 Udorthents, sandy 25.0 2.1%
654 Udorthents, loamy 68.4 5.8%
655 Udorthents, wetsubstratum
6.6 0.6%
Hydrologic Soil Group—Middlesex County, Massachusetts
Natural ResourcesConservation Service
Web Soil SurveyNational Cooperative Soil Survey
5/18/2015Page 4 of 5
F - 6

Hydrologic Soil Group— Summary by Map Unit — Middlesex County, Massachusetts (MA017)
Map unit symbol Map unit name Rating Acres in AOI Percent of AOI
656 Udorthents-Urban landcomplex
141.1 11.9%
Totals for Area of Interest 1,189.8 100.0%
Description
Hydrologic soil groups are based on estimates of runoff potential. Soils areassigned to one of four groups according to the rate of water infiltration when thesoils are not protected by vegetation, are thoroughly wet, and receive precipitationfrom long-duration storms.
The soils in the United States are assigned to four groups (A, B, C, and D) andthree dual classes (A/D, B/D, and C/D). The groups are defined as follows:
Group A. Soils having a high infiltration rate (low runoff potential) when thoroughlywet. These consist mainly of deep, well drained to excessively drained sands orgravelly sands. These soils have a high rate of water transmission.
Group B. Soils having a moderate infiltration rate when thoroughly wet. Theseconsist chiefly of moderately deep or deep, moderately well drained or well drainedsoils that have moderately fine texture to moderately coarse texture. These soilshave a moderate rate of water transmission.
Group C. Soils having a slow infiltration rate when thoroughly wet. These consistchiefly of soils having a layer that impedes the downward movement of water orsoils of moderately fine texture or fine texture. These soils have a slow rate of watertransmission.
Group D. Soils having a very slow infiltration rate (high runoff potential) whenthoroughly wet. These consist chiefly of clays that have a high shrink-swellpotential, soils that have a high water table, soils that have a claypan or clay layerat or near the surface, and soils that are shallow over nearly impervious material.These soils have a very slow rate of water transmission.
If a soil is assigned to a dual hydrologic group (A/D, B/D, or C/D), the first letter isfor drained areas and the second is for undrained areas. Only the soils that in theirnatural condition are in group D are assigned to dual classes.
Rating Options
Aggregation Method: Dominant Condition
Component Percent Cutoff: None Specified
Tie-break Rule: Higher
Hydrologic Soil Group—Middlesex County, Massachusetts
Natural ResourcesConservation Service
Web Soil SurveyNational Cooperative Soil Survey
5/18/2015Page 5 of 5
F - 7

Depth to Water Table—Middlesex County, Massachusetts
Natural ResourcesConservation Service
Web Soil SurveyNational Cooperative Soil Survey
5/18/2015Page 1 of 5
4680
300
4680
600
4680
900
4681
200
4681
500
4681
800
4682
100
4682
400
4680
300
4680
600
4680
900
4681
200
4681
500
4681
800
4682
100
4682
400
294100 294400 294700 295000 295300 295600 295900 296200 296500 296800 297100 297400
294100 294400 294700 295000 295300 295600 295900 296200 296500 296800 297100 297400
42° 16' 4'' N71
° 2
9' 5
1'' W
42° 16' 4'' N
71° 2
7' 1
9'' W
42° 14' 51'' N
71° 2
9' 5
1'' W
42° 14' 51'' N
71° 2
7' 1
9'' W
N
Map projection: Web Mercator Corner coordinates: WGS84 Edge tics: UTM Zone 19N WGS840 500 1000 2000 3000
Feet0 200 400 800 1200
MetersMap Scale: 1:15,900 if printed on A landscape (11" x 8.5") sheet.
F - 8

MAP LEGEND MAP INFORMATION
Area of Interest (AOI)Area of Interest (AOI)
SoilsSoil Rating Polygons
0 - 25
25 - 50
50 - 100
100 - 150
150 - 200
> 200
Not rated or not available
Soil Rating Lines0 - 25
25 - 50
50 - 100
100 - 150
150 - 200
> 200
Not rated or not available
Soil Rating Points0 - 25
25 - 50
50 - 100
100 - 150
150 - 200
> 200
Not rated or not available
Water FeaturesStreams and Canals
TransportationRails
Interstate Highways
US Routes
Major Roads
Local Roads
BackgroundAerial Photography
The soil surveys that comprise your AOI were mapped at 1:25,000.
Please rely on the bar scale on each map sheet for mapmeasurements.
Source of Map: Natural Resources Conservation ServiceWeb Soil Survey URL: http://websoilsurvey.nrcs.usda.govCoordinate System: Web Mercator (EPSG:3857)
Maps from the Web Soil Survey are based on the Web Mercatorprojection, which preserves direction and shape but distortsdistance and area. A projection that preserves area, such as theAlbers equal-area conic projection, should be used if more accuratecalculations of distance or area are required.
This product is generated from the USDA-NRCS certified data as ofthe version date(s) listed below.
Soil Survey Area: Middlesex County, MassachusettsSurvey Area Data: Version 14, Sep 19, 2014
Soil map units are labeled (as space allows) for map scales 1:50,000or larger.
Date(s) aerial images were photographed: Sep 12, 2014—Sep28, 2014
The orthophoto or other base map on which the soil lines werecompiled and digitized probably differs from the backgroundimagery displayed on these maps. As a result, some minor shiftingof map unit boundaries may be evident.
Depth to Water Table—Middlesex County, Massachusetts
Natural ResourcesConservation Service
Web Soil SurveyNational Cooperative Soil Survey
5/18/2015Page 2 of 5
F - 9
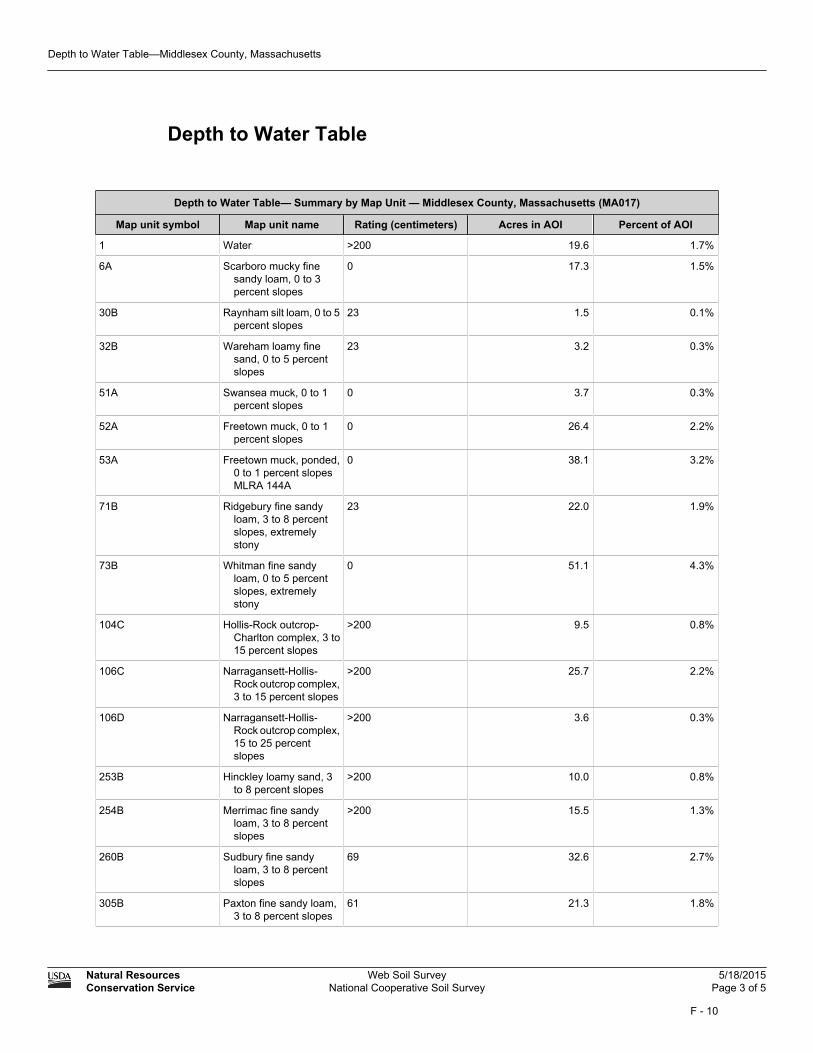
Depth to Water Table
Depth to Water Table— Summary by Map Unit — Middlesex County, Massachusetts (MA017)
Map unit symbol Map unit name Rating (centimeters) Acres in AOI Percent of AOI
1 Water >200 19.6 1.7%
6A Scarboro mucky finesandy loam, 0 to 3percent slopes
0 17.3 1.5%
30B Raynham silt loam, 0 to 5percent slopes
23 1.5 0.1%
32B Wareham loamy finesand, 0 to 5 percentslopes
23 3.2 0.3%
51A Swansea muck, 0 to 1percent slopes
0 3.7 0.3%
52A Freetown muck, 0 to 1percent slopes
0 26.4 2.2%
53A Freetown muck, ponded,0 to 1 percent slopesMLRA 144A
0 38.1 3.2%
71B Ridgebury fine sandyloam, 3 to 8 percentslopes, extremelystony
23 22.0 1.9%
73B Whitman fine sandyloam, 0 to 5 percentslopes, extremelystony
0 51.1 4.3%
104C Hollis-Rock outcrop-Charlton complex, 3 to15 percent slopes
>200 9.5 0.8%
106C Narragansett-Hollis-Rock outcrop complex,3 to 15 percent slopes
>200 25.7 2.2%
106D Narragansett-Hollis-Rock outcrop complex,15 to 25 percentslopes
>200 3.6 0.3%
253B Hinckley loamy sand, 3to 8 percent slopes
>200 10.0 0.8%
254B Merrimac fine sandyloam, 3 to 8 percentslopes
>200 15.5 1.3%
260B Sudbury fine sandyloam, 3 to 8 percentslopes
69 32.6 2.7%
305B Paxton fine sandy loam,3 to 8 percent slopes
61 21.3 1.8%
Depth to Water Table—Middlesex County, Massachusetts
Natural ResourcesConservation Service
Web Soil SurveyNational Cooperative Soil Survey
5/18/2015Page 3 of 5
F - 10

Depth to Water Table— Summary by Map Unit — Middlesex County, Massachusetts (MA017)
Map unit symbol Map unit name Rating (centimeters) Acres in AOI Percent of AOI
305C Paxton fine sandy loam,8 to 15 percent slopes
50 12.2 1.0%
307B Paxton fine sandy loam,3 to 8 percent slopes,extremely stony
50 25.0 2.1%
307C Paxton fine sandy loam,8 to 15 percent slopes,extremely stony
50 30.6 2.6%
307D Paxton fine sandy loam,15 to 25 percentslopes, extremelystony
50 52.5 4.4%
310B Woodbridge fine sandyloam, 3 to 8 percentslopes
46 81.3 6.8%
312B Woodbridge fine sandyloam, 0 to 8 percentslopes, extremelystony
46 76.6 6.4%
317B Scituate fine sandy loam,3 to 8 percent slopes,extremely stony
50 7.4 0.6%
335B Rainbow silt loam, 3 to 8percent slopes
50 11.0 0.9%
336B Rainbow silt loam, 3 to 8percent slopes, verystony
50 40.5 3.4%
415B Narragansett silt loam, 3to 8 percent slopes
>200 32.1 2.7%
416B Narragansett silt loam, 3to 8 percent slopes,very stony
>200 155.7 13.1%
416C Narragansett silt loam, 8to 15 percent slopes,very stony
>200 48.3 4.1%
416D Narragansett silt loam,15 to 25 percentslopes, very stony
>200 14.9 1.3%
422C Canton fine sandy loam,8 to 15 percent slopes,extremely stony
>200 0.6 0.1%
626B Merrimac-Urban landcomplex, 0 to 8percent slopes
>200 58.8 4.9%
653 Udorthents, sandy >200 25.0 2.1%
654 Udorthents, loamy >200 68.4 5.8%
655 Udorthents, wetsubstratum
>200 6.6 0.6%
Depth to Water Table—Middlesex County, Massachusetts
Natural ResourcesConservation Service
Web Soil SurveyNational Cooperative Soil Survey
5/18/2015Page 4 of 5
F - 11

Depth to Water Table— Summary by Map Unit — Middlesex County, Massachusetts (MA017)
Map unit symbol Map unit name Rating (centimeters) Acres in AOI Percent of AOI
656 Udorthents-Urban landcomplex
>200 141.1 11.9%
Totals for Area of Interest 1,189.8 100.0%
Description
"Water table" refers to a saturated zone in the soil. It occurs during specifiedmonths. Estimates of the upper limit are based mainly on observations of the watertable at selected sites and on evidence of a saturated zone, namely grayish colors(redoximorphic features) in the soil. A saturated zone that lasts for less than a monthis not considered a water table.
This attribute is actually recorded as three separate values in the database. A lowvalue and a high value indicate the range of this attribute for the soil component. A"representative" value indicates the expected value of this attribute for thecomponent. For this soil property, only the representative value is used.
Rating Options
Units of Measure: centimeters
Aggregation Method: Dominant Component
Component Percent Cutoff: None Specified
Tie-break Rule: Lower
Interpret Nulls as Zero: No
Beginning Month: January
Ending Month: December
Depth to Water Table—Middlesex County, Massachusetts
Natural ResourcesConservation Service
Web Soil SurveyNational Cooperative Soil Survey
5/18/2015Page 5 of 5
F - 12

Summary of Previous Soil Explorations: As noted in the Stormwater Management Summary the project proposed to modify a previous approval. The 2007 SWM Report included hundreds of test holes and borings. Kelly Engineering Group, Inc. have chosen to provide a portions of the previous soil testing that demonstrate that the NRCS soils mapping is accurate and the proposed recharge components will have more than 2’ separation to seasonal high groundwater. The attached Soil Exploration Exhibit shows the extend of the previous soil testing with a summary of results including depth to refusal, water, and percolation rate.
F - 13

SOILEXPLORATION
EXHIBITTRANSIT APARTMENTS
ASHLAND, MA
ASHLAND RAIL
F - 14

F - 15

F - 16

F - 17

F - 18
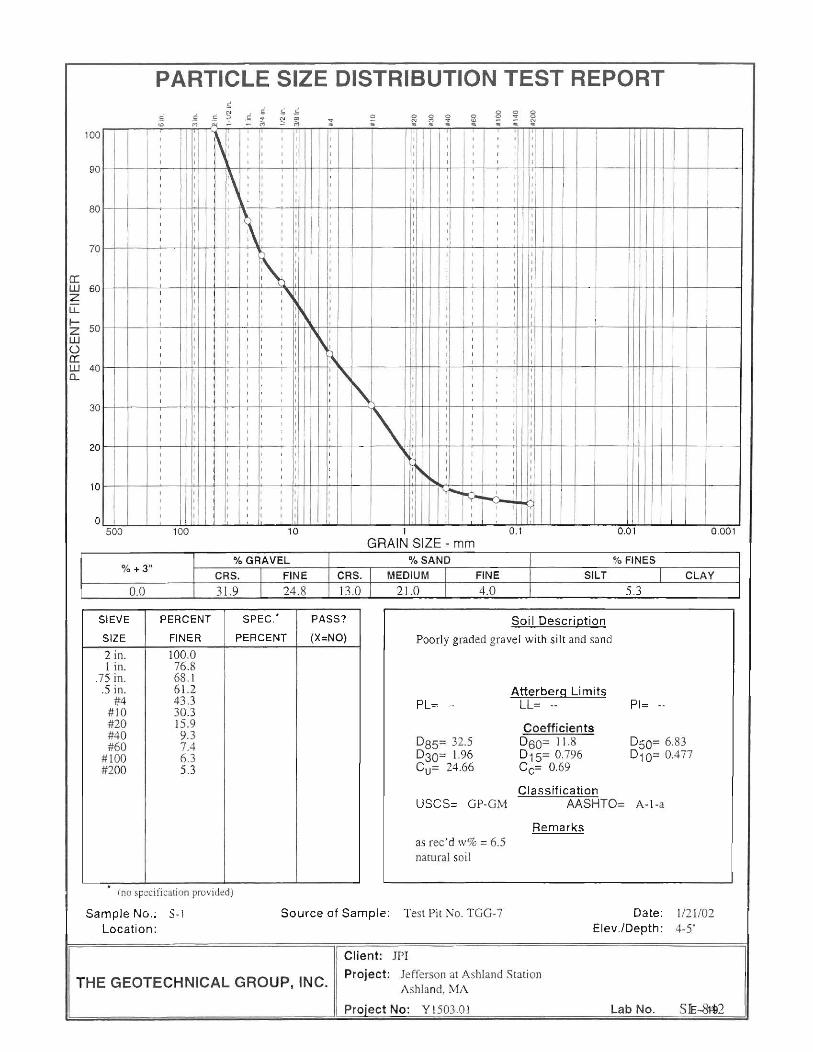
F - 19

F - 20

F - 21

Site Locus
USGS Framingham Quad1987, Metric
F - 22
