dave schoch ford asia pacificcorporate.ford.com/content/dam/corporate/en/investors/investor... ·...
TRANSCRIPT
SLIDE 9
Ford Asia PacificSeptember 15, 2014
Dave SchochGroup Vice President, Ford Motor Company
President, Asia PacificMorgan Stanley 2ndAnnual Laguna Conference
September 15, 2014
SLIDE 1
AGENDA
• Our Strategy
• Business Environment
• Executing Our Plan
• Achieving Effective Scale
• Our Progress
• Q & A
SLIDE 2
Profits & Cash
PROFITABLE GROWTH FOR ALL
Profits & Cash
PROFITABLE GROWTH FOR ALL
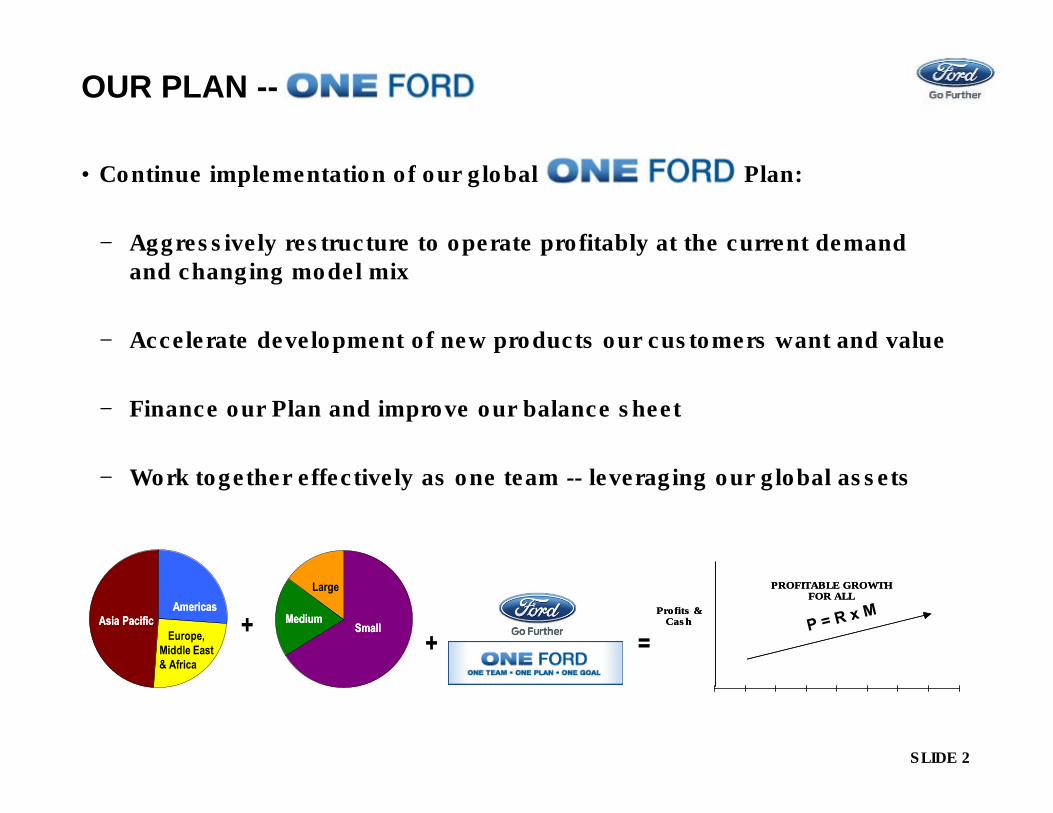
OUR PLAN --
• Continue implementation of our global Plan:
− Aggressively restructure to operate profitably at the current demandand changing model mix
− Accelerate development of new products our customers want and value
− Finance our Plan and improve our balance sheet
− Work together effectively as one team -- leveraging our global assets
++ =
SmallSmallMediumMedium
Large
Asia PacificAsia Pacific
AmericasAmericas
Europe,
Middle East
& Africa
SLIDE 3
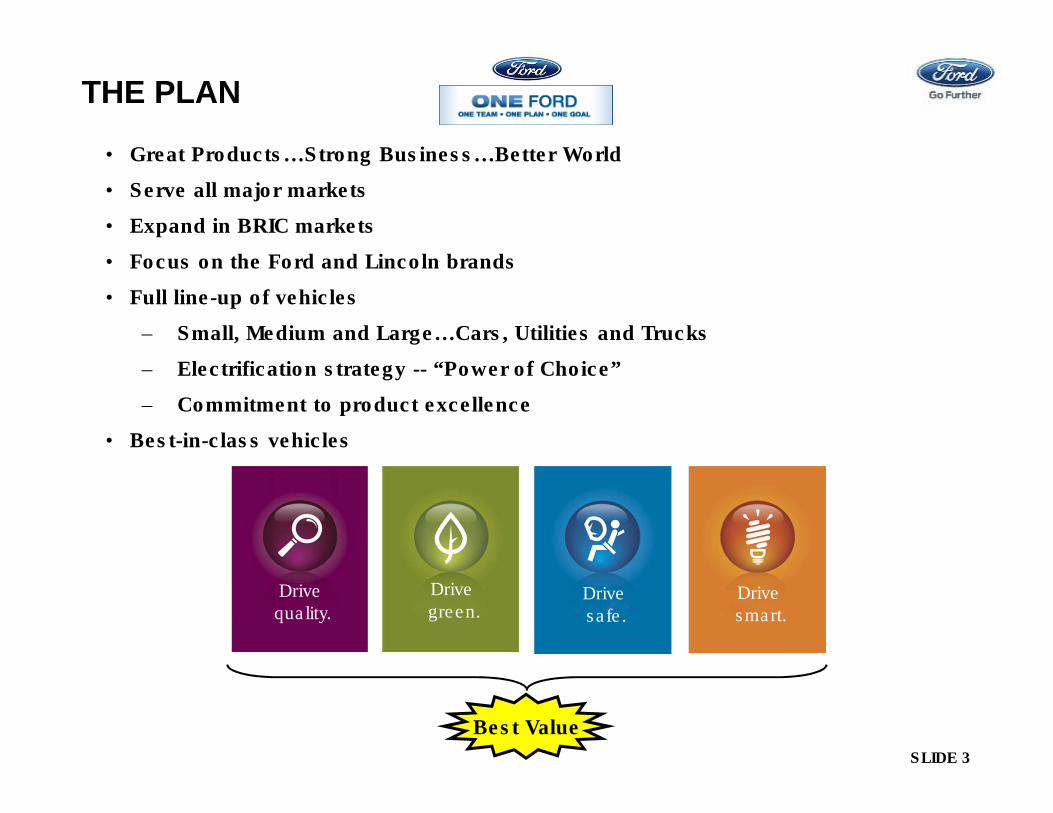
THE PLAN
• Great Products…Strong Business…Better World
• Serve all major markets
• Expand in BRIC markets
• Focus on the Ford and Lincoln brands
• Full line-up of vehicles
– Small, Medium and Large…Cars, Utilities and Trucks
– Electrification strategy -- “Power of Choice”
– Commitment to product excellence
• Best-in-class vehicles
Drive quality.
Drive green.
Drive safe.
Drive smart.
Best Value
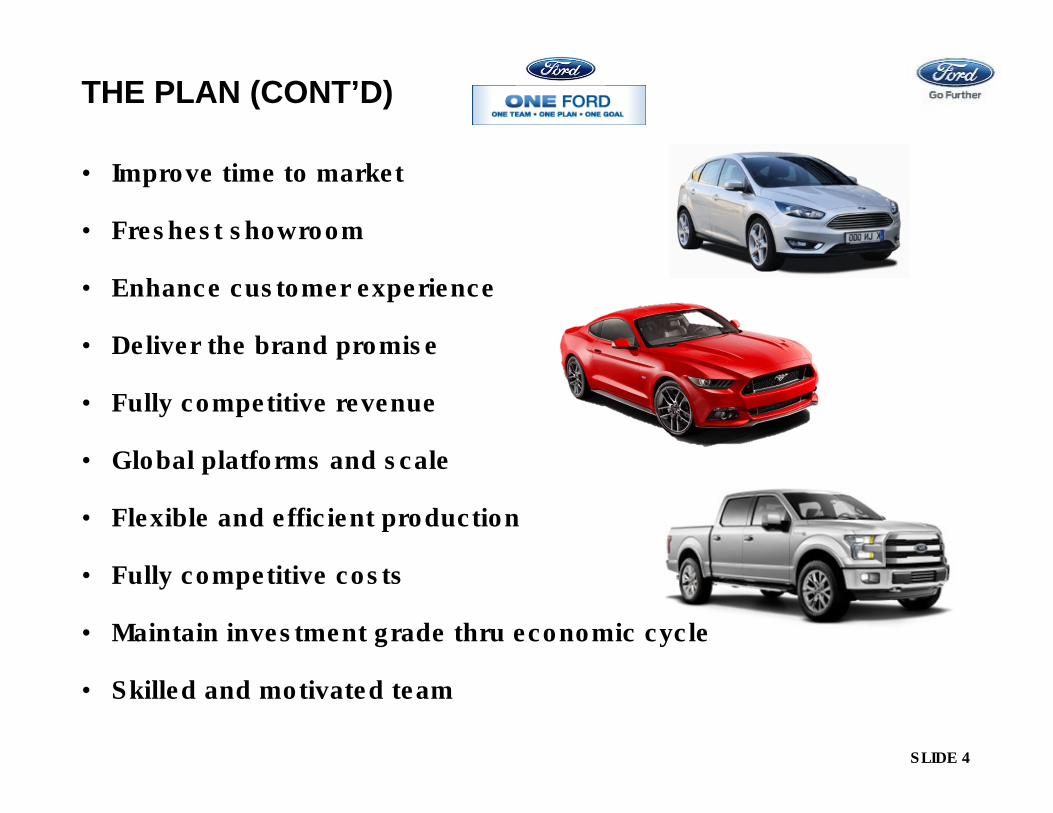
SLIDE 4
• Improve time to market
• Freshest showroom
• Enhance customer experience
• Deliver the brand promise
• Fully competitive revenue
• Global platforms and scale
• Flexible and efficient production
• Fully competitive costs
• Maintain investment grade thru economic cycle
• Skilled and motivated team
THE PLAN (CONT’D)

SLIDE 5
B-Platform (Fiesta) C/D Platform (Fusion / Mondeo)C-Platform (Focus)
Full-Size Pickup (F-150) Over 8500 Pickup (Super Duty)
Sports Car (Mustang) Light Truck (Ranger)D-Platform (Explorer)
Full-Size Van (Transit)
GLOBAL CORE PLATFORMS
SLIDE 6
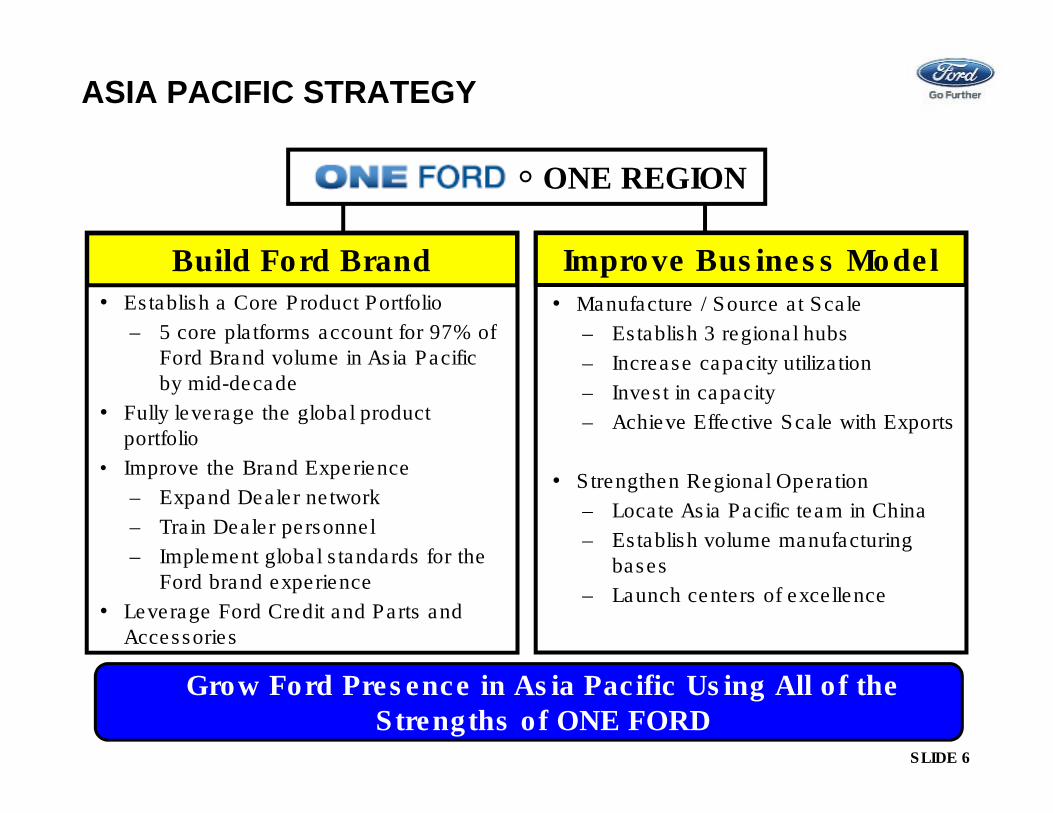
ASIA PACIFIC STRATEGY
Grow Ford Presence in Asia Pacific Using All of the Strengths of ONE FORD
• Establish a Core Product Portfolio
– 5 core platforms account for 97% of Ford Brand volume in Asia Pacific by mid-decade
• Fully leverage the global product portfolio
• Improve the Brand Experience
– Expand Dealer network
– Train Dealer personnel
– Implement global standards for the Ford brand experience
• Leverage Ford Credit and Parts and Accessories
• Manufacture / Source at Scale
– Establish 3 regional hubs
– Increase capacity utilization
– Invest in capacity
– Achieve Effective Scale with Exports
• Strengthen Regional Operation
– Locate Asia Pacific team in China
– Establish volume manufacturing bases
– Launch centers of excellence
Build Ford Brand
ONE REGION
Improve Business Model

SLIDE 7
FORD IN CHINA
Ford Consists Of Four Distinct Activities In China
Low Volume
Brand-Enhancing
Import
100% Ford
Trucks and
Commercial
Local
Manufacture
32% Equity
Share
Premium
Passenger
Import
100% Ford
Non-Premium
Passenger
Local
Manufacture
Unconsolidated
JV (50%)
ChanganFord (CAF)
JMCFord
ImportLincoln
SLIDE 8
AGENDA
• Our Strategy
• Business Environment
• Executing Our Plan
• Achieving Effective Scale
• Our Progress
• Q & A
SLIDE 9
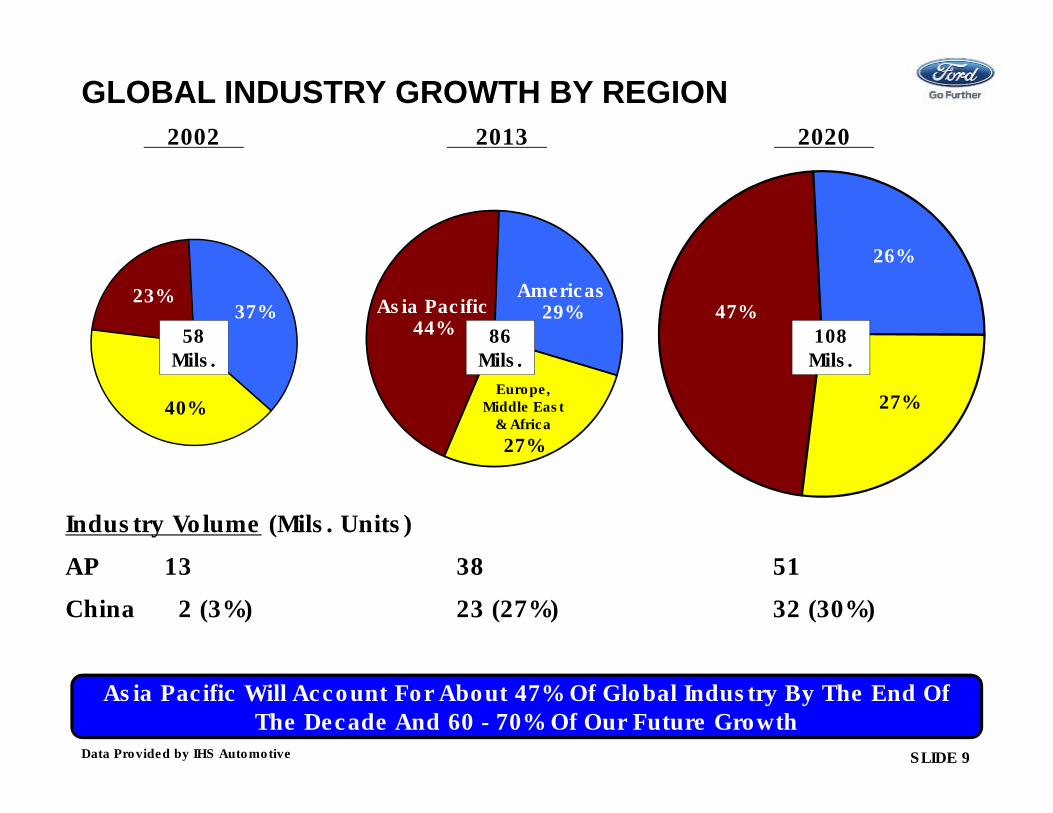
GLOBAL INDUSTRY GROWTH BY REGION
Asia Pacific Will Account For About 47% Of Global Industry By The End Of The Decade And 60 - 70% Of Our Future Growth
2002 2013 2020
40%
23%37%
Europe, Middle East
& Africa
27%
Americas29%Asia Pacific
44%
27%
26%
47%108
Mils.86
Mils.58
Mils.
Industry Volume (Mils. Units)
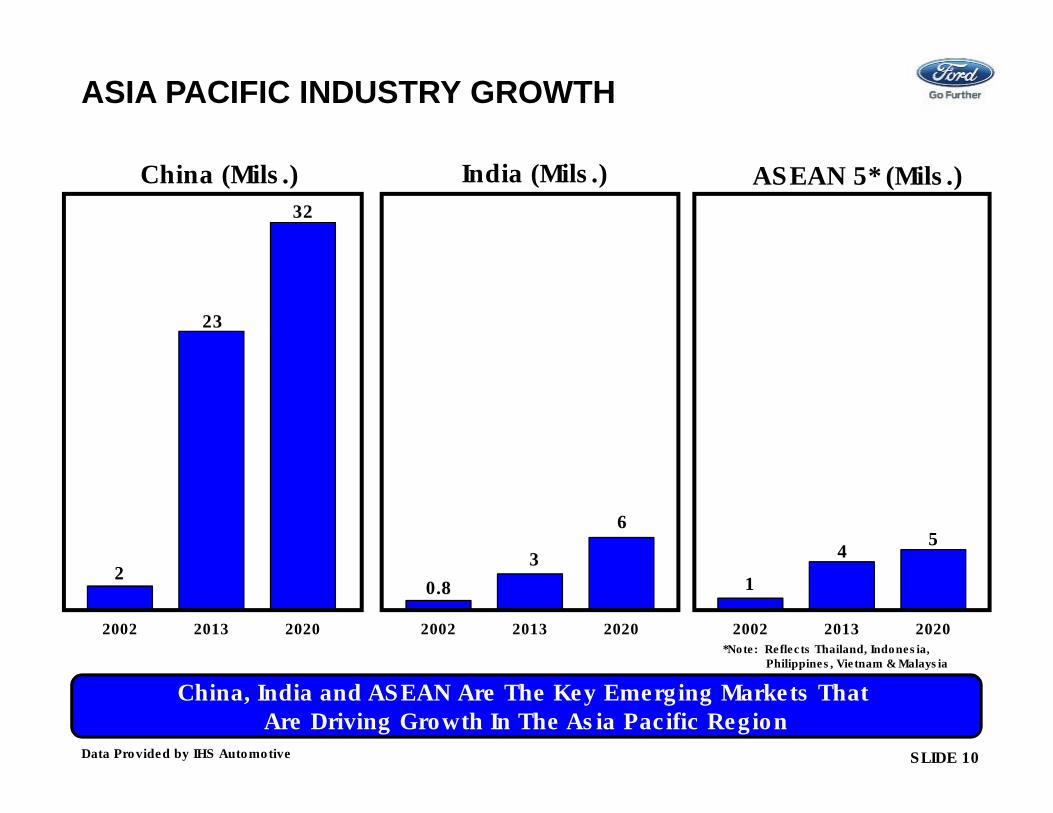
AP 13 38 51
China 12 (3%) 23 (27%) 32 (30%)
Data Provided by IHS Automotive
SLIDE 10
2002 2013 20202002 2013 20202002 2013 2020
China (Mils.) India (Mils.)
2
23
32
0.8
3
6
China, India and ASEAN Are The Key Emerging Markets That Are Driving Growth In The Asia Pacific Region
ASEAN 5* (Mils.)
5
1
4
Data Provided by IHS Automotive
*Note: Reflects Thailand, Indonesia,Philippines, Vietnam & Malaysia
ASIA PACIFIC INDUSTRY GROWTH

SLIDE 11
256 Million
357 Million
$(TBD)
Urban Income Distribution Trend
2012 2022
< $9,000
Upper Middle$16,000-$34,000
Middle Class$9,000 - $16,000
> $34,000
14%
29%
54%
3%
53%
16%
22%
9%
CHINA INCOME TREND AND URBANIZATION
Urbanization Continues; Middle/Upper Classes Grow To 84% Of Urban Households
$(TBD)
Growth Of Urban Households
2012 2022
Data Provided by McKinsey
SLIDE 12
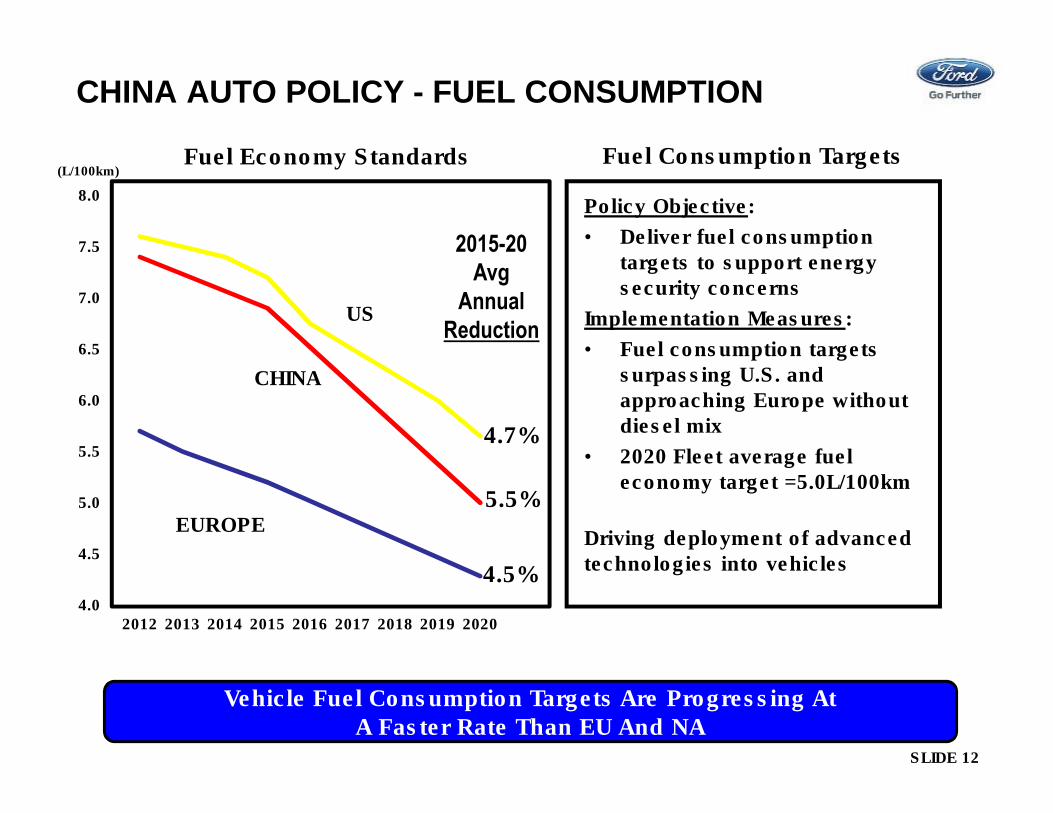
CHINA AUTO POLICY - FUEL CONSUMPTION
Fuel Consumption Targets
Vehicle Fuel Consumption Targets Are Progressing At A Faster Rate Than EU And NA
Policy Objective:
• Deliver fuel consumption targets to support energy security concerns
Implementation Measures:
• Fuel consumption targets surpassing U.S. and approaching Europe without diesel mix
• 2020 Fleet average fuel economy target =5.0L/100km
Driving deployment of advanced technologies into vehicles
Fuel Economy Standards
4.0
4.5
5.0
5.5
6.0
6.5
7.0
7.5
8.0
2012 2013 2014 2015 2016 2017 2018 2019 2020
CHINA
US
EUROPE
(L/100km)
2015-20
Avg
Annual
Reduction
4.7%
5.5%
4.5%
SLIDE 13
AGENDA
• Our Strategy
• Business Environment
• Executing Our Plan
• Achieving Effective Scale
• Our Progress
• Q & A
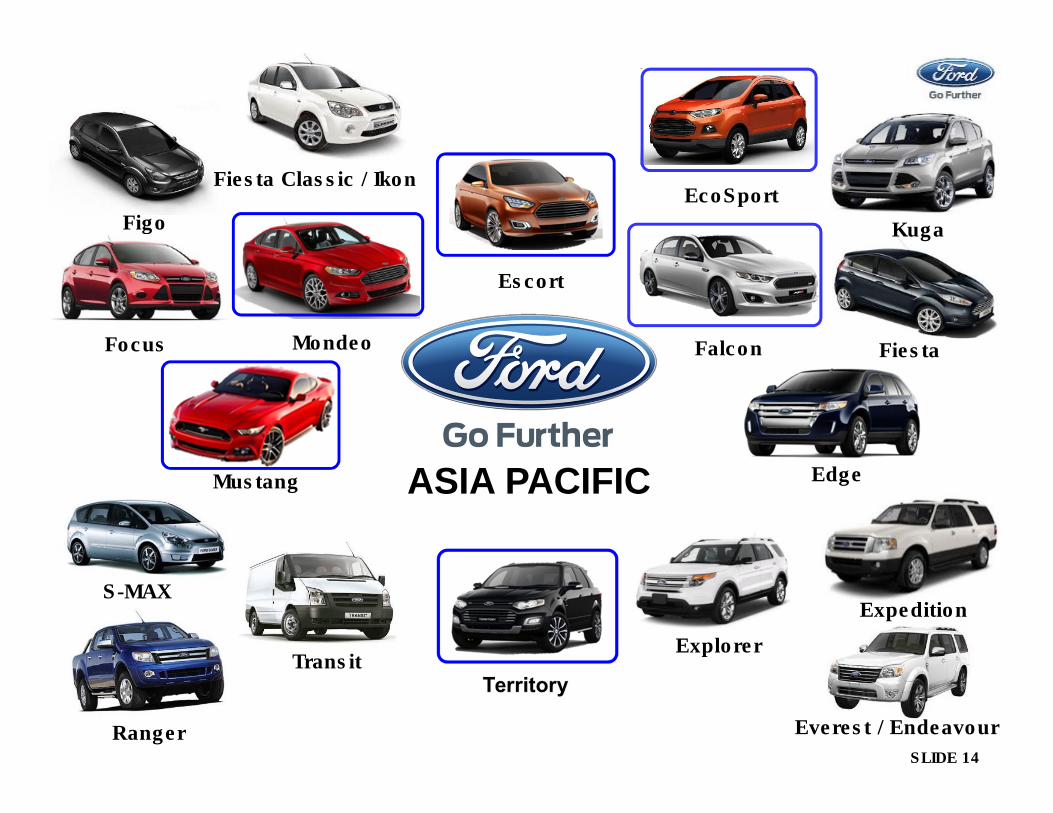
SLIDE 14
Edge
Fiesta
Figo
Focus
Kuga
Fiesta Classic / Ikon
Everest / Endeavour
S-MAX
Ranger
Transit Explorer
Expedition
Escort
EcoSport
Falcon
Mustang ASIA PACIFIC
Mondeo
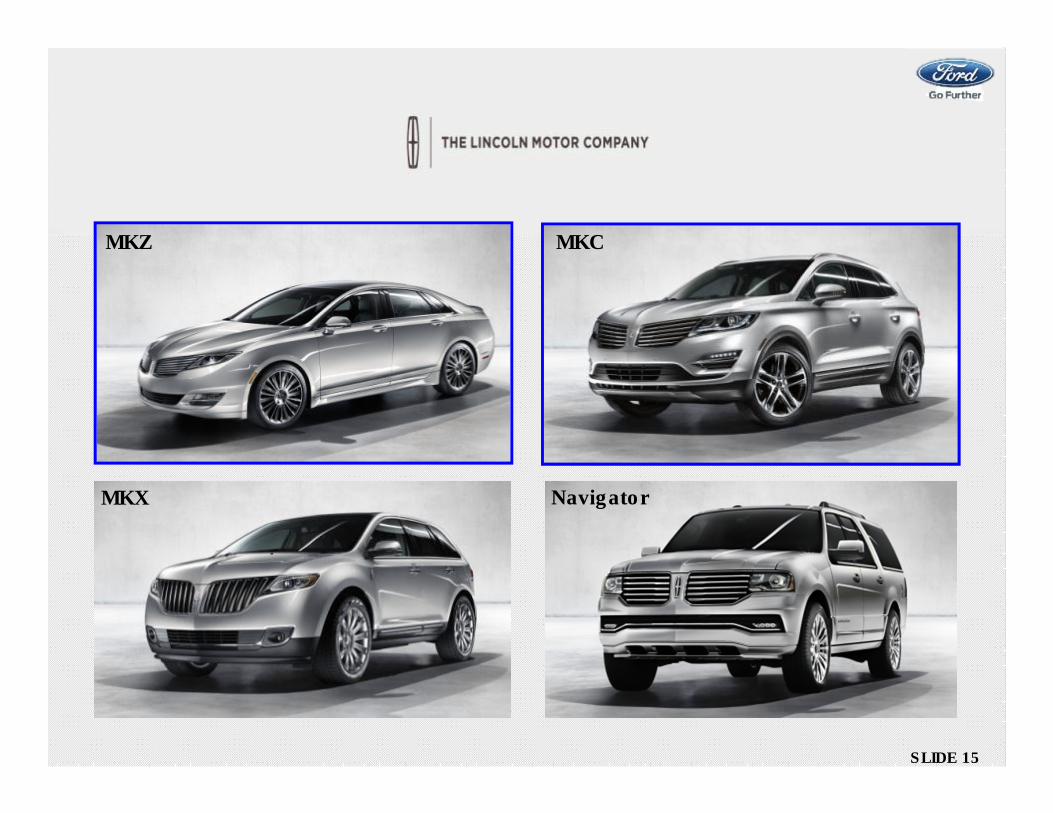
SLIDE 15
MKCMKZ
MKX Navigator
SLIDE 16
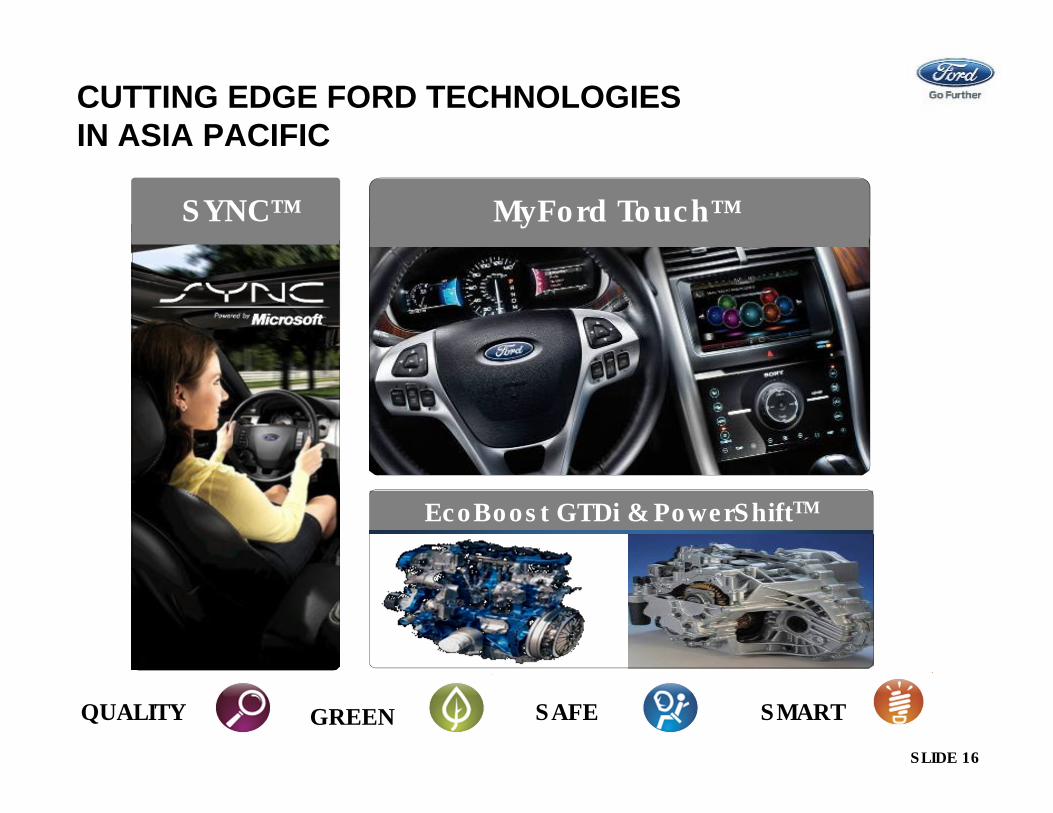
CUTTING EDGE FORD TECHNOLOGIES
IN ASIA PACIFIC
QUALITY GREEN SAFE SMART
EcoBoost GTDi & PowerShiftTM
MyFord Touch™SYNC™
SLIDE 17
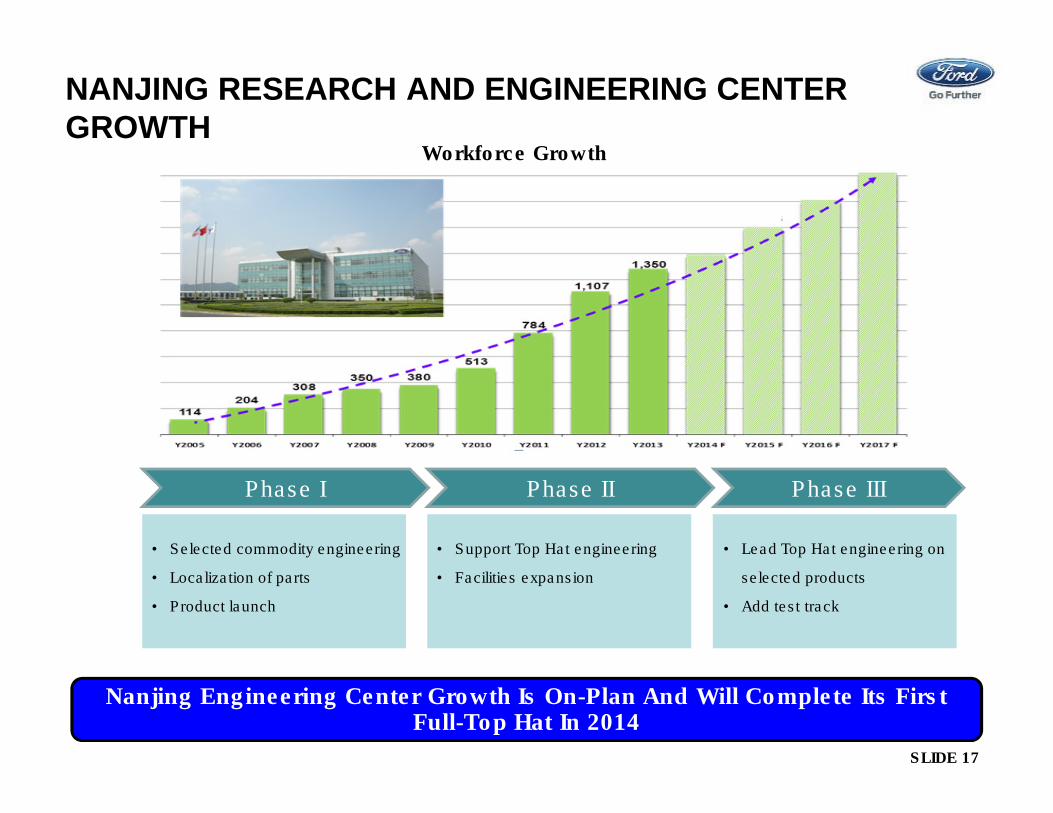
Nanjing Engineering Center Growth Is On-Plan And Will Complete Its First Full-Top Hat In 2014
NANJING RESEARCH AND ENGINEERING CENTER
GROWTH
Phase I Phase II
• Selected commodity engineering
• Localization of parts
• Product launch
• Support Top Hat engineering
• Facilities expansion
• Lead Top Hat engineering on
selected products
• Add test track
Phase III
Workforce Growth
SLIDE 18
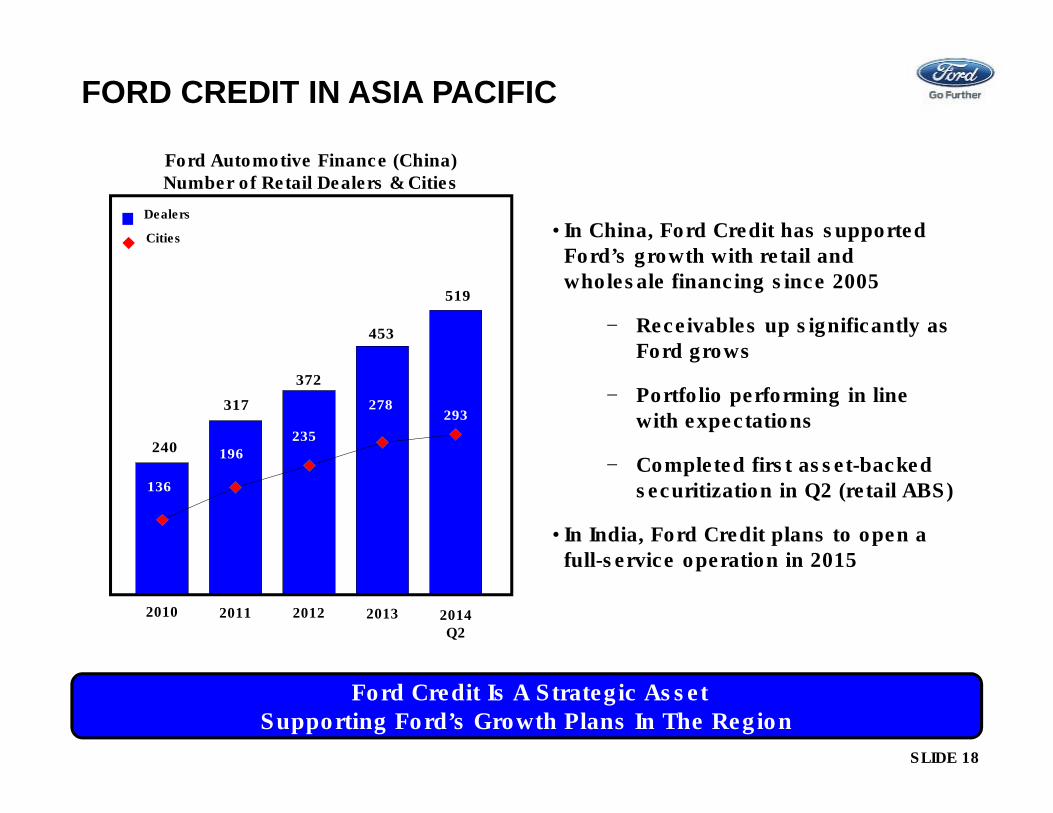
FORD CREDIT IN ASIA PACIFIC
• In China, Ford Credit has supported Ford’s growth with retail and wholesale financing since 2005
− Receivables up significantly as Ford grows
− Portfolio performing in line with expectations
− Completed first asset-backed securitization in Q2 (retail ABS)
• In India, Ford Credit plans to open a full-service operation in 2015
Ford Credit Is A Strategic AssetSupporting Ford’s Growth Plans In The Region
2011 2012 2013 2014Q2
2010
519
453
372
317
240
293278
235
196
136
Ford Automotive Finance (China) Number of Retail Dealers & Cities
Dealers
Cities
SLIDE 19
AGENDA
• Our Strategy
• Business Environment
• Executing Our Plan
• Achieving Effective Scale
• Our Progress
• Q & A
SLIDE 20
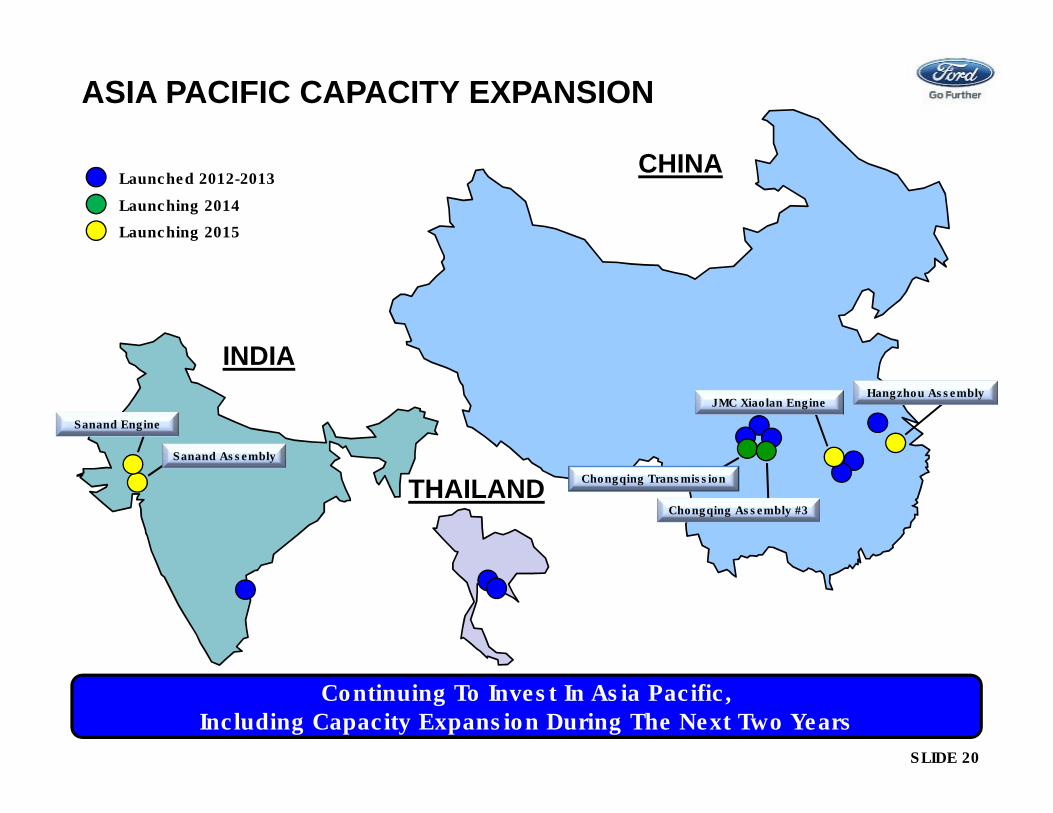
ASIA PACIFIC CAPACITY EXPANSION
CHINA
INDIA
Sanand Assembly
Sanand Engine
Launched 2012-2013
THAILANDChongqing Assembly #3
Chongqing Transmission
Hangzhou Assembly
Launching 2014
Launching 2015
Continuing To Invest In Asia Pacific, Including Capacity Expansion During The Next Two Years
JMC Xiaolan Engine
SLIDE 21
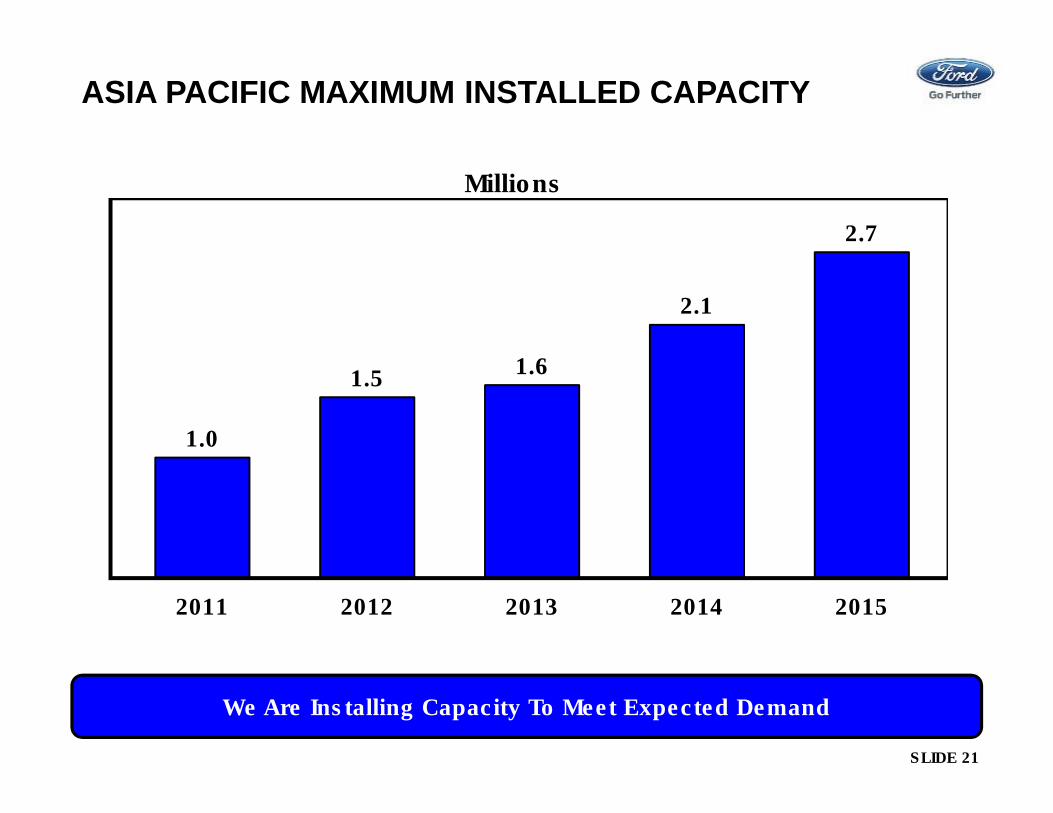
1.0
1.51.6
2.1
2.7
2011 2012 2013 2014 2015
Millions
We Are Installing Capacity To Meet Expected Demand
ASIA PACIFIC MAXIMUM INSTALLED CAPACITY
SLIDE 22
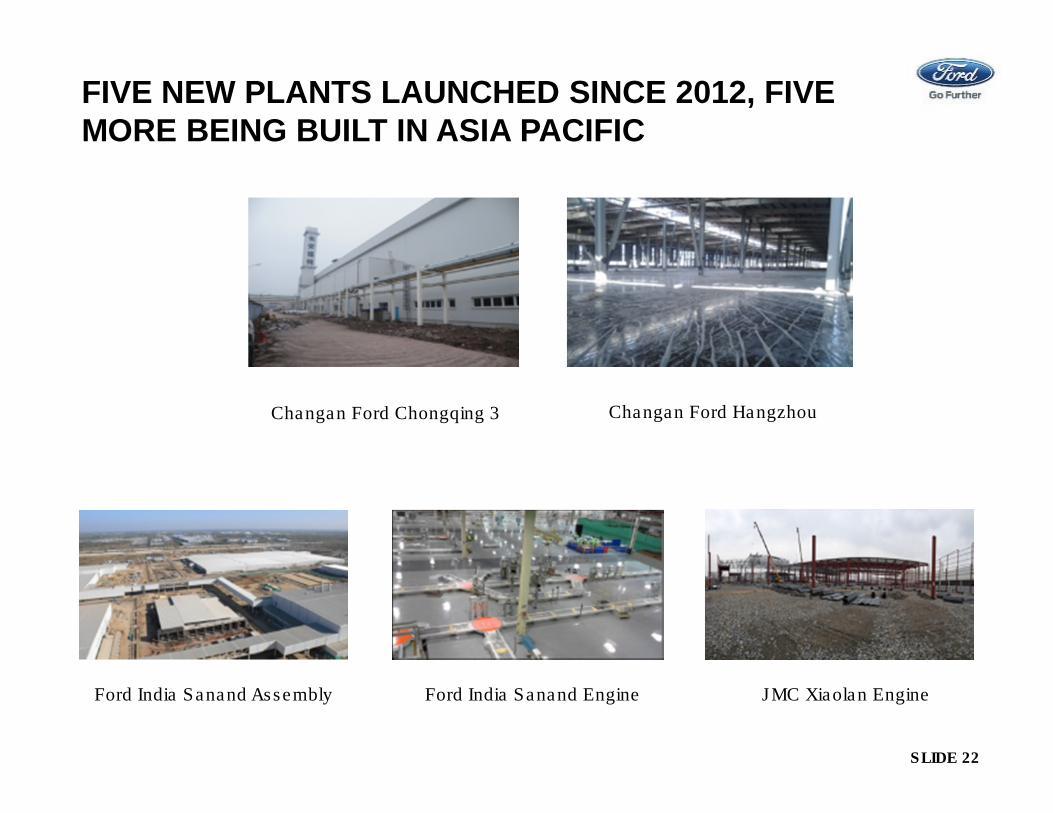
Changan Ford Chongqing 3 Changan Ford Hangzhou
Ford India Sanand Assembly Ford India Sanand Engine JMC Xiaolan Engine
FIVE NEW PLANTS LAUNCHED SINCE 2012, FIVE
MORE BEING BUILT IN ASIA PACIFIC
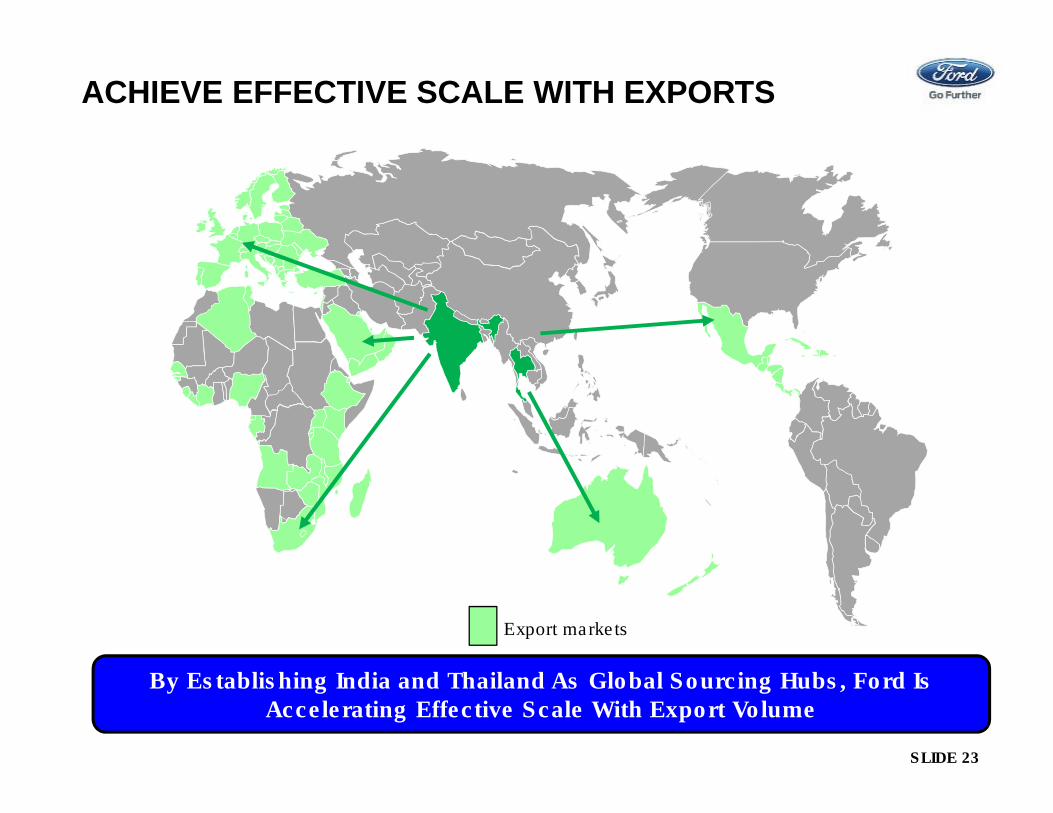
SLIDE 23
Export markets
By Establishing India and Thailand As Global Sourcing Hubs, Ford Is Accelerating Effective Scale With Export Volume
ACHIEVE EFFECTIVE SCALE WITH EXPORTS
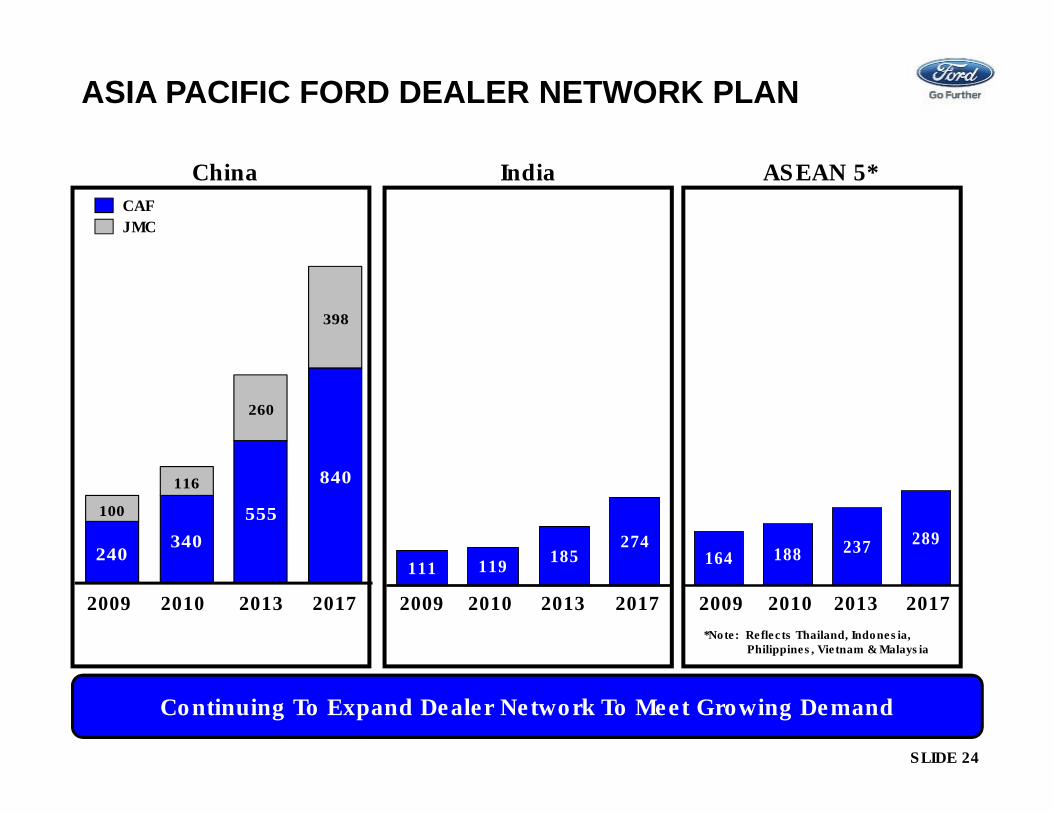
SLIDE 24
China India
111 119
274185
2009 2013 20172010
Continuing To Expand Dealer Network To Meet Growing Demand
ASEAN 5*
164 188289237
2009 2013 20172010
CAF
JMC
240340
555
840
100
116
260
398
2009 2013 20172010
*Note: Reflects Thailand, Indonesia,Philippines, Vietnam & Malaysia
ASIA PACIFIC FORD DEALER NETWORK PLAN

SLIDE 25
AGENDA
• Our Strategy
• Business Environment
• Executing Our Plan
• Achieving Effective Scale
• Our Progress
• Q & A
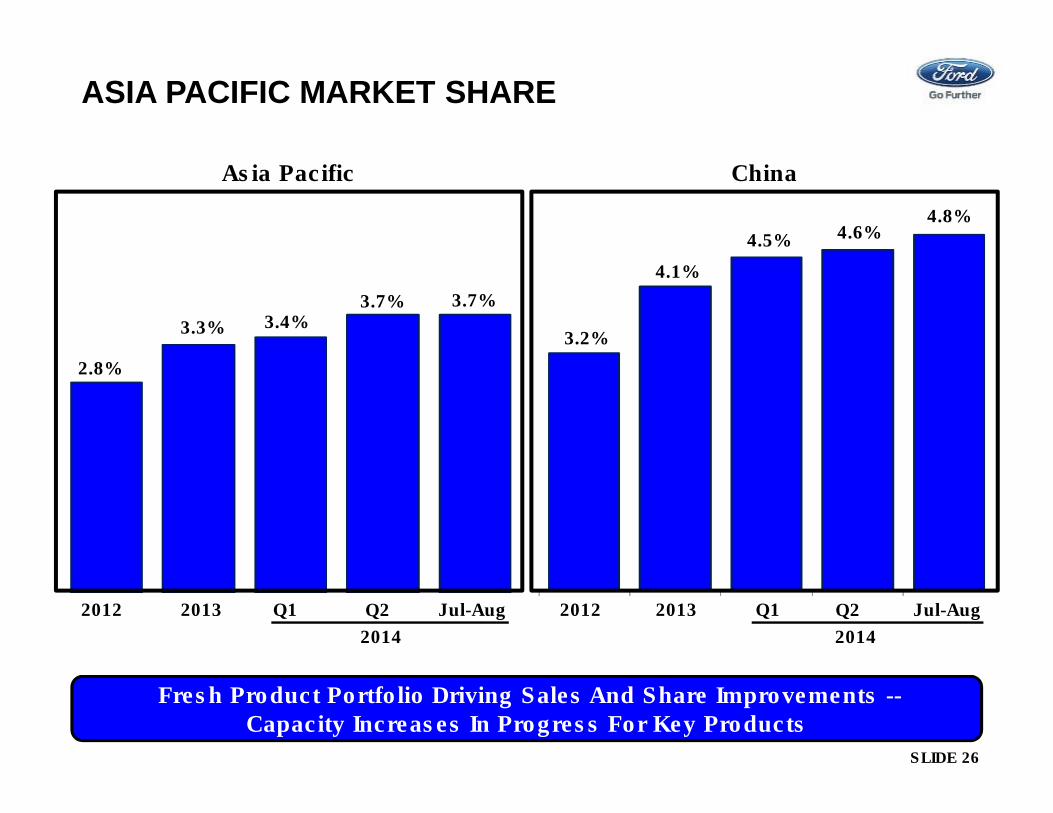
SLIDE 26
2.8%
3.3%
3.7%
Asia Pacific China
Fresh Product Portfolio Driving Sales And Share Improvements --Capacity Increases In Progress For Key Products
3.4%
ASIA PACIFIC MARKET SHARE
2012 2013 Jul-AugQ1
2014
3.2%
4.1%
4.8%
4.5%
2012 2013 Jul-AugQ1
2014
3.7%
Q2
4.6%
Q2
SLIDE 27
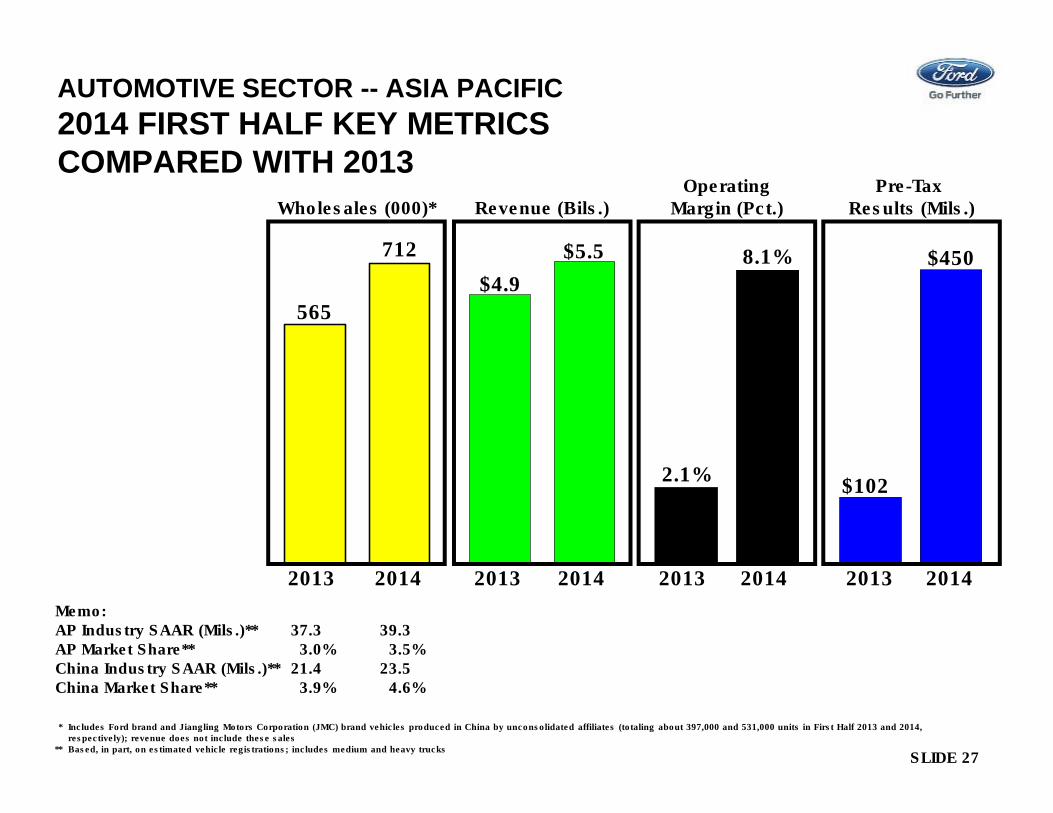
AUTOMOTIVE SECTOR -- ASIA PACIFIC
2014 FIRST HALF KEY METRICS
COMPARED WITH 2013
* Includes Ford brand and Jiangling Motors Corporation (JMC) brand vehicles produced in China by unconsolidated affiliates (totaling about 397,000 and 531,000 units in First Half 2013 and 2014, respectively); revenue does not include these sales
** Based, in part, on estimated vehicle registrations; includes medium and heavy trucks
565
$4.9
712 $5.5
Revenue (Bils.)Wholesales (000)*
$102
$450
Pre-Tax Results (Mils.)
2.1%
8.1%
OperatingMargin (Pct.)
Memo:AP Industry SAAR (Mils.)** 37.3 39.3AP Market Share** 3.0% 3.5%China Industry SAAR (Mils.)** 21.4 23.5China Market Share** 3.9% 4.6%
20142013 20142013 2014201320142013
SLIDE 28
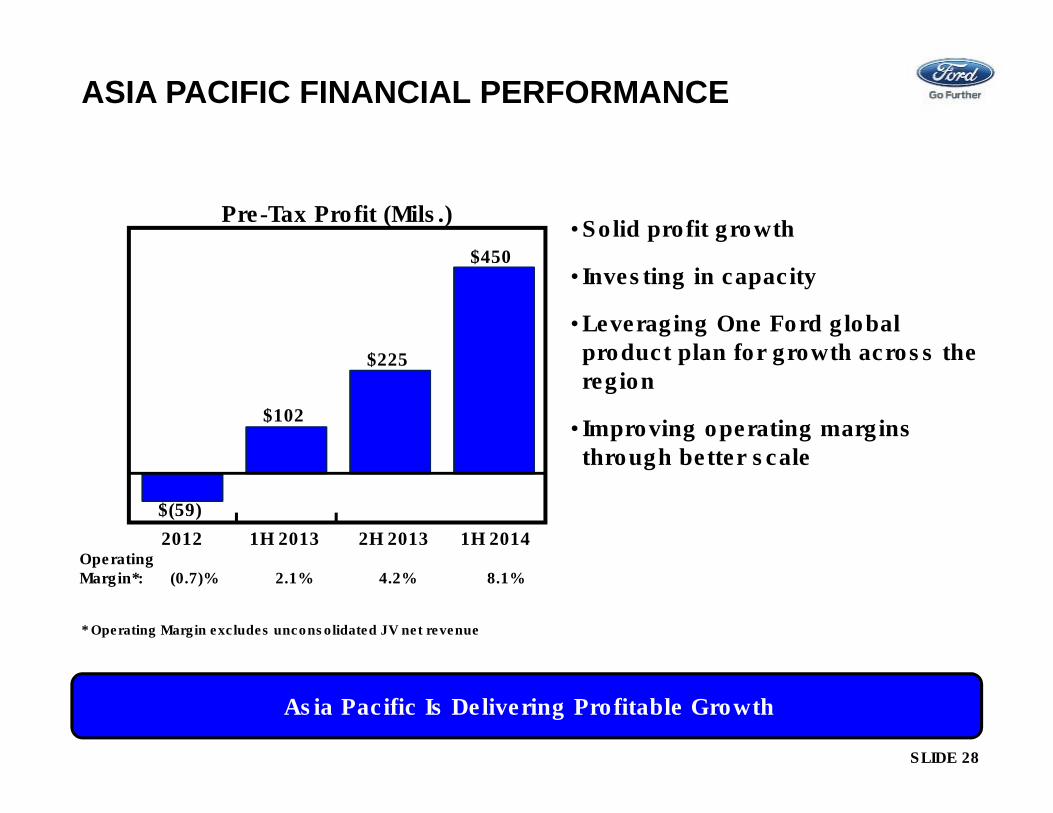
ASIA PACIFIC FINANCIAL PERFORMANCE
Pre-Tax Profit (Mils.)
$(59)
2012OperatingMargin*: (0.7)% 2.1% 4.2% 8.1%
$450
1H 2014
• Solid profit growth
• Investing in capacity
• Leveraging One Ford global product plan for growth across the region
• Improving operating margins through better scale
1H 2013
$102
* Operating Margin excludes unconsolidated JV net revenue
Asia Pacific Is Delivering Profitable Growth
$225
2H 2013

SLIDE 29
2014 KEY METRICS -- BUSINESS UNITS
Asia Pacific’s 2014 Outlook Is Higher Profit Than 2013
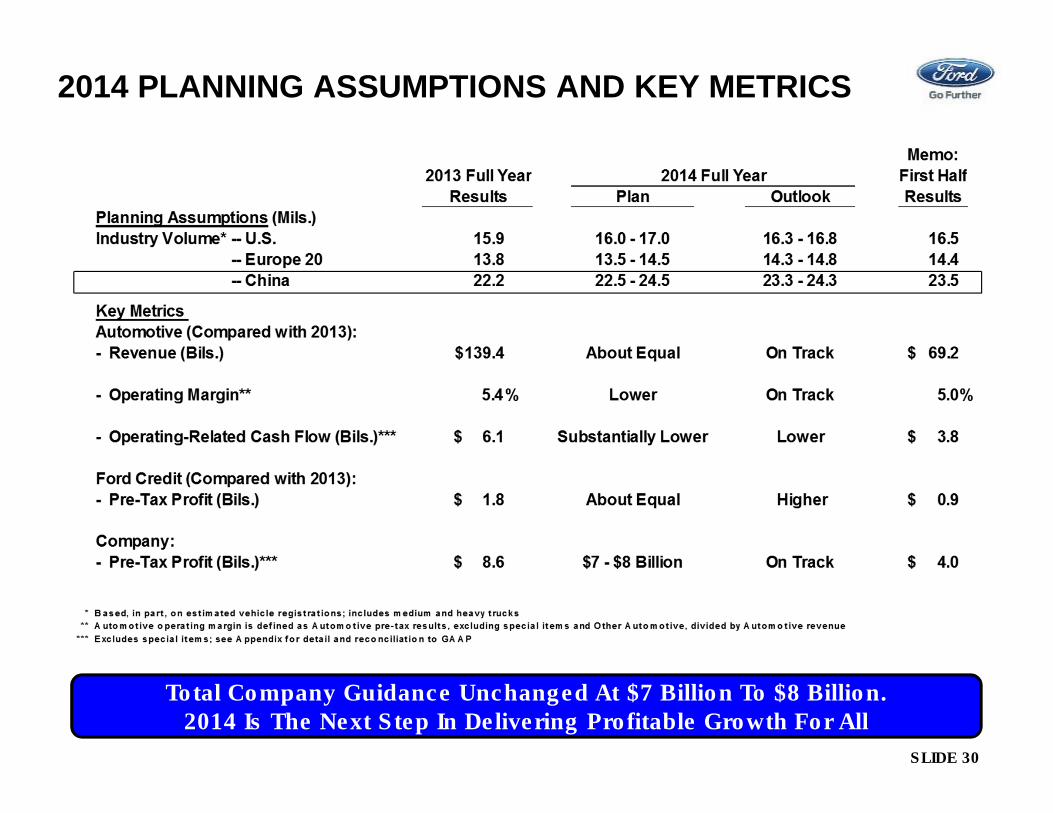
SLIDE 30
2014 PLANNING ASSUMPTIONS AND KEY METRICS
Total Company Guidance Unchanged At $7 Billion To $8 Billion.2014 Is The Next Step In Delivering Profitable Growth For All
SLIDE 31
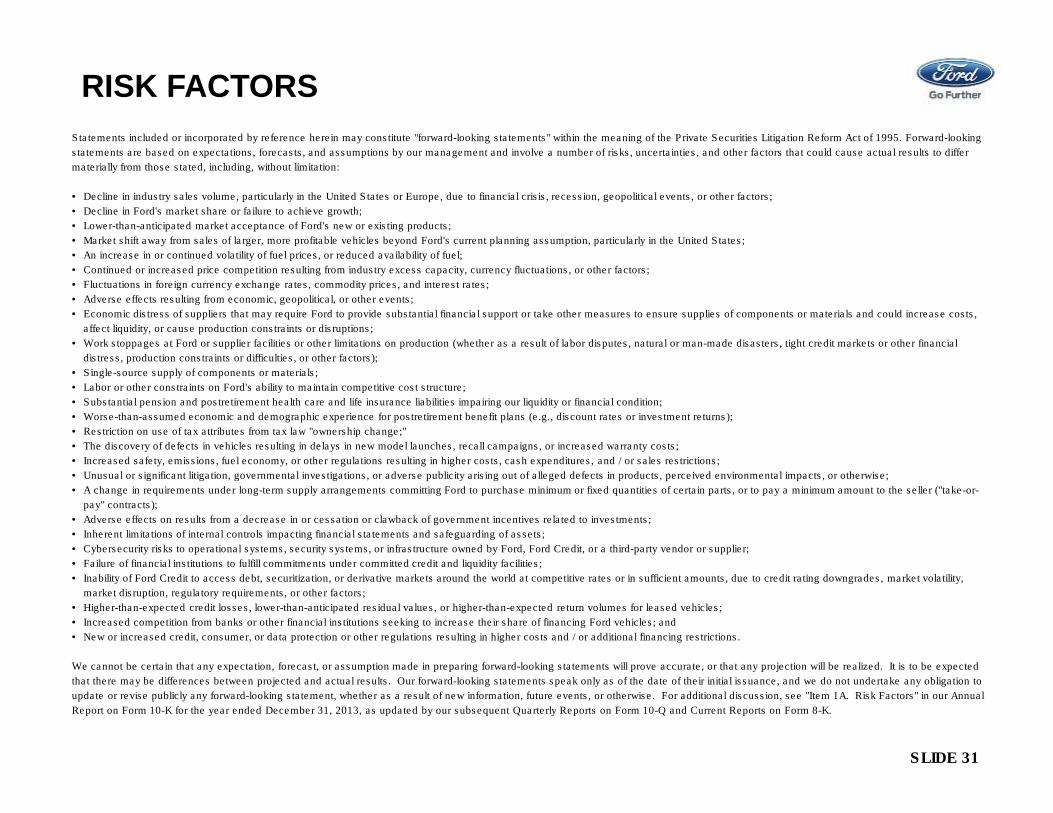
Statements included or incorporated by reference herein may constitute "forward-looking statements" within the meaning of the Private Securities Litigation Reform Act of 1995. Forward-looking
statements are based on expectations, forecasts, and assumptions by our management and involve a number of risks, uncertainties, and other factors that could cause actual results to differ
materially from those stated, including, without limitation:
• Decline in industry sales volume, particularly in the United States or Europe, due to financial crisis, recession, geopolitical events, or other factors;
• Decline in Ford's market share or failure to achieve growth;
• Lower-than-anticipated market acceptance of Ford's new or existing products;
• Market shift away from sales of larger, more profitable vehicles beyond Ford's current planning assumption, particularly in the United States;
• An increase in or continued volatility of fuel prices, or reduced availability of fuel;
• Continued or increased price competition resulting from industry excess capacity, currency fluctuations, or other factors;
• Fluctuations in foreign currency exchange rates, commodity prices, and interest rates;
• Adverse effects resulting from economic, geopolitical, or other events;
• Economic distress of suppliers that may require Ford to provide substantial financial support or take other measures to ensure supplies of components or materials and could increase costs,
affect liquidity, or cause production constraints or disruptions;
• Work stoppages at Ford or supplier facilities or other limitations on production (whether as a result of labor disputes, natural or man-made disasters, tight credit markets or other financial
distress, production constraints or difficulties, or other factors);
• Single-source supply of components or materials;
• Labor or other constraints on Ford's ability to maintain competitive cost structure;
• Substantial pension and postretirement health care and life insurance liabilities impairing our liquidity or financial condition;
• Worse-than-assumed economic and demographic experience for postretirement benefit plans (e.g., discount rates or investment returns);
• Restriction on use of tax attributes from tax law "ownership change;"
• The discovery of defects in vehicles resulting in delays in new model launches, recall campaigns, or increased warranty costs;
• Increased safety, emissions, fuel economy, or other regulations resulting in higher costs, cash expenditures, and / or sales restrictions;
• Unusual or significant litigation, governmental investigations, or adverse publicity arising out of alleged defects in products, perceived environmental impacts, or otherwise;
• A change in requirements under long-term supply arrangements committing Ford to purchase minimum or fixed quantities of certain parts, or to pay a minimum amount to the seller ("take-or-
pay" contracts);
• Adverse effects on results from a decrease in or cessation or clawback of government incentives related to investments;
• Inherent limitations of internal controls impacting financial statements and safeguarding of assets;
• Cybersecurity risks to operational systems, security systems, or infrastructure owned by Ford, Ford Credit, or a third-party vendor or supplier;
• Failure of financial institutions to fulfill commitments under committed credit and liquidity facilities;
• Inability of Ford Credit to access debt, securitization, or derivative markets around the world at competitive rates or in sufficient amounts, due to credit rating downgrades, market volatility,
market disruption, regulatory requirements, or other factors;
• Higher-than-expected credit losses, lower-than-anticipated residual values, or higher-than-expected return volumes for leased vehicles;
• Increased competition from banks or other financial institutions seeking to increase their share of financing Ford vehicles; and
• New or increased credit, consumer, or data protection or other regulations resulting in higher costs and / or additional financing restrictions.
We cannot be certain that any expectation, forecast, or assumption made in preparing forward-looking statements will prove accurate, or that any projection will be realized. It is to be expected
that there may be differences between projected and actual results. Our forward-looking statements speak only as of the date of their initial issuance, and we do not undertake any obligation to
update or revise publicly any forward-looking statement, whether as a result of new information, future events, or otherwise. For additional discussion, see "Item 1A. Risk Factors" in our Annual
Report on Form 10-K for the year ended December 31, 2013, as updated by our subsequent Quarterly Reports on Form 10-Q and Current Reports on Form 8-K.
RISK FACTORS

QUESTIONS?
SLIDE 33
APPENDIX
SLIDE 34
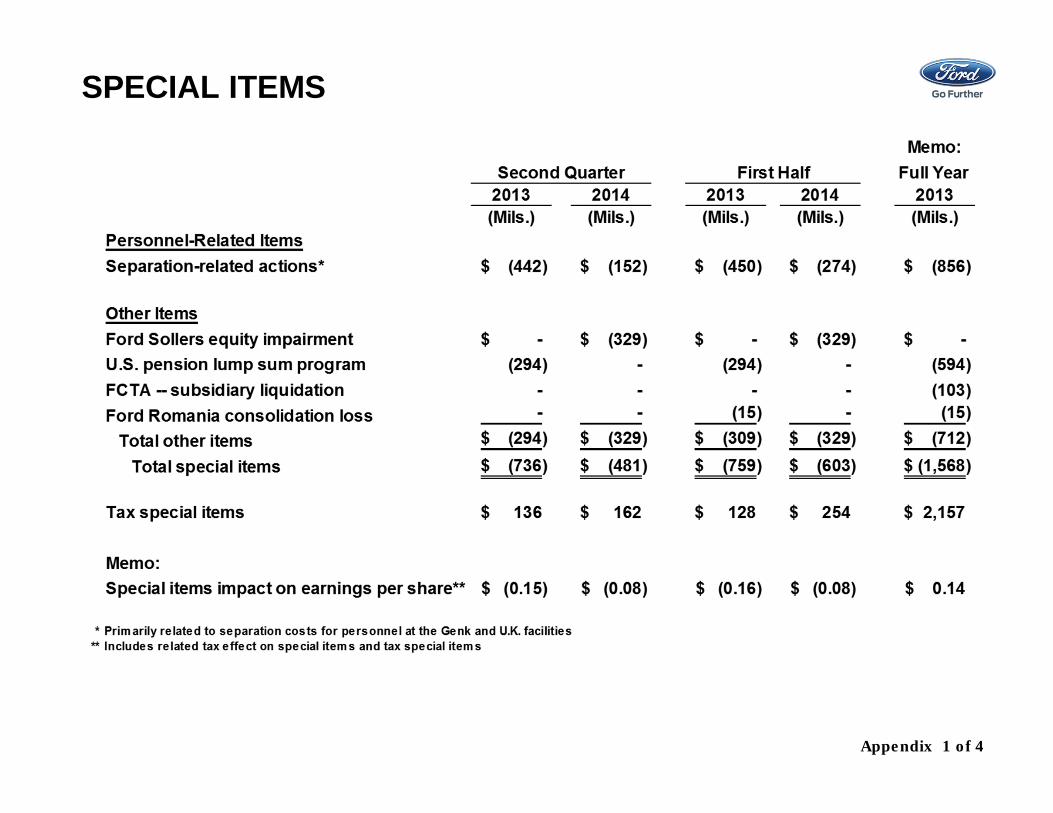
SPECIAL ITEMS
Appendix 1 of 4
SLIDE 35
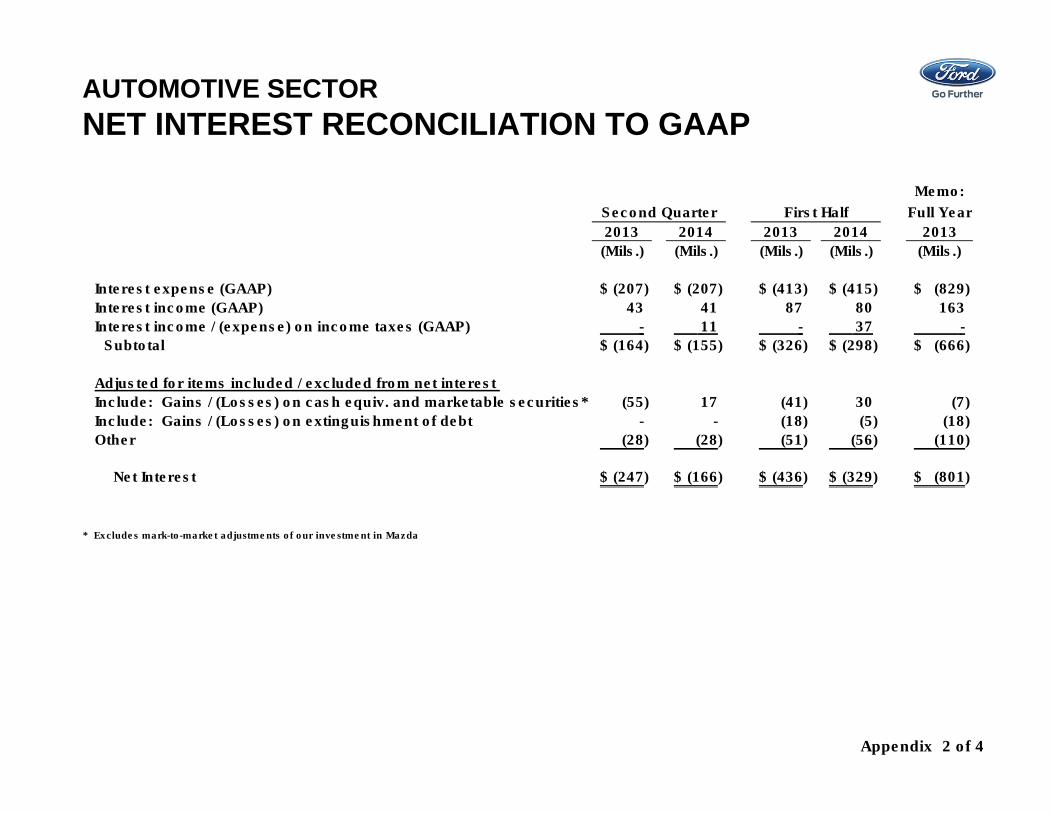
AUTOMOTIVE SECTOR
NET INTEREST RECONCILIATION TO GAAP
Memo:
Full Year
2013 2014 2013 2014 2013
(Mils.) (Mils.) (Mils.) (Mils.) (Mils.)
Interest expense (GAAP) (207)$ (207)$ (413)$ (415)$ (829)$
Interest income (GAAP) 43 41 87 80 163
Interest income / (expense) on income taxes (GAAP) - 11 - 37 -
Subtotal (164)$ (155)$ (326)$ (298)$ (666)$
Adjusted for items included / excluded from net interest
Include: Gains / (Losses) on cash equiv. and marketable securities* (55) 17 (41) 30 (7)
Include: Gains / (Losses) on extinguishment of debt - - (18) (5) (18)
Other (28) (28) (51) (56) (110)
Net Interest (247)$ (166)$ (436)$ (329)$ (801)$
* Excludes mark-to-market adjustments of our investment in Mazda
Second Quarter First Half
Appendix 2 of 4

SLIDE 36
AUTOMOTIVE SECTOR
GROSS CASH RECONCILIATION TO GAAP
Dec. 31 Mar. 31 June 30
(Bils.) (Bils.) (Bils.) (Bils.)
Cash and cash equivalents 5.5$ 5.0$ 4.5$ 4.7$
Marketable securities 20.2 20.1 20.7 21.1
Total cash and marketable securities (GAAP) 25.7$ 25.1$ 25.2$ 25.8$
Securities in transit* - (0.3) - -
Gross cash 25.7$ 24.8$ 25.2$ 25.8$
* The purchase or sale of marketable securities for which the cash settlement was not made by period end and a payable or receivable was recorded on
the balance sheet
June 30
2013 2014
Appendix 3 of 4
SLIDE 37
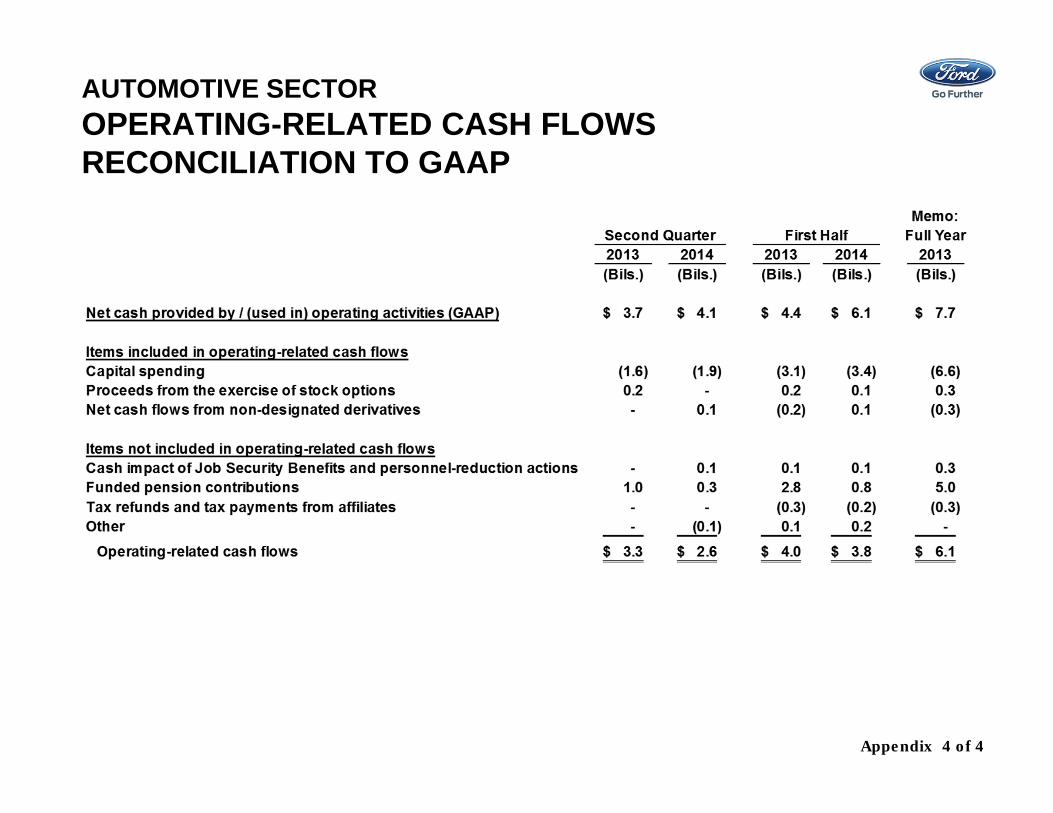
AUTOMOTIVE SECTOR
OPERATING-RELATED CASH FLOWS
RECONCILIATION TO GAAP
Appendix 4 of 4