dave reistenberg supplemental (mva) presentation
TRANSCRIPT
8/6/2019 Dave Reistenberg Supplemental (MVA) Presentation
http://slidepdf.com/reader/full/dave-reistenberg-supplemental-mva-presentation 1/12
6/13/11
1
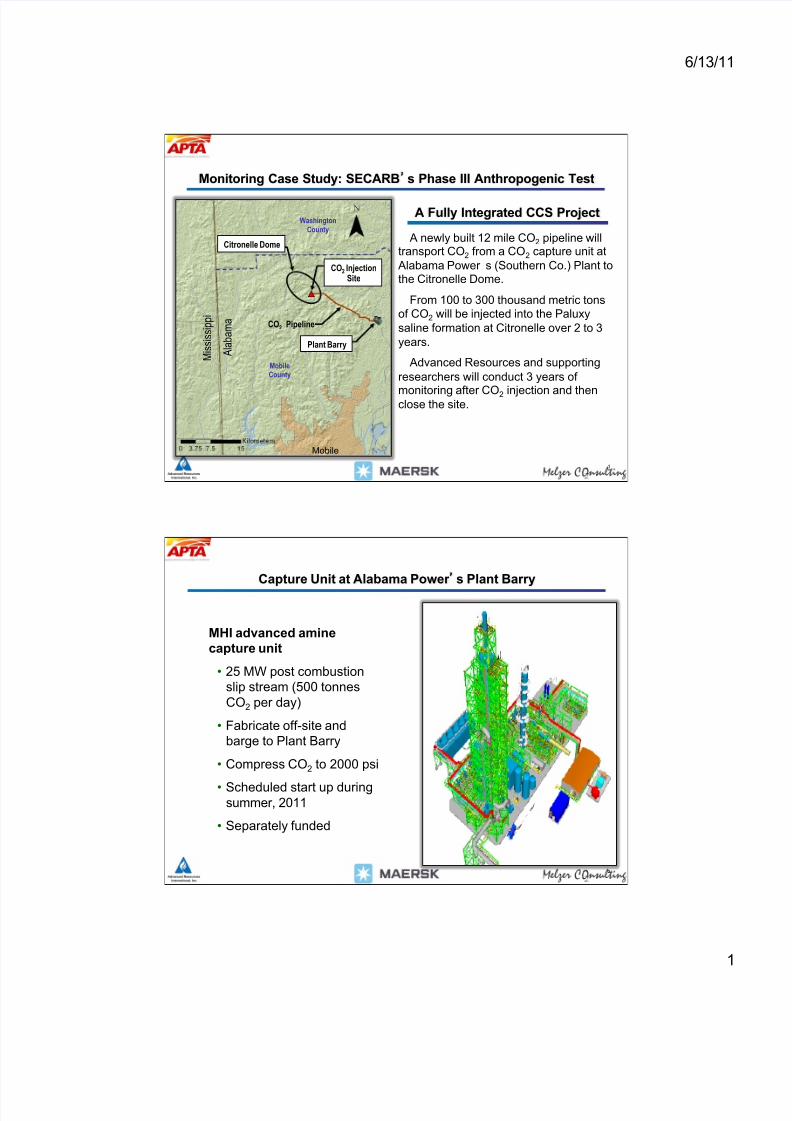
Monitoring Case Study: SECARB s Phase III Anthropogenic Test
Mobile
A l a b a m a
M i s s
i s s
i p p
i
MobileCounty
WashingtonCounty
CO2 Pipeline
A newly built 12 mile CO 2 pipeline willtransport CO 2 from a CO 2 capture unit atAlabama Power s (Southern Co.) Plant tothe Citronelle Dome.
From 100 to 300 thousand metric tonsof CO 2 will be injected into the Paluxysaline formation at Citronelle over 2 to 3years.
Advanced Resources and supportingresearchers will conduct 3 years of
monitoring after CO 2 injection and thenclose the site.
A Fully Integrated CCS Project
Plant Barry
Citronelle Dome
CO2 InjectionSite
1
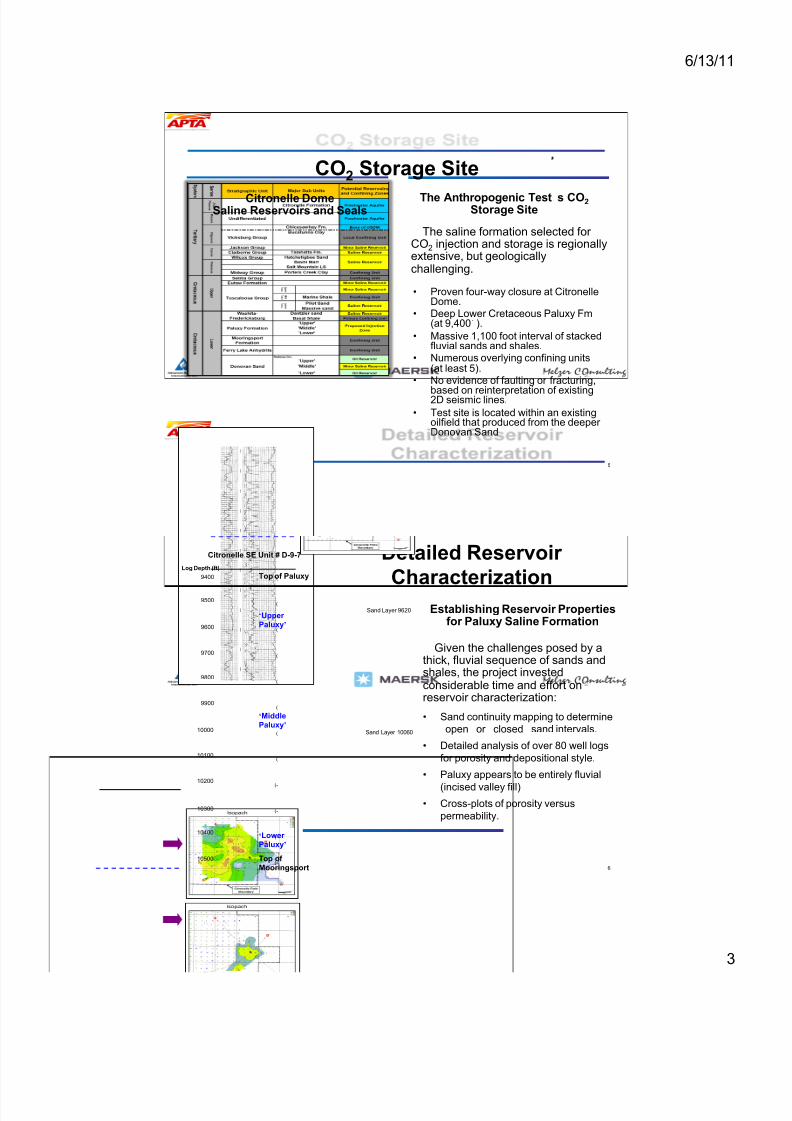
Capture Unit at Alabama Power s Plant Barry
MHI advanced aminecapture unit
• 25 MW post combustionslip stream (500 tonnesCO 2 per day)
• Fabricate off-site andbarge to Plant Barry
• Compress CO 2 to 2000 psi
• Scheduled start up duringsummer, 2011
• Separately funded
2

8/6/2019 Dave Reistenberg Supplemental (MVA) Presentation
http://slidepdf.com/reader/full/dave-reistenberg-supplemental-mva-presentation 2/12
6/13/11
2
Capture Plant and Compressor Will be Operational by July 2011
3
9-2010
11-2010
1-2011
Source: Esposito et al., 2008
Structural Contour Map of the Top of the
Rodessa Formation
A A
Cross Section from Plant Barry to Citronelle Dome
Test Site Structural Geology
Regional data and studies show that theCitronelle Dome is:• A subtle open fold
• Limbs dipping less than 1 degree
• Four-way structural closure
Modified from: Pashin et al., 2008
Sources: Pashin et al., 2008; Cottingham, 1988; Esposito and others, 2008
Plant Barry
Anthro Test Site
TestSite
8/6/2019 Dave Reistenberg Supplemental (MVA) Presentation
http://slidepdf.com/reader/full/dave-reistenberg-supplemental-mva-presentation 3/12
6/13/11
3
Citronelle DomeSaline Reservoirs and Seals
CO 2 Storage Site
• Proven four-way closure at CitronelleDome.
• Deep Lower Cretaceous Paluxy Fm(at 9,400 ).
• Massive 1,100 foot interval of stackedfluvial sands and shales.
• Numerous overlying confining units(at least 5).
• No evidence of faulting or fracturing,
based on reinterpretation of existing2D seismic lines.• Test site is located within an existing
oilfield that produced from the deeper Donovan Sand
The saline formation selected for CO 2 injection and storage is regionallyextensive, but geologicallychallenging.
The Anthropogenic Test s CO 2 Storage Site
5
• Sand continuity mapping to determineopen or closed sand intervals.
• Detailed analysis of over 80 well logsfor porosity and depositional style.
• Paluxy appears to be entirely fluvial(incised valley fill)
• Cross-plots of porosity versuspermeability.
Given the challenges posed by athick, fluvial sequence of sands andshales, the project investedconsiderable time and effort onreservoir characterization:
Detailed Reservoir Characterization
Establishing Reservoir Properties
for Paluxy Saline Formation
(
(
(
(
(
(
(
(
(-
(-
(-
(-
9500
9400
9700
9600
9900
9800
10100
10000
10300
10200
10500
10400
Citronelle SE Unit # D-9-7
Log Depth (ft) Top of Paluxy
‘ Upper Paluxy ’
‘ MiddlePaluxy ’
‘ Lower Paluxy ’ Top of Mooringsport
Sand Layer 10060
Sand Layer 9620
6

8/6/2019 Dave Reistenberg Supplemental (MVA) Presentation
http://slidepdf.com/reader/full/dave-reistenberg-supplemental-mva-presentation 4/12
6/13/11
4
CO 2 Injection Well
• 100+ meters of net feet of sand
• Average sand porosity of 20%
• Permeability from <0.1 to >3 Darcies
• Normal pressure and temperaturegradients
Based on detailed characterization of the thick Paluxy sand/shale interval, weselected 17 sand units for CO 2 injection:
Subsequent reservoir characterization(currently underway) will help confirm andupdate the key CO 2 injectivity and storagecapacity parameters.
Detailed Reservoir Characterization (Cont d)
Building the Geologic Model
7
CO2 Storage Monitoring, Verification, andAccounting Tool Kit
1) Deep Monitoring (Below Base of Freshwater): TrackCO 2 plume and pressure front in the reservoir. Monitor for migration above the confining unit
2) Shallow Monitoring (Above Base of Freshwater toGround Surface): Monitor for CO 2 buildup inunderground sources of drinking water
3) Surface/Atmospheric Monitoring: Monitor for elevated
CO 2 levels or tracers at ground surface or in theshallow atmosphere
8

8/6/2019 Dave Reistenberg Supplemental (MVA) Presentation
http://slidepdf.com/reader/full/dave-reistenberg-supplemental-mva-presentation 5/12
6/13/11
5
1) Deep Monitoring Tools
Seismic Tools – Established Industry Tools that can beused to determine area of significant CO 2 plumecoverage (i.e. saturation greater than 10%) but not
pressure or saturation.
Time-Lapse Surface Seismic : Source and receivers on groundsurface
• Large areal coverage• Can be deployed in 3D• Existing penetrations unnecessary• Baseline deployment can be used for geologic model• Vertical resolution of 30-100 meters• Challenge to use with small, thin, or low saturation plumes• Challenge to use in busy subsurfaces (i.e. extraction/injection
into shallower formations)
9
Time-Lapse Vertical Seismic Profile (VSP): Source onsurface, receivers deployed in an existing deep wellbore
• Areal extent limited to <1,000 meter from receiver wellbore• Can be deployed in 3D• Existing penetration required• Baseline deployment can be used for geologic model• Vertical resolution of ~10 meters (10x higher than surface
seismic)• Potential to monitor smaller, thinner, or low stacked plumes
1) Deep Monitoring Tools

8/6/2019 Dave Reistenberg Supplemental (MVA) Presentation
http://slidepdf.com/reader/full/dave-reistenberg-supplemental-mva-presentation 6/12
6/13/11
6
Time-Lapse Crosswell Seismic: Source and Receiver in offsetexisting wellbores
• Areal limited to <300 meter from receiver wellbore• Detailed transect between two wellbores (2D image)• Existing penetrations required• Baseline deployment can be used for geologic model (detailed
stratigraphy)• Vertical resolution of ~3 meters (30x higher than surface
seismic)• Potential to monitor smaller, thinner, or low stacked plumes
1) Deep Monitoring Tools
Well Based Tools – Utilize Existing wellbores that penetrate the injection zone
Neutron Logging – Monitor neutron adsorption (CO 2 is aweak neutron adsorber)
• High degree of vertical resolution (<1 meter)• Capable of determining saturation levels• High repeatability (versus seismic)• Shallow penetration (~40 cm)
Pressure – Classic reservoir performance tool• Inexpensive, data rich
•
Establish reservoir capacity, boundaries• Limited to formation of interest
1) Deep Monitoring Tools

8/6/2019 Dave Reistenberg Supplemental (MVA) Presentation
http://slidepdf.com/reader/full/dave-reistenberg-supplemental-mva-presentation 7/12
6/13/11
7
Ground Surface Deformation
Satellite Interferometry (aka InSAR) – Map ground surface levelsin time lapse for indications of expansion (injection) or subsidence) extraction. Useful for determination of injectionpressure buildup
• Most promising in shallow reservoirs and/or reservoirs with lowpermeability (i.e. high pressure buildup)
• Inexpensive, historical data may be available• Non-unique solution (vertical position of CO 2 buildup must be
modeled)• Challenge in wooded areas or those with significant water
coverage• May not be useful in busy subsurfaces
1) Deep Monitoring Tools
Surface Tilt – deploy multiple tiltmeters on ground surface attest site
• Higher sensitivity than InSAR, may be useful for smaller,deeper or low pressure injections
• May not be useful in busy subsurfaces
1) Deep Monitoring Tools

8/6/2019 Dave Reistenberg Supplemental (MVA) Presentation
http://slidepdf.com/reader/full/dave-reistenberg-supplemental-mva-presentation 8/12
6/13/11
8
Groundwater Geochemistry: Monitor for changes in chemistrythat may indicate CO2 leakage (i.e. pH, dissolved metals)
Tracers: Introduce tracers into CO2 stream and monitor for presence in groundwater or at surface• Challenge is that tracers may not stay within injected CO 2.
Industry experience is mixed
15
2) Shallow Monitoring Tools
Soil Flux Accumulation Chambers – monitor soil CO 2 levels atpoints on ground surface. High precision, low areal coverage(~ 1 square meter)• Long baseline required to establish natural variation
Eddy Covariance – Micrometeorological tool to monitor shallowatmospheric CO 2 levels in a several thousand square meter area• Assumes homogeneous surface conditions• Long baseline required to establish natural variation• Complex methodology for analysis• Cannot pinpoint leak within monitoring area
16
3) Surface/Atmospheric Monitoring Tools
8/6/2019 Dave Reistenberg Supplemental (MVA) Presentation
http://slidepdf.com/reader/full/dave-reistenberg-supplemental-mva-presentation 9/12
6/13/11
9
Anthropogenic Test CO 2 Monitoring Design – Challenges and Opportunities
Challenges• Injection into multiple sand units, each less than 15 meters thick• Deep injection (>3,000 meters)• Subsurface is busy at Citronelle – shallow water extraction,
deep water injection and oil extraction• Existing wellbores present primary leakage risk• Public perception is always a consideration
Opportunities• Multiple proven industry (EOR and Sequestration) tools are available
for plume tracking• Existing oilfield well development (40 acre spacing) allow for high
density access to reservoir • Geological structure relatively simple (unfaulted/unfractured)• Additional funding available for novel monitoring tool deployment
Anthropogenic Test CO 2 Monitoring Design – Challenges and Opportunities

8/6/2019 Dave Reistenberg Supplemental (MVA) Presentation
http://slidepdf.com/reader/full/dave-reistenberg-supplemental-mva-presentation 10/12
6/13/11
10
• Near-surface (groundwater) and deep reservoir fluid sampling –Monitor for geochemical evidence for CO 2 buildup
• In-zone and above-zone pressure and temperature monitoring –Precise, inexpensive standard monitoring tool
• Cased-hole neutron logging – Measure CO 2 saturation in proximity toan existing wellbore (depth of penetration about 35 cm)
•
Crosswell seismic and VSP. Monitor CO 2 plume edge and verticalshape utilizing new and existing wellbores for tool deployment.
The anthropogenic test will use a mix of existing oilfield wellsand new drill wells for tracking the CO 2 plume using the followingproven industry tools:
Anthropogenic Test CO 2 Shallow and Deep Monitoring Design
Note that other promising tools are likely bad candidates at thetest site:
• 3D surface seismic – low degree of vertical resolution (30-100meters) makes ability to track multiple, thin plumes unliklely
• Surface deformation tools (measured by tiltmeters/GPS or satellite interferometry) are unattractive due to busy subsurface and low anticipated pressure buildup
Anthropogenic Test CO 2 Deep Monitoring Design

8/6/2019 Dave Reistenberg Supplemental (MVA) Presentation
http://slidepdf.com/reader/full/dave-reistenberg-supplemental-mva-presentation 11/12
6/13/11
11
Novel Tool DeploymentThe Carbon Capture Project s MBM Integrated Sensing
CO2CRC Otway
Modular BoreholeMonitoring
Provide a design of a flexibleintegrated sensor platform for acquiring multiplemeasurements using onedeployment completion
• Dedicated seismic string (for VSP)
• U-tube reservoir fluid sampler
• Distributed temperature
• Tracer monitoring – Monitor for the presence of tracers added to theinjected CO 2 at selected ground surface locations. Concentrateefforts on likely leakage conduits (existing well penetrations).
• Soil Flux – Monitor soil CO 2 levels at selected points on groundsurface. High precision, low areal coverage (~ 1 square meter)
The anthropogenic test deploy the following monitoring toolsfor regulatory compliance and as an outreach program
CO 2 MonitoringSurface Monitoring Design
Both of these monitoring methods are relatively inexpensive
(compared to deep monitoring tools) and are high profile . As suchthey act as defacto local outreach programs

8/6/2019 Dave Reistenberg Supplemental (MVA) Presentation
http://slidepdf.com/reader/full/dave-reistenberg-supplemental-mva-presentation 12/12
6/13/11
12
CO 2 Injection Monitoring
23
D-4-13 and/or D-4-14
In-zone montoringAbove-zone monitoringFluid sampling
D-9-11
Neutron Logging
Proposed Injector Injection SurveysDownholePressure
Proposed Inj/Obs WellNeutron logging
Crosswell seismic (source)
New Characterization WellNeutron loggingMBM (in-zone pressure, fluidsampling, seismic, temp)
Modeled Plume
Extent