date period - grade a math help€¦ · 3 writing equations of lines ... date _____ period_____...
TRANSCRIPT

Day Topic 1 Relations and Functions
Domain and Range
2 Graphing Linear Equations Objective 1
3 Writing Equations of Lines
4 Using the Graphing Calculator Piecewise Functions
5 Quiz 6 Absolute Value Functions and
7 Vertical and Horizontal Translations
8 Graphs of Double Absolute Value
Equations
9 Graphs of Two-variable Inequalities
10 Graphs of Absolute Value Inequalities
11 Review
Date _________ Period_________
Unit 2: Functions, Equations, & Graphs of Degree One

1
Date _________ Period_________
U2 D1: Relations/Functions & Domain/Range
2
2
-2
4
2
f x = x2
8
6
4
2
-2
-4
-6
-8
-5 5
10
5
-5
1
Formal notes:
A _____________________is a set of pairs of input and output values. You can write them as ordered pairs. The ___________________ of a relation is the set of all inputs, or x-coordinates of the ordered pairs. The ____________________ of a relation is the set of all outputs, or y-coordinates of the ordered pairs. A _______________________ is a relation in which each element of the domain is paired with exactly one element in the range. Look for: The same x-value, but different y-values! This means it is not a function! Are the following relations function? State why or why not! a) 5,1 , 3,5 , 8,1 , 2, 7 , b) 3,1 , 2, 4 , 3,3 , 1,0 ,
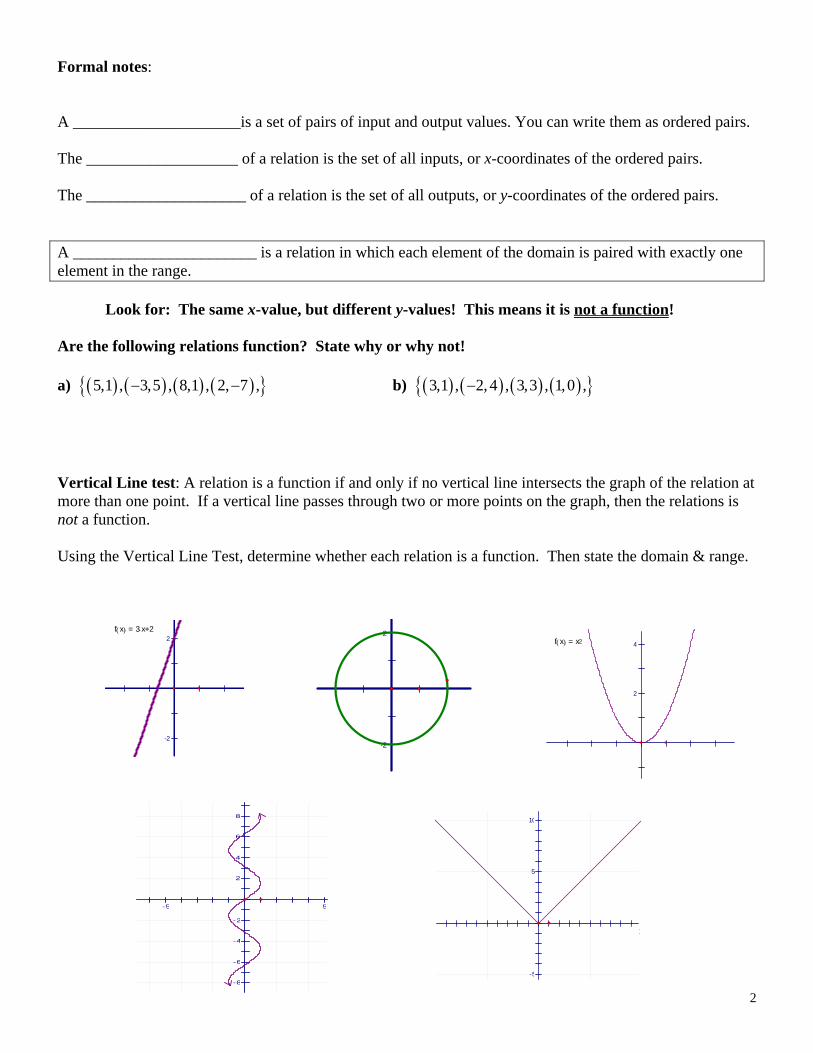
Vertical Line test: A relation is a function if and only if no vertical line intersects the graph of the relation at more than one point. If a vertical line passes through two or more points on the graph, then the relations is not a function. Using the Vertical Line Test, determine whether each relation is a function. Then state the domain & range.
2
-2
f x = 3x+2

3
Mapping Diagram: Identify the domain and range. Then tell whether the relation is a function. Input Output Input Output -3 3 -3 3 1 -2 1 1 4 1 3 4 4 -2
Function Notation:
3 2y x can be written in a “fancy notation” 3 2f x x .
f x is read as _________________________ and does NOT mean f times x.
“Normal Way” Function Way
1,5 1 5f
Simplify 2 1y x when 3x 2 1f x x ; find 3f
Find 5),0(),3( fandff for the following functions:
a. 53)( xxf b. 3
( ) 14
f x x

4
Closure
1) Why is 2,1 , 3,1 a function, but 2,1 , 2,3 is not?
2) Let 5 50y x where x is the number of tickets sold at a Conestoga football game, and y is the profit
made by the school. Is this a function? Determine the domain and range.
3) Is 2 5y x a function? Justify your answer.
Possible justifications above could be…
a.
b.
c.
Extension:

5
Directions: use the stations around the room and the help of your teacher and classmates to prepare yourself
for a “pop” quiz at the 8 minute bell. You will not be allowed to use your notes during the quiz.
The problems below will help prepare you for the quiz.
Graph each line. Practice using each of the 3 methods.
1. 2 1y x 2. 3 4 12x y 3. 2 6x y
Find the slope of each line through the set of points provided.
4. 2,5 and 1,7 5. 1 1
,2 and ,53 6
6. 13,6 and 0,
3
Date _________ Period_________
U2 D2: Graphing Linear Equations

6
Find the slope and y-intercept for each equation below.
7. 3 8 12x y 8. 2 11x y 9. 7 2( 4)x y x
Write each equation in standard form.
10. 3 2 3y x 11. 1 1
82 3
x y
12. Describe point-slope form and compare it to slope-intercept form.

7
1. Warm up: list the general form for the 3 forms of a line that we talked about yesterday.
2. We will use two forms to write the equation of a line: __________________ & ___________________.
Name:
General Form:
You Need:
3. Sometimes the “you need” part will be obvious. Other times you will need to extrapolate it from the information you are given.
a. Parallel Lines b. Perpendicular Lines
c. x-intercept
d. y-intercept
4. Examples:
a) Write the equation of the line with a slope of 1
4 and a y-intercept of 8.
b) Now write the equation of the line above in standard form. c) Find the intercepts of the line 2 10x y
Date _________ Period_________
U1 D3: Writing Equations of Lines

8
Classwork Examples: 1. Write the equation in standard form: slope = 3 and the point is 1,5 (Hint: write in slope-int first!)
2. Write the equation of the line point-slope form: 7,11 and 6, 2 .
Find the intercepts of the equations below.
3. 3x 4. 3 4 12x y 5. 47
5f x x
Write the equation of the line in slope-intercept form for each situation below.
6. through (2,1) and parallel to 2 5
3 8y x 7. (5,0) and (-3,2)
8. through 2,2 and perpendicular to 3
25
y x 9. through 4,1 and horizontal
Extension: HW Start!

9
2 2 if 2
( ) 3 31 if 2
x xf x
x x x
1. Piecewise Functions: A combination of functions, where each corresponds to a part of the ___________.
2. Example A:
113
112)(
xifx
xifxxf Example B:
Example C: 5
2 22
5 2
x if x
x if x
Example D:
3 1
( ) 4 1 5
1 7 5
2 2
x if x
g x x if x
x if x
Date _________ Period_________
U1 D4: Using the Graphing Calculator & Piecewise Functions

10
3. Recap: How to graph a piecewise function
a. Find the _______________ point for the first case.
b. Graph the first line on the ___________________. You can find any two points in the interval!
Be sure to account for _____________ or ____________ circles.
c. Find the 2nd critical point. Determine if the points are _____________, closed, or
__________________ and graph the line.
4. Writing the equation of a piecewise function: Sometimes you are given the _______________ and you
must write the equation.
Step 1: Find the interval of the “left-most” function
Step 2: Find the slope and 1 point of that function. Write Eq.
Step 3: Repeats steps 1-2 for all other functions
Step 4: Write as a piecewise function y
Try on your own:

11
5. A special piecewise function: The _____________________ integer function.
x means “the greatest integer less than or equal to x”
x x x 2 x
Let’s use the tables to graph the functions
f x x 2f x x
Wrap Up: Confidence Meter for tomorrow’s quiz? 1 2 3 4 5 6 7 8 9 10

12
1. Warmup: solve the equation 723 x by using the critical points method we learned in unit 1.
2. We will use a similar process to _________________ absolute value equations.
3. The critical point will create the ________________ of the absolute value graph.
a. This is the tip of the _____ shaped graph.
Examples: 123 xy 3 1y x
Date _________ Period_________
U1 D6: Absolute Value Functions & Graphs
13
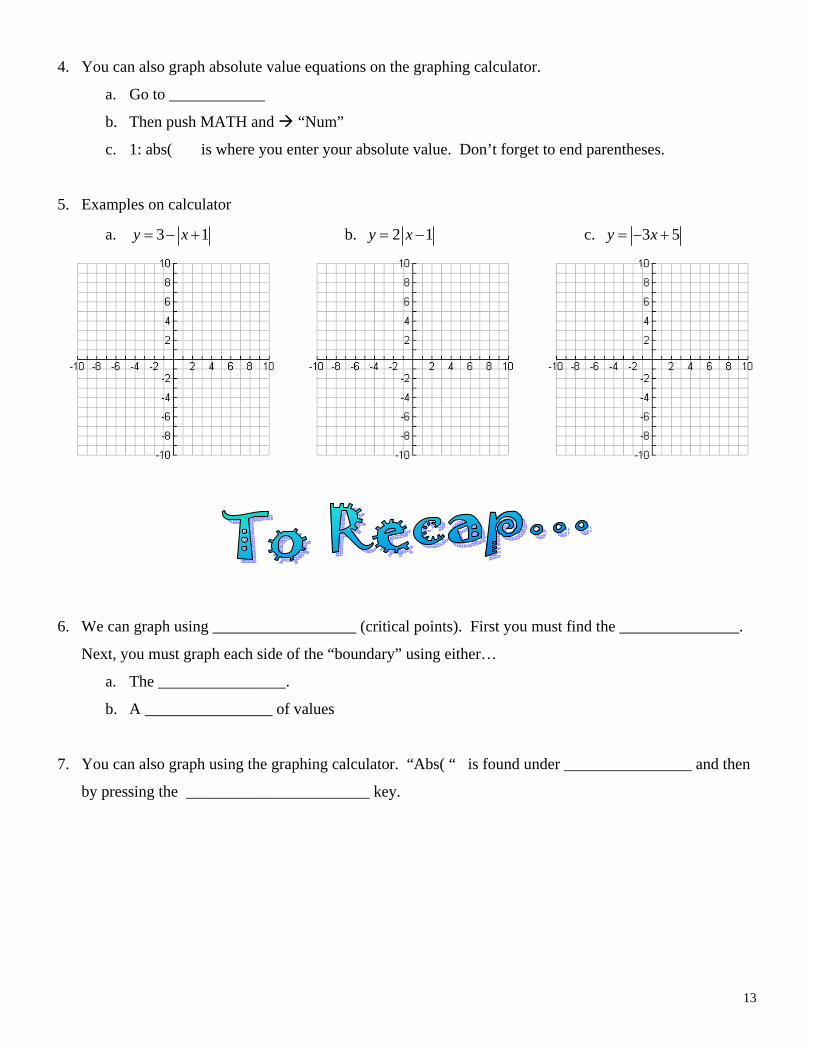
4. You can also graph absolute value equations on the graphing calculator.
a. Go to ____________
b. Then push MATH and “Num”
c. 1: abs( is where you enter your absolute value. Don’t forget to end parentheses.
5. Examples on calculator
a. 3 1y x b. 2 1y x c. 3 5y x
6. We can graph using __________________ (critical points). First you must find the _______________.
Next, you must graph each side of the “boundary” using either…
a. The ________________.
b. A ________________ of values
7. You can also graph using the graphing calculator. “Abs( “ is found under ________________ and then
by pressing the _______________________ key.

14
8. Graph each equation below by using partitioning (you can choose slope or table) and then check your
answers using the calculator.
a. 4y x b. 2 6y x
c. 3y x d. 3 1
2 2y x
15
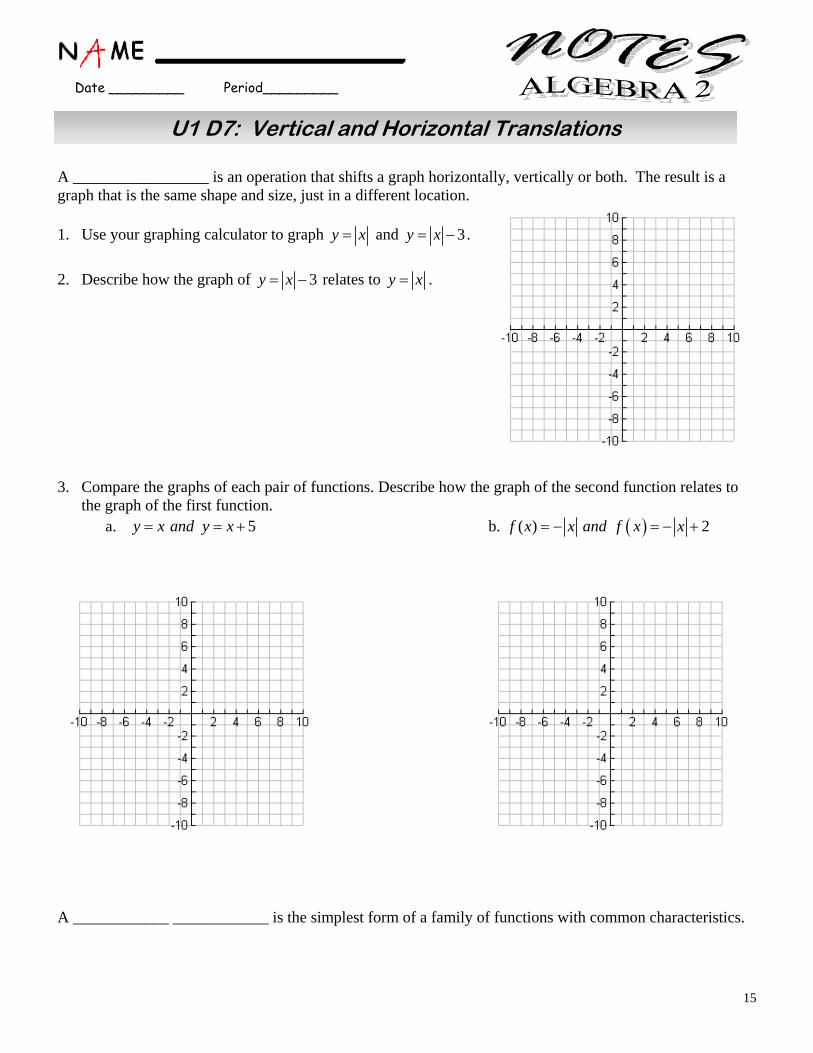
A _________________ is an operation that shifts a graph horizontally, vertically or both. The result is a graph that is the same shape and size, just in a different location. 1. Use your graphing calculator to graph y x and 3y x .
2. Describe how the graph of 3y x relates to y x .
3. Compare the graphs of each pair of functions. Describe how the graph of the second function relates to
the graph of the first function. a. 5y x and y x b. ( ) 2f x x and f x x
A ____________ ____________ is the simplest form of a family of functions with common characteristics.
Date _________ Period_________
U1 D7: Vertical and Horizontal Translations

16
Vertical translations To graph the function y x k and y x k , translate the graph of the parent function up k units.
To graph the functions y x k and y x k translate the graph down k units.
Examples:
1. For each function, identify the parent function and the value of k. Then graph the function by translating the parent function.
a. 2y x b. 3y x
2. Write an equation for each translation, then graph it!
a. 2y x , 4 units down b. y = 1 1
,4 2
x unit up

17
Horizontal translation Let h be a positive real number. Then y x h translates the graph of y x h units to the left, and
y x h translates the graph h units to the right.
* Notice, this “backwards” of what you might intuitively think. * Examples:
1. For each function, identify the parent function and the value of h. Then graph the function by translating the parent function.
a. 3y x b. 2y x
2. Write the equations for the horizontal translation
y = ____________________________ y =______________________________

18
The “basic” or “parent” graph of a line is y x and for an absolute value it is y x . The graphs of those
two functions are shown below. For each equation given, describe the translation from the parent graph.
The first one is done for you.
y x y x
1. 2 3y x Abs Val: Horizontal Shift Left 2 and Vertical Shift Down 3
2. 4y x
3. 1y x
4. 4 3y x
5. 7y x
6. 2 3y x
7. 4y x

19
1. Graph the absolute value equation on the left using partitioning
2 1 3y x 4 2y x x
2 3y x x 4 2y x x
Date _________ Period_________
U1 D8: Graphs of Double Absolute Value Equations
20
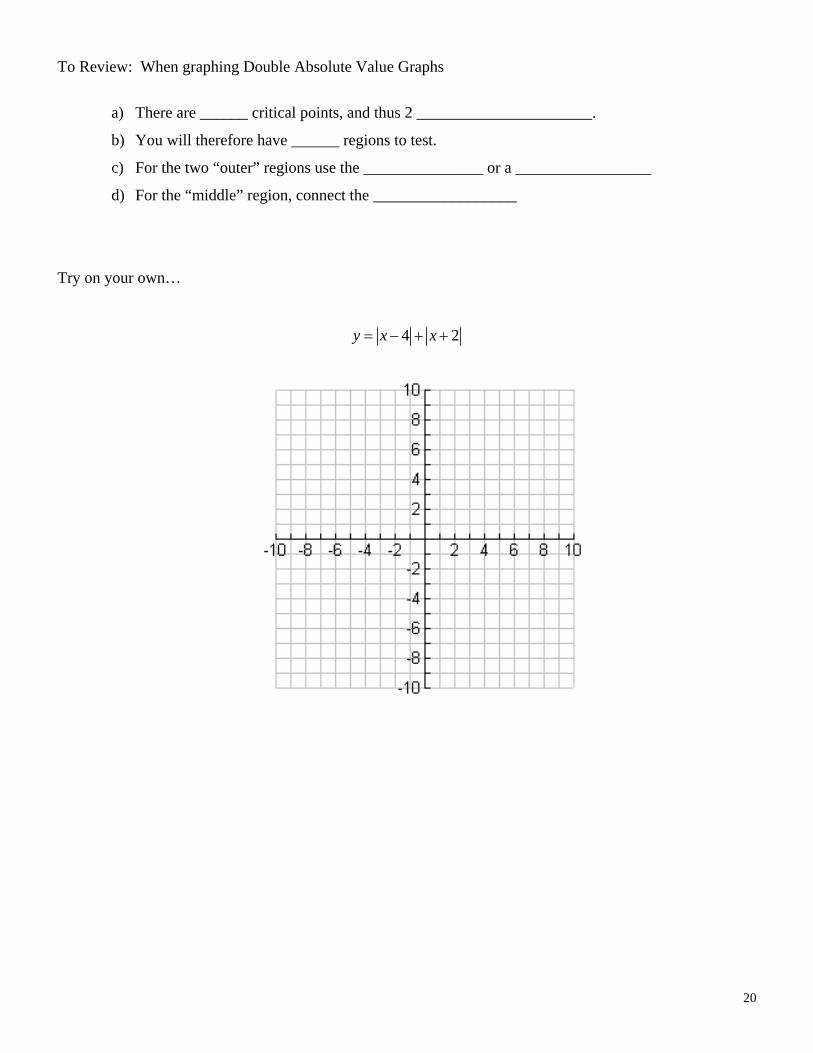
To Review: When graphing Double Absolute Value Graphs
a) There are ______ critical points, and thus 2 ______________________.
b) You will therefore have ______ regions to test.
c) For the two “outer” regions use the _______________ or a _________________
d) For the “middle” region, connect the __________________
Try on your own…
4 2y x x
21
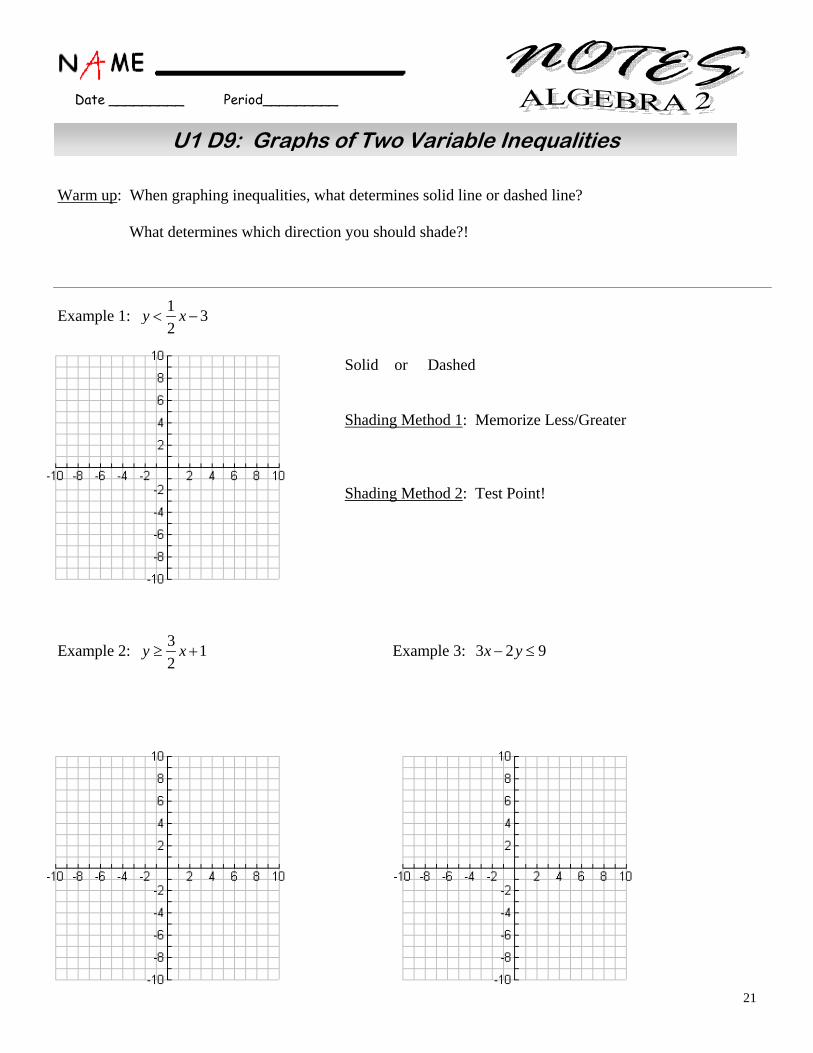
Warm up: When graphing inequalities, what determines solid line or dashed line? What determines which direction you should shade?!
Example 1: 1
32
y x
Solid or Dashed
Shading Method 1: Memorize Less/Greater Shading Method 2: Test Point!
Example 2: 3
12
y x Example 3: 3 2 9x y
Date _________ Period_________
U1 D9: Graphs of Two Variable Inequalities

22
Directions: Write the equation of each graph shown below.
Step 1: Find the equation of the boundary line by finding m and b. Step 2: Determine if the graph is shaded above (> or ) or below (< or ) Step 3: Determine if the boundary line is solid or dashed.
Try on your own…
1) 2 3 2x y 2) 2 5 10x y 3) 2
43
y x
4) Write the equation for the graph shown:

23
Graph absolute value inequalities the same way you would graph an equation. Of course, you need to account for a solid or dashed boundary line, and also the shading. Solid or Dashed: We covered this yesterday and in unit 1! To shade: Either use the inequality symbol to determine ___________ or ___________ Or, use the ______________ point strategy. The shading will either by “inside” the V or “outside” Example 1: 3 1y x Example 2: 4 1y x
Example 3: 3 1y x
* Note:
Date _________ Period_________
U1 D10: Graphs of Absolute Value Inequalities

24
4) 2y x 5) 1 2 1y x
6) 1
22
y x 7) 4x
25
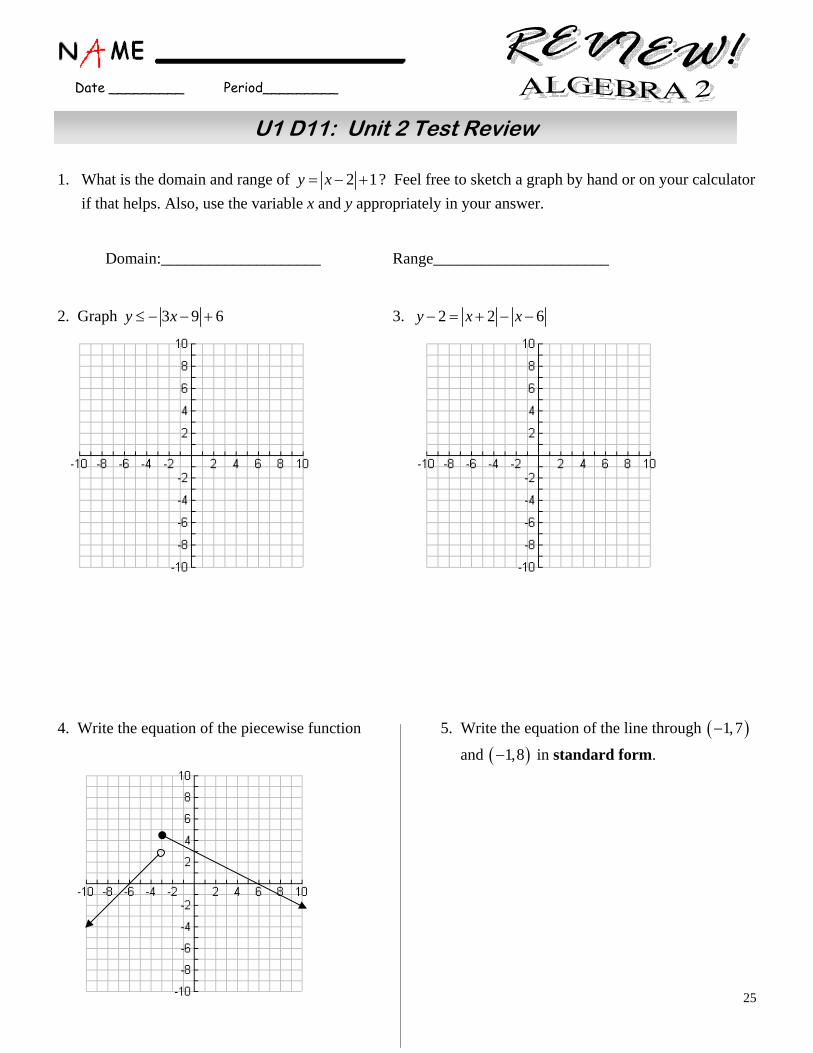
1. What is the domain and range of 2 1y x ? Feel free to sketch a graph by hand or on your calculator
if that helps. Also, use the variable x and y appropriately in your answer. Domain:____________________ Range______________________ 2. Graph 3 9 6y x 3. 2 2 6y x x
4. Write the equation of the piecewise function 5. Write the equation of the line through 1,7
and 1,8 in standard form.
Date _________ Period_________
U1 D11: Unit 2 Test Review
26
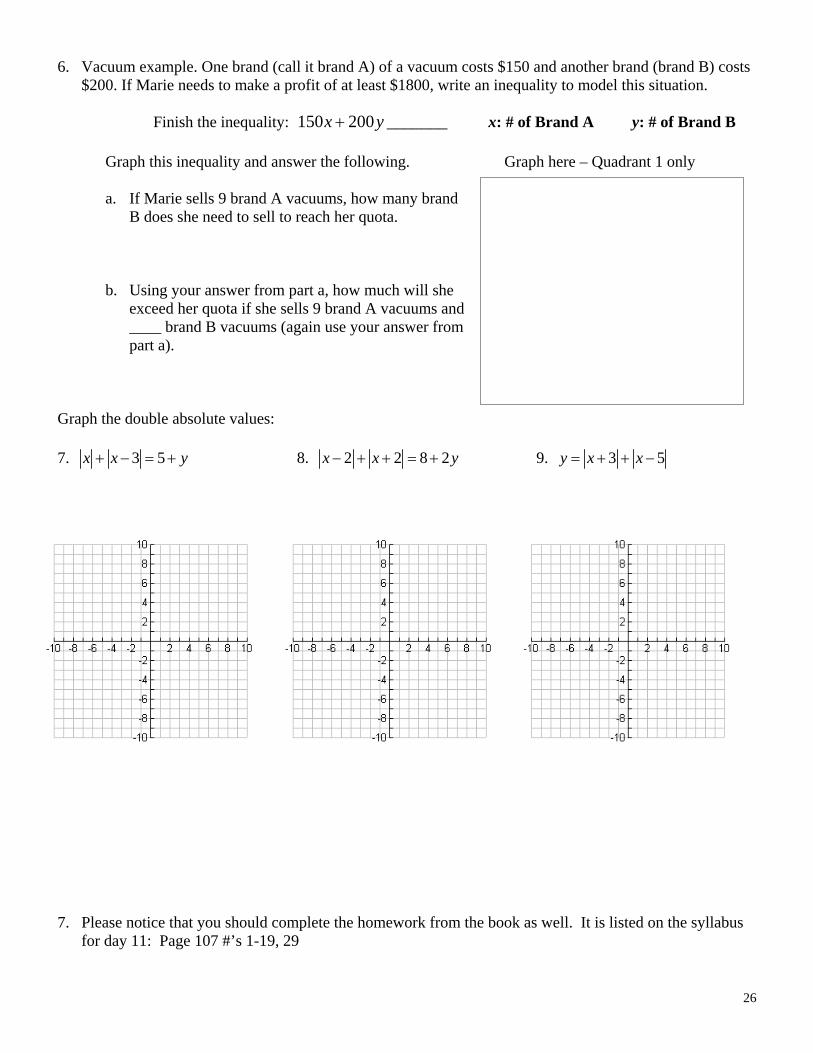
6. Vacuum example. One brand (call it brand A) of a vacuum costs $150 and another brand (brand B) costs $200. If Marie needs to make a profit of at least $1800, write an inequality to model this situation.
Finish the inequality: 150 200 _______x y x: # of Brand A y: # of Brand B Graph this inequality and answer the following. Graph here – Quadrant 1 only a. If Marie sells 9 brand A vacuums, how many brand
B does she need to sell to reach her quota.
b. Using your answer from part a, how much will she exceed her quota if she sells 9 brand A vacuums and ____ brand B vacuums (again use your answer from part a).
Graph the double absolute values: 7. 3 5x x y 8. 2 2 8 2x x y 9. 3 5y x x
7. Please notice that you should complete the homework from the book as well. It is listed on the syllabus
for day 11: Page 107 #’s 1-19, 29