date: june 5, 2020 subject: land value capture policy study
TRANSCRIPT
DATE: June 5, 2020 SUBJECT: Land Value Capture Policy Study The Land Value Capture Policy Study, attached, was brought to the Joint Board and Mayors’ Council Finance Committee on March 12, 2020 and the full Mayors’ Council on May 28, 2020. This study of potential land value capture approaches for TransLink was requested by the Board and Mayors’ Council as part of broader research into a Funding Strategy for TransLink. Materials were developed with external stakeholders throughout Fall 2019 and Spring 2020, prior to the COVID-19 pandemic. The scope of the study was established in collaboration with Metro Vancouver staff and TransLink retained Coriolis Consulting to perform the study based on their expertise on land economics and urban planning. The study:
1) Quantifies the amount of land value uplift that can be created by transit infrastructure in this
region; and 2) Identifies the challenges and opportunities for TransLink to use land value to generate new
revenue for transit investments, increase walking, cycling, and transit ridership, and support transit-oriented affordable rental housing creation.
In the report, Coriolis recommends pursuing both direct participation in strategic land acquisition and urban development, and land-based taxes and charges (e.g. property transfer tax, benefitting area tax, community amenity contributions). Based on feedback from Mayors’ Council in Spring 2020, TransLink will also continue to evaluate a variable-rate Development Cost Charge (DCC). The potential for any of the Land Value Capture mechanisms to be implemented as a part of TransLink’s funding framework will require additional discussion based on the economic conditions of the region during the re-building phase following the pandemic. ATTACHMENT
• Land Value Capture Report by Coriolis Consulting Corp. & Wollenberg Munro Consulting Inc.

Evaluation of Land Value Capture and Urban
Development as Sources of Revenue for TransLink
February 2020
Prepared for:
TransLink
By:
EVALUATION OF LAND VALUE CAPTURE AND URBAN DEVELOPMENT AS SOURCES OF REVENUE FOR TRANSLINK
PAGE I
Table of Contents
1.0 Introduction ........................................................................................................... 1
1.1 Background ........................................................................................................................... 1
1.2 Terms ..................................................................................................................................... 1
1.3 TransLink’s Goals ................................................................................................................ 2
1.4 Study Participants ................................................................................................................ 4
1.5 Professional Disclaimer ....................................................................................................... 4
2.0 Foundations of Land Value Capture ................................................................... 5
2.1 Rationale ............................................................................................................................... 5
2.2 The Factors that Create Urban Land Value........................................................................ 5
2.2.1 Geography and Context ......................................................................................... 6
2.2.2 Local Zoning and Infrastructure ............................................................................. 7
2.2.3 Site Characteristics ................................................................................................ 7
2.3 The Role of Land Owners .................................................................................................... 8
2.4 Approaches Using Taxes, Charges, and Zoning ............................................................ 10
2.4.1 One-Time Taxes and Charges ............................................................................ 10
2.4.2 Recurring Taxes ................................................................................................... 10
2.5 Approaches Using Direct Participation in Strategic Land Acquisition and
Development ....................................................................................................................... 11
2.5.1 Strategic Land Acquisition and Disposition ......................................................... 11
2.5.2 Participation in Urban Development Projects ...................................................... 12
2.6 Other Approaches Not Considered in this Report .......................................................... 14
2.7 Advantages and Disadvantages of Land Value Capture ................................................ 15
2.7.1 Taxes ................................................................................................................... 15
2.7.2 Development Charges and Zoning ...................................................................... 17
2.7.3 Land Acquisition and Disposition ......................................................................... 17
3.0 Approaches Currently Applied in BC ................................................................ 18
3.1 Taxes, Development Charges, and Zoning ...................................................................... 18
3.1.1 Federal Government ............................................................................................ 18
3.1.2 Provincial Government ........................................................................................ 18
3.1.3 Metro Vancouver.................................................................................................. 20
3.1.4 Municipalities ....................................................................................................... 20
3.1.5 TransLink ............................................................................................................. 23

EVALUATION OF LAND VALUE CAPTURE AND URBAN DEVELOPMENT AS SOURCES OF REVENUE FOR TRANSLINK
PAGE II
3.1.6 Summary of Taxes, Charges, and Zoning Mechanisms Currently Used in BC .. 25
3.2 Strategic Acquisition and Development Approaches .................................................... 26
4.0 Examples of Approaches Used by Other Agencies Outside of BC ................ 28
4.1 Examples of Approaches to Support Transit Investment .............................................. 28
4.1.1 Canada ................................................................................................................ 28
4.1.2 USA ...................................................................................................................... 29
4.1.3 Outside North America ........................................................................................ 29
4.2 Examples of Approaches to Support Affordable Housing ............................................. 31
4.3 General Observations ........................................................................................................ 31
5.0 Transit Investment, Rezoning, and Land Value ............................................... 33
5.1 Transit Investment and Densification .............................................................................. 33
5.2 Transit Investment and Price/Rent Premiums ................................................................. 34
5.2.1 Sales Price Premium for Multi-Family Strata Residential Units ........................... 34
5.2.2 Lease Rate Premium for Commercial Space ...................................................... 35
5.2.3 Residential Rents ................................................................................................. 37
5.2.4 Implications for Case Studies .............................................................................. 37
5.3 Transit Investment and Rezoning: Case Studies ............................................................ 37
5.3.1 Summary of the Multi-Family Residential Case Studies...................................... 38
5.3.2 Summary of Commercial Case Studies ............................................................... 39
5.4 Conclusions ........................................................................................................................ 39
6.0 Impacts of Different Approaches ...................................................................... 41
6.1 Impacts on Land Owners, Tenants, and Developers ...................................................... 41
6.1.1 Property Taxes (General, Surcharge, Benefitting Area) ...................................... 41
6.1.2 Development Charges ......................................................................................... 43
6.1.3 Density Bonusing and CACs ............................................................................... 43
6.1.4 Land Acquisition and Disposition ......................................................................... 44
6.1.5 Development ........................................................................................................ 44
6.1.6 Summary of Impacts ............................................................................................ 44
6.2 Impacts on Other Levels of Government ......................................................................... 45
7.0 Stakeholder Perspectives .................................................................................. 47
7.1 Summary of Stakeholder Perspectives ............................................................................ 47
7.2 Response to Stakeholder Input ........................................................................................ 49
8.0 Possible Directions for TransLink ..................................................................... 51
8.1 Aligning Approaches and Objectives ............................................................................... 51
EVALUATION OF LAND VALUE CAPTURE AND URBAN DEVELOPMENT AS SOURCES OF REVENUE FOR TRANSLINK
PAGE III
8.2 Evaluating the Options and Identifying Those to Consider Further in the Near Term52
8.2.1 Capital Gains Tax ................................................................................................ 52
8.2.2 Foreign Purchaser Tax ........................................................................................ 53
8.2.3 Property Transfer Tax .......................................................................................... 53
8.2.4 Revisions to TransLink DCC Framework ............................................................ 53
8.2.5 CAC and Density Bonus Revenue Sharing ......................................................... 54
8.2.6 Across-the-Board Increase in Property Taxes ..................................................... 54
8.2.7 Land Value Tax .................................................................................................... 54
8.2.8 Benefitting Area Tax ............................................................................................ 55
8.2.9 Strategic Land Acquisition and Disposition ......................................................... 56
8.2.10 Participation in Urban Development Projects ...................................................... 56
8.3 Examining the Approaches with Potential in More Detail .............................................. 57
8.3.1 Benefitting Area Tax ............................................................................................ 58
8.3.2 CAC and Density Bonus Revenue Sharing ......................................................... 60
8.3.3 Property Transfer Tax .......................................................................................... 63
8.3.4 Strategic Acquisition and Disposition of Land ..................................................... 64
8.3.5 Participation in Urban Development Projects ...................................................... 65
8.4 Potential Uses of New Revenue ........................................................................................ 67
8.5 Policy Questions to be Addressed ................................................................................... 68
8.5.1 Benefitting Area Tax ............................................................................................ 68
8.5.2 CAC and Density Bonus Revenue Sharing ......................................................... 68
8.5.3 Property Transfer Tax .......................................................................................... 69
8.5.4 Strategic Acquisition and Disposition of Land ..................................................... 69
8.5.5 Participation in Urban Development Projects ...................................................... 69
9.0 Recommendations .............................................................................................. 70
Appendix 1: Case Studies ............................................................................................ 72
A.1 Approach ............................................................................................................................. 73
A.2 Identification of Case Studies ........................................................................................... 73
A.2.1 Multi-Family Residential Case Studies ................................................................ 73
A.2.2 Commercial Case Studies ................................................................................... 74
A.2.3 Summary List of Case Studies ............................................................................ 74
A.3 Data Sources ....................................................................................................................... 74
A.4 Detailed Descriptions of Case Studies ............................................................................. 75
Case Study #1: Strata Multi-family Residential Redevelopment in the Broadway Corridor . 75

EVALUATION OF LAND VALUE CAPTURE AND URBAN DEVELOPMENT AS SOURCES OF REVENUE FOR TRANSLINK
PAGE IV
Case Study #2: Market Rental Multi-family Residential Redevelopment in the Broadway
Corridor ................................................................................................................ 77
Case Study #3: Strata Multi-family Residential Redevelopment in Burquitlam .................... 79
Case Study #4: Strata Multi-family Residential Redevelopment in Fleetwood .................... 80
Case Study #5: Strata Multi-family Residential Redevelopment in Lynn Creek .................. 82
Case Study #6: Commercial Redevelopment in the Broadway Corridor ............................. 83
Case Study #7: Commercial Redevelopment in Surrey City Centre .................................... 85
A.4 Summary of Case Studies and Implications for TransLink ........................................... 87
A.5 Attachments (Pro Formas) ................................................................................................ 88

EVALUATION OF LAND VALUE CAPTURE AND URBAN DEVELOPMENT AS SOURCES OF REVENUE FOR TRANSLINK
PAGE 1
1.0 Introduction
1.1 Background
TransLink funds its share of the capital and operating cost of the regional transit system using a variety of
revenue sources, including transit fares, property tax, fuel tax, parking tax, and the new regional transportation
DCC that came into effect in January 2020.
The region needs more investment in transit infrastructure, requiring additional funding. TransLink is
interested in exploring new sources of revenue that will be sustainable in the long run and that have the
potential to advance regional policies. The new regional TransLink DCC that came into effect in January 2020
is an example of expanding the funding base, by obtaining revenue from new urban development projects.
This report examines the potential for TransLink to generate revenue from two kinds of approaches that are
linked to the increasing value of land and the continuing strong demand for residential and commercial
development in this region:
• One approach is called Land Value Capture, which is a broad term that refers to ways to obtain public
revenue or benefits from growth in the value of urban land. The rationale for land value capture is that
public investment in community building and infrastructure is a key driver of land value growth, so it is
reasonable to capture some of the growth in value to pay for the infrastructure.
• The second approach is a greater role in urban development activity by TransLink. TransLink has lands
that are no longer needed for transportation purposes and lands that could accommodate development
on top of or beside transit infrastructure, and it is acquiring land for future transit investment in places
where there will be future development opportunities. By being more active in urban development,
TransLink could create a new stream of revenues.
TransLink commissioned Coriolis Consulting Corp. and Wollenberg Munro Consulting Inc. to analyze the
potential to generate revenue using these two approaches.
1.2 Terms
1. “Land Value Capture” means any mechanism whereby a public entity obtains benefits or revenue
derived from land value or increases in land value. There is a wide range of land value capture
approaches which can be divided into two groups:
a) One-time forms of capture. These are methods of land value capture that occur at a particular event,
such as the sale of a property, development approval, or rezoning. “One-time” does not mean only
once in the history of a property, but once per major event or transaction.
b) Recurring forms of capture. These are methods of land value capture that are ongoing (usually
annually) and are not linked to specific events or transactions. This group includes property taxes.
2. “Urban Development” means direct participation in the urban land market and in the creation of new
residential or commercial projects. There are three main ways in which TransLink could be involved in
urban development:
a) Disposition of surplus lands. TransLink has property that was acquired in the past but is no longer
needed for transportation purposes. This includes entire sites, portions of sites, or the air rights above
transit facilities. These lands could be made available to the market for urban development. Prior to
the disposition of such lands, TransLink has the opportunity to capture value associated with

EVALUATION OF LAND VALUE CAPTURE AND URBAN DEVELOPMENT AS SOURCES OF REVENUE FOR TRANSLINK
PAGE 2
rezoning. Disposition of sites or air rights is a form of land value capture, as it takes advantage of
market-wide gains in land value that have occurred since acquisition and benefits from any land value
increases that result from transit investment and upzoning. This differs from other forms of land value
capture in that it only applies to property that is owned by TransLink rather than to all properties in
an area subject to a tax or development charge.
b) Strategic acquisition and subsequent disposition of lands. TransLink acquires property for
transportation construction. In some cases (such as new transit stations) there can be opportunities
to acquire more land than the minimum needed for construction, in order to take advantage of the
new accessibility that will be provided by transit service and to ensure that the post-construction
development sites are optimized in terms of size and configuration. In these cases, TransLink can
benefit from land value gains due to accessibility, rezoning, and market uplift between the time of
acquisition and disposition (which usually will span several years). Strategic acquisition/disposition is
also a form of land value capture, benefitting from market-wide gains in land value and from transit
investment and upzoning. This approach involves more risk than the disposition of already-owned
surplus property, as it requires new capital investment in property and it usually requires holding land
for several years.
c) Development. There may be cases in which TransLink can best meet its goals by participating in
development projects on its lands, rather than just marketing them to developers. While there is
additional risk involved in development, there is the potential to earn developer profit and the potential
to shape development projects to achieve regional goals such as supporting transit-oriented
affordable housing or enhancing the transit experience for riders. Participation in development
projects is the one approach considered in this report that is not technically a form of land value
capture. The gain in land value of owned property is land value capture, but the separate (albeit
related) decision to be an equity participant in a project is a business decision intended to earn a
profit (not to capture land value). We include development participation because TransLink is
interested in exploring this possible source of revenue and because any disposition of surplus
property carries with it the possibility to be involved in development on the property.
1.3 TransLink’s Goals
The main focus of this work is to identify possible new sources of revenue to pay for transit investment and
transit operations. Generating revenue is not the only reason to consider land value capture and involvement
in urban development, though.
The region has many land use-transportation integration priorities, as outlined in TransLink’s Regional
Transportation Strategy and Metro Vancouver’s Regional Growth Strategy. In particular, there is strong
evidence that affordable rental housing in transit-oriented locations is an excellent strategy for addressing
housing affordability, because transit-oriented housing can reduce household transportation cost, reduce
commuting time (which can be an important benefit to lower income households trying to improve their
circumstances), and reduce construction cost by reducing the need for costly underground parking.
Affordable, transit-oriented housing is also good for building public transit ridership, as lower income
households (and particularly renters) tend to be high transit users.
In addition to building ridership, facilitating urban development at transit stations provides the higher density,
proximity, physical infrastructure, and placemaking that support walking and cycling.

EVALUATION OF LAND VALUE CAPTURE AND URBAN DEVELOPMENT AS SOURCES OF REVENUE FOR TRANSLINK
PAGE 3
Consistent with its mandate to advance the Regional Transportation Strategy and Regional Growth Strategy,
TransLink is looking to this study to help it understand opportunities and challenges for using land value
capture to support three regional goals:
1. Identify new sources of revenue for regional transportation purposes that can be applied to:
• New investment in transportation infrastructure.
• Repaying existing debt for past investments in infrastructure.
• Transit operating costs.
2. Support transit-oriented affordable rental housing. Metro Vancouver needs more affordable rental
housing, especially in transit-oriented locations because renters tend to be more likely to use transit and
they benefit from the reduced cost of living that transit offers over car ownership. Being involved in the
urban land market, either through the terms of sale/lease of TransLink surplus sites or direct participation
in development, gives TransLink the ability to facilitate the construction of more rental units. Consistent
with the Metro Vancouver Transit-Oriented Affordable Housing Study1, “transit-oriented affordable rental
housing” generally refers to housing with these characteristics:
a. Rental tenure.
b. Affordable to households with incomes in range of $35,000 to $60,000 per year (about 50% to 80%
of regional median household income). Household income below $35,000 is considered very low and
generally requires non-market, public sector subsidized housing solutions. Household income above
$60,000 is in the moderate range and is generally able to support market rent in some parts of the
region.
c. In proximity to rapid transit or the Frequent Transit Network, allowing access to employment with
reasonable commute times and without having to rely on owning a private vehicle.
The emphasis is on affordable, transit-oriented rental housing because households in this segment are
above-average users of transit, are not having their needs met by market rental housing, and are capable
of paying enough rent to make new construction financially viable without ongoing subsidy provided land
(or density) is available at little cost.
3. Increase walking, cycling, and transit use. Increasing the non-automobile number of trips requires
supportive infrastructure (e.g. bike lanes) and it requires that transit be well-integrated with adjacent
development so that it is convenient for pedestrians and cyclists. Being involved in urban development
creates the opportunity to directly influence the form and character of development so that it is transit
supportive.
Land value capture can also be used to achieve other goals. For example, land value capture can be a tool
for wealth distribution, for reducing land values or housing prices (usually as part of a broader strategy to
make housing more affordable), or for reducing investment in property solely for capital appreciation
purposes. This report for TransLink is not intended to consider ways to achieve these kinds of outcomes.
This report focuses on the possible use of land value capture and possible involvement in urban development
as mechanisms for achieving TransLink’s three primary goals listed above.
1 Coriolis Consulting Corp. and Wollenberg Munro Consulting Inc., “Reducing the Barrier to High Land Cost: Strategies for Facilitating More Affordable Rental Housing Construction in Metro Vancouver. Phase 2 of the Transit-Oriented Affordable Housing Study.” March 2019.

EVALUATION OF LAND VALUE CAPTURE AND URBAN DEVELOPMENT AS SOURCES OF REVENUE FOR TRANSLINK
PAGE 4
1.4 Study Participants
TransLink established a staff Working Group to manage this project and provide direction to the consultants.
TransLink invited Metro Vancouver to participate on this team, particularly regarding ways in which TransLink
might use land value capture to support affordable rental housing at transit-oriented locations in the region.
Representatives of local government and the development industry participated in two rounds of workshops
to review the consultant team’s work and also provided written comments on the first draft of the report.
The consultant team completed all of the technical analysis and provided independent opinions and
recommendations, as contained in this final report. The opinions expressed in this report do not necessarily
reflect the opinions of TransLink, Metro Vancouver, or any of the stakeholders who provided input.
1.5 Professional Disclaimer
This document may contain estimates and forecasts of future growth and urban development prospects,
estimates of the financial performance of possible future urban development projects, opinions regarding the
likelihood of approval of development projects, and recommendations regarding development strategy or
municipal/regional policy. All such estimates, forecasts, opinions, and recommendations are based in part on
forecasts and assumptions regarding population change, economic growth, policy, market conditions,
development costs, and other variables. The assumptions, estimates, forecasts, opinions, and
recommendations are based on interpreting past trends, gauging current conditions, and making judgments
about the future. As with all judgments concerning future trends and events, however, there is uncertainty
and risk that conditions change or unanticipated circumstances occur such that actual events turn out
differently than as anticipated in this document, which is intended to be used as a reasonable indicator of
potential outcomes rather than as a precise prediction of future events.
Nothing contained in this report, express or implied, shall confer rights or remedies upon, or create any
contractual relationship with, or cause of action in favour of, any third party relying upon this document.
In no event shall Coriolis Consulting Corp. or Wollenberg Munro Consulting Inc. be liable to TransLink or any
third party for any indirect, incidental, special, or consequential damages whatsoever, including lost revenues
or profits.

EVALUATION OF LAND VALUE CAPTURE AND URBAN DEVELOPMENT AS SOURCES OF REVENUE FOR TRANSLINK
PAGE 5
2.0 Foundations of Land Value Capture
2.1 Rationale
Land value capture is already in use, or is being considered, as a revenue-generating tool in many urban
regions around the world. There is extensive interest in this tool because there is a compelling case for the
public sector to capture some of the value that the public sector creates via community building and
infrastructure investment and then reinvest this value to create further public benefit.
The rationale for land value capture can be summarized in this way:
• The value of urban land is based heavily on how it can be used and its access to urban infrastructure.
• Increases in land value (as distinct from the value of improvements) are almost entirely due to public
actions, such as zoning, infrastructure investment, and the creation of the legal and economic framework
within which communities develop. The public sector should benefit from these actions rather than all of
the benefit accruing to private owners of land.
• Investment in land is not as productive for the economy as investments that create jobs and income, so
taxation policy should generally discourage passive land investment in favour of more active forms of
investment.
• In urban areas, land should be used to its maximum potential, not left vacant or under-used, so property
tax policy should encourage development.
• Land cannot move, so tax avoidance is not a concern.
It is important to note that “land value capture” makes a distinction between land value and total property
value. The value of each urban property is the sum of its land value and its improvements value.
Improvements mainly refers to buildings. Most users of urban land tend to “bundle” land and improvements,
in the sense that a person puts a value on their home, or a business is willing to pay a certain rent to occupy
space in a particular location. But it is possible to un-bundle the value into its land and improvements
components. Land value capture focuses on the land portion, because this is the part of property value that
is created mainly by public sector actions and this is the passive part of property investment that is
comparatively unproductive for the economy, whereas improvements value is created by private investment
in new construction which creates economically and socially useful space for housing and employment.
Land value capture perhaps sounds like a new form of taxation, but in BC property owners are already
exposed to several kinds of land value capture taxes and charges that go by other names. Property tax,
property transfer tax, and the new Provincial school tax surcharge are just some of the ways that many land
owners are taxed (on the value of land and improvements). Developers already deal with other forms of land
value capture, including Development Cost Charges and Community Amenity Contributions. So, the idea is
not new. The purpose of this report is to explore how TransLink might use land value capture to achieve its
goals.
2.2 The Factors that Create Urban Land Value
In order to understand the rationale for public sector land value capture, it is important to consider how urban
land value is created in the first place.
EVALUATION OF LAND VALUE CAPTURE AND URBAN DEVELOPMENT AS SOURCES OF REVENUE FOR TRANSLINK
PAGE 6
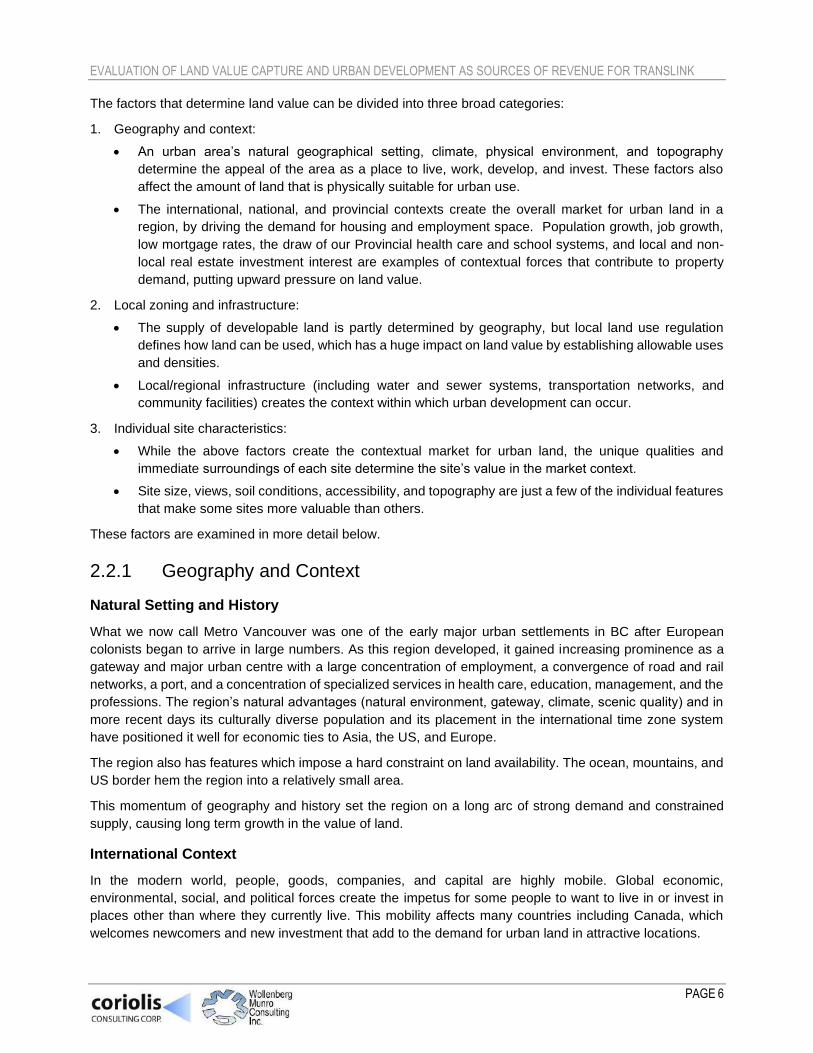
The factors that determine land value can be divided into three broad categories:
1. Geography and context:
• An urban area’s natural geographical setting, climate, physical environment, and topography
determine the appeal of the area as a place to live, work, develop, and invest. These factors also
affect the amount of land that is physically suitable for urban use.
• The international, national, and provincial contexts create the overall market for urban land in a
region, by driving the demand for housing and employment space. Population growth, job growth,
low mortgage rates, the draw of our Provincial health care and school systems, and local and non-
local real estate investment interest are examples of contextual forces that contribute to property
demand, putting upward pressure on land value.
2. Local zoning and infrastructure:
• The supply of developable land is partly determined by geography, but local land use regulation
defines how land can be used, which has a huge impact on land value by establishing allowable uses
and densities.
• Local/regional infrastructure (including water and sewer systems, transportation networks, and
community facilities) creates the context within which urban development can occur.
3. Individual site characteristics:
• While the above factors create the contextual market for urban land, the unique qualities and
immediate surroundings of each site determine the site’s value in the market context.
• Site size, views, soil conditions, accessibility, and topography are just a few of the individual features
that make some sites more valuable than others.
These factors are examined in more detail below.
2.2.1 Geography and Context
Natural Setting and History
What we now call Metro Vancouver was one of the early major urban settlements in BC after European
colonists began to arrive in large numbers. As this region developed, it gained increasing prominence as a
gateway and major urban centre with a large concentration of employment, a convergence of road and rail
networks, a port, and a concentration of specialized services in health care, education, management, and the
professions. The region’s natural advantages (natural environment, gateway, climate, scenic quality) and in
more recent days its culturally diverse population and its placement in the international time zone system
have positioned it well for economic ties to Asia, the US, and Europe.
The region also has features which impose a hard constraint on land availability. The ocean, mountains, and
US border hem the region into a relatively small area.
This momentum of geography and history set the region on a long arc of strong demand and constrained
supply, causing long term growth in the value of land.
International Context
In the modern world, people, goods, companies, and capital are highly mobile. Global economic,
environmental, social, and political forces create the impetus for some people to want to live in or invest in
places other than where they currently live. This mobility affects many countries including Canada, which
welcomes newcomers and new investment that add to the demand for urban land in attractive locations.

EVALUATION OF LAND VALUE CAPTURE AND URBAN DEVELOPMENT AS SOURCES OF REVENUE FOR TRANSLINK
PAGE 7
National Context
Canada as a nation state and a national economy has major competitive advantages that lead to the demand
for urban land, including:
• A framework of property rights and the rule of law.
• A comparatively safe, tolerant, and culturally diverse community structure.
• An extensive network of air, marine, rail, transit, and highway infrastructure.
• A system of immigration and offshore investment management.
• A strong central bank and national banking system.
This national context attracts and supports population growth, business growth, and local and non-local
investment, all of which contribute to growth in urban land value.
Provincial Context
The Province of BC is responsible for key elements of the context that supports land value growth, including:
• The health care system.
• K to 12 public education.
• Post-secondary education.
• Regional infrastructure including highways, bridges, and transit.
• Economic development initiatives that attract investment and companies.
This Provincial framework contributes to land value growth in many communities, although there are declines
in some due to challenges such as the reduction of output in the forestry sector. The effect of the Provincial
education and health care system is magnified in Metro Vancouver, as it has the largest concentration of
post-secondary institutions and specialized health care facilities and services.
The Province also has a significant influence on the supply of developable land in Metro Vancouver, via the
Agricultural Land Reserve which protects farmland but also has the effect of shrinking an already-constrained
supply of land for development for urban use.
2.2.2 Local Zoning and Infrastructure
Local governments and regional agencies also make a significant contribution to the forces that create and
increase land value. The planning and zoning framework governs land use, height, and density which affect
the value of land. Local government provides infrastructure and amenities, regional agencies provide the
water system (Metro Vancouver Water Department), sewer networks (GVS&DD), electricity (BC Hydro),
natural gas (FortisBC), and transportation/transit infrastructure (TransLink).
2.2.3 Site Characteristics
The national, provincial, and regional/local contexts create an overall market for urban land in Metro
Vancouver, driving demand for housing and employment space and delimiting the supply of land for
development. Within this regional market, site specific factors determine the market value of individual parcels
of land. These include:
• The specific zoning regulations that apply to each site.

EVALUATION OF LAND VALUE CAPTURE AND URBAN DEVELOPMENT AS SOURCES OF REVENUE FOR TRANSLINK
PAGE 8
• Accessibility by road and transit for residential and commercial uses and by rail, sea, or air for many
industrial uses.
• Services and utilities to the site.
• Nearby amenities and services (e.g. schools, shopping, parks, recreation/community centres).
• Soil conditions and topography.
• Special features such as views or waterfront.
These features determine the value of land. Investments in improvements increase total property value but
do not change the value of the land.
2.3 The Role of Land Owners
In the breakdown of factors that drive land value, all of them can be considered contextual, inherent in the
site itself, or the result of actions by others (mostly local government) that directly benefit the parcel of land.
The land owner does not really have a direct ability to cause land value to rise. Certainly land owners can
invest in improvements, which increase the total value of the property, but this does not change the value of
the land. The land owner can seek rezoning, but local government makes this decision. Therefore, many
commentators treat land value gain as a sort of windfall for the owner: the owner benefits from public
decisions (such as rezoning, transit investment, nearby public amenities such as parks) without having
directly paid for them. However, the characterization of the land value gain as a pure windfall makes it sound
accidental, which is not entirely true:
• Land owners have usually made deliberate decisions about where and when to buy land for housing,
business use, development, or investment. They may not cause land value gain, but they make a choice
that presumably includes some thought about where there is an opportunity. An investment in land
involves taking risk, weighing options, and making choices. This is different than finding money on the
sidewalk. While land values have risen rapidly in Metro Vancouver during the last decade, there have
Urban Land Value
International, national, provincial context, and geography
Local zoning, infrastructure and facilities
Individual site characteristics

EVALUATION OF LAND VALUE CAPTURE AND URBAN DEVELOPMENT AS SOURCES OF REVENUE FOR TRANSLINK
PAGE 9
been periods of decline or very low growth (e.g.
1981 to 1988, 1995 to 2002, 2008 to 2009, 2018
to 2019), indicating that there is risk.
• Owners of houses or residential strata units may
have made tradeoffs when they acquired their
homes. For example, suppose two households
each have a house purchase budget of
$1,000,000. One opts for a small, older home
near the region’s core so family members can
walk to work, school, or shopping. This purchase
involves $800,000 of land value and $200,000
of improvements. The other opts for a suburban
location because of a higher priority on larger,
newer space. This purchase involves $200,000
in land value and $800,000 in improvements,
and also means that this household drives more.
Now suppose land values in both cases rise by
25% over some period. The first household will
realize a higher land value gain and, if a land
value tax mechanism were in place, would pay
more tax. This may be perceived as inequitable
considering the tradeoff that was made at the
outset.
• Developers or land owners who seek rezoning
would receive a windfall if extra density is
available at no cost. But if they exchange cash or amenities to obtain increased density there is no land
value windfall as long as the amount they pay is commensurate with the value of the density.
The conversation about land value capture in Metro Vancouver is in part stimulated by the rapid rise in land
values over the last decade or so.
The trend in Metro Vancouver house prices from 2005 to 2018 as indicated by the Greater Vancouver Real
Estate Board’s MLS Home Price Index2 is summarized in Exhibit 1.
Exhibit 1: Average Annual % Increase in Metro Vancouver Housing Prices by Type of Property (2005 to 2018)
Average Annual Increase in Metro Vancouver
Single detached 8.7%
Strata apartment 9.1%
Source: MLS Home Price Index, Greater Vancouver Real Estate Board.
All owners of residential property in the region have seen significant percentage increases in the land value
component of the total value. The dollar value increases are much larger in some areas (such as the west
side of Vancouver) because values were higher to start with, but the percentage gains are high across the
region.
2 The index is based on the estimated annual change in the sales price of a benchmark property within each submarket.
An investment in land involves taking risk, weighing options, and making
choices. If land value goes up it's not the same as the lucky accident of finding money on the sidewalk.
Household "A" purchases $1 million modest older house on lot with
higher land value ($800,000 land; $200,000 improvements)
Household "B" purchases $1 million newer house on lot with lower land
value ($200,000 land; $800,000 improvements)
Land Value Capture impacts Household "A"more than
Household "B" because "A" has higher land value

EVALUATION OF LAND VALUE CAPTURE AND URBAN DEVELOPMENT AS SOURCES OF REVENUE FOR TRANSLINK
PAGE 10
2.4 Approaches Using Taxes, Charges, and Zoning
This section summarizes the main forms of land value capture that involve taxes and charges applied to
urban areas. The approaches are divided into one-time and recurring methods.
2.4.1 One-Time Taxes and Charges
There are several commonly used ways to derive revenue from land value at a point in time, usually at a
transaction or at a development milestone. These include:
• Taxes on the transfer of property ownership at time of sale. These are sometimes called stamp taxes
and in BC are called Property Transfer Tax.
• Income tax or capital gains tax on the increase in property value when sold. Different jurisdictions
treat capital gains differently. In Canada most capital gains are taxed favourably compared to income and
gains on principal residences are exempt from taxation.
• Fees charged on new development at the time of permit approval, mainly to raise revenue to pay the
capital cost of community infrastructure. These are variously called development levies, impact fees, or
development charges. In BC, they are called DCCs or (in the City of Vancouver) DCLs.
• Public benefits in exchange for new development entitlements (density), usually at rezoning. Many
jurisdictions use density bonusing or negotiated contributions at the time of rezoning to obtain public
benefits or amenities. These are commonly called Community Amenity Contributions (CACs) or density
bonusing in BC.
There are some important features of these one-time approaches:
• Property transfer taxes are paid by the purchaser and do not require a cash outlay by the existing owner.
• Capital gains tax occurs when the owner sells, meaning the sales proceeds provide the cash used to pay
the tax.
• Fees paid at development approval are paid by developers as part of the process of creating a new
project and tend to come out of what otherwise would be land value.
• Public benefits at rezoning are an exchange of density, which creates new land value, for amenities and
infrastructure that use some of the new value to address the needs and impacts of growth.
2.4.2 Recurring Taxes
The second major group of land-based revenues consists of different kinds of ongoing taxes on property.
These include:
• Tax on Property Value or Land Value. Almost all jurisdictions levy annual tax on the value of land,
improvements, or (most commonly) both. The most common approach is for land and improvements to
be taxed at the same rate, although there are a few jurisdictions that allow different tax rates for land and
improvements.
• Property Tax Surcharge. Some jurisdictions apply a property tax surcharge to some categories of
property, such as property above a certain value or in a particular location. The BC School Tax surcharge
on high value residential property is an example of a value-based surcharge and the BC Speculation and
Vacancy Tax is an example of a surcharge on a particular group of properties based on location and
occupancy.

EVALUATION OF LAND VALUE CAPTURE AND URBAN DEVELOPMENT AS SOURCES OF REVENUE FOR TRANSLINK
PAGE 11
• Benefitting Area Surcharge. Some jurisdictions apply a tax surcharge to properties that benefit from a
specific public sector capital project. These are sometimes called betterment taxes, special service area
taxes, local improvement taxes, or special assessment districts. Several jurisdictions in the US levy
additional property taxes on property in defined transit service areas.
These recurring charges are paid by the owners or users of the property out of their income or wealth, not
out of proceeds from disposition or development of the property. The taxpayer must have a source of income,
have cash on hand, or borrow to cover the cost of the tax, unless there is some system of exemption or
deferment.
2.5 Approaches Using Direct Participation in Strategic Land
Acquisition and Development
Land value capture mechanisms are intended to derive revenue from all urban property that benefits from
investments in infrastructure or from land use decisions. Land value capture by a public entity does not have
to be associated with any direct participation in the land market or in urban development projects. However,
direct participation in the urban land market, or in development projects, is another way that the public sector
can reap benefits from infrastructure investments and zoning changes.
2.5.1 Strategic Land Acquisition and Disposition
All levels of government are involved in acquiring and selling/leasing land for a wide range of purposes
including generating revenue, supporting housing, and meeting civic social, recreational, and cultural
objectives. Agencies involved in delivering transportation infrastructure are of necessity involved in the land
market because they require property for permanent use for stations and corridors as well as temporary use
during construction for staging and storage. This need for property creates an opportunity to take advantage
of subsequent gains in land value due to increased accessibility after a new line goes into service, changes
in zoning, and general growth in land value in an overall rising market.
Public agencies with long term involvement in transportation infrastructure delivery also end up with
properties that were needed in the past but are no longer needed for transportation purposes and so are
partly or entirely surplus. Depending on where they are and how long they have been held, the value of these
properties may be significantly higher than original acquisition cost.
Under the general heading of strategic land acquisition and disposition, there are several ways in which a
transportation agency can earn revenue or achieve other objectives such as encouraging transit ridership or
supporting affordable housing:
• Disposition of property that has become surplus to the agency’s functional transportation requirements.
Sites once needed for storing/maintaining transit vehicles or transfer stations may no longer be required
due to changes in technology, transportation networks, or other factors.
• Disposition of sites required for temporary use during major construction once construction is complete.
• When acquiring land for new infrastructure, acquisition of more than the bare minimum needed for transit
use. There are several ways to create these opportunities:
o The potential for air rights development over transit infrastructure can be maximized if care is taken
in acquiring sufficient land to create the physical ability for such development and if care is taken in
the siting and design of transit infrastructure.
EVALUATION OF LAND VALUE CAPTURE AND URBAN DEVELOPMENT AS SOURCES OF REVENUE FOR TRANSLINK
PAGE 12
o If the land required for transit construction necessitates the acquisition of a part of a property, it can
be financially advantageous to acquire the entire property either to ensure that post construction
there is a workable development site or to avoid the situation that it costs more to acquire a partial
property (because of negative impacts on the residual portion) than to just buy the whole site.
o If the land required for transit construction is adjacent to property that is a strong candidate for land
assembly that creates additional, better development potential.
These opportunities create the potential to generate three kinds of land value gain:
• Usually considerable time passes between acquisition and subsequent disposition of surplus property. In
strong land markets, the growth in land value can exceed a public agency’s cost of capital meaning that
even if the funds to buy land must be borrowed the eventual sale will produce a net gain.
• The area around new transit stations is often a candidate for changes in land use and increases in density,
which usually add to land value. Even when much of the land value lift caused by rezoning is captured
by local government, in the form of development levies or mechanisms such as CACs, a portion of the
lift accrues to land owners.
• New transit infrastructure improves accessibility, which tends to add a price premium on residential and
commercial space in the vicinity of the transit. This price premium translates to increased land value for
the owner.
In many cases, land acquired by a transit agency can benefit from all three of these gains so it can become
very attractive to make early strategic investments in land when planning for major new infrastructure projects.
In addition to generating revenue, land acquisition also creates the potential to achieve other objectives.
When an agency disposes of developable land, via sale or lease, there is an opportunity to influence land
use and the form and character of development in ways that can support affordable housing or that support
transit ridership. Mechanisms to achieve objectives regarding affordable housing and transit ridership support
include:
• Terms of sale or lease of land to developers. TransLink could, for example, require the inclusion of
affordable rental housing units when it disposes of development sites and could require that the physical
design of projects be supportive of walking, cycling, and transit use.
• Zoning. When TransLink seeks rezoning of property prior to disposition it could work with local
governments to include zoning provisions regarding affordable rental housing or to require design
elements that are supportive of walking, cycling, and transit use.
• Funding. TransLink could apply some of the proceeds from strategic land acquisition/disposition to
investments in affordable housing (directly or by contributing to other initiatives such as the regional
affordable fund being proposed by Metro Vancouver as one of the outcomes of its Transit-Oriented
Affordable Housing work).
There are tradeoffs, of course, because incorporating rental housing results in less land value (unless local
government is willing to provide significantly more new density for rental than it would for strata). It is up to
the agency to decide which objectives to advance and how to prioritize different potential public benefits.
2.5.2 Participation in Urban Development Projects
If a transit agency sells or leases surplus lands to the development sector, the agency benefits from gains in
land value that have occurred since the time of acquisition, especially if new transit infrastructure has been
built in that time and if allowable land use and density have changed. A private developer who acquires the

EVALUATION OF LAND VALUE CAPTURE AND URBAN DEVELOPMENT AS SOURCES OF REVENUE FOR TRANSLINK
PAGE 13
land then benefits from any land value growth between the time of site acquisition and the completion of the
project, and also (in a successful project) earns a developer profit.
By directly participating in development projects, a public agency can tap some or all of this revenue potential.
TransLink could be involved in urban development projects in various ways:
• Rather than sell or lease surplus sites or development parcels to developers, TransLink could take on
the role of developer either alone or in partnership with other developers.
• TransLink could be the developer of rentable space within or adjacent to new transit infrastructure (e.g.
retail space as part of the station or rentable space in the air rights above a station).
• TransLink could take ownership of space within a development project in lieu of being paid for a
development parcel. In this case, TransLink would not be a developer but would take on some
development risk by taking space instead of cash.
Direct participation in development projects is not technically a form of land value capture. The land value
capture is realized when a surplus property is made available for development, either to an arms-length
developer or to an internal development division. Participating in the actual development on the surplus
property would be a separate business decision by TransLink that involves injecting new equity and/or
deciding to invest the value of the land into the project in order to make a profit in addition to capturing the
(increased) value of the land. Of course, non-profit developers work on a different business model, but
presumably TransLink would only become directly involved in development projects as a means of generating
revenue (i.e. profit) to be applied to the organization’s investment objectives.
Direct participation in development is very different from land value capture as it involves significant possible
risk, including:
• Market risk. Large scale, high density development projects typically involve two or more years between
commencement and completion. During this time market conditions can change. If prices and the rate of
sale or lease-up increase, then developers benefit. But the market can go soft, reducing or eliminating
profit and creating the risk of loss.
• Cost risk. Developers use various methods to reduce risk of increasing construction cost, but there is
always exposure to delay, mistakes, material or labour issues, and other factors that can increase cost.
If costs rise more than sales prices, then profitability is impaired.
• Approvals risk. The process of obtaining municipal development approvals involves risk related to
municipal requirements (e.g. off-site works, sustainability features, design) and timing. Risk can be
significantly mitigated by resolving zoning-related matters before committing to a project but there are
still risks inherent in the development permit and building permit phase of a development project,
particularly for large projects and projects that involve any significant opposition from the public or specific
stakeholder groups.
• Financing risk. Almost all development projects require construction financing. Depending on the terms
of such financing, there is a risk that interest rates rise during construction.
• Physical risk. Development projects can encounter soil contamination, problematic geotechnical or
hydrological conditions, or damage during construction (e.g. fire, excavation collapse) that increase cost.
These can be mitigated by thorough due diligence work before committing to a project, but some risk
always remains.
• Partner risk. An agency may prefer to work with a developer partner rather than be fully responsible for
a project. This has the advantage of adding expertise to the team, spreading risk, and reducing the need

EVALUATION OF LAND VALUE CAPTURE AND URBAN DEVELOPMENT AS SOURCES OF REVENUE FOR TRANSLINK
PAGE 14
for agency equity or borrowing, but it comes with a new set of risks associated with the legal and financial
structure of the deal. A partner may become insolvent, act outside the terms of agreements, cause
negative publicity, or do other things that impair the financial or reputational position of the public sector
partner. These risks can be mitigated by careful partner selection and robust legal agreements, but these
risks cannot be completely eliminated.
Because of the risks involved, the decision to participate directly in urban development projects requires
caution and considerable advance work to ensure that the potential benefits are significant enough to warrant
the risks. A transit agency can mitigate the risks of being involved in development by:
• Focusing on projects that are at transit locations. Market risk is lower in high demand locations.
• Focusing on projects that include high-demand product.
• Extensive due diligence, appropriate provision for contingency, and detailed risk assessment.
Direct participation in development can generate revenue to apply to transit, affordable housing, and other
objectives. In addition, direct participation in development would enable TransLink to create affordable rental
housing and to design projects to incorporate features that support walking, cycling, and transit use.
2.6 Other Approaches Not Considered in this Report
TransLink asked us about four other approaches, which are not considered in this report for the following
reasons:
1. Cash-in-Lieu of Off-Street Parking. Off-street parking is an expensive component of high density
residential and commercial construction. In transit-oriented locations, demand for parking is lower and
developers are usually interested in reducing municipal zoning requirements for off-street parking when
the cost saving is greater than any loss in revenue.
Reduced parking requirements can be implemented by changing zoning requirements, without requiring
any contribution from developers. Alternatively, there are systems in which a reduced parking
requirement can be obtained in exchange for a cash-in-lieu payment, with the funds applied to transit
investment.
This means of generating revenue is not considered in this report for these reasons:
• Development regulation in BC is completely the responsibility of local government and is not likely to
be restructured to give other agencies a role in defining zoning requirements such as parking.
• Cash-in-lieu of parking is a revenue generating tool but it is not a land value capture mechanism. If
the cash payment is equal to what the cost of parking would have been, there is no impact on
development economics so there is no transfer of land value (and developers are not likely to build
less parking if they have to pay for it anyway). If the cash payment is less than the cost of the parking,
this can actually put upward pressure on land value by reducing development cost.
2. Hotel and Short-Term Rental Tax. Some local governments impose taxes on specific uses. However,
these are not land value capture mechanisms so they are not considered in this report:
• Hotel taxes are based on room revenue, so they are a tax on revenue not on value. There may be
an indirect effect on the value of hotel properties by reducing net operating income, but this is not the
aim.
• Taxes or fees on short term rentals are a means of regulating the use, not taxing value.
3. Tax Increment Financing. Another approach that is often mentioned is called Tax Increment Financing
(TIF). TIF works like this:

EVALUATION OF LAND VALUE CAPTURE AND URBAN DEVELOPMENT AS SOURCES OF REVENUE FOR TRANSLINK
PAGE 15
• A public agency with property tax authority borrows money (either as a loan or by issuing a bond) to
pay for some form of infrastructure that is expected to cause land values and property tax revenues
to rise.
• To provide security for the lender or bondholders, the agency pledges to apply growth in property tax
revenue in the benefitting area to repayment. This pledge is a way to reduce the risk of default.
So, TIF is not land value capture per se. It is just a means of using increased value (i.e. the growth in
property taxes in a specific area) as security to obtain financing. There is no “new money”; the gains in
property tax revenue caused by infrastructure investment are going to occur whether or not TIF is used;
the TIF is simply an allocation of new taxes to the specific purpose of repaying borrowed funds.3 This
approach can make sense if a local government can only obtain financing by pledging the future tax
growth in a defined area. In jurisdictions that do not have difficulty borrowing, it makes more sense for a
lender or bond buyer to have repayment obligations secured by the entire tax base of the agency, not
just the portion of the tax base inside the TIF area. For these reasons, TIF is not directly relevant to
TransLink’s situation and is not considered in this policy analysis report.
4. Penalties on Low Density Development. Some stakeholders have suggested applying a charge or tax
on low density development as a disincentive to development that is not transit-oriented. Such a charge
would be an indirect form of land value capture, in the same way that DCCs put downward pressure on
a developer’s ability to pay for land. The existing property tax system in BC acts as a kind of disincentive
to maintaining under-developed properties (because property is taxed based on its development
potential) but the use of triple net leases can diminish the effectiveness of this disincentive because the
tax is passed to tenants. There are two reasons why we do not include this kind of charge in this report.
First, such a charge is mainly intended as a disincentive to influence urban development patterns. We
take the view that if there is a desire to limit low density development, this should be accomplished directly
by regional planning policy and by municipal land use planning rather than indirectly by a charge levied
by a regional transportation agency that has no direct statutory role in land use planning or development
regulation. Second, in Metro Vancouver there is a diminishing supply of land available for new low density
residential development. While a charge of this type may be an effective influence on land use, it is not
likely a sustainable long term revenue stream.
2.7 Advantages and Disadvantages of Land Value Capture
2.7.1 Taxes
Governments have a variety of ways to raise tax revenue from individuals and corporations, including income
tax, sales tax (such as PST or gasoline tax in BC), value added tax (such as GST in Canada), user fees, and
property tax. Each of these revenue tools has advantages and disadvantages in terms of fairness,
progressiveness (i.e. rising progressively with income in order to make the tax burden more equitable in its
impact), economic efficiency (minimizing negative impacts of taxation on the economy), the ability to modify
behaviour (e.g. using a carbon tax to reduce fuel consumption), and other factors.
With this wide variety of tax measures available, it is important to consider whether there are particular
advantages and disadvantages to taxing the value of land.
3 There are special circumstances in which a TIF-like instrument creates new revenue for a local government. For example, in Alberta municipalities can create Community Revitalization Levy districts in which the Province agrees that any growth in what would have been the Provincial share of property tax is transferred to the municipality. In this case, it is not the “TIF” that is creating new local money, it is the willingness of the Province to transfer revenue to the municipality.

EVALUATION OF LAND VALUE CAPTURE AND URBAN DEVELOPMENT AS SOURCES OF REVENUE FOR TRANSLINK
PAGE 16
The idea of taxing land is not new. In the late 1700’s, Adam Smith advocated taxing land as a means of
generating revenue without reducing total economic output because it does not impede productivity. George
Henry, a 19th century economist, proposed that taxes on income reduce incentive to work and taxes on
production are a disincentive to productivity, but taxes on land do not discourage productive economic activity.
Land investment is passive; capital tied up in land does not generate economic benefits the same way that
investments in business do. Taxing land value can recoup some of the investment that caused land value
gains. Taxing land value can also lead to reductions in land value and house prices, although the advantage
of a lower upfront price (which would lower the requirement for down payment and result in lower mortgage
costs) can be offset by higher ongoing taxation costs.
Note that these are arguments for taxing land but not improvements, which do contribute to productive
capacity and provide benefits such as housing. Taxing land can encourage investment in improvements
(because the tax burden would be spread over more space).
One of the main arguments against recurring taxation of land value is that this tax is unrelated to income or
ability to pay. This concern is often articulated with regard to homeowners whose homes have risen in value
but whose incomes have not. The
counterarguments are that such people can
sell their homes and move to lower value
accommodation or that, in places such as
BC, some households are eligible to defer
property tax (at a very favourable interest
rate) until time of sale. But there is still some
social and political objection to tax policy that
forces people to sell their home, take on
debt, or see their equity decline.
Business owner/occupiers may also face
financial challenges if their taxes rise,
because their business may not generate
enough income to cover the new cost.
Another possible concern is that increased
property taxes can in some cases be passed
on to residential and commercial renters.
The effect of changes in land value on tax revenues depends on the structure of the tax. For example:
• Property taxes in BC are primarily determined by the budget requirements of local government and the
Province. The budget identifies how much property tax revenue is needed, and then this tax burden is
distributed across the assessment base. Changes in value affect how much tax each property pays, but
do not necessarily affect the total tax revenue stream.
• Taxes that are applied to property based on its value (e.g. the Provincial School Tax Surcharge or the
sliding scale used in the Provincial Property Transfer Tax) are affected by changes in land value. Rising
land values will produce more revenue and falling land values will produce less, unless the rates or rate
classes are adjusted.
• Taxes on the proceeds from property disposition (e.g. capital gains tax) are affected by the total volume
and value of dispositions.
When choosing and designing a land value capture approach, there are ways to reduce vulnerability of the
revenue stream to changes in land value.
• can recoup some of the investment that caused the land value gain
• can lead to reductions in land value, which can aid housing affordability
• can encourage investment in improvements
•resilient to changes in land value, as tax rates can be adjusted accordingly
Advantages
...of taxing land value (i.e. not improvement
value).
• land value is unrelated to income or the ability to pay
• may not be affordable for business owners/occupiers
• increased taxes may be passed along to renters
Disadvantages
...of taxing land value.

EVALUATION OF LAND VALUE CAPTURE AND URBAN DEVELOPMENT AS SOURCES OF REVENUE FOR TRANSLINK
PAGE 17
2.7.2 Development Charges and Zoning
These approaches apply to new urban development, not to land owners in general. They have two main
advantages:
• These approaches draw revenue from a new group of payers, rather than continuing to charge transit
riders, auto users, and land owners in general. The charges are paid by developers, but the ultimate
impact tends to be a reduction in the value of development land from what it otherwise would be.
However, owners of development property generally enjoy land value gains even though some of the
value is captured by development fees or zoning related contributions.
• There is a clear link between those who benefit (i.e. land owners benefit from land value gains due to
transit investment and upzoning) and those who pay (i.e. some of the potential land value gain is captured
by the public sector).
There are some disadvantages of land value capture approaches that rely on urban development:
• Because the pace of development varies over time, the revenue stream from development charges or
zoning-based contributions will also vary. This form of land value capture is inherently less regular than
property tax.
• Because of land economics, there is some risk that charges on development or zoning impact the viability
of new development if the charges are not carefully calibrated to continue to provide incentives for
developers and for land owners. If the pace of development is reduced, there will be impacts on
affordability. This risk can be managed by ensuring that charges are set appropriately.
• If land values fall, revenues from these sources could fall, in part because of changes in the value of
density and in part because reduced financial performance of projects could reduce their ability to absorb
cost.
2.7.3 Land Acquisition and Disposition
Participation in the land market has these advantages:
• The agency making the investment in transit can directly capture value by controlling property that will
rise in value due to transit investment and upzoning.
• Disposition of surplus lands and air rights provides capacity for new development that would not otherwise
be available, in transit-oriented locations.
• Control over land disposition allows a degree of control over the form and character of development,
which can support affordable housing, transit ridership, cycling, and walking.
• Strategic acquisition and assembly can create attractive development sites that are better than those that
result from a minimalist approach to land acquisition for transit infrastructure.
There are two potential disadvantages of land value capture via direct involvement in the land market:
• New acquisitions require a source of capital. This means (in the short run) diverting capital that could
otherwise have been used to fund transit or repay debt. Of course, the long term objective is that this
investment pays dividends that can be applied to transit.
• There is risk if the land market declines. In a growing region, this risk tends to be cyclical so it may be
that the main concern is one of timing. Revenue from property disposition may be less predictable and
may have to be postponed to avoid disposition during a downturn.

EVALUATION OF LAND VALUE CAPTURE AND URBAN DEVELOPMENT AS SOURCES OF REVENUE FOR TRANSLINK
PAGE 18
3.0 Approaches Currently Applied in BC
3.1 Taxes, Development Charges, and Zoning
3.1.1 Federal Government
The Federal Government at present has only one significant form of land value capture, which is tax on gains
from the sale of real property. The gains are considered a capital gain or income, with different tax rates,
depending on the nature of the taxpayer and its business. Personal principal residence property is exempt
from taxation.
In the 2019 federal election, some political parties proposed ways in which the federal government might
engage in additional forms of land value capture, including:
• A tax on foreign property owners, at time of purchase or possibly a recurring tax.
• A wealth tax on high net worth individuals, with such tax applying to all forms of wealth including real
property.
The introduction of either or both of these new forms of taxation might, depending on their magnitude, impact
property values and affect the ability of other levels of government to implement land value capture
mechanisms.
3.1.2 Provincial Government
The Province of BC employs a wide range of land value capture taxes to obtain revenue and to achieve other
policy objectives.
One time
The Province’s one-time sources of land value capture include:
a) A 20% tax at time of purchase on the value of property acquired by foreign purchasers.
b) The Property Transfer Tax, which applies to most title transfers of real property (there are various
exemptions such as newly built homes priced below a defined threshold and homes purchased by first
time buyers). This tax is on a sliding scale: 1% on the first $200,000 plus 2% on the portion between
$200,000 and $2,000,000 plus 3% on the portion over $2,000,000 plus (for residential property only) an
additional 2% on the portion over $3,000,000.
c) Tax on the gains from sale of real property, either as income tax or capital gains tax depending on the
nature of the taxpayer and the nature of the taxpayer’s business. Gains on sale of personal principal
residence property is exempt.
Recurring
The Province employs several recurring means of land value taxation:
a) A large share of annual property tax in BC is paid to the Province. In BC, property tax is levied on 100%
of the value of land and 100% of the value of improvements, so it is not solely a land value capture
mechanism. This taxation system has been in place since 1984. Prior to that, BC had periods in which

EVALUATION OF LAND VALUE CAPTURE AND URBAN DEVELOPMENT AS SOURCES OF REVENUE FOR TRANSLINK
PAGE 19
land was taxed at 100% of value and improvements were taxed at a lower percentage. There were even
periods during the early 20th century when property tax was only levied on land value.4
Properties in BC pay property tax to local government, the Province, and regional agencies including
TransLink. The assessment and taxation system requires properties to be divided into classes (e.g.
residential, business, agricultural) each of which has its own tax rate. This is called a variable tax rate
system. Current legislation in BC does not allow municipalities to set different tax rates for land versus
improvements, different tax rates for vacant or under-developed property, different tax rates for similar
properties in different areas, or different tax rates based on value.
b) The Province has implemented a Speculation and Vacancy Tax, which charges an additional annual
percentage of property value on properties in defined taxable regions5 that are not a principal residence
and not rented out, or that are owned by non-residents or people not paying income tax in Canada (so-
called satellite families). The Province’s stated purpose for this tax is to shift vacant dwellings into the
rental market, to decrease the non-local demand for property, and to help make housing more affordable
in the applicable areas.
The tax rate varies based on whether the owner is a Canadian citizen or permanent resident of Canada,
or a satellite family.6 For 2019 and subsequent years, the tax rate is 2% of assessed value for foreign
owners and satellite families and 0.5% of assessed value for Canadian citizens or permanent residents
of Canada who are not members of a satellite family.
In the Lower Mainland this tax is currently applied in municipalities within the Metro Vancouver Regional
District (excluding Bowen Island, the Village of Lions Bay and Electoral area A, but including UBC and
the University Endowment Lands) and in the City of Abbotsford, the District of Mission, and the City of
Chilliwack.
c) The Province has implemented a School Tax surcharge that applies to high value residential properties
(including vacant land but not including purpose-built rental housing), at an extra 0.2% on the portion of
assessed value between $3 million and $4 million plus 0.4% on the portion of assessed value over $4
million. While called a School Tax, the funds go into Provincial general revenue and are not earmarked
for educational purposes. This tax is not based on the residency status of the owner. It is intended to put
downward pressure on the price of the affected properties and raise revenue. This tax is essentially a
means of wealth distribution.
4 For an excellent history of property taxation in BC, see “Land Value Taxation in Vancouver: Rent-Seeking and the Tax Revolt”, Christopher England, 2018, American Journal of Economics and Sociology Vol 77, No. 1.
5 “Taxable Regions” include these geographic areas:
• Municipalities within the Capital Regional District. Excluding Salt Spring Island, Juan de Fuca Electoral Area, and the Southern Gulf Islands.
• Municipalities within the Metro Vancouver Regional District, excluding Bowen Island, the Village of Lions Bay, and Electoral area A, but including UBC and the University Endowment Lands.
• The City of Abbotsford, The District of Mission, The City of Chilliwack, The City of Kelowna, The City of West Kelowna, The City of Nanaimo, and The District of Lantzville.
Exclusions from taxable regions include: Reserve lands, treaty lands and lands of self-governing Indigenous Nations; Islands that are accessible only by air or water; Residential properties under certain ownership (i.e. an Indigenous nation; municipalities; regional districts, governments and other public bodies; registered charities; housing co-ops; certain not-for-profit organizations).
6 “Satellite family” is defined as including “people who declare LESS than 50% of their total combined household income for the year on Canadian income tax returns”…they may pay tax at the highest rate and may not be entitled to all exemptions… This could apply even if the people are Canadian citizens or BC residents. Source: https://www2.gov.bc.ca/gov/content/taxes/property-taxes/speculation-and-vacancy-tax/exemptions-speculation-and-vacancy-tax/individuals/international-income#satellite-family.

EVALUATION OF LAND VALUE CAPTURE AND URBAN DEVELOPMENT AS SOURCES OF REVENUE FOR TRANSLINK
PAGE 20
3.1.3 Metro Vancouver
Metro Vancouver is a regional agency that delivers (directly or through subsidiaries) region-wide services
including planning, affordable housing, parks, the regional water network, and regional sewer and drainage
networks.
Metro Vancouver currently uses a one-time form of land value capture, which is the Greater Vancouver
Sewerage and Drainage District Development Cost Charge (GVS&DD DCC) for regional sewer works. This
DCC is levied on new residential, commercial, and industrial construction throughout the service region. A
fee waiver or reduction is available for not-for-profit affordable rental housing. The charge is collected by local
governments at time of building permit issuance (or at subdivision for the creation of new single detached
house lots) and remitted to Metro Vancouver.
Metro Vancouver also charges property tax on all properties within the region. These taxes are included in
the annual property tax bills delivered by local governments. The tax revenue is applied toward Metro
Vancouver’s services in regional planning, regional parks, and affordable housing.
3.1.4 Municipalities
Local governments in Metro Vancouver already make extensive use of land value capture mechanisms to
generate revenue, including both one-time (DCCs, density bonusing and community amenity contributions)
and recurring mechanisms (taxes).
One-Time
a) DCCs
Municipalities in BC use Development Cost Charges (Development Cost Levies in the City of Vancouver),
which are levies on new urban development to pay for community-wide infrastructure. For municipalities other
than Vancouver, DCCs can only be used to raise revenue for water and sewer networks, drainage systems,
road networks, and park land acquisition (with the exception of the small number of resort municipalities which
can use DCCs for affordable housing). The enabling legislation for DCCs is Section 559.2 of the Local
Government Act, which sets out a highly regulated structure for collecting and using DCC revenue. The City
of Vancouver has a similar authority pursuant to the Vancouver Charter; one notable difference is that the
City can use DCLs for a few additional kinds of infrastructure such as child care facilities.
In addition to municipal DCCs in Metro Vancouver, there are also two regional DCCs levied on development
as noted in Section 5.3 (GVS&DD DCC for sewer works) and Section 5.5 (TransLink’s new authority to levy
a regional DCC for transportation infrastructure).
DCCs are technically cost-recovery mechanisms, but their impact on the land market is to put downward
pressure on the amount that developers are able to pay for development sites, so DCCs are an indirect form
of land value capture.
There is a limit to how much a development project can absorb for DCC payments. With local governments,
GVS&DD, and TransLink all charging DCCs, they are essentially competing for a share of this finite capacity
to pay DCCs. This requires caution and coordination in setting DCC rates to make sure that the combined
impact of multiple fees does not have a negative impact on the financial viability or pace of new development.
b) Density Bonusing and Community Amenity Contributions
The structure of land use and development regulation in BC creates the potential for municipalities to obtain
public benefits or revenue through the use of municipal zoning power. This is a direct form of land value
EVALUATION OF LAND VALUE CAPTURE AND URBAN DEVELOPMENT AS SOURCES OF REVENUE FOR TRANSLINK
PAGE 21
capture, because municipalities can provide new density (which adds to land value) in exchange for public
benefits such as community facilities, affordable housing, or cash-in-lieu.
These zoning-based tools are unique among land value capture mechanisms because they create the land
value that they are capturing.
Creating new density, via zoning changes, is akin to making new “land” in the sense that the value in an
urban context is derived from what can be done with the property. Developers technically buy land, but what
they are really buying is the development entitlements that come with the land…the land use, height, and
density that can be developed under zoning. Where there is strong demand for new development, changing
the allowable land use and increasing allowable density create a gain in land value. Mechanisms such as
density bonusing or Community Amenity Contributions simultaneously create this value and build in a
structure for allocating this value among the local government (to fund community amenities), the land owner
(to provide an incentive to sell land into the development market), and the developer (to make it worth going
through the time and cost of rezoning).
Density bonusing works like this:
• Section 482 of the Local Government Act and Section 565.1 of the Vancouver Charter give municipalities
the ability to zone land with a basic allowable density, for which no public benefit must be provided, and
a specific supplemental or bonus density which can be obtained in exchange for a prescribed package
of public benefits which can include community facilities, affordable housing, or cash-in-lieu.
• Developers can develop a site under the base density or can obtain the bonus density, assuming the
extra density is marketable and financially attractive.
• The value of the extra density must be equal to or more than the cost of providing the public benefit, or it
will not be of interest to developers.
Community Amenity Contributions are similar (i.e. the exchange of new density for public benefits) but they
are not defined in legislation in the way that density bonusing is.
Municipalities in BC have the sole authority to decide whether a proposed rezoning is in the community’s
interest and should be approved. In making this decision, elected Councils should consider the impact of new
development on the community and can evaluate whether the proposed project yields sufficient benefit to the
community to warrant absorbing the impacts. The acceptability of a zoning -- both to the municipality and to
residents -- can be increased if the project is seen to provide amenities, affordable housing, or other public
benefits that will meet the needs of new residents and address impacts on existing residents. So, the process
of considering a proposed change in zoning often includes negotiations between the local government and
the proponent regarding the public benefits to be provided. The negotiation process can be simplified and
expedited if the local government provides targets (i.e. dollar amounts or specific on-site amenities that are
sought in exchange for each increment in density) but the principle is the same: the value of new density is
calculated and then an agreement is reached on the portion of this value that should take the form of public
benefit.
Almost all municipalities in Metro Vancouver use density bonusing and/or negotiated Community Amenity
Contributions as a means of capturing some of the new land value that is created by upzoning in order to
fund community amenities or infrastructure.
There are criticisms of CACs as a means of capturing land value:
• Some members of the development industry take the position that CACs add to the cost of housing and
therefore make the affordability situation worse. However, CACs are always associated with increased
housing capacity (because CACs are only paid when land is rezoned to higher density) and CACs are in

EVALUATION OF LAND VALUE CAPTURE AND URBAN DEVELOPMENT AS SOURCES OF REVENUE FOR TRANSLINK
PAGE 22
effect an exchange of density (which has value) for public benefits, and this exchange is almost always
structured to be financially attractive to land owners and developers. There is no compelling evidence to
indicate that CACs have put upward pressure on housing prices in Metro Vancouver (see for example
“CAC Policy and Housing Affordability: Review for the City of Vancouver”, Wollenberg Munro Consulting
Inc and Coriolis Consulting Corp, April 2019).
• CAC systems are sometimes criticized because the negotiations are not transparent, take too long, and
create uncertainty in the land market. In some cases, these are valid concerns. CACs ought to be
expeditiously negotiated, consistently applied, clearly communicated (to the general public, developers,
and land owners), and structured to ensure that the allocation of land value gains due to rezoning creates
incentives to land owners to sell their land into the market, incentives for developers to seek rezonings
that are consistent with planning policy, and public benefits that deal with the needs and impacts of
development on communities.
If TransLink explores the potential to share in CAC revenues, it will encounter the following challenges:
• Local governments currently have complete control over the zoning process and therefore complete
control over the use of density bonusing or CAC systems, which means they receive all of the revenue
and amenities. There will need to be a compelling case for why they should share these revenues.
• Because there is already a perception in the development industry that CAC systems are time-
consuming, complex, and uncertain, there will be concern if TransLink’s participation adds to these
concerns.
• There is a wide variation across Metro Vancouver municipalities in terms of when and how they negotiate
CACs. TransLink would have to develop an approach that is easily applied in a variety of situations.
• There is a wide variation across Metro Vancouver in the market value of new strata residential, rental
residential, and office density, which means wide variation in the quantum of public benefit that can be
achieved when density is increased. A region-wide uniform approach (as in the new TransLink DCC) will
have to be viable in the low land value parts of the region, while a submarket-based approach will result
in large differences in the revenue that can be derived from different areas.
It is also possible that the Province will explore changes to how local governments collect and use CACs.
The recently completed “Development Approvals Process Review” (published by the Ministry of Municipal
Affairs and Housing in September 2019) documents the results of Province-wide stakeholder engagement
with local governments, the development industry, and others regarding all aspects of development approvals
processes. The report suggests a variety of ways that might be explored in order to increase the predictability
and uniformity of CAC frameworks, including new legislation to regularize the collection of CACs and the idea
of a “super DCC” that covers more kinds of amenity and infrastructure than DCCs can currently be collected
for. The Province has not committed to any course of action, but there may be more attention to this subject.
If the government undertakes a more formal exploration of options, then TransLink should try to be part of
the conversation.
Recurring
a) Property Tax
All local governments raise a large portion of their operating and capital budget through property tax.
The main elements of the local government property tax system in BC are as follows:
• All property is assessed at its current market value.

EVALUATION OF LAND VALUE CAPTURE AND URBAN DEVELOPMENT AS SOURCES OF REVENUE FOR TRANSLINK
PAGE 23
• All property is assigned a property class7 based on its current use (e.g. residential, commercial).
• Each municipality adopts a set of tax rates (“mill rates”, or dollars per thousand dollars of assessed value)
that apply to the different classes of property. These rates can vary for different types of property and it
is typical for these rates to be higher for commercial and industrial property than for residential property.
• Other agencies (e.g. the Province, BC Assessment, the Municipal Finance Authority, and TransLink)
apply their allowable taxation rates to the assessed value.
• The tax rates are applied to the land value and the improvements value equally.
b) Taxes on Specific Types of Properties
Local governments in BC generally cannot levy special property taxes on specific types of properties, but
there is one exception.
The City of Vancouver Empty Homes Tax (EHT) levies an annual surtax on the assessed taxable value of
residential properties deemed “empty”. A home is not considered empty if it is a principal residence or rented
for at least six months of the year. From 2016 when the EHT was launched to 2019, the EHT rate was 1% of
the property’s assessed taxable value. In each of the next 3 years the rate will increase by 25% to 1.25% in
2020, 1.5% in 2021, and 1.75% in 2022.
The City’s stated intention is to invest net revenues into affordable housing initiatives, so it is essentially a
form of wealth transfer. Since the EHT was launched in 2016, the program has yielded $39.7 million in net
revenue.
c) Benefitting Area Taxes
Local governments in BC don’t have much ability to levy special property taxes in certain areas, with one
little-used exception. In all other municipalities other than Vancouver, Section 210 of the Community Charter
gives local government the authority to establish a local service area for the provision of a specific service
that applies to properties in a defined area. Properties within this defined area are taxed (in addition to their
basic property tax) to pay for the local service. Similarly, pursuant to Section 500 of the Vancouver Charter,
the City of Vancouver can levy a tax for local improvement projects when the project involves capital
investment by the City that will “specially benefit real property in a limited and determinable area”. Local
improvement taxes in Vancouver are usually only applied for relatively small projects that benefit a few
properties, such as improvements to lanes.
3.1.5 TransLink
TransLink has the ability to use three different land value capture taxes and charges to generate revenue: a
DCC, general property tax, and a benefitting area tax.
One Time
As of 2018, the Province adopted legislative changes that enable TransLink to levy a region-wide DCC on
new development to help pay for transportation investment (SCBCTA Act Section 34.21). The collection of
this new DCC started in January 2020 and revenues are being used to help pay for transit infrastructure. This
is the first time in BC that the Province has allowed the use of DCCs to fund transit and it is the first time that
7 There are 9 property classes in BC: Class 1 Residential, Class 2 Utilities, Class 3 Supportive Housing, Class 4 Major Industry, Class 5 Light Industry, Class 6 Business/Other, Class 7 Managed Forest Land, Class 8 Recreational Property/Non-Profit Organization, Class 9 Farm. Properties can have split classifications if they have several distinct uses that fall into more than one class.
EVALUATION OF LAND VALUE CAPTURE AND URBAN DEVELOPMENT AS SOURCES OF REVENUE FOR TRANSLINK
PAGE 24
an agency that is not a local government (i.e. municipality or regional district) has been authorized to levy a
DCC.
The new TransLink DCC is forecast to generate an average of about $29 million (uninflated) per year during
2020 to 2027.
The regional transportation DCC has these features:
• At present, there are different rates for single detached, duplex/townhouse, and apartment units. There
are also different rates for retail/service, office, institutional, and industrial space.
• At present, the rates for each use apply across the entire region. During the three years in which the DCC
system was designed (including extensive consultation with stakeholders in local government and the
development industry) consideration was given to options including common region-wide rates and rates
that varied across the region based on factors such as the intensity of transit service or the level of new
transit investment anticipated in different areas. After considerable discussion and debate, TransLink
adopted the premise that the benefits of regional transit improvement are broadly distributed and do not
necessarily match the distribution of capital investment, so it was decided that the TransLink DCC rates
should be uniform for each land use across the region. The legislation gives TransLink the ability to vary
rates in the future if deemed appropriate.
Recurring
a) Property Tax
Section 25(2)(a) of the South Coast British Columbia Transportation Authority (SCBCTA) Act empowers
TransLink to levy tax on the “net taxable value of land and improvements” throughout the transportation
service region. The legislation only allows TransLink to increase its property tax revenues by more than 3%
per year if the increase is approved by the Mayors’ Council in an investment plan. Prior to 2017, the annual
property tax was structured so that TransLink generally only increased its total property tax revenue by 3%
over the previous year’s tax revenue (with some exceptions). This constraint was presumably imposed as a
means of limiting the exposure of taxpayers to increases significantly above inflation. However, in any given
year the assessment roll consists of the previous year’s property assessment plus growth that is the result of
new improvements or changes in land value due to upzoning. The former 3% limit on tax revenue increase
meant that if the assessment roll grew (by say 2%) due to new construction or land value gains due to
rezoning then the increase on existing property would be limited to 1%, generally less than inflation.
Starting in 2017, TransLink adjusted its approach to calculating increased property tax revenue. There are
now two components to tax revenue growth:
• The tax revenue derived from the previous year’s assessment base can be increased up to 3%. This puts
a limit on the increase that an existing typical taxpayer will absorb.
• In addition, TransLink receives the new tax revenue that comes from applying its tax rate to “new”
assessment base created by development of new improvements or changes in property value due to
rezoning (versus value increase just due to market change).
TransLink is also authorized to collect $18 million per year from a smaller set of property taxes in whatever
proportions TransLink determines, but this amount is not allowed to escalate with inflation. This is known as
the Replacement Tax.
TransLink currently receives a total of on the order of $360 million per year (in 2018) from property taxes, not
including the Replacement Tax.

EVALUATION OF LAND VALUE CAPTURE AND URBAN DEVELOPMENT AS SOURCES OF REVENUE FOR TRANSLINK
PAGE 25
b) Benefitting Area Tax
TransLink has the ability to levy a benefitting area property tax surcharge.8 SCBCTA Act Section 25(7) allows
TransLink to “establish different zones…and…adopt different tax rates…in different zones based on the
benefit…as a result of proximity to a transportation station or…major facility constructed or funded by the
authority”.
While this legislation has existed for a long time, TransLink has not elected to use this benefitting area taxation
mechanism. The main reason has been that if proximity to transit infrastructure increases property value and
if this is reflected in assessed values, then such properties will already pay more tax than similar properties
without the transit benefit. Adding a benefitting area tax means that such properties would pay more “basic”
property tax because of their higher value and would also pay a surcharge because of the benefit. This is
not necessarily a reason to avoid using the benefitting area tax, but it is a consideration in gauging the impact
and equity of using the tax. TransLink also benefits from new development around rapid transit stations in
the form of increased ridership and increased property taxes. Properties that benefit from a higher level of
access don’t just enjoy the benefit of increased land value. The owners and occupants of such property also
benefit from the ability to spend less on automobile costs (purchase, operation, parking) and convenience.
So, it may be entirely reasonable to charge a benefitting area property tax surcharge.
3.1.6 Summary of Taxes, Charges, and Zoning Mechanisms Currently
Used in BC
Exhibit 2 and Exhibit 3 summarize the current situation in BC regarding land value capture via taxes,
development charges, and zoning. The main observation that can be made based on the two exhibits is that
there is already an extensive land value capture “landscape” in the Province and in Metro Vancouver. All
levels of government use a variety of means to generate revenue from property.
Exhibit 2: One-Time Land Value Capture Taxes and Charges
“One-time” Approaches Province Metro Vancouver Municipalities TransLink
Property transfer tax
Foreign buyer tax
Capital gain or income tax at sale
(except principal
residence)
Development Cost Charge
(GVS&DD)
(commencing 2020)
Density Bonus and CAC at rezoning
Park land dedication or cash-in-lieu at subdivision
8 TransLink advised that it may need legislative amendments or regulation as part of implementing a benefiting area tax. This would need to be explored if TransLink decides to examine this approach in more detail in subsequent work.
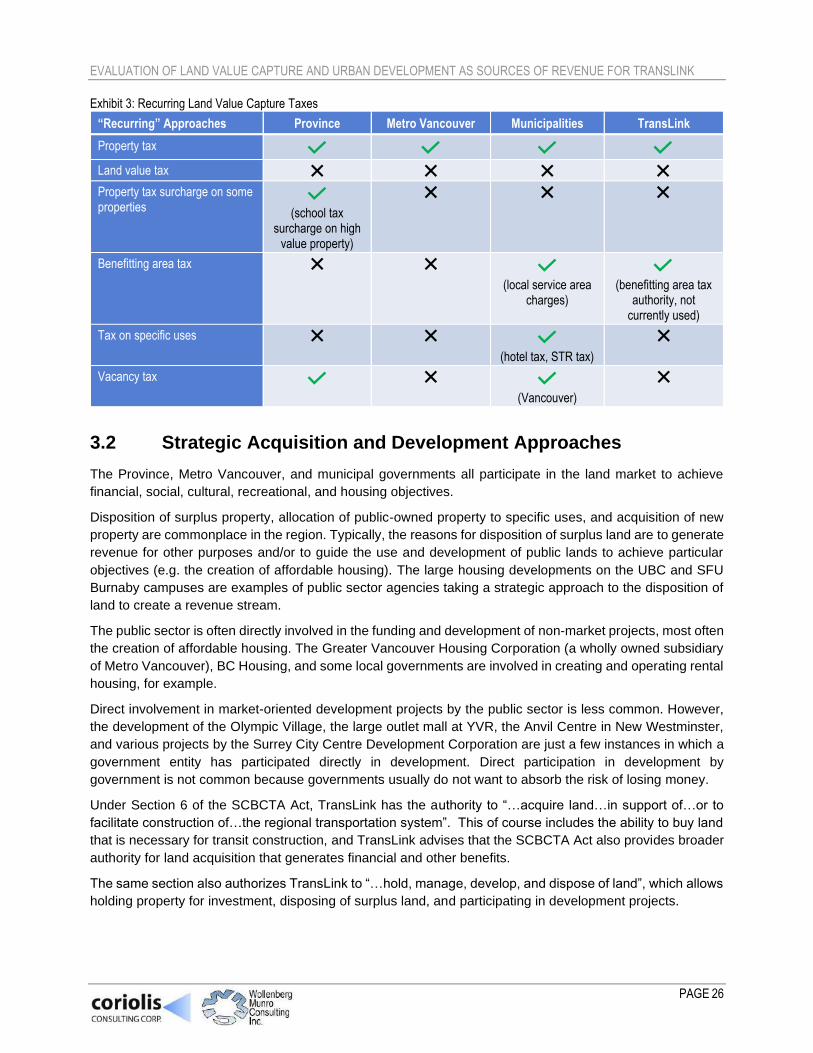
EVALUATION OF LAND VALUE CAPTURE AND URBAN DEVELOPMENT AS SOURCES OF REVENUE FOR TRANSLINK
PAGE 26
Exhibit 3: Recurring Land Value Capture Taxes
“Recurring” Approaches Province Metro Vancouver Municipalities TransLink
Property tax
Land value tax
Property tax surcharge on some properties
(school tax
surcharge on high value property)
Benefitting area tax
(local service area charges)
(benefitting area tax
authority, not currently used)
Tax on specific uses
(hotel tax, STR tax)
Vacancy tax
(Vancouver)
3.2 Strategic Acquisition and Development Approaches
The Province, Metro Vancouver, and municipal governments all participate in the land market to achieve
financial, social, cultural, recreational, and housing objectives.
Disposition of surplus property, allocation of public-owned property to specific uses, and acquisition of new
property are commonplace in the region. Typically, the reasons for disposition of surplus land are to generate
revenue for other purposes and/or to guide the use and development of public lands to achieve particular
objectives (e.g. the creation of affordable housing). The large housing developments on the UBC and SFU
Burnaby campuses are examples of public sector agencies taking a strategic approach to the disposition of
land to create a revenue stream.
The public sector is often directly involved in the funding and development of non-market projects, most often
the creation of affordable housing. The Greater Vancouver Housing Corporation (a wholly owned subsidiary
of Metro Vancouver), BC Housing, and some local governments are involved in creating and operating rental
housing, for example.
Direct involvement in market-oriented development projects by the public sector is less common. However,
the development of the Olympic Village, the large outlet mall at YVR, the Anvil Centre in New Westminster,
and various projects by the Surrey City Centre Development Corporation are just a few instances in which a
government entity has participated directly in development. Direct participation in development by
government is not common because governments usually do not want to absorb the risk of losing money.
Under Section 6 of the SCBCTA Act, TransLink has the authority to “…acquire land…in support of…or to
facilitate construction of…the regional transportation system”. This of course includes the ability to buy land
that is necessary for transit construction, and TransLink advises that the SCBCTA Act also provides broader
authority for land acquisition that generates financial and other benefits.
The same section also authorizes TransLink to “…hold, manage, develop, and dispose of land”, which allows
holding property for investment, disposing of surplus land, and participating in development projects.

EVALUATION OF LAND VALUE CAPTURE AND URBAN DEVELOPMENT AS SOURCES OF REVENUE FOR TRANSLINK
PAGE 27
To date, TransLink’s involvement in the land market and in development projects has not been extensive:
• Some retail space has been developed in the fare-paid zone of some stations, generating ongoing
revenue and enhancing the system for riders.
• Some surplus properties have been offered to the market, such as the former Oakridge Transit Centre
(which became surplus when a new facility was constructed on a site beside the Arthur Laing Bridge in
South Vancouver) and the surplus land at the King Edward Station on the Canada Line, which included
land adjacent to the station plus air rights over the station.
Exhibit 4: Examples of TransLink Land Disposition

EVALUATION OF LAND VALUE CAPTURE AND URBAN DEVELOPMENT AS SOURCES OF REVENUE FOR TRANSLINK
PAGE 28
4.0 Examples of Approaches Used by Other Agencies
Outside of BC
There are many jurisdictions outside of BC that use, or are considering, some form of land value capture
and/or participation in urban development. Property tax is almost universally used to generate local
government revenue, and in the US and Canada there are many cities that use some form of density bonus
or other means of obtaining public benefits or affordable housing in exchange for new density.
This section provides brief descriptions of examples of approaches used in other places.
4.1 Examples of Approaches to Support Transit Investment
4.1.1 Canada
Ontario
While the enabling legislation is different than in BC, Ontario municipalities have the ability to charge
development fees (Development Charges) similar to DCCs or DCLs and they have the ability to obtain
amenities or cash-in-lieu when granting additional density (called Section 37 benefits, they are similar to
density bonus or Community Amenity Contributions).
Metrolinx (Greater Toronto)
In addition to typical transit funding sources, Metrolinx has incorporated a Transit-Oriented Development
(TOD) Program in its 2041 Plan. The aims of the TOD program are to generate revenue through the
disposition of air rights parcels at transit stations, increase ridership, improve the customer experience, and
contribute to city building. Metrolinx does not become a partner or inject additional equity; it makes
development sites available at fair market value to developers.
Calgary Transit
The City of Calgary and Calgary Transit have a city-wide framework for Transit-Oriented Development,
primarily as a means of planning higher density development at transit stations but also as a means of
revenue generation via the disposition and development of public lands. The TOD strategy includes looking
for opportunities to acquire additional lands to enhance the potential for development and identifying publicly
owned sites that can become catalysts for redevelopment. The City specifically looks for strategic land
acquisition beyond infrastructure needs and disposition of remnant parcels post transit construction to recover
investments in transit. The City is also considering alternative sources of transit funding including
development partnerships, leasing public land at transit stations, and new development levies.
Edmonton Transit
The City of Edmonton is pursuing initiatives to facilitate higher density development at transit stations and
generate revenue and ridership. One initiative is to facilitate the redevelopment of City-owned park-and-ride
sites at suburban stations. The City has also become involved in actual development, with mixed results. In
one project (Station Pointe) the City invested capital to transform a large former industrial site into a residential
community with parcels available for sale to developers. City investment included streets, services, parks,
and amenities but take-up by developers has been very slow. In another project, the City has partnered with
a private sector developer to ready a former commercial site for residential development.

EVALUATION OF LAND VALUE CAPTURE AND URBAN DEVELOPMENT AS SOURCES OF REVENUE FOR TRANSLINK
PAGE 29
4.1.2 USA
Portland, USA
A new light rail link between the airport and the existing transit system was funded in part via a tax increment
financing district to support borrowing, an agreement with a developer that provided a capital contribution in
exchange for development rights on a large property served by the new line, and a levy on passengers
arriving at the airport.
Kansas City, USA
Kansas City has a Transportation Development District (TDD) that raises revenue for streetcar (LRT)
construction. The package includes a sales tax (maximum of 1%) on retail sales within the TDD boundary, a
real estate tax surcharge on property within the TDD boundary, and a special assessment on surface parking
lots in the boundary. These assessments are limited by state law to 20 years.
Miami-Dade County, USA
This county has established a Transportation Infrastructure Improvement District within a half mile of transit
corridors, in which any increase in property taxes above a defined base rate is allocated to pay for transit
infrastructure. This is not a new source of revenue or a net gain in revenue; it is a mechanism to ensure that
tax revenues above a threshold are channeled to pay for transit.
Pennsylvania, USA
The state has authorized the creation of Transportation Revitalization Investment Districts, in which a portion
of future property tax revenue gains can be earmarked for transit infrastructure. There is not necessarily new
revenue, but an ability to pledge a portion of revenue to the repayment of loans or bond issues. Pennsylvania
is also one of a few jurisdictions in the USA in which a significant number of municipalities use what is called
split rate property tax, with a higher rate on land value and a lower rate on improvements value.
Chicago Transit Authority
CTA has an ambitious capital program to expand and improve the regional transit system. Locally-generated
sources of funding include bond financing, property taxes, and a dedicated sales tax.
New York Metropolitan Transit Authority
The New York MTA is planning a $50 billion capital plan to address deferred maintenance and
expand/improve the system. The locally generated sources of funding include bonds, an automobile toll on
the Central Business District, a progressive tax on the sale of high value real estate, and a sales tax on
internet retail sales.
4.1.3 Outside North America
Crossrail (Elizabeth Line), London UK
The Crossrail project has been under construction for over a decade. A limited section went into service in
late 2019, but full opening is not expected until 2021. It is a massive addition to the London transit system.
Funding came from a wide variety of sources, but it is notable that significant contributions came from
developer contributions, a community improvement levy, and the sale of surplus lands.

EVALUATION OF LAND VALUE CAPTURE AND URBAN DEVELOPMENT AS SOURCES OF REVENUE FOR TRANSLINK
PAGE 30
Australia
Jurisdictions in Australia use various forms of land value capture including a “stamp duty” (similar to BC’s
Property Transfer Tax), development charges, and property tax. Some public agencies in Australia are
considering more broad-based approaches to land value capture that could be applied at the federal, state,
and local levels. So far, government has produced research and discussion papers on topics such as the use
of public lands and new forms of property tax but has not yet enacted new tools.
New Zealand
The government of New Zealand is considering land value capture as a means of funding new infrastructure
projects. Based on published statements from officials, one measure being considered is to tax the
incremental growth in land value caused by transit improvements, measured by comparing the growth in land
value for similar properties that have not directly benefited from transit investment.
Sao Paolo, Brazil
This South American city has taken an unusual approach to raising revenue from new development rights:
• The city identifies a redevelopment zone in which it wants to see increased density.
• The city defines how much additional floor space, beyond that allowed under current zoning, is
appropriate in the area and then issues “bonds” for this density.
• The bonds are auctioned; the purchasers of the bonds are then able to use the density on properties they
own within the redevelopment zone (or they can sell it to others in the area).
• The revenue raised from the auction is invested in housing and infrastructure in the redevelopment zone.
This has similarities to a Community Amenity Contribution system (developers provide cash or amenities in
exchange for density) and to Vancouver’s system of transferable density for heritage projects (the density is
not confined to a specific single site, as in a typical rezoning), but the Sao Paolo approach is of course
different in that the new density is auctioned to the highest bidder rather than negotiated with individual
property owners. Another key difference is that for the system to work, most or all properties in the
redevelopment zone must be deemed to be appropriate to absorb extra density.
Hong Kong
The Hong Kong Mass Transit Railway Corporation funds transit infrastructure through involvement in urban
development at stations. The Corporation obtains from government the development rights for land on and
beside transit infrastructure and then tenders development opportunities to the private sector. The corporation
enters into profit sharing arrangements or leases. A similar approach is used in Hong Kong to support the
creation of affordable housing.
Japan
Japan uses a system call Land Readjustment to facilitate the assembly, replotting, and infrastructure
investment for lands on the perimeter of growing urban regions. Areas that are appropriate for redevelopment
are often owned by large numbers of individuals who on their own do not have the wherewithal for assembly
or major infrastructure investment. State agencies are created for readjustment projects and have the
authority to assemble the land, invest in infrastructure, and distribute proceeds to the participants.

EVALUATION OF LAND VALUE CAPTURE AND URBAN DEVELOPMENT AS SOURCES OF REVENUE FOR TRANSLINK
PAGE 31
4.2 Examples of Approaches to Support Affordable Housing
Seattle, USA
The City of Seattle includes a Housing Levy in its property tax. The levy raises funds that are used to construct
affordable rental housing for low income households. This levy has been in place since 1981 and it has
supported the construction of around 12,000 units. The City estimates the median cost per home owner to
be about $125 per year. The Housing Levy must go before voters for renewal every few years.
Los Angeles and Seattle Regional Transit Agencies, USA
Sound Transit in Seattle and LA County Metro Transit are similar to TransLink in that they are regional
agencies that serve a large number of local governments. In both regions, the transit authorities use a form
of land value capture to help fund transit infrastructure and to assist in the creation of affordable housing.
They use what they each call “strategic land acquisition”. When planning and implementing transit
infrastructure projects, they:
• Locate stations where there are good opportunities to assemble land.
• Acquire more land than the minimum needed for construction.
• Ensure that post-construction, the surplus land will be in configurations that are easy to develop.
• Take advantage of the land value gains due to transit and upzoning.
• Offer surplus land to the market, in some cases at full market value to fund transit and in some cases at
less than market value for the provision of affordable rental housing. Los Angeles Metro also provides
some loans on favourable terms to affordable housing projects.
In addition to the regional transit agency involvement, both the City of Seattle and the City of Los Angeles
make extensive use of density bonusing to achieve affordable housing and amenities.
Vienna, Austria
Vienna is often cited as an example of addressing housing affordability via a large and sustained involvement
in rental housing construction by the state. Vienna has systematically acquired a large portfolio of urban land
that is used for the construction of new rental housing by government or by non-profits. As a result,
approximately 60% of housing is non-market and rent-controlled to maintain affordability.
4.3 General Observations
In a large proportion of the examples around the world, land value capture mechanisms and in some cases
participation in urban development are mainly considered as a means to fund infrastructure, particularly
transit as there is a correlation between transit improvements and increased value. There are fewer cases
where land value capture is used to fund affordable housing.
The most common land value capture approaches appear to be some form of property tax (in many cases a
benefitting area surcharge), development fees, and the creation and disposition of new development rights
(i.e. density).9 Many transit agencies also use the strategic acquisition and disposition of land as a means of
generating revenue and aiding the creation of affordable housing.
9 It is worth noting that CAC-like mechanisms are used in many cities in Canada and the US. While many landowners and developers have the view that the value of additional density should belong entirely to the landowner, this is not the premise of many North American rezoning frameworks. New York, San Francisco, Seattle, Los Angeles, Toronto, Halifax, and of course Vancouver are just a few examples of cities that approve new density in exchange for public benefits.

EVALUATION OF LAND VALUE CAPTURE AND URBAN DEVELOPMENT AS SOURCES OF REVENUE FOR TRANSLINK
PAGE 32
It appears that few transit agencies become directly involved in urban development projects (beyond leasing
or selling sites).
Tax increment financing is often used as a means of securing loans or bond issues. This vehicle allows
agencies to secure investment capital, by providing assurance for repayment, but it does not generate any
new revenue.
There do not appear to be many instances in which land value capture is used specifically to suppress land
values or discourage investment in land. In fact, many of the jurisdictions are counting on land value increases
so they can tap the gains to pay for infrastructure.
Based on this survey, several local governments in Metro Vancouver could be considered in the forefront of
using a comprehensive approach to land value capture in the form of annual property taxes, development
charges, and CACs.
Other jurisdictions show possible avenues for refinement including the use of benefitting area taxes,
differential tax rates on land and improvements, and special levies for transit or affordable housing.

EVALUATION OF LAND VALUE CAPTURE AND URBAN DEVELOPMENT AS SOURCES OF REVENUE FOR TRANSLINK
PAGE 33
5.0 Transit Investment, Rezoning, and Land Value
If TransLink is going to gain broad support for using land value capture and urban development to achieve
its goals, it will be important to demonstrate that transit investment creates land value and creates good
business opportunities for being involved in the market.
This section examines the link between transit infrastructure and development activity and also evaluates the
relative significance of transit investment versus rezoning in generating gains in land value. The comparison
of the land value created through rezoning with land value created by transit investment (i.e. improved transit
access) is analyzed using case studies.
5.1 Transit Investment and Densification
Exhibit 5 shows that during the past 5 to 10 years in areas of Metro Vancouver outside downtown and the
Broadway Corridor there has been an increasing tendency for new office development and new multi-family
strata residential development to occur within walking distance (800 metres) of rapid transit stations. The
gains are dramatic; as of 2019 over 80% of new office growth and almost two-thirds of new strata residential
growth are in rapid transit station areas. This demonstrates two key tendencies:
• Developers perceive that there is strong market appeal for office space and housing that is served by
transit.
• Local governments tend to direct high density development to transit-served locations.
This means there is compelling evidence that transit investment is a key input to densification and to the
ability of local governments to obtain public benefits based on the additional land value that results from
rezonings at transit-oriented locations.
This also means that there will be strong market interest in any development properties that TransLink can
make available by the disposition of surplus sites or air rights over transit infrastructure at rapid transit
stations.
Exhibit 5: Office and Residential Strata Development at Transit Stations
Source: Based on analysis by Coriolis Consulting using in-house office floorspace data and residential sales and listings data from NHS Live. For context, since 2009, 53% of new office development occurred in Downtown/Broadway Corridor and 47% occurred outside of these locations. *Note that sales of new strata residential units are from Jan 2015 to Sept 2019 and active listings as of Oct 2019.

EVALUATION OF LAND VALUE CAPTURE AND URBAN DEVELOPMENT AS SOURCES OF REVENUE FOR TRANSLINK
PAGE 34
5.2 Transit Investment and Price/Rent Premiums
5.2.1 Sales Price Premium for Multi-Family Strata Residential Units
In principle, it seems reasonable to assume that there would be a premium for living near a rapid transit
station or a rapid bus stop, in part because of the value of added convenience from having access to transit
and in part because of the potential financial benefit of using transit versus owning and operating a vehicle.
However, there are many other important considerations that come into play when deciding where to buy or
rent a place to live such as affordability; residential market outlook; proximity to family, friends, work, school,
and commercial services; safety; general culture and prestige/image of the neighbourhood; prestige/image
of the building; walkability/bike-ability; and building or neighbourhood amenities/recreation features. Rapid
transit access is only one of many factors that could affect the marketability and pricing of new strata
residential projects.
In comparing sales evidence for strata residential units in buildings near rapid transit (defined as being within
800 metres of a rapid transit station) and buildings in similar markets not near rapid transit, it is not possible
to control for all differences other than proximity to a rapid transit station to isolate the sales price premium
associated with this difference. Factors such as the age of the building, quality of the building/finishes,
neighbourhood characteristics, site specific features, building amenities, building prestige, unit layout/
specifications, and marketing/branding of the building can blur the analysis. However, by looking at buildings
of about the same age and about the same quality in similar market conditions with and without rapid transit,
the results can illustrate the order of magnitude sales price premium associated with rapid transit access.
We analyzed residential sales data for buildings with and without rapid transit access in New Westminster
(Sapperton/Downtown vs Uptown), Coquitlam (Burquitlam vs Austin Heights), Richmond (near and not near
rapid transit stations), Surrey (Surrey City Centre vs Guildford), the west side of Vancouver (Cambie Corridor
vs Broadway/Arbutus), and the east side of Vancouver (Kingsway near and not near rapid transit).10 There
was not useful sales evidence in Burnaby because there aren’t buildings of a similar quality built around the
same time in both rapid transit and non-rapid transit locations (as most development in Burnaby has occurred
near rapid transit stations).
Based on the average sales price per square foot for units that sold during the six-month period from March
to August 2019 in several similar aged/quality “pairs” of buildings, the price premium for rapid transit proximity
is illustrated by these examples:
• In Vancouver, the average sales price for units that sold in Wall Centre Central Park (less than 800m to
Joyce-Collingwood SkyTrain Station) during March to August 2019 was 1% higher than the average sales
price for units that sold at Kensington Gardens (more than 800m away from Nanaimo SkyTrain Station)
during the same timeframe.
• In Surrey, the average sales price for units that sold at Venue (less than 800m to Gateway Station) during
March to August 2019 was 7% higher than the average sales price for units that sold at Guildhouse (more
than 800m to Surrey Central Station and King George Station) during the same timeframe. Both projects
were completed in 2018.
• In New Westminster, the average sales price for units that sold in Trapp + Holbrook (less than 800m to
New Westminster Station and Columbia Station) during March to August 2019 was 9% higher than the
average sales price for units that sold in Viceroy in Uptown New Westminster (more than 800m to a rapid
10 Residential unit sales data is from the Real Estate Board of Greater Vancouver online MLSLink subscription database.

EVALUATION OF LAND VALUE CAPTURE AND URBAN DEVELOPMENT AS SOURCES OF REVENUE FOR TRANSLINK
PAGE 35
transit station) during the same timeframe. The Viceroy in Uptown New Westminster is older, so the
premium is likely partly attributable to transit access and partly attributable to the age of the building (and
possibly other factors).
• In Vancouver, the average sales price for units that sold in Edward by Mosaic (less than 800m to King
Edward Canada Line Station) during March to August 2019 was 10% higher than the average sales price
for units that sold at the Leveson (more than 800m to Marine Drive Canada Line Station) during the same
timeframe. Edward by Mosaic was completed in 2019 and the Leveson was completed in 2018, so the
premium could be partly attributable to transit access as well as Edward by Mosaic being newer and
having a more central location (and possibly other factors).
The sales evidence for most “pairs” of buildings suggests a price difference in the range of 1% to 10% at
rapid transit served buildings versus non-rapid transit served buildings in Metro Vancouver, although this
could overstate the premium because of differences in other characteristics such as quality of the
neighbourhood, building age, and building amenities which are challenging to control for.
This range is similar to the findings of a recent study by Canada Mortgage and Housing Corp. that examined
the impacts of GO train expansion on house prices in Hamilton-Niagara. The November 2019 CMHC study
estimated that house prices were between 4% and 9% higher in various areas in Hamilton-Niagara than they
otherwise would have been without the expansion of transit.11
Overall, we think it is reasonable to assume that there is a transit-related premium of up to about 5% for strata
residential unit sales prices at rapid transit stations in Metro Vancouver compared to similar non-rapid transit
served locations. This may seem like a relatively low premium to some observers who assume that transit
accessibility is attractive and important in the housing market. However, it is important to keep in mind that
most higher density locations in Metro Vancouver have reasonably good transit access, whether it is by rapid
transit or by bus. It is not really possible to find many examples of “transit” versus “no transit” new development
projects, so the comparison is really between projects near rapid transit and projects with good bus service.
5.2.2 Lease Rate Premium for Commercial Space
As with residential sales prices, in principle it seems reasonable to assume that there would be a premium
for leasing commercial space near a rapid transit station or a rapid bus stop because of the added
convenience and potential to reduce commuting times. However, there are many other important
considerations that come into play when businesses are deciding where to rent commercial space such as
affordability; proximity to where the business owner lives; proximity to where employees live (and whether
these locations are transit-served); proximity to commercial services; availability of amenities such as day
care; prestige/reputation of the landlord/management company; opportunities for expansion; and availability
of parking. Rapid transit access is only one of many factors that could affect the marketability and pricing of
commercial space.
11 CMHC, “Housing Market Insight: Hamilton-Niagara – GO Train Expansion: The Impact on House Prices in Hamilton-Niagara.” November 2019. The analysis found that the Confederation GO Station increased house prices in East Hamilton by up to 4%, Niagara Falls GO Station increased house prices in that area by up to 7%, the St. Catherines GO Station increased house prices in that area by up to 8%, the Confederation GO Station increased house prices in Stoney Creek by up to 8%, and the West Harbour GO Station increased house prices in Hamilton Centre by up to 9%.

EVALUATION OF LAND VALUE CAPTURE AND URBAN DEVELOPMENT AS SOURCES OF REVENUE FOR TRANSLINK
PAGE 36
We reviewed four indicators of the potential lease rate premium for commercial space near a rapid transit
station:
• Evidence of differences in asking or achieved office lease rates for buildings of a similar quality, age, and
type (e.g. high density office projects) in rapid transit served and non-rapid transit served locations.12
There is very little vacancy in the office market in the region, so data on asking lease rates is limited. In
addition, most new office space in the region is being built near rapid transit stations so there is limited
comparable product not served by rapid transit. However, comparing evidence in transit-served and non-
transit served office buildings in New Westminster, Burnaby, Surrey, and Vancouver suggests that office
lease rates are in the range of 2% to 20% higher in transit-served locations. This likely overstates the
premium associated with transit-access, as transit-served locations also tend to be more amenity-rich
neighbourhoods with more urban office buildings.
• BC Assessment Authority data on the assessed values for existing office buildings within 800m of a rapid
transit station compared to similar buildings that are not within 800m of a rapid transit station in several
locations throughout the region.13 Comparing similar quality buildings in the same municipalities (to
control for property tax differences) suggested that office buildings near rapid transit stations have
assessed values in the range of 2% to 5% higher than comparable office buildings in similar markets that
are not near rapid transit.
• Interviews with commercial real estate brokers about the magnitude of the lease rate premium for office
space near rapid transit versus comparable space not near rapid transit. Commercial brokers noted that
the demand for office space outside of downtown Vancouver is highly driven by employee attraction and
retention, and convenient access to rapid transit is a key factor in the locational decision for many
businesses that occupy office space. Commercial brokers noted that the premium is on the order of about
10%, although this reflects a combination of rapid transit accessibility, lower office vacancy near rapid
transit stations, and a difference in the type of space that is available (i.e. high density, urban office space
in amenity-rich locations near rapid transit versus lower density, business park office space).
• Studies by others about the potential office lease rate premium associated with being located near a rapid
transit station in the region. For example, Jones Lang Lasalle (JLL) previously published a “Rapid Transit
Office Index” for the Metro Vancouver region. In the Q1 2016 Outlook edition of this report, JLL reported
that the average asking net office lease rates for the inventory of office buildings with greater than 10,000
square feet within 500m of a rapid transit station in Vancouver, Burnaby, Surrey, Richmond, New
Westminster, and Coquitlam were in the range of 10% to 30% higher than the average asking net office
lease rate for the inventory of office buildings with greater than 10,000 square feet outside of 500m of a
rapid transit station in the same municipality. This likely overstates the premium associated with rapid
transit accessibility, because the inventory of space near rapid transit stations contains a much higher
share of new buildings and there are many other features that could contribute to lease rate differences
when looking at the overall inventory of office space within 500m and further than 500m of rapid transit
stations within a municipality, but it helps illustrate an upper bound.
Based on these indicators, we think it is reasonable to assume that there is a premium of up to about 10%
for commercial lease rates at rapid transit stations in Metro Vancouver compared to similar non-rapid transit
locations.
12 Office lease rate data is based on internet research using www.spacelist.ca and major brokerage websites. 13 Assessed values were obtained from BC Assessment Authority via https://www.bcassessment.ca/Property/AssessmentSearch.

EVALUATION OF LAND VALUE CAPTURE AND URBAN DEVELOPMENT AS SOURCES OF REVENUE FOR TRANSLINK
PAGE 37
5.2.3 Residential Rents
While there likely is a market rent premium associated with proximity to rapid transit, the case study analysis
in this study did not include rental residential properties for these reasons:
• New rental residential development in most of the region supports little or no land value, which is why
new rental construction has depended on mechanisms such as cost reduction (e.g. DCC waivers or
reduced off-street parking requirements) or incentive density. So, there is little or no land value growth
associated with most new rental residential development, meaning there is not much opportunity for land
value capture even if there is a rent rate premium associated with units near rapid transit.
• Existing rental units have rent increases controlled by the Residential Tenancy Act. Because these units
are only allowed to adjust to market rent at the time of turnover, it is not possible without great effort to
assemble a data set that would allow the isolation of a rent premium associated with rapid transit
proximity.
• Limited new rental construction makes it difficult to find sufficiently comparable new projects to be able
to identify and isolate a residential rent premium for transit proximity.
5.2.4 Implications for Case Studies
Based on market research and sales evidence, empirical evidence, and a review of other studies, there
appears to be a premium for commercial rents (up to 10%) and strata residential unit sales prices (up to 5%)
near light rail rapid transit stations in this region. We use these premiums in the case study analysis.
5.3 Transit Investment and Rezoning: Case Studies
As noted above, the comparison of the land value created through rezoning with land value created by transit
investment (i.e. improved transit access) is analyzed using case studies. The detailed analysis for the case
studies is contained in Appendix 1. For each case study, financial models were constructed for the following
scenarios:
• “Base case” financial performance of a development site assuming no rezoning and no transit influence.
This either reflects value under existing zoning or under existing use, depending on the case study.
• “Rezoning only”, which shows the financial performance of rezoning the development site to a density
typical for the sub-market, in the absence of a price premium for rapid transit proximity.
• “Rezoning with transit”, which shows the financial performance of rezoning the development to a density
typical for the sub-market and incorporating a premium (in sales prices or rent rates) for improved transit
access.
Municipal Community Amenity Contributions (CAC) policies are not included14 so the case studies illustrate
the total land lift, the portion of the total attributable to the rezoning (increased density), and the portion
attributable to the transit premium prior to CACs.
The following sections summarize the multi-family residential case studies and commercial case studies.
14 Including the City of Vancouver’s Developer Contribution Expectation (DCE) in the Broadway Corridor.

EVALUATION OF LAND VALUE CAPTURE AND URBAN DEVELOPMENT AS SOURCES OF REVENUE FOR TRANSLINK
PAGE 38
5.3.1 Summary of the Multi-Family Residential Case Studies
Key points about the multi-family residential case studies are as follows:
1. Locations. Locations for multi-family residential case studies were selected based on where rapid transit
expansions are planned or have recently been completed: the Broadway Corridor (where the new
Broadway Subway Project will extend rapid transit from VCC-Clark to Arbutus), Burquitlam (where the
Evergreen Extension went into service in December 2016), Fleetwood (located on the planned extension
to Langley), and Lynn Creek (which will be served by the Marine Drive RapidBus connecting West
Vancouver with Phibbs Exchange).
2. Transit Premium. Based on the analysis in Section 5.2, we used a transit premium of 5% for multi-family
unit sales price for enhanced light rail rapid transit and a lower transit premium (1%) for enhanced transit
access in the form of rapid bus.
3. Tenure. The case studies assume strata multi-family residential development to show the maximum
extent to which improved transit access generates land value relative to upzoning (because strata
residential land values are much higher than rental residential land values), except for one market rental
scenario in the Broadway Corridor (where market rents are high enough to support a significant land
value) to illustrate the economics of redevelopment under both strata residential and rental residential.
The results of the multi-family residential case studies are summarized in Exhibit 6. The analysis illustrates
that:
• Transit investment is responsible for a significant share of the gains in strata multi-family residential land
value in transit-oriented areas. The dollar value gain in land value varies considerably around the region,
but it appears that rapid transit investment can create 20% or more of the gain in land value from a
combination of upzoning and transit investment.
• The share of land value gain created by transit investment is higher in areas with lower land values,
reaching over 40% in some cases.
Exhibit 6: Summary of Multi-Family Residential Case Studies ($M indicates $millions)
Case Study
FSR (Existing)/ Rezoned
Strata Residential Sales Prices ($ psf)
Existing Value
Supportable Land Value
with Rezoning
Supportable Land Value
with Rezoning
and Transit
Without transit
With transit
Land Lift
Case Study #1: C-3A Site in Broadway Corridor (strata)
(3.0) 6.0
$1,475 $1,549 (5% higher)
$22.8M $45.4M $50.3M • $22.6M from rezoning (82%)
• $4.9M from transit (18%)
• $27.5M total (100%)
Case Study #2: C-3A Site in Broadway Corridor (market rental)
(3.0) 6.0
Average rent psf:
$3.73
Average rent psf:
$3.92 (5% higher)
$22.8M $13.3M $15.2M Redevelopment to market rental is not financially viable on this site even with the transit premium
Case Study #3: C-2 Site in Burquitlam (strata)
(1.05) 4.5
$855 $900 (5% higher)
$9.8M $16.3M $21.7M • $6.5M from rezoning (54%)
• $5.4M from transit (46%)
• $11.9M total (100%)
Case Study #4: CH-1 Site in Fleetwood (strata)
(1.0) 4.0
$760 $800 (5% higher)
$3.1M $0.9M $3.8M Not a redevelopment candidate without the transit premium; transit premium makes project financially viable
Case Study #5: Single family lot assembly in Lynn Creek (strata)
(0.35-0.45) 2.5
$800 $808 (1% higher for
rapid bus)
$6.5M $10.8M $11.2M • $4.3M from rezoning (92%)
• $0.4M from transit (8%)
• $4.7M total (100%)

EVALUATION OF LAND VALUE CAPTURE AND URBAN DEVELOPMENT AS SOURCES OF REVENUE FOR TRANSLINK
PAGE 39
5.3.2 Summary of Commercial Case Studies
Key points about the commercial case studies are as follows:
1. Locations. This analysis uses a higher land value and a lower land value location for the commercial
case studies to show the range in contribution of upzoning and improved transit access to land value
increases in different sub-markets with rapid transit access (or planned rapid transit access) in the region:
Uptown Office Precinct in the Broadway Corridor (where the new Broadway Subway Project will extend
rapid transit from VCC-Clark to Arbutus) and Surrey City Centre (where the City of Surrey’s recently
adopted new City Centre Plan envisions transit-oriented redevelopment of low-density properties near
rapid transit stations including around King George Station on the existing Expo Line).
2. Transit Rent Premium. Based on the analysis in Section 5.2, the analysis uses a transit premium of
10% for commercial lease rates for enhanced light rail rapid transit.
The results of the commercial case studies are summarized in Exhibit 7. The analysis supports the following
conclusions:
• Without the premium associated with rapid transit, office development is not financially viable in many
suburban locations in the region.
• With rapid transit, high density office development is financially viable in some locations but the lift in land
value from rezoning and transit investment is marginal.
Exhibit 7: Summary of Commercial Case Studies ($M indicates $millions)
Case Study
FSR (Existing)/ Rezoned
Office Lease Rates ($ psf net)
Existing Value
Supportable Land Value
with Rezoning
Supportable Land Value
with Rezoning
and Transit
Without transit
With transit
Land Lift
Case Study #6: Site in Broadway Corridor Uptown Office Precinct
(3.0) 6.0
$37 $40.70 (10% higher)
$15.3M $11.2M $16.9M Not an office redevelopment candidate without the transit premium; transit premium makes project financially viable
Case Study #7: Site in Surrey City Centre
(0.8) 3.5
$28 $31 (10% higher)
$10.7M -$5.0M $6.6M Office redevelopment is not financially viable on this site even with the transit premium
5.4 Conclusions
The analysis of regional development patterns and the case studies show that:
1. There is strong evidence that transit investment is a major contributor to the ability of local governments
to plan high density housing and employment nodes and to obtain public benefits from the extra land
value created by the approval of new density.
2. There are significant opportunities for TransLink to earn revenue through an ongoing program of strategic
acquisition and disposition of land, especially at rapid transit locations. By buying land early in a transit
project planning process, TransLink could benefit from general increases in the market value of land,
increased value due to improved transit access, and increased value due to rezoning to allow more
density (even after allowing for municipal CACs on additional density).
3. There will be strong market interest in development properties that TransLink can make available by the
disposition of surplus sites or air rights over transit infrastructure at rapid transit stations.
EVALUATION OF LAND VALUE CAPTURE AND URBAN DEVELOPMENT AS SOURCES OF REVENUE FOR TRANSLINK
PAGE 40
4. Municipalities are currently the only entities to obtain revenue or benefits from CACs and density
bonusing, but transit investment is responsible for a significant share of the gains in multi-family
residential land value in transit-oriented areas, due to the premium achieved by market residential units
in areas with high levels of transit service. This lends support to the idea that a portion of CACs on transit-
oriented multi-family residential rezonings could be allocated to fund transit investment.
5. The ability to charge a CAC on transit-oriented office development is marginal (and municipalities typically
do not charge CACs on office development), so it is likely not worth TransLink exploring the idea of CAC-
revenue sharing on office development.
6. There is potential for TransLink to earn revenue by participating in development projects, particularly at
transit-served locations where development risk is mitigated by strong market interest.

EVALUATION OF LAND VALUE CAPTURE AND URBAN DEVELOPMENT AS SOURCES OF REVENUE FOR TRANSLINK
PAGE 41
6.0 Impacts of Different Approaches
There are strong arguments in favour of TransLink making more use of land value capture to fund transit
investment, and there are several approaches that can be considered. There are also reasons in favour of
TransLink participating in urban development projects to fund transit investment and achieve other objectives.
A key consideration is the kinds of positive and negative impacts these approaches would have on land
owners, developers, tax payers, and local governments. This section reviews the potential impacts of different
approaches.
6.1 Impacts on Land Owners, Tenants, and Developers
6.1.1 Property Taxes (General, Surcharge, Benefitting Area)
The impacts of a higher land value tax, a property tax surcharge, or a benefitting area tax vary with the type
of property and the nature of any leases or rental arrangements.
Groups that benefit from these kinds of taxes could include:
• Those buying their first home, if the tax is large enough to reduce the market value of housing. However,
the reduction in home purchase price could be offset by the ongoing cost of the tax to the owner. Note
that people selling a home would see a loss in equity if the tax reduces market value.
• Any property owner whose taxes fall due to a redistribution of the overall property tax burden. For
example, if the intent of a new property tax is to be revenue neutral, then some properties affected by the
tax will pay more and some will pay less. Even if the new tax is intended to generate additional total
revenue, the structure of the tax could be such that some properties pay more and some pay less, with
a net gain in total tax revenue.
• Those who benefit from any new infrastructure or affordable housing constructed using the tax revenue.
• Those whose land values rise as a result of new infrastructure funded by the tax (although in a benefitting
area tax this increase in value is all or partly offset by the tax).
• Development land owners, if a new recurring land value tax replaces CAC or DCC/DCL systems.
The cost of a new recurring land value tax is borne by the property owners (or their tenants) who pay the tax.
Only with a benefitting area tax is there a direct link between those who benefit and those who pay.
All property taxes are initially paid by the owner of the property, but the nature of the impact varies depending
on the type of property and in some cases the cost is shifted to others (tenants).
Residential Rental Properties
In most residential rental properties, rents are structured on a gross basis meaning tenants do not directly
pay the property tax; the landlord pays the tax using some of the rental income. Because residential rents in
BC are set by the market and by regulations under the Residential Tenancy Act, the effect of property tax
increases on residential rents is as follows:
• For units rented at full market rent, there is no impact on tenants. The increased tax cost cannot be
passed on in the form of “above market” rent, so landlord net income is reduced. This can have the
negative consequence of reducing developer/investor interest in constructing new rental housing if the
tax is so high that net income is not sufficient to make projects viable. If the pace of rental construction is

EVALUATION OF LAND VALUE CAPTURE AND URBAN DEVELOPMENT AS SOURCES OF REVENUE FOR TRANSLINK
PAGE 42
too low (as we have seen in this region over the last several decades), vacancy is too low and rents rise
faster than inflation.
• For units that have had rent growth limited by the Residential Tenancy Act, rents are typically below
current market rates. If these below-market rates are then allowed to rise faster than inflation because
increased operating costs (including property taxes) result in higher allowable rent increases, then
increased property tax will result in these rents being higher than they otherwise would be (although still
below market).
Commercial Properties
In many commercial properties, leases are structured so that the tenant pays rent and pays a pro rata share
of the property tax (and other operating expenses). If one takes the view that over the long term, commercial
tenants can pay a maximum total amount to occupy space (regardless of how this value is parsed into rent,
tax, or operating costs) then, theoretically, property taxes do not add to the cost of occupancy. The impact of
property tax in the long run is to reduce the market rent that can be charged by landlords.
However, in the short run commercial tenants are locked into rent payments based on their leases which are
typically 3 to 5 year terms. In this case, the tenants must pay the increased tax but have no ability to offset
the cost by reducing rent. This can be very challenging for small businesses, especially those that are already
paying very high property taxes because they happen to occupy potential redevelopment sites with high
value.
Businesses that own their own premises will absorb any new property tax, so net income from the business
will be reduced unless the owner can reduce other costs or increase revenues to offset the tax.
Homeowners
The impact of annual property tax on residential land values or housing prices is not as clear as one would
like. The academic research does not always show a direct link between property tax and value, possibly
because property taxes tend to be small (on an annual basis) relative to the value of the property, there are
many other more significant factors that affect value, and property owners may not expect to own property
long enough to absorb the long term impact.
Financial analysis would suggest that a large increase in property tax (i.e. large enough to stand out among
other factors) would lead to a reduction in property value, so it is reasonable to assume that a significant new
tax on residential land would result in a reduction in the market price of affected freehold and strata units.
This would be a disadvantage for owners (their equity falls) and an advantage for buyers (prices are lower),
but the upfront affordability benefit of a lower purchase price (a lower down payment, lower mortgage
payments, or both) would be somewhat offset by higher ongoing property tax costs.
Additional broad-based taxes on land value would affect all home owners in the targeted category of property,
not just those who own redevelopment sites. This approach would enable taxing authorities to benefit from
market-wide increases in land value regardless of the cause, rather than linking new taxes to specific benefits
generated by specific investments (such as transit) or specific decisions (such as rezoning).
However, because land value tax is not linked to the income of the owner, one possible impact is that some
residential property owners may not have enough income to absorb a recurring tax. Such owners have the
option of selling and moving to a lower-value property, if possible, or if they are eligible (mainly older owners
of residential property) they can defer the tax until they sell the property. A property owner’s ability to defer
taxes is constrained if there is not sufficient equity after allowing for secured lines of credit, reverse mortgages,
or traditional mortgages.

EVALUATION OF LAND VALUE CAPTURE AND URBAN DEVELOPMENT AS SOURCES OF REVENUE FOR TRANSLINK
PAGE 43
6.1.2 Development Charges
Development charges such as DCCs or DCLs are technically infrastructure cost recovery mechanisms
because they collect revenue from new development projects to pay for community-wide networks such as
roads, water, sewer, or parks. Development fees are not simply added to the end sales prices or rent rates
of units, as these are determined by supply and demand for housing units in the market. Because of the way
development sites are valued in the market, development charges have the effect of putting downward
pressure on the amount developers can pay for land. While a development charge may be imposed for the
purpose of paying for infrastructure, its economic impact is to capture what otherwise would have become
land value.
This does not necessarily mean that land values are declining; it means that development fees can cause
the pace of land value growth to be slower than it otherwise would.
In the face of this downward pressure on land value, there are two possible outcomes:
• As long as land is still significantly more valuable as redevelopment property than as holding property (in
its current use), there is not likely to be a reduction in the flow of land to the redevelopment market. In
this case, there is not a negative impact on the pace of development, the viability of development, the
price of new product, or overall housing prices.
• If development fees are too high, however, developers cannot offer enough to compete land away from
purchasers who want to retain the existing use (e.g. single detached houses or older low-density
commercial property). This means that the flow of land to redevelopment is reduced, so the pace of new
construction is reduced. If demand remains strong, reducing the pace of new development will cause all
housing prices (not just the price of new units) to rise.
As long as development charges are set carefully, they do not have a negative impact on project viability or
housing affordability. The cost of levies such as DCCs is absorbed by the owners of redevelopment land.
However, in a region like Metro Vancouver, where there are several DCC layers (municipal, GVS&DD,
TransLink), it is important to monitor the cumulative impact of these levies rather than look at each DCC in
isolation.
The parties that benefit from the DCC system are those that use the new infrastructure, those whose property
value is increased by the new infrastructure, and (indirectly) those whose property taxes are lower than they
otherwise would be because some infrastructure is paid for by DCC revenues rather than property tax.
6.1.3 Density Bonusing and CACs
Rezoning creates new development density that has land value. Community Amenity Contributions (CACs)
obtained in exchange for this new density capture some of the value created by rezoning that would otherwise
become additional value for the owners of development sites. The CAC funds are used to provide public
amenities and affordable housing.
CACs do not add to the market price of housing because CACs are always associated with an increase in
housing capacity and, in any case, housing prices are determined by demand and supply forces. CACs can
help address housing affordability if new strata or market rental density is offered in exchange for affordable
housing benefits.
CACs are paid by developers but they receive valuable density in exchange, so there is not a net cost to
them. The cost could be said to be absorbed by land owners (who would otherwise have obtained all of the
value of new density), but only if one assumes that rezonings would be approved even if no public benefits
result.

EVALUATION OF LAND VALUE CAPTURE AND URBAN DEVELOPMENT AS SOURCES OF REVENUE FOR TRANSLINK
PAGE 44
The parties that benefit from the CAC system include those who use the new amenities and infrastructure,
those whose land value is increased by the new amenities and infrastructure, developers who earn additional
profit by developing the additional density, households who benefit from any new affordable housing provided
as part of the CAC, and (indirectly) those whose property taxes are lower than they otherwise would be if the
amenities and infrastructure were funded via property tax.
6.1.4 Land Acquisition and Disposition
The acquisition and subsequent resale or lease of land by public entities can generate revenue and add to
housing supply, so there are positive outcomes for infrastructure funding and housing affordability.
One common strategy for land disposition as a land value capture tool is advance acquisition of more land
than is needed for transit construction and subsequent sale of rezoned development sites with transit access,
either to help pay for the transit or to provide sites for affordable housing.
There is no direct cost to any party that results from public sector involvement in land acquisition and
disposition, unless a particular transaction results in a loss that must be covered from another revenue source.
The main benefit is that there is less reliance on all other sources of revenue, including property tax.
One way to take advantage of land value capture using public land is to lease rather than sell property. When
a land lease expires, there is an opportunity to take the land back if necessary for a civic purpose (thereby
eliminating the need to acquire a site) or there is an opportunity to re-lease the land at the current market
value, taking advantage of land value growth over the life of the lease. Of course, this requires either that the
current occupants pay market value for a lease renewal or that the property is made available under a new
lease for redevelopment.
6.1.5 Development
The involvement of a public agency in development can have positive impacts for those who benefit directly
from the project, such as tenants who benefit from affordable housing. There are not usually any negative
impacts, as the total extent of market participation is typically not large enough to cause concern about
competition with the private sector.
Because of the risks involved in development, the greatest impact is potentially on the agency itself in the
event that a project creates a financial loss that must be made up from other funding sources.
6.1.6 Summary of Impacts
Exhibit 8 and Exhibit 9 summarize the foregoing review of impacts. Three main conclusions are supported
by this review:
• One-time land value capture taxes and charges affect property owners but not tenants.
• Recurring taxation approaches to land value capture affect property owners and in some cases tenants.
• Strategic land acquisition/disposition and involvement in development projects do not have negative
impacts on other participants in the land market.
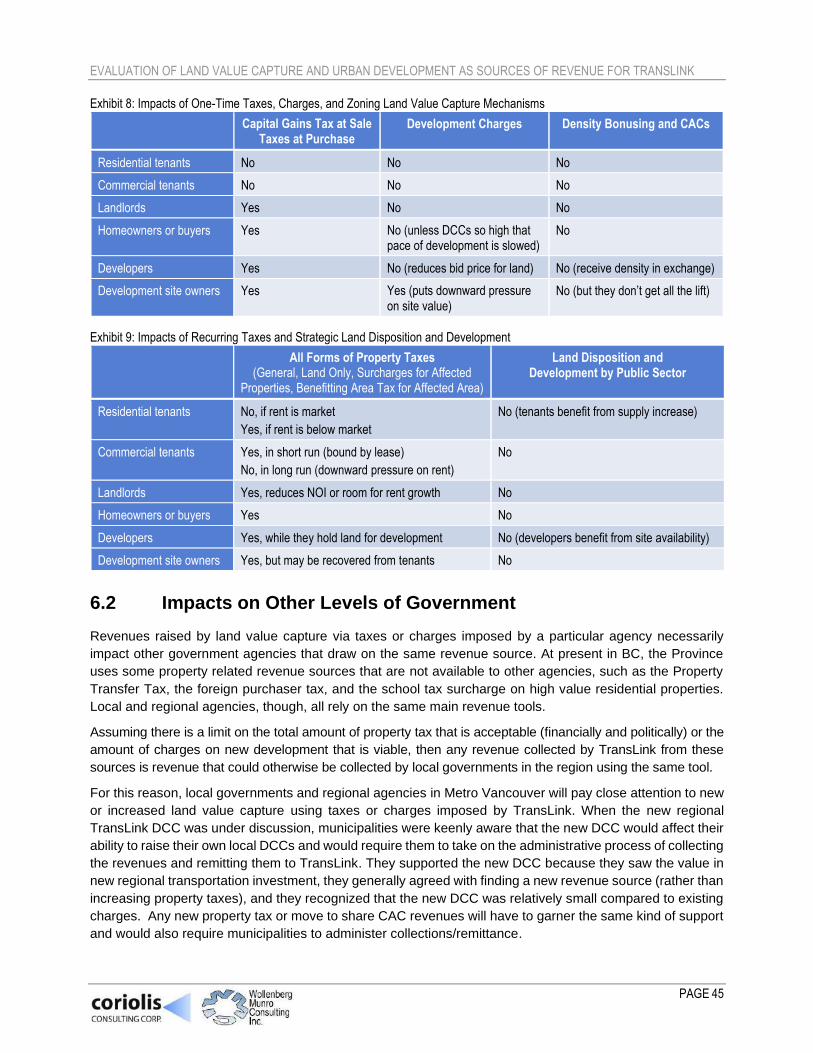
EVALUATION OF LAND VALUE CAPTURE AND URBAN DEVELOPMENT AS SOURCES OF REVENUE FOR TRANSLINK
PAGE 45
Exhibit 8: Impacts of One-Time Taxes, Charges, and Zoning Land Value Capture Mechanisms Capital Gains Tax at Sale
Taxes at Purchase Development Charges Density Bonusing and CACs
Residential tenants No No No
Commercial tenants No No No
Landlords Yes No No
Homeowners or buyers Yes No (unless DCCs so high that pace of development is slowed)
No
Developers Yes No (reduces bid price for land) No (receive density in exchange)
Development site owners Yes Yes (puts downward pressure on site value)
No (but they don’t get all the lift)
Exhibit 9: Impacts of Recurring Taxes and Strategic Land Disposition and Development
All Forms of Property Taxes (General, Land Only, Surcharges for Affected
Properties, Benefitting Area Tax for Affected Area)
Land Disposition and Development by Public Sector
Residential tenants No, if rent is market
Yes, if rent is below market
No (tenants benefit from supply increase)
Commercial tenants Yes, in short run (bound by lease)
No, in long run (downward pressure on rent)
No
Landlords Yes, reduces NOI or room for rent growth No
Homeowners or buyers Yes No
Developers Yes, while they hold land for development No (developers benefit from site availability)
Development site owners Yes, but may be recovered from tenants No
6.2 Impacts on Other Levels of Government
Revenues raised by land value capture via taxes or charges imposed by a particular agency necessarily
impact other government agencies that draw on the same revenue source. At present in BC, the Province
uses some property related revenue sources that are not available to other agencies, such as the Property
Transfer Tax, the foreign purchaser tax, and the school tax surcharge on high value residential properties.
Local and regional agencies, though, all rely on the same main revenue tools.
Assuming there is a limit on the total amount of property tax that is acceptable (financially and politically) or the
amount of charges on new development that is viable, then any revenue collected by TransLink from these
sources is revenue that could otherwise be collected by local governments in the region using the same tool.
For this reason, local governments and regional agencies in Metro Vancouver will pay close attention to new
or increased land value capture using taxes or charges imposed by TransLink. When the new regional
TransLink DCC was under discussion, municipalities were keenly aware that the new DCC would affect their
ability to raise their own local DCCs and would require them to take on the administrative process of collecting
the revenues and remitting them to TransLink. They supported the new DCC because they saw the value in
new regional transportation investment, they generally agreed with finding a new revenue source (rather than
increasing property taxes), and they recognized that the new DCC was relatively small compared to existing
charges. Any new property tax or move to share CAC revenues will have to garner the same kind of support
and would also require municipalities to administer collections/remittance.

EVALUATION OF LAND VALUE CAPTURE AND URBAN DEVELOPMENT AS SOURCES OF REVENUE FOR TRANSLINK
PAGE 46
Increased land acquisition/disposition or involvement in development projects by TransLink will not impact
other levels of government because there would be no reduction in their ability to collect revenue. Increased
activity by TransLink in strategic land acquisition/disposition or involvement in development projects may
create interest in collaboration from other public sector agencies who hold relevant properties or rights.

EVALUATION OF LAND VALUE CAPTURE AND URBAN DEVELOPMENT AS SOURCES OF REVENUE FOR TRANSLINK
PAGE 47
7.0 Stakeholder Perspectives
7.1 Summary of Stakeholder Perspectives
In December 2019, TransLink and the consultants convened an initial set of workshops with representatives
of the Provincial government, Metro Vancouver, local governments in Metro Vancouver, the regional
development industry, and other interested groups. These initial workshops were intended to describe the
scope of work for this project, summarize some of the analysis, and provide a preliminary indication of the
possible revenue approaches that seemed to have the best potential for TransLink in the near term.
In January 2020, representatives of the same stakeholder groups were given a copy of a preliminary draft
version of this report and invited to a second workshop to discuss the draft report. TransLink also gave
stakeholders time to further review the draft report and provide written comments after the workshop.
Key messages from the stakeholders are summarized below.
Sharing Revenues from CACs and Density Bonusing
• There is broad local government opposition to sharing CAC or density bonus revenues with TransLink.
Local governments tend to see this approach as competition for shares of an existing revenue source
and they prefer that TransLink try to find new revenues. Local governments noted that municipalities have
few revenue tools available to them so they rely on CACs and density bonusing to fund the community
amenities, services, and infrastructure needed to support growth such as community centres, cultural
facilities, libraries, fire halls, and affordable housing. Many municipalities also noted that, in keeping with
Provincial guidelines, they invest CAC revenues into the immediate community from which they are
collected. Some noted that they control zoning, which they see as the primary instrument of creating new
land value. They also noted that municipalities in this region have very different rates of growth so
municipalities with the most development (via rezonings which is when CACs can be charged) would
contribute the most towards transit investment in a CAC revenue-sharing model.
• Some municipalities noted that CAC revenues could be smaller in the future as municipalities explore
ways to increase affordable housing in new projects (which reduces the ability to pay a CAC).
• One municipality also noted that TransLink participation in the CAC process may increase the complexity,
uncertainty, and processing time for new developments.
• Only one municipality expressed being open to the idea of CAC revenue-sharing on the condition that
revenues only be used for new rapid transit construction.
• Developers are of the view that the CAC process is generally too complex, time-consuming, and
uncertain, so they are reluctant to have TransLink do anything that adds to these concerns. However,
UDI expressed support for TransLink receiving a share of CAC revenues from local governments
recognizing that transit infrastructure contributes to creating land value in this region. UDI suggested the
idea of a formula-based fee to be paid by developers to TransLink around transit stations in exchange for
additional density as opposed to a new negotiated CAC. UDI noted that rental housing and commercial
developments are unlikely to be able to contribute any significant CAC revenues to TransLink, in contrast
to strata residential development projects.
Benefitting Area Tax
• Some stakeholders are supportive of a benefitting area tax, subject to the details about where it is levied
and the amount of the tax. Some stakeholders noted that implementation of a benefitting area tax would

EVALUATION OF LAND VALUE CAPTURE AND URBAN DEVELOPMENT AS SOURCES OF REVENUE FOR TRANSLINK
PAGE 48
be facilitated by the existing property value assessment system which makes it easy to quantify the value
of properties closer to transit. Some stakeholders noted there is a rationale for such a tax (because
properties near transit benefit from accessibility), and it may encourage under-developed sites near
transit stations to be redeveloped with higher density uses which support transit ridership.
• Some stakeholders expressed concern about “double” taxing properties (because higher assessed
values means properties near transit already pay more basic TransLink property tax than similar
properties not near transit).
• Some stakeholders expressed concern that a benefitting area tax could result in resident opposition to
new rapid transit projects and concern that a benefitting area tax around transit stations could discourage
development in those locations.
• Many local governments expressed concern that a benefitting area tax may have the unintended
consequence of displacing small businesses as well as organizations in the arts, culture, and non-profit
sectors because property tax increases would be passed on to tenants through their leases. These
stakeholders noted that analysis would be needed to estimate potential impacts (and presumably find
ways to mitigate those).
• UDI suggested that TransLink could consider phasing in a very small benefitting area tax at new and
existing transit stations as the rapid transit system is expanded, because all property owners near transit
stations are likely to see property value increases as the rapid transit system is enhanced and expanded.
Strategic Land Acquisition/Disposition and Participation in Urban Development
• There was broad support for TransLink becoming more creative and active in the strategic acquisition
and disposition of property, recognizing that market conditions fluctuate and this could require careful
planning/analysis and a long term view. One local government suggested that TransLink coordinate land
acquisition/disposition activities with local governments to ensure alignment of land use objectives and
that TransLink could consider creating an arms length development corporation.
• There was broad support for TransLink participating in development projects, with appropriate measures
to mitigate risk, which could include building up a portfolio of income-producing properties (e.g.
commercial space, rental housing).
Property Transfer Tax
• There was general support for TransLink participating with Metro Vancouver and local governments in
lobbying the Province for a share of Property Transfer Tax.
Affordable Housing
• There were differing opinions among stakeholders about whether or how TransLink should help develop
or fund affordable housing. Some stakeholders support the idea of TransLink helping to develop or fund
affordable housing including making surplus development sites available or participating in development
projects. On the other hand, some see the provision of affordable housing as the responsibility of the
Province, Metro Vancouver, and municipalities so TransLink should focus on just complying with
affordable housing policy requirements in any developments that it participates in or sites it makes
available for development.
• Some see opportunities for intergovernmental collaboration in the development of lands near transit to
advance affordable housing objectives.

EVALUATION OF LAND VALUE CAPTURE AND URBAN DEVELOPMENT AS SOURCES OF REVENUE FOR TRANSLINK
PAGE 49
Other
• The development community noted that development fees, costs, and taxes can only be accounted for
by developers in valuing development sites if the land is purchased after the announcement of the
fee/cost/tax, so it is essential to provide very early notice before new charges are implemented.
• Some stakeholders noted that TransLink recently adjusted its property tax structure and introduced the
new regional DCC for transit, so time may be needed to evaluate the impacts of those costs before
introducing new ones.
• Some stakeholders commented that Project Partnership Agreements provide an opportunity for
TransLink and municipalities to agree upon how land along new rapid transit corridors will be treated
(including how affordable housing will be supported and how CAC collection will be handled).
• Some stakeholders commented that TransLink should continue to seek ways to diversify its funding
sources beyond land value capture, including a regional mobility pricing system.
• Some stakeholders commented that TransLink will likely need to combine one-time charges, recurring
charges, and development-related activities, rather than adopt a single approach.
• The development industry cautioned against exploring capital gains tax, as this is a complex political and
financial topic that TransLink should not get drawn into.
7.2 Response to Stakeholder Input
The input from stakeholders was clear, comprehensive, and constructive, but also challenging in some
respects.
There is broad support for three of the potential revenue sources: a greater involvement in land
acquisition/disposition, greater involvement in urban development, and seeking an arrangement with the
Province for sharing Property Transfer Tax revenues.
There is significant concern on the part of local governments about sharing CAC and density bonus benefits.
This is understandable, as local governments currently do not have to share these benefits and they rely on
them as a major source of capital funding for amenities, affordable housing, and some kinds of infrastructure.
However, it is clear that transit investment supports densification and is responsible for a significant share of
the land value gains that result from investment in transit. For this reason, transit should be considered an
appropriate candidate for a share of the benefits that flow from rezoning and densification in areas served by
transit investment. One of the underlying premises of land value capture is that some of the value should be
available to help pay for the infrastructure that creates the value in the first place. Of course a large share of
the benefits from rezoning must be allocated to meeting the needs of growth, but TransLink should take the
view that it is reasonable for it to receive a share of the benefits. In exploring this option further, TransLink
should take a collaborative approach and should recognize the concerns of, and potential impacts on, local
government.
There is also significant concern about the possible impacts of a benefitting area tax, particularly on small
business and non-profits. This is a legitimate concern because of some consequences of the structure of the
property tax system. However, some points need to be made in response. First, several local governments
in the region have been increasing property taxes at more than the rate of inflation (and local government is
responsible for around half of the total property tax bill on most properties). A new TransLink benefitting area
tax is likely to be small in comparison to municipal increases and may mean that local government has to be
more careful in its own tax-setting decisions. Second, a benefitting area tax is one of the most direct available
means to capture some of the land value growth that is associated with enhanced transit investment. Third,

EVALUATION OF LAND VALUE CAPTURE AND URBAN DEVELOPMENT AS SOURCES OF REVENUE FOR TRANSLINK
PAGE 50
the Province is considering ways to mitigate the impact of the tax system on small business. Fourth, areas
around rapid transit stations are expected to undergo redevelopment, so the problem of small businesses or
non-profits absorbing the whole tax burden for under-developed properties should diminish. Certainly
TransLink should be sensitive to potential impacts but a benefitting area tax, which is already contemplated
in legislation, should be explored further in our view.
Stakeholder contact also indicates that there is a range of perspectives about the appropriate role for
TransLink in the provision of affordable housing. Some stakeholders argue for a substantial role, while others
note that affordable housing is the responsibility of other agencies. TransLink is in a unique position to
facilitate the provision of transit-oriented affordable rental housing but it will have to make careful, deliberate
decisions about the extent to which it should allocate resources to housing.

EVALUATION OF LAND VALUE CAPTURE AND URBAN DEVELOPMENT AS SOURCES OF REVENUE FOR TRANSLINK
PAGE 51
8.0 Possible Directions for TransLink
Based on all of the foregoing analysis, there is a wide range of approaches that TransLink could explore to
generate more revenue and further its objectives regarding affordable housing and increased support for
walking, cycling, and transit ridership.
The next step is to narrow the range, to identify the approaches that TransLink should consider in much more
detail. The goal is not to narrow the approaches down to select one preferred approach, but to identify the
approaches that are worth considering in greater detail. TransLink may explore and eventually seek to
implement a combination of approaches.
We use four steps to winnow the list:
• First, we review the possible approaches to see how they align with TransLink’s goals. This allows us to
flag any approaches that are particularly suited or unsuited to what TransLink wants to achieve.
• Second, we review each possible approach to see if there is any compelling reason to drop any from
further consideration at this time.
• Third, for the candidates that warrant more consideration, we evaluate them using criteria including
revenue potential, sustainability, and ease of implementation.
• Finally, based on the evaluation, we identify those that have the greatest potential for generating revenue
and achieving TransLink’s goals.
8.1 Aligning Approaches and Objectives
Exhibit 10 lists the main alternative approaches that have been identified and indicates whether they align
with TransLink’s objectives of generating revenue (for capital projects or for operating costs), supporting
transit-oriented affordable rental housing, and supporting walking, cycling, and transit ridership. Supporting
transit-oriented affordable rental housing and walking, cycling, and transit ridership could include using
revenues to support these goals or could mean providing physical opportunities to facilitate/build affordable
housing and walking, cycling, and transit supportive infrastructure. Exhibit 10 makes this distinction.
As indicated in the exhibit, all of the approaches can generate revenue for transit. DCCs and CACs are only
applicable to capital investment, but all of the other approaches generate revenue that could be applied to
capital or operating costs.
All of the approaches except DCCs generate revenue that could be applied to transit-oriented affordable
rental housing if TransLink elects to allocate resources to this objective. The TransLink DCC is structured so
that the revenue can only be applied to transportation capital investment. CACs and taxes create revenue
that TransLink could allocate to affordable housing. Land disposition and development could generate
revenue or could involve foregoing land value or profit revenues in order to invest directly in the creation of
affordable housing.
Only land disposition and participation in development would give TransLink the direct ability to physically
shape the form and character of development to promote walking, cycling, and transit use and the direct
ability to physically provide sites for (or develop projects that include) affordable rental housing. In selling or
leasing surplus lands, TransLink could require that developers use project design, the mix of uses, and in-
project facilities (e.g. support for cycling) to support non-auto transportation. By developing projects,
TransLink can control these directly and can allocate funds to go beyond what a private sector developer
might do.

EVALUATION OF LAND VALUE CAPTURE AND URBAN DEVELOPMENT AS SOURCES OF REVENUE FOR TRANSLINK
PAGE 52
Exhibit 10: Alignment with TransLink’s Objectives
Revenue for Investment
Revenue for Operations
Increase Walking, Cycling, Transit Use
Transit-Oriented Affordable Rental Housing
Revenue Physical Opportunity
Revenue Physical Opportunity
Capital Gains Tax at Sale
Taxes at Purchase
Development Cost Charge
Density Bonus and CAC at rezoning
Property Tax (General, Surcharge, Benefitting Area)
Land Value Tax
Strategic Land Acquisition/Disposition
Development
Based on this review, all of the possible approaches align with the objective of increasing revenue for
transportation investment, although tax approaches have the advantage of generating funds for capital and
operating costs as well as revenue that could be applied to affordable housing. Density bonus, CACs, and
DCCs have more narrow revenue applicability, as they are confined to capital investment and probably only
for transit.
Strategic land acquisition/disposition and participation in development are the only approaches that would
allow TransLink to have a direct role in the provision of transit-oriented rental housing and in shaping the form
of development to support transit ridership, walking, and cycling.
8.2 Evaluating the Options and Identifying Those to Consider
Further in the Near Term
8.2.1 Capital Gains Tax
Only the Federal and Provincial governments have the power to levy income tax. This authority has not been
devolved to any lower order of government, so it seems highly unlikely that one regional agency (i.e.
TransLink) could be granted this taxation tool.
There is increasing discourse in Canada regarding changes to capital gains tax as part of an approach to
dealing with income inequality. There are strong voices on both sides of this conversation, particularly
regarding the pros and cons of encouraging capital investment via tax policy and regarding the exemption
that applies to principal residences. This is an important public policy debate that is likely to play out over
years to come, involving all levels of government. The question for TransLink is whether it should enter this
arena at this time. We do not see any value to TransLink of investing time and resources in pursuing this tax
ability, and it could become a divisive distraction.
Potential: Do not explore further.

EVALUATION OF LAND VALUE CAPTURE AND URBAN DEVELOPMENT AS SOURCES OF REVENUE FOR TRANSLINK
PAGE 53
8.2.2 Foreign Purchaser Tax
This kind of tax has been introduced by the Province as part of a strategy to reduce non-local demand for
residential real estate. In the recent Federal election, some political parties floated the idea of a Federal tax
with a similar objective. It seems highly unlikely that a regional agency would be given a special ability to
directly influence international investment in real estate in Canada.
Potential: Do not explore further.
8.2.3 Property Transfer Tax
To date, only the Province has this taxing authority, which it has used to generate revenue and to try to reduce
non-local demand for residential property. In 2017, Metro Vancouver estimated that this region generated
over 75% of the Provincial revenue from this tax (which generates on the order of $2 billion per year), and so
on behalf of local governments and regional agencies has been lobbying the Province to share these
revenues to apply them directly to regional needs.15 There is regional interest in applying some of this money
to affordable housing. There is also a compelling argument that affordable transportation helps reduce the
impact of housing costs, so some of the revenue could be applied to transit investment.
The Province has not made any commitment to share these revenues.
If the Province considers revenue-sharing, there would be several complex policy considerations:
• How much of the tax should be distributed out to local and regional agencies and how much should be
retained by the Province?
• If any is distributed, should it be proportional to the amount paid? This might seem a fair approach, but it
is worth noting that for a very long time the Province’s share of property tax revenue (which is mainly
intended to fund the public K to 12 education system) has been collected based on property value and
distributed in the form of per student grants to fund school operations.
• If any is distributed, should it flow to regional agencies (e.g. Metro Vancouver, TransLink), local
governments, or a combination?
• What should the funds be used for? Given the intent of raising the tax rate to help address housing
affordability, it might be argued that the funds should be directed to the construction of affordable housing.
This matter will not be easily resolved and it is not likely to be seen as a TransLink issue per se. TransLink
has an interest in the idea of distributing property transfer tax revenues, but is not in a strong position to lead
this initiative.
Potential: Participate with Metro Vancouver and local governments in efforts to influence the Province, but
do not make this a centerpiece in TransLink’s near future work on funding options.
8.2.4 Revisions to TransLink DCC Framework
The legislation that enables the TransLink DCC already allows for the possibility of increasing rates.
Collections began in January 2020 and the first increase in rates has already been locked in for 2021 (based
on a consultation process with the development industry that resulted in phasing in the charge).
The legislation also allows the possibility of differential DCC rates across the region, but in the work leading
to the creation of the new DCC there was a strong preference for uniform rates based on the premise that
15 Metro Vancouver, “Provincial Property-based Taxes in the Metro Vancouver Region.” 4 April 2017.

EVALUATION OF LAND VALUE CAPTURE AND URBAN DEVELOPMENT AS SOURCES OF REVENUE FOR TRANSLINK
PAGE 54
the benefits of transit investment are distributed widely and not necessarily proportional to where the
investment happens.
In the future, there may be more willingness in the region, among industry and local government, to explore
the idea of a tiered DCC structure (with higher rates in areas with the most intense service), but as the ink is
barely dry on the current framework there would likely be little support for making changes in the early years
of this new charge.
Potential: Plan ahead for inflationary adjustments to DCC rates, but do not change the DCC framework at
this time. Monitor collections and watch carefully to see if there is any evidence of negative market impacts.
In the longer term, revisit the question of whether the regional DCC should have different rates in different
areas.
8.2.5 CAC and Density Bonus Revenue Sharing
Transit investment clearly supports the ability of local governments to plan for higher density residential and
commercial development. Transit investment also contributes to increased land value because of the market
premium for prices and rents at rapid transit locations.
Transit, therefore, has a major role in creating the urban economics circumstances that enable density
bonusing and rezoning to provide public benefits, which means a compelling case can be made for TransLink
to have access to some of this revenue potential.
Local governments will reasonably take the view that public benefits from density bonusing and rezoning are
needed to provide the amenities and infrastructure needed to support larger, higher density communities.
However, local governments must go through a priority-setting exercise to allocate the public benefits from
rezoning to local amenities such as daycare or community centre space, emergency facilities such as fire
halls, library space, affordable housing or other needs. Rather than viewing the allocation of benefits as a
competition between TransLink and municipalities, there is a case for having a collaborative conversation
about how transit helps support densification and contributes to land value growth and about how transit
should fit into the prioritization of investments that should be funded out of the revenues from CACs and
density bonusing.
Potential: Explore further. Engage in a dialogue with regional municipalities about possible approaches to
allocating a portion of the benefits from CACs and density bonusing to transit investment.
8.2.6 Across-the-Board Increase in Property Taxes
The Mayors’ Council has expressed a clear preference for finding revenues other than by further loading up
the existing sources. There is probably very little political or public support for a widespread property tax
increase at this time, although it of course exists as an option if required for a new TransLink investment plan.
Potential: Unless it becomes necessary to raise sufficient revenue for TransLink investment plans, do not
select this as a preferred option for additional revenue in the short term.
8.2.7 Land Value Tax
Current BC legislation does not allow general property tax on land only, or different tax rates for land and
improvements. The only tax tool that is somewhat like a land value tax is a parcel tax, as allowed under
Section 200 of the Community Charter, to recover the cost of a specific service that benefits specific
properties. If the parcel tax is allocated based on site area or site frontage, then the tax is applied without

EVALUATION OF LAND VALUE CAPTURE AND URBAN DEVELOPMENT AS SOURCES OF REVENUE FOR TRANSLINK
PAGE 55
reference to the value of improvements so it can be considered a kind of land value tax. There are some
shortcomings with parcel taxes:
• They are either applied to the whole community or to the specific set of properties that benefit from a
service.
• They are structured as a cost recovery mechanism, so the amount of the tax is not based on the value
of the property.
A true land value tax based on land value is not possible in BC under current legislation, although such a tax
would have these advantages:
• It taxes the portion of property value that is directly affected by infrastructure investment.
• Land value taxes can encourage more intensive use of property, as owners have an incentive to maximize
the area of improvements over which to spread the land tax.
While there are strong proponents of land value tax as a means of redistributing income and shaping housing
demand, there are also opponents who are concerned about the impact on home owners, business owners,
and tenants because there is no direct connection between the tax and the ability to pay.
It seems unlikely that TransLink alone would be given the ability in BC to tax land at a different rate than
improvements, so there is not much incentive for TransLink to try to push this agenda for its purposes.
Potential: Monitor the positions of the Provincial Government, Metro Vancouver, and local governments in
the region for any signals that a broader approach to land value taxation is gaining support and then be part
of the conversation as an important property tax stakeholder.
8.2.8 Benefitting Area Tax
TransLink already has the legislative power to implement a benefitting area tax.16 While still a form of property
tax, it is a new approach that links tax directly to the value and accessibility created by transit investment
which could attract less opposition (and potentially more support) than a region-wide increase in property tax.
Like property tax, this revenue could be applied to capital investment or operations and is ongoing.
One concern is that a benefitting area tax could be portrayed as making some properties “pay twice”. If transit
access confers extra property value, then all properties in a benefitting area are already paying more property
tax because of their higher value. A benefitting area tax would add a surcharge to these properties. However,
such properties enjoy several benefits, including higher property value, higher accessibility to transit, and
higher marketability for attracting tenants or purchasers. The rationale for adding the benefitting area tax is
essentially that it makes the tax progressive, with properties with very high transit access paying a larger
share of value than properties with less access.
UDI noted that one approach would be to consider phasing in (with early advanced notice) a very small
benefitting area tax at new and existing transit stations as the rapid transit system is expanded.
Potential: Consider further, including examining different approaches to defining benefitting areas and
confirming whether legislative amendments or regulation would be needed to implement a new benefitting
area tax.
16 TransLink advised that it may need legislative amendments or regulation as part of implementing a benefiting area tax. This would need to be explored if TransLink decides to examine this approach in more detail in subsequent work.

EVALUATION OF LAND VALUE CAPTURE AND URBAN DEVELOPMENT AS SOURCES OF REVENUE FOR TRANSLINK
PAGE 56
8.2.9 Strategic Land Acquisition and Disposition
TransLink already engages in land disposition and acquisition, so this is not a new revenue tool. TransLink
will presumably continue to market properties that (in whole or in part) become surplus to transportation needs
and will continue to acquire land for transit construction. However, TransLink can become more creative and
aggressive in the land market, in several ways:
• Exploring the potential to market portions of TransLink owned sites that are not entirely needed or to
market air rights above existing transportation facilities that will remain.
• Exploring partnerships in locations where TransLink and other owners could cooperate to create
development opportunities. For example, there are locations along the Expo line right of way (which is
owned by BC Hydro) where there are opportunities for TransLink and BC Hydro to combine their interests
in land to make new development sites.
• Acquiring additional properties when buying land for transportation investment, when there are
opportunities for assembly that will result in strong development opportunities after transportation
construction is complete.
Because TransLink is engaged in long term planning for new transit investment, it is in an excellent position
to acquire good quality development properties well in advance of new transit construction. TransLink can
take advantage of general increases in market value, the new value created by transit investment, and new
value that is associated with increased density.
Involvement in the land market will also give TransLink more ability to shape development and integrate land
use and transportation. When disposing of property, via lease or sale, TransLink can exert some control over
the mix of uses (to require affordable housing, for example) and the form and character of development, to
be supportive of walking, cycling, and transit ridership.
Potential: Consider becoming more creative and active in the acquisition and disposition of land, as a means
of generating revenue and shaping urban development at transit-oriented locations. Develop a strategic plan
for greater involvement in the acquisition and disposition of development sites, with guidelines for examining
TransLink’s existing portfolio of properties and to guide acquisitions of new properties.17
8.2.10 Participation in Urban Development Projects
Direct participation in development projects could be a new source of revenue for TransLink, as well as the
most direct possible means to shape development and integrate land use and transportation.
There are several ways that TransLink can benefit from direct involvement in urban development:
• TransLink can earn revenue (profit) from being involved in building and selling market-oriented
development projects, For example, rather than selling or leasing property it can take on the role of
developer (i.e. finance and build the project, market the space, earn the profit). This could be done alone
or in partnership with other developers.
• TransLink could participate in joint ventures with other agencies that provide affordable housing.
TransLink could for example provide some of its development parcels to non-profits or public sector
housing providers for the construction of affordable rental housing. However, it is important to understand
17 TransLink’s current guidelines set the objectives of adhering to applicable laws, bylaws, and municipal approval requirements and having a positive financial business case for acquisition/disposition decisions. A strategic plan would provide more detailed guidance and parameters.
EVALUATION OF LAND VALUE CAPTURE AND URBAN DEVELOPMENT AS SOURCES OF REVENUE FOR TRANSLINK
PAGE 57
that this would reduce the revenue from the disposition of such sites by allocating benefits to affordable
housing rather than transit investment.
• TransLink can build a portfolio of income-producing property, such as retail space, office space, and
rental housing at transit-oriented locations to generate an ongoing source of income.
• TransLink can design and create projects that include affordable housing and that support walking,
cycling, and transit ridership. In these cases, TransLink would be allocating revenue to housing or support
for alternative modes of travel rather than retaining the revenue for investment in new transit
infrastructure.
It is important to note that these sorts of projects are very different from simply selling or leasing development
parcels or air rights to developers. Selling or leasing parcels will generate revenue but does not involve
exposure to development risk. Direct involvement in a project (e.g. investing equity and taking responsibility
for development decisions) involves risks. For this reason, transit agencies in North America tend to be
involved in strategic land acquisition and disposition but not directly involved in residential or commercial
development. However, there are ways to manage and mitigate these risks.
Potential: Consider being involved in development projects that can achieve TransLink’s objectives for
revenue, affordable housing, and supporting walking, cycling, and transit ridership. Develop a strategic plan
for greater involvement in development projects, with guidelines for examining TransLink’s existing portfolio
of properties and to guide development of new properties.18
8.3 Examining the Approaches with Potential in More Detail
Based on the work so far, five approaches stand out as warranting more examination:
1. Creating a benefitting area tax, as already allowed under the SCBCTA Act.
2. Exploring the potential to enter into CAC or density bonusing revenue sharing arrangements with local
government.
3. Participating with Metro Vancouver local governments in efforts to lobby the Province to share property
transfer tax revenues.
4. Becoming more creative and active in the strategic acquisition and disposition of land.
5. Participating in urban development projects.
Each of these approaches is evaluated using these criteria:
• Alignment with TransLink objectives: Each approach is evaluated in terms of its ability to generate
revenue, support affordable housing, and support walking, cycling, and transit ridership.
• Potential revenues: TransLink uses a revenue benchmark of about $25 million to $50 million per year for
analyzing the feasibility and impacts of different funding sources and when evaluating new funding
streams.
• Sustainability of the revenue stream.
• Potential impacts.
• Ease of implementation.
18 TransLink’s current guidelines set the objectives of adhering to applicable laws, bylaws, and municipal approval requirements and having a positive financial business case for development decisions. A strategic plan would provide more detailed guidance and parameters.

EVALUATION OF LAND VALUE CAPTURE AND URBAN DEVELOPMENT AS SOURCES OF REVENUE FOR TRANSLINK
PAGE 58
8.3.1 Benefitting Area Tax
Alignment with TransLink Objectives
A benefitting area tax would generate new revenue for TransLink. TransLink could apply Benefitting Area Tax
revenues to new transportation capital investment, infrastructure that supports walking, cycling, and transit
use, and to transit operations. TransLink could also apply these revenues to other objectives (e.g. affordable
housing) or a combination, but TransLink advised that it is unlikely to apply benefitting area tax revenues to
affordable housing as it does not do so with its existing property tax revenues.
As a tax, it would not directly provide housing or shape the form of urban development.
Potential Revenue
The revenue potential depends on several variables:
• The definition of benefitting areas.
• The tax rate(s) applied within these areas.
• Whether or not the general property tax rate is adjusted downward to partially offset the increase.
So, the approach we take is to illustrate how the tax might be structured in order to achieve the revenue
threshold of $25 million per year.
As shown in Exhibit 11, TransLink’s total property tax revenue was around $373 million in 2018 (including the
Replacement Tax), equal to about 20% of total revenue. During 2014 to 2016, property tax revenue grew by
3% or less per year (consistent with the former maximum of 3%) but since then has grown by over 4% per
year because of the change to apply the 3% cap to previous tax revenue and then add the growth from new
assessed value due to new development. Exhibit 12 shows the effect of this policy change, indicating the
new property tax revenue in 2017 and 2018.
Exhibit 11: TransLink Property Tax Revenues 2014-2018 ($millions) 2014 2015 2016 2017 2018
Property Tax Revenue a $306.6 $314.7 $324.5 $339.1 $355.8
Replacement Tax Revenue b $17.9 $17.8 $18.0 $17.8 $17.9
Subtotal - Property Tax + Replacement Tax Revenue $324.5 $332.5 $342.5 $357.0 $373.7
Total Revenue from All Sources $1,453.8 $1,627.7 $2,152.3 $1,688.4 $1,849.2
Annual Increase in Property Tax + Replacement Tax Revenue 2.7% 2.5% 3.0% 4.2% 4.7%
Property Tax + Replacement Tax Share of Total Revenue 22% 20% 16% 21% 20%
Source: TransLink, Annual Statutory Reports. Note a: Levied on Property Classes (1) Residential, (2) Utilities, (4) Major Industry, (5) Light Industry, (6) Business/Other, (8) Recreation/Non-Profit, and (9) Farm class. Note b: Levied on Property Classes (1) Residential, (2) Utilities, (4) Major Industry, (5) Light Industry, (6) Business/Other and cannot exceed $18 million per year.

EVALUATION OF LAND VALUE CAPTURE AND URBAN DEVELOPMENT AS SOURCES OF REVENUE FOR TRANSLINK
PAGE 59
Exhibit 12: TransLink Property Tax Revenue Before and After 2017 Policy Change ($millions)
2014 2015 2016 2017 2018
Actual Property Tax Revenue $306.6 $314.7 $324.5 $339.1 $355.8
Property Tax Revenue if total could only increase by up to 3% per year
$306.6 $314.7 $324.5 $334.2 $344.3
Additional Property Tax Revenue associated with 2017 adjustment
n/a n/a n/a $4.9 $11.6
To raise $25 million to $50 million in new revenue, total TransLink regional property taxes would have to rise
by about 7% to 14%.
A benefitting area tax would have to be a larger percentage increase because it would be applied on only a
portion of the assessment base.
If, for illustrative purposes, it is assumed that a new benefitting area tax would be applied to properties within
400 metres of an existing rapid transit station (on the Expo, Millennium, Canada, and Evergreen Lines as at
2019), as shown in Exhibit 13 there would be a total assessment base of about $167.5 billion, which is about
13% of the entire regional assessment base.
Exhibit 13: Assessed Value for Properties within 400m of Rapid Transit Station, 2019 ($millions)
Total Assessed
Land Value
Total Assessed Improvements
Value Total
Assessed Value
Properties within 400m of an Existing Rapid Transit Station:
Class 1: Residential within 400m $57,944.7 $20,686.2 $78,631.0
Class 6: Business/Other $56,071.4 $23,321.4 $79,392.7
Rest of Classes Combined $7,505.8 $2,010.9 $9,516.7
Total $121,521.9 $46,018.5 $167,540.4
Total All Properties in Metro Vancouver:
Class 1: Residential $792,242.2 $199,359.4 $991,601.5
Class 6: Business/Other $158,445.0 $43,646.8 $202,091.7
Rest of Classes Combined $107,554.3 $23,756.7 $131,311.0
Total $1,058,241.4 $266,762.9 $1,325,004.3
Source: Landcor Data Corporation.
Exhibit 14 shows the implications for property taxation on residential and business properties in this sample
benefitting area.
Exhibit 14: Testing Benefitting Area Tax Revenue Potential ($millions)
Property Type
Total 2019 Assessed
Value Within 400 m of all
existing rapid transit stations
2019 TransLink mill rates
(per thousand dollars of assessed
value)
2019 Property
Taxes
Extra property tax to achieve $25
million increase assuming same
mix of residential and business
taxes
Percent increase in TransLink
property tax in benefitting area
Increase in total
property tax if TransLink
averages 7% of total
Residential $78,631.0 $0.2193 $17.2 $5.5 32% 2.2%
Business/Other $79,392.7 $0.7617 $60.5 $19.5 32% 2.2%
Other Classes $9,516.7 n/a n/a n/a n/a n/a
Total $167,540.4 n/a $77.7 $25 32% 2.2%
Achieving the revenue threshold requires a 32% increase in TransLink property taxes inside the defined
benefitting area. TransLink estimates that on average TransLink accounts for 7% of a homeowner’s total

EVALUATION OF LAND VALUE CAPTURE AND URBAN DEVELOPMENT AS SOURCES OF REVENUE FOR TRANSLINK
PAGE 60
property tax bill19, so a 32% increase in the TransLink portion means an increase of a little over 2% in total
taxes (in addition to any increase applied to all properties) inside the benefitting area.20
This percentage increase could be reduced by:
• Including the rapid transit station areas on the new extensions in Surrey and Vancouver in the definition
of benefitting areas.
• Including properties in Frequent Transit Development Areas served by buses in the definition of
benefitting areas.
Sustainability of the Revenue Stream
This is a sustainable revenue stream that could increase over time because an increasing share of total
regional development is occurring in transit-served locations. This revenue stream would be affected by
changes in land value if the tax is set at a flat rate. The revenue stream would be resilient to changes in land
value if the tax rate is determined by a budget that defines the target revenue from this source.
Potential Impacts
This new tax would possibly constrain the ability of local governments to increase their property taxes,
assuming there is a financially and politically acceptable maximum total property tax that property owners will
absorb.
There would be impacts on these groups:
• Commercial tenants on fixed term leases will have to absorb the increased operating cost.
• Residential tenants paying less than full market rent may absorb increased costs if the Residential
Tenancy Act rent controls allow higher rent increases to cover the higher operating costs.
• Home owners will absorb an increased cost.
• Landlords who cannot pass the tax forward to tenants will have reduced net operating income.
• Businesses that own their own property will absorb increased operating cost.
These groups also benefit from the transit, so the property tax is recouping some of that benefit.
Ease of Implementation
The authority to create a benefitting area tax already exists in the SCBCTA Act.
8.3.2 CAC and Density Bonus Revenue Sharing
Alignment with TransLink Objectives
While there is no legislation governing the use of CAC revenues, the common practice is to apply them to
capital investment needed to meet the needs of growth. Legislation requires that benefits from density
bonusing be used for amenities or affordable housing, but there is considerable flexibility in the allocation of
benefits to capital projects. TransLink could apply CAC or density bonus shared revenues to new transit
capital investment and infrastructure that supports walking, cycling, and transit use, but TransLink has
indicated that it would be unlikely to apply these revenues to affordable housing because local governments
19 TransLink website at https://www.translink.ca/About-Us/Media/2018/March/Phase-Two-Regional-Funding.aspx 20 This assumes that on average TransLink also accounts for 7% of commercial total property tax bills.

EVALUATION OF LAND VALUE CAPTURE AND URBAN DEVELOPMENT AS SOURCES OF REVENUE FOR TRANSLINK
PAGE 61
already collect CACs for this purpose and there is no precedent for TransLink to do so. TransLink would likely
encounter resistance to applying CAC revenue to pay down debt for past investments or to fund transit
operating cost.
Potential Revenue
This is very difficult to estimate because not all municipalities report their CAC receipts and because some
public benefits are received in kind, which require a conversion to estimate cash equivalence.
Using available reported data for Vancouver, Surrey, Coquitlam, Burnaby, Richmond, West Vancouver, and
the District of North Vancouver, total contributions from development (not including DCCs and DCLs) in 2017
and 2018 were in the range of $660 to $690 million (heavily concentrated in Vancouver, Burnaby, and Surrey).
The totals were much lower during 2014 to 2016, averaging about $350 million to $400 million. These
municipalities account for a large share of total residential development in Metro Vancouver21, but the rest of
the municipalities in Metro Vancouver also obtain developer contributions.
These revenues fluctuate considerably depending on the amount of rezoning activity, market conditions, and
municipal policy.
To illustrate TransLink’s revenue potential, the first step is to establish a conservative forecast of total CAC
and density bonus revenues in Metro Vancouver, at an average say $500 million per year. To achieve $25
million, TransLink’s share would be 5%. However, while most revenues come from increased density in
transit-oriented locations (where municipalities might be open to the argument that transit contributes to the
increased land value that enables benefits from rezoning), there are projects that contribute public benefits
but receive little direct value from transit.
If, for illustrative purposes, it is assumed that municipalities might share CAC and density bonus revenues in
defined “benefitting areas” served by rapid transit and if such areas account for say 60% of all benefits
(assuming benefits are mostly obtained from strata multi-family residential projects and that about 60% of
new strata residential development is within 800 metres of a rapid transit station as illustrated in Exhibit 5),
then to achieve $25 million per year TransLink would have to obtain about 8% of the eligible revenue. This is
not unreasonable given that transit service supports densification and appears to contribute significantly more
(based on the case study analysis in Section 5.3) than 8% of the land value gains because of the premium
paid for strata residential space in transit-served locations.
The above estimates assume that TransLink explores sharing existing density bonusing and CACs. An
alternative way to structure a system could involve a new CAC or density bonus for transit infrastructure
levied on approved new density in defined areas. There is no existing legislation to enable such a system,
but in theory a system could be designed in which TransLink receives an amount per square foot of new
approved density in defined areas. For example, if apartment development averages about 11,000 units per
year in the region22, if about 70% of these are strata projects23 (i.e. not market rental or affordable rental as it
is rare for these types of projects to pay a CAC), and if about 60% of these are located in defined benefitting
areas near rapid transit stations, this works out to an average of about 4,620 new strata apartment units per
year. At an average apartment unit size of 850 square feet, this is about 3,927,000 square feet of strata
apartment development. If it is assumed that 50% of this development uses new density approved by
21 For example, Vancouver, Surrey, Coquitlam, Burnaby, Richmond, West Vancouver, and the District of North Vancouver accounted for 77% of total apartment starts in the region in 2017 and 2018 combined based on CMHC housing starts data.
22 Coriolis Consulting Corp., “Regional DCC for Transit Infrastructure: Structure, Rates, and Revenue Forecasts.” 1 August 2018. 23 In the June 2016 “Regional Housing Affordability Strategy” by Metro Vancouver, it forecast that about 70% of anticipated housing
demand in the region between 2016 and 2026 would be market condo units versus market rental/affordable rental units.

EVALUATION OF LAND VALUE CAPTURE AND URBAN DEVELOPMENT AS SOURCES OF REVENUE FOR TRANSLINK
PAGE 62
rezoning, then to achieve $25 million a new CAC for transit infrastructure would need to be on the order of
$13 per square foot. This figure is a small share of CACs charged in high land value communities, but a large
figure compared to the CACs achievable in low land value communities in Metro Vancouver.
Note that the above estimates of revenue are illustrative of how TransLink might achieve a revenue target of
$25 million per year. These estimates understate the share of land value gains that are due to transit
investment compared to the gains that are due to rezoning.
Sustainability of the Revenue Stream
CAC and density bonus revenue is a function of the pace of development, the value of new density, and
municipal policy about development contributions so changes in any of these will impact the revenue stream.
While CAC revenues across Metro Vancouver will fluctuate from year to year, over the long-term
redevelopment and densification will continue to create the potential for developer contributions from density
bonusing and rezonings. The Province may explore changes to CAC and density bonus structures, in
response to input from the development industry and local government, but some system of obtaining
development contributions in exchange for new density is likely to continue.
Potential Impacts
CACs and density bonusing can have these impacts:
• If these systems extract 100% of the land lift from rezoning, there is a risk that there is insufficient
incentive for land owners to sell property into the redevelopment market. This is why most systems aim
to obtain a portion of the value of new density.
• These systems mean that land owners or developers do not receive all of the upside from rezoning. This
could be regarded as an impact, but as long as there is sufficient movement of land into redevelopment,
and sufficient developer interest in additional density, then there are not negative impacts on the housing
market. In fact, if public benefits help make redevelopment more acceptable in the community and if some
of the benefits take the form of affordable housing then CACs help make the housing situation better.
• In some cases, the implementation of CACs creates delay, costs, and uncertainty.
TransLink involvement in CACs and density bonusing could have these effects:
• Any revenue received by TransLink could otherwise have gone to local government. For this reason,
local governments may not agree that revenue sharing is in their interests.
• If TransLink involvement is perceived as making the system more complicated or time-consuming, it will
be resisted by the development industry.
• If TransLink involvement significantly increases total expectations for CACs, then it could reduce the
incentives for land owners and developers to be involved in the rezoning process, leading to reduced
pace of development and rising house prices.
TransLink would have to proceed cautiously to avoid resistance and negative consequences.
Ease of Implementation
There are several different ways in which CAC and density bonus revenue sharing could be implemented:
• Individual negotiations with municipalities, leading to agreement on sharing the proceeds from CACs and
density bonusing. There are precedents in the region for this approach, such as the CAC that the City of
Richmond implemented to raise funds for the Capstan Way station on the Canada Line. There are two
different ways that such agreements could be structured: local governments could commit to allocate a
share of their CACs to transit projects (i.e. the funds would not flow to TransLink but would be invested

EVALUATION OF LAND VALUE CAPTURE AND URBAN DEVELOPMENT AS SOURCES OF REVENUE FOR TRANSLINK
PAGE 63
in agreed-on transit projects), or local governments could remit to TransLink an agreed-on share of
revenues.
• A flat rate applied to new density across the region (which could be applied in density bonus bylaws, fixed
rate CAC districts, or site-by-site negotiations). This would require either new provincial legislation or a
multi-party agreement between TransLink and the local governments in Metro Vancouver.
• Negotiation with individual municipalities that are receiving new capital investment in transit. These
negotiations could be part of the Project Partnership Agreements.
In the absence of Provincial legislation to create a region-wide approach, negotiations will have to proceed
individually with all municipalities, as every municipality has its own CAC and/or density bonus system and
its own market conditions. Municipalities that are not receiving significant transit investment may not see any
reason to even consider the idea.
It may be that the best approach is to include CAC or density bonus revenue sharing as a business term in each
local government with which TransLink negotiates Project Partnership Agreements24 related to a large transit
capital project.
In further exploration of this source of funding, TransLink will have to proceed carefully and work closely with
local governments given their stated concerns about the impacts of losing a share of their existing revenue
streams.
8.3.3 Property Transfer Tax
Alignment with TransLink Objectives
Obtaining a share of property transfer taxes would generate new revenue for TransLink that could be applied
to new transportation capital investment, infrastructure that supports walking, cycling, and transit use, and to
transit operations. TransLink could also apply these revenues to other objectives (e.g. affordable housing) or
a combination, but TransLink advised that it is unlikely to apply property transfer tax revenues to affordable
housing as it does not do so with its existing tax revenues.
As a tax, it would not directly provide housing or shape the form of urban development.
Potential Revenue
The potential revenue associated with any property transfer tax that is shared by the Province with the region
of which TransLink may receive a portion depends on (a) negotiations with the Province and (b) the split between
TransLink, Metro Vancouver, and municipalities.
As an illustrative example, in 2017 Metro Vancouver estimated that this region generated over 75% of the
Provincial revenue from this tax (which generates on the order of $2 billion per year).25 To yield $25 million
per year, TransLink would need a 1.7% share of property transfer tax revenues generated in the region (i.e.
$2 billion x 75% = $1.5 billion; $25 million ÷ $1.5 billion = 1.6%).
Sustainability of the Revenue Stream
The revenue stream would be sustainable if negotiations with the Province were successful, although the
amount of revenue will be affected by the volume of sales transactions and changes in property values.
24 Project Partnership Agreements include two separate agreements: a non-binding Supportive Policy Agreement and a binding Financial Contribution Agreement.
25 Metro Vancouver, “Provincial Property-based Taxes in the Metro Vancouver Region.” 4 April 2017.

EVALUATION OF LAND VALUE CAPTURE AND URBAN DEVELOPMENT AS SOURCES OF REVENUE FOR TRANSLINK
PAGE 64
Potential Impacts
It is possible that if the Province agreed to give the region (including TransLink) a share of property transfer
taxes generated in Metro Vancouver that it might reduce other funding it provides directly to TransLink.
Ease of Implementation
This source of revenue will be entirely dependent on negotiation. It depends on if the Province is willing to
share this revenue stream and, if the Province does give a share to the region (including TransLink), the
portion that would be received by TransLink.
8.3.4 Strategic Acquisition and Disposition of Land
Alignment with TransLink Objectives
Participation in the land market can generate revenue for transit capital investment, transit operations, and
financial contributions to other objectives including affordable housing and infrastructure and programs that
promote walking, cycling, and transit ridership.
Revenue would come from the sale or lease of development parcels or air rights. Objectives for affordable
housing or promoting walking, cycling, and transit ridership could be achieved by means such as:
• Being in control of rezoning applications before taking sites to the market. The approved rezonings could
include obligations for affordable housing or design elements that support walking, cycling, and transit
ridership.
• Including requirements in purchase and sale agreements or leases for development sites or air rights
parcels.
Disposition of development property creates opportunities to make land available on terms that call for
including affordable housing and for design that is supportive of transportation objectives.
Potential Revenue
The revenue potential depends on the value of surplus property that TransLink can make available for
disposition including current surplus property and lands that are acquired for strategic purposes and then
subsequently marketed after taking advantage of market growth, transit access, and upzoning.
The inflow of revenue will probably not be regular, as a single sale of a large property (such as the former
Oakridge Transit Centre site), produces a large spike in revenue. This revenue should likely be thought of in
10-year cycles rather than regular annual amounts.
It is possible to illustrate the scale of activity needed to produce an average of $25 million per year, by making
some assumptions:
• Assume an overall average current land value for high density residential and commercial development
property in the region of $150 per square foot buildable.26
• Assume that on average TransLink’s added value (after original purchase price, market growth, transit
access, and retained share of land lift from rezoning, after CAC) works out to about one third of the
disposition value or $50 per square foot buildable.
26 Based on Coriolis Consulting’s experience and internal databases, current land values range from about $50 per square foot buildable to $400+ per square foot buildable throughout the region.
EVALUATION OF LAND VALUE CAPTURE AND URBAN DEVELOPMENT AS SOURCES OF REVENUE FOR TRANSLINK
PAGE 65
• To achieve a gain of $25 million per year, TransLink would have to put 500,000 square feet of new
residential and office development capacity into the market every year. At an overall average density of
say 4.0 FSR, this means 125,000 square feet of land (just under 3 acres).
TransLink is not likely to be able to produce a steady flow of 3 acres every year to the development market,
but looked at as a 20 year target this means about 60 acres. Considering the lands (and possible air rights
over transit stations) TransLink already owns that could be declared surplus and the long-term outlook for
future transit construction this does not seem beyond reach.
Note that the above estimate is based only on potential acquisition and disposition of property and does not
assume any direct participation by TransLink as a partner in development projects. This land
acquisition/disposition revenue stream is generated by marketing surplus lands (after adding value through
rezoning) and by early strategic acquisition of property (for example, when buying land for transit construction)
that can be rezoned and marketed to developers after transit work is completed.
It is also important to note that decisions to incorporate affordable housing or to incorporate physical elements
that support walking, cycling, and transit ridership may result in TransLink receiving less revenue (for transit
investment) from the disposition of development properties.
Sustainability of the Revenue Stream
This revenue is not sustainable if TransLink only takes to the market land it already owns that is surplus. This
will be a dwindling supply that will eventually be depleted.
For this to be a sustainable source of revenue, TransLink will have to be active in acquiring new land in
strategic locations in order to create the future inventory of value-added development sites that can be leased
or sold. The amount of revenue will depend on the amount and location of property acquisition and changes
in land values in these areas.
Potential Impacts
There are no significant negative impacts from the strategic acquisition and disposition of land.
Ease of Implementation
TransLink already has the authority to acquire and dispose of land. To take a more active approach, TransLink
will need a mandate to acquire more land, a pool of capital to enable it to buy property, and the financial and
technical resources to make sound acquisitions and navigate approvals and dispositions.
8.3.5 Participation in Urban Development Projects
Alignment with TransLink Objectives
Participation in development projects can generate revenue for transit capital investment, transit operations,
and financial contributions to other objectives including affordable housing and infrastructure and programs
that promote walking, cycling, and transit ridership.
Direct involvement in development also creates opportunities to include affordable housing and control the
form and character of development so that it is supportive of walking, cycling, and transit ridership.

EVALUATION OF LAND VALUE CAPTURE AND URBAN DEVELOPMENT AS SOURCES OF REVENUE FOR TRANSLINK
PAGE 66
Potential Revenue
The revenue potential obviously depends on how active TransLink becomes in development, in terms of the
number and type of projects and its role. To illustrate the scale of potential revenue, some assumptions are
needed:
• Assume that TransLink wants to be a partner in development projects and wants to limit its financial
involvement to injecting land only (i.e. no cash or borrowing).
• Assume that on average the value of new market development product (strata residential, market rental,
office, retail) across Metro Vancouver is around $800 per square foot.
• Assume an average profit margin of 12% of project value, or $96 per square foot.
• Assume that TransLink only invests land value as its share of equity and this works out on average to a
25% interest in projects, or $24 per square foot of profit to TransLink.
• To make $25 million per year, TransLink would have to partner in a little over 1 million square feet of
product per year (equivalent to say 800 housing units plus a couple of large office buildings).
Note that this revenue is different from (and in addition to) the revenue from land acquisition/disposition that
was estimated in the previous section. This new revenue calculation is an estimate of the share of profit that
TransLink would make from being a partner in development projects, based on the stated assumptions.
One million square feet per year is a large amount of development activity, which may not be achievable if
TransLink concentrates only on projects at transit stations.
Because this is a large amount of development activity, it could make sense to think in terms of a revenue
target of $25 million per year as a sum of the revenue to be generated by a combination of strategic land
acquisition/disposition and direct participation in urban development projects.
An alternative way to generate revenue from development is to create income-producing property that yields
ongoing income from rents.
Investments in income-producing property in Metro Vancouver tend to generate returns (using Internal Rate
of Return as the metric) of around 6% before financing. Somewhat simplistically, if TransLink borrows 75%
of project cost at 3%, then it should be able to make around 15% on equity (which might be in the form of
land). The total capital investment to yield $25 million per year at a return of 15% on equity (assuming 75%
is financed) is about $670 million. If the all-in cost to create such investments (including land and all
construction costs) averages around $700 per square foot, this represents a total portfolio of about 960,000
square feet of space. This is not a large portfolio; it could be achieved with a mix of say 50,000 square feet
of retail, an office building of 150,000 square feet, and 800 units of market rental housing. If developed over
10 years or so, the average annual rate of development is modest.
Sustainability of the Revenue Stream
This revenue stream can continue as long as TransLink finds sufficient good development opportunities with
acceptable risk.
Potential Impacts
There are no negative impacts on other parties. The development industry would probably welcome
TransLink as a partner, particularly if it is bringing forward a regular stream of potential development sites.
Because of the risks involved in development, it is possible that projects lose money. Consequently, the
greatest potential impact is on TransLink itself if development activity causes losses that must be covered
using revenue that had been earmarked for transit capital investment or operations.

EVALUATION OF LAND VALUE CAPTURE AND URBAN DEVELOPMENT AS SOURCES OF REVENUE FOR TRANSLINK
PAGE 67
Ease of Implementation
TransLink already has the legal authority to acquire, hold, develop, and sell/lease land. To earn revenue from
development, TransLink needs the financial and professional resources to find opportunities, negotiate with
partners, structure deals, and implement projects.
8.4 Potential Uses of New Revenue
Some of the potential new sources of revenue would allow TransLink considerable flexibility in applying the
funds to different purposes, except for CAC sharing which would likely be confined to new investment in
transit capital (in part because local governments are unlikely to be willing to share revenue unless there is a
commitment to use it for transit expansion).
Exhibit 15 indicates possible uses of each of the sources that are suggested for further consideration. The
most flexibility is with revenue from the strategic acquisition/disposition of land and revenue from participating
in development projects.
Exhibit 15: Possible Use of Revenue from Each Approach
Benefitting Area Tax
CAC or Density Bonus Revenue Sharing
Agreements with Local Governments
Property Transfer Tax
Revenue from Strategic Acquisition &
Disposition of Land
Revenue from Development
Projects
Capital investment in new transit (including upgrades)
Yes Yes Yes Yes Yes
Repayment of existing debt from previous projects
Yes No Yes Yes Yes
Transit operations Yes No Yes Yes Yes
Property acquisition Yes No Yes Yes Yes
Equity for development projects
Yes No Yes Yes Yes
Affordable housing (direct investment or contribution)
Not likely; affordable housing is not TransLink’s primary mandate, so there would likely be resistance to a transit agency increasing taxes to pay for affordable housing
No; local governments are likely only willing to considering CAC or density bonus revenue sharing if funds are used for transit investment (that supports the densification and land value gains that create the potential for CACs)
Not likely; TransLink advised that it is unlikely to apply property transfer tax revenues to affordable housing as it does not do so with its existing property tax revenues
Yes. Possible approaches include:
• Requiring lands sold or leased to include affordable housing, which will reduce the land value and is therefore a form of allocating revenue to affordable housing
• Investing the proceeds from sales and leasing into affordable housing, either directly or by working with others on initiatives such as the TOAH fund proposed by Metro Vancouver
Yes. Possible approaches include:
• Direct incorporation of affordable housing in any projects developed by TransLink
• Investing some of the profit from development into affordable housing, either directly or by working with others on initiatives such as the TOAH fund proposed by Metro Vancouver
Infrastructure to support walking, cycling, or transit ridership
Yes Yes, if directly linked to transit capital investment
Yes Yes Yes

EVALUATION OF LAND VALUE CAPTURE AND URBAN DEVELOPMENT AS SOURCES OF REVENUE FOR TRANSLINK
PAGE 68
8.5 Policy Questions to be Addressed
There are two over-arching policy questions that TransLink must address if it wants to increase its use of land
value capture:
• Which approaches to explore further? The consulting team has recommended five approaches for further
consideration, but there are clear differences of opinion among the stakeholders regarding some of these
approaches.
• How to allocate the revenues? TransLink’s main mandate is the creation and operation of the regional
transit system, so presumably most new revenue will be allocated to this purpose. However, there is
strong support from some stakeholders for TransLink to become more involved in supporting the creation
of affordable transit-oriented rental housing, so TransLink will have to decide on the allocation of revenue
to transit construction, transit operation, support for affordable housing, and support for initiatives that
encourage walking, cycling, and transit ridership.
In addition to these fundamental questions, each of the five approaches recommended for further exploration
also raise significant policy questions that should be addressed, as listed in the following sections.
8.5.1 Benefitting Area Tax
1. Should benefitting areas include areas around existing transportation infrastructure or only around new
investments?
2. Should benefitting areas be established for all transportation investments by TransLink or only some (e.g.
all transit investment or only rapid transit investment)?
3. Should benefitting areas all pay the same tax surcharge or should the charge vary by area?
4. Should the tax inside benefitting areas be the same for land and improvements?27
5. Should the definition of benefitting areas allow for gradations (e.g. one rate within 400 metres of a station
and another rate for 400 metres to 800 metres), to avoid sharp differences that might cause development
to avoid taxation areas?
6. What is the appropriate surcharge in benefitting areas?
7. Should there be any exemptions from a benefitting area tax?
8.5.2 CAC and Density Bonus Revenue Sharing
1. Should this idea be explored with all Metro Vancouver local governments or only those where a significant
new transit capital investment is being made?
2. Is a region-wide approach workable or will this be a series of individual arrangements with individual local
governments? In either situation, what types of areas would be subject to a CAC or density bonus for
transit infrastructure?
27 In Part 3, Section 25(7), the SCBCTAA states that TransLink may “(a) establish zones in the transportation service region, and (b) adopt different tax rates for land and improvements in different zones based on the benefit that the authority considers accrues to the land and improvements in a zone as a result of proximity to a transportation station, or to another major transportation facility, that has been constructed or funded by the authority.” This might mean that tax rates can vary by area or that rates can vary between land and improvements in benefitting areas; this would need to be explored further to confirm the legal interpretation.

EVALUATION OF LAND VALUE CAPTURE AND URBAN DEVELOPMENT AS SOURCES OF REVENUE FOR TRANSLINK
PAGE 69
3. Should a CAC or density bonus for transit infrastructure be based on a percentage of municipal CACs or
a target flat rate?
8.5.3 Property Transfer Tax
1. What is the appropriate role for TransLink in pursuing the idea of sharing property transfer tax revenues?
8.5.4 Strategic Acquisition and Disposition of Land
1. How broad should the mandate for property acquisition be? Should activity be focused at transit
locations? How should policy decisions be made to enable timely or expedited transactions?
2. When is the optimal time to make new property investments, relative to the timing of planning future
transit investments? Once TransLink signals the location and timing of new projects, some of the
advantage of early land acquisition is lost. On the other hand, buying land well ahead of project definition
may risk criticism that TransLink has not been transparent in its transit planning process and risks buying
land in “wrong” locations.
3. When taking surplus land to the market, how much emphasis should be on revenue generation versus
contributing to transit-oriented affordable rental housing?
4. Given that many transit stations are on land owned by others (e.g. BC Hydro, Province of BC), should
TransLink partner with these owners to create development opportunities?
8.5.5 Participation in Urban Development Projects
1. What kinds of projects and locations offer the appropriate mix of revenue potential and tolerable risk?
2. Should TransLink be involved in strata residential for profit, or focus on transit-oriented rental residential?
3. Should TransLink take on projects on its own, or only in partnership with experienced developers? In
partnerships, what percentage interest should TransLink take (e.g. the percentage interest equal to land
value, or contribute land and equity to have a 50% interest)?

EVALUATION OF LAND VALUE CAPTURE AND URBAN DEVELOPMENT AS SOURCES OF REVENUE FOR TRANSLINK
PAGE 70
9.0 Recommendations
1. Explore several of the potential tools in more detail, rather than select a single preferred approach at this
time. A combination of approaches has greater revenue potential and will allow progress on all of
TransLink’s stated objectives. Also, because there is stakeholder concern about some of the potential
approaches so they may not be implementable in the near term, TransLink should keep exploring several
options.
2. Explore in greater detail the creation of a transit benefitting area tax, as allowed under Part 3, Section
25(7) of the SCBCTA Act. This work should include determining whether any legislative amendments or
regulations would be needed to implement this tax. In the analysis of alternative ways to structure this
tax, TransLink should consider scenarios that only include areas around new rapid transit stations,
scenarios that include areas around existing and proposed rapid transit stations, and scenarios that
include Frequent Transit Development Area geographies and corridors. Scenarios should also include
different definitions of benefitting area (e.g. within 400 metres and 800 metres of a rapid transit station).
This analysis should include careful evaluation of potential negative impacts and ways to mitigate them.
3. Explore the idea of sharing CAC and density bonus revenues in locations that are transit-served and are
designated for significant increases in density based on transit investment. CAC and density bonus
sharing is the approach with the most direct link between transit investment and the creation of new land
value. While there was broad municipal opposition to the idea of CAC revenue sharing, TransLink should
emphasize the point that transit investment creates the potential for densification and generates a
significant share of the increase in land value associated with rezoning to higher density, so it should be
considered as a potential source of revenue for transit. There are several scenarios that could be
considered including:
a. Individual negotiations with all local governments in Metro Vancouver that have existing or proposed
major investments in transit, regarding sharing CAC and density bonus revenues.
b. Negotiations only with local governments that will receive major new transit investments, as one of
the terms in Project Partnership Agreements, particularly any Financial Contribution Agreements.
c. Discussion with the Province about a TransLink-specific flat rate CAC or density bonus rate to be
applied to rezonings around major transit investments.
Because many municipalities have already expressed opposition to CAC revenue sharing, if TransLink
elects to explore this approach in more detail it should adopt a highly collaborative approach and first
focus mainly on (b) and (c) above.
4. Develop a strategic plan for greater involvement in the acquisition and disposition of development sites.
This strategic plan should include:
a. Detailed evaluation of the existing inventory of TransLink-owned property to identify sites or portions
of sites that are surplus and could be available for urban development.
b. Detailed examination of all rapid transit stations to identify potential for air rights development. As
many stations are on lands owned by parties other than TransLink (e.g. BC Hydro, Province of BC),
this would require partnering with the owners.
c. Advance acquisition of land in strategic locations when acquiring land for new stations, particularly in
areas likely to be designated for increased density and where assembly creates the potential for
creating attractive development sites.

EVALUATION OF LAND VALUE CAPTURE AND URBAN DEVELOPMENT AS SOURCES OF REVENUE FOR TRANSLINK
PAGE 71
5. Develop a strategic plan for participating in urban development projects as a new source of revenue,
including profit from projects developed for sale and net operating income from creating a portfolio of
income-producing rental residential, retail, and office properties.
6. Because of the ridership benefits from rental housing at transit stations, and because of the pressing
need for transit-oriented rental housing in the region, TransLink should consider using land
acquisition/disposition and participation in development as means to achieve revenues that can be
applied to a mix of transit capital investment, transit operations, and affordable housing. Land
acquisition/disposition and participation in urban development also provide the physical opportunity to
support walking, cycling, and transit infrastructure and affordable housing. Because there are varied
expectations within the region about the extent that TransLink should be involved in the creation of
affordable rental housing, TransLink should establish and communicate clear objectives regarding its role
(if any) in supporting, funding, or creating affordable rental housing. If TransLink decides to have a
significant role, it should develop a business case for its potential involvement in this area.
7. Participate with Metro Vancouver and local governments in efforts to influence the Province regarding
property transfer tax revenue sharing, but do not rely on this as a near term source of revenue for transit
investment.
8. Monitor the positions of the Provincial Government, Metro Vancouver, and municipalities in the region
regarding a broader approach to land value tax and then be part of the conversation as a stakeholder
when appropriate.

EVALUATION OF LAND VALUE CAPTURE AND URBAN DEVELOPMENT AS SOURCES OF REVENUE FOR TRANSLINK
PAGE 72
Appendix 1: Case Studies

EVALUATION OF LAND VALUE CAPTURE AND URBAN DEVELOPMENT AS SOURCES OF REVENUE FOR TRANSLINK
PAGE 73
Case Studies
A.1 Approach
The comparison of land value created through rezoning with the land value created by transit investment (i.e.
improved transit access) is analyzed using case studies.
For each case study, financial models were constructed for the following scenarios:
• “Base case” financial performance of a development site assuming no rezoning and no transit influence.
This either reflects value under existing zoning or under existing use, depending on the case study.
• “Rezoning only”, which shows the financial performance of rezoning the development site to a density
typical for the sub-market, in the absence of a price premium for rapid transit proximity.
• “Rezoning with transit”, which shows the financial performance of rezoning the development to a density
typical for the sub-market and incorporating a premium (in sales prices or rent rates) for improved transit
access. Based on the analysis summarized earlier in this report, the case studies use a premium of 5%
for multi-family unit sales prices near enhanced rapid transit and a premium of 10% for office lease rates
near rapid transit.28
Municipal Community Amenity Contributions (CAC) policies are not included29 so the case studies illustrate
the total land lift, the portion of the total attributable to the rezoning (increased density), and the portion
attributable to the transit premium prior to CACs.
A.2 Identification of Case Studies
A.2.1 Multi-Family Residential Case Studies
For the multi-family residential case studies, locations in different sub-markets in the region where rapid transit
expansions are planned or have recently been completed were selected including:
• The Broadway Corridor, where the new Broadway Subway Project will extend rapid transit from VCC-
Clark to Arbutus.
• Burquitlam, where the Evergreen Extension went into service in December 2016.
• Fleetwood, located on the planned extension to Langley.
• Lynn Creek, which will be served by the Marine Drive RapidBus that will connect West Vancouver with
Phibbs Exchange.
The case studies assume strata multi-family residential development to show the maximum extent to which
improved transit access generates land value relative to upzoning (because strata residential land values are
much higher than rental residential land values), except for one market rental scenario in the Broadway
28 Note that these premiums are based on analysis of sales prices and lease rates near vs not near rapid transit stations. One of the case studies is for multi-family residential redevelopment near new rapid bus service, so we use a lower premium (1%) on multi-family unit sales prices near a new rapid bus stop vs near a new rapid transit station.
29 Including the City of Vancouver’s Developer Contribution Expectation (DCE) in the Broadway Corridor.

EVALUATION OF LAND VALUE CAPTURE AND URBAN DEVELOPMENT AS SOURCES OF REVENUE FOR TRANSLINK
PAGE 74
Corridor (where market rents are high enough to support a significant land value) to illustrate the economics
of redevelopment under both strata and rental residential.
A.2.2 Commercial Case Studies
For the commercial case studies, the analysis uses a higher land value and a lower land value location to
show the range in contribution of upzoning and improved transit access to land value increases in different
sub-markets with rapid transit access (or planned rapid transit access) in the region:
• The Broadway Corridor, where the new Broadway Subway Project will extend rapid transit from VCC-
Clark to Arbutus.
• Surrey City Centre, where the City of Surrey’s recently adopted new City Centre Plan envisions transit-
oriented redevelopment of low density properties near rapid transit stations including around King George
Station on the existing Expo Line.
Based on the analysis summarized in Section 5.2 of this report, the case studies use a transit premium of
10% for commercial lease rates near enhanced light rail rapid transit.
A.2.3 Summary List of Case Studies
Based on the foregoing, there are a total of 7 case studies:
1. Strata multi-family residential case study in the Broadway Corridor.
2. Market rental multi-family residential case study in the Broadway Corridor.
3. Strata multi-family residential case study in Burquitlam.
4. Strata multi-family residential case study in Fleetwood.
5. Strata multi-family residential case study in Lynn Creek.
6. Commercial case study in the Broadway Corridor.
7. Commercial case study in Surrey City Centre.
Detailed descriptions of each case study are provided in the following section.
A.3 Data Sources
Coriolis Consulting Corp. built the financial models used in the case study analysis and populated the models
with all assumptions. The major assumptions and inputs are based on the following data sources and
professional judgement:30
• Assumed densities are based on applicable municipal zoning bylaws and planning documents (OCPs).
• Residential sales prices are based sales data obtained from the Real Estate Board of Greater
Vancouver’s online subscription database (MLSLink) and residential sales from Urban Analytics’ online
subscription database (NHSLive).
30 Coriolis Consulting Corp. is a land economics, urban development, and land use planning consulting firm in Vancouver, BC. We have been in business for 37 years and have extensive experience analyzing the financial performance of development projects throughout the region.
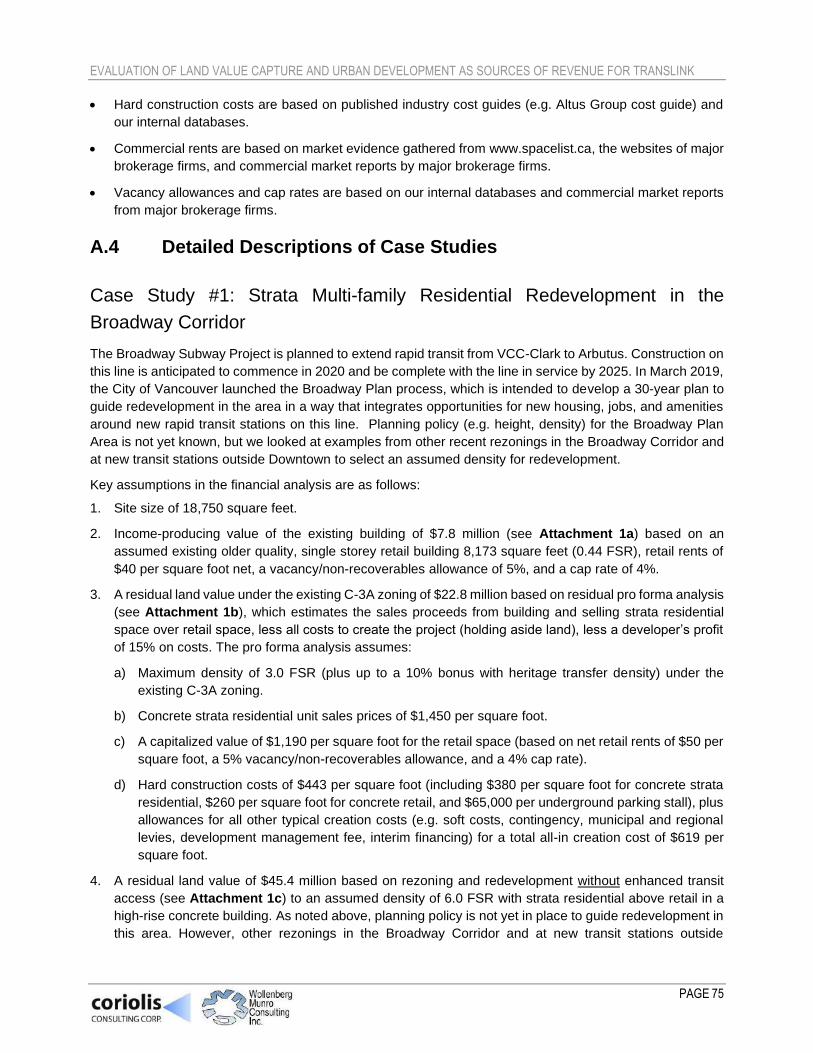
EVALUATION OF LAND VALUE CAPTURE AND URBAN DEVELOPMENT AS SOURCES OF REVENUE FOR TRANSLINK
PAGE 75
• Hard construction costs are based on published industry cost guides (e.g. Altus Group cost guide) and
our internal databases.
• Commercial rents are based on market evidence gathered from www.spacelist.ca, the websites of major
brokerage firms, and commercial market reports by major brokerage firms.
• Vacancy allowances and cap rates are based on our internal databases and commercial market reports
from major brokerage firms.
A.4 Detailed Descriptions of Case Studies
Case Study #1: Strata Multi-family Residential Redevelopment in the
Broadway Corridor
The Broadway Subway Project is planned to extend rapid transit from VCC-Clark to Arbutus. Construction on
this line is anticipated to commence in 2020 and be complete with the line in service by 2025. In March 2019,
the City of Vancouver launched the Broadway Plan process, which is intended to develop a 30-year plan to
guide redevelopment in the area in a way that integrates opportunities for new housing, jobs, and amenities
around new rapid transit stations on this line. Planning policy (e.g. height, density) for the Broadway Plan
Area is not yet known, but we looked at examples from other recent rezonings in the Broadway Corridor and
at new transit stations outside Downtown to select an assumed density for redevelopment.
Key assumptions in the financial analysis are as follows:
1. Site size of 18,750 square feet.
2. Income-producing value of the existing building of $7.8 million (see Attachment 1a) based on an
assumed existing older quality, single storey retail building 8,173 square feet (0.44 FSR), retail rents of
$40 per square foot net, a vacancy/non-recoverables allowance of 5%, and a cap rate of 4%.
3. A residual land value under the existing C-3A zoning of $22.8 million based on residual pro forma analysis
(see Attachment 1b), which estimates the sales proceeds from building and selling strata residential
space over retail space, less all costs to create the project (holding aside land), less a developer’s profit
of 15% on costs. The pro forma analysis assumes:
a) Maximum density of 3.0 FSR (plus up to a 10% bonus with heritage transfer density) under the
existing C-3A zoning.
b) Concrete strata residential unit sales prices of $1,450 per square foot.
c) A capitalized value of $1,190 per square foot for the retail space (based on net retail rents of $50 per
square foot, a 5% vacancy/non-recoverables allowance, and a 4% cap rate).
d) Hard construction costs of $443 per square foot (including $380 per square foot for concrete strata
residential, $260 per square foot for concrete retail, and $65,000 per underground parking stall), plus
allowances for all other typical creation costs (e.g. soft costs, contingency, municipal and regional
levies, development management fee, interim financing) for a total all-in creation cost of $619 per
square foot.
4. A residual land value of $45.4 million based on rezoning and redevelopment without enhanced transit
access (see Attachment 1c) to an assumed density of 6.0 FSR with strata residential above retail in a
high-rise concrete building. As noted above, planning policy is not yet in place to guide redevelopment in
this area. However, other rezonings in the Broadway Corridor and at new transit stations outside

EVALUATION OF LAND VALUE CAPTURE AND URBAN DEVELOPMENT AS SOURCES OF REVENUE FOR TRANSLINK
PAGE 76
Downtown have achieved densities typically in the range of 5.0 to 7.0 FSR so a density of 6.0 FSR was
used for the financial analysis. The pro forma analysis assumes:
a) An allowance for rezoning costs of $500,000.
b) Concrete strata residential unit sales prices of $1,475 per square foot (slightly higher than in the
redevelopment scenario under the existing zoning because the building is taller so the average sales
price is higher to reflect more view units).
c) A capitalized value of $1,190 per square foot for the retail space (based on net retail rents of $50 per
square foot, a 5% vacancy/non-recoverables allowance, and a 4% cap rate).
d) Hard construction costs of $443 per square foot (including $380 per square foot for concrete strata
residential, $260 per square foot for concrete retail, and $65,000 per underground parking stall), plus
allowances for all other typical creation costs (e.g. soft costs, contingency, municipal and regional
levies, development management fee, interim financing) for a total all-in creation cost of $615 per
square foot.
e) No CAC payment (i.e. the City’s Developer Contribution Expectation or DCE in the Broadway
Corridor) because we hold this aside to calculate the total land lift before amenity contributions and
the relative portion of lift attributable to increased density versus enhanced transit accessibility.
5. A residual land value of $50.3 million based on rezoning and redevelopment with enhanced transit access
(see Attachment 1d) to an assumed density of 6.0 FSR with strata residential above retail in a high-rise
concrete building. The pro forma analysis includes all of the same assumptions as in point 4 above (and
as in Attachment 1c), except that concrete strata residential unit sales prices are assumed to be 5%
higher to reflect a premium associated with enhanced transit access (i.e. $1,549 per square foot instead
of $1,475 per square foot).
The results of the analysis for Case Study #1 are shown in the following tables. As shown, the potential
increase in sales prices of 5% for being close to a rapid transit station works out to about $4.9 million of the
total $27.5 million in land lift (holding aside the DCE that would be payable to the City of Vancouver)
associated with the rezoning and redevelopment project (i.e. about 18% of the total land lift).

EVALUATION OF LAND VALUE CAPTURE AND URBAN DEVELOPMENT AS SOURCES OF REVENUE FOR TRANSLINK
PAGE 77
Summary of Financial Analysis for Case Study #1 (Multi-Family Residential Redevelopment - Strata, Broadway Corridor)
Case Study
Type of
Transit
Assumed density in
the rezoning
Strata Residential Sales Prices ($ psf)
Transit Premium Land Value Under Rezoning Without Transit
Without transit
With transit
$ psf %a
$ psfb
Sales price premium as a % of value of extra
density
Case Study #1: C-3A Site in the Broadway Corridor (Strata Residential Redevelopment)
Rapid transit
6.0 FSR $1,475 $1,549 (5%
higher)
$74 5% $398 19% ($74 ÷ $398)
Case Study Existing Value Land Value After Rezoning,
without Transit Premium Land Value After Rezoning, with
Transit
Case Study #1 $22.8 million31 $45.4 million $50.3 million
Land lift from rezoning Land lift from transit
$22.6 million $4.9 million
(82%) (18%)
Case Study #2: Market Rental Multi-family Residential Redevelopment in the
Broadway Corridor
This case study uses the same site as in Case Study #1 but illustrates the economics of a market rental multi-
family project instead of a strata project. The key assumptions about site size, the income-producing value of
the existing building, and residual land value under the existing C-3A zoning are the same. The key
assumptions in the rezoning and redevelopment scenarios are as follows:
1. A residual land value of $13.3 million based on rezoning and redevelopment without enhanced transit
access (see Attachment 2a) to an assumed density of 6.0 FSR with market rental residential above retail
in a high-rise concrete building. The pro forma analysis assumes:
a) An allowance for rezoning costs of $500,000.
b) A capitalized value of about $890 per square foot for the market rental residential space (based on a
mix of studio, 1-bedroom, 2-bedroom, and 3-bedroom units and an overall average rent of $3.73 per
square foot, parking revenues of $100 per month per stall, storage rental revenues of $50 per month,
a 2% vacancy/non-recoverables allowance, and a 4% cap rate).
c) A capitalized value of about $1,190 per square foot for the retail space (based on net retail rents of
$50 per square foot, a 5% vacancy/non-recoverables allowance, and a 4% cap rate).
d) Hard construction costs of $400 per square foot (including $350 per square foot for concrete market
rental residential, $260 per square foot for concrete retail, and $65,000 per underground parking
stall), plus allowances for all other typical creation costs (e.g. soft costs, contingency, municipal and
regional levies, development management fee, interim financing) for a total all-in creation cost of
$560 per square foot.
31 The existing value is based on the residual land value assuming redevelopment under the existing C-3A zoning, which generates a higher value than the income-producing approach based on the existing building.
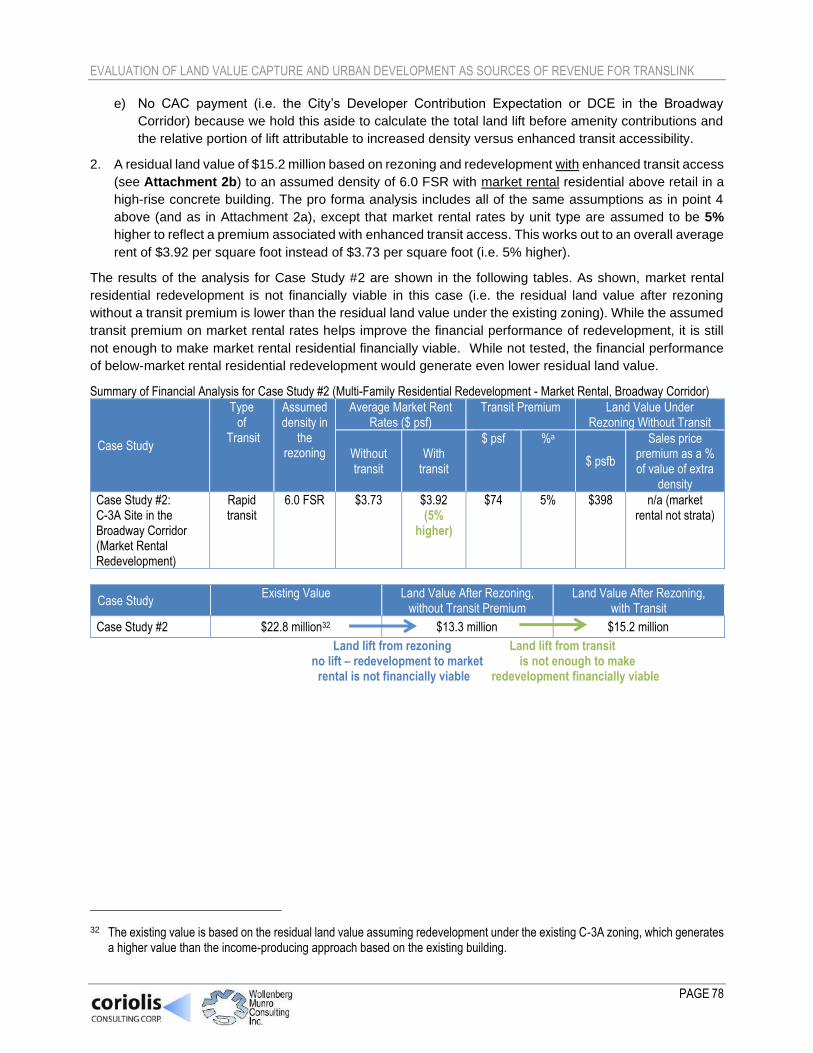
EVALUATION OF LAND VALUE CAPTURE AND URBAN DEVELOPMENT AS SOURCES OF REVENUE FOR TRANSLINK
PAGE 78
e) No CAC payment (i.e. the City’s Developer Contribution Expectation or DCE in the Broadway
Corridor) because we hold this aside to calculate the total land lift before amenity contributions and
the relative portion of lift attributable to increased density versus enhanced transit accessibility.
2. A residual land value of $15.2 million based on rezoning and redevelopment with enhanced transit access
(see Attachment 2b) to an assumed density of 6.0 FSR with market rental residential above retail in a
high-rise concrete building. The pro forma analysis includes all of the same assumptions as in point 4
above (and as in Attachment 2a), except that market rental rates by unit type are assumed to be 5%
higher to reflect a premium associated with enhanced transit access. This works out to an overall average
rent of $3.92 per square foot instead of $3.73 per square foot (i.e. 5% higher).
The results of the analysis for Case Study #2 are shown in the following tables. As shown, market rental
residential redevelopment is not financially viable in this case (i.e. the residual land value after rezoning
without a transit premium is lower than the residual land value under the existing zoning). While the assumed
transit premium on market rental rates helps improve the financial performance of redevelopment, it is still
not enough to make market rental residential financially viable. While not tested, the financial performance
of below-market rental residential redevelopment would generate even lower residual land value.
Summary of Financial Analysis for Case Study #2 (Multi-Family Residential Redevelopment - Market Rental, Broadway Corridor)
Case Study
Type of
Transit
Assumed density in
the rezoning
Average Market Rent Rates ($ psf)
Transit Premium Land Value Under Rezoning Without Transit
Without transit
With transit
$ psf %a
$ psfb
Sales price premium as a % of value of extra
density
Case Study #2: C-3A Site in the Broadway Corridor (Market Rental Redevelopment)
Rapid transit
6.0 FSR $3.73 $3.92 (5%
higher)
$74 5% $398 n/a (market rental not strata)
Case Study Existing Value Land Value After Rezoning,
without Transit Premium Land Value After Rezoning,
with Transit
Case Study #2 $22.8 million32 $13.3 million $15.2 million
Land lift from rezoning Land lift from transit no lift – redevelopment to market is not enough to make rental is not financially viable redevelopment financially viable
32 The existing value is based on the residual land value assuming redevelopment under the existing C-3A zoning, which generates a higher value than the income-producing approach based on the existing building.
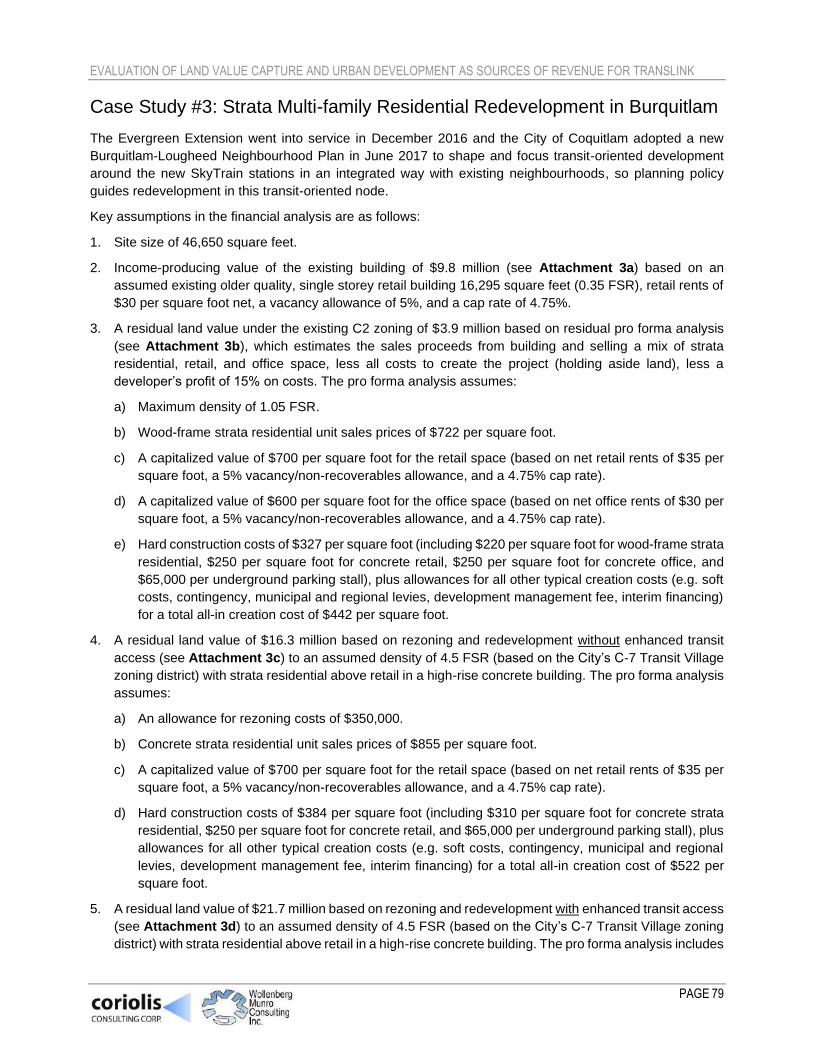
EVALUATION OF LAND VALUE CAPTURE AND URBAN DEVELOPMENT AS SOURCES OF REVENUE FOR TRANSLINK
PAGE 79
Case Study #3: Strata Multi-family Residential Redevelopment in Burquitlam
The Evergreen Extension went into service in December 2016 and the City of Coquitlam adopted a new
Burquitlam-Lougheed Neighbourhood Plan in June 2017 to shape and focus transit-oriented development
around the new SkyTrain stations in an integrated way with existing neighbourhoods, so planning policy
guides redevelopment in this transit-oriented node.
Key assumptions in the financial analysis are as follows:
1. Site size of 46,650 square feet.
2. Income-producing value of the existing building of $9.8 million (see Attachment 3a) based on an
assumed existing older quality, single storey retail building 16,295 square feet (0.35 FSR), retail rents of
$30 per square foot net, a vacancy allowance of 5%, and a cap rate of 4.75%.
3. A residual land value under the existing C2 zoning of $3.9 million based on residual pro forma analysis
(see Attachment 3b), which estimates the sales proceeds from building and selling a mix of strata
residential, retail, and office space, less all costs to create the project (holding aside land), less a
developer’s profit of 15% on costs. The pro forma analysis assumes:
a) Maximum density of 1.05 FSR.
b) Wood-frame strata residential unit sales prices of $722 per square foot.
c) A capitalized value of $700 per square foot for the retail space (based on net retail rents of $35 per
square foot, a 5% vacancy/non-recoverables allowance, and a 4.75% cap rate).
d) A capitalized value of $600 per square foot for the office space (based on net office rents of $30 per
square foot, a 5% vacancy/non-recoverables allowance, and a 4.75% cap rate).
e) Hard construction costs of $327 per square foot (including $220 per square foot for wood-frame strata
residential, $250 per square foot for concrete retail, $250 per square foot for concrete office, and
$65,000 per underground parking stall), plus allowances for all other typical creation costs (e.g. soft
costs, contingency, municipal and regional levies, development management fee, interim financing)
for a total all-in creation cost of $442 per square foot.
4. A residual land value of $16.3 million based on rezoning and redevelopment without enhanced transit
access (see Attachment 3c) to an assumed density of 4.5 FSR (based on the City’s C-7 Transit Village
zoning district) with strata residential above retail in a high-rise concrete building. The pro forma analysis
assumes:
a) An allowance for rezoning costs of $350,000.
b) Concrete strata residential unit sales prices of $855 per square foot.
c) A capitalized value of $700 per square foot for the retail space (based on net retail rents of $35 per
square foot, a 5% vacancy/non-recoverables allowance, and a 4.75% cap rate).
d) Hard construction costs of $384 per square foot (including $310 per square foot for concrete strata
residential, $250 per square foot for concrete retail, and $65,000 per underground parking stall), plus
allowances for all other typical creation costs (e.g. soft costs, contingency, municipal and regional
levies, development management fee, interim financing) for a total all-in creation cost of $522 per
square foot.
5. A residual land value of $21.7 million based on rezoning and redevelopment with enhanced transit access
(see Attachment 3d) to an assumed density of 4.5 FSR (based on the City’s C-7 Transit Village zoning
district) with strata residential above retail in a high-rise concrete building. The pro forma analysis includes

EVALUATION OF LAND VALUE CAPTURE AND URBAN DEVELOPMENT AS SOURCES OF REVENUE FOR TRANSLINK
PAGE 80
all of the same assumptions as in point 4 above (and as in Attachment 3c), except that concrete strata
residential unit sales prices are assumed to be 5% higher to reflect a premium associated with enhanced
transit access (i.e. $900 per square foot instead of $855 per square foot).
The results of the analysis for Case Study #3 are shown in the following tables. As shown, the potential
increase in sales prices of 5% for being close to a rapid transit station works out to about $5.4 million of the
total $11.9 million in land lift associated with the rezoning and redevelopment project (i.e. about 46% of the
total land lift).
Summary of Financial Analysis for Case Study #3 (Multi-Family Residential Redevelopment, Burquitlam)
Case Study
Type of
Transit
Assumed density in
the rezoning
Strata Residential Sales Prices ($ psf)
Transit Premium Land Value Under Rezoning Without Transit
Without transit
With transit
$ psf %a
$ psfb
Sales price premium as a % of value of extra
density
Case Study #3: C2 Site in Burquitlam (Strata Residential Redevelopment)
Rapid transit
4.5 FSR $855 $900 (5%
higher)
$45 5% $78 58% ($45 ÷ $78)
Case Study
Existing Value Land Value After Rezoning, without Transit Premium
Land Value After Rezoning, with Transit
Case Study #3 $9.8 million33 $16.3 million $21.7 million
Land lift from rezoning Land lift from transit $6.5 million $5.4 million (54%) (46%)
Case Study #4: Strata Multi-family Residential Redevelopment in Fleetwood
The Surrey Langley Line is planned to extend rapid transit from King George SkyTrain Station to Langley City
Centre. Planning and business case analysis for this line is currently underway, with funding in place for a
first phase to Fleetwood that is anticipated to be built during 2022 to 2025. The City of Surrey is currently
working on a Fleetwood Plan which will guide redevelopment in the area to encourage transit-oriented
development. While densities and height for transit-oriented redevelopment are not yet defined, we assumed
a density of 4.0 FAR in the rezoning and redevelopment scenarios to match the density that the City was
considering in areas such as Newton and Guildford that were previously planned to have LRT extensions.34
Key assumptions in the financial analysis are as follows:
1. Site size of 37,034 square feet.
2. Income-producing value of the existing building of $3.1 million (see Attachment 4a) based on assumed
existing older quality, single storey retail buildings with 7,200 square feet (0.19 FSR), retail rents of $22.50
per square foot net, a vacancy allowance of 5%, and a cap rate of 5%.
33 The existing value is based on the income-producing value of the existing building, which is higher than the residual land value assuming redevelopment under the existing C2 zoning.
34 We also ran scenarios at 2.5 FAR to match the density envisioned in the existing OCP for this case study site, but redevelopment at 2.5 FAR (or less) does not support sufficient residual land value to make the site a redevelopment candidate (i.e. the income-producing value of the existing use is higher than the residual land value under redevelopment to 2.5 FAR).

EVALUATION OF LAND VALUE CAPTURE AND URBAN DEVELOPMENT AS SOURCES OF REVENUE FOR TRANSLINK
PAGE 81
3. A residual land value under the existing CH1 zoning of $1.7 million based on residual pro forma analysis
(see Attachment 4b), which estimates the sales proceeds from building and selling a mixed retail/office
project, less all costs to create the project (holding aside land), less a developer’s profit of 15% on costs.
The pro forma analysis assumes:
a) Maximum density of 1.0 FSR.
b) An overall value of $525 per square foot buildable based on net retail rents of $30 per square foot,
net office rents of $27.50 per square foot, net parking revenues of $75 per stall per month, operating
costs of $15 per square foot for retail space, operating costs of $10 per square foot for office space,
a 2% vacancy/non-recoverables allowance, a 5% cap rate, and a sales commission of 2%.
c) Hard construction costs of $262 per square foot (including $250 per square foot for concrete retail,
$250 per square foot for concrete office, and $7,500 per at grade parking stall), plus allowances for
all other typical creation costs (e.g. soft costs, contingency, municipal and regional levies, interim
financing) for a total all-in creation cost of $408 per square foot.
4. A residual land value of $0.9 million based on rezoning and redevelopment without enhanced transit
access (see Attachment 4c) to an assumed density of 4.0 FSR (based on densities that the City of
Surrey was considering in areas such as Newton and Guildford that were previously being planned for
LRT extensions) with strata residential above retail in a high-rise concrete building. The pro forma
analysis assumes:
a) An allowance for rezoning costs of $350,000.
b) Concrete strata residential unit sales prices of $760 per square foot.
c) A capitalized value of $686 per square foot for the retail space (based on net retail rents of $35 per
square foot, a 5% vacancy/non-recoverables allowance, and a 5% cap rate).
d) Hard construction costs of $380 per square foot (including $310 per square foot for concrete strata
residential, $250 per square foot for concrete retail, and $45,000 per underground parking stall), plus
allowances for all other typical creation costs (e.g. soft costs, contingency, municipal and regional
levies, development management fee, interim financing) for a total all-in creation cost of $486 per
square foot.
5. A residual land value of $3.8 million based on rezoning and redevelopment with enhanced transit access
(see Attachment 4d) to an assumed density of 4.0 FSR (based on densities that the City of Surrey was
considering in areas such as Newton and Guildford that were previously being planned for LRT
extensions) with strata residential above retail in a high-rise concrete building. The pro forma analysis
includes all of the same assumptions as in point 4 above (and as in Attachment 4c), except that concrete
strata residential unit sales prices are assumed to be 5% higher to reflect a premium associated with
enhanced transit access (i.e. $800 per square foot instead of $760 per square foot).
The results of the analysis for Case Study #4 are shown in the following tables. As shown, redevelopment is
not viable based on current market conditions and an assumed density of 4.0 FAR in the absence of rapid
transit expansion. In this case, the potential increase in sales prices of 5% for being close to a rapid transit
station means that the rezoning and redevelopment is viable (so all of the lift could be attributable to improved
transit access).
EVALUATION OF LAND VALUE CAPTURE AND URBAN DEVELOPMENT AS SOURCES OF REVENUE FOR TRANSLINK
PAGE 82
Summary of Financial Analysis for Case Study #4 (Multi-Family Residential Redevelopment, Fleetwood)
Case Study
Type of
Transit
Assumed density in
the rezoning
Strata Residential Sales Prices ($ psf)
Transit Premium Land Value Under Rezoning Without Transit
Without transit
With transit
$ psf %a
$ psfb
Sales price premium as a % of value of extra
density
Case Study #4: CHI Site in Fleetwood (Strata Residential Redevelopment)
Rapid transit
4.0 FSR $760 $800 (5%
higher)
$40 5% $6 over 100% ($40 ÷ $6)
Case Study
Existing Value Land Value After Rezoning, without Transit Premium
Land Value After Rezoning, with Transit
Case Study #4 $3.1 million35 $0.9 million $3.8 million
Land lift from rezoning Land lift from transit no lift – redevelopment is not makes redevelopment viable financially viable without transit
Case Study #5: Strata Multi-family Residential Redevelopment in Lynn Creek
Lynn Creek Town Centre is one of the neighbourhoods that will experience improved rapid bus transit from
the Marine Drive RapidBus which will connect West Vancouver with Phibbs Exchange. Construction of this
route is underway and expected to be complete in March 2020. The District of North Vancouver’s Lower Lynn
Town Centre planning policies encourage transit-oriented development around frequent transit bus service
in this neighbourhood. This case study assumes an assembly of 4 single family lots in the Lynn Creek Town
Centre. The analysis assumes a density of redevelopment of 2.5 FSR based on municipal policies for the
area.
Key assumptions in the financial analysis are as follows:
1. Site size of 31,140 square feet.
2. Combined existing value of the four existing single family lots of $6.5 million (see Attachment 5a) based
on single family lot values and an assumed assembly premium of 20%.
3. A residual land value of $10.8 million based on rezoning and redevelopment without enhanced transit
access (see Attachment 5b) to an assumed density of 2.5 FSR based on densities for the Lynn Creek
Town Centre, with strata residential in a wood-frame building. The pro forma analysis assumes:
a) An allowance for rezoning costs of $200,000.
b) Wood-frame strata residential unit sales prices of $800 per square foot.
c) Hard construction costs of $301 per square foot (including $230 per square foot for wood-frame strata
residential and $55,000 per underground parking stall), plus allowances for all other typical creation
costs (e.g. soft costs, contingency, municipal and regional levies, development management fee,
interim financing) for a total all-in creation cost of $418 per square foot.
35 The existing value is based on the income-producing value of the existing buildings, which is higher than the residual land value assuming redevelopment under the existing CH1 zoning.

EVALUATION OF LAND VALUE CAPTURE AND URBAN DEVELOPMENT AS SOURCES OF REVENUE FOR TRANSLINK
PAGE 83
4. A residual land value of $11.2 million based on rezoning and redevelopment with enhanced transit access
(see Attachment 5c) to an assumed density of 2.5 FSR based on densities for the Lynn Creek Town
Centre, with strata residential in a wood-frame building. The pro forma analysis includes all of the same
assumptions as in point 4 above (and as in Attachment 5b), except that wood-frame strata residential
unit sales prices are assumed to be 1% higher to reflect a premium associated with enhanced bus rapid
transit access (i.e. $808 per square foot instead of $800 per square foot). We used a lower premium (1%
compared to 5%) for bus rapid transit compared to light rail rapid transit.
The results of the analysis for Case Study #5 are shown in the following tables. As shown, the potential
increase in sales prices of 1% for being close to a bus rapid transit station works out to about $0.4 million of
the total $4.7 million in land lift associated with the rezoning and redevelopment project (i.e. about 8% of the
total land lift).
Summary of Financial Analysis for Case Study #5 (Multi-Family Residential Redevelopment, Lynn Creek)
Case Study
Type of
Transit
Assumed density in
the rezoning
Strata Residential Sales Prices ($ psf)
Transit Premium Land Value Under Rezoning Without Transit
Without transit
With transit
$ psf %a
$ psfb
Sales price premium as a % of value of extra
density
Case Study #5: Single Family Site in Lynn Creek (Strata Residential Redevelopment)
Bus rapid transit
2.5 FSR $800 $800 (1%
higher)
$8 1% $138 6% ($8 ÷ $138)
Case Study
Existing Value Land Value After Rezoning, without Transit Premium
Land Value After Rezoning, with Transit
Case Study #5 $6.5 million $10.8 million $11.2 million
Land lift from rezoning Land lift from transit $4.3 million $0.4 million (92%) (8%)
Case Study #6: Commercial Redevelopment in the Broadway Corridor
The Broadway Subway Project is planned to extend rapid transit from VCC-Clark to Arbutus. Construction on
this line is anticipated to commence in 2020 and be complete with the line in service by 2025. In March 2019,
the City of Vancouver launched the Broadway Plan process, which is intended to develop a 30-year plan to
guide redevelopment in the area in a way that integrates opportunities for new housing, jobs, and amenities
around new rapid transit stations on this line. We selected a case study site in the Uptown Office Precinct
(which applies to properties along Broadway between Cambie and Oak) and assumed a rezoning to 6.0 FSR
based on precedents in the Broadway Corridor and at other transit station locations in Vancouver outside of
Downtown.
Key assumptions in the financial analysis are as follows:
1. Site size of 17,550 square feet.
2. Income-producing value of the existing building of $15.3 million (see Attachment 6a) based on an
assumed existing older quality, mixed use building with 9,310 square feet of retail space, 5,997 square
feet of office space, and 6 rental residential units; retail rents of $40 per square foot net, office rents of
$25 per square foot net, a vacancy/non-recoverables allowance of 5%, a cap rate of 4% for the retail

EVALUATION OF LAND VALUE CAPTURE AND URBAN DEVELOPMENT AS SOURCES OF REVENUE FOR TRANSLINK
PAGE 84
space, a cap rate of 4.5% for the office space, a value of $550,000 per rental residential unit, and an
assumed acquisition premium of 10%.
3. A residual land value under the existing C-3A zoning of $6.8 million based on residual pro forma analysis
(see Attachment 6b), which estimates the sales proceeds from building and selling a mixed retail/office
project (assumes no residential as the site is in the Uptown Office Precinct), less all costs to create the
project (holding aside land), less a developer’s profit of 15% on costs. The pro forma analysis assumes:
a) Maximum density of 3.0 FSR (plus up to a 10% bonus with heritage transfer density) under the
existing C-3A zoning.
b) An overall value of $873 per square foot buildable based on net retail rents of $50 per square foot,
net office rents of $37 per square foot, net parking revenues of $150 per stall per month, operating
costs of $18 per square foot for retail and office space, a 5% vacancy/non-recoverables allowance,
a 4.25% cap rate, and a sales commission of 2%.
c) Hard construction costs of $402 per square foot (including $300 per square foot for concrete retail
and office space and $55,000 per underground parking stall), plus allowances for all other typical
creation costs (e.g. soft costs, contingency, municipal and regional levies, interim financing) for a
total all-in creation cost of $626 per square foot.
4. A residual land value of $11.1 million based on rezoning and redevelopment without enhanced transit
access (see Attachment 6c) to an assumed density of 6.0 FSR with office above retail based on
precedents in the Broadway Corridor and at other transit station locations in Vancouver outside of
Downtown. The pro forma analysis assumes:
a) An allowance for rezoning costs of $250,000.
b) An overall value of $861 per square foot buildable based on net retail rents of $50 per square foot,
net office rents of $37 per square foot, net parking revenues of $150 per stall per month, operating
costs of $18 per square foot for retail and office space, a 5% vacancy/non-recoverables allowance,
a 4.25% cap rate, and a sales commission of 2%.
c) Hard construction costs of $411 per square foot (including $300 per square foot for concrete retail
and office space and $60,000 per underground parking stall which is slightly higher than in
Attachment 6b because the parking includes additional underground levels which is more expensive),
plus allowances for all other typical creation costs (e.g. soft costs, contingency, municipal and
regional levies, interim financing) for a total all-in creation cost of $628 per square foot.
5. A residual land value of $16.9 million based on rezoning and redevelopment with enhanced transit access
(see Attachment 6d) to an assumed density of 6.0 FSR with office above retail based on precedents in
the Broadway Corridor and at other transit station locations in Vancouver outside of Downtown. The pro
forma analysis includes all of the same assumptions as in point 4 above (and as in Attachment 6c), except
that office lease rates are assumed to be 10% higher to reflect a premium associated with enhanced
rapid transit access (i.e. $40.70 per square foot net instead of $37 per square foot).
The results of the analysis for Case Study #6 are shown in the following table. As shown, redevelopment with
office above retail is not viable based on current market conditions and an assumed density of 6.0 FAR in the
absence of rapid transit expansion. In this case, the potential increase in office lease rates of 10% for being
close to a rapid transit station means that the rezoning and redevelopment is viable (so all of the lift could be
attributable to improved transit access).

EVALUATION OF LAND VALUE CAPTURE AND URBAN DEVELOPMENT AS SOURCES OF REVENUE FOR TRANSLINK
PAGE 85
Summary of Financial Analysis for Case Study #6 (Commercial Redevelopment, Broadway Corridor)
Case Study
Type of
Transit
Assumed density in
the rezoning
Office Lease Rates ($ psf net)
Existing Value Land Value After Rezoning, without Transit Premium
Land Value After Rezoning, with
Transit Without transit
With transit
Case Study #6: C-3A Site, Broadway Corridor (Commercial Redevelopment)
Rapid transit
6.0 FSR $37.00 $40.70 (10%
higher)
$15.3 million36 $11.2 million $16.9 million
Land lift from rezoning Land lift from transit n/a (redevelopment makes redevelopment is not financially viable) financially viable
Case Study #7: Commercial Redevelopment in Surrey City Centre
The City of Surrey’s City Centre Plan envisions redevelopment of low density properties near rapid transit
stations with higher density redevelopment. We selected a site occupied by low density, older retail space at
grade that is currently zoned C-8 but designated for 3.5 FAR in the Surrey City Centre Plan (which was
adopted January 2017 in part to help encourage transit-oriented development). The 3.5 FAR could be used
for strata residential or office redevelopment, so we show the relative value of strata residential development
at this density for comparison.
Key assumptions in the financial analysis are as follows:
1. Site size of 86,986 square feet.
2. Income-producing value of the existing buildings of $10.7 million (see Attachment 7a) based on assumed
existing older quality, retail buildings with a total of 15,731 square feet of retail space, retail rents of $32.50
per square foot net, a vacancy/non-recoverables allowance of 5%, a cap rate of 5%, and an assumed
acquisition premium of 10%.
3. A residual land value of $12.3 million (see Attachment 7b) based on strata multi-family residential
development above retail at an assumed density of 3.5 FSR. The pro forma analysis assumes:
a) An allowance for rezoning costs of $250,000.
b) Concrete strata residential sales prices of $798 per square foot.
c) A capitalized value of $855 per square foot for the retail space (based on net retail rents of $45 per
square foot, a 5% vacancy/non-recoverables allowance, and a 5% cap rate).
d) Hard construction costs of $377 per square foot (including $310 per square foot for concrete strata
residential, $250 per square foot for concrete retail, and $60,000 per underground parking stall), plus
allowances for all other typical creation costs (e.g. soft costs, contingency, municipal and regional
levies, interim financing) for a total all-in creation cost of $476 per square foot.
36 The existing value is based on the income-producing value of the existing building, which is higher than the residual land value assuming commercial-only redevelopment under the existing C-3A zoning.

EVALUATION OF LAND VALUE CAPTURE AND URBAN DEVELOPMENT AS SOURCES OF REVENUE FOR TRANSLINK
PAGE 86
4. A residual land value of -$5.0 million (i.e. not viable) based on rezoning and redevelopment with office
above retail without transit access (see Attachment 7c) to an assumed density of 3.5 FSR. The pro
forma analysis assumes:
a) An allowance for rezoning costs of $250,000.
b) An overall value of $598 per square foot buildable based on net retail rents of $45 per square foot,
net office rents of $28 per square foot, net parking revenues of $150 per stall per month, operating
costs of $18 per square foot for retail and office space, a 5% vacancy/non-recoverables allowance,
a 4.75% cap rate, and a sales commission of 2%.
c) Hard construction costs of $352 per square foot (including $280 per square foot for concrete retail
and office space and $55,000 per underground parking stall), plus allowances for all other typical
creation costs (e.g. soft costs, contingency, municipal and regional levies, interim financing) for a
total all-in creation cost of $537 per square foot.
5. A residual land value of $6.6 million based on rezoning and redevelopment with transit access (see
Attachment 7d) to an assumed density of 3.5 FSR with office above retail. The pro forma analysis
includes all of the same assumptions as in point 4 above (and as in Attachment 7c), except that office
lease rates are assumed to be 10% higher to reflect a premium associated with enhanced rapid transit
access (i.e. $31 per square foot net instead of $28 per square foot).
The results of the analysis for Case Study #7 are shown in the following table. As shown, redevelopment with
office above retail is not viable based on current market conditions and an assumed density of 3.5 FAR. The
site is more valuable in its existing use or as a strata multi-family residential development site.
Summary of Financial Analysis for Case Study #7 (Commercial Redevelopment, Surrey City Centre)
Case Study
Type of
Transit
Assumed density in
the rezoning
Office Lease Rates ($ psf net)
Existing Value Land Value After Rezoning, without Transit Premium
Land Value After Rezoning, with
Transit Without transit
With transit
Case Study #7: Office Project in Surrey City Centre
Rapid transit
3.5 FSR $28 $31 (10%
higher)
$10.7 million based on existing use; $12.3 million
as strata residential
redevelopment site
-$5.0 million $6.6 million
Land lift from rezoning Land lift from transit n/a (office redevelopment n/a (office redevelopment is not financially viable) is still not financially viable)

EVALUATION OF LAND VALUE CAPTURE AND URBAN DEVELOPMENT AS SOURCES OF REVENUE FOR TRANSLINK
PAGE 87
A.4 Summary of Case Studies and Implications for TransLink
The results of the case study analysis are summarized in the following table. The case studies suggest the
following main points:
• Rapid transit investment is responsible for a significant share of the gains in strata multi-family residential
land value in transit-oriented areas. The dollar value gain in land value varies considerably around the
region, but it appears that rapid transit investment can create 20% (or more) of the gain in land value
from a combination of upzoning and transit investment. The share of land value gain created by transit
investment is higher in areas with lower land values, reaching over 40% in some cases. This lends
support for engaging with municipalities about the possibility of CAC revenue sharing from strata multi-
family residential rezonings near rapid transit stations.
• Without the premium associated with rapid transit, office development is not financially viable in many
suburban locations in the region.
• With rapid transit, high density office development is financially viable in some locations, but the lift in
land value from rezoning and transit is marginal so the ability to charge a CAC is negligible (and
municipalities typically do not charge CACs on office development).
Roll Up Summary of Financial Analysis for Case Studies
Case Study
Type of
Transit
Existing value Land Value After
Rezoning, without Transit
Premium
Land Value After
Rezoning, with Transit
Land Lift
From rezoning
From transit
Total
#1: Strata multi-family project, Broadway Corridor
Rapid transit
$22.8 million $45.4 million $50.3 million $22.6 million (82%)
$4.9 million (18%)
$27.5 million
#2: Market rental residential project, Broadway Corridor
Rapid transit
$22.8 million $13.3 million $15.2 million not financially viable
not financially viable
not financially viable
#3: Strata multi-family project, Burquitlam
Rapid transit
$9.8 million $16.3 million $21.7 million $6.5 million (54%)
$5.4 million (46%)
$11.9 million
#4: Strata multi-family project, Fleetwood
Rapid transit
$3.1 million $0.9 million $3.8 million not financially
viable
transit premium
makes project financially
viable
$0.7 million
#5: Strata multi-family project, Lynn Creek
Bus Rapid transit
$6.5 million $10.8 million $11.2 million $4.3 million (92%)
$0.4 million (8%)
$4.7 million
#6: Office project, Broadway Corridor
Rapid transit
$15.3 million $11.2 million $16.9 million not financially viable
transit premium
makes project financially
viable
$1.6 million
#7: Office project, Surrey City Centre
Rapid transit
$10.7 million based on existing use;
$12.3 million as a strata residential
redevelopment site
-$5.0 million $6.6 million not financially viable
not financially viable
not financially viable
EVALUATION OF LAND VALUE CAPTURE AND URBAN DEVELOPMENT AS SOURCES OF REVENUE FOR TRANSLINK
PAGE 88
A.5 Attachments (Pro Formas)

EVALUATION OF LAND VALUE CAPTURE AND URBAN DEVELOPMENT AS SOURCES OF REVENUE FOR TRANSLINK
PAGE 89
Attachment 1a
Attachment 1a
Case Study #1: Site on West Broadway
Estimated Existing Value based on Income Potential
Major AssumptionsSite and Building Size
Site Size 18,750 sq.ft. or
Assumed Existing Density 0.44 FSR
Total Commercial Space 8,173 sq.ft.
Office 0 sq.ft. with 95% rentable
Retail 8,173 sq.ft. 100% rentable
Revenue and Value
Average Lease Rate for Office Space $20.00 per sq.ft. net, base building with no TI
Average Lease Rate for Retail Space $40.00 per sq.ft. net, base building
Vacancy and Non Recoverables 5.0%
Capitalization Rate 4.00%
Value of Office Space $500.00
Value of Retail and Service Space $1,000 per sq.ft. of leasable area
Estimated Overall Value
Capitalized Value of Office Space $0
Capitalized Value of Retail/Service Space $7,764,350
Total Value of Commercial $7,764,350

EVALUATION OF LAND VALUE CAPTURE AND URBAN DEVELOPMENT AS SOURCES OF REVENUE FOR TRANSLINK
PAGE 90
Attachment 1b
(continues on following page)
Attachment 1b
Case Study #1: Site on West Broadway
Estimated Residual Land Value based on Existing C-3A Zoning (strata) (3.3 FSR)
Major Assumptions (shading indicates figures that are inputs; unshaded cells are formulas)
Site Size 18,750 sq.ft. which equals 0.43 acres
150 feet of frontage
Existing Base Density 3.00 FSR
Increased Density 1 0.30 FSR
Increased Density 2 0.00 FSR
Density with Bonuses 3.30 FSR
Assumed Commercial Density 0.50 FSR
Residential Density Before Exclusions 2.80 FSR
Enclosed Balconies 0.00 0% of residential
Storage 39.8 sf per unit
Effective Residential Density After Bonuses and Exclusions 2.80 FSR
Total Effective Gross Density After Bonuses and Exclusions 3.30 FSR
Total Gross Floorspace 61,875 sf
Concept Gross SF Efficiency
Net Saleable
or Rentable Avg Unit Size
Number of
Units
Parking Stalls
per Unit or
1000 sf
Parking
Stalls
Strata Residential 52,500 85% 44,625 783 57 1.1 63
Market Rental 0 85% 0 616 0 0.6 0
Below Market Rental 0 85% 0 664 0 0.6 0
Social Housing 0 85% 0 706 0 0.5 0
Retail 9,375 100% 9,375 n/a n/a 14
Office 0 95% 0 n/a n/a 0
Total 61,875 54,000 57 77
Revenue/Value
Strata Residential $1,450 per net square foot
Market Rental $0 per net square foot (see separate calculations)
Below Market Rental $0 per net square foot (see separate calculations)
Social Housing $0 per net square foot (see separate calculations)
Retail* $1,188 per net square foot including parking revenue (see separate calculations)
Office $0 per net square foot including parking revenue (see separate calculations)
Pre Construction Costs
Upfront Compensation to Existing Tenants $0
Tenant Relocation $0
Allowance for Demolition of Existing Buildings $163,460 or $20 per sq. ft. of existing building
Allowance for Remediation $0
Site Preparation/Fill $0
On and Off-Site Servicing $160,061 $3,500 per lineal metre of frontage
Density Bonus Contribution $86 psf of bonus density
Rezoning Costs $0
Construction Costs
Hard Construction Costs
Market Strata Residential Area $380 per gross sq.ft. of residential area
Market Rental Residential Area $350 per gross sq.ft. of rental residential area
Below Market Residential Area $350 per gross sq.ft. of rental residential area
Social Housing Residential Area $350 per gross sq.ft. of rental residential area
Retail Area (shell space - no TI) $260 per gross sq.ft. of retail area
Office Area (shell space - no TI) $260 per gross sq.ft. of commercial area
Cost Per Garage/Underground Parking Stall $65,000 per underground/structured parking stall
Overall Costs Per Square Foot $443 per gross sq.ft.
Sustainability Premium 0%
Total Estimated Cost per Square Foot $443
Hard Cost Used in Analysis $443
Site Landscaping $0 or $0 psf of site area on 50% of site
Public Art Contribution $0.00 per sq. ft.
Soft costs and Professional Fees 8.0% of hard costs, landscaping and site prep/servicing costs
Development management 3.0% of hard costs, landscaping and site prep/servicing costs and soft costs
Fees, legal and survey for rental portion $0
Contingency on hard and soft costs 5.0% of hard, soft and management costs
Government Levies
GVS & DD Sewer Levy - Strata Apartment $1,072 per apartment unit
GVS & DD Sewer Levy - Rental Residential $1,072 per unit
GVS & DD Sewer Levy - Commercial $0.93 per sq.ft. of commercial space
TransLink - Strata Apartment Residential $1,200 per market unit
TransLink - Rental Residential $1,200 per unit
TransLink - Commercial $1.25 per sq.ft. of commercial space
Market Strata Apartment DCLs $28.26 per sq.ft. of floorspace
Market Rental DCLs $28.26 per sq.ft. of floorspace
Below Market Rental DCLs $0.00 per sq.ft. of floorspace
Social Housing DCLs $0.00 per sq.ft. of floorspace
Retail DCLs $20.64 per sq.ft. of floorspace
Office DCLs $20.64 per sq.ft. of floorspace
School Site Acquisition Charge $0 per unit

EVALUATION OF LAND VALUE CAPTURE AND URBAN DEVELOPMENT AS SOURCES OF REVENUE FOR TRANSLINK
PAGE 91
Attachment 1b – continued
(continues on following page)
Financing
Interim financing 5.0% assuming a 2.00 year construction period
Financing charged on 50% of land and 75% of construction costs
Financing fees 1.25%
Commissions and Marketing
Commissions on Strata Residential 3.0% of gross strata market residential revenue
Marketing on Strata Residential 2.0% of gross strata market residential revenue
Commissions on Sale of Commercial 2.0% of gross commercial value
Commission on Sale of Rental Units 2.0% of value
Initial Lease Up Costs on Market Rental Units $3,500 per unit
Initial Lease Up Costs on Below Market Rental Units $0 per unit
Initial Lease Up Costs on Social Housing Units $0 per unit
Leasing Commissions on Commercial Space $5.00 per sq.ft.
Tenant Improvement Allowance on Retail Space $0.00 per sq.ft.
Tenant Improvement Allowance on Office Space $0.00 per sq.ft.
Other Costs and Allowances
Net GST on Market Rental Units 5.00% of capitalized value of rental units
Net GST on Below Market Rental Units 0.00% of capitalized value of rental units
Net GST on Social Housing Units 0.00% of development cost of new units (assumes rebate)
Property Taxes 0.247% of assessed value
Assumed current assessment (Year 1 of analysis) $31,545,900
Assumed assessment after 1 year of construction (Year 2 of analysis) $37,919,531 (50% of completed project value)
Developer's Profit 15.0% of total costs or 13.0% of gross market revenue/value
School Tax Surcharge During Development*
Tax Rate 0.2% between $3.0-$4.0 million, and 0.4% over $4.0 million
Residential Portion of current assessment (Year 1 of analysis) $31,545,900
Assumed residential portion of assessment after 1 year of construction $32,353,125 (50% of completed residential project value)
*Assumes BC Owner
*Retail Value Assumptions
Lease Rate NNN $50.00 psf per year
Monthly Parking Revenue (net of costs) $0 per month
Vacancy and Non Recoverable Allowance 5.00%
Capitalization Rate 4.00%
Capitalized Value per 1000 SF Gross
Rental Rev $468,750
Parking $0
Total $468,750
Vacancy $23,438
NOI $445,313
Capitalized Value $11,132,813
Value psf of net leasable space $1,187.50 psf

EVALUATION OF LAND VALUE CAPTURE AND URBAN DEVELOPMENT AS SOURCES OF REVENUE FOR TRANSLINK
PAGE 92
Attachment 1b – continued
Analysis
Revenue
Strata Sales Revenue $64,706,250
Market Rental Revenue $0
Below Market Rental Revenue $0
Social Housing Units Revenue $0
Gross Retail Value $11,132,813
Gross Office Value $0
Total Gross Value $75,839,063
Less Commissions on Strata $1,941,188
Less Commissions on Rental $0
Less Commissions on Commercial $222,656
Net Sales Revenue/Value $73,675,219
Project Costs
Upfront Compensation to Existing Tenants $0
Tenant Relocation $0
Allowance for Demolition of Existing Buildings $163,460
Allowance for Remediation $0
Site Preparation/Fill $0
On and Off-Site Servicing $160,061
Density Bonus Contribution $483,386
Rezoning Costs $0
Hard Construction Costs $27,392,500
Site Landscaping $0
Public Art Contribution $0
Soft costs and Professional Fees $2,255,953
Development management $913,661
Fees, legal and survey for rental portion $0
Contingency on hard and soft costs $1,568,451
Marketing on Strata Units $1,294,125
Initial Lease Up Costs on Market Rental Units $0
Initial Lease Up Costs on Below Market Rental Units $0
Initial Lease Up Costs on Social Rental Units $0
Leasing Commissions on Commercial Space $46,875
Tenant Improvement Allowance on Retail Space $0
Tenant Improvement Allowance on Office Space $0
GVS & DD Sewer Levy - Strata Apartment $61,104
GVS & DD Sewer Levy - Rental Residential $0
GVS & DD Sewer Levy - Commercial $8,719
TransLink - Strata Apartment Residential $68,400
TransLink - Rental Residential $0
TransLink - Commercial $11,719
Market Strata Apartment DCLs $1,483,650
Market Rental DCLs $0
Below Market Rental DCLs $0
Social Housing DCLs $0
Retail DCLs $193,500
Office DCLs $0
School Site Acquisition Charge $0
Less property tax allowance during approvals/development $210,390
Less School Tax Surcharge During Development $283,688
Interim financing on construction costs $1,361,848
Financing fees/costs $355,889
Less Net GST (assuming builder holds units) $0
Total Project Costs Before Land $38,317,378 which works out to $619 psf of gross floor area
Developer's Profit $9,889,414
Residual to Land and Land Carry $25,468,427
Less financing on land during construction and approvals $1,416,681
Less financing fee on land loan $135,291
Less property closing costs $1,061,532
Residual Land Value $22,854,923
Residual Value per sq.ft. of site $1,219
Residual Value per sq.ft. of FSR $406
Residual Value per sq.ft. of gross buildable floorspace $369

EVALUATION OF LAND VALUE CAPTURE AND URBAN DEVELOPMENT AS SOURCES OF REVENUE FOR TRANSLINK
PAGE 93
Attachment 1c
(continues on following page)
Attachment 1c
Case Study #1: Site on West Broadway
Estimated Residual Land Value based on Rezoning to Mixed-Use Concrete at 6.0 FSR (strata) (rezoning only; no rapid transit premium)
Major Assumptions (shading indicates figures that are inputs; unshaded cells are formulas)
Site Size 18,750 sq.ft. which equals 0.43 acres
150 feet of frontage
Existing Base Density 3.00 FSR
Increased Density 1 0.00 FSR
Increased Density 2 3.00 FSR
Density with Bonuses 6.00 FSR
Assumed Commercial Density 0.50 FSR
Residential Density Before Exclusions 5.50 FSR
Enclosed Balconies 0.00 0% of residential
Storage 0.22 39.8 sf per unit
Effective Residential Density After Bonuses and Exclusions 5.72 FSR
Total Effective Gross Density After Bonuses and Exclusions 6.22 FSR
Total Gross Floorspace 116,682 sf
Concept Gross SF Efficiency
Net Saleable
or Rentable Avg Unit Size
Number of
Units
Parking Stalls
per Unit or
1000 sf
Parking
Stalls
Strata Residential 107,307 85% 91,211 869 105 1.1 116
Market Rental 0 85% 0 616 0 0.6 0
Below Market Rental 0 85% 0 664 0 0.6 0
Social Housing 0 85% 0 706 0 0.5 0
Retail 9,375 100% 9,375 n/a n/a 14
Office 0 95% 0 n/a n/a 0
Total 116,682 100,586 105 130
Revenue/Value
Strata Residential $1,475 per net square foot
Market Rental $0 per net square foot (see separate calculations)
Below Market Rental $0 per net square foot (see separate calculations)
Social Housing $0 per net square foot (see separate calculations)
Retail* $1,188 per net square foot including parking revenue (see separate calculations)
Office $0 per net square foot including parking revenue (see separate calculations)
Pre Construction Costs
Upfront Compensation to Existing Tenants $0
Tenant Relocation $0
Allowance for Demolition of Existing Buildings $163,460 or $20 per sq. ft. of existing building
Allowance for Remediation $0
Site Preparation/Fill $0
On and Off-Site Servicing $160,061 $3,500 per lineal metre of frontage
Density Bonus Contribution $0 psf of bonus density
Rezoning Costs $500,000
Construction Costs
Hard Construction Costs
Market Strata Residential Area $380 per gross sq.ft. of residential area
Market Rental Residential Area $350 per gross sq.ft. of rental residential area
Below Market Residential Area $350 per gross sq.ft. of rental residential area
Social Housing Residential Area $350 per gross sq.ft. of rental residential area
Retail Area (shell space - no TI) $260 per gross sq.ft. of retail area
Office Area (shell space - no TI) $260 per gross sq.ft. of commercial area
Cost Per Garage/Underground Parking Stall $65,000 per underground/structured parking stall
Overall Costs Per Square Foot $443 per gross sq.ft.
Sustainability Premium 0%
Total Estimated Cost per Square Foot $443
Hard Cost Used in Analysis $443
Site Landscaping $0 or $0 psf of site area on 50% of site
Public Art Contribution $1.98 per sq. ft.
Soft costs and Professional Fees 8.0% of hard costs, landscaping and site prep/servicing costs
Development management 3.0% of hard costs, landscaping and site prep/servicing costs and soft costs
Fees, legal and survey for rental portion $0
Contingency on hard and soft costs 5.0% of hard, soft and management costs
Government Levies
GVS & DD Sewer Levy - Strata Apartment $1,072 per apartment unit
GVS & DD Sewer Levy - Rental Residential $1,072 per unit
GVS & DD Sewer Levy - Commercial $0.93 per sq.ft. of commercial space
TransLink - Strata Apartment Residential $1,200 per market unit
TransLink - Rental Residential $1,200 per unit
TransLink - Commercial $1.25 per sq.ft. of commercial space
Market Strata Apartment DCLs $28.26 per sq.ft. of floorspace
Market Rental DCLs $28.26 per sq.ft. of floorspace
Below Market Rental DCLs $0.00 per sq.ft. of floorspace
Social Housing DCLs $0.00 per sq.ft. of floorspace
Retail DCLs $20.64 per sq.ft. of floorspace
Office DCLs $20.64 per sq.ft. of floorspace
School Site Acquisition Charge $0 per unit

EVALUATION OF LAND VALUE CAPTURE AND URBAN DEVELOPMENT AS SOURCES OF REVENUE FOR TRANSLINK
PAGE 94
Attachment 1c – continued
(continues on following page)
Financing
Interim financing 5.0% assuming a 2.00 year construction period
Financing charged on 50% of land and 75% of construction costs
Financing fees 1.25%
Commissions and Marketing
Commissions on Strata Residential 3.0% of gross strata market residential revenue
Marketing on Strata Residential 2.0% of gross strata market residential revenue
Commissions on Sale of Commercial 2.0% of gross commercial value
Commission on Sale of Rental Units 2.0% of value
Initial Lease Up Costs on Market Rental Units $3,500 per unit
Initial Lease Up Costs on Below Market Rental Units $0 per unit
Initial Lease Up Costs on Social Housing Units $0 per unit
Leasing Commissions on Commercial Space $5.00 per sq.ft.
Tenant Improvement Allowance on Retail Space $0.00 per sq.ft.
Tenant Improvement Allowance on Office Space $0.00 per sq.ft.
Other Costs and Allowances
Net GST on Market Rental Units 5.00% of capitalized value of rental units
Net GST on Below Market Rental Units 0.00% of capitalized value of rental units
Net GST on Social Housing Units 0.00% of development cost of new units (assumes rebate)
Property Taxes 0.247% of assessed value
Assumed current assessment (Year 1 of analysis) $31,545,900
Assumed assessment after 1 year of construction (Year 2 of analysis) $72,834,429 (50% of completed project value)
Developer's Profit 15.0% of total costs or 13.0% of gross market revenue/value
School Tax Surcharge During Development*
Tax Rate 0.2% between $3.0-$4.0 million, and0.4% over $4.0 million
Residential Portion of current assessment (Year 1 of analysis) $31,545,900
Assumed residential portion of assessment after 1 year of construction $67,268,023 (50% of completed residential project value)
*Assumes BC Owner
*Retail Value Assumptions
Lease Rate NNN $50.00 psf per year
Monthly Parking Revenue (net of costs) $0 per month
Vacancy and Non Recoverable Allowance 5.00%
Capitalization Rate 4.00%
Capitalized Value per 1000 SF Gross
Rental Rev $468,750
Parking $0
Total $468,750
Vacancy $23,438
NOI $445,313
Capitalized Value $11,132,813
Value psf of net leasable space $1,187.50 psf

EVALUATION OF LAND VALUE CAPTURE AND URBAN DEVELOPMENT AS SOURCES OF REVENUE FOR TRANSLINK
PAGE 95
Attachment 1c – continued
Analysis
Revenue
Strata Sales Revenue $134,536,046
Market Rental Revenue $0
Below Market Rental Revenue $0
Social Housing Units Revenue $0
Gross Retail Value $11,132,813
Gross Office Value $0
Total Gross Value $145,668,858
Less Commissions on Strata $4,036,081
Less Commissions on Rental $0
Less Commissions on Commercial $222,656
Net Sales Revenue/Value $141,410,121
Project Costs
Upfront Compensation to Existing Tenants $0
Tenant Relocation $0
Allowance for Demolition of Existing Buildings $163,460
Allowance for Remediation $0
Site Preparation/Fill $0
On and Off-Site Servicing $160,061
Density Bonus Contribution $0
Rezoning Costs $500,000
Hard Construction Costs $51,664,128
Site Landscaping $0
Public Art Contribution $231,030
Soft costs and Professional Fees $4,217,494
Development management $1,708,085
Fees, legal and survey for rental portion $0
Contingency on hard and soft costs $2,932,213
Marketing on Strata Units $2,690,721
Initial Lease Up Costs on Market Rental Units $0
Initial Lease Up Costs on Below Market Rental Units $0
Initial Lease Up Costs on Social Rental Units $0
Leasing Commissions on Commercial Space $46,875
Tenant Improvement Allowance on Retail Space $0
Tenant Improvement Allowance on Office Space $0
GVS & DD Sewer Levy - Strata Apartment $112,560
GVS & DD Sewer Levy - Rental Residential $0
GVS & DD Sewer Levy - Commercial $8,719
TransLink - Strata Apartment Residential $126,000
TransLink - Rental Residential $0
TransLink - Commercial $11,719
Market Strata Apartment DCLs $3,032,493
Market Rental DCLs $0
Below Market Rental DCLs $0
Social Housing DCLs $0
Retail DCLs $193,500
Office DCLs $0
School Site Acquisition Charge $0
Less property tax allowance during approvals/development $296,570
Less School Tax Surcharge During Development $423,347
Interim financing on construction costs $2,553,586
Financing fees/costs $666,305
Less Net GST (assuming builder holds units) $0
Total Project Costs Before Land $71,738,867 which works out to $615 psf of gross floor area
Developer's Profit $18,995,219
Residual to Land and Land Carry $50,676,035
Less financing on land during construction and approvals $2,818,854
Less financing fee on land loan $269,197
Less property closing costs $2,185,929
Residual Land Value $45,402,054
Residual Value per sq.ft. of site $2,421
Residual Value per sq.ft. of FSR $404
Residual Value per sq.ft. of gross buildable floorspace $389

EVALUATION OF LAND VALUE CAPTURE AND URBAN DEVELOPMENT AS SOURCES OF REVENUE FOR TRANSLINK
PAGE 96
Attachment 1d
(continues on following page)
Attachment 1d
Case Study #1: Site on West Broadway
Estimated Residual Land Value based on Rezoning to Mixed-Use Concrete at 6.0 FSR (strata) (rezoning only; with rapid transit premium)
Major Assumptions (shading indicates figures that are inputs; unshaded cells are formulas)
Site Size 18,750 sq.ft. which equals 0.43 acres
150 feet of frontage
Existing Base Density 3.00 FSR
Increased Density 1 0.00 FSR
Increased Density 2 3.00 FSR
Density with Bonuses 6.00 FSR
Assumed Commercial Density 0.50 FSR
Residential Density Before Exclusions 5.50 FSR
Enclosed Balconies 0.00 0% of residential
Storage 0.22 39.8 sf per unit
Effective Residential Density After Bonuses and Exclusions 5.72 FSR
Total Effective Gross Density After Bonuses and Exclusions 6.22 FSR
Total Gross Floorspace 116,682 sf
Concept Gross SF Efficiency
Net Saleable
or Rentable Avg Unit Size
Number of
Units
Parking Stalls
per Unit or
1000 sf
Parking
Stalls
Strata Residential 107,307 85% 91,211 869 105 1.1 116
Market Rental 0 85% 0 616 0 0.6 0
Below Market Rental 0 85% 0 664 0 0.6 0
Social Housing 0 85% 0 706 0 0.5 0
Retail 9,375 100% 9,375 n/a n/a 14
Office 0 95% 0 n/a n/a 0
Total 116,682 100,586 105 130
Revenue/Value
Strata Residential $1,549 per net square foot
Market Rental $0 per net square foot (see separate calculations)
Below Market Rental $0 per net square foot (see separate calculations)
Social Housing $0 per net square foot (see separate calculations)
Retail* $1,188 per net square foot including parking revenue (see separate calculations)
Office $0 per net square foot including parking revenue (see separate calculations)
Pre Construction Costs
Upfront Compensation to Existing Tenants $0
Tenant Relocation $0
Allowance for Demolition of Existing Buildings $163,460 or $20 per sq. ft. of existing building
Allowance for Remediation $0
Site Preparation/Fill $0
On and Off-Site Servicing $160,061 $3,500 per lineal metre of frontage
Density Bonus Contribution $0 psf of bonus density
Rezoning Costs $500,000
Construction Costs
Hard Construction Costs
Market Strata Residential Area $380 per gross sq.ft. of residential area
Market Rental Residential Area $350 per gross sq.ft. of rental residential area
Below Market Residential Area $350 per gross sq.ft. of rental residential area
Social Housing Residential Area $350 per gross sq.ft. of rental residential area
Retail Area (shell space - no TI) $260 per gross sq.ft. of retail area
Office Area (shell space - no TI) $260 per gross sq.ft. of commercial area
Cost Per Garage/Underground Parking Stall $65,000 per underground/structured parking stall
Overall Costs Per Square Foot $443 per gross sq.ft.
Sustainability Premium 0%
Total Estimated Cost per Square Foot $443
Hard Cost Used in Analysis $443
Site Landscaping $0 or $0 psf of site area on 50% of site
Public Art Contribution $1.98 per sq. ft.
Soft costs and Professional Fees 8.0% of hard costs, landscaping and site prep/servicing costs
Development management 3.0% of hard costs, landscaping and site prep/servicing costs and soft costs
Fees, legal and survey for rental portion $0
Contingency on hard and soft costs 5.0% of hard, soft and management costs
Government Levies
GVS & DD Sewer Levy - Strata Apartment $1,072 per apartment unit
GVS & DD Sewer Levy - Rental Residential $1,072 per unit
GVS & DD Sewer Levy - Commercial $0.93 per sq.ft. of commercial space
TransLink - Strata Apartment Residential $1,200 per market unit
TransLink - Rental Residential $1,200 per unit
TransLink - Commercial $1.25 per sq.ft. of commercial space
Market Strata Apartment DCLs $28.26 per sq.ft. of floorspace
Market Rental DCLs $28.26 per sq.ft. of floorspace
Below Market Rental DCLs $0.00 per sq.ft. of floorspace
Social Housing DCLs $0.00 per sq.ft. of floorspace
Retail DCLs $20.64 per sq.ft. of floorspace
Office DCLs $20.64 per sq.ft. of floorspace
School Site Acquisition Charge $0 per unit

EVALUATION OF LAND VALUE CAPTURE AND URBAN DEVELOPMENT AS SOURCES OF REVENUE FOR TRANSLINK
PAGE 97
Attachment 1d – continued
(continues on following page)
Financing
Interim financing 5.0% assuming a 2.00 year construction period
Financing charged on 50% of land and 75% of construction costs
Financing fees 1.25%
Commissions and Marketing
Commissions on Strata Residential 3.0% of gross strata market residential revenue
Marketing on Strata Residential 2.0% of gross strata market residential revenue
Commissions on Sale of Commercial 2.0% of gross commercial value
Commission on Sale of Rental Units 2.0% of value
Initial Lease Up Costs on Market Rental Units $3,500 per unit
Initial Lease Up Costs on Below Market Rental Units $0 per unit
Initial Lease Up Costs on Social Housing Units $0 per unit
Leasing Commissions on Commercial Space $5.00 per sq.ft.
Tenant Improvement Allowance on Retail Space $0.00 per sq.ft.
Tenant Improvement Allowance on Office Space $0.00 per sq.ft.
Other Costs and Allowances
Net GST on Market Rental Units 5.00% of capitalized value of rental units
Net GST on Below Market Rental Units 0.00% of capitalized value of rental units
Net GST on Social Housing Units 0.00% of development cost of new units (assumes rebate)
Property Taxes 0.247% of assessed value
Assumed current assessment (Year 1 of analysis) $31,545,900
Assumed assessment after 1 year of construction (Year 2 of analysis) $76,197,830 (50% of completed project value)
Developer's Profit 15.0% of total costs or 13.0% of gross market revenue/value
School Tax Surcharge During Development*
Tax Rate 0.2% between $3.0-$4.0 million, and0.4% over $4.0 million
Residential Portion of current assessment (Year 1 of analysis) $31,545,900
Assumed residential portion of assessment after 1 year of construction $70,631,424 (50% of completed residential project value)
*Assumes BC Owner
*Retail Value Assumptions
Lease Rate NNN $50.00 psf per year
Monthly Parking Revenue (net of costs) $0 per month
Vacancy and Non Recoverable Allowance 5.00%
Capitalization Rate 4.00%
Capitalized Value per 1000 SF Gross
Rental Rev $468,750
Parking $0
Total $468,750
Vacancy $23,438
NOI $445,313
Capitalized Value $11,132,813
Value psf of net leasable space $1,187.50 psf

EVALUATION OF LAND VALUE CAPTURE AND URBAN DEVELOPMENT AS SOURCES OF REVENUE FOR TRANSLINK
PAGE 98
Attachment 1d – continued
Analysis
Revenue
Strata Sales Revenue $141,262,848
Market Rental Revenue $0
Below Market Rental Revenue $0
Social Housing Units Revenue $0
Gross Retail Value $11,132,813
Gross Office Value $0
Total Gross Value $152,395,661
Less Commissions on Strata $4,237,885
Less Commissions on Rental $0
Less Commissions on Commercial $222,656
Net Sales Revenue/Value $147,935,119
Project Costs
Upfront Compensation to Existing Tenants $0
Tenant Relocation $0
Allowance for Demolition of Existing Buildings $163,460
Allowance for Remediation $0
Site Preparation/Fill $0
On and Off-Site Servicing $160,061
Density Bonus Contribution $0
Rezoning Costs $500,000
Hard Construction Costs $51,664,128
Site Landscaping $0
Public Art Contribution $231,030
Soft costs and Professional Fees $4,217,494
Development management $1,708,085
Fees, legal and survey for rental portion $0
Contingency on hard and soft costs $2,932,213
Marketing on Strata Units $2,825,257
Initial Lease Up Costs on Market Rental Units $0
Initial Lease Up Costs on Below Market Rental Units $0
Initial Lease Up Costs on Social Rental Units $0
Leasing Commissions on Commercial Space $46,875
Tenant Improvement Allowance on Retail Space $0
Tenant Improvement Allowance on Office Space $0
GVS & DD Sewer Levy - Strata Apartment $112,560
GVS & DD Sewer Levy - Rental Residential $0
GVS & DD Sewer Levy - Commercial $8,719
TransLink - Strata Apartment Residential $126,000
TransLink - Rental Residential $0
TransLink - Commercial $11,719
Market Strata Apartment DCLs $3,032,493
Market Rental DCLs $0
Below Market Rental DCLs $0
Social Housing DCLs $0
Retail DCLs $193,500
Office DCLs $0
School Site Acquisition Charge $0
Less property tax allowance during approvals/development $304,871
Less School Tax Surcharge During Development $436,801
Interim financing on construction costs $2,558,942
Financing fees/costs $667,821
Less Net GST (assuming builder holds units) $0
Total Project Costs Before Land $71,902,030 which works out to $616 psf of gross floor area
Developer's Profit $19,872,394
Residual to Land and Land Carry $56,160,695
Less financing on land during construction and approvals $3,123,939
Less financing fee on land loan $298,332
Less property closing costs $2,430,575
Residual Land Value $50,307,849
Residual Value per sq.ft. of site $2,683
Residual Value per sq.ft. of FSR $447
Residual Value per sq.ft. of gross buildable floorspace $431

EVALUATION OF LAND VALUE CAPTURE AND URBAN DEVELOPMENT AS SOURCES OF REVENUE FOR TRANSLINK
PAGE 99
Attachment 2a
(continues on following page)
Attachment 2a
Case Study #2: Site on West Broadway
Estimated Residual Land Value based on Rezoning to Mixed-Use Concrete at 6.0 FSR (market rental) (rezoning only; no rapid transit premium)
Major Assumptions (shading indicates figures that are inputs; unshaded cells are formulas)
Site Size 18,750 sq.ft.
150 feet of frontage
Existing Base Density 3.00 FSR
Increased Density 1 0.00 FSR
Increased Density 2 3.00 FSR
Density with Bonuses 6.00 FSR
Assumed Commercial Density 0.50 FSR
Residential Density Before Exclusions 5.50 FSR
Enclosed Balconies 0.00 0% of residential
Storage 6% of residential FSR 39.9 sf per unit
Effective Residential Density After Bonuses and Exclusions 5.80 FSR
Total Effective Gross Density After Bonuses and Exclusions 6.30 FSR
Total Gross Floorspace 118,172 sf
Concept Gross SF Efficiency
Net Saleable
or Rentable Avg Unit Size
Number of
Units
Parking Stalls
per Unit or
1000 sf
Parking
Stalls
Strata Residential 0 85% 0 #DIV/0! 0 1.1 0
Market Rental 108,797 85% 92,477 616 150 0.6 90
Below Market Rental 0 85% 0 664 0 0.6 0
Social Housing 0 85% 0 706 0 0.5 0
Retail 9,375 100% 9,375 n/a n/a 14
Office 0 95% 0 n/a n/a 0
Total 118,172 101,852 150 104
Revenue/Value
Strata Residential $0 per net square foot
Market Rental $889 per net square foot (see separate calculations)
Below Market Rental $0 per net square foot (see separate calculations)
Social Housing $0 per net square foot (see separate calculations)
Retail* $1,188 per net square foot including parking revenue (see separate calculations)
Office $0 per net square foot including parking revenue (see separate calculations)
Pre Construction Costs
Upfront Compensation to Existing Tenants $0
Tenant Relocation $0
Allowance for Demolition of Existing Buildings $163,460 or $20 per sq. ft. of existing building
Allowance for Remediation $0
Site Preparation/Fill $0
On and Off-Site Servicing $160,061 $3,500 per lineal metre of frontage
Density Bonus Contribution $0 psf of bonus density
Rezoning Costs $500,000
Construction Costs
Hard Construction Costs
Market Strata Residential Area $380 per gross sq.ft. of residential area
Market Rental Residential Area $350 per gross sq.ft. of rental residential area
Below Market Residential Area $350 per gross sq.ft. of rental residential area
Social Housing Residential Area $350 per gross sq.ft. of rental residential area
Retail Area (shell space - no TI) $260 per gross sq.ft. of retail area
Office Area (shell space - no TI) $260 per gross sq.ft. of commercial area
Cost Per Garage/Underground Parking Stall $65,000 per underground/structured parking stall
Overall Costs Per Square Foot $400 per gross sq.ft.
Sustainability Premium 0%
Total Estimated Cost per Square Foot $400
Hard Cost Used in Analysis $400
Site Landscaping $0 or $0 psf of site area on 50% of site
Public Art Contribution $1.98 per sq. ft.
Soft costs and Professional Fees 8.0% of hard costs, landscaping and site prep/servicing costs
Development management 3.0% of hard costs, landscaping and site prep/servicing costs and soft costs
Fees, legal and survey for rental portion $0
Contingency on hard and soft costs 5.0% of hard, soft and management costs
Government Levies
GVS & DD Sewer Levy - Strata Apartment $1,072 per apartment unit
GVS & DD Sewer Levy - Rental Residential $1,072 per unit
GVS & DD Sewer Levy - Commercial $0.93 per sq.ft. of commercial space
TransLink - Strata Apartment Residential $1,200 per market unit
TransLink - Rental Residential $1,200 per unit
TransLink - Commercial $1.25 per sq.ft. of commercial space
Market Strata Apartment DCLs $28.26 per sq.ft. of floorspace
Market Rental DCLs $10.09 per sq.ft. of floorspace
Below Market Rental DCLs $0.00 per sq.ft. of floorspace
Social Housing DCLs $0.00 per sq.ft. of floorspace
Retail DCLs $20.64 per sq.ft. of floorspace
Office DCLs $20.64 per sq.ft. of floorspace
School Site Acquisition Charge $0 per unit

EVALUATION OF LAND VALUE CAPTURE AND URBAN DEVELOPMENT AS SOURCES OF REVENUE FOR TRANSLINK
PAGE 100
Attachment 2a – continued
(continues on following page)
Financing
Interim financing 5.0% assuming a 2.00 year construction period
Financing charged on 50% of land and 75% of construction costs
Financing fees 1.25%
Commissions and Marketing
Commissions on Strata Residential 3.0% of gross strata market residential revenue
Marketing on Strata Residential 2.0% of gross strata market residential revenue
Commissions on Sale of Commercial 2.0% of gross commercial value
Commission on Sale of Rental Units 0.0% of value
Initial Lease Up Costs on Market Rental Units $3,500 per unit
Initial Lease Up Costs on Below Market Rental Units $0 per unit
Initial Lease Up Costs on Social Housing Units $0 per unit
Leasing Commissions on Commercial Space $5.00 per sq.ft.
Tenant Improvement Allowance on Retail Space $0.00 per sq.ft.
Tenant Improvement Allowance on Office Space $0.00 per sq.ft.
Other Costs and Allowances
Net GST on Market Rental Units 5.00% of capitalized value of rental units
Net GST on Below Market Rental Units 0.00% of capitalized value of rental units
Net GST on Social Housing Units 0.00% of development cost of new units (assumes rebate)
Property Taxes 0.247% of assessed value
Assumed current assessment (Year 1 of analysis) $31,545,900
Assumed assessment after 1 year of construction (Year 2 of analysis) $46,680,548 (50% of completed project value)
Developer's Profit 15.0% of total costs or 13.0% of gross market revenue/value
School Tax Surcharge During Development*
Tax Rate 0.2% between $3.0-$4.0 million, and0.4% over $4.0 million
Residential Portion of current assessment (Year 1 of analysis) $31,545,900
Assumed residential portion of assessment after 1 year of construction $41,114,142 (50% of completed residential project value)
*Assumes BC Owner
*Market Rental Capitalized Value Assumptions
Rent Assumptions Rent
Unit Type # Units Size rent/month
Studios 25 25% 435 1,768$
1-Bedroom 40 40% 545 2,056$
2-Bedroom 25 25% 775 2,703$
3-Bedroom 10 10% 950 3,559$
Total 100 100%
Average 616 2,296$
3.73$
Revenue and Operating Cost Assumptions
Rental Rate Per Month $3.73 psf per month or
$2,296 per unit per month
Monthly Parking Revenue $100 per month
Storage Revenue $40 per month on 75% of units
Vacancy and Non Recoverable Allowance 2.00%
Operating costs for New Rental Units $4,801 per unit per year
Property Tax Allowance
Residential Assessment (upon completion of new building) $80,917,676 (see capitalized value below)
Residential Tax Rate 0.247%
Residential Property Taxes $199,726
Capitalization Rate for Rental Apartment Space 4.00%
Capitalized Value
Rental Rev $4,132,890
Parking $108,000
Storage $54,000
Total $4,294,890
Vacancy $85,898
Net $4,208,992
Op Costs $720,135
Taxes $199,726
NOI $3,289,131
Capitalized Value $82,228,283
psf of rentable space $889.17
**Retail Value Assumptions
Lease Rate NNN $50.00 psf per year
Monthly Parking Revenue (net of costs) $0 per month
Vacancy and Non Recoverable Allowance 5.00%
Capitalization Rate 4.00%
Capitalized Value per 1000 SF Gross
Rental Rev $468,750
Parking $0
Total $468,750
Vacancy $23,438
NOI $445,313
Capitalized Value $11,132,813
Value psf of net leasable space $1,187.50 psf

EVALUATION OF LAND VALUE CAPTURE AND URBAN DEVELOPMENT AS SOURCES OF REVENUE FOR TRANSLINK
PAGE 101
Attachment 2a – continued
Analysis
Revenue
Strata Sales Revenue $0
Market Rental Revenue $82,228,283
Below Market Rental Revenue $0
Social Housing Units Revenue $0
Gross Retail Value $11,132,813
Gross Office Value $0
Total Gross Value $93,361,096
Less Commissions on Strata $0
Less Commissions on Rental $0
Less Commissions on Commercial $222,656
Net Sales Revenue/Value $93,138,440
Project Costs
Upfront Compensation to Existing Tenants $0
Tenant Relocation $0
Allowance for Demolition of Existing Buildings $163,460
Allowance for Remediation $0
Site Preparation/Fill $0
On and Off-Site Servicing $160,061
Density Bonus Contribution $0
Rezoning Costs $500,000
Hard Construction Costs $47,276,406
Site Landscaping $0
Public Art Contribution $233,980
Soft costs and Professional Fees $3,866,713
Development management $1,566,019
Fees, legal and survey for rental portion $0
Contingency on hard and soft costs $2,688,332
Marketing on Strata Units $0
Initial Lease Up Costs on Market Rental Units $525,000
Initial Lease Up Costs on Below Market Rental Units $0
Initial Lease Up Costs on Social Rental Units $0
Leasing Commissions on Commercial Space $46,875
Tenant Improvement Allowance on Retail Space $0
Tenant Improvement Allowance on Office Space $0
GVS & DD Sewer Levy - Strata Apartment $0
GVS & DD Sewer Levy - Rental Residential $160,800
GVS & DD Sewer Levy - Commercial $8,719
TransLink - Strata Apartment Residential $0
TransLink - Rental Residential $180,000
TransLink - Commercial $11,719
Market Strata Apartment DCLs $0
Market Rental DCLs $1,097,760
Below Market Rental DCLs $0
Social Housing DCLs $0
Retail DCLs $193,500
Office DCLs $0
School Site Acquisition Charge $0
Less property tax allowance during approvals/development $232,015
Less School Tax Surcharge During Development $318,732
Interim financing on construction costs $2,209,176
Financing fees/costs $575,993
Less Net GST (assuming builder holds units) $4,111,414
Total Project Costs Before Land $66,126,674 which works out to $560 psf of gross floor area
Developer's Profit $12,174,287
Residual to Land and Land Carry $14,837,479
Less financing on land during construction and approvals $825,335
Less financing fee on land loan $78,818
Less property closing costs $587,333
Residual Land Value $13,345,993
Residual Value per sq.ft. of site $712
Residual Value per sq.ft. of FSR $119
Residual Value per sq.ft. of gross buildable floorspace $113

EVALUATION OF LAND VALUE CAPTURE AND URBAN DEVELOPMENT AS SOURCES OF REVENUE FOR TRANSLINK
PAGE 102
Attachment 2b
(continues on following page)
Attachment 2b
Case Study #2: Site on West Broadway
Estimated Residual Land Value based on Rezoning to Mixed-Use Concrete at 6.0 FSR (market rental) (rezoning only; with rapid transit premium)
Major Assumptions (shading indicates figures that are inputs; unshaded cells are formulas)
Site Size 18,750 sq.ft.
150 feet of frontage
Existing Base Density 3.00 FSR
Increased Density 1 0.00 FSR
Increased Density 2 3.00 FSR
Density with Bonuses 6.00 FSR
Assumed Commercial Density 0.50 FSR
Residential Density Before Exclusions 5.50 FSR
Enclosed Balconies 0.00 0% of residential
Storage 6% of residential FSR 39.9 sf per unit
Effective Residential Density After Bonuses and Exclusions 5.80 FSR
Total Effective Gross Density After Bonuses and Exclusions 6.30 FSR
Total Gross Floorspace 118,172 sf
Concept Gross SF Efficiency
Net Saleable
or Rentable Avg Unit Size
Number of
Units
Parking Stalls
per Unit or
1000 sf Parking Stalls
Strata Residential 0 85% 0 #DIV/0! 0 1.1 0
Market Rental 108,797 85% 92,477 616 150 0.6 90
Below Market Rental 0 85% 0 664 0 0.6 0
Social Housing 0 85% 0 706 0 0.5 0
Retail 9,375 100% 9,375 n/a n/a 14
Office 0 95% 0 n/a n/a 0
Total 118,172 101,852 150 104
Revenue/Value
Strata Residential $0 per net square foot
Market Rental $944 per net square foot (see separate calculations)
Below Market Rental $0 per net square foot (see separate calculations)
Social Housing $0 per net square foot (see separate calculations)
Retail* $1,188 per net square foot including parking revenue (see separate calculations)
Office $0 per net square foot including parking revenue (see separate calculations)
Pre Construction Costs
Upfront Compensation to Existing Tenants $0
Tenant Relocation $0
Allowance for Demolition of Existing Buildings $163,460 or $20 per sq. ft. of existing building
Allowance for Remediation $0
Site Preparation/Fill $0
On and Off-Site Servicing $160,061 $3,500 per lineal metre of frontage
Density Bonus Contribution $0 psf of bonus density
Rezoning Costs $500,000
Construction Costs
Hard Construction Costs
Market Strata Residential Area $380 per gross sq.ft. of residential area
Market Rental Residential Area $350 per gross sq.ft. of rental residential area
Below Market Residential Area $350 per gross sq.ft. of rental residential area
Social Housing Residential Area $350 per gross sq.ft. of rental residential area
Retail Area (shell space - no TI) $260 per gross sq.ft. of retail area
Office Area (shell space - no TI) $260 per gross sq.ft. of commercial area
Cost Per Garage/Underground Parking Stall $65,000 per underground/structured parking stall
Overall Costs Per Square Foot $400 per gross sq.ft.
Sustainability Premium 0%
Total Estimated Cost per Square Foot $400
Hard Cost Used in Analysis $400
Site Landscaping $0 or $0 psf of site area on 50% of site
Public Art Contribution $1.98 per sq. ft.
Soft costs and Professional Fees 8.0% of hard costs, landscaping and site prep/servicing costs
Development management 3.0% of hard costs, landscaping and site prep/servicing costs and soft costs
Fees, legal and survey for rental portion $0
Contingency on hard and soft costs 5.0% of hard, soft and management costs
Government Levies
GVS & DD Sewer Levy - Strata Apartment $1,072 per apartment unit
GVS & DD Sewer Levy - Rental Residential $1,072 per unit
GVS & DD Sewer Levy - Commercial $0.93 per sq.ft. of commercial space
TransLink - Strata Apartment Residential $1,200 per market unit
TransLink - Rental Residential $1,200 per unit
TransLink - Commercial $1.25 per sq.ft. of commercial space
Market Strata Apartment DCLs $28.26 per sq.ft. of floorspace
Market Rental DCLs $28.26 per sq.ft. of floorspace
Below Market Rental DCLs $0.00 per sq.ft. of floorspace
Social Housing DCLs $0.00 per sq.ft. of floorspace
Retail DCLs $20.64 per sq.ft. of floorspace
Office DCLs $20.64 per sq.ft. of floorspace
School Site Acquisition Charge $0 per unit
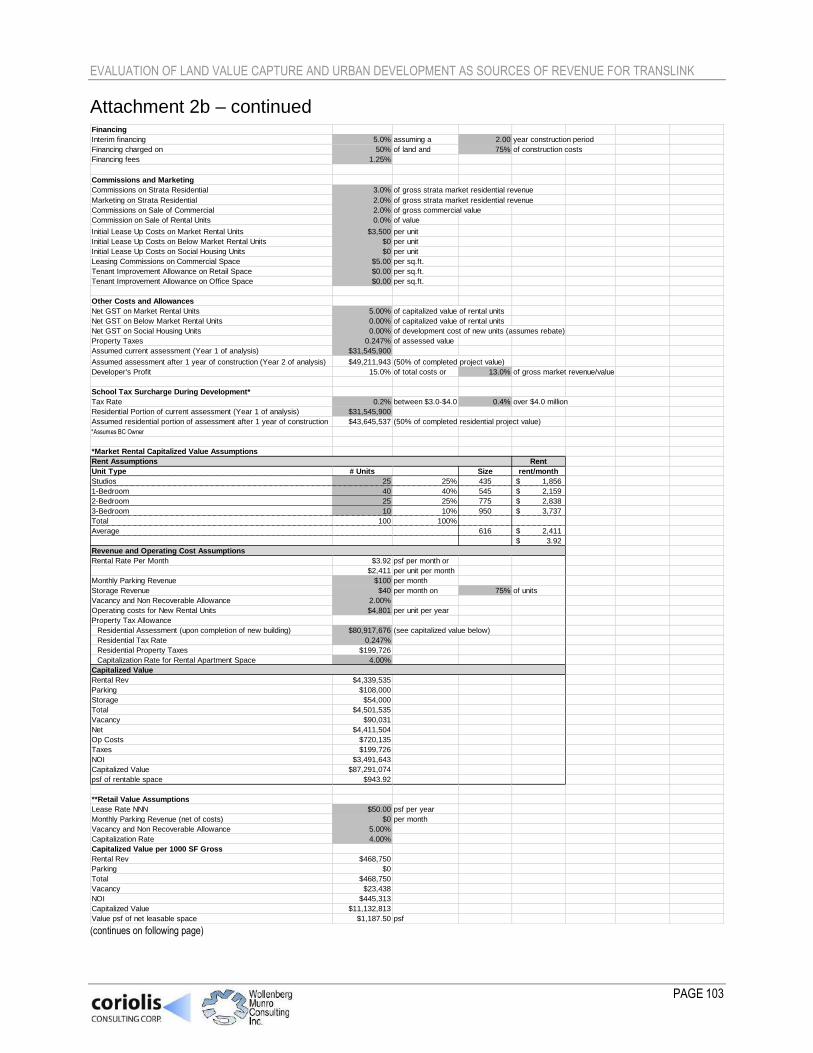
EVALUATION OF LAND VALUE CAPTURE AND URBAN DEVELOPMENT AS SOURCES OF REVENUE FOR TRANSLINK
PAGE 103
Attachment 2b – continued
(continues on following page)
Financing
Interim financing 5.0% assuming a 2.00 year construction period
Financing charged on 50% of land and 75% of construction costs
Financing fees 1.25%
Commissions and Marketing
Commissions on Strata Residential 3.0% of gross strata market residential revenue
Marketing on Strata Residential 2.0% of gross strata market residential revenue
Commissions on Sale of Commercial 2.0% of gross commercial value
Commission on Sale of Rental Units 0.0% of value
Initial Lease Up Costs on Market Rental Units $3,500 per unit
Initial Lease Up Costs on Below Market Rental Units $0 per unit
Initial Lease Up Costs on Social Housing Units $0 per unit
Leasing Commissions on Commercial Space $5.00 per sq.ft.
Tenant Improvement Allowance on Retail Space $0.00 per sq.ft.
Tenant Improvement Allowance on Office Space $0.00 per sq.ft.
Other Costs and Allowances
Net GST on Market Rental Units 5.00% of capitalized value of rental units
Net GST on Below Market Rental Units 0.00% of capitalized value of rental units
Net GST on Social Housing Units 0.00% of development cost of new units (assumes rebate)
Property Taxes 0.247% of assessed value
Assumed current assessment (Year 1 of analysis) $31,545,900
Assumed assessment after 1 year of construction (Year 2 of analysis) $49,211,943 (50% of completed project value)
Developer's Profit 15.0% of total costs or 13.0% of gross market revenue/value
School Tax Surcharge During Development*
Tax Rate 0.2% between $3.0-$4.0 million, and0.4% over $4.0 million
Residential Portion of current assessment (Year 1 of analysis) $31,545,900
Assumed residential portion of assessment after 1 year of construction $43,645,537 (50% of completed residential project value)
*Assumes BC Owner
*Market Rental Capitalized Value Assumptions
Rent Assumptions Rent
Unit Type # Units Size rent/month
Studios 25 25% 435 1,856$
1-Bedroom 40 40% 545 2,159$
2-Bedroom 25 25% 775 2,838$
3-Bedroom 10 10% 950 3,737$
Total 100 100%
Average 616 2,411$
3.92$
Revenue and Operating Cost Assumptions
Rental Rate Per Month $3.92 psf per month or
$2,411 per unit per month
Monthly Parking Revenue $100 per month
Storage Revenue $40 per month on 75% of units
Vacancy and Non Recoverable Allowance 2.00%
Operating costs for New Rental Units $4,801 per unit per year
Property Tax Allowance
Residential Assessment (upon completion of new building) $80,917,676 (see capitalized value below)
Residential Tax Rate 0.247%
Residential Property Taxes $199,726
Capitalization Rate for Rental Apartment Space 4.00%
Capitalized Value
Rental Rev $4,339,535
Parking $108,000
Storage $54,000
Total $4,501,535
Vacancy $90,031
Net $4,411,504
Op Costs $720,135
Taxes $199,726
NOI $3,491,643
Capitalized Value $87,291,074
psf of rentable space $943.92
**Retail Value Assumptions
Lease Rate NNN $50.00 psf per year
Monthly Parking Revenue (net of costs) $0 per month
Vacancy and Non Recoverable Allowance 5.00%
Capitalization Rate 4.00%
Capitalized Value per 1000 SF Gross
Rental Rev $468,750
Parking $0
Total $468,750
Vacancy $23,438
NOI $445,313
Capitalized Value $11,132,813
Value psf of net leasable space $1,187.50 psf

EVALUATION OF LAND VALUE CAPTURE AND URBAN DEVELOPMENT AS SOURCES OF REVENUE FOR TRANSLINK
PAGE 104
Attachment 2b – continued
Analysis
Revenue
Strata Sales Revenue $0
Market Rental Revenue $87,291,074
Below Market Rental Revenue $0
Social Housing Units Revenue $0
Gross Retail Value $11,132,813
Gross Office Value $0
Total Gross Value $98,423,886
Less Commissions on Strata $0
Less Commissions on Rental $0
Less Commissions on Commercial $222,656
Net Sales Revenue/Value $98,201,230
Project Costs
Upfront Compensation to Existing Tenants $0
Tenant Relocation $0
Allowance for Demolition of Existing Buildings $163,460
Allowance for Remediation $0
Site Preparation/Fill $0
On and Off-Site Servicing $160,061
Density Bonus Contribution $0
Rezoning Costs $500,000
Hard Construction Costs $47,276,406
Site Landscaping $0
Public Art Contribution $233,980
Soft costs and Professional Fees $3,866,713
Development management $1,566,019
Fees, legal and survey for rental portion $0
Contingency on hard and soft costs $2,688,332
Marketing on Strata Units $0
Initial Lease Up Costs on Market Rental Units $525,000
Initial Lease Up Costs on Below Market Rental Units $0
Initial Lease Up Costs on Social Rental Units $0
Leasing Commissions on Commercial Space $46,875
Tenant Improvement Allowance on Retail Space $0
Tenant Improvement Allowance on Office Space $0
GVS & DD Sewer Levy - Strata Apartment $0
GVS & DD Sewer Levy - Rental Residential $160,800
GVS & DD Sewer Levy - Commercial $8,719
TransLink - Strata Apartment Residential $0
TransLink - Rental Residential $180,000
TransLink - Commercial $11,719
Market Strata Apartment DCLs $0
Market Rental DCLs $3,074,600
Below Market Rental DCLs $0
Social Housing DCLs $0
Retail DCLs $193,500
Office DCLs $0
School Site Acquisition Charge $0
Less property tax allowance during approvals/development $238,263
Less School Tax Surcharge During Development $328,858
Interim financing on construction costs $2,283,542
Financing fees/costs $595,377
Less Net GST (assuming builder holds units) $4,364,554
Total Project Costs Before Land $68,466,776 which works out to $579 psf of gross floor area
Developer's Profit $12,834,475
Residual to Land and Land Carry $16,899,980
Less financing on land during construction and approvals $940,061
Less financing fee on land loan $89,775
Less property closing costs $679,332
Residual Land Value $15,190,812
Residual Value per sq.ft. of site $810
Residual Value per sq.ft. of FSR $135
Residual Value per sq.ft. of gross buildable floorspace $129
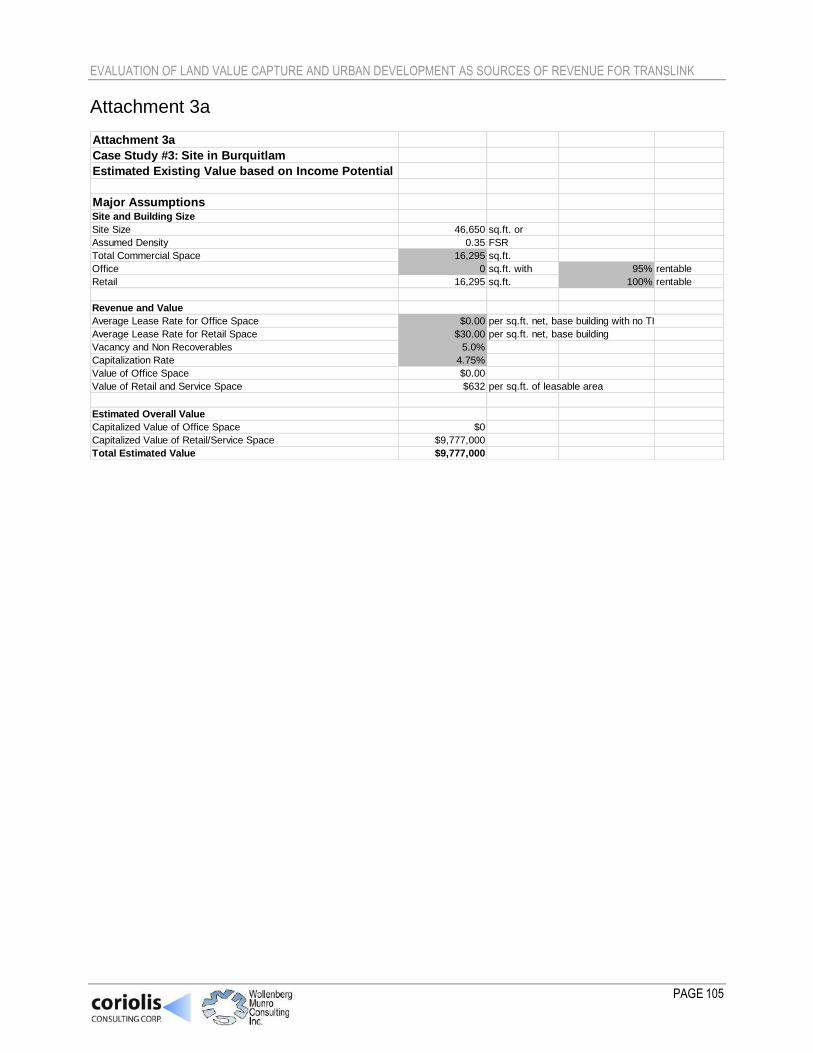
EVALUATION OF LAND VALUE CAPTURE AND URBAN DEVELOPMENT AS SOURCES OF REVENUE FOR TRANSLINK
PAGE 105
Attachment 3a
Attachment 3a
Case Study #3: Site in Burquitlam
Estimated Existing Value based on Income Potential
Major AssumptionsSite and Building Size
Site Size 46,650 sq.ft. or
Assumed Density 0.35 FSR
Total Commercial Space 16,295 sq.ft.
Office 0 sq.ft. with 95% rentable
Retail 16,295 sq.ft. 100% rentable
Revenue and Value
Average Lease Rate for Office Space $0.00 per sq.ft. net, base building with no TI
Average Lease Rate for Retail Space $30.00 per sq.ft. net, base building
Vacancy and Non Recoverables 5.0%
Capitalization Rate 4.75%
Value of Office Space $0.00
Value of Retail and Service Space $632 per sq.ft. of leasable area
Estimated Overall Value
Capitalized Value of Office Space $0
Capitalized Value of Retail/Service Space $9,777,000
Total Estimated Value $9,777,000
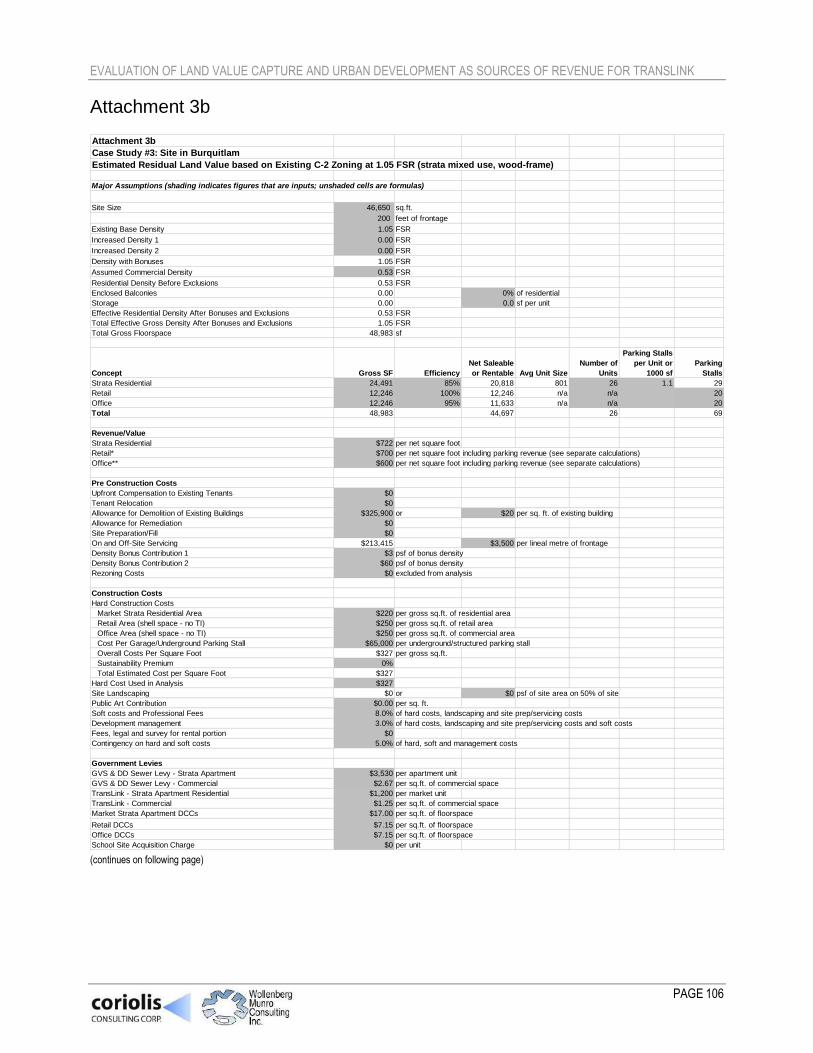
EVALUATION OF LAND VALUE CAPTURE AND URBAN DEVELOPMENT AS SOURCES OF REVENUE FOR TRANSLINK
PAGE 106
Attachment 3b
(continues on following page)
Attachment 3b
Case Study #3: Site in Burquitlam
Estimated Residual Land Value based on Existing C-2 Zoning at 1.05 FSR (strata mixed use, wood-frame)
Major Assumptions (shading indicates figures that are inputs; unshaded cells are formulas)
Site Size 46,650 sq.ft.
200 feet of frontage
Existing Base Density 1.05 FSR
Increased Density 1 0.00 FSR
Increased Density 2 0.00 FSR
Density with Bonuses 1.05 FSR
Assumed Commercial Density 0.53 FSR
Residential Density Before Exclusions 0.53 FSR
Enclosed Balconies 0.00 0% of residential
Storage 0.00 0.0 sf per unit
Effective Residential Density After Bonuses and Exclusions 0.53 FSR
Total Effective Gross Density After Bonuses and Exclusions 1.05 FSR
Total Gross Floorspace 48,983 sf
Concept Gross SF Efficiency
Net Saleable
or Rentable Avg Unit Size
Number of
Units
Parking Stalls
per Unit or
1000 sf
Parking
Stalls
Strata Residential 24,491 85% 20,818 801 26 1.1 29
Retail 12,246 100% 12,246 n/a n/a 20
Office 12,246 95% 11,633 n/a n/a 20
Total 48,983 44,697 26 69
Revenue/Value
Strata Residential $722 per net square foot
Retail* $700 per net square foot including parking revenue (see separate calculations)
Office** $600 per net square foot including parking revenue (see separate calculations)
Pre Construction Costs
Upfront Compensation to Existing Tenants $0
Tenant Relocation $0
Allowance for Demolition of Existing Buildings $325,900 or $20 per sq. ft. of existing building
Allowance for Remediation $0
Site Preparation/Fill $0
On and Off-Site Servicing $213,415 $3,500 per lineal metre of frontage
Density Bonus Contribution 1 $3 psf of bonus density
Density Bonus Contribution 2 $60 psf of bonus density
Rezoning Costs $0 excluded from analysis
Construction Costs
Hard Construction Costs
Market Strata Residential Area $220 per gross sq.ft. of residential area
Retail Area (shell space - no TI) $250 per gross sq.ft. of retail area
Office Area (shell space - no TI) $250 per gross sq.ft. of commercial area
Cost Per Garage/Underground Parking Stall $65,000 per underground/structured parking stall
Overall Costs Per Square Foot $327 per gross sq.ft.
Sustainability Premium 0%
Total Estimated Cost per Square Foot $327
Hard Cost Used in Analysis $327
Site Landscaping $0 or $0 psf of site area on 50% of site
Public Art Contribution $0.00 per sq. ft.
Soft costs and Professional Fees 8.0% of hard costs, landscaping and site prep/servicing costs
Development management 3.0% of hard costs, landscaping and site prep/servicing costs and soft costs
Fees, legal and survey for rental portion $0
Contingency on hard and soft costs 5.0% of hard, soft and management costs
Government Levies
GVS & DD Sewer Levy - Strata Apartment $3,530 per apartment unit
GVS & DD Sewer Levy - Commercial $2.67 per sq.ft. of commercial space
TransLink - Strata Apartment Residential $1,200 per market unit
TransLink - Commercial $1.25 per sq.ft. of commercial space
Market Strata Apartment DCCs $17.00 per sq.ft. of floorspace
Retail DCCs $7.15 per sq.ft. of floorspace
Office DCCs $7.15 per sq.ft. of floorspace
School Site Acquisition Charge $0 per unit
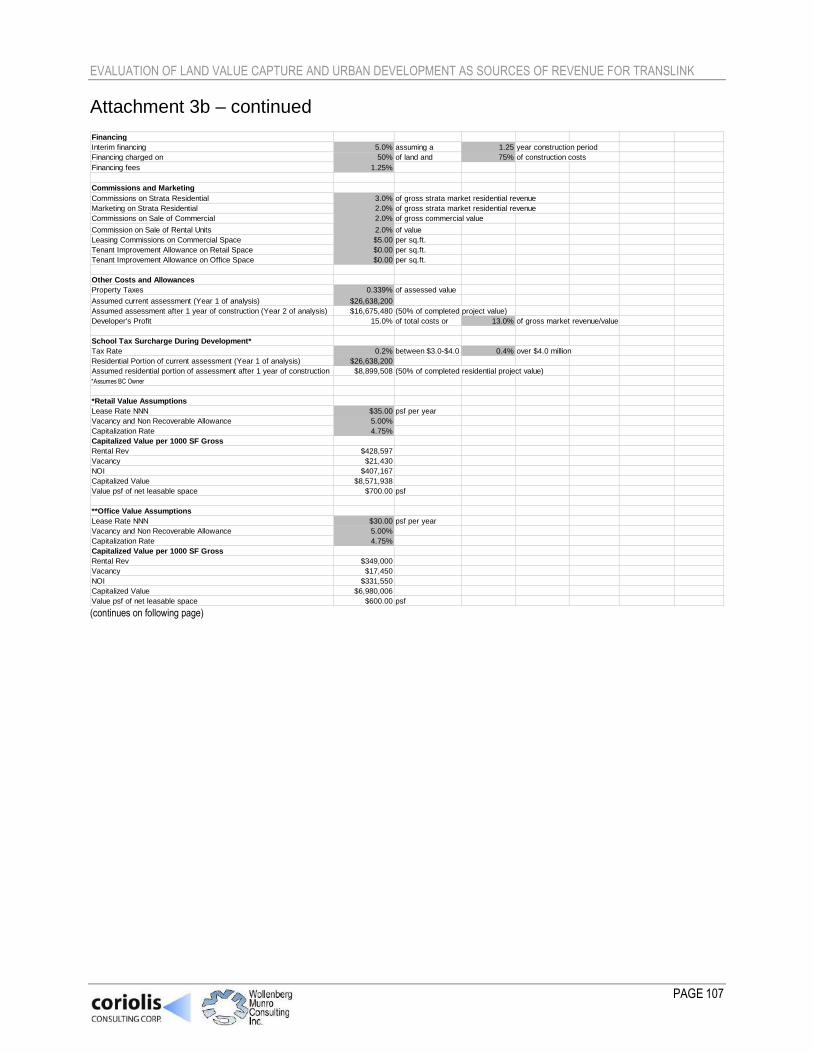
EVALUATION OF LAND VALUE CAPTURE AND URBAN DEVELOPMENT AS SOURCES OF REVENUE FOR TRANSLINK
PAGE 107
Attachment 3b – continued
(continues on following page)
Financing
Interim financing 5.0% assuming a 1.25 year construction period
Financing charged on 50% of land and 75% of construction costs
Financing fees 1.25%
Commissions and Marketing
Commissions on Strata Residential 3.0% of gross strata market residential revenue
Marketing on Strata Residential 2.0% of gross strata market residential revenue
Commissions on Sale of Commercial 2.0% of gross commercial value
Commission on Sale of Rental Units 2.0% of value
Leasing Commissions on Commercial Space $5.00 per sq.ft.
Tenant Improvement Allowance on Retail Space $0.00 per sq.ft.
Tenant Improvement Allowance on Office Space $0.00 per sq.ft.
Other Costs and Allowances
Property Taxes 0.339% of assessed value
Assumed current assessment (Year 1 of analysis) $26,638,200
Assumed assessment after 1 year of construction (Year 2 of analysis) $16,675,480 (50% of completed project value)
Developer's Profit 15.0% of total costs or 13.0% of gross market revenue/value
School Tax Surcharge During Development*
Tax Rate 0.2% between $3.0-$4.0 million, and0.4% over $4.0 million
Residential Portion of current assessment (Year 1 of analysis) $26,638,200
Assumed residential portion of assessment after 1 year of construction $8,899,508 (50% of completed residential project value)
*Assumes BC Owner
*Retail Value Assumptions
Lease Rate NNN $35.00 psf per year
Vacancy and Non Recoverable Allowance 5.00%
Capitalization Rate 4.75%
Capitalized Value per 1000 SF Gross
Rental Rev $428,597
Vacancy $21,430
NOI $407,167
Capitalized Value $8,571,938
Value psf of net leasable space $700.00 psf
**Office Value Assumptions
Lease Rate NNN $30.00 psf per year
Vacancy and Non Recoverable Allowance 5.00%
Capitalization Rate 4.75%
Capitalized Value per 1000 SF Gross
Rental Rev $349,000
Vacancy $17,450
NOI $331,550
Capitalized Value $6,980,006
Value psf of net leasable space $600.00 psf

EVALUATION OF LAND VALUE CAPTURE AND URBAN DEVELOPMENT AS SOURCES OF REVENUE FOR TRANSLINK
PAGE 108
Attachment 3b – continued
Analysis
Revenue
Strata Sales Revenue $15,030,280
Gross Retail Value $8,571,938
Gross Office Value $6,980,006
Total Gross Value $30,582,224
Less Commissions on Strata $450,908
Less Commissions on Commercial $311,039
Net Sales Revenue/Value $29,820,277
Project Costs
Upfront Compensation to Existing Tenants $0
Tenant Relocation $0
Allowance for Demolition of Existing Buildings $325,900
Allowance for Remediation $0
Site Preparation/Fill $0
On and Off-Site Servicing $213,415
Density Bonus Contribution $73,474
Rezoning Costs $0
Hard Construction Costs $15,995,888
Site Landscaping $0
Public Art Contribution $0
Soft costs and Professional Fees $1,328,694
Development management $538,121
Fees, legal and survey for rental portion $0
Contingency on hard and soft costs $923,775
Marketing on Strata Units $300,606
Leasing Commissions on Commercial Space $119,395
Tenant Improvement Allowance on Retail Space $0
Tenant Improvement Allowance on Office Space $0
GVS & DD Sewer Levy - Strata Apartment $91,780
GVS & DD Sewer Levy - Commercial $65,392
TransLink - Strata Apartment Residential $31,200
TransLink - Commercial $30,614
Market Strata Apartment DCCs $416,382
Retail DCCs $87,599
Office DCCs $87,599
School Site Acquisition Charge $0
Less property tax allowance during approvals/development $148,541
Less School Tax Surcharge During Development $142,844
Interim financing on construction costs $486,993
Financing fees/costs $200,702
Less Net GST (assuming builder holds units) $0
Total Project Costs Before Land $21,608,913 which works out to $441 psf of gross floor area
Developer's Profit $3,987,922
Residual to Land and Land Carry $4,223,441
Less financing on land during construction and approvals $164,450
Less financing fee on land loan $22,832
Less property closing costs $117,218
Residual Land Value $3,918,942
Residual Value per sq.ft. of site $84
Residual Value per sq.ft. of FSR $80
Residual Value per sq.ft. of gross buildable floorspace $80

EVALUATION OF LAND VALUE CAPTURE AND URBAN DEVELOPMENT AS SOURCES OF REVENUE FOR TRANSLINK
PAGE 109
Attachment 3c
(continues on following page)
Attachment 3c
Case Study #3: Site in Burquitlam
Estimated Residual Land Value based on Rezoning to C-7 Transit Village at 4.5 FSR (strata) (rezoning only; no rapid transit premium)
Major Assumptions (shading indicates figures that are inputs; unshaded cells are formulas)
Site Size 46,650 sq.ft.
200 feet of frontage
Existing Base Density 1.05 FSR
Increased Density 1 1.45 FSR
Increased Density 2 2.00 FSR
Density with Bonuses 4.50 FSR
Assumed Commercial Density 0.25 FSR
Residential Density Before Exclusions 4.25 FSR
Enclosed Balconies 0.00 0% of residential
Storage 0.00 0.0 sf per unit
Effective Residential Density After Bonuses and Exclusions 4.25 FSR
Total Effective Gross Density After Bonuses and Exclusions 4.50 FSR
Total Gross Floorspace 209,925 sf
Concept Gross SF Efficiency
Net Saleable
or Rentable Avg Unit Size
Number of
Units
Parking Stalls
per Unit or
1000 sf
Parking
Stalls
Strata Residential 198,263 85% 168,523 802 210 1.1 231
Retail 11,663 100% 11,663 n/a n/a 19
Office 0 95% 0 n/a n/a 0
Total 209,925 180,186 210 250
Revenue/Value
Strata Residential $855 per net square foot
Retail* $700 per net square foot including parking revenue (see separate calculations)
Office $0 per net square foot including parking revenue (see separate calculations)
Pre Construction Costs
Upfront Compensation to Existing Tenants $0
Tenant Relocation $0
Allowance for Demolition of Existing Buildings $325,900 or $20 per sq. ft. of existing building
Allowance for Remediation $0
Site Preparation/Fill $0
On and Off-Site Servicing $213,415 $3,500 per lineal metre of frontage
Density Bonus Contribution 1 $0 psf of bonus density
Density Bonus Contribution 2 $0 psf of bonus density
Rezoning Costs $350,000
Construction Costs
Hard Construction Costs
Market Strata Residential Area $310 per gross sq.ft. of residential area
Retail Area (shell space - no TI) $250 per gross sq.ft. of retail area
Office Area (shell space - no TI) $250 per gross sq.ft. of commercial area
Cost Per Garage/Underground Parking Stall $65,000 per underground/structured parking stall
Overall Costs Per Square Foot $384 per gross sq.ft.
Sustainability Premium 0%
Total Estimated Cost per Square Foot $384
Hard Cost Used in Analysis $384
Site Landscaping $0 or $0 psf of site area on 50% of site
Public Art Contribution $0.00 per sq. ft.
Soft costs and Professional Fees 8.0% of hard costs, landscaping and site prep/servicing costs
Development management 3.0% of hard costs, landscaping and site prep/servicing costs and soft costs
Fees, legal and survey for rental portion $0
Contingency on hard and soft costs 5.0% of hard, soft and management costs
Government Levies
GVS & DD Sewer Levy - Strata Apartment $3,530 per apartment unit
GVS & DD Sewer Levy - Commercial $2.67 per sq.ft. of commercial space
TransLink - Strata Apartment Residential $1,200 per market unit
TransLink - Commercial $1.25 per sq.ft. of commercial space
Market Strata Apartment DCCs $17.00 per sq.ft. of floorspace
Retail DCCs $7.15 per sq.ft. of floorspace
Office DCCs $7.15 per sq.ft. of floorspace
School Site Acquisition Charge $0 per unit
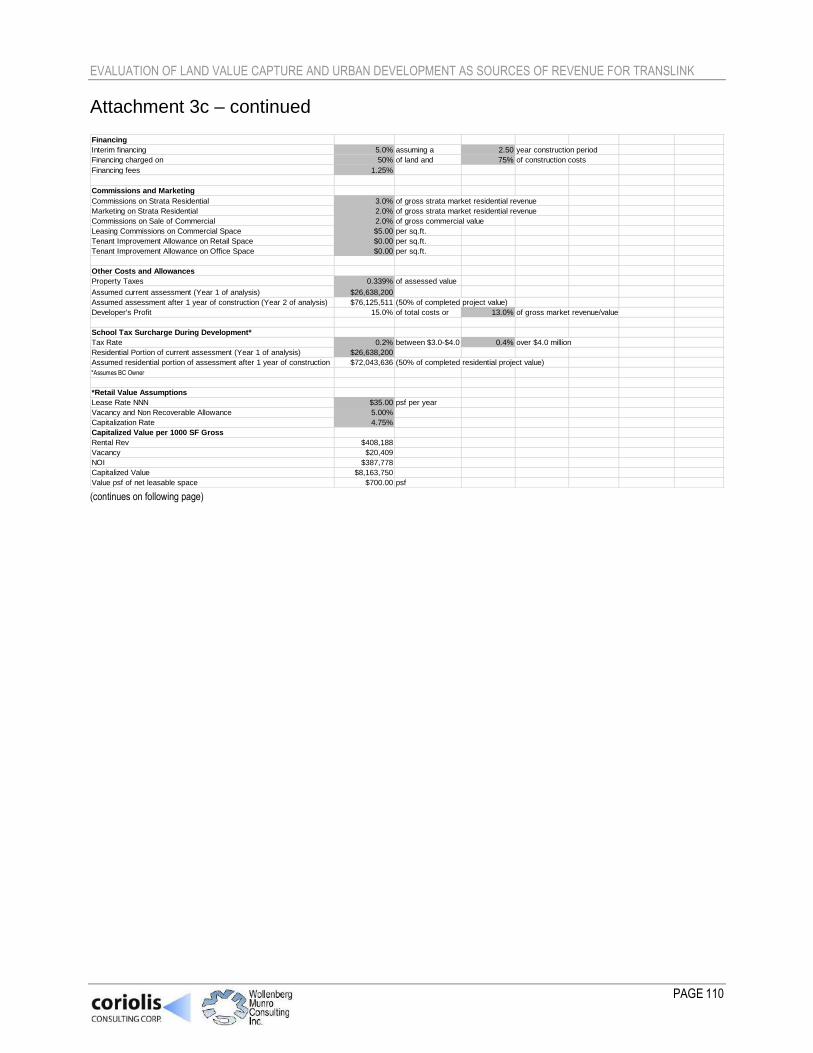
EVALUATION OF LAND VALUE CAPTURE AND URBAN DEVELOPMENT AS SOURCES OF REVENUE FOR TRANSLINK
PAGE 110
Attachment 3c – continued
(continues on following page)
Financing
Interim financing 5.0% assuming a 2.50 year construction period
Financing charged on 50% of land and 75% of construction costs
Financing fees 1.25%
Commissions and Marketing
Commissions on Strata Residential 3.0% of gross strata market residential revenue
Marketing on Strata Residential 2.0% of gross strata market residential revenue
Commissions on Sale of Commercial 2.0% of gross commercial value
Leasing Commissions on Commercial Space $5.00 per sq.ft.
Tenant Improvement Allowance on Retail Space $0.00 per sq.ft.
Tenant Improvement Allowance on Office Space $0.00 per sq.ft.
Other Costs and Allowances
Property Taxes 0.339% of assessed value
Assumed current assessment (Year 1 of analysis) $26,638,200
Assumed assessment after 1 year of construction (Year 2 of analysis) $76,125,511 (50% of completed project value)
Developer's Profit 15.0% of total costs or 13.0% of gross market revenue/value
School Tax Surcharge During Development*
Tax Rate 0.2% between $3.0-$4.0 million, and0.4% over $4.0 million
Residential Portion of current assessment (Year 1 of analysis) $26,638,200
Assumed residential portion of assessment after 1 year of construction $72,043,636 (50% of completed residential project value)
*Assumes BC Owner
*Retail Value Assumptions
Lease Rate NNN $35.00 psf per year
Vacancy and Non Recoverable Allowance 5.00%
Capitalization Rate 4.75%
Capitalized Value per 1000 SF Gross
Rental Rev $408,188
Vacancy $20,409
NOI $387,778
Capitalized Value $8,163,750
Value psf of net leasable space $700.00 psf

EVALUATION OF LAND VALUE CAPTURE AND URBAN DEVELOPMENT AS SOURCES OF REVENUE FOR TRANSLINK
PAGE 111
Attachment 3c – continued
Analysis
Revenue
Strata Sales Revenue $144,087,272
Gross Retail Value $8,163,750
Gross Office Value $0
Total Gross Value $152,251,022
Less Commissions on Strata $4,322,618
Less Commissions on Commercial $163,275
Net Sales Revenue/Value $147,765,129
Project Costs
Upfront Compensation to Existing Tenants $0
Tenant Relocation $0
Allowance for Demolition of Existing Buildings $325,900
Allowance for Remediation $0
Site Preparation/Fill $0
On and Off-Site Servicing $213,415
Density Bonus Contribution $0
Rezoning Costs $350,000
Hard Construction Costs $80,627,000
Site Landscaping $0
Public Art Contribution $0
Soft costs and Professional Fees $6,521,305
Development management $2,641,129
Fees, legal and survey for rental portion $0
Contingency on hard and soft costs $4,533,937
Marketing on Strata Units $2,881,745
Leasing Commissions on Commercial Space $58,313
Tenant Improvement Allowance on Retail Space $0
Tenant Improvement Allowance on Office Space $0
GVS & DD Sewer Levy - Strata Apartment $741,300
GVS & DD Sewer Levy - Commercial $31,139
TransLink - Strata Apartment Residential $252,000
TransLink - Rental Residential $0
TransLink - Commercial $14,578
Market Strata Apartment DCCs $3,370,710
Retail DCCs $83,428
Office DCCs $0
School Site Acquisition Charge $0
Less property tax allowance during approvals/development $523,000
Less School Tax Surcharge During Development $550,091
Interim financing on construction costs $4,836,042
Financing fees/costs $1,017,703
Less Net GST (assuming builder holds units) $0
Total Project Costs Before Land $109,572,736 which works out to $522 psf of gross floor area
Developer's Profit $19,853,533
Residual to Land and Land Carry $18,338,859
Less financing on land during construction and approvals $1,224,119
Less financing fee on land loan $96,270
Less property closing costs $733,877
Residual Land Value $16,284,593
Residual Value per sq.ft. of site $349
Residual Value per sq.ft. of FSR $78
Residual Value per sq.ft. of gross buildable floorspace $78

EVALUATION OF LAND VALUE CAPTURE AND URBAN DEVELOPMENT AS SOURCES OF REVENUE FOR TRANSLINK
PAGE 112
Attachment 3d
(continues on following page)
Attachment 3d
Case Study #3: Site in Burquitlam
Estimated Residual Land Value based on Rezoning to C-7 Transit Village at 4.5 FSR (strata) (rezoning only; with rapid transit premium)
Major Assumptions (shading indicates figures that are inputs; unshaded cells are formulas)
Site Size 46,650 sq.ft.
200 feet of frontage
Existing Base Density 1.05 FSR
Increased Density 1 1.45 FSR
Increased Density 2 2.00 FSR
Density with Bonuses 4.50 FSR
Assumed Commercial Density 0.25 FSR
Residential Density Before Exclusions 4.25 FSR
Enclosed Balconies 0.00 0% of residential
Storage 0.00 0.0 sf per unit
Effective Residential Density After Bonuses and Exclusions 4.25 FSR
Total Effective Gross Density After Bonuses and Exclusions 4.50 FSR
Total Gross Floorspace 209,925 sf
Concept Gross SF Efficiency
Net Saleable
or Rentable Avg Unit Size
Number of
Units
Parking Stalls
per Unit or
1000 sf
Parking
Stalls
Strata Residential 198,263 85% 168,523 802 210 1.1 231
Retail 11,663 100% 11,663 n/a n/a 19
Office 0 95% 0 n/a n/a 0
Total 209,925 180,186 210 250
Revenue/Value
Strata Residential $900 per net square foot
Retail* $700 per net square foot including parking revenue (see separate calculations)
Office $0 per net square foot including parking revenue (see separate calculations)
Pre Construction Costs
Upfront Compensation to Existing Tenants $0
Tenant Relocation $0
Allowance for Demolition of Existing Buildings $325,900 or $20 per sq. ft. of existing building
Allowance for Remediation $0
Site Preparation/Fill $0
On and Off-Site Servicing $213,415 $3,500 per lineal metre of frontage
Density Bonus Contribution 1 $0 psf of bonus density
Density Bonus Contribution 2 $0 psf of bonus density
Rezoning Costs $350,000
Construction Costs
Hard Construction Costs
Market Strata Residential Area $310 per gross sq.ft. of residential area
Retail Area (shell space - no TI) $250 per gross sq.ft. of retail area
Office Area (shell space - no TI) $250 per gross sq.ft. of commercial area
Cost Per Garage/Underground Parking Stall $65,000 per underground/structured parking stall
Overall Costs Per Square Foot $384 per gross sq.ft.
Sustainability Premium 0%
Total Estimated Cost per Square Foot $384
Hard Cost Used in Analysis $384
Site Landscaping $0 or $0 psf of site area on 50% of site
Public Art Contribution $0.00 per sq. ft.
Soft costs and Professional Fees 8.0% of hard costs, landscaping and site prep/servicing costs
Development management 3.0% of hard costs, landscaping and site prep/servicing costs and soft costs
Fees, legal and survey for rental portion $0
Contingency on hard and soft costs 5.0% of hard, soft and management costs
Government Levies
GVS & DD Sewer Levy - Strata Apartment $3,530 per apartment unit
GVS & DD Sewer Levy - Commercial $2.67 per sq.ft. of commercial space
TransLink - Strata Apartment Residential $1,200 per market unit
TransLink - Commercial $1.25 per sq.ft. of commercial space
Market Strata Apartment DCCs $17.00 per sq.ft. of floorspace
Retail DCCs $7.15 per sq.ft. of floorspace
Office DCCs $7.15 per sq.ft. of floorspace
School Site Acquisition Charge $0 per unit

EVALUATION OF LAND VALUE CAPTURE AND URBAN DEVELOPMENT AS SOURCES OF REVENUE FOR TRANSLINK
PAGE 113
Attachment 3d – continued
(continues on following page)
Financing
Interim financing 5.0% assuming a 2.50 year construction period
Financing charged on 50% of land and 75% of construction costs
Financing fees 1.25%
Commissions and Marketing
Commissions on Strata Residential 3.0% of gross strata market residential revenue
Marketing on Strata Residential 2.0% of gross strata market residential revenue
Commissions on Sale of Commercial 2.0% of gross commercial value
Leasing Commissions on Commercial Space $5.00 per sq.ft.
Tenant Improvement Allowance on Retail Space $0.00 per sq.ft.
Tenant Improvement Allowance on Office Space $0.00 per sq.ft.
Other Costs and Allowances
Property Taxes 0.339% of assessed value
Assumed current assessment (Year 1 of analysis) $26,638,200
Assumed assessment after 1 year of construction (Year 2 of analysis) $79,917,281 (50% of completed project value)
Developer's Profit 15.0% of total costs or 13.0% of gross market revenue/value
School Tax Surcharge During Development*
Tax Rate 0.2% between $3.0-$4.0 million, and0.4% over $4.0 million
Residential Portion of current assessment (Year 1 of analysis) $26,638,200
Assumed residential portion of assessment after 1 year of construction $75,835,406 (50% of completed residential project value)
*Assumes BC Owner
*Retail Value Assumptions
Lease Rate NNN $35.00 psf per year
Vacancy and Non Recoverable Allowance 5.00%
Capitalization Rate 4.75%
Capitalized Value per 1000 SF Gross
Rental Rev $408,188
Vacancy $20,409
NOI $387,778
Capitalized Value $8,163,750
Value psf of net leasable space $700.00 psf

EVALUATION OF LAND VALUE CAPTURE AND URBAN DEVELOPMENT AS SOURCES OF REVENUE FOR TRANSLINK
PAGE 114
Attachment 3d – continued
Analysis
Revenue
Strata Sales Revenue $151,670,813
Gross Retail Value $8,163,750
Gross Office Value $0
Total Gross Value $159,834,563
Less Commissions on Strata $4,550,124
Less Commissions on Commercial $163,275
Net Sales Revenue/Value $155,121,163
Project Costs
Upfront Compensation to Existing Tenants $0
Tenant Relocation $0
Allowance for Demolition of Existing Buildings $325,900
Allowance for Remediation $0
Site Preparation/Fill $0
On and Off-Site Servicing $213,415
Density Bonus Contribution $0
Rezoning Costs $350,000
Hard Construction Costs $80,627,000
Site Landscaping $0
Public Art Contribution $0
Soft costs and Professional Fees $6,521,305
Development management $2,641,129
Fees, legal and survey for rental portion $0
Contingency on hard and soft costs $4,533,937
Marketing on Strata Units $3,033,416
Leasing Commissions on Commercial Space $58,313
Tenant Improvement Allowance on Retail Space $0
Tenant Improvement Allowance on Office Space $0
GVS & DD Sewer Levy - Strata Apartment $741,300
GVS & DD Sewer Levy - Commercial $31,139
TransLink - Strata Apartment Residential $252,000
TransLink - Rental Residential $0
TransLink - Commercial $14,578
Market Strata Apartment DCCs $3,370,710
Retail DCCs $83,428
Office DCCs $0
School Site Acquisition Charge $0
Less property tax allowance during approvals/development $542,298
Less School Tax Surcharge During Development $572,842
Interim financing on construction costs $4,844,056
Financing fees/costs $1,019,595
Less Net GST (assuming builder holds units) $0
Total Project Costs Before Land $109,776,361 which works out to $523 psf of gross floor area
Developer's Profit $20,842,427
Residual to Land and Land Carry $24,502,376
Less financing on land during construction and approvals $1,635,534
Less financing fee on land loan $128,626
Less property closing costs $1,005,565
Residual Land Value $21,732,651
Residual Value per sq.ft. of site $466
Residual Value per sq.ft. of FSR $104
Residual Value per sq.ft. of gross buildable floorspace $104

EVALUATION OF LAND VALUE CAPTURE AND URBAN DEVELOPMENT AS SOURCES OF REVENUE FOR TRANSLINK
PAGE 115
Attachment 4a
Attachment 4a
Case Study #4: Site in Fleetwood
Estimated Existing Value based on Income Potential
Major Assumptions
Site and Building Size
Site Size 37,034 sq.ft. or 521 by 71
Assumed Density 0.194 FAR
Total Commercial Space 7,200 sq.ft.
Office 0 sq.ft. with 90% rentable
Retail 7,200 sq.ft. with 100% rentable
Revenue and Value
Average Lease Rate for Office Space $0.00 per sq.ft. net, base building with no TI
Average Lease Rate for Retail Space $22.50 per sq.ft. net, base building
Capitalization Rate 5.00%
Value of Office Space Upon Lease-up $0.00
Value of Retail and Service Space Upon Lease-up $450 per sq.ft. of leasable area
Vacancy and non recoverables 5.00%
Estimated Overall Value
Capitalized Value of Office Space $0
Capitalized Value of Retail/Service Space $3,078,000
Total Value of Commercial $3,078,000

EVALUATION OF LAND VALUE CAPTURE AND URBAN DEVELOPMENT AS SOURCES OF REVENUE FOR TRANSLINK
PAGE 116
Attachment 4b
(continues on following page)
Attachment 4b
Case Study #4: Site in Fleetwood
Estimated Residual Land Value based on Existing CHI Zoning at 1.0 FSR (retail plus limited office uses)
Assumptions
Site and Building Size Assumptions:
Assumed Site Size 37,034 or 0.85 acre
FAR 1.00
Project Size 37,034
Retail Area 11,110 sq. ft.
Office Area 25,924 sq. ft.
Rentable Area (Retail) 11,110 sq. ft. or 100% of gross area
Rentable Area (Office) 23,331 sq. ft. or 90% of gross area
Common Area (Shared) 7,407 sq. ft. or 20% of gross area
Parking (Retail) 3 stall per 100 square metres of gross area
Parking (Office) 1.4 stall per 100 square metres of gross area
Total Stalls 61
Underground/structured Parking Stalls 0
Surface Parking Stalls 61
Revenue and Value Assumptions:
Average Net Lease Rate (Retail) $30.00 per sq.ft. of rentable area
Average Net Lease Rate (Office) $27.50 per sq.ft. of rentable area
Operating Costs (Retail) $15.00 per sq.ft. of rentable area
Operating Costs (Office) $10.00 per sq.ft. of rentable area
Annual Vacancy Allowance 2.0%
Property Management 0.0% of lease revenue (included in operating costs)
Structural Allowance 0.0% of lease revenue
Assumed Net Parking Revenue $75 per stall per month
Capitalization Rate 5.00%
Profit Allowance 13.0% of value or 15.0% of costs
Cost Assumptions:
Demolition Allowance $72,000
Site Servicing (sidewalks, landscaping, etc) $555,415
Allowance for piling, stabilization $0 per gross sq.ft.
Building Construction Costs (to base building retail) $250 per sq.ft.
Building Construction Costs (to base building office) $250 per sq.ft.
Parking Construction Costs $0 per stall (assuming underground)
Parking Construction Costs $7,500 per stall (assuming at grade)
Base Building Hard Construction Costs $262 per sq.ft. buildable (including parking)
Allowance to Finish Common Areas $50 per sq.ft. of common area
Fit-up Allowance Retail $25 per rentable square foot
Fit-up Allowance Office $50 per rentable square foot
Soft Costs (including project management) 12% of hard costs
Contingency 5.0% of hard and soft costs
City-Wide DCC $10.92 per sq. ft. floorspace
City-Centre DCC $0.00 per sq. ft. floorspace
Metro Vancouver DCC $2.67 per sq. ft. of floorspace
Interim Financing 5.0% on 50% of all costs assuming a 1.00 year construction period
Share of Construction Costs Financed 75.0%
Share of Land Costs Financed 75.0%
Property Taxes During Development 1.02% applied to land value in Year 1 $4,119,200
applied to 50% of gross value of building in Year 2, which is: $9,926,276
Upfront Leasing Commissions 17% of Year 1 revenue
Marketing $50,000
Lease-up period after construction complete 6 months, or 0.5 years
Assumed up-front vacancy cost during lease-up $42.50 per sq.ft. (i.e. lease revenue+operating costs) on 25% of space during lease-up
Sales Commission 2%

EVALUATION OF LAND VALUE CAPTURE AND URBAN DEVELOPMENT AS SOURCES OF REVENUE FOR TRANSLINK
PAGE 117
Attachment 4b – continued
Analysis
Revenue
Lease Revenue $955,422
Recovered Operating Costs $417,373
Parking Income $19,800
Total Gross Revenue $1,392,595
Less Operating Costs $399,967
Less Management $0
Less Structural $0
Net Operating Income $992,628
Capitalized Value $19,852,553
Less Commission $397,051
Net Proceeds $19,455,502
Total Value per sq.ft. buildable $525
Costs
Demolition Allowance $72,000
Site Servicing $555,415
Allowance for piling, stabilization $0
Hard Construction (including parking) $9,702,908
Allowance to Finish Common Areas $370,340
Fit-up Allowance Retail $277,755
Fit-up Allowance Office $1,166,571
Upfront Leasing Commissions $162,422
Marketing $50,000
Upfront Vacancy Cost during Lease-up $196,743
Soft Costs (including project management) $1,164,349
Contingency $543,363
City-Wide DCC $404,411
City-Centre DCC $0
Metro Vancouver DCC $98,881
Property Taxes during Development $63,097
Interim Financing $278,030
Total Costs Before Land and Profit $15,106,284 which works out to $408 per sq.ft. buildable
Developer's Profit $2,588,773
Residual to Land and Land Carry
Land Residual Before Holding Costs $1,760,445
Less interim financing on land $89,123
Less property transfer tax $1,566
Residual Land Value $1,669,756 or $1,963,994 per acre
Residual Value per sq.ft. of site $45
Residual Value per sq.ft. of FSR $45
Residual Value per sq.ft. of gross buildable floorspace $45

EVALUATION OF LAND VALUE CAPTURE AND URBAN DEVELOPMENT AS SOURCES OF REVENUE FOR TRANSLINK
PAGE 118
Attachment 4c
(continues on following page)
Attachment 4c
Case Study #4: Site in Fleetwood
Estimated Residual Land Value based on Rezoning to 4.0 FSR (strata) (rezoning only; no rapid transit premium)
Major Assumptions (shading indicates figures that are inputs; unshaded cells are formulas)
Site and Building Size
Gross Parcel Size 37,034 sq.ft. 0.85 acre
Dedications 0 sq.ft.
Site Size 37,034 sq.ft. or
Site Frontage 521 ft
Base Density 2.5 FAR
Bonus Density 1.5 FAR
Exclusions 0.0 FAR
Total Density 4.0 FAR
Total Gross floorspace 148,136 sq.ft.
Gross residential floorspace 137,026 sq.ft.
Gross commercial floorspace 11,110 sq.ft.
Concept Gross SF Efficiency
Net Saleable
or Rentable Avg Unit Size
Number of
Units
Parking Stalls
per Unit or
1075 sf
Parking
Stalls
Strata Residential 125,916 83.0% 104,510 800 131 1.5 197
Rental 0 85% 0 565 0 1.5 0
Retail 11,110 100% 11,110 n/a n/a 3.00 31
Office 0 95% 0 n/a n/a 0.0 0
Total 137,026 115,620 131 228
Revenue/Value
Strata Residential $760 per net square foot
Rental $0 per net square foot (see separate calculations)
Retail* $686 per net square foot including parking revenue (see separate calculations)
Office $0 per net square foot including parking revenue (see separate calculations)
Pre Construction Costs
Upfront Compensation to Existing Tenants $0
Tenant Relocation $0
Allowance for Demolition of Existing Buildings $72,000
Allowance for Remediation $0
Site Preparation/Fill $0
Standard Site Servicing $555,415 $3,500 per lineal metre of frontage
Amenity Contributions on Base Density
Community Amenity Contribution Residential $1,458 per unit on average
Affordable Housing Contribution $1,000 per strata unit
Public Art Contribution (Allowance) $1.95 psf of gross building
Undergrounding Utilities $0.00 psf of gross building
Community Amenity Contribution Non-Residential $0.00 psf of site area
Amenity Contributions on Bonus Density
Community Amenity Contribution Residential $0 per unit on average
Affordable Housing Contribution $0 per strata unit
Public Art Contribution (Allowance) $0.00 psf of gross building
Undergrounding Utilities $0.00 psf of gross building
Community Amenity Contribution Non-Residential $0.00 psf of site area
Rezoning Costs $350,000
Construction Costs
Hard Construction Costs
Market Strata Residential Area $310 per gross sq.ft. of residential area
Rental Residential Area $0 per gross sq.ft. of rental residential area
Retail Area (shell space - no TI) $250 per gross sq.ft. of retail area
Office Area (shell space - no TI) $0 per gross sq.ft. of commercial area
Cost Per Garage/Underground Parking Stall $45,000 per underground/structured parking stall
Overall Costs Per Square Foot $380.01 per gross sq.ft.
Sustainability Premium 0%
Total Estimated Cost per Square Foot $380
Hard Cost Used in Analysis $380
Site Landscaping $185,170 or $10 psf of site area on 50% of site
Electrical Charging Station $0 - stations $0 per station
Other $0
Soft costs and Professional Fees 8.0% of hard costs, landscaping and site prep/servicing costs
Development management 3.0% of hard costs, landscaping and site prep/servicing costs and soft costs
Fees, legal and survey for rental portion $0
Contingency on hard and soft costs 5.0% of hard, soft and management costs

EVALUATION OF LAND VALUE CAPTURE AND URBAN DEVELOPMENT AS SOURCES OF REVENUE FOR TRANSLINK
PAGE 119
Attachment 4c – continued
(continues on following page)
Government Levies
GVS & DD Sewer Levy - Strata Apartment $3,530 per apartment unit
GVS & DD Sewer Levy - Townhouse $0 per townhouse unit
GVS & DD Sewer Levy - Rental Residential $3,530 per unit
GVS & DD Sewer Levy - Commercial $2.67 per sq.ft. of commercial space
TransLink - Strata Apartment Residential $1,200 per market unit
TransLink - Townhouse $0 per market unit
TransLink - Rental Residential $1,200 per unit
TransLink - Commercial $1.25 per sq.ft. of commercial space
Market Strata Apartment DCCs $21.38 per sq.ft. of floorspace
Market Townhouse DCCs $0.00 per sq.ft. of floorspace
Rental Residential DCCs $21.38 per sq.ft. of floorspace
Retail DCCs $10.92 per sq.ft. of floorspace
Office DCCs $0.00 per sq.ft. of floorspace
School Site Acquisition Charge $600 per unit
Financing
Interim financing 5.0% assuming a 2.25 year construction period
Financing charged on 75% of land and 75% of construction costs
Financing fees 1.25%
Commissions and Marketing
Commissions on Strata Residential 3.0% of gross strata market residential revenue
Marketing on Strata Residential 2.0% of gross strata market residential revenue
Commissions on Sale of Commercial 2.0% of gross commercial value
Commission on Sale of Rental Units 2.0% of value
Initial Lease Up Costs on Rental Units $2,000 per unit
Leasing Commissions on Commercial Space $5.00 per sq.ft.
Tenant Improvement Allowance on Retail Space $25.00 per sq.ft.
Tenant Improvement Allowance on Office Space $50.00 per sq.ft.
Other Costs and Allowances
Net GST on Rental Units 3.20% of capitalized value of rental units
Property Taxes 0.326% of assessed value
Assumed current assessment (Year 1 of analysis) $4,119,200
Assumed assessment after 1 year of construction (Year 2 of analysis) $43,407,922 (50% of completed project value)
Developer's Profit 15.0% of total costs or 13.0% of gross market revenue/value
School Tax Surcharge During Development*
Tax Rate 0.2% between $3.0-$4.0 million, and0.4% over $4.0 million
Residential Portion of current assessment (Year 1 of analysis) $4,119,200
Assumed residential portion of assessment after 1 year of construction $39,713,780 (50% of completed residential project value)
*Assumes BC Owner
*Retail Value Assumptions
Lease Rate NNN $35.00 psf per year
Vacancy and Non Recoverable Allowance 5.00%
Capitalization Rate 5.00%
Capitalized Value per 1000 SF Gross
Rental Rev $35,000
Vacancy $1,750
NOI $33,250
Capitalized Value $665,000
Value psf of net leasable space $665 psf

EVALUATION OF LAND VALUE CAPTURE AND URBAN DEVELOPMENT AS SOURCES OF REVENUE FOR TRANSLINK
PAGE 120
Attachment 4c – continued
Analysis
Revenue
Strata Sales Revenue $79,427,560
Rental Value $0
Gross Retail Value $7,388,283
Gross Office Value $0
Total Gross Value $86,815,843
Less Commissions on Strata $2,382,827
Less Commissions on Rental $0
Less Commissions on Commercial $147,766
Net Sales Revenue/Value $84,285,251
Project Costs
Upfront Compensation to Existing Tenants $0
Tenant Relocation $0
Allowance for Demolition of Existing Buildings $72,000
Allowance for Remediation $0
Site Preparation/Fill $0
Standard Site Servicing $555,415
Electrical Charging Station $0
Amenity Contributions on Base Density
Community Amenity Contribution Residential $119,371
Affordable Housing Contribution $81,875
Public Art Contribution (Allowance) $180,546
Undergrounding Utilities $0
Community Amenity Contribution Non-Residential $0
Amenity Contributions on Bonus Density
Community Amenity Contribution Residential $0
Affordable Housing Contribution $0
Public Art Contribution (Allowance) $0
Undergrounding Utilities $0
Community Amenity Contribution Non-Residential $0
Rezoning Costs $350,000
Hard Construction Costs $52,071,386
Site Landscaping $185,170
Electrical Charging Station $0
Other $0
Soft costs and Professional Fees $4,283,501
Development management $1,734,818
Fees, legal and survey for rental portion $0
Contingency on hard and soft costs $2,962,615
Marketing on Strata Units $1,588,551
Initial Lease Up Costs on Rental Units $0
Leasing Commissions on Commercial Space $55,551
Tenant Improvement Allowance on Retail Space $277,755
Tenant Improvement Allowance on Office Space $0
GVS & DD Sewer Levy - Strata Apartment $462,430
GVS & DD Sewer Levy - Townhouse $0
GVS & DD Sewer Levy - Rental Residential $0
GVS & DD Sewer Levy - Commercial $29,664
TransLink - Strata Apartment Residential $157,200
TransLink - Townhouse $0
TransLink - Rental Residential $0
TransLink - Commercial $13,888
Market Strata Apartment DCCs $2,692,076
Market Townhouse DCCs $0
Rental Residential DCCs $0
Retail DCCs $121,323
Office DCCs $0
School Site Acquisition Charge $78,600
Less property tax allowance during approvals/development $197,261
Less School Tax Surcharge During Development $184,784
Interim financing on construction costs $2,887,978
Financing fees/costs $668,848
Less Net GST (assuming builder holds units) $0
Total Project Costs Before Land $72,012,606 which works out to $486 per sq.ft.
Developer's Profit $11,320,786
Residual to Land and Land Carry $951,859
Less financing on land during construction and approvals $87,363
Less financing fee on land loan $7,294
Less property closing costs -$33,783
Residual Land Value $890,985
Residual Value per sq.ft. of site $24
Residual Value per sq.ft. of FSR $6
Residual Value per sq.ft. of gross buildable floorspace $6

EVALUATION OF LAND VALUE CAPTURE AND URBAN DEVELOPMENT AS SOURCES OF REVENUE FOR TRANSLINK
PAGE 121
Attachment 4d
(continues on following page)
Attachment 4d
Case Study #4: Site in Fleetwood
Estimated Residual Land Value based on Rezoning to 4.0 FSR (strata) (rezoning only; with rapid transit premium)
Major Assumptions (shading indicates figures that are inputs; unshaded cells are formulas)
Site and Building Size
Gross Parcel Size 37,034 sq.ft. 0.85 acre
Dedications 0 sq.ft.
Site Size 37,034 sq.ft. or
Site Frontage 521 ft
Base Density 2.5 FAR
Bonus Density 1.5 FAR
Exclusions 0.0 FAR
Total Density 4.0 FAR
Total Gross floorspace 148,136 sq.ft.
Gross residential floorspace 137,026 sq.ft.
Gross commercial floorspace 11,110 sq.ft.
Concept Gross SF Efficiency
Net Saleable
or Rentable Avg Unit Size
Number of
Units
Parking Stalls
per Unit or
1075 sf
Parking
Stalls
Strata Residential 125,916 83.0% 104,510 800 131 1.5 197
Rental 0 85% 0 565 0 1.5 0
Retail 11,110 100% 11,110 n/a n/a 3.00 31
Office 0 95% 0 n/a n/a 0.0 0
Total 137,026 115,620 131 228
Revenue/Value
Strata Residential $800 per net square foot
Rental $0 per net square foot (see separate calculations)
Retail $686 per net square foot including parking revenue (see separate calculations)
Office $0 per net square foot including parking revenue (see separate calculations)
Pre Construction Costs
Upfront Compensation to Existing Tenants $0
Tenant Relocation $0
Allowance for Demolition of Existing Buildings $72,000
Allowance for Remediation $0
Site Preparation/Fill $0
Standard Site Servicing $555,415 $3,500 per lineal metre of frontage
Amenity Contributions on Base Density
Community Amenity Contribution Residential $1,458 per unit on average
Affordable Housing Contribution $1,000 per strata unit
Public Art Contribution (Allowance) $1.95 psf of gross building
Undergrounding Utilities $0.00 psf of gross building
Community Amenity Contribution Non-Residential $0.00 psf of site area
Amenity Contributions on Bonus Density
Community Amenity Contribution Residential $0 per unit on average
Affordable Housing Contribution $0 per strata unit
Public Art Contribution (Allowance) $0.00 psf of gross building
Undergrounding Utilities $0.00 psf of gross building
Community Amenity Contribution Non-Residential $0.00 psf of site area
Rezoning Costs $350,000
Construction Costs
Hard Construction Costs
Market Strata Residential Area $310 per gross sq.ft. of residential area
Rental Residential Area $0 per gross sq.ft. of rental residential area
Retail Area (shell space - no TI) $250 per gross sq.ft. of retail area
Office Area (shell space - no TI) $0 per gross sq.ft. of commercial area
Cost Per Garage/Underground Parking Stall $45,000 per underground/structured parking stall
Overall Costs Per Square Foot $380.01 per gross sq.ft.
Sustainability Premium 0%
Total Estimated Cost per Square Foot $380
Hard Cost Used in Analysis $380
Site Landscaping $185,170 or $10 psf of site area on 50% of site
Electrical Charging Station $0 - stations $0 per station
Other $0
Soft costs and Professional Fees 8.0% of hard costs, landscaping and site prep/servicing costs
Development management 3.0% of hard costs, landscaping and site prep/servicing costs and soft costs
Fees, legal and survey for rental portion $0
Contingency on hard and soft costs 5.0% of hard, soft and management costs

EVALUATION OF LAND VALUE CAPTURE AND URBAN DEVELOPMENT AS SOURCES OF REVENUE FOR TRANSLINK
PAGE 122
Attachment 4d – continued
(continues on following page)
Financing
Interim financing 5.0% assuming a 2.25 year construction period
Financing charged on 75% of land and 75% of construction costs
Financing fees 1.25%
Commissions and Marketing
Commissions on Strata Residential 3.0% of gross strata market residential revenue
Marketing on Strata Residential 2.0% of gross strata market residential revenue
Commissions on Sale of Commercial 2.0% of gross commercial value
Commission on Sale of Rental Units 2.0% of value
Initial Lease Up Costs on Rental Units $2,000 per unit
Leasing Commissions on Commercial Space $5.00 per sq.ft.
Tenant Improvement Allowance on Retail Space $25.00 per sq.ft.
Tenant Improvement Allowance on Office Space $50.00 per sq.ft.
Other Costs and Allowances
Net GST on Rental Units 3.20% of capitalized value of rental units
Property Taxes 0.326% of assessed value
Assumed current assessment (Year 1 of analysis) $4,119,200
Assumed assessment after 1 year of construction (Year 2 of analysis) $45,498,121 (50% of completed project value)
Developer's Profit 15.0% of total costs or 13.0% of gross market revenue/value
School Tax Surcharge During Development*
Tax Rate 0.2% between $3.0-$4.0 million, and0.4% over $4.0 million
Residential Portion of current assessment (Year 1 of analysis) $4,119,200
Assumed residential portion of assessment after 1 year of construction $41,803,979 (50% of completed residential project value)
*Assumes BC Owner
*Retail Value Assumptions
Lease Rate NNN $35.00 psf per year
Vacancy and Non Recoverable Allowance 5.00%
Capitalization Rate 5.00%
Capitalized Value per 1000 SF Gross
Rental Rev $35,000
Vacancy $1,750
NOI $33,250
Capitalized Value $665,000
Value psf of net leasable space $665 psf

EVALUATION OF LAND VALUE CAPTURE AND URBAN DEVELOPMENT AS SOURCES OF REVENUE FOR TRANSLINK
PAGE 123
Attachment 4d – continued
Analysis
Revenue
Strata Sales Revenue $83,607,958
Rental Value $0
Gross Retail Value $7,388,283
Gross Office Value $0
Total Gross Value $90,996,241
Less Commissions on Strata $2,508,239
Less Commissions on Rental $0
Less Commissions on Commercial $147,766
Net Sales Revenue/Value $88,340,237
Project Costs
Upfront Compensation to Existing Tenants $0
Tenant Relocation $0
Allowance for Demolition of Existing Buildings $72,000
Allowance for Remediation $0
Site Preparation/Fill $0
Standard Site Servicing $555,415
Electrical Charging Station $0
Amenity Contributions on Base Density
Community Amenity Contribution Residential $119,371
Affordable Housing Contribution $81,875
Public Art Contribution (Allowance) $180,546
Undergrounding Utilities $0
Community Amenity Contribution Non-Residential $0
Amenity Contributions on Bonus Density
Community Amenity Contribution Residential $0
Affordable Housing Contribution $0
Public Art Contribution (Allowance) $0
Undergrounding Utilities $0
Community Amenity Contribution Non-Residential $0
Rezoning Costs $350,000
Hard Construction Costs $52,071,386
Site Landscaping $185,170
Electrical Charging Station $0
Other $0
Soft costs and Professional Fees $4,283,501
Development management $1,734,818
Fees, legal and survey for rental portion $0
Contingency on hard and soft costs $2,962,615
Marketing on Strata Units $1,672,159
Initial Lease Up Costs on Rental Units $0
Leasing Commissions on Commercial Space $55,551
Tenant Improvement Allowance on Retail Space $277,755
Tenant Improvement Allowance on Office Space $0
GVS & DD Sewer Levy - Strata Apartment $462,430
GVS & DD Sewer Levy - Townhouse $0
GVS & DD Sewer Levy - Rental Residential $0
GVS & DD Sewer Levy - Commercial $29,664
TransLink - Strata Apartment Residential $157,200
TransLink - Townhouse $0
TransLink - Rental Residential $0
TransLink - Commercial $13,888
Market Strata Apartment DCCs $2,692,076
Market Townhouse DCCs $0
Rental Residential DCCs $0
Retail DCCs $121,323
Office DCCs $0
School Site Acquisition Charge $78,600
Less property tax allowance during approvals/development $205,789
Less School Tax Surcharge During Development $195,235
Interim financing on construction costs $2,892,306
Financing fees/costs $669,850
Less Net GST (assuming builder holds units) $0
Total Project Costs Before Land $72,120,523 which works out to $487 per sq.ft.
Developer's Profit $11,865,910
Residual to Land and Land Carry $4,353,804
Less financing on land during construction and approvals $399,598
Less financing fee on land loan $33,364
Less property closing costs $111,740
Residual Land Value $3,809,103
Residual Value per sq.ft. of site $103
Residual Value per sq.ft. of FSR $26
Residual Value per sq.ft. of gross buildable floorspace $26

EVALUATION OF LAND VALUE CAPTURE AND URBAN DEVELOPMENT AS SOURCES OF REVENUE FOR TRANSLINK
PAGE 124
Attachment 5a
Attachment 5a
Case Study #5: Site in Lynn Creek
Estimated Existing Value based on Existing Single Family Lot Values
Existing Use Existing
Zoning Total Size
Estimated
Value Per Sq.
Ft.
Total Estimated ValueAssembly
Premium Total Value
SFD RS4 12,400 140$ 1,740,000$ 20% 2,088,000$
SFD RS4 7,480 180$ 1,350,000$ 20% 1,620,000$
SFD RS4 7,060 180$ 1,270,000$ 20% 1,524,000$
SFD RS4 4,200 260$ 1,090,000$ 20% 1,308,000$
31,140 5,450,000$ 6,540,000$

EVALUATION OF LAND VALUE CAPTURE AND URBAN DEVELOPMENT AS SOURCES OF REVENUE FOR TRANSLINK
PAGE 125
Attachment 5b
(continues on following page)
Attachment 5b
Case Study #5: Site in Lynn Creek Town Centre
Estimated Residual Land Value based on Rezoning to 2.5 FSR OCP Density (strata) (rezoning only; no rapid transit premium)
Major Assumptions (shading indicates figures that are inputs; unshaded cells are formulas)
Site and Building Size
Site size 31,146 sq.ft. or 0.72 acre
Base Density - Existing Zoning 0.45 FSR (Deemed Density)
Bonus Density to OCP 2.05 FSR
FSR Exclusions 0.00 FSR (lock off units, amenity space, etc)
Total Density 2.50 FSR
Total Gross floorspace 77,865 sq.ft.
Gross residential floorspace 77,865 sq.ft.
Gross commercial floorspace 0 sq.ft.
Concept Gross SF Efficiency
Net Saleable
or Rentable Avg Unit Size
Number of
Units
Parking Stalls
per Unit or
1000 sf
Parking
Stalls
Strata Residential 77,865 85% 66,185 800 83 1.20 100
Retail 0 100% 0 n/a n/a 1.9 0
Office 0 95% 0 n/a n/a 1.9 0
Total 77,865 66,185 2,683 83 100
Revenue/Value
Strata Residential (woodframe) $800 per net square foot
Retail $0 per net square foot including parking revenue (see separate calculations)
Office $0 per net square foot including parking revenue (see separate calculations)
Pre Construction Costs
Upfront Compensation to Existing Tenants $0
Tenant Relocation $0
Allowance for Demolition of Existing Buildings $0
Allowance for Remediation $0
Site Preparation/Fill $0
Site Servicing $289,291 or $2,500 per lineal metre of frontage
Density Bonus Contribution $0.00 psf of bonus density from base to OCP
Rezoning Costs $200,000 excluded from analysis
Construction Costs
Hard Construction Costs
Market Strata Residential Area $230 per gross sq.ft. of residential area
Retail Area (shell space - no TI) $250 per gross sq.ft. of retail area
Office Area (shell space - no TI) $250 per gross sq.ft. of commercial area
Cost Per Underground Parking Stall $55,000 per underground/structured parking stall
Overall Costs Per Square Foot $301 per gross sq.ft.
Sustainability Premium 0%
Total Estimated Cost per Square Foot $301
Hard Cost Used in Analysis $301
Landscaping $311,460 or $20 psf of site area on 50% of site
Other $0
Soft costs and Professional Fees 8.0% of hard costs, landscaping and site prep/servicing costs
Development management 3.0% of hard costs, landscaping and site prep/servicing costs and soft costs
Fees, legal and survey for rental portion $0
Contingency on hard and soft costs 5.0% of hard, soft and management costs
Government Levies
GVRD Sewer Levy - Strata Residential $1,416 per market unit
GVRD Sewer Levy - Commercial $1.20 per sq.ft. of commercial space
TransLink - Strata Residential $1,200 per market unit
TransLink - Commercial $1.25 per sq.ft. of commercial space
Market Strata Residential DCCs $14.38 per sq.ft. of floorspace
Retail DCCs $11.32 per sq.ft. of floorspace
Office DCCs $11.32 per sq.ft. of floorspace
School Site Acquisition Charge $0.00 per unit
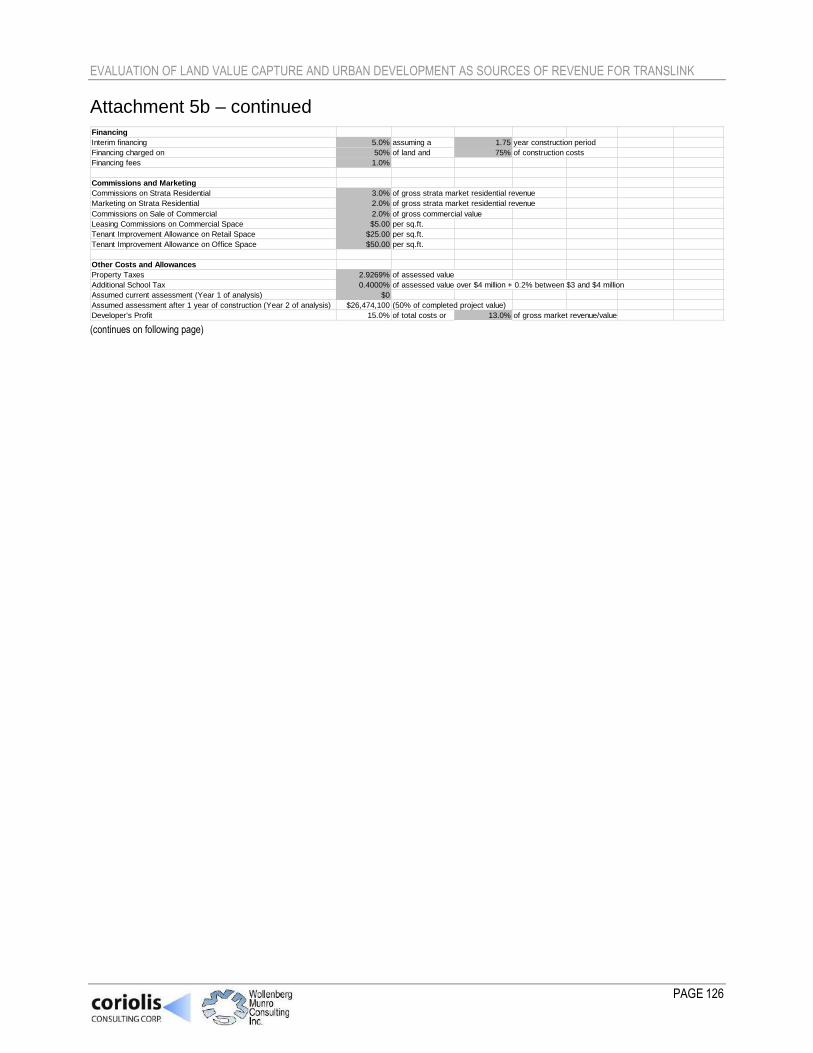
EVALUATION OF LAND VALUE CAPTURE AND URBAN DEVELOPMENT AS SOURCES OF REVENUE FOR TRANSLINK
PAGE 126
Attachment 5b – continued
(continues on following page)
Financing
Interim financing 5.0% assuming a 1.75 year construction period
Financing charged on 50% of land and 75% of construction costs
Financing fees 1.0%
Commissions and Marketing
Commissions on Strata Residential 3.0% of gross strata market residential revenue
Marketing on Strata Residential 2.0% of gross strata market residential revenue
Commissions on Sale of Commercial 2.0% of gross commercial value
Leasing Commissions on Commercial Space $5.00 per sq.ft.
Tenant Improvement Allowance on Retail Space $25.00 per sq.ft.
Tenant Improvement Allowance on Office Space $50.00 per sq.ft.
Other Costs and Allowances
Property Taxes 2.9269% of assessed value
Additional School Tax 0.4000% of assessed value over $4 million + 0.2% between $3 and $4 million
Assumed current assessment (Year 1 of analysis) $0
Assumed assessment after 1 year of construction (Year 2 of analysis) $26,474,100 (50% of completed project value)
Developer's Profit 15.0% of total costs or 13.0% of gross market revenue/value

EVALUATION OF LAND VALUE CAPTURE AND URBAN DEVELOPMENT AS SOURCES OF REVENUE FOR TRANSLINK
PAGE 127
Attachment 5b – continued
Analysis
Revenue
Strata Sales Revenue $52,948,200
Gross Retail Value $0
Gross Office Value $0
Total Gross Value $52,948,200
Less Commissions on Strata $1,588,446
Less Commissions on Commercial $0
Net Sales Revenue/Value $51,359,754
Project Costs
Upfront Compensation to Existing Tenants $0
Tenant Relocation $0
Allowance for Demolition of Existing Buildings $0
Allowance for Remediation $0
Site Preparation/Fill $0
Site Servicing $289,291
Density Bonus Contribution $0
Rezoning Costs $200,000
Hard Construction Costs $23,408,950
Landscaping $311,460
Other $0
Soft costs and Professional Fees $1,936,776
Development management $784,394
Fees, legal and survey for rental portion $0
Contingency on hard and soft costs $1,346,544
Marketing on Strata Units $1,058,964
Leasing Commissions on Commercial Space $0
Tenant Improvement Allowance on Retail Space $0
Tenant Improvement Allowance on Office Space $0
GVRD Sewer Levy - Strata Residential $117,528
GVRD Sewer Levy - Commercial $0
TransLink - Strata Residential $99,600
TransLink - Commercial $0
Market Strata Residential DCCs $1,119,445
Retail DCCs $0
Office DCCs $0
School Site Acquisition Charge $0
Less property tax allowance during approvals/development $581,153
Less school tax allowance during approvals/development $47,922
Interim financing on construction costs $1,027,098
Financing fees/costs $242,468
Less Net GST (assuming builder holds units) $0
Total Project Costs Before Land $32,571,593
Developer's Profit $6,904,445
Residual to Land and Land Carry $11,883,715
Less financing on land during construction and approvals $594,929
Less financing fee on land loan $50,800
Less property purchase tax $459,304
Residual Land Value $10,778,683
Residual Value per sq.ft. of site $346
Residual Value per sq.ft. of FSR $138
Residual Value per sq.ft. of gross buildable floorspace $138

EVALUATION OF LAND VALUE CAPTURE AND URBAN DEVELOPMENT AS SOURCES OF REVENUE FOR TRANSLINK
PAGE 128
Attachment 5c
(continues on following page)
Attachment 5c
Case Study #5: Site in Lynn Creek Town Centre
Estimated Residual Land Value based on Rezoning to 2.5 FSR OCP Density (strata) (rezoning only; with Bus Rapid Transit premium)
Major Assumptions (shading indicates figures that are inputs; unshaded cells are formulas)
Site and Building Size
Site size 31,146 sq.ft. or 0.72 acre
Base Density - Existing Zoning 0.45 FSR (Deemed Density)
Bonus Density to OCP 2.05 FSR
FSR Exclusions 0.00 FSR (lock off units, amenity space, etc)
Total Density 2.50 FSR
Total Gross floorspace 77,865 sq.ft.
Gross residential floorspace 77,865 sq.ft.
Gross commercial floorspace 0 sq.ft.
Concept Gross SF Efficiency
Net Saleable
or Rentable Avg Unit Size
Number of
Units
Parking Stalls
per Unit or
1000 sf
Parking
Stalls
Strata Residential 77,865 85% 66,185 800 83 1.20 100
Retail 0 100% 0 n/a n/a 1.9 0
Office 0 95% 0 n/a n/a 1.9 0
Total 77,865 66,185 2,683 83 100
Revenue/Value
Strata Residential (woodframe) $808 per net square foot
Retail $0 per net square foot including parking revenue (see separate calculations)
Office $0 per net square foot including parking revenue (see separate calculations)
Pre Construction Costs
Upfront Compensation to Existing Tenants $0
Tenant Relocation $0
Allowance for Demolition of Existing Buildings $0
Allowance for Remediation $0
Site Preparation/Fill $0
Site Servicing $289,291 or $2,500 per lineal metre of frontage
Density Bonus Contribution $0.00 psf of bonus density from base to OCP
Rezoning Costs $200,000 excluded from analysis
Construction Costs
Hard Construction Costs
Market Strata Residential Area $230 per gross sq.ft. of residential area
Retail Area (shell space - no TI) $250 per gross sq.ft. of retail area
Office Area (shell space - no TI) $250 per gross sq.ft. of commercial area
Cost Per Underground Parking Stall $55,000 per underground/structured parking stall
Overall Costs Per Square Foot $301 per gross sq.ft.
Sustainability Premium 0%
Total Estimated Cost per Square Foot $301
Hard Cost Used in Analysis $301
Landscaping $311,460 or $20 psf of site area on 50% of site
Other $0
Soft costs and Professional Fees 8.0% of hard costs, landscaping and site prep/servicing costs
Development management 3.0% of hard costs, landscaping and site prep/servicing costs and soft costs
Fees, legal and survey for rental portion $0
Contingency on hard and soft costs 5.0% of hard, soft and management costs
Government Levies
GVRD Sewer Levy - Strata Residential $1,416 per market unit
GVRD Sewer Levy - Commercial $1.20 per sq.ft. of commercial space
TransLink - Strata Residential $1,200 per market unit
TransLink - Commercial $1.25 per sq.ft. of commercial space
Market Strata Residential DCCs $14.38 per sq.ft. of floorspace
Retail DCCs $11.32 per sq.ft. of floorspace
Office DCCs $11.32 per sq.ft. of floorspace
School Site Acquisition Charge $0.00 per unit

EVALUATION OF LAND VALUE CAPTURE AND URBAN DEVELOPMENT AS SOURCES OF REVENUE FOR TRANSLINK
PAGE 129
Attachment 5c – continued
(continues on following page)
Financing
Interim financing 5.0% assuming a 1.75 year construction period
Financing charged on 50% of land and 75% of construction costs
Financing fees 1.0%
Commissions and Marketing
Commissions on Strata Residential 3.0% of gross strata market residential revenue
Marketing on Strata Residential 2.0% of gross strata market residential revenue
Commissions on Sale of Commercial 2.0% of gross commercial value
Leasing Commissions on Commercial Space $5.00 per sq.ft.
Tenant Improvement Allowance on Retail Space $25.00 per sq.ft.
Tenant Improvement Allowance on Office Space $50.00 per sq.ft.
Other Costs and Allowances
Property Taxes 2.9269% of assessed value
Additional School Tax 0.4000% of assessed value over $4 million + 0.2% between $3 and $4 million
Assumed current assessment (Year 1 of analysis) $0
Assumed assessment after 1 year of construction (Year 2 of analysis) $26,738,841 (50% of completed project value)
Developer's Profit 15.0% of total costs or 13.0% of gross market revenue/value

EVALUATION OF LAND VALUE CAPTURE AND URBAN DEVELOPMENT AS SOURCES OF REVENUE FOR TRANSLINK
PAGE 130
Attachment 5c – continued
Analysis
Revenue
Strata Sales Revenue $53,477,682
Gross Retail Value $0
Gross Office Value $0
Total Gross Value $53,477,682
Less Commissions on Strata $1,604,330
Less Commissions on Commercial $0
Net Sales Revenue/Value $51,873,352
Project Costs
Upfront Compensation to Existing Tenants $0
Tenant Relocation $0
Allowance for Demolition of Existing Buildings $0
Allowance for Remediation $0
Site Preparation/Fill $0
Site Servicing $289,291
Density Bonus Contribution $0
Rezoning Costs $200,000
Hard Construction Costs $23,408,950
Landscaping $311,460
Other $0
Soft costs and Professional Fees $1,936,776
Development management $784,394
Fees, legal and survey for rental portion $0
Contingency on hard and soft costs $1,346,544
Marketing on Strata Units $1,069,554
Leasing Commissions on Commercial Space $0
Tenant Improvement Allowance on Retail Space $0
Tenant Improvement Allowance on Office Space $0
GVRD Sewer Levy - Strata Residential $117,528
GVRD Sewer Levy - Commercial $0
TransLink - Strata Residential $99,600
TransLink - Commercial $0
Market Strata Residential DCCs $1,119,445
Retail DCCs $0
Office DCCs $0
School Site Acquisition Charge $0
Less property tax allowance during approvals/development $586,964
Less school tax allowance during approvals/development $48,717
Interim financing on construction costs $1,027,662
Financing fees/costs $242,602
Less Net GST (assuming builder holds units) $0
Total Project Costs Before Land $32,589,486
Developer's Profit $6,973,490
Residual to Land and Land Carry $12,310,376
Less financing on land during construction and approvals $616,288
Less financing fee on land loan $52,623
Less property purchase tax $478,470
Residual Land Value $11,162,995
Residual Value per sq.ft. of site $358
Residual Value per sq.ft. of FSR $143
Residual Value per sq.ft. of gross buildable floorspace $143

EVALUATION OF LAND VALUE CAPTURE AND URBAN DEVELOPMENT AS SOURCES OF REVENUE FOR TRANSLINK
PAGE 131
Attachment 6a
Attachment 6a
Case Study #6: Site in Broadway Corridor
Estimated Existing Value based on Income Potential
Major Assumptions
Site and Building Size
Site Size 17,550 sq.ft. or 150 by 117
Assumed Density 0.00 FSR
Total Commercial Space 15,307 sq.ft.
Office 9,310 sq.ft. with 100% rentable
Retail 5,997 sq.ft. 100% rentable
Revenue and Value
Average Lease Rate for Office Space $25.00 per sq.ft. net, base building with no TI
Average Lease Rate for Retail Space $40.00 per sq.ft. net, base building
Capitalization Rate for Office 4.50%
Capitalization Rate for Retail 4.00%
Value of Office Space Upon Lease-up $556
Value of Retail and Service Space Upon Lease-up $1,000 per sq.ft. of leasable area
Vacancy and non recoverables 5%
Estimated Overall Value
Capitalized Value of Office Space $4,913,611
Capitalized Value of Retail/Service Space $5,697,150
Total Value of Commercial $10,610,761
Plus Rental Units $3,300,000 $550,000 per unit and 6 units
Estimated Value $13,910,761
Acquisition Premium 10%
Total Estimated Value $15,301,837

EVALUATION OF LAND VALUE CAPTURE AND URBAN DEVELOPMENT AS SOURCES OF REVENUE FOR TRANSLINK
PAGE 132
Attachment 6b
(continues on following page)
Attachment 6b
Case Study #6: Site in Broadway Corridor Uptown Office Precinct Estimated Residual Land Value based on Existing C-3A Zoning (commercial) (3.3 FSR)
Assumes developer builds, leases, and then sells and expects a 15% profit margin on total costs
Assumptions
Site and Building Size Assumptions:
Assumed Site Size 17,550 or 0.4 acre
FSR 3.00 FSR
Heritage Density Transfer 0.30 FSR
Density with Bonuses 3.30 FSR
Project Size 57,915 sq. ft.
Gross Office Area 51,773 sq. ft. 2.95 FSR
Gross Retail 6,143 sq. ft. 0.35 FSR
Parking 108 1 per 50m2
Total Stalls 108
Underground/structured Parking Stalls 108
Surface Parking Stalls 0
Strata Office Share 0% of gross site area
Leasehold Office Share 100% of gross site area
Saleable Strata Office 0 sq. ft. or 95% of gross area and 0 parking stalls
Leasable Leasehold Office 49,184 sq. ft. or 95% of gross area and 104 parking stalls
Rentable Area (Retail) 5,835 sq. ft. or 95% of gross area 4 parking stalls
108 total parking stalls
Revenue and Value Assumptions: 43,044 square feet
Average Strata Sales Price (Office) $1,100 per sq.ft. of saleable area 2.5 storeys
Average Net Lease Rate (Office) $37.00 per sq.ft. of rentable area assuming landlord provides fit up allowance
Average Net Lease Rate (Retail) $50.00 per sq.ft. of rentable area assuming landlord provides fit up allowance
Operating Costs (Office) $18.00 per sq.ft. of rentable area
Operating Costs (Retail) $18.00 per sq.ft. of rentable area
Annual Vacancy Allowance 5.0%
Property Management 0.0% of lease revenue (included in operating costs)
Structural Allowance 0.0% of lease revenue
Assumed Net Parking Revenue $150.00 per stall per month
Cap Rate 4.25%
Profit Allowance 13.0% of value or 15.0% of costs
Pre-Construction Costs
Heritage Density $85.00 psf
Cost Assumptions:
Demolition Allowance $335,900 $20 per square foot of existing building area
Site Servicing (sidewalks, landscaping, etc) $274,390 $3,000 per metre of frontage
Allowance for piling, stabilization $0 per gross sq.ft.
Building Construction Costs (to base building office) $300 per sq.ft.
Building Construction Costs (to base building retail) $300 per sq.ft.
Parking Construction Costs $55,000 per stall (assuming underground)
Parking Construction Costs $5,000 per stall (assuming at grade)
Base Building Hard Construction Costs $402 per sq.ft. buildable (including parking)
Allowance to finish common areas $50 per sq.ft. of common area
Fit-up Allowance Office Strata $0 per saleable square foot
Fit-up Allowance Office Leasehold $50 per rentable square foot
Fit-up Allowance Retail $25 per rentable square foot
Soft Costs (including project management) 15% of hard costs
Contingency 3.5% of hard and soft costs
City of Vancouver DCL $20.64 per sq. ft. of floorspace
Layered DCL $0.00 per sq. ft. of floorspace
Metro Vancouver DCL $0.930 per sq. ft. of floorspace
Interim Financing 5.0% on 50% of all costs assuming a 1.75 year construction period
Share of Construction Costs Financed 75.0%
Share of Land Costs Financed 50.0%
Financing Fee 1.5%
Property Taxes During Development 0.9021% applied to land value in Year 1 $26,914,600
applied to 50% of gross value of building in Year 2, which is: $25,795,373
Upfront Leasing Commissions 35% of Year 1 revenue
Marketing $173,745 $3.00 per square foot
Lease-up period after construction complete 6 months, or 0.50 years
Assumed up-front vacancy cost during lease-up $55.00 per sq.ft. (i.e. lease revenue+operating costs) on 50% of space during lease-up
Sales Commission 2.0%

EVALUATION OF LAND VALUE CAPTURE AND URBAN DEVELOPMENT AS SOURCES OF REVENUE FOR TRANSLINK
PAGE 133
Attachment 6b – continued
AnalysisStrata Revenue $0
Lease Revenue $2,005,994
Recovered Operating Costs $990,347
Parking Income $186,613
Total Gross Revenue $3,182,953
Less Operating Costs $990,347
Net Operating Income $2,192,607
Capitalized Value of Leasehold Space $51,590,746
Value of Strata Space $0
Total Value $51,590,746
Less Commission $1,031,815
Net Proceeds $50,558,931
Total Value per sq.ft. buildable $873
Heritage Density $447,525
Demolition Allowance $335,900
Site Servicing $274,390
Allowance for piling, stabilization $0
Hard Construction (including parking) $23,281,830
Allowance to finish common areas $144,788
Fit-Up of Strata Space $0
Fit-Up of Leasehold Space $2,605,078
Upfront Leasing Commissions $702,098
Marketing $173,745
Upfront Vacancy Cost during Lease-up $676,278
Soft Costs (including project management) $3,492,275
Contingency $937,094
City of Vancouver DCL $1,195,366
Layered DCL $0
Metro Vancouver DCL $53,861
Property Taxes during Development $417,317
Interim Financing $1,139,826
Financing fees/costs $403,620
Total Costs Before Land and Profit $36,280,990
Total Costs per sq.ft. buildable $626
Profit: $6,727,433
Land Residual:
Land Residual Before Holding Costs $7,550,508
Less interim financing on land $382,244
Less property taxes during approvals $121,397
Less property closing costs $260,631
Residual Land Value $6,786,235
Residual Value per sq.ft. of site $387
Residual Value per sq.ft. of FSR $117
Residual Value per sq.ft. of gross buildable floorspace $117
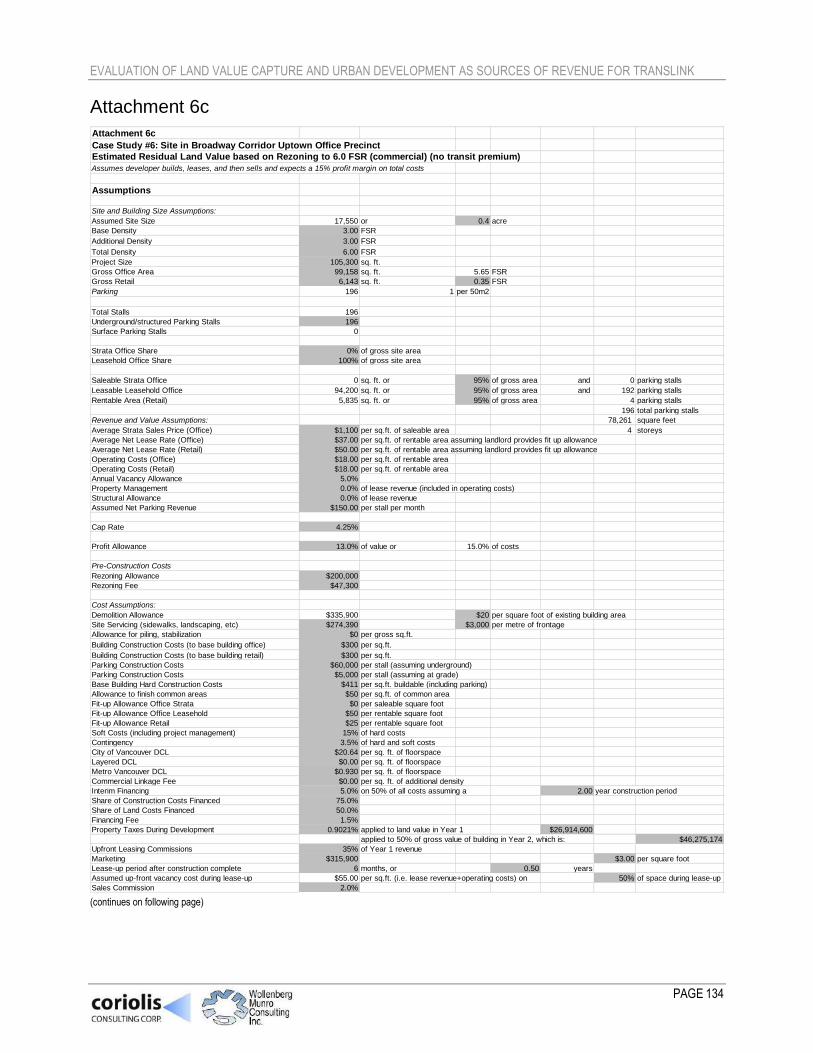
EVALUATION OF LAND VALUE CAPTURE AND URBAN DEVELOPMENT AS SOURCES OF REVENUE FOR TRANSLINK
PAGE 134
Attachment 6c
(continues on following page)
Attachment 6c
Case Study #6: Site in Broadway Corridor Uptown Office Precinct
Estimated Residual Land Value based on Rezoning to 6.0 FSR (commercial) (no transit premium)
Assumes developer builds, leases, and then sells and expects a 15% profit margin on total costs
Assumptions
Site and Building Size Assumptions:
Assumed Site Size 17,550 or 0.4 acre
Base Density 3.00 FSR
Additional Density 3.00 FSR
Total Density 6.00 FSR
Project Size 105,300 sq. ft.
Gross Office Area 99,158 sq. ft. 5.65 FSR
Gross Retail 6,143 sq. ft. 0.35 FSR
Parking 196 1 per 50m2
Total Stalls 196
Underground/structured Parking Stalls 196
Surface Parking Stalls 0
Strata Office Share 0% of gross site area
Leasehold Office Share 100% of gross site area
Saleable Strata Office 0 sq. ft. or 95% of gross area and 0 parking stalls
Leasable Leasehold Office 94,200 sq. ft. or 95% of gross area and 192 parking stalls
Rentable Area (Retail) 5,835 sq. ft. or 95% of gross area 4 parking stalls
196 total parking stalls
Revenue and Value Assumptions: 78,261 square feet
Average Strata Sales Price (Office) $1,100 per sq.ft. of saleable area 4 storeys
Average Net Lease Rate (Office) $37.00 per sq.ft. of rentable area assuming landlord provides fit up allowance
Average Net Lease Rate (Retail) $50.00 per sq.ft. of rentable area assuming landlord provides fit up allowance
Operating Costs (Office) $18.00 per sq.ft. of rentable area
Operating Costs (Retail) $18.00 per sq.ft. of rentable area
Annual Vacancy Allowance 5.0%
Property Management 0.0% of lease revenue (included in operating costs)
Structural Allowance 0.0% of lease revenue
Assumed Net Parking Revenue $150.00 per stall per month
Cap Rate 4.25%
Profit Allowance 13.0% of value or 15.0% of costs
Pre-Construction Costs
Rezoning Allowance $200,000
Rezoning Fee $47,300
Cost Assumptions:
Demolition Allowance $335,900 $20 per square foot of existing building area
Site Servicing (sidewalks, landscaping, etc) $274,390 $3,000 per metre of frontage
Allowance for piling, stabilization $0 per gross sq.ft.
Building Construction Costs (to base building office) $300 per sq.ft.
Building Construction Costs (to base building retail) $300 per sq.ft.
Parking Construction Costs $60,000 per stall (assuming underground)
Parking Construction Costs $5,000 per stall (assuming at grade)
Base Building Hard Construction Costs $411 per sq.ft. buildable (including parking)
Allowance to finish common areas $50 per sq.ft. of common area
Fit-up Allowance Office Strata $0 per saleable square foot
Fit-up Allowance Office Leasehold $50 per rentable square foot
Fit-up Allowance Retail $25 per rentable square foot
Soft Costs (including project management) 15% of hard costs
Contingency 3.5% of hard and soft costs
City of Vancouver DCL $20.64 per sq. ft. of floorspace
Layered DCL $0.00 per sq. ft. of floorspace
Metro Vancouver DCL $0.930 per sq. ft. of floorspace
Commercial Linkage Fee $0.00 per sq. ft. of additional density
Interim Financing 5.0% on 50% of all costs assuming a 2.00 year construction period
Share of Construction Costs Financed 75.0%
Share of Land Costs Financed 50.0%
Financing Fee 1.5%
Property Taxes During Development 0.9021% applied to land value in Year 1 $26,914,600
applied to 50% of gross value of building in Year 2, which is: $46,275,174
Upfront Leasing Commissions 35% of Year 1 revenue
Marketing $315,900 $3.00 per square foot
Lease-up period after construction complete 6 months, or 0.50 years
Assumed up-front vacancy cost during lease-up $55.00 per sq.ft. (i.e. lease revenue+operating costs) on 50% of space during lease-up
Sales Commission 2.0%

EVALUATION OF LAND VALUE CAPTURE AND URBAN DEVELOPMENT AS SOURCES OF REVENUE FOR TRANSLINK
PAGE 135
Attachment 6c – continued
AnalysisStrata Revenue $0
Lease Revenue $3,588,297
Recovered Operating Costs $1,800,630
Parking Income $345,093
Total Gross Revenue $5,734,020
Less Operating Costs $1,800,630
Net Operating Income $3,933,390
Capitalized Value of Leasehold Space $92,550,348
Value of Strata Space $0
Total Value $92,550,348
Less Commission $1,851,007
Net Proceeds $90,699,341
Heritage Density $0
Demolition Allowance $335,900
Site Servicing $274,390
Allowance for piling, stabilization $0
Hard Construction (including parking) $43,278,300
Allowance to finish common areas $263,250
Fit-Up of Strata Space $0
Fit-Up of Leasehold Space $4,855,866
Upfront Leasing Commissions $1,255,904
Marketing $315,900
Upfront Vacancy Cost during Lease-up $1,295,245
Soft Costs (including project management) $6,491,745
Contingency $1,741,952
City of Vancouver DCL $2,173,392
Layered DCL $0
Metro Vancouver DCL $97,929
Commercial Linkage Fee $0
Property Taxes during Development $660,238
Interim Financing $2,364,000
Financing fees/costs $735,795
Total Costs Before Land and Profit $66,139,805 which works out to $628 per sq.ft. buildable
Total Costs per sq.ft. buildable
Profit: $12,068,565
Land Residual:
Land Residual Before Holding Costs $12,490,971
Less interim financing on land $702,617
Less property taxes during approvals $121,397
Less property closing costs $480,547
Residual Land Value $11,186,409

EVALUATION OF LAND VALUE CAPTURE AND URBAN DEVELOPMENT AS SOURCES OF REVENUE FOR TRANSLINK
PAGE 136
Attachment 6d
(continues on following page)
Attachment 6d
Case Study #6: Site in Broadway Corridor Uptown Office Precinct
Estimated Residual Land Value based on Rezoning to 6.0 FSR (commercial) (with transit premium)
Assumes developer builds, leases, and then sells and expects a 15% profit margin on total costs
Assumptions
Site and Building Size Assumptions:
Assumed Site Size 17,550 or 0.4 acre
Base Density 3.00 FSR
Additional Density 3.00 FSR
Total Density 6.00 FSR
Project Size 105,300 sq. ft.
Gross Office Area 99,158 sq. ft. 5.65 FSR
Gross Retail 6,143 sq. ft. 0.35 FSR
Parking 196 1 per 50m2
Total Stalls 196
Underground/structured Parking Stalls 196
Surface Parking Stalls 0
Strata Office Share 0% of gross site area
Leasehold Office Share 100% of gross site area
Saleable Strata Office 0 sq. ft. or 95% of gross area and 0 parking stalls
Leasable Leasehold Office 94,200 sq. ft. or 95% of gross area and 192 parking stalls
Rentable Area (Retail) 5,835 sq. ft. or 95% of gross area 4 parking stalls
196 total parking stalls
Revenue and Value Assumptions: 78,261 square feet
Average Strata Sales Price (Office) $1,100 per sq.ft. of saleable area 4 storeys
Average Net Lease Rate (Office) $40.70 per sq.ft. of rentable area assuming landlord provides fit up allowance
Average Net Lease Rate (Retail) $50.00 per sq.ft. of rentable area assuming landlord provides fit up allowance
Operating Costs (Office) $18.00 per sq.ft. of rentable area
Operating Costs (Retail) $18.00 per sq.ft. of rentable area
Annual Vacancy Allowance 5.0%
Property Management 0.0% of lease revenue (included in operating costs)
Structural Allowance 0.0% of lease revenue
Assumed Net Parking Revenue $150.00 per stall per month
Cap Rate 4.25%
Profit Allowance 13.0% of value or 15.0% of costs
Pre-Construction Costs
Rezoning Allowance $200,000
Rezoning Fee $47,300
Cost Assumptions:
Demolition Allowance $335,900 $20 per square foot of existing building area
Site Servicing (sidewalks, landscaping, etc) $274,390 $3,000 per metre of frontage
Allowance for piling, stabilization $0 per gross sq.ft.
Building Construction Costs (to base building office) $300 per sq.ft.
Building Construction Costs (to base building retail) $300 per sq.ft.
Parking Construction Costs $60,000 per stall (assuming underground)
Parking Construction Costs $5,000 per stall (assuming at grade)
Base Building Hard Construction Costs $411 per sq.ft. buildable (including parking)
Allowance to finish common areas $50 per sq.ft. of common area
Fit-up Allowance Office Strata $0 per saleable square foot
Fit-up Allowance Office Leasehold $50 per rentable square foot
Fit-up Allowance Retail $25 per rentable square foot
Soft Costs (including project management) 15% of hard costs
Contingency 3.5% of hard and soft costs
City of Vancouver DCL $20.64 per sq. ft. of floorspace
Layered DCL $0.00 per sq. ft. of floorspace
Metro Vancouver DCL $0.930 per sq. ft. of floorspace
Commercial Linkage Fee $0.00 per sq. ft. of additional density
Interim Financing 5.0% on 50% of all costs assuming a 2.00 year construction period
Share of Construction Costs Financed 75.0%
Share of Land Costs Financed 50.0%
Financing Fee 1.5%
Property Taxes During Development 0.9021% applied to land value in Year 1 $26,914,600
applied to 50% of gross value of building in Year 2, which is: $50,170,606
Upfront Leasing Commissions 35% of Year 1 revenue
Marketing $315,900 $3.00 per square foot
Lease-up period after construction complete 6 months, or 0.50 years
Assumed up-front vacancy cost during lease-up $58.70 per sq.ft. (i.e. lease revenue+operating costs) on 50% of space during lease-up
Sales Commission 2.0%
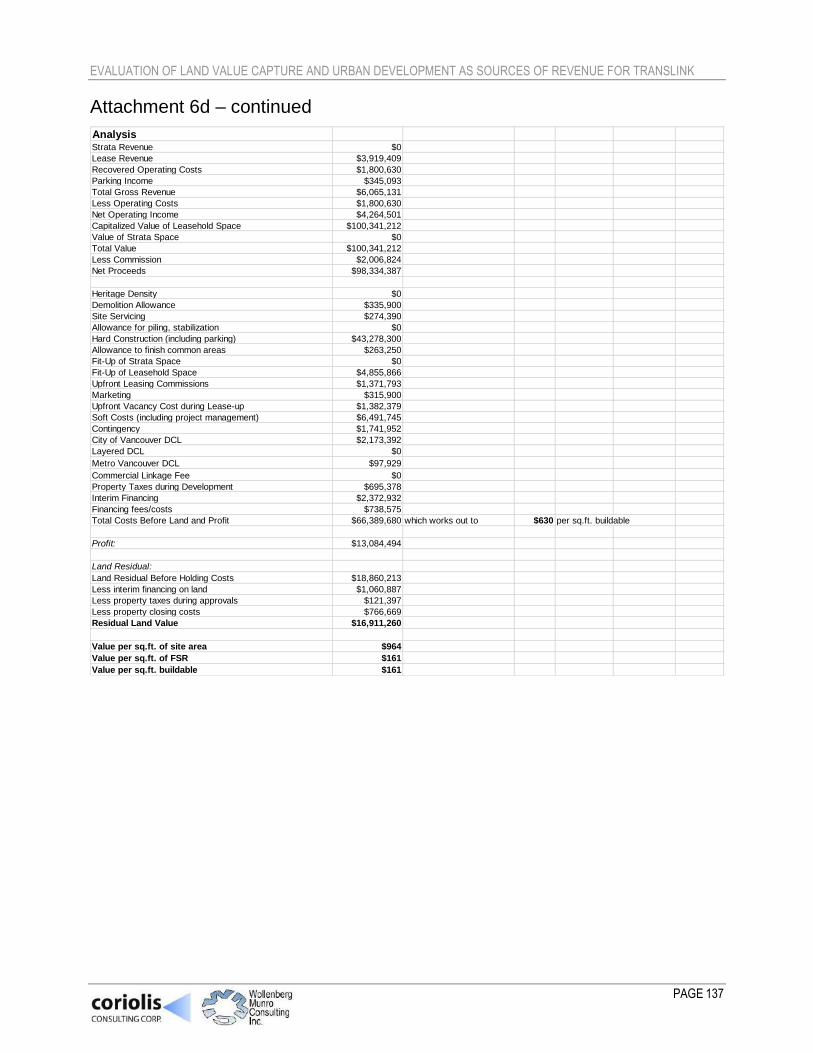
EVALUATION OF LAND VALUE CAPTURE AND URBAN DEVELOPMENT AS SOURCES OF REVENUE FOR TRANSLINK
PAGE 137
Attachment 6d – continued
AnalysisStrata Revenue $0
Lease Revenue $3,919,409
Recovered Operating Costs $1,800,630
Parking Income $345,093
Total Gross Revenue $6,065,131
Less Operating Costs $1,800,630
Net Operating Income $4,264,501
Capitalized Value of Leasehold Space $100,341,212
Value of Strata Space $0
Total Value $100,341,212
Less Commission $2,006,824
Net Proceeds $98,334,387
Heritage Density $0
Demolition Allowance $335,900
Site Servicing $274,390
Allowance for piling, stabilization $0
Hard Construction (including parking) $43,278,300
Allowance to finish common areas $263,250
Fit-Up of Strata Space $0
Fit-Up of Leasehold Space $4,855,866
Upfront Leasing Commissions $1,371,793
Marketing $315,900
Upfront Vacancy Cost during Lease-up $1,382,379
Soft Costs (including project management) $6,491,745
Contingency $1,741,952
City of Vancouver DCL $2,173,392
Layered DCL $0
Metro Vancouver DCL $97,929
Commercial Linkage Fee $0
Property Taxes during Development $695,378
Interim Financing $2,372,932
Financing fees/costs $738,575
Total Costs Before Land and Profit $66,389,680 which works out to $630 per sq.ft. buildable
Profit: $13,084,494
Land Residual:
Land Residual Before Holding Costs $18,860,213
Less interim financing on land $1,060,887
Less property taxes during approvals $121,397
Less property closing costs $766,669
Residual Land Value $16,911,260
Value per sq.ft. of site area $964
Value per sq.ft. of FSR $161
Value per sq.ft. buildable $161
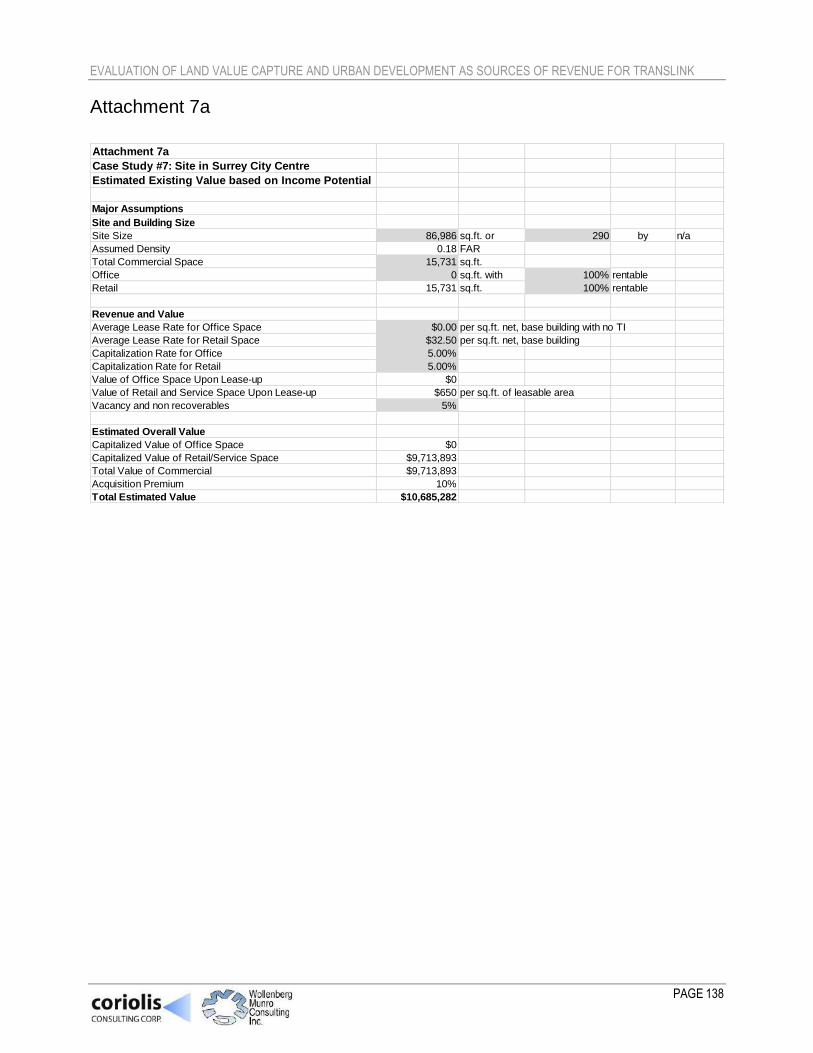
EVALUATION OF LAND VALUE CAPTURE AND URBAN DEVELOPMENT AS SOURCES OF REVENUE FOR TRANSLINK
PAGE 138
Attachment 7a
Attachment 7a
Case Study #7: Site in Surrey City Centre
Estimated Existing Value based on Income Potential
Major Assumptions
Site and Building Size
Site Size 86,986 sq.ft. or 290 by n/a
Assumed Density 0.18 FAR
Total Commercial Space 15,731 sq.ft.
Office 0 sq.ft. with 100% rentable
Retail 15,731 sq.ft. 100% rentable
Revenue and Value
Average Lease Rate for Office Space $0.00 per sq.ft. net, base building with no TI
Average Lease Rate for Retail Space $32.50 per sq.ft. net, base building
Capitalization Rate for Office 5.00%
Capitalization Rate for Retail 5.00%
Value of Office Space Upon Lease-up $0
Value of Retail and Service Space Upon Lease-up $650 per sq.ft. of leasable area
Vacancy and non recoverables 5%
Estimated Overall Value
Capitalized Value of Office Space $0
Capitalized Value of Retail/Service Space $9,713,893
Total Value of Commercial $9,713,893
Acquisition Premium 10%
Total Estimated Value $10,685,282

EVALUATION OF LAND VALUE CAPTURE AND URBAN DEVELOPMENT AS SOURCES OF REVENUE FOR TRANSLINK
PAGE 139
Attachment 7b
(continues on following page)
Attachment 7b
Case Study #7: Site in Surrey City Centre
Estimated Residual Land Value based on Rezoning to 3.5 FSR (mixed use strata above retail) (no transit premium)
Major Assumptions (shading indicates figures that are inputs; unshaded cells are formulas)
Site and Building Size
Gross Parcel Size 86,986 sq.ft. 2.00 acre
Dedications 0 sq.ft.
Site Size 86,986 sq.ft. or
Site Frontage 290 ft
Base Density 3.5 FAR
Bonus Density 0.0 FAR
Exclusions 0.0 FAR
Total Density 3.5 FAR
Total Gross floorspace 304,451 sq.ft.
Gross residential floorspace 278,355 sq.ft.
Gross commercial floorspace 26,096 sq.ft.
Concept Gross SF Efficiency
Net Saleable
or Rentable Avg Unit Size
Number of
Units
Parking Stalls
per Unit or
1075 sf
Parking
Stalls
Strata Residential 252,259 83.0% 209,375 800 262 1.0 262
Rental 0 85% 0 565 0 1.0 0
Retail 26,096 100% 26,096 n/a n/a 3.00 73
Office 0 95% 0 n/a n/a 0.0 0
Total 278,355 235,471 262 335
Revenue/Value
Strata Residential $798 per net square foot
Rental $0 per net square foot (see separate calculations)
Retail* $855 per net square foot including parking revenue (see separate calculations)
Office $0 per net square foot including parking revenue (see separate calculations)
Pre Construction Costs
Upfront Compensation to Existing Tenants $0
Tenant Relocation $0
Allowance for Demolition of Existing Buildings $314,620
Allowance for Remediation $0
Site Preparation/Fill $0
Standard Site Servicing $309,451 $3,500 per lineal metre of frontage
Amenity Contributions on Base Density
Community Amenity Contribution Residential $1,717 per unit on average
Affordable Housing Contribution $1,000 per strata unit
Public Art Contribution (Allowance) $1.93 psf of gross building
Undergrounding Utilities $1.79 psf of gross building
Community Amenity Contribution Non-Residential $0.03 psf of site area
Amenity Contributions on Bonus Density
Community Amenity Contribution Residential $0 per unit on average
Affordable Housing Contribution $0 per strata unit
Public Art Contribution (Allowance) $0.00 psf of gross building
Undergrounding Utilities $0.00 psf of gross building
Community Amenity Contribution Non-Residential $0.00 psf of site area
Rezoning Costs $250,000
Construction Costs
Hard Construction Costs
Market Strata Residential Area $310 per gross sq.ft. of residential area
Rental Residential Area $0 per gross sq.ft. of rental residential area
Retail Area (shell space - no TI) $250 per gross sq.ft. of retail area
Office Area (shell space - no TI) $0 per gross sq.ft. of commercial area
Cost Per Garage/Underground Parking Stall $60,000 per underground/structured parking stall
Overall Costs Per Square Foot $377 per gross sq.ft.
Sustainability Premium 0%
Total Estimated Cost per Square Foot $377
Hard Cost Used in Analysis $377
Site Landscaping $434,930 or $10 psf of site area on 50% of site
Electrical Charging Station $0 - stations $0 per station
Other $0
Soft costs and Professional Fees 8.0% of hard costs, landscaping and site prep/servicing costs
Development management 3.0% of hard costs, landscaping and site prep/servicing costs and soft costs
Fees, legal and survey for rental portion $0
Contingency on hard and soft costs 5.0% of hard, soft and management costs

EVALUATION OF LAND VALUE CAPTURE AND URBAN DEVELOPMENT AS SOURCES OF REVENUE FOR TRANSLINK
PAGE 140
Attachment 7b – continued
(continues on following page)
Government Levies
GVS & DD Sewer Levy - Strata Apartment $3,530 per apartment unit
GVS & DD Sewer Levy - Townhouse $0 per townhouse unit
GVS & DD Sewer Levy - Rental Residential $3,530 per unit
GVS & DD Sewer Levy - Commercial $2.67 per sq.ft. of commercial space
TransLink - Strata Apartment Residential $1,200 per market unit
TransLink - Townhouse $0 per market unit
TransLink - Rental Residential $1,200 per unit
TransLink - Commercial $1.25 per sq.ft. of commercial space
Market Strata Apartment DCCs $15.88 per sq.ft. of floorspace
Market Townhouse DCCs $0.00 per sq.ft. of floorspace
Rental Residential DCCs $15.88 per sq.ft. of floorspace
Retail DCCs $12.47 per sq.ft. of floorspace
Office DCCs $0.00 per sq.ft. of floorspace
School Site Acquisition Charge $600 per unit
Financing
Interim financing 5.0% assuming a 2.50 year construction period
Financing charged on 75% of land and 75% of construction costs
Financing fees 1.25%
Commissions and Marketing
Commissions on Strata Residential 3.0% of gross strata market residential revenue
Marketing on Strata Residential 2.0% of gross strata market residential revenue
Commissions on Sale of Commercial 2.0% of gross commercial value
Commission on Sale of Rental Units 2.0% of value
Initial Lease Up Costs on Rental Units $2,000 per unit
Leasing Commissions on Commercial Space $5.00 per sq.ft.
Tenant Improvement Allowance on Retail Space $25.00 per sq.ft.
Tenant Improvement Allowance on Office Space $50.00 per sq.ft.
Other Costs and Allowances
Net GST on Rental Units 3.20% of capitalized value of rental units
Property Taxes 0.326% of assessed value
Assumed current assessment (Year 1 of analysis) $18,977,600
Assumed assessment after 1 year of construction (Year 2 of analysis) $94,696,700 (50% of completed project value)
Developer's Profit 15.0% of total costs or 13.0% of gross market revenue/value
School Tax Surcharge During Development*
Tax Rate 0.2% between $3.0-$4.0 million, and0.4% over $4.0 million
Residential Portion of current assessment (Year 1 of analysis) $18,977,600
Assumed residential portion of assessment after 1 year of construction $83,540,745 (50% of completed residential project value)
*Assumes BC Owner
*Retail Value Assumptions
Lease Rate NNN $45.00 psf per year
Vacancy and Non Recoverable Allowance 5.00%
Capitalization Rate 5.00%
Capitalized Value per 1000 SF Gross
Rental Rev $45,000
Vacancy $2,250
NOI $42,750
Capitalized Value $855,000
Value psf of net leasable space $855 psf
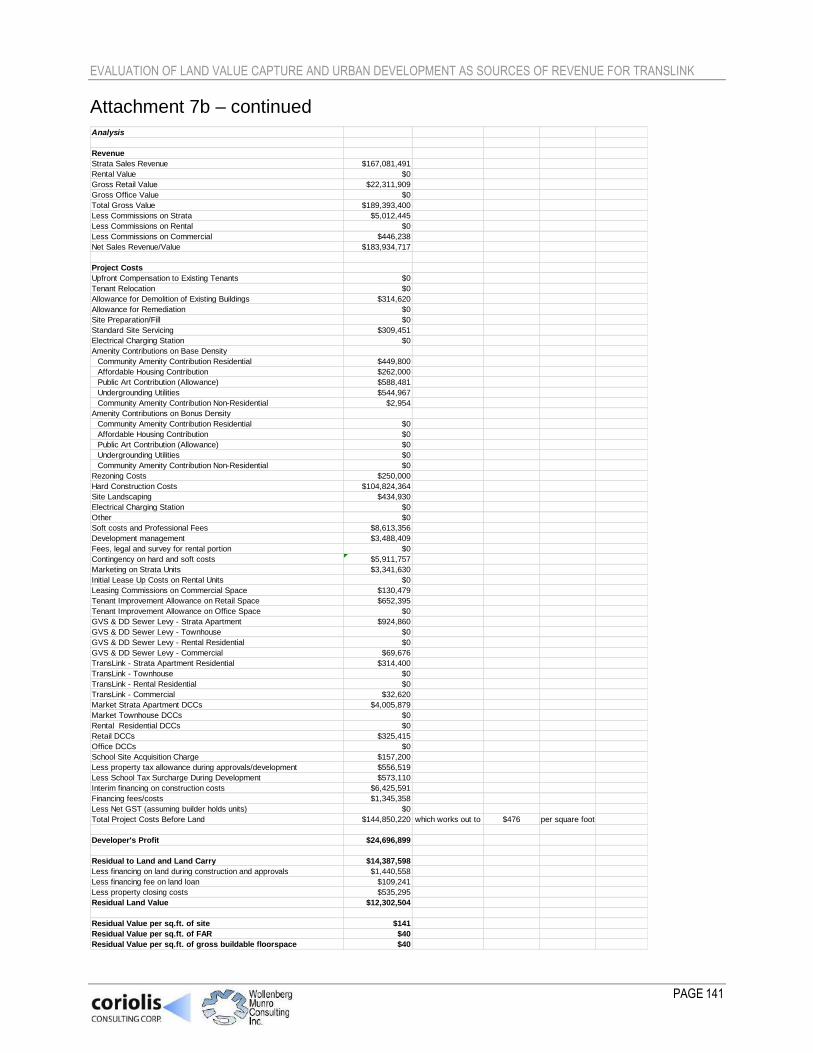
EVALUATION OF LAND VALUE CAPTURE AND URBAN DEVELOPMENT AS SOURCES OF REVENUE FOR TRANSLINK
PAGE 141
Attachment 7b – continued
Analysis
Revenue
Strata Sales Revenue $167,081,491
Rental Value $0
Gross Retail Value $22,311,909
Gross Office Value $0
Total Gross Value $189,393,400
Less Commissions on Strata $5,012,445
Less Commissions on Rental $0
Less Commissions on Commercial $446,238
Net Sales Revenue/Value $183,934,717
Project Costs
Upfront Compensation to Existing Tenants $0
Tenant Relocation $0
Allowance for Demolition of Existing Buildings $314,620
Allowance for Remediation $0
Site Preparation/Fill $0
Standard Site Servicing $309,451
Electrical Charging Station $0
Amenity Contributions on Base Density
Community Amenity Contribution Residential $449,800
Affordable Housing Contribution $262,000
Public Art Contribution (Allowance) $588,481
Undergrounding Utilities $544,967
Community Amenity Contribution Non-Residential $2,954
Amenity Contributions on Bonus Density
Community Amenity Contribution Residential $0
Affordable Housing Contribution $0
Public Art Contribution (Allowance) $0
Undergrounding Utilities $0
Community Amenity Contribution Non-Residential $0
Rezoning Costs $250,000
Hard Construction Costs $104,824,364
Site Landscaping $434,930
Electrical Charging Station $0
Other $0
Soft costs and Professional Fees $8,613,356
Development management $3,488,409
Fees, legal and survey for rental portion $0
Contingency on hard and soft costs $5,911,757
Marketing on Strata Units $3,341,630
Initial Lease Up Costs on Rental Units $0
Leasing Commissions on Commercial Space $130,479
Tenant Improvement Allowance on Retail Space $652,395
Tenant Improvement Allowance on Office Space $0
GVS & DD Sewer Levy - Strata Apartment $924,860
GVS & DD Sewer Levy - Townhouse $0
GVS & DD Sewer Levy - Rental Residential $0
GVS & DD Sewer Levy - Commercial $69,676
TransLink - Strata Apartment Residential $314,400
TransLink - Townhouse $0
TransLink - Rental Residential $0
TransLink - Commercial $32,620
Market Strata Apartment DCCs $4,005,879
Market Townhouse DCCs $0
Rental Residential DCCs $0
Retail DCCs $325,415
Office DCCs $0
School Site Acquisition Charge $157,200
Less property tax allowance during approvals/development $556,519
Less School Tax Surcharge During Development $573,110
Interim financing on construction costs $6,425,591
Financing fees/costs $1,345,358
Less Net GST (assuming builder holds units) $0
Total Project Costs Before Land $144,850,220 which works out to $476 per square foot
Developer's Profit $24,696,899
Residual to Land and Land Carry $14,387,598
Less financing on land during construction and approvals $1,440,558
Less financing fee on land loan $109,241
Less property closing costs $535,295
Residual Land Value $12,302,504
Residual Value per sq.ft. of site $141
Residual Value per sq.ft. of FAR $40
Residual Value per sq.ft. of gross buildable floorspace $40

EVALUATION OF LAND VALUE CAPTURE AND URBAN DEVELOPMENT AS SOURCES OF REVENUE FOR TRANSLINK
PAGE 142
Attachment 7c
(continues on following page)
Attachment 7c
Case Study #7: Site in Surrey City Centre Estimated Residual Land Value based on Rezoning to 3.5 FSR (commercial) (no transit premium)
Assumes developer builds, leases, and then sells and expects a 15% profit margin on total costs
Assumptions
Site and Building Size Assumptions:
Assumed Site Size 86,986 or 2.0 acre
FAR 3.50 FAR
Density Bonus 0.00 FAR
Density with Bonuses 3.50 FAR
Project Size 304,451 sq. ft.
Gross Office Area 274,006 sq. ft. 3.15 FAR
Gross Retail 30,445 sq. ft. 0.35 FAR
Parking 398 1 per 71m2
Total Stalls 398
Underground/structured Parking Stalls 398
Surface Parking Stalls 0
Strata Office Share 0% of gross site area
Leasehold Office Share 100% of gross site area
Saleable Strata Office 0 sq. ft. or 95% of gross area and 0 parking stalls
Leasable Leasehold Office 260,306 sq. ft. or 95% of gross area and 379 parking stalls
Rentable Area (Retail) 28,923 sq. ft. or 95% of gross area 20 parking stalls
398 total parking stalls
Revenue and Value Assumptions: 159,349 square feet
Average Strata Sales Price (Office) $0 per sq.ft. of saleable area 1.8 storeys
Average Net Lease Rate (Office) $27.90 per sq.ft. of rentable area assuming landlord provides fit up allowance
Average Net Lease Rate (Retail) $45.00 per sq.ft. of rentable area assuming landlord provides fit up allowance
Operating Costs (Office) $18.00 per sq.ft. of rentable area
Operating Costs (Retail) $18.00 per sq.ft. of rentable area
Annual Vacancy Allowance 5.0%
Property Management 0.0% of lease revenue (included in operating costs)
Structural Allowance 0.0% of lease revenue
Assumed Net Parking Revenue $150.00 per stall per month
Cap Rate 4.75%
Profit Allowance 13.0% of value or 15.0% of costs
Cost Assumptions:
Rezoning Allowance $250,000
Demolition Allowance $314,620 $20 per square foot of existing building area
Site Servicing (sidewalks, landscaping, etc) $530,488 $3,000 per metre of frontage
Allowance for piling, stabilization $0 per gross sq.ft.
Building Construction Costs (to base building office) $280 per sq.ft.
Building Construction Costs (to base building retail) $280 per sq.ft.
Parking Construction Costs $55,000 per stall (assuming underground)
Parking Construction Costs $5,000 per stall (assuming at grade)
Base Building Hard Construction Costs $352 per sq.ft. buildable (including parking)
Allowance to finish common areas $50 per sq.ft. of common area
Fit-up Allowance Office Strata $0 per saleable square foot
Fit-up Allowance Office Leasehold $50 per rentable square foot
Fit-up Allowance Retail $25 per rentable square foot
Soft Costs (including project management) 15% of hard costs
Contingency 3.5% of hard and soft costs
City of Surrey DCC Ground Floor (includes CC additional rates) $13.71 per sq. ft. of floorspace
City of Surrey Upper Floor (includes CC additional rates) $9.11 per sq. ft. of floorspace
Metro Vancouver DCC $2.67 per sq. ft. of floorspace
Interim Financing 5.0% on 50% of all costs assuming a 2.25 year construction period
Share of Construction Costs Financed 75.0%
Share of Land Costs Financed 50.0%
Financing Fee 1.5%
Property Taxes During Development 1.0212% applied to land value in Year 1 $18,977,600
applied to 50% of gross value of building in Year 2, which is: $92,819,048
Upfront Leasing Commissions 35% of Year 1 revenue
Marketing $913,353 $3.00 per square foot
Lease-up period after construction complete 6 months, or 0.50 years
Assumed up-front vacancy cost during lease-up $45.90 per sq.ft. (i.e. lease revenue+operating costs) on 50% of space during lease-up
Sales Commission 2.0%

EVALUATION OF LAND VALUE CAPTURE AND URBAN DEVELOPMENT AS SOURCES OF REVENUE FOR TRANSLINK
PAGE 143
Attachment 7c – continued
AnalysisStrata Revenue $0
Lease Revenue $8,135,852
Recovered Operating Costs $5,206,112
Parking Income $681,958
Total Gross Revenue $14,023,922
Less Operating Costs $5,206,112
Net Operating Income $8,817,810
Capitalized Value of Leasehold Space $185,638,096
Value of Strata Space $0
Total Value $185,638,096
Less Commission $3,712,762
Net Proceeds $181,925,335
Total Value per sq.ft. buildable $598
Rezoning Allowance $250,000
Demolition Allowance $314,620
Site Servicing $530,488
Allowance for piling, stabilization $0
Hard Construction (including parking) $107,166,752
Allowance to finish common areas $761,128
Fit-Up of Strata Space $0
Fit-Up of Leasehold Space $13,738,351
Upfront Leasing Commissions $2,847,548
Marketing $913,353
Upfront Vacancy Cost during Lease-up $2,987,007
Soft Costs (including project management) $16,075,013
Contingency $4,313,462
City of Surrey DCC Ground Floor (includes CC additional rates) $417,402
City of Surrey Upper Floor (includes CC additional rates) $2,496,194
Metro Vancouver DCC $812,884
Property Taxes during Development $1,378,607
Interim Financing $6,539,181
Financing fees/costs $1,817,347
Total Costs Before Land and Profit $163,359,337 which works out to $537 per sq.ft. buildable
Profit: $24,207,208
Land Residual:
Land Residual Before Holding Costs -$5,641,210
Less interim financing on land -$349,050
Less property taxes during approvals $96,898
Less property closing costs -$331,319
Residual Land Value -$5,057,739
Value per sq.ft. buildable -$17
Value per sq.ft. of site area -$58
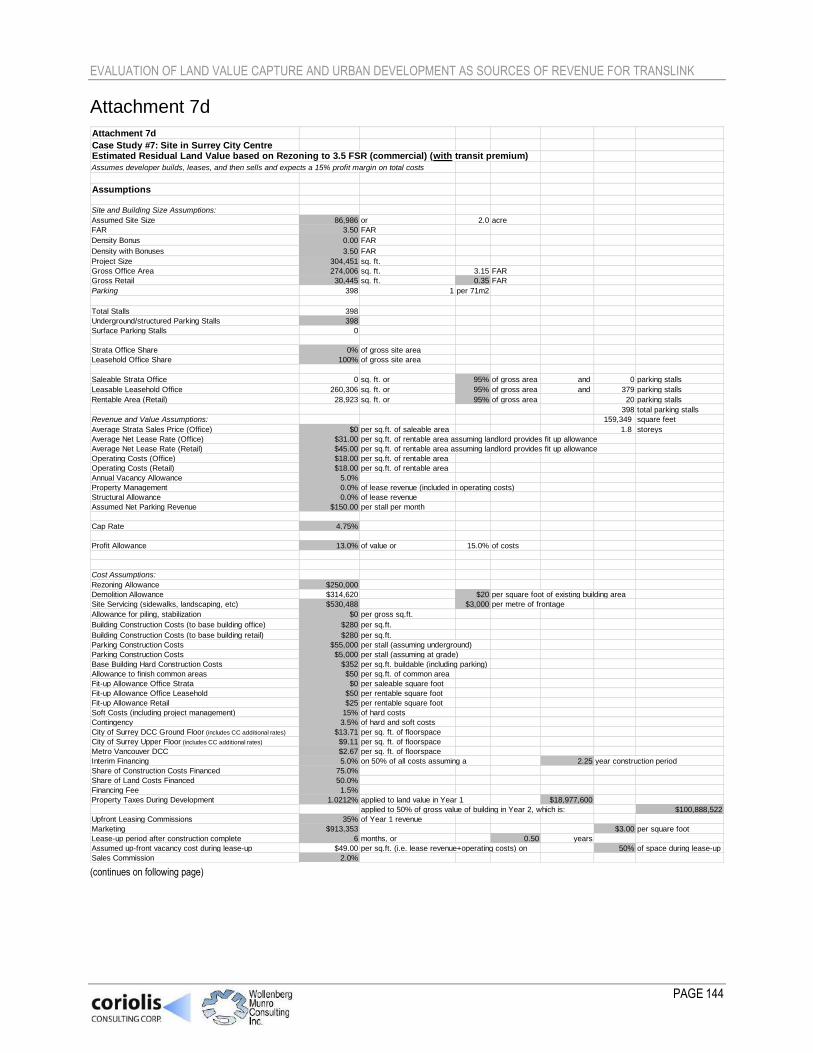
EVALUATION OF LAND VALUE CAPTURE AND URBAN DEVELOPMENT AS SOURCES OF REVENUE FOR TRANSLINK
PAGE 144
Attachment 7d
(continues on following page)
Attachment 7d
Case Study #7: Site in Surrey City Centre Estimated Residual Land Value based on Rezoning to 3.5 FSR (commercial) (with transit premium)
Assumes developer builds, leases, and then sells and expects a 15% profit margin on total costs
Assumptions
Site and Building Size Assumptions:
Assumed Site Size 86,986 or 2.0 acre
FAR 3.50 FAR
Density Bonus 0.00 FAR
Density with Bonuses 3.50 FAR
Project Size 304,451 sq. ft.
Gross Office Area 274,006 sq. ft. 3.15 FAR
Gross Retail 30,445 sq. ft. 0.35 FAR
Parking 398 1 per 71m2
Total Stalls 398
Underground/structured Parking Stalls 398
Surface Parking Stalls 0
Strata Office Share 0% of gross site area
Leasehold Office Share 100% of gross site area
Saleable Strata Office 0 sq. ft. or 95% of gross area and 0 parking stalls
Leasable Leasehold Office 260,306 sq. ft. or 95% of gross area and 379 parking stalls
Rentable Area (Retail) 28,923 sq. ft. or 95% of gross area 20 parking stalls
398 total parking stalls
Revenue and Value Assumptions: 159,349 square feet
Average Strata Sales Price (Office) $0 per sq.ft. of saleable area 1.8 storeys
Average Net Lease Rate (Office) $31.00 per sq.ft. of rentable area assuming landlord provides fit up allowance
Average Net Lease Rate (Retail) $45.00 per sq.ft. of rentable area assuming landlord provides fit up allowance
Operating Costs (Office) $18.00 per sq.ft. of rentable area
Operating Costs (Retail) $18.00 per sq.ft. of rentable area
Annual Vacancy Allowance 5.0%
Property Management 0.0% of lease revenue (included in operating costs)
Structural Allowance 0.0% of lease revenue
Assumed Net Parking Revenue $150.00 per stall per month
Cap Rate 4.75%
Profit Allowance 13.0% of value or 15.0% of costs
Cost Assumptions:
Rezoning Allowance $250,000
Demolition Allowance $314,620 $20 per square foot of existing building area
Site Servicing (sidewalks, landscaping, etc) $530,488 $3,000 per metre of frontage
Allowance for piling, stabilization $0 per gross sq.ft.
Building Construction Costs (to base building office) $280 per sq.ft.
Building Construction Costs (to base building retail) $280 per sq.ft.
Parking Construction Costs $55,000 per stall (assuming underground)
Parking Construction Costs $5,000 per stall (assuming at grade)
Base Building Hard Construction Costs $352 per sq.ft. buildable (including parking)
Allowance to finish common areas $50 per sq.ft. of common area
Fit-up Allowance Office Strata $0 per saleable square foot
Fit-up Allowance Office Leasehold $50 per rentable square foot
Fit-up Allowance Retail $25 per rentable square foot
Soft Costs (including project management) 15% of hard costs
Contingency 3.5% of hard and soft costs
City of Surrey DCC Ground Floor (includes CC additional rates) $13.71 per sq. ft. of floorspace
City of Surrey Upper Floor (includes CC additional rates) $9.11 per sq. ft. of floorspace
Metro Vancouver DCC $2.67 per sq. ft. of floorspace
Interim Financing 5.0% on 50% of all costs assuming a 2.25 year construction period
Share of Construction Costs Financed 75.0%
Share of Land Costs Financed 50.0%
Financing Fee 1.5%
Property Taxes During Development 1.0212% applied to land value in Year 1 $18,977,600
applied to 50% of gross value of building in Year 2, which is: $100,888,522
Upfront Leasing Commissions 35% of Year 1 revenue
Marketing $913,353 $3.00 per square foot
Lease-up period after construction complete 6 months, or 0.50 years
Assumed up-front vacancy cost during lease-up $49.00 per sq.ft. (i.e. lease revenue+operating costs) on 50% of space during lease-up
Sales Commission 2.0%

EVALUATION OF LAND VALUE CAPTURE AND URBAN DEVELOPMENT AS SOURCES OF REVENUE FOR TRANSLINK
PAGE 145
Attachment 7d – continued
AnalysisStrata Revenue $0
Lease Revenue $8,902,452
Recovered Operating Costs $5,206,112
Parking Income $681,958
Total Gross Revenue $14,790,522
Less Operating Costs $5,206,112
Net Operating Income $9,584,410
Capitalized Value of Leasehold Space $201,777,044
Value of Strata Space $0
Total Value $201,777,044
Less Commission $4,035,541
Net Proceeds $197,741,503
Total Value per sq.ft. buildable $650
Rezoning Allowance $250,000
Demolition Allowance $314,620
Site Servicing $530,488
Allowance for piling, stabilization $0
Hard Construction (including parking) $107,166,752
Allowance to finish common areas $761,128
Fit-Up of Strata Space $0
Fit-Up of Leasehold Space $13,738,351
Upfront Leasing Commissions $3,115,858
Marketing $913,353
Upfront Vacancy Cost during Lease-up $3,188,744
Soft Costs (including project management) $16,075,013
Contingency $4,313,462
City of Surrey DCC Ground Floor (includes CC additional rates) $417,402
City of Surrey Upper Floor (includes CC additional rates) $2,496,194
Metro Vancouver DCC $812,884
Property Taxes during Development $1,481,612
Interim Financing $6,563,357
Financing fees/costs $1,824,066
Total Costs Before Land and Profit $163,963,283 which works out to $539 per sq.ft. buildable
Profit: $26,311,727
Land Residual:
Land Residual Before Holding Costs $7,466,493
Less interim financing on land $461,989
Less property taxes during approvals $96,898
Less property closing costs $254,002
Residual Land Value $6,653,604
Value per sq.ft. buildable $22
Value per sq.ft. of site area $76