date: 18th december 2018 women in northern ireland 2018 in ni - dece… · women in northern...
TRANSCRIPT

Women in Northern Ireland published on 18th December 2018 Page 1
The following publication considers the different labour market experiences of women and men in Northern Ireland. A consistent feature of the labour market is higher unemployment and employment rates for males and higher inactivity rates for females. Using the Labour Force Survey quarterly and household datasets, these features are explored.
Key Points:
• The employment rate for males in NI has been consistently higher than for females over the past ten years. Although the number of employees in NI is evenly split between males and females, the number of self-employed males is more than double the number of self-employed females.
• The unemployment rate for males in NI has been consistently higher than for females over the past ten years. At July-September 2018, two-thirds of the unemployed were male and one-third were female.
• Over the past 10 years there has consistently been more economically inactive women than men. At July-September 2018 a third of working age women were economically inactive, compared to 23% of men.
• The most common reason for inactivity among women was family and home commitments, while the most common reason for men was sick or disabled. (LFS July-September 2018)
• Economic activity rates were lowest for women with a youngest dependent child of pre-school age.
Women in Northern Ireland 2018 Geographical Area: Northern Ireland Theme: Labour Market Frequency: Annual
Date: 18th December 2018

Women in Northern Ireland published on 18th December 2018 Page 2
Context The Women in Northern Ireland report is an annual publication summarising key labour market statistics for females. Please note all data within this report is not adjusted for seasonality.
Key users of Northern Ireland labour market statistics include government departments, in particular the Department for the Economy (DfE), to design and monitor the impact of economic and labour market policy. Other Government departments such as The Executive Office, the Department of Finance (DoF) and the Department of Agriculture, Environment and Rural Affairs (DAERA), as well as bodies such as Invest NI and Belfast City Council, regularly require specific ad hoc labour market analysis in order to monitor policies for example, equality and employment. In addition, significant 'non-governmental' users of labour market statistics include the media, banks, academics, private consultants and the general public, primarily for reporting or researching the performance of the economy in general. Labour market statistics attract widespread media coverage, with a number of broadcasters publishing articles on the labour market on a monthly basis, generally on the day of publication of the Labour Market Report. Labour market statistics feature in the DfE economic commentary which provides an overview of the state of the Northern Ireland economy, setting it in context with the UK and Republic of Ireland. The most up-to-date official statistics on the economy and labour market are available on the Economic Overview section of the NISRA website. Further information on using labour market statistics can be found on the Office for National Statistics (ONS) website:
- Guide to Labour Market Statistics - Glossary
User Feedback A request was made on the 2017 edition of Women in NI for feedback from users – specifically to better understand how the statistics are being used and whether there are any improvements that can be made. A response to the feedback received was published on the NISRA website. Using the feedback, this edition of Women in NI has been restructured to cover only Labour Force Survey data with links to the previously included external data in the Annex. Analysis of activity/inactivity levels has been expanded with particular emphasis on the impact of dependents on economic activity. This publication will continue to remain under review. Any further comments or feedback are welcome at [email protected]

Women in Northern Ireland published on 18th December 2018 Page 3
This Women in Northern Ireland report contains the following chapters:
Page
1 Summary 4 2 Women in the labour force
6
2.1 Economic Activity
6
2.2 Employment 7 2.3 Unemployment
9
2.4 Economic Inactivity
10
3 Women with dependents
12
3.1 Economic Activity and age
12
3.2 Dependent Children 13 Further Information 16
Annex 18
National Statistics National Statistics status means that official statistics meet the highest standards of trustworthiness, quality and public value. All official statistics should comply with all aspects of the Code of Practice for Official Statistics. They are awarded National Statistics status following an assessment by the Authority’s regulatory arm. The Authority considers whether the statistics meet the highest standards of Code compliance, including the value they add to public decisions and debate. It is a producer’s responsibility to maintain compliance with the standards expected of National Statistics. If we become concerned about whether these statistics are still meeting the appropriate standards, we will discuss any concerns with the Authority promptly. National Statistics status can be removed at any point when the highest standards are not maintained, and reinstated when standards are restored

Women in Northern Ireland published on 18th December 2018 Page 4
1 Summary
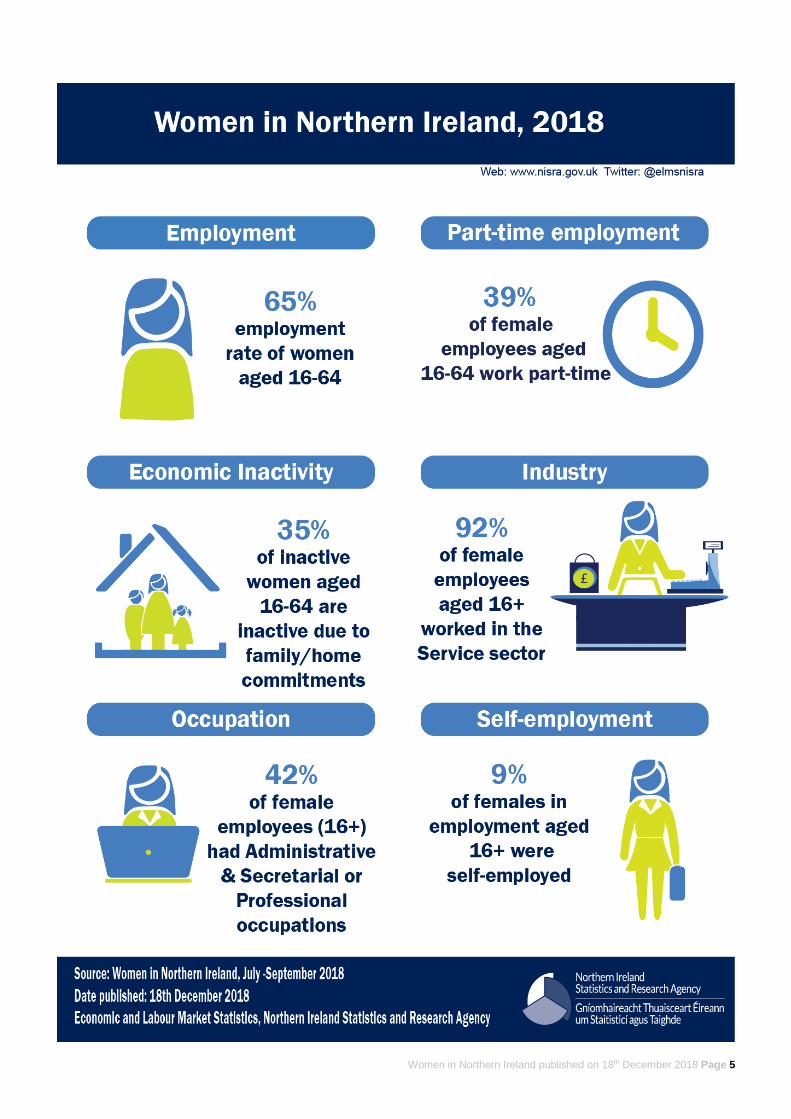
Women make up half of the working age population. However a third of working age women are not in the labour force. The main reason for women being outside of the labour force (economically inactive) is looking after the family/home. In contrast this is the least likely reason for economic inactivity for males. An analysis of Labour Force Survey data shows that for women with children, economic inactivity rates are highest for those whose youngest child is of pre-school age. This has the greatest impact on the inactivity rate of women aged 25-34 years, the age grouping with the highest proportion of mothers of pre-school age children. Conversely, economic activity rates are highest for males of this age with more than 90% of men of this age in the labour force. Women are most likely to be economically active during the ages of 35-49 years. At these ages approximately four-fifths of women are in the labour market (working or looking for work). Women continue to be much more likely to work part-time hours than a man, and if employed are likely to have a job in the service sector, particularly the public administration, education and health sectors.
Women in Northern Ireland published on 18th December 2018 Page 5

Women in Northern Ireland published on 18th December 2018 Page 6
2 Women in the labour force
2.1 Economic activity
Key Findings:
• The LFS showed that at July - September 2018, an estimated 410,000 women (16+) were economically active (employed or unemployed)
• The number of economically active women was lower than economically active men (458,000)
• There was a larger (8%) increase in economically active women since 2008 than men (1%) Figure 1: Economic activity rate by gender (16-64), Jul-Sep 2008 - Jul-Sep 2018 (non-zero axis)
In the last 10 years the female economic activity rate has consistently been lower than the rate for males, however the gap has closed slightly in that time. For women the economic activity rate peaked at 69.9% in July-September 2016 and for men it peaked at 80.7% in January-March 2016. The 16-64 economic activity rate for women in NI was 66.7%, which was:
• lower than the corresponding rate for men (76.6%). • close to the average activity rate for women (67.3%) over the past 5 years.
76.6%
66.7%
50%
55%
60%
65%
70%
75%
80%
85%
Econ
omic
Act
ivity
Rat
e
Male
Female
Economically Active: people aged 16 or over who are either in employment or unemployed. Economic Activity rate: calculated by taking the number of people (employed or unemployed) aged 16-64 as a proportion of all working age people

Women in Northern Ireland published on 18th December 2018 Page 7
2.2 Employment
Key Findings:
• At July - September 2018, the estimated number of women (16+) in employment was 399,000
• Women accounted for 48% of those currently in employment • Women in employment was made up of 358,000 employees (90%), 36,000 self-employed
(9%) and a small number on government training and employment schemes or unpaid family workers
Figure 2: Employment rate by gender (16-64), Jul-Sep 2008 – Jul-Sep 2018 (non-zero axis)
Similar to the economic activity rate, in the last 10 years the female employment rate has consistently been lower than the rate for males, however the gap has closed slightly in that time. The employment rate peaked for women in January-March 2018 at 67.4% and for men in January-March 2016 at 75.1%. The employment rate for females aged 16 to 64 was 64.7%, which was:
• an increase of 1.8 pps over the last 10 years and an increase of 0.4 pps over the last year. • lower than the male employment rate (72.5%), which is 1.3 pps lower than the same point 10
years ago, and an increase of 0.4 pps over the last year.
72.5%
64.7%
45%
55%
65%
75%
85%
95%
Empl
oym
ent R
ate
Male
Female
LFS employed: people aged 16 or over who did at least one hour of paid work in the reference week (whether as an employee or self-employed); those who had a paid job that they were temporarily away from; those on government-supported training and employee programmes and those doing unpaid family work. Employment rate: calculated by taking the number of employed people aged 16-64 as a proportion of all working age people

Women in Northern Ireland Published on 18th December 2018 Page 8
Figure 3: Gender profile of employees and self-employed (16+), Jul-Sep 2008 – Jul-Sep 2018
* Those on government schemes, training and employment programmes too small for reliable estimate Overall there has been an increase for both males (15,000) and females (29,000) in employment over the last 10 years. The increase in female employment comprised increases in self-employment and employees of equal size. In contrast the number of male employees increased during this period while males in self-employment decreased. Employment by category In terms of the type of job:
• women account for 51% of all employees, and 30% of the total self-employed. • proportionally, the gender profile of employees has remained as a relatively evenly split.
Employment by working pattern In terms of working patterns for females aged 16-64:
• almost two-fifths (39%) of female employees work part-time compared to 9% of male employees. • the majority (82%) of part-time employees are women. • Almost three quarters (74%) of female employees (16+) working part-time stated that the reason
was because they ‘Didn’t want full-time work’. • the proportion of female employees working full-time has decreased from 10 years ago (by 2.6
pps) to 61% and the proportion of males working full-time is similar (fallen by 0.5 pps) at 91%.
0
50000
100000
150000
200000
250000
300000
350000
400000
Male self-employed
Male Employees
Female Employees
Female self-employed

Women in Northern Ireland published on 18th December 2018 Page 9
2.3 Unemployment
Key Findings: • The female unemployment rate has been consistently lower than the male unemployment rate
for the last ten years Figure 4: Unemployment rate by gender (16+), Jul-Sep 2008 – Jul-Sep 2018
Figure 5 shows the female unemployment rate has consistently been below the male unemployment rate for the last 10 years. While the two rates don’t mirror exactly, they generally follow the same trend with the lowest rate for both males and females recorded in Jan-Mar 2018.1 Unemployment
• In July – September 2018, LFS estimates show that one-third of the unemployed aged over 16 years were female and two-thirds were male.
• In July – September 2018, the unemployment rate (unemployed as a percentage of the economically active) for women aged 16+ in NI was 2.8% compared with 5.2% for men.
• The number of unemployed males and females in 2018 is similar to levels in 2008. However, during this period the number of females unemployed reached a peak in summer 2012, and a low in early 2018.
• Similarly in this period, the number of males unemployed reached a peak in early 2013 and a low in early 2018.
1 Please note, the number of unemployed females for Jan-Mar 2018 estimate is below the usual threshold for release of 8,000 – the confidence intervals are (+/-) 0.5% or (+/-) 3,500.
5.2%
2.8%
0%
2%
4%
6%
8%
10%
12%
Male
Female
LFS unemployment: The International Labour Organisation (ILO) define unemployed as those without a job who were able to start work in the two weeks following their LFS interview and had either looked for work in the four weeks prior to interview or were waiting to start a job they had already obtained (numbers and rates refer to 16+ population) Unemployment rate: calculated by taking the number aged 16+ who are unemployed as a proportion of all economically active people aged 16 and over

Women in Northern Ireland published on 18th December 2018 Page 10
2.4 Economic Inactivity
Key Findings:
• One third of working age women are economically inactive • Women have had a consistently higher rate of economic inactivity than men for the last
10 years
Figure 5: Economic inactivity rate by gender (16-64), Jul-Sep 2008 - Jul-Sep 2018
The economic inactivity rate for women has been consistently higher than men, however it has narrowed slightly over the last decade.
In the period July – September 2018, the LFS showed estimates:
• a third of working age women and less than a quarter of men (23.4%) are economically inactive. • the 16-64 inactivity rate for women is similar to (0.3 pps lower) the same point 5 years ago and is
0.5 pps lower than one year ago. The corresponding rate for men (23.4%) is 2.5 pps higher than 5 years ago, and decreased by 0.6 pps during the last year.
• During the last 5 years the economic inactivity rate for women has fluctuated by + 2.5 pps around an average of 32.7%. For men it has remained within + 2.5 pps around an average of 21.8%.
23.4%
33.3%
0%
5%
10%
15%
20%
25%
30%
35%
40%
45%
50%
Male
Female
Economically inactive: people who are neither in employment nor unemployed on the ILO measure. This group includes all those who are looking after a home, long term sick or disabled, students and retired (numbers refer to 16+ population, rates refer to 16-64 years). Economic inactivity rate: calculated by taking the number of inactive people aged 16-64 as a proportion of all working age people

Women in Northern Ireland published on 18th December 2018 Page 11
Figure 6: Reasons for economic inactivity by gender (16-64), July – September 2018
“Other” includes the ‘retired’ and ‘discouraged workers’ (those not in a job who would like work and whose reason for not
seeking work in the past four weeks is that they believe there are no jobs available). Of the economically inactive aged 16-64 years:
• more than a third of women who were unavailable for work gave the reason for inactivity as being family/home commitments (35%). This was the least likely reason for male inactivity.
• the main reason given by men aged 16-64 for inactivity was related to sickness and disability (38%). This compares with 22% of women, making it the third most common reason for women.
The economically inactive can be broken down by those who do or do not want to work, showing that:
• of the 197,000 women aged 16-64, 18% (35,000) wanted a job, but were not seeking work in the past four weeks or were unable to start work. The remaining 82% stated that they did not want work. Similar proportions were displayed for men; 19% wanted a job and 81% did not want work.
0% 5% 10% 15% 20% 25% 30% 35% 40% 45%
Other
Sick Disabled
Student
Family/Home
Female
Male
*
*Figures too small for a reliable estimate.

Women in Northern Ireland published on 18th December 2018 Page 12
3 Women with Dependants
The previous section demonstrated that economic inactivity was higher among women and the most common reason for inactivity was home or family responsibilities. This section examines the impact of dependents on economic activity. Analysis in this section relates to the household unit. Where men or women are discussed it relates to head of households (as defined below) rather than all adults. Dependant: Dependent children are those under 16 years and those never-married aged 16 to 18 in full-time education. Head of household2: This is the head of the family unit or the spouse/cohabitee of the head of the family unit. Key Findings:
• The greatest difference in activity rates between men and women was for those aged 25-34
• Within the 25-34 year age group there was a 12 percentage point difference in economic activity rates between women with and without children
• The economic activity rate for women with pre-school age children was substantially lower than men with pre-school age children
3.1 Economic Activity and Age Figure 7: Economic activity rates for male and female head of households, July-September 2018
At July-September 2018:
• Economic activity rates were higher for men than women across all age groups • Economic activity rates were lowest for men and women aged 16-24 years. The main reason for
inactivity for this age group was continued education. • Economic activity rates were highest for women aged 35-49 (79.1%) and highest for men aged
25-34 (92.1%). • The greatest difference in activity rates between men and women was for the 25-34 age group
(92.1% activity rate for males compared to 70.7% activity rate for females).
2 For more information on household concepts & definitions visit http://www.ons.gov.uk/ons/guide-method/method-quality/specific/labour-market/labour-market-statistics/volume-8---2008.pdf
0%
10%
20%
30%
40%
50%
60%
70%
80%
90%
100%
16-24 25-34 35-49 50-64 Total
Males Females

Women in Northern Ireland published on 18th December 2018 Page 13
3.2 Dependent Children Approximately half of all economically active men and women (16-64) had children (48% and 49% respectively). Figure 8: Economic activity rate of men and women (16-64) with and without children, July-
September 2018
Figure 8 illustrates that at July-September 2018 economic activity was higher for both men and women (16-64) with dependent children than without. This trend has also been observed in previous years where economic activity was higher among men and women with dependents. Further analysis has shown that this trend is related to the age of head of household. Disaggregating Figure 9 further investigates the effect of age of head of household on economic activity rates.
0%
10%
20%
30%
40%
50%
60%
70%
80%
90%
100%
0 1+
Males Females

Women in Northern Ireland published on 18th December 2018 Page 14
Figure 9: Economic activity rate by age of women with and without dependent children, July-
September 2018
• Women aged 25-34 without dependent children had a higher economic activity rate (78.3%) than those with dependent children (65.8%). For those with children, 72% had a youngest dependent child aged 0-4 years old.
• For women aged 35-49 there was not a notable difference in activity rates between those with dependents and those without. Of the women aged 35-49 who had dependent children 42% had a youngest dependent child aged 5-10 years and 29% had a youngest dependent child aged 0-4.
• Women aged 50-64 with dependent children had a higher economic activity rate (66.3%) than women in the same age group with no dependent children. For the majority (91%) of these women the youngest dependent child was aged 11-18 years old.
Figure 10: Economic activity rate by age of men with and without dependent children, July-
September 2018
• Men with dependent children had a consistently higher economic activity rate across all age groups than men without dependent children. This trend differed from the trend for females.
• Economic activity rate of men with dependents didn’t vary across the age groups, whereas the economic activity rate of men with no dependent children decreases with age.
0%
10%
20%
30%
40%
50%
60%
70%
80%
90%
16-24 25-34 35-49 50-64
No dependents 1+
* Age of female head of household *Figures too small for a reliable estimate.
0%
10%
20%
30%
40%
50%
60%
70%
80%
90%
100%
25-34 35-49 50-64
No dependents 1+*16-24 Figures too small for a reliable estimate.
Age of male head of household

Women in Northern Ireland published on 18th December 2018 Page 15
0%
10%
20%
30%
40%
50%
60%
70%
80%
90%
100%
(0-4) (5-10) (11-18)
Males Females
Figure 11: Economic activity rates of men and women (16-64) by age of youngest dependent
child, July-September 2018
The graph above shows economic activity rates for males and females disaggregated by age of youngest dependent child. Age groupings of children are aligned with pre-school, primary school and secondary school age.
• Women consistently have lower economic activity than men regardless of age of youngest dependent child.
• The variation in economic activity rate by age of youngest child is lower for males than for females.
• The group with the lowest economic activity is women with a youngest child of pre-school age (64.2%). The difference in economic activity rate for men and women with a youngest child of pre-school age is 30.0pps.
• The gap in inactivity rates between men and women for those with primary and secondary school age children is half that for those with pre-school age children.
Age of youngest dependent child
Women in Northern Ireland published on 18th December 2018 Page 16
Further information
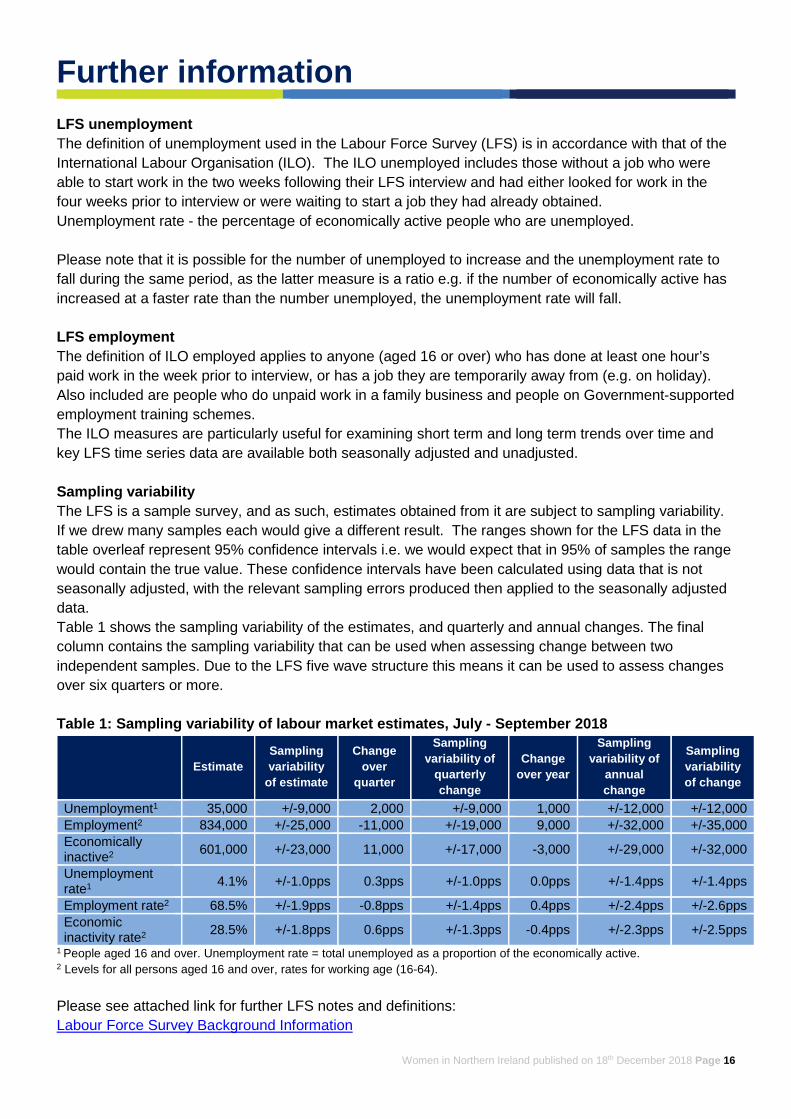
LFS unemployment The definition of unemployment used in the Labour Force Survey (LFS) is in accordance with that of the International Labour Organisation (ILO). The ILO unemployed includes those without a job who were able to start work in the two weeks following their LFS interview and had either looked for work in the four weeks prior to interview or were waiting to start a job they had already obtained. Unemployment rate - the percentage of economically active people who are unemployed. Please note that it is possible for the number of unemployed to increase and the unemployment rate to fall during the same period, as the latter measure is a ratio e.g. if the number of economically active has increased at a faster rate than the number unemployed, the unemployment rate will fall. LFS employment The definition of ILO employed applies to anyone (aged 16 or over) who has done at least one hour’s paid work in the week prior to interview, or has a job they are temporarily away from (e.g. on holiday). Also included are people who do unpaid work in a family business and people on Government-supported employment training schemes. The ILO measures are particularly useful for examining short term and long term trends over time and key LFS time series data are available both seasonally adjusted and unadjusted. Sampling variability The LFS is a sample survey, and as such, estimates obtained from it are subject to sampling variability. If we drew many samples each would give a different result. The ranges shown for the LFS data in the table overleaf represent 95% confidence intervals i.e. we would expect that in 95% of samples the range would contain the true value. These confidence intervals have been calculated using data that is not seasonally adjusted, with the relevant sampling errors produced then applied to the seasonally adjusted data. Table 1 shows the sampling variability of the estimates, and quarterly and annual changes. The final column contains the sampling variability that can be used when assessing change between two independent samples. Due to the LFS five wave structure this means it can be used to assess changes over six quarters or more. Table 1: Sampling variability of labour market estimates, July - September 2018
Estimate Sampling variability
of estimate
Change over
quarter
Sampling variability of
quarterly change
Change over year
Sampling variability of
annual change
Sampling variability of change
Unemployment1 35,000 +/-9,000 2,000 +/-9,000 1,000 +/-12,000 +/-12,000 Employment2 834,000 +/-25,000 -11,000 +/-19,000 9,000 +/-32,000 +/-35,000 Economically inactive2 601,000 +/-23,000 11,000 +/-17,000 -3,000 +/-29,000 +/-32,000
Unemployment rate1 4.1% +/-1.0pps 0.3pps +/-1.0pps 0.0pps +/-1.4pps +/-1.4pps
Employment rate2 68.5% +/-1.9pps -0.8pps +/-1.4pps 0.4pps +/-2.4pps +/-2.6pps Economic inactivity rate2 28.5% +/-1.8pps 0.6pps +/-1.3pps -0.4pps +/-2.3pps +/-2.5pps
1 People aged 16 and over. Unemployment rate = total unemployed as a proportion of the economically active. 2 Levels for all persons aged 16 and over, rates for working age (16-64). Please see attached link for further LFS notes and definitions: Labour Force Survey Background Information

Women in Northern Ireland published on 18th December 2018 Page 17
LFS Comparisons Estimates of employment, unemployment, and economic inactivity are derived from the LFS, a survey of households. The most robust estimates of short-term movements in these estimates are obtained by comparing the estimates over rolling three month periods. For example the 3 months ending September 2018 should be compared with the estimates for July-September 2017, which were first published on 30th November 2017. This provides a more robust estimate than comparing with the estimates for June-August 2018. This is because the July and August data are included within both estimates, so effectively observed differences are those between the individual months of June 2018 and September 2018. The LFS is sampled such that it is representative of the NI population over a three month period, not for single month periods. Thresholds Thresholds are used to determine whether LFS data are suitably robust for publication. The threshold used for the quarterly LFS datasets is 8,000. As such, data below 8,000 are suppressed. LFS revisions LFS microdata have recently been revised to incorporate the latest population estimates. The revisions affect LFS data from the period May - July 2012 onwards and were first published in May 2017. The magnitude of the revisions are relatively small, with the revisions to the unemployment rate falling within +/-0.1 percentage points and the working age employment rate within +/- 0.2 percentage points. The procedures being applied to the NI LFS results are consistent with those applied by the Office for National Statistics to other UK regions. More information on the revision policy concerning labour market statistics can be found through the link below: Labour market statistics revisions policy For Further Information: Carly Gordon Economic & Labour Market Statistics Branch Floor 1 Colby House Stranmillis Court BT9 5RR Tel: (028) 90255172 Email: [email protected] Twitter: @ELMSNISRA

Women in Northern Ireland published on 18th December 2018 Page 18
Annex – Previous external sources
3.2 Childcare provision Day care places (source: Department of Health) Link to Children’s services statistics: https://www.health-ni.gov.uk/articles/childrens-day-care 3.3 Assistance for parents Benefit Claimants (source: Department for Communities) Link to Benefits Statistics Summary Publication: https://www.communities-ni.gov.uk/publications/benefits-statistics-summary-publication-national-statistics-august-2018 Child and working tax credits (source: Her Majesty’s Revenue and Customs) Link to Personal tax credit statistics: https://www.gov.uk/government/collections/personal-tax-credits-statistics Link to Child and Working Tax Credits Statistics: Finalised annual awards in 2016 to 2017: https://www.gov.uk/government/uploads/system/uploads/attachment_data/file/720637/CWTC_commentary_-_main_publication.pdf 4. Educational standards Qualifications on leaving school (source: Department of Education) Link to School leavers – 2016/17 statistical bulletin: https://www.education-ni.gov.uk/publications/school-leavers-201617-statistical-bulletin Higher and Further Education (source: Department for the Economy) Link to Further Education Activity in Northern Ireland 2017/18: https://www.economy-ni.gov.uk/publications/further-education-activity-northern-ireland-201718 Enrolments of full-time undergraduate first year students at NI HEI by gender and subject area (source: Higher Education Statistics Agency (HESA) Link to ‘Where do HE students study?’: https://www.hesa.ac.uk/data-and-analysis/students/where-study Subject choice in Higher Education (source: Department for the Economy) Link to Enrolments at UK Higher Education Institutions by country of institution and subject area – 2016/17: https://www.economy-ni.gov.uk/publications/enrolments-uk-higher-education-institutions-by-country-institution-and-subject-area-201617 Enrolments of first year, full-time undergraduate students in STEM subjects by gender (source: HESA) Link to ‘What do HE students study?’: https://www.hesa.ac.uk/data-and-analysis/students/what-study

Women in Northern Ireland published on 18th December 2018 Page 19
Subject Choices at NI Further Education Colleges (source: Department for the Economy) Link to Further Education Activity in FE Colleges in Northern Ireland 2017/18: https://www.economy-ni.gov.uk/publications/further-education-activity-fe-colleges-northern-ireland-201718 5. Women in politics and public life
Link to UK Parliament website: www.parliament.uk Link to European Parliament website: www.europarl.europa.eu Public Appointments (source: The Executive Office) Link to Public Appointment Annual Report for NI 2016/17 https://www.executiveoffice-ni.gov.uk/publications/public-appointments-annual-report-201617 6. Women into business Levels of female entrepreneurship (source: Invest NI, Global Entrepreneurship Monitor (GEM)) Link to GEM UK: Northern Ireland Report 2017 https://www.enterpriseresearch.ac.uk/gem-uk-northern-ireland-report-2017/