datalog pro
DESCRIPTION
Set Current MeterTRANSCRIPT

© Valeport Limited
DataLog Pro Software Manual Page 1 04008261a.doc
VALEPORT LIMITED
DataLog Pro
Operation Manual
Document Ref: 04008261a Document Version: A Date: December 2008 This confidential document was prepared by the staff of Valeport Limited, the Company, and is the property of the Company, which also owns the copyright therein. All rights conferred by the law of the copyright and by virtue of international copyright conventions are reserved to the Company. This document must not be copied, reprinted or reproduced in any material form, either wholly or in part, and the contents of this document, and any method or technique available therefrom, must not be disclosed to any other person whatsoever without the prior written consent of the Company. Valeport Limited, Tel: +44 (0)1803 869292 St Peters Quay, Fax: +44 (0)1803 869293 Totnes, e-mail: [email protected] Devon, TQ9 5EW, Web: www.valeport.co.uk UK As part of our policy of continuous development, we reserve the right to alter, without prior notice, all specifications, designs, prices and conditions of supply for all our equipment. Copyright 2008

© Valeport Limited
DataLog Pro Software Manual Page 2 04008261a.doc
CHAPTER DESCRIPTION PAGE
1 INTRODUCTION ............................................................................................................. 4
2 INSTALLATION ............................................................................................................... 5
3 CONNECTING TO THE INSTRUMENT .......................................................................... 6
3.1 Establishing Communications ................................................................................ 7
3.2 Changing Baud Rate ............................................................................................ 13
3.3 Changing Setup ................................................................................................... 14
3.3.1 Sampling Mode & Rate .................................................................................... 14
3.3.1.1 Sampling Mode ......................................................................................... 14
3.3.1.2 Sampling Rate .......................................................................................... 15
3.3.2 Burst Setup ...................................................................................................... 16
3.3.2.1 MIDAS & Monitor Instruments ................................................................... 16
3.3.2.2 miniTIDE ................................................................................................... 17
3.3.3 Time Setup (Standard) .................................................................................... 18
3.3.4 Time Setup (Burst Mode, MIDAS & Monitor Range) ........................................ 18
3.3.5 Conditional setup ............................................................................................. 19
3.3.6 Standard Deviation ouput ................................................................................ 19
3.3.7 Local Settings .................................................................................................. 19
3.3.8 Units Setup ...................................................................................................... 20
3.3.9 GPS port setup ................................................................................................ 20
3.3.10 Output Port Setup ............................................................................................ 21
3.3.11 Profile Setup .................................................................................................... 21
3.3.11.1 (MIDAS & Monitor Range) ........................................................................ 21
3.3.11.2 Profile Setup (miniSVP & miniCTD) .......................................................... 23
3.3.12 Pressure Tare .................................................................................................. 24
4 DEPLOYMENT ............................................................................................................. 25
4.1 Self Recording Deployment .................................................................................. 25
4.2 Direct Reading Deployment.................................................................................. 25
5 DATA UPLOAD & MEMORY ......................................................................................... 26
5.1 Upload (MIDAS & Monitor Instruments)................................................................ 27
5.2 Upload (mini Instruments) .................................................................................... 28
5.3 Data File Location ................................................................................................ 29
5.4 Erasing Memory ................................................................................................... 29
6 FILE HANDLING ........................................................................................................... 30
6.1 Opening Uploaded Data Files .............................................................................. 30
6.2 Saving Real Time Data Files ................................................................................ 31
6.3 Opening Real Time Data Files ............................................................................. 32
7 DATA DISPLAY ............................................................................................................ 33
7.1 Simple Display ..................................................................................................... 34
7.1.1 Changing Background ..................................................................................... 35
7.1.2 Changing Font ................................................................................................. 36
7.2 Scroll Display ....................................................................................................... 37
7.3 Graph Display ...................................................................................................... 38
7.4 Profile Display ...................................................................................................... 39
7.5 Graph and Profile Display Features ...................................................................... 40
7.5.1 Zooming .......................................................................................................... 40
7.5.2 Adjusting Scale ................................................................................................ 40
7.5.3 Exporting Graphs ............................................................................................. 41
7.6 Last Data Display ................................................................................................. 41

© Valeport Limited
DataLog Pro Software Manual Page 3 04008261a.doc
7.7 Saving Your Display ............................................................................................. 42
8 MANUALS .................................................................................................................... 43
9 SEAWATER CALCULATIONS UTILITY ........................................................................ 44
© Valeport Limited
DataLog Pro Software Manual Page 4 04008261a.doc
1 INTRODUCTION
This manual covers the operation of Valeport’s DataLog Pro software, compatible with
the following Valeport products:
• miniSVP • MIDAS CTD (+)
• miniCTD • Monitor CTD
• miniTIDE • MIDAS SVX2
• MIDAS SVP • MIDAS WLR
• Monitor SVP • MIDAS ECM
The software is also backwards compatible with older products from the same family:
• Model 650 Mk2 SVP
• Model 606 CTD
• Model SVXtra Combined SVP/CTD
• MIDAS SVX Combined SVP/CTD
• Model 808_400 Current Meter (Basic unit with optional C,T,P or SV sensors only)
The software allows setup of the instrument sampling regime, extraction of recorded
data, and display of both real time and recorded data in a selection of formats.
DataLog Pro is supplied on a single CDROM with the instrument. Whilst all new
instruments are shipped with the latest version of this software, shipping / warehousing
delays, or sourcing the instrument through a 3rd party, may result in a newer edition of
the software being available. It is worth checking the support pages of our website to
confirm that you have the latest version of the software before using it.

© Valeport Limited
DataLog Pro Software Manual Page 5 04008261a.doc
2 INSTALLATION
To install DataLog Pro, run “setup.exe” from the installation CDROM, or from the
“DataLog_Pro_install” directory if you have downloaded the software.
Once installed, DataLog Pro may be run by clicking the icon on your desktop.
Note that a second utility program will also be installed with a similar icon, called "Sea
Water Calculations". This program allows the user to verify the calculation of Salinity,
Density, Depth and Sound Speed values using industry standard equations, and is
described in full in Section 9 of this manual.

© Valeport Limited
DataLog Pro Software Manual Page 6 04008261a.doc
3 CONNECTING TO THE INSTRUMENT
When you run DataLog Pro, or click "Comms Wizard", on the menu bar, this screen will
appear:
There are 4 buttons available, the function of each is described on screen and below.
The Communicate button allows you to talk to the instrument for the
purposes of setting it up or extracting recorded data files to PC. These
functions are described in detail in Sections 3, 4 & 5.
The Open File button allows you to open data that you have previously
uploaded from the instrument; this data may then be viewed using a
variety of display functions, as described in Section 7.
The About button displays the current version number of the software.
Valeport support staff may ask you for this number if you have a
technical problem.
Exit closes down the DataLog Pro program.

© Valeport Limited
DataLog Pro Software Manual Page 7 04008261a.doc
3.1 ESTABLISHING COMMUNICATIONS
Click the Communicate button on the Welcome
screen to begin the process of connecting to
the instrument. This screen will be shown:
The Com Port box on the left will list all the
Com Ports fitted to your PC. Choose the port
that you wish to use to communicate with the
instrument.
The Type box in the centre of the screen lists
the available communications options:
RS232 This standard format is always available, and allows communications direct
with PC. Use the standard 3m Y lead between instrument and PC for this
method. The vast majority of applications will use this method - unless you
have a specific adapter for one of the other modes, use RS232.
RS485 Allows communications over long cable lengths (up to 1000m minimum). It
requires a special adapter and additionally you must set the instrument to
operate in this mode. The procedure for this is to FIRST use the Y lead only
to connect the instrument to the PC. Select RS485 in the Type box, and click
Next. The software will communicate with the instrument, and will then set it
to RS485 mode. When communications have been established, simply
exchange the Y lead for the RS485 adapter, and continue as normal.
RS422 Like RS485, this is a robust, long cable method, and will operate over cables
up to 1500m in length. It also requires a special adapter; follow the
instructions given above for RS485 mode, but select RS422 instead,
FSK This is a 2-wire communications method, available as an option on MIDAS
units only. It will transmit data from and power to the instrument over cable
lengths up to 6km (depending on cable specification), but requires an
additional circuit to be fitted to the MIDAS instrument, as well as an adapter at
the top end. Check this box only if you have FSK fitted (38400 baud only).
Note that RS422 and FSK communications are not available for the “mini” series.

© Valeport Limited
DataLog Pro Software Manual Page 8 04008261a.doc
MODEM Allows communication via a TAPI modem with Valeport GSM modem
interface. (19200 baud only).
Baud rate is the speed at which the PC and the instrument communicate. Monitor and
MIDAS Instruments will always leave the factory set to 19200 baud, which works
reliably with RS232 over cable lengths up to 50m. Mini SVP/CTD/Tide instruments
always leave the factory set to 115200.
A higher rate may be appropriate if uploading large data
files over the 3m Y lead, or a lower rate if you are using
RS232 communications over longer cables (200m max).
See Section 3.2 for details on how to change the baud
rate.
If you do not know the baud rate of your instrument, or
communications cannot be established at the baud rate
you thought the instrument was set to, select "Don't
Know", and DataLog Pro will find the current baud rate of
the instrument.
Note that MiniTide, MiniSVP, MiniCTD should only be set to 34800, 57600 or 115200.
Note that if you using FSK adapters, the baud rate will be fixed to a default value (FSK 38400).
When you have chosen the correct Comm Port,
Type and Baud Rate, click Next. The following
screen will appear. (Unless using MODEM option)
Follow the instructions, and Click Next.
© Valeport Limited
DataLog Pro Software Manual Page 9 04008261a.doc
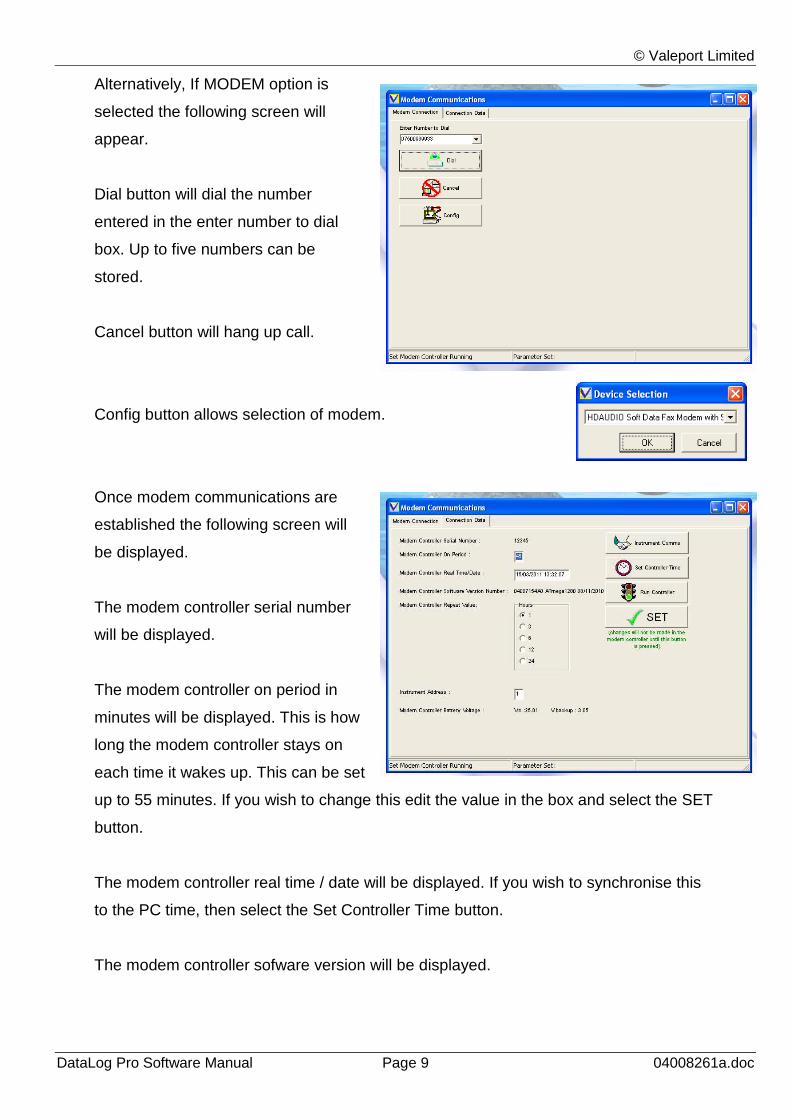
Alternatively, If MODEM option is
selected the following screen will
appear.
Dial button will dial the number
entered in the enter number to dial
box. Up to five numbers can be
stored.
Cancel button will hang up call.
Config button allows selection of modem.
Once modem communications are
established the following screen will
be displayed.
The modem controller serial number
will be displayed.
The modem controller on period in
minutes will be displayed. This is how
long the modem controller stays on
each time it wakes up. This can be set
up to 55 minutes. If you wish to change this edit the value in the box and select the SET
button.
The modem controller real time / date will be displayed. If you wish to synchronise this
to the PC time, then select the Set Controller Time button.
The modem controller sofware version will be displayed.

© Valeport Limited
DataLog Pro Software Manual Page 10 04008261a.doc
The modem controller repeat value in hours will be displayed. This is the wake up
interval. Options of 1, 3, 6, 12 and 24 hours are available. To chnge, select the required
radio button and select the SET button.
The instrument address is displayed. If you wish to change this, edit the value in the box
and select the SET button.
The modem controller voltage levels will be displayed.
The Instrument Comms button starts the interrupt instrument process.
The Run Controller button closes the dial up connection and returns the controller to its
shutdown / wake-up cycle.

© Valeport Limited
DataLog Pro Software Manual Page 11 04008261a.doc
Once the interrupt cycle has started:
The software will indicate what it is doing in the
bottom left hand corner of the screen:
After the "Attempting to interrupt instrument" message (illustrated on previous page),
the software will send a series of commands and queries to the instrument to establish
what type of device it is, what its current settings are, and what data it holds in memory.
When all the required information has been collected, a screen will be displayed
summarising the instrument status:
In the example shown, the device is a MIDAS SVX2 500, Serial Number 29832.
Communications have been established using RS485 at a baud rate of 19200. The
sampling setup is given (refer to Section 3.3.1), together with the value and date of the
last pressure tare (Section 3.3.12), the amount of empty memory, and the status of both
the power source (this refers to the battery pack if running on batteries, or the external
power supply if not) and the backup Lithium battery (400 series instrument only, not
“mini” range).
During the interrogation the software may encounter an unexpected setting or value for
a particular parameter. The unexpected value MAY be indicative of an underlying
problem, and a warning will be displayed. An example may be that the instrument
date/time is unacceptably different from the PC date/time. This MAY be caused by a
flat backup battery. Although it may be possible to correct the symptom of the problem
(e.g. by resetting the clock), there may be other consequences that prevent the
instrument from running properly. It is advisable to take note of the error, and contact
Valeport for further advice.
© Valeport Limited
DataLog Pro Software Manual Page 12 04008261a.doc
Having established communications, you are presented with 5 options:
Change Setup Click this button to change the way that the instrument samples
data, and to adjust basic parameters such as the date and time.
If you are not sure how the device has been setup, you should
use this function to check it before deployment. See Section
3.3 for details of the Setup procedure.
Upload Screen If you have just deployed the device and wish to recover the
data it has logged, use the Upload Screen button. This also
allows you to erase the memory. See Section 5 for further
details.
Run This button will set the device into Run mode using the current
settings. It will begin to log and output data according to the
sampling scenario you have set. See Section 4 for further
details.
Change Baud Rate Having established communications at a particular baud rate,
you may wish to change this to suit your particular
requirements. For example, a higher baud rate may be suitable
for extracting large amounts of data, or a lower rate for using
longer cable lengths. See Section 3.2.
Cancel This button will close communications and return you to the
opening screen.

© Valeport Limited
DataLog Pro Software Manual Page 13 04008261a.doc
3.2 CHANGING BAUD RATE
The following screen will appear when you click this button. Simply select the new
required baud rate, and Click OK. The software will first set the instrument to this rate,
and will then adjust the PC Communications Port to the same rate, and try to re-
establish communications.
Note that MiniTide, MiniSVP, MiniCTD should only be set to 34800, 57600 or 115200.
Note that if you select an inappropriately high rate (e.g. 115200 with a cable longer than
3m), it may not be possible to re-establish communications. If this happens, please
remove power from the instrument (or disconnect the cable from the instrument), and
return to the beginning of the program. Select “Don’t Know” for the baud rate, and then
follow the instructions. During the first 15 seconds after switch-on, the instrument will
perform an autobaud function that allows it to communicate with the PC at the fastest
rate it can reliably achieve.

© Valeport Limited
DataLog Pro Software Manual Page 14 04008261a.doc
3.3 CHANGING SETUP
3.3.1 SAMPLING MODE & RATE
DataLog Pro allows you to set the
instrument to work in one of three
operating modes, and at a choice of
sampling rates.
3.3.1.1 SAMPLING MODE
Continuous Mode The instrument will simply take readings at regular intervals until it
is stopped. It is ideal for ship-borne applications where a regular
data output is required – an example may be where it is mounted
close to a multi-beam transducer and the data is used to allow
continual correction for beam angle.
miniTIDE runs at maximum 2Hz
Burst Mode The instrument will take a set of readings, then “sleep” for a
defined period of time before waking up and repeating the
process. This type of use is ideal for longer term deployments in a
fixed position, since it conserves battery and memory usage.
Not available on miniSVP or miniCTD
Profile Mode This mode sets the instrument to take readings at fixed depth
intervals as it is lowered and raised through the water column.
Not available on miniTIDE

© Valeport Limited
DataLog Pro Software Manual Page 15 04008261a.doc
3.3.1.2 SAMPLING RATE
The instrument will produce a set of readings a number of times per second, from once
to eight times. There are a few important points to note about the Sampling Rate:
1) The sampling is synchronised, so data is taken from all fitted sensors at exactly
the same instant. There is no variation in data quality between 1Hz and 8Hz
sampling, just in the volume of data.
2) Running in continuous mode, there is a limit to how fast your eyes can cope with
data updating on screen – it may not always be a good idea to run at 8Hz.
3) The sampling rate doesn’t affect the power consumption, so if you are using
burst mode, do not worry about running at 8Hz rather than 1Hz. The important
thing is how long the instrument is on for, not how fast it is sampling.
4) Profile Mode always defaults to 8Hz – this is how often it will read the pressure
sensor data to check whether it has reached the next depth at which take a
measurement. In free-fall, the probe will travel at about 2m/s, so at 8Hz it should
be able to get profile readings at around 0.25m intervals. Bear this in mind when
setting up the Profile.
5) miniTIDE will only sample at 1 or 2 Hz in Continuous mode
Once the Sampling Mode and Rate have been set, click “Next”. The sequence of
subsequent screens depends on the sample mode selected:
Continuous Set Time, Set Units, Site Information, PressureTare
Burst Set Burst Pattern, Set Time, Set Units, Site Information, PressureTare
Profile Set Time, Set Units, Set Profile Pattern, Site Information, PressureTare

© Valeport Limited
DataLog Pro Software Manual Page 16 04008261a.doc
3.3.2 BURST SETUP
3.3.2.1 MIDAS & MONITOR INSTRUMENTS
The basic pattern of Burst Sampling is to
measure a number of data points, then sleep
for a while to conserve power, then wake up
and repeat the cycle.
There are 4 values to be set for this mode,
which together define this sequence.
1) How fast the instrument samples. This has already been set on the previous
page, and in the example above is 8Hz (i.e. 8 sets of data per second). If you
wish to change this, click “Back” to return to the previous screen, and select the
required rate.
2) How many samples (lines of data) you want the instrument to measure in its
Burst. In the example, 40 lines of data has been entered. Running at 8Hz, this
will mean sampling data for 5 seconds.
3) How long you want between the start of each Burst. In this example, 2 minutes
has been set for this value. After the 5 seconds of sampling, the instrument will
therefore sleep for a further 1 minute 55 seconds, before waking up and
repeating the pattern. Data would therefore be recorded at 2 minute intervals.
4) Data Averaging. There are two options here – the instrument can be set to
record (and output) all the measured data points as they are taken (i.e. 40 lines
of data over a 5 second period), or the instrument can take an average value of
the readings and just record that. This method obviously greatly reduces the
memory usage of the instrument. Note that if the Average value is recorded,
then the Standard Deviation of the measurements is also recorded, which may
be used as indicator of data quality.

© Valeport Limited
DataLog Pro Software Manual Page 17 04008261a.doc
3.3.2.2 MINITIDE
The basic pattern of Burst Sampling is to measure a number of data points, then sleep
for a while to conserve power, then wake up and repeat the cycle. The miniTIDE
features 5 pre-programmed Burst patterns, as indicated:
For example, pattern B4 indicates that the instrument will sample data for 40 seconds,
then enter a sleep mode. This pattern is repeated every 15 minutes, so the sleep
period will last for 14 minutes 20 seconds. At the end of each sample period, the data
will be averaged and logged / output.
Note that although the miniTIDE is fitted with a sufficiently large memory that it is
unlikely it will ever be filled, the choice of Burst pattern will significantly affect the
possible length of deployment by affecting the battery life. Please refer to the separate
Operating Manual for the miniTIDE probe for the estimated battery life in each mode.
Select the desired sampling regime, and click Next.

© Valeport Limited
DataLog Pro Software Manual Page 18 04008261a.doc
3.3.3 TIME SETUP (STANDARD)
Once you have set up your sampling
regime, you will be asked to set the
instrument time. The current instrument
time is indicated – simply check the box to
update this time to match the time on your
PC. Note that this update does not
happen immediately, but during the final
instrument setting process.
3.3.4 TIME SETUP (BURST MODE, MIDAS & MONITOR RANGE )
Once you have set up your sampling
regime, you will be asked to set the
instrument time. The current instrument
time is indicated – simply check the box to
update this time to match the time on your
PC. Note that this update does not
happen immediately, but during the final
instrument setting process.
Burst Mode on the MIDAS and Monitor range of instruments also features a “Delay Start”
feature, where the instrument may be set to begin sampling at a specified point in the
future, usually after it has been deployed. This saves battery and memory being wasted
while the instrument is transported to and deployed at the monitoring location. To use
the Delay Start function, check the box, and set the required start time. Do this by
highlighting each value in the date/time box, and either typing a new value or using the
up/down buttons to set the required value.
© Valeport Limited
DataLog Pro Software Manual Page 19 04008261a.doc
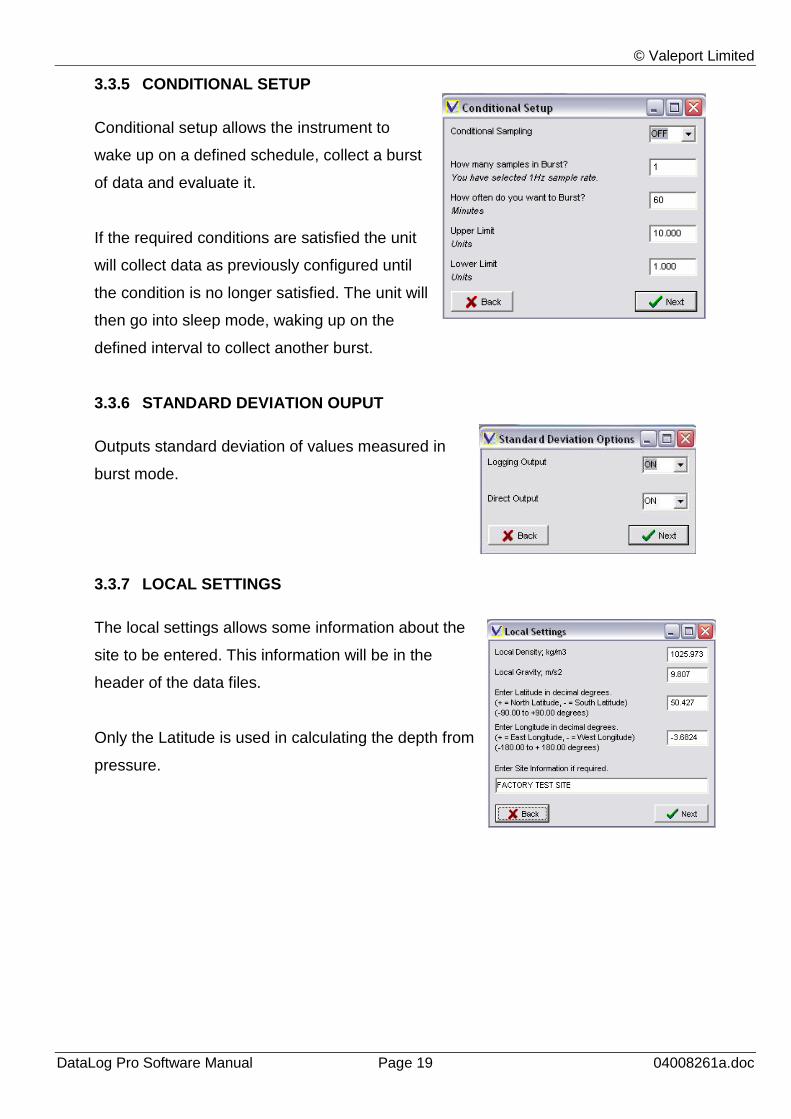
3.3.5 CONDITIONAL SETUP
Conditional setup allows the instrument to
wake up on a defined schedule, collect a burst
of data and evaluate it.
If the required conditions are satisfied the unit
will collect data as previously configured until
the condition is no longer satisfied. The unit will
then go into sleep mode, waking up on the
defined interval to collect another burst.
3.3.6 STANDARD DEVIATION OUPUT
Outputs standard deviation of values measured in
burst mode.
3.3.7 LOCAL SETTINGS
The local settings allows some information about the
site to be entered. This information will be in the
header of the data files.
Only the Latitude is used in calculating the depth from
pressure.
© Valeport Limited
DataLog Pro Software Manual Page 20 04008261a.doc
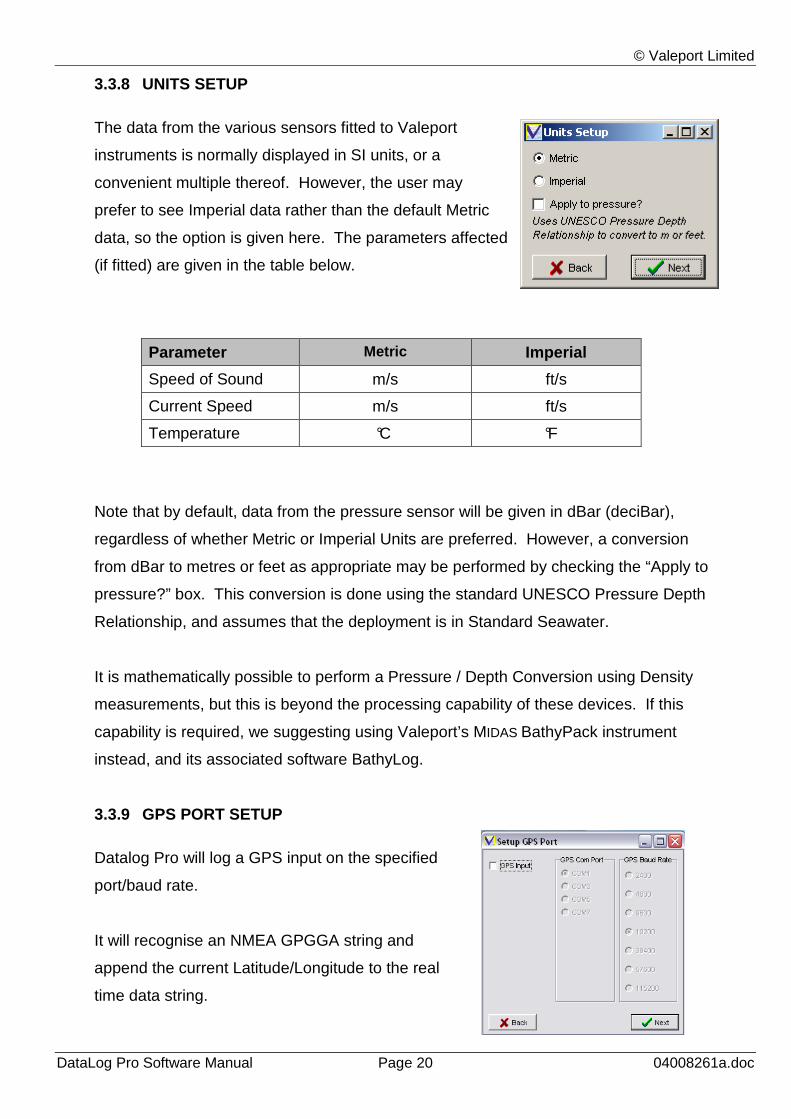
3.3.8 UNITS SETUP
The data from the various sensors fitted to Valeport
instruments is normally displayed in SI units, or a
convenient multiple thereof. However, the user may
prefer to see Imperial data rather than the default Metric
data, so the option is given here. The parameters affected
(if fitted) are given in the table below.
Parameter Metric Imperial
Speed of Sound m/s ft/s
Current Speed m/s ft/s
Temperature °C °F
Note that by default, data from the pressure sensor will be given in dBar (deciBar),
regardless of whether Metric or Imperial Units are preferred. However, a conversion
from dBar to metres or feet as appropriate may be performed by checking the “Apply to
pressure?” box. This conversion is done using the standard UNESCO Pressure Depth
Relationship, and assumes that the deployment is in Standard Seawater.
It is mathematically possible to perform a Pressure / Depth Conversion using Density
measurements, but this is beyond the processing capability of these devices. If this
capability is required, we suggesting using Valeport’s MIDAS BathyPack instrument
instead, and its associated software BathyLog.
3.3.9 GPS PORT SETUP
Datalog Pro will log a GPS input on the specified
port/baud rate.
It will recognise an NMEA GPGGA string and
append the current Latitude/Longitude to the real
time data string.

© Valeport Limited
DataLog Pro Software Manual Page 21 04008261a.doc
3.3.10 OUTPUT PORT SETUP
Datalog Pro can relay the real time data string on via
a selected com port. It is intended to be used once
the GPS position has been appended to the real
time string.
3.3.11 PROFILE SETUP
3.3.11.1 (MIDAS & MONITOR RANGE)
There are two values that must be set to
define a Profile. The first is the depth at
which you wish to make the first
measurement, and the second is the
distance between measurements. There
are a few points to note:
1) The Start Point takes account of the fact that you may use a Pressure
Tare Value (see Section 3.3.8). If you do use a Pressure Tare, then a
value of “0” is effectively the water surface, and “5” would be 5 dBar
below the surface. Note that the profile settings are always in dBar
(deciBar), where 1 dBar is approximately equivalent to 1m seawater.
2) The instrument will take measurements both on the way down and on the
way back up through the water column.
3) The instrument works by taking complete sets of data as fast as it can
(8Hz). For each set of data, it compares the measured pressure with the
pressure at which it should take the next reading in the profile. If the
pressure has reached this value, then the data is kept. If not, the data is
discarded. Because it works this way, it is important that you do not ask it
to make an unreasonably detailed profile. It can only take 8 readings per
© Valeport Limited
DataLog Pro Software Manual Page 22 04008261a.doc
second, so if you ask it to take a measurement every 0.05dBar (approx
5cm), this equates to a maximum drop rate of 0.4m/s. If you then drop it
at 2m/s, it will not be able to sample fast enough to give you the required
profile interval, and you will not get the profile you expected.
When you are happy with your Profile Setup, click “Next”.

© Valeport Limited
DataLog Pro Software Manual Page 23 04008261a.doc
3.3.11.2 PROFILE SETUP (MINISVP &
MINICTD)
For the miniSVP and miniCTD, you are
required to set the interval for Profiling, i.e. the
depth change between each measurement.
There are a few points to note:
1) The Start Point takes account of the fact that you may use a Pressure Tare
Value (see Section 3.3.8). If you do use a Pressure Tare, then a value of “0” is
effectively the water surface, and “5” would be 5 dBar below the surface.
2) The profile settings are always in the same units as you have selected to
display the data (Section 3.3.5).
3) The instrument will take measurements both on the way down and on the way
back up through the water column.
4) The instrument works by taking complete sets of data as fast as it can (8Hz).
For each set of data, it compares the measured pressure with the pressure at
which it should take the next reading in the profile. If the pressure has reached
this value, then the data is kept. If not, the data is discarded. Because it works
this way, it is important that you do not ask it to make an unreasonably detailed
profile. It can only take 8 readings per second, so if you ask it to take a
measurement every 0.05dBar (approx 5cm), this equates to a maximum drop
rate of 0.4m/s. If you then drop it at 2m/s, it will not be able to sample fast
enough to give you the required profile interval, and you will not get the profile
you expected.

© Valeport Limited
DataLog Pro Software Manual Page 24 04008261a.doc
3.3.12 PRESSURE TARE
The Pressure sensor fitted to your device is an “Absolute” sensor, which means it
measures the total pressure acting on it, including atmospheric pressure. Atmospheric
pressure obviously varies according to weather systems, but at sea level it will be in the
region of 1 Bar, or 10 dBar. Depending on the conditions of the day, the sensor will
therefore measure approximately 10dBar at the surface, before it has even entered the
water. This offset will apply to all your readings throughout the deployment.
Note that the actual value of the reading in air will depend on the accuracy of the pressure sensor as well as the conditions of the day.
The following screen gives you two methods of dealing with this issue:
1) Apply a Tare to the pressure reading. This function will measure the pressure
acting on the sensor at sea level (before you deploy it), and then subtract this
value from each subsequent pressure reading. To do this, click the “Set Pressure
Tare” box; the Tare value will be taken when you click the “Finish Setup” button.
We recommend that you use this feature for Profiling.
2) Record the total pressure (including atmospheric) by using a Tare value of zero.
Click the “Zero Pressure Tare” box to do this. If you do this, and subsequently
want to remove the atmospheric pressure value from your data, then you will
need to make a separate note of what the atmospheric pressure is, or for long
term deployments, how it changes over time.
We recommend that you use this method for long term deployments.
3) To maintain the current Pressure Tare values, ensure that both boxes are clear.
To complete the Setup Wizard, click the “Finish Set up” button.

© Valeport Limited
DataLog Pro Software Manual Page 25 04008261a.doc
4 DEPLOYMENT
When the Setup Wizard has been completed, you will be returned to the
“Communications Established” screen.
To start the instrument running according to the sampling pattern you have set, click the
“Run” button.
Choose whether you wish to deploy the instrument in Self Recording mode or Direct
Reading Mode (i.e. with a cable attached, outputting data in real time).
4.1 SELF RECORDING DEPLOYMENT
If you choose to deploy in Self Recording
mode, the program will display a brief list of
instructions as shown:
At this point, the software will send no further commands to the instrument – the act of
fitting the Switch Plug (step 3) turns the instrument on and starts the sampling. Clicking
“OK” will return you to the opening DataLog Express screen.
4.2 DIRECT READING DEPLOYMENT
Selecting Direct Reading mode and clicking the “Next” button causes the software to
immediately instruct the instrument to begin sampling using the chosen setup. Use the
various data display functions as described in Section 7 to view the data in your
preferred style.

© Valeport Limited
DataLog Pro Software Manual Page 26 04008261a.doc
5 DATA UPLOAD & MEMORY
To Upload data from the instrument memory, it is first necessary to establish
communications as described in Section 3.1.
From the “Communications Established” window, click the
“Upload Screen” button.
The following will be displayed:
This screen lists all the data files held in the instrument’s memory. It also shows the
size of the file, and the date and time at which it was created. Note that a new file is
created each time the instrument is put into “Run” mode, or each time the Switch Plug is
inserted into the instrument, so if you want to make multiple profiles before uploading
data, remove and re-insert the Switch Plug between profiles to put them in separate
data files.
There are also options for translating data into different output formats.

© Valeport Limited
DataLog Pro Software Manual Page 27 04008261a.doc
5.1 UPLOAD (MIDAS & MONITOR INSTRUMENTS)
Choose the files you wish to upload by highlighting them, using the standard Windows
Shift and Ctrl buttons to select multiple files. Then click the “Upload Files” button.
During the Upload Process, the
software will show this status
window:
Data is stored in memory and
uploaded in binary format, to
maximise memory usage. The
uploaded binary file (FILE1.BIN
in this example) is then
automatically translated into a
readable ASCII text file.
The text files may be viewed using DataLog Express, but may also be opened in a
standard spreadsheet package for further analysis or manipulation. However, some
spreadsheet packages have a limit on the number of lines of data that they can handle,
so a small pop-up window allows you to specify the maximum file size that you require.
If the data file is larger than this, it will be broken down into smaller files.
Simply Enter the maximum number of lines of
data that your spreadsheet can handle and
click “Set”. The display will show the size of
the data file that this is equivalent to (737280
bytes in the example). Provided that this is
bigger than the actual file size (89764), then
all the data will be contained in a single file.
When you are happy with these settings, click
OK to complete the translation process.
A confirmation window will appear to show
that the process is complete.

© Valeport Limited
DataLog Pro Software Manual Page 28 04008261a.doc
5.2 UPLOAD (MINI INSTRUMENTS)
Choose the files you wish to upload by highlighting them, using the standard Windows
Shift and Ctrl buttons to select multiple files. Then click the “Upload Files” button.
During the Upload Process, the
software will show this status
window:
Data is stored in memory and
uploaded in ASCII text format.
The text files may be viewed using DataLog Pro, but may also be opened in a standard
spreadsheet package for further analysis or manipulation.
A confirmation window will appear to show that the
process is complete.

© Valeport Limited
DataLog Pro Software Manual Page 29 04008261a.doc
5.3 DATA FILE LOCATION
Data is always uploaded to the following location:
C:\Program Files\DataLog Pro\Data\{nnnnn}\ddmmyyyy
Where: {nnnnn} signifies the instrument serial number
Ddmmyyyy signifies the date of the upload
5.4 ERASING MEMORY
Valeport instruments use Flash memory, which is non-volatile (i.e. doesn’t require
battery backup), and is extremely reliable. It can also be emptied and re-used many
thousands of times. However, the way in which the memory is used, maximising the
available storage capacity, means that it is not possible to delete individual files - the
memory can only be erased completely.
To delete files from the instrument memory, simply click the
“Erase Memory” button. You will be warned that data cannot
be recovered after this process, and the memory will then be
deleted.

© Valeport Limited
DataLog Pro Software Manual Page 30 04008261a.doc
6 FILE HANDLING
DataLog Pro may be used to view data that has been uploaded from an instrument or
data received in real time data via a cable link. Additionally, it may be used to record
real time data on the PC as it is received.
Section 7 of this manual gives details on the various data display functions available
within the software – this section shows how to open uploaded data files, and how to
save and open real time data files.
6.1 OPENING UPLOADED DATA FILES
To open an uploaded data file, either click
the Open File button on the Welcome
Screen or select Open File from the File
menu at the top of the page:
You will be shown a standard
Windows “Open” display, as
indicated.
Navigate to the correct folder,
remembering that data is always
uploaded to the following
location:
C:\Program Files\DataLog Pro\Data\{nnnnn}\ddmmyyyy
Where: {nnnnn} signifies the instrument serial number
Ddmmyyyy signifies the date of the upload
Make sure to select the correct File Type, either MIDAS Data Files or mini Data Files
from the drop down list. Mini data files have a “.txt” extension, MIDAS data files have
numerical extensions, normally “.000”. Note that if an uploaded file is split into more
than one ASCII file (Section 5.1), then the extension increments, i.e. “.001”, “.002” etc.
© Valeport Limited
DataLog Pro Software Manual Page 31 04008261a.doc
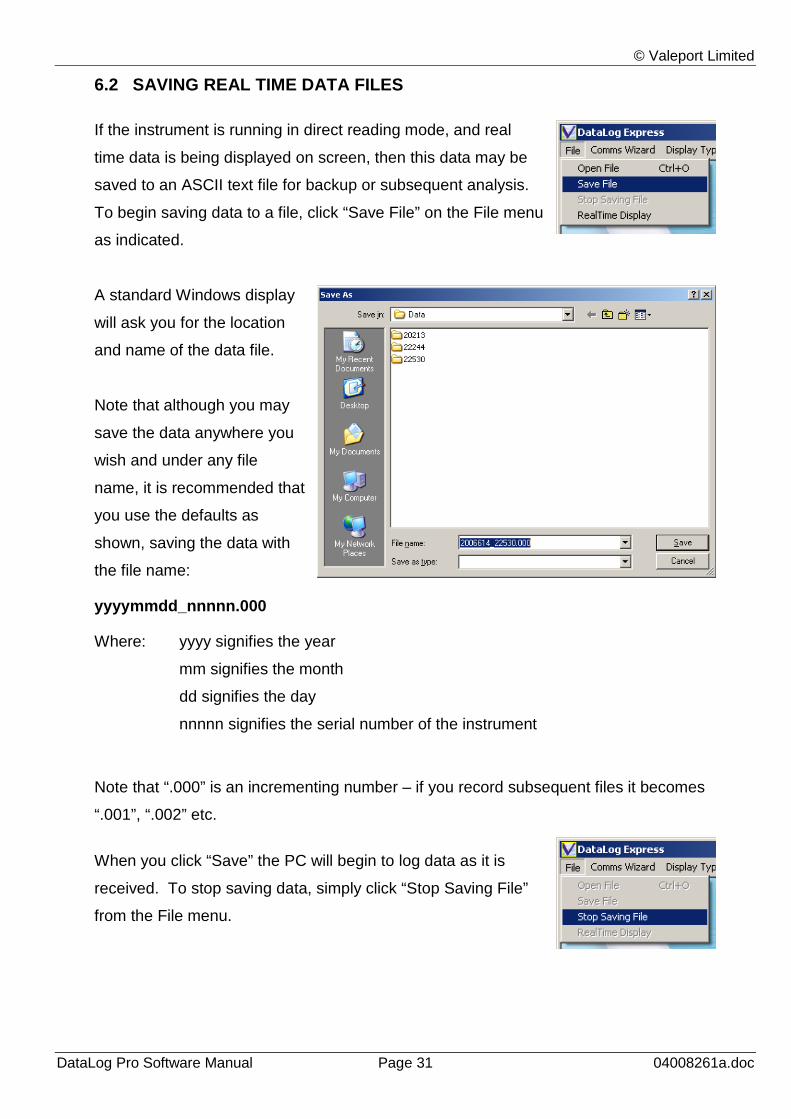
6.2 SAVING REAL TIME DATA FILES
If the instrument is running in direct reading mode, and real
time data is being displayed on screen, then this data may be
saved to an ASCII text file for backup or subsequent analysis.
To begin saving data to a file, click “Save File” on the File menu
as indicated.
A standard Windows display
will ask you for the location
and name of the data file.
Note that although you may
save the data anywhere you
wish and under any file
name, it is recommended that
you use the defaults as
shown, saving the data with
the file name:
yyyymmdd_nnnnn.000
Where: yyyy signifies the year
mm signifies the month
dd signifies the day
nnnnn signifies the serial number of the instrument
Note that “.000” is an incrementing number – if you record subsequent files it becomes
“.001”, “.002” etc.
When you click “Save” the PC will begin to log data as it is
received. To stop saving data, simply click “Stop Saving File”
from the File menu.

© Valeport Limited
DataLog Pro Software Manual Page 32 04008261a.doc
6.3 OPENING REAL TIME DATA FILES
To open an uploaded data file, either click
the Open File button on the Welcome
Screen or select Open File from the File
menu at the top of the page:
You will be shown a
standard Windows “Open”
display, as indicated.
Navigate to the folder
where you saved the data,
and locate the correct file,
remembering the file
naming protocol described
in Section 6.2 above. Click
Open, and refer to Section
7 for details of how to
display the data.
© Valeport Limited
DataLog Pro Software Manual Page 33 04008261a.doc
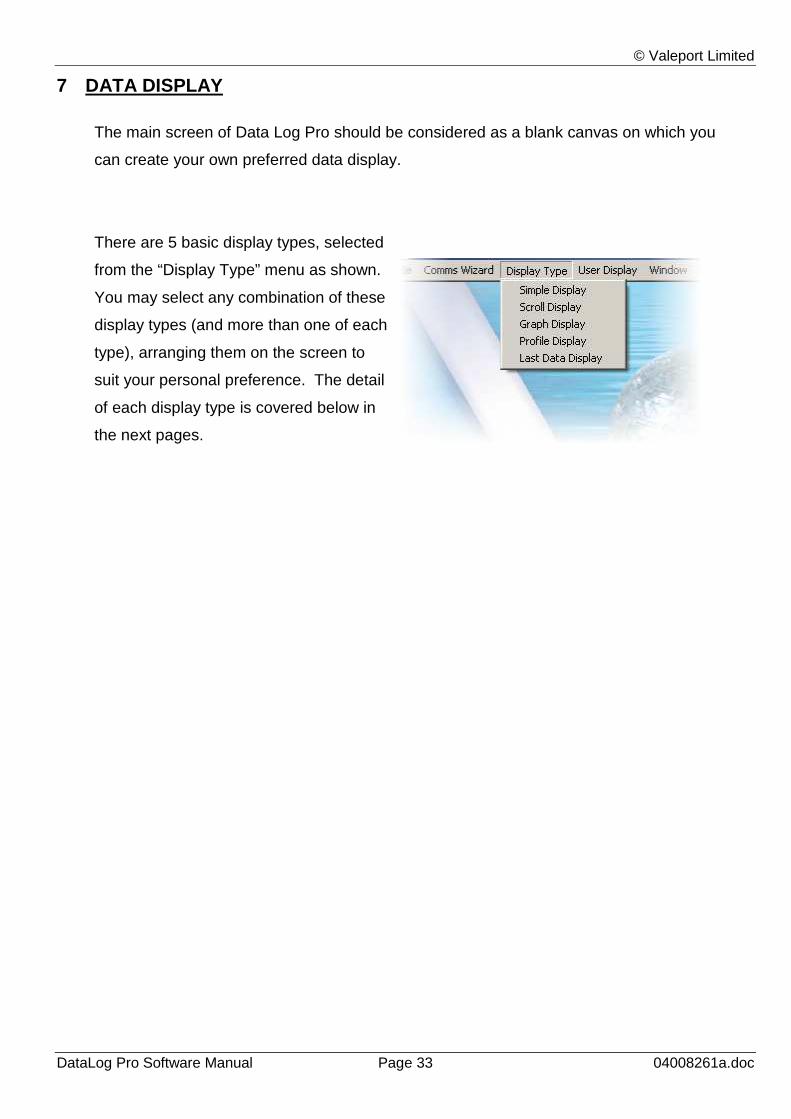
7 DATA DISPLAY
The main screen of Data Log Pro should be considered as a blank canvas on which you
can create your own preferred data display.
There are 5 basic display types, selected
from the “Display Type” menu as shown.
You may select any combination of these
display types (and more than one of each
type), arranging them on the screen to
suit your personal preference. The detail
of each display type is covered below in
the next pages.

© Valeport Limited
DataLog Pro Software Manual Page 34 04008261a.doc
7.1 SIMPLE DISPLAY
The Simple Display gives the latest reading
of any single chosen parameter, and is
therefore best used for viewing real time
data. Select “Simple Display” from “Display
Type” menu, and this box will appear:
Using the mouse, Right-click in the display box to show the options for this display type.
Firstly, you must choose which parameter you want to display. Click “Sensor List”, and
the available parameters will be displayed. Choose the parameter of interest –
Temperature in the above example.
The box will now display the most recent
data value from that parameter, updating as
new data is received.
This box may be moved around the screen, and the size changed by dragging the
corners. The text will automatically adjust to the largest size that can fit in the box.
In order to improve the visibility of this display, you can change the properties of the text
and the background to suit your preference.
© Valeport Limited
DataLog Pro Software Manual Page 35 04008261a.doc
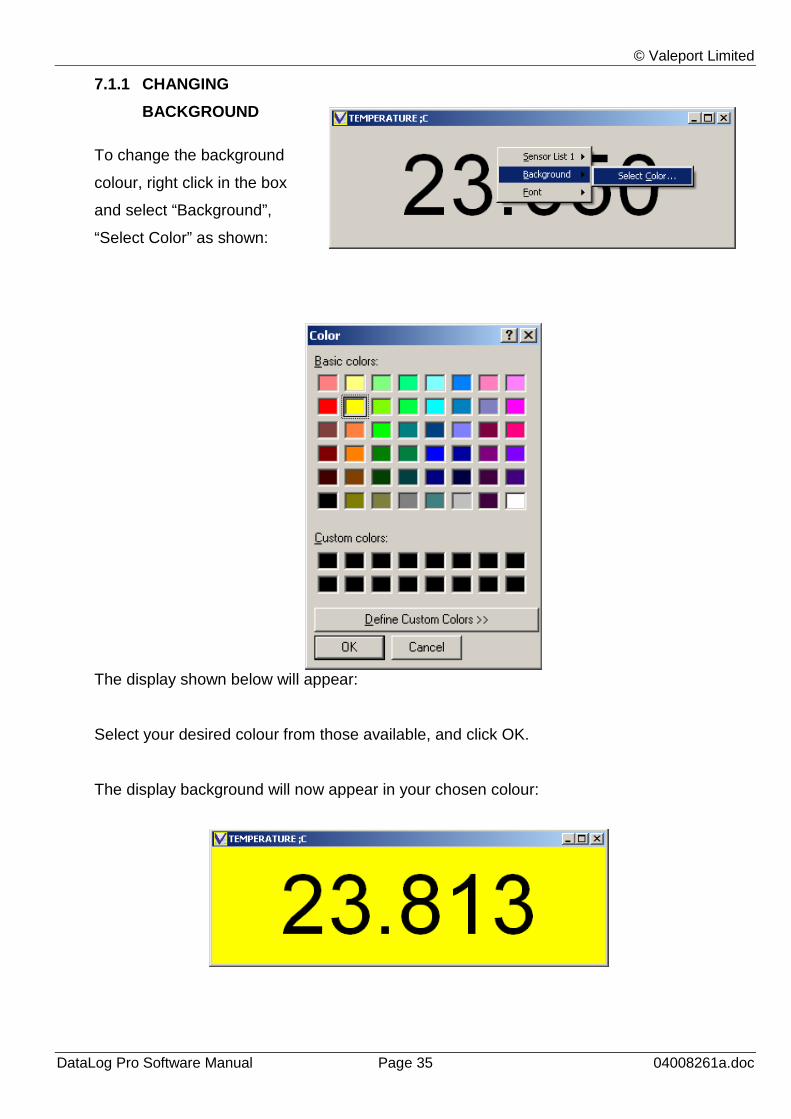
7.1.1 CHANGING
BACKGROUND
To change the background
colour, right click in the box
and select “Background”,
“Select Color” as shown:
The display shown below will appear:
Select your desired colour from those available, and click OK.
The display background will now appear in your chosen colour:

© Valeport Limited
DataLog Pro Software Manual Page 36 04008261a.doc
7.1.2 CHANGING FONT
To change the style and
colour of the text, right click in
the box, and select “Font”,
“Select Font” as shown:
The following display will appear:
Choose your preferred Font and colour as shown. Do not adjust the size, since it will
automatically fill the available space anyway.
Then Click “OK”. Your display will
be given in your chosen Font.
If the Font does not automatically adjust to fill the box, simply adjust the size of the box
minutely to force the text to expand.
Note: When changing Fonts and Backgrounds, it is sensible to choose colours that have a high contrast to enable the display to be easily read.

© Valeport Limited
DataLog Pro Software Manual Page 37 04008261a.doc
7.2 SCROLL DISPLAY
The scroll display is a tabular list of the data, and is suitable for showing either real time
data, or data from a saved or uploaded file.
The Scroll window initially appears as shown:
Right – click in the Window, and select “Sensor
List 1”, then choose the parameter you wish to
view. Note that you can repeat this process to
add parameters to the scroll window
The final Scroll Window will look
something like this.
The following points should be noted about the Scroll Window:
• The most recent data point is at the top of the list, the oldest at the bottom
• Large data files may take a few seconds to open with this display
• The columns widths are adjustable using the mouse
• The entire display may be positioned and resized using the mouse
• Background colour and Font may be adjusted as with the Simple Display

© Valeport Limited
DataLog Pro Software Manual Page 38 04008261a.doc
7.3 GRAPH DISPLAY
DataLog Express will show a Time Series
Graph of any chosen parameter, from
either recorded / uploaded data files or as
it is received in real time.
Choose “Graph Display” from the “Display
Type” menu and this screen will appear:
Right – click the box and choose the
required parameter from the “Sensor List”,
as shown.
Repeat to add more parameters to the same graph, which will be shown in a different
colour, and on individual axes, as shown below:
The Graph Window may be moved and sized using the mouse. By default, the graph
scales will “Autoscale” to fit the displayed data. Control of this feature and other graph
functions are described in Section 7.5.

© Valeport Limited
DataLog Pro Software Manual Page 39 04008261a.doc
7.4 PROFILE DISPLAY
DataLog Express will display data as a
Profile, i.e. plotting each parameter against
Pressure / Depth rather than against Time.
This type of display is suitable for use with
either uploaded / recorded data files, or
with real time data.
Choose “Profile Display” from the “Display
Type” menu and this screen will appear:
Right – click the box and choose the
required parameter from the “Sensor List”,
as shown.
Repeat to add more parameters to the same
graph, which will be shown in a different
colour, and on individual axes, as shown
below:
The Profile Window may be moved and sized
using the mouse. By default, the graph scales
will “Autoscale” to fit the displayed data.
Control of this feature and other graph
functions are described in Section 7.5.

© Valeport Limited
DataLog Pro Software Manual Page 40 04008261a.doc
7.5 GRAPH AND PROFILE DISPLAY FEATURES
7.5.1 ZOOMING
A particular Section of the graph may be “zoomed in” for closer viewing by simply
drawing a box with the mouse over the area of the graph of interest. Draw the box from
top left to bottom right.
To zoom out, simply draw a box with the mouse from
bottom right to top left, anywhere in the graph window
7.5.2 ADJUSTING SCALE
By default, the scale for each parameter will “Autoscale” to suit the range of data being
displayed. However, it is possible to manually control the scale if preferred.
Right click on the scale to be adjusted – click on the actual line of
the scale as shown.
Then, enter the required minimum and maximum values for the
scale, and click OK.
To return to the Autoscale mode, simply click “Auto”.

© Valeport Limited
DataLog Pro Software Manual Page 41 04008261a.doc
7.5.3 EXPORTING GRAPHS
The image of a Graph or Profile may be made available to other packages, for use in
presentations and reports. Right click the Graph and select the “Chart Option”, then
choose to either “Copy” the image to the PC clipboard for simple pasting, or “Save” it to
disk as a bitmap or metafile image.
7.6 LAST DATA DISPLAY
The Last Data Display is a simple tabular
display of the last piece of data received for
each parameter. It is suitable for use with
real time data. Initially the screen will
appear as indicated:
Right click the mouse in the box to
select the required parameters from the
“Sensor List”, repeating the process to
add more sensors.
The following points should be noted about the Last Data Window:
• The columns widths are adjustable using the mouse
• The entire display may be positioned and resized using the mouse
• Background colour and Font may be adjusted as with the Simple Display

© Valeport Limited
DataLog Pro Software Manual Page 42 04008261a.doc
7.7 SAVING YOUR DISPLAY
Having decided on
which types of data
display you require,
it is possible to
arrange them on
the screen by
moving and
resizing them as
appropriate. An
example of how the
screen could look
is shown here:
Having finalised your design, it is possible to save it
for future use as one of two “User Displays”. Click
“User Display” on the menu bar, then choose either
“User Display 1” or “User Display 2”, and finally
“Save”. The screen format will be recorded as
either User Display 1 or 2 accordingly.
To call up a previously saved display format, simply
select User Display 1 or 2, and “Load”. Note that it
may take a few seconds to load all the data into the
various displays.
It is also possible to rename these preferred display
formats to enable easier recognition. Select
“Rename” from eiether User Display 1 or 2 and Enter
the new name as appropriate:

© Valeport Limited
DataLog Pro Software Manual Page 43 04008261a.doc
8 MANUALS
A software copy of this operating manual, together with the hardware manuals for all the
instruments with which DataLog Pro is compatible, is included with the installation of the
software. Select “Manuals” from the menu, and then choose either “DataLog Pro” or the
appropriate instrument hardware manual from the drop down list.
These manuals are saved in Adobe Acrobat format, so will require Adobe Acrobat
Reader to be installed on your PC. If you do not have this, please visit the following
website to download it. Acrobat Reader is free.
www.adobe.com/products/acrobat/readstep2.html

© Valeport Limited
DataLog Pro Software Manual Page 44 04008261a.doc
9 SEAWATER CALCULATIONS UTILITY
The Seawater Calculations Utility installed in conjunction with DataLog Express is
provided as a tool for the user to carry out standard oceanographic calculations.
Simply input Conductivity/Salinity, Pressure Temperature (in IPT68 or IPT 90 scales)
and Latitude (if known), and click on the Calculate button. The program will calculate
and display the following parameters:
• Density Anomaly Gamma (Calculated Density – 1000kg/m³)
• Conductivity or Salinity (whichever the user did not
enter).
• Sound Speed calculated using the chosen Speed
of Sound Formula:
• Depth in metres calculated using the UNESCO
standard formula. This is an approximation, and
does not account for variations in density distribution throughout the water
column. Its accuracy has been estimated at better than 0.1m.
All formulae, including the various Speed of Sound formulae are available in full from
Valeport, if required.