databasing of nmr data benefits impurities & degradants ... · databasing of nmr data benefits...
TRANSCRIPT

Databasing of NMR Data Benefits Impurities & Degradants Research Dr Steve Coombes
Pfizer Global R&D, Sandwich. UK
ACD/Labs UK User Meeting 17th May 2007

2
Presentation Overview
Impurity and Degradant ID
Spectroscopic tools for analysis
Data analysis– Manual– Computer Assisted
Conclusions

3
Why ID Impurities and Degradants?
To ensure drug safety– Identify impurities present in Active Pharmaceutical
Ingredient (API) to make sure no toxic or mutagenic substances administered to patients
– Establish Drug Product (DP) degradation profile to help show stable formulation and underline shelf life assignment
IMPD and CTD (CMC) requirements– FDA guidelines state must identify impurities present at a
level > 0.1%
Chemistry optimisation
Analytical testing optimisation

4
API
Peak of interest
5
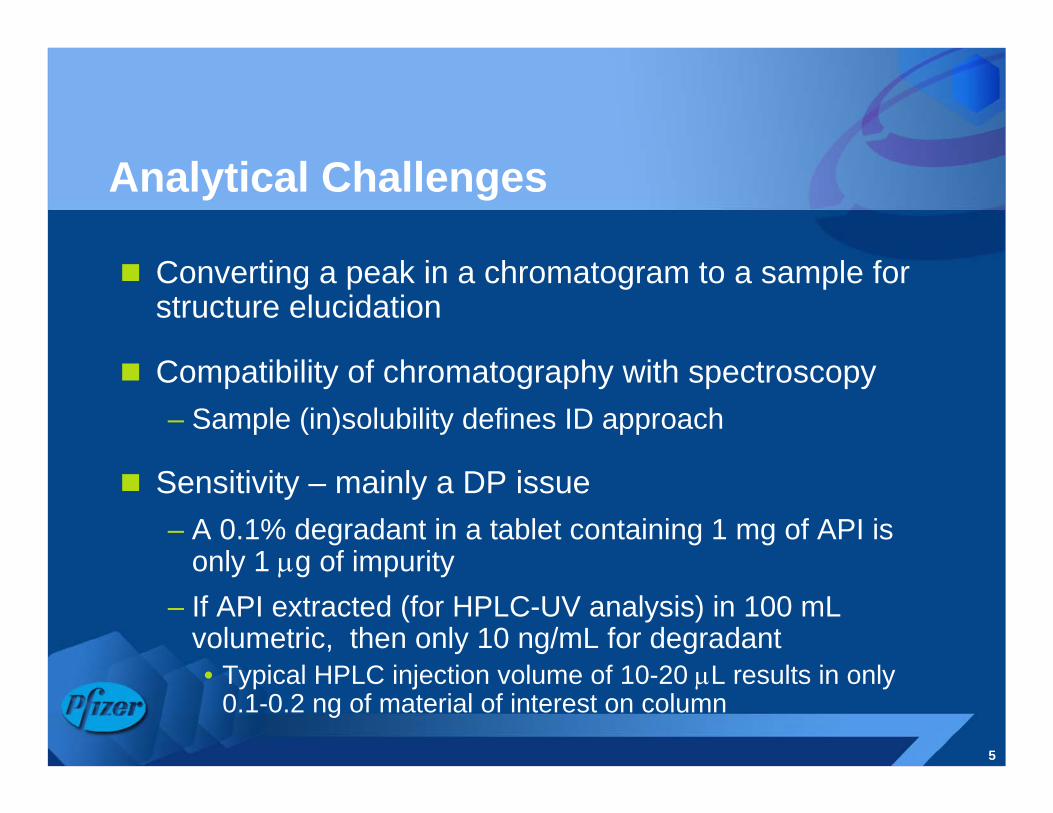
Analytical Challenges
Converting a peak in a chromatogram to a sample for structure elucidation
Compatibility of chromatography with spectroscopy– Sample (in)solubility defines ID approach
Sensitivity – mainly a DP issue– A 0.1% degradant in a tablet containing 1 mg of API is
only 1 μg of impurity– If API extracted (for HPLC-UV analysis) in 100 mL
volumetric, then only 10 ng/mL for degradant• Typical HPLC injection volume of 10-20 μL results in only
0.1-0.2 ng of material of interest on column

6
Spectroscopic Data
Mass Spectrometry– Provides framework (MF) within which to work– Fragmentation analysis provides indication of where in the
molecule changes occur (with respect to parent)
NMR spectroscopy– 1H (and 13C) 1D data gives number or nuclei present and
chemical shits indicate the atoms local environment– 2D data (1H-1H, 1H-13C & 1H-15N) give direct or long-range
correlation information allowing the “pieces” of the structure to be “glued” together• Homonuclear expts – COSY, ROESY• Heteronuclear expts – HSQC, HMBC

7
Impurity Identification Strategies
1st pass LC-MS & LC-MS/MS– Accurate mass and accurate fragment measurements
down to pg levels
If unsuccessful then NMR data required to ID unknown
Roughly require 1 mg/mL concentration of analyte– LC-NMR (if impurity present > 1%)– Sample enrichment – peak trapping, SPE-NMR– Sample isolation
• Looking to isolate minimum of 50-100 μg of material for ~ MW 500 compound to enable full suite of (2D) NMR data to be acquired (in a reasonable time scale)

8
Data Analysis – Resources
Legacy knowledge and user expertise– May be user specific, vulnerable if unavailable
Previously analysed data– Spectral databases
• Allows easy search for related compounds• Rapidly compare data of unknown with that of known
structures to establish likely chemical shifts and correlations
– Assignment databases• 1H and 13C NMR predictions for proposed structures to help
assigning unknown data• Enables CASE to generate fragment libraries which can be
used to build “known” portions of the molecule

9
Data Analysis – Options
In-vivo– Brain power – existing knowledge of parent molecule and
related compounds, intermediates and other impurities• Enables expert to focus on the 5-10% of data that is crucial to
solving the problem
In-silico– Computer Assisted Structure Elucidation (CASE) – utilise
the known information and data for unbiased structure generation
10
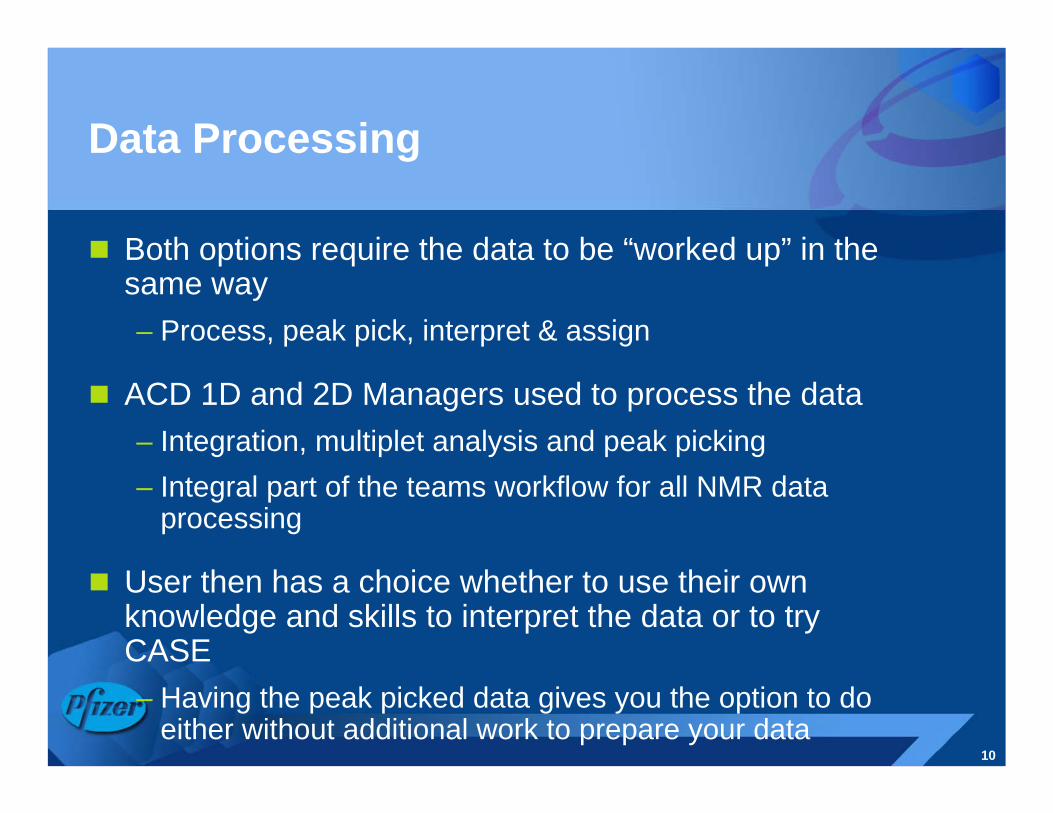
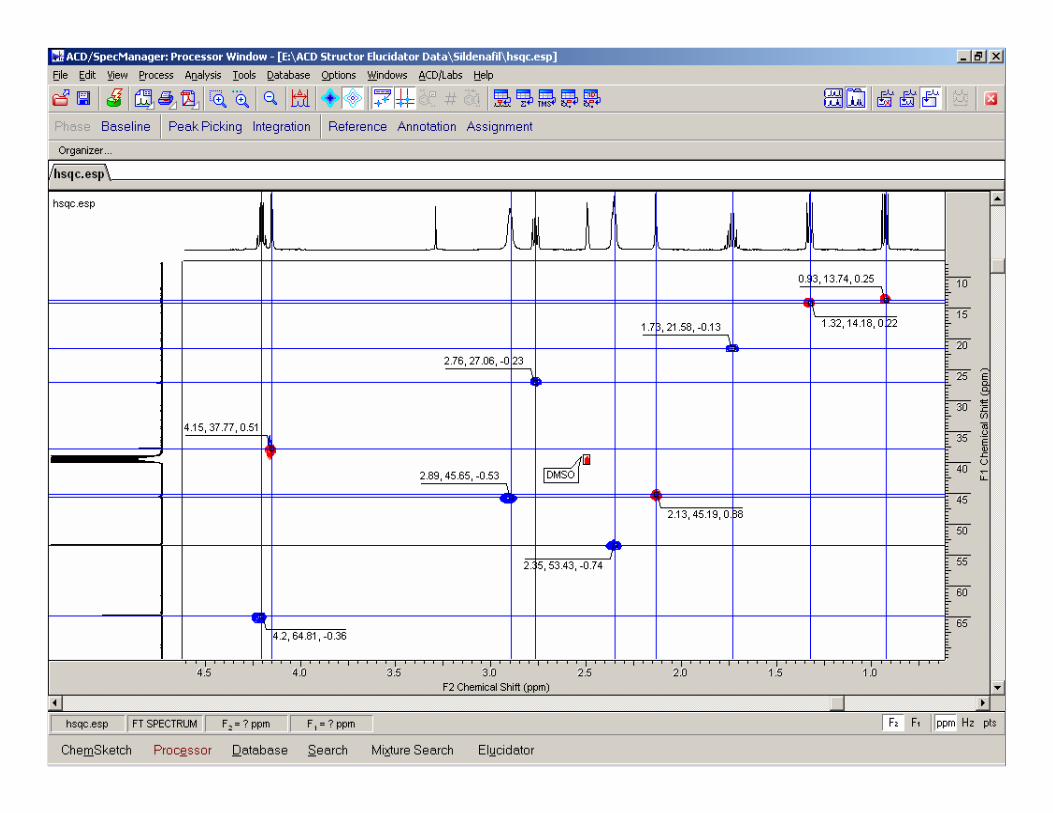
Data Processing
Both options require the data to be “worked up” in the same way– Process, peak pick, interpret & assign
ACD 1D and 2D Managers used to process the data– Integration, multiplet analysis and peak picking– Integral part of the teams workflow for all NMR data
processing
User then has a choice whether to use their own knowledge and skills to interpret the data or to try CASE– Having the peak picked data gives you the option to do
either without additional work to prepare your data
11

12
Manual Data Interpretation
Compare data of unknown with that of known structures to establish key correlations– What’s the same and what’s changed?
From the chemical shifts and correlations observed, propose structures and determine whether consistent with spectroscopic data– Predict 1H and 13C spectra for proposed structures
Iterative process until correct structure can be established
13
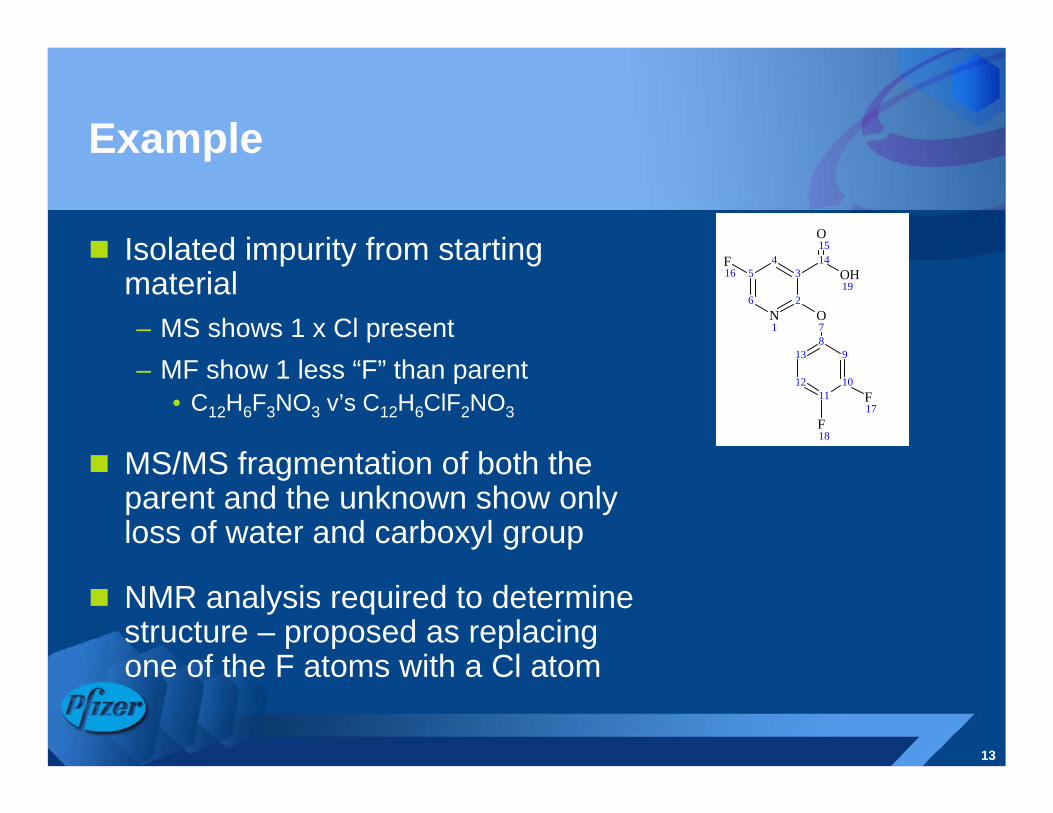
Example
Isolated impurity from starting material– MS shows 1 x Cl present– MF show 1 less “F” than parent
• C12H6F3NO3 v’s C12H6ClF2NO3
MS/MS fragmentation of both the parent and the unknown show only loss of water and carboxyl group
NMR analysis required to determine structure – proposed as replacing one of the F atoms with a Cl atom
9
10
8
11
13
12
3
2
4
N1
5
6O7
F18
F17
F16
14
O15
OH19

8.5 8.4 8.3 8.2 8.1 8.0 7.9 7.8 7.7 7.6 7.5 7.4 7.3 7.2 7.1 7.0 6.9 6.8F2 Chemical Shift (ppm)
110
115
120
125
130
135
140
145
150
155
160
165F1
Che
mic
al S
hift
(ppm
)
7.56, 129.07
7.56, 140.04
7.98, 135.13
8.13, 155.4
7.29, 129.03
7.29, 140.04
7.56, 154.06
7.56, 124.85
7.29, 154.06
8.13, 127.36
8.6 8.5 8.4 8.3 8.2 8.1 8.0 7.9 7.8 7.7 7.6 7.5 7.4 7.3 7.2 7.1 7.0 6.9 6.8F2 Chemical Shift (ppm)
105
110
115
120
125
130
135
140
145
150
155
160
165
170F1
Che
mic
al S
hift
(ppm
)
(10, 12)
(10, 8)
(4, 6)
(6, 2)
(13, 12)(11, 12)
(11, ?)(13, ?)(13, 8)
(10, 9)
(10, 11)
(13, 9)(11, 9)
(6, 4)
8.5 8.4 8.3 8.2 8.1 8.0 7.9 7.8 7.7 7.6 7.5 7.4 7.3 7.2 7.1 7.0 6.9 6.8F2 Chemical Shift (ppm)
110
115
120
125
130
135
140
145
150
155
160
165
F1 C
hem
ical
Shi
ft (p
pm)(4, 6)
(6, 4)
(10, 11)
(4, 5)(10, 8)
(9, 13)(13, 9)
(10, 12)(13, 11)
(6, 2)
(9, 11)
(4, 14)
3
2
4
N1
5
6O78
139
121011
14OH19
O15
F16
F18
F17
Chemical shifts and multiplicity changed
Similar correlation pattern observed suggesting Pyridine ring unchanged
Big differences in correlations observed in 2nd
ring suggesting not just a straight forward “trans-halogenation”
Chemical shifts and correlations consistent with 1,2,5 tri-subd ring
1H-13C HMBC
3
2
4
N1
5
6O7
14OH19
O15
F16
8139
121011
F17
Cl18
15
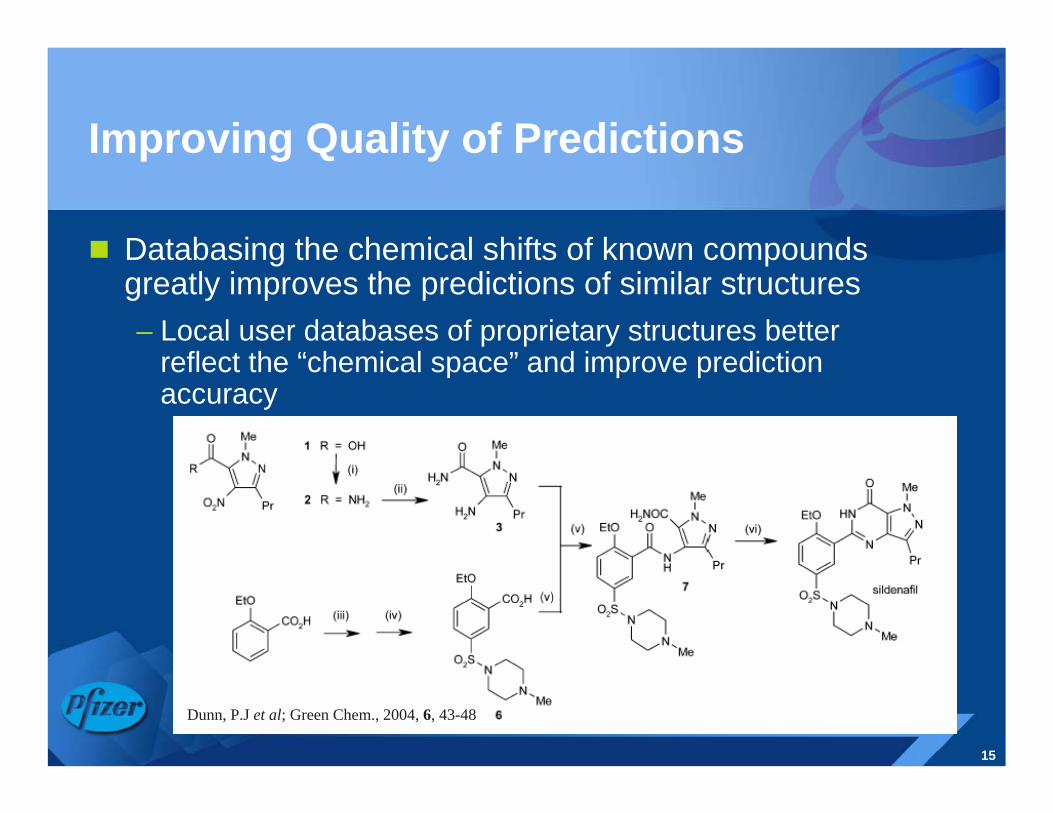
Improving Quality of Predictions
Databasing the chemical shifts of known compounds greatly improves the predictions of similar structures– Local user databases of proprietary structures better
reflect the “chemical space” and improve prediction accuracy
Dunn, P.J et al; Green Chem., 2004, 6, 43-48

8.5 8.0 7.5 7.0 6.5 6.0 5.5 5.0 4.5 4.0 3.5 3.0 2.5 2.0 1.5 1.0Chemical Shift (ppm)
8.093.002.031.010.981.981.000.981.00
DMSO-d6
water
19
62634
413 9
32 3110
36
23
2021, 25, 22, 24
2.23
6
34 319 20 23
36
4
6
34 1332
31
4
2320
21 22 24 25
21 22 24 25
8.5 8.0 7.5 7.0 6.5 6.0 5.5 5.0 4.5 4.0 3.5 3.0 2.5 2.0 1.5 1.0Chemical Shift (ppm)
8.093.002.031.010.981.981.000.981.00
DMSO-d6
water
19
62634
413 9
32 3110
36
23
2021, 25, 22, 24
2.23
6
34 319 20 23
36
4
6
34 1332
31
4
2320
21 22 24 25
21 22 24 25
Prediction without Pfizer training databaseDeviation of shifts from experimental: 0.44 ppm
Prediction with Pfizer training database(includes precursors)Deviation of shifts from experimental: 0.09 ppm
Experimental data
3
2
4
N1
5
6
O7
14
8139
121011
NH19
O15
20
21
25
22
24
23NH26 27
O28
29
34
30
33
31
32
CH336
OH35
F18
F17
F16
Prediction of Spectra With Training Databases

17
Computer Assisted Structure Elucidation
Recent advances have made CASE much more reliable and easier to use
Take your peak picked NMR data (1D, COSY, HSQC, HMBC) along with MF and import into ACD/Labs Structure Elucidator
Once data imported into Structure Elucidator, a degree of grooming is required to ensure data in correct format to enable software to work– Ensure all correlations are present and that all H’s and C’s have
correct label– Ensure all 1D data tables have correct number of atoms
assigned• 13C check multiplicity (C, CH, CH2 or CH3)

18
Convert spectral peaks into “co-ordinate map” to allow for generation of the Molecular Connectivity Diagram (MCD)

19
Molecular Connectivity Diagram (MCD)
Structures then generated based on observed correlations and chemical shifts

20
Molecular Fragments
1H-1H and 1H-13C long range couplings, integrals & chemical shifts establish the moieties present
MS fragmentation data
(loss of 164) shows that we have
CH3
CH2O
R1
CH3
CH2CH2
R2
CH
CH
CH
OR3
R4
R5
CH2
CH2
N
NH
+
CH2
CH2
CH3
R6
R
CH2
CH2
N
N
CH2
CH2
CH3
SO O

21
The Remnants
What’s left – C6H4N4O– Hardest piece of structure to establish due to limited
correlation information
Of which, part is CH3 and NH
Must have a heterocycle isomeric with:
N
NH
NN
O
CH3
propyl
aromatic
N
N
NH
N
O
propyl
CH3
aromatic
NHN
N
N
CH3
propyl
aromatic
O
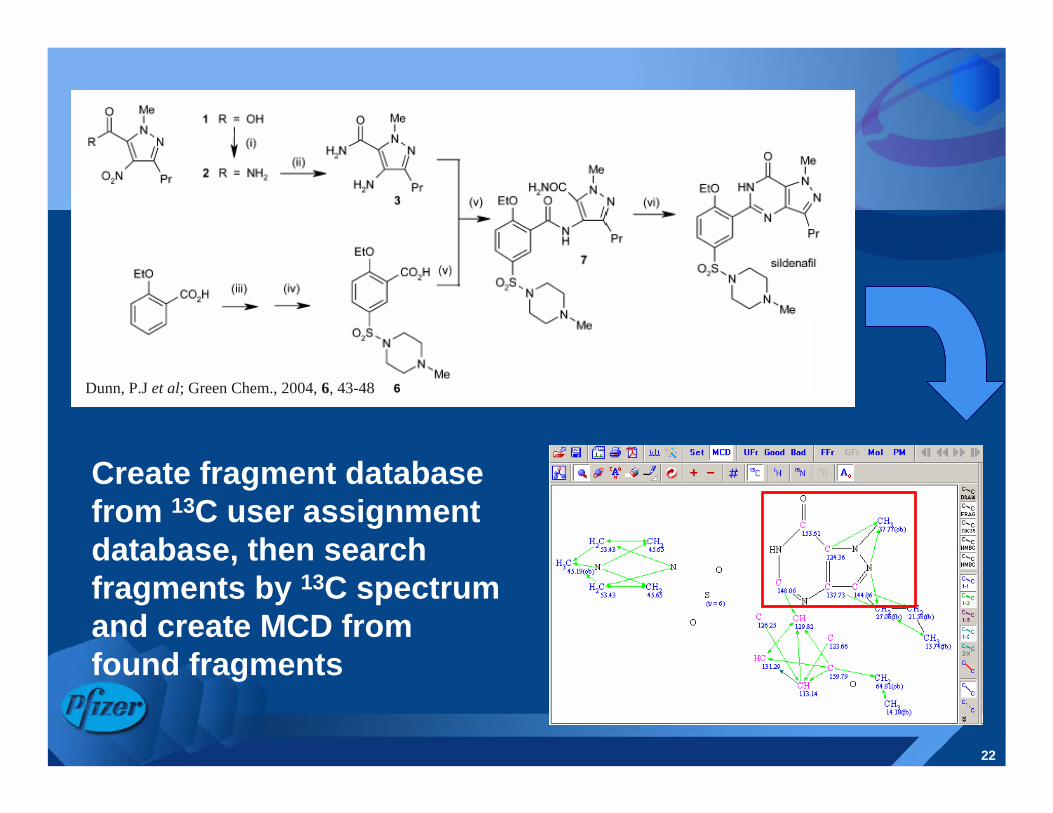
22
Create fragment database from 13C user assignment database, then search fragments by 13C spectrum and create MCD from found fragments
Dunn, P.J et al; Green Chem., 2004, 6, 43-48

23
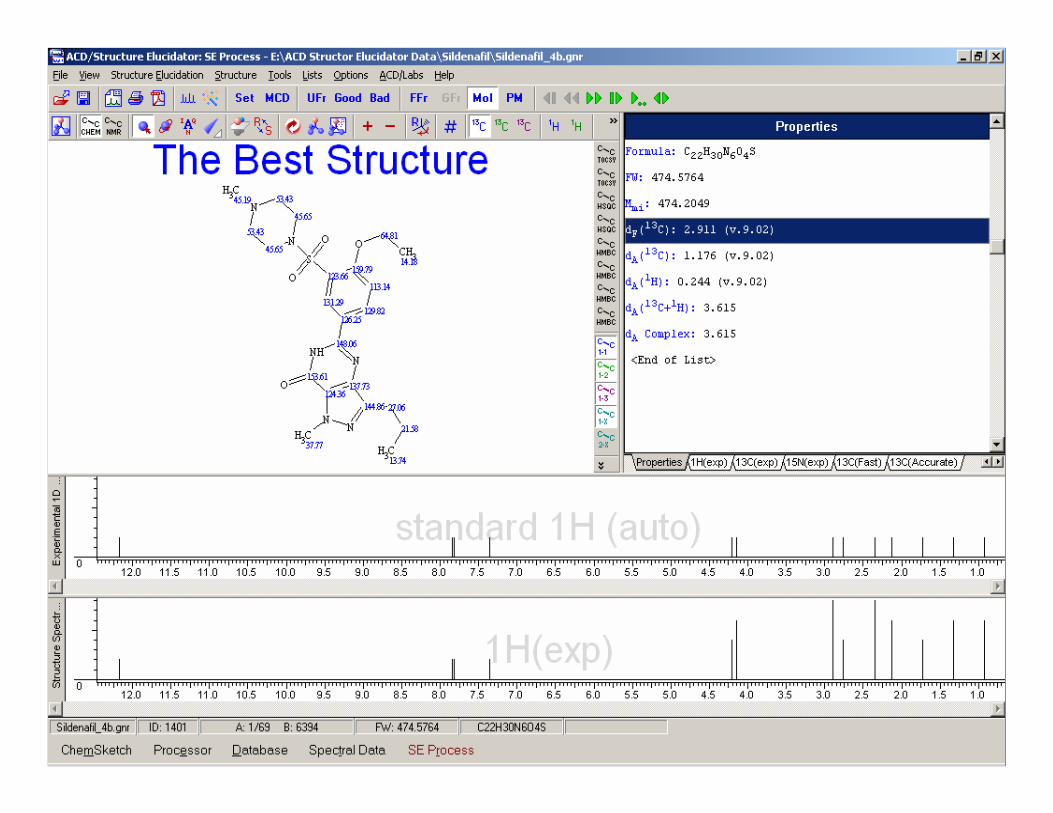
Example - Sildenafil
Search fragments by 13C spectrum resulted in 1721 found fragments
These then used to create 1 new MCD
Run CSB Generator…
24

25
Databasing of Assigned Data
Once the structure has been identified (manually or automatically) the 1D and 2D spectra can be assigned
The assigned spectra are only a button click away from saving the information into user assignment and spectral databases
“Instrument Vendor” software allows you to do all the processing of data but ACD tools enable you to extract the information and knowledge for further use– This is where the software is differentiated from that of
other purely “data processing” tools
26
Knowledge Management
The information in our proprietary databases are then used to further improve the accuracy of 1H and 13C spectral predictions– Pfizer NMRUDB contains > 2400 1H compound entries
and > 4000 13C compound entries
The NMRUDB also improves the quality and chemical space of “fragment libraries” to increase the efficiency of CASE
The use of ACD 2D Manager allows for straight forward processing, analysis, assignment and archiving of spectra as part of the workflow process and not “an additional job”

27
Conclusions
Knowledge management is a vital tool in the quest for increased productivity
Spectral databases allow easy access to related data sets that can be shared locally as well as globally
Assignment databases provide globally accessible resource for knowledge sharing– Can be used to improve accuracy of predictions– Enables rapid automated structure determination within
CASE
Use within a workflow process enables databasing of each and every data set worked on rapidly and easily

28
Acknowledgements
George Johnson
Adrian Davis
Anna Codina
Ros Richards