database report 2011 v26 - gov.pe.ca
TRANSCRIPT


Prince Edward Island Reproductive Care Program
Perinatal Database Report 2011

Acknowledgements The PEI Reproductive Care Program is a joint initiative that operates under the direction of a multidisciplinary planning committee representing the PEI Medical Society, Department of Health and Wellness and Health PEI, as well as lay members. As one component of its mandate, the Program has been responsible for the development of standardized assessment tools, and of a Provincial Perinatal Database. The PEI Perinatal Database is a product of the efforts of an early advocate of the Program, Dr. Douglas Cudmore and the diligent work and dedication of past Board members and coordinators as well as current Joint Planning Committee members. The PEI Reproductive Care Program is pleased to present the PEI Perinatal Database Report for 2011 and wishes to thank all previous and current board members for their dedication and support. The Laboratory Centre for Disease Control’s Bureau of Reproductive and Child Health, under the Action Plan for Health and the Environment, provided funding for the initial development of the database and this support is also greatly appreciated. Data for the Perinatal Database is collected from medical records in the Prince County Hospital and Queen Elizabeth Hospital. The PEI Reproductive Care Program gratefully acknowledges the assistance of these medical records departments. Physicians and nurses who collect the data and enter it on the records are key to the success of the database and are thanked for their assistance. PEI Reproductive Care Program July 2013

Background
This report contains an analysis of the data collected about pregnant women and their newborns during the period from January 1 to December 31, 2011. The PEI Reproductive Care Program recognizes that pregnancy outcomes are influenced by events that occur in the perinatal period, which includes the pre-conception, prenatal, intra-partum and postnatal periods. The perinatal periods lay the foundation for a child’s development and impacts on health and well-being throughout life. The PEI Perinatal Database is intended to be used by health care professionals, government, consumers and other organizations and individuals to help assess and improve the delivery of maternal & newborn care, education and support on PEI. To aid in this, the database holds information regarding a variety of variables including maternal demographics and lifestyle behaviors, prenatal status and interventions, intra-partum and postnatal status and interventions, births, and perinatal morbidity and mortality statistics. Analysis of the data from the Perinatal Database provides a basis to inform providers and decision makers about the outcomes of the care provided; promotes ongoing improvement in perinatal outcomes through enhanced knowledge; and has the potential to form the basis for initiating changes in maternal/newborn care throughout the Province of Prince Edward Island. The information collected is also used to complement other Provincial databases, including the Public Health Nursing and Nutrition databases. The level of inquiry in this report is primarily descriptive. The PEI Reproductive Care Program ensures the integrity, security and confidentiality of all data deposited in the database. Rigorous data quality checks are applied to the data to ensure a high level of data integrity and data consistency.


Perinatal Database Report 2011 i
Executive Summary
The 2011 Perinatal Database Report is a document that summarizes key maternal and infant health data which is collected exclusively from the Prince Edward Island Reproductive Care Program. The current report is presented in three sections: Maternal Demographics, Prenatal Risks and Prenatal Care, Labour & Delivery and Maternal Health Outcomes, and Newborn Health Outcomes. New in 2011 is the PEI Reproductive Care Program Perinatal Surveillance Report.
Key findings within the report:
In PEI, as in Canada and other developed countries, the average maternal age at time of delivery has been increasing over time. The average maternal age at delivery for all PEI mothers in 2011 was 29.2 years. While the overall trend shows increasing maternal age over time, this varies by region.
Advanced maternal age for nulliparous women continues to increase.
Teenage pregnancies account for 5.8% of all pregnancies on PEI, which is similar to 2008.
In 2011, 64% of mothers <25 years of age were single compared to 11% of mothers 25 years of age and older.
PEI mothers are more likely to be overweight or obese (47.2%) than Canadian mothers (33%) prior to pregnancy. Women with a higher body mass index (BMI) are more likely to have poor health and poor pregnancy outcomes. For instance, women with a high BMI are more likely to develop gestational diabetes mellitus and have a Caesarean birth.
In PEI in 2011, the incidence of gestational diabetes was 0.9% in normal weight women and
9.1% in women who were obese. The rates of gestational hypertension varied from 5.2% of women within the normal weight category to 15.3% in women who were obese.
Smoking during pregnancy and exposure to second hand smoke have declined over the past 10 years. However, cigarette smoking and exposure to second hand smoke continues to be a prenatal risk factor for women under 25 years of age in particular.
Self-reported alcohol use is decreased, however results of the PEI Meconium Study (2010-2011) demonstrated that at least 3.1% of babies were exposed to heavy or binge prenatal alcohol consumption while in utero. Self-reported alcohol use during pregnancy is a greater risk factor for mothers >40 years of age.
Self reported drug abuse has increased significantly in younger expecting mothers since 2008, and increased in all age groups.
In 2011, vaginal births were most common, followed by Caesarean births then assisted
vaginal births. The percentage of births by Caesarean has increased since 1998, though decreased slightly since 2008.
The rate of episiotomies has decreased significantly over time from 33.1% in 1998 to 7.5% in 2011. Despite decreases in the episiotomy rate there has not been any increase in the rates of third or fourth degree tears.

ii Perinatal Database Report 2011
The overall Caesarean birth rate has decreased since 2008 from 30.1% to 28.5%; this decrease is attributed to fewer nulliparous women who present in spontaneous labour with a normal presentation singleton at full term and deliver via Caesarean birth.
Maternal hospital length of stay is impacted by type of delivery and maternal conditions such as diabetes and hypertension and the incidence of severe maternal morbidity.
Babies born on PEI tend to weigh more than babies born in Canada. In term singleton
births, as the maternal pre-pregnancy BMI increased so did the likelihood the baby would be either high birth weight or macrosomic.
In PEI, in 2011, approximately 73% of all mothers were breastfeeding their newborns at discharge from hospital which has been steadily increasing over time. Unfortunately this rate is still lower than the national average. Age continues to have an impact on breastfeeding rates in PEI. Younger mothers in 2011 were less likely to choose to initiate breastfeeding than those in 2008.

Perinatal Database Report 2011 iii
PEI REPRODUCTIVE CARE PROGRAM PERINATAL SURVEILLANCE REPORT
1998 2003 2008 2011
Maternal Health Indicators
Deliveries (Mothers) 1493 1404 1434 1403
Average maternal age at delivery (in years)
28.0 28.1 28.9 29.2
Advanced maternal age at delivery (≥35 years) (per 100 deliveries)
12.6 13.0 16.4 14.5
Younger maternal age at delivery (<20 years) (per 100 deliveries)
9.8 6.7 5.6 5.8
Average maternal age at first delivery (nulliparous) (in years)
25.5 26.0 26.5 27.3
First time mothers (nulliparous) (per 100 deliveries)
41.6 43.7 44.1 41.8
First time mothers (nulliparous) ≥ 35 years (per 100 first time deliveries)
6.1 7.2 7.7 8.9
Pre-pregnancy BMI>25 Overweight/Obese (per 100 mothers)
41.6 48.2 45.2 47.2
Pre-pregnancy BMI<18 Underweight (per 100 mothers)
5.5 2.8 4.4 3.6
Mothers with <5 antenatal visits (per 100 deliveries)
- - - 4.4
Smoking during pregnancy (self-reported) (per 100 deliveries)
33.3 23.3 21.8 19.2
Alcohol Use during pregnancy (self-reported) (per 100 deliveries)
3.2 3.2 0.6 0.7
Drug Abuse during pregnancy (self-reported) (per 100 deliveries)
0.1 1.0 1.4 2.8
Labour/Postpartum Health Indicators Labour induction (per 100 deliveries ¥)
34.4 38.1 37.4 36.8
Epidural use in labour (per 100 deliveries with labour)
7.1 34.9 38.5 34.3
Episiotomy rate (per 100 deliveries)
33.1 10.3 10.2 7.5
Caesarean birth (per 100 deliveries)
22.1 29.7 30.1 28.5
Postpartum length of stay after vaginal birth (in hours)
- - 59.8 58.1
Postpartum length of stay after caesarean birth (in hours)
- - 100.1 89.8
Newborn Health Indicators Births (Babies born on PEI) 1509* 1426 1434 1405
Birth Weight (average in grams)
3475* 3492 3464 3482
Low Birth Weight ( > 500 g to 2500g) (per 100 live births) 4.6 *†
4.0 † 5.0
‡ 4.0
‡
High Birth Weight ( > 4500g) (per 100 live births)
3.7* 3.2 2.7 2.9
Breastfeeding Initiation (per 100 live births)
- 67.9 74.0 78.3
Breastfeeding at Discharge (per 100 live births)
59.3* 62.8 70.5 73.2
Multiple births (rate per 100 live births)
- 2.3 1.4 0.9
Preterm Birth rate (per 100 live births)
5.4* 5.7 6.4 5.6
Crude stillbirth rate (per 1000 total births)
2.0* 8.4 3.4 2.1
Congenital Anomaly (per 100 live births)
- 3.8 5.8 6.1
Newborn Average Length of Stay (in hours)
- - 87.5 86.8
Data Source: PEI Reproductive Care Program Perinatal Database. ¥ excludes planned Caesarean births *1998 includes data from out of province births (i.e.: IWK) † includes stillbirths ‡ excludes stillbirths

iv Perinatal Database Report 2011

Table of Contents
1 Maternal Demographics, Prenatal Risks, and Prenatal Care ................................................ 1
1.1 Number of Mothers .............................................................................................................. 3
1.2 Maternal Age at Delivery ..................................................................................................... 4
1.3 Maternal Weight .................................................................................................................. 7
1.4 Prenatal Care ...................................................................................................................... 9
1.5 Smoking, Exposure to Second Hand Smoke, Alcohol Use and Drug Abuse .................... 10
1.6 Diabetes and Hypertension ............................................................................................... 15
2 Labour and Delivery and Maternal Health Outcomes .......................................................... 17
2.1 Labour ............................................................................................................................... 19
2.2 Methods of Delivery ........................................................................................................... 20
2.3 Inductions and Epidurals ................................................................................................... 21
2.4 Perinatal Trauma ............................................................................................................... 23
2.5 Caesarean Births ............................................................................................................... 24
2.7 Maternal Length of Stay .................................................................................................... 29
2.8 Maternal Morbidity and Mortality ....................................................................................... 31
3 Newborn Health Outcomes .................................................................................................. 33
3.1 Newborns .......................................................................................................................... 35
3.2 Newborn Birth Weight ....................................................................................................... 36
3.3 Infant Feeding ................................................................................................................... 38
3.4 Multiple Births .................................................................................................................... 44
3.5 Preterm Births ................................................................................................................... 45
3.6 Fetal and Infant Mortality ................................................................................................... 46
3.7 Congenital Anomalies ....................................................................................................... 47
3.8 Length of Stay ................................................................................................................... 48
3.9 Newborn Readmissions .................................................................................................... 49
4 Appendices .......................................................................................................................... 51
4.1 Glossary of Terms ............................................................................................................. 53
4.2 Synopsis of PEI Department of Health and Wellness Breastfeeding Policy...................... 55
4.3 Breastfeeding Education ................................................................................................... 57
4.4 Variables Available in the PEI Reproductive Care Program Perinatal Database .............. 59
4.5 PEI Perinatal Database Data Request Form ..................................................................... 63
4.6 PEI Perinatal Database Data Analysis Request Form ...................................................... 65
5 References .......................................................................................................................... 67


Perinatal Database Report 2011 1
1 Maternal Demographics, Prenatal Risks, and Prenatal Care
Maternal Demographics, Prenatal Risks, and Prenatal Care
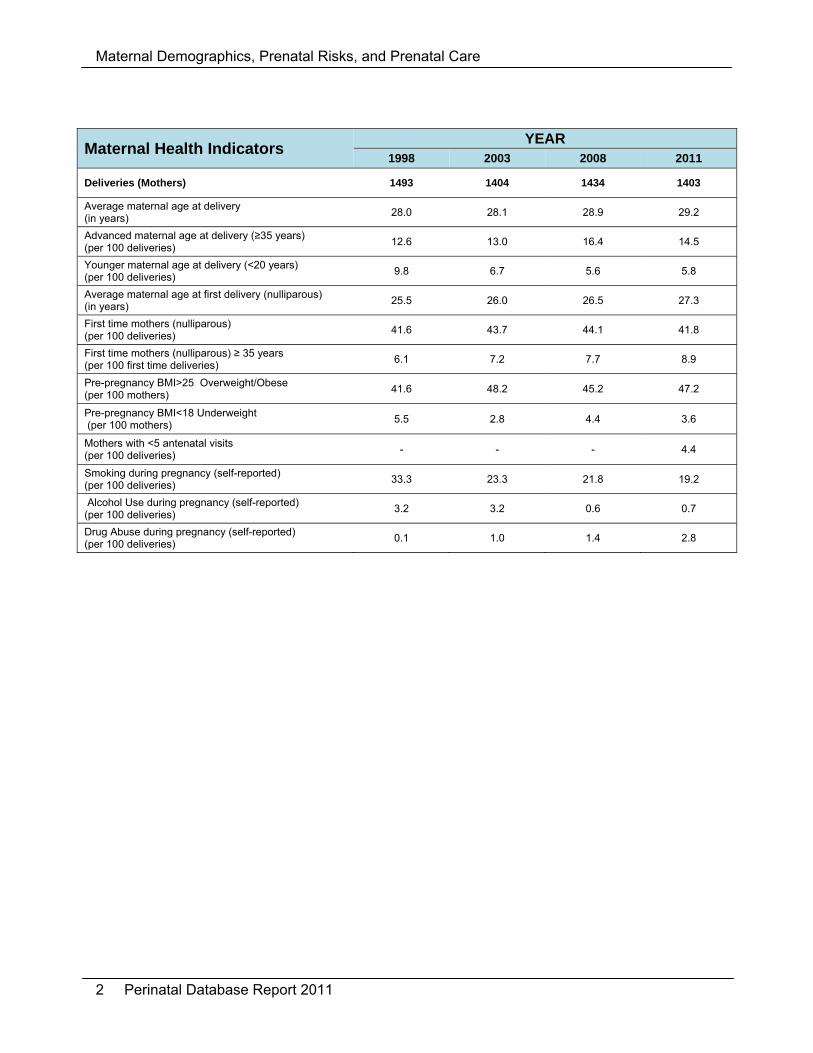
2 Perinatal Database Report 2011
Maternal Health Indicators YEAR
1998 2003 2008 2011
Deliveries (Mothers) 1493 1404 1434 1403
Average maternal age at delivery (in years)
28.0 28.1 28.9 29.2
Advanced maternal age at delivery (≥35 years) (per 100 deliveries)
12.6 13.0 16.4 14.5
Younger maternal age at delivery (<20 years) (per 100 deliveries)
9.8 6.7 5.6 5.8
Average maternal age at first delivery (nulliparous) (in years)
25.5 26.0 26.5 27.3
First time mothers (nulliparous) (per 100 deliveries)
41.6 43.7 44.1 41.8
First time mothers (nulliparous) ≥ 35 years (per 100 first time deliveries)
6.1 7.2 7.7 8.9
Pre-pregnancy BMI>25 Overweight/Obese (per 100 mothers)
41.6 48.2 45.2 47.2
Pre-pregnancy BMI<18 Underweight (per 100 mothers)
5.5 2.8 4.4 3.6
Mothers with <5 antenatal visits (per 100 deliveries)
- - - 4.4
Smoking during pregnancy (self-reported) (per 100 deliveries)
33.3 23.3 21.8 19.2
Alcohol Use during pregnancy (self-reported) (per 100 deliveries)
3.2 3.2 0.6 0.7
Drug Abuse during pregnancy (self-reported) (per 100 deliveries)
0.1 1.0 1.4 2.8

Maternal Demographics, Prenatal Risks, and Prenatal Care
Perinatal Database Report 2011 3
1.1 Number of Mothers
In 2011, data was captured for 1,403 PEI mothers. A number of mothers each year are transferred out of province for premature or high risk deliveries. At present we do not receive complete data on most mothers who deliver outside of PEI. The number of women giving birth decreased steadily over time from 1992 to an all time low in 2002. This number appears stable since 2003, 2008 and most currently in 2011, however due to data gaps the overall trend cannot be truly measured.
1851
17491710
1754
1683
1582
1493 1498
1428
13581308
14041434
1403
0
200
400
600
800
1000
1200
1400
1600
1800
2000
1992 1993 1994 1995 1996 1997 1998 1999 2000 2001 2002 2003 2004 2005 2006 2007 2008 2009 2010 2011
Count
Year
Number of Mothers, PEI, 1992‐2011
Note: Data are not available from 2004 to 2007 or 2009 to 2010

Maternal Demographics, Prenatal Risks, and Prenatal Care
4 Perinatal Database Report 2011
1.2 Maternal Age at Delivery
Maternal age is defined as the mother’s age in years at the time she delivers and is calculated using the mother’s date of birth and baby’s date of birth. Age is one factor to consider in relation to maternal health, perinatal outcomes and newborn health factors. In PEI, maternal age at delivery ranged from 15 to 45 years. The proportion of young mothers has decreased since 1998. The proportion of mothers ≥
35 years is 15% and appears to have decreased since 2008; however the proportion of first time deliveries in this age category has steadily been increasing.
Mothers in Kings were the youngest in PEI in 2011 with 28.5% under 25 years. Mothers aged 30-34 years showed the greatest increase in the percentage of the total births
in the province for 2011 with almost half (~47%) of the women in PEI who gave birth being 30 years of age or older.
Average Maternal Age In PEI, as in Canada and other developed countries, the average maternal age at time of birth has been increasing over time. Mothers in PEI are slightly younger than the national average of 29.7 years according to Statistics Canada.1, 2 Age of the mother at first birth is of interest to both researchers and the public as it influences the total number of births a woman might have in her life, which impacts the size, composition and future growth of the population.3, 4 The average maternal age among mothers on PEI who had at least one birth in the past (parity ≥1) was 30.6 years.
25
26
27
28
29
30
1991 1992 1993 1994 1995 1996 1997 1998 1999 2000 2001 2002 2003 2004 2005 2006 2007 2008 2009 2010 2011
Average Age at Delivery
Average Maternal Age at Delivery (Live Births), PEI and Canada, 1991‐2011
PEI
Canada

Maternal Demographics, Prenatal Risks, and Prenatal Care
Perinatal Database Report 2011 5
In 2011, 42% of all mothers were having their first baby. Of the women ≥35 years that gave birth 25% were having their first baby, this increased from 21% in 2008. Percent Composition of Maternal Age Groupings by Parity, PEI, 2011
Parity 0 (%) Parity 1 (%) Parity 2+ (%)
<20 years 84 14 1.2
20-24 years 57.7 32.6 9.6
25-29 years 44.5 37.5 17.9
30-34 years 30.4 42.2 27.3
35+ years 25.5 38.7 35.8
Overall 41.8 37.1 21.2
Both teen pregnancy (<20 years) and pregnancy with advanced maternal age (≥35 years) have been identified as being associated with potential risks to mother and baby.5, 6 Although 35 years of age is not an absolute number for when risks increase for women in pregnancy and childbirth, there are some prenatal complications for which there is increased risk after this age. Advanced maternal age alone is an important risk factor for chromosomal anomalies.7 Age can also have an impact on the rate of multiple births and stillbirths, though the use of reproductive technologies also has an impact. 4
1998 2003 2008 2011
Multiple Live Births 28.2 29.5 32 27.9
Singleton Live Births 28 28.1 28.9 29.2
Stillbirths 26.5 27.7 27.3 29.9
25
26
27
28
29
30
31
32
33
Average
Maternal Age
Average Maternal Age by Selected Birth Types, PEI, 1998/2003/2008/2011

Maternal Demographics, Prenatal Risks, and Prenatal Care
6 Perinatal Database Report 2011
Marital Status Pregnancy outcomes can be affected by marital status; this is often linked to socio-economic status and support systems.8
Most pregnant women in 2011 were involved in an on-going partnership, 60% being married and 16% in a common-law relationship. Approximately one quarter of pregnant women were not in a relationship (23% single and <1% divorced or separated).
64% of mothers less than 25 years of age were single (60% in 2008) compared to 11% of mothers 25 years of age and older being single (11% in 2008).

Maternal Demographics, Prenatal Risks, and Prenatal Care
Perinatal Database Report 2011 7
1.3 Maternal Weight
Women’s height and pre-pregnancy weight were used to calculate body mass index (BMI). BMI was calculated and grouped according to the classification guide below (for the purpose of this report all ≥30 were classed as obese):
Health Risk Classification According to Body Mass Index (BMI) 10
Classification BMI Category (kg/m2) Risk of developing health problems
Underweight <18.5 Increased
Normal Weight 18.5 - 24.9 Least
Overweight 25.0 - 29.9 Increased
Obese ≥30.0 High to Extremely high*
*Risk depends on classification of obesity (Class I, II, III)
In 2009, Canadian women who are of “child-bearing age” were significantly heavier than in the past.13 This correlates with population weight increases in Canada that show that ‘nearly half of adult Canadians are overweight or obese’9:
One third of Canadian women enter pregnancy with a BMI equal to or greater than 25. A woman’s high pre-pregnancy BMI can affect pregnancy and postpartum health outcomes, birth type, birth weights, prematurity risks, breastfeeding and childhood obesity outcomes.10, 11 ,12,13
6% of Canadian women entered pregnancy at a low BMI. Low pre-pregnancy BMI can also affect pregnancy and postpartum health outcomes, preterm birth risks and birth weights.12
In PEI in 2011: 47.2% were overweight/obese (BMI >25) prior to pregnancy, with over half of these
being obese (BMI >30), this has increased since 2008. 3.6% of PEI women were underweight, this has decreased since 2008.
The proportion of women who had a vaginal delivery decreases as pre-pregnancy BMI increases. For both overweight and obese mothers there is an increased likelihood of a Caesarean birth compared to normal weight mothers. Type of Delivery by Maternal Pre-pregnancy BMI, PEI, 2011
Vaginal Assisted Vaginal C-Birth
Underweight (%) 74.5 0.0 25.5
Normal Weight (%) 71.8 5.1 23.1
Overweight (%) 62.1 4.0 34.0
Obese (%) 58.9 2.5 38.6

Maternal Demographics, Prenatal Risks, and Prenatal Care
8 Perinatal Database Report 2011
0% 20% 40% 60% 80% 100%
All
West Prince
East Prince
Queens
Kings
Pre‐pregnancy Body Mass Index (BMI) by Region, PEI, 2011
Normal Weight Overweight Obese Underweight
Note: Pre-pregnancy weight was missing in the prenatal records of 83 mothers (6%) of total mothers.
Queens Region had the highest proportion of mothers considered to be underweight. West Prince had the highest proportion of mothers in the overweight/obese categories.

Maternal Demographics, Prenatal Risks, and Prenatal Care
Perinatal Database Report 2011 9
1.4 Prenatal Care
Prenatal care has important implications for maternal health and ongoing health care for women, infants and families. The Public Health Agency of Canada (PHAC) recommends women seek prenatal care early in pregnancy.14 Early prenatal care is more effective as it allows for early risk assessment, treatment of medical conditions or risk reduction and education.15,16 Less than 1% of PEI women who gave birth in PEI in 2011 did not receive prenatal care.
0
20
40
60
80
100
0‐4 5‐10 11‐15
Percent of M
others
Number of visits
Antenatal Physician Visits for Nulliparous and Multiparous,PEI, 2011
Nulliparous Multiparous
Note: Both Obstetrician and family practitioner visits are included in number of visits. Emergency room and walk-in visits are excluded. Prenatal education is offered on PEI by Public Health Nursing, Community Dietitians, and Family Resource Centers as well as physicians, obstetricians, obstetrical nurses and nurse practitioners. It is important for preparing mothers and fathers for pregnancy, birth and parenthood. Prenatal education, particularly through prenatal classes, is valued as a way to prepare expecting parents for the physical and life changes of pregnancy, childbirth and parenting. It was not possible to analyze attendance at prenatal classes due to missing data. Meeting an expecting woman’s information needs has been seen to be important to:
Improve her overall health Adopt healthy behaviour changes (i.e.: nutrition, exercise and smoking cessation) Increase self-care and infant care knowledge Increase her ability to make informed choices.14

Maternal Demographics, Prenatal Risks, and Prenatal Care
10 Perinatal Database Report 2011
1.5 Smoking, Exposure to Second Hand Smoke, Alcohol Use and Drug Abuse
Smoking Cigarette smoking is an important modifiable cause of adverse pregnancy outcomes. 17 Maternal cigarette smoking has been associated with intrauterine growth restriction (IUGR), increased risk of preterm birth, spontaneous abortion, placental complications, stillbirth and sudden infant death syndrome (SIDS) as well as childhood respiratory illness, asthma, and neurodevelopmental and behavioural problems. Some research has shown that “in population studies and nationwide surveys, pregnant smokers report more illicit drug use than pregnant nonsmokers”. 18 Mothers who smoke are also more likely to stop exclusively breastfeeding earlier in their newborn’s life. 19, 20 Pregnant mothers exposure to second hand smoke has decreased substantially over time from 45.5% of pregnant mothers in 1998 to 21.2% in 2011. There is variation in rates of cigarette smoking in PEI based on place of residence:
Mothers in Kings had the highest rates of smoking during pregnancy at 25.1%, which has increased slightly since 2008.
Mothers in West Prince have the highest rates (32%) of exposure to second hand smoke during pregnancy, but have reduced their rates of smoking during pregnancy (>35 % in 2008 to 20.3% in 2011).
Alcohol Alcohol is a teratogen. Prenatal exposure can lead to a range of conditions known as Fetal Alcohol Spectrum Disorder (FASD) which can result in cognitive, behavioural, neurodevelopmental, physiological and physical impairments. Clinical guidelines have recommended that when planning a pregnancy and during pregnancy no alcohol is the best choice as even a small amount of alcohol during pregnancy can have a negative and permanent impact on the developing fetal brain. In August 2010 the Society of Obstetricians and Gynaecologists of Canada (SOGC) released the comprehensive Alcohol Use and Pregnancy Consensus Clinical Guideline reinforcing that ‘abstinence is the prudent choice for a woman who is or might become pregnant’.21 The effects of prenatal exposure to alcohol vary widely and can differ depending on amount of alcohol consumed, developmental stage of fetus and individual factors such as a mother’s own health status.22 Alcohol use during pregnancy was self-reported by less than 1% of all women in PEI. There is concern that self-reports of alcohol consumption may be underestimates due to the potential under-reporting by women.23 The PEI Meconium Study tested a meconium sample from all live newborns born to PEI mothers from November 2010 to November 2011. This province-wide study showed that at least 3.1% of PEI babies during this time period were exposed to heavy, or binge, prenatal alcohol consumption while in utero. Since approximately 40% of prenatally alcohol exposed babies will have FASD this means that “… at least 16 babies born during the one year study period will likely have FASD.” 24 Research into the correlation between alcohol use and illicit drug use during pregnancy has shown an increased risk of alcohol consumption with illicit drug use, increasing the risk of FASD in newborns. 25

Maternal Demographics, Prenatal Risks, and Prenatal Care
Perinatal Database Report 2011 11
Drug Abuse Abuse of drugs around the time of pregnancy is a concern, but obtaining accurate data can be difficult because of the reliability of self-reports. The negative effects on the fetus are potentially compounded by exposure to a combination of street drugs, smoking, alcohol use, high-risk behaviours, or lack of prenatal care which tend to be correlated with drug abuse. 26 Drug abuse during pregnancy has increased significantly across PEI:
0.7% of expecting mothers self-reporting drug abuse in 1998 2.8% of expecting mothers self-reporting drug abuse in 2011 When analyzed by regions East Prince and Queens had the highest increases drug
abuse. In 2011 drug abuse during pregnancy was associated with:
Low birth weight (10.5 % of singleton, liveborn deliveries) Preterm birth
0
2
4
6
2003 2008 2011
Percent of D
eliveries
Drug Abuse during Pregnancy, PEI, 2003/2008/2011

Maternal Demographics, Prenatal Risks, and Prenatal Care
12 Perinatal Database Report 2011
There was a concerning and significant increase in the drug use risk factors for younger expectant mothers from 3.1% in 2003 to 11.1% in 2011.
<20 20‐24 25‐29 30‐34 35‐39 40+
2003 3.1 1.8 0.9 0.3 0.6 0
2008 3.8 4.1 1.1 0 0 0
2011 11.1 6.7 2.1 1.1 0 0
0
3
6
9
12
15
Percent of D
eliveries
Drug Use during Pregnancy by Maternal Age Group, PEI, 2003/2008/2011
On PEI, data shows that there is also a trending increase in the proportion of females aged 12-19 being hospitalized or visiting a medical professional for drug use or misuse (e.g.: acute toxicity, treatment for addiction or injury related to drug use). Drug abuse data in the PEI Reproductive Care Perinatal Database are based on self-reports. Drug abuse is often under-reported. 27 Marijuana use is included in the category of drug abuse in the Perinatal Database. Though often not considered a ‘hard drug’ marijuana is considered to be harmful to use during pregnancy and breastfeeding. It recommended not to be used by nursing mothers; some studies have correlated marijuana use by mothers to severe neurobehavioural effects infants due to “significant absorption in infants following exposure via breast milk”. 28 There is some concern that fathers smoking marijuana actually increase the risk of SIDS in breastfed infants.29

Maternal Demographics, Prenatal Risks, and Prenatal Care
Perinatal Database Report 2011 13
Teratogens such as smoking, exposure to second hand smoke, alcohol and drug use can affect pregnancy, birth and can have long term permanent effects on children over their lifetimes. These effects can include preterm birth rates, congenital anomalies and birthweight.
Preterm Birth Rate, Congenital Anomalies and Average Birthweight by Substance Use Category, PEI, 2011
Smoking Second Hand
Smoke Exposure Alcohol
Use Drug
Abuse No Risk Factor
Preterm Births (%) 6.7 7.6 10.0 18.0 1.8
Congenital Anomalies* (%) 4.8 8.6 0.0 5.1 5.5
Average Birthweight for Term Singletons (grams)
3365 3378 3314 3365 3570
*It is important to note that congenital anomalies recorded by the PEI Reproductive Care Program Database are only those diagnosed after birth but before the newborn discharge. This does not take into account those congenital anomalies diagnosed over the child’s lifetime.
<20 20‐24 25‐29 30‐34 35‐39 40+
Smoking During Pregnancy 44.4 37.7 17.5 11.3 7.5 13.3
Exposure to Second Hand Smoke 43.7 41.1 20.6 12.7 10.8 10.3
Alcohol Risk Factors 1.2 0.8 1.2 0.2 0 3.3
Drug Risk Factors 11.1 6.7 2.1 1.1 0 0
0
5
10
15
20
25
30
35
40
45
50
Percent of D
eliveries
Smoking, Exposure to Second Hand Smoke, Alcohol and Drug Abuse during Pregnancy by Maternal Age Group, PEI, 2011
Since 2008 smoking has decreased in all age categories except in 20-24 years olds where the rate increased from 35.8% to 37.7%. Exposure to second-hand smoke has decreased in all age categories. While self-reported alcohol use has decreased in the <20 years olds (3.8% in 2008) it has increased in the 40+ year old mothers (0% in 2008).

Maternal Demographics, Prenatal Risks, and Prenatal Care
14 Perinatal Database Report 2011
0
5
10
15
20
25
30
35
All West Prince East Prince Queens Kings
Percent of D
eliveries
Smoking, Second Hand Smoke and Substance Use by Region, PEI, 2011
Smoking During Pregnancy Exposure to Second Hand Smoke Alcohol Risk Factors Drug Risk Factors
Cigarette smoke remains the most frequent teratogen exposure across all regions on PEI. In 2011, 23.3% of mothers report pre-pregnancy smoking while 21.2% of all mothers report smoking during pregnancy.

Maternal Demographics, Prenatal Risks, and Prenatal Care
Perinatal Database Report 2011 15
1.6 Diabetes and Hypertension
Diabetes and hypertension are two conditions that may be present prior to, or be exacerbated during pregnancy. Diabetes in pregnancy (both pre-existing and gestational) has been linked to changes in maternal and infant health outcomes. There has been a Canadian trend toward improvements in fetal survival in women with pre-eclampsia; however this has led to an increase in preterm births.30 In 2011 9.6% of women were noted to have a hypertensive disorder in pregnancy and 4.0% were noted to have diabetes (pre-existing or gestational). Pre-pregnancy BMI is associated with the incidence of gestational diabetes and hypertension. Mothers with Diabetes or Hypertension, PEI, 1998/2003/2008/2011
Pre-existing
Hypertension Gestational
Hypertension Pre-existing
Diabetes Gestational
Diabetes
1998 (%) 1.5 9.7 0.1 4.2
2003 (%) 1.0 11.1 0.7 1.6
2008 (%) 0.8 7.9 0.4 3.0
2011 (%) 1.2 8.5 0.5 3.5
There was no difference in preterm (<37 weeks) birth rates for mothers with pre-existing hypertension, pre-existing diabetes, gestational diabetes, and gestational hypertension as compared to mothers who did not have these conditions. Severe complications which required transfer to a tertiary care centre outside of PEI would not be included in these numbers.
Underweight Normal Weight Overweight Obese
Gestational Diabetes 2.1 0.9 3.3 9.1
Gestational Hypertension 0 5.2 10.6 15.3
0
2
4
6
8
10
12
14
16
18
Percent of deliveries
Incidence of Gestational Diabetes and Gestational Hypertension by Pre‐pregnancy BMI, PEI, 2011

Maternal Demographics, Prenatal Risks, and Prenatal Care
16 Perinatal Database Report 2011

Perinatal Database Report 2011 17
2 Labour and Delivery and Maternal Health Outcomes

Labour and Delivery and Maternal Health Outcomes
18 Perinatal Database Report 2011
¥ excludes planned Caesarean births
Labour/Postpartum Health Indicators
YEAR 1998 2003 2008 2011
Labour induction (per 100 deliveries ¥)
34.4 38.1 37.4 36.8
Epidural use in labour (per 100 deliveries with labour)
7.1 34.9 38.5 34.3
Episiotomy rate (per 100 deliveries)
33.1 10.3 10.2 7.5
Caesarean birth (per 100 deliveries)
22.1 29.7 30.1 28.5
Postpartum length of stay after vaginal birth (in hours)
- - 59.8 58.1
Postpartum length of stay after caesarean birth (in hours)
- - 100.1 89.8
Labour and Delivery and Maternal Health Outcomes
Perinatal Database Report 2011 19
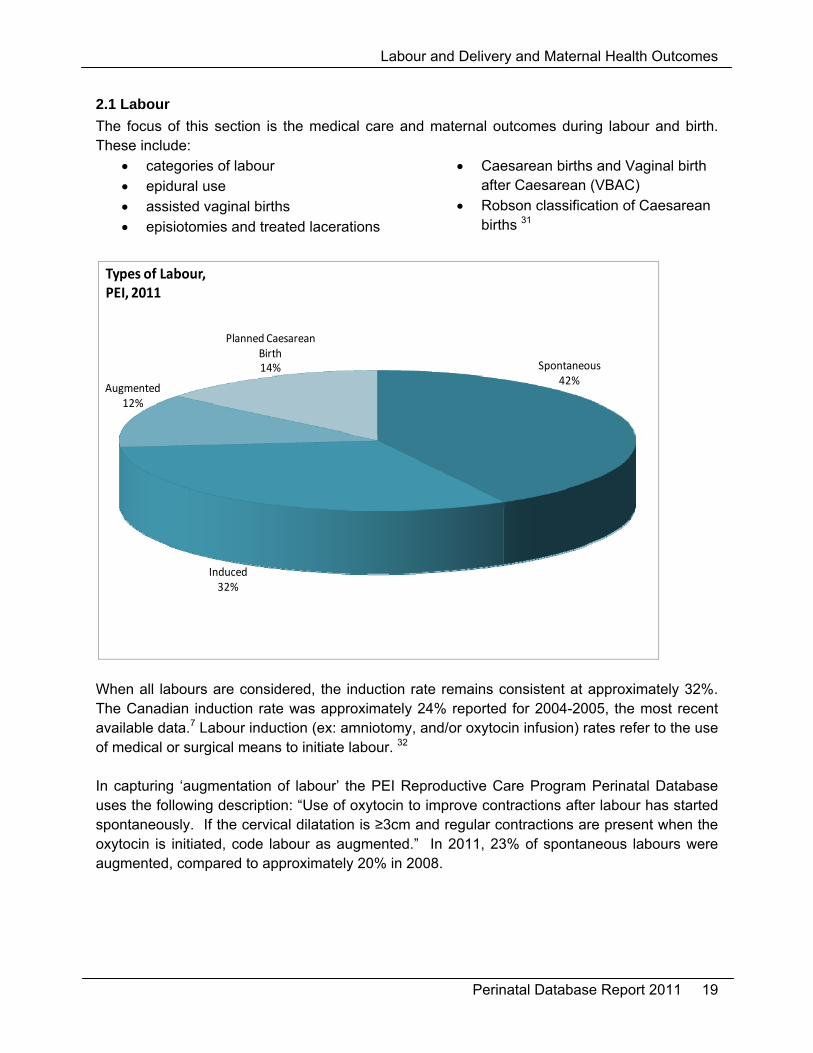
Spontaneous42%
Induced32%
Augmented12%
Planned Caesarean Birth14%
Types of Labour, PEI, 2011
2.1 Labour
The focus of this section is the medical care and maternal outcomes during labour and birth. These include:
categories of labour epidural use assisted vaginal births episiotomies and treated lacerations
Caesarean births and Vaginal birth after Caesarean (VBAC)
Robson classification of Caesarean births 31
When all labours are considered, the induction rate remains consistent at approximately 32%. The Canadian induction rate was approximately 24% reported for 2004-2005, the most recent available data.7 Labour induction (ex: amniotomy, and/or oxytocin infusion) rates refer to the use of medical or surgical means to initiate labour. 32 In capturing ‘augmentation of labour’ the PEI Reproductive Care Program Perinatal Database uses the following description: “Use of oxytocin to improve contractions after labour has started spontaneously. If the cervical dilatation is ≥3cm and regular contractions are present when the oxytocin is initiated, code labour as augmented.” In 2011, 23% of spontaneous labours were augmented, compared to approximately 20% in 2008.

Labour and Delivery and Maternal Health Outcomes
20 Perinatal Database Report 2011
2.2 Methods of Delivery
In 2011, the majority of births on PEI were vaginal births. The percentage of births by Caesarean and of assisted vaginal births has decreased since 2003. The Canadian Institute for Health Information (CIHI) “Health Indicators 2013” report noted a Caesarean birth rate of 28.9% for PEI compared with 27.1% in Canada for 2011-2012.33 Method of Delivery, PEI, 2011 1998 2003 2008 2011
Vaginal (%) 69.7 64.5 65.5 67.0
Assisted Vaginal (%) 8.2 5.8 4.5 4.4
C-Birth (%) 22.1 29.7 30.1 28.5
Note: Assisted vaginal deliveries include vacuum (66.1%) forceps (24.2%) vacuum & forceps (9.7%)
In 2011, nulliparous women were less likely to undergo a Caesarean birth which is the reverse from 2008. Nulliparous women were more likely to have an assisted vaginal birth than multiparous women in 2011.
Vaginal Assisted Vaginal C‐Birth
Overall 67 4.4 28.5
Nulliparous 63.5 9.3 27.2
Multiparous 69.5 1.0 29.5
0
10
20
30
40
50
60
70
80
90
100
Percent of D
eliveries
Method of Delivery by Parity, PEI, 2011

Labour and Delivery and Maternal Health Outcomes
Perinatal Database Report 2011 21
2.3 Inductions and Epidurals
The rate of induction in these figures has been calculated excluding women where it was noted that a Caesarean birth was planned prior to labour initiation. In 2008 the rate of induction was similar regardless of parity, while in 2011 nulliparous women were receiving significantly more inductions than multiparous women. This was similar to years previous to 2008. Rate of Labour induction by Parity, PEI, 2011 1998 2003 2008 2011
Overall 34.4 38.1 37.4 36.8
Nulliparous (%) 38.0 41.0 38.2 41.3
Multiparous (%) 31.8 34 36.6 32.9
For nulliparous women, every year increase in age makes her 8% more likely to be induced. Older nulliparous women are most often induced and this trend has remained consistent over time. Similarly, teenage nulliparous women are least likely to be induced.
<20 20‐24 25‐29 30‐34 35+
1998 26.1 33.7 42.9 37.1 44.7
2003 32.9 39.6 38.1 40.2 45.5
2008 26.7 41.1 33.8 35.3 44.9
2011 28.6 32.4 38.7 54.3 59.6
0
10
20
30
40
50
60
70
80
90
100
Percent of Induced Nulliparous Mothers
Labour Induction by Maternal Age for Nulliparous Women,PEI, 1998/2003/2008/2011

Labour and Delivery and Maternal Health Outcomes
22 Perinatal Database Report 2011
For women whose labour was induced the majority had a combined method of induction, most often oxytocin and artificial rupture of membranes. Method of Labour Induction by Parity, PEI, 2011
ARM
Combined Method
Oxytocin Prostaglandin Other
Overall 9.3 36.1 26.1 26.1 2.3
Nulliparous (%) 5.2 35.4 29.3 28.8 1.3
Multiparous (%) 13.7 37.0 22.7 23.2 3.3
Overall, post dates (≥41 weeks gestation) were the most frequently noted primary indication for induction. 34, 35 When reviewing instances where post dates was noted as the indication for induction, 83% of the women were ≥41 weeks gestation. There are significantly more nulliparous women (90%) induced for post dates than multiparous (75.3%). Primary Reason for Induction by Parity, PEI, 2011
Overall Nulliparous Multiparous
Fetal Compromise* 4.5 5.4 3.4
Maternal Condition** 13.6 16.6 10.3
Other*** 18.0 5.4 31.9
Post Dates 37.5 39.0 35.8
Premature Rupture of Membranes 26.5 33.6 18.6
* Fetal compromise: isoimmunization, suspected fetal distress, oligohydramnious, polyhydramnios, fetal anomaly, suspect intrauterine growth restriction (IUGR) **Maternal condition: gestational Diabetes mellitus, Diabetes mellitus, significant Antepartum hemorrhage, hypertension, Pruritic Urticarial Papules and Plaques, cholestatic jaundice, thrombocytopenia, seizures ***Other: social/elective, history of precipitate labour, current intrauterine death, previous fetal death, poor obstetrical history, geographic, maternal age, multiple pregnancy, unstable lie, macrosomia, other
The rate of epidural administration for labour has increased significantly since 1998: 7.1% in 1998 38.5% in 2008 34.3% in 2011
According to the CIHI report “Highlights of 2010–2011: Selected Indicators Describing the Birthing Process in Canada” ‘In Canada, epidurals were used in 56.7% of all vaginal deliveries in 2010-11’. 36 This is a significant increase from 45.7% in 2001-2002. Epidural for labour is not available at all times in the two maternity hospitals on PEI.

Labour and Delivery and Maternal Health Outcomes
Perinatal Database Report 2011 23
2.4 Perinatal Trauma
Episiotomies and third and fourth degree lacerations are types of perinatal trauma. The rate of episiotomies has decreased significantly over time:
33.1% in 1998 10.2 % in 2008 7.5% in 2011
Of all episiotomies performed in 2011, over 77% were for nulliparous women (compared to 60% in 2008). Based on the 2008 Canadian Perinatal Health Report, 20.4% of women in Canada received an episiotomy (2004/05), compared to 14.6% of women in PEI.7 Despite overall decreases in the episiotomy rate there has not been any increase in the rates of third or fourth degree lacerations. Third and fourth degree lacerations can impact length of stay for mothers as well as recovery time. Rate of Third and Fourth Degree Lacerations, PEI, 1998/2003/2008/2011
Third Degree Fourth Degree
1998 3.1 0.8
2003 2.4 0.3
2008 2.4 0.6
2011 2.1 0.0
Third and fourth degree lacerations for 2004/05 were similar, 3.2% in PEI (2.1% in 2011) and 3.8% nationally (newer nationally published data unavailable).7

Labour and Delivery and Maternal Health Outcomes
24 Perinatal Database Report 2011
2.5 Caesarean Births
Robson Classification Caesarean birth (C-birth) rates have risen around the world, particularly in developed countries.31, 37, 38, 39 This rise is of debate and public health concern due to potential maternal and newborn health risks and health system cost issues.31, 37, 38, 39, 40 The Robson Classification system was developed to define comparable, mutually exclusive groups of mothers using clinical factors such as parity, obstetrical history, course of labour and delivery, and gestation.31 The ten groups are analyzed in relation to the size of the group, C-birth rate within the group, and the contribution of the groups to the overall C-birth rate. When data is analyzed using the Robson Classification System it follows a specific methodology designed to explore groups of mothers and their overall impact on C-births. One of the disadvantages of the classification is that it identifies who are having C-births, but does not explain why they are having them. 40, 41 This is particularly significant when looking at rates of C-birth that are occurring by mother’s request, or for specific high-risk medical conditions. Some jurisdictions such as British Columbia gather data regarding maternal requests, since maternal request is not taken into account in the Robson Classification system, but can explain some increase in C-birth rates.42 The Robson Classification has been recommended by the World Health Organization to standardize the comparison C-births both internationally and locally. Using a single system facilitates auditing, analyzing, and comparing rates across settings, regions and over time.31, 40 Recently in 2012, the SOGC recommended that a modified Robson Criteria be used to sub-classify women who had a C-birth to help further compare rates and indications. These recommended sub-groups show whether the C-birth occurred after an expecting women went into spontaneous labour, was induced or before labour (depending on the grouping). 41

Labour and Delivery and Maternal Health Outcomes
Perinatal Database Report 2011 25
Group Description Size of Group* C-Birth Rate**
Contribution of Each Group***
1998 2003 2008 2011 1998 2003 2008 2011 1998 2003 2008 2011
1 Nulliparous, singleton, cephalic , ≥37 weeks, spontaneous labour
22.3 22.2 23.3 21.6 12 21.8 24.9 11.9 2.7 4.8 5.8 2.6
2
Nulliparous, singleton, cephalic , ≥37 weeks
15.8 16.5 16.4 16.8 37.3 42.4 40 39.3 5.9 7.0 6.6 6.6
b) induced labour 15.8 35.8 5.7
c) C-birth before labour 0.9 100 0.9
3 Multiparous, without uterine scar, singleton, cephalic ≥37 weeks, spontaneous labour
26.7 24.9 23.3 25.3 2.5 2.6 2.1 1.4 0.7 0.6 0.5 0.4
4
Multiparous, without uterine scar, singleton, cephalic ≥37 weeks
15.1 14.7 14.3 14.8 9.3 8.2 8.3 15.0 1.4 1.2 1.2 2.2
b) induced labour 13.5 7.9 1.1
c) C-birth before labour 1.2 94.1 1.1
5
Multiparous, previous uterine scar, singleton, cephalic ≥37 weeks
11.3 12 13.7 14.5 60.7 77.5 79.7 83.7 6.8 9.3 10.9 12.1
a) spontaneous 3.4 57.5 1.9
b) induced labour 1.4 36.8 0.5
c) C-birth before labour 9.7 99.3 9.7
6 Nulliparous, singleton breech 1.4 1.9 1.9 1.9 90.5 100 100 92.3 1.3 1.9 1.9 1.7
7 Multiparous, singleton breech including previous uterine scar
1.9 1.9 1.1 1.8 82.1 100 93.8 92 1.5 1.9 1 1.6
8 Multiples including previous uterine scar
1.1 1.5 1.4 0.9 35.3 66.7 55 76.9 0.4 1 0.8 0.7
9 Singleton, transverse or oblique lie including previous uterine scar
0.3 0.6 0 0 100 100 0 0 0.3 0.6 0 0
10 Singleton, cephalic, ≤36 weeks including previous uterine scar
4.0 3.8 4.6 2.4 26.7 34 30.3 23.5 1.1 1.3 1.4 0.6
Overall Caesarean Rate 22.1 29.7 30.1 28.5
*Size of group = total number women in group/overall total number of women X 100% **C-birth rate = number C-birth total /number women in each group X 100% ***Contribution of each group = number C-birth in group/overall number women X 100%
Size of Groups The size of groups 1 and 2 continues to remain stable over time, however there is a lower proportion of nulliparous women in group 1 compared to 2 suggesting a high induction issue. The sizes of groups 3, 4, and 6 through 9 are also stable over time. The decrease in size of group 10 may be a reflection of premature labours being referred to IWK, our tertiary care center and therefore that data is not included in this report. The size of group 5, our previous C-birth mothers, continues to increase over time to a current size of 14.5%. The average or goal size of this group is 10% and higher sizes are reflective of high C-birth rates in the past, particularly in groups 1 and 2. C-Birth Rates The rate of C-birth in group 1 has decreased to 11.9% (2011) from 24.9% (2008). This change alone explains the overall decrease in 2011 C-births to 28.5% from 30.1% in 2008. The goal C-birth rate for group 1 mothers is <10% so PEI has seen much progress towards this.

Labour and Delivery and Maternal Health Outcomes
26 Perinatal Database Report 2011
The C-birth rate in group 3 was 1.4% which is ideal. The C-birth rate in group 4 has increased since 2008. This demonstrates that compared with 2008, multiparous women who are induced are more likely to end up with a C-birth than 3 years previously. This increase has impacted the overall C-birth rate. The C-birth rate in group 5 is high in 2011 at 83.7% and is a reflection of VBAC attempts and successes. Optimally group 5 should have a rate between 50-60%. Overall Contribution of Each Group Groups 1, 2, and 5 normally contribute approximately two thirds of the overall C-birth rate. In PEI in 2011 these groups account for 75% of the overall rate. The overall C-birth rate has decreased since 2008 and is lower than the rate in 2003. It appears that much progress has occurred in group 1 mothers which will over time help reduce the group 5 size in future which will in turn decrease C-birth rates further. It is important to remember that C-birth rates should not be considered as high or low, without taking the relevant epidemiological information into consideration.31
0
5
10
15
20
25
30
35
1998 2003 2008 2011
Percent of O
verall C‐birth Rate
Contribution of Each Group to the Caesarean Birth Rate, PEI, 1998/2003/2008/2011
1 2 3 4 5 6 7 8 9 10
Group 1
Group 2
Group 5
The contribution of Group 1 to the overall C-birth rate has decreased in 2011. This is the most important group in changing our future C-birth rates. This group contains nulliparous women, with a normal singleton presentation that have gone into spontaneous labour.

Labour and Delivery and Maternal Health Outcomes
Perinatal Database Report 2011 27
PEI rates of C-births had been increasing (similar to other Canadian provinces)37, 43, 45 but have decreased in 2011 compared with 2008. Nulliparous women are being induced in higher numbers than would be expected. A review of this practice will be important in our C-birth rates moving forward. If the size of group 2 relative to group 1 can be reduced then the overall C-birth rate will continue to decline because it will decrease the future size of group 5 and hopefully increase the size of groups 3 and 4. Reviewing C-births using the Robson (or Modified) Classification is helpful in reporting C-births rates over time but more study is needed to truly determine the factors contributing to C-births (i.e. age, weight, maternal choice, health policy). Once these factors are understood, effecting C-birth appropriateness will be more achievable.
Labour and Delivery and Maternal Health Outcomes
28 Perinatal Database Report 2011
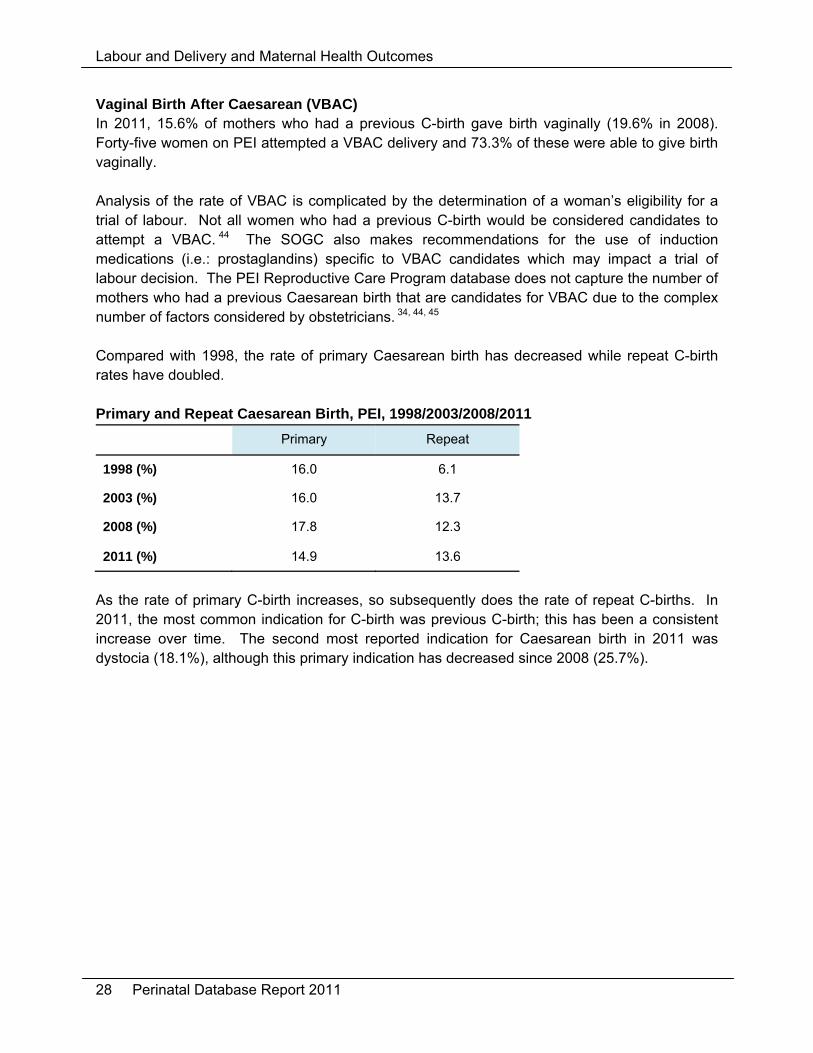
Vaginal Birth After Caesarean (VBAC) In 2011, 15.6% of mothers who had a previous C-birth gave birth vaginally (19.6% in 2008). Forty-five women on PEI attempted a VBAC delivery and 73.3% of these were able to give birth vaginally. Analysis of the rate of VBAC is complicated by the determination of a woman’s eligibility for a trial of labour. Not all women who had a previous C-birth would be considered candidates to attempt a VBAC. 44 The SOGC also makes recommendations for the use of induction medications (i.e.: prostaglandins) specific to VBAC candidates which may impact a trial of labour decision. The PEI Reproductive Care Program database does not capture the number of mothers who had a previous Caesarean birth that are candidates for VBAC due to the complex number of factors considered by obstetricians. 34, 44, 45 Compared with 1998, the rate of primary Caesarean birth has decreased while repeat C-birth rates have doubled. Primary and Repeat Caesarean Birth, PEI, 1998/2003/2008/2011
Primary Repeat
1998 (%) 16.0 6.1
2003 (%) 16.0 13.7
2008 (%) 17.8 12.3
2011 (%) 14.9 13.6
As the rate of primary C-birth increases, so subsequently does the rate of repeat C-births. In 2011, the most common indication for C-birth was previous C-birth; this has been a consistent increase over time. The second most reported indication for Caesarean birth in 2011 was dystocia (18.1%), although this primary indication has decreased since 2008 (25.7%).

Labour and Delivery and Maternal Health Outcomes
Perinatal Database Report 2011 29
2.7 Maternal Length of Stay
The appropriate length of hospital stay for childbirth has been a controversial issue for decades, but is generally seen as an indicator of maternal health. The mother’s health condition does affect length of stay but a number of other factors do as well:
healthcare policies and resources characteristics of the health care delivery system availability of follow-up resources/supports in the community socio-demographic characteristics of the mother.7
Length of Stay by Delivery type, PEI, 2011 Vaginal C-Birth Average Antepartum Length of Stay (hrs) 8.9 13.6 Average Postpartum Length of Stay (hrs) 58.1 89.8 Average Total Length of Stay (hrs) 66.9 102.4
Women who had a C-birth on PEI had a postpartum hospital stay 31.7 hours longer than those who had a vaginal birth (this difference decreased from 40.3 hours in 2008). In 2011 the total length of hospital stay for vaginal births was 66.9 hours (2.8 days) and for C-births 102 hours (4.3 days). An overly shortened length of stay (less than 2 days for vaginal birth and less than 4 days for C-births) has been shown to have an effect on breastfeeding duration, maternal and infant readmission & infant morbidity and mortality. Government and professional guidelines have recommended a postpartum follow-up visit shortly after hospital discharge which can positively impact breastfeeding, maternal/infant readmissions and infant outcomes considerably.46, 47, 48 In PEI all women are offered a postpartum home visit by Public Health Nursing, with continued follow-up as necessary. Mothers with diabetes or hypertension, either pre-existing or gestational, were more likely to experience a C-birth (37.8%) than mothers without these conditions (27.2%) and were more likely to have a longer stay in hospital (4 days versus 3 days for those without these conditions) as demonstrated in the table below. This longer hospital stay may also be attributed to the longer stay associated with C-birth as compared to vaginal birth.

Labour and Delivery and Maternal Health Outcomes
30 Perinatal Database Report 2011
0 25 50 75 100 125
Pre‐existing Hypertension
Gestational Hypertension
Pre‐existing Diabetes
Gestational Diabetes
Neither Hypertension nor Diabetes
Average Length of Stay (Hours)
Length of Stay by Diabetes or Hypertension, PEI, 2011

Labour and Delivery and Maternal Health Outcomes
Perinatal Database Report 2011 31
2.8 Maternal Morbidity and Mortality
The most common severe maternal morbidities in 2011 were: severe pregnancy-induced hypertension (1.4%) anesthetic complications (0.8%) postpartum haemorrhage with transfusion (0.5%)
As would be expected, length of stay was significantly increased when complications occurred (4.9 days) compared to no complications (3.2 days). Women with any severe maternal morbidity (57.1%) were more likely to experience a C-birth than women with no severe condition (27.8%). There were no reported maternal deaths in PEI in 2011. Maternal deaths are defined as deaths of women while pregnant or within 42 days of the completion/termination of pregnancy, irrespective of duration or site of pregnancy, from any reason related to pregnancy.46 Severe maternal morbidity is used to monitor the quality of maternity care since the incidence of maternal deaths has declined in developed countries.

Labour and Delivery and Maternal Health Outcomes
32 Perinatal Database Report 2011

Perinatal Database Report 2011 33
3 Newborn Health Outcomes

Newborn Health Outcomes
34 Perinatal Database Report 2011
* 1998 includes data from out of province births (i.e.: IWK) which tend to be premature, high‐risk or low birth weight babies † includes stillbirths ‡ excludes stillbirths
Newborn Health Indicators YEAR
1998* 2003 2008 2011
Births (Babies born on PEI) 1509* 1426 1434 1405
Birth Weight (average in grams)
3475* 3492 3464 3482
Low Birth Weight (≥500 g to 2500g) (per 100 live births) 4.6* † 4.0
† 5.0
‡ 4.0
‡
High Birth Weight (≥4500g) (per 100 live births)
3.7* 3.2 2.7 2.9
Breastfeeding Initiation (per 100 live births)
- 67.9 74.0 78.3
Breastfeeding at Discharge (per 100 live births)
59.3* 62.8 70.5 73.2
Multiple births (rate per 100 live births)
- 2.3 1.4 0.9
Preterm Birth rate (per 100 live births)
5.4* 5.7 6.4 5.6
Crude stillbirth rate (per 1000 total births)
2.0* 8.4 3.4 2.1
Congenital Anomaly (per 100 live births)
- 3.8 5.8 6.1
Newborn Average Length of Stay (in hours)
- - 87.5 86.8

Newborn Health Outcomes
Perinatal Database Report 2011 35
3.1 Newborns
In 2011 there were 1,405 babies born on Prince Edward Island, 2 of which were homebirths. There were also approximately 25 babies born at the IWK Hospital in Nova Scotia to Island mothers who required more complex care. These mothers and babies are not included in this report as the information for these babies is unavailable from Nova Scotia at this time. Statistics Canada reports show that from 2007 to 2008 there was a large percentage increase of 6.8% in births on PEI. This correlates with a high rate of international migration in 2008. 49, 50 Since then PEI has seen yearly percentage decreases in births in both 2009 (-1.8%) and 2010 (-3.7%) with a slight increase in 2011 (+1.2%). Canada as a whole has seen little change in numbers of births over the last 3 years.
0
200
400
600
800
1000
1200
1400
1600
1800
2000
1992 1993 1994 1995 1996 1997 1998 1999 2000 2001 2002 2003 2004 2005 2006 2007 2008 2009 2010 2011
Count
Number of Babies Born,PEI, 1992‐2011
Data from Vital Statistics(births registered in PEI)

Newborn Health Outcomes
36 Perinatal Database Report 2011
3.2 Newborn Birth Weight
Birth weight has been shown to be the primary determinant of perinatal, neonatal, and post-natal outcomes for newborns.30, 51 Gestational ages can be difficult to determine while the measurement of birth weight can be relatively simple, accurate, valid and reproducible therefore it is the most commonly used indicator worldwide to compare populations.52 Low birth weight can result from preterm or IUGR birth, or a combination of the two and may have health implications. High birth weight can be associated with both infant and maternal birth complications and may increase the risk of Type 2 diabetes later in life. 2,7, 49 Newborn Birth Weight Classifications:
Low Birth Weight: ≥500g-2,500 grams
High Birth Weight:4,000 grams-4,499 grams Macrosomic: ≥4,500 grams
The average newborn birth weight was 3,482 grams. These numbers do not include newborns of PEI mothers who were born outside the province of PEI. Statistics Canada reports indicate the mean birth weight for babies born in Canada was 3,355 grams.
3200
3250
3300
3350
3400
3450
3500
3550
NL PE NS NB QC ON MB SK AB BC YK NT NU
Grams
Average Birth Weight for Provinces and Territories, 2011
Canada
In Canada 6% of live births were categorized as low birth weight and 1.9% as high birth weight in 2011.2, 49 Of PEI live births 4.0% were low birth weight and 2.9% were high birth weight.

Newborn Health Outcomes
Perinatal Database Report 2011 37
Live Term Singleton Birth Weight Categories by Maternal Pre-Pregnancy BMI, PEI, 2011
Underweight Normal Weight Overweight Obese
Low Birth Weight (%) 0.0 2.9 2.0 2.0
High Birth Weight (%) 9.3 10.5 12.5 18.2
Macrosomic (%) 0.0 1.8 3.7 5.2
Mother’s pre-pregnancy BMI impacts the infant’s birth weight. When term singleton births were reviewed, it was noted that as the maternal pre-pregnancy BMI increased, so did the likelihood the baby would be either high birth weight or macrosomic. The average birth weight for term singleton infants born to mothers whose pre-pregnancy BMI put them in the obese category was 3,629 grams. This compares to 3,494 grams for infants whose mothers are in the normal weight category (according to pre-pregnancy BMI).
3150
3200
3250
3300
3350
3400
3450
3500
3550
3600
3650
3700
Underweight Normal Weight Overweight Obese Unknown
Newborn Birth W
eight (gram
s)
Pre‐pregnancy BMI
Average Birth Weight for Term Singletons by MaternalPre‐pregnancy BMI, PEI, 2011

Newborn Health Outcomes
38 Perinatal Database Report 2011
3.3 Infant Feeding
Many worldwide and Canadian health organizations support breastfeeding, these include: Health Canada (HC), PHAC, Canadian Paediatric Society (CPS), SOGC, the United Nations Children’s Fund, and the World Health Organization. The rationales given highlight breastfeeding providing optimal nutritional and immunological benefits for the growth and development of infants. Breastfeeding is recommended for the first six months of life, at least, for healthy term infants. Breast milk is the optimal food for infants, and breastfeeding may continue for up to two years and beyond.47,48,53,54,55 Increasing breastfeeding rates has also been shown “help reduce the prevalence of various illnesses and health conditions, which in turn results in lower health care costs”.56 Recognizing the importance of promoting, supporting and protecting breastfeeding has become increasingly important across jurisdictions. The PEI Department of Health and Wellness recently adopted a Breastfeeding Policy that “unequivocally supports breastfeeding as the optimal form of nutrition for newborns given its beneficial effects on infants’ growth, immunity, and cognitive development.” 57 (Appendix A) The Baby Friendly Initiative is being utilized across the world as a focused, consistent and evidence-based method of increasing breastfeeding rates. 48, 58 In 2012 a joint statement of HC, CPS, Dietitians of Canada, and Breastfeeding Committee for Canada titled ‘Nutrition for Healthy Term Infants: Recommendations from Birth to Six Months’ was released to be used by parents and caregivers, with tips on talking with families about infant nutrition. ‘Nutrition for Healthy Term Infants: Recommendations from Birth to Six Months’ states:
Breastfeeding is the normal and unequalled method of feeding infants. Breastfeeding initiation and duration rates increase with active protection, support, and
promotion. Supplemental Vitamin D is recommended for breastfed infants. First complementary foods should be iron-rich. Routine growth monitoring is important to assess infant health and nutrition. Feeding changes are unnecessary for most common health conditions in infancy. Breastfeeding is rarely contraindicated. 53
It also includes specific guidelines on the use of breast milk substitutes. The 2012 PEI Chief Public Health Officer’s Report and Health Trends noted that breastfeeding research has indicated protective effects for infants such as:
Illness, infection and allergy reduction Reduction in risk factors for Type 2 diabetes and childhood obesity. 59
Mothers who breastfeed may also benefit by lower rates of:
Osteoporosis Specific types of ovarian and breast cancer. 59

Newborn Health Outcomes
Perinatal Database Report 2011 39
According to ‘Breastfeeding Initiation in Canada: Key Statistics and Graphics (2009-2010)’, 87.3% of Canadian mothers breastfed or tried to breastfeed their last child, which was down 0.6% from 2007-2008. Rates were lowest in the Atlantic Region at 74.8% and highest in British Columbia at 93.1%. Breastfeeding initiation rates have improved in the Atlantic Region by 1% since 2007-2008. 55 In Canada breastfeeding rates have been found to be related to income levels, education levels, marital status, area of residence and age in 2009-2010. 55, 60
In PEI in 2011 approximately 78.3% of all mothers initiated breastfeeding with their newborns. At discharge from hospital, 73.2% were still breastfeeding, which is a loss of 5% of breastfeeding mothers within days of giving birth. In PEI in 2011 breastfeeding rates have been found to be related to:
Maternal age: o Those 25 years of age were less likely to be breastfeeding at discharge with
61.2% in 2011 (50% in 2003 and 63% in 2008) o For mothers >25 years breastfeeding at discharge rates were 76.7% in 2011
(67% in 2003 and 73% in 2008). Women in partnerships (married or common-law) were more likely to be breastfeeding at
discharge (78%) than women in no relationship (single, separated, or divorced) (57.2%). There is no change in breastfeeding at discharge rates for single women since 2008; this factor is important to breastfeeding rates since 23% of pregnant women in PEI were not in a relationship in 2011.
Normal weight mothers (based on pre-pregnancy BMI) are significantly more likely to initiate breastfeeding than are underweight, overweight and obese mothers combined.
Vaginal or Caesarean birth did not affect the rates of breastfeeding initiation or breastfeeding at discharge.
Newborn Health Outcomes
40 Perinatal Database Report 2011
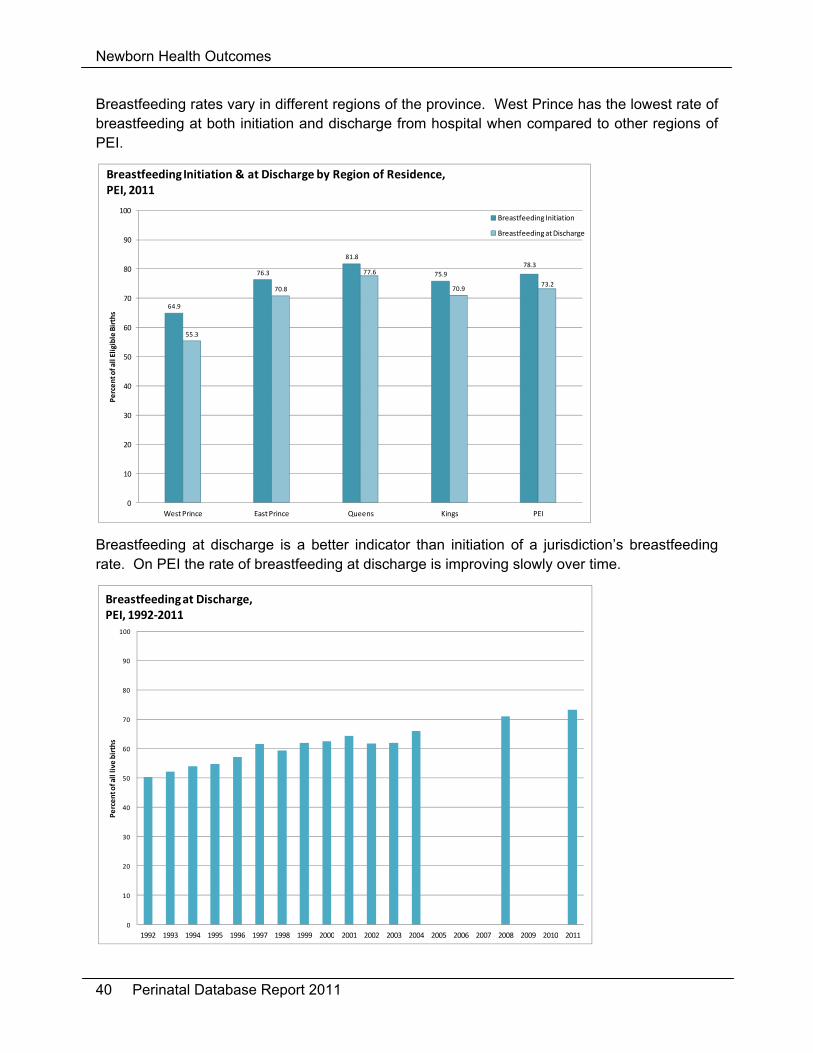
Breastfeeding rates vary in different regions of the province. West Prince has the lowest rate of breastfeeding at both initiation and discharge from hospital when compared to other regions of PEI.
64.9
76.3
81.8
75.9
78.3
55.3
70.8
77.6
70.973.2
0
10
20
30
40
50
60
70
80
90
100
West Prince East Prince Queens Kings PEI
Percent of all Eligible Births
Breastfeeding Initiation & at Discharge by Region of Residence, PEI, 2011
Breastfeeding Initiation
Breastfeeding at Discharge
Breastfeeding at discharge is a better indicator than initiation of a jurisdiction’s breastfeeding rate. On PEI the rate of breastfeeding at discharge is improving slowly over time.
0
10
20
30
40
50
60
70
80
90
100
1992 1993 1994 1995 1996 1997 1998 1999 2000 2001 2002 2003 2004 2005 2006 2007 2008 2009 2010 2011
Percent of all live
births
Breastfeeding at Discharge, PEI, 1992‐2011

Newborn Health Outcomes
Perinatal Database Report 2011 41
“Nutrition for Healthy Term Infants: Recommendations from Birth to Six Months” recommends that a mother should be advised to reduce or stop smoking since smoking can affect:
Mother’s milk production Infants’ growth Infants’ sleep patterns in the short term.53
Healthcare providers should advise the mother to keep breastfeeding even if she keeps smoking since breastfeeding can reduce the negative effects of the infants’ exposure to cigarette smoke.53 A recent study out of Nova Scotia showed that one modifiable risk factor to early cessation of exclusive breastfeeding was smoking.20 Smoking mothers are much less likely to breastfeed at discharge when compared to non-smoking mothers. This trend is evident across the province.
0
10
20
30
40
50
60
70
80
90
100
West Prince East Prince Queens Kings PEI
Percent of A
ll Eligible Births
Breastfeeding at Discharge by Smoking Status and Region, 2011
Smoker
Non‐smoker
Newborn Health Outcomes
42 Perinatal Database Report 2011
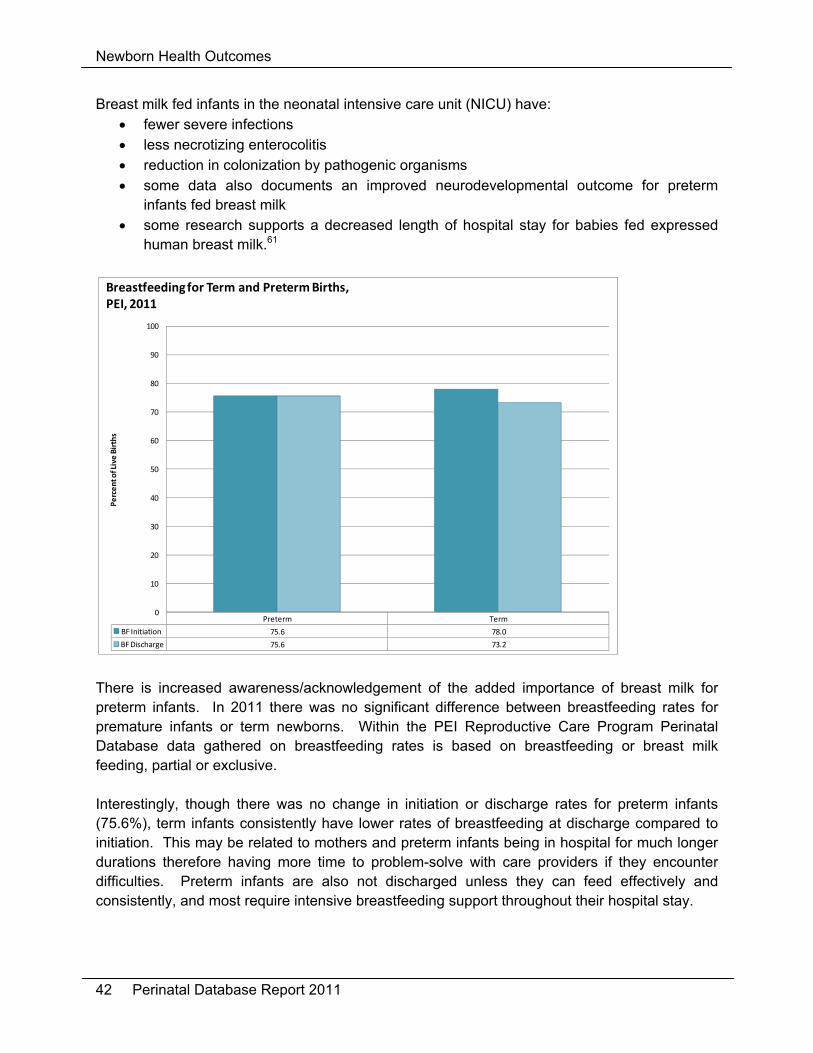
Breast milk fed infants in the neonatal intensive care unit (NICU) have: fewer severe infections less necrotizing enterocolitis reduction in colonization by pathogenic organisms some data also documents an improved neurodevelopmental outcome for preterm
infants fed breast milk some research supports a decreased length of hospital stay for babies fed expressed
human breast milk.61
Preterm Term
BF Initiation 75.6 78.0
BF Discharge 75.6 73.2
0
10
20
30
40
50
60
70
80
90
100
Percent of Live Births
Breastfeeding for Term and Preterm Births, PEI, 2011
There is increased awareness/acknowledgement of the added importance of breast milk for preterm infants. In 2011 there was no significant difference between breastfeeding rates for premature infants or term newborns. Within the PEI Reproductive Care Program Perinatal Database data gathered on breastfeeding rates is based on breastfeeding or breast milk feeding, partial or exclusive. Interestingly, though there was no change in initiation or discharge rates for preterm infants (75.6%), term infants consistently have lower rates of breastfeeding at discharge compared to initiation. This may be related to mothers and preterm infants being in hospital for much longer durations therefore having more time to problem-solve with care providers if they encounter difficulties. Preterm infants are also not discharged unless they can feed effectively and consistently, and most require intensive breastfeeding support throughout their hospital stay.
Newborn Health Outcomes
Perinatal Database Report 2011 43
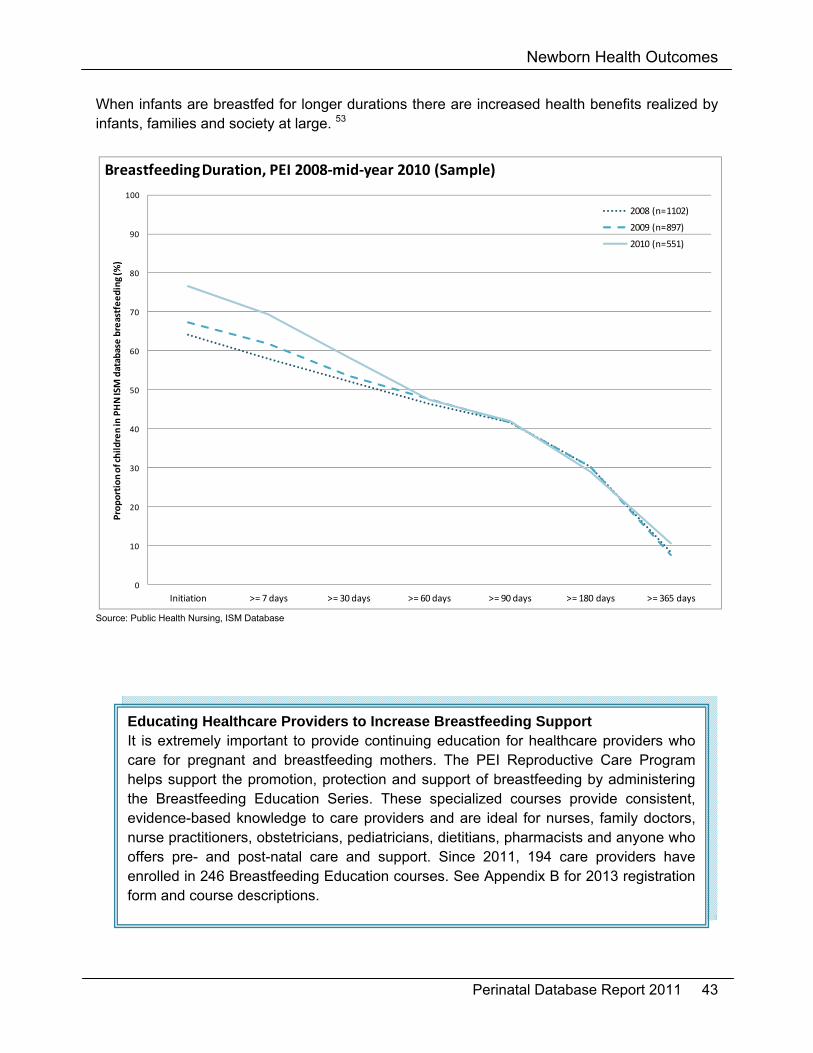
When infants are breastfed for longer durations there are increased health benefits realized by infants, families and society at large. 53
0
10
20
30
40
50
60
70
80
90
100
Initiation >= 7 days >= 30 days >= 60 days >= 90 days >= 180 days >= 365 days
Proportion of children in PHN ISM database breastfeeding (%
)
Breastfeeding Duration, PEI 2008‐mid‐year 2010 (Sample)
2008 (n=1102)
2009 (n=897)
2010 (n=551)
Source: Public Health Nursing, ISM Database
Educating Healthcare Providers to Increase Breastfeeding Support It is extremely important to provide continuing education for healthcare providers who care for pregnant and breastfeeding mothers. The PEI Reproductive Care Program helps support the promotion, protection and support of breastfeeding by administering the Breastfeeding Education Series. These specialized courses provide consistent, evidence-based knowledge to care providers and are ideal for nurses, family doctors, nurse practitioners, obstetricians, pediatricians, dietitians, pharmacists and anyone who offers pre- and post-natal care and support. Since 2011, 194 care providers have enrolled in 246 Breastfeeding Education courses. See Appendix B for 2013 registration form and course descriptions.

Newborn Health Outcomes
44 Perinatal Database Report 2011
3.4 Multiple Births
There were 13 sets of twins born on PEI. Out of province births (i.e. multiples born at the IWK) are not included in this report because of the unavailability of complete data; therefore this number is an underestimation of the actual number. In 2008 the rate of multiple births increased with maternal age, this did not occur in 1998 or 2011. In the past decade the increased use of assisted human reproduction (AHR) and higher maternal age at conception had been attributed to the rise in the rate of multiple births.62
0
1
2
3
4
5
6
7
8
<20 years 20‐24 years 25‐29 years 30‐34 years 35‐39 years 40+ years
Percent of Live Births
Rate of Multiple Births by Maternal Age, PEI, 1998/2008/2011
1998
2011
2008

Newborn Health Outcomes
Perinatal Database Report 2011 45
3.5 Preterm Births
Preterm birth is of significant public health importance because of its association with an increase in mortality and increased morbidities. Preterm birth is defined as an infant born at <37 weeks (259 days) gestation. The most severe effects of prematurity are noted when infants are <32 weeks gestation at birth but all infants born at <37 weeks gestation have an increased risk of morbidity or mortality. It is general practice in PEI to refer all threatened premature labours occurring at <32 weeks gestation to IWK in Nova Scotia. For the purpose of this report preterm birth was calculated using clinical estimate of gestational age at birth. Medically indicated preterm birth may be required for maternal medical conditions, pregnancy-related conditions or fetal conditions when the health benefits for the mother and/or baby outweigh the potential risks associated with preterm birth. The PEI Reproductive Care Program Database does not differentiate between spontaneous and medically indicated preterm births. In 2011, premature birth was noted for 5.6% of all live births in PEI. In total, 4.6% of these births occurred at 34-36 weeks gestation and 1% occurred at less than 34 weeks gestation with no data available on out of province births. Preterm Birth Rates using Clinical Estimate of Gestational Age, PEI, 2011
Number % of Live Births
Spontaneous Preterm Birth 36 2.6
Preterm Labour Induction 21 1.5
Preterm Caesarean with No Labour 21 1.5
Total 78 5.6
“Perinatal Health Indicators for Canada 2011” reports a preterm birth rate of 7.9 per 100 live births in Canada (excluding Ontario) for 2008.63 The 5.6% noted here for PEI may reflect a decrease in preterm births but is likely also a result of our inability to include data for mothers transferred to, and babies born at, tertiary centres out of province (i.e.: IWK tertiary care centre).

Newborn Health Outcomes
46 Perinatal Database Report 2011
3.6 Fetal and Infant Mortality
Fetal Mortality The PEI Vital Statistics Act states ‘stillbirth means the complete expulsion or extraction from its mother after at least twenty weeks pregnancy, or after attaining a weight of at least 500 grams, of a product of conception in which, after the expulsion or extraction, there is no breathing, beating of the heart, pulsation of the umbilical cord or unmistakable movement of voluntary muscle’. 64 The fetal mortality (stillbirth) rate is defined as the number of fetal deaths per 1,000 total births (live births and stillbirths).7 Stillbirth rates fluctuate greatly from year to year in PEI, largely due to our small population and small total number of births.
6.8
3.5
2.5
2
4.6
3.5
4.4
3
8.4
3.4
2.1
0
1
2
3
4
5
6
7
8
9
10
1995 1996 1997 1998 1999 2000 2001 2002 2003 2004 2005 2006 2007 2008 2009 2010 2011
Rate per 1,000 births
Stillbirth Rates, PEI, 1995‐2011
Infant Mortality The infant mortality rate is defined as the number of deaths of live born infants in the first year after birth per 1,000 live births. Infant mortality can be divided into three components: early neonatal deaths (0-6 days), late neonatal deaths (7-27 days) and postnatal deaths (28-364 days).7 For privacy reasons this report does not publish infant mortality rates when there have been less than 5 individuals affected.

Newborn Health Outcomes
Perinatal Database Report 2011 47
3.7 Congenital Anomalies
Congenital anomalies, birth defects and congenital malformations are synonymous terms that describe an abnormality of structure or function present at birth.7 Within the PEI Reproductive Care Program Perinatal Database only anomalies diagnosed after birth but before newborn discharge are reported. Of live births in 2011, 6.1% were classified with a congenital anomaly (5.8% in 2008). Congenital Anomalies, PEI, 2008 and 2011
System Rate per 1,000 Births
2008 Rate per 1,000 Births
2011
Central Nervous 2.1 0
Cardiovascular 9.0 13.6
Gastrointestinal 2.8 0.7
Genitourinary 13.8 10.8
Musculoskeletal 13.1 16.5
Ear/Nose/Mouth/Throat 17.3 19.4
Chromosomal 0 0

Newborn Health Outcomes
48 Perinatal Database Report 2011
3.8 Length of Stay
The average length of stay for all liveborn newborns born in hospital and then discharged home in 2011 was 86.8 hours (3.6 days). Typically babies born via vaginal birth (73.8 hours) have shorter lengths of stay than those born by C-birth (116.5 hours). It is important to note again that this does not include data from newborns born outside the province such as those born at IWK. Babies born in tertiary care centres such as the IWK are often most at risk and may well be premature infants with complications that require intensive care. If their data was included these length of stay estimates would likely be higher

Newborn Health Outcomes
Perinatal Database Report 2011 49
3.9 Newborn Readmissions
The PEI Reproductive Care Program Perinatal Database captures information on infants with readmissions to hospital up to and including 28 days of age. In 2011, 46 newborns were readmitted for various reasons (a total of 47 readmissions) reflecting 3.3% of live births delivered on PEI. The most common reasons for readmission were:
feeding difficulties: 17.0% (10.9% in 2008) hyperbilirubinemia: 14.9% (28.3% in 2008) respiratory conditions 12.8% infections 12.8% gastro-esophageal reflux disease (GERD): 10.6% (17.4% in 2008)
In 2011, 14.9% of readmitted newborns born on PEI had 2 or more of the above diagnoses associated with the readmission. Data analysis showed no significant difference in rate of re-admissions between newborns with a shorter or longer length of stay after birth. There is no significant difference between rates of newborns born via vaginal birth who were re-admitted and those born via C-birth.

Newborn Health Outcomes
50 Perinatal Database Report 2011

Perinatal Database Report 2011 51
4 Appendices

Appendices
52 Perinatal Database Report 2011

Appendices
Perinatal Database Report 2011 53
4.1 Glossary of Terms
Advanced maternal age: ≥35 years of age at the time of birth.
Antepartum: period of time from conception to labour and birth.
Assisted vaginal delivery: vaginal birth which required assistance of forceps or vacuum.
Augmentation: use of oxytocin to improve/increase contractions after labour has started spontaneously (cervical dilation is ≥3cm and regular contractions are present when the oxytocin is initiated).
Body Mass Index (BMI): calculated using the expectant mother’s height and pre-pregnancy weight.
Clinical estimate of gestational age: closest approximation in weeks to the gestational age, obtained by the physical examination of the newborn.
Dystocia: unable to deliver, possibly due to cephalopelvic disproportion, failure to progress, maternal exhaustion, cervical stenosis as recorded by the delivering doctor.
Episiotomy: surgical incision on the perineum intended to facilitate delivery.
Induction: procedure or medication administration intended to initiate labour when there are no regular contractions which results in labour within 24 hours (generally at cervical dilation of <3cm).
Maternal age at delivery: calculated using mother’s date of birth and date of delivery.
Meconium: the first bowel movement of a fetus/newborn before or after delivery which is formed by the fetus during the 2nd and 3rd trimester of pregnancy.
Multiparous: expectant mother with one previous pregnancy that resulted in one or more infants weighing ≥500g at birth or ≥20 weeks gestational age.
Multiple births: present pregnancy of two or more fetuses.
Nulliparous: expectant mother with no previous pregnancies.
Post dates: ≥41 weeks gestation.
Postpartum: period of time immediately following birth until 28 days after birth.
Pre-eclampsia: abnormally high blood pressure during pregnancy and labour with proteinuria and/or edema which may progress to eclampsia (i.e. abnormal reflexes, seizures or convulsions) as diagnosed by the attending doctor.
Primary C-birth: a mother who has a Caesarean birth for this delivery (but may have had previous vaginal birth).
Repeat C-birth: a mother who has a Caesarean birth for this delivery and has had a previous C-birth.
Singleton: present pregnancy of one fetus.

Appendices
54 Perinatal Database Report 2011
Teratogens: substance to which an expectant mother is exposed or ingests that can disturb the development of an embryo or fetus. Teratogens may cause a birth defect in the child or may halt the pregnancy outright. The Perinatal Database looks at teratogens such as smoking, exposure to second hand smoke, alcohol and drug abuse.
Third/Fourth degree laceration: third degree laceration is defined as a tear in the vaginal tissue, perineal skin, and perineal muscles and may extend into the anal sphincter. A fourth degree laceration goes through the anal sphincter and the tissue underneath. This is noted in the Perinatal Database as diagnosed by the delivering doctor.
Appendices
Perinatal Database Report 2011 55
4.2 Synopsis of PEI Department of Health and Wellness Breastfeeding Policy
I. Statement
The PEI Department of Health and Wellness unequivocally supports breastfeeding as the optimal form
of nutrition for newborns given its beneficial effects on infants’ growth, immunity, and cognitive
development.
In order for the PEI Department of Health and Wellness to provide leadership of the protection,
promotion and support of breastfeeding, and to improve the health status of mothers and babies, we
will:
Make breastfeeding a public health priority
Re‐establish breastfeeding as our cultural norm
Create momentum to strive for Baby Friendly Initiative status in PEI facilities
Work collaboratively with stakeholders to develop educational and communication material to
improve societal acceptance
Work collaboratively with Health PEI to implement this policy
II. Rationale
The World Health Organization and countless other professional health organizations recommend
exclusive breastfeeding for the first six months of life followed by the gradual introduction of nutrient‐
rich solid foods to complement breastfeeding for up to two years and beyond. 1,2
Historically Prince Edward Island has low breastfeeding rates. Approximately 71% of newborns born in
2008 were being breastfed at discharge from the hospital. 3 While initiation rates are low, the duration
of breastfeeding also needs improvement. Based on the 2006/07 Maternity Experiences Survey, only
35% of mothers breastfed (any amount) their infants at six months of age. This was significantly lower
than the national average. 4
Increased rates of breastfeeding initiation and duration result in reduced incidence of many acute
childhood diseases and chronic adult diseases regardless of economic status (including asthma,
diabetes, heart disease and obesity).
III. Applicability
This policy applies to the Department of Health and Wellness and Health PEI including all provincial
government and health system funded practitioners and staff.
1 World Health Organization. (2003). The Global Strategy for Infant and Young Child Feeding. Geneva: World Health Organization, http://whqlibdoc.who.int/publications/2003/9241562218.pdf. 2 Infant Feeding Joint Working Group (2012). Nutrition for Healthy Term Infants: Recommendations for Birth to Six Months. A Joint Statement of Health Canada, Canadian Paediatric Society, Dietitians of Canada, and Breastfeeeding Committee for Canada. (Draft), http://www.hc-sc.gc.ca/fn-an/consult/infant-nourisson2/recommendations/index-eng.php#a1 3 Prince Edward Island Reproductive Care Program (2008). Perinatal Database Report 2008. http://www.gov.pe.ca/photos/original/dhw_rcp_pdr08.pdf 4 Public Health Agency of Canada (2009). What Mothers Say: The Canadian Maternity Experiences Survey. Ottawa, 2009. http://www.phac-aspc.gc.ca/hrs-ssg/pdf/survey-eng.pdf

Appendices
56 Perinatal Database Report 2011

Appendices
Perinatal Database Report 2011 57
4.3 Breastfeeding Education
The Breastfeeding Education Series are specialized courses designed for health care professionals working with women who plan to, or who are, breastfeeding. The Health e-Learning courses & Step2 Education courses are offered with registration through the PEI Reproductive Care Program.
Registration Form
Name ________________________________________ Phone# _______________________ Position/Work Place _____________________________ Supervisor/Manager _____________ E-mail ________________________________________ Payment included: $_____________
Step 2 Education: Core Courses $72.00 ES 01 Breastfeeding Essentials (20 hours-Online study)
ES 03 Breastfeeding Essentials for Doctors (5 hours-Online study)
Health e-Learning: $115.00 12 hour BreastEd Online study courses BE01 Breast Milk: Composition and Function
BE02 Anatomy and Physiology of the Lactating Breast
BE03 Positioning and Latch of the Baby to the Breast
BE04 Breastfeeding Initiation and the First Week
BE05 Communication and Education
BE06 Breast milk, Breastfeeding and the Preterm Infant
BE07 Breastfeeding after the First Week
BE08 Breast milk, Lactation and Medications
BE09 Other Factors Influencing the Breastfeeding Dyad
BE10 Evolution of Breastfeeding as a Public Health Issue
Step 2 Education: Continuing Education Lectures $18.00 1 hour Online Lectures CE12 Jane Morton: Making Enough Milk For The Preterm
CE15 Lawrence Gartner: Bilirubin Management And Implications For Breastfeeding CE16 Martin Ward-Platt: Neonatal Hypoglycaemia - Evidence And Recommendations
CE19 Marsha Walker: Stemming The Tide Of Supplementation: What, When, How, And Why
CE20 Laurie Nommsen-Rivers: Delayed Onset Of Lactogenesis: Causes, Consequences, Lactation Support
CE23 Barbara Morrison: Translating Evidence Into Practice: Birth Kangaroo Care
CE28 Nils Bergman: Infant Feeding Frequency: Proposal Based On Available Evidence And Neuroscience
CE32 Diane Weissinger: Watch Your Language
CE35 Yvette Sheehy: Breastfeeding Premature Infants
CE36 Kathleen Marinell: Breastfeeding The Late Preterm Infant REGISTRATION FEE: Must accompany registration form. PRICES SUBJECT TO CHANGE
Cheque/ Money order made payable to: PEI Minister of Finance
Send registration form and payment to: Breastfeeding Education, c/o PEI Reproductive Care Program, 16 Fitzroy St. 2nd Floor Sullivan Building, PO Box 2000, Charlottetown, PE, C1A 7N8 (contact: 368-4952 or [email protected])
See Breastfeeding Education Course Descriptions on our Website: http://www.gov.pe.ca/health/reproductivecare

Appendices
58 Perinatal Database Report 2011

Appendices
Perinatal Database Report 2011 59
4.4 Variables Available in the PEI Reproductive Care Program Perinatal Database
* The type of data collected over time has been adjusted. The list below reflects data captured in 2011 onward. For data available historically please contact the PEI Reproductive Care Program. ** For data analysis or raw data requests please complete below forms (available online) and forward to the PEI Reproductive Care Program.
Maternal Data Indicator of singleton or multiple pregnancy Type of prenatal care provided Date of delivery Maternal residential postal code at delivery (or out of province indication) Maternal age at delivery Education (last level completed) Marital status at delivery Pre-pregnancy weight Maternal height Gravida Parity Abortions Number of previous stillbirths/intrauterine deaths Number of previous neonatal deaths Number of previous preterm births Number of previous caesarean sections Number of previous low birth weight infants Number of previous high birth weight infants Previous IUGR Received flu vaccine this pregnancy Pre-conceptual folic acid Prenatal vitamins Use of assisted conception Method of assisted conception Date of last menstruation First intrapartum ultrasound date Gestational age at first ultrasound Rh immunoglobulin given antepartum Haemoglobin in third trimester Group B Strep screening completed Date of first contact with prenatal provider Type of prenatal care provider Prenatal family physician/obstetrician Prenatal education classes IUGR assessed for this pregnancy Exposed to second hand smoke Pre-pregnancy smoking Smoking 0-20 weeks Smoking at delivery Average # of alcohol containing drinks per week Binge drinking 1 or more times during this pregnancy Maternal drug therapy during this pregnancy Maternal drug and chemical abuse during pregnancy

Appendices
60 Perinatal Database Report 2011
Maternal carrier states Maternal steroid therapy Cesarean Birth with no labour Date and time and location of labour admission Gestation at 1st stage Cervical dilatation on admission Maternal admission weight Labour medication and administration Maternal drug therapy intrapartum/postpartum Antepartum/Intrapartum/Postpartum antibiotics Labour 1st stage onset date and time Labour 1st stage initiation Medical augmentation of labour Induction of labour Anaesthesia/Analgesia during labour and delivery Episiotomy VBAC Attempted VBAC Successful Electronic Fetal Monitoring Cesarean birth Primary indication for C-section Secondary indication for C-section Period of PURPLE Crying education Received Pertussis vaccine Maternal admission date/time Admitting facility Attending physician Reason for admission Diagnostic codes according to the International Classification of Diseases (ICD) Procedure codes according to the International Classification of Diseases (ICD) Maternal disposition at discharge Discharge date/time Referring hospital Cause of death (if applicable) Newborn Data Admission type Admission facility Attending physician Admission date/time Discharge date/time Type of care required/length of stay in specialized units Diagnostic codes according to the International Classification of Diseases (ICD) Procedure codes according to the International Classification of Diseases (ICD) Outcome of stay Cause of death (if applicable) Baby’s sequence (if applicable) Type of membrane rupture ROM date and time Meconium before delivery Mode/Method of delivery

Appendices
Perinatal Database Report 2011 61
Position/Presentation at delivery Date and time of birth Sex Birth weight (g) Head Circumference (cm) Length (cm) Clinical estimate of gestational age Apgars at 1, 5, 10 minutes (if applicable) Cord Artery pH / Cord Venous pH / pCO2
Base Excess/Deficit Value Breastfeeding Initiation Breastfeeding at Discharge Breastfeeding Status at Discharge Neonatal Resuscitation/Details

Appendices
62 Perinatal Database Report 2011

Appendices
Perinatal Database Report 2011 63
4.5 PEI Perinatal Database Data Request Form
PEI Reproductive Care Program 16 Fitzroy Street, PO Box 2000
2nd Floor Sullivan Building Charlottetown, PE C1A 7N8
Tel: 902 368-4952 Fax: 902 620-3354
E-mail: [email protected] http://www.gov.pe.ca/health/reproductivecare
Data Request Form
Date Submitted: ______________________Date requested by: ________________________
Name(s): ___________________________________________________________________
Organization (if applicable): ____________________________________________________
Phone Number: __________________ email: ______________________________________
Mailing Address: _____________________________________________________________
1. Project title:
______________________________________________________________________
2. Copy of proposal attached: Yes___ No___
3. Copy of ethical review attached: Yes___ No___
4. Purpose of the request/objective of the study:
____________________________________________________________________________
____________________________________________________________________________
____________________________________________________________________________
____________________________________________________________________________
____________________________________________________________________________
____________________________________________________________________________
____________________________________________________________________________
____________________________________________________________________________

Appendices
64 Perinatal Database Report 2011
Plan for use of this information: (please circle any that are appropriate and provide details about journals targeted, expected audience for presentations):
Publication___ poster presentation___ oral presentation___
____________________________________________________________________________
____________________________________________________________________________
____________________________________________________________________________
____________________________________________________________________________
5. Project description: Please provide the specific variables required, if possible*. For those unfamiliar with the PEI
Reproductive Care Perinatal Database, consultation with PEI RCP is recommended prior to
submission. Attach any project descriptions or research proposals as necessary.
____________________________________________________________________________
____________________________________________________________________________
____________________________________________________________________________
____________________________________________________________________________
____________________________________________________________________________
____________________________________________________________________________
____________________________________________________________________________
____________________________________________________________________________
____________________________________________________________________________
____________________________________________________________________________
____________________________________________________________________________
____________________________________________________________________________
____________________________________________________________________________
____________________________________________________________________________
____________________________________________________________________________
____________________________________________________________________________
____________________________________________________________________________ * Variables such as birth date, birth time, birth order for higher order multiples, postal code, health care facility and physician specialty designation could potentially identify an individual mother, infant, or care provider. The need for potential identifiers should be carefully considered before submitting a request and alternatives discussed with an RCP representative.

Appendices
Perinatal Database Report 2011 65
4.6 PEI Perinatal Database Data Analysis Request Form
PEI Reproductive Care Program 16 Fitzroy Street, PO Box 2000
2nd Floor Sullivan Building Charlottetown, PE C1A 7N8
Tel: 902 368-4952 Fax: 902 620-3354
E-mail: [email protected] http://www.gov.pe.ca/health/reproductivecare
Data Analysis Request Form
Date Submitted: ___________________ Date analysis requested by: ____________________
Name(s): ____________________________________________________________________
Organization (if applicable): _____________________________________________________
Phone Number: ____________________________ email: ____________________________
Mailing Address: _____________________________________________________________
1. Purpose of the request (What are you trying to answer?): _________________________
____________________________________________________________________________
____________________________________________________________________________
____________________________________________________________________________
____________________________________________________________________________
____________________________________________________________________________
____________________________________________________________________________
2. I plan to use this information in the following way (please circle any that are appropriate and provide details about expected audience and format) program/practice evaluation: _____________________________________________________
publication: __________________________________________________________________
poster presentation: ____________________________________________________________
oral presentation: ______________________________________________________________
review of clinical practice: _______________________________________________________
non-published research: ________________________________________________________
other: ______________________________________________________________________

Appendices
66 Perinatal Database Report 2011
____________________________________________________________________________
____________________________________________________________________________
____________________________________________________________________________
____________________________________________________________________________
____________________________________________________________________________
____________________________________________________________________________
3. Other pertinent information (ex: specific variables if known) *For those unfamiliar with the PEI Reproductive Care Perinatal Database variables a review of past published reports or consultation with our program is recommended. ____________________________________________________________________________
____________________________________________________________________________
____________________________________________________________________________
____________________________________________________________________________
____________________________________________________________________________
____________________________________________________________________________
____________________________________________________________________________
____________________________________________________________________________
____________________________________________________________________________
____________________________________________________________________________
____________________________________________________________________________
____________________________________________________________________________
____________________________________________________________________________
____________________________________________________________________________
____________________________________________________________________________
____________________________________________________________________________

Perinatal Database Report 2011 67
5 References

68 Perinatal Database Report 2011

References
Perinatal Database Report 2011 69
1 Statistics Canada (2011) Mean Age of Mother at Time of Delivery (live births), CANSIM Table 102-4504 Canada, provinces and territories, annual. Retrieved May 2013 from: http://www5.statcan.gc.ca/cansim/pick-choisir?lang=eng&p2=33&id=1024504 2 Statistics Canada (2011) Births (Table 102-4005, 102-4501 to 102-4516). Retrieved April 2013 from: http://www.statcan.gc.ca/daily-quotidien/110427/dq110427a-eng.htm 3 Society of Obstetricians and Gynaecologists of Canada Committee Opinion (2012) Delayed Childbearing. Journal of Obstetrics and Gynaecology Canada, 34(1). 4 Canadian Institute for Health Information (2011) In Due Time: Why Maternal Age Matters. Retrieved June 2013 from: http://www.cihi.ca/CIHI-ext-portal/internet/EN/document/factors+influencing+health/environmental/release_15sep11 5 Best Start. Update Report on Teen Pregnancy Prevention. Retrieved May 2013 from: http://www.beststart.org/resources/rep_health/pdf/teen_pregnancy.pdf 6 Chen, X-K., Wen, SW., Fleming, N., Demissie, K., Rhoads, GG., Walker, M. (2007) Teenage pregnancy and adverse birth outcomes: a large population based retrospective cohort study. International Journal of Epidemiology, 36(2). 7 Public Health Agency of Canada (2008) Canadian Perinatal Health Report. Retrieved May, 2013 from : http://www.phac-aspc.gc.ca/publicat/2008/cphr-rspc/index-eng.php 8 Luo, ZC., Wilkins, R., Kramer, MS. The Fetal and Infant Health Study Group of the Canadian Perinatal Surveillance System (2004) Disparities in Pregnancy Outcomes According to Marital and Cohabitation Status. Obstetrics & Gynecology, 2004(103). 9 Human Resources and Skills Development Canada (2013) Indicators of Well-Being in Canada: Health-Obesity. Accessible at http://www4.hrsdc.gc.ca/[email protected]?iid=6 10 Statistics Canada. (2000) Health Risks Classification according to Body Mass Index (BMI). Retrieved May 2013 from: http://www.hc-sc.gc.ca/fn-an/nutrition/weights-poids/guide-ld-adult/cg_quick_ref-ldc_rapide_ref-table1-eng.php 11 Heude,,B., Thiébaugeorges, O., Goua, V., Forhan, A., Kaminski, M., Foliguet, B., Schweitzer, M., Magnin, G., Charles, M., and the EDEN Mother-Child Cohort Study group (2012) Pre-pregnancy body mass index and weight gain during pregnancy: relations with gestational diabetes and hypertension, and birth outcomes. Maternal and Child Health Journal, 16(2).
12 Chung, J., Melsop, K., Gilbert, W., Caughey, A., Walker, C., Main, E. (2012) Increasing pre-pregnancy body mass index is predictive of a progressive escalation in adverse pregnancy outcomes. Journal of Maternal-Fetal and Neonatal Medicine, 25(9).
13 Health Canada (2010) Nutrition Guidelines for Health Professionals: Gestational Weight Gain. Retrieved May 2013 from: http://www.hc-sc.gc.ca/fn-an/nutrition/prenatal/ewba-mbsa-eng.php#a1 14 Public Health Agency of Canada (2009) What Mothers Say: The Canadian Maternity Experiences Survey. Retrieved April 2013 from http://www.phac-aspc.gc.ca/rhs-ssg/pdf/survey-eng.pdf

References
70 Perinatal Database Report 2011
15 Society of Obstetricians and Gynaecologists of Canada Practice Guideline (1998) Guidelines for care during pregnancy and birth. http://sogc.org/clinical-practice-guidelines/ 16 Health Canada (2000) Family-centered maternity care and newborn Care: National Guidelines. Retrieved May 2013 from http://www.phac-aspc.gc.ca/hp-ps/dca-dea/publications/fcm-smp/ 17 Committee on Health Care for Underserved Women/Committee on Obstetric Practice (2012) Smoking Cessation During Pregnancy. American College of Obstetricians and Gynecologists
18 Gaalema, D., Higgins, S., Pepin, C., Heil, S., Bernstein, I. (2013) Illicit Drug Use Among Pregnant Women Enrolled in Treatment for Cigarette Smoking Cessation Nicotine Tobacco. Research, 15(5).
19 Society of Obstetricians and Gynaecologists of Canada Clinical Practice Guideline (2011) Substance Use in Pregnancy. Journal of Obstetrics and Gynaecology Canada, 33(4). 20 Brown, C., Dodds, L., Attenborough, R., Bryanton, J., Rose, A., Flowerdew, G., Langille, D., Lauzon, L., Semenic S. (2013) Rates and Determinants of Exclusive Breastfeeding in first 6 months among women in Nova Scotia: a population-based cohort study. Canadian Medical Association Journal. Accessible at http://www.cmajopen.ca/content/1/1/E9.full 21 Society of Obstetricians and Gynaecologists of Canada Clinical Practice Guideline (2010) Alcohol Use and Pregnancy Consensus Guidelines. Journal of Obstetrics and Gynaecology Canada, 32(8). 22 CanFASD (2013) FASD Fact Sheet Accessible from http://www.canfasd.ca/press-centre/fasd-fact-sheet/ 23 Bhuvaneswar, c., Chang, g., Epstein, L., Stern, T. (2007) Alcohol Use During Pregnancy: Prevalence and Impact. Primary Care Companion, Journal of Clinical Psychiatry, 9(6). 24 Bryanton, J., Bigsby, K., Boswall, D., Gareri, J., McCarthy, MJ., Fraser, B., Walsh, D., Freeman, B. (2012) PEI Meconium Study: The Incidence of Prenatal Alcohol Exposure on PEI. Invited presentation at the Public Health Agency of Canada & Atlantic Intergovernmental FASD Partnership roundtable, PEI Women’s Health and Substance Use in Pregnancy. Charlottetown, PEI. 25 Kulaga, V., Shor, S., Koren, G. (2010) Correlation between drugs of abuse and alcohol by hair analysis. Alcohol, 44(7).
26 Prenatal Exposure to Drugs of Abuse (2011) National Institute on Drug Abuse. Accessible from: http://www.drugabuse.gov/publications/topics-in-brief/prenatal-exposure-to-drugs-abuse 27 Kaiser, M., Hays, B. (2005) Health-risk behaviors in a sample of first-time pregnant adolescents. Public Health Nursing, 22(6).
28 Alapati, S., Hale, T. (2012) Effects of Marijuana on the Fetus and Breastfeeding Infants. Infant Risk Centre. Accessible at http://www.infantrisk.com/content/effects-marijuana-fetus-and-breastfeeding-infants 29 National Library of Medicine LactMed Database (2013) Cannabis. Accessible at http://toxnet.nlm.nih.gov/cgi-bin/sis/search/f?./temp/~uwvH7d:1 30 Ohlsson, A., Shah, P. (2008). Determinants and Prevention of Low Birth Weight: A Synopsis of the Evidence Institute of Health Economics.

References
Perinatal Database Report 2011 71
31 Robson, M. (2001) Can we reduce the caesarean section rate? Best Practice & Research Clinical Obstetrics & Gynaecology, 15(1). 32 British Columbia Perinatal Health Program (2010) Perinatal Health Report 2008. Retrieved May 2013 from: http://www.health.gov.bc.ca/public-health/core-programs/health-improvement/reproductive-health/health-status-data.html 33 Health Indicators (2013) Canadian Institute for Health Information. Retrieved April 2013 from: https://secure.cihi.ca/free_products/health_indicators_2012_en.pdf 34 Society of Obstetricians and Gynaecologists of Canada Clinical Practice Guideline (2008) Guidelines for the management of pregnancy at 41+0 to 42+0 weeks. Journal of Obstetrics and Gynaecology Canada, 30(9). 35 Glantz, J., Thornburg, L., Vardp, J. (2011) Maternal and Neonatal Morbidity Among Nulliparous Women Undergoing Elective Induction of Labor. Journal of Reproductive Medicine, 56(1-2). 36 Giving Birth in Canada (2012) Canadian Institute for Health Information, Highlights of 2010–2011 Selected Indicators Describing the Birthing Process in Canada https://secure.cihi.ca/free_products/Childbirth_Highlights_2010-11_EN.pdf 37 Joseph, K., Young, D., Dodds, L., O’Connell, C., Allen, V., Chandras, S., Allen, A., (2003) Changes in maternal characteristics and obstetrical practice and recent increases in primary Cesarean delivery. Obstetrics & Gynaecology, 102(791). 38 Denk, C., Kruse, L., Jain, N., (2006) Surveillance of Cesarean section deliveries, New Jersey, 1999-2004. Birth, 33(203). 39 Brennan, D., Robson, M., Murphy, M., O’Herlihy, C., (2009) Comparative analysis of international cesarean delivery rates using 10-group classification identifies significant variation in spontaneous labor. American Journal of Obstetrics & Gynecology 201(3). 40 Torloni, M., Betran, A., Souza, J., Widmer, M., Allen, T., Gulmezoglu, M., Merialdi, M., (2011) Classifications for Cesarean Section: A Systematic Review. PLoS ONE: January 2011: e14566. 41 Society of Obstetricians and Gynaecologists of Canada Maternal Fetal Medicine Committee Opinion (2012) Classification of Caesarean Sections in Canada: The Modified Robson Criteria, Journal of Obstetrics and Gynaecology Canada, 34(10). 42 Perinatal Services BC. Data & Surveillance. Retrieved May 2013 from http://www.perinatalservicesbc.ca/DataAndSurveillance/Surveillance/default.htm 43 Allen, V., Baskett, T., O’Connell, C. (2010) Contribution of select maternal groups to temporal trends in rates of Caesarean section. Journal of Obstetrics & Gynaecology Canada, 32(633). 44 Society of Obstetricians and Gynaecologists of Canada Clinical Practice Guideline (2005) Guidelines for Vaginal Birth after Previous Caesarean Birth. Journal of Obstetrics and Gynaecology Canada, 27(2). 45 Canadian Perinatal Program Coalition (2011). Exploring Caesarean Births – A second look using the Robson 10 group classification. June. 46 Health Canada (2004) Special Report on Maternal Mortality and Severe Morbidity in Canada — Enhanced Surveillance: The Path to Prevention.
References
72 Perinatal Database Report 2011
47 Schurmans, N., Senikas, V., LaLonde, A. (2009) Healthy Beginnings 4th Edition. John Wiley & Sons Canada. 48 Pound, C., Unger, S., (2012) The Baby-Friendly Initiative: Protecting, Promoting and Supporting Breastfeeding, Canadian Paediatric Society. Paediatric Child Health,17(6). 49 Statistics Canada (2013) Table 102-4509 - Live births, by birth weight and sex, Canada, provinces and territories, annual. Retrieved April 2013 from http://www5.statcan.gc.ca/cansim /a05?lang=eng&id=1024509 50 Statistics Canada (2013) Components of population growth, Canada, provinces and territories, annual (persons). Retrieved April 2013 from http://www5.statcan.gc.ca/cansim/pick-choisir?lang=eng&p2=33&id=0510004 51 Kramer, MS., Morin, I., Yang, H., Platt, RW., Usher, R., McNamara, H., et al. (2002) Why are babies getting bigger? Temporal trends in fetal growth and its determinants. Journal of Pediatrics, 141(4). 52 Human Resources and Skills Development Canada (2013) Indicators of Well-Being in Canada: Health-Low Birth Weight. Accessible at http://www4.hrsdc.gc.ca/[email protected]?iid=4 53 Health Canada, (2012) Nutrition for Healthy Term Infants: Recommendations from Birth to Six Months. Retrievable from http://www.hc-sc.gc.ca/fn-an/nutrition/infant-nourisson/recom/index-eng.php 54 Public Health Agency of Canada. (2009) 10 Valuable Tips for Breastfeeding. Retrievable from: http://www.phac-aspc.gc.ca/hp-ps/dca-dea/stages-etapes/childhood-enfance_0-2/nutrition/pdf/tips-cons-eng.pdf 55 Health Canada (2009-2010) Food and Nutrition, Breast Feeding Initiation in Canada: Key Statistics and Graphics. Retrieved April 2013 from: http://www.hc-sc.gc.ca/fn-an/surveill/nutrition/commun/prenatal/initiation-eng.php#a2 56 US Department of Health and Human Services (2011) The Surgeon General’s Call to Action to Support Breastfeeding. Office of the Surgeon General. Accessed June 2013 from http://www.surgeongeneral.gov/library/calls/breastfeeding/calltoactiontosupportbreastfeeding.pdf 57 Prince Edward Island Government, Department of Health and Wellness (2012) Breastfeeding Policy. 58 Breastfeeding Committee for Canada: the National Authority for the Baby-Friendly Initiative: Who Benefits from Baby-Friendly? Accessible at http://breastfeedingcanada.ca/BFI.aspx 59 Chief Public Health Office of the Department of Health and Wellness (2012) Promote, Prevent, Prevent- PEI Chief Public Health Officer’s Report and Health Trends 2012. Accessible from http://www.gov.pe.ca/health/index.php3?number=1042233&lang=E 60 Health Canada (2012) Breastfeeding Practices in Canada: Overview. Retrieved May 2013 from http://www.hc-sc.gc.ca/fn-an/surveill/nutrition/commun/prenatal/overview-apercu-eng.php 61 Kim, JH., Unger, H. (2010) Human Milk Banking. Paediatric Child Health NG 2010-01. 62 Min, J., Yuzpe, A., Greene, C., Leveille, M., Bissonnette, F., Collins, J., Hughes, E., Cook, J. (2009) Prevention of Multiples Births Associated with Infertility Treatments: A Canadian Framework. Accessible at: http://www.docstoc.com/docs/81489819/Prevention-of-Multiple-Births-Associated-with-Infertility

References
Perinatal Database Report 2011 73
63 Public Health Agency of Canada (2012) Perinatal Health Indicators for Canada 2011. Available by request from http://www.phac-aspc.gc.ca/rhs-ssg/phi-isp-2011-eng.php 64 Government of PEI (2010) Vital Statistics Act. April 2013: http://www.gov.pe.ca/law/statutes/pdf/v-04_01.pdf?PHPSESSID=a37482661d3e6fdf84d32273b8de713e

