database managing using ms excel and ms access: brief
TRANSCRIPT

1 The workbook was compiled by A.O.Chepok, PhD in Solid State Phys., MSc in Comp. Sci., 2013
Database Managing using MS Excel and MS Access:
brief Theory and Laboratory Manual
Table of Contents
Contents of the Manual is organized as follows:
Chapter I t e m page
Introduction: Using Database Technology in Engineering …………………………………. 1
Chapter 1 On Database Models …………………………………………………………. 3
Chapter 2 Databases with MS Excel: step by step Database Tutorial …………………... 5
Chapter 3 Managing Databases with MS Access ……………………………………….. 12
Chapter 4 Basics of SQL queries ………………………………………………………... 29
Appendix A …………………………………………………………………… 32
Appendix B …………………………………………………………………… 34
Appendix C …………………………………………………………………… 37
Appendix D …………………………………………………………………... 41
Apps:
Appendix E …………………………………………………………………… 48
Additional sources
Internet sources ……………………………………………………………….. 56
Introduction : Using Database Technology in Engineering
The use of database technology in the engineering computing environment differs from tradi-
tional data processing. Many database features developed for the more traditional applications can be
transferred to the engineering environment. Some of these features take on new meaning, but many are
only viewed from a different perspective in engineering applications. Engineering applications impose
unique requirements on, but also can particularly benefit from, the following aspects of database tech-
nology:
� data representation;
� change management;
� cooperative processing.

2 The workbook was compiled by A.O.Chepok, PhD in Solid State Phys., MSc in Comp. Sci., 2013
The initial application of database technology to the engineering computing environment solves
some of the simpler needs of engineering applications. Database management systems provide data
representation capabilities that decouple the logical format for data representation from an inflexible
file format. In this sense the database becomes a persistent data store which alleviates the need for each
application to parse a file into the program’s internal data structures.
The sophisticated data representation capabilities needed to support engineering systems have
only recently emerged in database systems. Engineering data contains complex interrelations and data
types for which general purpose support has not been available until recently. The typical engineering
application involves highly structured data and navigation of these structures is a more common opera-
tion than repeated processing of a single data structure. The more recent approaches to data representa-
tion provide a platform for direct expression and encoding of the rich semantics of data with respect to
representation and constraints. Techniques for data representation which are particularly suitable for
engineering are described in the section on the nature of engineering data.
Strategies for applying database technology to the broader category of needs for the entire en-
gineering computing environment are also emerging. These strategies address the coordination of the
evolution of a product’s development throughout its life-cycle. The introduction of database technol-
ogy into engineering processes can provide the opportunity to improve the entire way of doing busi-
ness for many industries. The technology is a key enabling factor for future directions in engineering
and manufacturing automation and it is essential for concurrent engineering, flexible manufacturing,
and enterprise integration.
Changes within the engineering environment are an inherent part of the engineering process. As
a product is being developed, information needs are evolving along with it. Managing those changes is
a crucial service that can be supported by a database management system. A reliable change manage-
ment system is essential for reducing the time needed to engineer and manufacture a quality product.
Database support for managing the changes within the environment are described in the section on
managing changes.
The remainder of this article discusses the relevance of database technology in engineering ap-
plications as outlined above. Database technology is useful for all types of engineering applications.
As the engineering computing environment increasingly grows more complex, the use of database
technology will play a more significant role in the engineering process than is the practice today.
The database's functionality is optimal storage and retrieval of data, maintain correctness of the
data, and maintaining consistency of the system at all times.

3 The workbook was compiled by A.O.Chepok, PhD in Solid State Phys., MSc in Comp. Sci., 2013
Chapter 1. On Database Models
(Brief classification based on Data Modeling)
1.1. Hierarchical Model:
In a hierarchical model data is represented as having a parent-child relationship among each
other and is organized in a tree-like structure. The organization of data enforces a structure according
the rule: “A Parent can have many Children but a Child can have only one Parent”. Thus, this model
inherently forces repetitions of data at the child levels. The records have 1:N or more generally a
"one–to–many" relationship between them. This was one of the first data base models to be used and
implemented in IBM's Information Management System (IMS). Hierarchical model was the most in-
tuitive way to represent real-world data but was not the most optimal one. This model was later re-
placed by a more efficient and optimal model called the “Relational Model” that we shall discuss next .
Fig. 1 : The structure of the hierarchical data model
1.2. Network Model:
The network model can be seen as a generalization of the hierarchical model. In this model,
each data object can have multiple parents and each parent object can have multiple children. This the
network model forms a "lattice-type" structure in contrast to the "tree-like structure" of the hierarchical
model. The network model represents real-world data relationship more naturally and under less con-
strained environment than the hierarchical model.
Fig. 2 : The structure of the network data model

4 The workbook was compiled by A.O.Chepok, PhD in Solid State Phys., MSc in Comp. Sci., 2013
1.3. Relational Model:
The Relational Model was formulated by Edgar Codd and is one of the most influential model
that has governed the implementation of some of the best known Database systems. The model is
based on "first order predicate logic". In a representation such as A = {x| )(xP }, )( xP is the predicate
that makes a descriptive statement about the elements of set A, such as "All positive integers less than
1000" results in a set A = {1, ..., 999}. So, a predicate maps an "entity" to a "truth table". In the above
example, 'x' is an entity and )(xP is a mapping which determines whether 'x' belongs to set A or not.
Now, suppose that we have a huge domain and we need to make some statements that apply selec-
tively to some or all members in the domain. The formal language that allows us to make such a state-
ment is called "first order logic". In first order logic statements, a predicate either takes the role of a
defining the "property" of an entity or the "relationship between entities". Further and in-depth descrip-
tion on the mathematical foundations of the relational model is beyond the scope of the present work.
So, in the relational model, data is represented using a set of predicates over a finite set of vari-
ables that model the belongingness of certain values to a certain sets and the constraints that apply on
them. The relational model, owing to its strong foundations in mathematical formal logic is extremely
powerful in representation and at the same time efficient in terms of storage requirements (by remov-
ing redundancies due to repeated data) and also speed of retrieval/storage.
1.4. Object-Relational Model:
The Object-Relational Model is similar to the relational model except for additions of object-
oriented concepts in modeling. The data modeling is done using relational concepts while the object-
oriented concepts facilitate complex modeling of the data and its relationship with the methods of ma-
nipulation/retrieval and storage. This is one of the newer and more powerful models of all the models
discussed in this section.
There are lots of other models classifying databases based on the object-models such as Semi-
structure Model, Associative Model, Entity-Attribute-Value Model etc., but a detailed study of each of
these is beyond the present scope. The aim of the above classification was to attain a minimal under-
standing that would help us appreciate the design of performance analysis methods for Databases.

5 The workbook was compiled by A.O.Chepok, PhD in Solid State Phys., MSc in Comp. Sci., 2013
Chapter 2. Databases with Microsoft Excel: step by step Database Tutorial
2.1. About Excel of Microsoft Office Suit
Description: Excel is an electronic spreadsheet program whose options for manipulating num-
bers have made it the most popular spreadsheet program in the world. Its widespread use makes it easy
to exchange files with almost anyone, or to display information in printed form. Because it is part of
the Microsoft Office Suite, it can easily exchange data with that suite's database, word processing and
presentation program.
MS Excel has the basic features of all spreadsheets, using a grid of cells arranged in numbered
rows and letter-named columns to organize data manipulations like arithmetic operations. It has a bat-
tery of supplied functions to answer statistical, engineering and financial needs. In addition, it can dis-
play data as line graphs, histograms and charts, and with a very limited three-dimensional graphical
display. It allows sectioning of data to view its dependencies on various factors for different perspec-
tives (using pivot tables and the scenario manager). It has a programming aspect, Visual Basic for Ap-
plications (VBA), allowing the user to employ a wide variety of numerical methods, for example, for
solving differential equations of mathematical physics, and then reporting the results back to the
spreadsheet. It also has a variety of interactive features allowing user interfaces that can completely
hide the spreadsheet from the user, so the spreadsheet presents itself as a so-called application, or deci-
sion support system (DSS), via a custom-designed user interface, for example, a stock analyzer, or in
general, as a design tool that asks the user questions and provides answers and reports. In a more
elaborate realization, an Excel application can automatically poll external databases and measuring
instruments using an update schedule, analyze the results, make a WORD report or POWER POINT
slide show, and e-mail these presentations on a regular basis to a list of participants.
Popularity of Excel : Excel gained momentum with the release of Windows 3.1 in 1992. This
was also the first time Excel was included in Microsoft Office Suit. Since the release of Excel 4 in
1992, the program has gone through major upgrades and has been available for Windows and Mac op-
erating systems.
2.2. Four Basic Uses of MS Excel
Calculations: You can set the calculations and formulas between variables only once. These
numbers change automatically when you change a value, making it easy to try “what–if ”-scenarios.
Data: You can sort and filter data for easy analysis. The powerful and convenient Conditional
Formatting tool allows you to highlight information that meets certain criteria.
Charts: Excel allows to create many figures by displaying them as a colorful chart. You have
full control over the color and appearance of bar graphs, pie charts and line charts.

6 The workbook was compiled by A.O.Chepok, PhD in Solid State Phys., MSc in Comp. Sci., 2013
Programming: In order to automate complicated entries and procedures you can use the built-in
Visual Basic for Applications program language (VBA ) to show dialog boxes, forms and button that
process data with one click.
2.3. MS Excel as an Electronic Spreadsheet Program
A Spreadsheet? What does it mean? – A spreadsheet is an interactive computer application pro-
gram for organization and analysis of information in tabular form. Spreadsheets developed as comput-
erized simulations of paper accounting worksheets. The program operates on data represented as cells
of an array, organized in rows and columns. Each cell of the array can contain either numeric or text
data, or the results of formulas that automatically calculate and display a value based on the contents of
other cells.
The user of any spreadsheet can make changes in any stored value and observe the effects on
calculated values. Modern spreadsheet software can have multiple interacting sheets, and can display
data either as text and numerals, or in graphical form.
In addition to the fundamental operations of arithmetic and mathematical functions, modern
spreadsheets provide built-in functions for common financial and statistical operations. Such calcula-
tions as net present value or standard deviation can be applied to tabular data with a pre-programmed
function in a formula. Spreadsheet programs also provide conditional expressions, functions to convert
between text and numbers, and functions that operate on strings of text.
Spreadsheets have now replaced paper-based systems throughout the business world. Although
they were first developed for accounting or bookkeeping tasks, they now are used extensively in any
context where tabular lists are built, sorted, and shared.
Excel is a software program capable of creating and editing spreadsheets. For example, with a
spreadsheet you could create your own payroll, balance your check book, organize a large amount of
data in an easy to read format, and much more. This is done by adding, subtracting, multiplying, and
dividing the values in the spreadsheet to view overall totals and create graphs based on that data.
So, MS Excel can be used for storing, organizing and manipulating data. When you look at the
Excel screen (see Fig.1) you see a rectangular table or grid of rows and columns. The horizontal rows
are identified by numbers (1,2,3,…) and the vertical columns with letters of the alphabet (A,B,C,…).
For columns beyond 26, columns are identified by two or more letters such as AA , AB, AC.
The intersection point between a column and a row is a small rectangular box known as a cell. A
cell is the basic unit for storing data in the spreadsheet. Because an Excel spreadsheet contains thou-
sands of these cells, each is given a cell reference or address to identify it. The cell reference is a com-
bination of the column letter and the row number such as A3, B16, AA345 and so on.

7 The workbook was compiled by A.O.Chepok, PhD in Solid State Phys., MSc in Comp. Sci., 2013
The data in a spreadsheet is entered into each of the cells, and some cells may also contain for-
mulas for the processing of data from other cells.
The types of data that a cell can hold include numbers, text or formulas. Just as in math class,
formulas are used for calculations usually involving data contained in other cells. Excel and other elec-
tronic spreadsheets include a number of built in formulas used for common tasks known as functions.
2.4. Excel is the powerful Multipurpose tool for various Data processing
Spreadsheets are often used to store various data. Formulas and functions that are used on this
type of data include:
� Performing basic mathematical operations such as summing columns and rows of figures.
� Finding values such as profit or loss.
� Calculating repayment plans for loans or mortgages.
� Finding the average, maximum, or minimum values in a specified range of data.
Fig.3 : general look of Microsoft Excel 2010 spreadsheet, a component of MS Office 2010
Other common operations that Excel can be used for include:
� graphing or charting data to assist users in identifying data trends.
� sorting and filtering data to find specific information.
The information gathered in a spreadsheet can easily be incorporated into electronic presenta-
tions, web pages, or printed off in report form.
So, we can assert the fact that one can hold properly four important things, such as:

8 The workbook was compiled by A.O.Chepok, PhD in Solid State Phys., MSc in Comp. Sci., 2013
� Varied Data Documenting
One of the primary uses of Excel is for documenting a business or organization's financial bal-
ances and transactions. Documenting such transactions enables a business to maintain financial records
in a clear and organized manner. This allows for easier accounting, printing and sharing of accounting
documents.
� Powerful Tool for Analysis and Reports
Excel also is widely used for various data analysis. The data recorded in spreadsheets can be
calculated and compared for a business or organization to better understanding through analysis of its
varied data using Excel's tools.
One’s reporting is another experience of the primary uses of Excel. Yearly, monthly and daily
financial reports can be made to present a company's earnings. Using an advanced reporting feature,
such as a financial calendar featuring annual, monthly and daily earnings data, can be a highly efficient
way of conveying data to investors and executives in an organization.
� Charting of Data
The charting of any kinds data is another primary use of Excel. The application features many
ways to display data using various kinds of colored graphics for representing amounts and other val-
ues. There are line charts, pie charts, area charts, and many other kinds of charts available in Excel.
The application is used by many organizations for graphical charting of financial and statistical data to
better understand data in a visual manner.
2.5. Advantages of Microsoft Excel
As the industry standard for spreadsheet software, Microsoft Excel comes with many advantages
to the new user or the user transitioning from another spreadsheet package. Over several decades, Mi-
crosoft has updated, expanded and adjustable Excel to keep up with both modern technology and the
needs of spreadsheet users. Here are a few of the advantages of using Microsoft Excel.
Compatibility with other Excel Users
Excel users rarely need to worry about file compatibility when sending or receiving spreadsheets
to or from colleagues. Due to the extraordinary popularity of Microsoft Excel, Excel users seldom
need to worry about converting a spreadsheet to a different format.
Compatibility with other Data Manipulation Software
Again due to Excel's popularity, Excel spreadsheets can be inserted, viewed, imported or ma-
nipulated from within a variety of other popular software applications, from other Microsoft Office
products to third-party accounting and tracking programs.

9 The workbook was compiled by A.O.Chepok, PhD in Solid State Phys., MSc in Comp. Sci., 2013
Beyond the extensive help documentation included within MS Excel, users can also find many
resources for help online, in libraries and in bookstores in the form of free tutorials, walk-through vid-
eos, support forums and comprehensive guides and how-to books.
Powerful Customization
Although these features are rarely seen by most users, Microsoft Excel offers tremendous cus-
tomization through macros and Visual Basic add-ons, for those users with specific needs and pro-
gramming experience.
Ease of Use
Excel is also widely considered to be one of the most easily accessible spreadsheet programs,
with instinctive design, simple point-and-click functionality and helpful wizards to guide new users
through the more complicated processes.
2.6. Microsoft Excel Database Files
At times, we need to keep track of information and a good place to this is in an Excel database
file. Whether it is a personal list of phone numbers, a contact list for members of an organization or
team, or a collection of coins, cards, or books, an Excel database file makes it easy to enter, store, and
find specific information.
Microsoft Excel has built it tools to help you keep track of data and to find specific information
when you want it. As well, with its hundreds of columns and thousands of rows, an Excel spreadsheet
can hold an enormous amount of data.
The main steps in this tutorial are:
� Entering the Data – How data is stored
� Entering Data Correctly – How to avoid common errors
� Rows are Records, Columns are Fields – Organizing your data
� Creating the Table – Creating the database
� Using the Database Tools – Sorting and Filtering data
� Expanding the Database – Adding new records
� Completing the Database Formatting – Formatting the title and cell color
2.7. Data Definition and Entering Data in Excel
Definition: Data is information that is stored in any spreadsheet program such as Excel. Data is
stored in cells in a worksheet. Generally, each cell holds a single item of data. In addition to being
stored in the spreadsheet, the data can be used in calculations, displayed in graphs, or sorted and fil-
tered to find specific information.

10 The workbook was compiled by A.O.Chepok, PhD in Solid State Phys., MSc in Comp. Sci., 2013
Types of data in Excel : Generally speaking, data type refers to the characteristics of the infor-
mation stored in a worksheet cell. The two types of data most commonly used in spreadsheet programs
are text and numbers.
Text data is usually words that are used for worksheet headings, names, and labels for identify-
ing columns of data. Text data can contain letters numbers, and special characters such as ! or & . By
default, text data is left aligned in a cell.
Numbers can be used in calculations. By default, numbers are right aligned in a cell.
In addition to actual numbers – such as 10, 20, 30, 40 – Excel also stores dates and times as
numbers. Problems can arise if numbers get stored as text data. This can prevent them from being used
in calculations.
Formulas: a formula is a mathematical equation such as adding or subtracting two numbers.
Formulas, which include spreadsheet functions, are usually considered to be Numbers but they are
sometimes identified as a separate type of data.
Using AutoComplete to Enter Data
Excel’s AutoComplete feature is intended to simplify the task of data entry. When entering la-
bels down a column, if you begin typing text that has previously been entered, Excel will display a
black box containing the previous entry in the cell you are entering data into.
If you want to reenter the same text, press the Enter key and Excel enters the text for you. If you
are entering a different word continue typing and the AutoComplete box will go away.
Limitations of AutoComplete are:
� It only works for data being entered in columns – it will not work if you are entering text across
a row.
� It only works for columns of continuous data. As soon as an empty cell is left in a column,
AutoComplete is interrupted.
Turning Off AutoComplete
If you do not want to use the AutoComplete feature: Click on Tools →→→→ Options in the menus to
bring up the Options dialog box.
Click on the Edit tab
Remove the checkmark from the Enable AutoComplete for cell values option box.
Cells and cell references in Excel
Cell Facts
� Data is stored in cells in an Excel spreadsheet.

11 The workbook was compiled by A.O.Chepok, PhD in Solid State Phys., MSc in Comp. Sci., 2013
� Each small rectangle in a spreadsheet is a cell.
� A cell is the intersection point of a column and a row.
Column and Row Facts
� Columns run vertically in a spreadsheet and are identified by a letter.
� Rows run horizontally and are identified by a number.
� There are 65,536 rows, 256 columns, and over 16 million cells in a worksheet.
Cell Reference Facts
� To keep track of all these cells, each cell has a cell reference or address.
� A cell reference is a combination of the column letter and the row number.
� The active cell reference is shown in the name box above column A.
12 The workbook was compiled by A.O.Chepok, PhD in Solid State Phys., MSc in Comp. Sci., 2013
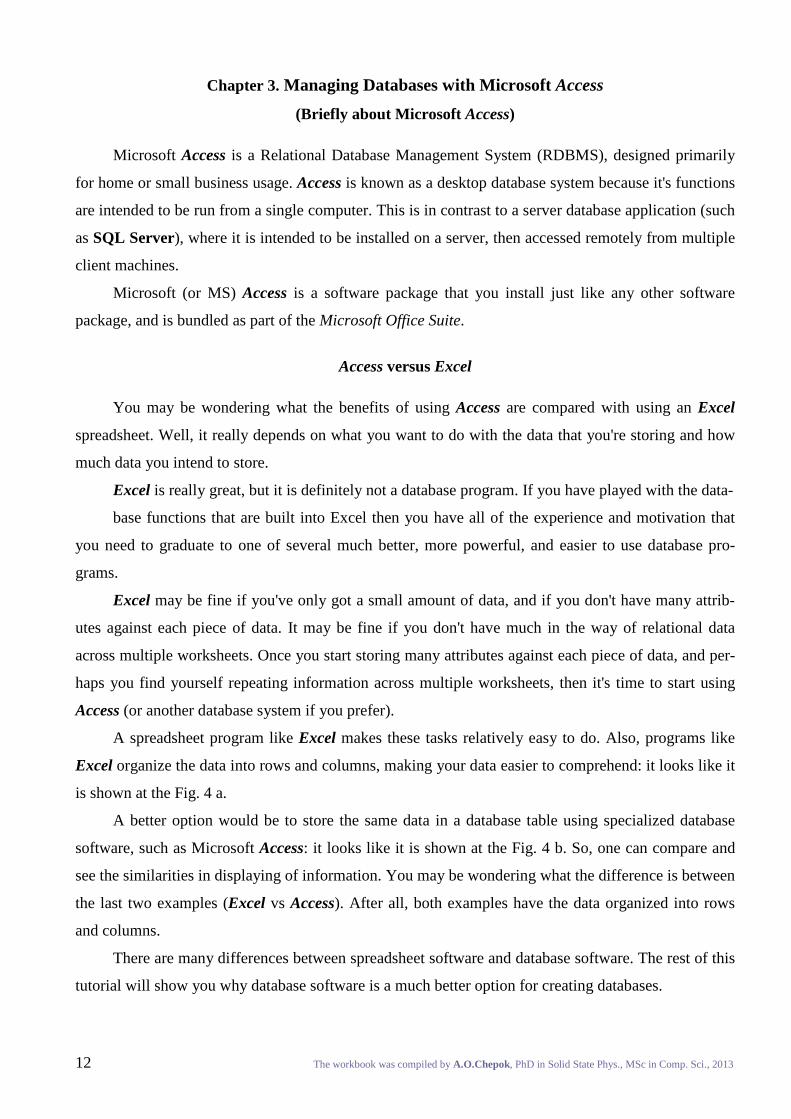
Chapter 3. Managing Databases with Microsoft Access
(Briefly about Microsoft Access)
Microsoft Access is a Relational Database Management System (RDBMS), designed primarily
for home or small business usage. Access is known as a desktop database system because it's functions
are intended to be run from a single computer. This is in contrast to a server database application (such
as SQL Server), where it is intended to be installed on a server, then accessed remotely from multiple
client machines.
Microsoft (or MS) Access is a software package that you install just like any other software
package, and is bundled as part of the Microsoft Office Suite.
Access versus Excel
You may be wondering what the benefits of using Access are compared with using an Excel
spreadsheet. Well, it really depends on what you want to do with the data that you're storing and how
much data you intend to store.
Excel is really great, but it is definitely not a database program. If you have played with the data-
base functions that are built into Excel then you have all of the experience and motivation that
you need to graduate to one of several much better, more powerful, and easier to use database pro-
grams.
Excel may be fine if you've only got a small amount of data, and if you don't have many attrib-
utes against each piece of data. It may be fine if you don't have much in the way of relational data
across multiple worksheets. Once you start storing many attributes against each piece of data, and per-
haps you find yourself repeating information across multiple worksheets, then it's time to start using
Access (or another database system if you prefer).
A spreadsheet program like Excel makes these tasks relatively easy to do. Also, programs like
Excel organize the data into rows and columns, making your data easier to comprehend: it looks like it
is shown at the Fig. 4 a.
A better option would be to store the same data in a database table using specialized database
software, such as Microsoft Access: it looks like it is shown at the Fig. 4 b. So, one can compare and
see the similarities in displaying of information. You may be wondering what the difference is between
the last two examples (Excel vs Access). After all, both examples have the data organized into rows
and columns.
There are many differences between spreadsheet software and database software. The rest of this
tutorial will show you why database software is a much better option for creating databases.

13 The workbook was compiled by A.O.Chepok, PhD in Solid State Phys., MSc in Comp. Sci., 2013
Fig. 4 a: The small piece of common database as it commonly looks in Excel
Another important reason for using Access over Excel is, if you need to generate a lot of queries
and reports. Access is much better suited for doing this compared to Excel.
Microsoft Access Database File Extension
When you create (and save) a database in Microsoft Access, the database is saved with a .mdb
extension. This is the file extension you will use the most, when developing Access databases. Once
you've established your database, you also have the option of saving it as an MDE file, which gives
you some benefits over the MDB file. An MDE file uses a .mde extension.
Fig. 4 b: The same piece of the database as it commonly looks in Access

14 The workbook was compiled by A.O.Chepok, PhD in Solid State Phys., MSc in Comp. Sci., 2013
Microsoft Access: brief “as it used” Tutorial
Fig. 5 : The main Access view after opening it up
This is the main screen you'll see when opening up Access to view an existing database. The
outer part is the database management system and it's menu, the middle part is the actual database. In
this example, the database is called "dateSite" and has 20 tables. If you were to open a different data-
base, the name of the database would be different and you would see different tables, but the available
options would be the same (i.e. Tables, Queries, Forms, Reports, Macros, Modules, Open, Design,
New).
Some of these options are common across all database management systems. All database sys-
tems allow you to create tables, build queries, design a new database, and open an existing database.

15 The workbook was compiled by A.O.Chepok, PhD in Solid State Phys., MSc in Comp. Sci., 2013
Microsoft SQL Server
Fig. 6 : Microsoft SQL Server display view
Microsoft SQL Server is a more robust database management system than Access. While Ac-
cess is better suited to home and small office use, SQL Server is more suited to enterprise applications
such as corporate CRMs and websites etc (see Fig. 6).
The above screen is what you see when you open SQL Server through Enterprise Manager. En-
terprise Manager is a built-in tool for managing SQL Server and its databases. In this example, there
are 6 databases. Each database is represented down the left pane, and also in the main pane (with a
"database" icon).
16 The workbook was compiled by A.O.Chepok, PhD in Solid State Phys., MSc in Comp. Sci., 2013
Which Database System to Use?
If you are using a database for home or small office use, MS Access or Filemaker should be
fine. If you need to create a database driven website, then you're better off using a more robust system
such as SQL Server, Oracle, or MySQL.
The examples in this tutorial use MS Access. If you don't have Access, you should still be able
to follow the examples. The tasks we perform are the same tasks you would need to perform regardless
of which database management system you use. The key goal with this tutorial is to provide you with
an overview of what is involved in creating and maintaining a database.
Creating a Database
With database management systems, many tasks can be done either via programatically or a
user interface. Creating databases is no exception.
Option 1: Programatically
Many database administrators (DBAs) use Structured Query Language (SQL) to perform many
of their database tasks. To enter SQL, you need to open an interface that allows you to enter your code.
For example, if you use SQL Server, you would normally use Query Analyzer. The following example
is the basic code for creating a new database. Parameters can be added to this example if your re-
quirements are more specific.
Note: This example assumes you know how to use your database system to run scripts like this.
If you don't you, will probably find it easier to use the user interface method (below).
Option 2: User Interface
Most database systems make it very easy to create a database via a user interface. Generally,
it's just a matter of selecting an option from a menu, then providing a name for your database. The fol-
lowing examples demonstrate how to create a database in Microsoft Access.
1. From the "File" menu, click on "New Database":

17 The workbook was compiled by A.O.Chepok, PhD in Solid State Phys., MSc in Comp. Sci., 2013
2. Choose "Blank Database" (MS Access also gives you the ability to choose from a template,
but we'll just use a blank database here):
3. Choose a location to save the database:

18 The workbook was compiled by A.O.Chepok, PhD in Solid State Phys., MSc in Comp. Sci., 2013
Your New Database
Once you've completed the above tasks, you should see a blank database, like this:
We know this database is blank because it doesn't have any tables. If it did, you would see
these tables in the middle pane of the table tab. Now that we have our blank database, we can start add-
ing some tables.

19 The workbook was compiled by A.O.Chepok, PhD in Solid State Phys., MSc in Comp. Sci., 2013
1. About Database Tables
Database tables will most likely be the area you'll become most familiar with after working
with databases for a while. Now, before we go ahead and start adding tables to our new database, let's
have a look at what a database table actually is.
What is a Table?
In database terms, a table is responsible for storing data in the database. Database tables consist
of rows and columns. In the following example, the second row is highlighted in black:
In the next example, the second column is highlighted in black. This column has been given a
name of "FirstName":

20 The workbook was compiled by A.O.Chepok, PhD in Solid State Phys., MSc in Comp. Sci., 2013
A row contains each record in the table, and the column is responsible for defining the type of
data that goes into each cell. Therefore, if we need to add a new person to our table, we would create a
new row with the person's details. OK , now lets go ahead and create a table.
2. Creating Database Tables
With database management systems, you need to create your tables before you can enter data.
Just as you can create a database programatically, you can create your tables programatically too.
Option 1: Programatically
The following is an example of creating a new table. Note that we are specifying the name of
the table, the name of each column, and the data type of each column. More parameters can be added
to this example if your requirements are more specific.
Option 2: User Interface
Database management systems usually have a "Design View" for creating tables. Design view
enables you to create the names of each column, specify the type of data that can go into each column,
as well as specifying any other restrictions you'd like to enforce. Restricting the data type for each col-
umn is very important and helps maintain data integrity. For example, it can prevent us from acciden-
tally entering an email address into a field for storing the current date.
More parameters can be added against each column if you require them. For example, you
could specify a default value to be used (in case the field has been left blank by the user). When you
create a table via the user interface (or design view), depending on which database system you use,
you should see something like this:
Code
CREATE TABLE Individual(IndividualId int,FirstName Varchar(255),LastName Varchar(255),

21 The workbook was compiled by A.O.Chepok, PhD in Solid State Phys., MSc in Comp. Sci., 2013
Once you've created your table in "design view", you can switch to "datasheet view" to see the
resulting table. You should see something like this:
22 The workbook was compiled by A.O.Chepok, PhD in Solid State Phys., MSc in Comp. Sci., 2013
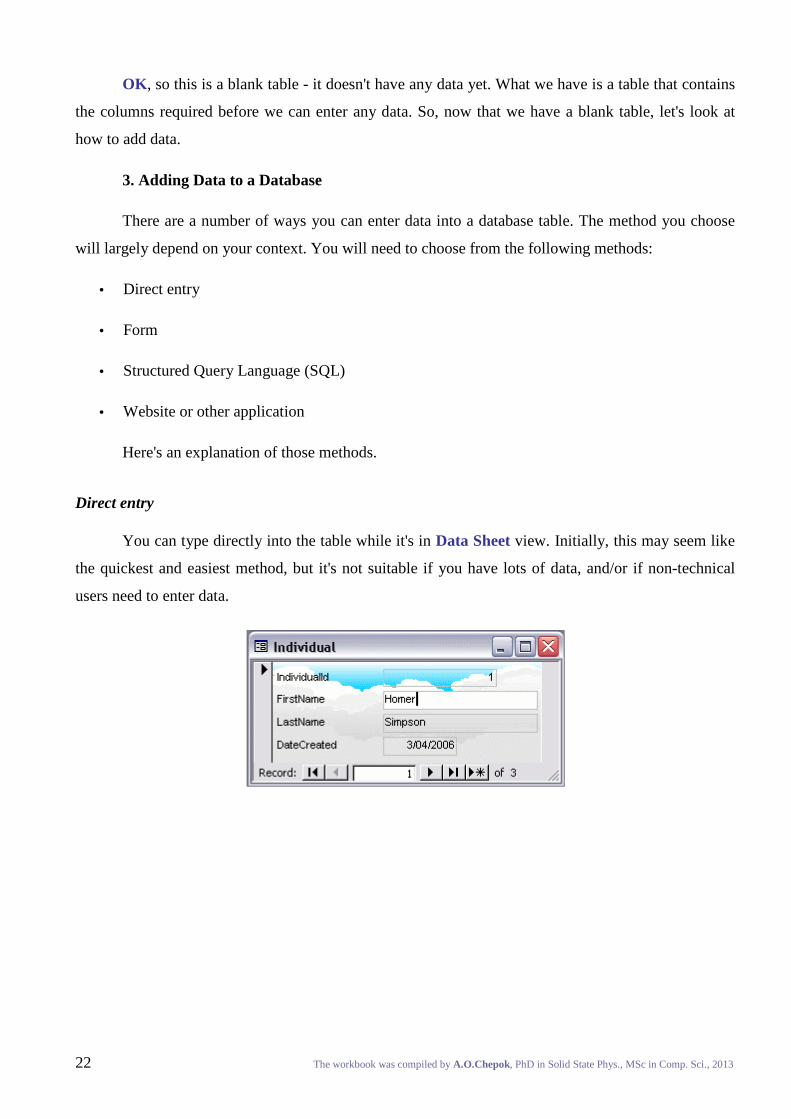
OK , so this is a blank table - it doesn't have any data yet. What we have is a table that contains
the columns required before we can enter any data. So, now that we have a blank table, let's look at
how to add data.
3. Adding Data to a Database
There are a number of ways you can enter data into a database table. The method you choose
will largely depend on your context. You will need to choose from the following methods:
• Direct entry
• Form
• Structured Query Language (SQL)
• Website or other application
Here's an explanation of those methods.
Direct entry
You can type directly into the table while it's in Data Sheet view. Initially, this may seem like
the quickest and easiest method, but it's not suitable if you have lots of data, and/or if non-technical
users need to enter data.

23 The workbook was compiled by A.O.Chepok, PhD in Solid State Phys., MSc in Comp. Sci., 2013
Form
If you use a desktop database program (such as MS Access), you can set up a form, so that non-
technical users can enter data into the form. Once they submit the form, the data is automatically in-
serted into our table. The form could insert data into multiple tables too - saving you from having to
open up each table to manually insert the data.
Most enterprise database systems don't have the ability for setting up a form. This is probably
because they're designed for larger scale applications with hundreds, thousands, or even millions of
users. In this environment, a form would be created through other means (for example, using HTML).
Applications such as Access provide a form wizard, which steps you through the process to building a
form.
4. Relational Database Design
Most popular database management systems are relational systems, and are usually referred to
as Relational Database Management Systems (RDBMS). What this means is that their databases can
contain multiple tables, some (or all) of which are related to each other. For example, consider the fol-
lowing screenshot:

24 The workbook was compiled by A.O.Chepok, PhD in Solid State Phys., MSc in Comp. Sci., 2013
In this example, the database has 20 tables. Each table serves a specific purpose. This enables
us to organize our data much better. It can also help us with the integrity of our data.
Using the example above, the Individual table can hold data that is strictly about the individual.
The City Table can hold a list of all cities. If we want to know which city each individual lives, we
could store a "pointer" in the Individual table to that city in the City Table.

25 The workbook was compiled by A.O.Chepok, PhD in Solid State Phys., MSc in Comp. Sci., 2013
This example (shown above) demonstrates the relationship between the Individual table and the
City Table. The individuals in the "Individual " table live in cities that are defined in the "City " table.
Therefore, we can cross-reference each "Individual " record with a "City " record.
How Does This Work?
Firstly, in the City table, each record has a unique identifier. A unique identifier is a value that
is unique to each record. This identifier can be as simple as an incrementing number. So, in our City
table, the first record has a number of 1, the second record has a number of 2, and so on.
Secondly, when entering each individual into the Individual table, instead of writing out the full
city name in that table, we only need to add the city's unique identifier. In this case, the unique identi-
fier is a number, so we enter this number into the "CityId " column of the "Individual" table.
The following screenshots demonstrate this:

26 The workbook was compiled by A.O.Chepok, PhD in Solid State Phys., MSc in Comp. Sci., 2013
So, by looking at both tables, we can determine that Homer lives in Sydney, Barney lives in
Cairns, and both Ozzy and Fred live in Osaka. At this stage, nobody in our database lives in Queens-
town or Dunedin.
Primary Keys and Foreign Keys
Primary keys and foreign keys are terms that you will become very familiar with when design-
ing databases. These terms describe what role each of the columns play in their relationship with each
other.
The column that contains the unique identifier is referred to as the Primary Key. So, in our City
Table, the primary key is the CityId column.
A foreign key is the column in the other table that points to the primary key. Therefore, the
CityId column in the Individual table is a foreign key to the CityId column in the City Table.
5. Database Driven Website
A database driven website is a website that has most of its webpage content in a database.
Therefore, the website content isn't actually sitting in files on the server, it is sitting in tables and col-
umns in a database. A website with its content stored on the file system is often referred to as a static
website, whereas a database driven website is often referred to as a dynamic.
Content Management Systems
A website with dynamic content usually has a CMS (Content Management System) to assist the
content providers in updating the website.
A CMS is usually provided in the form of an administration area where content providers need
to log in before they can add content. Once logged in, they can create, update and delete articles. They
may be able to upload files such as Word documents, PDF files etc. They might be able to upload im-
ages too. All of this content can be stored in the database. Some may be stored on the file system too
though. For example, although documents and images can be stored in the database, there are some-
times reasons to store them on the file system. Performance is often a key reason. Database size is an-
other.
Discussion Forums and Blogs
Discussion forums and blogs have become a popular feature for many websites. Most, if not all,
forums and blogs are database driven. Users can register their details, then add content. When the user

27 The workbook was compiled by A.O.Chepok, PhD in Solid State Phys., MSc in Comp. Sci., 2013
clicks the "Submit" button, their details/content is inserted into the database. Then when someone de-
cides to view this content, it is read from the database using SQL (Structured Query Language).
Combination of Static and Dynamic
Some websites have a combination of static content and dynamic content. There could be any
number of reasons for this. Often, smaller websites will be static. There's little need to configure a da-
tabase just to store a handful of webpages – much easier and cheaper to keep them as files on the
server. Even websites like this might contain some added functionality such as a discussion forum, or a
blog. In this case, the discussion forum or blog will need its content stored in a database.
Benefits of a Database Driven Website
Database driven websites can provide much more functionality than a static site can. Extended
functionality could include:
• Enabling many (potentially non-technical) users to provide content for the website. Users can
publish articles on the website without needing to FTP them to a web server.
• Shopping cart
• You can provide advanced search functionality that enables users to filter the results based on a
given field. They can then sort those results by a field – say "Price" or "Date".
• Customized homepage
• You can allow your users to perform tasks such as registering for a newsletter, post questions
to your forums, provide comments on a blog, update their profile, etc.
• Integration with corporate applications such as CRM systems, HR systems etc.
• Much more …
Creating a Database Driven Website
The most common tasks for database driven websites is inserting, updating, and deleting data.
Some of these are the same tasks that you learned in this tutorial, however when using a database
driven website, you need to use a different method to do these tasks. You need to use a programming
language called SQL (Structured Query Language) to insert, update, and delete your data.

28 The workbook was compiled by A.O.Chepok, PhD in Solid State Phys., MSc in Comp. Sci., 2013
Don't worry, this is not as scary as it may sound. SQL is a very easy language to learn and,
once you start using it, you will be thankful you took the time to learn it. In fact, you've already
learned some basic SQL statements in previous lessons.
To create a database driven website, you need the following skills:
• You need to be able to build a static website HTML, and preferrably CSS and JavaScript
• You need to be able to write basic code using a server side scripting language such as PHP,
ColdFusion etc.
• You need to know how to write basic SQL
• You need to be able to design/build a database. If you need to learn about databases but missed
the start of this tutorial.
6. Database Summary
You should now have a general understanding about databases and how they're used. This tuto-
rial was intended for beginners trying to gain an understanding of databases. Databases are not like
most other files and require a little bit of thought in order for you to understand the concept. If you
have your own database management system installed, you should have a better understanding of
where to start and what the various options mean.
What Next?
Most of the examples in this tutorial used MS Access. If you'd like to learn how to use MS Ac-
cess, try performing several Laboratory works (see Appendix to the paper).
Also, you'll have noticed SQL coming up throughout this tutorial. SQL is a very powerful lan-
guage, but is also very easy to learn. You can achieve a lot even by learning just a little SQL. After a
little practice you will be able to do things such as:
� Select only the columns you want from a query
� Query multiple tables
• Create tables & databases programatically
• Use built-in functions
• Create an index and more...

29 The workbook was compiled by A.O.Chepok, PhD in Solid State Phys., MSc in Comp. Sci., 2013
Chapter 4. Basics of SQL queries
(this chapter describes some practices for using SQL language
for relational data querying, reports creating and modifying)
Structured Query Language (SQL)
You can use a programming language called SQL to insert the data (we could also have used
SQL to create the database and tables if we'd wanted to). One advantage of this is that you can save
your SQL script for re-use. This could be handy if you need to insert the data into multiple databases.
It's also useful to create scripts that insert "lookup" data – this is generally a base set of data that never
changes (such as Countries, Cities, etc). If you ever need to rebuild your database, you can simply run
your ready made script against it (which saves you from manually re-entering the data).
Website or other application
You could build a program that uses the database to store and retrieve data. The person entering
the data doesn't need to have direct access to the database. They don't even need to have database
software. By using SQL, your database could be part of a larger application – such as a website. This is
probably the most common method of adding data to a database. If you've ever registered with a web-
site, your details would have been inserted into a database using this method.
Querying a Database
Queries are one of the things that make databases so powerful. A "query" refers to the action of
retrieving data from your database. Usually, you will be selective with how much data you want re-
turned. If you have a lot of data in your database, you probably don't want to see everything. More
likely, you'll only want to see data that fits a certain criteria.
For example, you might only want to see how many individuals in your database live in a given
city. Or you might only want to see which individuals have registered with your database within a
given time period. As with many other tasks, you can query a database either programatically or via a
user interface.

30 The workbook was compiled by A.O.Chepok, PhD in Solid State Phys., MSc in Comp. Sci., 2013
Option 1: Programatically
The way to retrieve data from your database with SQL is to use the "SELECT" statement. Us-
ing the SELECT statement, you can retrieve all records...
Code
SELECT * FROM Individual
...or just some of the records:
Code
SELECT * FROM IndividualWHERE FirstName = 'Homer'
The 2nd query only returns records where the value in the "FirstName" column equals
"Homer". Therefore, if only one individual in our database had the name "Homer", that person's record
would be shown. It may look like this:
SQL is a powerful language and the above statement is very simple. You can use SQL to
choose which columns you want to display, you could add further criteria, and you can even query
multiple tables at the same time. If you're interested in learning more about SQL, be sure to check out
our SQL tutorial after you've finished this one!
Option 2: User Interface
You might find the user interface easier to generate your queries, especially if they are com-
plex. Database management systems usually offer a "design view" for your queries. Design view en-
ables you to pick and choose which columns you want to display and what criteria you'd like to use to
filter the data. Here's an example of design view in Microsoft Access:

31 The workbook was compiled by A.O.Chepok, PhD in Solid State Phys., MSc in Comp. Sci., 2013
When using design view, the database system actually uses SQL (behind the scenes) to gener-
ate the query.

32 The workbook was compiled by A.O.Chepok, PhD in Solid State Phys., MSc in Comp. Sci., 2013
Appendix A
Instructions to the Lab. #1
Topic: “The basic functions of Excel aimed at editing, sorting
and re-arrangement of Databases”
1. Before start the Laboratory work (Lab. #1) you need to get the personalized initial database
kernel1.
2. You should familiarize yourself with the received dataset before you start to perform the task
accordingly the Laboratory work, and after that you have to complete the information by filling
with assumed data up to 8-10 rows (lines of the table) per sample.
3. Thereafter you have to perform some manipulations with the updated information according
the plan of Lab. #1.
1. Editing information in MS Excel databases
In order to editing information there is command FORM in MS Excel. The command allows us
to view, edit and check individual cell and lines of any columns with specific data.
Activating the Command occurs in two stages: 1) a User have to click (to activate) 1 cell of the
row he needs, then Excel will focused its efforts on the specific row of the table; 2) after the cell acti-
vating a User have to use two electronic buttons Data →→→→ FORM to enable chosen procedure. After that
Excel shows the dialog window to view and/or edit the database entries.
Exercise #1: Update the data records of your variant with the command Form with your own in-
formation per sample.
Exercise #2: With electronic Excel buttons Format →→→→ Column →→→→ Hide/Show edit the structure
the database. Before the table structure editing one has to highlight (to select) certain columns and use
proper buttons.
2. Sorting (ordering) the Data
Sorting procedure of any data in Excel table in ascending or descending order by any criterion
one can realize with electronic buttons Data →→→→ Sorting. To realize the procedure one has to select
(highlight) all the cells and use the sorting criterion he needs.
Exercise #3: Re-arrange information of different columns.
1 see your variant for personal data set

33 The workbook was compiled by A.O.Chepok, PhD in Solid State Phys., MSc in Comp. Sci., 2013
3. AutoFilter Tools
Data filtering aimed to show (to select) only the information that meet the specified criteria. In
order to control filtering one can enable the electronic buttons Data →→→→ Filter →→→→ AutoFilter . Selection
of data can be carried out as well as by one criterion and by many criteria.
The AutoFilter procedure can be cancelled. Besides, AutoFilter Tool helps to find empty cells
in the Excel tables.
Exercise #4: Find and show the list of employees of “# …” Dept. of the “ABC” Corporation.
What to do in order to perform this Lab :
1. Sort the students' Surnames in alphabetical order (it is the basic List #1);
2. Find (by using of Filter tool) Surname & Name of the Captain of the group, and after finding highlight
the cells with any colour you prefer;
3. Following the Session results and based on the current test scores calculate the grade point average
(GPA) to the nearest hundredth (use Format tool);
4. Based on the results of the last Session calculate the average score of the group;
5. Based on the results of the last Session (see GPA) draw grants for the students;
6. Calculate the monthly fund of grants for the group;
7. Based on the student's average score compile a list of student's rating (it is the List #2);
8. Find Surname & Name of the student(s) who has MIN average score after the last Session;
9. Find Surname & Name of the student(s) who has MAX average score after the last Session;
10. Compile a list of student's which average score are within the interval2: for example [Aver. Score of the
group ±±±± 15%] .
Note: It is recommended to show the results of each item on the same worksheet.
`
Fig. A-1: Example of how the worksheet should look like after step №5.
2 see your variant for personal data

34 The workbook was compiled by A.O.Chepok, PhD in Solid State Phys., MSc in Comp. Sci., 2013
Appendix B
Instructions to the Lab. #2
Topic: “Primary information processing. Reporting on request”
1. Before start the Laboratory work (Lab.#2) you have got the personalized initial database ker-
nel (see Lab.#1).
2. You should familiarize yourself with the received dataset before you start to perform the task
accordingly the Laboratory work Instructions.
3. Thereafter you have to perform processing the received information accordingly the plan of
Lab.#2.
Being based on the initial information you received (see your version of the “Personal Database
of the ABC ltd. employee” you have:
� to understand the Database structure;
� to understand the meaning of the query and make reports on them;
� to get by means of Excel tools the set of required plots (diagrams) based on the processed data
(so called secondary data).
Based on the fact that in the current month the Company’s management decided to pay each em-
ployee his bonus additionally to his salary according to his “personal” rate (see the Database).
The List of tasks linked to the primary Information processing
Being based on these data:
� calculate bonuses (in UHR) which are accrued to each employee of the Company in the current
month on the results of the previous period, and (see below)
� also calculate the total amount payable to the employee for the current month including accrued
bonuses (= find total monthly earns for each person).
� calculate the average salary of employees for each Department and for the Company as a
whole.
� calculate the age (one’s full years number) of each employee for the current year (the result
should be rounded to the nearest whole number).
� calculate the average age of the employees of each Department and calculate the average age of
the employees of the Company as a whole.

35 The workbook was compiled by A.O.Chepok, PhD in Solid State Phys., MSc in Comp. Sci., 2013
The List of Requests for compiling appropriate Reports :
� Find out how many employees of the Company have the following number of children: “0” (=
no one), “1” (= only one), “2” (= only two) , “3” (= only three), etc. up to a maximum. Ob-
tained results are presented in a Table (see Table #1):
children number of (persons) employees
0 1 2 3 4 5
� Get information about the Dept. employee which salary is different from the average salary in
this Department (and in the Company – a separate List) no more than 15%.
� Get information about the Dept. employee which salary is more than the average salary in this
Department (and in the Company – a separate List).
� Get information about the Dept. employee which salary is less than the average salary in this
Department (and in the Company – a separate List).
� For each Dept. of the Company: make a Schedule of Birthday celebration (sort the List by
Dept., within each Dept. – by month of Birth, within each month – by date of Birth).
For submitting one’s reports (usually reports presented in the form of list or table) one has to
copy received info to another Excel Worksheet or another Workbook.
on Graphic jobs :
� Compile a pie chart showing the average monthly salary of employees by each Department.
� Compile a histogram based on the Table #1 data.
The resulting graphics (charts) shall be drawn up properly: the graphs and their axes must be
signed, if necessary, provide the graphs with legends.
*************************************************** **********
The list of Notions to perform Lab.#2 :
Notion #1. The average values in Excel are automatically computed using some built-in rou-
tines: follow “Functions” (or “Another Functions”) →→→→ “Statistical” (see Fig. B-1).
Notion #2. In Excel the required amount of data in the list are automatically computed using built-in routines: follow “Functions” (or “Another Functions”) →→→→ “Statistical”.

36 The workbook was compiled by A.O.Chepok, PhD in Solid State Phys., MSc in Comp. Sci., 2013
Fig. B-1: More frequent and automatic functions of Excel. Notion #3. All the financial data one has to present in the format of "**** . ** " and specify the
units of measurement.
Notion #4. All the data on the average age one has to present in the format of "** . *" and specify
the units of measurement.
Notion #5. The task "Get information about the employees ..." means getting lists of all available
personal information from the column "Surname" to the "Cell phone operator" inclusively.
Fig. B-2: The main library of functions of Excel.

37 The workbook was compiled by A.O.Chepok, PhD in Solid State Phys., MSc in Comp. Sci., 2013
Appendix C
Instructions to the Lab. #3
Topic: “Operating with databases in MS Access. Step 1: Tables creating”
Part 1: Creating database Tables in Access
(see previous Information and Instructions according to MS Access)
To design a database, you must know its structure: you have to know the structure of the
information to be presented in this database.
So, within the framework of the present Lab.#3 we will design two simple databases – “My
personal Library” and “The List of Unemployed Persons”.
1. Creating the database Table#1 named “My personal Library ”
Let the database "My personal Library" contains information about all of somebody’s books.
Let it be known the following information about each of his/her books:
� Author’s name and Surname;
� the Book Title;
� year of Edition;
� a Title of Publisher;
� the date of purchasing of the Book;
� Topics (thematic section).
Let all of this information will be contained in the three tables: the Parent Table#1 – “Book
Publishers”, the Parent Table#2 – “Topics”, and the Child Table #3 – “Books”.
The Parent Table#1 – “Book Publishers” :
Structure of the Table #1:
Field Name Data Type Field Size Key field The Book Publisher’s code Number Yes The Publisher Title Text 25
Contents of the Table #1:
The Book Publisher’s code The Publisher Title 1 DP Publications 2 Book Club Associates 3 Chapman & Hall 4 BlackWell 5 The Hambledon Press

38 The workbook was compiled by A.O.Chepok, PhD in Solid State Phys., MSc in Comp. Sci., 2013
the Parent Table #2 – “Topics”
Structure of the Table #2:
Field Name Data Type Field Size Key field The Topic’s code Number Yes The Topic’s header Text 20
Contents of the Table #2:
The Topic’s code The Topic’s header 1 Educational literature 2 Rest, Leisure 3 Cooking and Recipes 4 Lyrics 5 Hobby
the Child Table #3 – «Books»
Structure of the Table #3:
Field Name Data Type Field Size Key field Data source The Book code AutoNumber Yes Author’s name and Surname Text 30 The Book Title Text 50 Year of Edition Number The Publisher Code Number The data from Ta-
ble #1 – “Book Publishers”
The Topic’s Code Number The data from Ta-ble #2 – «Topics»
the date of purchasing of the Book Date/Time (short date format)
Contents of the Table #3:
The Book code
Author’s name and surname
The book Title Year of Edition
The Pub-lisher Code
The Topic’s Code
the date of purchasing
1 John Perrin Taxation Policy & Practice
1995 3 1 21.08.1996
2 Tom Wilkie British Science and politics since 1945
1991 4 5 12.12.1991
3 T. Lucey Quantitative Tech-niques
1996 1 1 03.07.2002
4 Richard Hay-man
Riddles in Stone 1997 5 5 15.06.2000
5 Edward Gib-bon
The Decline and Fall of the Roman Empire
1972 2 5 04.09.1987
**************************************************** ************************* *

39 The workbook was compiled by A.O.Chepok, PhD in Solid State Phys., MSc in Comp. Sci., 2013
2. Creating the database Table#2 «The List of Unemployed Persons»
Let the database "The List of Unemployed Persons" contains information about the registered
unemployed people who live in certain settlement (populated area). At the same time one knows the
following information about of each such person.
� Surname;
� Date of Birth;
� home Phone No;
� cell Phone No;
� Education;
� Total work experience;
� Last Position;
� Desired Position;
� Address (Populated Area).
All collected information will be contained in three tables: the Parent Table #1 – “Populated
Area”, the Parent Table #2 – “Education”, and the Child Table #3 – “Unemployed Persons”.
the Parent Table #1 – «Populated Area»
Structure of the Table #1:
Field Name Data Type Field Size Key field Populated Area code Number Yes Populated Area Text 35
Contents of the Table #1:
Populated Area code Populated Area 1 Primorsky distr. 2 Suvorovsky distr. 3 Kyivsky distr. 4 Malinovsky distr.
the Parent Table #2 – «Education» Structure of the Table #2:
Field Name Data Type Field Size Key field Education branch code Number Yes Education branch Text 25
Contents of the Table #2:
Education branch code Education branch 1 Secondary Education 2 Secondary Special Education 3 Higher Education

40 The workbook was compiled by A.O.Chepok, PhD in Solid State Phys., MSc in Comp. Sci., 2013
the Child Table #3 – «Unemployed Persons»
Structure of the Table #3:
Field Name Data Type Field Size Key field Data source Surname Text 25 Yes Date of Birth Date/Time
(short date format)
Home Phone No. Text 10 Cell Phone No. Text 10 Education branch code Number Total work experience Number Last Position Text 20 Desired Position Text 20 Populated Area (Address) code Number
Contents of the Table #3: №
Record Number
Surname Date of
Birth
home Phone
No.
cell Phone
No.
Education branch code
Total work
experience
Last Position
Desired Position
Populated Area code
1 2 3 4 5 6 7 8 9 10 11

41 The workbook was compiled by A.O.Chepok, PhD in Solid State Phys., MSc in Comp. Sci., 2013
Appendix D
Instructions to the Lab. #4
Topic: “Operating with Tables & Forms in MS Access”
Part 1: Creating database Tables in Access
(see previous Information and Instructions according to MS Access)
As it is usual, to design a database, you must know its structure: you have to know the
structure of the information to be presented in this database.
1. Creating the database Table#1 “My personal Library”
So, one has to create four database tables with the following names: “The Staff Position
Directory ”, “ The Dept. Directory”, “ Basic Personal Data of Employees” and “Additional Personal
Info about Employee”.
The Table#1 – “The Staff Position Directory” :
Structure of the Table #1:
Field Name Data Type Field Properties Value Code of Position
Position Title Salary
As you can see, the Primary Key marker is placed next to the 1st item – the Code of Positions
by name. After the creation of the Table structure is finished one has to fill the table with proper data,
for example, as follows.
Contents of the Table #1:
Code of Position Position Title 1 Director 2 Chief Accountant 3 Head of Dept. #1 (Accounting Dept.) 4 Head of Dept. #2 (Personnel Dept.) 5 Head of Dept. #3 (Technical Dept.) 6 Head of Dept. #4 (Cargo Dept.) 7 Head of Dept. #5 (Electric Dept.) 8 Personnel Officer 9 Accountant 10 assistant accountant 11 engineer 12 electrical engineer 13 technician 14 economist 15 Driver №1 16 Driver №2 17 Serviceman №1 18 Serviceman №2
42 The workbook was compiled by A.O.Chepok, PhD in Solid State Phys., MSc in Comp. Sci., 2013
19 Mechanic №1 20 Mechanic №2
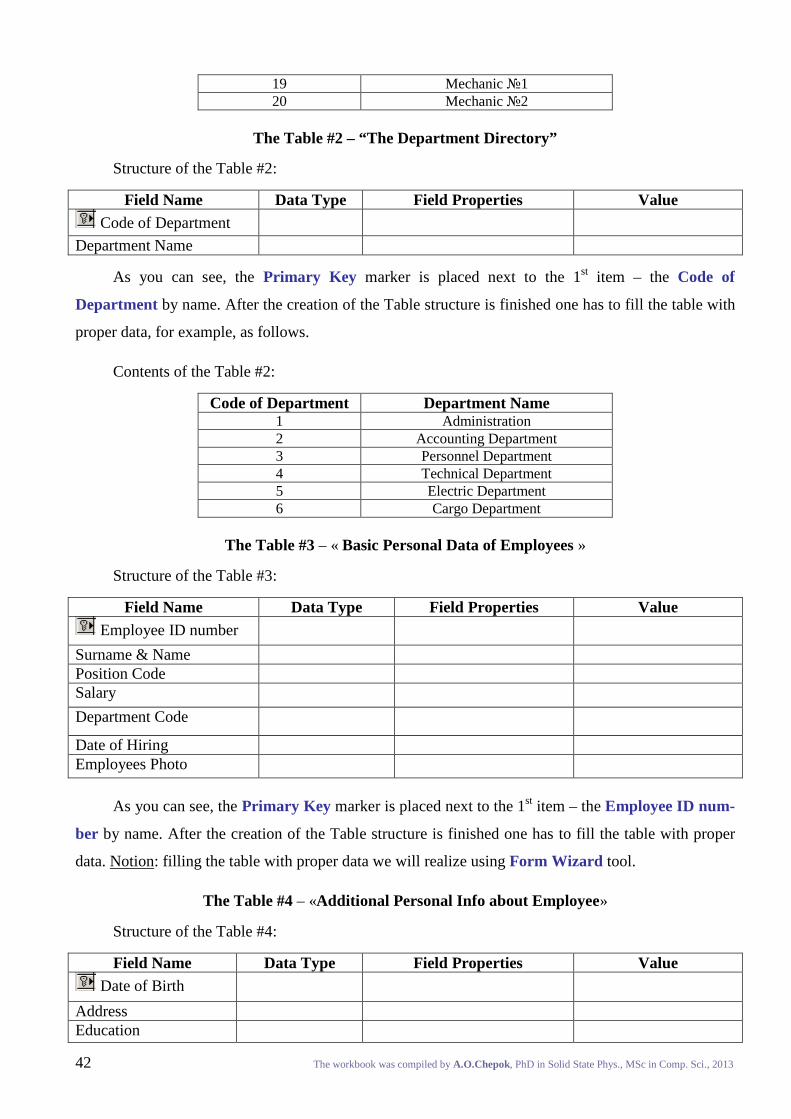
The Table #2 – “The Department Directory”
Structure of the Table #2:
Field Name Data Type Field Properties Value Code of Department
Department Name
As you can see, the Primary Key marker is placed next to the 1st item – the Code of
Department by name. After the creation of the Table structure is finished one has to fill the table with
proper data, for example, as follows.
Contents of the Table #2:
Code of Department Department Name 1 Administration 2 Accounting Department 3 Personnel Department 4 Technical Department 5 Electric Department 6 Cargo Department
The Table #3 – « Basic Personal Data of Employees »
Structure of the Table #3:
Field Name Data Type Field Properties Value Employee ID number
Surname & Name Position Code Salary
Department Code
Date of Hiring Employees Photo
As you can see, the Primary Key marker is placed next to the 1st item – the Employee ID num-
ber by name. After the creation of the Table structure is finished one has to fill the table with proper
data. Notion: filling the table with proper data we will realize using Form Wizard tool.
The Table #4 – «Additional Personal Info about Employee»
Structure of the Table #4:
Field Name Data Type Field Properties Value Date of Birth
Address Education

43 The workbook was compiled by A.O.Chepok, PhD in Solid State Phys., MSc in Comp. Sci., 2013
Marriage Status
Number of Children
As you can see, the Primary Key marker is placed next to the 1st item – the Employee ID num-
ber by name. After the creation of the Table structure is finished one has to fill the table with proper
data. Notion: filling the table with proper data we will realize using Form Wizard tool.
**************************************************** ********************************** *
Part 2: Creating Relationship setting between the Tables
To create relationships between the database Tables MS Access has the special dialog window
called Relationships. This window one can open by clicking on the button (see Tools) or by the
command Service →→→→ Relationships (see Fig. D-1):
Fig. D-1: Appearance and location of the Relationships electronic button. Double clicking upon the Relationship line between the Tables will cause Edit Relationships
window appearance. From this window, select different fields if necessary and select an option from
Enforce Referential Integrity option button if necessary. These options give Access permission to
automatically make changes to referential tables if key records in one of the Tables is deleted. Check
the Enforce Referential Integrity box to ensure that the relationships are valid and that the data is not
accidentally deleted when data is added, edited, or deleted. Then click Create to create the link. After
that one can see the scheme of Tables and the relationships between them.
Notion: you have to set some relational links between the DataTables as follows (see Fig. D-2):
Fig. D-2: Establishment appropriate relational links between the DataTables (step 1).

44 The workbook was compiled by A.O.Chepok, PhD in Solid State Phys., MSc in Comp. Sci., 2013
The next step – step 2 – is filling the table “Relation Changing” (see Fig. D-3).
Fig. D-3: Establishment appropriate relational links between the DataTables (step 2).
The next step – step 3 – is filling the table “Relation Changing” (see Fig. D-4).
Fig. D-4: Establishment appropriate relational links between the DataTables (step 3).
* *************************************************** ************************************ *
Part 3: Form Creating and Editing
In order to fill the database with proper information you must perform the following steps as it
shown below. Notion: all the specific information you need to come up. Choose Form Wizard : it is
step 4 (see Fig. D-5 ), then we have to fill the proper table – step 5 and step 6 – aimed to compile the
table we need (Fig. D-6 and Fig. D-7).

45 The workbook was compiled by A.O.Chepok, PhD in Solid State Phys., MSc in Comp. Sci., 2013
Fig. D-5 : Form creating procedure within Access (step 4).
Fig. D-6 : Form creating procedure within Access (step 5).
Fig. D-7 : Form creating procedure within Access (step 6).

46 The workbook was compiled by A.O.Chepok, PhD in Solid State Phys., MSc in Comp. Sci., 2013
The next phase is a series of steps for selection of the desired style of the table: one can find the
desired style of the form from the standard set. See the figures beneath as an example (Fig. D-8 and
Fig. D-9).
Fig. D-8 : Form creating procedure within Access (step 7) :
selection of the desired style of the form from the standard set.
Fig. D-9 : Form creating procedure within Access (step 8).

47 The workbook was compiled by A.O.Chepok, PhD in Solid State Phys., MSc in Comp. Sci., 2013
Finally, after you complete filling the data you have to apply the form page with any picture (or
an appropriate photo) you wish to illustrate the imaginary person, for example, like this:
Fig. D-10 : Particular Form which is filled with the necessary data without OLE objects.
Fig. D-11 : Particular Form which is filled with the necessary data with additional OLE object.

48 The workbook was compiled by A.O.Chepok, PhD in Solid State Phys., MSc in Comp. Sci., 2013
Appendix E
Instructions to the Lab. #5
Topic: “Operating with Queries & Reports in MS Access”
Part 1: Creation of specific Query series based on the database in Access.
(see previous Information and Instructions according to MS Access)
The main idea of the Lab. Work:
It is necessary to collect and output information about:
� employees whose age does not exceed 30 years;
� work experience of employees at the company;
� employees, who live in a certain area (district) of the city;
� employees hired to work at the company in a given period.
It is also necessary to make some calculations within MS Access and create several statements:
� document on accrual of the personal premium according the rate of 15% of his salary;
* *************************************************** ********************************** *
The Query #1: The list of employees which age is not greater than 30 years
To create a query one has to activate the Database window, then to choose creation of a query in
Design mode. So your database should already be open with the Database Window showing. It can be
done by doing this way: the main Access window → Query → Create query in Design View (see
Fig. E-1).
Fig. E-1: on a query in Design mode.
The Show Table window will appear, allowing you to select the source table or query to be
used. The Query design window will be visible behind that.

49 The workbook was compiled by A.O.Chepok, PhD in Solid State Phys., MSc in Comp. Sci., 2013
Make sure the desired table is selected as shown in Fig. E-2 and click Add (you can also dou-
ble-click the name of a table to add it). Click Close button to close the Show Table window and you
will now be in the Query Design window.
Fig. E-2: selection the desired table.
The top section of the window (see Fig. E-3) shows a list of fields in the source table(s). The bot-
tom half, referred to as the QBE Grid (Query-by-Example), is where you can select the fields and crite-
ria essential to the query results.
Fig. E-3: The top section of the window shows a list of fields in the source table(s).

50 The workbook was compiled by A.O.Chepok, PhD in Solid State Phys., MSc in Comp. Sci., 2013
Selecting Fields for Query Output
Selecting fields to be included in the query results can be done in several different ways. In the
following exercises you will learn different ways of doing it. The bottom half of the query design win-
dow is where information about the currently selected fields will be kept.
Choose the table “Basic Personal Data of Employees” and supply the “Query1: Select Query”
table with appropriate information according to your demand (see Fig. E-4 as an example).
Fig. E-4: The basic elements of the query design screen: selected fields for Query Output.
Be attentive when filling in the query design screen: the upper pane should contain field lists for
the tables on which the query is based, and the lower pane should contain the actual query definition.
Check the information you have just entered: these fields will be used in the queries that will follow!
Running a query for execution
To perform a query one has to use the command Query →→→→ Run or the button on the
toolbar (see Fig. below):
Fig. E-5.

51 The workbook was compiled by A.O.Chepok, PhD in Solid State Phys., MSc in Comp. Sci., 2013
The result of the query is displayed in the appropriate table, for example like this (Fig. E-6):
Fig. E-6
* *************************************************** ************************************* *
Part 2: Creating Reports based on specific Queries in Access.
It is necessary to solve three problems as follow:
� making reports on given databases according specific queries;
� editing (or formatting) the received reports;
� learn how to output the received reports to print.
Based on the data from two tables (“Basic Personal Data of Employees” and “Additional
Personal Info… ”) one has to create four reports3 with the specified fields and then edit them in order
to be printed. So, it is necessary to compile 4 lists with data concerning to …
� employees whose age does not exceed 30 years; ← report #1
� work experience of employees at the company; ← report #2
� employees, who live in a certain area (district) of the city; ← report #3
� employees hired to work at the company in a given period ← report #4
Below we can see some steps which can lead us to our goal.
1. Choose the Reports menu.
(Once you've opened the main Access window, you'll be presented with the main database menu shown below. Go ahead
and click on the "Reports" selection (Fig. E-7) and you'll see a list of the various reports Microsoft included in the sample
database.)
2. Create a new report.
(Next step: go ahead and click on the "New" button
(Fig. E-7) and we'll begin the process of creating
a report from scratch.)
Fig. E-7 : First steps for a new Report creation.
3 Remark: make these reports by the scheme “Reports →→→→ Create →→→→ Report Wizard”.

52 The workbook was compiled by A.O.Chepok, PhD in Solid State Phys., MSc in Comp. Sci., 2013
3. Select a creation method. For example, it will be the Report Wizard mode.
(The next screen that appears will ask you to select the method you wish to use to create the report. We're going to use the
Report Wizard which will walk us through the creation process step-by-step. After you've mastered the wizard, you might
want to return to this step and explore the flexibility provided by the other creation methods.)
4. Choose a table or query.
(Next we want to choose the source of data for our report. If you want to retrieve information from a single table, you can
select it from the drop-down box below. Alternatively, for more complex reports, we can choose to base our report on the
output of a query that we previously designed.)
5. Select the fields to include (Fig. E-8).
(Use the ‘>’ button to move over the desired fields. Go ahead and select these fields. When you are satisfied, click the Next
button.)
Fig. E-8 : Select the fields to include them within your report.
6. Select the grouping levels (Fig. E-9).
(At this stage, you can select one or more grouping levels to refine the order in which our report data is presented. Go
ahead and simply click on the Next button to bypass this step. You may wish to return here later and experiment with
grouping levels.)

53 The workbook was compiled by A.O.Chepok, PhD in Solid State Phys., MSc in Comp. Sci., 2013
Fig. E-9 : Choose the grouping levels.
7. Choose your sorting options (Fig. E-10).
(In order to make reports useful, we often want to sort our results by one or more attributes. Select this attribute from the
first drop-down box and then click the Next button to continue.)
Fig. E-10 : Choose the sorting options

54 The workbook was compiled by A.O.Chepok, PhD in Solid State Phys., MSc in Comp. Sci., 2013
8. Choose the formatting options (Fig. E-11).
(In the next screen, we’re presented with some formatting options. We’ll accept the default tabular layout but let’s change
the page orientation to landscape to ensure the data fits properly on the page. Once you’ve completed this, click the Next
button to continue.)
Fig. E-11 : Chose Formatting Options
9. Select a report style (Fig. E-12).
(The next screen asks you to select a style for your report. Click on the various options and you’ll see a preview of your
report in that style in the left portion of the screen. We’ll use the Corporate style for this report. Select this option and then
click the Next button to move on.)
Fig. E-12 : Select a Report Style.

55 The workbook was compiled by A.O.Chepok, PhD in Solid State Phys., MSc in Comp. Sci., 2013
10. Add the title (Fig. E-13).
(Access will automatically provide a nicely formatted title at the top of the screen, with the appearance shown in the report
style you selected during the previous step. Make sure that the “Preview the report” option is selected and click on Finish
to see our report!)
Fig. E-13 : Adding a Title
11. So, our report should look something like this (Fig. E-14).
Fig. E-14 : Our Finished Product (a similar kind of).
And finally, save the reports as “Report # …” by name.

56 The workbook was compiled by A.O.Chepok, PhD in Solid State Phys., MSc in Comp. Sci., 2013
Internet sources
Additional information can be seen at the following addresses :
1. http://en.wikipedia.org/wiki/Microsoft_Access
2. http://office.microsoft.com/en-gb/excel-help/using-access-or-excel-to-manage-your-data-HA010210195.aspx
3. http://www.makeuseof.com/tag/excel-vs-access-can-spreadsheet-replace-database/
4. http://www.fmsinc.com/microsoftaccess/modules/code/
5. http://www.pivotdashboard.com/Pages/PowerPivotExample.aspx
6. http://softtoyssoftware.com/dbnet/programmingprojects/linkexcelaccess.htm
7. http://stackoverflow.com/questions/375991/import-excel-spreadsheet-columns-into-sql-server-database
8. http://www.octalsoft.com/home
9. http://www.octalsoft.com/ms-access-to-sql-server-migration/144-excel-to-relational-database
10. https://www.lib.purdue.edu/find/databases
11. http://www.tomsguide.com/us/download/Software-Database-And-Database-Management-Systems,0702-
7015.html ←←←← 13 Free Softwares