database for green products (dgp version 1.0) ashok kumar prachi nimse
TRANSCRIPT

Database for Green Products(DGP version 1.0)
Ashok Kumar
Prachi Nimse
Objectives The purpose of the project is to create a tool for Green Products as an
alternative for Nongreen Products.
The tool is an attempt to bring some of the green products among the vast number of products that are available in the market to one place so that the consumer can look through the tool and make a decision of his/her own as to which product to buy.
This tool will give an idea of the products to the consumer in making a smart choice for purchasing such products and also help them to find the products.
This Tool helps you identify products that are:
» Green
» Sustainable
» Recycled
» Organic
» Energy efficient

Methodology
A comprehensive literature review on different types of products available in the market, has been done and those products are listed in Microsoft Access using different tables.
The Tool is divided into various headings for each category of products, and then each category contains the various green products available for that category, their advantages, sources from where the information is taken and finally the green price of that product.
All tables are incorporated into one single table to make it easier to design queries and form code .
Final output is in the form of reports that can be exported into different formats such as Excel, HTML, Rich Text format as per the user’s convenience.

Tool Development A pollution prevention tool has been created which gives an option for alternative
nongreen products.
Following is the list of product types available in DGP1.0 tool :
• Industrial
• Construction
• Household
• Stationary
• Electrical
The tool consists of tables with headings namely Product Type, Category, Sub-category, Alternative Product Name, Advantages, Manufacturer, Additional information source as well as Green Price.

Category Tool Source Use
PowerA Green Power TrackingSpreadsheet
EPA Calculates the green power.
Power profiler EPA Compare emissions profile of input region to national average.
Energy Escalation Rate Calculator FEMP Use rate in contract language for ESPCs and UESCs.
Fleets Federal automotive Statistical Tool(FAST)
DOE DOE compiles data inputs annually
Hybrid Electric Vehicle(HEV)Cost calculator
DOE Creates analysis of cost savings associated with HEVs over non-HEVs.
Freight Logistics Environmental and Energy Tracking (FLEET) Performance Model
EPA Produces environmental impact analysis of large vehicle fleets.
Hybrid Car Gas Mileage Impact Calculator
Hybridcars.com
Compares estimated annual or 10-year cost and emissions between hybrid and non-hybrid vehicle.
Buildings San Francisco’s Green building Project Reporting Information Tool
SF Environment
Each section includes data on environmental benefits and economic savings.
Sustainable federal Building Database FEMP Documents listed provide guidance for federal organizations developing their own policy or guidelines.
Building for Environmental and Economic Sustainability(BEES)
NIST/EPA
Data and graphs comparing life-cycle performance of alternative building materials.
Construction Waste Management Database
GSA Contact information for suitable C&D recycling companies.
Review of Available Tools

Review of Available Tools cont…..
Electronics Electronic Product Environmental assessment Tool(EPEAT)
Green Electronics
Council
Easily enables purchasers to include environmental impacts in electronics purchase contract language.
Savings Calculator CENERGY STAR
Calculates cost savings of ENERGY STAR unit over conventional unit.
Recycling Electronics and Asset Disposition(READ)Services
EPA Provides a method of managing, recycling, or disposing of electronic equipment in an environmentally responsible manner
Recycling Waste Reduction Model(WARM)
EPA Compare baseline and alternative waste management practices.
Durable Goods calculator EPA Compare outputs of baseline and alternative disposal scenarios.
Recycled Content(ReCon)Tool EPA Compare existing to available inventory by emissions avoided and energy saved.
Environmental Benefits Calculator
Northeast Recycling Council (NERC)
Detailed description of environmental impact avoided by recycling carried out, especially in relation to Energy, GHG emissions, Waterborne waste
Environmental Benefits Calculator
National Recycling Coalition
Details of emissions and waterborne waste reduced, and energy and natural resources saved by recycling.
Category Tool Source Use
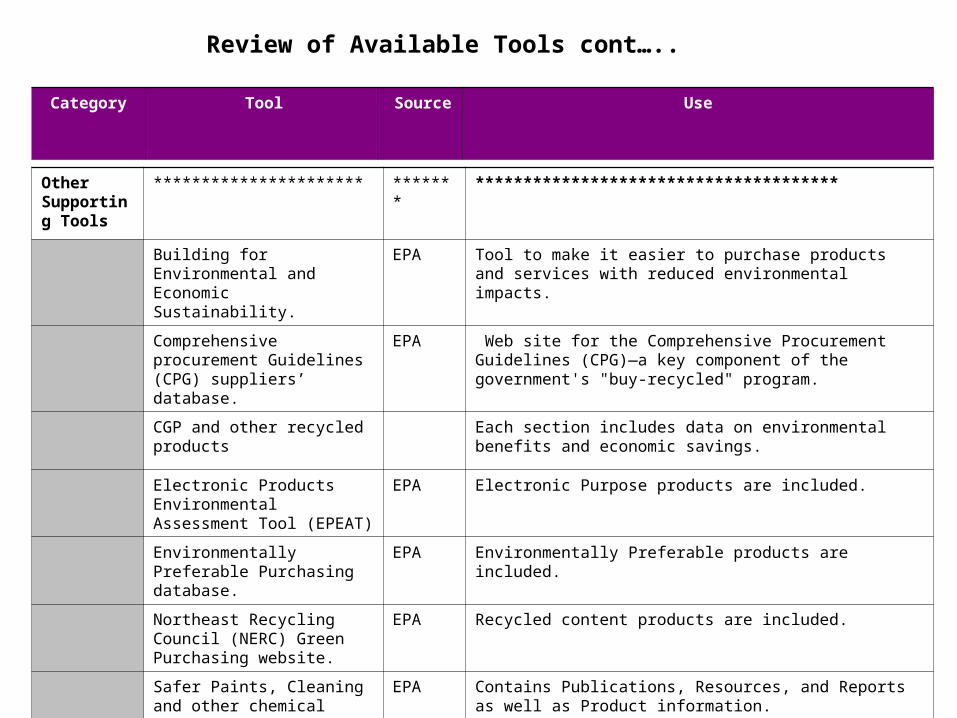
Other Supporting Tools
********************** ******* **************************************
Building for Environmental and Economic Sustainability.
EPA Tool to make it easier to purchase products and services with reduced environmental impacts.
Comprehensive procurement Guidelines (CPG) suppliers’ database.
EPA Web site for the Comprehensive Procurement Guidelines (CPG)—a key component of the government's "buy-recycled" program.
CGP and other recycled products
Each section includes data on environmental benefits and economic savings.
Electronic Products Environmental Assessment Tool (EPEAT)
EPA Electronic Purpose products are included.
Environmentally Preferable Purchasing database.
EPA Environmentally Preferable products are included.
Northeast Recycling Council (NERC) Green Purchasing website.
EPA Recycled content products are included.
Safer Paints, Cleaning and other chemical products
EPA Contains Publications, Resources, and Reports as well as Product information.
Category Tool Source Use
Review of Available Tools cont…..

Main Table
• Initially multiple tables, one each for each Product Type were created. While this approach has the advantage of faster querying, it has an inherent inefficiency in that new queries have to be written for each additional Product Type added into our database. This limits the number of Product Types which can be easily managed using this database.
• Later, a database was developed in such a way that all the data are e in a single table which makes querying easier albeit a little slower. The advantage of the single table is that only we have to design one single query for all product types.
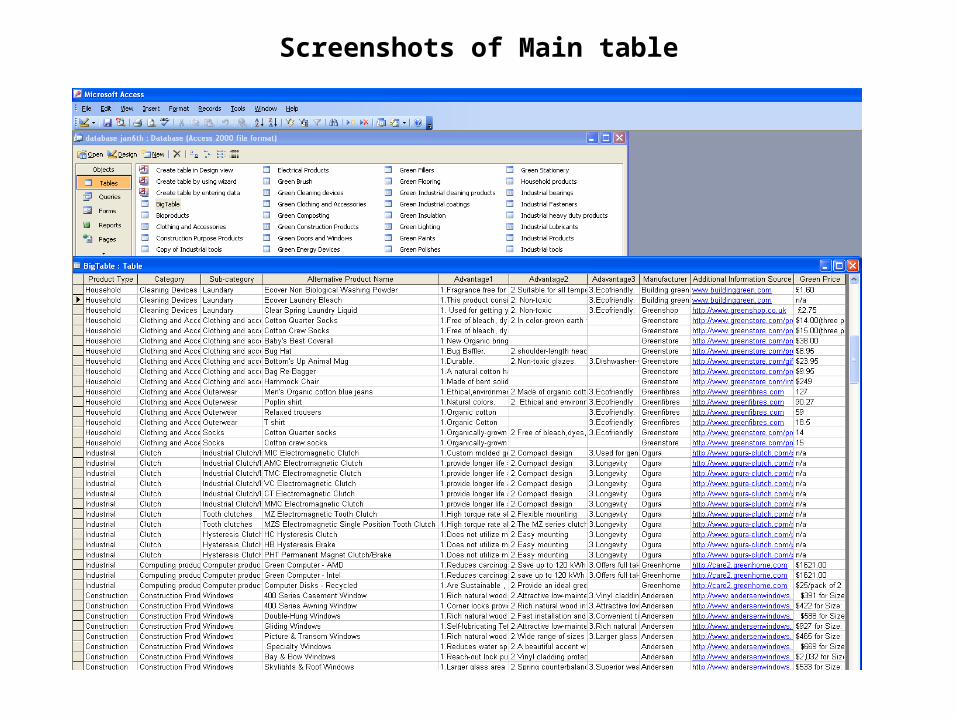
Screenshots of Main table

Relations between Tables of the Database
• To normalize the database, the whole database is divided into several tables which are connected by relationships like primary key, foreign key, etc.This will maintain the referential integrity of the database and avoids unnecessary duplication of data.
• For example, each ‘Product Type’ in the table ‘BigTable’ should be present in the table ‘ProductTypes’. This prevents the addition of a product type which is not already present in our database. Similarly, categories are listed for each ProductType in the table ‘Subcategories’ which are in turn used in the table BigTable. This process is usually called ‘Normalization’ of databases.

Screenshot of Relations between Tables of the Database
Queries
• A query is a statement which when run against the database returns results from it. The query can span over multiple tables.
• For example, the query
SELECT DISTINCT BigTable. [Product Type], BigTable. Category FROM BigTable;
returns all the distinct pairs of the type (Product Type, Category) from the table BigTable.

Screenshots of Queries

Forms
• Form is a Graphical-User element for this database which allows the users to alter the search-parameters dynamically using the run-time, and return the results based upon the user-inputs. The procedure to create forms is listed below, followed by its usage.
• Procedure to create form is shown as screenshots in the next slides.

Screenshots of Procedure to Create Form

Screenshots of Form

Screenshots for Form

Screenshots of Product Type
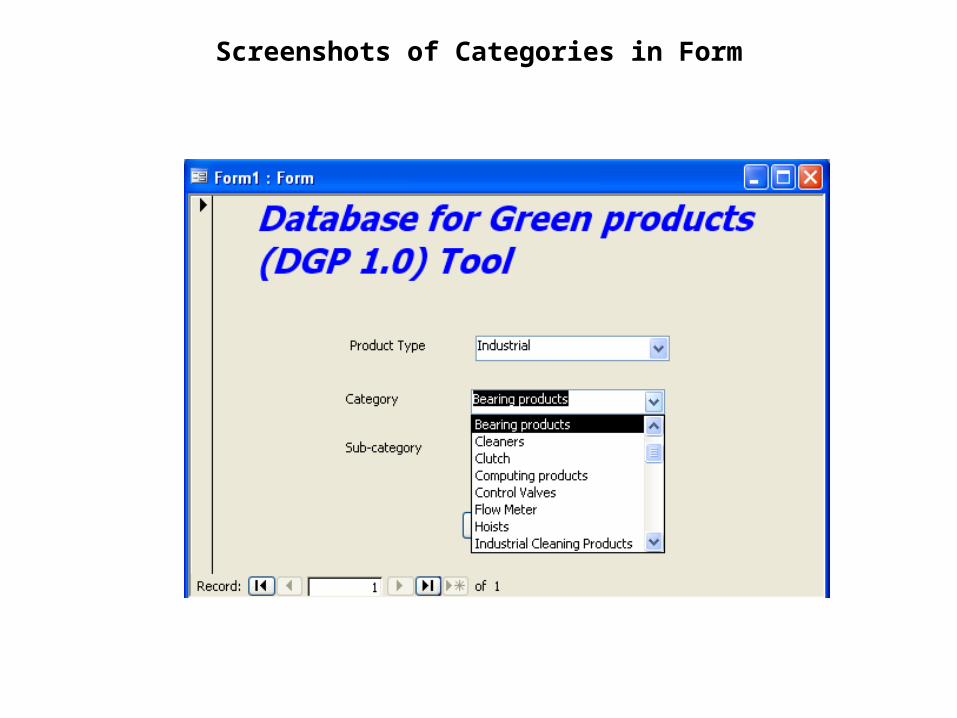
Screenshots of Categories in Form

Screenshots of Sub-categories
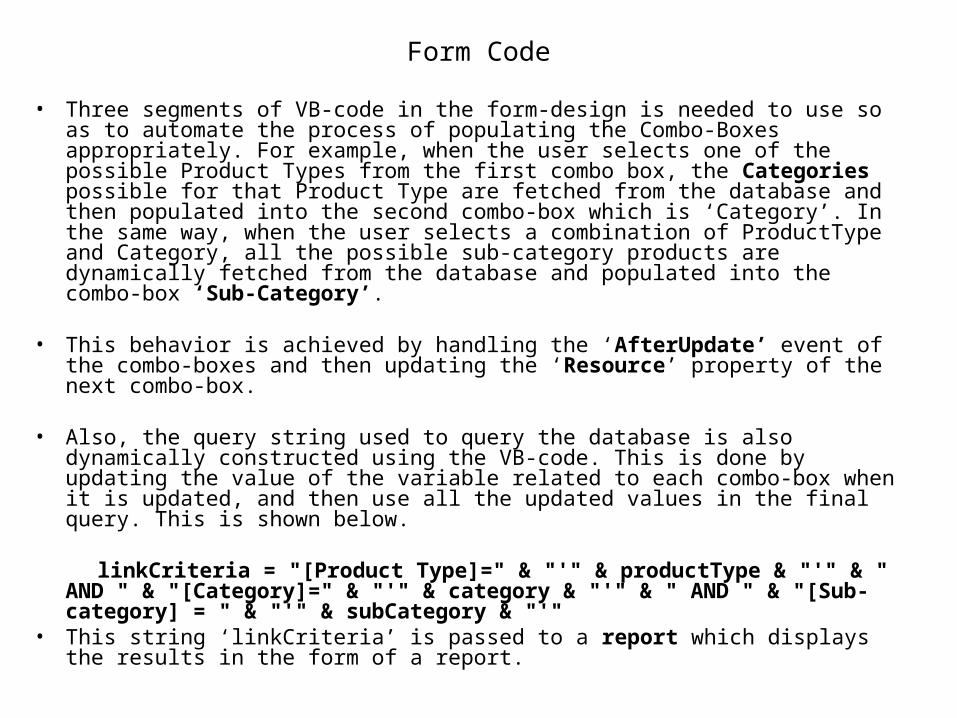
Form Code
• Three segments of VB-code in the form-design is needed to use so as to automate the process of populating the Combo-Boxes appropriately. For example, when the user selects one of the possible Product Types from the first combo box, the Categories possible for that Product Type are fetched from the database and then populated into the second combo-box which is ‘Category’. In the same way, when the user selects a combination of ProductType and Category, all the possible sub-category products are dynamically fetched from the database and populated into the combo-box ‘Sub-Category’.
• This behavior is achieved by handling the ‘AfterUpdate’ event of the combo-boxes and then updating the ‘Resource’ property of the next combo-box.
• Also, the query string used to query the database is also dynamically constructed using the VB-code. This is done by updating the value of the variable related to each combo-box when it is updated, and then use all the updated values in the final query. This is shown below.
linkCriteria = "[Product Type]=" & "'" & productType & "'" & " AND " & "[Category]=" & "'" & category & "'" & " AND " & "[Sub-category] = " & "'" & subCategory & "'"
• This string ‘linkCriteria’ is passed to a report which displays the results in the form of a report.

Screenshots of Form Code

Advantages of using Report
• Reports are in Access to display the final result because it can be exported to other useful formats such as an Excel sheet (.xls), HTML document (.html), Rich Text Format document (.rtf), plain text file (.txt) or even an Active Server Pages (.asp) document. This gives us the possible flexibility of using it on a Microsoft-IIS server and displays our results on a web-page.
• Screenshots in next slides explain the step by step procedure to create form as well as export options available.

Screenshots of Report

Screenshots of Final Report

How to Export

Export options
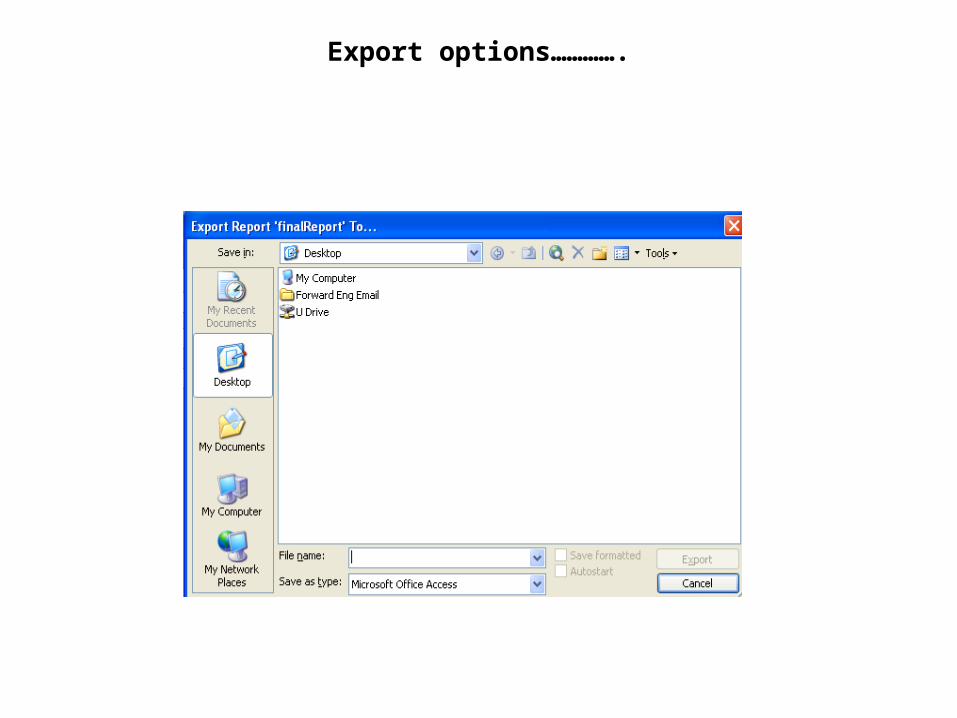
Export options………….

How Else is DGP Tool different?
Our format: The DGP tool is prepared in Microsoft Access. This makes it quicker and easier to read. Moreover, Access is a database tool which is designed primarily for storing data, and querying it efficiently.
Additional data: Information provided is easy to use, it provides hypertext link which helps the customer to go in detail for further information of the product.
Environmental Concern: Majority of the product listed are eco-friendly.
Our extensive research services: For finding the one product, all possible available sources will display in the report format which helps the user to narrow down his search to get more information of the product.
Output: The output from Microsoft access can be converted to HTML document, Excel format, Textfiles, as well as in Rich Text Format.
Extendibility: This tool is extendible, in the sense that new product-types can be added over the time easily, and the tool works fine without modifying the under-lying code for querying and report-generation. One example of such extendibility is provided in a later section.

Superiority of Green ProductsExample: Green Paints vs. Non-Green Paints
Disadvantages of Non-Green Paints Advantages of Green Paints
The paint contains upto 85% solvents which emit volatile organic compounds (VOC) such as hydrocarbons into the air which contain carcinogenic, mutagenic or toxic substances.According to the EPA, VOCs can cause respiratory, skin and eye irritation; headaches; nausea; muscle weakness; and more serious ailments and diseases.
Beyond VOCs, many paints are made with toxic substances and chemicals that come from nonrenewable resources or are energy-intensive or polluting to environment.
Many synthetic solvents are classified as carcinogenic .
Level of solvents in the air during application can exceed recommended levels by up to seven times
Painters are prone to suffer from dermatitis, bronchitis and asthma and nervous system illness
Petrochemical paint manufacturers are now promoting water based paints as an alternative to their toxic ranges but these actually contain more chemicals than the oil based type they are intended to replace
Several components of water based paints evaporate for a long time after painting, and some may affect human physiology
Vinyl resins, such as those found in conventional emulsion wall paints can damage lungs, liver and blood, are skin irritants and possible carcinogens
Recycled latex paint is made using standard paint processing equipment. This means that industries need not spend any extra money for the equipments.
They also don’t have to spend any extra money for testing the green product as recycled paint runs through the same quality tests that are used in the manufacture of new, non-recycled paint.
In manufacturing, using post-consumer paint reduces the energy consumption and pollution of paint production. It also assures that a usable product is diverted from the waste stream.
Recycled latex paint is applied using all conventional painting methods — spray, brush or roller, can use it anywhere one might use non-recycled. Hence extra cost of making some special painting methods is saved.
“Natural” paints are made mostly of renewable or abundant naturally occurring materials such as citrus oil, lime, clay, linseed oil and chalk. Hence the cost of production is reduced when compared to common paints.
Natural paints are healthier and more environmentally sound than latex or oil paints. Hence less problems with following the EPA regulations with VOC’s emissions’.
These paints are made from natural plant and mineral ingredients, no petrochemicals or chemical preservatives.
These products are non-combustible, odorless and non allergenic, so they are great for the chemically sensitive, and an excellent, healthier option overall. Their impact to the environment from manufacturing is very low.
Manufacturers are also making far more environmentally friendly adhesives, so green home builders are more likely to use them.

DGP 1.0 Specifications• To run DGP 1.0 Microsoft Access is needed.
• DGP 1.0 can be downloaded from http://p2tools.utoledo.edu/ppistools.htm
Future Work
The DGP Database is updated on a regular basis and will grow as new information is made available. In the future, the tool base could further be developed in the following ways:
More product categories could be included, thereby increasing the products available in the data base.
Further, the advantages and disadvantages of green products as well as non-green products of the same category, which is available in the market, can be compared. This will help the consumers in deciding more firmly as to why green products are far better than the non-green ones. Also the prices can be compared.
Also all the available guidelines as well as requirements for the green products could be included in the tool which will help the industries to look for the product standards requirements for greener products.