data use challenges and the potential of live data
TRANSCRIPT
Data use challenges and the potential
of live data visualization tools A case study of health data-use workshops in Zambia
November, 2017
Master’s Thesis
Peter Mogaka Ogega

Data use challenges and the potential of live
data visualization tools
“…data needs not only to be reviewed, it needs to be contextualized, synthesized, and it need
to be prioritized.” – Zambia partner representative; on improving data use in Zambia.
A case study of health data-use workshops in Zambia
Peter Mogaka Ogega

II
© Peter Mogaka Ogega
2017
Title
Peter Mogaka Ogega
http://www.duo.uio.no
Print: Reprosentralen, University of Oslo
III
Abstract
Zambia’s Health Management Information System (HMIS) is currently undergoing a
strengthening process. One aim of the strengthening process is to improve data use. Data in
Zambia´s HMIS receives limited usage for data-informed decision making. Earlier studies
have identified some challenges to data use such as poor data quality, data availability etc.
This thesis is an exploratory interpretive study on Zambia´s data-use workshops and how they
contribute to data use in Zambia public health domain. It looked to identify how and for what
purposes data is used, what are the key challenges to data use, and the prospects of
introducing live data visualization tools to strengthen data-use workshops and data use. The
study has involved users from all levels of Zambia´s HMIS in order to identify common
thoughts and ideas on live data visualization tools; and data use at large. It mainly involved
attending a data-use workshop, conducting interviews along with document analysis.
The study identifies key challenges to data use as financial constraints, infrastructure
constraints, poor data quality, limited data availability and accountability and lack of key data
competencies by personnel. The implementation of live data visualizations tools, for the
strengthening of DIMs and data use, was likely to impact both positively. However, while the
study´s findings suggest that live data tools could potentially improve data use through
improving data access, data availability and data quality, such measures would also be
challenged by general financial and infrastructural constraints. In addition, I develop a model
for the potential introduction of live data visualization tools. The model identifies reciprocal
and determinant relationship between the challenges and the live data visualization tools.
IV
Acknowledgement
All this work wouldn`t be possible on my own. I would therefore like to acknowledge the
efforts of several people. First, I would like to thank my supervisor Terje Aksel Sanner for his
guidance, support and light moments throughout the journey of writing this thesis. I would
like to thank the Akros team and Zambian team; for making my stay as comfortable as
possible. Scott Russpatrick for informative talks, help and review, Natasha Mwelwa for being
my ‘PA’ during my visits, Albert for making sure I got the right materials for my research,
Tabonga for her assistance, and Tabo for helping me settle in well during my visits to Lusaka.
I would like to thank my ‘study buddy’ and friend Anastasia Parramore for the good times,
thoughts on various topics and the chit-chat. They were always interesting. Martine Wanjiku
for helping me spellcheck, tremendous love and support. Lastly, I would like to thank my
family for believing me, supporting me, and letting me make my own decisions; including
studying abroad.

V
Table of content
Table of Contents Data use challenges and the potential of live data visualization tools ........................................ I
Abstract .................................................................................................................................... III
Acknowledgement .................................................................................................................... IV
Table of content ......................................................................................................................... V
List of figures ........................................................................................................................ VIII
List of tables ............................................................................................................................. IX
Abbreviations ............................................................................................................................ X
1 INTRODUCTION .............................................................................................................. 1
1.1 Problem statement ....................................................................................................... 1
1.2 Research context .......................................................................................................... 2
1.3 Motivation .................................................................................................................... 3
1.3.1 Personal motivation .............................................................................................. 3
1.3.2 Practical motivation .............................................................................................. 3
1.3.3 Knowledge motivation ......................................................................................... 4
1.3.4 Assumptions ......................................................................................................... 4
1.4 Research Questions ...................................................................................................... 4
1.5 Thesis structure ............................................................................................................ 5
2 LITERATURE REVIEW ................................................................................................... 7
2.1 Data use in Low-resource context: data-use workshops and data visualization tools. 7
2.1.1 Data use workshops and Peer reviews ................................................................. 7
2.1.2 Scorecard .............................................................................................................. 9
2.1.3 Summary ............................................................................................................ 10
2.2 Conceptual framework ............................................................................................... 11
2.2.1 Data use and decision making ............................................................................ 11
2.2.2 District level data use and decision-making ....................................................... 14
2.2.3 Summary ............................................................................................................ 16
3 BACKGROUND .............................................................................................................. 18
3.1 Zambia overview ....................................................................................................... 18
3.2 Health System in Zambia ........................................................................................... 21
3.3 Health Information Systems Program (HISP) and District Health Information System
2 (DHIS2) ............................................................................................................................. 24
3.3.1 Health Information Systems Program ................................................................ 24
3.3.2 District Health Information System 2 ................................................................ 25

VI
3.3.3 Visualization tools .............................................................................................. 26
3.3.4 DHIS2 in Zambia ............................................................................................... 28
3.4 MOH Cooperating Partners ....................................................................................... 28
3.4.1 UNICEF and Millennium Development Goals inititiative (MDGi) .................. 28
3.4.2 Akros .................................................................................................................. 30
3.5 HMIS strengthening project ...................................................................................... 31
3.5.1 Quality Improvement ......................................................................................... 31
3.5.2 District Integrated Meeting ................................................................................ 32
3.6 Summary .................................................................................................................... 32
4 METHODS ....................................................................................................................... 34
4.1 Research Strategy ...................................................................................................... 34
4.1.1 Research approach .............................................................................................. 34
4.1.2 Reflexivity .......................................................................................................... 35
4.2 Research methods ...................................................................................................... 37
4.2.1 Case study ........................................................................................................... 37
4.3 Data collection ........................................................................................................... 38
4.3.1 Access and study setting ..................................................................................... 38
4.3.2 Data collection methods ..................................................................................... 39
4.3.3 Sources for data collection ................................................................................. 44
4.4 Data analysis .............................................................................................................. 45
4.5 Limitations ................................................................................................................. 50
4.6 Ethical considerations ................................................................................................ 51
4.7 Summary .................................................................................................................... 52
5 EMPIRICAL FINDINGS ................................................................................................. 53
5.1 Capacity of Personnel ................................................................................................ 53
5.1.1 The participants .................................................................................................. 53
5.1.2 Computer literacy ............................................................................................... 54
5.1.3 Data presentation, review and analysis .............................................................. 54
5.1.4 DHIS2 Capability ............................................................................................... 55
5.1.5 Staffing ............................................................................................................... 56
5.2 Process/ Routine for DIMs ........................................................................................ 56
5.2.1 Standard DIM agenda/framework ...................................................................... 56
5.2.2 Measure of success and Purpose of DIMs .......................................................... 58
5.2.3 District Scorecard ............................................................................................... 59
5.3 Data quality and Availability ..................................................................................... 60
5.3.1 Data quality, availability, accessibility and use ................................................. 60
5.3.2 DHIS2 clean-up and Live DHIS2 ...................................................................... 62
VII
5.3.3 Population data ................................................................................................... 62
5.4 Infrastructure .............................................................................................................. 63
5.4.1 Location of DIMs ............................................................................................... 63
5.4.2 Funding ............................................................................................................... 63
5.4.3 Internet connectivity and Electricity .................................................................. 64
5.5 Quality Improvement ................................................................................................. 64
5.6 Governance, Donors and Partners ............................................................................. 66
5.6.1 Funding ............................................................................................................... 67
5.6.2 Donor collaboration ............................................................................................ 68
6 RESULTS AND DISCUSSION ...................................................................................... 69
6.1 Results........................................................................................................................ 69
6.1.1 Data use .............................................................................................................. 69
6.1.2 Key challenges to data use ................................................................................. 70
6.2 Discussions ................................................................................................................ 74
6.2.1 Engaging data users and data producers ............................................................. 74
6.2.2 Improving data quality ....................................................................................... 75
6.2.3 Improving data availability ................................................................................ 76
6.2.4 Building capacity and competencies .................................................................. 77
6.2.5 Straightening organizations data demand and use infrastructure ....................... 78
6.2.6 Monitoring and evaluation, communicating data demand and use successes .... 79
6.2.7 Live data visualization tools ............................................................................... 79
6.3 Summary .................................................................................................................... 83
7 CONCLUSION AND FURTHER RESEARCH ............................................................. 85
7.1 Summary of the research process .............................................................................. 85
7.2 Reflections and conclusion ........................................................................................ 85
7.3 Further Research ........................................................................................................ 86
REFERENCES ......................................................................................................................... 88
APPPENDIX ............................................................................................................................ 92
Appendix A – DIM opening presentation ................................................................................ 93
Appendix B – Data quality reports ........................................................................................... 94
Appendix C – Informed consent .............................................................................................. 96
Appendix D – Interview guides ................................................................................................ 97
Appendix E – Rufunsa district scorecard ................................................................................. 98
Appendix F – DIM agenda ....................................................................................................... 99
VIII
List of figures
Figure 1; Scorecard example .................................................................................................. 9 Figure 2; The conceptual framework ..................................................................................... 12 Figure 3; Map of Zambia and her neighboring countries. ................................................... 18
Figure 4; A Zambian Chief with a tablet used to track his chiefdom´s performance .............. 20 Figure 5; Lusaka province ................................................................................................... 21 Figure 6; a rural health center in Zambia ................................................................................. 22 Figure 7; a visualization of Zambia´s Health System .............................................................. 23 Figure 8; CC at work ................................................................................................................ 24
Figure 9; DHIS2 role out ..................................................................................................... 25
Figure 10; DHIS as a data warehouse .................................................................................... 26
Figure 11; dashboard example ............................................................................................... 27 Figure 12; RMNCH&N sample scorecard ............................................................................... 28 Figure 13; MDGi presence .................................................................................................. 29 Figure 14; QI committees structure .......................................................................................... 32 Figure 15; observation notes from the DIM ............................................................................. 43
Figure 16; data analysis notes and category mapping and relationships .................................. 48 Figure 17; data analysis - live data tools model relation and development ............................. 50
Figure 18; Rufunsa District´s facility presentations ................................................................. 57 Figure 19; district scorecard presentation and discussion ........................................................ 59
Figure 20; A section of Rufunsa District´s scorecard for, quarter 3 and 4 of 2016. ................ 60 Figure 21; QI project presentation ............................................................................................ 65
Figure 22; DC addressing the DIM .......................................................................................... 67 Figure 23; A model for synthesizing the potential of live data visualization tools use ........... 80

IX
List of tables
Table 1; Summary of framework ............................................................................................. 17 Table 2; list of data sources ...................................................................................................... 44 Table 3: Data analysis categories, key findings and framework intervention relation ............ 49
Table 4; Participants and their designations ............................................................................. 54 Table 5; Challenges, interventions and their measures ............................................................ 72
X
Abbreviations
7NDP Seventh National Development Plan
AFD African Development Index
CC Community Champion
CHA Community Health Assistant
CHAZ Churches Health Associations of Zambia
CHW Community Health Worker
CLTS Community-led Total Sanitation
CP Cooperating Partner
DC District Commissioner
DDH District Director of Health
EHT Environmental Health Technician
DHIO District Health Information Officer
DHIS2 District Health Information System 2
DHMT District Health Management Team
DHO District Health Office
DIM District Integrated Meeting
HIS Health Information System
HISP Health Information Systems Program
HMIS Health Management Information Systems
IS Information Systems
J2ME Java 2 Platform, Micro Edition
MOH Ministry of Health
NGO Non-Governmental Organization
NHSP National Health Sector Strategic Plan
PHO Provincial Health Office
PHC Primary Health Care
PMO Provincial Medical Office
PRISMA Preferred Reporting Items for Systematic reviews and Meta-Analyses
RMNCH&N Reproductive, Maternal, Newborn and Child Health and Nutrition
UiO University of Oslo
UNFPA United Nations Population Fund

XI
UNICEF United Nations Children’s Fund
WASH Water, Sanitation and Hygiene
WHO World Health Organization


1
1 INTRODUCTION This thesis is a study about data use, its challenges and the potential of utilizing live data
visualization tools in Zambia´s public health domain. It primarily involves attending a data-
use workshop and conducting interviews. The study identifies key challenges to data use as
financial constraints, infrastructure constraints, poor data quality, limited data availability and
accountability and lack of key data competencies by personnel. The implementation of live
data visualizations tools, for the strengthening of District Integrated Meetings (DIM) and data
use, was likely to impact both positively i.e strengthen and improve them than the current
situation. However, while the study findings suggest that live data tools could potentially
improve data use through improving data access, availability and quality, such measures
would also be challenged by general financial and infrastructural constraints.
In addition, I develop a model for the synthesis of the potential introduction of live data
visualization tools (see chapter, 6.2.7, page 79). The model identifies the relationship between
the challenges identified and the live visualization tools and uses this to group them. Two
groups of challenge are identified;
Reciprocal challenges - affect and are affected by the various challenges identified. These
include poor data quality, lack of key data competencies by staff, limited data availability,
access and accountability, poor partner coordination and lack of standardization or
standardized processes/procedure.
Determinant challenges - limit the introduction of live data tools. These are infrastructural
and financial constraints.
This chapter includes a statement of the general problem. The research context and the
motivations – describing the purpose and the significance of the study - are to be discussed
next, followed by the study's assumptions and research questions. Lastly, an overview of this
thesis structure will be outlined.
1.1 Problem statement Health management information systems (HMIS) are used to generate data health status, and
health service provision data - of a population. The intention being; use of this data for
planning and decision-making at every level of the systems - with emphasis on the level
2
where they are produced. The health information system is greatly inclined towards
quantitative data. For example, mortality of a population overtime, description of health status
among others (AbouZahr and Boerma, 2005).
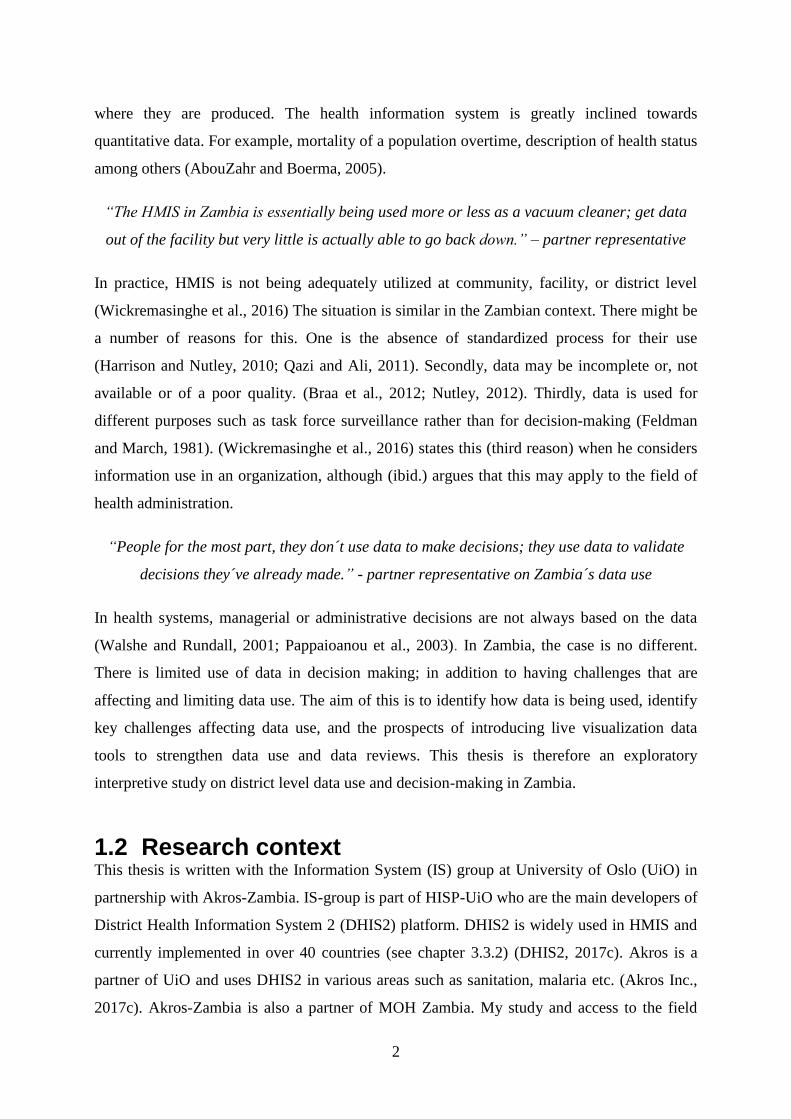
“The HMIS in Zambia is essentially being used more or less as a vacuum cleaner; get data
out of the facility but very little is actually able to go back down.” – partner representative
In practice, HMIS is not being adequately utilized at community, facility, or district level
(Wickremasinghe et al., 2016) The situation is similar in the Zambian context. There might be
a number of reasons for this. One is the absence of standardized process for their use
(Harrison and Nutley, 2010; Qazi and Ali, 2011). Secondly, data may be incomplete or, not
available or of a poor quality. (Braa et al., 2012; Nutley, 2012). Thirdly, data is used for
different purposes such as task force surveillance rather than for decision-making (Feldman
and March, 1981). (Wickremasinghe et al., 2016) states this (third reason) when he considers
information use in an organization, although (ibid.) argues that this may apply to the field of
health administration.
“People for the most part, they don´t use data to make decisions; they use data to validate
decisions they´ve already made.” - partner representative on Zambia´s data use
In health systems, managerial or administrative decisions are not always based on the data
(Walshe and Rundall, 2001; Pappaioanou et al., 2003). In Zambia, the case is no different.
There is limited use of data in decision making; in addition to having challenges that are
affecting and limiting data use. The aim of this is to identify how data is being used, identify
key challenges affecting data use, and the prospects of introducing live visualization data
tools to strengthen data use and data reviews. This thesis is therefore an exploratory
interpretive study on district level data use and decision-making in Zambia.
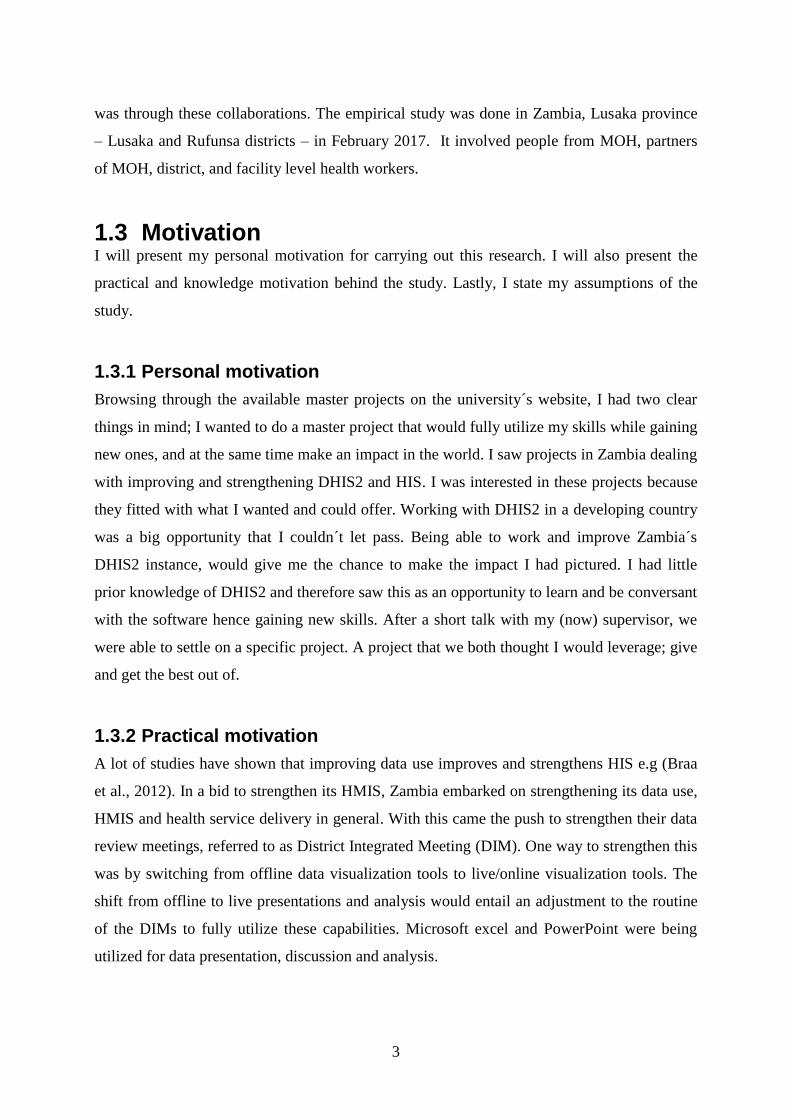
1.2 Research context This thesis is written with the Information System (IS) group at University of Oslo (UiO) in
partnership with Akros-Zambia. IS-group is part of HISP-UiO who are the main developers of
District Health Information System 2 (DHIS2) platform. DHIS2 is widely used in HMIS and
currently implemented in over 40 countries (see chapter 3.3.2) (DHIS2, 2017c). Akros is a
partner of UiO and uses DHIS2 in various areas such as sanitation, malaria etc. (Akros Inc.,
2017c). Akros-Zambia is also a partner of MOH Zambia. My study and access to the field
3
was through these collaborations. The empirical study was done in Zambia, Lusaka province
– Lusaka and Rufunsa districts – in February 2017. It involved people from MOH, partners
of MOH, district, and facility level health workers.
1.3 Motivation I will present my personal motivation for carrying out this research. I will also present the
practical and knowledge motivation behind the study. Lastly, I state my assumptions of the
study.
1.3.1 Personal motivation
Browsing through the available master projects on the university´s website, I had two clear
things in mind; I wanted to do a master project that would fully utilize my skills while gaining
new ones, and at the same time make an impact in the world. I saw projects in Zambia dealing
with improving and strengthening DHIS2 and HIS. I was interested in these projects because
they fitted with what I wanted and could offer. Working with DHIS2 in a developing country
was a big opportunity that I couldn´t let pass. Being able to work and improve Zambia´s
DHIS2 instance, would give me the chance to make the impact I had pictured. I had little
prior knowledge of DHIS2 and therefore saw this as an opportunity to learn and be conversant
with the software hence gaining new skills. After a short talk with my (now) supervisor, we
were able to settle on a specific project. A project that we both thought I would leverage; give
and get the best out of.
1.3.2 Practical motivation
A lot of studies have shown that improving data use improves and strengthens HIS e.g (Braa
et al., 2012). In a bid to strengthen its HMIS, Zambia embarked on strengthening its data use,
HMIS and health service delivery in general. With this came the push to strengthen their data
review meetings, referred to as District Integrated Meeting (DIM). One way to strengthen this
was by switching from offline data visualization tools to live/online visualization tools. The
shift from offline to live presentations and analysis would entail an adjustment to the routine
of the DIMs to fully utilize these capabilities. Microsoft excel and PowerPoint were being
utilized for data presentation, discussion and analysis.

4
Having briefly worked with the development of the Reproductive, Maternal, Newborn and
Child Health and Nutrition (RMNCH&N) Scorecard (see page 27), it was therefore, deemed,
necessary to attended a DIM (to get a feel of what it entails – identify the good and bad
practices) before any adjustments to its routine would be made. Getting the real picture of the
current situation was key, instead of assumptions-based changes. The focus areas settled on
were district data use and its challenges, and the introduction of live data visualization tools at
the DIMs.
1.3.3 Knowledge motivation
A lot has been written about improving data quality and the health systems data collection, for
instance (Abajebel et al., 2011; Chitama et al., 2011; Braa et al., 2012). On the contrary, little
has been written about how data is being used. The situation is similar when it comes to the
utilization of live data visualization tools in data use and decision-making processes. (Braa et
al., 2012) writes about Zanzibar and how use of DHIS2 positively impacted data use
workshops.
In contrast, there is little literature about challenges facing such live data visualization tools,
and how to strengthen data reviews/ data use workshops beyond infrastructure and financial
constraints. My knowledge motivation hence stems from shedding more light on the
influence, challenges and impact such visualization tools have on data use and data review
meetings.
1.3.4 Assumptions
My assumption going into the study was that attending one DIM would give a general
overview of what goes on in (all) DIMs. It was my assumption that practices of the DIMs
were more similar than different. My assumption was however, challenged. During the study,
I found that DIMs varied from province to province. This implies that practices varied. Some
practices may have been close, while others may have differed with a huge margin. Some
practices were common across the DIMs, according to the empirical data.
1.4 Research Questions The study looks at district level data use, its challenges, as well as utilization of live data
visualization tools in DIMs. It was therefore necessary to gain a deep insight of these DIMs;

5
the processes of data use, decision-making and the challenges. The research is thus guided by
these principles. It looks at how data is being used, the challenges affecting data use, and the
utilization of live data visualization tools.
The research questions are therefore;
1) How is data being used (how and for what purposes), and what are the key obstacles
to data use?
2) What are the prospects of using live data visualization tools to strengthen DIMs and
data use?
1.5 Thesis structure Chapter 2 presents the adopted framework used as the lens on the empirical data, related
literature on data use in and HMIS context, district level decision-making and the use of
scorecards as a visual tool. I discuss the key implications from this related literature and
highlight a few gaps that exist.
Chapter 3 describes the context and background of the study. I describe the relevant context
of the country (Zambia) and district where the research was done. In particular I elaborate on
Zambia´s current health system, HMIS strengthening efforts, and data collection routines. I
also explain the role of the Health Information Systems Program (HISP), and the District
Health Information System 2(DHIS2) in the Zambian HMIS context. Finally, I present some
of MOH Zambia Cooperating Partners (CPs) as they play a central role in supporting and
funding HMIS data use initiatives in Zambia.
Chapter 4 describes my methodology. The research approach, the research methods, data
collection methods and data sources are presented and discussed. Data analysis, study
limitation along with ethical considerations are addressed here.
Chapter 5 presents my empirical findings. Findings presented are on data use, capacity of
personnel, infrastructure, data quality, Quality Improvement (QI), partner involvement, and
funding.

6
In Chapter 6 I discuss further the empirical findings by applying the analytical framework. I
present the results from the study and highlight the relationship between the two research
questions.
Chapter 7 concludes and gives a summary of the thesis as well as suggesting areas for further
research.
7
2 LITERATURE REVIEW This chapter has two sections: the first section, presents related literature on data use-
workshops in low-resource settings, visualization tools such as scorecards and finally a
summary. The second section present the adopted framework as well as literature on
challenges to data use in low-resource setting. Finally, a comparison of the adopted
framework and the challenges are made in the form of a table.
2.1 Data use in Low-resource context: data-use workshops and data visualization tools. The following section looks at related literature on data reviews and data use. It presents data
on data use workshops/peer reviews, their relationship to data use, and scorecards. It also
presents the impact they have on data use and decision-making. A summary concludes the
section.
2.1.1 Data use workshops and Peer reviews
The notion of peer based review has a multiple definitions and functions, and is applied in
diverse fields and studies (Grol, 1994). Peer based review (considered same as data-use
workshop in this thesis) is seen as an evaluation by peers collaborating in a practice, intended
to achieve continuous improvement Various peer review models have been used for
improving clinical performance, and internal quality of care (ibid.). There is little information
about data use workshops routine itself along with its goals and purposes. Countries such as
Zambia, Malawi and Tanzania have data use workshops. In these cases, they´re intended to be
conducted quarterly with involvement of stakeholders from all levels (facility, national and
partner).
A study done by (Braa et al., 2012) on improving data quality and data use through data-use
workshops found out that data-use workshops with participation of data users themselves can
improve HIS, as well as enhancing staff capacity for presentation, information use, and
analysis for decision-making. Although not much is mentioned about the data-use workshops
routine itself, in the study data was presented online using DHIS2 and its analytical tools such
as pivot tables and graphs. Standardized analysis templates based on MDG and local
strategies were also used. Improvements were then noted in some of the areas such as;

8
Data quality; use of data quality checks, as well as heated discussion on data quality issues in
the workshops, contributed to improved data quality.
Data analysis and interpretation; in the beginning, presentation focused on raw data, but as
competency in HMIS tasks (data analysis tools, targets and indicators) increased, self-
assessment was strengthened. Emphasis on targets and indicators helped increase their use at
local levels.
Integration; several databases were integrated and this allowed members to better understand
the roles played by the various actors. This resulted in improved practical collaboration.
Problem-solving; through increased appreciation for improved data quality and more
competency in performing HMIS tasks, District Health Management Teams (DHMT) were
able to solve daily data management issues.
Presentation and practical computer skills; by use of DHIS for analysis, presentation and
dissemination, the workshop participants improved their computer skills along with
knowledge of basic software and computer hardware e.g backup. Presentation skills of the
DHMT were initially weak but later on developed enough for them to run the workshop
without outside facilitators. They were used to drawing graphs and using PowerPoint but
standardized templates for presentations were developed.
“The workshops directly contributed to improvements in data coverage, data set quality and
rationalization, and local use of target indicators.” (ibid.). The research thus proved their
hypothesis - that more use of data leads to improved data quality, which leads to substantial
information use innovations in. Eventually, the culture of non-use and poor quality of data
was broken.
(Moyo et al., 2014) investigated the potential of peer based review strategy to improve data
quality and data use in Malawi. “Peer based reviews can contribute to strengthening HIS in
developing countries through promoting learning networks, data quality checks, data use, and
enhancing collaboration among managers.” (ibid.). (ibid.) did a case study based on
implementation of quarterly zonal-reviews aimed at strengthening HIS. The peer based
reviews provided an opportunity for skills development of health workers, establishment of
learning networks to improve coordination and collaboration among stakeholders and
improved data quality and promotion of its use in decision making processes. (ibid.) states
9
that peer review has the potential to break the vicious circle of poor data quality and limited
data use.
“The key to the effort is people, not technology, and that success lies in sharpening their
skills, motivating them and enabling them to work effectively.” (Srinivasan, 1989) A study on
how Primary Health Care (PHC) performance data use in monthly peer review improved the
health workers’ motivation, skills and professionalism in Maharashtra, India (ibid.) It also
found that restricting collection, analysis and decision-making programs to top management
make them have limited use. Extending processes to include peers and lowest level workers
increases their (processes) benefits.
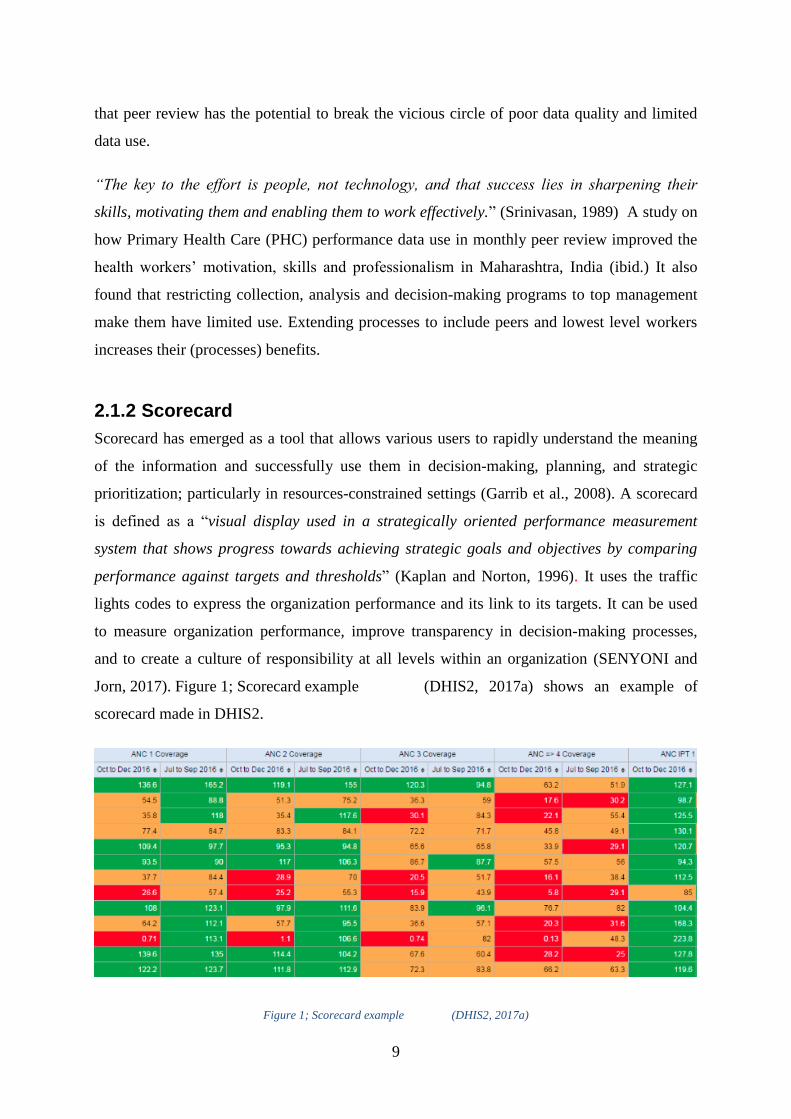
2.1.2 Scorecard
Scorecard has emerged as a tool that allows various users to rapidly understand the meaning
of the information and successfully use them in decision-making, planning, and strategic
prioritization; particularly in resources-constrained settings (Garrib et al., 2008). A scorecard
is defined as a “visual display used in a strategically oriented performance measurement
system that shows progress towards achieving strategic goals and objectives by comparing
performance against targets and thresholds” (Kaplan and Norton, 1996). It uses the traffic
lights codes to express the organization performance and its link to its targets. It can be used
to measure organization performance, improve transparency in decision-making processes,
and to create a culture of responsibility at all levels within an organization (SENYONI and
Jorn, 2017). Figure 1; Scorecard example (DHIS2, 2017a) shows an example of
scorecard made in DHIS2.
Figure 1; Scorecard example (DHIS2, 2017a)

10
(ibid.) studies the design and implementation of a Maternal and Child Health scorecard for the
EAC. It enabled participating members to use the scorecard as a common tool for discussion
and communication. It created a shared understanding and hence aligning s at the regional
level. According to (ibid.), it has a mediator’s capacity to support collaboration,
communication and sharing of knowledge among the participating members.
Afghanistan introduced a balance scorecard (BSC) performance system in 2004 (Edward et
al., 2011). It was used to manage the delivery of PHC services. A study by (ibid.) on the
trends of the BSC found that it was successfully utilized. It was used to evaluate and improve
health service capacity and service delivery by use of performance indicators. However, to
ensure its continued relevance, effectiveness and efficiency measures, it needed to be
reconfigured to accommodate changes in health systems´ policy (ibid.).
A study by (Rosinski et al., 2013) on efforts to control diarrhea finds that (introducing) a new
diarrhea control scorecard could help track progress, establish accountability and
transparency, focus efforts towards the most effective interventions and bring out
inadequacies in diarrhea control attempts to the attention of various stakeholders such as
Ministries of Health and donors.
2.1.3 Summary
All in all, data-use workshops encourage self-assessment. They also present an opportunity to
compare presentation and performances; pinpointing common problems relating to data
quality and health services performance. Even further, they promote local involvement and
improve data quality. In a technical sense, they provide feedback for HMIS development such
as the revision of indicators, the design and development of new functionalities etc. They are
therefore a very important tool as far as HMIS and data use is concerned.
There are various ways of creating a scorecard. They include; the Alma scorecard (ALMA,
2017), making it on excel such as the one seen in fFigure 1; Scorecard example
(DHIS2, 2017a)1, use of pivot table on DHIS2 (DHIS2, 2017a) - just to mention a
few. So far literature suggests that the utilization of a scorecard improves data use and health
service delivery; although their sustainability has to be considered in their design. As
mentioned above, it´s an emerging tool. It thus needs more and further research is therefore
11
needed to identify its main impact and contribution to data use and decision-making,
especially in low-resource settings.
2.2 Conceptual framework This section presents the conceptual framework that is used for data analysis. Moreover, it
presents data use and decision-making at the district level – low-resource settings. IT also
presents challenges to data use. A summary then discusses the relationship between the
conceptual framework interventions and challenges presented.
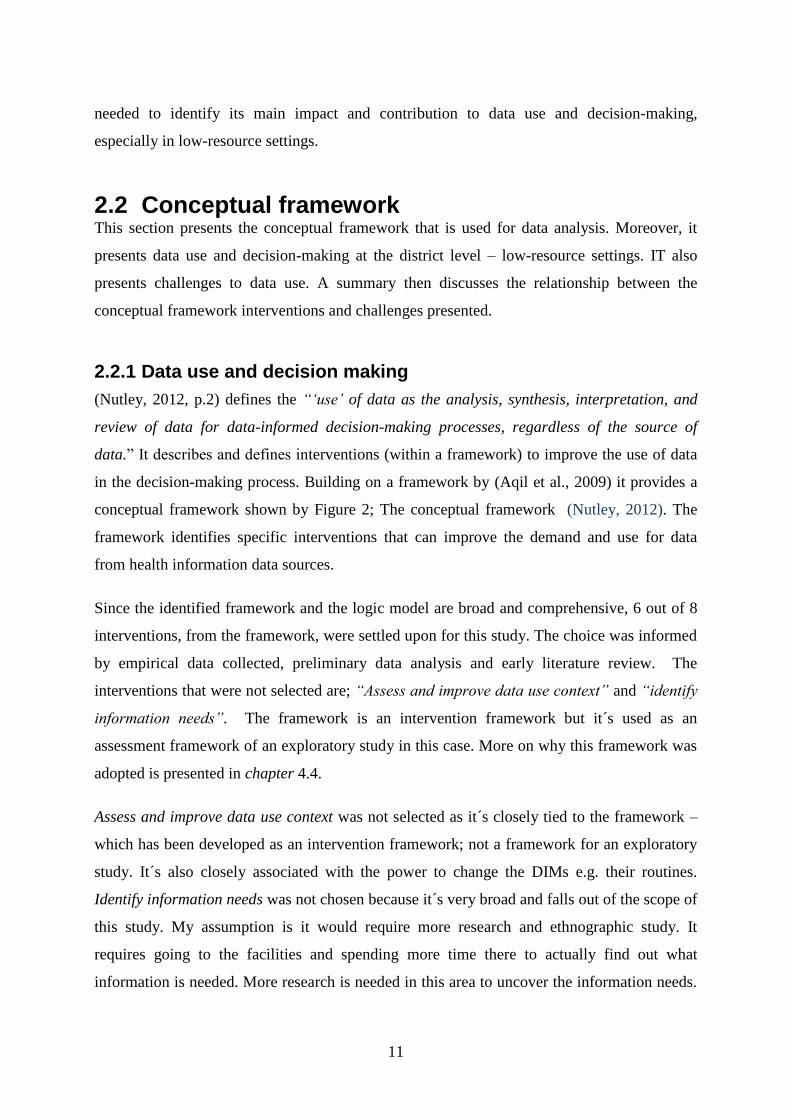
2.2.1 Data use and decision making
(Nutley, 2012, p.2) defines the “‘use’ of data as the analysis, synthesis, interpretation, and
review of data for data-informed decision-making processes, regardless of the source of
data.” It describes and defines interventions (within a framework) to improve the use of data
in the decision-making process. Building on a framework by (Aqil et al., 2009) it provides a
conceptual framework shown by Figure 2; The conceptual framework (Nutley, 2012). The
framework identifies specific interventions that can improve the demand and use for data
from health information data sources.
Since the identified framework and the logic model are broad and comprehensive, 6 out of 8
interventions, from the framework, were settled upon for this study. The choice was informed
by empirical data collected, preliminary data analysis and early literature review. The
interventions that were not selected are; “Assess and improve data use context” and “identify
information needs”. The framework is an intervention framework but it´s used as an
assessment framework of an exploratory study in this case. More on why this framework was
adopted is presented in chapter 4.4.
Assess and improve data use context was not selected as it´s closely tied to the framework –
which has been developed as an intervention framework; not a framework for an exploratory
study. It´s also closely associated with the power to change the DIMs e.g. their routines.
Identify information needs was not chosen because it´s very broad and falls out of the scope of
this study. My assumption is it would require more research and ethnographic study. It
requires going to the facilities and spending more time there to actually find out what
information is needed. More research is needed in this area to uncover the information needs.
12
Last but not least, the two interventions don´t directly point to a specific problem or challenge
in this study.
Although improve data quality and improve data availability are separate in figure 2, they are
initially discussed as one in the conceptual framework. However, for data analysis and
discussions, they are slightly revised; split into 2(as in figure 2.) More on this revision and
examples can be found in chapter 4.4.
Figure 2; The conceptual framework (Nutley, 2012)
The 6 interventions are;
Engaging data users and data producers
Data users – those who use data in program development and improvement, and data
producers - those who design, implement, and manage information systems and research; lack
of interaction between data producers and data users leads to breakdowns in the decision-
making cycle (Lomas, 1997; 2007).

13
When data users and data producers collaborate, they become more aware of available data
sources, data collection methods and processes, and the quality of their data. They have the
chance to overcome barricades to data use, besides improving the sharing of data resources.
By understanding who the data users and data producers are, then linking their work together;
the Information cycle is strengthened. Moreover, the value of data with regards to program
improvement becomes clear (Lomas, 1997; Berg, 2001; Lomas, 2007; Patton, 2008;
Blanchard and Aral, 2010; Koon et al., 2012).
Improving data quality; improving data availability
Poor data quality leads to drop in demand for data, hence crippling the cycle of data informed
decision making (Foreit et al., 2006; Braa et al., 2012). There is therefore, need to develop,
communicate and implement data quality procedures, in addition to training and re-training of
health personnel on data quality techniques and procedures/measures. Consistent data use
occurrence requires high quality data, in that the data users are assertive that the data they are
using is accurate, timely and complete. Without quality data; informed decision making will
not occur, and program efficiency and effectiveness will suffer (Mavimbe et al., 2005).
There is also the need to improve data availability in terms of synthesis, communication, and
access. Data users have different roles, different information needs, different interest levels in
the decision-making process (Davies et al., 2011). Well-designed information systems often
comprise of information technology infrastructure, report templates and policies to support
the communication of analyzed data through dissemination and feedback procedures. Data
users’ ability to access and share data easily is always under-developed in these systems. Data
analysis, access and communication need to be ameliorated; to support use of the information
in decision making (Aqil et al., 2009).
Building capacity in data use core competencies
Competencies include skills in data analysis, presentation, interpretation, synthesis and the
creation of data-informed programmatic recommendations. Data users often struggle with
these competencies. They therefore need training on analysis, critical review and data
interpretation hence understanding the data they possess, data they will need and when, so
that they can demand it. Data producers often receive short term training (as part of M&E
training) with limited follow up. Skills are therefore not totally developed. These newly
14
trained personnel are thus not well equipped to apply the new skills in their work setting
(Clotteau et al., 2011).
Strengthening the organization’s data demand and use infrastructure
Colleagues, data users and data producers function in an organizational context (Aqil et al.,
2009). The organization is administrated by rules, processes, values, and systems. These rules,
processes, values, and systems have the capability of supporting or impeding an individual’s
capacity to use data in decision making (ibid.). An organization that provides clear guidelines
for data quality processes, and define roles responsibilities and roles related to using data, will
strengthen other interventions (in place) to improve data informed decisions making. Standard
operating procedures and policies, that govern how work is accomplished, should distinctly
state the role and value of data in an organizational setting.
Monitoring and evaluating, communicating data demand and use successes.
Data users are more likely to use data if they highly value data informed decisions making.
Stakeholders and decision makers will only use data for decision making if only they put
value on data (Lavis et al., 2006). Training or positive messages about benefits of using data
in decision making or positive experiences of data informed decisions making can be used to
build this value. Frequent use of data for decision-making increases the data demand. (Foreit
et al., 2006).
2.2.2 District level data use and decision-making
HMIS used in low-income setting countries collect a lot of data. As mentioned earlier, data
use at district and community level is low. There are several reasons for this e.g poor data
quality (Braa et al., 2012). Moreover, much as been written about data use and district
decision making using data collected by HMIS. For example, (Wickremasinghe et al., 2016)
did a systematic literature review, following PRISMA statement and guidelines (Moher et al.,
2009), on district decision making for health in low-income settings (e.g Ethiopia, Nigeria,
Zambia etc). It explores manners in which health managers, and district administrators use
health data to make decisions. Additionally, it outlines the decision-making tools used, and
pinpoint challenges faced when using these tools.
15
It found 12 examples of tools to assist decision making at the district level. At least all of
them had two key stages: identification of priorities, and development of an action plan to
address them. Those with more steps, four incorporated steps to review or monitor action
plans settled upon (suggesting the use of HMIS data). Challenges to the decision-making
processes identified, were categorized into 3 primary categories;
The availability and quality of health and health facility data
Unreliable data, untimely data, difficulties accessing data and challenges agreeing on the
minimum data set for inclusion in HMIS were some of the challenges encountered.
Examples include; (La Vincente et al., 2013) where lack of data and data accessibility
difficulties were reported; the cases of (Maluka et al., 2010; Nnaji et al., 2010; Maluka et al.,
2011) unreliable data and untimely data production couldn’t contribute to decision-making
process.
Human dynamics (Social and political dynamics in the decision-making process)
Political conflicts would lead to decisions being made, but not based on data and thus some
issues remained unsolved. Following of the national level goals, and priorities and ignoring
local data was also noted. Training in addition to informal mentoring was needed - to develop
administration, management and other skills related to planning.
Examples include: In Nigeria, (Nnaji et al., 2010) notes that neither the private sector
representative nor the community were wholly involved in decision-making; (De Savigny,
2008) states that capacity strengthening (through training) was needed – besides emphasizing
that tools are important but not sufficient; in (Murthy, 1998) local data was ignored for
decision-making, instead national priorities were used.
Financial constraints.
For instance, discontinued plans and expenditure due to lack of flexible funds; competitive
and time-consuming process of securing funds; limited overall funding. It was easy to lose
motivation over time.
16
Examples include: in (Maluka et al., 2011) delays in funds disbursement from the central
government constrained the decision–making process. (ibid.) notes a disconnection of plans
and expenditure due to the lack of flexible funds.
Review of the data revealed three recurring features: one, relevant and good quality data are
essential. Two, a structured decision-making process needs to include activities/events that
will aid building of consensus. Three, the community can have a well-defined role.
“Transparency and accountability are underlying factors for a standardized decision-making
process.” - (Wickremasinghe et al., 2016). It then recommends that the decision-making
process is standardized to help replicability - which was not the case in any of the studies they
reviewed.
“The use of a structured process can not only help decision makers make priority decisions,
but can also increase the demand for, and the availability and quality of data.” (ibid.) To
overcome the challenges to decisions-making they suggest that; health systems be
decentralized for better autonomy to make and implement decisions (including financial
autonomy); timely, accurate and relevant data for decentralized decisions making; equipping
stakeholders with knowledge and skills to carry out their tasks, and use of structured process.
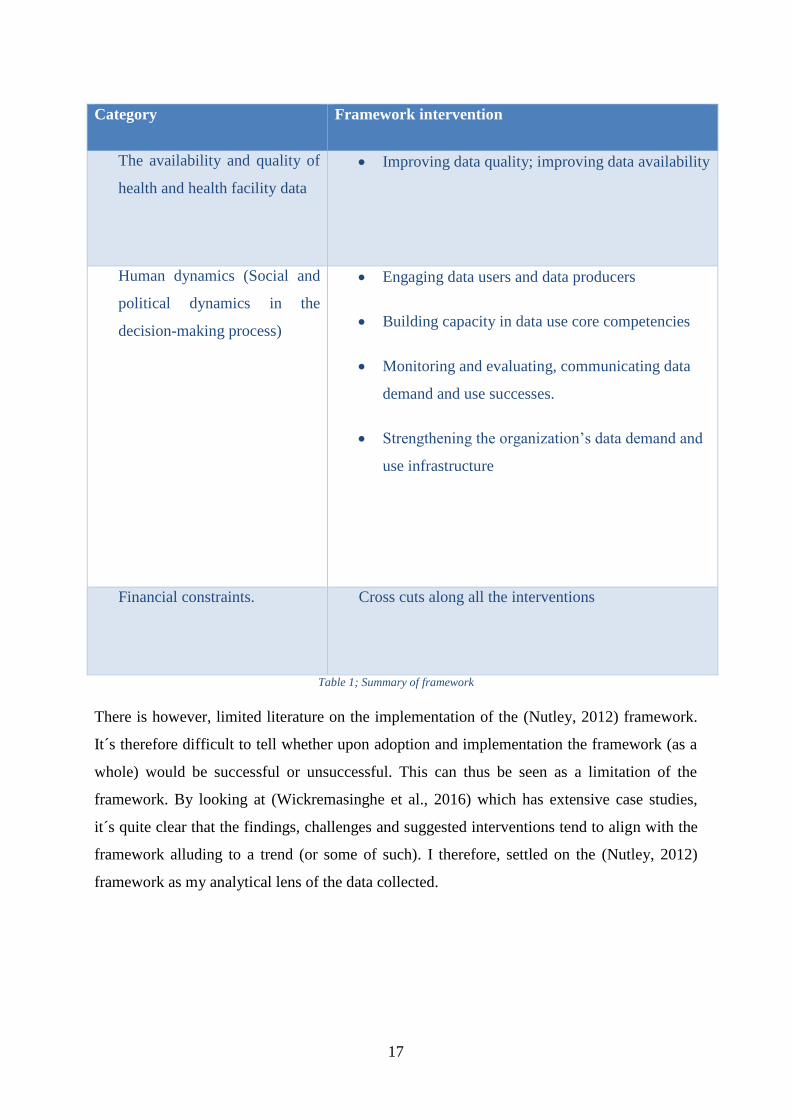
2.2.3 Summary
The challenges identified can be related to some of this study´s objective; research question 1.
It was therefore necessary to do some analysis on the challenges identified by the (ibid.) and
try fit them into the conceptual framework; during literature review. The 3 categories of
challenges from (Wickremasinghe et al., 2016) are placed into the 6 interventions from the
framework as shown in Table 1; Summary of framework. This was helpful in deciding the
choice of the framework; as it was preliminary data analysis. In addition, it helped with
structuring the empirical data later on during data analysis.
17
Category Framework intervention
The availability and quality of
health and health facility data
Improving data quality; improving data availability
Human dynamics (Social and
political dynamics in the
decision-making process)
Engaging data users and data producers
Building capacity in data use core competencies
Monitoring and evaluating, communicating data
demand and use successes.
Strengthening the organization’s data demand and
use infrastructure
Financial constraints.
Cross cuts along all the interventions
Table 1; Summary of framework
There is however, limited literature on the implementation of the (Nutley, 2012) framework.
It´s therefore difficult to tell whether upon adoption and implementation the framework (as a
whole) would be successful or unsuccessful. This can thus be seen as a limitation of the
framework. By looking at (Wickremasinghe et al., 2016) which has extensive case studies,
it´s quite clear that the findings, challenges and suggested interventions tend to align with the
framework alluding to a trend (or some of such). I therefore, settled on the (Nutley, 2012)
framework as my analytical lens of the data collected.
18
3 BACKGROUND This chapter presents the context of this study in detail. The country Zambia, Lusaka province
and Rufunsa district are presented. I also elaborate on Zambia´s current health system, HMIS
strengthening efforts, data collection routines. I also explain the role of the Health
Information Systems Program (HISP), and the District Health Information System 2(DHIS2)
in the context of Zambia HMIS. Finally, I present some of CPs that play role in HMIS data
use initiatives in Zambia.
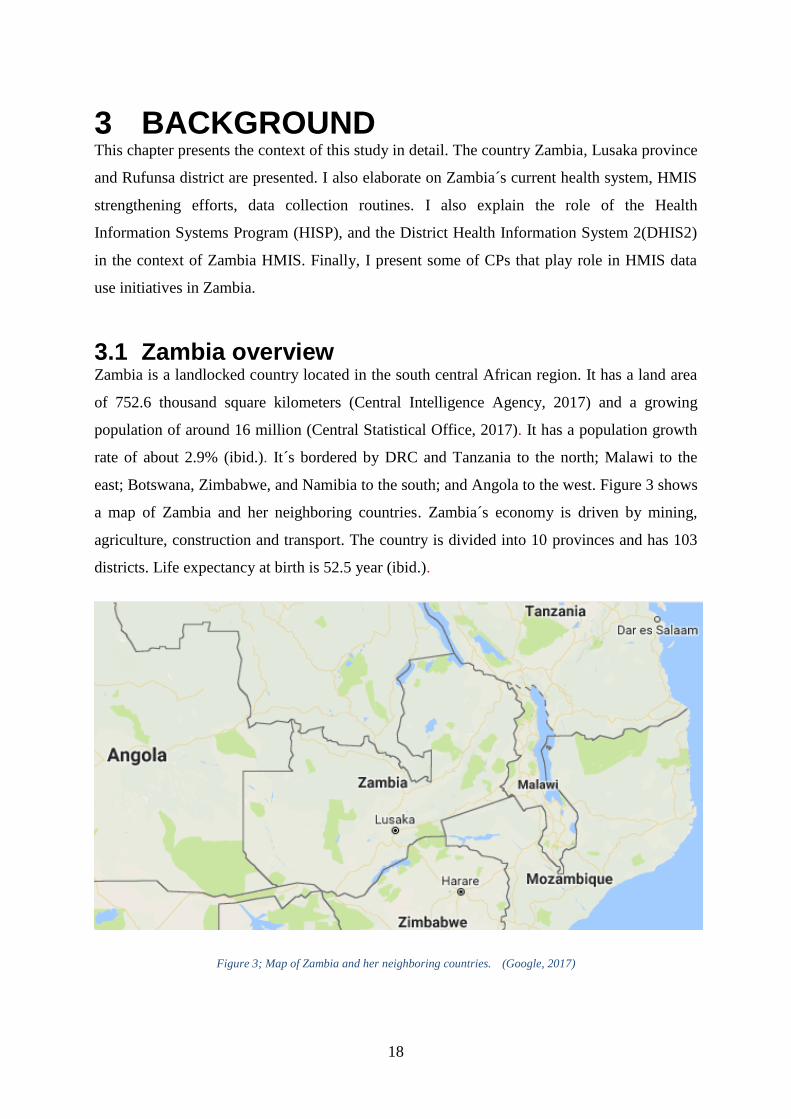
3.1 Zambia overview Zambia is a landlocked country located in the south central African region. It has a land area
of 752.6 thousand square kilometers (Central Intelligence Agency, 2017) and a growing
population of around 16 million (Central Statistical Office, 2017). It has a population growth
rate of about 2.9% (ibid.). It´s bordered by DRC and Tanzania to the north; Malawi to the
east; Botswana, Zimbabwe, and Namibia to the south; and Angola to the west. Figure 3 shows
a map of Zambia and her neighboring countries. Zambia´s economy is driven by mining,
agriculture, construction and transport. The country is divided into 10 provinces and has 103
districts. Life expectancy at birth is 52.5 year (ibid.).
Figure 3; Map of Zambia and her neighboring countries. (Google, 2017)
19
English is the language of communication and instruction in Zambia. However, there are also
local languages such as Bemba, Lozi, Kuvale, Kaonde, Lunda, Nyanja and Tonga etc. Zambia
is an urbanized country; with about 40% of the population living in urban areas (Central
Statistical Office, 2017). Majority of Zambians continue to live in poverty. As of 2015
incidence of poverty is at 54.4% (ibid.). Even though the data shows there has been a decline
in the poverty from the year 2004, poverty in rural areas is at 76.6% and 23.4% in urban areas
In matters infrastructure, Zambia suffers a lot of challenges in terms of electricity, roads and
ICT. Rural areas are more affected than urban areas. Underdevelopment of rural areas is
credited to having a highly-centralised system of development delivery among other factors.
Zambia is largely dependent on solar and hydro energy. This has led to power shortages,
especially during the dry season. Moreover, poor management of water resources contributed
to the same which in turn affected industrial productivity (Central Intelligence Agency, 2017).
Only 31% of households are connected to electricity by 2015 (found under living condition
statistics) (Central Statistical Office, 2017).
Zambia has tarmacked roads connecting the major cities and international borders. It was
ranked 22nd of 54 in the AFD Index for 2016 (Charles Lufumpa et al., 2016). It´s estimated
that about 77 out of 100 inhabitants use cellular mobile (Central Intelligence Agency, 2017).
22% of the population use the internet as of 2015 (ibid.).
The seventh National Development Plan (7NDP) was formulated to achieve the goals of
vision 2030; create a resilient and diverse economy for sustained growth and socio-economic
growth transformation (Ministry of National Development Planning, 2017). All sectors of the
economy (agriculture, mining, fishing etc) thus use the 7ndp as guiding tool in their overall
operations
In addition, Zambia has traditional leaders; the chiefs. In total, they´re 288 chiefs (Ministry of
Chiefs and Traditional Affairs, 2016). Chiefs are the head of chiefdoms. They are under the
Ministry of Chiefs and Traditional affairs which acts as an advisory body to the government
on traditional and customary issues. It may also advise on matter referred to them by the
president. In the community, the chiefs command a lot of respect and are considered royalties.
Chiefdoms are passed down through inheritance. It´s a norm to give gifts such as maize,
sugar, cooking oil to the chiefs when you go visit them. They reside in chief´s palaces and
welcome an audience from the government/NGO officials.
20
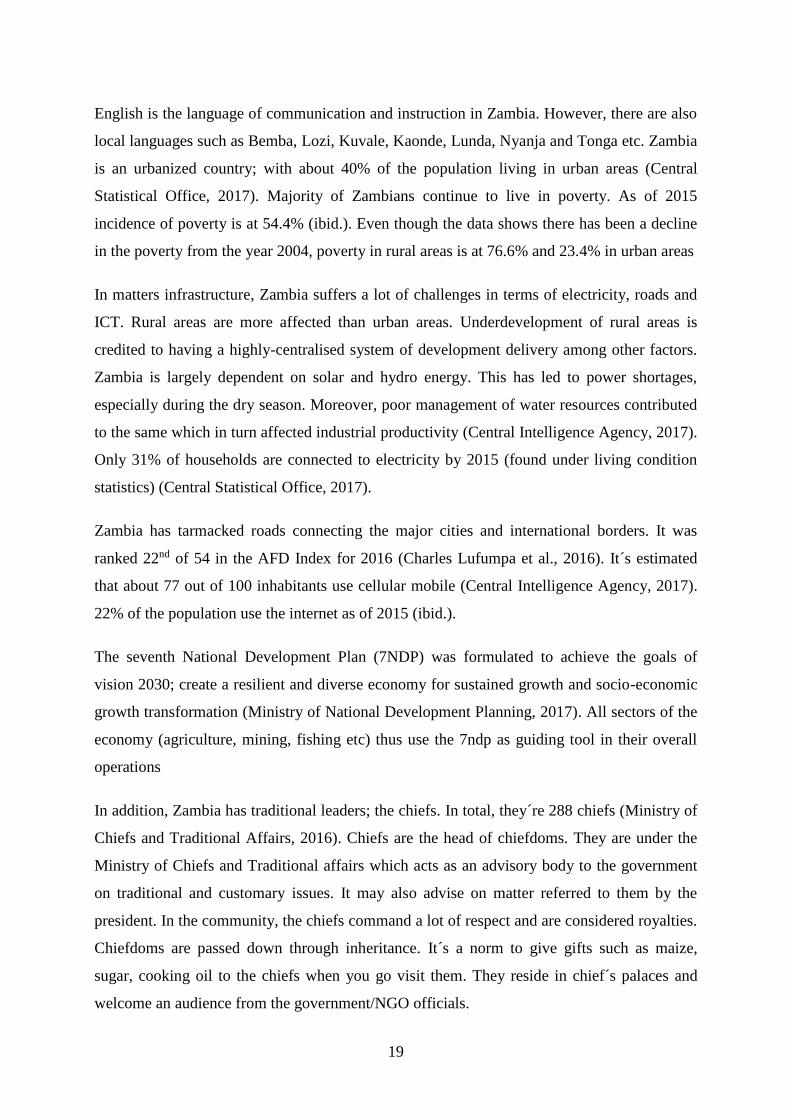
Community interventions may fail if the chief is not engaged. For example, Akros used the
chiefs to help in the carrying out of the Community-led Total Sanitation (CLTS) project
(DHIS2) - the projects It seeks to eliminate water and food contamination (improve
sanitation). Figure 4 shows a chief with the tablet used to track the sanitation levels.
Figure 4; A Zambian Chief with a tablet used to track his chiefdom´s performance
Lusaka province is one of the 10 provinces of Zambia. It´s located in the south-central part of
the country and hosts the country´s capital, Lusaka, also the capital of the province. Lusaka
city acts as a hub for services, businesses and organizations (Ministry of National
21
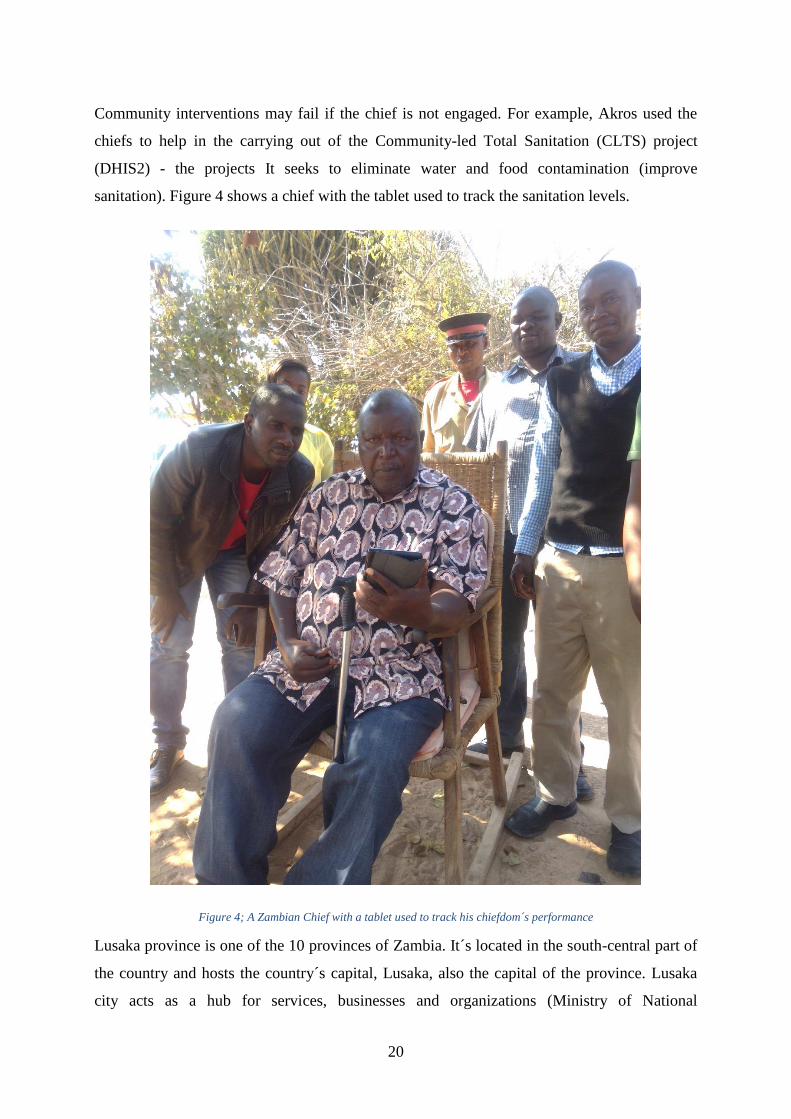
Development Planning, 2017). It’s bordered by Zimbabwe and the smallest in term of area.
Figure 5 shows Lusaka province and some of its major towns. It has a population of about 2.7
million people as of 2015 and is the most populated province (Central Statistical Office,
2017). It had a population growth of 4% as of 2014. Lusaka province has 5 districts.
Rufunsa is one of the new districts in Zambia. It´s located in Lusaka province and was curved
out of Chongwe district. It’s located in the north-east part of Lusaka province and is bordered
by eastern province of Zambia and Mozambique to the east. Rufunsa is mainly a rural district
with vast distances between facilities. It has 22 health facilities.
Figure 5; Lusaka province (adopted from (Unicef Zambia, 2015))
3.2 Health System in Zambia “The MOH’s focus is the provision of a continuum of care with particular emphasis placed
on strengthening health systems and services using the primary health care (PHC)
approach.” (MOH Zambia, 2017)
Zambia´s health services are provided by four main players: the government, the mines,
private providers (for-profit), and faith-based providers (not-for-profit) (ibid.). The public
sector is the biggest provider of health services (ibid.). The 2017-2021 National Health Sector
Strategic Plan (NHSP) provides guidance on all health interventions in the health sector.
Zambian health sector has been implementing reforms in a bid to improve service delivery.
Decentralization where health delivery was delegated to the district, has been at core of these
reforms (ibid.).
As stated earlier, Zambia has 10 administrative provinces and 105 districts. Provincial health
offices (PHOs) (10), DHOs (105), and statutory bodies provide health management in the
country. Zambia therefore has (ibid.);
22
8 third-level hospitals – all owned by the government
34 second-level hospitals – 26 Government-owned, and 8 Churches Health
Associations of Zambia (CHAZ) owned.
99 first-level hospitals,
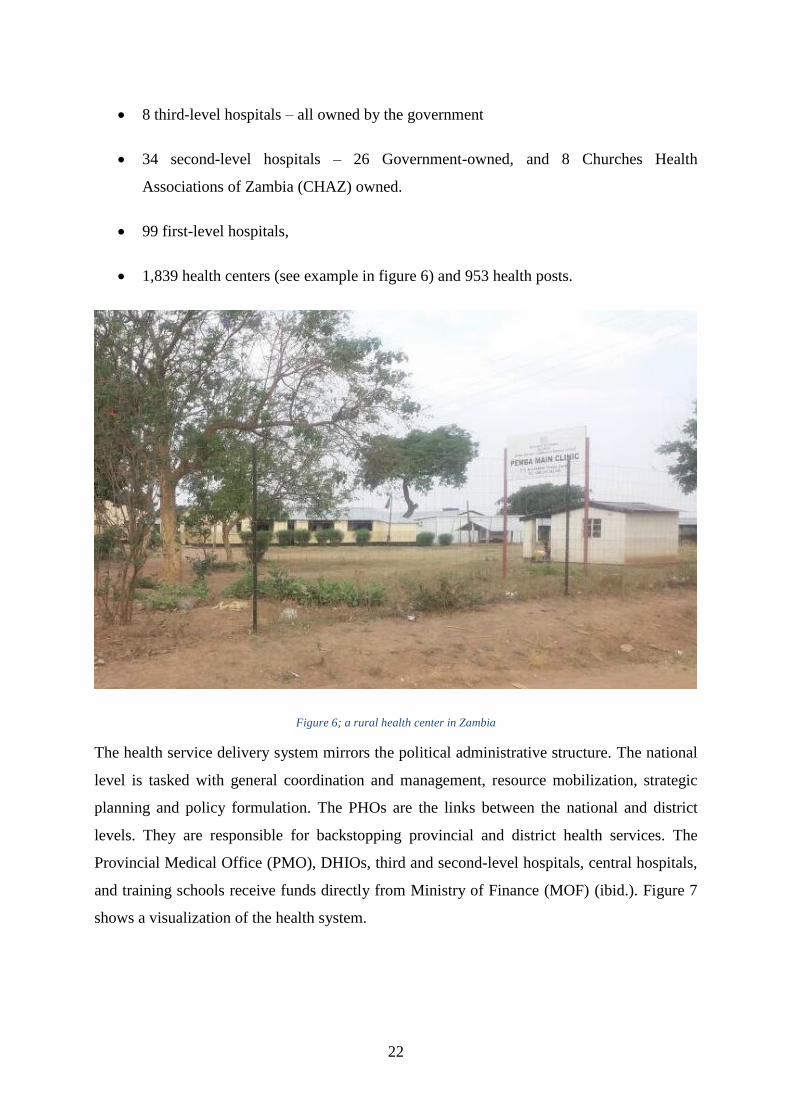
1,839 health centers (see example in figure 6) and 953 health posts.
Figure 6; a rural health center in Zambia
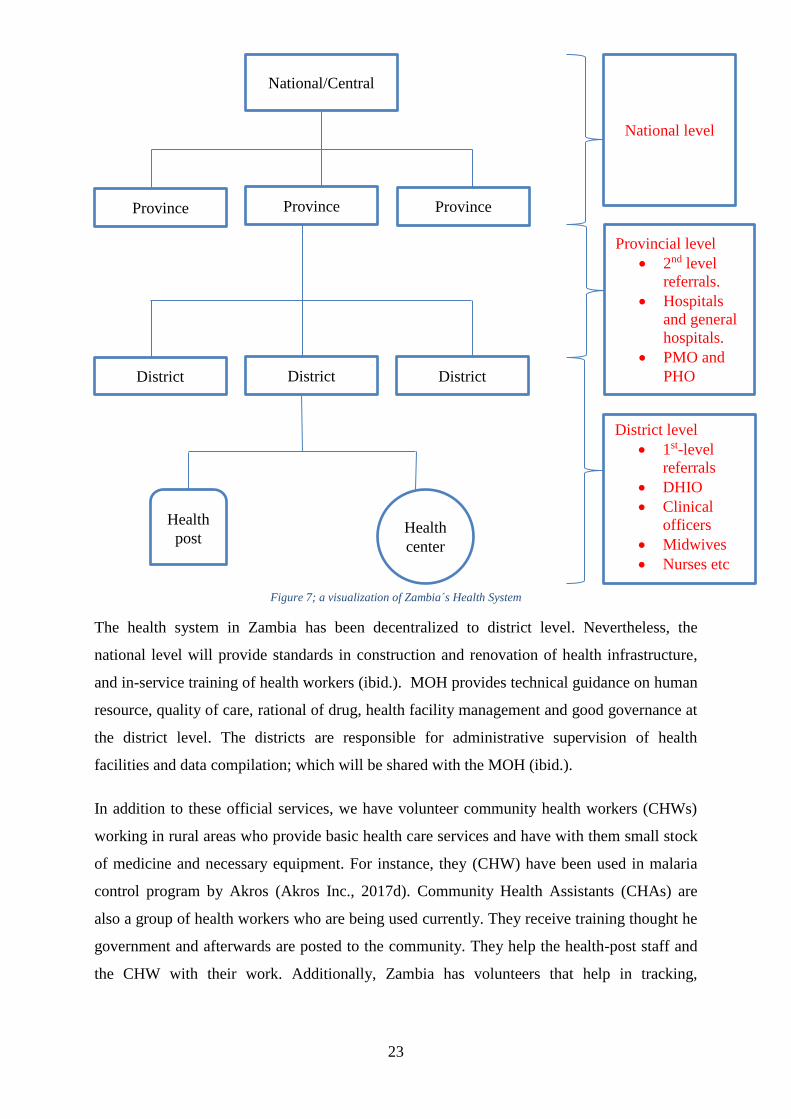
The health service delivery system mirrors the political administrative structure. The national
level is tasked with general coordination and management, resource mobilization, strategic
planning and policy formulation. The PHOs are the links between the national and district
levels. They are responsible for backstopping provincial and district health services. The
Provincial Medical Office (PMO), DHIOs, third and second-level hospitals, central hospitals,
and training schools receive funds directly from Ministry of Finance (MOF) (ibid.). Figure 7
shows a visualization of the health system.
23
Figure 7; a visualization of Zambia´s Health System
The health system in Zambia has been decentralized to district level. Nevertheless, the
national level will provide standards in construction and renovation of health infrastructure,
and in-service training of health workers (ibid.). MOH provides technical guidance on human
resource, quality of care, rational of drug, health facility management and good governance at
the district level. The districts are responsible for administrative supervision of health
facilities and data compilation; which will be shared with the MOH (ibid.).
In addition to these official services, we have volunteer community health workers (CHWs)
working in rural areas who provide basic health care services and have with them small stock
of medicine and necessary equipment. For instance, they (CHW) have been used in malaria
control program by Akros (Akros Inc., 2017d). Community Health Assistants (CHAs) are
also a group of health workers who are being used currently. They receive training thought he
government and afterwards are posted to the community. They help the health-post staff and
the CHW with their work. Additionally, Zambia has volunteers that help in tracking,
Health
center
District level
1st-level
referrals
DHIO
Clinical
officers
Midwives
Nurses etc
District
Health
post
Province
National/Central
District District
Province Province
National level
Provincial level
2nd level
referrals.
Hospitals
and general
hospitals.
PMO and
PHO
24
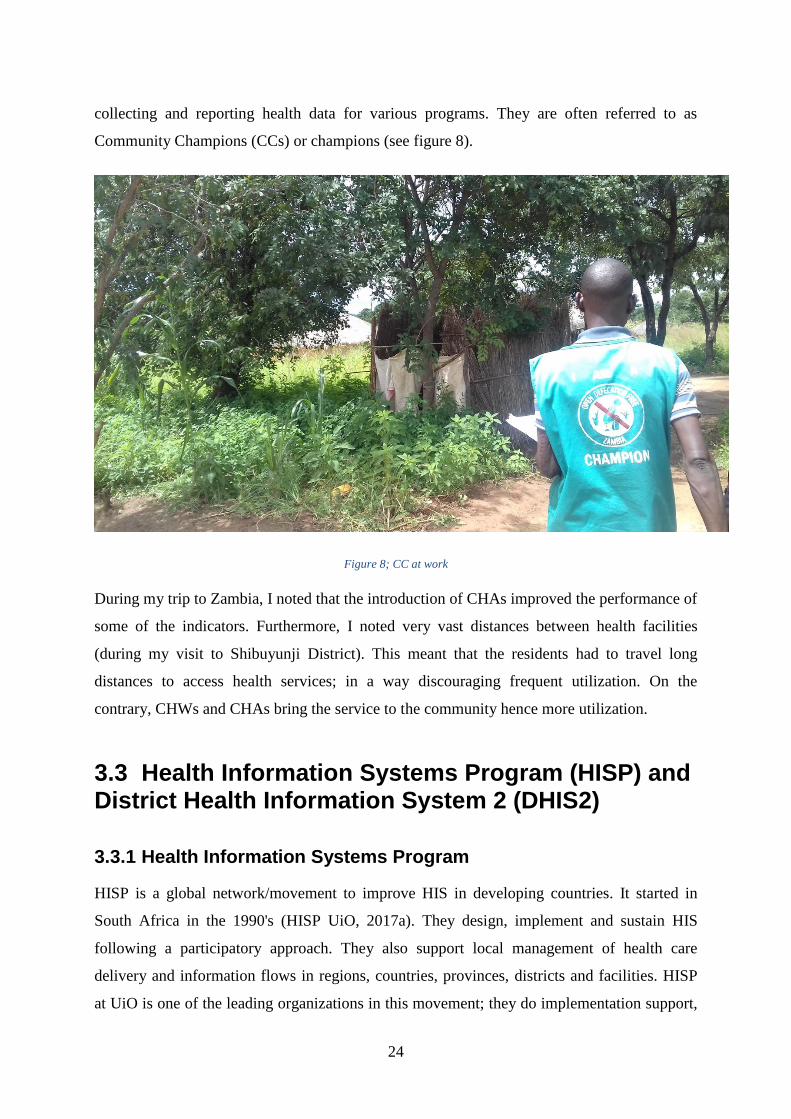
collecting and reporting health data for various programs. They are often referred to as
Community Champions (CCs) or champions (see figure 8).
Figure 8; CC at work
During my trip to Zambia, I noted that the introduction of CHAs improved the performance of
some of the indicators. Furthermore, I noted very vast distances between health facilities
(during my visit to Shibuyunji District). This meant that the residents had to travel long
distances to access health services; in a way discouraging frequent utilization. On the
contrary, CHWs and CHAs bring the service to the community hence more utilization.
3.3 Health Information Systems Program (HISP) and District Health Information System 2 (DHIS2)
3.3.1 Health Information Systems Program
HISP is a global network/movement to improve HIS in developing countries. It started in
South Africa in the 1990's (HISP UiO, 2017a). They design, implement and sustain HIS
following a participatory approach. They also support local management of health care
delivery and information flows in regions, countries, provinces, districts and facilities. HISP
at UiO is one of the leading organizations in this movement; they do implementation support,
25
capacity building, research (PhD and masters). There are several HISP groups around the
world. Some of them are in Uganda, Vietnam, Bangladesh, Tanzania etc. (HISP UiO, 2017b).
3.3.2 District Health Information System 2
“DHIS 2 is the preferred health management information system in 30 countries and even
more organizations across four continents.” – (DHIS2, 2017c).
The development of DHIS2 is at the core of the HISP movement. The core development team
is hosted by HISP at UiO (HISP UiO, 2017a). DHIS2 is a tool (software) that allows data
collection processing, analysis and visualization from several sources for different user
groups. It´s a web-based software, in addition to being used on J2ME-applications and
Android (DHIS2, 2017e). It´s an open source software distributed under the BSD license
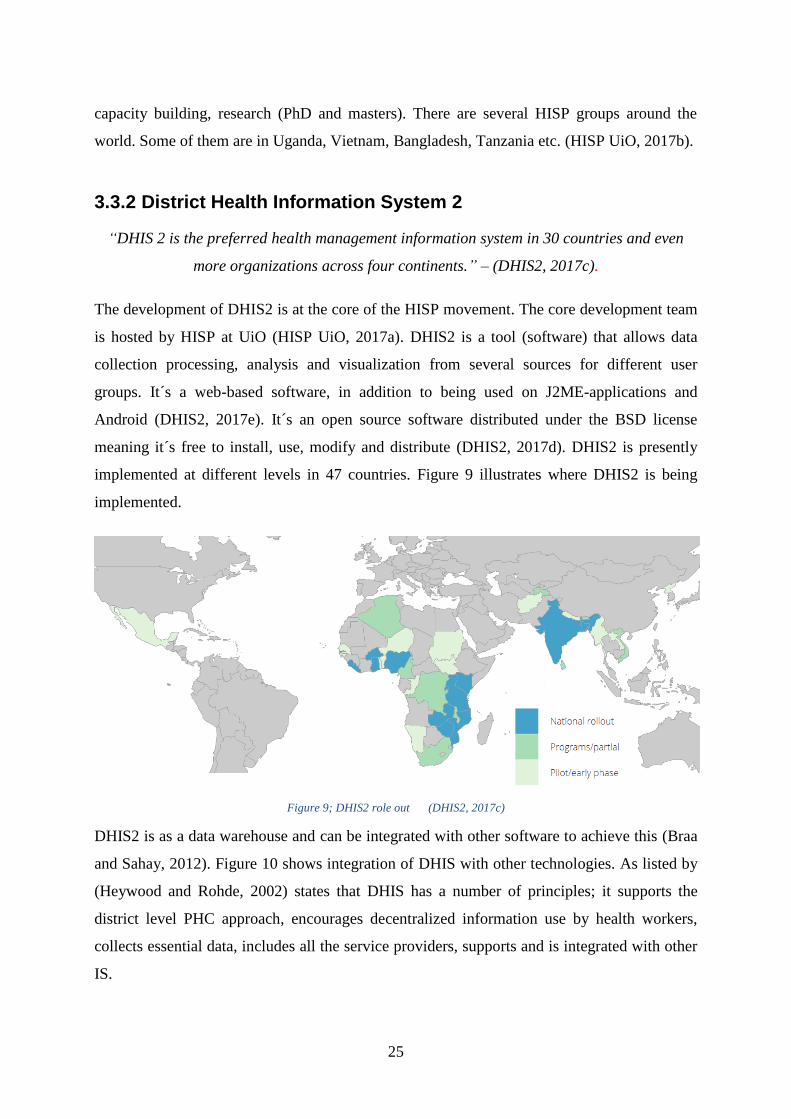
meaning it´s free to install, use, modify and distribute (DHIS2, 2017d). DHIS2 is presently
implemented at different levels in 47 countries. Figure 9 illustrates where DHIS2 is being
implemented.
Figure 9; DHIS2 role out (DHIS2, 2017c)
DHIS2 is as a data warehouse and can be integrated with other software to achieve this (Braa
and Sahay, 2012). Figure 10 shows integration of DHIS with other technologies. As listed by
(Heywood and Rohde, 2002) states that DHIS has a number of principles; it supports the
district level PHC approach, encourages decentralized information use by health workers,
collects essential data, includes all the service providers, supports and is integrated with other
IS.

26
Figure 10; DHIS as a data warehouse (Braa and Sahay, 2012)
3.3.3 Visualization tools
DHIS2 allows users to aggregate and manage routine data. You can configure and set-up
various aspects, such as data entry forms, indicators and reports, for a comprehensive data
management. In addition, DHIS2 has several features for data visualization which help you
bring meaning to your data. They include; charts, dashboards, pivot tables etc (DHIS2,
2017b).
Dashboard and Scorecard
Dashboards are a data visualization feature in DHIS2 that allows you to place your favorite
reports, charts and maps for ease/swift access. It has an integrated message functionality that
lets you communicate with other users directly (ibid.). You can also access the data
interpretation feed; comment and start discussions and thus have a better understanding of
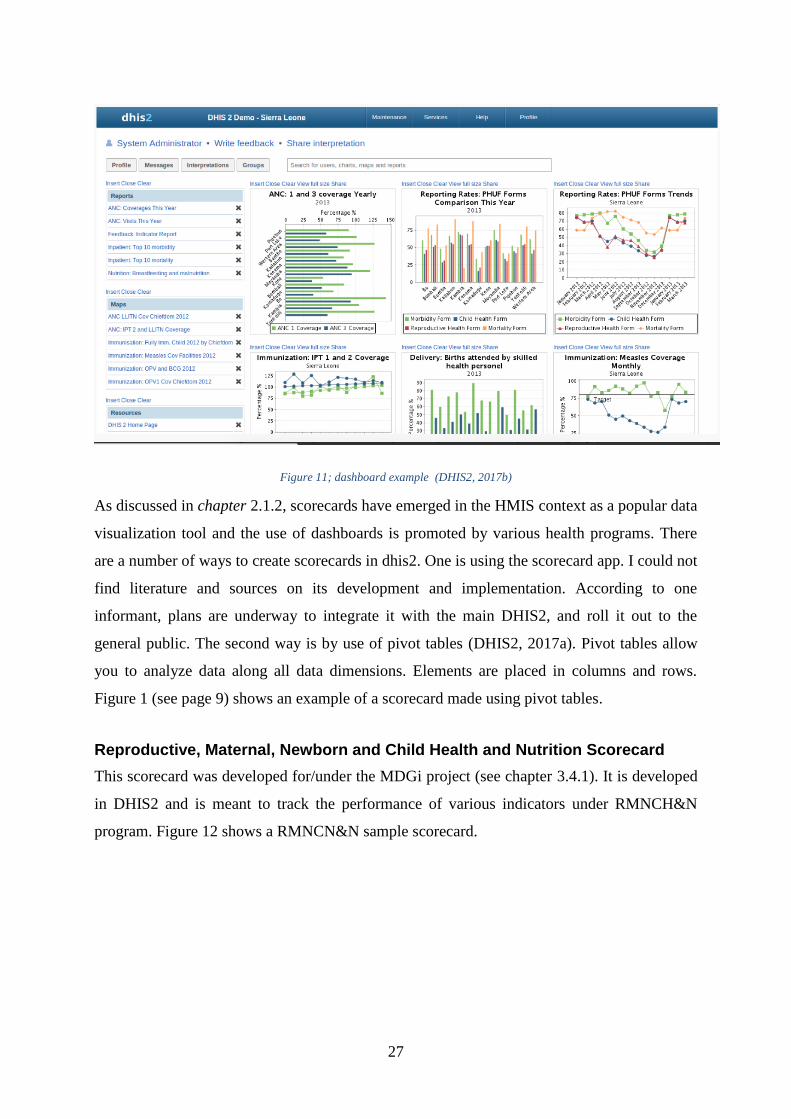
your data (ibid.). Figure 11 shows an example of a dashboard from a demo version of DHIS2.
27
Figure 11; dashboard example (DHIS2, 2017b)
As discussed in chapter 2.1.2, scorecards have emerged in the HMIS context as a popular data
visualization tool and the use of dashboards is promoted by various health programs. There
are a number of ways to create scorecards in dhis2. One is using the scorecard app. I could not
find literature and sources on its development and implementation. According to one
informant, plans are underway to integrate it with the main DHIS2, and roll it out to the
general public. The second way is by use of pivot tables (DHIS2, 2017a). Pivot tables allow
you to analyze data along all data dimensions. Elements are placed in columns and rows.
Figure 1 (see page 9) shows an example of a scorecard made using pivot tables.
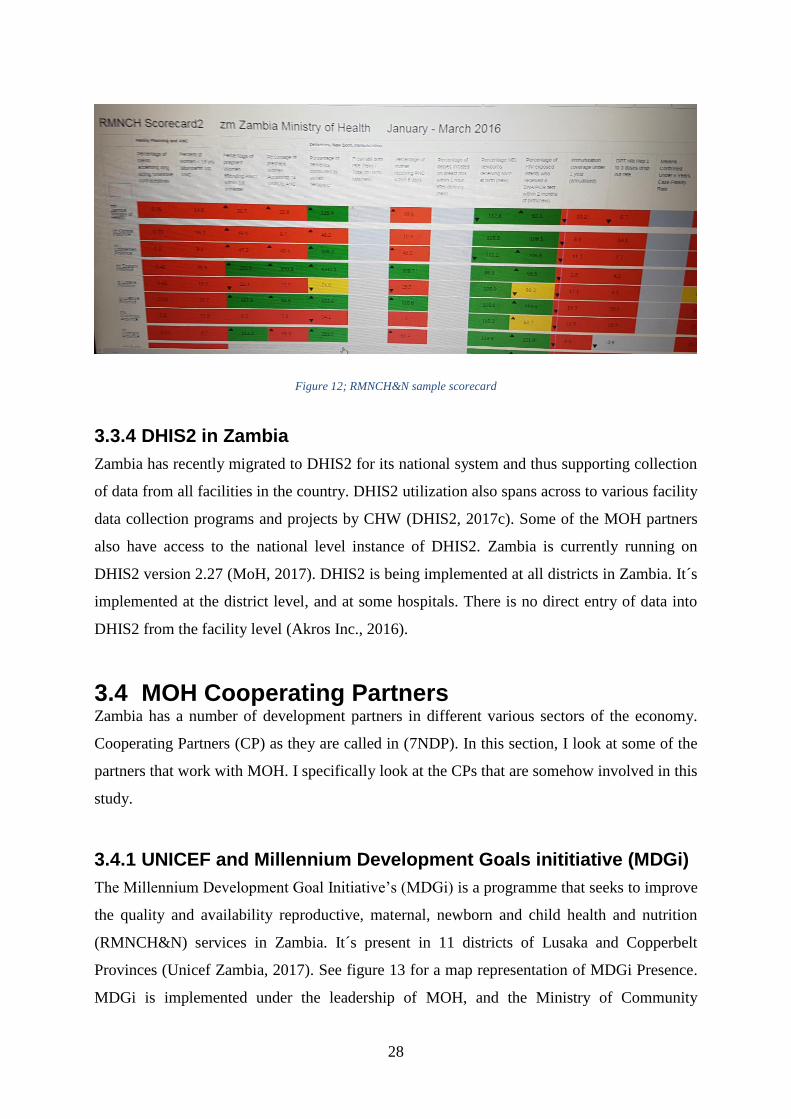
Reproductive, Maternal, Newborn and Child Health and Nutrition Scorecard
This scorecard was developed for/under the MDGi project (see chapter 3.4.1). It is developed
in DHIS2 and is meant to track the performance of various indicators under RMNCH&N
program. Figure 12 shows a RMNCN&N sample scorecard.
28
Figure 12; RMNCH&N sample scorecard
3.3.4 DHIS2 in Zambia
Zambia has recently migrated to DHIS2 for its national system and thus supporting collection
of data from all facilities in the country. DHIS2 utilization also spans across to various facility
data collection programs and projects by CHW (DHIS2, 2017c). Some of the MOH partners
also have access to the national level instance of DHIS2. Zambia is currently running on
DHIS2 version 2.27 (MoH, 2017). DHIS2 is being implemented at all districts in Zambia. It´s
implemented at the district level, and at some hospitals. There is no direct entry of data into
DHIS2 from the facility level (Akros Inc., 2016).
3.4 MOH Cooperating Partners Zambia has a number of development partners in different various sectors of the economy.
Cooperating Partners (CP) as they are called in (7NDP). In this section, I look at some of the
partners that work with MOH. I specifically look at the CPs that are somehow involved in this
study.
3.4.1 UNICEF and Millennium Development Goals inititiative (MDGi)
The Millennium Development Goal Initiative’s (MDGi) is a programme that seeks to improve
the quality and availability reproductive, maternal, newborn and child health and nutrition
(RMNCH&N) services in Zambia. It´s present in 11 districts of Lusaka and Copperbelt
Provinces (Unicef Zambia, 2017). See figure 13 for a map representation of MDGi Presence.
MDGi is implemented under the leadership of MOH, and the Ministry of Community

29
Development, Mother and Child Health along with close collaboration with UNICEF, WHO
and UNFPA (Unicef Zambia, 2015).
Figure 13; MDGi presence (Unicef Zambia, 2015)
MDGi is funded by the European Union. UNICEF manages the overall support of UN support
to the programme, besides providing technical support for key aspects of maternal, newborn
and child health, nutrition, adolescent health, and health system strengthening. UNFPA offers
technical support in adolescent health area. WHO delivers technical assistance in the
adaptation of national guidelines in newborn and child health, as well as with “training of
trainers” (ibid.).
MDGi´s core activities are (ibid.);
Cross cutting activities – activities such as health workers training, updating health
standards and practices,
Nutrition activities – improving nutrition outcomes

30
Adolescent and youth friendly services activities
Maternal, newborn and child health
Communication for development activities
Health systems strengthening activities – activities such as support of HMIS, capacity
building
3.4.2 Akros
“Akros establishes data-driven systems that improve the health and well-being of
disadvantaged communities” – (Akros Inc., 2017b)
Akros is a small for-profit organization which works with various donors, such as UNICEF,
USAID, and government ministries to achieve its mission. It has a presence across the
southern Africa region although most of its staff members are located in Lusaka, Zambia. It
creates data-driven systems to improve the health, and welfare of disadvantaged communities.
Akros’ projects have enabled it to develop working relationships at central levels in Angola,
Botswana, Malawi, Mozambique, Namibia, South Africa, Swaziland and Zimbabwe (Akros
Inc., 2017a).
Akros focus areas are (Akros Inc., 2017c);
Malaria prevention - Akros uses a number of tools to combat malaria: Entomological
surveillance, genotyping, indoor residual spraying tools and community surveillance.
Water & Sanitation - Akros along with UNICEF Zambia and Ministry of Local
Government and Housing (Zambia), to develop a monthly mobile surveillance system
that shows precisely which villages do not have adequate latrines. An example is
CLTS under the water and sanitation programme (WASH) project (DHIS2).
Health Data Systems - Akros is involved with various activities: Helps MOH with
data collection, transmission and analysis, teach partners on how to use HMIS, and
assist in program management.
31
3.5 HMIS strengthening project (Aqil et al., 2009, p.226) refers to HMIS “any data collection conducted regularly with an
interval of less than 1 year in health facilities and their extension in the community.”
Strengthening HMIS is one of the core functions of the MDGi project. Akros was thus
contracted by MOH to carry out an assessment (Akros Inc., 2016) of the 11 MDGi districts.
The assessment was done partially with MOH, for MOH.
The assessment found challenges in term of decision-making, data quality, HMIS among
other areas. There is thus, a comprehensive strategy to tackle the three objectives of the HMIS
strengthening. These objectives are;
Strengthening human resource (HR) capacity – to support the consistent, timely flow
of quality data, and feedback through the health system hierarchy.
Broad DHIS2 support - from hardware support to software configuration and HR
capacity, in order to support and improve programmatic decision making.
HMIS system-wide support - to increase demand and use of quality data, planning and
intervention management; throughout the health system hierarchy.
The assessment was used to guide the implementation of the project; decisions were made
based on the current state facts found at facility, provincial and national levels.
3.5.1 Quality Improvement
QI is the process of engaging appropriate methodologies and quality management tools to
close the gap between current and expected levels of performance(USAID Systems for Better
Health, July 2016). In the health sector, the reach and scope of QI is translated to measurable
improvements in health care services and the health status of targeted patient/client groups.
The World Health Organization (WHO) considers QI a permanent and on-going obligation
and a priority for health service development.
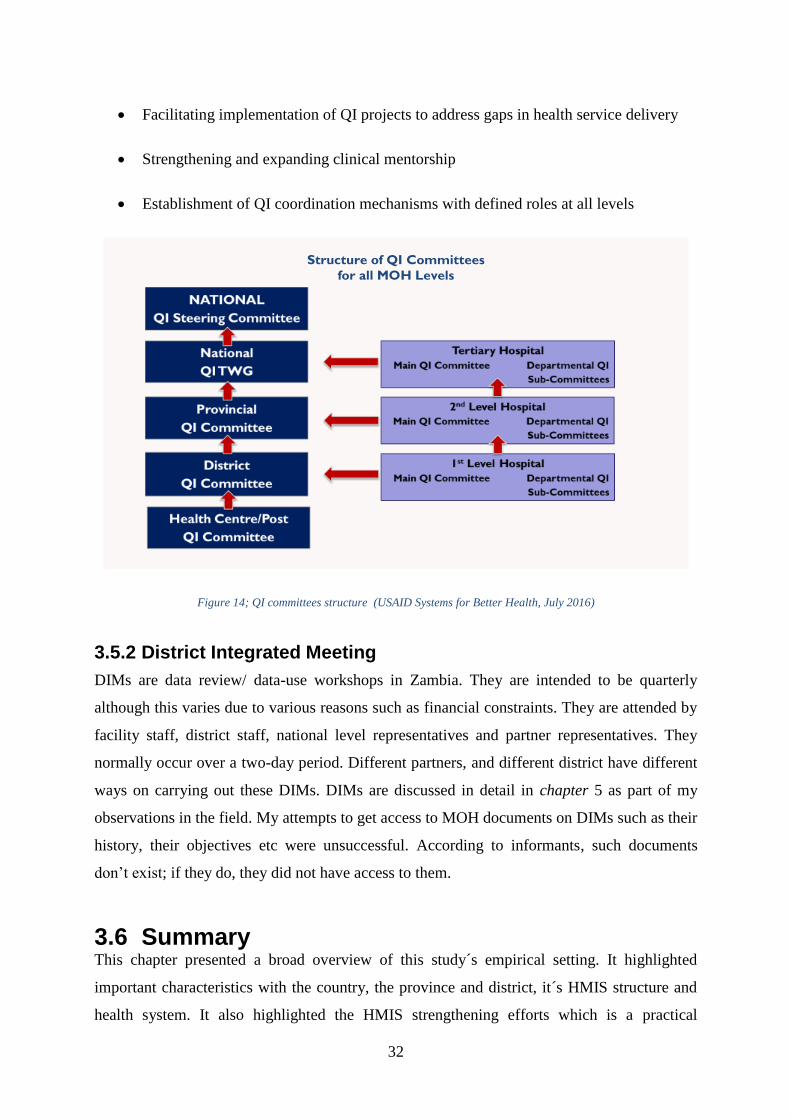
Figure 14 shows the structure of QI committees for the various MOH levels. MOH has
institutionalized the QI system through the following initiatives (just to mention a few)
(USAID Systems for Better Health, July 2016);
32
Facilitating implementation of QI projects to address gaps in health service delivery
Strengthening and expanding clinical mentorship
Establishment of QI coordination mechanisms with defined roles at all levels
Figure 14; QI committees structure (USAID Systems for Better Health, July 2016)
3.5.2 District Integrated Meeting
DIMs are data review/ data-use workshops in Zambia. They are intended to be quarterly
although this varies due to various reasons such as financial constraints. They are attended by
facility staff, district staff, national level representatives and partner representatives. They
normally occur over a two-day period. Different partners, and different district have different
ways on carrying out these DIMs. DIMs are discussed in detail in chapter 5 as part of my
observations in the field. My attempts to get access to MOH documents on DIMs such as their
history, their objectives etc were unsuccessful. According to informants, such documents
don’t exist; if they do, they did not have access to them.
3.6 Summary This chapter presented a broad overview of this study´s empirical setting. It highlighted
important characteristics with the country, the province and district, it´s HMIS structure and
health system. It also highlighted the HMIS strengthening efforts which is a practical
Structure of QI Committees
for all MOH Levels

33
motivation for this research. In addition, it mentioned some of the visualization tools
especially those available through DHIS2. Some of the partners’ efforts and involvement with
work that affects this study are also mentioned. The next chapter (methods) describes the
various methods employed to conduct the research
34
4 METHODS In this chapter, I present how the study was carried out. I begin with the research design,
where I discuss the approach and the choice of this approach. The role of the research and
reflexivity is also discussed under this section. Research methods are next to be presented –
case study and its choice. Thereafter will follow a section on data collection method and
procedures; including sources of data. How data was analyzed and structured is then
presented. Ethical considerations are final to be discussed, before a summary concludes the
chapter.
A quick reminder of the objectives of this research - this study is an exploratory study on data
use, district decision-making and live visualization tools impact on data use. It therefore, asks
the two questions:
RQ1: How is data being used, and what are the key obstacles to data use?
RQ2: What are the prospects of using live data visualization tools to strengthen DIMs and
data use?
4.1 Research Strategy
4.1.1 Research approach
When doing research, you can choose between quantitative or qualitative approaches. Data
that can be expressed in entities or pure numbers i.e more/less, few/many etc is held as
quantitative data, while data that cannot be expressed in this manner is held as qualitative data
(Grønmo, 1996). A qualitative study design facilitates the understanding of why people act
the way they do. Simultaneously, it derives a deeper insight into how they experience and
interpret the world they live in. Qualitative studies therefore, allow the participants to respond
to questions of an explorative nature; such as how and what (Malterud, 2003).
I have chosen to use a qualitative research approach as the basic method. Drawing on
informants’ thoughts, feelings, perceptions and experiences (with respects to cultural, social
and economic conditions) offer a more holistic understanding of the phenomenon (data use
and decision making) hence, a qualitative research design was considered to be most
appropriate for this study. Observations, in-depth interviews and document analysis were

35
done to contextualize the findings, and contribute to the mastery of the phenomenon under
study from various angles.
Qualitative studies can be divided into 3 different approaches; positivistic, interpretative or
critical approach (Klein and Myers, 1999). Positivistic which is focused on measureable
effects, critical which is focused on social critique and bringing restrictive conditions of the
status quo to light, or interpretive which “assumes that our knowledge of reality is gained
only through social constructions such a language, consciousness, shared meanings,
documents, tools, and other artifacts” (ibid.). Moreover, interpretive research does not pre-
state variables, instead it centres/concentrate on the convolution of human sense-making as
the state comes out (Kaplan and Maxwell, 1994).
In an IS settings, interpretive methods are "aimed at producing an understanding of the
context of the information system, and the process whereby the information system influences
and is influenced by the context"(Walsham, 1993, p.4). (Klein and Myers, 1999) states that
conducting interpretive research, in an IS setting, helps the researchers understand human
thought and action in organizational and social and environments. It has the capability to
produce deep insights into IS phenomena; such information management and IS development.
The philosophical foundation of this thesis is thus interpretive, as I attribute that knowledge is
accessible through social constructs like language, consciousness and shared meanings. The
descriptions provided in this thesis are the result of formal interviews and observations,
which, again, is based on the subject’s own interpretation of a situation hence interpretive in
nature. A qualitative interpretive study was considered the best in this case taking into
consideration objectives of the study. In addition, as earlier stated in this section (along with
the objectives of the study), explaining a situation goes hand in hand with changing it; to
change a situation you must first understand it. In this case, it´s through a proper research.
4.1.2 Reflexivity
Through reflexivity, a qualitative researcher is supposed to observe and document their own
roles in the research process (Malterud, 2001; Patton, 2002; Kaplan and Maxwell, 2005).
These include assumptions, biases or reaction that might impact data collection and
interpretation (Tolley et al., 2016). Qualitative researchers should make their role as a
researcher an explicit part of data collection, analysis, and reporting (Kaplan and Maxwell,
36
2005). Their interests, biases, perceptions, knowledge, observations all play a role in the study
(ibid.). This is because knowledge is created in social, cultural and relational contexts. An
interview itself is considered as one of the context of interactive knowledge creation. My
preconceptions, my position and who I am would influence knowledge creation.
Results are one way of analyzing the materials gathered. However, there is no guarantee this
“truth” will fully arise from views of the participants themselves (Patton, 2002; Malterud,
2003). There is thus a chance that observations and interpretations of situation may not match
the participant’s understanding of the same issues. In this study, I came from a slightly
different background which may have created a little distance in the interviews. However,
having an African background may have had positive impact in data collection. This may
have made it easier to have informal talks with the informants and mingle in informal settings.
I had prior experience on DHIS2 which helped in understanding some of phenomena
observed in the DIM. However, not having a background in the health sector/environment
may have affected the observation process negatively. I sometimes did not understand the
proceeding and discussions of the DIM. I had to ask for clarification from the person seated
next to me or later during the breaks. However, I did have some prior knowledge on the
health issue such as the indicators (from DHIS2 training and the indicators workshop) and this
may have had a positive impact on my ability to interpret people´s comments and responses
during the DIMs.
Role of the researcher
The degree of involvement is a vital decision to make when conducting research. This is
because it can affect the relationship with participants, bias the data collected, and how it’s
interpreted. Walsham positions researcher involvement into two categories; neutral, though
not unbiased, observer and a full action researcher (Walsham, 1995; 2006). In the context of
this research, an observer researcher was considered the best; with regards to the research
objectives. However, it´s been important to highlight my role as an independent researcher,
and confidentiality; to get honest feedback, and a realistic, comprehensive overview.
37
4.2 Research methods
4.2.1 Case study
When first choosing the research methodology to be used for this study, a few methods were
interesting and thus need a careful evaluation. Action research was considered and is one of
the widely-used methodology in the IS-group within the University of Oslo (Baskerville,
1999; Braa et al., 2004). However, doing a full-scale AR project did not seem feasible due to
the relatively short time frame of the research. Dealing with the partners and stakeholders in
Zambia could have led to delays, could affect the timeline of a study. An example is the case
of a fellow master student (Parramore, 2017) where facility trainings (methods chapter) were
delayed for a couple of months hence affecting the data collection timeline.
A case study methodology was settled upon as it was the most appropriate given the
exploratory objectives of the study. A case study is defined, by (Benbasat et al., 1987) as one
which studies a phenomenon in its natural setting and uses multiple data collection methods to
collect information from one or more entities. Case study research is the most frequently used
qualitative method in IS (Orlikowski and Baroudi, 1991; Alavi and Carlson, 1992).
According to (Yin, 2009, p.4) case studies allow researchers to keep the holistic and
meaningful features of real-life events; for example, managerial and organizational processes.
He goes on further to state that they are appropriate for answering the “what” and “how”
questions. Although (Yin, 2009, p.17) has primarily been engaged in positivist studies, he
argues that the same characteristics apply to interpretivist studies.
A case study seeks to enlighten a decision(s); how they were implemented, and with what
aftermaths(Schramm, 1971). It will deal with a number of decisions taken, describe the state
in which they were taken, and the procedures involved in carrying them out. In addition, it
will also describe a variety of situations and relationships (Schramm, 1971). (Yin, 1994, p.
10-11) explains “ethnographies usually require long periods of time in the 'field' and
emphasize detailed, observational.” In contrast to ethnography, “…case studies are a form of
enquiry that does not depend solely on ethnographic or participant-observer data." (ibid.). A
case study thus fitted well with the objectives of this study.
38
4.3 Data collection This section will describe the data collection process and methods. As you will note various
qualitative data collection methods have been used. Qualitative studies normally use several
data collection methods to give a wider coverage range (Bonoma, 1985). Most of the data has
been collected through interviews. The reason being they let researchers access participants´
interpretations and to examine them at a later date (Walsham, 1995).
4.3.1 Access and study setting
Access to research site/field was through the IS-group at the UiO partnership with Akros.
Akros is a member of the HISP-network. In total, I made 3 trips to Zambia each lasting 2
weeks. The first 2 trips in, June 2016 and October-November 2016, were preliminary visits.
During the first trip, no research area and topic had been chosen. It was meant to be a
preparation visit to see what projects and areas Akros works with, along with gaining
knowledge on the context and the culture. I travelled to Shibuyunji district with Akros
Surveillance officers involved with the CLTS project (DHIS2). The trip involved visiting
villages to check on its sanitation state, configuring phones for the CCs and visiting the
District Commissioner’s (DC) office.
The second trip´s objective was to decide on a research area and topic. I attended the
indicators workshop in Kabwe. The workshop was meant to decide the different definitions
and names of indicators to be include in DHIS2. It was used to decide the various data
elements1 for DHIS2. It´s through this workshop that the MOH representatives in attendance,
voiced and pushed for the use of live DHIS2. I also had a talk with the Akros team working
on the RMNCH&N scorecard on their plans and thoughts on the impact of introducing the
scorecard as well as live DHIS2. The trip was fruitful as the research area of data use and
interactive DHIS2 was decided. I was also introduced to a DHIO whom I kept in contact with
through emails. When a DIM date was set, I made my final trip in February 2017 to attend the
DIM.
Before the final trip, some documents were shared through email so that I could be well
prepared for the trip. Interview guides and questions were then developed. To understand the
ഃЍ
1 Data elements are used to calculate various indicators in DHIS2. They contain actual reported health
figures/data.

39
decisions making process entirely, participants need to represent the various levels involved
in the process. At least one person from every level was interviewed. With the help of Akros
team, I was able to identify informants and set up interviews.
My presence was announced and recognized by the facilitators of the DIM. As a master
student from Norway, I attracted curiosity and interest. These circumstances may have made
my informants more willing and interested in talking to me during or after the DIM. No kind
of incentive was provided by me or demanded by the informants. However most of the health
personnel attending the DIM receive allowances and per diems. I also attended the 2-day DIM
(explained in chapter 5) and 3rd day QI session.
4.3.2 Data collection methods
Various qualitative data collection methods have been used. According to (Benbasat et al.,
1987) multiple data collection methods are usually employed in case research. Table 2 in
chapter 4.3.3 (page 44) summarizes the sources of data and the data collection methods used.
Evidence from two or more sources will always converge to support the research findings.
(ibid.) identifies these sources of evidence that work well as;
Documentation – written material ranging from newspapers clippings to formal
reports
Archival records – organization charts, finance or personnel records
Interviews – may be open-ended or focused
Direct observation – observing and noting down of events, actions of the field
environment
Physical artifacts – devices, tools, outputs.
The main data collection methods of the study have thus been interviews, observation and
documentation.
4.3.2.1 Interviews
Interviews in qualitative interviews make efforts to understand the world from the perspective
of those interviewed. In addition, they give details about the meaning behind their
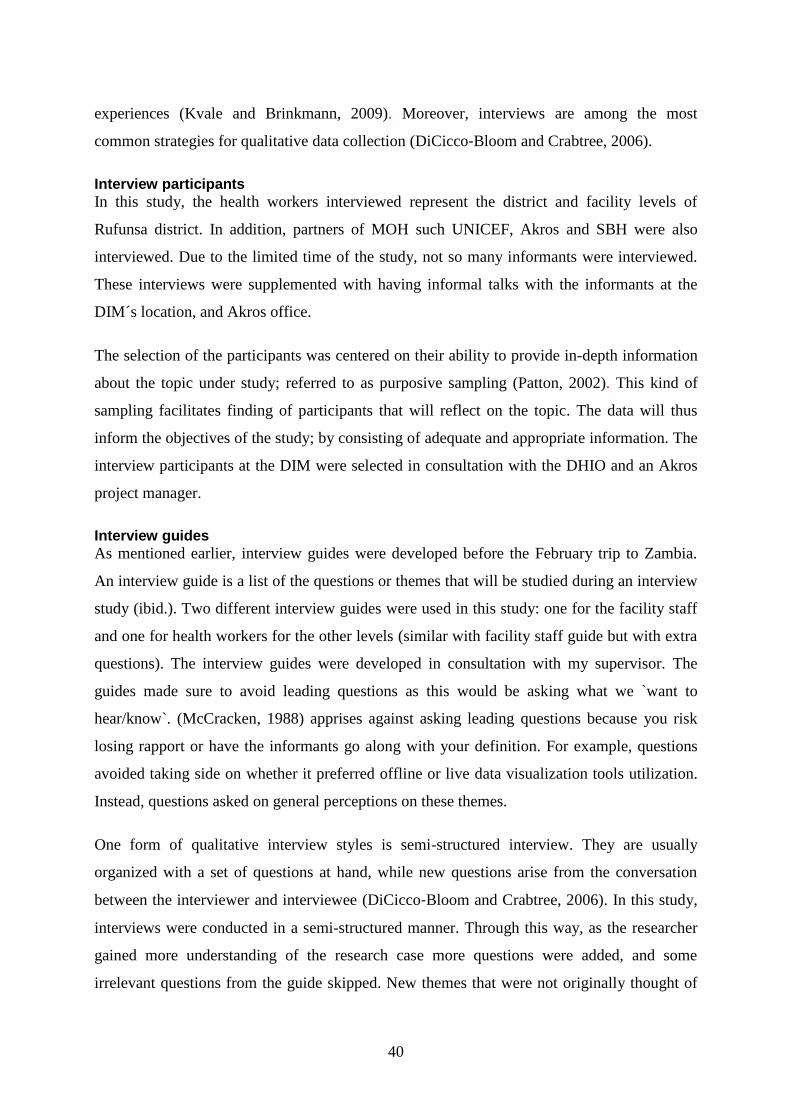
40
experiences (Kvale and Brinkmann, 2009). Moreover, interviews are among the most
common strategies for qualitative data collection (DiCicco‐Bloom and Crabtree, 2006).
Interview participants
In this study, the health workers interviewed represent the district and facility levels of
Rufunsa district. In addition, partners of MOH such UNICEF, Akros and SBH were also
interviewed. Due to the limited time of the study, not so many informants were interviewed.
These interviews were supplemented with having informal talks with the informants at the
DIM´s location, and Akros office.
The selection of the participants was centered on their ability to provide in-depth information
about the topic under study; referred to as purposive sampling (Patton, 2002). This kind of
sampling facilitates finding of participants that will reflect on the topic. The data will thus
inform the objectives of the study; by consisting of adequate and appropriate information. The
interview participants at the DIM were selected in consultation with the DHIO and an Akros
project manager.
Interview guides
As mentioned earlier, interview guides were developed before the February trip to Zambia.
An interview guide is a list of the questions or themes that will be studied during an interview
study (ibid.). Two different interview guides were used in this study: one for the facility staff
and one for health workers for the other levels (similar with facility staff guide but with extra
questions). The interview guides were developed in consultation with my supervisor. The
guides made sure to avoid leading questions as this would be asking what we `want to
hear/know`. (McCracken, 1988) apprises against asking leading questions because you risk
losing rapport or have the informants go along with your definition. For example, questions
avoided taking side on whether it preferred offline or live data visualization tools utilization.
Instead, questions asked on general perceptions on these themes.
One form of qualitative interview styles is semi-structured interview. They are usually
organized with a set of questions at hand, while new questions arise from the conversation
between the interviewer and interviewee (DiCicco‐Bloom and Crabtree, 2006). In this study,
interviews were conducted in a semi-structured manner. Through this way, as the researcher
gained more understanding of the research case more questions were added, and some
irrelevant questions from the guide skipped. New themes that were not originally thought of

41
during the planning of the study arose, and having a semi-structured allowed for the
researcher to address these themes.
Interviews were conducted in English as it is the official language of Zambia. Moreover, all
the participants were well conversant with the language. At the beginning of the interviews,
participants were informed about the study, what questions and the average duration of the
interview. These are in line with (Rowley, 2012) for conducting research interviews. (ibid.)
points that the researcher should make sure the interviewee does not feel embarrassed,
inconvenienced, or expected to disclose something confidential. These would involve;
Indicating who the researcher was and why they were conducting the study.
Brief explanation of the research.
Giving an estimate of the interview duration
Assuring the interviewees of the confidentiality of the interviews
Interview guides
Facility and district level staff interviews were done during the 3 days of the DIM and QI
meeting. They were conducted during breaks and after the DIM, so as not interfere the
participants’ contribution in the data review process. They were done in a quiet room near the
location of the DIM.
The other interviews were done at Akros offices. A few challenges were faced while
conducting these interviews. One was finding a vacant and quiet room to conduct the
interview. The meeting room was sometimes booked and hence couldn´t be used at will. The
solution was to find another room or wait till the meeting room was available for use. Second
challenge, was the busy schedule of the informants from MOH and partner level. They always
had meetings. Planned interviews had to be postpone to another day on a few occasions.
Interview recording and transcription
A tape recorder is used in this kind of studies to document, and thereafter analyze the
interviews (Kvale and Brinkmann, 2009). In this study, one tape recorder (phone voice
recorder) was used to record all the interviews. Afterwards all the interviews were transcribed
word for word by the researcher.
42
4.3.2.2 Observation
Observation is a complementary method to get more precise information on behavior because
it gives first-hand association with the social world under study (Patton, 2002). When
research is conducted through in-depth interviews, the information acquired will depend
heavily on informants willing to share; contrary to observation. There is generally a disparity
between what people say they do, and what they actually do (Malterud, 2003). Moreover, it is
probable that one can misconstrue or miss information that is crucial to the research (Patton,
2002). Being part of a study environment can influence it to some degree; just by being
present.
Observation was done throughout the fieldwork. During the DIM, I took the role of a passive
observer. Observations were noted down mostly in an unstructured manner with use of bullet
points to separate the observations. Follow up questions were also noted down in the same
manner. Notes were taken down especially during the DIM, QI session and indicators´
workshop. Figure 15 shows my observation notes from the DIM. The date and purpose of the
event were noted down; for easier analysis and interpretation.
43
Figure 15; observation notes from the DIM
4.3.2.3 Document analysis
Documents were shared by Akros before the final trip to Zambia. They included published
and unpublished works, and reports. They gave me an insight on the goal and reasons for the
HMIS strengthening carried out by Akros, as well as reports on the country´s current state of
data use and DIMs. Other documents on Zambia DHIS2 were shared upon arrival. They gave
an insight on some of the errors in Zambia´s HMIS. Most of the documents reviewed were
shared through email and the cloud.
4.3.2.4 Pictures
Pictures were taken throughout the study. The main purposes being to document the context,
as well as acting as reference later on; during analysis and interpretation. Peoples´ privacy
was taken into consideration when doing this. Therefore, it was important to ask for consent
before sharing and publishing them. Pictures were taken mainly at the DIM with the emphasis
being to show the setting rather than the people involved in them.
4.3.2.5 Online calls and Email
Online calls such as Skype and Google hangout were conducted with Akros employees, my
supervisor, and other master students working on similar projects. They were used to update
each other on the progress and current situation of the projects. Email was a good way of
asking follow-up questions to some of the informants such as progress being made in terms of
DHIS and how analyzed data is disseminated. Moreover, it was used to request and receive
more documents on the research case such as data quality reports and Agenda for DIM.
I did, at some point, have a problem getting responses from some of the informants. One of
the main informants stopped responding to my emails for a few months; even after sending
several follow up emails on the initial email. This delayed and affected the data collection and
analysis process. I had to make personal phone calls to the informants; in addition to having
third party persons do a follow up for me. These methods were successful as the informants
responded soon afterwards.
4.3.2.6 Conversations during breaks
There were several breaks at the DIM – lunch and tea breaks. I used this opportunity to
socialize with the attendance. As I was already introduced to the attendees, getting to have
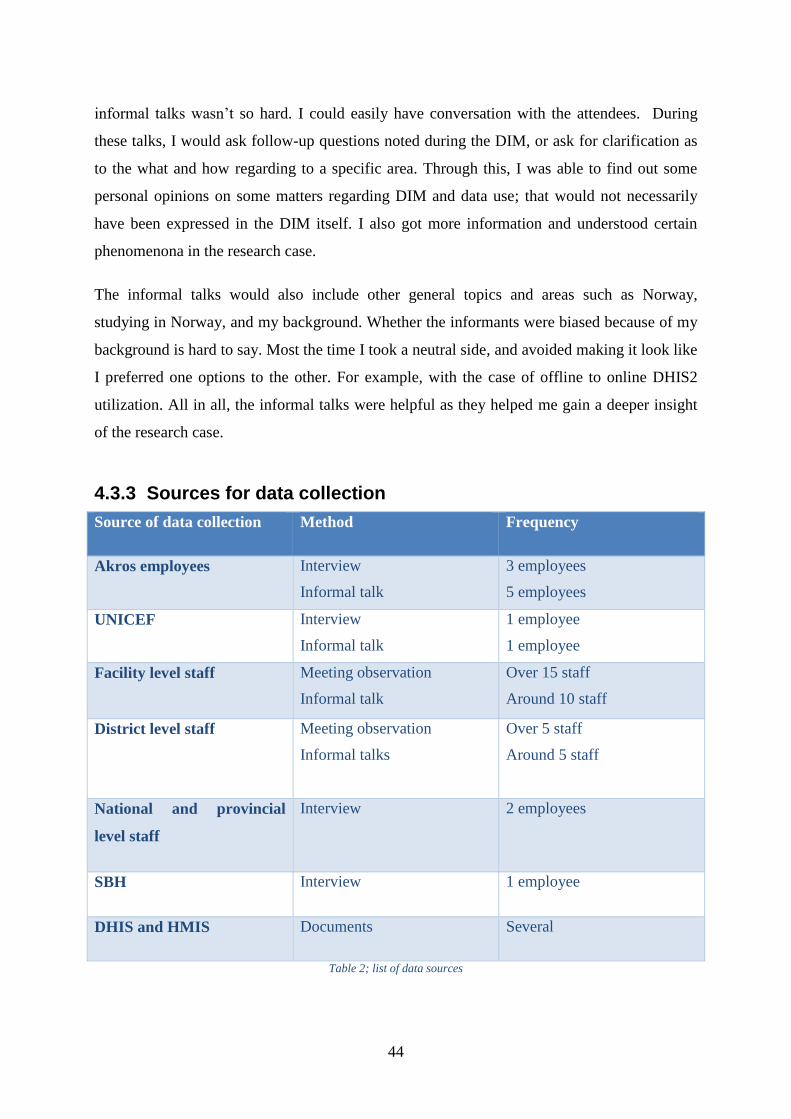
44
informal talks wasn’t so hard. I could easily have conversation with the attendees. During
these talks, I would ask follow-up questions noted during the DIM, or ask for clarification as
to the what and how regarding to a specific area. Through this, I was able to find out some
personal opinions on some matters regarding DIM and data use; that would not necessarily
have been expressed in the DIM itself. I also got more information and understood certain
phenomenona in the research case.
The informal talks would also include other general topics and areas such as Norway,
studying in Norway, and my background. Whether the informants were biased because of my
background is hard to say. Most the time I took a neutral side, and avoided making it look like
I preferred one options to the other. For example, with the case of offline to online DHIS2
utilization. All in all, the informal talks were helpful as they helped me gain a deeper insight
of the research case.
4.3.3 Sources for data collection
Source of data collection Method Frequency
Akros employees Interview
Informal talk
3 employees
5 employees
UNICEF Interview
Informal talk
1 employee
1 employee
Facility level staff Meeting observation
Informal talk
Over 15 staff
Around 10 staff
District level staff Meeting observation
Informal talks
Over 5 staff
Around 5 staff
National and provincial
level staff
Interview 2 employees
SBH Interview 1 employee
DHIS and HMIS Documents Several
Table 2; list of data sources
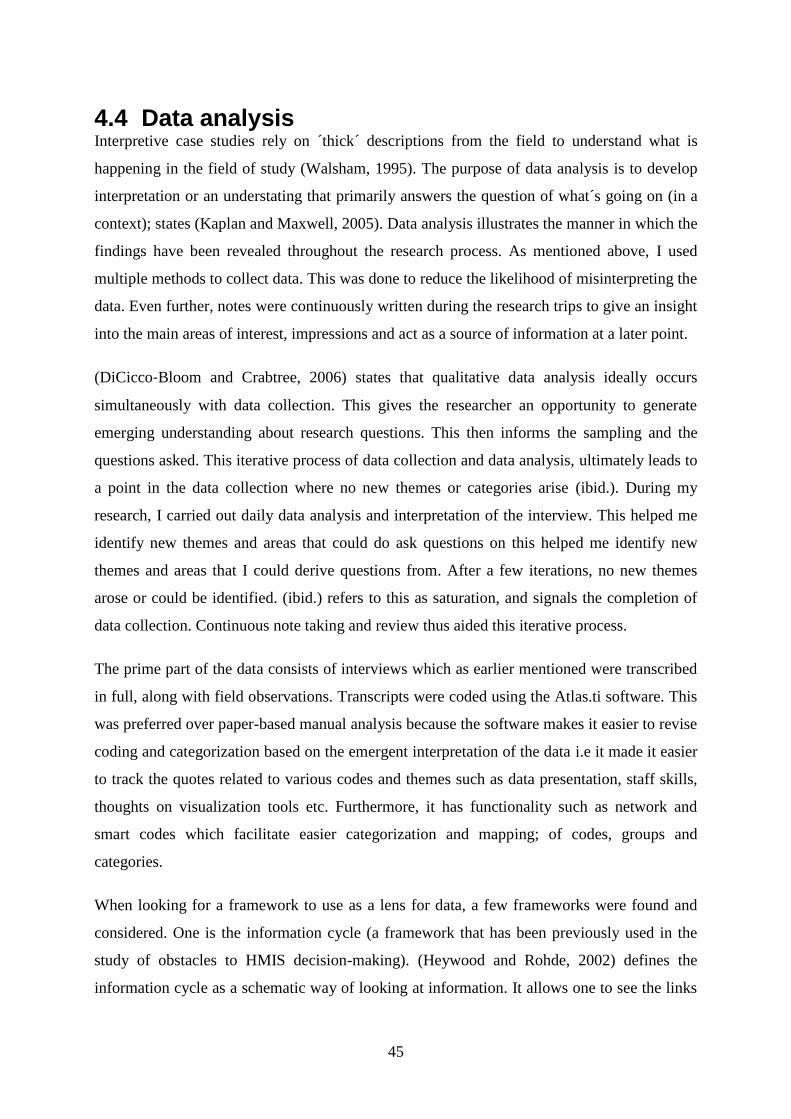
45
4.4 Data analysis Interpretive case studies rely on ´thick´ descriptions from the field to understand what is
happening in the field of study (Walsham, 1995). The purpose of data analysis is to develop
interpretation or an understating that primarily answers the question of what´s going on (in a
context); states (Kaplan and Maxwell, 2005). Data analysis illustrates the manner in which the
findings have been revealed throughout the research process. As mentioned above, I used
multiple methods to collect data. This was done to reduce the likelihood of misinterpreting the
data. Even further, notes were continuously written during the research trips to give an insight
into the main areas of interest, impressions and act as a source of information at a later point.
(DiCicco‐Bloom and Crabtree, 2006) states that qualitative data analysis ideally occurs
simultaneously with data collection. This gives the researcher an opportunity to generate
emerging understanding about research questions. This then informs the sampling and the
questions asked. This iterative process of data collection and data analysis, ultimately leads to
a point in the data collection where no new themes or categories arise (ibid.). During my
research, I carried out daily data analysis and interpretation of the interview. This helped me
identify new themes and areas that could do ask questions on this helped me identify new
themes and areas that I could derive questions from. After a few iterations, no new themes
arose or could be identified. (ibid.) refers to this as saturation, and signals the completion of
data collection. Continuous note taking and review thus aided this iterative process.
The prime part of the data consists of interviews which as earlier mentioned were transcribed
in full, along with field observations. Transcripts were coded using the Atlas.ti software. This
was preferred over paper-based manual analysis because the software makes it easier to revise
coding and categorization based on the emergent interpretation of the data i.e it made it easier
to track the quotes related to various codes and themes such as data presentation, staff skills,
thoughts on visualization tools etc. Furthermore, it has functionality such as network and
smart codes which facilitate easier categorization and mapping; of codes, groups and
categories.
When looking for a framework to use as a lens for data, a few frameworks were found and
considered. One is the information cycle (a framework that has been previously used in the
study of obstacles to HMIS decision-making). (Heywood and Rohde, 2002) defines the
information cycle as a schematic way of looking at information. It allows one to see the links
46
between the different phases data goes through. These phases include; collecting, processing,
analyzing, presenting, interpreting and using information. An example of the information
cycle use, is the case of (Garrib et al., 2008) where it was used to evaluate the implementation
of the DHIS in 10 primary health care clinics in South Africa.
However, I found this framework to be too broad and not specific about the different types of
challenges associated with HMIS data use and decision making. Hence, it would be difficult
to drawn on the information cycle to structure empirical data and identify specific challenges
and potential remedies to those challenges. Besides, live visualization data tools, which is an
important theme in the study, it didn´t clearly transcend the information cycle framework
hence would be a challenge to develop a model for the live data tools introduction.
“This paper also focuses specifically on those interventions that most directly affect the
demand for and use of data.” (Nutley, 2012, p.3)
In search of a more specific framework, the (Nutley, 2012) conceptual framework was
identified. It was adopted because of;
It´s a specific elaboration of the PRISM assessment tools – which has been widely
used to assess and improve HMISs. An example is the Zambia HMIS assessment
(Akros Inc., 2016). It has interventions that I could use to identify specific challenges,
and eventually develop a model for the synthesis of potential use of live data
visualization tools.
It fits with this research´s practical motivation; which is improving data use leads to
improved HMIS and health service delivery.
The framework has backing from literature/findings, and data from other sources.
Each framework intervention is clearly explained and then backed up by literature. I
therefore, considered it a credible source/framework.
The field notes were reviewed and coded by themes that emerged through the review of the
transcripts. Codes, themes and categories created were mainly informed by the framework
and (Wickremasinghe et al., 2016) as discussed in chapter 2.2 An example from the
transcripts is “We do not have many people who have the skill in terms of data analysis.” This
was coded as “staff skills”. It was grouped under the category “personnel capacity and
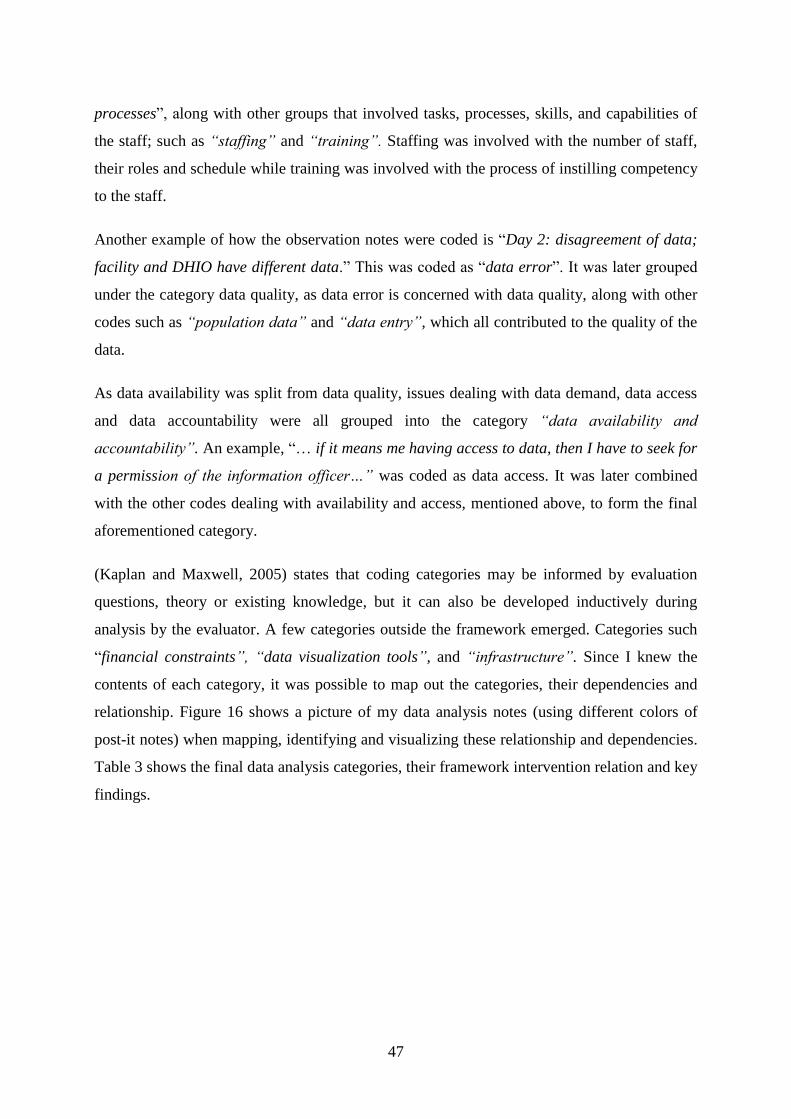
47
processes”, along with other groups that involved tasks, processes, skills, and capabilities of
the staff; such as “staffing” and “training”. Staffing was involved with the number of staff,
their roles and schedule while training was involved with the process of instilling competency
to the staff.
Another example of how the observation notes were coded is “Day 2: disagreement of data;
facility and DHIO have different data.” This was coded as “data error”. It was later grouped
under the category data quality, as data error is concerned with data quality, along with other
codes such as “population data” and “data entry”, which all contributed to the quality of the
data.
As data availability was split from data quality, issues dealing with data demand, data access
and data accountability were all grouped into the category “data availability and
accountability”. An example, “… if it means me having access to data, then I have to seek for
a permission of the information officer…” was coded as data access. It was later combined
with the other codes dealing with availability and access, mentioned above, to form the final
aforementioned category.
(Kaplan and Maxwell, 2005) states that coding categories may be informed by evaluation
questions, theory or existing knowledge, but it can also be developed inductively during
analysis by the evaluator. A few categories outside the framework emerged. Categories such
“financial constraints”, “data visualization tools”, and “infrastructure”. Since I knew the
contents of each category, it was possible to map out the categories, their dependencies and
relationship. Figure 16 shows a picture of my data analysis notes (using different colors of
post-it notes) when mapping, identifying and visualizing these relationship and dependencies.
Table 3 shows the final data analysis categories, their framework intervention relation and key
findings.
48
Figure 16; data analysis notes and category mapping and relationships
Category Framework intervention Key finding
Data quality Improving data quality;
improving data availability
Poor data quality.
Data availability and
accountability
Improving data quality;
improving data availability
Limited access to data –
especially to the facility
levels.
Low data accountability
Standard processes and
procedures
Strengthening the
organization’s data demand
and use infrastructure.
Lack of national standards
and guidelines for DIMs
and data use.

49
Partners involvement Engaging data users and
data producers.
Strengthening the
organization’s data demand
and use infrastructure.
Poor partner coordination;
fragmented HMIS.
Personnel processes and
capacity
Engaging data users and
data producers.
Building capacity in data
use core competencies.
Monitoring and evaluating,
communicating data
demand and use successes.
Lack of data analysis skills
by staff; especially the
facility level.
Staffing challenges.
Live visualization tools Strengthening the
organization’s data demand
and use infrastructure.
Current limited use of
Visualization tools.
Impact positively on data
use
Infrastructure All interventions Various infrastructural
constraints.
Finance All intervention Financial constraints for
DIMs and health programs.
Table 3: Data analysis categories, key findings and framework intervention relation
A model for synthesizing the potential of live data visualization data tools was also
developed. It´s shown by figure 23 and discussed further in chapter 6.2.7 (see page 79). With
the help of the conceptual framework, the identified challenges (from data analysis) are
mapped out in terms of their relationship to the live data visualization tools. Two groups of
relationships emerged. I named them with respect to their already identified relationship. The
two groups of challenges are “determinant challenges” - which limit the use of data
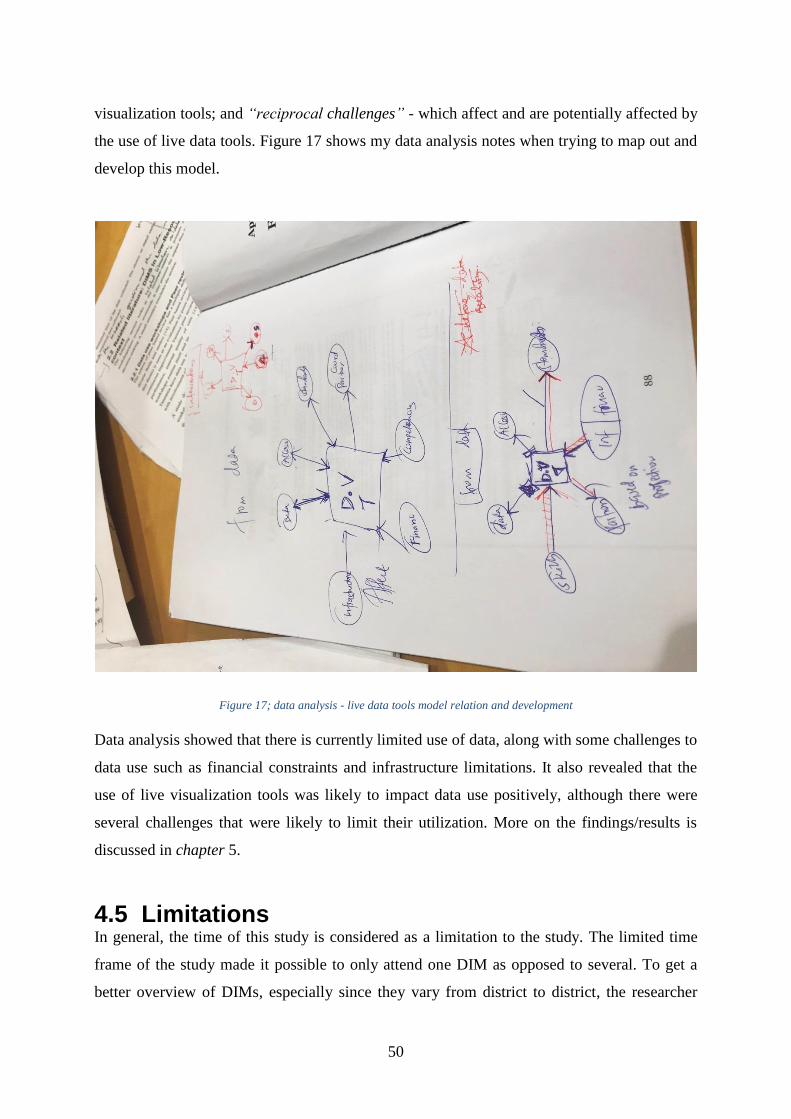
50
visualization tools; and “reciprocal challenges” - which affect and are potentially affected by
the use of live data tools. Figure 17 shows my data analysis notes when trying to map out and
develop this model.
Figure 17; data analysis - live data tools model relation and development
Data analysis showed that there is currently limited use of data, along with some challenges to
data use such as financial constraints and infrastructure limitations. It also revealed that the
use of live visualization tools was likely to impact data use positively, although there were
several challenges that were likely to limit their utilization. More on the findings/results is
discussed in chapter 5.
4.5 Limitations In general, the time of this study is considered as a limitation to the study. The limited time
frame of the study made it possible to only attend one DIM as opposed to several. To get a
better overview of DIMs, especially since they vary from district to district, the researcher

51
believes it was necessary to attend more. However, this was addressed by interviewing, at
least one, informants from partner and national levels. Having attended several DIMs, the
information they shared would have come from vast DIMs; various provinces and districts.
Due to the time frame, the number of informants interviewed was limited. This was addressed
by interviewing informants from all the levels (facility to partner level) in order to get
information on the overall context. In addition, since this is a qualitative interpretive study,
where the participants responded to questions of an explorative nature, the number of
participants doesn´t affect the validity of the study. “The product of any qualitative analysis is
an interpretation, rather than a purely “objective” account.” (Kaplan and Maxwell, 2005).
Instead, it´s what they shared that´s very meaningful and at the core of this study.
4.6 Ethical considerations Ethical considerations are important when conducting a research. Qualitative case studies
share interest in personal views and settings (Denzin and Lincoln, 1994, Chapter 17).
Moreover, there is always a possibility of recognizing the participants (Goodwin, 2006). Per
se, the principle of confidentiality need be addressed. Confidentiality means that the
information given during interviews by informants will not be traced back to them, or made
available to others (ibid.). It´s been therefore necessary and important to keep the informants
as anonymous possible – through storage, noting down of names with regards to the
interviews, and use of generalized names like “facility staff” for quotation.
Another important aspect to consider is the mosaic effect – where bits of information are
pieced together to create a fuller picture, and eventually identifying the person/informant. It´s
however, quite easy to identify the different informants and stakeholders in this study given
that it has a limited scope; this is noted as challenge to confidentiality by (ibid.). This study
however, does not include very controversial information. No informant raised concerns
about being identifiable or any confidentiality issues.
The informants were given an overview of the interview, as described in chapter 4.3.2.1.
Verbal consent for interviewing and recording was then given. No sensitive or personal data
was collected, so no strong measures were used to secure and store recordings. Both
recordings and transcripts were stored in the cloud, as were the pictures taken during the
research.
52
4.7 Summary This chapter explains the research methodologies applied to the research in this study. It also
shows how these methods have been applied. The role of the researcher, and interpretative
qualitative study are discussed in detail. The various methods used to arrive (data collection)
at the empirical findings are outlined, and discussed along with how the data was analyzed
and structured. Examples on the data analysis process are also given. Limitations of the
research are next to be addressed. The chapter concludes with a description of the ethical
guidelines and how they were handled. The data collected using all the methods described in
this chapter, is presented in the next chapter (Empirical findings).
53
5 EMPIRICAL FINDINGS In this chapter, I present the empirical data collected during the fieldwork. Data was mainly
collected through observation, interviews and informal talks. The data is largely
supplemented with quotes from interviews. The findings are grouped with related fields such
as infrastructure, governance and funding, capacity of personnel etc.
5.1 Capacity of Personnel
5.1.1 The participants
The attendees of DIMs are from all the levels of the health system. Most of the attendees were
health facility staff. They have different titles which were hard to understand at first, but were
later on explained to me by one of the facility staff. They all had a role/position they
represented such as nutrition health, Mother and Child Health etc. The partners/donors’
representatives were also present. Table 4; Participants and their designations shows the
participants, their designation and the level they represent.
During one of the informal talks with the DHIO, he informed me that anyone is invited to the
DIM from the district. He normally encourages rotation of the facility staff attending the DIM
in that, it’s not always the same facility personnel attending the DIM. This is a way of
exposing the facility staff to data use discussion, and thus understand the purposes why they
collect data. The facility and district staff usually get a daily allowance when attending the
meeting. The amount would vary depending on the location of the DIM and their role in the
district.

54
Level Designation
Facility Clinical officers
Nurses
Midwives
EHT
CHAs
District DDH
DC
DHIO
Data specialist
Nutritionist
Partners – World vision and UNICEF Consultants
Table 4; Participants and their designations
5.1.2 Computer literacy
Most members of the facility in attendance had a personal laptop and/or smartphone with
them. This was as a result of recommendation/encouragement from the DHIO (to buy a
personal laptop) a way of improving their computer literacy (and of the district at large). They
were able to operate and carry out tasks on their laptops quite comfortably. However, this
represents just a few of the health officers at the DIM. The level of computer literacy at the
various facilities is therefore, hard to tell/judge based on this.
5.1.3 Data presentation, review and analysis
“We do not have many people who have the skill in terms of data analysis... Program officers
even at the district level, they still have some lapses in terms of how they can analyze their
data and how they can use it. Also, the facilities in charges, they also have that challenge” –
district official
The health facility staff did not receive training on data presentation, review and analysis.
Data interpretation was a problem as some of the facility staff didn´t understand them. A
number of times during the DIM certain indicators, would be explained to the facility staff.
National targets were not also clear in some cases; all these results in data analysis challenges.
The presenters were shy and looked away from the audience, in addition to them being
55
inaudible. They would quickly skip through slides but maybe this was a way of being fast
and keeping time because all 21 facilities were supposed to present. However, the district
level staff received training on data review and analysis.
“I think also some of those examples; some of the facilities were actually getting surprised of
their own data they are presenting themselves.” – district official
In one case during a facility presentation, the presenter seemed confused on the figures they
were presenting; whether they were percentages or actual figures. Prior to the DIM, and on a
monthly basis, the facilities were supposed to review, discuss and analyze their data.
However, this seemed not to be the case. This is echoed by (USAID Systems for Better
Health, July 2016) where the facility staff say that there is no need of doing data review if it’s
done only when there is a DIM. In some cases, the presenters were non-technical people and
could not really answer the questions that arose.
5.1.4 DHIS2 Capability
Most of the facility staff were not aware or conversant with DHIS2. Some of the knowledge
they had was that DHIS2 was a HMIS in use. Other health facility staff that used DHIS2 only
used it for data entry. They did not have access or rights to perform other functions with
DHIS2. Contrary to the facility staff, the district level staff were well conversant with DHIS2.
They would perform various functions including creating dashboards and graphs, and access
to data. Some of the quotes below show the informants responses to their DHIS2 capabilities.
“In terms of access, it’s limited. I’m the only who can enter in to the DHIS and pull out data.
We don’t have function or dashboards where probably I can populate in advance… rely on
my presence. If I’m not there then they will not do it.” – district official
“I think I have never used DHIS software.” – facility staff
“… Mainly it’s only on data entry and also generating of reports. Like the HIA1, HIA2, HIA3
and 4.” – facility staff
Limited access to data implies less availability of data to the health staff at the facility. In
addition, they were dependent on the district level for access and advanced DHIS2
capabilities, such as dashboards. Data entry into DHIS2 was done at the district level mainly
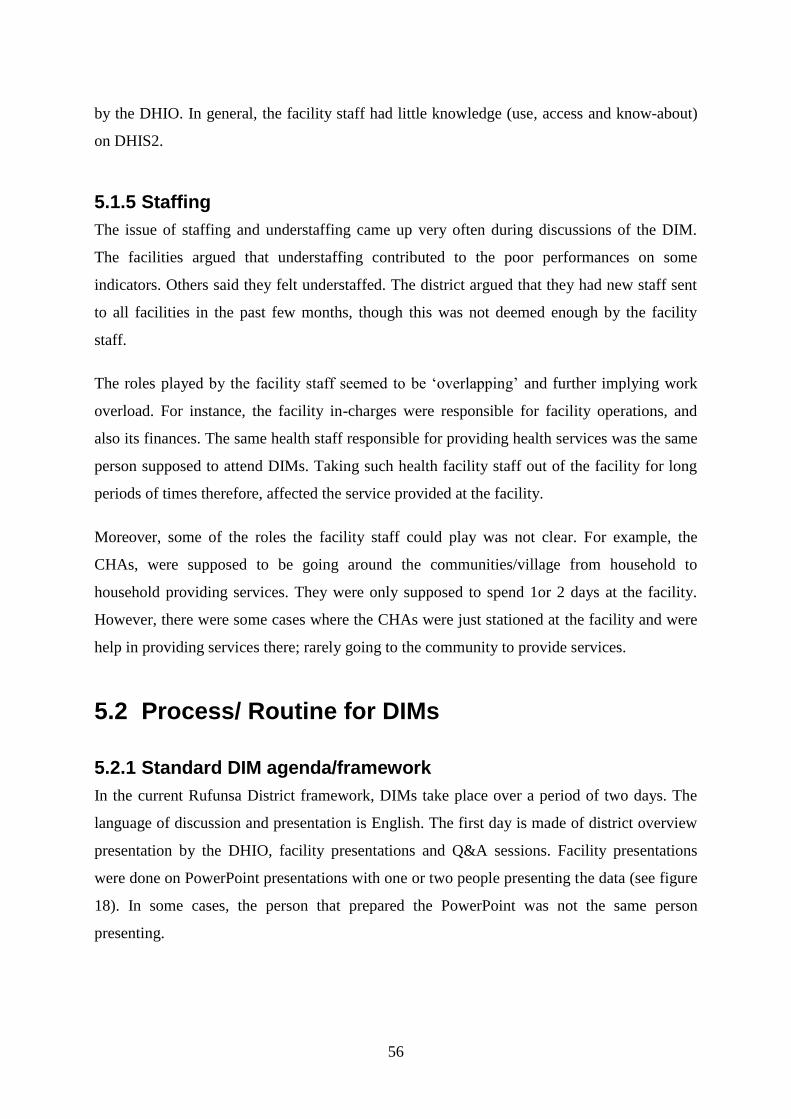
56
by the DHIO. In general, the facility staff had little knowledge (use, access and know-about)
on DHIS2.
5.1.5 Staffing
The issue of staffing and understaffing came up very often during discussions of the DIM.
The facilities argued that understaffing contributed to the poor performances on some
indicators. Others said they felt understaffed. The district argued that they had new staff sent
to all facilities in the past few months, though this was not deemed enough by the facility
staff.
The roles played by the facility staff seemed to be ‘overlapping’ and further implying work
overload. For instance, the facility in-charges were responsible for facility operations, and
also its finances. The same health staff responsible for providing health services was the same
person supposed to attend DIMs. Taking such health facility staff out of the facility for long
periods of times therefore, affected the service provided at the facility.
Moreover, some of the roles the facility staff could play was not clear. For example, the
CHAs, were supposed to be going around the communities/village from household to
household providing services. They were only supposed to spend 1or 2 days at the facility.
However, there were some cases where the CHAs were just stationed at the facility and were
help in providing services there; rarely going to the community to provide services.
5.2 Process/ Routine for DIMs
5.2.1 Standard DIM agenda/framework
In the current Rufunsa District framework, DIMs take place over a period of two days. The
language of discussion and presentation is English. The first day is made of district overview
presentation by the DHIO, facility presentations and Q&A sessions. Facility presentations
were done on PowerPoint presentations with one or two people presenting the data (see figure
18). In some cases, the person that prepared the PowerPoint was not the same person
presenting.
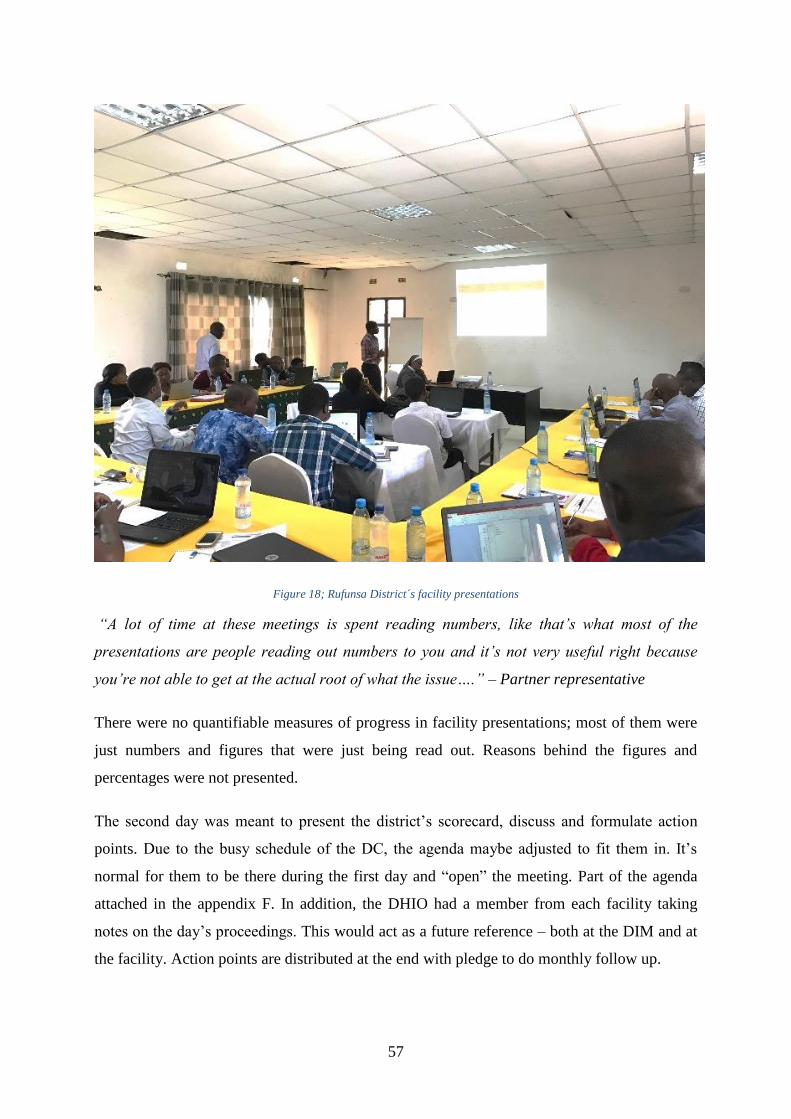
57
Figure 18; Rufunsa District´s facility presentations
“A lot of time at these meetings is spent reading numbers, like that’s what most of the
presentations are people reading out numbers to you and it’s not very useful right because
you’re not able to get at the actual root of what the issue….” – Partner representative
There were no quantifiable measures of progress in facility presentations; most of them were
just numbers and figures that were just being read out. Reasons behind the figures and
percentages were not presented.
The second day was meant to present the district’s scorecard, discuss and formulate action
points. Due to the busy schedule of the DC, the agenda maybe adjusted to fit them in. It’s
normal for them to be there during the first day and “open” the meeting. Part of the agenda
attached in the appendix F. In addition, the DHIO had a member from each facility taking
notes on the day’s proceedings. This would act as a future reference – both at the DIM and at
the facility. Action points are distributed at the end with pledge to do monthly follow up.
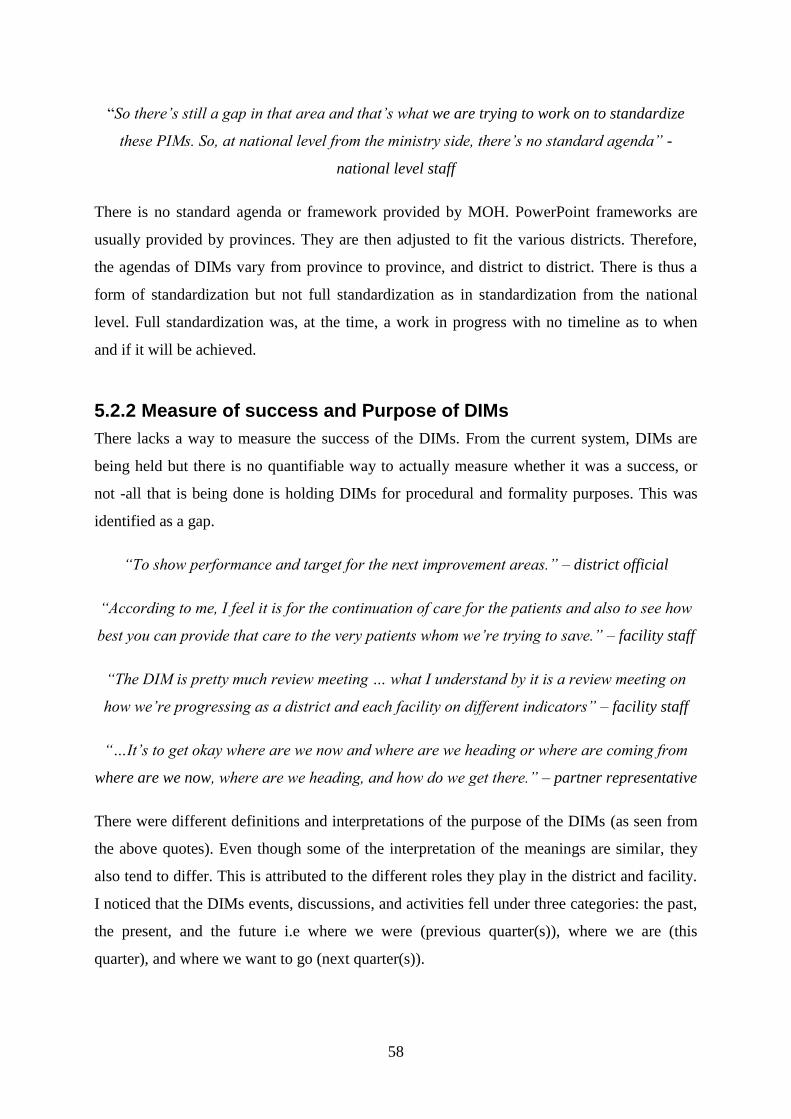
58
“So there’s still a gap in that area and that’s what we are trying to work on to standardize
these PIMs. So, at national level from the ministry side, there’s no standard agenda” -
national level staff
There is no standard agenda or framework provided by MOH. PowerPoint frameworks are
usually provided by provinces. They are then adjusted to fit the various districts. Therefore,
the agendas of DIMs vary from province to province, and district to district. There is thus a
form of standardization but not full standardization as in standardization from the national
level. Full standardization was, at the time, a work in progress with no timeline as to when
and if it will be achieved.
5.2.2 Measure of success and Purpose of DIMs
There lacks a way to measure the success of the DIMs. From the current system, DIMs are
being held but there is no quantifiable way to actually measure whether it was a success, or
not -all that is being done is holding DIMs for procedural and formality purposes. This was
identified as a gap.
“To show performance and target for the next improvement areas.” – district official
“According to me, I feel it is for the continuation of care for the patients and also to see how
best you can provide that care to the very patients whom we’re trying to save.” – facility staff
“The DIM is pretty much review meeting … what I understand by it is a review meeting on
how we’re progressing as a district and each facility on different indicators” – facility staff
“…It’s to get okay where are we now and where are we heading or where are coming from
where are we now, where are we heading, and how do we get there.” – partner representative
There were different definitions and interpretations of the purpose of the DIMs (as seen from
the above quotes). Even though some of the interpretation of the meanings are similar, they
also tend to differ. This is attributed to the different roles they play in the district and facility.
I noticed that the DIMs events, discussions, and activities fell under three categories: the past,
the present, and the future i.e where we were (previous quarter(s)), where we are (this
quarter), and where we want to go (next quarter(s)).
59
5.2.3 District Scorecard
A district scorecard was one of the data visualization tools presented. It was prepared prior to
the DIM by DHIO´s office. The same office would lead the discussion of the scorecard at the
DIM. “…I start now making my presentation for the district. Then from there I will also make
a separate score card for certain indicators. All this is actually done manually because when
it comes to data analysis I usually do it in Excel.” The scorecard was manually prepared
using excel. They would export data from DHIS2 into an excel spreadsheet. Color coding all
the indicators would then follow. The scorecard would then normally be presented by DHIO
on the second day of the DIM. Figure 19 shows presentations and discussions of the district´s
scorecard. Figure 20 an example of scorecard, on excel, from Rufunsa district, quarter 3 and 4
of 2016
Figure 19; district scorecard presentation and discussion
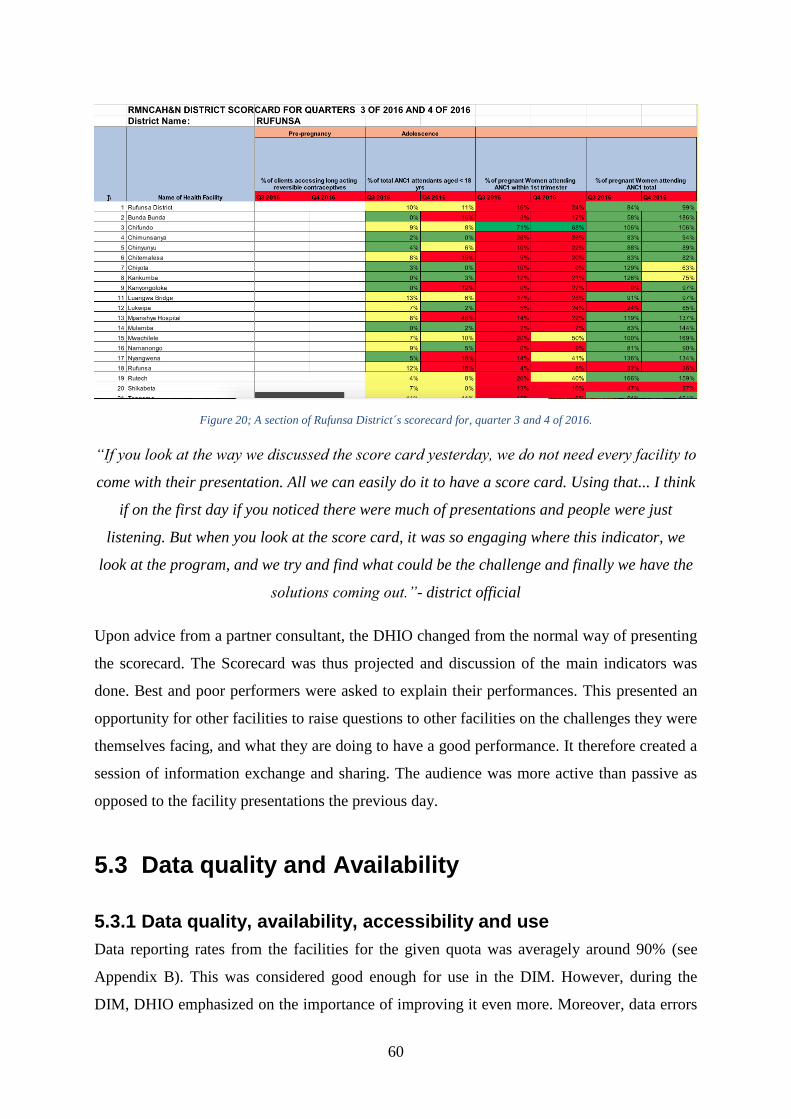
60
Figure 20; A section of Rufunsa District´s scorecard for, quarter 3 and 4 of 2016.
“If you look at the way we discussed the score card yesterday, we do not need every facility to
come with their presentation. All we can easily do it to have a score card. Using that... I think
if on the first day if you noticed there were much of presentations and people were just
listening. But when you look at the score card, it was so engaging where this indicator, we
look at the program, and we try and find what could be the challenge and finally we have the
solutions coming out.”- district official
Upon advice from a partner consultant, the DHIO changed from the normal way of presenting
the scorecard. The Scorecard was thus projected and discussion of the main indicators was
done. Best and poor performers were asked to explain their performances. This presented an
opportunity for other facilities to raise questions to other facilities on the challenges they were
themselves facing, and what they are doing to have a good performance. It therefore created a
session of information exchange and sharing. The audience was more active than passive as
opposed to the facility presentations the previous day.
5.3 Data quality and Availability
5.3.1 Data quality, availability, accessibility and use
Data reporting rates from the facilities for the given quota was averagely around 90% (see
Appendix B). This was considered good enough for use in the DIM. However, during the
DIM, DHIO emphasized on the importance of improving it even more. Moreover, data errors

61
were present. For example, one of the facility had different figures in a certain indicator, to
the figures in the DHIS2. Upon investing it, by use of previous trends from that facility on
that particular indicator, it was recognized as a data entry error. This is because there was a
very high jump in the figure recorded for that quota from the previous quotas. Conflicts in
data were usually/often deferred to another time in the future.
“It is used for planning, also measuring performance. As well also data is also used to set
national targets even the national level.” – facility staff
Informants were asked about how they felt data is being used and what purposes they feel it’s
being used for. Here a few challenges (gaps as they would call them) on data quality, data use
and analysis were identified. How they felt the data was being used would vary depending on
their designation. The facility staff did not understand the data, and thus they did not use it
frequently. “It was just a matter of fulfilling what is required of them” (data collection and
reporting) as one informant put it.
“The challenge I’ve noticed with data use is accessibility. We haven’t created enough
platform for our users to access it easily. As long as it’s still in a manual form, I don’t really
expect much from the facility. I feel the data is not being to the capacity it’s supposed to be
used…” – district official
“So, program people who are supposed to make these decisions they’re not demanding for
data they’re not thinking of programmatic questions or areas they need to improve on and
then ask for data to make decisions.” – national level representative
Furthermore, access to data was largely limited to only the district office staff. Facility staff
were dependent on the district office to disseminate processed data. Not even the officers for
whom the data is intended had the necessary access. In addition, demand for data by the
program officers, and the `ín-charge´ personnel was rare; further showing the limited
utilization of data. Presence of analyzed data (in the form of charts, graphs etc) was also
lacking at the facilities. I didn´t come along channels to communicate best case practices as a
means of promoting data use. These might have negatively impacted data use, and data-driven
decision making.
62
5.3.2 DHIS2 clean-up and Live DHIS2
“So, we’re struggling to make sure that we take DHIS2 to place whereby it can be suitable for
analysis and in a user-friendly way. So, there’s a plan in place of course.” – partner
representative
Zambia´s DHIS2 experiences a few challenges and errors that need to be `cleaned-up`. The
Zambian DHIS2 needed clean-up; to remove some of errors present. An example of these
errors is indicator calculation using comb categories and population data duplication. Another
example is the lack of or presence of conflicting population data figures. Population figures
are really important in the calculation of indicators – which are used to measure performance
of various health services provided.
“one thing, which we can gain by using live DHIS2, is if you make it presentational or you
make a demonstration you’re giving people a wide room to challenge, to ask questions, and
view data into different dimensions. But if you’re using a PowerPoint is static… one of the
reason is the one which I told you before like a flexibility and to becoming dynamic but the
second thing is, a lot of people spend a lot of time to prepare this PowerPoint representation
so using a live system is a time saving.” – partner represetnaitve
The entire team from facility, to MOH, to partners like Akros all support and welcome the use
of live DHIS2 for DIMs. Apart from spending less time on making presentation, it will also
increase data use in that more engaged data-based discussions will occur. They believe it will
positively impact data quality and data use by improving the efficiency of DIMs.
5.3.3 Population data
“The population data, we got from CSO, Central Statics Office through their 2010 census
bulletin. By then Rufunsa was not created yet… because the Rufunsa Constituency is what
also became the Rufunsa District. Using that population, we are able to cut off from the total
population which is allocated for Chongwe.” – district official
Lack of up-to-date population data is one of the challenges highlighted at the DIM. After new
districts were created in Zambia, the facilities catchment area changed and it is therefore
difficult to know the exact population each facility is serving. It´s assumed that this is the case
in most newly created districts and facilities. Various facilities have raised concern about the
data being in DHIS2 not reflecting the exact population at the facilities. The last national
63
census was held in 2010 (Central Statistical Office, 2017). Currently the Zambian DHIS2 is
using projection data provided by the CSO. This is reflected when calculating indicators,
where for example you have an over 100% value. All in all, this population data has affected
the quality of the data; in terms of indicator calculation.
5.4 Infrastructure
5.4.1 Location of DIMs
According to Rufunsa’s DHIO, the locations where the DIMs take place always vary (among
districts). They usually happen at lodges or hotels with conference facilities. Where to hold
them also is dependent on the funding available and number of people attending the
conference. Due to this variation, the facilities and services offered by the various chosen
locations will vary. For example, one hotel may provide internet and accommodation services
while others will not.
In this case, the DIM happened at Chimuthunzi Lodge in Chongwe. Chongwe is a small town
which is in Chongwe district and part of Lusaka province. The facilities and services offered
at the lodge were quite basic (pen, paper, water, projector and foodservices.) During the 3
days of the meeting, lunch was always late and therefore this would normally eat into the time
of the meeting making it begin later than anticipated.
5.4.2 Funding
Funding comes from MOH, donors and Partners. Some of the current donors/partners of
MOH are UNICEF, USAID, EU. Funds were disseminated from the central level to the lower
levels. How funds are used depends on the project and district prioritization. DIMs frequency
depended on availability of funds. Failure to secure enough funds or secure them on time
resulted in changes to their (DIM) timeline/occurrence. This was the case in Rufunsa where
they only had one DIM the previous year.
“I wouldn’t say that it’s more partner funded. I would say that when the partners have come
and they want to bring in that strengthening, and they have talked of wanting to support…. I
would give you an example. In 2016, when the partners did not support DIM, we had our last
DIM financed from the GRZ funds… The government´s will is there to support and they want
64
to support it, but if there are more competing demands and then the funds are limited, we
might want to prioritize.” – district official
There were split opinions on funding of the DIMs. Some informants felt that DIMs were
majorly donor funded while other felt the opposite – more MOH funded or equal. Lack of
funding for DIMs by MOH was attributed to prioritization of other health areas according to
some informants.
“… there’s definitely some sort of difference in terms of the focus based on who’s funding
what DIM and all those things and stuff like that…” – national level representative
In addition, funding by the partner/ donors was more biased and focused towards what their
area of interest i.e they would fund their own area of interest (such health programs, districts)
rather than the whole health and service delivery sector.
5.4.3 Internet connectivity and Electricity
There was no internet connectivity provided for the meeting or by the lodge. The only internet
available was personal mobile internet. This was accessed by use of modems or personal
hotspot. This, therefore, meant while some of the attendees (like the DHIO) had internet
connectivity some of the attendees from the facility lacked connectivity.
“The challenges like in our hospital is electricity power. We do have the PCs around like the
desktop and the laptops here and there but for them to function well the power is not sufficient
enough and also the internet system quite expensive of course so that is the major challenge
that which we have.” – facility official
Frequent power blackout was experienced. I was told this was the case in the whole country.
It was called ‘load-shedding’ by the locals – an attempt to distribute the electrical power
equally due to the low amount of electricity produced. The lodge however had a generator
that would be powered up and provide electricity when needed. Most facilities in Rufunsa
lacked electricity. They were using solar energy in most cases.
5.5 Quality Improvement “When we come in to QI, QI will actually come and tell us what is the real root cause of this
problem? Using that you will find that when we implement the QI project, next time we have
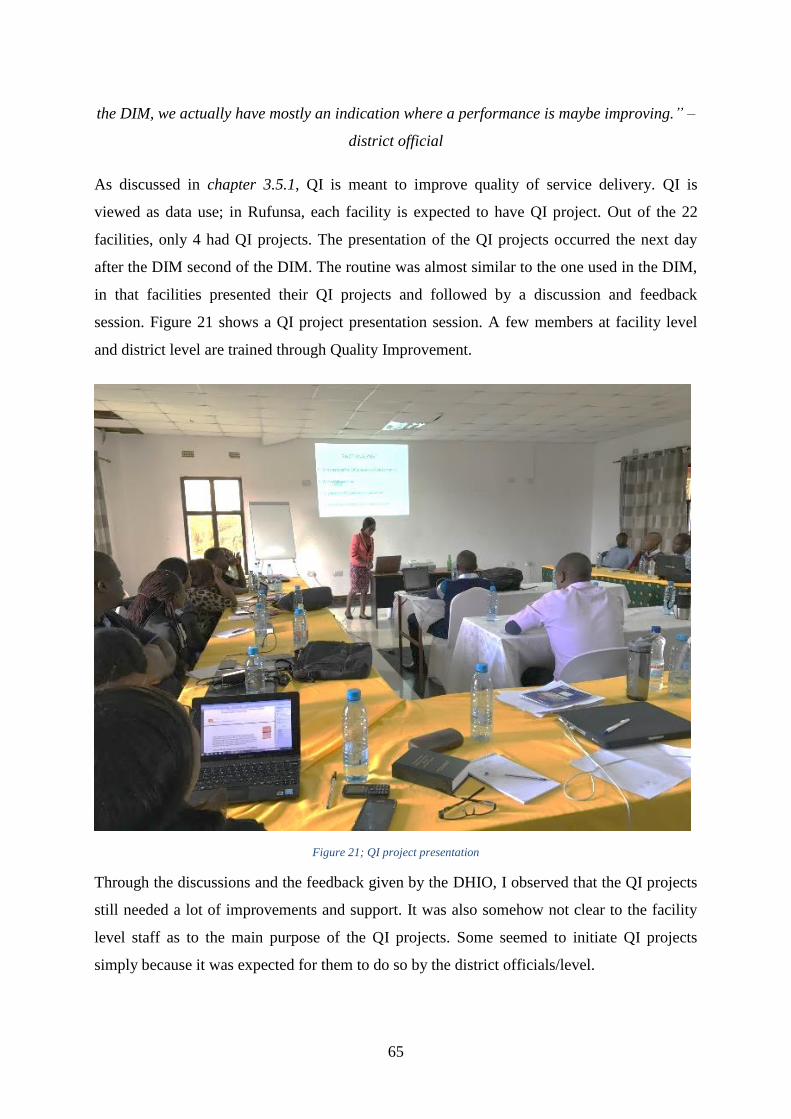
65
the DIM, we actually have mostly an indication where a performance is maybe improving.” –
district official
As discussed in chapter 3.5.1, QI is meant to improve quality of service delivery. QI is
viewed as data use; in Rufunsa, each facility is expected to have QI project. Out of the 22
facilities, only 4 had QI projects. The presentation of the QI projects occurred the next day
after the DIM second of the DIM. The routine was almost similar to the one used in the DIM,
in that facilities presented their QI projects and followed by a discussion and feedback
session. Figure 21 shows a QI project presentation session. A few members at facility level
and district level are trained through Quality Improvement.
Figure 21; QI project presentation
Through the discussions and the feedback given by the DHIO, I observed that the QI projects
still needed a lot of improvements and support. It was also somehow not clear to the facility
level staff as to the main purpose of the QI projects. Some seemed to initiate QI projects
simply because it was expected for them to do so by the district officials/level.

66
“That’s a huge challenge. I think its work overload. These are people who are only … Their
duty is not just doing data. They are also clinicians who are supposed to attend to patients.” –
district official
QI projects faced a number of challenges such as funding and staffing. Most of the people
expected to carry out and oversee these QI projects were the same as those
present/responsible for the DIMs. There was thus a responsibility ‘overlap’, and work
overload in some cases. These challenges resulted in the staff not being proactive at all these
activities; clinical, management and administration.
5.6 Governance, Donors and Partners “I think we have been receiving quite a lot of support because our immediate supervisors
usually are people from the province. I think you saw some of them being in that meeting.
They have been coming to give their technical support and then sometimes they will also I
think …” – district official
The DC was in attendance to give a closing speech at the DIM. Figure 22 shows the DC
addressing the DIM. She gave a very strong speech on the health situation, and was very
concerned with the overall situation in the district. In her speech, she covered some of the
challenges she had encountered, in addition to giving suggestions on how to solve them.
DHIO informed me that they always invite the DC, as this shows support from the MOH.
General support from MOH to the district was sufficient according to district and facility
staff.
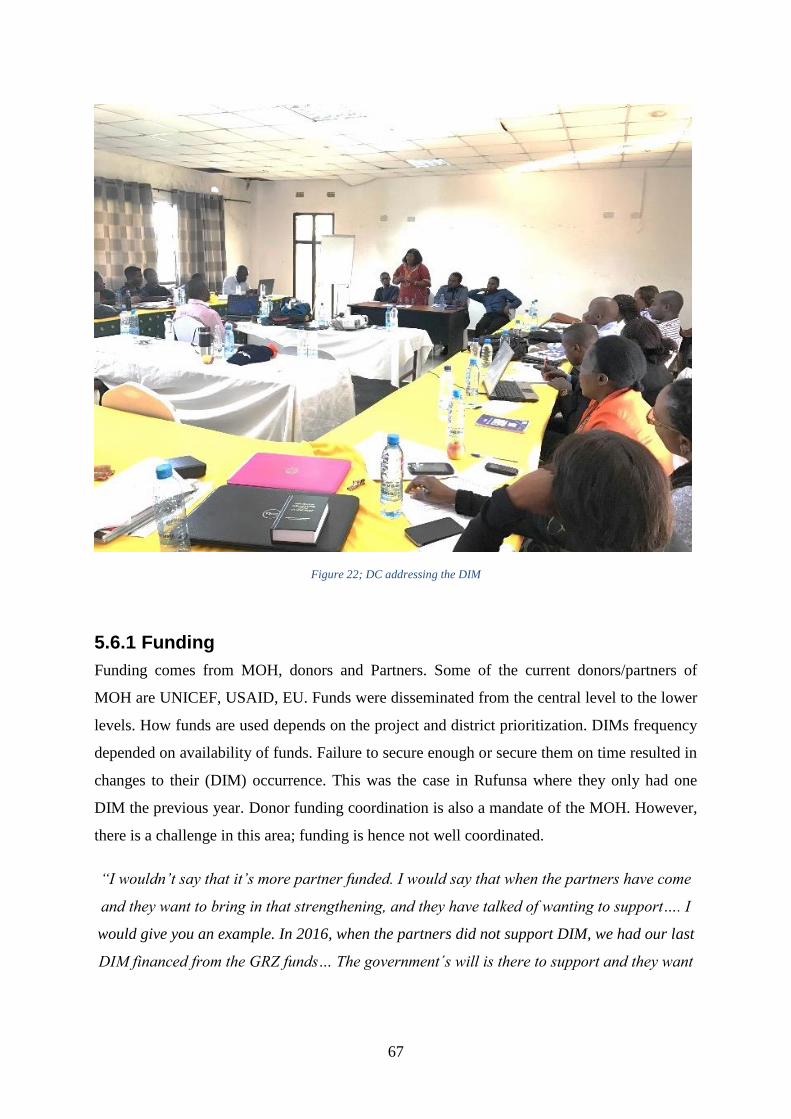
67
Figure 22; DC addressing the DIM
5.6.1 Funding
Funding comes from MOH, donors and Partners. Some of the current donors/partners of
MOH are UNICEF, USAID, EU. Funds were disseminated from the central level to the lower
levels. How funds are used depends on the project and district prioritization. DIMs frequency
depended on availability of funds. Failure to secure enough or secure them on time resulted in
changes to their (DIM) occurrence. This was the case in Rufunsa where they only had one
DIM the previous year. Donor funding coordination is also a mandate of the MOH. However,
there is a challenge in this area; funding is hence not well coordinated.
“I wouldn’t say that it’s more partner funded. I would say that when the partners have come
and they want to bring in that strengthening, and they have talked of wanting to support…. I
would give you an example. In 2016, when the partners did not support DIM, we had our last
DIM financed from the GRZ funds… The government´s will is there to support and they want

68
to support it, but if there are more competing demands and then the funds are limited, we
might want to prioritize.” – district official
There were split opinions on funding of the DIMs. Some informants felt that DIMs were
majorly donor funded while other felt the opposite. According to some informants, lack of
funding for DIMs by MOH was attributed to prioritization of other health areas.
“… there’s definitely some sort of difference in terms of the focus based on who’s funding
what DIM and all those things and stuff like that…” – national level representative
In addition, funding by the partner/ donors was more biased and focused towards their area of
interest(s) i.e they would fund their own area of interest (such health programs, districts)
rather than the whole health and service delivery sector.
5.6.2 Donor collaboration
“Well, I think that’s a challenge that we all face and in this kind of work… it’s a lot maybe
not harder but we’ve noticed that partners just sort of do just do their own activities without
really saying.” – partner representative
“We still have parallel databases. Not all databases are sitting in DHIS. I’ll give you an
example of Smart Care. Smart Care is a parallel database. Imam for nutrition is a parallel
database.” – DHIO
There is currently poor/limited partner coordination and collaboration. This can be attributed
to the fact that each partner has their own focus areas/projects/programs and key indicators. In
a way, in a way, it can be said that they are parallel programs and databases. This has led to
redundancy of activities and events of facilities. For example, in a one district, two DIMs by
two different donors were carried out. We also have cases of parallel databases, in addition to
all the data not being in DHIS2. During the DIM nutrition data was missing from DHIS2 and
therefore was not discussed. Nutrition data was however said to be in another database;
owned by one of the partners.
69
6 RESULTS AND DISCUSSION Before going on with the discussion of this chapter, a quick reminder of the objectives this
research. This study is an exploratory study on data use, district decision-making and live
visualization tools impact on data use. It therefore asks these two questions; One: find out
how is data being used, and what are the key obstacles to data use; two: What are the
prospects of using live visualization tools to strengthen DIMs and data use?
This chapter is divided into 3 sections: results, discussion and summary. The first section is
the results section. It outlines the results of data analysis and relate the results to the research
questions. The section - discussions section - uses the conceptual framework from chapter 2.2
to discuss the key results. Identified challenges to data use are address in this section.
Research question 2 is primarily (only) discussed in this section (chapter) to allow
comprehensive discussions and avoid repetition. A Summary section concludes this chapter.
6.1 Results Through data analysis it became clear how and for what purposes data is being used, what are
the key obstacles and the prospects of visualization tools. I choose to highlight the key results
and discuss them further in this section. I begin with the addressing research question 1 on
chapters, while the discussions chapter (chapter 6.2) addresses both research questions
6.1.1 Data use
The agenda of the DIMs and its discussions, under my interpretation, were geared towards:
one; where are we coming from (previous quarter(s)), two; where are we, and three; where are
we going or do we want to go (next quarter(s)). This can be said about the responses by
informants when asked what and for what purposes data is being used for. This structure
therefore helped me unpack the data and identify how data is being used. I therefore,
categorized their responses into 2 categories: one; where we were, plus where we are. Two;
where we want to go. The two categories were then assigned names and are further discussed
below. All in all, data was used in an effort to improve the quality of health services provided.
70
Performance review
“…this data which advises us on the grey areas that, the district or the facility has. It is
through this same data, it’s more like a mirror. It gives us a picture of who we are” – district
official
This covers “where are we coming from” and “where we are” category. Collected data was
used to evaluate the performance of various facilities, district, and provinces on health service
delivery. This was done by the use of indicators. It was a way of identifying the areas that
needed focus, interventions and improvement. For instance, at the facility level data was used
to show performance for a specific quarter, compare that performance to the previous quarter,
find out what progress has been made; what improved and what didn´t. Data was thus used to
show the current situation.
Planning and resource utilization
“Data to me I feel it is used for the issue of planning because how are you going to plan if
you don’t have data?” – facility staff
Data was also used for planning and resource utilization decisions. After the performance
review, came planning, resource allocation, resource prioritization. The district would use
data to make planning decisions, and setting of targets for the quarter and years (e.g next 2
year). For example, which areas they should focus on or, allocate more resources. In addition,
data was used to mobilize resources for the district. In order to get support from donors and
partners, they would first need access to data especially in the areas they needed support in.
QI projects would arise from performance reviews and would go into planning as means of
overcoming the main challenges facing a facility.
6.1.2 Key challenges to data use
Data use was faced with quite a number of obstacles. Table 5gives a summary of the obstacles
and the adopted framework intervention they fit in. Each intervention has a few measures
under them proposed by the framework as means of improving data use. Financial constraints
and infrastructural challenges cuts across all interventions as they are the 2 core challenges
that affect all the other challenges. The challenges with regards to the interventions and the
measures are discussed further in chapter 6.2.
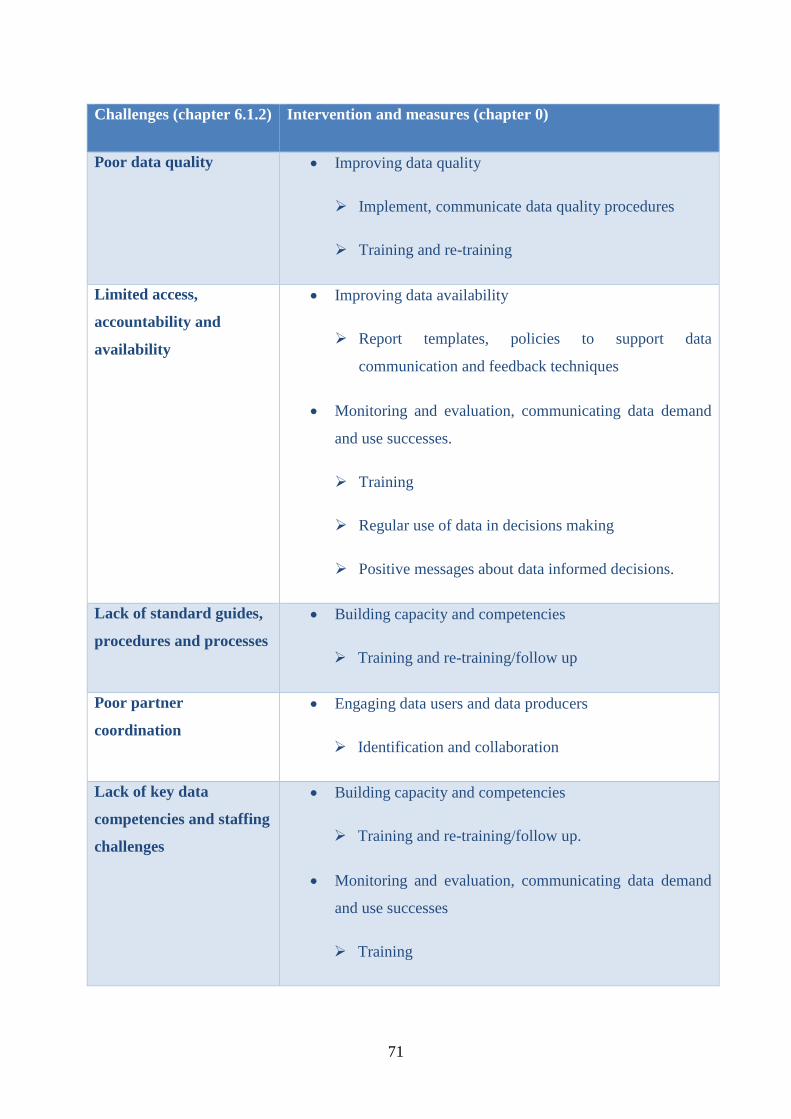
71
Challenges (chapter 6.1.2) Intervention and measures (chapter 0)
Poor data quality Improving data quality
Implement, communicate data quality procedures
Training and re-training
Limited access,
accountability and
availability
Improving data availability
Report templates, policies to support data
communication and feedback techniques
Monitoring and evaluation, communicating data demand
and use successes.
Training
Regular use of data in decisions making
Positive messages about data informed decisions.
Lack of standard guides,
procedures and processes
Building capacity and competencies
Training and re-training/follow up
Poor partner
coordination
Engaging data users and data producers
Identification and collaboration
Lack of key data
competencies and staffing
challenges
Building capacity and competencies
Training and re-training/follow up.
Monitoring and evaluation, communicating data demand
and use successes
Training

72
Regular use of data in decisions making
Positive messages about data informed decisions.
Financial constraints Cuts across all the interventions
Infrastructural challenges Cuts across all the interventions
Table 5; Challenges, interventions and their measures
Poor data quality
Data entry and data reporting errors contributed to the overall poor quality of data. Rufunsa
was considered a best performing district, so it´s data quality and reporting timeliness were
considered okay for DIM discussion. “…and then additionally all the data quality is bad. So
those numbers probably don’t even make much sense because they’re not really cleaned,”
shared an informant on data quality. Some districts were noted to have data of bad/poor
quality. Rural districts being the most affected. Poor data quality meant that people could not
trust the data and thus they could not use data to make decision.
Limited data access, availability, and accountability.
People don´t have access. And when they do have district data reviews, it´s usually the first
time people are actually seeing the data; a lot of times – partner representative
Facility level staff rely on district staff for access to processed data. The facility level
therefore generally lacks a way of viewing the reported data. They rely on the DHIO to fill
and pull the data from DHIS2. This means if the DHIO is not available or not highly
motivated and engaged, they won’t get access to the data. Facilities can thus not see their data
(inform of charts, graphs etc), track their performance and make programmatic decision.
“So, I asked him like, ´How often do you have people asking people their data? ´ What he
said was, “Depending on how often they have got meetings that they have to present right.” –
national level representative
73
In addition, to limited access, there is low demand for data by health program officials
accompanied by less accountability by staff. There is lack of ownership, and most staff don´t
take responsibility and ownership for their data. In addition, only four facilities (out of 21)
had QI projects. QI projects imply data use. This suggests that there is less demand and use of
data for/in decision making.
Lack of standard guides, procedures and processes
MOH has not provided a standard guideline for DIMs and data use. Moreover, there is no
measure for a successful DIM; alluding to the fact that they are just carried out as a formality.
Standardized processes such as agenda, guidelines, purpose of DIM that can be used to align
outcomes and utilization of data are lacking. QI projects may be an exception to this with
presence of procedures and QI committees at the facility level.
Lack of key data competencies and staffing challenges
“Well, I think data analysis is being ignored. Especially most of us we don’t take data
seriously even when we are using.” – facility staff
Staff, especially facility level, lack the skills and competency to analyze, review data and
make programmatic decisions. They even lack good presentation skills and most could be
seen shying away from the audience during their presentation. If they can´t fully analyze data
then they are not fully able to make programmatic decisions based on this data.
Poor partner coordination
MOH has a number of CPs. However, there is poor collaboration among CPs. This has led to
a fragmented HMIS, and redundancy of activities. A fragmented system point to all the
information is in one location (for example DIM) to support decision-making. An example is
nutrition data which wasn´t on DHIS2. It was hence not discussed at the DIM. The data was
however available in one of the partner´s database.
Financial constraints
Districts receive funds from the national level. The district then assigns funds to the facility
levels. Facilities are supposed to use these funds to make decisions (e.g operational decisions)
such as on QI projects. Financial constraints have been experienced across various areas and

74
levels. Limited overall funding has affected when and how frequent DIM occurs, in addition
to affecting the implementation of various projects and interventions. For example, QI
projects have also been halted, discontinued or delayed due to the same.
Infrastructural constraints
Infrastructural constraints, along with financial constraints, are the two main challenges
cutting across along all the other challenges. Zambia is affected by infrastructural challenges
such as roads, cellular coverage and power/electricity, hardware and software for HMIS. The
main infrastructural challenges are thus hardware, power and cellular coverage. For instance,
Rufunsa wasn´t connected to power making it a challenge to provide hardware (or the choice
of hardware) for HMIS at facility levels; not to mention the frequent power blackouts. Most
health facilities don’t have computer/hardware for accessing the HMIS. Rural areas do not
have the best of cellular coverage. Use of cellular coverage to access the internet is common
in Zambia. Poor cellular coverage translates to challenges in accessing the online DHIS2 (live
data use).
6.2 Discussions I first discuss the findings and results based on the conceptual framework. In addition, I
address the prospects of live data visualization tools based on the conceptual framework and
the challenges identified. I also present a model for the potential synthesis of live data
visualization tools. Financial and infrastructural constraints are mainly implicit in my
discussion in this chapter; they are discussed in a few cases.
6.2.1 Engaging data users and data producers
Linking up the work of data users and data producers, strengthens the information cycle.
Their collaboration makes them aware about data processes, data collection, and data sources
available. They thus have a chance of overcoming data use challenges and improve the
sharing of resources (Nutley, 2012).
Zambia has poor partner collaboration. There is some form of collaboration between the
MOH and its CPs. MOH has been able to bring in different partners to help with several areas
in the health system such as health programs and HMIS strengthening. However, there is still
a gap in the overall cooperation among the partners, and the partners with the MOH. There
75
are parallel databases that were not linked to DHIS2 (MOH´s main HMIS). Different partners
also carried out training on their systems and programs without collaborating with the MOH.
“Always we’re saying it’s a community with their mothers but their mothers are not here. Or
the community people are not here to defend from their side.” – partner representative
MOH has made efforts to bring the health services to the community through the use of
CHWs and CHAs. Despite that, little can be said about the community´s involvement in the
data use and decision-making processes. For example, there was no community representative
(or any form of a traditional leader) in DIM. Involving the community; a data producer in this
context should be fruitful. For example, the involvement of the traditional leaders in the
CLTS project by Akros, and a study by (Kossi et al., 2012) where the community is taking
part to improve their health status (in a sense creating accountability).
Financial constraints affected the overall collaboration between data users and data producers
in this context. Lack of funds affected the frequency of DIMs and the implementation of
identified intervention and plans. Infrastructural challenges such as frequent power blackout,
cellular coverage affected access and utilization of DHIS2/HMIS.
6.2.2 Improving data quality
Data informed decisions making are crippled by poor data quality (Foreit et al., 2006; Braa et
al., 2012). In addition to training and re-training on data quality techniques/approaches, there
is a need to develop, implement and communicate data quality procedures (Nutley, 2012).
Data informed decision will not occur without quality data; program efficiency and
effectiveness will then suffer (Mavimbe et al., 2005).
Zambia is affected by poor data quality. Although this may not be the case across all the
districts; some districts have data of better quality. Despite this, there is still a need to improve
the quality of data for data informed decision-making purposes.
“… the issues of population based numbers versus head count numbers at the facilities you
find the people saying we’re not being done justice maybe a figure by CSO is big or too small
as compared as to actually what is going on in the ground and things like that.” – national
level representative
76
Some of the causes of data of poor quality include population data, data entry errors, and lack
of regular data review. After the creation of new districts, the exact population a facility or
some district are serving is unknown. There are cases where facility staff feel that the
population data figure in DHIS2 is not a true representation of the situation on the ground.
Indicator calculation is highly dependent on population data. Therefore, use of “incorrect”
population figures can result in a misinterpretation of the current state.
“Day 2: disagreement of data; facility and DHIO have different data.” – Observation notes
from the DIM
Data entry errors are experienced. There were several instances where the data that the facility
has and the DHIO had was different. One of the reasons for the errors is data entry errors;
since data entry occurred at the district level, and not at facility where the data was collected.
Additionally, some facilities were also surprised by their data during DIM presentations;
hinting to the lack of prior and regular review/check of their data. District staff having
received training on data management, often emphasized and pushed for data of better if not
best quality from the facilities; during the DIM. Most of the facility staff hadn’t undergone
any kind of training on data management. This may have contributed to the poor data quality
experienced.
6.2.3 Improving data availability
Data demand is crippled by poor data quality (Foreit et al., 2006; Braa et al., 2012). Well-
designed information systems often comprise of information technology infrastructure, report
templates and policies to support the communication of analyzed data through dissemination
and feedback techniques. Data users’ ability to access and share data easily is always under-
developed in these systems (Harrison and Nutley, 2010). There is hence the need to improve
data availability in terms of synthesis, communication, access to support the use of the
information in decision making (Aqil et al., 2009).
There is limited access to data, especially at the facility level. Most facility staff cannot access
data from DHIS2. Those that use DHIS2, only use it for data entry purposes. The district
officials have access to DHIS2 and the data. Data entry into DHIS2, data processing and
analysis happens at the district level. After which processed data is meant to be disseminated
to the facilities.
77
“…you find that even in the actual facilities right, even just the presence of basic charts or
visualizations right, you find those are not there or if there are there they’re pretty much
outdated it’s now just like a painting on the wall” – national level representative
Templates, charts and graphs used to communicate processed data are lacking from the
facilities. Scorecard, that is meant to communicate the district’s performance, is manually (out
of DHIS2) done on excel by the DHIO; along with the dependency on the DHIO for
providing the analyzed data. An unengaged DHIO or unavailability, due to let’s say illness,
may mean a breakdown in process. DHIS2 being the main source of processed data,
infrastructural challenges such as power and lack of hardware to access DHIS2, have affected
the overall access to data.
6.2.4 Building capacity and competencies
Data users often struggle competencies such as skills in data analysis, presentation,
interpretation, synthesis and the creation of data-informed programmatic recommendations
(Nutley, 2012). They therefore need training on analysis, critical review and data
interpretation hence understanding the data they possess, what data they will need and when,
so that they can demand it (ibid.). Limited follow up after training make the skills not to fully
develop, and thus not well equipped to apply the new skills in the work setting (Clotteau et
al., 2011) (Srinivasan, 1989) states that enabling people to work effectively, motivating them
and sharpening their skills is the key to success.
“…when you trained someone for five days maybe in ART management, you assume that
they’ve got competences to manage someone or maybe to manage an ART client. But then the
gaps keep on being noticed in terms of how some of those people are doing.” – District
official
There is a need for strong follow up and re-training programs for the staff. Facility staff lack
training and skills on data analysis, presentation, interpretation and synthesis. Most of the
facility presenters were shy. Training was given to the district staff such as the DHIO.
Supervision and mentorship programs are in the process of being rolled out or were recently
rolled out. Training facility staff on QI projects was recently carried out. A few facility staff
were being chosen to receive this training.

78
Work overload and work overlap was common. Work overload suggests understaffing which
is argued for by the facility staff. It may impede the decisions making process; a health staff
wouldn’t be away from the facilities for a long time (for examples trainings or district
functions) as this would affect service delivery at facility.
6.2.5 Straightening organizations data demand and use infrastructure
The organizational setting; it´s procedures, rules, processes, systems, and values that govern
it. Processes have the ability of supporting or obstruct individuals’ capacity in data making
decisions. Clear guidelines for data quality and use of data will strengthen other interventions
for data informed decisions. The use of a structured process helps decision makers make
priority decisions, increase the demand for, the availability and quality of data
(Wickremasinghe et al., 2016).
National standards/guidelines/templates on how to conduct DIMs were lacking in the
Zambian context. Additionally, the measure of a successful DIM is lacking as well. Implying
that the DIM maybe considered as a formality; not necessarily for the impact it has on data
informed decisions. Different definition of the purposes of DIMs can be alluded to the lack of
a national standard that aligns data use and decision-making processes; among other reasons
such as training.
“There are no stipulated standards to say… Usually the province stipulates how our template
is going to be. Almost all the time, we make our templates from the templates for the
province.” – district official
There exists some form of guidelines/templates from the province. These templates vary from
province to province, and district to district. The templates received are PowerPoint
presentation that are adjusted and populated based on district and province. I never got to see
any guidelines, policies and operating procedures on the use of these templates. Guidelines
such as standard dashboards, scorecards for the different levels are missing or in the process
of being created.
“Yeah, so we spend a lot of time reading figures and not enough time of the analysis
interpretation and action based on that analysis and interpretation.” – partner representative
79
The current agenda and format of the DIM was criticized by most of the partner representative
for its lack of emphasis on data discussion. The agenda, discussed in chapter 5.2, was mostly
made of facility presentation - the first day. Little time was spent discussing the data,
scorecard and action points.
6.2.6 Monitoring and evaluation, communicating data demand and use successes
Decision makers and stakeholders will use data if they put value in it (Lavis et al., 2006).
Positive messages about data informed decisions making and training are among the ways of
building value. Additionally, Regular use of data for decision making increases the demand
for data (Foreit et al., 2006).
“I hope to be seen, to see it in the future is accountability of data, which is less practiced
right now. Somebody is not responsibility for that data.” – partner representative
Most of the facility staff, having not undergone training on data use and analysis, placed no
value in data. Some of the district officials that have undergone training seemed to put value
in the data, and often made emphasis on the value, and importance of data in decision making
and overall improvement in health service delivery. During facility presentation, there were
cases where the facility staff couldn´t really explain the data they were presenting. As
mentioned in chapter 6.1.2, lack of data accountability may suggest the same.
Some provinces have some form of reward system for the best performance in the province,
in a bid to boost data use at the facility level. There were no rewards/prizes presented during
the DIM I attended. Although, I can argue that good performance may be geared towards
receiving a price rather than placing value in the data. In the (Akros Inc., 2016), Rufunsa
district was mentioned and recognized for its effort on good health practices - Rufunsa´s
DHIO had created a Whatsapp group as a channel for communication in the district.
6.2.7 Live data visualization tools
In this sub-section, I discuss the impact visualization tools may have on data use based on the
challenges identified and the conceptual framework interventions. Figure 23 shows the model
for synthesizing the potential for live data visualization tools based on the framework and the
challenges identified in the Zambian context.
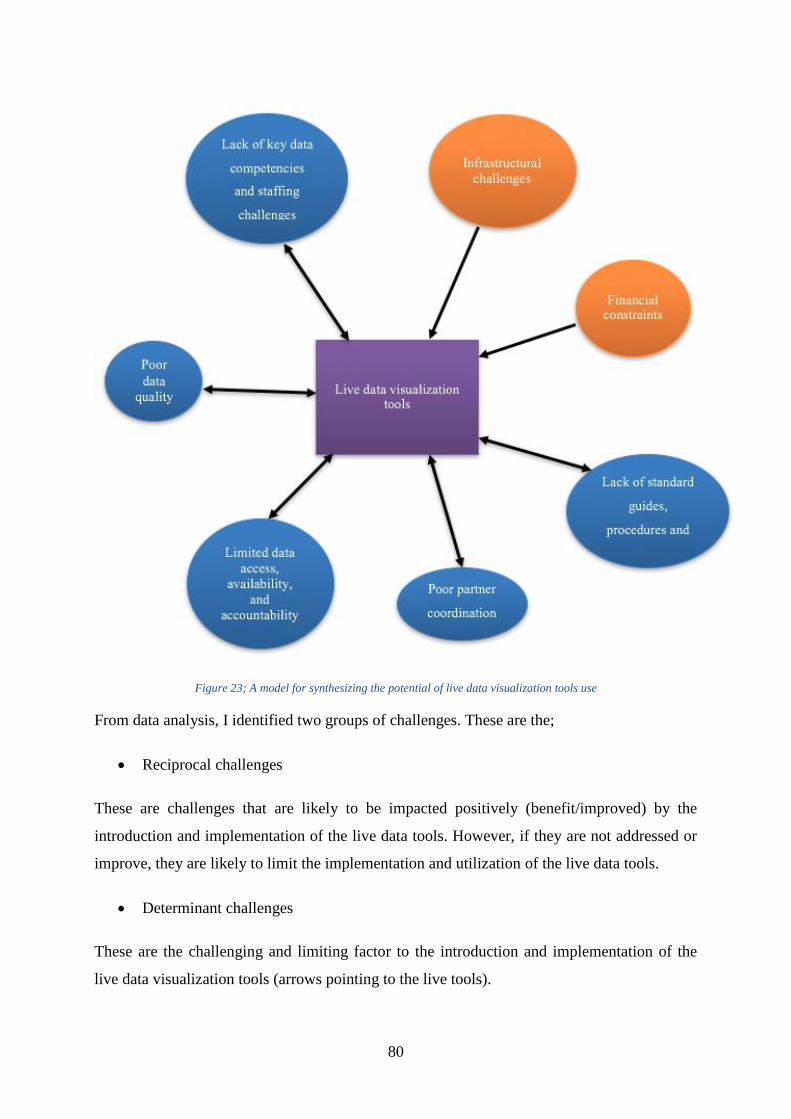
80
Figure 23; A model for synthesizing the potential of live data visualization tools use
From data analysis, I identified two groups of challenges. These are the;
Reciprocal challenges
These are challenges that are likely to be impacted positively (benefit/improved) by the
introduction and implementation of the live data tools. However, if they are not addressed or
improve, they are likely to limit the implementation and utilization of the live data tools.
Determinant challenges
These are the challenging and limiting factor to the introduction and implementation of the
live data visualization tools (arrows pointing to the live tools).
81
Reciprocal challenges
“…going live are that we are going to have real time data in real time and it will be less
tedious in terms of preparing for DIMs. It will be easier to prepare for DIMs. Then every time
with a live database, the facility will have the dashboard where they can actually see how
their performance is on a monthly basis or on a regular basis.” – district official
Introduction and utilization of live data visualization tools will likely improve data
availability and access. It will provide some kind of platform for data presentation, analysis
and access such as dashboards, graphs etc. Making it easier for the staff to process, synthesis,
analyze and communicate data. Preparing for DIMs and the DIM is itself will benefit from
live data access. For instance, data errors experienced in DIMs, can be resolved by accessing
the live system; find the reasons for the error instead of deferring them to another time as the
norm is.
“… not just improving access but making standard analytics like the dashboard, scorecard…
and pushing those out. Making them accessible to DHIO, PHIO…”
To add on to that, these tools are likely to improve and add to the use of standard
procedures/procedures and standardization, by making it easier to have and introduce standard
data analytics such as the scorecards, dashboards etc. I believe a streamlined use of such tools
is necessary to leverage them. Nevertheless, lack or limited of access and data availability
may limit the use of such tools. If access to data is only limited to a few staff (e.g only DHIO)
then the large health population would not be able to utilize them. Enough and efficient
platforms and channels to access data and increase availability may need to be implemented
along with the live data tools.
Lack of standard procedures and measures will affect the use of these tools. Different tools
maybe used differently. For example, for various purposes and projects, irregular use or
varying frequency etc. Lack of standard processes/procedures may thus lead to a not
“streamlined” use of these tools – attributed to varying DIMs – and thus not getting the best
out of them.
“Like I said I gave an example of Zanzibar during their presentations. They’re analyzing
their data straight from DHIS2 I think that would cut down a lot of time and you can focus a
little more on the action planning” – partner representative
82
An example of where such tools have been really helpful is Zanzibar (Braa et al., 2012);
where they were utilized for data use workshop. An example from the Zambian context is day
2 of the DIM; where the agenda was tweaked to allow more time to discuss the district
scorecard. During these sessions, data lead discussions occurred which all the parties
explaining themselves – poor or best performance. It gave an opportunity for worst
performance to ask for help from best performance and the participants at large. Such
discussions will lead to data informed decision making.
“I have heard about it and to me I feel that’s the way you have to go about it… I feel this is
long overdue, and if let’s say propagated to all the institutions then it will be able to result in
a very good outcome.” – facility staff
Zambia is also blessed with motivated staff who are willing to learn and use these live
visualization tools. All the informants welcomed the idea of introducing such tools, in
addition to being optimistic that they would impact data use and decision making positively.
Their data analysis, information use competencies are also likely to improve by using such
live data tools; again, an example is Zanzibar (ibid.). Despite this, the staff lack of
competency skills and experience with such live visualization data tools systems. This may
thus be an obstacle to the introduction of these tools. It will require a strong training and re-
training program to make such possible. Their introduction will imply putting a sustainable
plan in place, which may take some time.
Training of personnel can be used as a means of additional training on data quality procedures
and techniques. With improved data access, and some structured processes on the use these of
tools in place, data quality is likely to improve. Bring down data entry to the, facility level
instead of the district level, might eliminate some of the data entry errors experienced.
Nonetheless, poor data quality or the continued availability of data of poor data quality will
limit the utilization of these tools. As earlier mentioned (chapter 6.2.2) data, use occurrence
requires data of good quality; even data discussion and DIMs.
With the use of live data visualization tools, collaboration between data producers and data
users is likely to improve. This maybe a result of improved data access, present of standard
analytics, processes and procedures. Specific areas such as pooled funding from CP could be
useful as improved data review/analysis could benefit most, if not all, specific programs.
Furthermore, program specific standard analytics, such as dashboards and data analysis
83
templates, could be developed through collaborations with CPs. It will be therefore easier to
collaborate, share and use data among partners. On the other hand, continued poor partner
coordination will limit the use of data visualization tools; especially if they are initiated by
MOH.
Determinant challenges
“We might also have maybe like let’s say Rufunsa is not yet connected to power. Even to keep
the machines charged might be a challenge.” – district official
These are infrastructural and financial challenges. Hardware, power and internet access
challenges will also limit the use an introduction. Implementation and utilization of live data
tools requires a steady amount of infrastructure to fully utilize them. An efficient and reliable
way of accessing the internet will need to be identified and implemented. Solar power has
been used where there is no electricity or to supplement it, at least in Rufunsa district. With
financial constraints already being experienced, live visualization tools introduction presents
even more expenses and costs; training costs, hardware costs, internet use costs etc. Financial
constraints will thus limit the introduction and implementation of these tools.
6.3 Summary In this chapter, I first look at the results of data analysis, which included the uses of data and
the key challenges affecting data use. Data discussion based on the conceptual framework
then followed. Discussion of the prospects of utilization of live data visualization tools is last
to be discussed – based on the chosen framework and challenges identified. It also brings out
some of the relationship between research question one and research question two. Figure 23
shows this relationship in the form of a model.
The model can be used to synthesize the potential of live visualization tools. The model
identifies two group of challenges: determinant and reciprocal challenges. Determinant
challenges limit the introduction of live data tools. These are financial and infrastructural
challenges. Reciprocal challenges on the other hand, affect and are affected by the various
challenges identified. These include poor data quality, lack of key data competencies by staff,
limited data availability, access and accountability, poor partner coordination and lack of
standardization/standard processes/procedures.

84
Data analysis revealed that data was used for two key reasons: performance review; and
planning and resource utilization. The main challenges to data use were financial constraints,
infrastructure constraints, and skills and capacity of the personnel. The implementation of live
data visualizations tools was likely to impact both positively i.e. strengthen and improve them
than the current situation. However, while the study findings suggest that live data tools could
potentially improve data use through improving data access, availability and quality, such
measures would also be challenged by general financial and infrastructural constraints. For
instance, visualization would improve data use through improving data access, availability
and quality.
85
7 CONCLUSION AND FURTHER RESEARCH
7.1 Summary of the research process The study carried out in this thesis (an exploratory study) is with the objective of finding out
how and for what purposes data is used, the key challenges to data use and the prospects of
using live visualization tools to strengthen DIMs and data use. The research context for this
study was Zambia. It´s a qualitative research with case study as the chosen research method.
Several data collection methods were used for data collection. The study was motivated by
the lack of existing literature that problematize and critically assess the potentials of live data
visualization tools to improve data use in public health decision making in low resource
context. Literature such as (Braa et al., 2012) only highlight best practices of these tools,
while (Moyo et al., 2014) addresses data review and not utilization of live data visualization
tools.
To analyze the collected data, I adopted a conceptual framework by (Nutley, 2012). Empirical
data revealed various challenges to data use such as financial constraints, infrastructural
challenges, poor data quality etc. The prospect of introducing live data visualization tools also
revealed that they were likely to impact data use positively even though they were challenged
by finance and infrastructure constraints, in addition to personnel capability on such tools.
7.2 Reflections and conclusion The findings of this study can be used to inform decision making in Zambia as a whole. As
this study mainly looks at one district in Zambia, it can be used to inform decision in other
Zambian districts and Zambia as a country. With Zambia looking to improve its data use,
some of the challenges to data use are addressed in this thesis can be used to supplement other
studies and assessments on the same. It hence can be used to support improvements in the
DIMs and data use contexts.
More broadly, the study looks at peer-reviews and data use in a low-resource setting. Best
practices and challenges have been highlighted in this thesis. The findings can then be used as
a learning tool for other areas, countries and regions in a low-cost resource setting. As
mentioned in chapter 2 a lot has been written about decision making in low- cost resource
86
settings. This thesis can thus be considered under the same category; it highlights the
challenges to data use and decision making.
The determinant challenges may be used as a readiness assessment tool. This initial
assessment can be used to find out whether they limit the introduction of live data
visualization tools. Afterwards, the reciprocal challenges may be mapped out and the
relationships identified i.e whether they`re limiting or not. Weighting/ rating/ranking of the
reciprocal challenges can also be done. Then focusing on the weaker areas (of the reciprocal
challenges) may follow these steps.
There has been a trend to go live; utilize data warehouse approach and DHIS2 tools such as
dashboards and scorecards (Braa and Sahay, 2012). While (Braa et al., 2012) documents the
best case and how use of live data visualization tools improved various aspects/areas in the
data use workshop and personnel, this study goes a step further. It brings out the challenges
and relationships of various data use, decision making, and data-use workshop elements. For
instance, it shows the relationship between data quality and use of live visualization tools
besides bringing out challenges to data use. It therefore can be used to inform the
implementation and introduction of live data visualization tools in low-resource settings.
Zambia is currently in the process of introducing DHIS2 at the facility level (Parramore,
2017). The findings from this thesis can thus be used to support the introduction and
implementation of such data collection and analysis tools at district and sub-district levels.
7.3 Further Research I consider what I have found as not “the truth”, but “a truth”. With more research, more
aspects and versions of “the truth” will be revealed. Further research should go deeper into the
facility and district levels data use. It would be interesting to explore the impact the
introduction of the live data visualization tools will have on decision making and data use.
Zambia has the ambition to implement DHS2 at facility level, some of the challenges I have
identified are even more severe at this level, and thus a study at this level would be
interesting.
In addition, utilization of live data visualization tools, in other low-resource settings needs
further research. This can be used to shed light on their implementation, challenges and best
practices; especially issues with sustainability. An example would be studies based on live

87
data visualization tools, such as dashboards and scorecards; their implementation at facility,
district level, and how they impact data use.
With Zambia implementing reforms – decentralization being one of the reforms - exploring
how this reforms influence and impact data use and decision-making, is another area that
needs further research. Moreover, use of technology to enhance data-use workshop and
decision making at the district level needs further study.

88
REFERENCES Abajebel, S., C. Jira, et al. (2011). "Utilization of health information system at district level in
Jimma zone Oromia regional state, South West Ethiopia." Ethiopian journal of health
sciences 21(3).
AbouZahr, C. and T. Boerma (2005). "Health information systems: the foundations of public
health." Bull World Health Organ 83(8): 578-583.
Akros Inc. (2017a). "About US." Retrieved 12,09, 2017, from http://akros.com/about-us/.
Akros Inc. (2017b). "Akros." Retrieved 12,09, 2017, from http://akros.com/.
Akros Inc. (2017c). Akros. A. Inc.
Akros Inc. (2017d). "COMMUNITY SURVEILLANCE." Retrieved 12,10, 2017, from
http://akros.com/malaria-prevention/community-surveillance/.
Akros Inc., M. Z. (2016). HMIS Assessment 2016.
Alavi, M. and P. Carlson (1992). "A review of MIS research and disciplinary development."
Journal of Management Information Systems 8(4): 45-62.
ALMA (2017). "ALMA Scorecard for Accountability and Action." Retrieved 18/10, 2017,
from http://alma2030.org/scorecards-and-reports/map.
Aqil, A., T. Lippeveld, et al. (2009). "PRISM framework: a paradigm shift for designing,
strengthening and evaluating routine health information systems." Health Policy and
Planning 24(3): 217-228.
Baskerville, R. L. (1999). "Investigating information systems with action research."
Communications of the AIS 2(3es): 4.
Benbasat, I., D. K. Goldstein, et al. (1987). "The case research strategy in studies of
information systems." Mis Quarterly: 369-386.
Berg, M. (2001). "Implementing information systems in health care organizations: myths and
challenges." International journal of medical informatics 64(2): 143-156.
Blanchard, J. F. and S. O. Aral (2010). Program Science: an initiative to improve the
planning, implementation and evaluation of HIV/sexually transmitted infection
prevention programmes: The Medical Society for the Study of Venereal Disease.
Bonoma, T. V. (1985). "Case research in marketing: opportunities, problems, and a process."
Journal of marketing research: 199-208.
Braa, J., A. Heywood, et al. (2012). "Improving quality and use of data through data-use
workshops: Zanzibar, United Republic of Tanzania." Bulletin of the World Health
Organization 90(5): 379-384.
Braa, J., E. Monteiro, et al. (2004). "Networks of action: sustainable health information
systems across developing countries." Mis Quarterly: 337-362.
Braa, J. and S. Sahay (2012). Integrated health information architecture : power to the users :
design development and use. New Dehli, Matrix Publ.
Central Intelligence Agency (2017). "The World Factbook 2017." Retrieved 24-10, 2017,
from https://www.cia.gov/library/publications/the-world-factbook/geos/za.html.
Central Statistical Office (2017). "Zambia Portal Central Statistical Office - Data Catalog."
Retrieved 24-10, 2017, from
http://zambia.opendataforafrica.org/data#source=Central+Statistical+Office+of+Zamb
ia.
Charles Lufumpa, Nirina Letsara, et al. (2016). The Africa Infrastructure Development Index
(AIDI) 2016. www.afdb.org.
Chitama, D., R. Baltussen, et al. (2011). "From papers to practices: district level priority
setting processes and criteria for family planning, maternal, newborn and child health
interventions in Tanzania." BMC women's health 11(1): 46.

89
Clotteau, G., M.-H. Boily, et al. (2011). "Building Capacities for Results-Based National
M&E Systems." Influencing Change: 171-194.
Davies, P., N. Hodge, et al. (2011). "Conceptualising the information needs of senior decision
makers in health." Health Inform Syst Knowl Hub 18: 1-20.
De Savigny, D. (2008). Fixing health systems, IDRC.
Denzin, N. K. and Y. S. Lincoln (1994). Handbook of qualitative research. Thousand Oaks,
Calif, Sage.
DHIS2. "Zambia WASH: Mobile surveillance using DHIS2." Retrieved 12,09, 2017, from
https://docs.dhis2.org/master/en/user-stories/html/user_story_akros.html.
DHIS2 (2017a). "Creating Scorecards using the Pivot Table app." Retrieved 18,10, 2017a,
from https://www.dhis2.org/creating-scorecards-using-pivot-table-app.
DHIS2 (2017b). "Data management and analytics." Retrieved 20,10, from
https://www.dhis2.org/data-management
DHIS2 (2017c). "DHIS 2 In Action." Retrieved 12,09, from https://www.dhis2.org/inaction.
DHIS2 (2017d). "Downloads." Retrieved 12,09, from https://www.dhis2.org/downloads.
DHIS2 (2017e). "Technology Platform." Retrieved 12,09, from
https://www.dhis2.org/technology.
DiCicco‐Bloom, B. and B. F. Crabtree (2006). "The qualitative research interview." Medical
education 40(4): 314-321.
Edward, A., B. Kumar, et al. (2011). "Configuring balanced scorecards for measuring health
system performance: evidence from 5 years' evaluation in Afghanistan." PLoS
medicine 8(7): e1001066.
Feldman, M. S. and J. G. March (1981). "Information in organizations as signal and symbol."
Administrative science quarterly: 171-186.
Foreit, K., S. Moreland, et al. (2006). "Data demand and information use in the health sector:
conceptual framework." Chapel Hill, NC: MEASURE Evaluation, Carolina Population
Center: 1-17.
Garrib, A., K. Herbst, et al. (2008). "An evaluation of the district health information system in
rural South Africa." SAMJ: South African Medical Journal 98(7): 549-552.
Goodwin, D. (2006). "Ethical issues." Qualitative Research in Health Care, Third Edition: 53-
62.
Google (2017). Google maps Zambia: Google.
Grol, R. (1994). "Quality improvement by peer review in primary care: a practical guide."
Quality in Health Care 3(3): 147.
Grønmo, S. (1996). Forholdet mellom kvalitative og kvantitative tilnærminger i
samfunnsforskningen. Oslo, Universitetsforl., 1996.
Harrison, T. and T. Nutley (2010). "A review of constraints to using data for decision making.
Recommendations to inform the design of interventions."
Heywood, A. and J. Rohde (2002). "Using information for action: a manual for health
workers at facility level." South Africa: EQUITY Project.
HISP UiO (2017a). "Health Information Systems Programme (HISP)." Retrieved 13,09, 2017,
from http://www.mn.uio.no/ifi/english/research/networks/hisp/.
HISP UiO (2017b). "HISP Groups." Retrieved 13,09, 2017, from
http://www.mn.uio.no/ifi/english/research/networks/hisp/hisp-groups.html.
Kaplan, B. and J. Maxwell (1994). "Evaluating health care information systems: Methods and
applications." Qualitative Research Methods for Evaluating Computer Information
Systems. JG Anderson, CE Ayden and SJ Jay. Thousand Oaks, Sage.
Kaplan, B. and J. Maxwell (2005). "Qualitative research methods for evaluating computer
information systems." Evaluating the organizational impact of healthcare information
systems: 30-55.
90
Kaplan, R. S. and D. P. Norton (1996). The balanced scorecard: translating strategy into
action, Harvard Business Press.
Klein, H. K. and M. D. Myers (1999). "A set of principles for conducting and evaluating
interpretive field studies in information systems." Mis Quarterly: 67-93.
Koon, A., D. Nambiar, et al. (2012). "Embedding of research into decision-making
processes." Geneva: Alliance for Health Policy and Systems Research, WHO.
Kossi, E. K., J. I. Sæbø, et al. (2012). "Developing decentralised health information systems
in developing countries–cases from Sierra Leone and Kenya." The Journal of
Community Informatics 9(2).
Kvale, S. and S. Brinkmann (2009). Interviews : learning the craft of qualitative research
interviewing. Los Angeles, Calif, Sage.
La Vincente, S., B. Aldaba, et al. (2013). "Supporting local planning and budgeting for
maternal, neonatal and child health in the Philippines." Health research policy and
systems 11(1): 3.
Lavis, J. N., J. Lomas, et al. (2006). "Assessing country-level efforts to link research to
action." Bulletin of the World Health Organization 84(8): 620-628.
Lomas, J. (1997). Improving research dissemination and uptake in the health sector: beyond
the sound of one hand clapping, Centre for health economics and policy analysis
Hamilton.
Lomas, J. (2007). "The in-between world of knowledge brokering." Bmj 334(7585): 129-132.
Malterud, K. (2001). "Qualitative research: standards, challenges, and guidelines." The lancet
358(9280): 483-488.
Malterud, K. (2003). Kvalitative metoder i medisinsk forskning : en innføring. Oslo,
Universitetsforl.
Maluka, S., P. Kamuzora, et al. (2010). "Decentralized health care priority-setting in
Tanzania: evaluating against the accountability for reasonableness framework." Social
science & medicine 71(4): 751-759.
Maluka, S., P. Kamuzora, et al. (2011). "Implementing accountability for reasonableness
framework at district level in Tanzania: a realist evaluation." Implementation Science
6(1): 11.
Mavimbe, J. C., J. Braa, et al. (2005). "Assessing immunization data quality from routine
reports in Mozambique." BMC Public Health 5(1): 108.
McCracken, G. (1988). The long interview, Sage.
Ministry of Chiefs and Traditional Affairs, Z. (2016). "House of Chiefs." Retrieved 12,10,
2017, from http://www.mocta.gov.zm/index.php/house-of-chiefs.
Ministry of National Development Planning, Z. (2017). Seventh National Development Plan,
2017-2021 (7NDP): 4.
MoH (2017). "Zambia HMIS." Retrieved 19-09, 2017, from
https://www.zambiahmis.org/dhis-web-commons/security/login.action.
MOH Zambia (2017). Zambia National Health Strategic Plan 2017 – 2021
Moher, D., A. Liberati, et al. (2009). "Preferred reporting items for systematic reviews and
meta-analyses: the PRISMA statement." PLoS medicine 6(7): e1000097.
Moyo, C., T. Manda, et al. (2014). Peer based reviews as a strategy for strengthening the
health information systems: a case study from Malawi. Informatics in Africa
Conference HELINA’14.
Murthy, N. (1998). "Decentralized health planning: lessons from two districts in India."
Journal of health and population in developing countries 1(2): 1-10.
Nnaji, G., C. Oguoma, et al. (2010). "The challenges of budgeting in a newly introduced
district health system: a case study." Global Public Health 5(1): 87-101.

91
Nutley, T. (2012). "Improving data use in decision making. An intervention to strengthen
health systems."
Orlikowski, W. J. and J. J. Baroudi (1991). "Studying information technology in
organizations: Research approaches and assumptions." Information systems research
2(1): 1-28.
Pappaioanou, M., M. Malison, et al. (2003). "Strengthening capacity in developing countries
for evidence-based public health:: the data for decision-making project." Social
science & medicine 57(10): 1925-1937.
Parramore, A. (2017). Computer supported evidence-based decision-making at health
facilities in Zambia. Insitute of informatics. Reprosentralen, University of Oslo:
University of Oslo. Masters.
Patton, M. Q. (2002). Qualitative research & evaluation methods. Thousand Oaks, Calif, Sage
Publications.
Patton, M. Q. (2008). Utilization-focused evaluation, Sage publications.
Qazi, M. S. and M. Ali (2011). "Health Management Information System utilization in
Pakistan: challenges, pitfalls and the way forward." Bioscience trends 5(6): 245-254.
Rosinski, A. A., S. Narine, et al. (2013). "Developing a scorecard to assess global progress in
scaling up diarrhea control tools: a qualitative study of academic leaders and
implementers." PLoS One 8(7): e67320.
Rowley, J. (2012). "Conducting research interviews." Management Research Review 35(3/4):
260-271.
Schramm, W. (1971). "Notes on Case Studies of Instructional Media Projects."
SENYONI, W. and B. Jorn (2017). "Boundary Object in HIS: Designing and Implementation
of a Regional Scorecard."
Srinivasan, V. (1989). "Peer review among district health officers in Maharashtra, India."
International Journal of Gynecology & Obstetrics 30(1): 33-36.
Tolley, E. E., P. R. Ulin, et al. (2016). Qualitative methods in public health: a field guide for
applied research, John Wiley & Sons.
Unicef Zambia (2017). "The Millennium Development Goal Initiative (MDGi)
". Retrieved 12,09, 2017, from https://www.unicef.org/zambia/publications_16661.html.
Unicef Zambia, M. Z. (2015). Accelerating the reduction of Maternal, Neonatal and Child
Mortality. U. Zambia.
USAID Systems for Better Health (July 2016). Provincial Health Office and District Health
Office Capacity Assessment Report. Bethesda, MD: USAID Systems for Better
Health, Abt Associates Inc.
Walsham, G. (1993). Interpreting information systems in organizations, John Wiley & Sons,
Inc.
Walsham, G. (1995). "Interpretive case studies in IS research: nature and method." European
Journal of Information Systems 4(2): 74-81.
Walsham, G. (2006). "Doing interpretive research." European Journal of Information Systems
15(3): 320-330.
Walshe, K. and T. G. Rundall (2001). "Evidence‐based management: from theory to practice
in health care." The Milbank Quarterly 79(3): 429-457.
Wickremasinghe, D., I. E. Hashmi, et al. (2016). "District decision-making for health in low-
income settings: a systematic literature review." Health Policy and Planning
31(suppl_2): ii12-ii24.
Yin, R. K. (1994). Case study research : design and methods. Thousand Oaks, Calif, Sage.
Yin, R. K. (2009). Case study research : design and methods. Thousand Oaks, Calif, Sage.

92
APPPENDIX
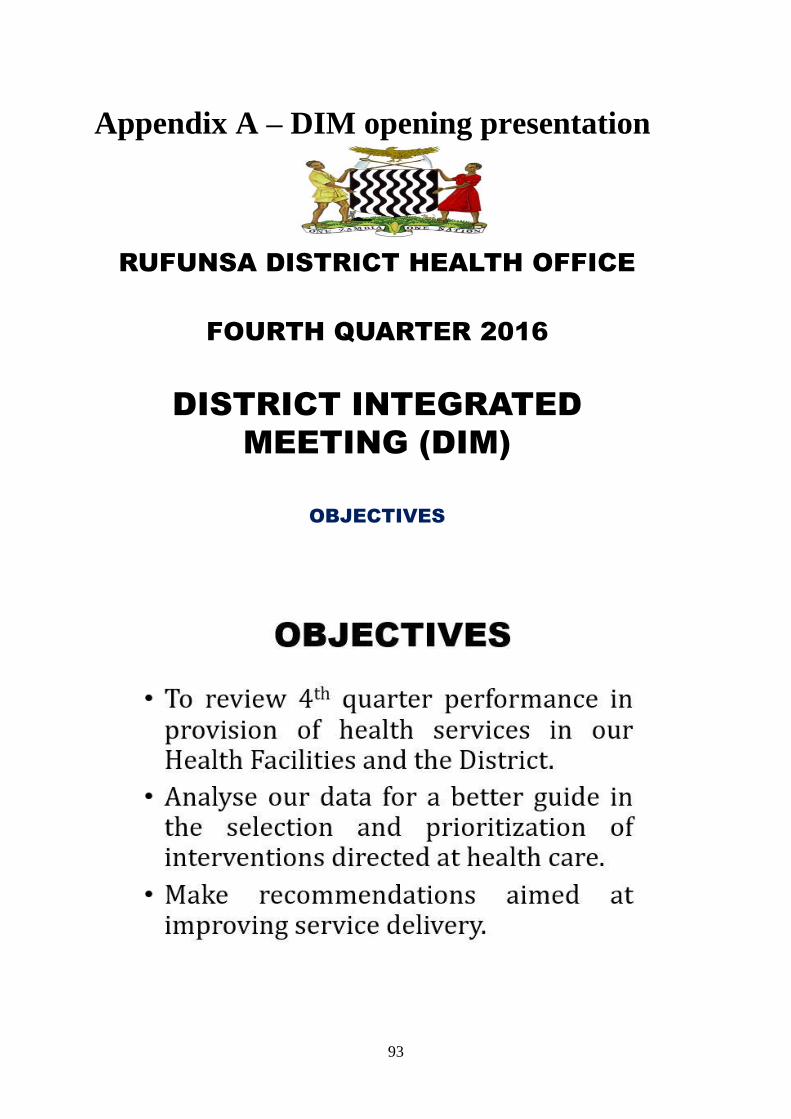
93
Appendix A – DIM opening presentation
RUFUNSA DISTRICT HEALTH OFFICE
FOURTH QUARTER 2016
DISTRICT INTEGRATED
MEETING (DIM)
OBJECTIVES
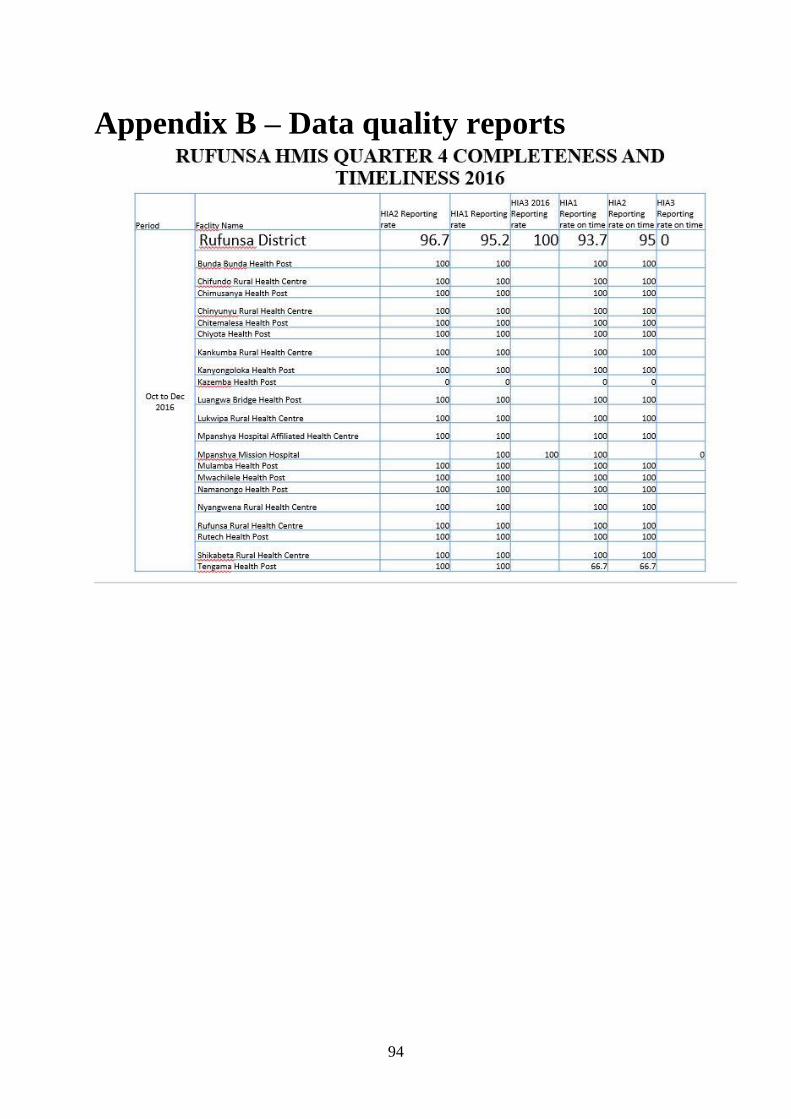
94
Appendix B – Data quality reports

95
96
Appendix C – Informed consent
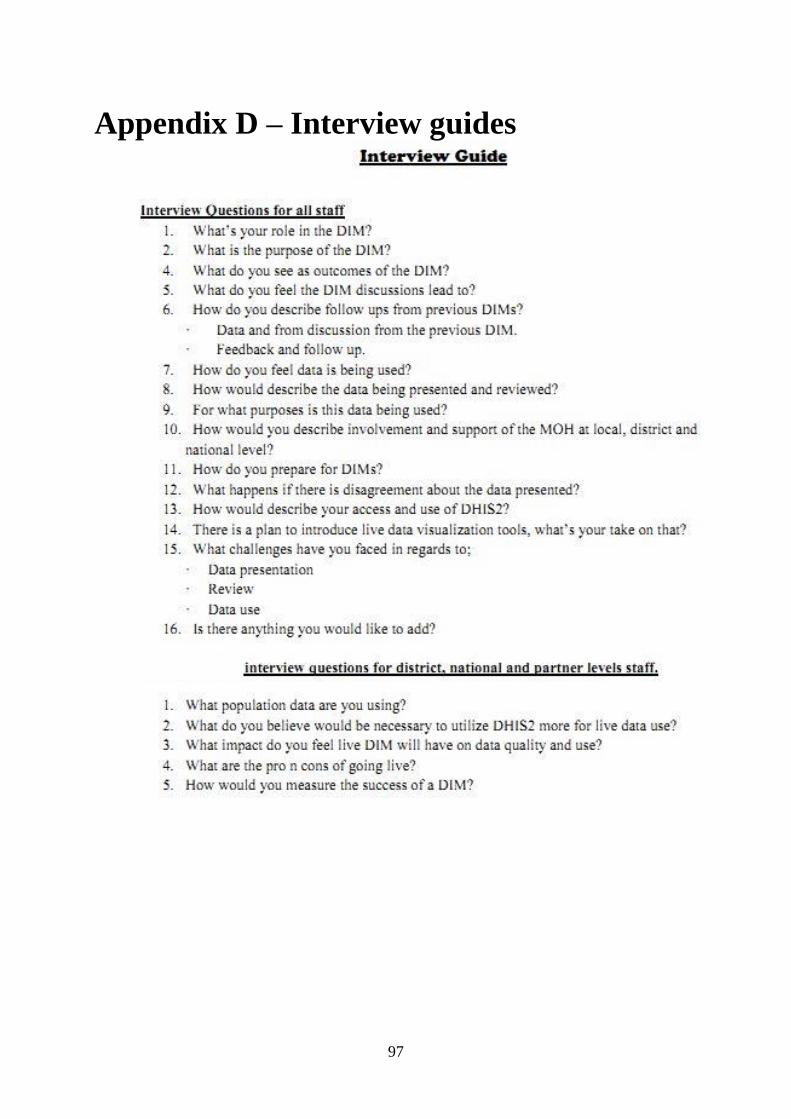
97
Appendix D – Interview guides
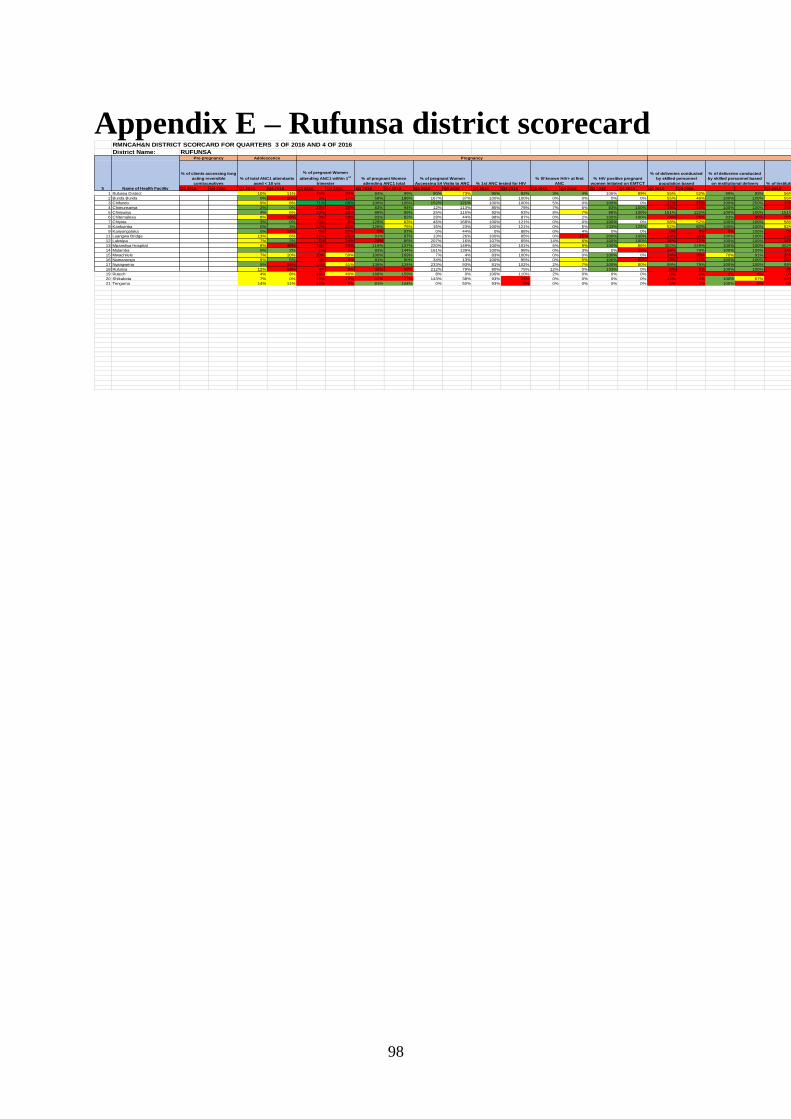
98
Appendix E – Rufunsa district scorecard RMNCAH&N DISTRICT SCORCARD FOR QUARTERS 3 OF 2016 AND 4 OF 2016
District Name: RUFUNSA
Q3 2016 Q4 2016 Q3 2016 Q4 2016 Q3 2016 Q4 2016 Q3 2016 Q4 2016 Q3 2016 Q4 2016 Q3 2016 Q4 2016 Q3 2016 Q4 2016 Q3 2016 Q4 2016 Q3 2016 Q4 2016 Q3 2016 Q4 2016 Q3 2016 Q4 2016 Q3 2016 Q4 2016 Q3 2016 Q4 2016 Q3 2016 Q4 2016 Q1 2016 Q2 2016 Q1 2016 Q2 2016 Q1 2016 Q2 2016 Q1 2016 Q2 2016 Q1 2016 Q2 2016 Q1 2016 Q2 2016
1 Rufunsa District 10% 11% 16% 24% 84% 99% 90% 73% 95% 92% 3% 4% 106% 89% 55% 52% 99% 93% 56% 55% 0.65% 0.22% 1.08% 1.09% 42% 40% 88% 90% 74% 93% 13% 4% 95% 96% 92% 94% 0.10% 0.24% 2.84% 3.50%
2 Bunda Bunda 0% 16% 3% 17% 58% 186% 167% 37% 100% 100% 0% 0% 0% 0% 55% 46% 100% 100% 55% 46% 0.00% 0.00% 0.00% 0.00% 30% 33% 100% 88% 45% 82% 24% 20% 100% 100% 100% 100% 0.19% 0.37% 0.37% 1.12%
3 Chifundo 9% 8% 71% 68% 106% 106% 152% 121% 100% 100% 5% 0% 100% 0% 17% 25% 100% 250% 17% 10% 0.00% 0.00% 0.00% 0.00% 37% 19% 100% 67% 87% 187% 28% -18% 100% 100% 100% 100% 0.97% 1.45% 5.76% 4.24%
4 Chimunsanya 2% 0% 28% 28% 83% 94% 12% 113% 85% 79% 7% 6% 83% 100% 19% 16% 100% 100% 19% 16% 0.00% 0.00% 0.00% 0.00% 47% 24% 100% 100% 81% 57% 20% 24% 100% 100% 100% 100% 0.00% 0.09% 0.47% 0.00%
5 Chinyunyu 4% 6% 10% 22% 88% 89% 25% 115% 92% 93% 8% 7% 88% 100% 151% 122% 100% 100% 151% 122% 1.14% 1.41% 1.14% 1.00% 36% 39% 100% 89% 65% 65% 20% 16% 100% 100% 100% 100% 0.00% 0.11% 1.12% 0.22%
6 Chitemalesa 8% 15% 9% 20% 83% 82% 28% 44% 98% 87% 0% 2% 100% 100% 24% 26% 83% 30% 29% 86% 0.00% 0.00% 0.00% 0.00% 61% 59% 56% 91% 89% 95% 18% 33% 100% 100% 100% 100% 0.00% 0.00% 0.32% 0.11%
7 Chiyota 3% 0% 10% 0% 129% 63% 46% 168% 100% 121% 0% 0% 100% 0% 58% 52% 100% 100% 58% 52% 0.00% 0.00% 0.00% 0.00% 68% 61% 35% 27% 98% 179% -29% 23% 100% 100% 100% 100% 0.00% 0.00% 46.49% 58.33%
8 Kankumba 0% 3% 12% 21% 126% 75% 15% 23% 100% 121% 0% 5% 233% 125% 52% 82% 100% 100% 52% 82% 0.00% 0.00% 0.00% 0.00% 73% 33% 100% 100% 34% 73% 49% 36% 100% 100% 100% 100% 0.00% 0.00% 0.00% 0.00%
9 Kanyongoloka 0% 12% 0% 27% 0% 97% 0% 44% 0% 88% 0% 4% 0% 0% 0% 8% 0% 100% 0% 8% 0.00% 0.00% 0.00% 0.00% 0% 25% 0% 0% 26% 16% 40% 8% 100% 100% 67% 100% 0.00% 0.00% 0.00% 0.26%
11 Luangwa Bridge 13% 6% 37% 28% 91% 97% 13% 26% 100% 85% 0% 15% 200% 100% 24% 35% 100% 100% 24% 35% 0.00% 0.00% 0.00% 0.00% 25% 65% 100% 100% 38% 135% 5% 0% 83% 100% 67% 100% 0.00% 0.00% 0.00% 0.00%
12 Lukwipa 7% 2% 5% 24% 24% 85% 207% 16% 107% 65% 14% 6% 100% 100% 16% 11% 100% 100% 16% 11% 0.00% 0.00% 0.00% 0.00% 47% 26% 100% 100% 49% 65% 5% -16% 100% 100% 100% 100% 0.35% 0.00% 0.93% 0.23%
13 Mpanshya Hospital 8% 46% 14% 22% 119% 137% 220% 149% 100% 101% 6% 9% 100% 86% 302% 229% 100% 100% 302% 229% 1.24% 0.00% 2.48% 0.00% 45% 55% 87% 87% 73% 90% -33% -34% 100% 100% 100% 100% 0.24% 1.10% 0.37% 2.07%
14 Mulamba 0% 2% 2% 7% 83% 144% 161% 139% 100% 98% 0% 3% 0% 33% 34% 79% 100% 100% 34% 79% 0.00% 0.00% 0.00% 0.00% 5% 48% 100% 100% 131% 125% -6% 30% 67% 100% 67% 100% 0.00% 0.00% 0.00% 0.00%
15 Mwachilele 7% 10% 20% 50% 100% 169% 7% 4% 83% 100% 0% 0% 100% 0% 24% 35% 70% 91% 35% 38% 0.00% 0.00% 0.00% 0.00% 36% 22% 100% 100% 31% 81% -3% -43% 100% 100% 100% 100% 0.22% 0.22% 0.00% 3.36%
16 Namanongo 9% 5% 0% 9% 81% 90% 34% 13% 100% 95% 0% 5% 100% 25% 29% 41% 100% 100% 29% 41% 0.00% 0.00% 0.00% 0.00% 33% 53% 100% 100% 103% 128% 9% -19% 100% 100% 100% 100% 0.00% 0.00% 0.00% 0.00%
17 Nyangwena 5% 18% 14% 41% 136% 134% 233% 93% 81% 102% 2% 7% 100% 80% 99% 79% 100% 100% 99% 79% 0.00% 0.00% 0.00% 0.00% 93% 101% 68% 100% 232% 116% 33% 24% 100% 100% 100% 100% 0.00% 0.48% 0.00% 0.32%
18 Rufunsa 12% 18% 4% 8% 32% 36% 212% 79% 80% 75% 12% 0% 133% 0% 8% 8% 100% 100% 8% 8% 0.00% 0.00% 0.00% 0.00% 34% 20% 83% 100% 45% 45% 5% -60% 100% 100% 100% 100% 0.00% 0.00% 0.00% 0.00%
19 Rutech 4% 8% 26% 40% 166% 159% 8% 0% 100% 110% 2% 0% 0% 0% 0% 0% 0% 0% 0% 0% 0.00% 0.00% 0.00% 0.00% 21% 11% 0% 0% 112% 112% 28% -28% 100% 100% 100% 100% 0.00% 1.12% 1.79% 18.10%
20 Shikabeta 7% 0% 13% 10% 47% 27% 143% 38% 93% 25% 0% 0% 0% 0% 42% 14% 100% 67% 42% 21% 0.00% 0.00% 0.00% 0.00% 40% 32% 83% 100% 0% 32% 15% -123% 100% 100% 83% 100% 0.00% 0.00% 14.19% 4.50%
21 Tengama 14% 11% 12% 6% 81% 104% 0% 50% 93% 0% 0% 0% 0% 0% 6% 0% 100% 0% 6% 0% 0.00% 0.00% 0.00% 0.00% 38% 63% 100% 0% 16% 149% -7% -29% 100% 100% 100% 67% 0.00% 0.00% 0.00% 0.00%
0.0283941
0.0037485
0.0575974
0.0047259
0.0111744
0.0031753
0.4648547
0
0
0
0.0093175
0.0036564
0
0
0
0
0
0.017879
0.1418919
0
]\ Name of Health Facility
Pre-pregnancy Adolescence Pregnancy
% 0f known HIV+ at first
ANC
% HIV positive pregnant
women initiated on EMTCT
Neonatal Health System
% of clients accessing long
acting reversible
contraceptives
% of total ANC1 attendants
aged < 18 yrs
% of pregnant Women
attending ANC1 within 1st
trimester
% of pregnant Women
attending ANC1 total
% of pregnant Women
Accessing ≥4 Visits to ANC % 1st ANC tested for HIV
Delivery and postnatal
% of deliveries conducted
by skilled personnel
population based % of Institutional deliveries
% of children with
weight between -2 Z
and -3 Z score
% of deliveries conducted
by skilled personnel based
on institutional delivery
% of children with
weight below -3 Z
score
% of children < 1 fully
immunized
Immunization drop out rate
(DPT1/DPT3)
% of HMIS
reportscompleted
% of HMIS reports timely
submittedFresh still birth rate Total still birth rate
% of mother receiving PNC
within 6 days
% of babies initiated on
breast milk within 1 hour
after delivery
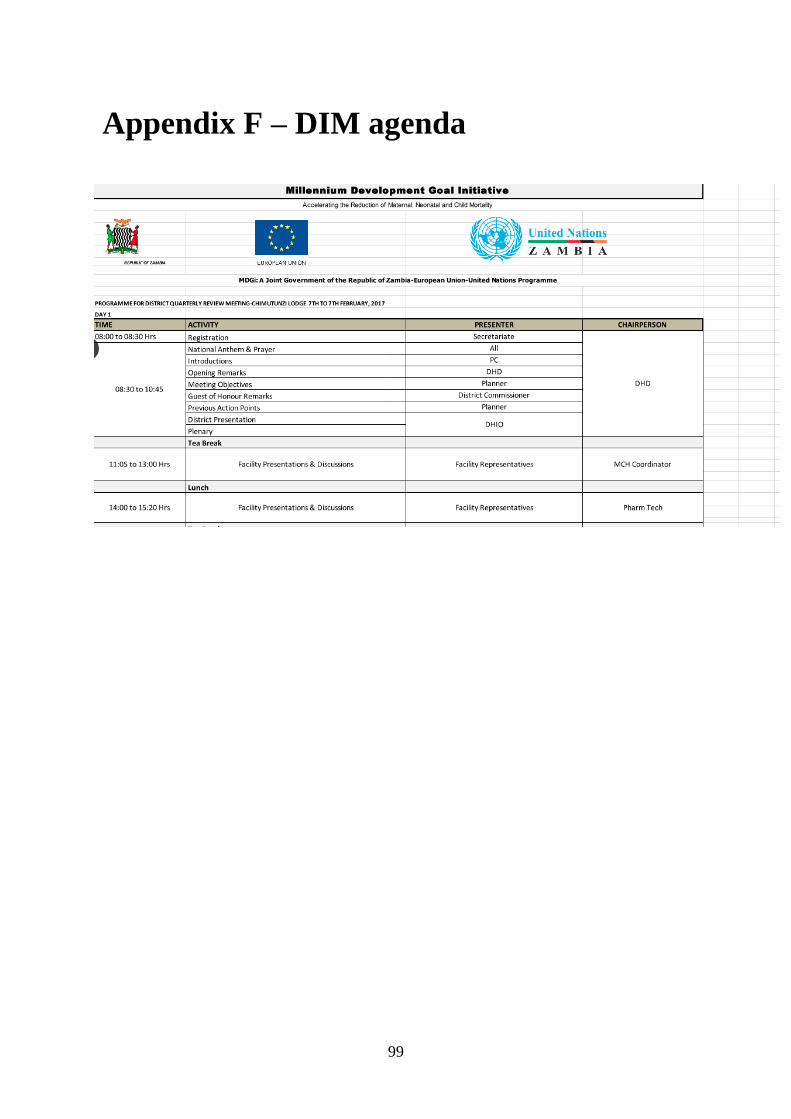
99
Appendix F – DIM agenda