data.census.gov today: a comprehensive overview
TRANSCRIPT
data.census.gov Today:A Comprehensive Overview
Dial-in: 1-888-324-8527
Passcode: 5913323
Tyson WeisterCenter for Enterprise Dissemination
Dissemination Outreach BranchU.S. Census Bureau
1
Outline
• Live Demo
• New data.census.gov Learning Resources
• Feedback (Top 10) and New Survey
• Common Questions
• Q&A
2
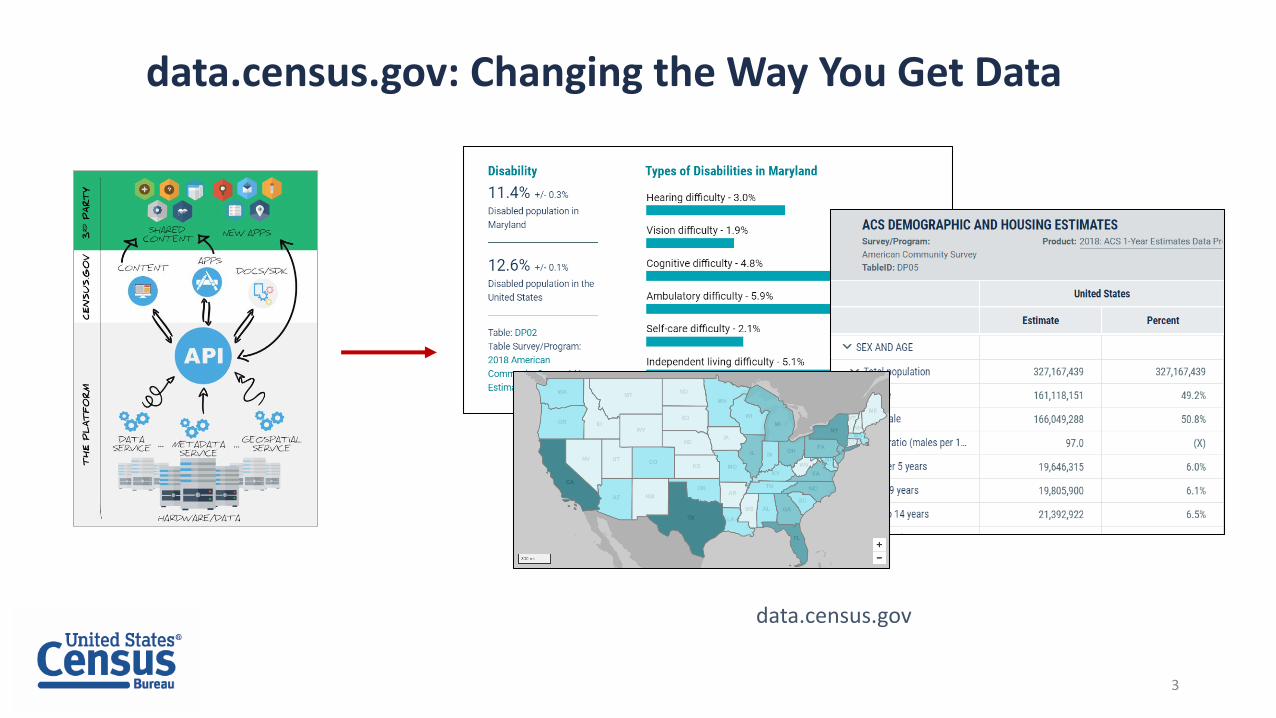
data.census.gov: Changing the Way You Get Data
data.census.gov
3

data.census.gov Demo
4
1. Getting Started with Census DataExample: Geography Profile for Denver County, Colorado
2. Searching by Table ID, Customizing Table View, and Saving ResultsExample: DP03 and DP02 for Denver County, Colorado, and ZIP Code Tabulation Area 80204
3. Searching by Topic, Mapping, and DownloadingExample: Population 60+ for all Census Tracts in Denver County, Colorado
4. Searching by Industry Code/Dataset, and Applying Custom FiltersExample: Number of establishments for nursing/residential care facilities for all counties in CO
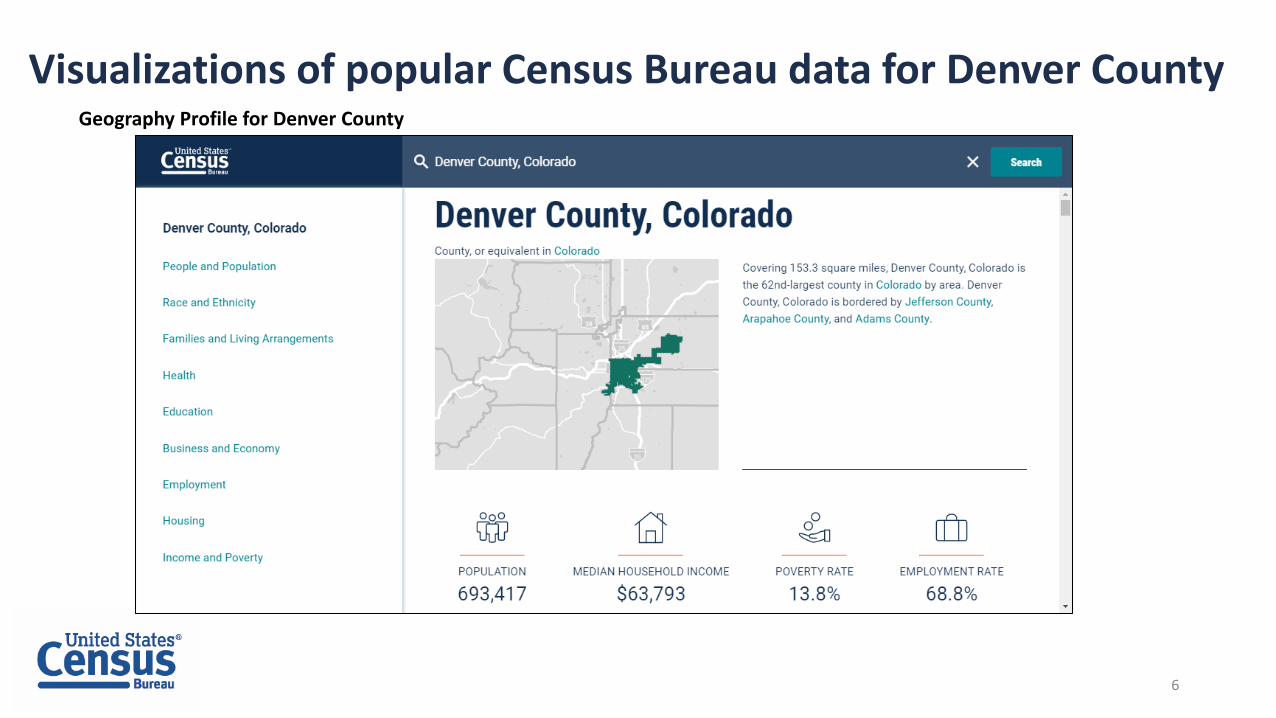
Visualizations of popular Census Bureau data for Denver CountyGeography Profile for Denver County
6

Visualizations of popular Census Bureau data for Denver CountyClick a table title for more information on the topic
7

data.census.gov Demo
8
1. Getting Started with Census DataExample: Geography Profile for Denver County, Colorado
2. Searching by Table ID, Customizing Table View, and Saving ResultsExample: DP03 and DP02 for Denver County, Colorado, and ZIP Code Tabulation Area 80204
3. Searching by Topic, Mapping, and DownloadingExample: Population 60+ for all Census Tracts in Denver County, Colorado
4. Searching by Industry Code/Dataset, and Applying Custom FiltersExample: Number of establishments for nursing/residential care facilities for all counties in CO
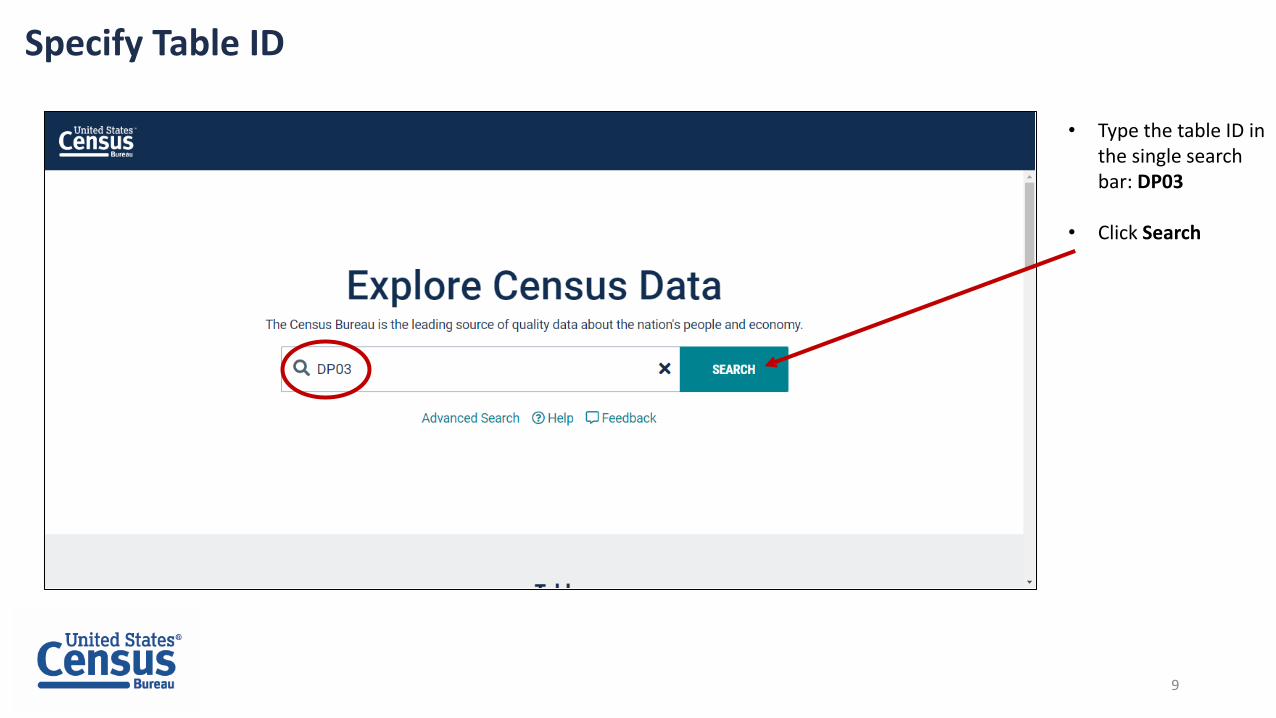
Specify Table ID
• Type the table ID in the single search bar: DP03
• Click Search
9
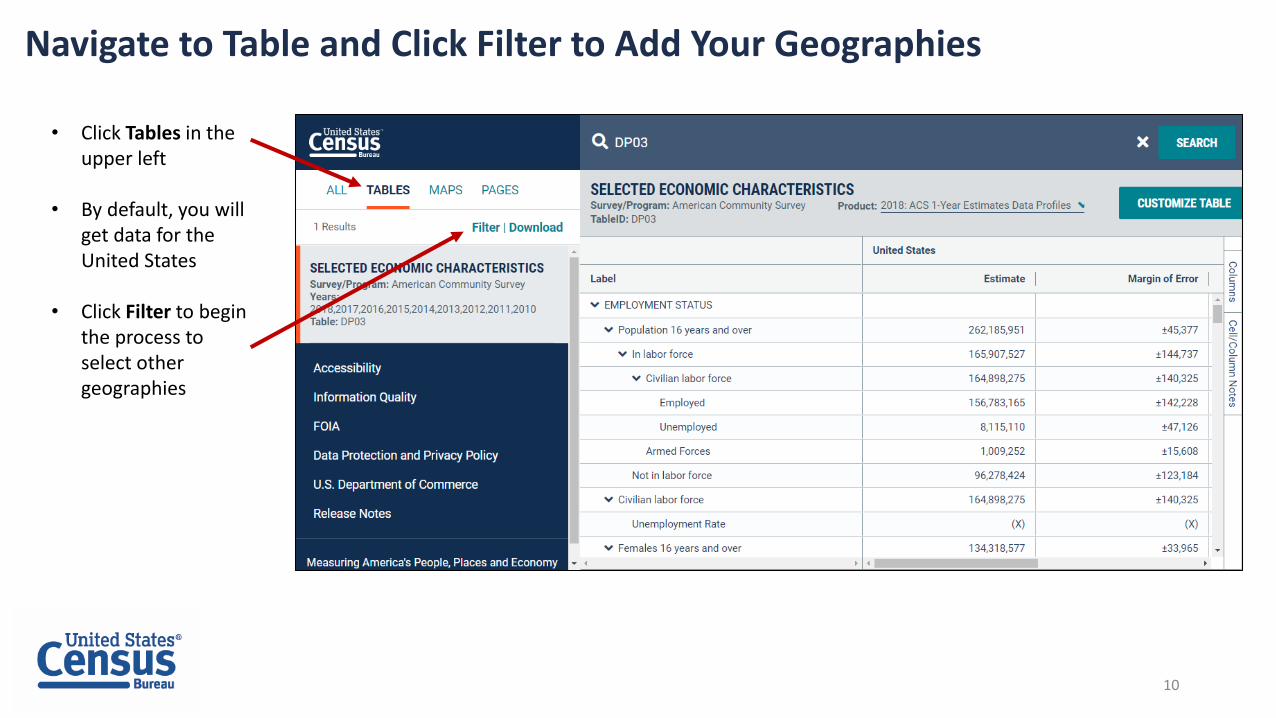
Navigate to Table and Click Filter to Add Your Geographies
• Click Tables in the upper left
• By default, you will get data for the United States
• Click Filter to begin the process to select other geographies
10

Select Geography: Denver County, CO
• Select Geography
Geography → County → Colorado → Denver County, Colorado
11
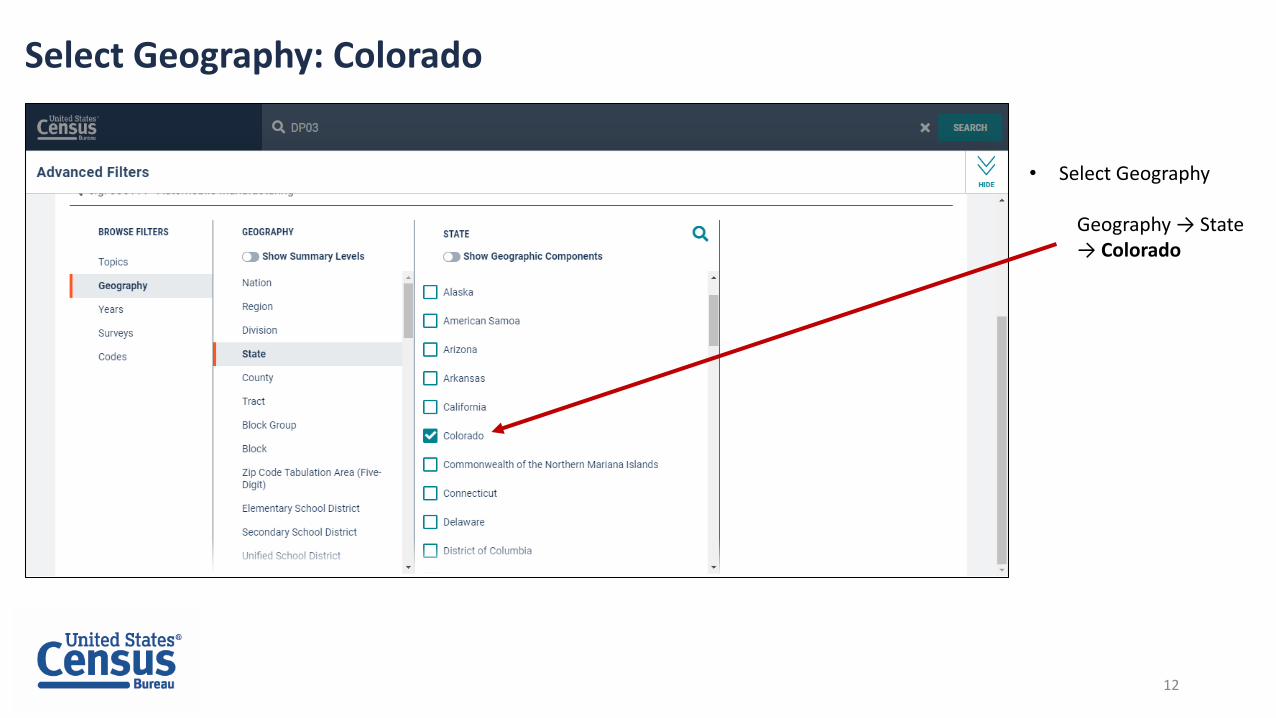
Select Geography: Colorado
• Select Geography
Geography → State → Colorado
12
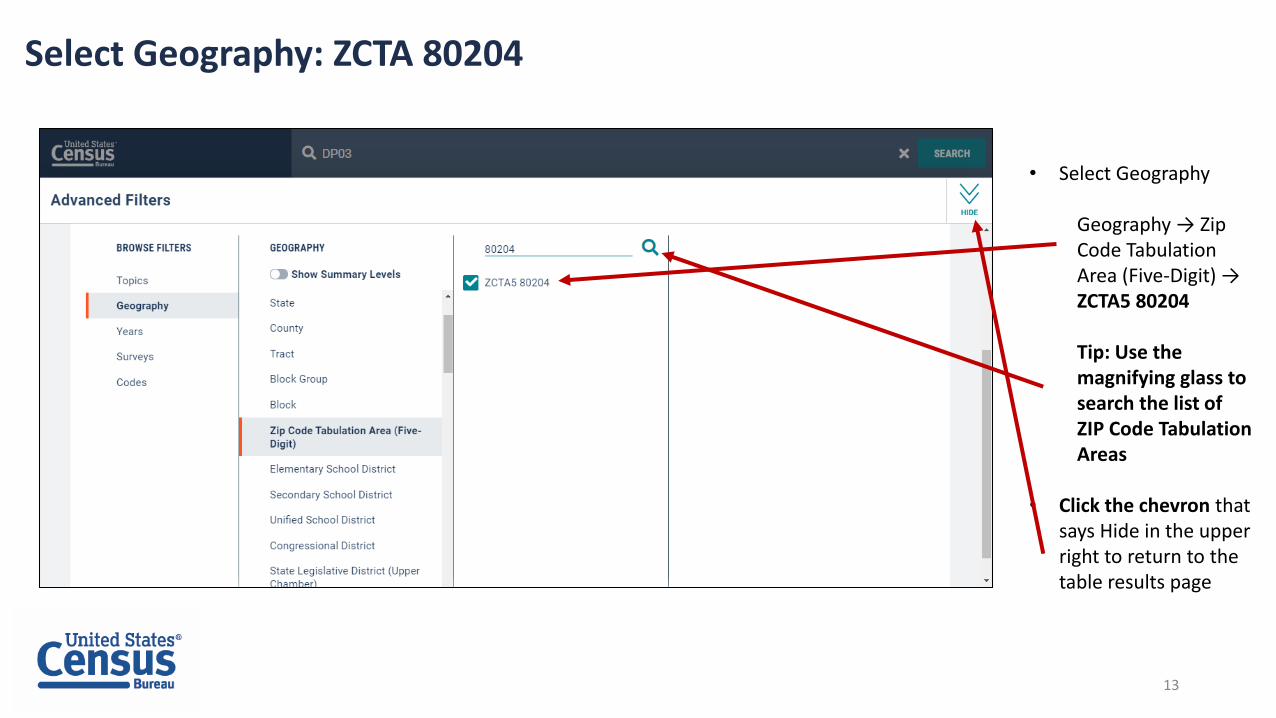
Select Geography: ZCTA 80204
• Select Geography
Geography → Zip Code Tabulation Area (Five-Digit) → ZCTA5 80204
Tip: Use the magnifying glass to search the list of ZIP Code Tabulation Areas
• Click the chevron that says Hide in the upper right to return to the table results page
13

Choose Your Product
• Select 2018 ACS 5-Year Estimates Data Profiles from the product drop down menu to get data for all of your selected geographies (the ACS 1-year estimates are only provided for selected geographic types that have 65,000 people or more)
• Click CustomizeTable in the upper right
14
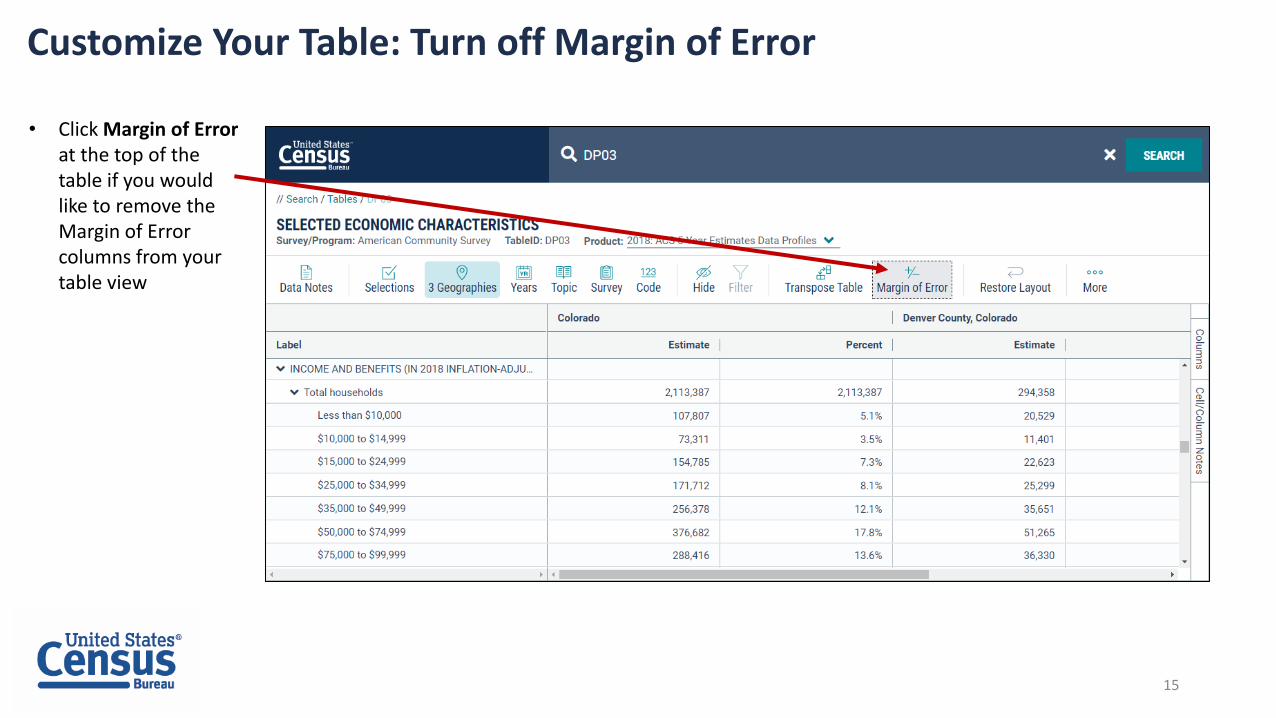
Customize Your Table: Turn off Margin of Error
• Click Margin of Error at the top of the table if you would like to remove the Margin of Error columns from your table view
15
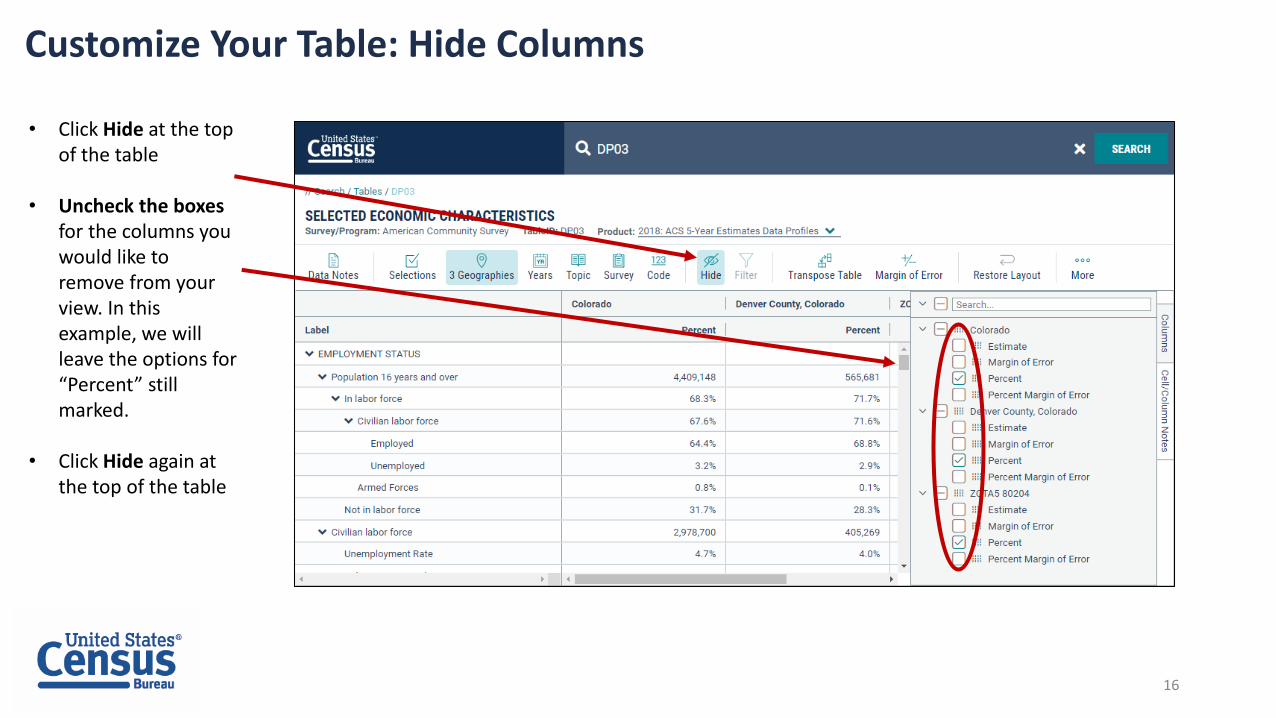
Customize Your Table: Hide Columns
• Click Hide at the top of the table
• Uncheck the boxes for the columns you would like to remove from your view. In this example, we will leave the options for “Percent” still marked.
• Click Hide again at the top of the table
16
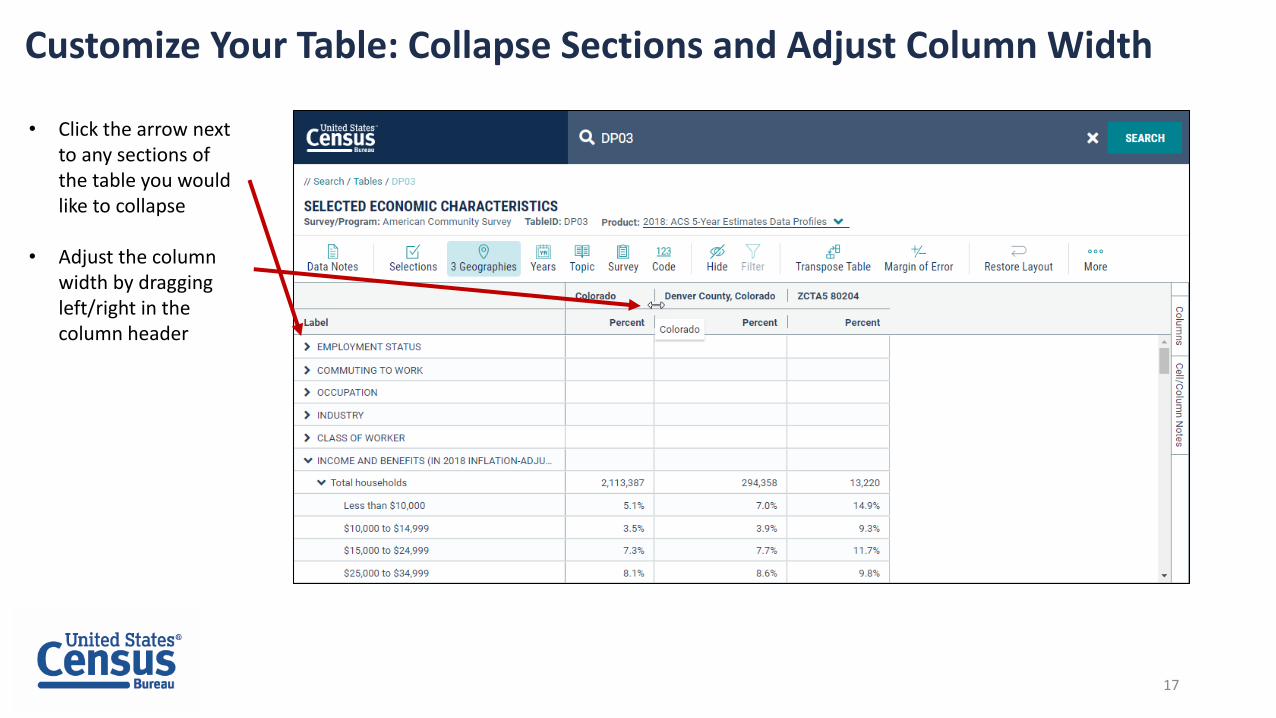
Customize Your Table: Collapse Sections and Adjust Column Width
• Click the arrow next to any sections of the table you would like to collapse
• Adjust the column width by dragging left/right in the column header
17
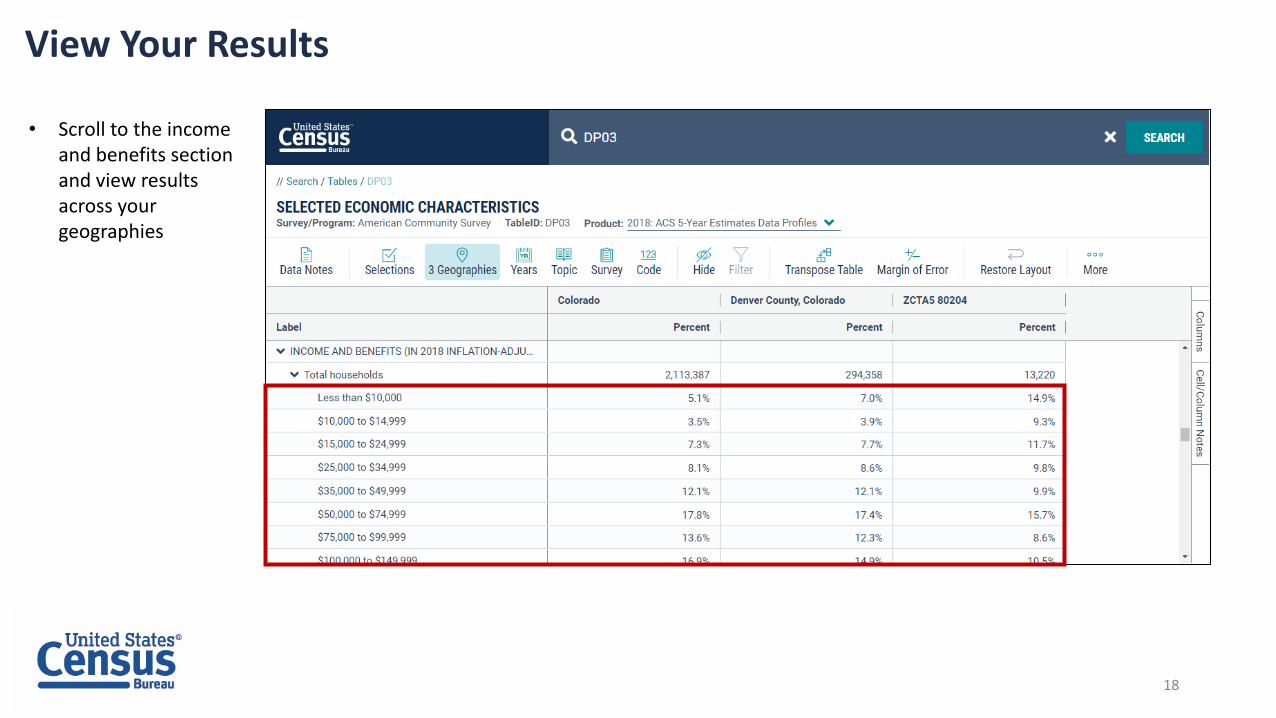
View Your Results
• Scroll to the income and benefits section and view results across your geographies
18
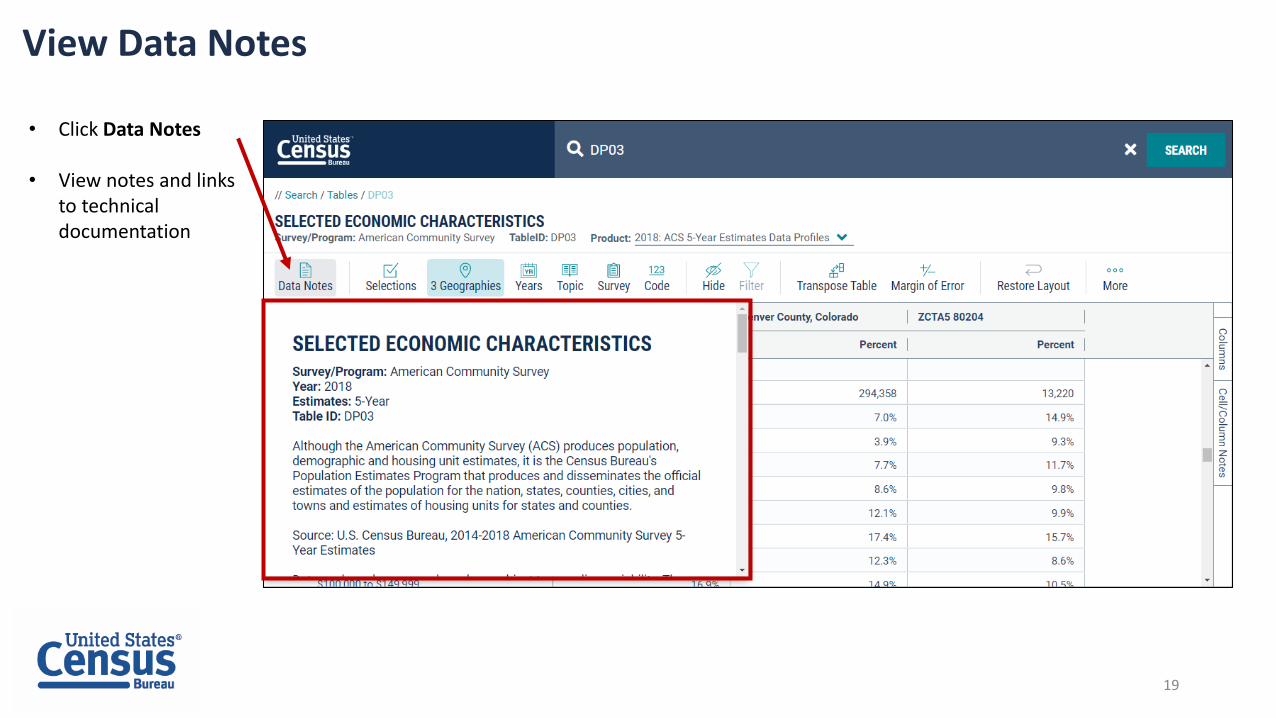
View Data Notes
• Click Data Notes
• View notes and links to technical documentation
19
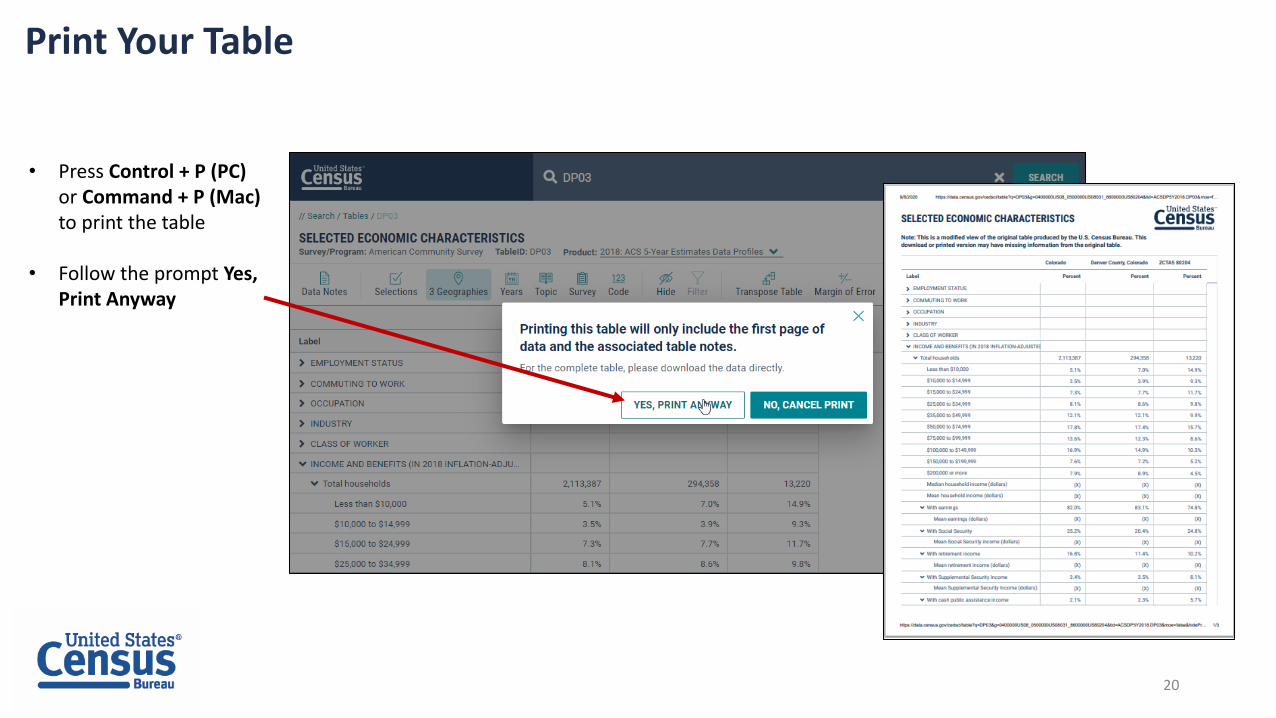
Print Your Table
• Press Control + P (PC)or Command + P (Mac) to print the table
• Follow the prompt Yes, Print Anyway
20

Export to Excel
You can export an entire table to Excel:• Right click the table• Select Export Table• Select Export to Excel
Open Excel file
21
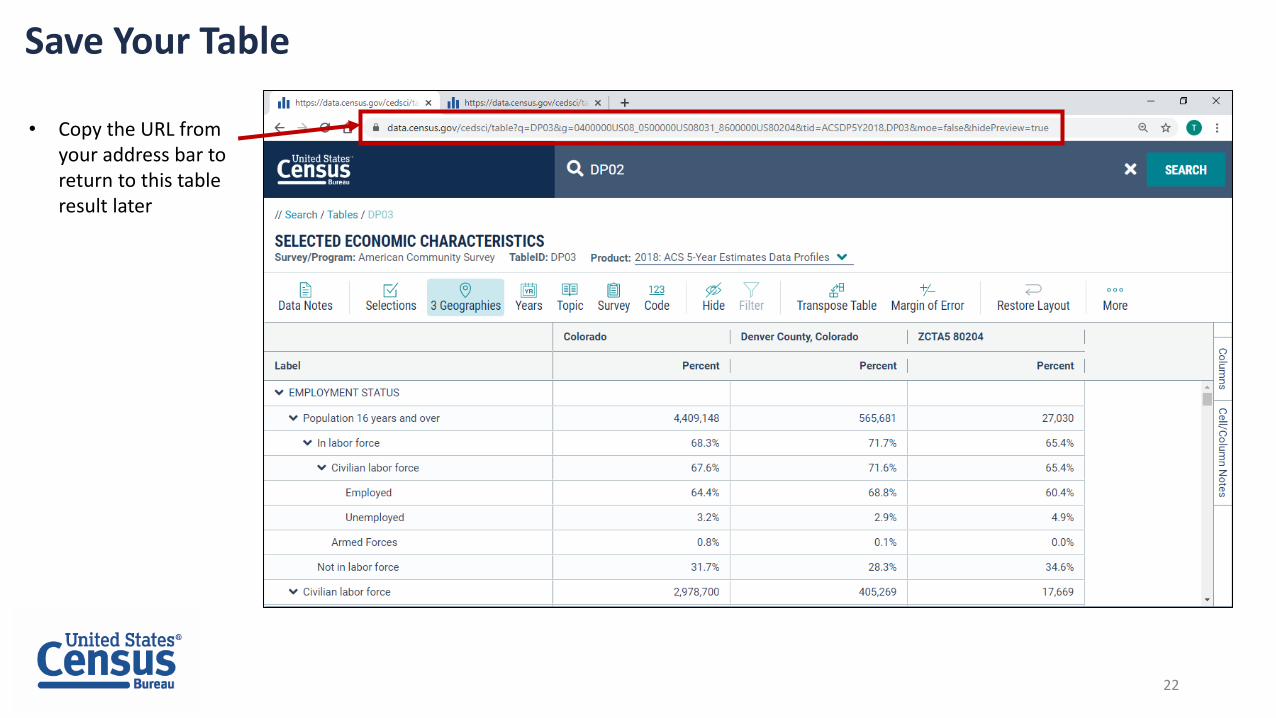
Save Your Table
• Copy the URL from your address bar to return to this table result later
22

Change Your Table ID
• Click into the single search bar and type a new table ID: DP02
• Notice the filters you previously selected are saved by default
• Click Search
23
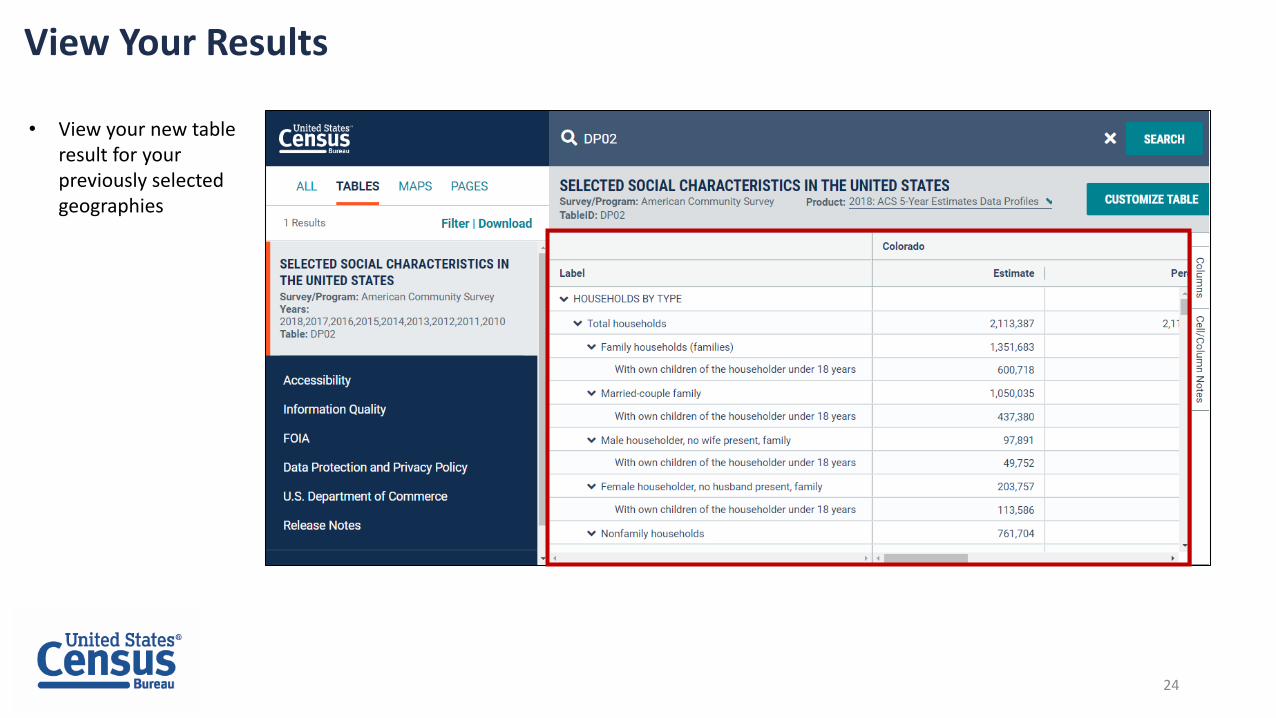
View Your Results
• View your new table result for your previously selected geographies
24

data.census.gov Demo
25
1. Getting Started with Census DataExample: Geography Profile for Denver County, Colorado
2. Searching by Table ID, Customizing Table View, and Saving ResultsExample: DP03 and DP02 for Denver County, Colorado, and ZIP Code Tabulation Area 80204
3. Searching by Topic, Mapping, and DownloadingExample: Population 60+ for all Census Tracts in Denver County, Colorado
4. Searching by Industry Code/Dataset, and Applying Custom FiltersExample: Number of establishments for nursing/residential care facilities for all counties in CO
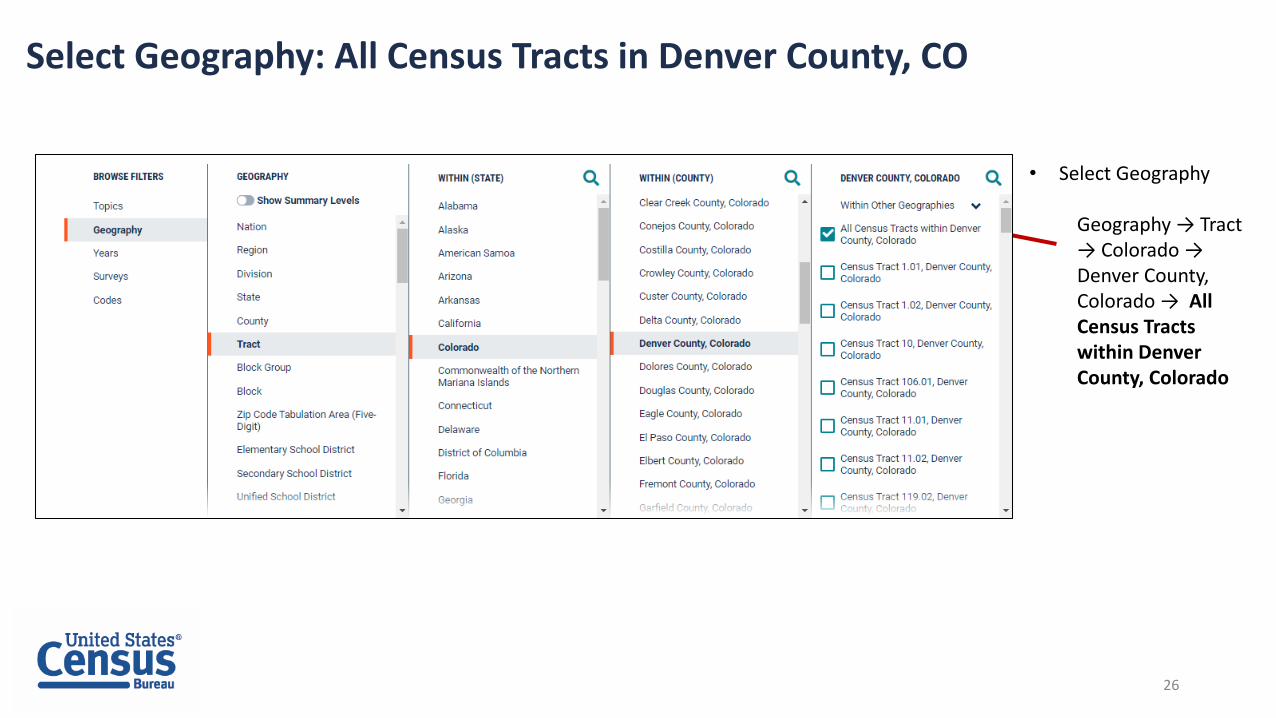
Select Geography: All Census Tracts in Denver County, CO
• Select Geography
Geography → Tract → Colorado → Denver County, Colorado → All Census Tracts within Denver County, Colorado
26
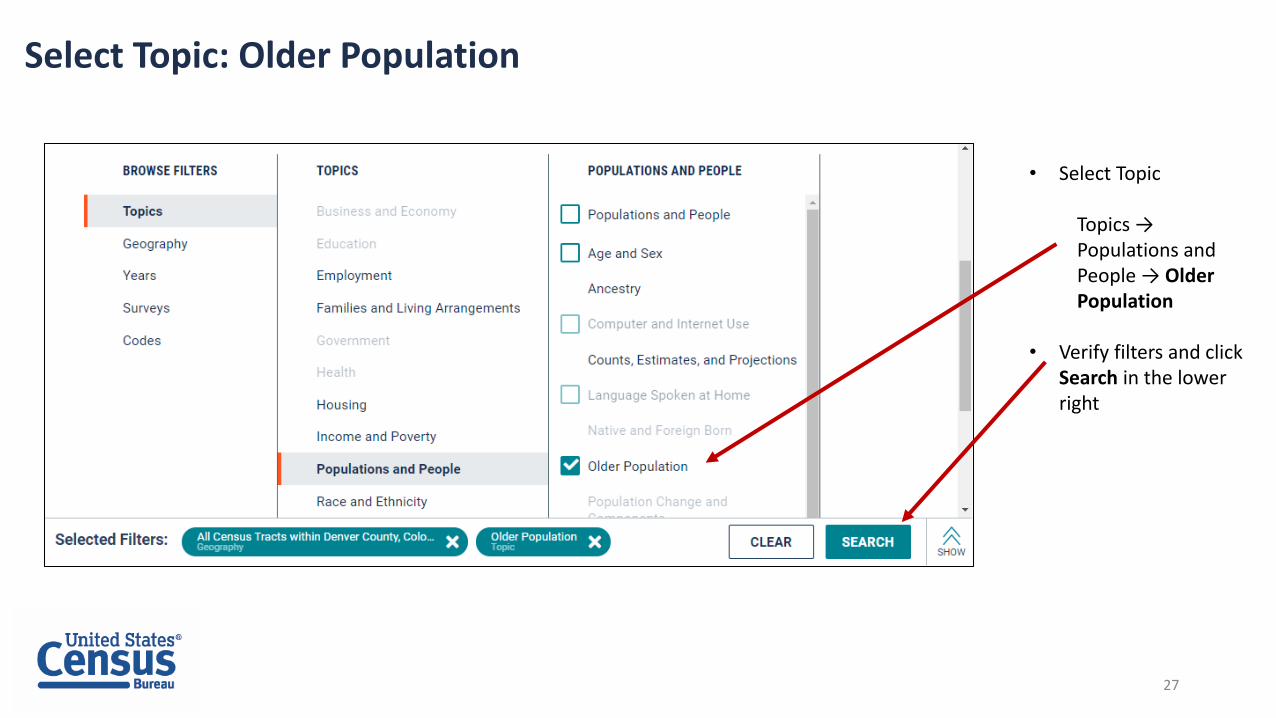
Select Topic: Older Population
• Select Topic
Topics → Populations and People → Older Population
• Verify filters and click Search in the lower right
27

View Table Results
• Click Tables in the upper left
• Find an estimate that you would like to map
28
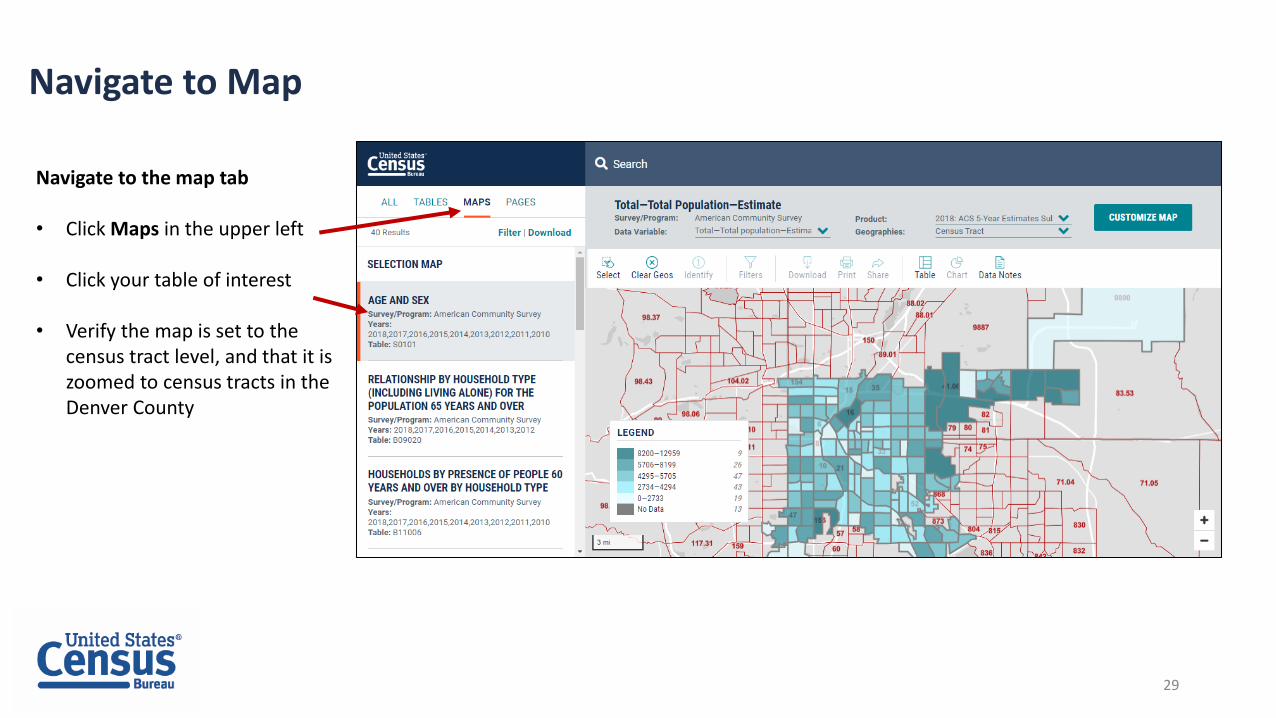
Navigate to Map
Navigate to the map tab
• Click Maps in the upper left
• Click your table of interest
• Verify the map is set to the census tract level, and that it is zoomed to census tracts in the Denver County
29

Select Your Variable
From the Map View
• Click Customize Map
• Select the Data Variable dropdown menu and keep scrolling to the bottom until you’ve loaded the full list
• Find and click the variable that says Percent—Total population—SELECTED AGE CATEGORIES—60 years and over--Estimate
30
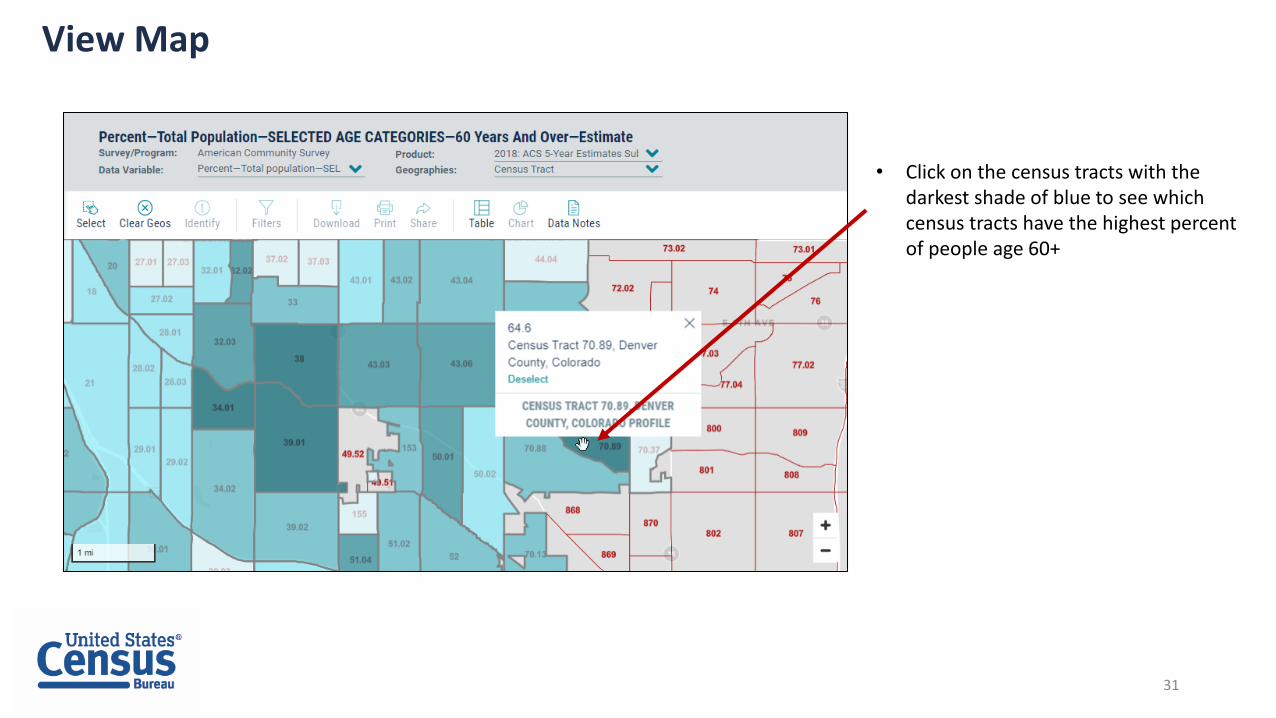
View Map
• Click on the census tracts with the darkest shade of blue to see which census tracts have the highest percent of people age 60+
31

Customize Your Map
• Click the Settings Icon to make changes to the map settings
• Change the color palette, number of data classes in your legend, or legend classification type (Natural Breaks, Quantile, Equal Interval)
32

Compare Your Variable Across Geographies
• Click View Table in the left navigation panel
• View table with all of your geographies. Click the column header for your variable to sort the data in ascending or descending order
• Click Go To Full Table
33
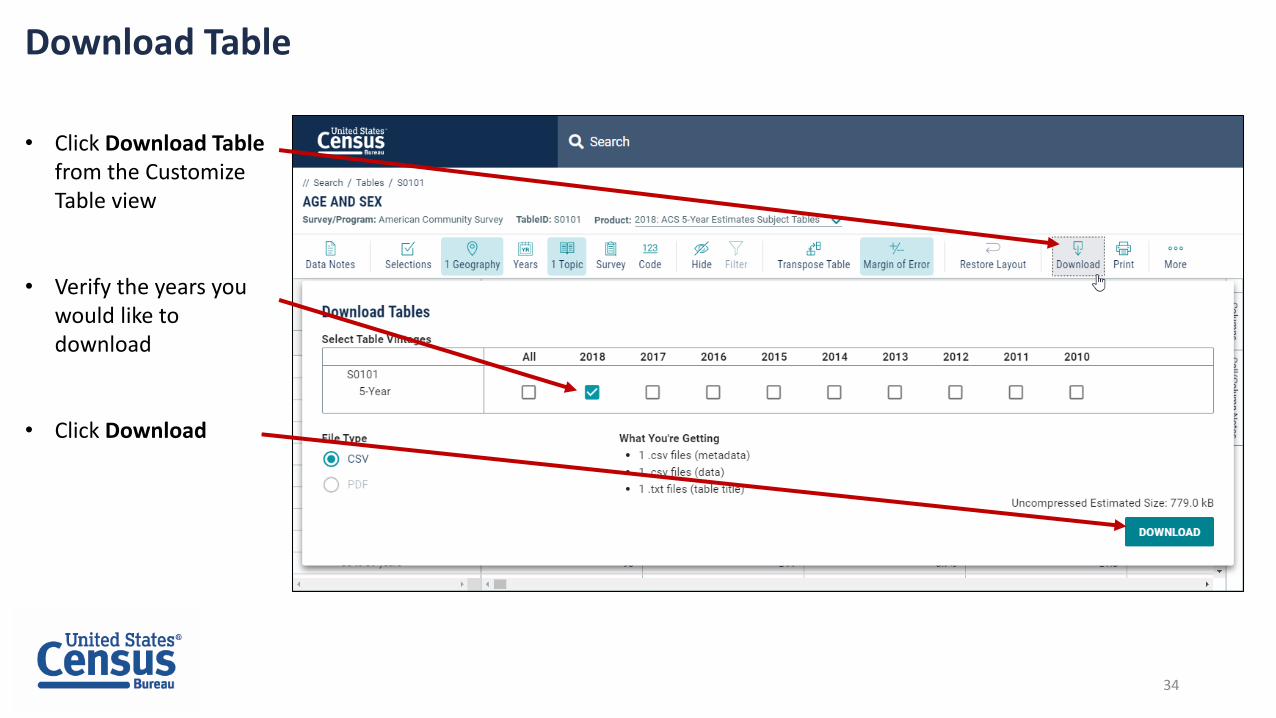
Download Table
• Click Download Table from the Customize Table view
• Verify the years you would like to download
• Click Download
34
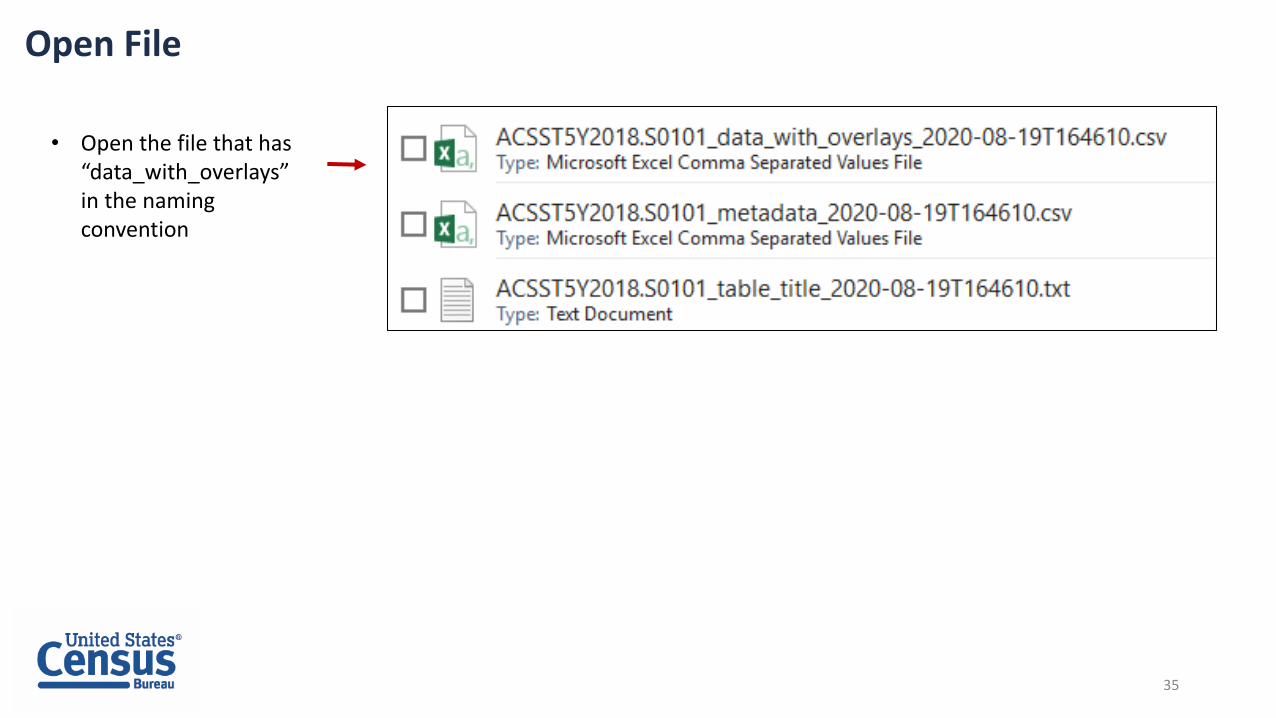
Open File
• Open the file that has “data_with_overlays” in the naming convention
35
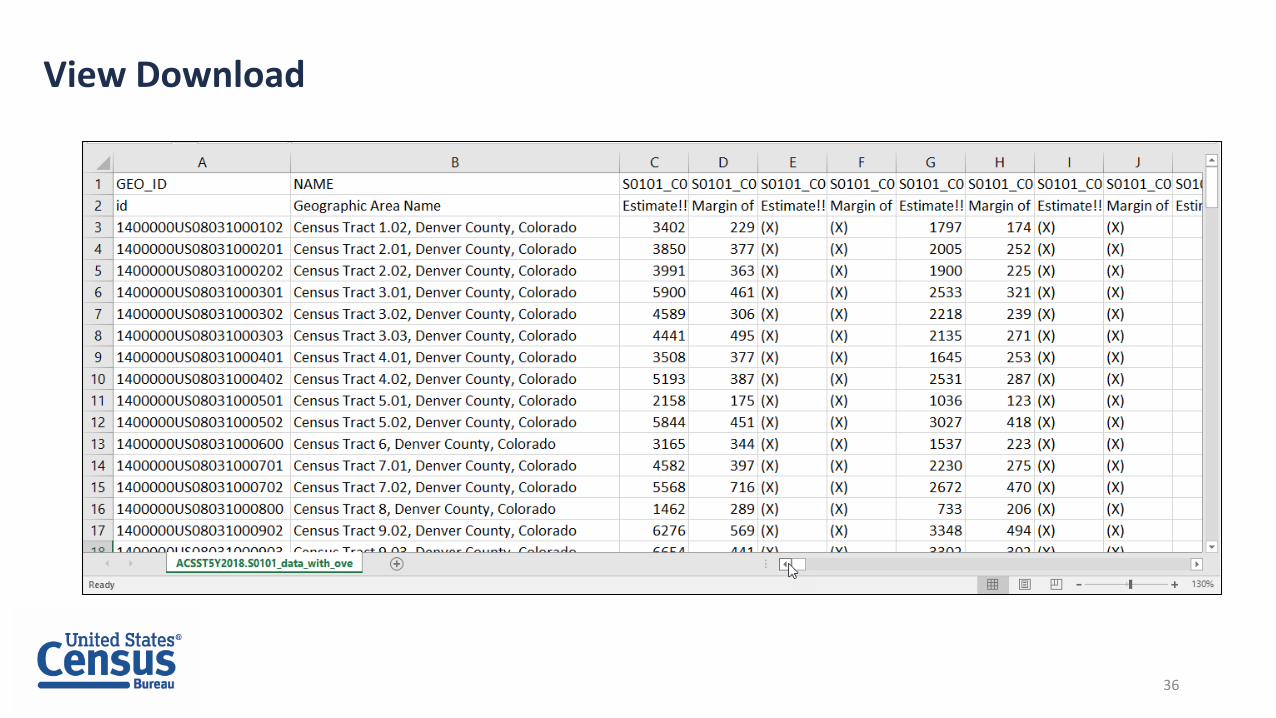
View Download
36
data.census.gov Demo
37
1. Getting Started with Census DataExample: Geography Profile for Denver County, Colorado
2. Searching by Table ID, Customizing Table View, and Saving ResultsExample: DP03 and DP02 for Denver County, Colorado, and ZIP Code Tabulation Area 80204
3. Searching by Topic, Mapping, and DownloadingExample: Population 60+ for all Census Tracts in Denver County, Colorado
4. Searching by Industry Code/Dataset, and Applying Custom FiltersExample: Number of establishments for nursing/residential care facilities for all counties in CO

Select Industry Code: NAICS 623
Using the advanced search
• Select NAICS 623 – Nursing and residential care facilitiesCodes → Industry Codes (NAICS) → 62 – Health care and social assistance → 623 – Nursing and residential care facilities → 623 – Nursing and residential care facilities
38

Select Geography: All Counties in Colorado
• Select Geography
Geography → 050 -County → Colorado → All counties in Colorado
Tip: Turn on the Show Summary Levels toggle to see the list of geographic areas that are compatible with your industry code selection. Geographies that are not compatible are grayed out
39
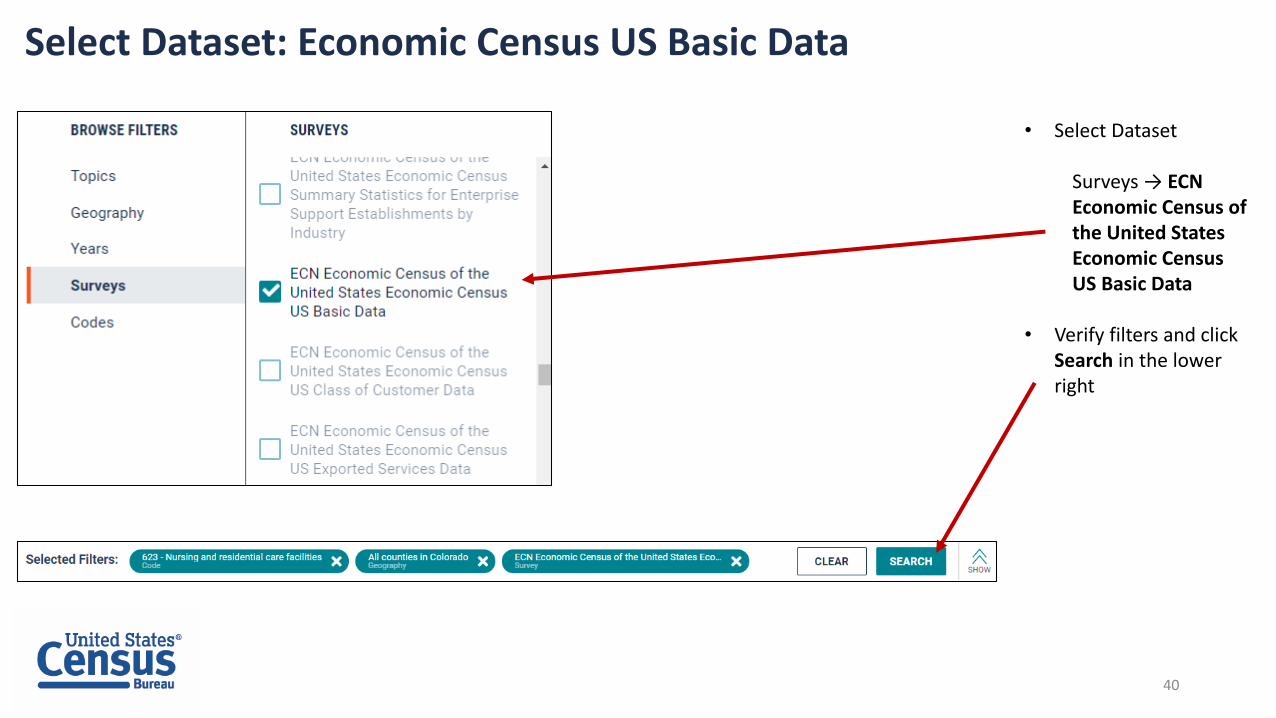
Select Dataset: Economic Census US Basic Data
• Select Dataset
Surveys → ECN Economic Census of the United States Economic Census US Basic Data
• Verify filters and click Search in the lower right
40
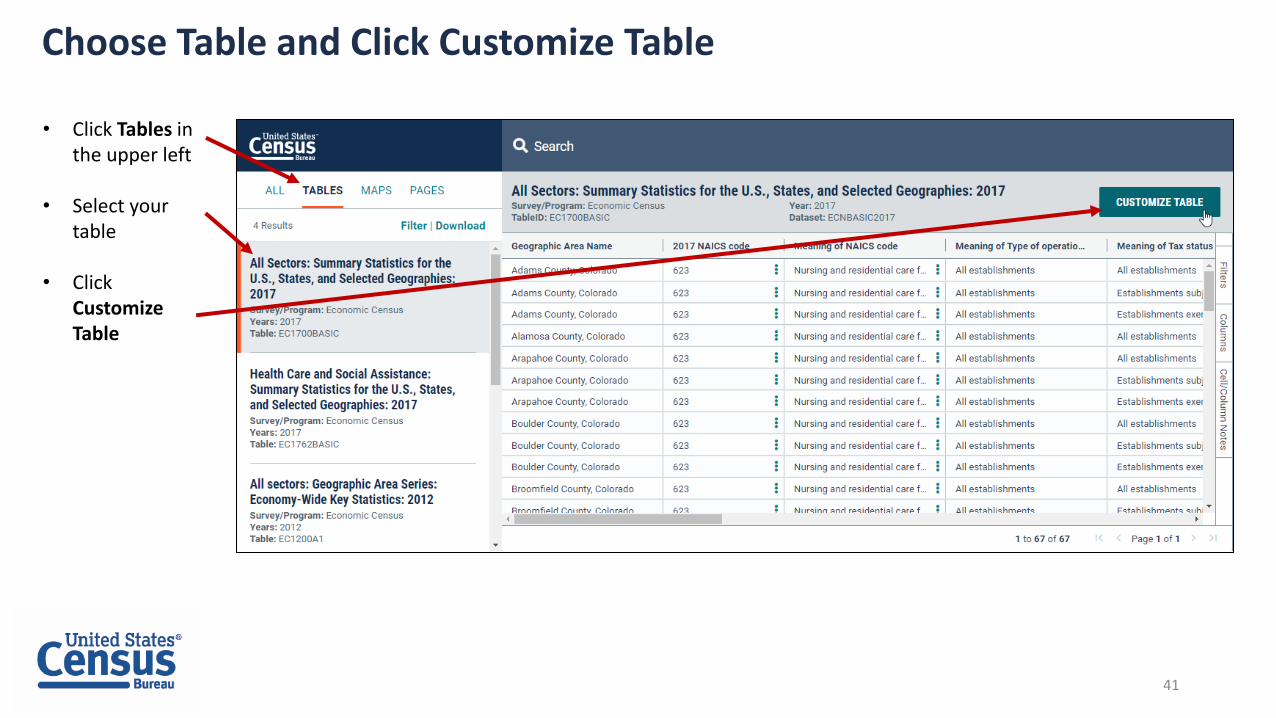
Choose Table and Click Customize Table
• Click Tables in the upper left
• Select your table
• Click Customize Table
41

Customize Your View: Pin a Column
Pin the first column with the geography names so it stays in view as you scroll to the right:
• Click the three bars in the column header
• Hover over Pin column
• Select Pin Left
42

Customize Your View: Filter Column Categories
Filter Meaning of Tax status code to show data only for All Establishments:
• Click the three bars in the column header
• Click the Filter icon
• Uncheck the boxes for Establishments exempt from federal income tax and Establishments subject to federal income tax
43
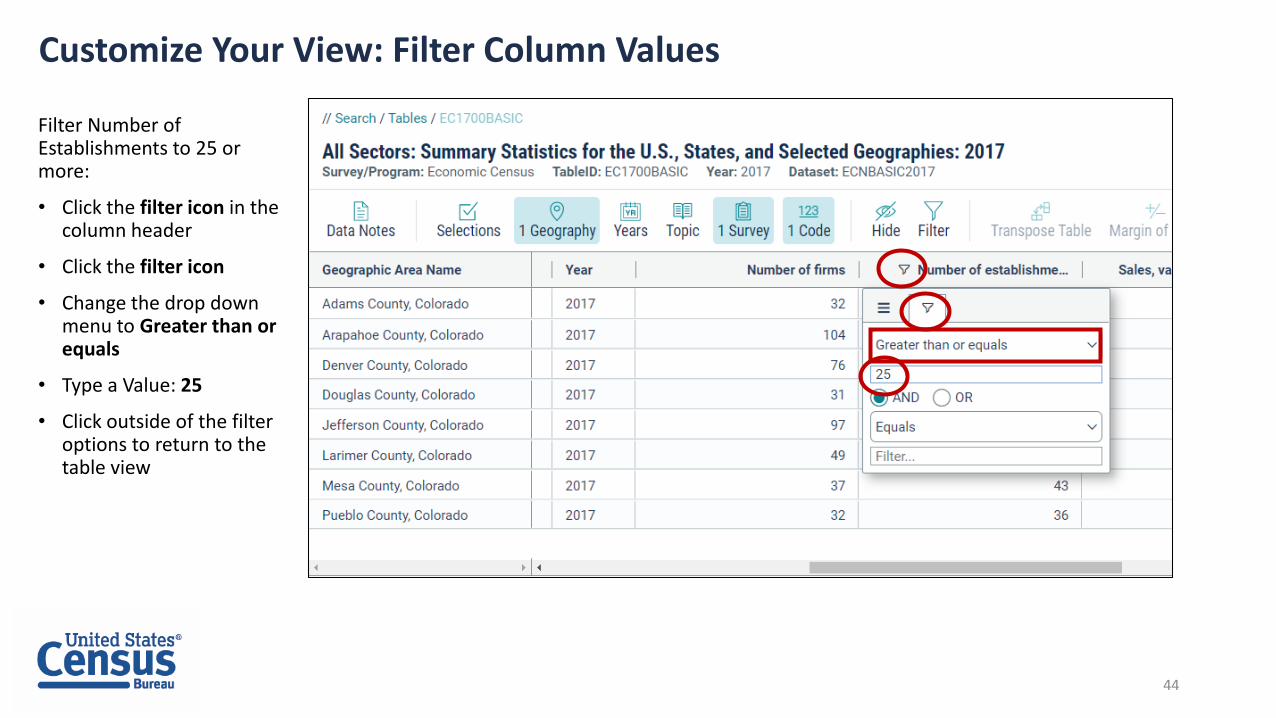
Customize Your View: Filter Column Values
Filter Number of Establishments to 25 or more:
• Click the filter icon in the column header
• Click the filter icon
• Change the drop down menu to Greater than or equals
• Type a Value: 25
• Click outside of the filter options to return to the table view
44

View Your Results: Number of Nursing/Residential Care Facilities by County in Colorado
45

Outline
• Live Demo
• New data.census.gov Learning Resources
• Feedback (Top 10) and New Survey
• Common Questions
• Q&A
46

data.census.govResource Page
47
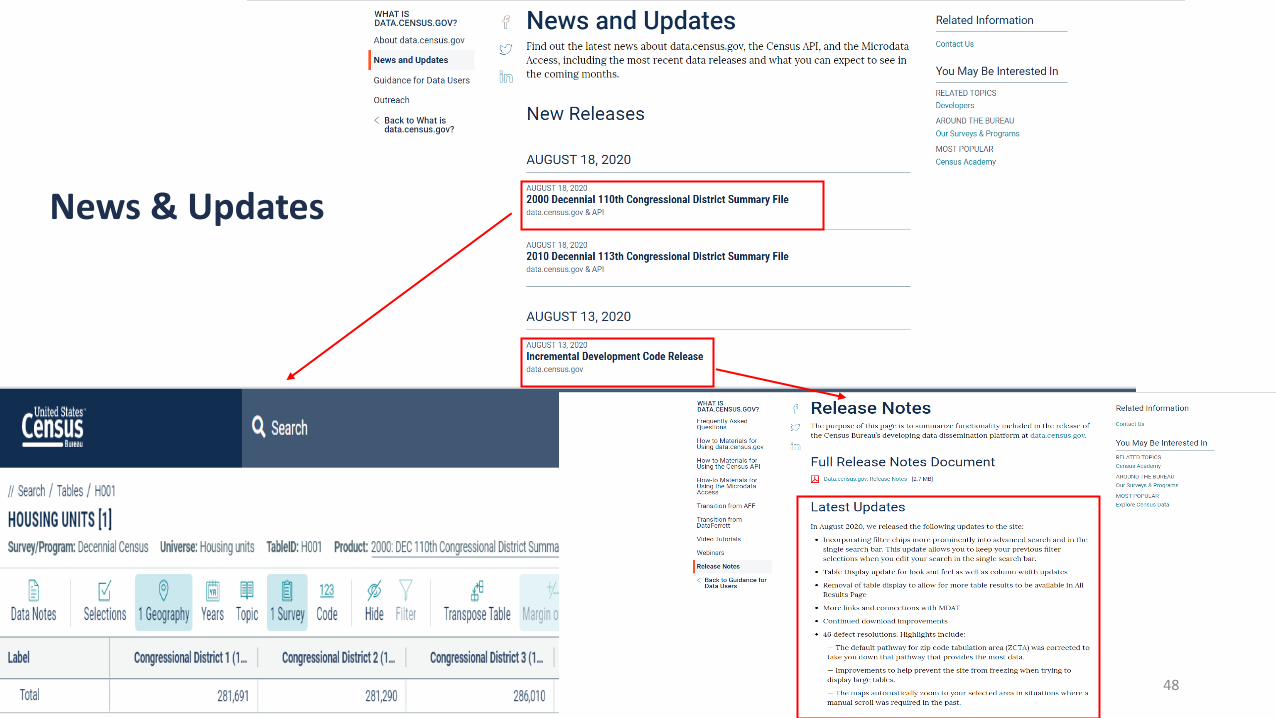
News & Updates
48

Release Notes & Latest Features
49

Guidance for Data Users
50
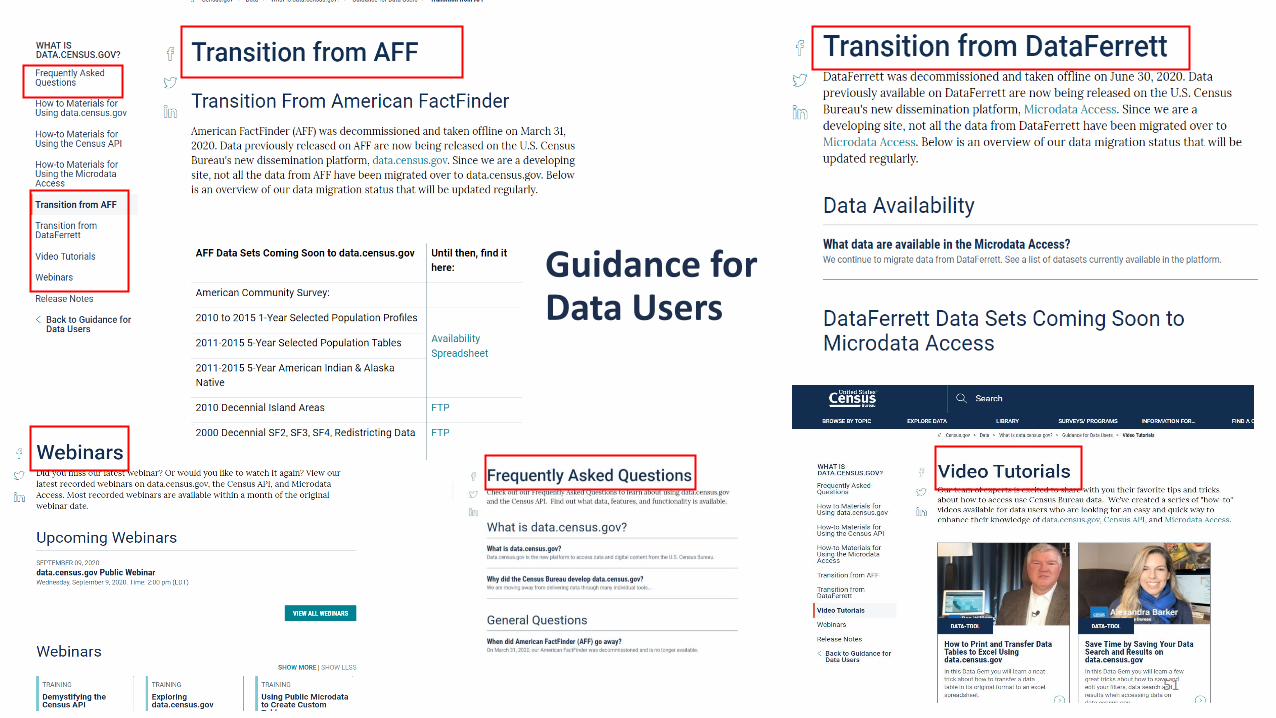
Guidance for Data Users
51
Outline
• Live Demo
• New data.census.gov Learning Resources
• Feedback (Top 10) and New Survey
• Common Questions
• Q&A
52
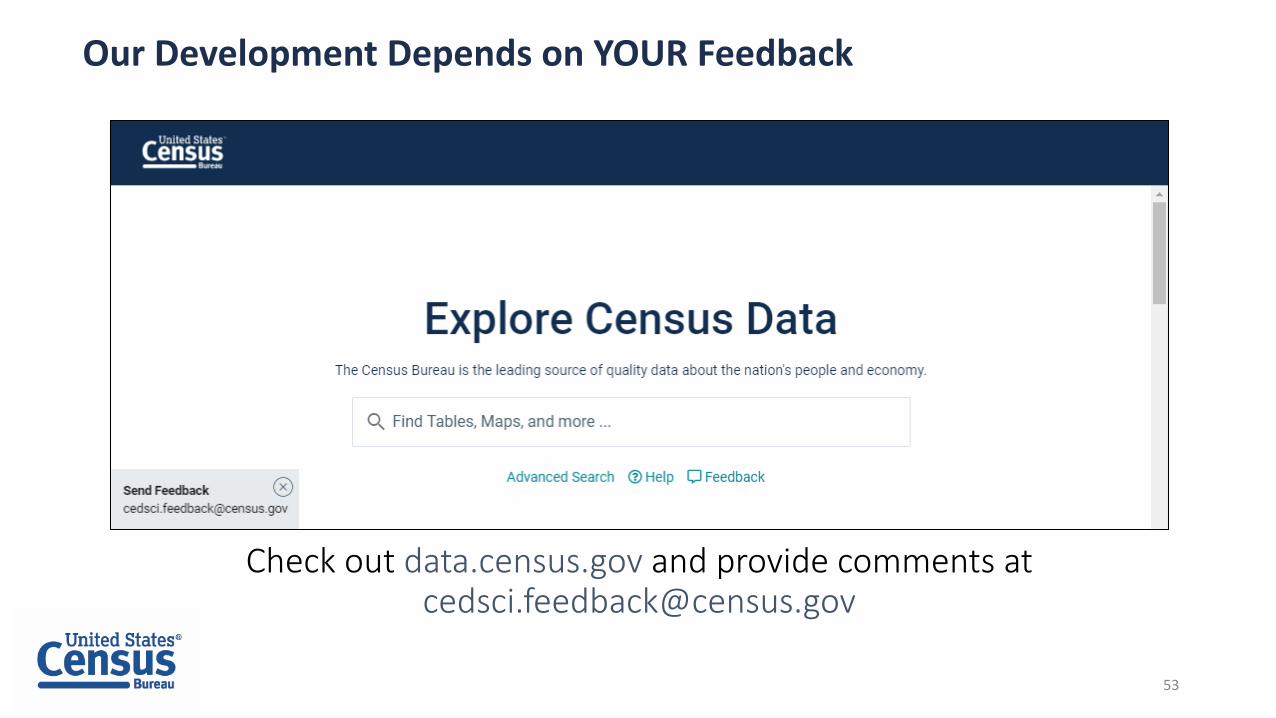
Our Development Depends on YOUR Feedback
Check out data.census.gov and provide comments at [email protected]
53

Feedback Process
54
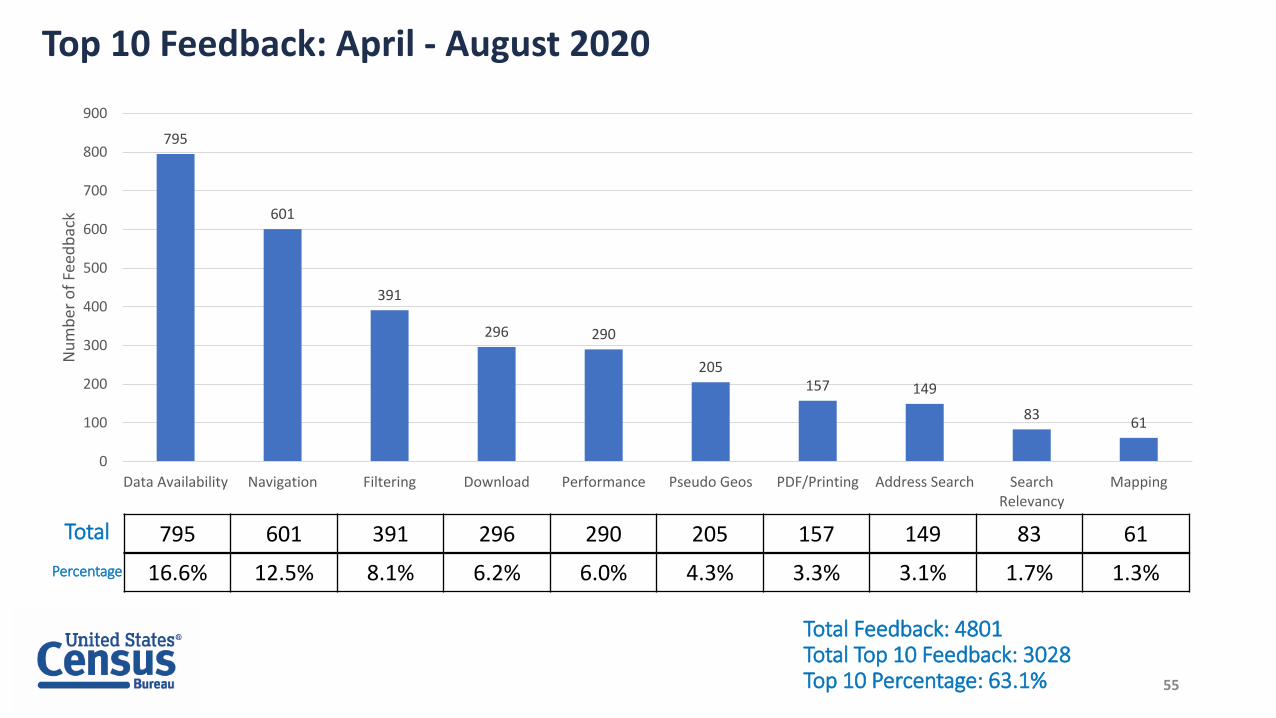
Top 10 Feedback: April - August 2020
795
601
391
296 290
205157 149
8361
0
100
200
300
400
500
600
700
800
900
Data Availability Navigation Filtering Download Performance Pseudo Geos PDF/Printing Address Search SearchRelevancy
Mapping
Nu
mb
er o
f Fe
edb
ack
Total 795 601 391 296 290 205 157 149 83 61
Percentage 16.6% 12.5% 8.1% 6.2% 6.0% 4.3% 3.3% 3.1% 1.7% 1.3%
Total Feedback: 4801Total Top 10 Feedback: 3028Top 10 Percentage: 63.1% 55
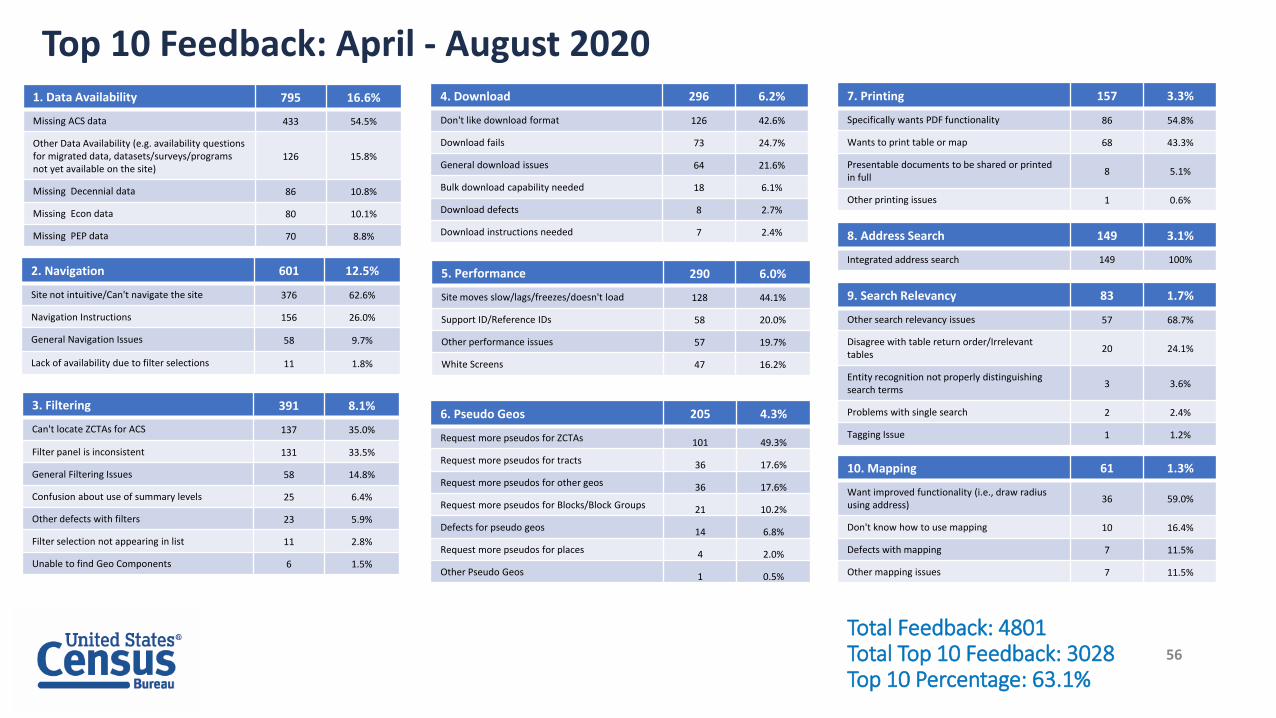
Top 10 Feedback: April - August 20201. Data Availability 795 16.6%
Missing ACS data 433 54.5%
Other Data Availability (e.g. availability questions for migrated data, datasets/surveys/programs not yet available on the site)
126 15.8%
Missing Decennial data 86 10.8%
Missing Econ data 80 10.1%
Missing PEP data 70 8.8%
2. Navigation 601 12.5%
Site not intuitive/Can't navigate the site 376 62.6%
Navigation Instructions 156 26.0%
General Navigation Issues 58 9.7%
Lack of availability due to filter selections 11 1.8%
3. Filtering 391 8.1%
Can't locate ZCTAs for ACS 137 35.0%
Filter panel is inconsistent 131 33.5%
General Filtering Issues 58 14.8%
Confusion about use of summary levels 25 6.4%
Other defects with filters 23 5.9%
Filter selection not appearing in list 11 2.8%
Unable to find Geo Components 6 1.5%
4. Download 296 6.2%
Don't like download format 126 42.6%
Download fails 73 24.7%
General download issues 64 21.6%
Bulk download capability needed 18 6.1%
Download defects 8 2.7%
Download instructions needed 7 2.4%
5. Performance 290 6.0%
Site moves slow/lags/freezes/doesn't load 128 44.1%
Support ID/Reference IDs 58 20.0%
Other performance issues 57 19.7%
White Screens 47 16.2%
6. Pseudo Geos 205 4.3%
Request more pseudos for ZCTAs 101 49.3%
Request more pseudos for tracts 36 17.6%
Request more pseudos for other geos 36 17.6%
Request more pseudos for Blocks/Block Groups 21 10.2%
Defects for pseudo geos 14 6.8%
Request more pseudos for places 4 2.0%
Other Pseudo Geos 1 0.5%
7. Printing 157 3.3%
Specifically wants PDF functionality 86 54.8%
Wants to print table or map 68 43.3%
Presentable documents to be shared or printed in full
8 5.1%
Other printing issues 1 0.6%
8. Address Search 149 3.1%
Integrated address search 149 100%
9. Search Relevancy 83 1.7%
Other search relevancy issues 57 68.7%
Disagree with table return order/Irrelevant tables
20 24.1%
Entity recognition not properly distinguishing search terms
3 3.6%
Problems with single search 2 2.4%
Tagging Issue 1 1.2%
10. Mapping 61 1.3%
Want improved functionality (i.e., draw radius using address)
36 59.0%
Don't know how to use mapping 10 16.4%
Defects with mapping 7 11.5%
Other mapping issues 7 11.5%
Total Feedback: 4801Total Top 10 Feedback: 3028Top 10 Percentage: 63.1%
56
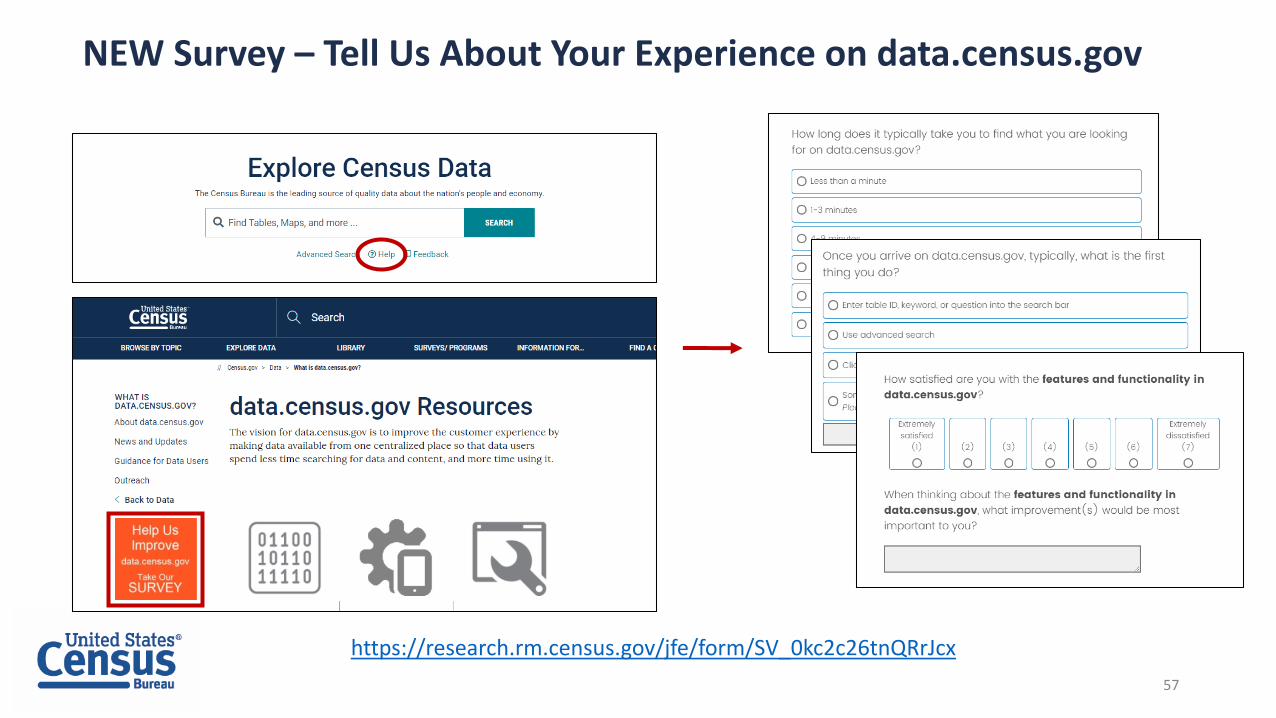
NEW Survey – Tell Us About Your Experience on data.census.gov
https://research.rm.census.gov/jfe/form/SV_0kc2c26tnQRrJcx
57

Outline
• Live Demo
• New data.census.gov Learning Resources
• Feedback (Top 10) and New Survey
• Common Questions
• Q&A
58
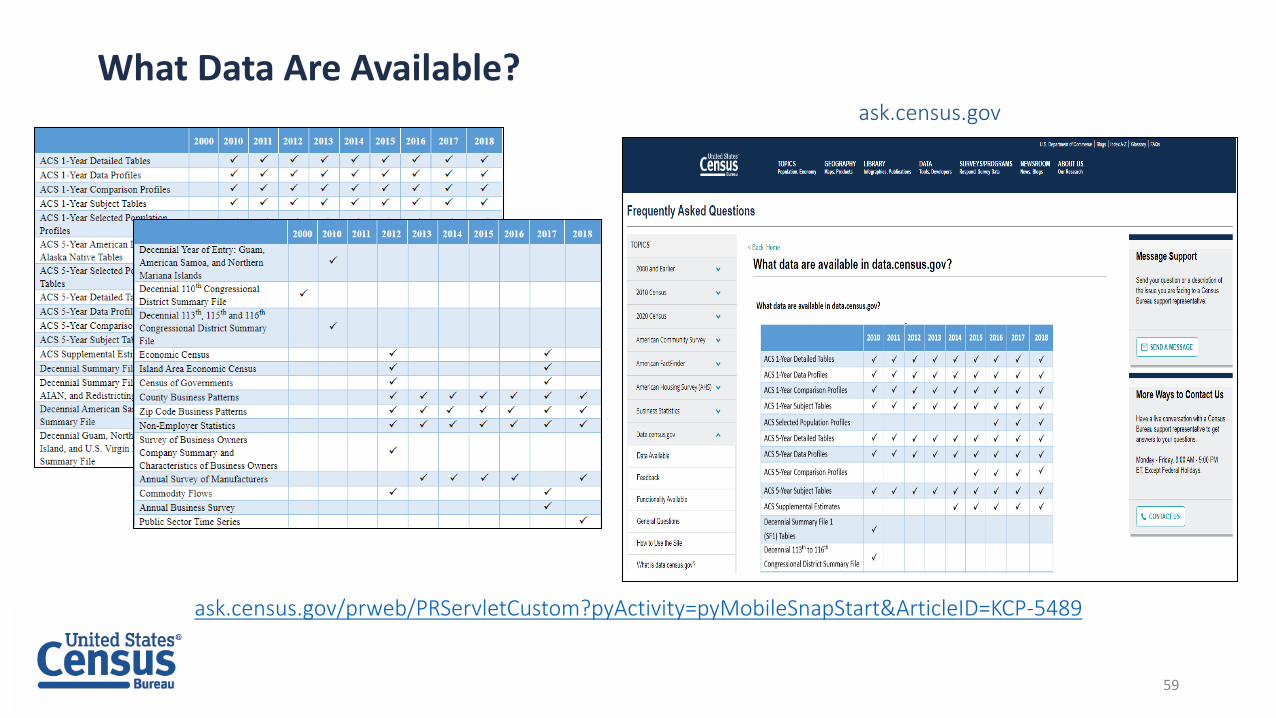
What Data Are Available?ask.census.gov
ask.census.gov/prweb/PRServletCustom?pyActivity=pyMobileSnapStart&ArticleID=KCP-5489
59
What Is the Recommended Browser?
data.census.gov works best in Google Chrome
60

Why Does My Table Not Show All of My Selected Geographies?Why Am I Unable to Select My Geography?
It is often the result of using ACS 1-year estimates instead of ACS 5-year estimates.
Click the product drop down menu and choose ACS 5-year estimates.
61
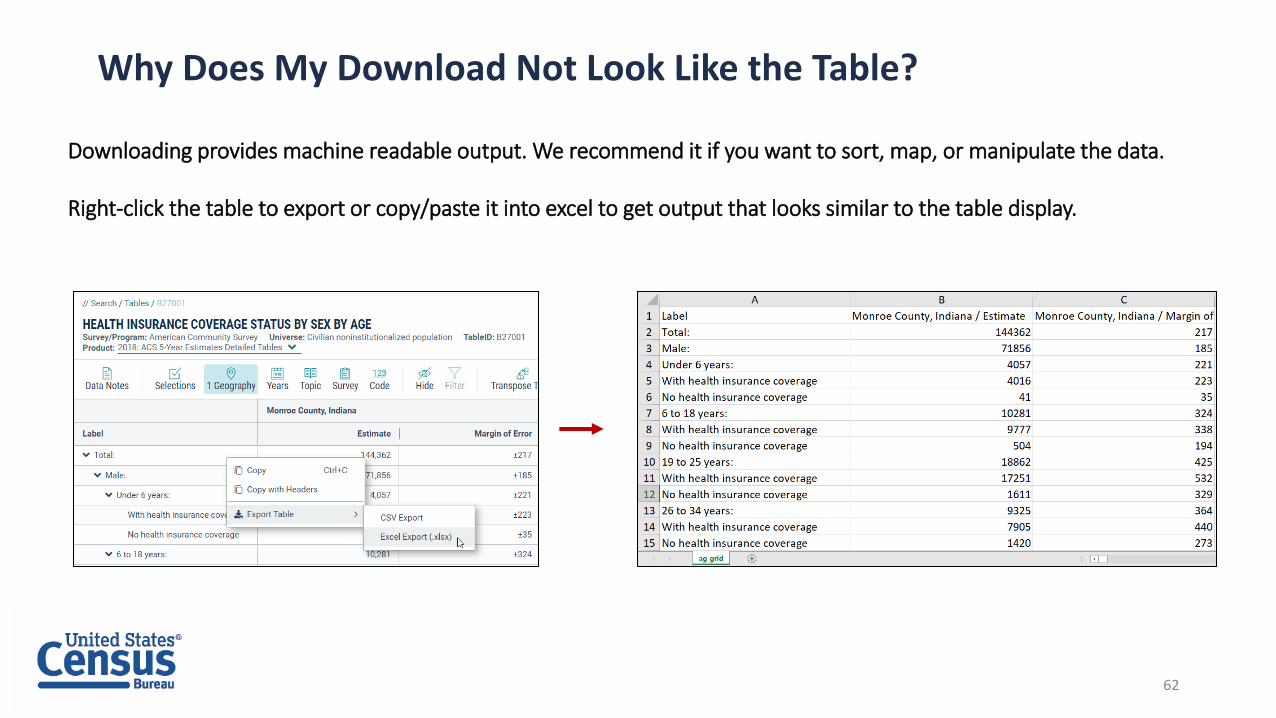
Why Does My Download Not Look Like the Table?
Downloading provides machine readable output. We recommend it if you want to sort, map, or manipulate the data.
Right-click the table to export or copy/paste it into excel to get output that looks similar to the table display.
62
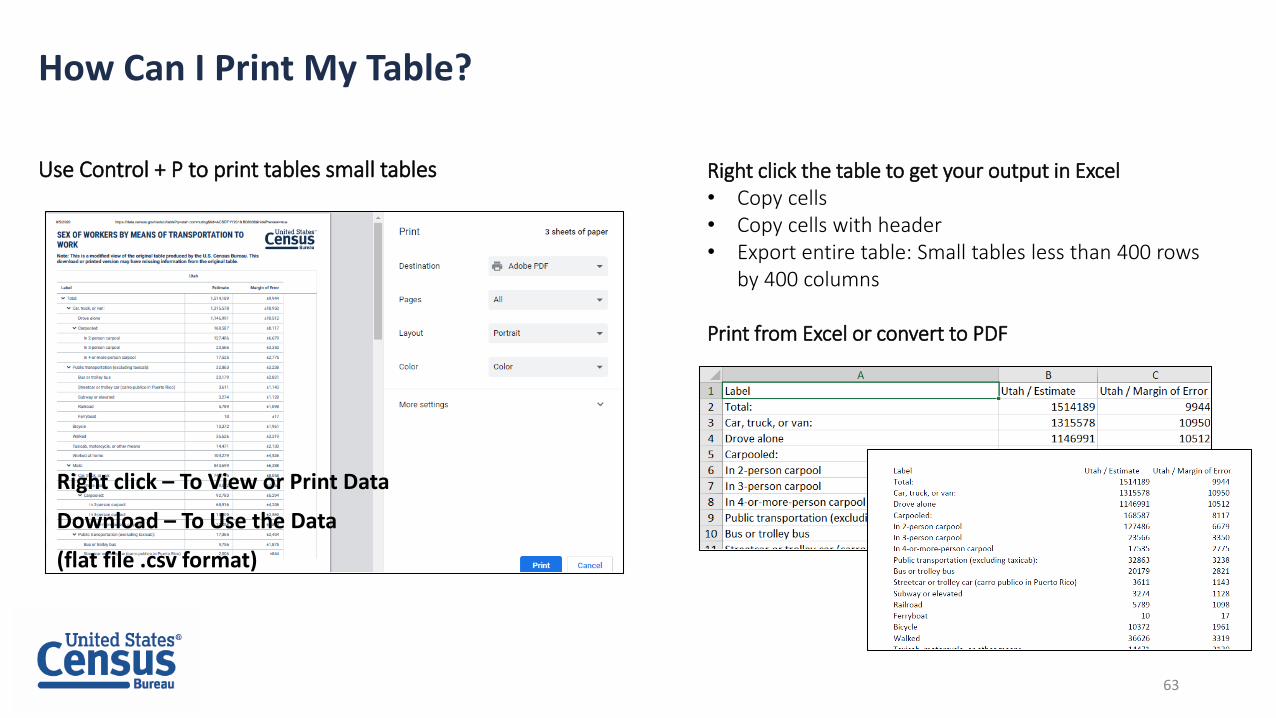
How Can I Print My Table?
Use Control + P to print tables small tables
or
Right click – To View or Print Data
Download – To Use the Data
(flat file .csv format)
Right click the table to get your output in Excel• Copy cells• Copy cells with header• Export entire table: Small tables less than 400 rows
by 400 columns
Print from Excel or convert to PDF
63
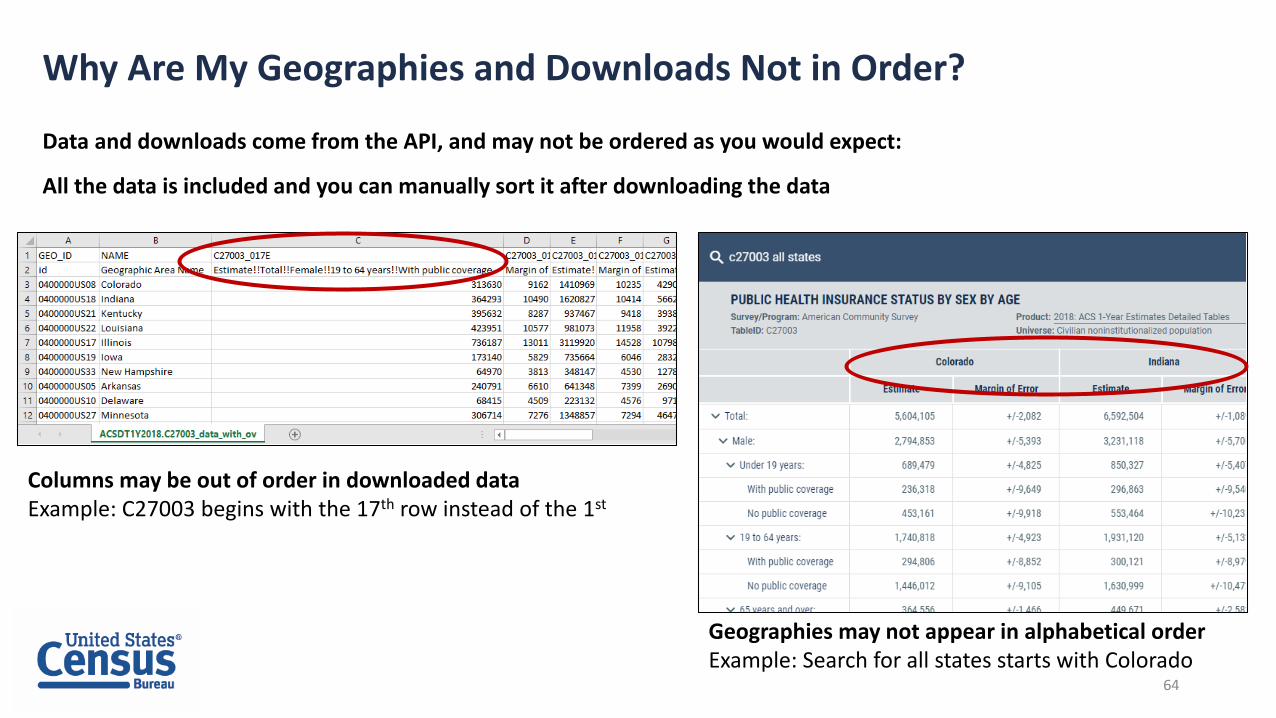
Why Are My Geographies and Downloads Not in Order?
Data and downloads come from the API, and may not be ordered as you would expect:
All the data is included and you can manually sort it after downloading the data
Geographies may not appear in alphabetical orderExample: Search for all states starts with Colorado
Columns may be out of order in downloaded dataExample: C27003 begins with the 17th row instead of the 1st
64

Where Are the Checkboxes to Select All Geos in a List?
We do not have all the collections that American FactFinder had. While we work to add them:
• Use maps on data.census.gov to select individual geographies or small groupings
• Use FTP sites or API -- Guides on how to access these data through the API are available on our Resource Page at: census.gov/data/what-is-data-census-gov.html
• Tell us what collections you would like to see by emailing [email protected]
65
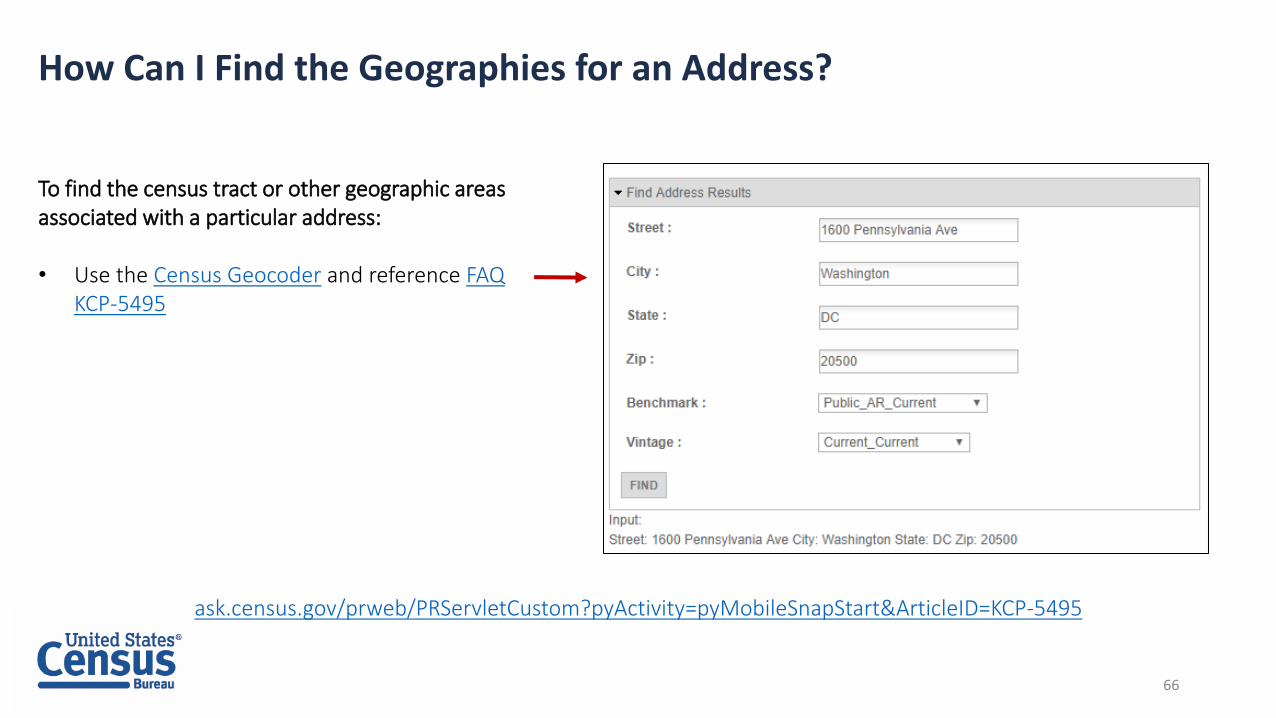
How Can I Find the Geographies for an Address?
To find the census tract or other geographic areas associated with a particular address:
• Use the Census Geocoder and reference FAQ KCP-5495
ask.census.gov/prweb/PRServletCustom?pyActivity=pyMobileSnapStart&ArticleID=KCP-5495
66

Questions
Media:
Public Information Office
U.S. Census Bureau
301-763-3030
Public:
Center for Enterprise Dissemination
U.S. Census Bureau
67

NEW Survey – Tell Us About Your Experience on data.census.gov
https://research.rm.census.gov/jfe/form/SV_0kc2c26tnQRrJcx
68

Microdata Access on data.census.gov/mdat
You can use microdata access on data.census.gov/mdat to create custom tables. Learn more at:census.gov/data/what-is-data-census-gov/guidance-for-data-users/how-to-materials-for-using-the-microdata-access.html
69
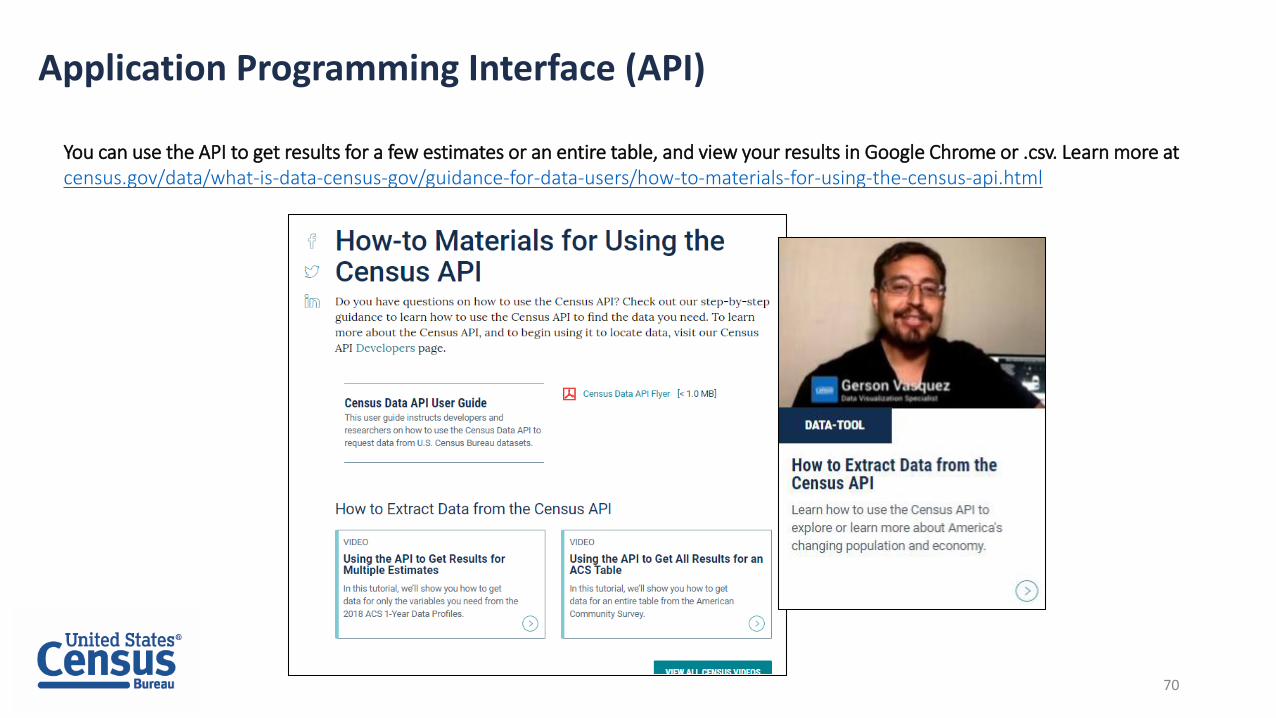
Application Programming Interface (API)
You can use the API to get results for a few estimates or an entire table, and view your results in Google Chrome or .csv. Learn more atcensus.gov/data/what-is-data-census-gov/guidance-for-data-users/how-to-materials-for-using-the-census-api.html
70
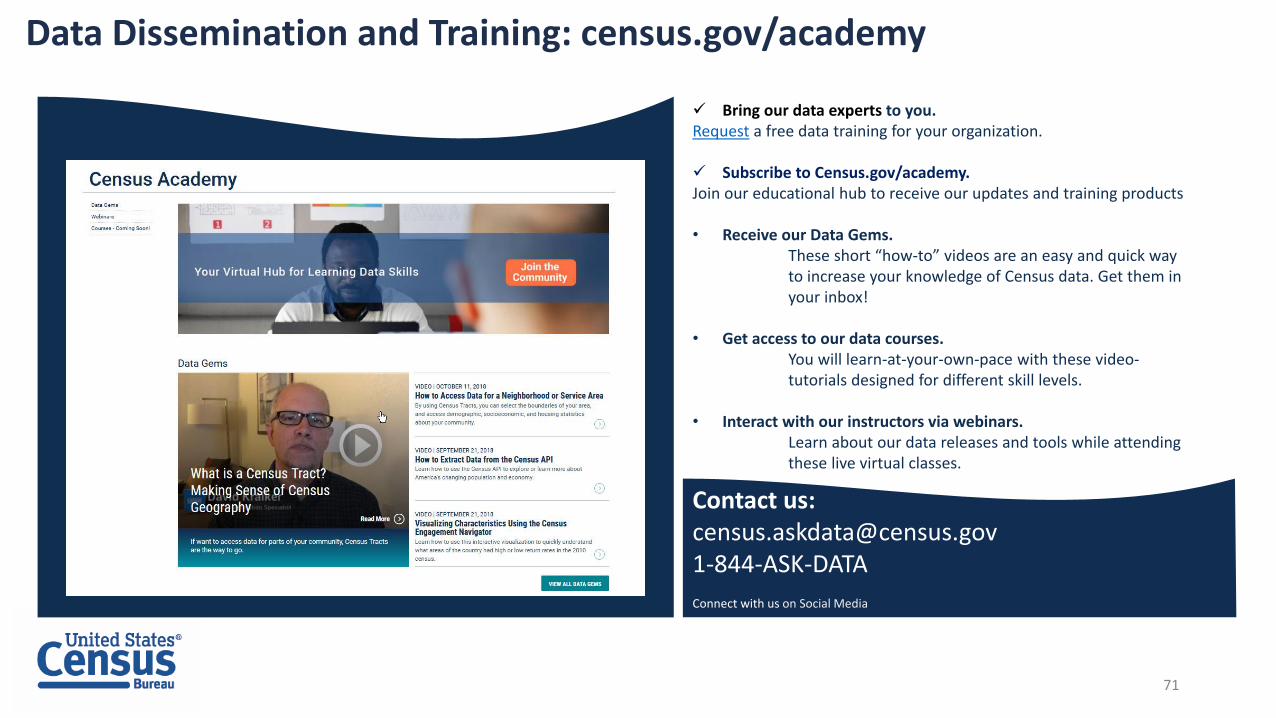
Data Dissemination and Training: census.gov/academy
Bring our data experts to you.Request a free data training for your organization.
Subscribe to Census.gov/academy.Join our educational hub to receive our updates and training products
• Receive our Data Gems.These short “how-to” videos are an easy and quick way to increase your knowledge of Census data. Get them in your inbox!
• Get access to our data courses.You will learn-at-your-own-pace with these video-tutorials designed for different skill levels.
• Interact with our instructors via webinars. Learn about our data releases and tools while attending these live virtual classes.
Contact us:[email protected]
Connect with us on Social Media
71
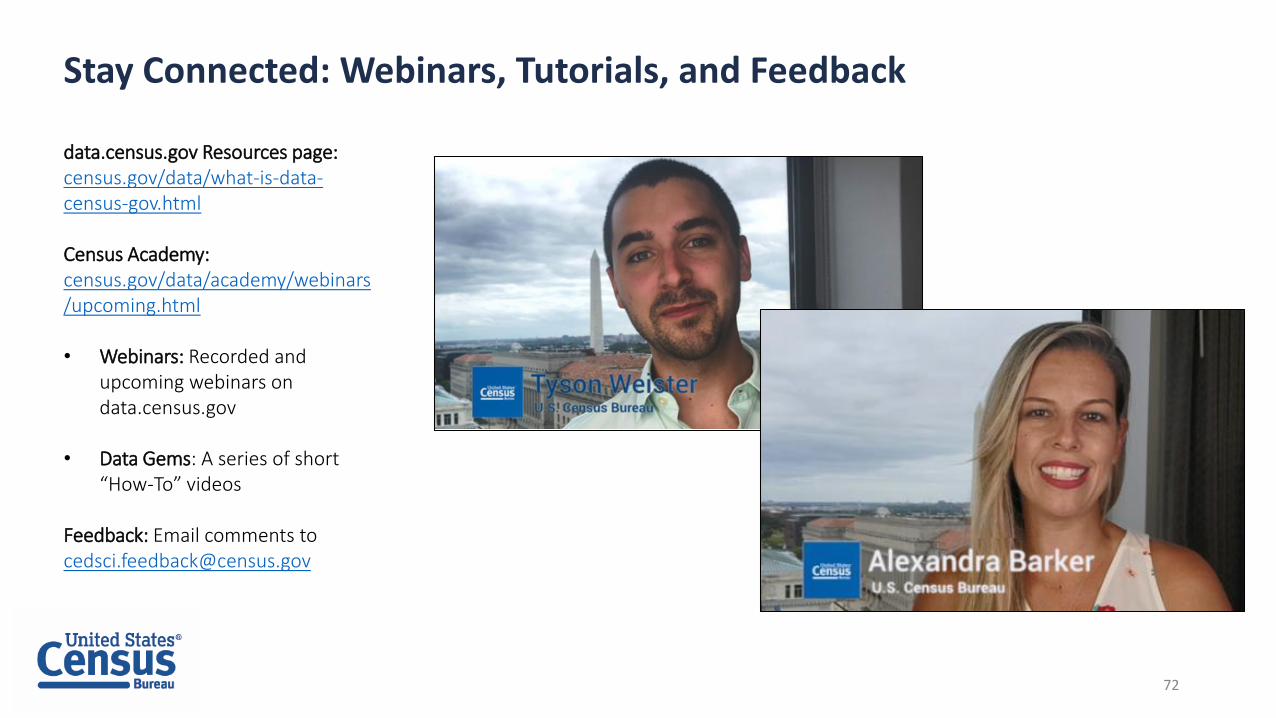
Stay Connected: Webinars, Tutorials, and Feedback
data.census.gov Resources page:census.gov/data/what-is-data-census-gov.html
Census Academy:census.gov/data/academy/webinars/upcoming.html
• Webinars: Recorded and upcoming webinars on data.census.gov
• Data Gems: A series of short “How-To” videos
Feedback: Email comments to [email protected]
72