data science: origins, methods, challenges and the future?
TRANSCRIPT

Data science:
Origins, methods,
challenges & the future?CAGATAY TURKAY,
giCentre, City University London
City Unrulyversity, 18 March 2015
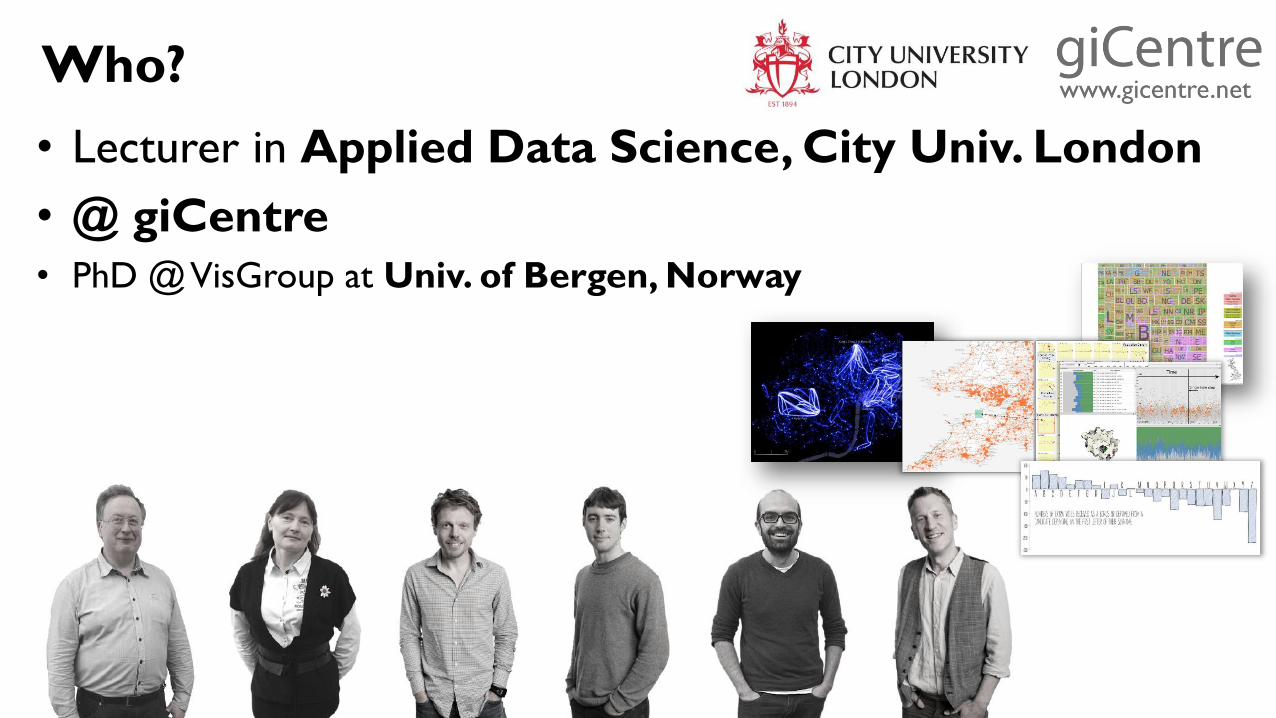
Who?
• Lecturer in Applied Data Science, City Univ. London
• @ giCentre
• PhD @ VisGroup at Univ. of Bergen, Norway

Research on …
Methods for
Interactive VisualData Analysis
WHAT IS
DATA SCIENCE?

Somes example first – Google Flu Trends
http://www.google.org/flutrends/
Ginsberg, Jeremy, et al. "Detecting influenza epidemics using search engine query data." Nature 457.7232 (2008): 1012-1014.
Video: http://goo.gl/4ysAmw
Google says ..
.. relationship between how
many people search for flu-
related topics and how many
people actually have flu
symptoms. … to estimatehow much flu is circulating ….

The Shortest Path to Happiness:
Recommending Beautiful, Quiet,
and Happy Routes in the City
Quercia, Daniele, Rossano Schifanella, and Luca Maria Aiello. ACM
conference on Hypertext and social media, 2014.
http://urbangems.org/
Data science is a systematic study
of generalizable extraction of
knowledge from data
From “Data Science and Prediction” by Vasant Dhar, Communications of the ACM, 2013
Data science is a process starting with
formulating a question that can be answered with
data, and iteratively collecting, cleaning,
analysing and modelling the data, while
communicating the answers to the relevant
audience along this iteration.

On the origins ..
Term coined by William S. Cleveland in 2001[*]
…knowledge among computer scientists about how to think
of and approach the analysis of data is limited, just as the
knowledge of computing environments by statisticians is limited.
A merger of the knowledge bases would produce a powerful
force for innovation.
[*] Cleveland, William S. "Data science: an action plan for expanding the technical areas of the field of statistics.“, (2001)

By Capgemini Consulting, http://www.slideshare.net/capgemini/impact-of-big-data-on-analytics

Data scientist ?
• Sexiest job of the 21st century, according to Harvard Business Review, 2012
• A data scientist is many people in one, someone:
– who understands domain (industry/academia) needs and
terminology
– who is able to mash-up several analytical tools
– who is able to design and implement solutions to extract
knowledge from the data
– who can communicate findings

On data analysts – analyst types

On data analysts – skills vs. types
DATA SCIENCE PROCESS
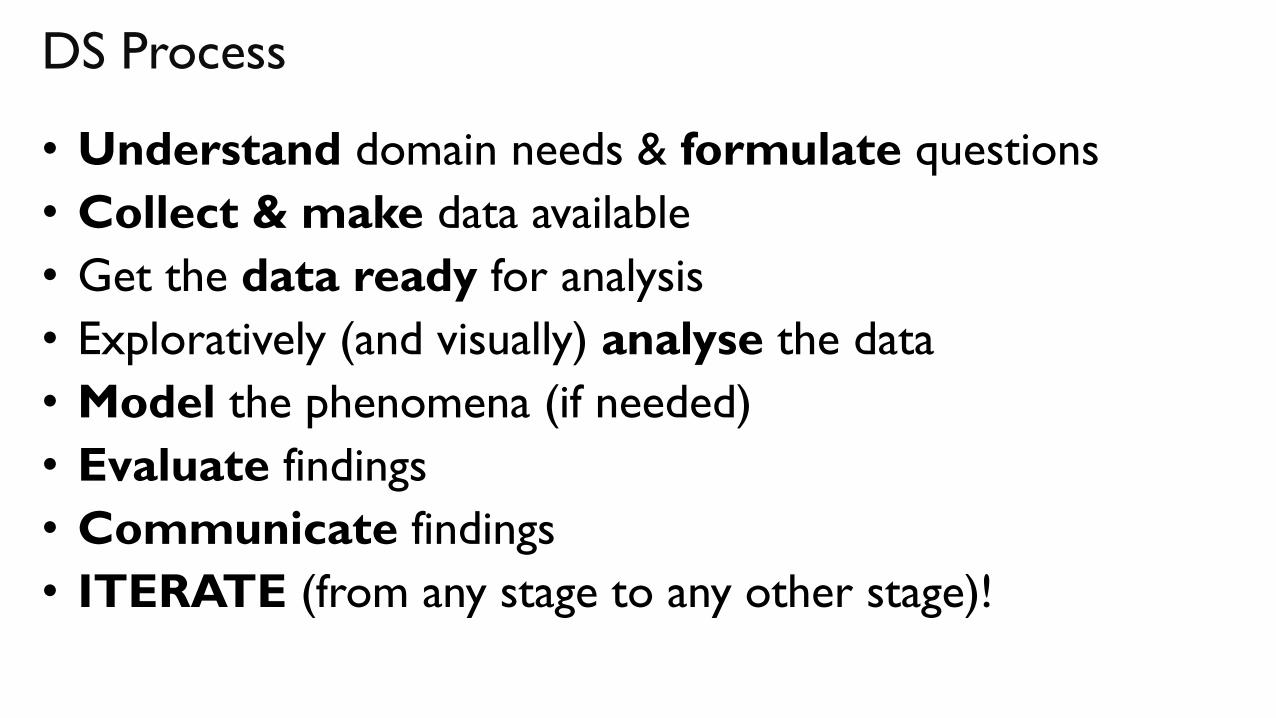
DS Process
• Understand domain needs & formulate questions
• Collect & make data available
• Get the data ready for analysis
• Exploratively (and visually) analyse the data
• Model the phenomena (if needed)
• Evaluate findings
• Communicate findings
• ITERATE (from any stage to any other stage)!
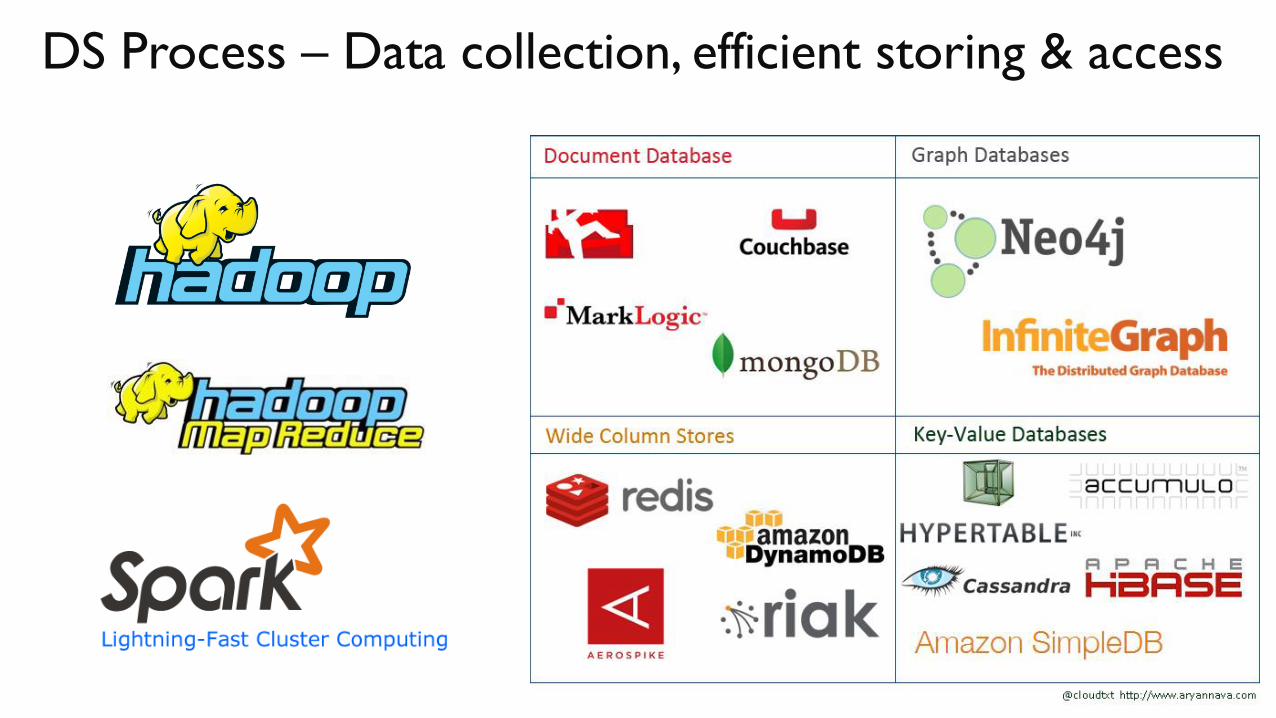
DS Process – Data collection, efficient storing & access
DS Process – Getting data ready
Many names:
Data wrangling,
data munging,
data cleaning,
data massaging,
data scrubbing,
pre-processing, ….
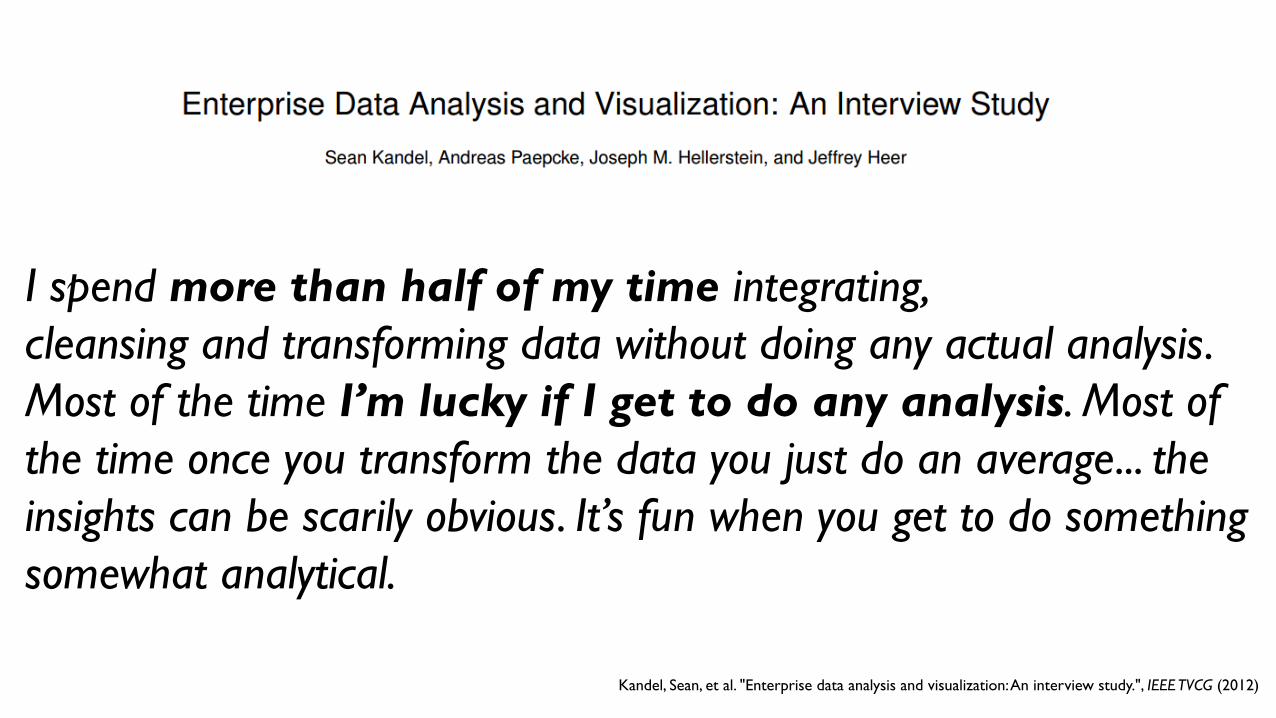
I spend more than half of my time integrating,
cleansing and transforming data without doing any actual analysis.
Most of the time I’m lucky if I get to do any analysis. Most of
the time once you transform the data you just do an average... the
insights can be scarily obvious. It’s fun when you get to do something
somewhat analytical.
Kandel, Sean, et al. "Enterprise data analysis and visualization: An interview study.", IEEE TVCG (2012)

DS Process – (Exploratively) Analysing data
Goal: Generate / confirm ideas, findings (hypotheses)
• Analysis tasks:
– Finding anomalies
– Finding relations
– Finding groups
– Summarizing information
– Making predictions
– Understanding uncertainties
– Evaluate hypotheses

DS Process – Build models
• Statistical models
– For summarising, representing data
– For predictions, estimations
• Machine learning methods, e.g., neural networks
– Predictive tasks
– Classification tasks
– Unsupervised / supervised models
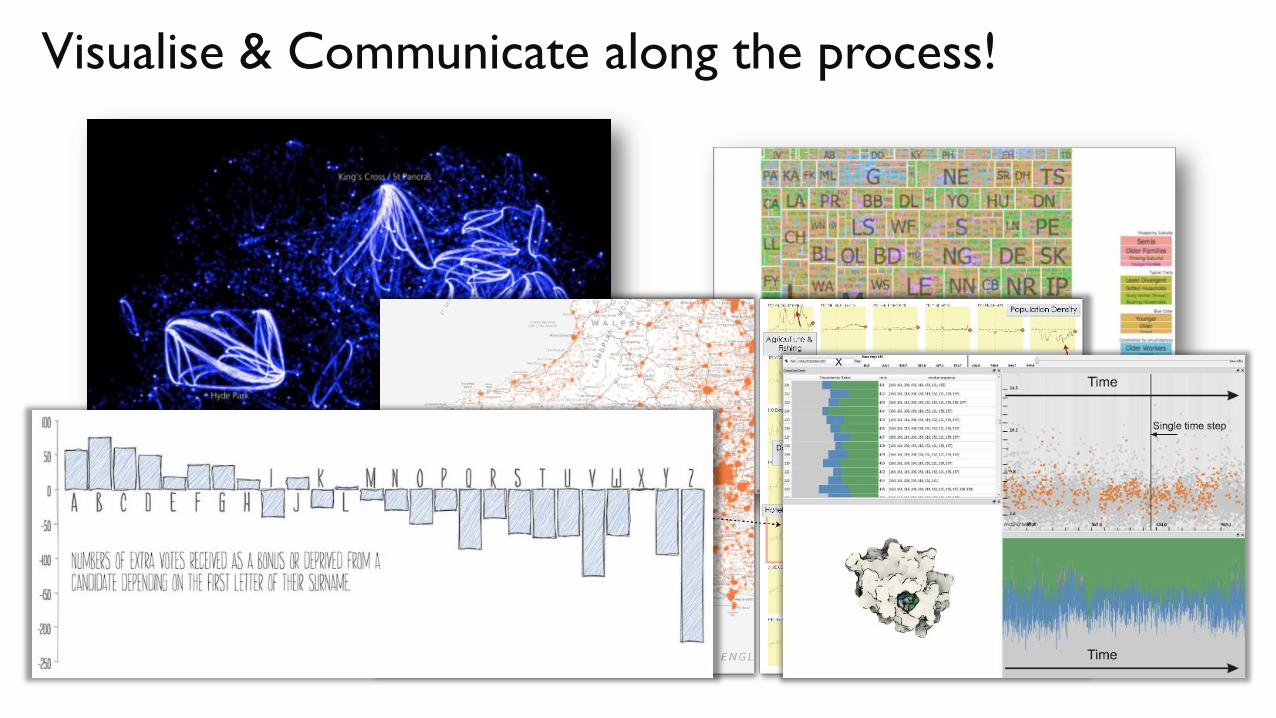
Visualise & Communicate along the process!

ITERATE !

(SOME) CHALLENGES

HETEROGENOUS DATA

+
Text
Material by Tamara Munzner, http://www.cs.ubc.ca/~tmm/talks.html#minicourse14
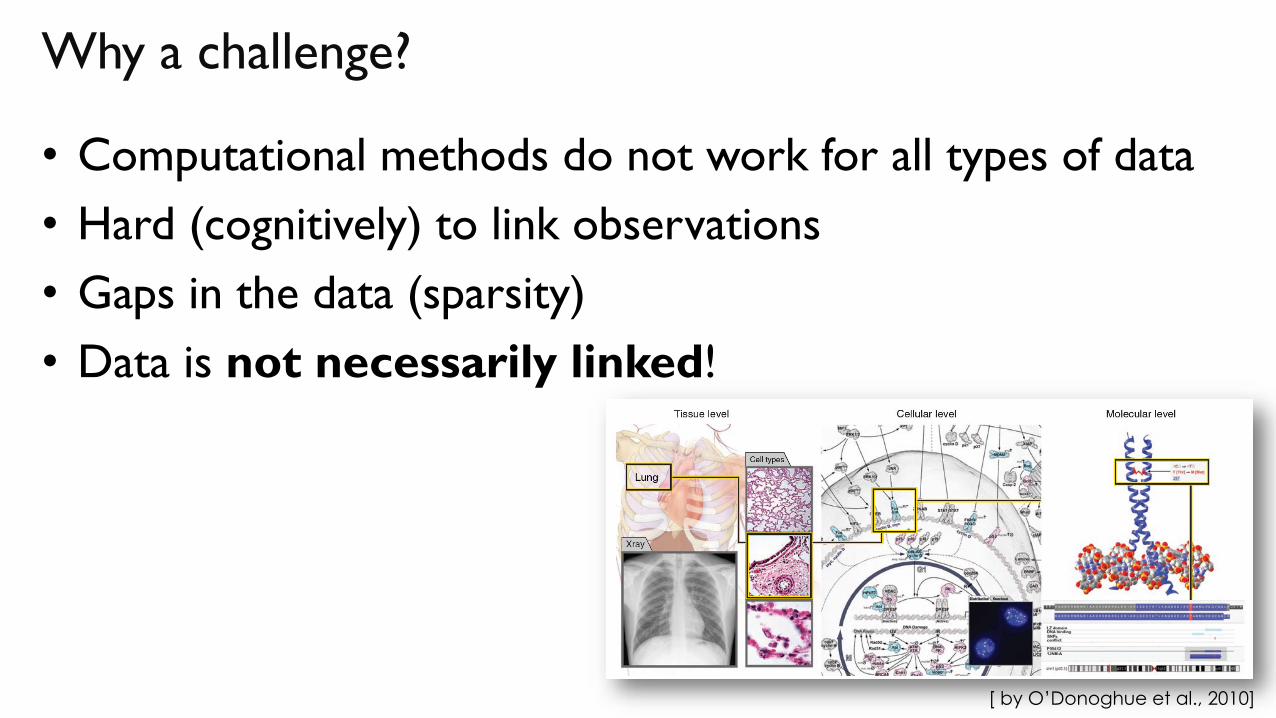
Why a challenge?
• Computational methods do not work for all types of data
• Hard (cognitively) to link observations
• Gaps in the data (sparsity)
• Data is not necessarily linked!
[ by O’Donoghue et al., 2010]

BREADTH OF DATA


Why a challenge?
• Models become complex!
• Hard to interpret and utilise
• Less reliable findings, high uncertainy
Image from: http://www.visiondummy.com/2014/04/curse-dimensionality-affect-classification/
The curse of dimensionality

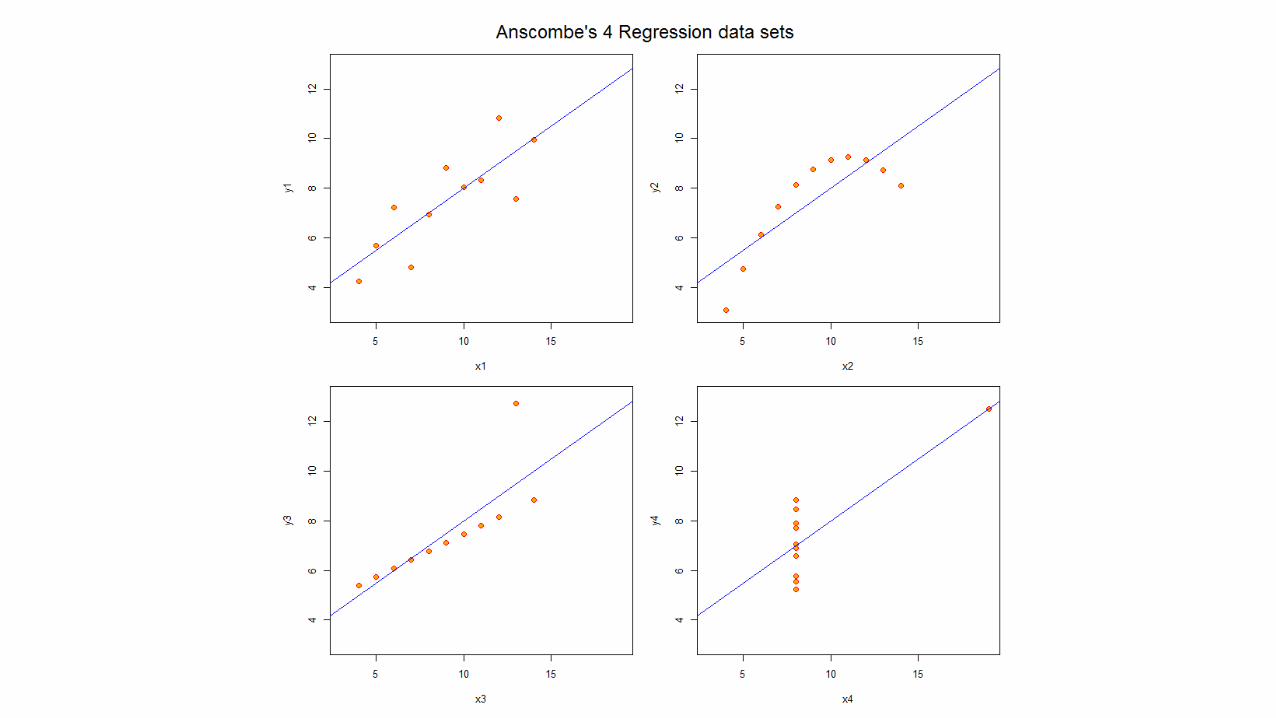
IMPERFECT DATA

This is a straight line that “connects the dots”, i.e., best fits the points.
Small exercise
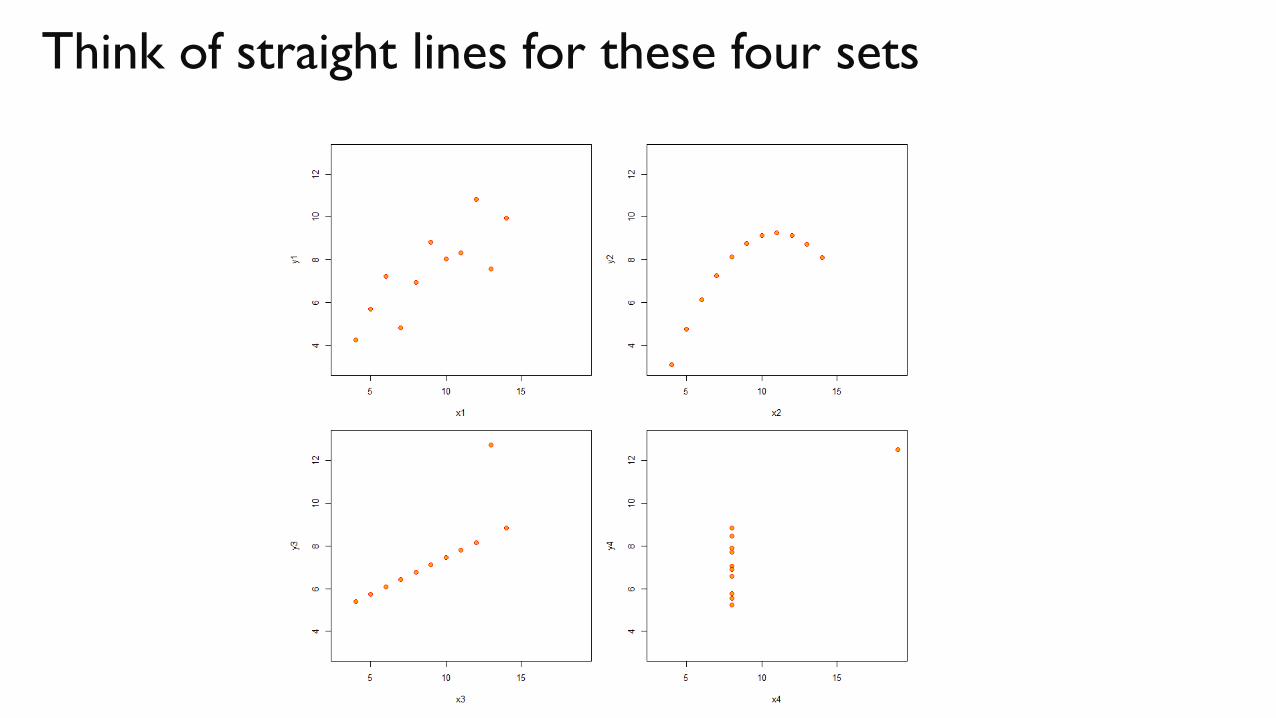
Think of straight lines for these four sets
DYNAMIC
DATA (& CONCEPTS)
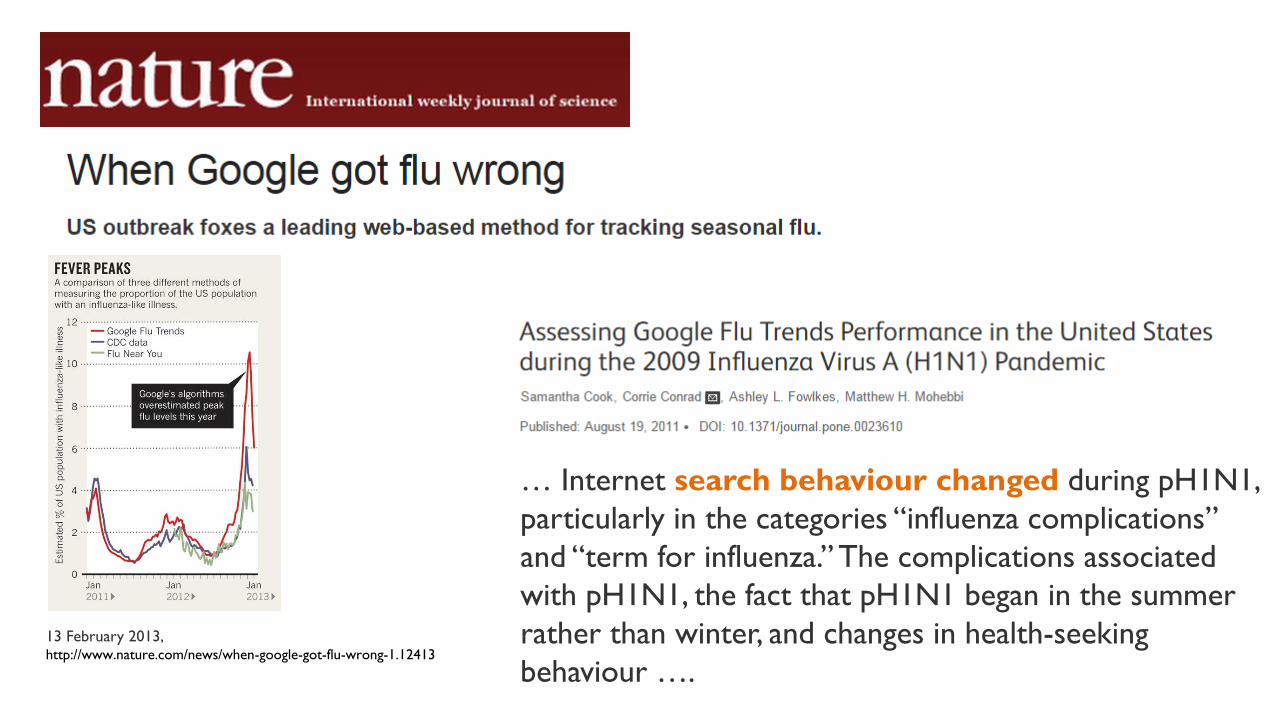
… Internet search behaviour changed during pH1N1,
particularly in the categories “influenza complications”
and “term for influenza.” The complications associated
with pH1N1, the fact that pH1N1 began in the summer
rather than winter, and changes in health-seeking
behaviour ….
13 February 2013,http://www.nature.com/news/when-google-got-flu-wrong-1.12413
GENERATING
PLAUSABLE & USEFUL
HYPOTHESES

http://www.tylervigen.com/

HOW WE (TRY TO) DEAL WITH
THESE? -- EXAMPLES


STUDY 1 – MULTIVARIATE GEOGRAPHICAL DATA
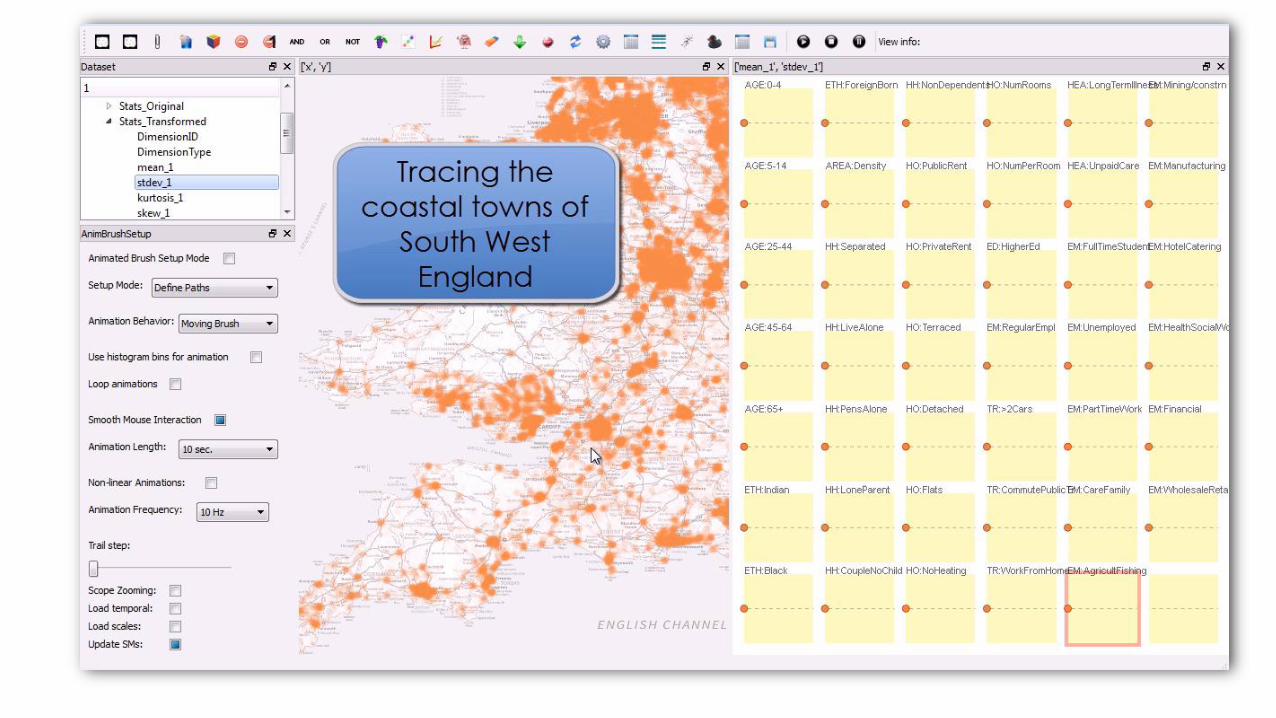
Attribute
Signatures:
Dynamic Visual
Summaries for
Analyzing Multivariate
Geographical Data
Cagatay Turkay, Aidan Slingsby,
Helwig Hauser, Jo Wood, Jason
Dykes, InfoVis 2014
UK Census of Population in 2001 and 2011 for the
181,000 Output Areas (OA)
for 41 indicators
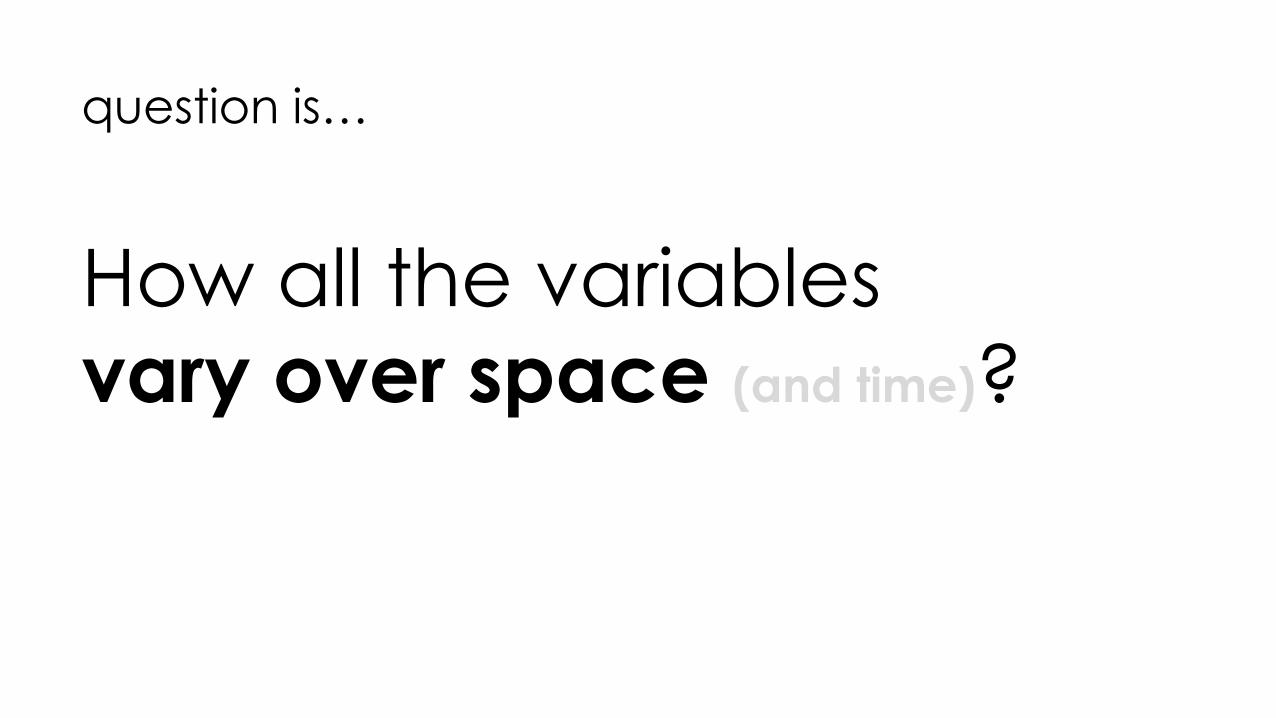
How all the variables
vary over space (and time)?
question is…
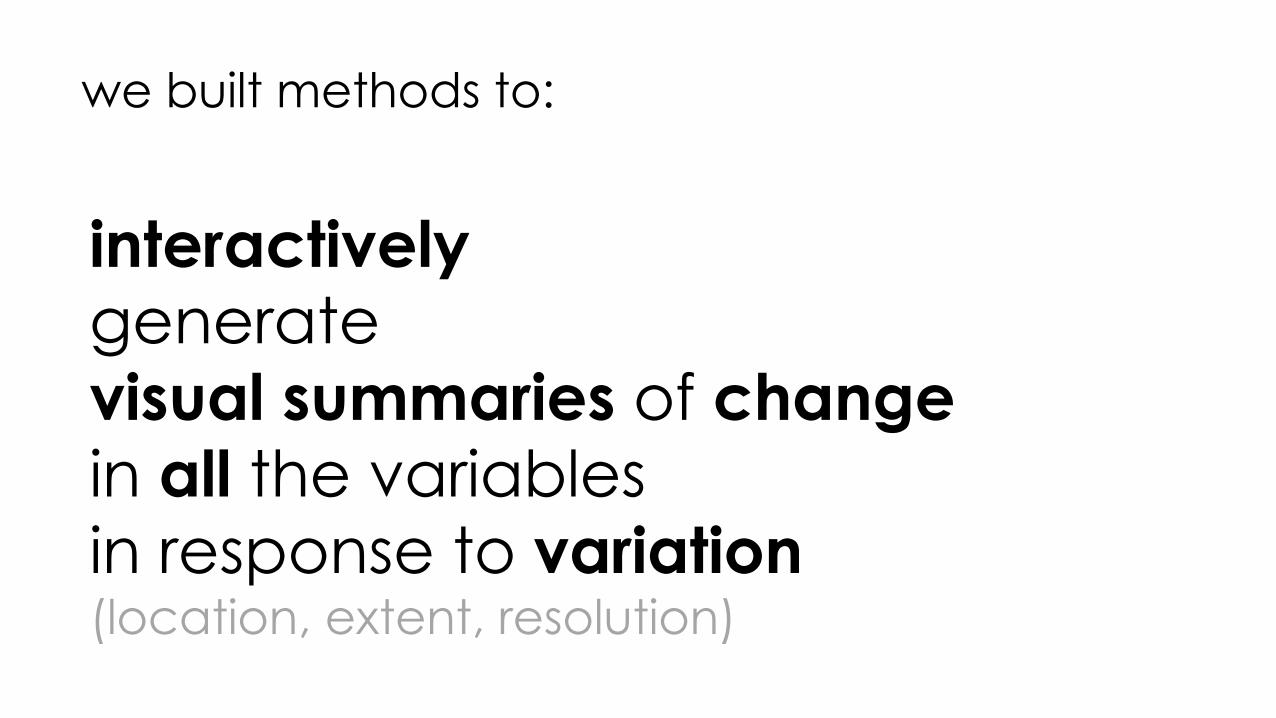
interactivelygenerate
visual summaries of change
in all the variables
in response to variation(location, extent, resolution)
we built methods to:
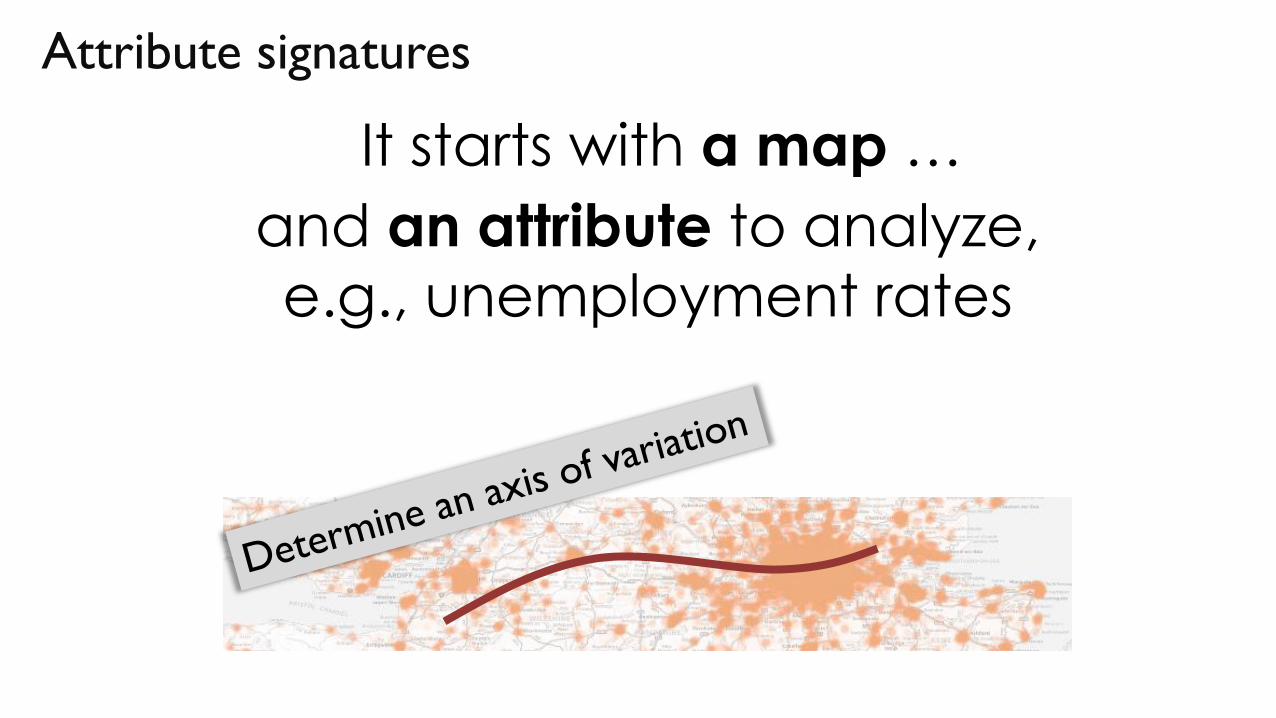
Attribute signatures
It starts with a map …
and an attribute to analyze,
e.g., unemployment rates

Attribute signatures
Above baseline

Attribute signatures
~ baseline (country average)
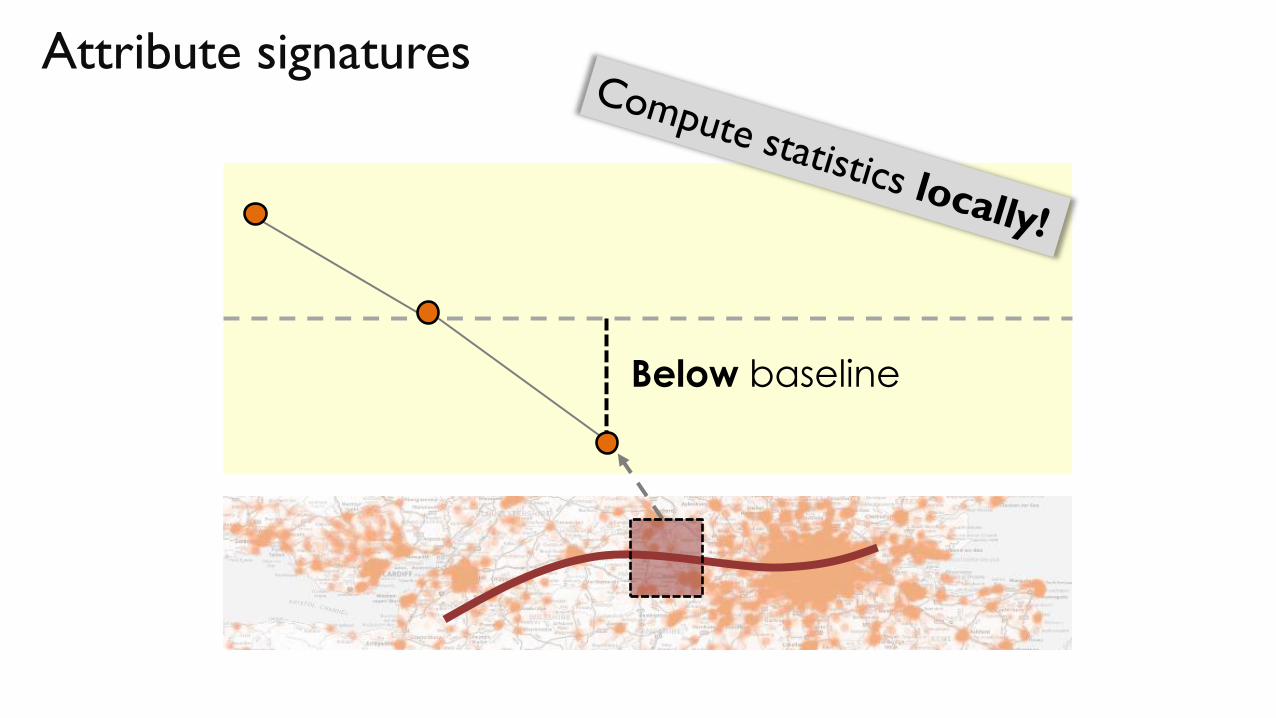
Attribute signatures
Below baseline

Attribute signatures

Attribute signatures
A dynamically generated
visual summary!

How about several attributes?
Linked
small
multiples
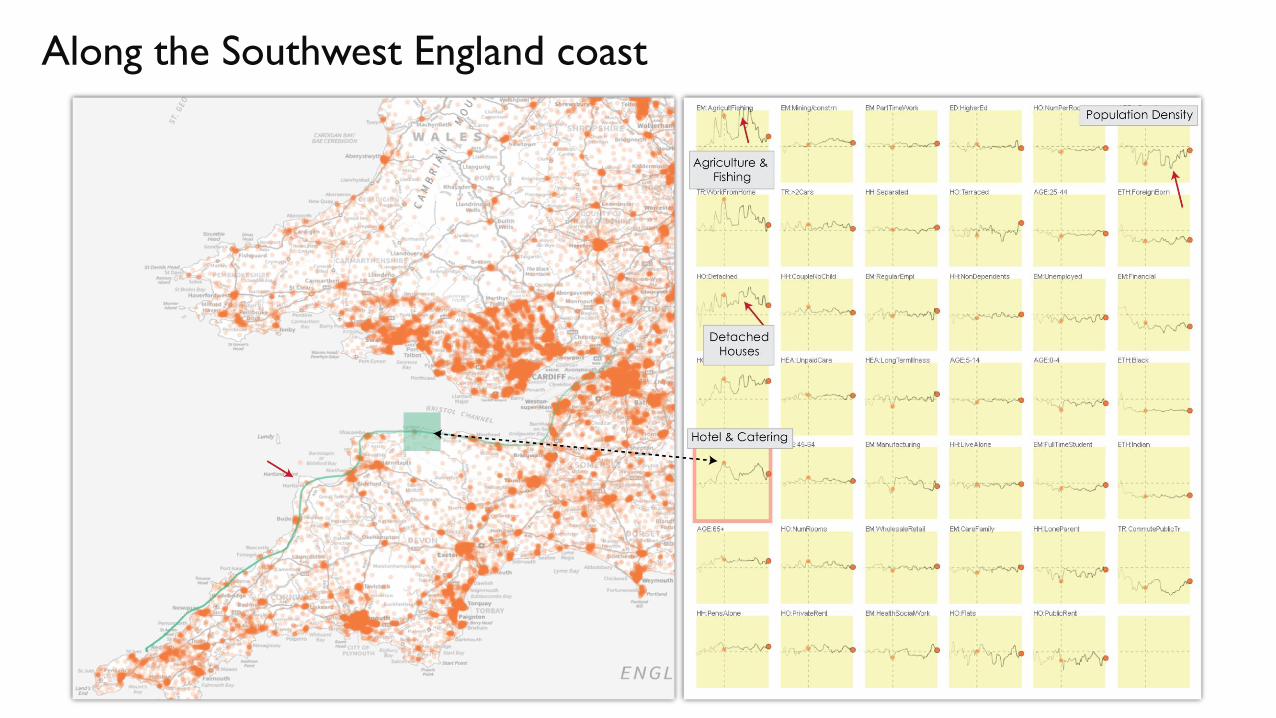
Along the Southwest England coast
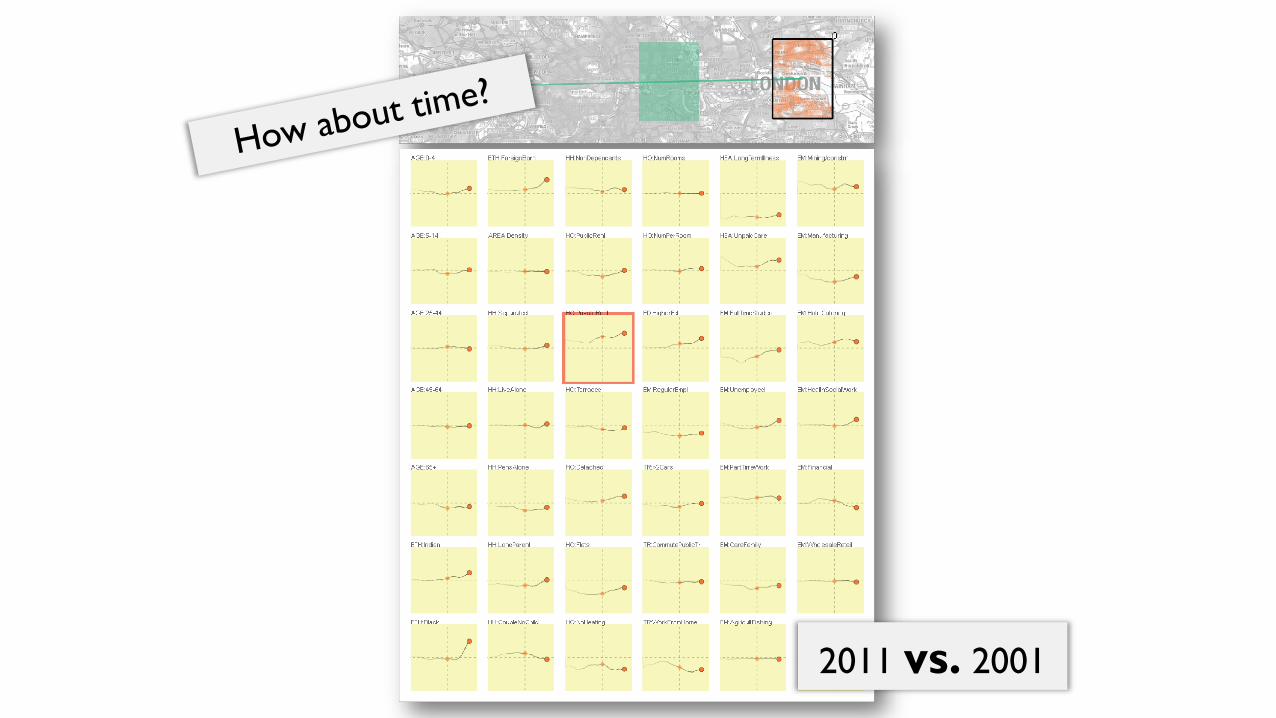
2011 vs. 2001
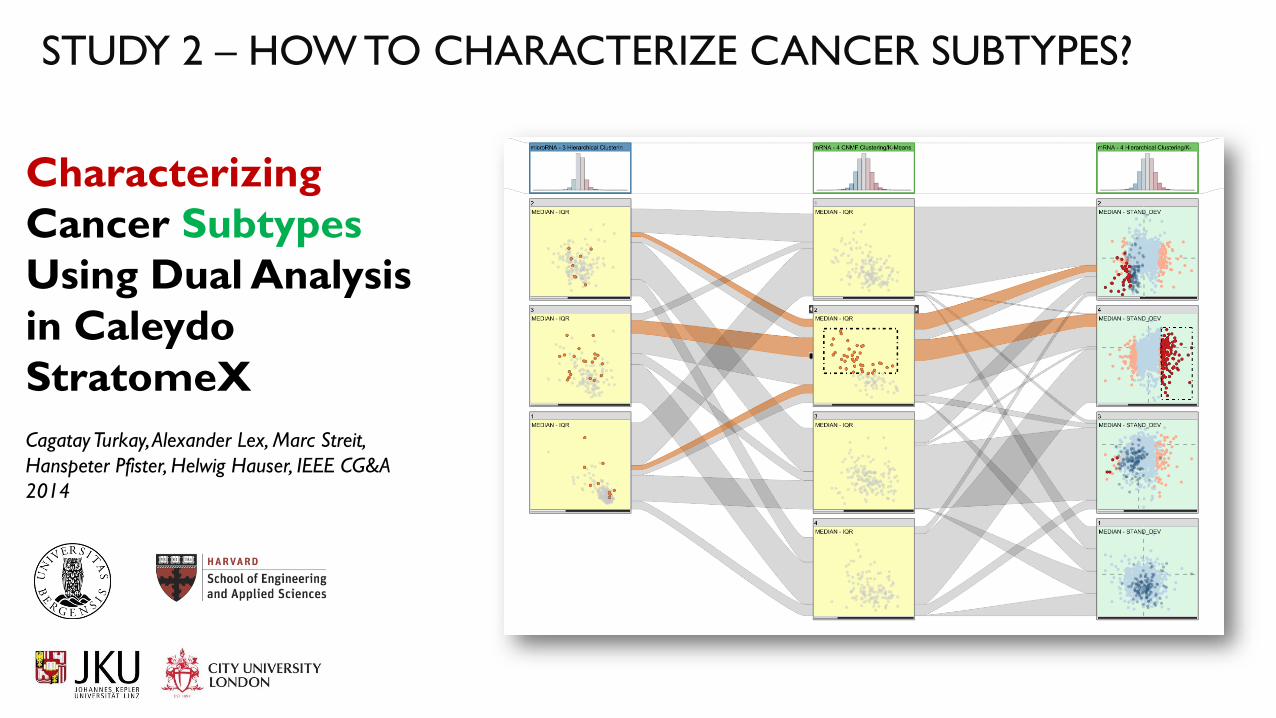
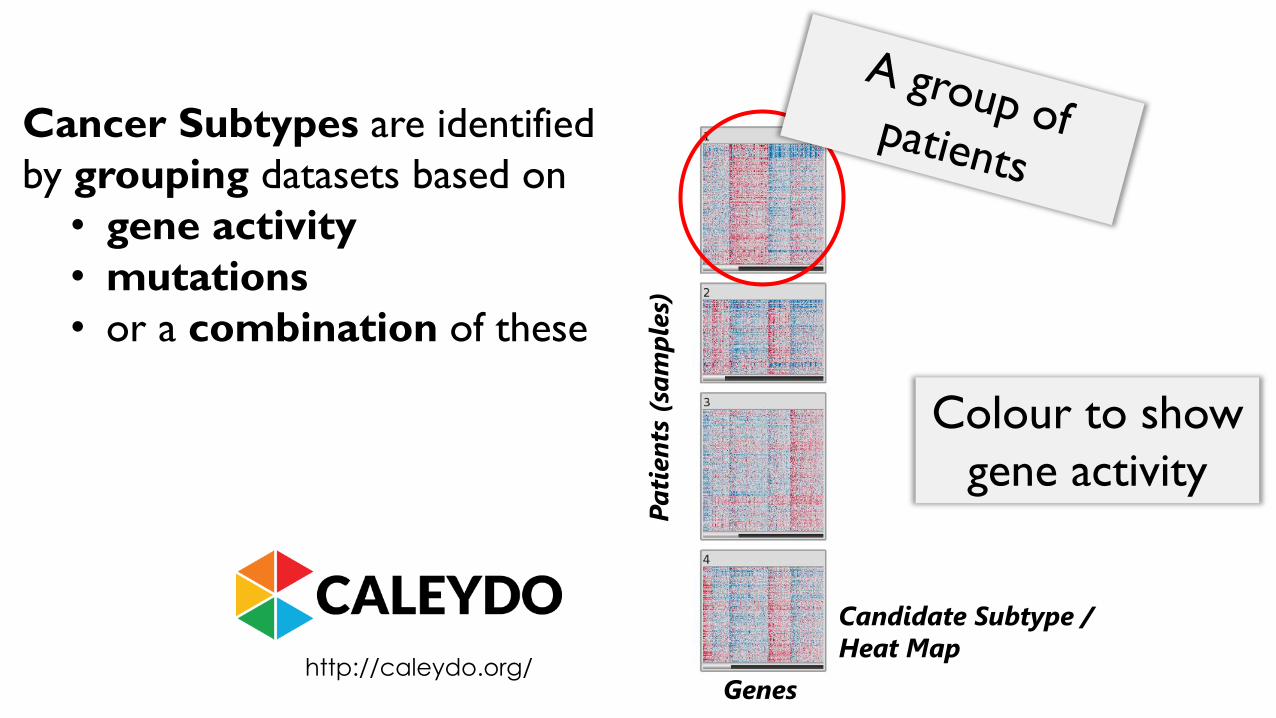
STUDY 2 – HOW TO CHARACTERIZE CANCER SUBTYPES?
Characterizing
Cancer Subtypes
Using Dual Analysis
in Caleydo
StratomeX
Cagatay Turkay, Alexander Lex, Marc Streit,
Hanspeter Pfister, Helwig Hauser, IEEE CG&A
2014
Pa
tien
ts (
sam
ple
s)Genes
Candidate Subtype /
Heat Map
Cancer Subtypes are identified
by grouping datasets based on
• gene activity
• mutations
• or a combination of these
http://caleydo.org/
Colour to show
gene activity
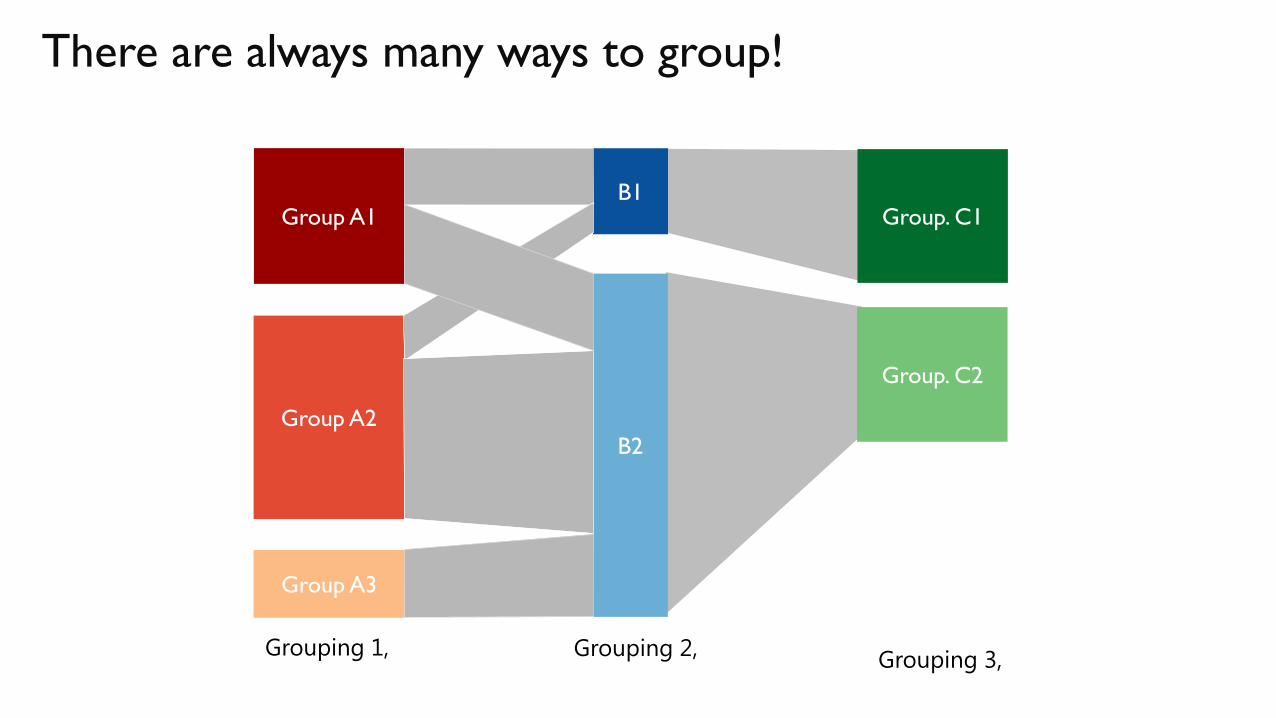
There are always many ways to group!
Group A1
Group A2
Group A3
B1
B2
Grouping 3,
Group. C1
Group. C2
Grouping 1, Grouping 2,

What are the groups & Why?
Many shared Patients
Clustering 1 Clustering 2
Sample OverlapsG
en
e O
verl
ap
s ??
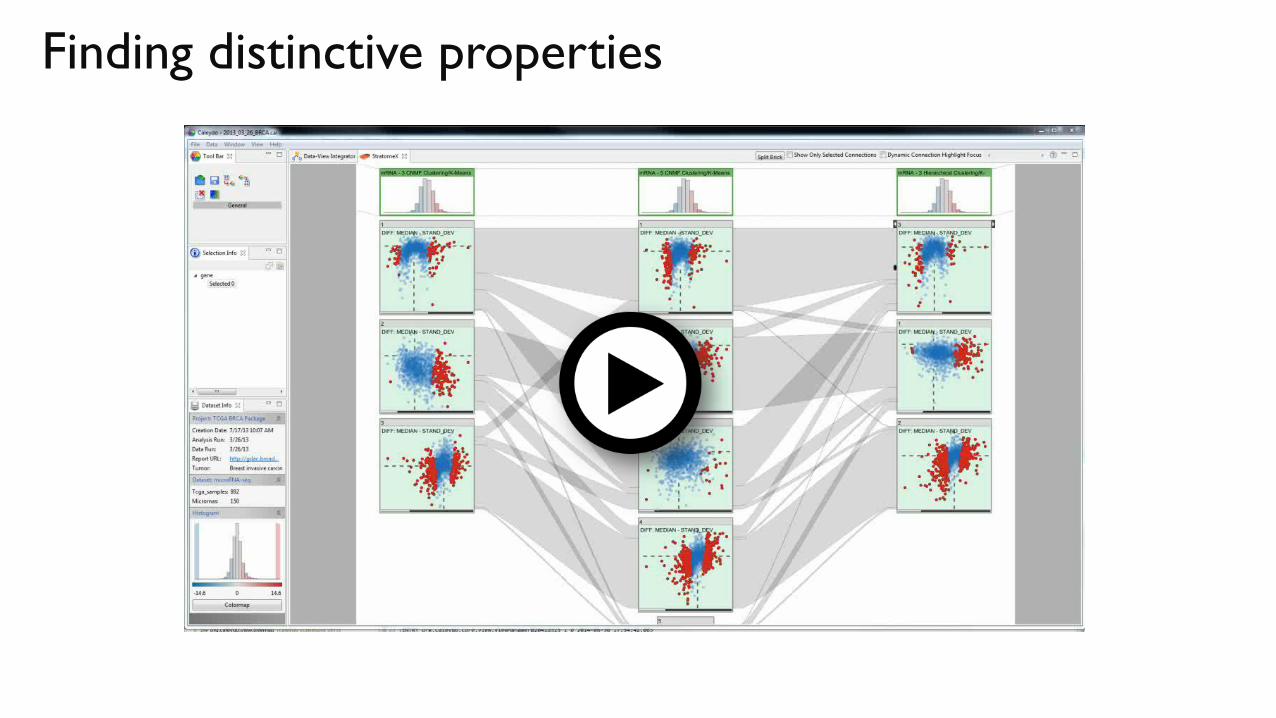
Finding distinctive properties
VISUAL ANALYSIS
TO FACILITATE THE
ITERATIVE PROCESS &
HYPOTHESES GENERATION
Some remarks on Future
• Infrastructure & speed – better solutions?
• More on “Value of the data”
• More sophisticated analyses
• Predictive analytics on the rise
• More central role for the user (through visualisation)
• New sources of data
– Increasingly you! , health apps, etc.
– Internet of things

Data science is a process starting with
formulating a question that can be answered with
data, and iteratively collecting, cleaning,
analysing and modelling the data, while
communicating the answers to the relevant
audience along this iteration.
To conclude ….

Some technologies (we use in teaching DS)
• Python
• Pandas for Statistical Computing
• Scikit-learn for machine learning
• R Statistical Computation Software
• Apache Spark
• Tableau Software

Further reading …

Thank you !
@cagatay_turkay
http://staff.city.ac.uk/cagatay.turkay.1/ More data science?
Data Science MSc @ CITY