data resource guide - bureau of primary health...
TRANSCRIPT

U.S. DEPARTMENT OF HEALTH AND HUMAN SERVICES Health Resources and Services Administration
Bureau of Primary Health Care Health Center Program
Data Resource Guide
Resource for Completing Form 9: Need for Assistance (NFA) Worksheet
2016

Contents
How to Use the Data Resource Guide .................................................................................... 4
Data Resources for Individual Indicators............................................................................... 6
Section I: Core Barriers .......................................................................................................... 6
1. Population to One FTE Primary Care Physician....................................................................... 6
a) Health Professional Shortage Area (HPSA) Data Instructions ........................................... 7
b) Primary Care Service Area (PCSA) Level Data Instructions............................................... 9
2 & 3: Percent of Population Below 200% FPL and Percent of Population Uninsured .........10
4: Distance (miles) or Travel Time (minutes) to the Nearest Primary Care Provider Accepting New Medicaid Patients and Uninsured Patients .................................................11
Section II: Core Health Indicators .........................................................................................12
1. Diabetes ..........................................................................................................................................13
2. Cardiovascular Disease ...................................................................................................................16
3. Cancer .............................................................................................................................................20
4. Prenatal and Perinatal Health.........................................................................................................24
5. Child Health.....................................................................................................................................29
6. Behavioral Health............................................................................................................................31
Section III: Other Health and Access Indicators ..................................................................33
1. Age-adjusted Death Rate (per 100,000) .........................................................................................33
2. HIV Infection Prevalence.................................................................................................................34
3. Percent Elderly ................................................................................................................................ 35
4. Adult Asthma Hospital Admission Rate ..........................................................................................35
5. Chronic Obstructive Pulmonary Disease Hospital Admission Rate ................................................36
6. Influenza and Pneumonia Death Rate (3 year average) .................................................................36
7. Adult Current Asthma Prevalence ..................................................................................................37
Page | 2 NFA Data Resource Guide

8. Age Adjusted Unintentional Injury Deaths (per 100,000) ..............................................................37
9. Percent Population Linguistically Isolated ......................................................................................38
10.Adults that Could Not See a Doctor in the Past Year Due to Cost.................................................39
11.Adults 65 and Older Who Have Not Had a Flu Shot in the Past Year ............................................40
12.Chlamydia (Sexually Transmitted Infection) ..................................................................................41
13.Percent of Adults Without a Visit to a Dentist or Dental Clinic in the Past Year for Any Reason .41
Extrapolating Data to Describe Need ....................................................................................42
Additional Data Resources.....................................................................................................47
Page | 3 NFA Data Resource Guide

How to Use the Data Resource Guide
This Data Resource Guide is a technical assistance tool for completing Form 9: Need for
Assistance Worksheet (NFA worksheet) and is to be used in conjunction with the NFA
worksheet Instructions available in the Health Center Program funding opportunity
announcements. The NFA worksheet uses key health indicators to provide a snapshot of the
barriers and health problems in the proposed service area and for the target population as they
compare to national data and provides HRSA with a quantitative measure of need for each
application. Applicants must adhere to the instructions in the funding opportunity
announcement and the guidelines presented in this document when completing the NFA
worksheet. Applicants will be required to certify the accuracy of the data reported.
In addition to providing suggested resources and data parameters for completing the NFA
worksheet, this guide includes instructions for using alternative data sources, considerations for
data extrapolation, and a listing of data sources. It is organized into the following sections:
How to Use the Data Resource Guide provides an overview of how indicators are
described in the guide and conditions for using alternative data sources.
Data Resources for Individual Indicators describes the data resources available to
complete the NFA worksheet sections:
○ Section I: Core Barriers describes data sources for each of the indicators in the
Core Barriers section. Applicants must report on three of the four indicators in
this section.
○ Section II: Core Health Indicators describes data sources for each of the
indicators in the Core Health areas (diabetes, cardiovascular disease, cancer,
prenatal and perinatal health, child health, and behavioral health). Applicants
must report on one indicator for each of the six health areas in this section.
○ Section III: Other Health and Access Indicators describes data sources for 13
other indicators. Applicants must report on two indicators from this section.
Extrapolating Data to Describe Need discusses when to use extrapolation and acceptable methods for data extrapolation.
Additional Data Resources provides resources specific to homeless, agricultural
workers, and public housing special populations that may be useful when completing the
NFA worksheet.
Applicants are encouraged to use the data sources outlined in the Data Resource Guide.
Alternate data sources are permitted if they meet all of the following conditions:
1. The alternate data source is a reliable and independent source such as a state or
local government agency, professional body, foundation, or other well-known
organization using recognized, scientifically accepted data collection and/or analysis
methods. Examples of such sources are local or state health departments. Data
generated by providers and unscientific surveys are not acceptable;
2. The alternate data source is publicly available; and
Page | 4 NFA Data Resource Guide

3. The data in the alternate data source is collected and analyzed in the same way as
the suggested data source.
An example of an acceptable alternate data source would be Behavioral Risk Factor
Surveillance Survey data gathered and published by the state health department, as long as the
state survey question utilizes the same wording and response choices as the suggested source.
An example of an unacceptable alternate data source would be a community survey that asks
respondents about health or income but does not define the question in the same way as the
recommended data source OR does not use a scientifically valid sampling methodology.
If an alternate data source is used, applicants must provide the following information in the NFA
worksheet:
1. Full citation for the data source (including an internet address where available)
2. The parameters for the indicator as defined by the data source
3. The year(s) to which the data apply
4. The geographic service area or target population for the data
The following definitions are used throughout this guide.
Indicator: The name of the measurement variable for which resources are provided to obtain
the requested data response for the NFA worksheet.
Data Response: Actual data result for the specified indicator for the service area/population.
Primary Data Source: The recommended data source for obtaining the requested data
response for each indicator. The Data Resource Guide provides a hyperlink to the data source
and the click path (or steps/selections) to access the specific data needed for each indicator.
Other Recommended Data Sources: Additional data sources that may be used to find the
data response for the indicator.
Format: Specifies the format in which the indicator must be reported on the worksheet (e.g.,
ratio, percentage).
Notes: If applicable, notes are provided regarding parameters for the data response.
Page | 5 NFA Data Resource Guide

Data Resources for Individual Indicators
Section I: Core Barriers
Applicants must respond to three of the four core barrier indicators. Applicants should report on
the three indicators which best characterize the needs of the service area or target population.
Core Barrier 1. Population to One FTE Primary Care Physician
Table 1: Population to One FTE Primary Care Physician
Primary Data Source
FOR TARGET POPULATION LEVEL DATA (if available):
Health Professional Shortage Area data (HPSA)
Find Shortage Areas: HPSA
Basic Search by State & County:
http://hpsafind.hrsa.gov/HPSASearch.aspx
Map Search: http://datawarehouse.hrsa.gov/tools/MapTool.aspx?layerid=A070103
(Note – these links identify the presence of a HPSA but do not provide the data needed to complete the NFA worksheet - Detailed Search is needed.)
Detailed Search including ratio:
Detailed Health Professional Shortage Area (HPSA) Data Portal
http://datawarehouse.hrsa.gov/tools/dataportal.aspx
Choose: Health Professional Shortage Areas (HPSAs)
See instructions below.
FOR SERVICE AREA LEVEL DATA (full population):
HRSA Data Warehouse
Primary Care Service Area (PCSA) and Census Tract level data http://datawarehouse.hrsa.gov/tools/dataportal.aspx
Choose: Primary Care Service Areas (PCSAs)
See instructions below.
Other Recommended
Data Source(s) See alternate data source conditions on page 4
Format Number of persons
Notes
Applicants should report the number of persons per 1 FTE Primary Care provider.
This measure cannot be extrapolated.
It is NOT permissible to use UDS or other practice-based sources of information.
Patient data is not equivalent to community-level data.
The data reported should reflect the providers available to the target population to the degree
possible. Each target population exists within an area that is unique with respect to providers’
ability or willingness to make their services available to the target population. Therefore,
applicants whose target population is a subset of the total service area population (such as the
Page | 6 NFA Data Resource Guide

low income residents of the community) must directly assess physician accessibility for the
target population; extrapolation is not possible.
The data source used will vary based on the target population and availability of data:
1) If the target population is comprised of the entire population of the service area, use the
service area level data source as indicated in Table 1 and explained below for the Primary
Care Service Area (PCSA) level data.
2) If the target population is a subset of the service area population AND population-specific
HPSA data are available for that target population, HPSA data can be used to calculate
the ratio. This is only possible if the area covered by the HPSA reasonably approximates
the service area, and if the population covered by the HPSA is generally equivalent to the
target population (i.e., a low income HPSA could be used for a project targeting low income
residents, but a linguistic isolation HPSA could not be used for that group). See below for
HPSA data instructions.
3) If the target population is a subset of the service area population AND population-specific
HPSA data are not available for the target population, applicants may conduct a
process equivalent to that used for a HPSA designation to obtain the data (see
http://bhpr.hrsa.gov/shortage/hpsas/designationcriteria/primarycarehpsacriteria.html). It is
not necessary that the data meet the HPSA designation threshold or that the population
group comprises 30% of the community.
4) If the target population is a subset of the service area population, AND population-specific
HPSA data are not available for the target population, AND following the HPSA
process is not possible, applicants should use the service area level data as the basis for
the ratio as indicated in Table 1 for the Primary Care Service Area (PCSA) level data.
Applicants should check with their state Primary Care Office to see if HPSA designations have
been tested for the service area/target population (this may be the case even if a HPSA
application was not submitted), or if the necessary provider data is available to support this
process. See http://bhpr.hrsa.gov/shortage/hpsas/primarycareoffices.html for PCO contact
information.
The following sections provide information on how to obtain data using either a) HPSA data if
available or b) PCSA data for any area.
a) Health Professional Shortage Area (HPSA) Data Instructions
Primary Care HPSAs are areas designated by HRSA, in collaboration with each state’s Primary
Care Office, as having shortages of primary care physicians, and may be geographic (covering
the entire population of an area), population-group specific (typically the low income population),
or facility based (comprehensive health center, federally qualified health center, or other public
facility serving a designated area).
HPSA data may be used if the area designated fully encompasses the service area or
has substantial overlap with the service area. HPSAs must be in “designated” status
Page | 7 NFA Data Resource Guide

under the Primary Care discipline. Facility HPSAs cannot be used, nor can areas
designated only in the Mental Health and/or Dental disciplines.
HPSAs that are designated for low-income or other population group-specific
designations may only be used to identify population-to-provider ratio if the target
population for the application is the same as that for which the HPSA is designated.
To see if a HPSA exists covering the area/population you are seeking to serve, you can
do a search using the HPSA Find tool or the HPSA layer of the Map Tool as noted in
Table 1 above.
○ For the HPSA Find tool, Select the appropriate state and county(ies) and then
select the “Primary Care” discipline. Then click the “Search” button. Any HPSAs
in the specified area will be displayed as a table and will have a specific ID
number. Only HPSAs listed as “Geographical Area”, “Whole County”, or
“Population Group” may be used for the purposes of calculating a Population to
Provider ratio. Facility HPSAs will also be listed but cannot be used. The table
will show the specific geographic areas covered below each designation. Check
that the area designated includes or substantially covers the proposed service
area.
○ Alternately, to see the specific boundaries of the HPSAs in the area, click on the
Map Tool link. Expand the Shortage Areas options, and then the Health
Professional Shortage Area (HPSA) options. Activate the HPSA – Primary Care
option and use the Search box or zoom tools to find the service area of interest.
Any HPSAs in the area will be shown in green. The “Identify” tool can be used to
show the HPSA IDs. These tools do not show the Population to Provider ratio
needed for the data response, however, so an additional step is needed if a
suitable HPSA exists. Be sure to record the HPSA ID of the HPSA you plan to
use.
To get the Population to Provider ratio for the HPSA covering your service area, click on
the Detailed Search link in Table 1 above.
○ Select the “Health Professional Shortage Areas (HPSAs)” option under Primary
Data Set and then click “Choose Indicators”.
○ Under “Additional Data” choose the following 3 indicators: HPSA FTE, HPSA
Designation Population, and HPSA Formal Ratio. Click “View Data”.
○ Under Data Portal Results, enter the HPSA ID of interest in the filter box at the
top of that column and then click the filter icon to the right of the box and select
“Equal To”. The designation of interest will be shown.
○ The ratio for the designation, along with the FTE and HSPA population, will be
displayed. If no NHSC/J-1 providers are present, the formal ratio can be used
directly.
○ In order to provide the most accurate scoring, National Health Service Corps
(NHSC) and J-1 visa waiver providers should be counted (they are not counted in
HPSA designation process or the HPSA Report for Primary Medical Care).
Applicants should contact their Primary Care Office (PCO) or Primary Care
Association (PCA) for assistance in determining if NHSC and/or J-1 visa waiver
providers were present at the time of the most recent HPSA designation renewal.
Page | 8 NFA Data Resource Guide

Lists of PCOs and PCAs can be accessed at http://bphc.hrsa.gov/qualityimprovement/supportnetworks/. If NHSC/J-1 provider FTEs need to be added, the PCO should be able to
provide the FTEs (either total or the portion dedicated to serving the
population group for the designation).
In the Data Portal Results, find the HPSA FTE and the HPSA Designation
Population columns for the HPSA.
Use the following formula to calculate the Population to Provider ratio:
Ratio = HPSA Designation Population / (HPSA FTE + NHSC Provider
FTE+ J-1 FTE) Note that if multiple HPSAs are included, sum the
population and the FTEs separately before dividing – do not average the
individual ratios. The “Export Selected Dataset” option may be used to
download the data to Excel.
b) Primary Care Service Area (PCSA) Level Data Instructions
To identify the PCSA(s) that best approximate your service area, visit the Map Tool in
the HRSA Data Warehouse. Expand the Primary Care Service Areas (PCSAs) options
under HRSA Data and check the box to activate the Primary Care Service Areas layer.
Use the Search box or zoom tools to find the service area of interest. Use the Base Map
and Boundaries options to add administrative boundaries and map images to help orient
yourself. The “Identify” tool can be used to show the PCSA IDs. Note that this tool will
show a “Ratio of Non-Institutionalized Population to Total Number of Primary Care
Providers,” however, this is not the Population to Provider ratio needed for the data
response. Therefore, an additional step is needed. Be sure to record the PCSA ID of the
PCSA you plan to use.
To get the correct Population to Provider ratio for the PCSA(s) covering your service
area, click on the Detailed Search link in Table 1 above. Select the “Primary Care
Service Areas (PCSAs)” option under Primary Data Set and then click “Choose
Indicators”. The “Non-Institutionalized Population” option will already be checked, but
you must also select the “Primary Care FTE Physicians for MUA or HPSA Purposes”
option under “Additional Data.” Click “View Data.” Under Data Portal Results, enter the
PCSA ID of interest in the filter box at the top of that column and then click the filter icon
to the right of the box and select “Equal To”. The data for the PCSA of interest will be
shown. Again, the ratio shown is not the correct ratio for this purpose. Use the following
formula to determine the Population to Provider Ratio:
Ratio = Non-Institutionalized Population / Primary Care FTE Physicians for MUA or
HPSA Purposes. Note that, if multiple PCSAs are included, sum the population and the
FTEs separately before dividing – do not average the individual ratios. The “Export
Selected Dataset” option may be used to download the data to Excel.
Page | 9 NFA Data Resource Guide

Core Barriers 2 & 3: Percent of Population Below 200% FPL and Percent of Population Uninsured
Table 2: Percent of Population Below 200% FPL and Percent of Population Uninsured
Primary Data
Source
Custom 2014 ZCTA-level Map/Data utility
Click HERE to access the utility.
See instructions below.
Other
Recommended
Data Source(s)
See alternate data source conditions on page 4.
Special populations applicants ONLY may report for the target population.
All other applicants must provide the response for the entire service area.
Format Percent
Notes
Due to the degree of change in the rate of uninsurance brought about by the
Affordable Care Act implementation in 2014, the direct use of 5-year local American
Community Survey data is not reflective of current status. Instead, a small area
(ZCTA-level) allocation of 1-year 2014 ACS uninsurance data was prepared using
poverty level and age breaks for the resident community. The map utility includes
both the necessary uninsurance and low income details to complete these two
sections of the worksheet, as well as information on how the data was prepared.
5-year ACS data should not be used as a substitute as the scales have been
recalibrated to the 1-year 2014 values.
Use the following process to gather data and calculate this measure:
1. Open the 2014 Estimated Uninsured and Low Income map and data utility. Use the
Search box or zoom tools to find the service area of interest. ZCTAs will display
once the map is zoomed to a sub-state level. Click any ZCTA to see the Uninsured
and Low Income details. To select multiple ZCTAS, click the “Attribute Table” button
in the controls at the bottom of the map (table area may be expanded) and re-zoom
the map so that the full service area is visible above the table. Make sure “Filter by
Map Extent” is highlighted. You may then select the ZCTAs of interest from the list
below, using the <CTRL> key to select multiple areas. Selected ZCTAs will be
highlighted on the map. To download the data for selected ZCTAs, click on the
Options button and choose “Export Selected to CSV.”
2. If multiple ZCTAs are included in the service area you must sum the numerators and
denominators separately before dividing to get the percent. Note that the Uninsured
and the Low Income measures have different population denominators. Be sure to
divide the correct numerator and denominators for each measure and then divide to
get the values for these measures as follows:
● % Uninsured = Uninsured Pop / Uninsured Denominator Pop
● % Low Income = Low Income Pop / Low Income Denominator Pop
Page | 10 NFA Data Resource Guide

Core Barrier 4: Distance (miles) or Travel Time (minutes) to the Nearest Primary Care Provider Accepting New Medicaid Patients and Uninsured Patients
Table 3: Distance (miles) or Travel Time (minutes) to the Nearest Primary Care Provider
Accepting New Medicaid Patients and Uninsured Patients
Google maps for drive times and public transportation times.
Primary Data
Source
UDS Mapper is the best map tool for identifying the nearest federally funded
primary care providers.
UDS Mapper: http://www.udsmapper.org (you will need to register for access)
Under the “Explore Service Area” tool, scroll to the bottom and check the following:
Health Center Service Access Points
NHSC Sites
Rural Health Clinics
Hover the mouse over each point shown to see the site address.
You will need to use Google maps to determine the time/distance to each site.
Do not simply report the distance to the closest site found. You may need to call
each site to determine if they are accepting new Medicaid and uninsured patients
on a sliding fee basis.
Other
Recommended
Data Source(s)
See alternate data source conditions on page 4
Format Number (miles or minutes)
Notes See below
Distance should be measured from the address of the proposed service site to the
nearest provider meeting the following criteria:
● Health Center Program (HCP) grantee and look-alike service sites (including other sites
operated by the applicant), NHSC sites, and Rural Health Clinics.
● Other providers that:
○ Currently accept new Medicaid and uninsured patients; and
○ Provide services to uninsured patients on a sliding fee scale, or at no cost; and
○ Provide comprehensive primary care services (whether provided by a physician
or other provider within the scope of their license, such as a nurse practitioner).
If multiple sites are proposed, applicant should average the distance from each individual
proposed site to the provider nearest each proposed site.
Distance by public transportation may be used when 1) at least 20% of the target population
lives below poverty, and 2) at least 30% of the target population uses public transportation as
the main source of transportation to work. To determine if the target population meets these
criteria:
Page | 11 NFA Data Resource Guide

1. Access the American FactFinder at:
http://factfinder.census.gov/faces/nav/jsf/pages/searchresults.xhtml?refresh=t#none.
2. Under box 1 of the search request for tables and files, enter S0802 and click “Go.”
3. Under the Geographies tab on the left, select the geographic units used to define
your service area (e.g., County, Census Tracts), click “Add to your Selections,” and
then click “Close” in the upper right of the Geographies box.
4. In the center table of the search results, check the box in the “Means of
Transportation to Work by Selected Characteristics” row with the 2014 ACS 5-year
estimates. Click View to access the data.
5. Calculate the percentage of the target population using public transportation by
dividing the estimate for Workers 16 years and over using Public Transportation by
the Total Workers 16 years and over.
Section II: Core Health Indicators
Applicants must report on one indicator for each of the six core health categories (diabetes,
cardiovascular disease, cancer, prenatal and perinatal health, child health, and behavioral
health). Applicants may choose any of the listed indicators for each category, or they may
provide an alternative related to the category in the “other” column.
“Other” indicators must be reported from a reliable and independent source such as a state or
local government agency, professional body, foundation, or other well-known organization using
recognized, scientifically-accepted data collection and/or analysis methods. Data generated by
providers (including UDS data) and unscientific surveys are not allowable.
If an “other” indicator is used, applicants must provide the following information in the NFA
worksheet:
The parameters (definition) for the indicator as defined by the data source
The proposed benchmark to be used, including the data unit and whether the data
response is greater than or less than the benchmark
The data response and year to which the data apply (if the data apply to a period of
more than one year, provide the most recent year)
Full citation for the data source (including an internet address where available) and the
rationale for using the alternative indicator
Under methodology utilized, the source of the benchmark and explanation of extrapolation, if applicable
The geographic service area or target population for the data
Page | 12 NFA Data Resource Guide

1. Diabetes
Table 4: Diabetes Prevalence
Primary Data
Source
FOR COUNTY LEVEL DATA
Centers for Disease Control (CDC) Diabetes Interactive Atlas
http://www.cdc.gov/diabetes/atlas/countydata/atlas.html
→ Under Diagnosed Diabetes Percentage/2012 click on “Indicator”.
→ Select Diagnosed Diabetes → Select Age Adjusted Percentage → Select 2012.
→ Click on “Select State” and “State_Name” to select your state.
→ Click on the map or the table at the bottom of the page to select your county.
→ Report the number in the Indicator column as the percent.
UDS Mapper http://www.udsmapper.org
→ Under Tools, select Community Health View.
→ Under “Limit my search to” select only Counties.
→ Under “Select a Theme or Topic” check CDC, National Diabetes Surveillance
System, Diabetes Prevalence, 2012.
→ Under “Select a group/category” select Age-Adjusted Percentage.
→ Roll over the county to show the diabetes prevalence percentage.
→ Indicator will appear in data table.
FOR STATE DATA
Behavioral Risk Factor Surveillance System (BRFSS)
http://www.cdc.gov/brfss/brfssprevalence/
→ Select State → Click Go.
→ Select Class: Chronic Health Indicators → Select Topic: Diabetes.
→ Select most recent year → Click Go.
→ Scroll over the bar chart indicating Yes for the question, “Have you ever been
told by a doctor that you have diabetes?”
Other
Recommended
Data Source(s)
County Health Rankings http://www.countyhealthrankings.org/
→ Select State → Select County → Under Quality of Life, select Additional Health
Outcomes → See Diabetes prevalence.
Format Percent
Notes Must be age-adjusted.
State level data is available by gender, age, race, income, and education.
Page | 13 NFA Data Resource Guide

Table 5: Adult Obesity Prevalence
Primary Data
Source
UDS Mapper http://www.udsmapper.org
→ In the Explore Service Area tool, make sure the Map tab is selected for the view
(not the Data tab).
→ Under the Explore Service Area tool on the right menu, search/add selected
service area zip code(s) in the “Search To Go or Select” field.
→ Once all ZCTAs are selected, go to the Data tab.
→ Select the “Additional Population Data and Indicators” tab at the bottom of the
screen.
→ Scroll to the right and click on % Adults Who Are Obese, est. 07-12.
→ Indicator will appear in the data table.
Other
Recommended
Data Source(s)
Community Health Status Indicators (CHSI) http://wwwn.cdc.gov/CommunityHealth
→ Select State → Select County → Under Morbidity, select Adult Obesity.
County Health Rankings http://www.countyhealthrankings.org/
→ Below the map, select Measure: Adult Obesity → Select State.
→ Click “Go.”
Format Percent
Notes
State level data is available by gender, age, race, income, and education.
Obesity is defined as a body mass index (BMI) equal to or greater than 30, based
on weight and height.
Table 6: Diabetes Mortality Rate
Primary Data
Source
CDC WONDER http://wonderd.cdc.gov
→ Select “Detailed Mortality”.
→ Under “1. Organize table layout” choose group results by county (and any other
demographics required). Check “Age Adjusted Rate”.
→ Under “2. Select location” choose “States” and then select your state.
→ Under “3. Select demographics” choose ten-year age groups. Select “all ages”.
Select any other desired demographics.
→ Use default values under sections 4 & 5.
→ Under “6. Select cause of death” choose “ICD-10 113 cause list” and in list select
“Diabetes mellitus (E10-E14)”.
→ Click Send → Report data in “Age Adjusted Rate per 100,000” column.
Other
Recommended
Data Source(s)
State and Local Health Departments
Format Rate per 100,000
Notes
Must be age-adjusted.
Diabetes mortality rate is number of deaths per 100,000 population reported due to
diabetes as the underlying cause or as one of multiple causes of death (ICD-10
codes E10-E14).
Data is available at some geographies by race, ethnicity, age, and gender.
Page | 14 NFA Data Resource Guide
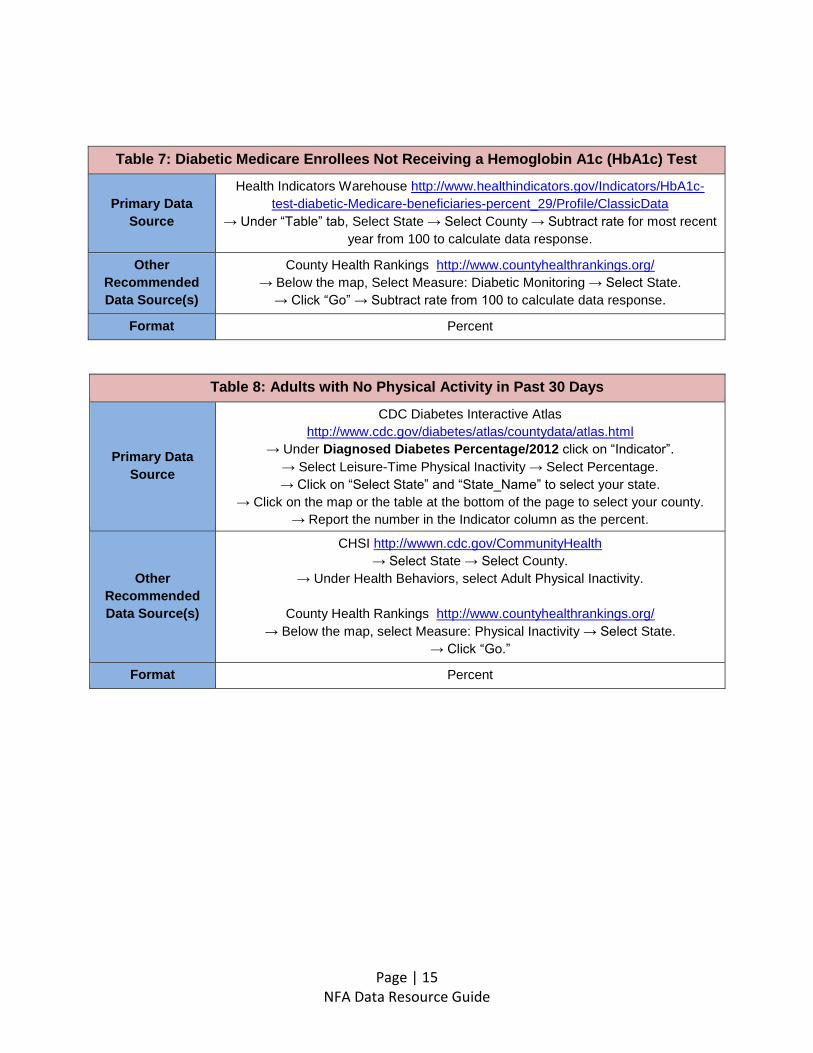
Table 7: Diabetic Medicare Enrollees Not Receiving a Hemoglobin A1c (HbA1c) Test
Primary Data
Source
Health Indicators Warehouse http://www.healthindicators.gov/Indicators/HbA1c
test-diabetic-Medicare-beneficiaries-percent_29/Profile/ClassicData
→ Under “Table” tab, Select State → Select County → Subtract rate for most recent
year from 100 to calculate data response.
Other
Recommended
Data Source(s)
County Health Rankings http://www.countyhealthrankings.org/
→ Below the map, Select Measure: Diabetic Monitoring → Select State.
→ Click “Go” → Subtract rate from 100 to calculate data response.
Format Percent
Table 8: Adults with No Physical Activity in Past 30 Days
Primary Data
Source
CDC Diabetes Interactive Atlas
http://www.cdc.gov/diabetes/atlas/countydata/atlas.html
→ Under Diagnosed Diabetes Percentage/2012 click on “Indicator”.
→ Select Leisure-Time Physical Inactivity → Select Percentage.
→ Click on “Select State” and “State_Name” to select your state.
→ Click on the map or the table at the bottom of the page to select your county.
→ Report the number in the Indicator column as the percent.
Other
Recommended
Data Source(s)
CHSI http://wwwn.cdc.gov/CommunityHealth
→ Select State → Select County.
→ Under Health Behaviors, select Adult Physical Inactivity.
County Health Rankings http://www.countyhealthrankings.org/
→ Below the map, select Measure: Physical Inactivity → Select State.
→ Click “Go.”
Format Percent
Page | 15 NFA Data Resource Guide

2. Cardiovascular Disease
Table 9: Hypertension Hospital Admission
Primary Data
Source
State Data Sources for State and County Data
Healthcare Cost and Utilization Project (HCUP) for national rates
http://hcupnet.ahrq.gov/HCUPnet.jsp?Id=EFF272FAADE64853&Form=MAINSEL&J
S=Y&Action=%3E%3ENext%3E%3E&_MAINSEL=AHRQ%20Quality%20Indicators
→ Scroll down and select AHRQ Quality Indicators → QI Summary Tables.
→ Indicator Selection: Prevention Quality Indicators – PQIs.
→ Detailed statistics (select most recent year) → Hypertension.
Other
Recommended
Data Source(s)
See alternate data source conditions on page 4.
Format Rate per 100,000
Notes
Indicator should be calculated using the Agency for Healthcare Research and
Quality PQI Methodology for patients 18 and older. The measure should be
adjusted for patient and hospital factors (per the AHRQ methodology). Crude
hypertension admission rates should not be used.
National rate available by age and gender.
Table 10: Congestive Heart Failure Hospital Admission
Primary Data
Source
State Data Sources for State and County Data
HCUP for national rates
http://hcupnet.ahrq.gov/HCUPnet.jsp?Id=EFF272FAADE64853&Form=MAINSEL&J
S=Y&Action=%3E%3ENext%3E%3E&_MAINSEL=AHRQ%20Quality%20Indicators
→ Scroll down and select AHRQ Quality Indicators → QI Summary Tables.
→ Indicator Selection: Prevention Quality Indicators – PQIs.
→ Detailed statistics (select most recent year) → Congestive heart failure.
Other
Recommended
Data Source(s)
See alternate data source conditions on page 4.
Format Rate per 100,000
Notes
Indicator should be calculated using the Agency for Healthcare Research and
Quality PQI Methodology for patients 18 and older. The measure should be
adjusted for patient and hospital factors (per the AHRQ methodology). Crude
congestive heart failure admission rates should not be used.
National rate available by age and gender.
Page | 16 NFA Data Resource Guide

Table 11: Mortality from Diseases of the Heart
Primary Data
Source
CDC WONDER http://wonder.cdc.gov
→ Select “Detailed Mortality”.
→ Under “1. Organize table layout” choose group results by county (and any other
demographics required). Check “Age Adjusted Rate”.
→ Under “2. Select location” choose “States” and then select your state.
→ Under “3. Select demographics“ choose “ten-year age groups” and any other
desired demographics.
→ Use default values under sections 4 & 5.
→ Under “6. Select cause of death” choose “ICD-10 113 cause list” and in list select
“Diseases of heart (I00-I09, I11,I13,I20-I51)”.
→ Click Send → Report data in “Age Adjusted Rate per 100,000” column.
Other
Recommended
Data Source(s)
Health Indicators Warehouse (HIW)
http://www.healthindicators.gov/Indicators/Heart-disease-deaths-per
100000_83/Profile/ClassicData
→ Under “Table” tab, select State → Select County.
→ Report age-adjusted rate for most recent year.
Format Rate per 100,000
Notes
Must be age-adjusted.
Total number of deaths per 100,000 reported as due to heart disease (includes
ICD-10 codes for selected causes of death I00-109, I11, I13, and I20-I51).
Table 12: Adults Reporting Diagnosis of High Blood Pressure
Primary Data
Source
UDS Mapper http://www.udsmapper.org
→ In the Explore Service Area tool, make sure the Map tab is selected for the view
(not the Data tab).
→ Under the Explore Service Area tool on the right menu, search/add selected
service area zip code(s) in the “Search To Go or Select” field.
→ Once all ZCTAs are selected, go to the Data tab.
→ Select the “Additional Population Data and Indicators” tab at the bottom of the
screen.
→ Scroll to the right and click on Percent of Adults Ever Told They Have High Blood
Pressure, est. 07-12 → Indicator will appear in data table.
Other
Recommended
Data Source(s)
FOR STATE DATA
BRFSS http://www.cdc.gov/brfss/brfssprevalence/
→ Select State → Click Go.
→ Select Class: Hypertension Awareness → Select Topic: High Blood Pressure.
→ Select most recent year → Click Go.
→ Scroll over the bar chart indicating Yes for “Adults who have been told they have
high blood pressure.”
Format Percent
Notes Data at national and state geographies is available by race/ethnicity, gender, age,
current insurance status, income, and education.
Page | 17 NFA Data Resource Guide

Table 13: No Cholesterol Screening
Primary Data
Source
FOR COUNTY LEVEL DATA
BRFSS https://chronicdata.cdc.gov/health-area/behavioral-risk-factors
→ Click on Dataset “Behavioral Risk Factors: Selected Metropolitan Area Risk
Trends (SMART) County Prevalence Data (2011 to 2012)”.
→ In the Locationdesc column, click on the left menu icon to filter by county.
→ In the Class column, click on the left menu icon to filter by Cholesterol
Awareness.
→ In the Topic column, click on the left menu icon to filter by Cholesterol Checked.
→ In the Question column, click on the left menu icon to filter by “Adults who have
had their blood cholesterol checked within the last five years”.
→ In the Response column, click on the left menu icon to filter by “Checked in past
5 years”.
→ Subtract the number in the Data_value column from 100 to calculate data
response.
FOR SELECT METROPOLITAN AREA DATA
BRFSS https://chronicdata.cdc.gov/health-area/behavioral-risk-factors
→ Click on Dataset “Behavioral Risk Factors: Selected Metropolitan Area Risk
Trends (SMART) MMSA Prevalence Data (2011 to present)”.
→ In the Locationdesc column, click on the left menu icon to filter by metropolitan
area → Follow the steps above.
FOR STATE DATA
BRFSS http://www.cdc.gov/brfss/brfssprevalence/
→ Select State → Click Go.
→ Select Class: Cholesterol Awareness → Select Topic: Cholesterol Checked.
→ Select most recent year → Click Go.
→ Scroll over the bar chart indicating Yes for “Adults who have had their blood
cholesterol checked within the last five years”.
→ Subtract the percentage from 100 to calculate data response.
Other
Recommended
Data Source(s)
Health Indicators Warehouse (HIW)
http://www.healthindicators.gov/Indicators/Cholesterol-screening-adults
percent_886/Profile/ClassicData
→ Use national age-adjusted rates for most recent year to extrapolate.
Format Percent
Notes
No screening in past 5 years.
Data at national and state geographies is available by race/ethnicity, gender, age,
current insurance status, income, and education.
Data for this indicator is not readily available at county or sub-county geographies.
Applicants may extrapolate state rates to the service area or target population
based on demographic characteristics, to the extent feasible.
Page | 18 NFA Data Resource Guide

Table 14: Cerebrovascular Disease Mortality
Primary Data
Source
CDC WONDER http://wonder.cdc.gov
→ Select “Detailed Mortality”.
→ Under “1. Organize table layout” choose group results by county (and any other
demographics required). Check “Age Adjusted Rate”.
→ Under “2. Select location” choose “States” and then select your state.
→ Under “3. Select demographics” choose “ten-year age groups” and any other
desired demographics.
→ Use default values under sections 4 & 5.
→ Under “6. Select cause of death” choose “ICD-10 113 cause list” and select from
the list “Cerebrovascular diseases (I60-I69)”.
→ Click Send → Report data in “Age Adjusted Rate per 100,000” column.
Other
Recommended
Data Source(s)
CHSI http://wwwn.cdc.gov/CommunityHealth
→ Select State → Select County → Under Mortality, select Stroke Deaths.
Health Indicators Warehouse (HIW)
http://www.healthindicators.gov/Indicators/Stroke-deaths-per
100000_881/Profile/ClassicData
→ Under “Table” tab, select State → Select County.
→ Use age-adjusted rate for most recent year.
Format Rate per 100,000
Notes
Must be age-adjusted.
Total number of deaths per 100,000 reported as due to cerebrovascular disease
(includes ICD-10 codes I60-I69).
Page | 19 NFA Data Resource Guide

3. Cancer
Table 15: Women with No Pap Test in the Past 3 years
Primary Data
Source
FOR COUNTY LEVEL DATA
BRFSS https://chronicdata.cdc.gov/health-area/behavioral-risk-factors
→ Click on Dataset “Behavioral Risk Factors: Selected Metropolitan Area Risk
Trends (SMART) County Prevalence Data (2011 to 2012).”
→ In the Locationdesc column, click on the left menu icon to filter by county.
→ In the Class column, click on the left menu icon to filter by Women’s Health.
→ In the Topic column, click on the left menu icon to filter by Pap Test.
→ In the Question column, click on the left menu icon to filter by “Women aged 18+
who have had a pap test within the past three years”.
→ In the Response column, click on the left menu icon to filter by “No”.
→ Report the number in the Data_value column.
FOR SELECT METROPOLITAN AREA DATA
BRFSS https://chronicdata.cdc.gov/health-area/behavioral-risk-factors
→ Click on Dataset “Behavioral Risk Factors: Selected Metropolitan Area Risk
Trends (SMART) MMSA Prevalence Data (2011 to present)”.
→ In the Locationdesc column, click on the left menu icon to filter by metropolitan
area → Follow the steps above.
FOR STATE DATA
BRFSS http://www.cdc.gov/brfss/brfssprevalence/
→ Select State → Click Go.
→ Select Class: Women’s Health → Select Topic: Pap Test.
→ Select most recent year → Click Go.
→ Scroll over the bar chart indicating No for “Women aged 18+ who have had a
pap test within the past three years”.
Other
Recommended
Data Source(s)
CHSI http://wwwn.cdc.gov/CommunityHealth
→ Select State → Select County.
→ Under Health Behaviors, select “Adult female routine pap tests”.
→ Subtract rate from 100 to calculate data response.
Kaiser State Health Facts http://www.statehealthfacts.org/index.jsp
→ Select State → Select Category: Women’s Health → Select “Percent of Women
Ages 18-64 who Report Having Had a Pap Smear within the Past Three Years”.
→ Subtract rate from 100 to calculate data response.
Format Percent
Notes
Women 18+.
Data at national and state geographies is available by race/ethnicity, gender, age,
current insurance status, income, and education.
Page | 20 NFA Data Resource Guide

Table 16: Women with No Mammogram in the Past 2 Years
Primary Data
Source
UDS Mapper http://www.udsmapper.org
→ Under Tools, select Community Health View.
→ Under “Limit my search to” select only Counties.
→ Under “Select a Theme or Topic” check Behavioral Risk Factor Surveillance
System (BFRSS), Mammogram, Women 50 and older, 2006-2010.
→ Under “Select a group/category” select Percentage 50+ with mammogram in
past 2 years.
→ Roll over the county to show the diabetes prevalence percentage.
→ Indicator will appear in data table.
→ Subtract rate from 100 to calculate data response.
Other
Recommended
Data Source(s)
FOR STATE DATA
BRFSS http://www.cdc.gov/brfss/brfssprevalence/
→ Select State → Click Go.
→ Select Class: Women’s Health → Select Topic: Mammogram.
→ Select most recent year → Click Go.
→ Scroll over the bar chart indicating No for “Women aged 50+ who have had a
mammogram within the past two years”.
Format Percent
Notes Women 50+.
Data at national and state geographies is available by race/ethnicity, gender, age,
current insurance status, income, and education.
Page | 21 NFA Data Resource Guide

Table 17: Adults with No Fecal Occult Blood Test (FOBT) within the Past 2 Years
Primary Data
Source
FOR COUNTY LEVEL DATA
BRFSS https://chronicdata.cdc.gov/health-area/behavioral-risk-factors
→ Click on Dataset “Behavioral Risk Factors: Selected Metropolitan Area Risk
Trends (SMART) County Prevalence Data (2011 to 2012)”.
→ In the Locationdesc column, click on the left menu icon to filter by county.
→ In the Class column, click on the left menu icon to filter by Colorectal Cancer
Screening.
→ In the Topic column, click on the left menu icon to filter by Blood Stool Test.
→ In the Question column, click on the left menu icon to filter by “Adults aged 50+
who have had a blood stool test within the past two years”.
→ In the Response column, click on the left menu icon to filter by “No”.
→ Report the number in the Data_value column.
FOR SELECT METROPOLITAN AREA DATA
BRFSS https://chronicdata.cdc.gov/health-area/behavioral-risk-factors
→ Click on Dataset “Behavioral Risk Factors: Selected Metropolitan Area Risk
Trends (SMART) MMSA Prevalence Data (2011 to present)”.
→ In the Locationdesc column, click on the left menu icon to filter by metropolitan
area → Follow the steps above.
FOR STATE DATA
BRFSS http://www.cdc.gov/brfss/brfssprevalence/
→ Select State → Click Go.
→ Select Class: Colorectal Cancer Screening → Select Topic: Blood Stool Test.
→ Select most recent year → Click Go.
→ Scroll over the bar chart indicating No for “Adults aged 50+ who have had a
blood stool test within the past two years”.
Other
Recommended
Data Source(s)
See alternate data source conditions on page 4.
Format Percent
Notes
Adults 50+.
Data at national and state geographies is available by race/ethnicity, gender, age,
current insurance status, income, and education.
Data for this indicator is not readily available at county or sub-county geographies.
Applicants may extrapolate state rates to the service area or target population
based on demographic characteristics, to the extent feasible.
Page | 22 NFA Data Resource Guide

Table 18: Adults who Currently Smoke Cigarettes
Primary Data
Source
UDS Mapper http://www.udsmapper.org
→ Under Tools, select Community Health View.
→ Under “Limit my search to” select only Counties.
→ Under “Select a Theme or Topic” check Behavioral Risk Factor Surveillance
System (BFRSS), Smoking, Adults 18 and older, 2006-2010.
→ Under “Select a group/category” select Percentage 18+ with currently smoking
cigarettes.
→ Roll over the county to show the percentage.
→ Indicator will appear in data table.
Other
Recommended
Data Source(s)
CHSI http://wwwn.cdc.gov/CommunityHealth
→ Select State → Select County → Under Health Behaviors, select Adult Smoking.
County Health Rankings http://www.countyhealthrankings.org/
→ Below the map, Select Measure: Adult Smoking → Select State.
→ Click “Go”.
Format Percent
Notes Data at national and state geographies is available by race/ethnicity, gender, age,
current insurance status, income, and education.
Table 19: Breast Cancer Mortality among Females
Primary Data
Source
CDC WONDER http://wonder.cdc.gov
→ Select “Detailed Mortality”.
→ Under “1. Organize table layout” choose group results by county (and any other
demographics required). Check “Age Adjusted Rate”.
→ Under “2. Select location” choose “States” and then select your state.
→ Under “3. Select Demographics” choose ten-year age groups.
→ Select “all ages” and select any other desired demographics.
→ Use default values under sections 4 & 5.
→ Under “6. Select cause of death” choose “ICD-10 113 cause list” and in list,
select “Malignant neoplasm of breast (C50)”.
→ Click Send.
→ Report data in “Age Adjusted Rate per 100,000” column.
Other
Recommended
Data Source(s)
Kaiser State Health Facts http://www.statehealthfacts.org/index.jsp
→ Select State → Select Category: Women’s Health → Select “Breast Cancer
Deaths per 100,000 Women”.
Format Rate per 100,000
Notes Must be age-adjusted.
Data is available at some geographies by race, ethnicity, and age.
Page | 23 NFA Data Resource Guide

Table 20: Colorectal Cancer Mortality
Primary Data
Source
CDC WONDER http://wonder.cdc.gov
→ Select “Detailed Mortality.”
→ Under “1. Organize table layout” choose group results by county (and any other
demographics required). Check “Age Adjusted Rate”.
→ Under “2. Select location” choose “States” and then select your state.
→ Under “3. Select Demographics” choose ten-year age groups.
→ Select “all ages” and select any other desired demographics.
→ Use default values under sections 4 & 5.
→ Under “6. Select cause of death” choose “ICD-10 113 cause list” and in list select
“Malignant neoplasms of colon, rectum and anus (C18-21)”.
→ Click Send → Report data in “Age Adjusted Rate per 100,000” column.
Other
Recommended
Data Source(s)
UDS Mapper http://www.udsmapper.org
→ Under Tools, select Community Health View.
→ Under “Limit my search to” select only Counties.
→ Under “Select a Theme or Topic” check Death Rate, Colorectal Cancer, 2007
2011 → Under “Select a group/category” select Rate per 100,000.
→ Roll over the county to show the percentage.
→ Indicator will appear in data table.
Format Rate per 100,000
Notes
Must be age-adjusted.
Data is available at some geographies by race, ethnicity, age, gender, and other
demographic factors.
4. Prenatal and Perinatal Health
Table 21: Low Birth Weight
Primary Data
Source
UDS Mapper http://www.udsmapper.org
→ In the Explore Service Area tool, make sure the Map tab is selected for the view
(not the Data tab).
→ Under the Explore Service Area tool on the right menu, search/add selected
service area zip code(s) in the “Search To Go or Select” field.
→ Once all ZCTAs are selected, go to the Data tab.
→ Select the “Additional Population Data and Indicators” tab at the bottom of the
screen.
→ Scroll to the right and click on Low Birth Weight Rate, est. 10-12.
→ Indicator will appear in data table.
County Health Rankings http://www.countyhealthrankings.org/
→ Select State → Select County.
→ Under Health Outcomes and Quality of Life → See Low birthweight.
Page | 24 NFA Data Resource Guide

Table 21: Low Birth Weight
Other
Recommended
Data Source(s)
CHSI http://wwwn.cdc.gov/CommunityHealth
→ Select State → Select County.
→ Under the “Indicators” tab, select Low Birth Weight.
CDC National Vital Statistics System (NVSS) http://www.cdc.gov/nchs/nvss.htm
CDC Wonder http://wonder.cdc.gov
State Health Departments
Format Percent
Notes Low birth weight = less than 2500 grams, 5 year average.
Data available for ranges greater than five years is acceptable.
Table 22: Infant Mortality Rate
Primary Data
Source
CDC WONDER http://wonder.cdc.gov
→ Select “Infant Deaths (Linked Birth/Infant Death Records)”.
→ Select “Linked Birth/Infant Death Records for 2007-2013 with ICD 10 codes”.
→ Under “1. Organize table layout” choose group results by county (and any other
demographics required).
→ Under “2. Select “maternal residence” and choose “States,” and then select your
state.
→ Use default values under sections 3, 4, & 5.
→ Under “6. Select infant characteristics” choose “All Ages” and “All Years”.
→ Under “7. Other options” select “Calculate Rates Per 1,000”.
→ Select “Send” and report the number in the “Death Rate Per 1,000” column.
Other
Recommended
Data Source(s)
CDC National Vital Statistics System (NVSS) http://www.cdc.gov/nchs/nvss.htm
State Health Departments
Format Rate per 1,000
Notes Data available for a 4-year rate or more is acceptable.
Page | 25 NFA Data Resource Guide

Table 23: Births to Teenage Mothers
Primary Data
Source
CDC WONDER http://wonder.cdc.gov
→ Select “Births”.
→ Select “Natality for 2007-2013”.
→ Under “1. Organize table layout” choose group results by county (and any other
demographics required).
→ Under “2. Select “maternal residence” and choose “States”, and then select your
state.
→ Under “3. Select other maternal characteristics” select “15-19 years” under “Age
of Mother” and select any other desired demographics.
→ Under “4. Select birth characteristics” select “All Years” under “Year”.
→ Use default values under sections 5 & 6.
→ Select “Send” and note the number of births for 15-19 year olds for the desired
county.
→ Go to “Request Form” tab and repeat, choosing “All Ages” under “Age of Mother”
in “3. Select other maternal characteristics”.
→ Select “Send” and note the number of births for all ages for the desired county.
→ Divide the number of births for 15-19 year olds by the number of all births to
obtain the percentage.
Other
Recommended
Data Source(s)
County Health Rankings http://www.countyhealthrankings.org/
→ Below the map, select Measure: Teen Births → Select State → Click “Go”.
CDC National Vital Statistics System (NVSS) http://www.cdc.gov/nchs/nvss.htm
State Health Departments
Format Percent
Notes
Ages 15-19, percent of all births.
Data is available at some geographies by race, ethnicity, age, gender, and other
demographic factors.
Page | 26 NFA Data Resource Guide

Table 24: Late Entry into Prenatal Care
Primary Data
Source
CDC WONDER http://wonder.cdc.gov
→ Select “Births”.
→ Select “Natality for 2007-2013”.
→ Under “1. Organize table layout” choose “group results by county” (and any other
demographics required).
→ Under “2. Select maternal residence” choose “States” and then select your state.
→ Under “3. Select other maternal characteristics” use default values.
→ Under “4. Select birth characteristics” select “No Prenatal Care” and “4th month”
through “10th month” under “Month Prenatal Care Began”.
→ Use default values under sections 5 & 6.
→ Select “Send” and note the number of births for the desired county.
→ Go to “Request Form” tab and repeat, choosing “All Months” under “Month
Prenatal Care Began” in “4. Select birth characteristics”.
→ Select “Send” and note the number of births for the desired county.
→ Divide the number of late entry into prenatal care by the number of all births to
obtain the percentage.
Other
Recommended
Data Source(s)
CDC National Vital Statistics System (NVSS) http://www.cdc.gov/nchs/nvss.htm
State Health Departments
Format Percent
Notes
Entry after first trimester, percent of all births.
Data is available at some geographies by race, ethnicity, age, gender, and other
demographic factors.
For less populated geographies, it may be necessary to choose 10-year data
groups for data to be available.
Page | 27 NFA Data Resource Guide

Table 25: Cigarette Use During Pregnancy
Primary Data
Source
CDC WONDER http://wonder.cdc.gov
→ Select “Births”.
→ Select “Natality for 2007-2013”.
→ Under “1. Organize table layout” choose group results by county (and any other
demographics required).
→ Under “2. Select maternal residence” choose “States” and then select your state
→ Use default values under sections 3 & 4.
→ Under “5. Select maternal risk factors” select “Yes” under “Tobacco Use”.
→ Use default values under section 6.
→ Select “Send” and note the number of births for tobacco users for the desired
county.
→ Go to “Request Form” tab and repeat, choosing “All Values” under “Tobacco
Use” in “5. Select maternal risk factors”.
→ Select “Send” and note the number of births for the desired county.
→ Divide the number of births for tobacco users by the number of all births to obtain
the percentage.
Other
Recommended
Data Source(s)
CDC National Vital Statistics System (NVSS) http://www.cdc.gov/nchs/nvss.htm
State Health Departments
Format Percent
Notes
Percent of all pregnancies.
Data is available at some geographies by race, ethnicity, age, gender, and other
demographic factors.
For less populated geographies, it may be necessary to choose 10-year data
groups for data to be available.
Table 26: Preterm Births
Primary Data
Source
CDC WONDER http://wonder.cdc.gov
→ Select “Births”.
→ Select “Natality for 2007-2013”.
→ Under “1. Organize table layout” choose “group results by county” (and any other
demographics required).
→ Under “2. Select maternal residence” choose “States” and then select your state.
→ Under “3. Select other maternal characteristics” use default values.
→ Under “4. Select birth characteristics” select “Under 20 weeks,” “20-27 weeks,”
“28-31 weeks,” “32-33 weeks,” and “34-36 weeks” under “Gestational Age Group 2”.
→ Use default values under sections 5 & 6.
→ Select “Send” and note the number of births for the desired county.
→ Go to “Request Form” tab and repeat, choosing “All Weeks” under “Gestational
Age Group 2” in “4. Select birth characteristics”.
→ Select “Send” and note the number of births for the desired county.
→ Divide the number of preterm births by the number of all births to obtain
percentage.
Page | 28 NFA Data Resource Guide

Table 26: Preterm Births
Other
Recommended
Data Source(s)
CHSI http://wwwn.cdc.gov/CommunityHealth
→ Select State → Select County → Under Morbidity, Select Preterm Births.
CDC National Vital Statistics System (NVSS) http://www.cdc.gov/nchs/nvss.htm
Format Percent
Notes
Less than 37 weeks gestational age.
Data is available at some geographies by race, ethnicity, age, gender, and other
demographic factors.
For less populated geographies, it may be necessary to choose 10-year data groups
for data to be available.
5. Child Health
Table 27: Children not Receiving Recommended Immunizations (4-3-1-3-3-1-4)
Primary Data
Source
CDC NIS http://www.cdc.gov/nchs/nis.htm
→ In the left menu, click “Immunization Coverage in the United States”.
→ Under “Surveys of U.S. Vaccination Coverage” choose “National Immunization
Survey (NIS) Children 19-35 months”.
→ Under (Children) NIS Data (timeframe) choose January – December 2014.
→ Under NIS Data Tables choose “Overall”.
→ Under “Overall” open file “Coverage with Individual Vaccines and Vaccination
Series”.
→ Find the row for your state/local area and the number in that row under the
“Combined 7-vaccine series” column (record only the number before the ± sign).
→ This is the % of children vaccinated; subtract this number from 100 to calculate
the % of children NOT vaccinated.
Other
Recommended
Data Source(s)
See alternate data source conditions on page 4.
Format Percent
Notes 19-35 months old.
Page | 29 NFA Data Resource Guide

Table 28: Children not Tested for Elevated Blood Lead Levels
Primary Data
Source
CDC Lead Poisoning Branch http://www.cdc.gov/nceh/lead/data/index.htm
→ Choose “CDC’s State Surveillance Data”.
→ Choose your state and open the data sheet for the most current year available.
→ Find the row for your county and the percent in the “Percent of Children Tested”
column → Subtract the number from 100 to calculate the % of children NOT tested.
Other
Recommended
Data Source(s)
See alternate data source conditions on page 4.
Format Percent
Notes
By 72 months of age.
Data not available for all states – where state data is available, data may not be
available for all counties.
Table 29: Pediatric Asthma Hospital Admission
Primary Data
Source
AHRQ NHQR/NHDR http://statesnapshots.ahrq.gov/snaps11/
→ Click on Data Query.
→ Under Choose Data, select State.
→ Select Subject Area: Diseases & Conditions.
→ Select Topic: Respiratory Diseases.
→ Select Measure: Hospital admissions for asthma per 100,000 population,
ages 2-17 → Click “Get Data” and report the rate for the most recent year.
Other
Recommended
Data Source(s)
State Data Sources using AHRQ Pediatric Quality Indicator definition and
exclusions found at http://www.qualitymeasures.ahrq.gov/content.aspx?id=38549
Format Rate per 100,000
Notes
2-17 year olds.
Data not readily available at county level.
Additional pediatric asthma information found at
http://www.ahrq.gov/research/findings/factsheets/children/chasthma/index.html.
Table 30: Children who are Obese
Primary Data
Source
Child Health Data http://childhealthdata.org/browse/survey?s=2
→ In Section 1, select the National Survey of Children’s Health, the most current year,
and the desired geography.
→ In Section 2, choose “Physical and Dental Health”.
→ In Section 3, select Indicator 1.4: Childhood weight status in 4 categories, age 10
17 → Report the % In the “Obese” column.
→ Use “Edit Search Criteria” box on this page to obtain data by income, race/ethnicity,
gender, and other characteristics.
Page | 30 NFA Data Resource Guide

Table 30: Children who are Obese
Other
Recommended
Data Source(s)
State Health Department Data
Format Percent
Notes
10-17 year olds.
Data, available at national and state levels, are stratified by age, gender, race,
language, and income to allow for extrapolation.
6. Behavioral Health
Table 31: Adults with at least One Major Depressive Episode in the Past Year
Primary Data
Source
STATE RATES
SAMHSA National Survey on Drug Use and Health
http://www.samhsa.gov/data/sites/default/files/NSDUHsaePercents2014.pdf
→ Table 26 → Report rate in 18+ (Estimate) column.
Other
Recommended
Data Source(s)
SUBSTATE/METRO RATES
SAMHSA National Survey on Drug Use and Health
http://www.samhsa.gov/data/population-data-nsduh/reports?tab=34
http://www.samhsa.gov/data/us_map?map=3
Format Percent
Notes Data not available for all metro areas.
Table 32: Suicide Rate
Primary Data
Source
CDC WONDER http://wonder.cdc.gov
→ Select “Detailed Mortality”.
→ Under “1. Organize table layout” choose “group results by county” (and any other
demographics required).
→ Under “2. Select location” choose “States” and then select your state.
→ Under sections 3, 4, & 5, use default values.
→ Under “6. Select cause of death” choose ICD-10 codes, and choose codes *U03,
X60-X84, Y87.0.
→ Click “Send” and report the rate for the desired county.
UDS Mapper http://www.udsmapper.org
→ Under Tools, select Community Health View.
→ Under “Limit my search to” select only Counties.
→ Under “Select a Theme or Topic” check Death Rate, Suicides, 2005-2009.
→ Under “Select a group/category” select Rate per 100K.
→ Roll over the county to show the rate.
→ Indicator will appear in data table.
Page | 31 NFA Data Resource Guide

Table 32: Suicide Rate
Other
Recommended
Data Source(s)
AHRQ NHQR/NHDR
http://statesnapshots.ahrq.gov/snaps11/
→ Click on Data Query → Select State.
→ Select Subject Area: Diseases & Conditions.
→ Select Topic: Mental Health and Substance Abuse.
→ Select Measure: Suicide deaths per 100,000 population.
→ Click “Get Data” and report the rate for the most recent year.
Format Rate per 100,000
Notes For less populated geographies, it may be necessary to choose 10-year data
groups for data to be available.
Table 33: Binge Alcohol Use in the Past Month
Primary Data
Source
STATE RATES
SAMHSA National Survey on Drug Use and Health
http://www.samhsa.gov/data/sites/default/files/NSDUHsaePercents2014.pdf
→ Table 10 → Report rate in 12+ (Estimate) column.
Other
Recommended
Data Source(s)
SUBSTATE/METRO RATES
SAMHSA National Survey on Drug Use and Health
http://www.samhsa.gov/data/population-data-nsduh/reports?tab=34
http://www.samhsa.gov/data/us_map?map=3
Format Percent
Notes Data not available for all metro areas.
Table 34: Drug Poisoning Mortality (i.e., drug overdose)
Primary Data
Source
CDC WONDER http://wonder.cdc.gov
→ Select “Detailed Mortality”.
→ Under “1. Organize table layout” choose “group results by county” (and any other
demographics required). Check “Age Adjusted Rate”.
→ Under “2. Select location” choose “States” and then select your state.
→ Under sections 3, 4, & 5, use default values.
→ Under “6. Select cause of death” choose ICD-10 codes, and use the control key to
choose codes X40-X44, X60-X64, X85, Y10-Y14 (choose “open” to expand code
groupings).
→ Click Send → Report data in “Age Adjusted Rate per 100,000” column.
Page | 32 NFA Data Resource Guide

Table 34: Drug Poisoning Mortality (i.e., drug overdose)
Other
Recommended
Data Source(s)
UDS Mapper http://www.udsmapper.org
→ Under Tools, select Community Health View.
→ Under “Limit my search to” select only Counties.
→ Under “Select a Theme or Topic” check Death Rate, Drug Poisoning, 2007-2011.
→ Under “Select a group/category” select Rate per 100,000.
→ Roll over the county to show the rate.
→ Indicator will appear in data table.
Format Rate per 100,000
Notes
Must be age-adjusted.
For less populated geographies, it may be necessary to choose 10-year data groups
for data to be available.
Section III: Other Health and Access Indicators
Applicants must respond to two of the thirteen other health and access indicators. Applicants
should choose indicators that best characterize the needs of the service area or target
population.
Some of the indicators in the Other Health and Access Indicators section are only available at
the county or state level. However, a number of them are reported by demographic factors,
such as race/ethnicity, income, age, or gender. These can be used in combination with service
area demographic data to extrapolate to the proposed service area and/or target population.
Extrapolation techniques and guidelines are provided in the Extrapolating Data to Describe
Need section.
1. Age-adjusted Death Rate (per 100,000)
Table 35: Age-adjusted Death Rate (per 100,000)
Primary Data
Source
CDC WONDER http://wonder.cdc.gov
→ Select “Compressed Mortality”.
→ Select “Mortality for 1999 – 2014 with ICD 10 codes”.
→ Under “1. Organize table layout” choose group results by county (and any other
demographics required). Check “Age Adjusted Rate”.
→ Under “2. Select location” choose “States” and then select your state.
→ Under “3. Select years and demographics” use the shift key to choose the most
recent 3 years under “Year”.
→ Under section 4 & 5, use default values.
→ Click Send → Report the rate in the “Age Adjusted Rate per 100,000” column.
Page | 33 NFA Data Resource Guide

Table 35: Age-adjusted Death Rate (per 100,000)
Other
Recommended
Data Source(s)
UDS Mapper http://www.udsmapper.org
→ In the Explore Service Area tool, make sure the Map tab is selected for the view
(not the Data tab).
→ Under the Explore Service Area tool on the right menu, search/add selected
service area zip code(s) in the “Search To Go or Select” field.
→ Once all ZCTAs are selected, go to the Data tab.
→ Select the “Additional Population Data and Indicators” tab at the bottom of the
screen.
→ Scroll to the right and click on Age-Adjusted Mortality Rate (per 100,000).
→ Indicator will appear in data table.
Format Rate per 100,000
Notes
Must be age-adjusted.
For less populated geographies, it may be necessary to expand the selected range
of years up to 10-year data groups for data to be available.
2. HIV Infection Prevalence
Table 36: HIV Infection Prevalence
Primary Data
Source
CDC HIV Surveillance Reports
http://www.cdc.gov/hiv/library/reports/surveillance/index.html
→ Click on HIV Surveillance Reports → Select Current Issue: Diagnoses of HIV
Infection in the United States and Dependent Areas, 2014.
→ Go to Table 22 → Divide rate in Total column by 100,000 and then multiply by
100 to calculate percent.
County Health Rankings http://www.countyhealthrankings.org/
→ Select State → Select County.
→ Under Quality of Life, select Additional Health Outcomes → See HIV prevalence.
→ Divide rate by 100,000 and then multiply by 100 to calculate percent.
Other
Recommended
Data Source(s)
UDS Mapper http://www.udsmapper.org
→ Under Tools, select Community Health View.
→ Under “Limit my search to” select only Counties.
→ Under “Select a Theme or Topic” check HIV Prevalence, Rate per 100,000,
2009.
→ Under “Select a group/category” select Rate per 100,000 population.
→ Roll over the county to show the rate.
→ Indicator will appear in data table.
→ Divide rate by 100,000 and then multiply by 100 to calculate percent.
Format Percent
Notes CDC state and national data is available by race/ethnicity for most states.
Rate per 100,000 must be converted to percentage to respond to the indicator.
Page | 34 NFA Data Resource Guide

3. Percent Elderly
Table 37: Elderly
Primary Data
Source
American Community Survey on Fact Finder 2
http://factfinder2.census.gov/faces/nav/jsf/pages/index.xhtml
→ Click on Guided Search → Choose People → Under Topics, choose Age & Sex
and then Age → Choose your desired Geographies → Under Search Results,
choose Age & Sex → Scroll down in Table Viewer to 65 years and over.
Other
Recommended
Data Source(s)
CHSI http://wwwn.cdc.gov/CommunityHealth
→ Select State → Select County → Select County Demographics.
County Health Rankings http://www.countyhealthrankings.org/
→ Select State → Select County → Select County Demographics.
→ See % 65 and older.
Format Percent
Notes 65 and older.
4. Adult Asthma Hospital Admission Rate
Table 38: Adult Asthma Hospital Admission Rate
Primary Data
Source
State Data Sources
For National Data: HCUP
http://hcupnet.ahrq.gov/HCUPnet.jsp?Id=EFF272FAADE64853&Form=MAINSEL&J
S=Y&Action=%3E%3ENext%3E%3E&_MAINSEL=AHRQ%20Quality%20Indicators
Scroll down and select AHRQ Quality Indicators → QI Summary Tables → Indicator
Selection: Detailed statistics (select most recent year) → Adult Asthma.
Other
Recommended
Data Source(s)
See alternate data source conditions on page 4.
Format Rate per 100,000
Notes 18 years and older.
HCUP provides national rates available by age and gender to support extrapolation.
Page | 35 NFA Data Resource Guide

5. Chronic Obstructive Pulmonary Disease Hospital Admission Rate
Table 39: Chronic Obstructive Pulmonary Disease Hospital Admission Rate
Primary Data
Source
State Data Sources
For National Data: HCUP
http://hcupnet.ahrq.gov/HCUPnet.jsp?Id=EFF272FAADE64853&Form=MAINSEL&J
S=Y&Action=%3E%3ENext%3E%3E&_MAINSEL=AHRQ%20Quality%20Indicators
Scroll down and select AHRQ Quality Indicators → QI Summary Table.
→ Indicator Selection: Detailed statistics (select most recent year).
→ Chronic obstructive pulmonary disease (COPD).
Other
Recommended
Data Source(s)
See alternate data source conditions on page 4.
Format Rate per 100,000
Notes 18 years and older.
HCUP provides national rates available by age and gender to support extrapolation.
6. Influenza and Pneumonia Death Rate (3 year average)
Table 40: Influenza and Pneumonia Death Rate
Primary Data
Source
CDC WONDER http://wonder.cdc.gov
→ Select “Compressed Mortality”.
→ Select “Mortality for 1999 – 2014 with ICD 10 codes”.
→ Under “1. Organize table layout” choose “group results by county” (and any other
demographics required).
→ Under “2. Select location” choose “States” and then select your state.
→ Under “3. Select years and demographics” use the shift key to choose the most
recent 3 years under “year”.
→ Under “4. Select cause of death” choose ICD-10 codes J09-J18 (Influenza and
pneumonia) (choose “open” to expand code groupings).
→ Click Send and report the rate per 100,000.
Other
Recommended
Data Source(s)
UDS Mapper http://www.udsmapper.org
→ Under Tools, select Community Health View.
→ Under “Limit my search to” select only Counties.
→ Under “Select a Theme or Topic” check Death Rate, Influenza and Pneumonia,
2007-2011 → Under “Select a group/category” select Rate per 100,000.
→ Roll over the county to show the rate.
→ Indicator will appear in data table.
Format Rate per 100,000
Notes
3 year average.
For less populated geographies, it may be necessary to choose 10-year data
groups for data to be available.
Page | 36 NFA Data Resource Guide

7. Adult Current Asthma Prevalence
Table 41: Adult Current Asthma Prevalence
Primary Data
Source
FOR COUNTY LEVEL DATA
BRFSS https://chronicdata.cdc.gov/health-area/behavioral-risk-factors
→ Click on Dataset “Behavioral Risk Factors: Selected Metropolitan Area Risk
Trends (SMART) County Prevalence Data (2011 to 2012)”.
→ In the Locationdesc column, click on the left menu icon to filter by county.
→ In the Class column, click on the left menu icon to filter by Chronic Health
Indicators.
→ In the Topic column, click on the left menu icon to filter by Asthma.
→ In the Question column, click on the left menu icon to filter by “Adults who have
been told they currently have asthma”.
→ In the Response column, click on the left menu icon to filter by “Yes”.
→ Report the number in the Data_value column.
FOR SELECT METROPOLITAN AREA DATA
BRFSS https://chronicdata.cdc.gov/health-area/behavioral-risk-factors
→ Click on Dataset “Behavioral Risk Factors: Selected Metropolitan Area Risk
Trends (SMART) MMSA Prevalence Data (2011 to present)”.
→ In the Locationdesc column, click on the left menu icon to filter by metropolitan
area → Follow the steps above.
Other
Recommended
Data Source(s)
FOR STATE DATA
BRFSS http://www.cdc.gov/brfss/brfssprevalence/
→ Select State → Click Go.
→ Select Class: Chronic Health Indicators → Select Topic: Asthma.
→ Select most recent year → Click Go.
→ Scroll over the bar chart indicating Yes for “Adults who have been told they
currently have asthma”.
Format Percent
8. Age Adjusted Unintentional Injury Deaths (per 100,000)
Table 42: Age Adjusted Unintentional Injury Deaths
Primary Data
Source
CDC WONDER http://wonder.cdc.gov
→ Select “Detailed Mortality”.
→ Under “1. Organize table layout” choose group results by county (and any other
demographics required). Check “Age Adjusted Rate”.
→ Under “2. Select location” choose “States” and then select your state.
→ Under sections 3 & 5, use default values.
→ Under “4. Select year and month” use the shift key to choose the most recent 3
years.
→ Under “6. Select cause of death” choose “Injury Intent and Mechanism” and under
“Injury Intent” select “Unintentional”.
→ Click Send and report the rate in the “Age Adjusted Rate per 100,000” column.
Page | 37 NFA Data Resource Guide

Table 42: Age Adjusted Unintentional Injury Deaths
Other
Recommended
Data Source(s)
CDC Web Based Injury and Statistics Query and Reporting System (WISQARSTM
)
http://www.cdc.gov/injury/wisqars/index.html
CHSI http://wwwn.cdc.gov/CommunityHealth
→ Select State → Select County → Under Mortality, select Unintentional injury.
Format Rate per 100,000
Notes
Must be age-adjusted.
For less populated geographies it may be necessary to choose 10-year data groups
for data to be available.
9. Percent Population Linguistically Isolated
Table 43: Percent Population Linguistically Isolated
Primary Data
Source
American Community Survey on Fact Finder 2
http://factfinder2.census.gov/faces/nav/jsf/pages/index.xhtml
→ Click on Guided Search, then Get Me Started → Choose “I’m looking for
information about people” → Under Topics, choose Language and then Language
Spoken at Home → Choose your desired Geographies.
→ Click Next, then select “Skip This Step” on the next screen.
→ Under Search Results, choose Language Spoken at Home.
→ Report the percent of the Population 5 years and over in the “Speak English less
than very well” column.
Other
Recommended
Data Source(s)
UDS Mapper http://www.udsmapper.org
→ Under Tools, select Community Health View.
→ Under “Limit my search to” select only Counties.
→ Under “Select a Theme or Topic” check American Community Survey (ACS)
Five-Year Estimates, Language, 2010-2014.
→ Under “Select a group/category” select Percent Linguistically Isolated
Households.
→ Roll over the county to show the rate.
→ Indicator will appear in data table.
Format Percent
Notes People 5 years and older who speak English less than very well.
Page | 38 NFA Data Resource Guide

10. Adults that Could Not See a Doctor in the Past Year Due to Cost
Table 44: Adults that Could Not See a Doctor in the Past Year Due to Cost
Primary Data
Source
UDS Mapper http://www.udsmapper.org
→ In the Explore Service Area tool, make sure the Map tab is selected for the view
(not the Data tab).
→ Under the Explore Service Area tool on the right menu, search/add selected
service area zip code(s) in the “Search To Go or Select” field.
→ Once all ZCTAs are selected, go to the Data tab.
→ Select the “Additional Population Data and Indicators” tab at the bottom of the
screen.
→ Scroll to the right and click on Percent of adults who have delayed or not sought
care due to high cost, est. 07-12.
→ Indicator will appear in data table.
Other
Recommended
Data Source(s)
FOR STATE DATA
BRFSS http://www.cdc.gov/brfss/brfssprevalence/
→ Select State → Click Go.
→ Select Class: Health Care Access/Coverage → Select Topic: Health Care Cost.
→ Select most recent year → Click Go.
→ Scroll over the bar chart indicating Yes for the question “Was there a time in the
past 12 months when you needed to see a doctor but could not because of cost?”
Format Percent
Notes 18 years and older.
Page | 39 NFA Data Resource Guide

11. Adults 65 and Older Who Have Not Had a Flu Shot in the Past Year
Table 45: Adults 65 and Older Who Have Not Had a Flu Shot in the Past Year
Primary Data
Source
UDS Mapper http://www.udsmapper.org
→ Under Tools, select Community Health View.
→ Under “Limit my search to” select only Counties.
→ Under “Select a Theme or Topic” check Behavioral Risk Factor Surveillance
System (BFRSS), Adults 65 and older with Flu Vaccine, 2006-2010.
→ Under “Select a group/category” select Percentage 65+ with flu vaccine in past
year → Roll over the county to show the percentage.
→ Indicator will appear in data table.
→ Subtract rate from 100 to calculate data response.
FOR COUNTY LEVEL DATA
BRFSS https://chronicdata.cdc.gov/health-area/behavioral-risk-factors
→ Click on Dataset “Behavioral Risk Factors: Selected Metropolitan Area Risk
Trends (SMART) County Prevalence Data (2011 to 2012)”.
→ In the Locationdesc column, click on the left menu icon to filter by county.
→ In the Class column, click on the left menu icon to filter by Immunization.
→ In the Topic column, click on the left menu icon to filter by Flu Shot.
→ In the Question column, click on the left menu icon to filter by “Adults aged 65+
who have had a flu shot within the past year”.
→ In the Response column, click on the left menu icon to filter by “No”.
→ Report the number in the Data_value column.
FOR SELECT METROPOLITAN AREA DATA
BRFSS https://chronicdata.cdc.gov/health-area/behavioral-risk-factors
→ Click on Dataset “Behavioral Risk Factors: Selected Metropolitan Area Risk
Trends (SMART) MMSA Prevalence Data (2011 to present)”.
→ In the Locationdesc column, click on the left menu icon to filter by metropolitan
area → Follow the steps above.
Other
Recommended
Data Source(s)
FOR STATE DATA
BRFSS http://www.cdc.gov/brfss/brfssprevalence/
→ Select State → Click Go.
→ Select Class: Immunization → Select Topic: Flu Shot.
→ Select most recent year → Click Go.
→ Scroll over the bar chart indicating No for “Adults aged 65+ who have had a flushot within the past year.”
Format Percent
Page | 40 NFA Data Resource Guide

12. Chlamydia (Sexually Transmitted Infection)
Table 46: Chlamydia (Sexually Transmitted Infection) Rate
Primary Data
Source
CDC National Center for Hepatitis, HIV, STD, and TB Prevention
http://www.cdc.gov/nchhstp/
→ Under “Related Topics” select Sexually Transmitted Diseases.
→ Under “Diseases & Related Conditions” select Chlamydia.
→ In the left menu under Chlamydia, select Statistics.
→ Select STD Surveillance 2014 – Chlamydia.
→ Select “Chlamydia by State” Table 2, “Chlamydia by Metropolitan Statistical
Area” Table 6, or “Chlamydia by County” Table 9.
Other
Recommended
Data Source(s)
County Health Rankings http://www.countyhealthrankings.org/
→ Below the map, select Measure: Sexually Transmitted Infections → Select State.
→ Click “Go” → Report number in “Chlamydia Rate” column.
Health Indicators Warehouse (HIW)
http://www.healthindicators.gov/Indicators/Chlamydia-per
100000_20/Profile/ClassicData
→ Under “Table” tab, select State → Select County.
→ Report rate for most recent year.
Format Rate per 100,000.
13. Percent of Adults Without a Visit to a Dentist or Dental Clinic in thePast Year for Any Reason
Table 47: Percent of Adults Without a Visit to a Dentist or Dental Clinic in the Past Year
for Any Reason
Primary Data
Source
UDS Mapper http://www.udsmapper.org
→ In the Explore Service Area tool, make sure the Map tab is selected for the view
(not the Data tab) → Under the Explore Service Area tool on the right menu,
search/add selected service area zip code(s) in the “Search To Go or Select” field.
→ Once all ZCTAs are selected, go to the Data tab.
→ Select the “Additional Population Data and Indicators” tab at the bottom of the
screen.
→ Scroll to the right and click on Percent of adults with no dental visit in the past
year → Indicator will appear in data table.
Other
Recommended
Data Source(s)
FOR STATE DATA
BRFSS http://www.cdc.gov/brfss/brfssprevalence/
→ Select State → Click Go.
→ Select Class: Oral Health → Select Topic: Dental Visit.
→ Select most recent year → Click Go.
→ Scroll over the bar chart indicating No for “Visited the dentist or dental clinic within
the past year for any reason”.
Format Percent
Page | 41 NFA Data Resource Guide

Extrapolating Data to Describe Need
The NFA instructions specify the level of data (service area or target population) to be reported
for each measure based on application type (section 330 (e, g, h, or i)). When the data
available through the recommended/available sources do not match the geographic units for the
proposed service area or the characteristics of the proposed target population, the available
data may be extrapolated to develop estimates that describe the area and/or population to be
served.
For the purposes of the NFA, extrapolation is the process of using data that describes one
population to estimate data for a comparable population, based on one or more common
differentiating demographic characteristics. This process requires careful consideration of the
nature of the measure and the available factors upon which it will be differentiated, as there is
potential to introduce bias due to correlated factors that cannot be included in the extrapolation.
The requirements for extrapolation include:
The measure is reported separately for different demographic groups.
There are differences in the relative rates/percentages for the demographic groups (or
the extrapolation will not alter the measure).
The service area or target population can be quantified according to the same
differentiating demographic characteristics.
The demographic groups that the measure is reported on are conceptually similar to
those groups in the service area or target population. For example, one would not want
to extrapolate a diabetes rate using race if the black population in the service area was
considerably younger than the overall black population for which the measure is
reported.
Note that if portions of the service area fall into separate areas for which the measure is
reported (e.g., different zip codes), the extrapolation must be done separately for each area for
which the measure is reported, and then combined to show the overall rate for the area.
The following table provides examples of circumstances when the use of extrapolation is
appropriate.
Page | 42 NFA Data Resource Guide

Table 48: When to Use Extrapolation
Extrapolation Level Appropriate When
Extrapolation to service area
Data for the measure is available at the county level but the
applicant’s service area includes only a few Census tracts in the
county.
OR
Applicant’s service area is split across two counties with different
rates for the measure.
Extrapolation to target population
Data for the measure is available at the county level, but the
applicant intends to serve primarily the low income population
within the county.
OR
The applicant intends to serve a special population for which data
is not normally reported.
Extrapolation to both service area and target population
Data for the measure is available at the county level but the
applicant intends to target the low income population in a few
census tracts within the county.
Applicants must document how any extrapolation was conducted and the data sources used.
Specifically, applicants should note:
1. The level of geography and population for the indicator data obtained.
2. The differentiating factor(s) on which extrapolation was based (e.g., separate rates by
income/poverty, age, gender).
3. The source for the service area population data.
4. The level of geography for the data reported.
If data are not available to conduct a valid extrapolation to the service area and/or target
population within it, the applicant must use data pertaining to the immediately surrounding
geographic area/population (e.g., if target population data are not available, service area data
may be used; if county level data are available, state level data cannot be used).
The following example shows how extrapolation is typically performed and how it can impact the
value of a measure.
Example: Extrapolating Core Barrier: Percent Population Uninsured, from County to
Service Area.
Extrapolation Requirements: Applicants must provide data response at service area level.
Page | 43 NFA Data Resource Guide

Scenario: Data for the measure (% uninsured) is available at the county level, but the
applicants’ service area includes a group of Census tracts within that county. Data must be
reported for the total population in the service area. Extrapolating data for percent population
uninsured will require the following steps.
Step 1: Calculate Percent of Population Uninsured by Federal Poverty Level (FPL) at County
Level.
Obtain data for the measure, at the most detailed geography available, broken out by the
demographic characteristic(s) on which the measure will be extrapolated.
In this instance (see table below), data are available for the county containing the service area,
and the extrapolation uses different ratios of the federal poverty level. The county has 293,685
residents of which 28,664 or 9.8% are uninsured. The rate of uninsurance is considerably
higher for those in the lower income ranges.
Statistical data can be raw population data (as in Table 49, columns a and b) from which the
measure must be calculated, or a standard statistic as in column c below (i.e.,
4,419/14,777=29.9% uninsurance rate for those below poverty).
Table 49: Percent of Population Uninsured by Federal Poverty Level (FPL) at County Level
Demographic Differentiating Factor Differentiated Measure at LARGER Geography (County)
a b c (= a / b)
Federal Poverty Level (FPL) Uninsured by FPL in
County Total Population by
FPL in County Percent Population Uninsured
by FPL in County
< 100% FPL 4,419 14,777 29.9%
100-199% FPL 7,004 28,173 24.9%
200 to 299% FPL 6,644 37,296 17.8%
300 to 399% FPL 4,756 46,751 10.2%
400 % FPL and over 5,841 166,688 3.5%
Totals 28,664 293,685 9.8%
Note: U.S. Census American Community Survey (ACS) data is the usual source for population
counts by demographic characteristics.
Step 2: Calculate Percent of Population by FPL in Service Area.
Obtain service area or target population data for the same demographic characteristics as the
county data in Table 49.
The service area is comprised of several Census tracts and Table 50, Column d shows raw
population counts that are the sum of the population count by FPL for the Census tracts in the
service area. Column e shows the percentages by FPL within the service area (calculated from
the sum of the numbers in column d). Table 50 shows that the service area has a total of
Page | 44 NFA Data Resource Guide

29,893 residents, of which 4,293 or 14.4% are below 100% FPL; 5,519 or 18.5% are between
100-200% FPL; etc.
Table 50: Percent of Population by FPL in Service Area
Demographic Differentiating Factor
TOTAL Population Within Service Area (Several Tracts within County)
d e (= d / sum of d)
Federal Poverty Level (FPL) Population Count by FPL in
Service Area Percent of Population by
FPL in Service Area
< 100% FPL 4,293 14.4%
100-199% FPL 5,519 18.5%
200 to 299% FPL 5,042 16.9%
300 to 399% FPL 4,133 13.8%
400 % FPL and over 10,906 36.5%
Totals 29,893
Step 3: Apply the demographic-specific rates obtained for the measure (% uninsured) from the
county to the service area or target population to obtain an estimate of the measure for the
service area or target population.
Multiply the percentage of uninsured by FPL at the county level (Table 49, column c) by the
count of individuals in that poverty range in the service area (Table 50, column d). This will
provide an estimate of the uninsured for each poverty range (see column f in Table 51).
Table 51: Percent of the Service Area Population (Several Tracts within County)
that is Uninsured
Demographic Differentiating Factor
Table 49, column c Table 50, column d column f
(Table 49, column c * Table 50, column d)
Federal Poverty Level (FPL) Percent Population
Uninsured by FPL in County
Population Count by FPL in Service Area
Number of Service Area Population Uninsured
< 100% FPL 29.9% 4,293 1,284
100-199% FPL 24.9% 5,519 1,372
200 to 299% FPL 17.8% 5,042 898
300 to 399% FPL 10.2% 4,133 420
400 % FPL and over 3.5% 10,906 382
Totals 9.8% 29,893 4,357
Calculation of % Uninsured in Service Area 4,357 divided by 29,893= 14.6%
Add the estimate of uninsured across poverty ranges in column f to get the count of total
uninsured in the service area (Table 51, column f, Total). Divide the count of total uninsured
(column f, Total) by the total population in the service area (Table 50, Column d, Total) to get
the % population uninsured in the service area.
Page | 45 NFA Data Resource Guide

Because the service area/target Census tracts have a higher portion of people at the lower end
of the income scale, and the uninsurance rate is higher among the lower income groups, the
rate for percent uninsured in the targeted service area is estimated to be 14.6% compared to
9.8% for the county overall.
Note: The calculations for an extrapolation to a specific target population (or for an extrapolation
that includes both service area and target population estimates) involves changing only the
values for the population to which the extrapolation is applied (columns d & e in the example
above).
Table 52 below combines the three steps taken above.
Table 52: Steps 1, 2, and 3 Combined
Demographic Differentiating Factor
Differentiated Measure at LARGER Geography (County)
a b c ( = a / b)
Poverty Ratio
Uninsured by Poverty Ratio in
County
Total Population by
Poverty Ratio in County
Percent Population Uninsured by
Poverty Ratio in County
Under 1.00 of poverty threshold 4,419 14,777 29.9%
1.00 to 1.99 of poverty threshold 7,004 28,173 24.9%
2.00 to 2.99 of poverty threshold 6,644 37,296 17.8%
3.00 to 3.99 of poverty threshold 4,756 46,751 10.2%
4.00 to 4.99 of poverty threshold 5,841 166,688 3.5%
Totals 28,664 293,685 9.8%
TOTAL Population Within Service Area (Several Tracts within County)
d e (= d / sum of d)
Population Count by Poverty Ratio in Service
Area Census Tracts
Percent of Population by Poverty Ratio in Service
Area Census Tracts
4,293 14.4%
5,519 18.5%
5,042 16.9%
4,133 13.8%
10,906 36.5%
29,893
Service Area Estimates of Measure
c * d c * e
Estimates of Uninsured Population
Estimate of Uninsured by
Percent of Total Pop
1,284 4.3%
1,372 4.6%
898 3.0%
420 1.4%
382 1.3%
4,357 14.6%
The example above shows the general approach to extrapolation. By considering the sources
of information available and the nature of the population you are trying to develop estimates for,
one can adapt this approach to a variety of situations. A sample extrapolation worksheet to
assist applicants in calculating extrapolated data is available at
http://bphc.hrsa.gov/programopportunities/fundingopportunities/nap.
Page | 46 NFA Data Resource Guide

Additional Data Resources
This section provides a listing of data sources that may be useful in completing the NFA worksheet. In addition, the Bureau of Primary Health Care’s National Training and Technical Assistance Cooperative Agreement partners (NCAs) provide technical assistance and resources focused on migratory and seasonal agricultural workers, people experiencing homelessness, residents of public housing, and other vulnerable populations. For a complete listing of NCAs, refer to http://bphc.hrsa.gov/qualityimprovement/strategicpartnerships/ncapca/natlagreement.html.
National Center for Farmworker Health
The National Center for Farmworker Health’s mission is to improve the health status offarm worker families through the provision of innovative training, technical assistance,and information services to migrant and community health centers. Their resourcecenter and digital library collection include fact sheets, studies, survey data, and listingsof various data resources specific to the migratory and seasonal agricultural workerpopulations.
Source: http://www.ncfh.org/
National Coalition for the Homeless
The National Coalition for the Homeless’ mission is to prevent and end homelessnesswhile ensuring the immediate needs of those experiencing homelessness are met andtheir civil rights protected. The information clearinghouse includes fact sheets andpublications addressing homeless-population specific data.
Source: http://www.nationalhomeless.org/publications/
The Urban Institute
The Urban Institute’s mission is to promote sound social policy and public debate onnational priorities such as homelessness, and the link below connects to the collection ofUrban Institute publications on homeless issues.
Source: http://www.urban.org/research-area/homelessness
The U.S. Conference of Mayors Hunger and Homelessness Survey
This report contains data collected from 22 cities whose mayors serve on theConference of Mayors Hunger and Homelessness Task Force. The report describescharacteristics of the homeless population and contains city profiles.
Source: http://usmayors.org/pressreleases/uploads/2015/1221-report-hhreport.pdf
U.S. Department of Health and Human Services Office of Minority Health (OMH) Resource Center
The OMH Resource Center offers a variety of information resources and publicationsrelated to the health status of racial and ethnic minority populations.
Source: http://www.minorityhealth.hhs.gov/omh/browse.aspx?lvl=1&lvlid=3
U.S. Department of Housing and Urban Development (HUD) Annual Homeless Assessment Report to Congress
This report outlines the key findings of homelessness counts in the United States. Thelink provides access to the data and additional tools.
Source: https://www.hudexchange.info/hdx/guides/ahar/
Page | 47 NFA Data Resource Guide