data notes - doing business
TRANSCRIPT

The indicators presented and analyzed
in Doing Business measure business reg-
ulation and the protection of property
rights—and their effect on businesses, es-
pecially small and medium-size domestic
firms. First, the indicators document the
complexity of regulation, such as the
number of procedures to start a business
or to register and transfer commercial
property. Second, they gauge the time
and cost to achieve a regulatory goal or
comply with regulation, such as the time
and cost to enforce a contract, go through
bankruptcy or trade across borders. Third,
they measure the extent of legal protec-
tions of property, for example, the pro-
tections of investors against looting by
company directors or the range of assets
that can be used as collateral according to
secured transactions laws. Fourth, a set of
TABLE 21.1 Topics and economies covered by each Doing Business report
TopicDB
2004DB
2005DB
2006DB
2007DB
2008DB
2009DB
2010DB
2011DB
2012DB
2013DB
2014
Getting electricity
Dealing with construction permits
Trading across borders
Paying taxes
Protecting investors
Registering property
Getting credit
Resolving insolvency
Enforcing contracts
Employing workers
Starting a business
Number of economies 133 145 155 175 178 181 183 183 183 185 189
indicators documents the tax burden on
businesses. Finally, a set of data covers
different aspects of employment regula-
tion. The 11 sets of indicators measured
in Doing Business were added over time,
and the sample of economies expanded
(table 21.1).
The data for all sets of indicators in Doing
Business 2014 are for June 2013.1
METHODOLOGYThe Doing Business data are collected in
a standardized way. To start, the Doing
Business team, with academic advisers,
designs a questionnaire. The question-
naire uses a simple business case to
ensure comparability across economies
Note: Data for the economies added to the sample each year are back-calculated to the previous year. The excep-tion is Kosovo, which was added to the sample after it became a member of the World Bank Group.
Data notes

and over time—with assumptions about
the legal form of the business, its size,
its location and the nature of its opera-
tions. Questionnaires are administered
to more than 10,200 local experts, in-
cluding lawyers, business consultants,
accountants, freight forwarders, govern-
ment officials and other professionals
routinely administering or advising on
legal and regulatory requirements (table
21.2). These experts have several rounds
of interaction with the Doing Business
team, involving conference calls, written
correspondence and visits by the team.
For Doing Business 2014 team members
visited 33 economies to verify data and
recruit respondents. The data from ques-
tionnaires are subjected to numerous
rounds of verification, leading to revi-
sions or expansions of the information
collected.
The Doing Business methodology offers
several advantages. It is transparent, us-
ing factual information about what laws
and regulations say and allowing multi-
ple interactions with local respondents
to clarify potential misinterpretations of
questions. Having representative sam-
ples of respondents is not an issue; Doing
Business is not a statistical survey, and the
texts of the relevant laws and regulations
are collected and answers checked for
accuracy. The methodology is inexpen-
sive and easily replicable, so data can be
collected in a large sample of economies.
Because standard assumptions are used
in the data collection, comparisons and
benchmarks are valid across economies.
Finally, the data not only highlight the
extent of specific regulatory obstacles to
business but also identify their source and
point to what might be reformed.
LIMITS TO WHAT IS MEASUREDThe Doing Business methodology has 5
limitations that should be considered
when interpreting the data. First, the
TABLE 21.2 How many experts does Doing Business consult?
Economies with given number of respondents (%)
Indicator set Respondents 1–2 3–5 5+
Starting a business 1,831 5 28 67
Dealing with construction permits 956 25 37 38
Getting electricity 811 25 50 24
Registering property 1,189 17 35 47
Getting credit 1,453 7 33 60
Protecting investors 1,110 24 37 40
Paying taxes 1,186 8 39 52
Trading across borders 1,040 20 49 31
Enforcing contracts 1,248 18 39 43
Resolving insolvency 1,047 23 37 40
Employing workers 1,155 19 40 42
Total 13,026 17 39 44
ECONOMY CHARACTERISTICS
Gross national income per capita Doing Business 2014 reports 2012 income per capita as published in the World
Bank’s World Development Indicators 2013. Income is calculated using the Atlas
method (current U.S. dollars). For cost indicators expressed as a percentage of
income per capita, 2012 gross national income (GNI) in U.S. dollars is used as
the denominator. GNI data were not available from the World Bank for Afghan-
istan, The Bahamas, Bahrain, Barbados, Brunei Darussalam, Djibouti, the Islamic
Republic of Iran, Kuwait, Libya, Myanmar, New Zealand, Oman, San Marino, the
Syrian Arab Republic, West Bank and Gaza, and the Republic of Yemen. In these
cases GDP or GNP per capita data and growth rates from other sources, such
as the International Monetary Fund’s World Economic Outlook database and the
Economist Intelligence Unit, were used.
Region and income group Doing Business uses the World Bank regional and income group classifications,
available at http://data.worldbank.org/about/country-classifications. The World
Bank does not assign regional classifications to high-income economies. For the
purpose of the Doing Business report, high-income OECD economies are assigned
the “regional” classification OECD high income. Figures and tables presenting re-
gional averages include economies from all income groups (low, lower middle,
upper middle and high income).
PopulationDoing Business 2014 reports midyear 2012 population statistics as published in
World Development Indicators 2013.
DATA NOTES 131
collected data refer to businesses in the
economy’s largest business city (which in
some economies differs from the capital)
and may not be representative of regu-
lation in other parts of the economy. To
address this limitation, subnational Do-
ing Business indicators were created (box
21.1). Second, the data often focus on a
specific business form—generally a limit-
ed liability company (or its legal equiva-
lent) of a specified size—and may not be
representative of the regulation on other
businesses, for example, sole proprietor-
ships. Third, transactions described in a
standardized case scenario refer to a spe-
cific set of issues and may not represent
the full set of issues a business encoun-
ters. Fourth, the measures of time involve
an element of judgment by the expert
respondents. When sources indicate
different estimates, the time indicators
reported in Doing Business represent the
median values of several responses given
under the assumptions of the standard-
ized case.
Finally, the methodology assumes that a
business has full information on what is
required and does not waste time when
completing procedures. In practice, com-
pleting a procedure may take longer if
the business lacks information or is un-
able to follow up promptly. Alternatively,
the business may choose to disregard
some burdensome procedures. For both
reasons the time delays reported in Do-
ing Business 2014 would differ from the
recollection of entrepreneurs reported
in the World Bank Enterprise Surveys or
other perception surveys.
CHANGES IN WHAT IS MEASUREDThe methodology for 2 indicator sets—
trading across borders and paying taxes—
was updated this year. For trading across
borders, documents that are required
purely for purposes of preferential treat-
ment are no longer included in the list of
documents (for example, a certificate
of origin if the use is only to qualify for a
preferential tariff rate under trade agree-
ments). For paying taxes, the value of fuel
taxes is no longer included in the total tax
rate because of the difficulty of computing
these taxes in a consistent way across all
economies covered. The fuel tax amounts
are in most cases very small, and measur-
ing these amounts is often complicated
because they depend on fuel consump-
tion. Fuel taxes continue to be counted in
the number of payments.
In a change involving several indicator
sets, the rule establishing that each pro-
cedure must take at least 1 day was re-
moved for procedures that can be fully
completed online in just a few hours.
This change affects the time indicator
for starting a business, dealing with con-
struction permits and registering prop-
erty.2 For procedures that can be fully
completed online, the duration is now set
at half a day rather than a full day.
The threshold for the total tax rate intro-
duced in 2011 for the purpose of calcu-
lating the ranking on the ease of paying
taxes was updated. All economies with a
total tax rate below the threshold (which
is calculated and adjusted on a yearly
basis) receive the same ranking on the
total tax rate indicator. The threshold is
not based on any economic theory of an
“optimal tax rate” that minimizes distor-
tions or maximizes efficiency in the tax
system of an economy overall. Instead,
it is mainly empirical in nature, set at
the lower end of the distribution of tax
rates levied on medium-size enterprises
in the manufacturing sector as observed
through the paying taxes indicators. This
reduces the bias in the indicators toward
economies that do not need to levy sig-
nificant taxes on companies like the Doing
Business standardized case study compa-
ny because they raise public revenue in
other ways—for example, through taxes
on foreign companies, through taxes on
sectors other than manufacturing or from
natural resources (all of which are outside
the scope of the methodology). This year
the threshold is 25,5%.
DATA CHALLENGES AND REVISIONSMost laws and regulations underlying
the Doing Business data are available on
the Doing Business website at http://www
.doingbusiness.org. All the sample ques-
tionnaires and the details underlying
the indicators are also published on the
website. Questions on the methodology
and challenges to data can be submitted
through the website’s “Ask a Question”
function at http://www.doingbusiness.org.
Doing Business publishes 10,584 indi-
cators (56 indicators per country) each
year. To create these indicators, the team
measures more than about 58,000 data
points, each of which is made available
on the Doing Business website. Historical
data for each indicator and economy are
available on the website, beginning with
the first year the indicator or economy
was included in the report. To provide a
comparable time series for research, the
data set is back-calculated to adjust for
BOX 21.1 Subnational Doing Business indicators
This year Doing Business completed subnational studies in Colombia, Italy and the
city of Hargeisa (Somaliland) and is currently updating indicators in Egypt, Mex-
ico and Nigeria. Doing Business also published regional studies for the g7+ and
the East African Community. The g7+ group is a country-owned and country-led
global mechanism established in April 2010 to monitor, report and draw attention
to the unique challenges faced by fragile states. The member countries included
in the report are Afghanistan, Burundi, the Central African Republic, Chad, the Co-
moros, the Democratic Republic of Congo, Côte d’Ivoire, Guinea, Guinea-Bissau,
Haiti, Liberia, Papua New Guinea, Sierra Leone, the Solomon Islands, South Sudan,
Timor-Leste and Togo.
The subnational studies point to differences in business regulation and its imple-
mentation—as well as in the pace of regulatory reform—across cities in the same
economy. For several economies subnational studies are now periodically updat-
ed to measure change over time or to expand geographic coverage to additional
cities. This year that is the case for all the subnational studies published.
DOING BUSINESS 2014132
changes in methodology and any revi-
sions in data due to corrections. The web-
site also makes available all original data
sets used for background papers. The cor-
rection rate between Doing Business 2013
and Doing Business 2014 is 8.5%.3
Governments submit queries on the data
and provide new information to Doing
Business. During the Doing Business 2014
production cycle the team received 82
such queries from governments.
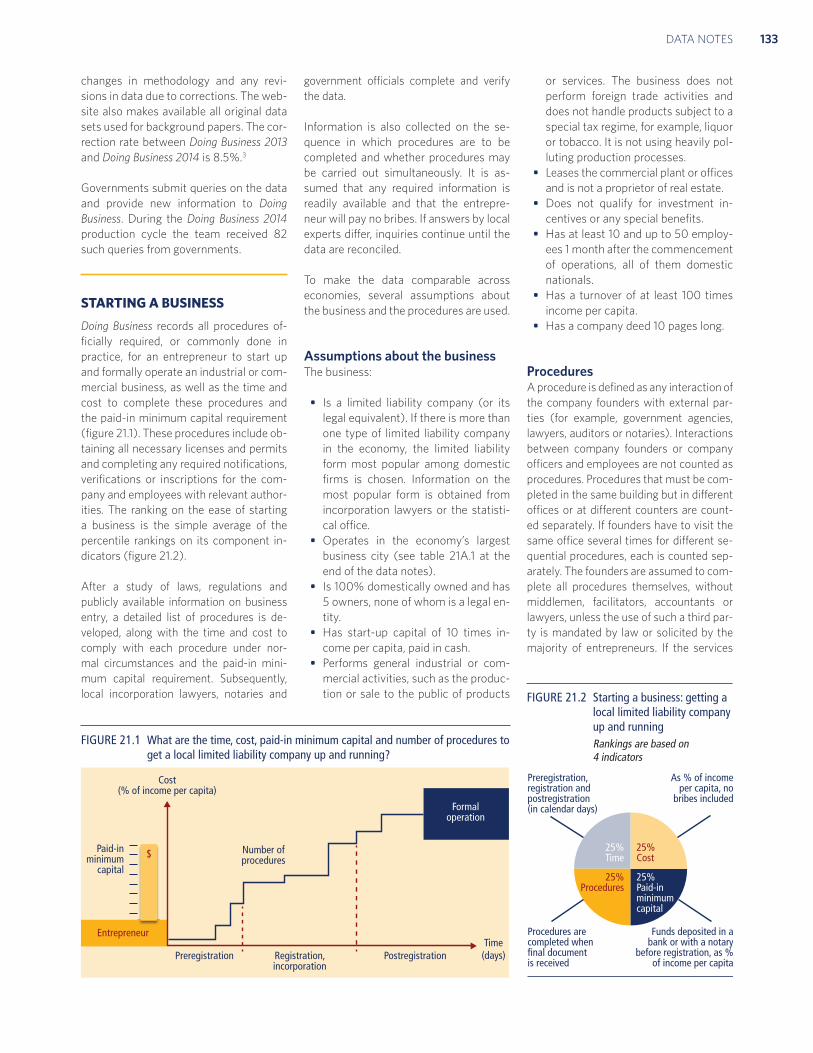
STARTING A BUSINESSDoing Business records all procedures of-
ficially required, or commonly done in
practice, for an entrepreneur to start up
and formally operate an industrial or com-
mercial business, as well as the time and
cost to complete these procedures and
the paid-in minimum capital requirement
(figure 21.1). These procedures include ob-
taining all necessary licenses and permits
and completing any required notifications,
verifications or inscriptions for the com-
pany and employees with relevant author-
ities. The ranking on the ease of starting
a business is the simple average of the
percentile rankings on its component in-
dicators (figure 21.2).
After a study of laws, regulations and
publicly available information on business
entry, a detailed list of procedures is de-
veloped, along with the time and cost to
comply with each procedure under nor-
mal circumstances and the paid-in mini-
mum capital requirement. Subsequently,
local incorporation lawyers, notaries and
government officials complete and verify
the data.
Information is also collected on the se-
quence in which procedures are to be
completed and whether procedures may
be carried out simultaneously. It is as-
sumed that any required information is
readily available and that the entrepre-
neur will pay no bribes. If answers by local
experts differ, inquiries continue until the
data are reconciled.
To make the data comparable across
economies, several assumptions about
the business and the procedures are used.
Assumptions about the businessThe business:
• Is a limited liability company (or its
legal equivalent). If there is more than
one type of limited liability company
in the economy, the limited liability
form most popular among domestic
firms is chosen. Information on the
most popular form is obtained from
incorporation lawyers or the statisti-
cal office.
• Operates in the economy’s largest
business city (see table 21A.1 at the
end of the data notes).
• Is 100% domestically owned and has
5 owners, none of whom is a legal en-
tity.
• Has start-up capital of 10 times in-
come per capita, paid in cash.
• Performs general industrial or com-
mercial activities, such as the produc-
tion or sale to the public of products
or services. The business does not
perform foreign trade activities and
does not handle products subject to a
special tax regime, for example, liquor
or tobacco. It is not using heavily pol-
luting production processes.
• Leases the commercial plant or offices
and is not a proprietor of real estate.
• Does not qualify for investment in-
centives or any special benefits.
• Has at least 10 and up to 50 employ-
ees 1 month after the commencement
of operations, all of them domestic
nationals.
• Has a turnover of at least 100 times
income per capita.
• Has a company deed 10 pages long.
ProceduresA procedure is defined as any interaction of
the company founders with external par-
ties (for example, government agencies,
lawyers, auditors or notaries). Interactions
between company founders or company
officers and employees are not counted as
procedures. Procedures that must be com-
pleted in the same building but in different
offices or at different counters are count-
ed separately. If founders have to visit the
same office several times for different se-
quential procedures, each is counted sep-
arately. The founders are assumed to com-
plete all procedures themselves, without
middlemen, facilitators, accountants or
lawyers, unless the use of such a third par-
ty is mandated by law or solicited by the
majority of entrepreneurs. If the services
25% Time
25% Procedures
25% Cost
25% Paid-in minimum capital
As % of incomeper capita, no
bribes included
Preregistration, registration and postregistration (in calendar days)
Funds deposited in abank or with a notary
before registration, as %of income per capita
Procedures are completed when final document is received
Cost(% of income per capita)
Number of procedures
Formaloperation
Preregistration
Entrepreneur
Registration,incorporation
Postregistration
Paid-inminimum
capital
$
Time(days)
FIGURE 21.2 Starting a business: getting a local limited liability company up and running Rankings are based on 4 indicators
FIGURE 21.1 What are the time, cost, paid-in minimum capital and number of procedures to get a local limited liability company up and running?
DATA NOTES 133

of professionals are required, procedures
conducted by such professionals on behalf
of the company are counted separately.
Each electronic procedure is counted sep-
arately. If 2 procedures can be completed
through the same website but require sep-
arate filings, they are counted as 2 sepa-
rate procedures.
Both pre- and postincorporation proce-
dures that are officially required for an en-
trepreneur to formally operate a business
are recorded (table 21.3).
Procedures required for official correspon-
dence or transactions with public agencies
are also included. For example, if a compa-
ny seal or stamp is required on official doc-
uments, such as tax declarations, obtain-
ing the seal or stamp is counted. Similarly,
if a company must open a bank account
before registering for sales tax or value
added tax, this transaction is included as
a procedure. Shortcuts are counted only
if they fulfill 4 criteria: they are legal, they
are available to the general public, they are
used by the majority of companies, and
avoiding them causes substantial delays.
Only procedures required of all business-
es are covered. Industry-specific proce-
dures are excluded. For example, pro-
cedures to comply with environmental
regulations are included only when they
apply to all businesses conducting gen-
eral commercial or industrial activities.
Procedures that the company undergoes
to connect to electricity, water, gas and
waste disposal services are not included.
TimeTime is recorded in calendar days. The
measure captures the median duration
that incorporation lawyers indicate is
necessary in practice to complete a pro-
cedure with minimum follow-up with
government agencies and no extra pay-
ments. It is assumed that the minimum
time required for each procedure is 1 day,
except for procedures that can be fully
completed online, for which the time re-
quired is recorded as half a day. Although
procedures may take place simultaneous-
ly, they cannot start on the same day (that
is, simultaneous procedures start on con-
secutive days), again with the exception
of procedures that can be fully completed
online. A procedure is considered com-
pleted once the company has received
the final incorporation document, such
as the company registration certificate or
tax number. If a procedure can be accel-
erated for an additional cost, the fastest
procedure is chosen if that option is more
beneficial to the economy’s ranking. It is
assumed that the entrepreneur does not
waste time and commits to completing
each remaining procedure without delay.
The time that the entrepreneur spends on
gathering information is ignored. It is as-
sumed that the entrepreneur is aware of
all entry requirements and their sequence
from the beginning but has had no prior
contact with any of the officials.
CostCost is recorded as a percentage of
the economy’s income per capita. It in-
cludes all official fees and fees for legal or
professional services if such services are
required by law. Fees for purchasing and
legalizing company books are included
if these transactions are required by law.
Although value added tax registration can
be counted as a separate procedure, value
added tax is not part of the incorporation
cost. The company law, the commercial
code and specific regulations and fee
schedules are used as sources for calcu-
lating costs. In the absence of fee sched-
ules, a government officer’s estimate is
taken as an official source. In the absence
of a government officer’s estimate, esti-
mates of incorporation lawyers are used.
If several incorporation lawyers provide
different estimates, the median reported
value is applied. In all cases the cost ex-
cludes bribes.
Paid-in minimum capitalThe paid-in minimum capital requirement
reflects the amount that the entrepreneur
needs to deposit in a bank or with a nota-
ry before registration and up to 3 months
following incorporation and is recorded
as a percentage of the economy’s income
per capita. The amount is typically spec-
ified in the commercial code or the com-
pany law. Many economies require mini-
mum capital but allow businesses to pay
only a part of it before registration, with
the rest to be paid after the first year of
operation. In Turkey in June 2013, for ex-
ample, the minimum capital requirement
was 10,000 Turkish liras, of which one-
fourth needed to be paid before registra-
tion. The paid-in minimum capital record-
ed for Turkey is therefore 2,500 Turkish
liras, or 14.35% of income per capita.
The data details on starting a business can
be found for each economy at http://www
.doingbusiness.org by selecting the economy
in the drop-down list. This methodology was
developed by Djankov and others (2002)
and is adopted here with minor changes.
DEALING WITH CONSTRUCTION PERMITSDoing Business records all procedures re-
quired for a business in the construction
industry to build a warehouse (figure 21.3).
These procedures include obtaining and
submitting all relevant project-specific
documents (for example, building plans,
TABLE 21.3 What do the starting a business indicators measure?
Procedures to legally start and operate a company (number)
Preregistration (for example, name verification or reservation, notarization)
Registration in the economy’s largest business city
Postregistration (for example, social security registration, company seal)
Time required to complete each procedure (calendar days)
Does not include time spent gathering information
Each procedure starts on a separate day (2 procedures cannot start on the same day). Procedures that can be fully completed online are an exception to this rule.
Procedure considered completed once final incorporation document is received
No prior contact with officials
Cost required to complete each procedure (% of income per capita)
Official costs only, no bribes
No professional fees unless services required by law
Paid-in minimum capital (% of income per capita)
Funds deposited in a bank or with a notary before registration (or within 3 months)
DOING BUSINESS 2014134

site maps and certificates of urbanism) to
the authorities; hiring external third-party
supervisors, engineers or inspectors (if
necessary); obtaining all necessary clear-
ances, licenses, permits and certificates;
submitting all required notifications; and
requesting and receiving all necessary in-
spections (unless completed by a private,
third-party inspector). Doing Business also
records procedures for obtaining con-
nections for water, sewerage and a fixed
landline. Procedures necessary to register
the property so that it can be used as col-
lateral or transferred to another entity are
also counted. The questionnaire divides
the process of building a warehouse into
distinct procedures and solicits data for
calculating the time and cost to complete
each procedure. The ranking on the ease
of dealing with construction permits is the
simple average of the percentile rankings
on its component indicators (figure 21.4).
Information is collected from experts in
construction licensing, including archi-
tects, civil engineers, construction law-
yers, construction firms, utility service
providers and public officials who deal
with building regulations, including ap-
provals, permit issuance and inspections.
To make the data comparable across
economies, several assumptions about
the business, the warehouse project and
the utility connections are used.
Assumptions about the construction companyThe business (BuildCo):
• Is a limited liability company.
• Operates in the economy’s largest
business city (see table 21A.1).
• Is 100% domestically and privately
owned.
• Has 5 owners, none of whom is a legal
entity.
• Is fully licensed and insured to carry
out construction projects, such as
building warehouses.
• Has 60 builders and other employees,
all of them nationals with the techni-
cal expertise and professional experi-
ence necessary to obtain construction
permits and approvals.
• Has at least 1 employee who is a li-
censed architect or engineer and reg-
istered with the local association of
architects or engineers.
• Has paid all taxes and taken out all
necessary insurance applicable to its
general business activity (for example,
accidental insurance for construction
workers and third-person liability).
• Owns the land on which the ware-
house is built.
Assumptions about the warehouse The warehouse:
• Will be used for general storage ac-
tivities, such as storage of books or
stationery. The warehouse will not be
used for any goods requiring special
conditions, such as food, chemicals or
pharmaceuticals.
• Has 2 stories, both above ground, with
a total surface of 1,300.6 square me-
ters (14,000 square feet). Each floor is
3 meters (9 feet, 10 inches) high.
• Has road access and is located in the
periurban area of the economy’s larg-
est business city (that is, on the fring-
es of the city but still within its official
limits).
• Is not located in a special econom-
ic or industrial zone. The zoning re-
quirements for warehouses are met
by building in an area where similar
warehouses can be found.
• Is located on a land plot of 929 square
meters (10,000 square feet) that is
100% owned by BuildCo and is accu-
rately registered in the cadastre and
land registry.
• Is a new construction (there was no
previous construction on the land).
• Has complete architectural and tech-
nical plans prepared by a licensed ar-
chitect.
• Will include all technical equipment
required to make the warehouse fully
operational.
• Will take 30 weeks to construct (ex-
cluding all delays due to administra-
tive and regulatory requirements).
Assumptions about the utility connectionsThe water and sewerage connection:
• Is 10 meters (32 feet, 10 inches) from
the existing water source and sewer tap.
• Does not require water for fire pro-
tection reasons; a fire extinguishing
Cost(% of income per capita)
Number of procedures
Completed warehouse
Preconstruction
A business in the construction
industry
Construction Postconstruction and utilitiesTime
(days)
FIGURE 21.3 What are the time, cost and number of procedures to comply with formalities to build a warehouse?
FIGURE 21.4 Dealing with construction permits: building a warehouse Rankings are based on 3 indicators
33.3% Time
33.3% Procedures
33.3% Cost
As % of income per capita, no
bribes included
Days to build a warehouse in main city
Procedures are completed when final document is received; construction permits, inspections and
utility connections included
DATA NOTES 135

system (dry system) will be used
instead. If a wet fire protection system
is required by law, it is assumed that
the water demand specified below
also covers the water needed for fire
protection.
• Has an average water use of 662 liters
(175 gallons) a day and an average
wastewater flow of 568 liters (150
gallons) a day.
• Has a peak water use of 1,325 liters (350
gallons) a day and a peak wastewater
flow of 1,136 liters (300 gallons) a day.
• Will have a constant level of water de-
mand and wastewater flow through-
out the year.
The telephone connection:
• Is 10 meters (32 feet, 10 inches) from
the main telephone network.
• Is a fixed landline.
ProceduresA procedure is any interaction of the
company’s employees or managers, or
any party acting on behalf of the com-
pany, with external parties, including
government agencies, notaries, the land
registry, the cadastre, utility companies
and public inspectors—or the hiring of
private inspectors and technical experts
apart from in-house architects and en-
gineers. Interactions between company
employees, such as development of the
warehouse plans and inspections con-
ducted by employees, are not counted as
procedures. But interactions necessary to
obtain any plans, drawings or other doc-
uments from external parties, or to have
such documents approved or stamped
by external parties, are counted as pro-
cedures. Procedures that the company
undergoes to connect to water, sewerage
and telephone services are included. All
procedures that are legally required, or
that are done in practice by the majority
of companies, to build a warehouse are
counted, even if they may be avoided in
exceptional cases (table 21.4).
TimeTime is recorded in calendar days. The
measure captures the median duration
that local experts indicate is necessary to
complete a procedure in practice. It is as-
sumed that the minimum time required for
each procedure is 1 day, except for proce-
dures that can be fully completed online,
for which the time required is recorded as
half a day. Although procedures may take
place simultaneously, they cannot start on
the same day (that is, simultaneous pro-
cedures start on consecutive days), again
with the exception of procedures that can
be fully completed online. If a procedure
can be accelerated legally for an addition-
al cost and the accelerated procedure is
used by the majority of companies, the
fastest procedure is chosen. It is assumed
that BuildCo does not waste time and
commits to completing each remaining
procedure without delay. The time that
BuildCo spends on gathering information
is ignored. It is assumed that BuildCo is
aware of all building requirements and
their sequence from the beginning.
CostCost is recorded as a percentage of the
economy’s income per capita. Only
official costs are recorded. All the fees as-
sociated with completing the procedures
to legally build a warehouse are recorded,
including those associated with obtaining
land use approvals and preconstruction
design clearances; receiving inspections
before, during and after construction;
obtaining utility connections; and regis-
tering the warehouse property. Nonrecur-
ring taxes required for the completion of
the warehouse project are also recorded.
Sales taxes (such as value added tax) or
capital gains taxes are not recorded. Nor
are deposits that must be paid up front
and are later refunded. The building code,
information from local experts and spe-
cific regulations and fee schedules are
used as sources for costs. If several local
partners provide different estimates, the
median reported value is used.
The data details on dealing with construction
permits can be found for each economy at
http://www.doingbusiness.org by selecting
the economy in the drop-down list.
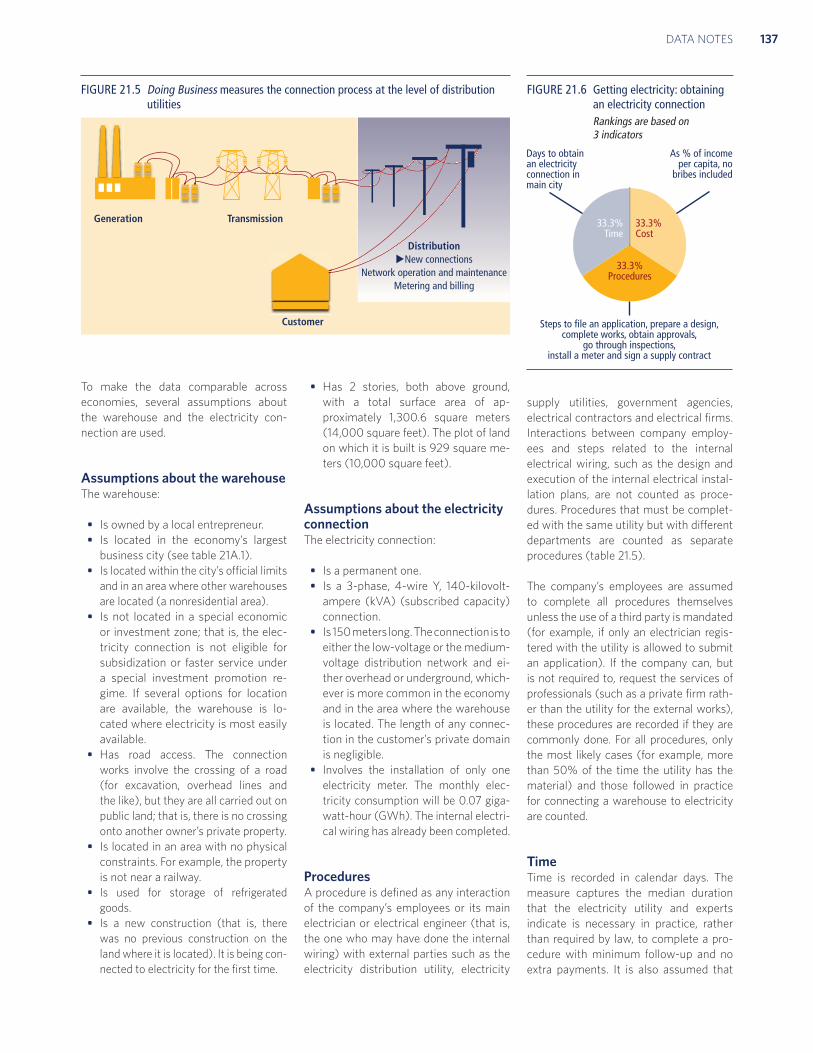
GETTING ELECTRICITYDoing Business records all procedures re-
quired for a business to obtain a perma-
nent electricity connection and supply for
a standardized warehouse (figure 21.5).
These procedures include applications
and contracts with electricity utilities,
all necessary inspections and clearances
from the utility and other agencies and
the external and final connection works.
The questionnaire divides the process
of getting an electricity connection into
distinct procedures and solicits data for
calculating the time and cost to complete
each procedure. The ranking on the ease
of getting electricity is the simple average
of the percentile rankings on its compo-
nent indicators (figure 21.6).
Data are collected from the electricity
distribution utility, then completed and
verified by electricity regulatory agencies
and independent professionals such as
electrical engineers, electrical contrac-
tors and construction companies. The
electricity distribution utility consulted
is the one serving the area (or areas)
where warehouses are located. If there is
a choice of distribution utilities, the one
serving the largest number of customers
is selected.
TABLE 21.4 What do the dealing with construction permits indicators measure?
Procedures to legally build a warehouse (number)
Submitting all relevant documents and obtaining all necessary clearances, licenses, permits and certificates
Submitting all required notifications and receiving all necessary inspections
Obtaining utility connections for water, sewerage and a land telephone line
Registering the warehouse after its completion (if required for use as collateral or for transfer of the warehouse)
Time required to complete each procedure (calendar days)
Does not include time spent gathering information
Each procedure starts on a separate day. Procedures that can be fully completed online are an exception to this rule.
Procedure considered completed once final document is received
No prior contact with officials
Cost required to complete each procedure (% of income per capita)
Official costs only, no bribes
DOING BUSINESS 2014136
To make the data comparable across
economies, several assumptions about
the warehouse and the electricity con-
nection are used.
Assumptions about the warehouseThe warehouse:
• Is owned by a local entrepreneur.
• Is located in the economy’s largest
business city (see table 21A.1).
• Is located within the city’s official limits
and in an area where other warehouses
are located (a nonresidential area).
• Is not located in a special economic
or investment zone; that is, the elec-
tricity connection is not eligible for
subsidization or faster service under
a special investment promotion re-
gime. If several options for location
are available, the warehouse is lo-
cated where electricity is most easily
available.
• Has road access. The connection
works involve the crossing of a road
(for excavation, overhead lines and
the like), but they are all carried out on
public land; that is, there is no crossing
onto another owner’s private property.
• Is located in an area with no physical
constraints. For example, the property
is not near a railway.
• Is used for storage of refrigerated
goods.
• Is a new construction (that is, there
was no previous construction on the
land where it is located). It is being con-
nected to electricity for the first time.
• Has 2 stories, both above ground,
with a total surface area of ap-
proximately 1,300.6 square meters
(14,000 square feet). The plot of land
on which it is built is 929 square me-
ters (10,000 square feet).
Assumptions about the electricity connection The electricity connection:
• Is a permanent one.
• Is a 3-phase, 4-wire Y, 140-kilovolt-
ampere (kVA) (subscribed capacity)
connection.
• Is 150 meters long. The connection is to
either the low-voltage or the medium-
voltage distribution network and ei-
ther overhead or underground, which-
ever is more common in the economy
and in the area where the warehouse
is located. The length of any connec-
tion in the customer’s private domain
is negligible.
• Involves the installation of only one
electricity meter. The monthly elec-
tricity consumption will be 0.07 giga-
watt-hour (GWh). The internal electri-
cal wiring has already been completed.
Procedures A procedure is defined as any interaction
of the company’s employees or its main
electrician or electrical engineer (that is,
the one who may have done the internal
wiring) with external parties such as the
electricity distribution utility, electricity
supply utilities, government agencies,
electrical contractors and electrical firms.
Interactions between company employ-
ees and steps related to the internal
electrical wiring, such as the design and
execution of the internal electrical instal-
lation plans, are not counted as proce-
dures. Procedures that must be complet-
ed with the same utility but with different
departments are counted as separate
procedures (table 21.5).
The company’s employees are assumed
to complete all procedures themselves
unless the use of a third party is mandated
(for example, if only an electrician regis-
tered with the utility is allowed to submit
an application). If the company can, but
is not required to, request the services of
professionals (such as a private firm rath-
er than the utility for the external works),
these procedures are recorded if they are
commonly done. For all procedures, only
the most likely cases (for example, more
than 50% of the time the utility has the
material) and those followed in practice
for connecting a warehouse to electricity
are counted.
Time Time is recorded in calendar days. The
measure captures the median duration
that the electricity utility and experts
indicate is necessary in practice, rather
than required by law, to complete a pro-
cedure with minimum follow-up and no
extra payments. It is also assumed that
Generation Transmission
DistributionNew connections
Network operation and maintenanceMetering and billing
Customer
FIGURE 21.5 Doing Business measures the connection process at the level of distribution utilities
33.3% Time
33.3% Cost
As % of income per capita, no
bribes included
Days to obtain an electricity connection in main city
Steps to file an application, prepare a design, complete works, obtain approvals,
go through inspections, install a meter and sign a supply contract
33.3% Procedures
FIGURE 21.6 Getting electricity: obtaining an electricity connectionRankings are based on 3 indicators
DATA NOTES 137

the minimum time required for each pro-
cedure is 1 day. Although procedures may
take place simultaneously, they cannot
start on the same day (that is, simulta-
neous procedures start on consecutive
days). It is assumed that the company
does not waste time and commits to com-
pleting each remaining procedure without
delay. The time that the company spends
on gathering information is ignored. It is
assumed that the company is aware of all
electricity connection requirements and
their sequence from the beginning.
Cost Cost is recorded as a percentage of the
economy’s income per capita. Costs are
recorded exclusive of value added tax.
All the fees and costs associated with
completing the procedures to connect
a warehouse to electricity are record-
ed, including those related to obtaining
clearances from government agencies,
applying for the connection, receiving in-
spections of both the site and the internal
wiring, purchasing material, getting the
actual connection works and paying a
security deposit. Information from local
experts and specific regulations and fee
schedules are used as sources for costs.
If several local partners provide different
estimates, the median reported value is
used. In all cases the cost excludes bribes.
Security depositUtilities require security deposits as a
guarantee against the possible failure of
customers to pay their consumption bills.
For this reason the security deposit for a
new customer is most often calculated
as a function of the customer’s estimated
consumption.
Doing Business does not record the full
amount of the security deposit. If the de-
posit is based on the customer’s actual
consumption, this basis is the one as-
sumed in the case study. Rather than the
full amount of the security deposit, Doing
Business records the present value of the
losses in interest earnings experienced by
the customer because the utility holds the
security deposit over a prolonged period,
in most cases until the end of the contract
(assumed to be after 5 years). In cases
where the security deposit is used to cov-
er the first monthly consumption bills, it is
not recorded. To calculate the present val-
ue of the lost interest earnings, the end-
2012 lending rates from the International
Monetary Fund’s International Financial
Statistics are used. In cases where the
security deposit is returned with interest,
the difference between the lending rate
and the interest paid by the utility is used
to calculate the present value.
In some economies the security deposit
can be put up in the form of a bond: the
company can obtain from a bank or an
insurance company a guarantee issued
on the assets it holds with that financial
institution. In contrast to the scenario
in which the customer pays the deposit
in cash to the utility, in this scenario the
company does not lose ownership con-
trol over the full amount and can con-
tinue using it. In return the company will
pay the bank a commission for obtaining
the bond. The commission charged may
vary depending on the credit standing
of the company. The best possible cred-
it standing and thus the lowest possible
commission are assumed. Where a bond
can be put up, the value recorded for the
deposit is the annual commission times
the 5 years assumed to be the length of
the contract. If both options exist, the
cheaper alternative is recorded.
In Honduras in June 2013 a customer
requesting a 140-kVA electricity connec-
tion would have had to put up a security
deposit of 126,894 Honduran lempiras
(L) in cash or check, and the deposit
would have been returned only at the
end of the contract. The customer could
instead have invested this money at the
prevailing lending rate of 18.45%. Over
the 5 years of the contract this would im-
ply a present value of lost interest earn-
ings of L 72,475. In contrast, if the cus-
tomer chose to settle the deposit with a
bank guarantee at an annual rate of 2.5%,
the amount lost over the 5 years would
be just L 15,862.
The data details on getting electricity can
be found for each economy at http://www
.doingbusiness.org.
REGISTERING PROPERTYDoing Business records the full sequence
of procedures necessary for a business
(buyer) to purchase a property from an-
other business (seller) and to transfer
the property title to the buyer’s name so
that the buyer can use the property for
expanding its business, use the proper-
ty as collateral in taking new loans or, if
necessary, sell the property to another
business. The process starts with obtain-
ing the necessary documents, such as a
copy of the seller’s title if necessary, and
conducting due diligence if required. The
transaction is considered complete when
it is opposable to third parties and when
the buyer can use the property, use it as
collateral for a bank loan or resell it (fig-
ure 21.7). The ranking on the ease of reg-
istering property is the simple average of
the percentile rankings on its component
indicators (figure 21.8).
Every procedure required by law or neces-
sary in practice is included, whether it is
the responsibility of the seller or the buy-
er or must be completed by a third party
on their behalf. Local property lawyers,
notaries and property registries provide
information on procedures as well as the
TABLE 21.5 What do the getting electricity indicators measure?
Procedures to obtain an electricity connection (number)
Submitting all relevant documents and obtaining all necessary clearances and permits
Completing all required notifications and receiving all necessary inspections
Obtaining external installation works and possibly purchasing material for these works
Concluding any necessary supply contract and obtaining final supply
Time required to complete each procedure (calendar days)
Is at least 1 calendar day
Each procedure starts on a separate day
Does not include time spent gathering information
Reflects the time spent in practice, with little follow-up and no prior contact with officials
Cost required to complete each procedure (% of income per capita)
Official costs only, no bribes
Value added tax excluded
DOING BUSINESS 2014138

time and cost to complete each of them.
The registering property indicators do
not measure the accessibility of proper-
ty registration systems, the legal security
offered by formal registration, the use of
informal property registration systems or
the equity of land policies.
To make the data comparable across
economies, several assumptions about
the parties to the transaction, the proper-
ty and the procedures are used.
Assumptions about the partiesThe parties (buyer and seller):
• Are limited liability companies.
• Are located in the periurban area of
the economy’s largest business city
(see table 21A.1).
• Are 100% domestically and privately
owned.
• Have 50 employees each, all of whom
are nationals.
• Perform general commercial activities.
Assumptions about the propertyThe property:
• Has a value of 50 times income per
capita. The sale price equals the value.
• Is fully owned by the seller.
• Has no mortgages attached and has
been under the same ownership for
the past 10 years.
• Is registered in the land registry or
cadastre, or both, and is free of title
disputes.
• Is located in a periurban commercial
zone, and no rezoning is required.
• Consists of land and a building. The
land area is 557.4 square meters
(6,000 square feet). A 2-story ware-
house of 929 square meters (10,000
square feet) is located on the land.
The warehouse is 10 years old, is in
good condition and complies with all
safety standards, building codes and
other legal requirements. It has no
heating system. The property of land
and building will be transferred in its
entirety.
• Will not be subject to renovations or
additional building following the pur-
chase.
• Has no trees, natural water sources,
natural reserves or historical monu-
ments of any kind.
• Will not be used for special purpos-
es, and no special permits, such as
for residential use, industrial plants,
waste storage or certain types of agri-
cultural activities, are required.
• Has no occupants, and no other party
holds a legal interest in it.
ProceduresA procedure is defined as any interaction
of the buyer or the seller, their agents (if
an agent is legally or in practice required)
or the property with external parties,
including government agencies, inspec-
tors, notaries and lawyers. Interactions
between company officers and employ-
ees are not considered. All procedures
that are legally or in practice required for
registering property are recorded, even if
they may be avoided in exceptional cases
(table 21.6). It is assumed that the buyer
follows the fastest legal option available
and used by the majority of property
owners. Although the buyer may use
lawyers or other professionals where
necessary in the registration process, it is
assumed that the buyer does not employ
an outside facilitator in the registration
process unless legally or in practice re-
quired to do so.
TimeTime is recorded in calendar days. The
measure captures the median dura-
tion that property lawyers, notaries or
registry officials indicate is necessary
to complete a procedure. It is assumed
that the minimum time required for each
procedure is 1 day, except for procedures
that can be fully completed online, for
which the time required is recorded as
half a day. Although procedures may
take place simultaneously, they cannot
start on the same day, again with the
exception of procedures that can be
fully completed online. It is assumed
that the buyer does not waste time and
commits to completing each remaining
procedure without delay. If a procedure
can be accelerated for an additional cost,
the fastest legal procedure available and
used by the majority of property owners
is chosen. If procedures can be under-
taken simultaneously, it is assumed that
they are. It is assumed that the parties
33.3% Time
33.3% Cost
As % of property value, no bribes
included
Days to transfer property in main city
Steps to check encumbrances, obtain clearance certificates, prepare deed and transfer title
so that the property can be occupied, sold or used as collateral
33.3% Procedures
Cost(% of property value)
Number of procedures
Buyer can use the property, resell it or use it as collateral
Preregistration
Seller with property registered and no
title disputes
Land & 2-story warehouse
Registration PostregistrationTime
(days)
FIGURE 21.7 What are the time, cost and number of procedures required to transfer property between 2 local companies?
FIGURE 21.8 Registering property: transfer of property between 2 local companies Rankings are based on 3 indicators
DATA NOTES 139

involved are aware of all requirements
and their sequence from the beginning.
Time spent on gathering information is
not considered.
CostCost is recorded as a percentage of the
property value, assumed to be equivalent
to 50 times income per capita. Only of-
ficial costs required by law are recorded,
including fees, transfer taxes, stamp du-
ties and any other payment to the prop-
erty registry, notaries, public agencies
or lawyers. Other taxes, such as capital
gains tax or value added tax, are excluded
from the cost measure. Both costs borne
by the buyer and those borne by the sell-
er are included. If cost estimates differ
among sources, the median reported val-
ue is used.
The data details on registering property can
be found for each economy at http://www
.doingbusiness.org by selecting the economy
in the drop-down list.
GETTING CREDITDoing Business measures the legal rights of
borrowers and lenders with respect to se-
cured transactions through one set of indi-
cators and the sharing of credit information
through another. The first set of indicators
measures whether certain features that fa-
cilitate lending exist within the applicable
collateral and bankruptcy laws. The second
set measures the coverage, scope and ac-
cessibility of credit information available
through public credit registries and private
credit bureaus (figure 21.9). The ranking
on the ease of getting credit is based on
the percentile rankings on the sum of its
component indicators: the depth of credit
information index and the strength of legal
rights index (figure 21.10).
Legal rightsThe data on the legal rights of borrowers
and lenders are gathered through a ques-
tionnaire administered to financial lawyers
and verified through analysis of laws and
regulations as well as public sources of
information on collateral and bankruptcy
laws. Questionnaire responses are verified
through several rounds of follow-up com-
munication with respondents as well as
by contacting third parties and consulting
public sources. The questionnaire data are
confirmed through teleconference calls or
on-site visits in all economies.
Strength of legal rights indexThe strength of legal rights index mea-
sures the degree to which collateral and
bankruptcy laws protect the rights of
borrowers and lenders and thus facilitate
lending (table 21.7). Two case scenarios,
case A and case B, are used to determine
the scope of the secured transactions
system. The case scenarios involve a se-
cured borrower, the incorporated compa-
ny ABC, and a secured lender, BizBank.
For example, in some economies the legal
framework for secured transactions will
allow only case A or case B to apply (not
both). Both cases examine the same set
of legal provisions relating to the use of
movable collateral.
Several assumptions about the secured
borrower and lender are used:
• ABC is a domestically incorporated,
limited liability company.
• The company has up to 50 employees.
• ABC has its headquarters and only
base of operations in the economy’s
largest business city (see table 21A.1).
• Both ABC and BizBank are 100% do-
mestically owned.
The case scenarios also involve assump-
tions. In case A, as collateral for the loan,
ABC grants BizBank a nonpossessory se-
curity interest in one category of movable
assets, for example, its machinery or its
inventory. ABC wants to keep both pos-
session and ownership of the collateral. In
economies where the law does not allow
nonpossessory security interests in mov-
able property, ABC and BizBank use a fi-
duciary transfer-of-title arrangement (or a
similar substitute for nonpossessory secu-
rity interests). The strength of legal rights
index does not cover functional equivalents
FIGURE 21.9 Do lenders have credit information on entrepreneurs seeking credit? Is the law favorable to borrowers and lenders using movable assets as collateral?
TABLE 21.6 What do the registering property indicators measure?
Procedures to legally transfer title on immovable property (number)
Preregistration procedures (for example, checking for liens, notarizing sales agreement, paying property transfer taxes)
Registration procedures in the economy’s largest business city
Postregistration procedures (for example, filing title with municipality)
Time required to complete each procedure (calendar days)
Does not include time spent gathering information
Each procedure starts on a separate day. Procedures that can be fully completed online are an exception to this rule.
Procedure considered completed once final document is received
No prior contact with officials
Cost required to complete each procedure (% of property value)
Official costs only, no bribes
No value added or capital gains taxes included
Can movable assets be used as collateral?
What types can be used as collateral?
Can lenders access credit information
on borrowers?
Potential borrower
Collateralregistry Lender
Movable asset
Credit registries and credit bureaus
Credit information
DOING BUSINESS 2014140

to security over movable assets (for exam-
ple, leasing or reservation of title).
In case B, ABC grants BizBank a business
charge, enterprise charge, floating charge
or any charge that gives BizBank a securi-
ty interest over ABC’s combined movable
assets (or as much of ABC’s movable as-
sets as possible). ABC keeps ownership
and possession of the assets.
The strength of legal rights index includes
8 aspects related to legal rights in collat-
eral law and 2 aspects in bankruptcy law.
A score of 1 is assigned for each of the fol-
lowing features of the laws:
• Any business may use movable
assets as collateral while keeping
possession of the assets, and any fi-
nancial institution may accept such
assets as collateral.
• The law allows a business to grant a
nonpossessory security right in a sin-
gle category of movable assets (such
as accounts receivable or inventory),
without requiring a specific descrip-
tion of the collateral.
• The law allows a business to grant a
nonpossessory security right in sub-
stantially all its movable assets, with-
out requiring a specific description of
the collateral.
• A security right may be given over fu-
ture or after-acquired assets and may
extend automatically to the products,
proceeds or replacements of the orig-
inal assets.
• A general description of debts and
obligations is permitted in the col-
lateral agreement and in registration
documents; all types of debts and ob-
ligations can be secured between the
parties, and the collateral agreement
can include a maximum amount for
which the assets are encumbered.
• A collateral registry or registration
institution for security interests over
movable property is in operation, uni-
fied geographically and by asset type,
with an electronic database indexed
by debtors’ names.
• Secured creditors are paid first (for
example, before tax claims and em-
ployee claims) when a debtor defaults
outside an insolvency procedure.
• Secured creditors are paid first (for
example, before tax claims and em-
ployee claims) when a business is
liquidated.
• Secured creditors either are not sub-
ject to an automatic stay or mora-
torium on enforcement procedures
when a debtor enters a court-super-
vised reorganization procedure, or the
law provides secured creditors with
grounds for relief from an automatic
stay or moratorium (for example, if the
movable property is in danger) or sets
a time limit for the automatic stay.
• The law allows parties to agree in a
collateral agreement that the lender
may enforce its security right out of
court.
The index ranges from 0 to 10, with higher
scores indicating that collateral and bank-
ruptcy laws are better designed to expand
access to credit.
Credit informationThe data on credit information sharing
are built in 2 stages. First, banking super-
vision authorities and public information
sources are surveyed to confirm the pres-
ence of a public credit registry or private
credit bureau. Second, when applicable,
a detailed questionnaire on the public
credit registry’s or private credit bureau’s
structure, laws and associated rules is
administered to the entity itself. Ques-
tionnaire responses are verified through
several rounds of follow-up communica-
tion with respondents as well as by con-
tacting third parties and consulting public
sources. The questionnaire data are con-
firmed through teleconference calls or
on-site visits in all economies.
Depth of credit information indexThe depth of credit information index
measures rules and practices affecting
the coverage, scope and accessibility of
credit information available through ei-
ther a public credit registry or a private
credit bureau. A score of 1 is assigned for
each of the following 6 features of the
public credit registry or private credit bu-
reau (or both):
• Data on both firms and individuals are
distributed.
• Both positive credit information (for
example, outstanding loan amounts
and pattern of on-time repayments)
and negative information (for exam-
ple, late payments and the number
and amount of defaults and bankrupt-
cies) are distributed.
• Data from retailers and utility com-
panies as well as financial institutions
are distributed.
• More than 2 years of historical data
are distributed. Credit registries and
bureaus that erase data on defaults as
soon as they are repaid obtain a score
of 0 for this indicator.
TABLE 21.7 What do the getting credit indicators measure?
Strength of legal rights index (0–10)
Protection of rights of borrowers and lenders through collateral laws
Protection of secured creditors’ rights through bankruptcy laws
Depth of credit information index (0–6)
Scope and accessibility of credit information distributed by public credit registries and private credit bureaus
Public credit registry coverage (% of adults)
Number of individuals and firms listed in a public credit registry as percentage of adult population
Private credit bureau coverage (% of adults)
Number of individuals and firms listed in largest private credit bureau as percentage of adult population
100%
Sum of depth of credit information index (0–6)
and strength of legal rights
index (0–10)
Scope, quality and accessibility of credit information through public and private credit registries and bureaus
Regulations on nonpossessory security interests in movable property
FIGURE 21.10 Getting credit: collateral rules and credit information Rankings are based on 2 indicators
Note: Private bureau coverage and public registry cov-erage are measured but do not count for the rankings.
DATA NOTES 141

• Data on loan amounts below 1% of in-
come per capita are distributed. Note
that a credit registry or bureau must
have a minimum coverage of 1% of
the adult population to score a 1 on
this indicator.
• By law, borrowers have the right to
access their data in the largest credit
registry or bureau in the economy.
The index ranges from 0 to 6, with higher
values indicating the availability of more
credit information, from either a public
credit registry or a private credit bureau,
to facilitate lending decisions. If the cred-
it registry or bureau is not operational or
has a coverage of less than 0.1% of the
adult population, the score on the depth
of credit information index is 0.
In Lithuania, for example, both a public
credit registry and a private credit bureau
operate. Both distribute positive and nega-
tive information (a score of 1). Both distrib-
ute data on firms and individuals (a score
of 1). Both distribute more than 2 years of
historical data (a score of 1). Although the
public credit registry does not distribute
data from retailers or utilities, the private
credit bureau does do so (a score of 1).
Although the public credit registry has a
threshold of 1,000 litai, the private credit
bureau distributes data on loans of any val-
ue (a score of 1). Borrowers have the right
to access their data in both the public cred-
it registry and the private credit bureau (a
score of 1). Summing across the indicators
gives Lithuania a total score of 6.
Public credit registry coverageThe public credit registry coverage indi-
cator reports the number of individuals
and firms listed in a public credit regis-
try’s database as of January 1, 2013, with
information on their borrowing history
from the past 5 years. The number is ex-
pressed as a percentage of the adult pop-
ulation (the population age 15 and above
in 2012 according to the World Bank’s
World Development Indicators). A public
credit registry is defined as a database
managed by the public sector, usually by
the central bank or the superintendent of
banks, that collects information on the
creditworthiness of borrowers (individu-
als or firms) in the financial system and
facilitates the exchange of credit infor-
mation among banks and other regulated
financial institutions. If no public registry
operates, the coverage value is 0.0%.
Private credit bureau coverageThe private credit bureau coverage indica-
tor reports the number of individuals and
firms listed in a private credit bureau’s
database as of January 1, 2013, with in-
formation on their borrowing history
from the past 5 years. The number is ex-
pressed as a percentage of the adult pop-
ulation (the population age 15 and above
in 2012 according to the World Bank’s
World Development Indicators). A private
credit bureau is defined as a private firm
or nonprofit organization that maintains a
database on the creditworthiness of bor-
rowers (individuals or firms) in the finan-
cial system and facilitates the exchange
of credit information among creditors.
Credit investigative bureaus and credit
reporting firms that do not directly facil-
itate information exchange among banks
and other financial institutions are not
considered. If no private bureau operates,
the coverage value is 0.0%.
The data details on getting credit can be
found for each economy at http://www.
doingbusiness.org by selecting the economy
in the drop-down list. This methodology was
developed by Djankov, McLiesh and Shleif-
er (2007) and is adopted here with minor
changes.
PROTECTING INVESTORSDoing Business measures the strength
of minority shareholder protections
against directors’ misuse of corporate
assets for personal gain. The indicators
distinguish 3 dimensions of investor
protections: transparency of relat-
ed-party transactions (extent of dis-
closure index), liability for self-dealing
(extent of director liability index) and
shareholders’ ability to sue officers
and directors for misconduct (ease of
shareholder suits index) (figure 21.11).
The data come from a questionnaire
administered to corporate and securi-
ties lawyers and are based on securities
regulations, company laws, civil proce-
dure codes and court rules of evidence.
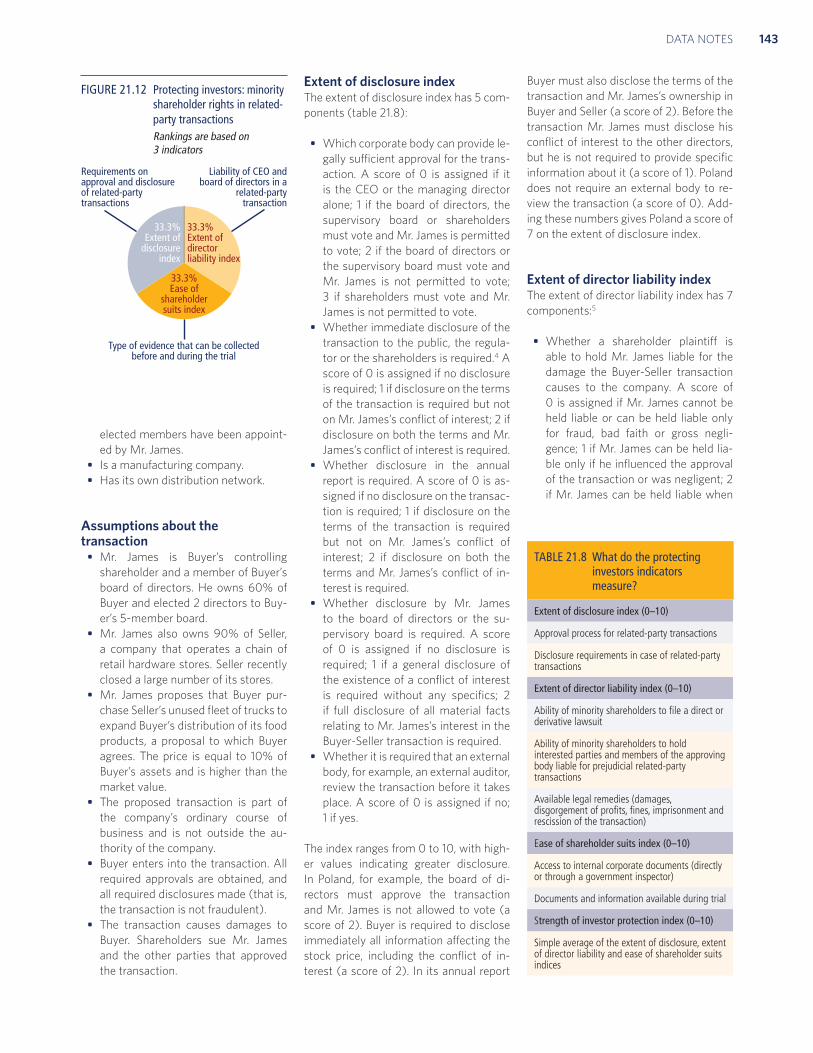
The ranking on the strength of investor
protection index is the simple average
of the percentile rankings on its compo-
nent indicators (figure 21.12).
To make the data comparable across
economies, several assumptions about
the business and the transaction are used.
Assumptions about the businessThe business (Buyer):
• Is a publicly traded corporation list-
ed on the economy’s most important
stock exchange. If the number of pub-
licly traded companies listed on that
exchange is less than 10, or if there is
no stock exchange in the economy, it
is assumed that Buyer is a large pri-
vate company with multiple share-
holders.
• Has a board of directors and a chief
executive officer (CEO) who may le-
gally act on behalf of Buyer where
permitted, even if this is not specifi-
cally required by law.
• Has a supervisory board (applicable to
economies with a 2-tier board system)
on which 60% of the shareholder-
Extent of disclosureDisclosure and approval requirements
Extent of director liabilityAbility to sue directors for damages
60% ownership, sits on board of directors
90% ownership, sits on board of directors
Ease of shareholder suitsAccess by shareholders to documents plus other evidence for trial
Minority shareholders
Transaction involving conflict
of interest
Mr. JamesLawsuit
Company A (buyer)
Company B (seller)
FIGURE 21.11 How well are minority shareholders protected against self-dealing in related-party transactions?
DOING BUSINESS 2014142
elected members have been appoint-
ed by Mr. James.
• Is a manufacturing company.
• Has its own distribution network.
Assumptions about the transaction
• Mr. James is Buyer’s controlling
shareholder and a member of Buyer’s
board of directors. He owns 60% of
Buyer and elected 2 directors to Buy-
er’s 5-member board.
• Mr. James also owns 90% of Seller,
a company that operates a chain of
retail hardware stores. Seller recently
closed a large number of its stores.
• Mr. James proposes that Buyer pur-
chase Seller’s unused fleet of trucks to
expand Buyer’s distribution of its food
products, a proposal to which Buyer
agrees. The price is equal to 10% of
Buyer’s assets and is higher than the
market value.
• The proposed transaction is part of
the company’s ordinary course of
business and is not outside the au-
thority of the company.
• Buyer enters into the transaction. All
required approvals are obtained, and
all required disclosures made (that is,
the transaction is not fraudulent).
• The transaction causes damages to
Buyer. Shareholders sue Mr. James
and the other parties that approved
the transaction.
Extent of disclosure indexThe extent of disclosure index has 5 com-
ponents (table 21.8):
• Which corporate body can provide le-
gally sufficient approval for the trans-
action. A score of 0 is assigned if it
is the CEO or the managing director
alone; 1 if the board of directors, the
supervisory board or shareholders
must vote and Mr. James is permitted
to vote; 2 if the board of directors or
the supervisory board must vote and
Mr. James is not permitted to vote;
3 if shareholders must vote and Mr.
James is not permitted to vote.
• Whether immediate disclosure of the
transaction to the public, the regula-
tor or the shareholders is required.4 A
score of 0 is assigned if no disclosure
is required; 1 if disclosure on the terms
of the transaction is required but not
on Mr. James’s conflict of interest; 2 if
disclosure on both the terms and Mr.
James’s conflict of interest is required.
• Whether disclosure in the annual
report is required. A score of 0 is as-
signed if no disclosure on the transac-
tion is required; 1 if disclosure on the
terms of the transaction is required
but not on Mr. James’s conflict of
interest; 2 if disclosure on both the
terms and Mr. James’s conflict of in-
terest is required.
• Whether disclosure by Mr. James
to the board of directors or the su-
pervisory board is required. A score
of 0 is assigned if no disclosure is
required; 1 if a general disclosure of
the existence of a conflict of interest
is required without any specifics; 2
if full disclosure of all material facts
relating to Mr. James’s interest in the
Buyer-Seller transaction is required.
• Whether it is required that an external
body, for example, an external auditor,
review the transaction before it takes
place. A score of 0 is assigned if no;
1 if yes.
The index ranges from 0 to 10, with high-
er values indicating greater disclosure.
In Poland, for example, the board of di-
rectors must approve the transaction
and Mr. James is not allowed to vote (a
score of 2). Buyer is required to disclose
immediately all information affecting the
stock price, including the conflict of in-
terest (a score of 2). In its annual report
Buyer must also disclose the terms of the
transaction and Mr. James’s ownership in
Buyer and Seller (a score of 2). Before the
transaction Mr. James must disclose his
conflict of interest to the other directors,
but he is not required to provide specific
information about it (a score of 1). Poland
does not require an external body to re-
view the transaction (a score of 0). Add-
ing these numbers gives Poland a score of
7 on the extent of disclosure index.
Extent of director liability indexThe extent of director liability index has 7
components:5
• Whether a shareholder plaintiff is
able to hold Mr. James liable for the
damage the Buyer-Seller transaction
causes to the company. A score of
0 is assigned if Mr. James cannot be
held liable or can be held liable only
for fraud, bad faith or gross negli-
gence; 1 if Mr. James can be held lia-
ble only if he influenced the approval
of the transaction or was negligent; 2
if Mr. James can be held liable when
TABLE 21.8 What do the protecting investors indicators measure?
Extent of disclosure index (0–10)
Approval process for related-party transactions
Disclosure requirements in case of related-party transactions
Extent of director liability index (0–10)
Ability of minority shareholders to file a direct or derivative lawsuit
Ability of minority shareholders to hold interested parties and members of the approving body liable for prejudicial related-party transactions
Available legal remedies (damages, disgorgement of profits, fines, imprisonment and rescission of the transaction)
Ease of shareholder suits index (0–10)
Access to internal corporate documents (directly or through a government inspector)
Documents and information available during trial
Strength of investor protection index (0–10)
Simple average of the extent of disclosure, extent of director liability and ease of shareholder suits indices
33.3% Extent of
disclosure index
33.3% Ease of
shareholder suits index
33.3% Extent of director liability index
Liability of CEO and board of directors in a
related-party transaction
Requirements on approval and disclosure of related-party transactions
Type of evidence that can be collected before and during the trial
FIGURE 21.12 Protecting investors: minority shareholder rights in related-party transactions Rankings are based on 3 indicators
DATA NOTES 143

the transaction is unfair or prejudicial
to the other shareholders.
• Whether a shareholder plaintiff is able
to hold the approving body (the CEO,
members of the board of directors or
members of the supervisory board)
liable for the damage the transaction
causes to the company. A score of 0
is assigned if the approving body can-
not be held liable or can be held liable
only for fraud, bad faith or gross neg-
ligence; 1 if the approving body can be
held liable for negligence; 2 if the ap-
proving body can be held liable when
the transaction is unfair or prejudicial
to the other shareholders.
• Whether a court can void the trans-
action upon a successful claim by a
shareholder plaintiff. A score of 0 is
assigned if rescission is unavailable
or is available only in case of fraud,
bad faith or gross negligence; 1 if re-
scission is available when the trans-
action is oppressive or prejudicial to
the other shareholders; 2 if rescission
is available when the transaction is
unfair or entails a conflict of interest.
• Whether Mr. James pays damages
for the harm caused to the compa-
ny upon a successful claim by the
shareholder plaintiff. A score of 0 is
assigned if no; 1 if yes.
• Whether Mr. James repays profits
made from the transaction upon a
successful claim by the shareholder
plaintiff. A score of 0 is assigned if no;
1 if yes.
• Whether both fines and imprison-
ment can be applied against Mr.
James. A score of 0 is assigned if no;
1 if yes.
• Whether shareholder plaintiffs are
able to sue directly or derivatively for
the damage the transaction causes to
the company. A score of 0 is assigned
if suits are unavailable or are available
only for shareholders holding more
than 10% of the company’s share
capital; 1 if direct or derivative suits
are available for shareholders holding
10% or less of share capital.
The index ranges from 0 to 10, with higher
values indicating greater liability of direc-
tors. Assuming that the prejudicial trans-
action was duly approved and disclosed,
in order to hold Mr. James liable in Pan-
ama, for example, a plaintiff must prove
that Mr. James influenced the approving
body or acted negligently (a score of 1).
To hold the other directors liable, a plain-
tiff must prove that they acted negligently
(a score of 1). The prejudicial transaction
cannot be voided (a score of 0). If Mr.
James is found liable, he must pay dam-
ages (a score of 1) but he is not required
to disgorge his profits (a score of 0). Mr.
James cannot be fined and imprisoned (a
score of 0). Direct or derivative suits are
available for shareholders holding 10% or
less of share capital (a score of 1). Adding
these numbers gives Panama a score of 4
on the extent of director liability index.
Ease of shareholder suits indexThe ease of shareholder suits index has 6
components:
• What range of documents is available
to the shareholder plaintiff from the
defendant and witnesses during trial.
A score of 1 is assigned for each of the
following types of documents avail-
able: information that the defendant
has indicated he intends to rely on for
his defense; information that directly
proves specific facts in the plaintiff’s
claim; any information relevant to the
subject matter of the claim; and any
information that may lead to the dis-
covery of relevant information.
• Whether the plaintiff can directly ex-
amine the defendant and witnesses
during trial. A score of 0 is assigned if
no; 1 if yes, with prior approval of the
questions by the judge; 2 if yes, with-
out prior approval.
• Whether the plaintiff can obtain cat-
egories of relevant documents from
the defendant without identifying
each document specifically. A score
of 0 is assigned if no; 1 if yes.
• Whether shareholders owning 10%
or less of the company’s share cap-
ital can request that a government
inspector investigate the Buyer-Seller
transaction without filing suit in court.
A score of 0 is assigned if no; 1 if yes.
• Whether shareholders owning 10%
or less of the company’s share capital
have the right to inspect the transac-
tion documents before filing suit. A
score of 0 is assigned if no; 1 if yes.
• Whether the standard of proof for civ-
il suits is lower than that for a criminal
case. A score of 0 is assigned if no; 1
if yes.
The index ranges from 0 to 10, with high-
er values indicating greater powers of
shareholders to challenge the transaction.
In Croatia, for example, the plaintiff can
access documents that the defendant in-
tends to rely on for his defense (a score of
1). The plaintiff can examine the defendant
and witnesses during trial, without prior
approval of the questions by the court (a
score of 2). The plaintiff must specifical-
ly identify the documents being sought
(for example, the Buyer-Seller purchase
agreement of July 15, 2006) and cannot
simply request categories (for example,
all documents related to the transaction)
(a score of 0). A shareholder holding 5%
of Buyer’s shares can request that a gov-
ernment inspector review suspected mis-
management by Mr. James and the CEO
without filing suit in court (a score of 1).
Shareholders cannot inspect the transac-
tion documents before deciding wheth-
er to sue (a score of 0). The standard of
proof for civil suits is the same as that for a
criminal case (a score of 0). Adding these
numbers gives Croatia a score of 4 on the
ease of shareholder suits index.
Strength of investor protection indexThe strength of investor protection index
is the average of the extent of disclosure
index, the extent of director liability index
and the ease of shareholder suits index.
The index ranges from 0 to 10, with higher
values indicating more investor protection.
The data details on protecting investors can
be found for each economy at http://www
.doingbusiness.org by selecting the economy
in the drop-down list. This methodology was
developed by Djankov and others (2008).
PAYING TAXESDoing Business records the taxes and man-
datory contributions that a medium-size
company must pay in a given year as well
as measures of the administrative burden
of paying taxes and contributions (figure
21.13). The project was developed and
implemented in cooperation with PwC.6
Taxes and contributions measured in-
clude the profit or corporate income tax,
social contributions and labor taxes paid
by the employer, property taxes, property
transfer taxes, dividend tax, capital gains
DOING BUSINESS 2014144

tax, financial transactions tax, waste col-
lection taxes, vehicle and road taxes, and
any other small taxes or fees.
The ranking on the ease of paying taxes is
the simple average of the percentile rank-
ings on its component indicators, with
a threshold being applied to one of the
component indicators, the total tax rate
(figure 21.14). The threshold is defined as
the highest total tax rate among the top
15% of economies in the ranking on the
total tax rate. It is calculated and adjust-
ed on a yearly basis. This year’s threshold
is 25.5%. All economies with a total tax
rate below this threshold receive the same
score as the economy at the threshold. The
threshold is not based on any economic
theory of an “optimal tax rate” that mini-
mizes distortions or maximizes efficiency
in the tax system of an economy overall.
Instead, it is mainly empirical in nature, set
at the lower end of the distribution of tax
rates levied on medium-size enterprises
in the manufacturing sector as observed
through the paying taxes indicators. This
reduces the bias in the indicators toward
economies that do not need to levy sig-
nificant taxes on companies like the Doing
Business standardized case study company
because they raise public revenue in other
ways—for example, through taxes on for-
eign companies, through taxes on sectors
other than manufacturing or from natural
resources (all of which are outside the
scope of the methodology).
Doing Business measures all taxes and
contributions that are government man-
dated (at any level—federal, state or lo-
cal) and that apply to the standardized
business and have an impact in its finan-
cial statements. In doing so, Doing Busi-
ness goes beyond the traditional definition
of a tax. As defined for the purposes of
government national accounts, taxes
include only compulsory, unrequited
payments to general government. Doing
Business departs from this definition be-
cause it measures imposed charges that
affect business accounts, not government
accounts. One main difference relates to
labor contributions. The Doing Business
measure includes government-mandated
contributions paid by the employer to a
requited private pension fund or workers’
insurance fund. The indicator includes,
for example, Australia’s compulsory su-
perannuation guarantee and workers’
compensation insurance. For the purpose
of calculating the total tax rate (defined
below), only taxes borne are included. For
example, value added taxes are generally
excluded (provided they are not irrecov-
erable) because they do not affect the ac-
counting profits of the business—that is,
they are not reflected in the income state-
ment. They are, however, included for
the purpose of the compliance measures
(time and payments), as they add to the
burden of complying with the tax system.
Doing Business uses a case scenario to
measure the taxes and contributions paid
by a standardized business and the com-
plexity of an economy’s tax compliance
system. This case scenario uses a set of fi-
nancial statements and assumptions about
transactions made over the course of the
year. In each economy tax experts from a
number of different firms (in many econ-
omies these include PwC) compute the
taxes and mandatory contributions due in
their jurisdiction based on the standard-
ized case study facts. Information is also
compiled on the frequency of filing and
payments as well as time taken to comply
with tax laws in an economy. To make the
data comparable across economies, sever-
al assumptions about the business and the
taxes and contributions are used.
The methodology for the paying taxes
indicators has benefited from discussion
with members of the International Tax
Dialogue and other stakeholders, which
led to a refinement of the questions on
the time to pay taxes, the collection of
additional data on the labor tax wedge for
further research and the introduction of a
threshold applied to the total tax rate for
the purpose of calculating the ranking on
the ease of paying taxes.
Assumptions about the businessThe business:
• Is a limited liability, taxable compa-
ny. If there is more than one type of
limited liability company in the econ-
omy, the limited liability form most
common among domestic firms is
chosen. The most common form is
reported by incorporation lawyers or
the statistical office.
• Started operations on January 1, 2011.
33.3% Time
33.3% Payments
33.3% Total tax rate
Firm tax liability as % of profits before
all taxes borne
Number of hours per year to prepare, file returns and pay taxes
Number of tax payments per year
To prepare, file and pay value added or sales tax, profit tax and labor taxes and contributions
Number of payments(per year)
% of profitbefore all taxes
Hoursper year
Total tax rate Time
FIGURE 21.13 What are the time, total tax rate and number of payments necessary for a local medium-size company to pay all taxes?
FIGURE 21.14 Paying taxes: tax compliance for a local manufacturing company Rankings are based on 3 indicators
Note: All economies below the threshold receive the same score in the total tax rate component as the economies at the threshold.
DATA NOTES 145
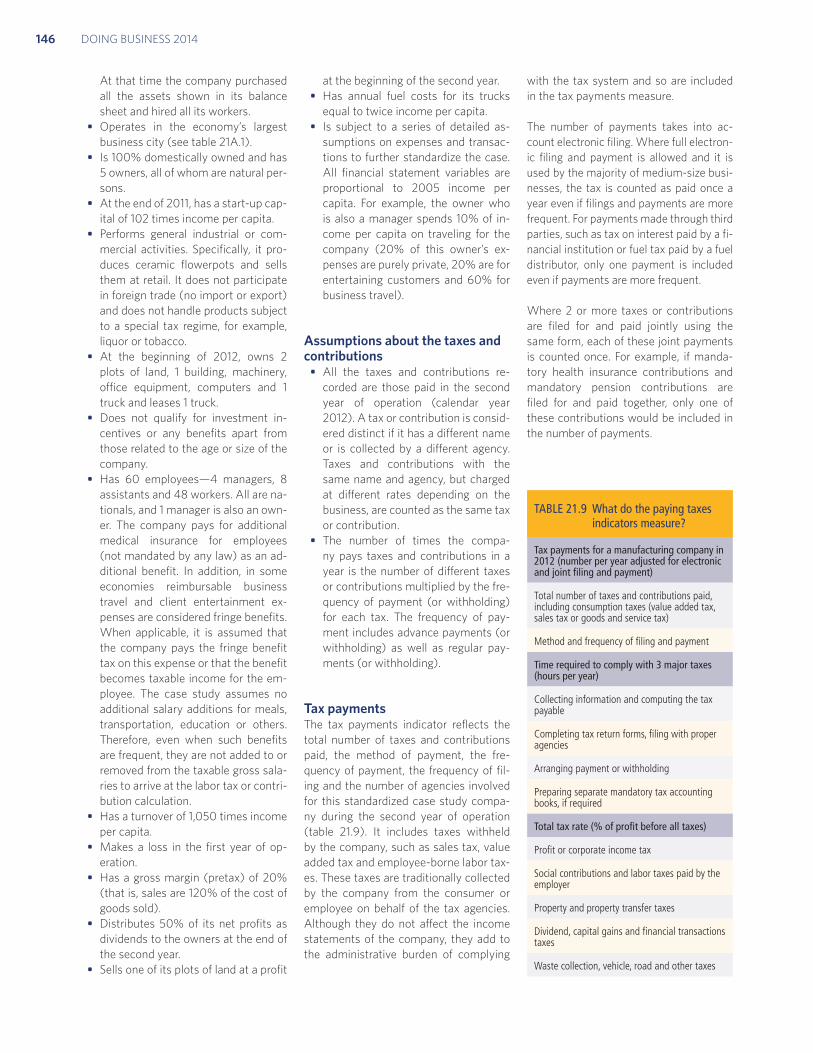
At that time the company purchased
all the assets shown in its balance
sheet and hired all its workers.
• Operates in the economy’s largest
business city (see table 21A.1).
• Is 100% domestically owned and has
5 owners, all of whom are natural per-
sons.
• At the end of 2011, has a start-up cap-
ital of 102 times income per capita.
• Performs general industrial or com-
mercial activities. Specifically, it pro-
duces ceramic flowerpots and sells
them at retail. It does not participate
in foreign trade (no import or export)
and does not handle products subject
to a special tax regime, for example,
liquor or tobacco.
• At the beginning of 2012, owns 2
plots of land, 1 building, machinery,
office equipment, computers and 1
truck and leases 1 truck.
• Does not qualify for investment in-
centives or any benefits apart from
those related to the age or size of the
company.
• Has 60 employees—4 managers, 8
assistants and 48 workers. All are na-
tionals, and 1 manager is also an own-
er. The company pays for additional
medical insurance for employees
(not mandated by any law) as an ad-
ditional benefit. In addition, in some
economies reimbursable business
travel and client entertainment ex-
penses are considered fringe benefits.
When applicable, it is assumed that
the company pays the fringe benefit
tax on this expense or that the benefit
becomes taxable income for the em-
ployee. The case study assumes no
additional salary additions for meals,
transportation, education or others.
Therefore, even when such benefits
are frequent, they are not added to or
removed from the taxable gross sala-
ries to arrive at the labor tax or contri-
bution calculation.
• Has a turnover of 1,050 times income
per capita.
• Makes a loss in the first year of op-
eration.
• Has a gross margin (pretax) of 20%
(that is, sales are 120% of the cost of
goods sold).
• Distributes 50% of its net profits as
dividends to the owners at the end of
the second year.
• Sells one of its plots of land at a profit
at the beginning of the second year.
• Has annual fuel costs for its trucks
equal to twice income per capita.
• Is subject to a series of detailed as-
sumptions on expenses and transac-
tions to further standardize the case.
All financial statement variables are
proportional to 2005 income per
capita. For example, the owner who
is also a manager spends 10% of in-
come per capita on traveling for the
company (20% of this owner’s ex-
penses are purely private, 20% are for
entertaining customers and 60% for
business travel).
Assumptions about the taxes and contributions
• All the taxes and contributions re-
corded are those paid in the second
year of operation (calendar year
2012). A tax or contribution is consid-
ered distinct if it has a different name
or is collected by a different agency.
Taxes and contributions with the
same name and agency, but charged
at different rates depending on the
business, are counted as the same tax
or contribution.
• The number of times the compa-
ny pays taxes and contributions in a
year is the number of different taxes
or contributions multiplied by the fre-
quency of payment (or withholding)
for each tax. The frequency of pay-
ment includes advance payments (or
withholding) as well as regular pay-
ments (or withholding).
Tax paymentsThe tax payments indicator reflects the
total number of taxes and contributions
paid, the method of payment, the fre-
quency of payment, the frequency of fil-
ing and the number of agencies involved
for this standardized case study compa-
ny during the second year of operation
(table 21.9). It includes taxes withheld
by the company, such as sales tax, value
added tax and employee-borne labor tax-
es. These taxes are traditionally collected
by the company from the consumer or
employee on behalf of the tax agencies.
Although they do not affect the income
statements of the company, they add to
the administrative burden of complying
with the tax system and so are included
in the tax payments measure.
The number of payments takes into ac-
count electronic filing. Where full electron-
ic filing and payment is allowed and it is
used by the majority of medium-size busi-
nesses, the tax is counted as paid once a
year even if filings and payments are more
frequent. For payments made through third
parties, such as tax on interest paid by a fi-
nancial institution or fuel tax paid by a fuel
distributor, only one payment is included
even if payments are more frequent.
Where 2 or more taxes or contributions
are filed for and paid jointly using the
same form, each of these joint payments
is counted once. For example, if manda-
tory health insurance contributions and
mandatory pension contributions are
filed for and paid together, only one of
these contributions would be included in
the number of payments.
TABLE 21.9 What do the paying taxes indicators measure?
Tax payments for a manufacturing company in 2012 (number per year adjusted for electronic and joint filing and payment)
Total number of taxes and contributions paid, including consumption taxes (value added tax, sales tax or goods and service tax)
Method and frequency of filing and payment
Time required to comply with 3 major taxes (hours per year)
Collecting information and computing the tax payable
Completing tax return forms, filing with proper agencies
Arranging payment or withholding
Preparing separate mandatory tax accounting books, if required
Total tax rate (% of profit before all taxes)
Profit or corporate income tax
Social contributions and labor taxes paid by the employer
Property and property transfer taxes
Dividend, capital gains and financial transactions taxes
Waste collection, vehicle, road and other taxes
DOING BUSINESS 2014146

TimeTime is recorded in hours per year. The
indicator measures the time taken to pre-
pare, file and pay 3 major types of taxes
and contributions: the corporate income
tax, value added or sales tax, and labor
taxes, including payroll taxes and social
contributions. Preparation time includes
the time to collect all information nec-
essary to compute the tax payable and
to calculate the amount payable. If sep-
arate accounting books must be kept for
tax purposes—or separate calculations
made—the time associated with these
processes is included. This extra time is in-
cluded only if the regular accounting work
is not enough to fulfill the tax accounting
requirements. Filing time includes the
time to complete all necessary tax return
forms and file the relevant returns at the
tax authority. Payment time considers the
hours needed to make the payment online
or at the tax authorities. Where taxes and
contributions are paid in person, the time
includes delays while waiting.
Total tax rateThe total tax rate measures the amount
of taxes and mandatory contributions
borne by the business in the second year
of operation, expressed as a share of
commercial profit. Doing Business 2014
reports the total tax rate for calendar year
2012. The total amount of taxes borne is
the sum of all the different taxes and con-
tributions payable after accounting for al-
lowable deductions and exemptions. The
taxes withheld (such as personal income
tax) or collected by the company and
remitted to the tax authorities (such as
value added tax, sales tax or goods and
service tax) but not borne by the compa-
ny are excluded. The taxes included can
be divided into 5 categories: profit or cor-
porate income tax, social contributions
and labor taxes paid by the employer
(in respect of which all mandatory con-
tributions are included, even if paid to a
private entity such as a requited pension
fund), property taxes, turnover taxes and
other taxes (such as municipal fees and
vehicle taxes). Fuel taxes are no longer
included in the total tax rate because of
the difficulty of computing these taxes in
a consistent way for all economies cov-
ered. The fuel tax amounts are in most
cases very small, and measuring these
amounts is often complicated because
they depend on fuel consumption. Fuel
taxes continue to be counted in the num-
ber of payments.
The total tax rate is designed to provide a
comprehensive measure of the cost of all
the taxes a business bears. It differs from
the statutory tax rate, which merely pro-
vides the factor to be applied to the tax
base. In computing the total tax rate, the
actual tax payable is divided by commer-
cial profit. Data for Kiribati are provided as
an example (table 21.10).
Commercial profit is essentially net profit
before all taxes borne. It differs from the
conventional profit before tax, reported in
financial statements. In computing profit
before tax, many of the taxes borne by a
firm are deductible. In computing com-
mercial profit, these taxes are not deduct-
ible. Commercial profit therefore presents
a clear picture of the actual profit of a
business before any of the taxes it bears
in the course of the fiscal year.
Commercial profit is computed as sales
minus cost of goods sold, minus gross
salaries, minus administrative expenses,
minus other expenses, minus provisions,
plus capital gains (from the property sale)
minus interest expense, plus interest in-
come and minus commercial deprecia-
tion. To compute the commercial depreci-
ation, a straight-line depreciation method
is applied, with the following rates: 0% for
the land, 5% for the building, 10% for the
machinery, 33% for the computers, 20%
for the office equipment, 20% for the
truck and 10% for business development
expenses. Commercial profit amounts to
59.4 times income per capita.
The methodology for calculating the to-
tal tax rate is broadly consistent with the
Total Tax Contribution framework devel-
oped by PwC and the calculation within
this framework for taxes borne. But while
the work undertaken by PwC is usually
based on data received from the largest
companies in the economy, Doing Busi-
ness focuses on a case study for a stan-
dardized medium-size company.
The data details on paying taxes can be
found for each economy at http://www.
doingbusiness.org by selecting the economy
in the drop-down list. This methodology was
developed by Djankov and others (2010).
TRADING ACROSS BORDERSDoing Business measures the time and
cost (excluding tariffs) associated with
exporting and importing a standardized
cargo of goods by sea transport. The time
and cost necessary to complete every
official procedure for exporting and im-
porting the goods are recorded; however,
the time and cost for sea transport are
not included. All documents needed by
the trader to export or import the goods
across the border are also recorded. For
exporting goods, procedures range from
packing the goods into the container at
the warehouse to their departure from
the port of exit. For importing goods,
procedures range from the vessel’s arriv-
al at the port of entry to the cargo’s de-
livery at the warehouse. For landlocked
economies, these include procedures at
the inland border post, since the port is
located in the transit economy. Payment
is made by letter of credit, and the time,
TABLE 21.10 Computing the total tax rate for Kiribati
Type of tax (tax base)
Statutory rate
r (%)
Statutory tax base
b ($A)
Actual tax payable a = r × b
($A)
Commercial profit*
c ($A)
Total tax rate t = a/c
(%)
Corporate income tax (taxable income) 20.0–35.0 87,565 25,647 109,801 23.4
Employer-paid social security contributions (taxable wages)
7.5 123,854 9,289 109,801 8.5
Total 34,936 31.8
* Profit before all taxes borne. Note: Commercial profit is assumed to be 59.4 times income per capita. $A is Australian dollar. Source: Doing Business database.
DATA NOTES 147

cost and documents required for the
issuance or advising of a letter of cred-
it are taken into account (figure 21.15).
The ranking on the ease of trading across
borders is the simple average of the per-
centile rankings on its component indi-
cators (figure 21.16).
Local freight forwarders, shipping lines,
customs brokers, port officials and banks
provide information on required docu-
ments and cost as well as the time to
complete each procedure. To make the
data comparable across economies, sev-
eral assumptions about the business and
the traded goods are used.
Assumptions about the traded goodsThe traded product travels in a dry-
cargo, 20-foot,7 full container load. It
weighs 10 tons and is valued at $20,000.
The product:
• Is not hazardous nor does it include
military items.
• Does not require refrigeration or any
other special environment.
• Does not require any special phy-
tosanitary or environmental safety
standards other than accepted inter-
national standards.
• Is one of the economy’s leading ex-
port or import products.
Assumptions about the businessThe business:
• Has at least 60 employees.
• Is located in the economy’s largest
business city (see table 21A.1).
• Is a private, limited liability company.
• Does not operate in an export process-
ing zone or an industrial estate with
special export or import privileges.
• Is 100% domestically owned.
• Exports more than 10% of its sales.
DocumentsAll documents required per shipment to
export and import the goods are record-
ed (table 21.11). It is assumed that a new
contract is drafted per shipment and that
the contract has already been agreed
upon and executed by both parties. Doc-
uments required for clearance by relevant
agencies—including government minis-
tries, customs, port authorities and other
control agencies—are taken into account.
For landlocked economies, documents re-
quired by authorities in the transit econ-
omy are also included. Since payment is
by letter of credit, all documents required
by banks for the issuance or securing of a
letter of credit are also taken into account.
Documents that are requested at the time
of clearance but that are valid for a year
or longer and do not require renewal per
shipment (for example, an annual tax
clearance certificate) are not included.
Documents that are required purely for
purposes of preferential treatment are no
longer included—for example, a certificate
of origin if the use is only to qualify for a
preferential tariff rate under trade agree-
ments. It is assumed that the exporter will
33.3% Documents
to export and import
33.3% Cost to export
and import
33.3% Time to export and import
Document preparation,customs clearance andtechnical control, port
and terminal handling,inland transport
and handling
All documents required by customs and other agencies
US$ per 20-foot container, no bribes or tariffs included
FIGURE 21.16 Trading across borders: exporting and importing by sea transport Rankings are based on 3 indicators
Full, 20-foot container
Port and terminal handling
Customs and border agencies
Inlandtransport
Export
Import
To export
Time
Cost
Documents
Time
Cost
DocumentsTo import
FIGURE 21.15 How much time, how many documents and what cost to export and import by sea transport?
TABLE 21.11 What do the trading across borders indicators measure?
Documents required to export and import (number)
Bank documents
Customs clearance documents
Port and terminal handling documents
Transport documents
Time required to export and import (days)
Obtaining, filling out and submitting all the documents
Inland transport and handling
Customs clearance and inspections
Port and terminal handling
Does not include sea transport time
Cost required to export and import (US$ per container)
All documentation
Inland transport and handling
Customs clearance and inspections
Port and terminal handling
Official costs only, no bribes
DOING BUSINESS 2014148

33.3% Time
33.3% Procedures
33.3% Cost
Attorney, court and enforcement costs as
% of claim value
Days to resolve commercial sale dispute through the courts
Steps to file claim, obtain judgment and enforce it
FIGURE 21.18 Enforcing contracts: resolving a commercial dispute through the courts Rankings are based on 3 indicators
always obtain a certificate of origin for its
trade partner, however, and the time and
cost associated with obtaining it are in-
cluded in the time and cost to export.
TimeThe time for exporting and importing
is recorded in calendar days. The time
calculation for a procedure starts from
the moment it is initiated and runs un-
til it is completed. If a procedure can be
accelerated for an additional cost and is
available to all trading companies, the
fastest legal procedure is chosen. Fast-
track procedures applying only to firms
located in an export processing zone, or
only to certain accredited firms under
authorized economic operator programs,
are not taken into account because they
are not available to all trading companies.
Sea transport time is not included. It is as-
sumed that neither the exporter nor the
importer wastes time and that each com-
mits to completing each remaining proce-
dure without delay. Procedures that can
be completed in parallel are measured
as simultaneous. But it is assumed that
document preparation, inland transport,
customs and other clearance, and port
and terminal handling require a minimum
time of 1 day each and cannot take place
simultaneously. The waiting time be-
tween procedures—for example, during
unloading of the cargo—is included in the
measure.
CostCost measures the fees levied on a 20-
foot container in U.S. dollars. All the fees
associated with completing the proce-
dures to export or import the goods are
taken into account. These include costs
for documents, administrative fees for
customs clearance and inspections, cus-
toms broker fees, port-related charges
and inland transport costs. The cost does
not include customs tariffs and duties or
costs related to sea transport. Only offi-
cial costs are recorded.
The data details on trading across borders
can be found for each economy at http://
www.doingbusiness.org by selecting the
economy in the drop-down list. This meth-
odology was developed by Djankov, Freund
and Pham (2010) and is adopted here with
minor changes.
ENFORCING CONTRACTSIndicators on enforcing contracts mea-
sure the efficiency of the judicial system
in resolving a commercial dispute. The
data are built by following the step-by-
step evolution of a commercial sale dis-
pute before local courts. The data are col-
lected through study of the codes of civil
procedure and other court regulations as
well as questionnaires completed by local
litigation lawyers and by judges (figure
21.17). The ranking on the ease of enforc-
ing contracts is the simple average of the
percentile rankings on its component in-
dicators (figure 21.18).
The name of the relevant court in each
economy—the court in the largest busi-
ness city with jurisdiction over com-
mercial cases worth 200% of income
per capita—is published at http://www
.doingbusiness.org/data/exploretopics/
enforcing-contracts.
Assumptions about the case• The value of the claim equals 200%
of the economy’s income per capita.
• The dispute concerns a lawful trans-
action between 2 businesses (Seller
and Buyer), located in the economy’s
largest business city (see table 21A.1).
Seller sells goods worth 200% of the
economy’s income per capita to Buyer.
After Seller delivers the goods to Buy-
er, Buyer refuses to pay for the goods
on the grounds that the delivered
goods were not of adequate quality.
• Seller (the plaintiff) sues Buyer (the
defendant) to recover the amount
under the sales agreement (that is,
200% of the economy’s income per
capita). Buyer opposes Seller’s claim,
saying that the quality of the goods
is not adequate. The claim is disput-
ed on the merits. The court cannot
decide the case on the basis of doc-
umentary evidence or legal title alone.
• A court in the economy’s largest busi-
ness city with jurisdiction over com-
mercial cases worth 200% of income
per capita decides the dispute.
• Seller attaches Buyer’s movable assets
(for example, office equipment and
vehicles) before obtaining a judgment
because Seller fears that Buyer may
become insolvent.
• An expert opinion is given on the qual-
ity of the delivered goods. If it is stan-
dard practice in the economy for each
party to call its own expert witness, the
parties each call one expert witness.
If it is standard practice for the judge
to appoint an independent expert, the
judge does so. In this case the judge
does not allow opposing expert testi-
mony.
• The judgment is 100% in favor of Sell-
er: the judge decides that the goods
are of adequate quality and that Buyer
must pay the agreed price.
• Buyer does not appeal the judgment.
Seller decides to start enforcing the
Court
Commercial dispute
Company A(seller
& plaintiff)
Company B(buyer
& defendant)
Trial & judgment
Filing of court case
Enforcement
TimeCost
Number of procedures
FIGURE 21.17 What are the time, cost and number of procedures to resolve a commercial dispute through the courts?
DATA NOTES 149
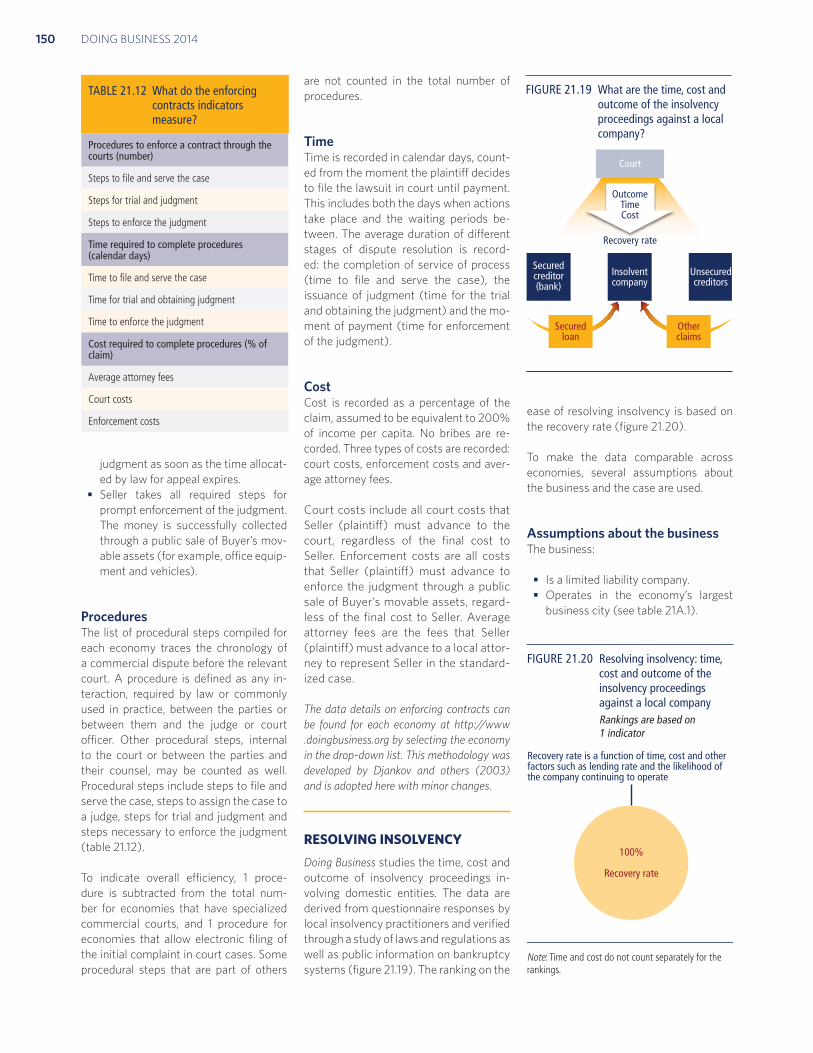
judgment as soon as the time allocat-
ed by law for appeal expires.
• Seller takes all required steps for
prompt enforcement of the judgment.
The money is successfully collected
through a public sale of Buyer’s mov-
able assets (for example, office equip-
ment and vehicles).
ProceduresThe list of procedural steps compiled for
each economy traces the chronology of
a commercial dispute before the relevant
court. A procedure is defined as any in-
teraction, required by law or commonly
used in practice, between the parties or
between them and the judge or court
officer. Other procedural steps, internal
to the court or between the parties and
their counsel, may be counted as well.
Procedural steps include steps to file and
serve the case, steps to assign the case to
a judge, steps for trial and judgment and
steps necessary to enforce the judgment
(table 21.12).
To indicate overall efficiency, 1 proce-
dure is subtracted from the total num-
ber for economies that have specialized
commercial courts, and 1 procedure for
economies that allow electronic filing of
the initial complaint in court cases. Some
procedural steps that are part of others
are not counted in the total number of
procedures.
TimeTime is recorded in calendar days, count-
ed from the moment the plaintiff decides
to file the lawsuit in court until payment.
This includes both the days when actions
take place and the waiting periods be-
tween. The average duration of different
stages of dispute resolution is record-
ed: the completion of service of process
(time to file and serve the case), the
issuance of judgment (time for the trial
and obtaining the judgment) and the mo-
ment of payment (time for enforcement
of the judgment).
CostCost is recorded as a percentage of the
claim, assumed to be equivalent to 200%
of income per capita. No bribes are re-
corded. Three types of costs are recorded:
court costs, enforcement costs and aver-
age attorney fees.
Court costs include all court costs that
Seller (plaintiff) must advance to the
court, regardless of the final cost to
Seller. Enforcement costs are all costs
that Seller (plaintiff) must advance to
enforce the judgment through a public
sale of Buyer’s movable assets, regard-
less of the final cost to Seller. Average
attorney fees are the fees that Seller
(plaintiff) must advance to a local attor-
ney to represent Seller in the standard-
ized case.
The data details on enforcing contracts can
be found for each economy at http://www
.doingbusiness.org by selecting the economy
in the drop-down list. This methodology was
developed by Djankov and others (2003)
and is adopted here with minor changes.
RESOLVING INSOLVENCY Doing Business studies the time, cost and
outcome of insolvency proceedings in-
volving domestic entities. The data are
derived from questionnaire responses by
local insolvency practitioners and verified
through a study of laws and regulations as
well as public information on bankruptcy
systems (figure 21.19). The ranking on the
ease of resolving insolvency is based on
the recovery rate (figure 21.20).
To make the data comparable across
economies, several assumptions about
the business and the case are used.
Assumptions about the businessThe business:
• Is a limited liability company.
• Operates in the economy’s largest
business city (see table 21A.1).
FIGURE 21.19 What are the time, cost and outcome of the insolvency proceedings against a local company?
Court
Securedloan
Otherclaims
Securedcreditor(bank)
Insolventcompany
Unsecuredcreditors
OutcomeTimeCost
Recovery rate
100%
Recovery rate
Recovery rate is a function of time, cost and other factors such as lending rate and the likelihood of the company continuing to operate
FIGURE 21.20 Resolving insolvency: time, cost and outcome of the insolvency proceedings against a local company Rankings are based on 1 indicator
Note: Time and cost do not count separately for the rankings.
TABLE 21.12 What do the enforcing contracts indicators measure?
Procedures to enforce a contract through the courts (number)
Steps to file and serve the case
Steps for trial and judgment
Steps to enforce the judgment
Time required to complete procedures (calendar days)
Time to file and serve the case
Time for trial and obtaining judgment
Time to enforce the judgment
Cost required to complete procedures (% of claim)
Average attorney fees
Court costs
Enforcement costs
DOING BUSINESS 2014150

Recovery rateThe recovery rate is recorded as cents on
the dollar recouped by creditors through
reorganization, liquidation or debt en-
forcement (foreclosure) proceedings.
The calculation takes into account the
outcome: whether the business emerges
from the proceedings as a going concern
or the assets are sold piecemeal. Then the
costs of the proceedings are deducted (1
cent for each percentage point of the val-
ue of the debtor’s estate). Finally, the val-
ue lost as a result of the time the money
remains tied up in insolvency proceedings
is taken into account, including the loss
of value due to depreciation of the hotel
furniture. Consistent with international
accounting practice, the annual depreci-
ation rate for furniture is taken to be 20%.
The furniture is assumed to account for a
quarter of the total value of assets. The
recovery rate is the present value of the
TABLE 21.13 What do the resolving insolvency indicators measure?
Time required to recover debt (years)
Measured in calendar years
Appeals and requests for extension are included
Cost required to recover debt (% of debtor’s estate)
Measured as percentage of estate value
Court fees
Fees of insolvency administrators
Lawyers’ fees
Assessors’ and auctioneers’ fees
Other related fees
Outcome
Whether business continues operating as a going concern or business assets are sold piecemeal
Recovery rate for creditors (cents on the dollar)
Measures the cents on the dollar recovered by creditors
Present value of debt recovered
Official costs of the insolvency proceedings are deducted
Depreciation of furniture is taken into account
Outcome for the business (survival or not) affects the maximum value that can be recovered
• Is 100% domestically owned, with
the founder, who is also the chairman
of the supervisory board, owning 51%
(no other shareholder holds more
than 5% of shares).
• Has downtown real estate, where it
runs a hotel, as its major asset.
• Has a professional general manager.
• Has 201 employees and 50 suppliers,
each of which is owed money for the
last delivery.
• Has a 10-year loan agreement with a
domestic bank secured by a mortgage
over the hotel’s real estate property. A
universal business charge (for exam-
ple, a floating charge) is also assumed
in economies where such collateral is
recognized. If the laws of the econo-
my do not specifically provide for a
universal business charge but con-
tracts commonly use some other pro-
vision to that effect, this provision is
specified in the loan agreement.
• Has observed the payment schedule
and all other conditions of the loan up
to now.
• The business’s market value, operat-
ing as a going concern, is 100 times
income per capita or $200,000,
whichever is greater. The market val-
ue of the company’s assets, if sold
piecemeal, is 70% of the business’s market value.
Assumptions about the caseThe business is experiencing liquidity
problems. The company’s loss in 2012 re-
duced its net worth to a negative figure. It
is January 1, 2013. There is no cash to pay
the bank interest or principal in full, due
the next day, January 2. The business will
therefore default on its loan. Manage-
ment believes that losses will be incurred
in 2013 and 2014 as well.
The amount outstanding under the loan
agreement is exactly equal to the market
value of the hotel business and represents
74% of the company’s total debt. The other
26% of its debt is held by unsecured credi-
tors (suppliers, employees, tax authorities).
The company has too many creditors to
negotiate an informal out-of-court work-
out. The following options are available:
a judicial procedure aimed at the reha-
bilitation or reorganization of the com-
pany to permit its continued operation; a
judicial procedure aimed at the liquidation
or winding-up of the company; or a debt
enforcement or foreclosure procedure
against the company, enforced either in
court (or through another government
authority) or out of court (for example, by
appointing a receiver).
Assumptions about the partiesThe bank wants to recover as much as
possible of its loan, as quickly and cheap-
ly as possible. The unsecured creditors
will do everything permitted under the
applicable laws to avoid a piecemeal sale
of the assets. The majority shareholder
wants to keep the company operating and
under its control. Management wants to
keep the company operating and preserve
its employees’ jobs. All the parties are lo-
cal entities or citizens; no foreign parties
are involved.
TimeTime for creditors to recover their credit
is recorded in calendar years (table 21.13).
The period of time measured by Doing
Business is from the company’s default
until the payment of some or all of the
money owed to the bank. Potential delay
tactics by the parties, such as the filing of
dilatory appeals or requests for extension,
are taken into consideration.
CostThe cost of the proceedings is recorded as
a percentage of the value of the debtor’s
estate. The cost is calculated on the basis
of questionnaire responses and includes
court fees and government levies; fees of
insolvency administrators, auctioneers,
assessors and lawyers; and all other fees
and costs.
OutcomeRecovery by creditors depends on wheth-
er the hotel business emerges from the
proceedings as a going concern or the
company’s assets are sold piecemeal. If
the business keeps operating, no value is
lost and the bank can satisfy its claim in
full, or recover 100 cents on the dollar. If
the assets are sold piecemeal, the maxi-
mum amount that can be recovered will
not exceed 70% of the bank’s claim, which
translates into 70 cents on the dollar.
DATA NOTES 151

remaining proceeds, based on end-2012
lending rates from the International Mon-
etary Fund’s International Financial Statis-
tics, supplemented with data from central
banks and the Economist Intelligence Unit.
No practice If an economy had zero cases a year over
the past 5 years involving a judicial reor-
ganization, judicial liquidation or debt en-
forcement procedure (foreclosure), the
economy receives a “no practice” ranking.
This means that creditors are unlikely to
recover their money through a formal legal
process (in or out of court). The recovery
rate for “no practice” economies is zero.
This methodology was developed by Djankov
and others (2008) and is adopted here with
minor changes.
EMPLOYING WORKERSDoing Business measures flexibility in the
regulation of employment, specifically
as it affects the hiring and redundancy of
workers and the rigidity of working hours
(figure 21.21). Over the period from 2007
to 2011 improvements were made to align
the methodology for the employing work-
ers indicators with the letter and spirit of
the ILO conventions. Only 4 of the 188 ILO
conventions cover areas measured by Do-
ing Business: employee termination, week-
end work, holiday with pay and night work.
The Doing Business methodology is fully
consistent with these 4 conventions. The
ILO conventions covering areas related to
the employing workers indicators do not
include the ILO core labor standards—8
conventions covering the right to collec-
tive bargaining, the elimination of forced
labor, the abolition of child labor and equi-
table treatment in employment practices.
Between 2009 and 2011 the World Bank
Group worked with a consultative group—
including labor lawyers, employer and
employee representatives, and experts
from the ILO, the OECD, civil society and
the private sector—to review the employ-
ing workers methodology and explore fu-
ture areas of research.8 A full report with
the conclusions of the consultative group,
along with the employing workers meth-
odology it proposed, is available at http://
www.doingbusiness.org/methodology/
employing-workers. This year Doing Busi-
ness continued research collecting addi-
tional data on regulations covering work-
ers’ probationary period.
Doing Business 2014 presents the data on the
employing workers indicators in an annex.
The report does not present rankings of econ-
omies on the employing workers indicators
or include the topic in the aggregate ranking
on the ease of doing business. Detailed data
collected on labor regulations are available
on the Doing Business website (http://www
.doingbusiness.org). The data on employing
workers are based on a detailed ques-
tionnaire on employment regulations that
is completed by local lawyers and public
officials. Employment laws and regulations
as well as secondary sources are reviewed to
ensure accuracy. To make the data compara-
ble across economies, several assumptions
about the worker and the business are used.
Assumptions about the workerThe worker:
• Earns a salary plus benefits equal to
the economy’s average wage during
the entire period of his employment.
• Has a pay period that is the most
common for workers in the economy.
• Is a lawful citizen who belongs to the
same race and religion as the majority
of the economy’s population.
• Resides in the economy’s largest busi-
ness city (see table 21A.1).
• Is not a member of a labor union, un-
less membership is mandatory.
Assumptions about the businessThe business:
• Is a limited liability company.
• Operates in the economy’s largest
business city.
• Is 100% domestically owned.
• Operates in the manufacturing sec-
tor.
• Has 60 employees.
• Is subject to collective bargaining
agreements in economies where
such agreements cover more than
half the manufacturing sector and
apply even to firms not party to them.
• Abides by every law and regulation
but does not grant workers more
benefits than mandated by law, reg-
ulation or (if applicable) collective
bargaining agreement.
Rigidity of employment Rigidity of employment covers 3 areas:
difficulty of hiring, rigidity of hours and
difficulty of redundancy (table 21.14).
Difficulty of hiring covers (i) whether
fixed-term contracts are prohibited for
permanent tasks; (ii) the maximum cu-
mulative duration of fixed-term contracts;
and (iii) the ratio of the minimum wage
for a trainee or first-time employee to the
average value added per worker.9
Rigidity of hours covers 5 areas: (i) wheth-
er there are restrictions on night work;
(ii) whether there are restrictions on
weekly holiday work; (iii) whether the
Hiring1.
Work scheduling
Redundancy
2.
3.i i
Hours
Schedule
R d dd3
FIGURE 21.21 How flexible are hiring, work scheduling and redundancy rules?
DOING BUSINESS 2014152

workweek can consist of 5.5 days or
is more than 6 days; (iv) whether the
workweek can extend to 50 hours or
more (including overtime) for 2 months
a year to respond to a seasonal increase
in production; and (v) whether the aver-
age paid annual leave for a worker with 1
year of tenure, a worker with 5 years and
a worker with 10 years is more than 26
working days or fewer than 15 working
days.
Difficulty of redundancy looks at 8 ques-
tions: (i) whether redundancy is disal-
lowed as a basis for terminating workers;
(ii) whether the employer needs to no-
tify a third party (such as a government
agency) to terminate 1 redundant worker;
(iii) whether the employer needs to no-
tify a third party to terminate a group of
9 redundant workers; (iv) whether the
employer needs approval from a third
party to terminate 1 redundant worker;
(v) whether the employer needs ap-
proval from a third party to terminate
a group of 9 redundant workers; (vi)
whether the law requires the employer
to reassign or retrain a worker before
making the worker redundant; (vii)
whether priority rules apply for redun-
dancies; and (viii) whether priority rules
apply for reemployment.
Redundancy costRedundancy cost measures the cost of
advance notice requirements, severance
payments and penalties due when ter-
minating a redundant worker, expressed
in weeks of salary. The average value of
notice requirements and severance pay-
ments applicable to a worker with 1 year
of tenure, a worker with 5 years and a
worker with 10 years is considered. One
month is recorded as 4 and 1/3 weeks.
The data details on employing workers can
be found for each economy at http://www.
doingbusiness.org. The Doing Business
website provides historical data sets to allow
comparison of data across years. The em-
ploying workers methodology was developed
by Botero and others (2004). Doing Busi-
ness 2014 does not present rankings of econ-
omies on the employing workers indicators.
NOTES
1. The data for paying taxes refer to January–
December 2012.
2. For getting electricity the rule that each
procedure must take a minimum of 1 day
still applies because in practice there are no
cases in which procedures can be fully com-
pleted online in less than a day. For example,
even though in some cases it is possible to
apply for an electricity connection online,
additional requirements mean that the pro-
cess cannot be completed in less than 1 day.
3. This correction rate reflects changes that ex-
ceed 5% up or down.
4. This question is usually regulated by stock ex-
change or securities laws. Points are awarded
only to economies with more than 10 listed
firms in their most important stock exchange.
5. When evaluating the regime of liability for
company directors for a prejudicial relat-
ed-party transaction, Doing Business assumes
that the transaction was duly disclosed and
approved. Doing Business does not measure
director liability in the event of fraud.
6. PwC refers to the network of member firms
of PricewaterhouseCoopers International
Limited (PwCIL), or, as the context requires,
individual member firms of the PwC net-
work. Each member firm is a separate legal
entity and does not act as agent of PwCIL
or any other member firm. PwCIL does
not provide any services to clients. PwCIL
is not responsible or liable for the acts or
omissions of any of its member firms nor
can it control the exercise of their profes-
sional judgment or bind them in any way.
No member firm is responsible or liable for
the acts or omissions of any other member
firm nor can it control the exercise of an-
other member firm’s professional judgment
or bind another member firm or PwCIL in
any way.
7. While different types of containers are used
around the world, the 2 most important are
20-foot and 40-foot containers. Use of 40-
foot containers is growing, but this year’s
research confirms that 20-foot containers
are still common in the majority of econo-
mies. According to respondents questioned
in each of the 189 economies covered by
Doing Business, 20-foot and 40-foot con-
tainers are equally common in 49% of the
economies, 20-foot containers are more
common in 29%, and 40-foot containers
are mostly relied on in only 10%. For the
remaining 12% of economies no data on
the use of the 2 types of containers were
available. The trading across borders indi-
cators will continue to be based on 20-foot
containers because this size remains the
most relevant for international trade across
the globe.
8. For the terms of reference and com-
position of the consultative group, see
World Bank, “Doing Business Employing
Workers Indicator Consultative Group,”
http://www.doingbusiness.org.
9. The average value added per worker is the
ratio of an economy’s GNI per capita to the
working-age population as a percentage of
the total population.
TABLE 21.14 What do the employing workers indicators measure?
Rigidity of employment
Difficulty of hiring
Fixed-term contracts prohibited for permanent tasks?
Maximum duration of fixed-term contracts
Ratio of minimum wage for trainee or first-time employee to value added per worker
Rigidity of hours
Restrictions on night work and weekend work?
Allowed maximum length of the workweek in days and hours, including overtimeFifty-hour workweeks permitted for 2 months due to an increase in production?
Paid annual vacation days
Difficulty of redundancy
Redundancy allowed as grounds for termination?
Notification required for termination of a redundant worker or group of workers?Approval required for termination of a redundant worker or group of workers?Employer obligated to reassign or retrain and to follow priority rules for redundancy and reemployment?
Redundancy cost (weeks of salary)
Notice requirements, severance payments and penalties due when terminating a redundant worker, expressed in weeks of salary
DATA NOTES 153
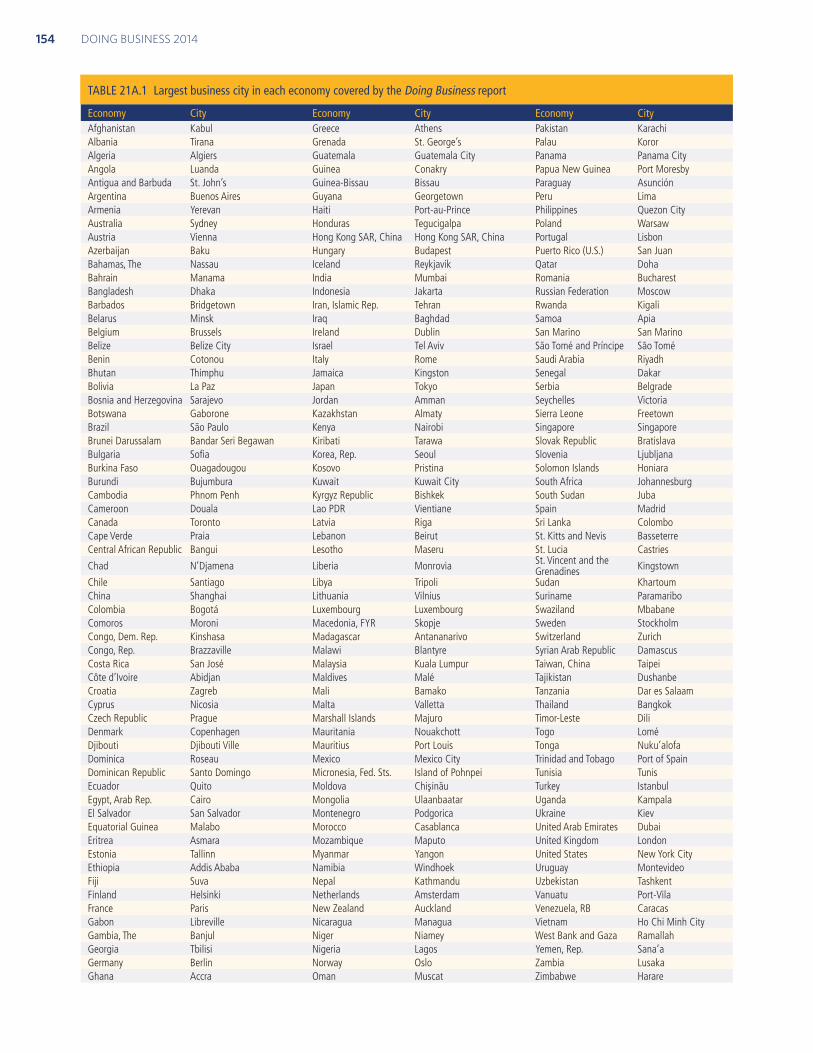
TABLE 21A.1 Largest business city in each economy covered by the Doing Business report
Economy City Economy City Economy CityAfghanistan Kabul Greece Athens Pakistan KarachiAlbania Tirana Grenada St. George’s Palau KororAlgeria Algiers Guatemala Guatemala City Panama Panama CityAngola Luanda Guinea Conakry Papua New Guinea Port MoresbyAntigua and Barbuda St. John’s Guinea-Bissau Bissau Paraguay AsunciónArgentina Buenos Aires Guyana Georgetown Peru LimaArmenia Yerevan Haiti Port-au-Prince Philippines Quezon CityAustralia Sydney Honduras Tegucigalpa Poland WarsawAustria Vienna Hong Kong SAR, China Hong Kong SAR, China Portugal LisbonAzerbaijan Baku Hungary Budapest Puerto Rico (U.S.) San JuanBahamas, The Nassau Iceland Reykjavik Qatar DohaBahrain Manama India Mumbai Romania BucharestBangladesh Dhaka Indonesia Jakarta Russian Federation MoscowBarbados Bridgetown Iran, Islamic Rep. Tehran Rwanda KigaliBelarus Minsk Iraq Baghdad Samoa ApiaBelgium Brussels Ireland Dublin San Marino San MarinoBelize Belize City Israel Tel Aviv São Tomé and Príncipe São ToméBenin Cotonou Italy Rome Saudi Arabia RiyadhBhutan Thimphu Jamaica Kingston Senegal DakarBolivia La Paz Japan Tokyo Serbia BelgradeBosnia and Herzegovina Sarajevo Jordan Amman Seychelles VictoriaBotswana Gaborone Kazakhstan Almaty Sierra Leone FreetownBrazil São Paulo Kenya Nairobi Singapore SingaporeBrunei Darussalam Bandar Seri Begawan Kiribati Tarawa Slovak Republic BratislavaBulgaria Sofia Korea, Rep. Seoul Slovenia LjubljanaBurkina Faso Ouagadougou Kosovo Pristina Solomon Islands HoniaraBurundi Bujumbura Kuwait Kuwait City South Africa JohannesburgCambodia Phnom Penh Kyrgyz Republic Bishkek South Sudan JubaCameroon Douala Lao PDR Vientiane Spain MadridCanada Toronto Latvia Riga Sri Lanka ColomboCape Verde Praia Lebanon Beirut St. Kitts and Nevis BasseterreCentral African Republic Bangui Lesotho Maseru St. Lucia Castries
Chad N’Djamena Liberia Monrovia St. Vincent and the Grenadines Kingstown
Chile Santiago Libya Tripoli Sudan KhartoumChina Shanghai Lithuania Vilnius Suriname ParamariboColombia Bogotá Luxembourg Luxembourg Swaziland MbabaneComoros Moroni Macedonia, FYR Skopje Sweden StockholmCongo, Dem. Rep. Kinshasa Madagascar Antananarivo Switzerland ZurichCongo, Rep. Brazzaville Malawi Blantyre Syrian Arab Republic DamascusCosta Rica San José Malaysia Kuala Lumpur Taiwan, China TaipeiCôte d’Ivoire Abidjan Maldives Malé Tajikistan DushanbeCroatia Zagreb Mali Bamako Tanzania Dar es SalaamCyprus Nicosia Malta Valletta Thailand BangkokCzech Republic Prague Marshall Islands Majuro Timor-Leste DiliDenmark Copenhagen Mauritania Nouakchott Togo LoméDjibouti Djibouti Ville Mauritius Port Louis Tonga Nuku’alofaDominica Roseau Mexico Mexico City Trinidad and Tobago Port of SpainDominican Republic Santo Domingo Micronesia, Fed. Sts. Island of Pohnpei Tunisia TunisEcuador Quito Moldova Chisinau Turkey IstanbulEgypt, Arab Rep. Cairo Mongolia Ulaanbaatar Uganda KampalaEl Salvador San Salvador Montenegro Podgorica Ukraine KievEquatorial Guinea Malabo Morocco Casablanca United Arab Emirates DubaiEritrea Asmara Mozambique Maputo United Kingdom LondonEstonia Tallinn Myanmar Yangon United States New York CityEthiopia Addis Ababa Namibia Windhoek Uruguay MontevideoFiji Suva Nepal Kathmandu Uzbekistan TashkentFinland Helsinki Netherlands Amsterdam Vanuatu Port-VilaFrance Paris New Zealand Auckland Venezuela, RB CaracasGabon Libreville Nicaragua Managua Vietnam Ho Chi Minh CityGambia, The Banjul Niger Niamey West Bank and Gaza RamallahGeorgia Tbilisi Nigeria Lagos Yemen, Rep. Sana’aGermany Berlin Norway Oslo Zambia LusakaGhana Accra Oman Muscat Zimbabwe Harare
DOING BUSINESS 2014154