data mining with mascot integra - university of …...4 asms 2005 data mining facilities in mascot...
TRANSCRIPT

1
ASMS 2005
Data mining with Mascot Integra

2
ASMS 2005
What is Mascot Integra?
• Fully functional ‘out-the-box’ solution for proteomics workflow and data management
• Support for all the major mass-spectrometry data systems
• Powered by the Sapphire™ LIMS package from LabVantage Solutions Inc
• Oracle database• Scaleable to the largest projects.
Mascot Integra is supplied as a ready to run system. It does not require the extensive setup and customisation associated with a traditional LIMS package.
Rather than re-invent the wheel, we have partnered with LabVantageSolutions Inc, (www.lims.com). Their Sapphire LIMS package provides the sample tracking and workflow modelling functionality for Mascot Integra
Using the Oracle database management system enables the database to scale efficiently as your data management requirements grow

3
ASMS 2005
Mascot Integra architecture
• 3 tier system– Oracle database
server– Sybase Enterprise
Application Server running a J2EE web application
– All user functionality available through Internet Explorer
All Mascot Integra functionality is accessible through a standard web browser.

4
ASMS 2005
Data mining facilities in Mascot Integra
• Data mining is one of the key features of Mascot Integra
• Standard reports– Extensions to the standard Mascot reports– Sample genealogy tracking
• including searching for proteins/peptides within results– Clustering reports
• Custom Excel reporting– Aiding/validating protein identification– Generating summary reports
• e.g. by project, study, experiment or user– Preparing data for publication.
The ‘raw’ Mascot search results are imported into the Integra database. The schema of the database has been designed to facilitate data mining. This allows us to offer extensions to the ‘Standard’ Mascot reports, track sample history, offer the new clustering report and facilitates flexible ad-hoc querying of the database to produce custom reports using Microsoft Excel.

5
ASMS 2005
Extended standard reports
• Filtering– You can set up SQL filters to exclude protein hits
which do not match specified criteria– Can be based on any property of the protein or of
its peptide matches stored in the database– Can take runtime parameters
• e.g. Show me only those proteins which have a mascot score > X
Filtering reports enables you to view only protein hits which match a range of specified criteria. They are very flexible and can be based on any property of the protein or its peptide matches which are stored within the database and can take runtime parameters, enabling the end user to specify the exact conditions after the filter has been designed -knowledge of the SQL query language is required to design the filters, but not to use them. For example, we could set up a filter which excludes all the protein hits from the report which do not contain at least one peptide match which is predicted to be phosphorylated.

6
ASMS 2005
Filters can be designed for use with the standard Mascot
reports. These return a list of valid protein
hits which will be displayed on the
report and can take runtime parameters.
This report is from a MudPIT run and contains 2267 protein hits – a large number of results to look through. However, we may have some a priori knowledge which we can apply to the situation – for example, we may know that there is a protein of interest in the source mixture with a pI > 9. If we design a filter which only displays protein hits with a pIvalue of 9 or above, then this returns 474 of those 2267 hits – the 1st of which is hit number 63

7
ASMS 2005
Individual protein/peptide matches can be approved and
persistent comments addedWhich are then visible
when we view the report later
All of the standard Mascot reports can be generated from the database. In addition, individual protein and peptide matches can be annotated and approved. These annotations are persistent and will be displayed on the report when viewed at a later date. A protein/peptide match can be annotated/approved as many times as you wish, so that additional notes and corrections can be added.

8
ASMS 2005
You can choose to view only protein hits from a specific range
Because the results hare held in the database, you can choose to view just a specified range of search results, rather than displaying all of the protein hits in the report. This speeds up report generation and reduces problems with Internet Explorer opening very large results files, and also helps with working systematically through a report.

9
ASMS 2005
It is possible to search for any protein hits stored in the database which contain an identified peptide match to a
specified sequence or subsequence
We can search for any accession or anything within the protein hit description. In addition to this, it is possible to search for any protein hits stored in the database which have an identified Mascot peptide match to a specified peptide sequence or subsequence. Here, we are looking for any protein hits in the database which have a peptide match containing the subsequence TPLK – one of the recognition sites for the p34cdc2 cell-cycle regulating kinase. As we can see, there are matches to several proteins which may be involved in the Cell-cycle (e.g. bub1, IPI00010141)

10
ASMS 2005
BLAST Clustering results
• Protein hits from multiple searches can be clustered into a single report– Comparing e.g.
• wild-type with mutant• Search conditions
• Uses BLAST• Result filters can be used to limit the protein
hits used to generate the report.
Another report groups protein hits from multiple reports, to allow comparison of the proteins present between the reports. This uses BLASTClust from NCBI and so uses the whole protein sequence to generate the clusters, not the peptide matches shared between the hits and not the protein accession – homologous proteins will appear in the same cluster. We can filter the proteins present in the report using the same filters which can be applied to the standard reports, and we can also provide protein sequences which we wish to exclude any matches to (e.g. Trypsin, Keratin).

11
ASMS 2005
Results from 2 different samples derived from same original
source.All proteins clustered have at least
one significant peptide match
The report shows which clusters are present in the searches. We can then take a closer look at the proteins present in the clusters. In the images on the right, yellow represents significant peptide matches (0.5%)

12
ASMS 2005
Custom Excel Reports
• Why Excel?– Good integration with databases via ODBC– Familiar interface– Good graphing facilities– Good data analysis tools– VB Macros allow users to extend reports.
One of the main advantages of holding the raw mascot search results in a database is the ability to do ad hoc querying and generate custom reports. The database schema allows searches to be grouped by experiment, study, project or across the whole database, enabling complex cross search queries to be generated easily. The interface we have chosen to use to generate custom reports is Microsoft Excel.

13
ASMS 2005
Custom Excel Reports
• Generate SQL Queries• Embed multiple queries into a single Excel
worksheet• Generate reports can then be uploaded onto
the Integra server to act as templates• Wizard to create simple SQL queries• More complex queries require knowledge of
the SQL query language.
To generate an Excel report requires knowledge of the SQL Query language and knowledge of how to get the best out of Excel. However, once the lab expert has designed an Excel report, it can be uploaded into Mascot Integra as a report template. Then the individual users can downloaded the report to use for their own search results/experiments/studies/projects.

14
ASMS 2005
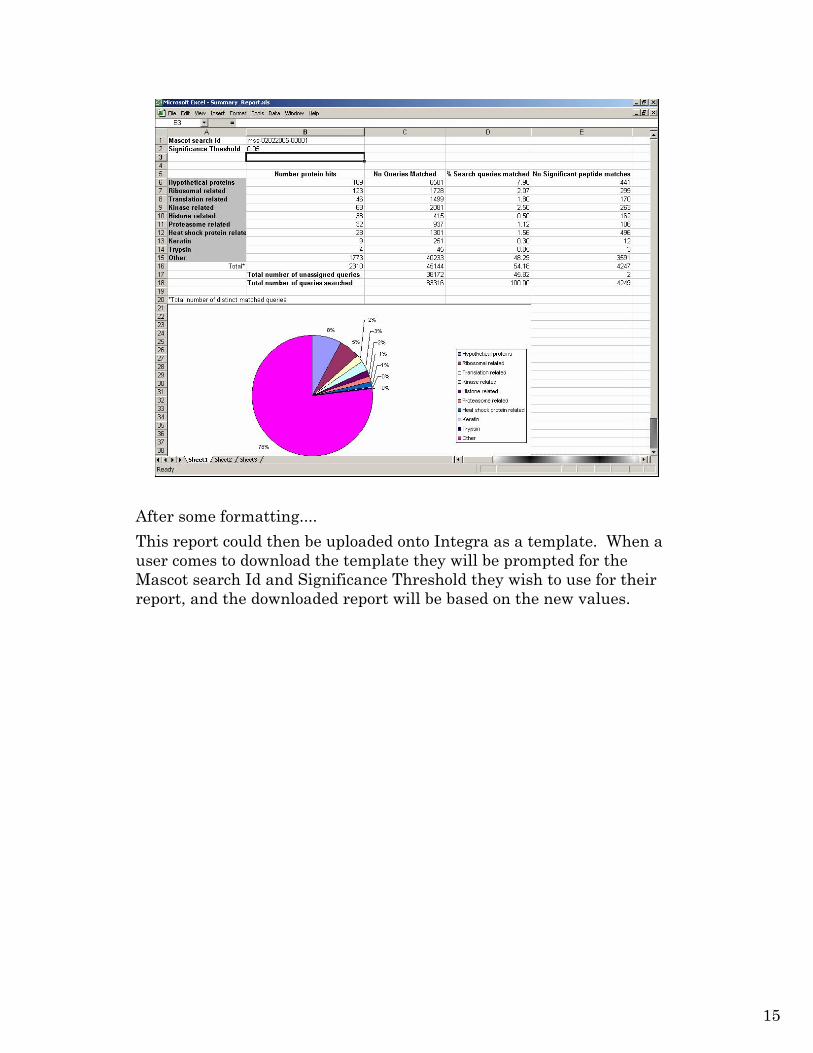
Here we have generated a query which generates summary data for a specified search using a specified peptide significance threshold. After setting up cells in the Excel worksheet which the query will take these values from, you import the Saved Query.
15
ASMS 2005
After some formatting....
This report could then be uploaded onto Integra as a template. When a user comes to download the template they will be prompted for the Mascot search Id and Significance Threshold they wish to use for their report, and the downloaded report will be based on the new values.

16
ASMS 2005
S.pombe 2D Gel example
• 2D Gel -> PMF search• 2 different spot processing protocols
– Manual in-gel digest– Automated in-gel digest on novel platform
• Compare results from the two different processing methods.
We’ll take a closer look at how we can use these data mining tools to generate a report in a ‘real world’ example.
Running 2D Gel analysis from S.pombe protein extracts and then comparing two different gel spot processing protocols (manual orautomated in-gel digest). We then want to compare the results obtained from the two methods to see if there are any differences between them

17
ASMS 2005
Data analysis approach
• Data from the two different methods searched and automatically imported into Integra (258 Mascot searches)
• Pull out all protein hits from all searches in the experiment exceeding specified criteria for each processing method into Excel– p < 0.05– 25% sequence coverage– Matches 6 or more peptides
• (Single SQL query)
• Analyse.
After the result are imported into the database we can generate an sqlquery to pull out the protein hit details from the two sets of searches (manual and automatic). The criteria (as are above) and can be specified within a single, simple SQL query against the protein hit table of the database.
We will then do some analysis of these data in Excel

18
ASMS 2005
Using the specified criteria, we can see that 95/110 spots have potential protein assignments from the automated digest method, compared with 77 from the manual in gel digest.

19
ASMS 2005
We’ve pulled out a lot of data relating to the quality of these matches from the database. Using Excels graphing tools we can take a closer look at the results from the two datasets to see if there are any overall differences in the data quality:
Overall quality of the data is similar – The distribution of no peptides matches and % coverage being similar for both the hand and robot(automated) datasets (the association with spot no was also expected as the lower mass proteins have been assigned the higher spot numbers). We can also plot the protein mass against the pI value for the potentially assigned protein hits to compare this with the source 2D gel information.

20
ASMS 2005
It is very easy to generate summary statistics using standard Excel features – again similar results for the number of peptides matches and percentage coverage from the two methods.

21
ASMS 2005
S.pombe conclusions
• Where we have matches, the data in both datasets is of similarly high quality
• Robot dataset identified matches for more spots within the specified criteria– Extraction quality was more consistent
• Use of EXCEL reports allows us to query and present these data quickly and easily.

22
ASMS 2005
Some other examples...
23
ASMS 2005
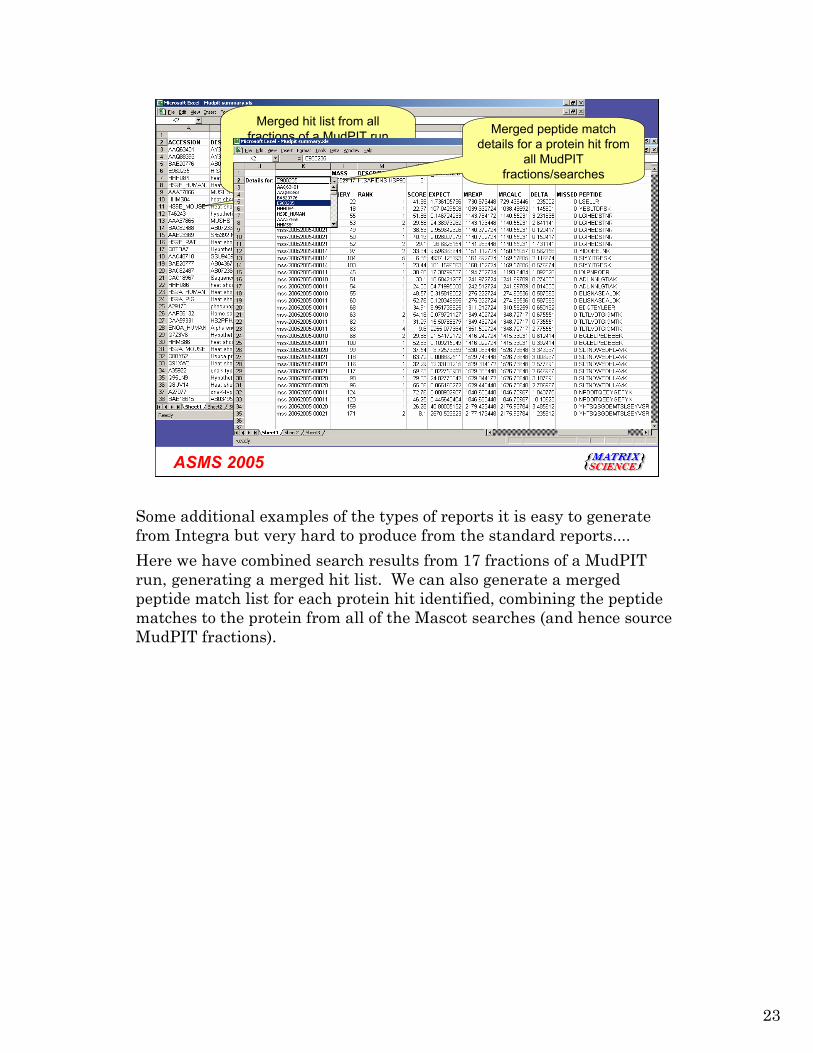
Merged hit list from all fractions of a MudPIT run
merged into a single report (each fraction resulting in separate Mascot search)
Merged peptide match details for a protein hit from
all MudPITfractions/searches
Some additional examples of the types of reports it is easy to generate from Integra but very hard to produce from the standard reports....
Here we have combined search results from 17 fractions of a MudPITrun, generating a merged hit list. We can also generate a merged peptide match list for each protein hit identified, combining the peptide matches to the protein from all of the Mascot searches (and hence source MudPIT fractions).

24
ASMS 2005
So we can check the quality of our 1st dimension chromatography...this generated from the same 17 MudPIT fractions. All of the peptides with a e value below the 0.05 threshold from all of the fractions have been identified and then cross checked against the search results from each fraction to see if the peptide is present (the yellow background shows the peptide is present, blue means it was absent from the search) – we can see that many of the peptides are present across multiple (usually adjacent) fractions.

25
ASMS 2005
A protein hit we’re not sure of – have we identified it elsewhere in the same experiment? and if so, what peptides did we match. In thisexperiment we have used the same source data, searched with different search parameters. The hit LUHU (an annexin) from a particular search is of interest but the scores are borderline. We can see from the other searches in the experiment that we have previously matched this hit and obtained a similar range of peptides.

26
ASMS 2005
Comparison between two PMF search strategies for a series of datafiles, then looking at the Mascot protein score and % coverage from the two strategies for the top hit for each source file.
Whatever Mods were picked they overall didn’t help, except possibly for 2190\0_E2 which might warrant further investigation (sig threshold 55)
Missing final point for 78/0_K3 for % coverage is because a possible PMF mixture was picked up by the Mods search. One of the proteins in the mixture was the same as that picked up by the No mods search.

27
ASMS 2005
Summary
• ‘Raw’ search results are imported into RDB tables in a logical structure, organised by Project, Study and Experimental relationships– Extended reports
• Hit approval/persistent comments• Filtered reports
– Data mining• Flexible ad hoc query• Excel reporting
Some knowledge of SQL required to generate the custom reports and filters for the standard reports. However, these only need to be done once and can then be used as templates by any other user.

28
ASMS 2005
Acknowledgements
• Mark Weeks, John Sinclair, Richard Jacob– Ludwig Institute for Cancer Research, London UK