data mining systems to determine sales trends and quantity ... · international journal of...
TRANSCRIPT

International Journal of Engineering and Techniques - Volume 4 Issue 1, Jan – Feb 2018
ISSN: 2395-1303 http://www.ijetjournal.org Page 186
Data Mining Systems to Determine Sales Trends and Quantity
Forecast Using Association Rule and CRISP-DM Method Fifit Alfiah1, Bagus Wahyu Pandhito2, Ani Trio Sunarni3, Deni Muharam4, Pradiko
Roliwinsyah Matusin5
1,5(Teknik Informatika, STMIK Raharja, and Tangerang)
2,3,4 (Ilmu Komputer, Universitas Budi Luhur, and Jakarta)
I. INTRODUCTION
Data is something that has not been meaning, data
that has been processed into an information, and that
information that can be used. Knowledge in digging
data is necessary in generating information so that it
becomes something good that can be used for
various purposes.
Data mining describes the discovery of knowledge
in the database. The use of mathematical techniques,
data analysis, artificial intelligence, and machine
learning to produce related information from large
databases. Data mining deals with the discovery of
something hidden and certain data patterns that are
not previously known.
In the management of data mining, the data set
becomes a very important, coupled with the method
of data mining will produce knowledge. This
knowledge is in the form of patterns, formulas, rules,
models emerging from the data. So it can be said that
good knowledge will produce good information as
wellunderline.
At this time the research to determine the pattern
of sales trend and quantity forecast done at PT. Pinus
Merah Abadi which is a distributor of vegetable
products spread across the dots all over Indonesia,
turnover is an important part of a distributor
company because a good turnover will be good for
human resources as it will open a new point, so it will
certainly require a new workforce and promotion for
the able and responsible.
Customer is the most important part of the sale,
therefore need to be analyzed up to the level of
customer, the data taken is a record of purchase
transactions, The data must be considered include
the product mix purchased in each transaction and
RESEARCH ARTICLE OPEN ACCESS
Abstract: Customer is the most important part of the business, the data taken is a record of the purchase transactions
of products purchased in each transaction. With the existence of data mining expected hidden and unknown pattern
can be utilized in customer purchasing pattern. Then apriori algorithm as the basis of which there are methods of
association rules and CRISP-DM in this system can determine thats the most products of interest by customers by
applying data mining system on each transaction data. Result of data mining processing to determine sales trend
towards a sales product where with this sales trend management team can analyze by disclosing which product
sales follow steep growth path and which stall or decrease. An example of data mining to determine the sales trend
pattern based on a combination of 2 products. Where it has been determined is Threshold Support = 0.1 and
Threshold Support x Confidence = 0.05 and for the quantity forecast of 23 products into the sample and who
managed to enter into quantity forecast only 13 products. Where the successful product is determined quantity
forecast only that has a support value above the threshold support value that has been determined by the authors in
this paper. Result of the quantity forecast of the input specified such as Threshold Support: 0.2, Threshold
SupportxConfidence: 0.1 and Percent Forcast: 0.15.
Keywords — Data mining, sales trend, quantity forecast, support, confidence, apriori algorithm, CRIPS-
DM.
International Journal of Engineering and Techniques - Volume 4 Issue 1, Jan – Feb 2018
ISSN: 2395-1303 http://www.ijetjournal.org Page 187
the quantity or quantity of products purchased in
each transaction. With the existence of data mining
expected hidden and previously unknown pattern
can be utilized in customer purchasing pattern. Then
this research look for pattern of taking customer
goods based on transaction data to determine sales
trend and quantity forecasting in PT. Pinus Merah
Abadi based on the value of support and confidence.
II. RELATED WORK
An easy way to comply with the conference paper
formatting requirements is to use this document as a
template and simply type your text into it.
A. Data Mining
From a business perspective, data mining is to
achieve deeper analysis on a large number of
enterprise data according to the established
enterprise business goals, the aim is to discover the
unknown, hidden potential rules and convert them
into a corresponding model, thus supporting business
decision support activities.
Data mining (Han & Kamber in Rodiyansyah,
2015) is the process of extracting information from a
data set using algorithms and techniques that science,
engineering and databases. Data mining is used for
extraction. With the data mining, it will get a gem of
knowledge (knowledge) in a collection of data that
many.
Data mining or machine learning (Lu et al., 2017)
is a semi-empirical strategy that uses known data
about properties and descriptors (including
computational and experimental parameters) of
some materials to find semiempirical rules, and uses
this rule to predict and evaluate unknown properties
of material.
The following are the parts of the data mining that
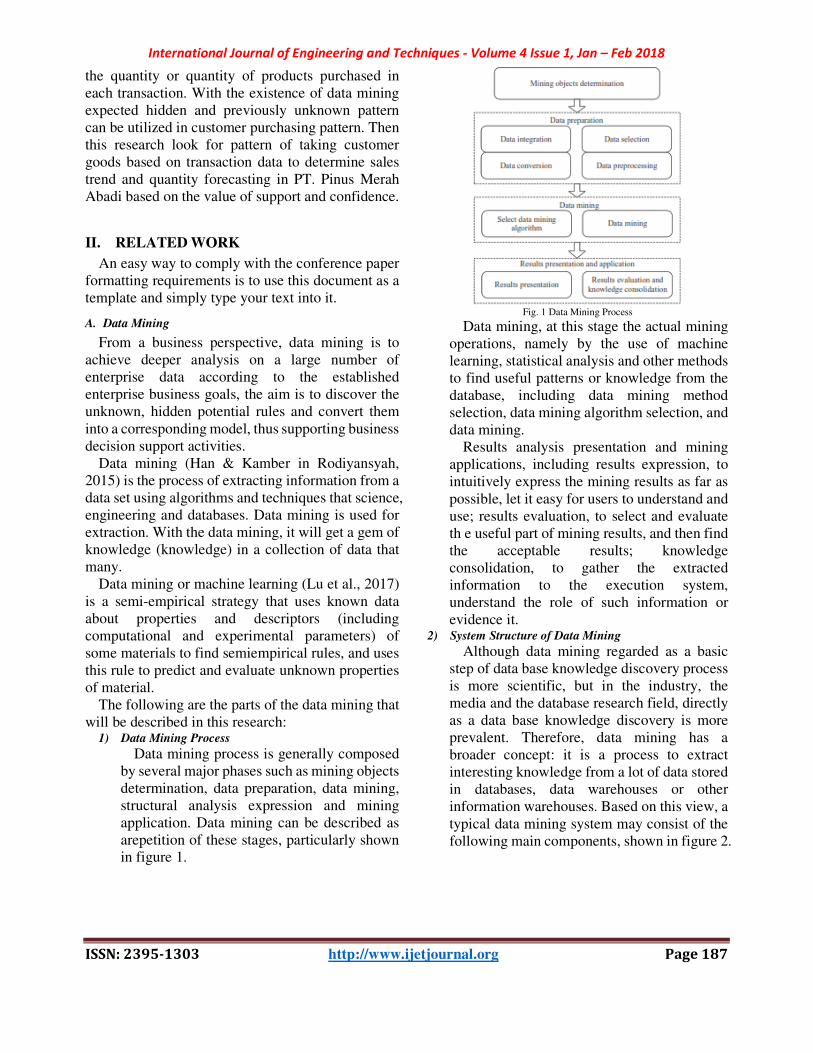
will be described in this research: 1) Data Mining Process
Data mining process is generally composed
by several major phases such as mining objects
determination, data preparation, data mining,
structural analysis expression and mining
application. Data mining can be described as
arepetition of these stages, particularly shown
in figure 1.
Fig. 1 Data Mining Process
Data mining, at this stage the actual mining
operations, namely by the use of machine
learning, statistical analysis and other methods
to find useful patterns or knowledge from the
database, including data mining method
selection, data mining algorithm selection, and
data mining.
Results analysis presentation and mining
applications, including results expression, to
intuitively express the mining results as far as
possible, let it easy for users to understand and
use; results evaluation, to select and evaluate
th e useful part of mining results, and then find
the acceptable results; knowledge
consolidation, to gather the extracted
information to the execution system,
understand the role of such information or
evidence it. 2) System Structure of Data Mining
Although data mining regarded as a basic
step of data base knowledge discovery process
is more scientific, but in the industry, the
media and the database research field, directly
as a data base knowledge discovery is more
prevalent. Therefore, data mining has a
broader concept: it is a process to extract
interesting knowledge from a lot of data stored
in databases, data warehouses or other
information warehouses. Based on this view, a
typical data mining system may consist of the
following main components, shown in figure 2.

International Journal of Engineering and Techniques - Volume 4 Issue 1, Jan – Feb 2018
ISSN: 2395-1303 http://www.ijetjournal.org Page 188
Fig. 2 System Structure of Data Mining
B. Definision of Association Rule
The most actively researched area among data
mining techniques involves discovering the
association rule that represents the association
among data.
Association rules regarding the study of "what's
with what". The rules or the prevailing market
analysis, the rules want to make the information in
the form of an "if-then" or "if-then" relationship.
This rule is calculated from probabilistic data.
Association rules will find a particular pattern that
associates one data with another. Frequent itemset is
a set of items that often appear simultaneously to
search the association rules of the data set, the first
stage to do is to find frequent itemset first. Once the
frequent itemset pattern is found, then look for
associative rules or link rules that meet the specified
requirements
C. Apriori Alghoritm
A priori algorithm or often called association rule
mining is a data mining technique for finding
association rules between a combination of items.
(Rodiyansyah, 2015) Let i = {i1, i2, i3, .. in} be a set
of items and D is the set of transaction databases that
each T transition is a set of items contained in a
transaction T. Each transaction is associated with an
identifier called TID. Rules that meet the minimum
support (min_sup) and minimum confidence
(min_conf) are called strong candidate rules. Under
the convention, the value of support and confidence
value is a value between 0% to 100% proportional to
0 to 1,0. In the Apriori algorithm determine the
candidate that may appear by paying attention to the
minimum support and minimum confidence.
Support is the value of the visitor or the percentage
of the combination of an item in the database. The
support formula is as follows:
�������� = NumberofTransactionsContainsA
TotalTransaction�100%
While confidence is the value of certainty is the
strength of the relationship between items in an
Apriori. Confidence can be searched after the
frequency pattern of the appearance of an item is
found. The formula for calculating confidence is as
follows: Example for example found rule A B
then: �!"#$%!&%P(B|A+
= NumberofTransactionsContainsAandB
-�.!/.&�#�! �!�.#!/��100%
Apriori algorithm has principles, among others:
a. Collect single items then search for the biggest
item.
b. Get the candidate pairs then count the large pairs
of each item.
c. Find candidate triplets from each item and so on.
d. Every subset of a frequent itemset should be
frequent.
D. CRISP-DM
CRISP-DM (Cross Industry Standard Process for
Data Mining) is a consortium of companies
established by the European Commission in 1996
and has been established as a standard process in data
mining that can be applied in various industry sectors.
The following are the six stages of the life cycle
of data mining development:
Fig. 3 CRISP-DM Data Mining Process
III. METHODOLOGY
International Journal of Engineering and Techniques - Volume 4 Issue 1, Jan – Feb 2018
ISSN: 2395-1303 http://www.ijetjournal.org Page 189
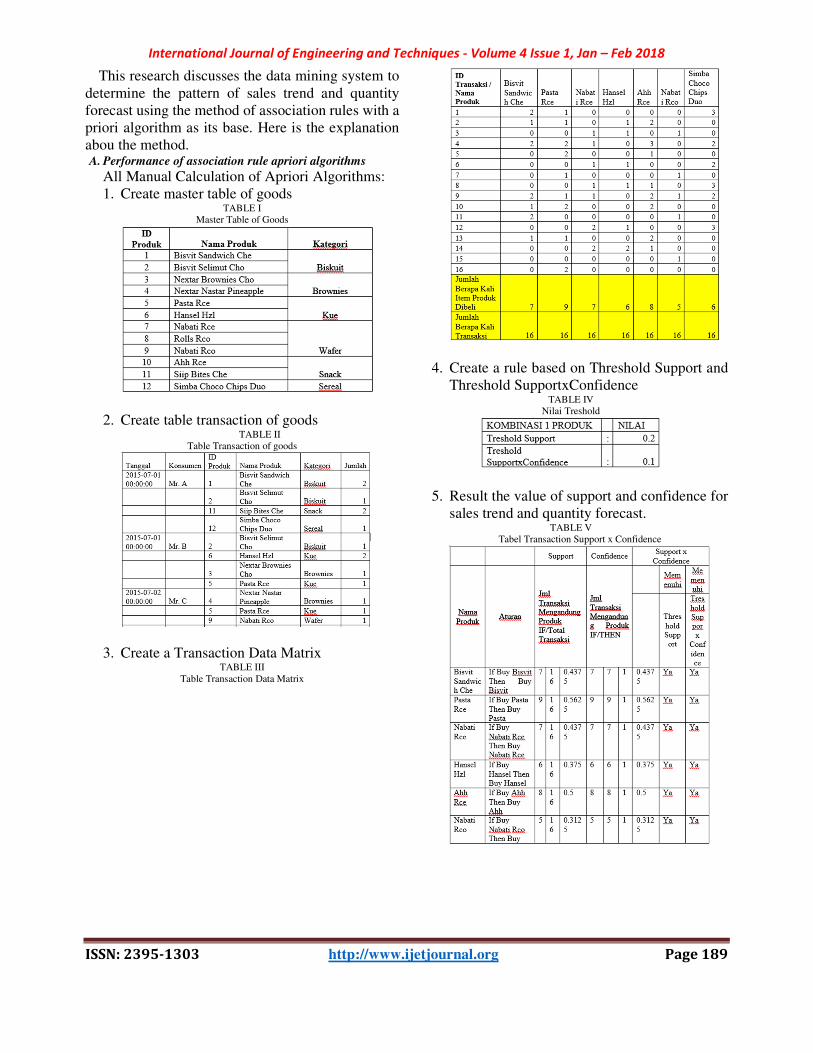
This research discusses the data mining system to
determine the pattern of sales trend and quantity
forecast using the method of association rules with a
priori algorithm as its base. Here is the explanation
abou the method. A. Performance of association rule apriori algorithms
All Manual Calculation of Apriori Algorithms:
1. Create master table of goods TABLE I
Master Table of Goods
2. Create table transaction of goods TABLE II
Table Transaction of goods
3. Create a Transaction Data Matrix TABLE III
Table Transaction Data Matrix
4. Create a rule based on Threshold Support and
Threshold SupportxConfidence TABLE IV
Nilai Treshold
5. Result the value of support and confidence for
sales trend and quantity forecast. TABLE V
Tabel Transaction Support x Confidence
International Journal of Engineering and Techniques - Volume 4 Issue 1, Jan – Feb 2018
ISSN: 2395-1303 http://www.ijetjournal.org Page 190
B. Stratified Random Sampling
Sampling in this research with probability
sampling technique that is proportionate
stratified random sampling by using slovin
formula. Probability sampling is a sampling
technique that provides equal opportunity for
each element (member) of the population to
be selected as a sample member.
The amount of sample in this study is
determined by the Slovin formula as follows:
! = 0
12034
Definition:
n = Number of samples
N = Population
e = error level (note: commonly used 1% or
0.01, 5% or 0.05 and 10% or 0.1).
The population in this research is 54
product and precision is determined or 5%
significance level, so the sample size in this
research are:
! = 56
125676.14= 23, 0169 dibulatkan
menjadi 23.
So, the total number of products that will
become sales trend and quantity forecast in
this research is 23 product.
IV. RESULT AND DISCUSSION
1. SALES TREND
Sales trends in this study become a
methodology for understanding sales results that
help in understanding market trends over a period
of time. Sales results are indicators of sales
patterns followed by the customer over a certain
period of time. Timed can be short, average or
long. Sales trends can be analyzed by compiling
sales and employment over a period of time to the
financial statements.
The following is a data mining experiment in
determining sales trend towards a sales product
where with this sales trend management team can
analyze by disclosing which product sales follow
steep growth path and which stall or decrease. An
example of data mining to determine the sales
trend pattern based on a combination of 2
products.
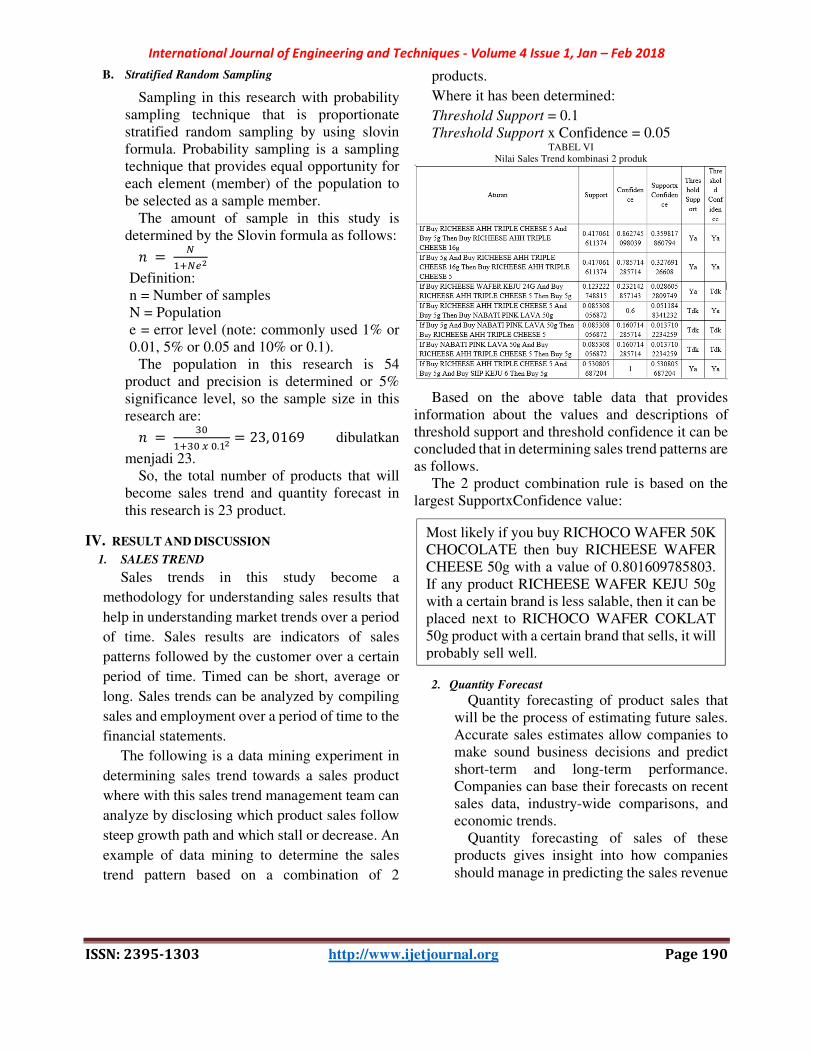
Where it has been determined:
Threshold Support = 0.1
Threshold Support x Confidence = 0.05 TABEL VI
Nilai Sales Trend kombinasi 2 produk
Based on the above table data that provides
information about the values and descriptions of
threshold support and threshold confidence it can be
concluded that in determining sales trend patterns are
as follows.
The 2 product combination rule is based on the
largest SupportxConfidence value:
2. Quantity Forecast
Quantity forecasting of product sales that
will be the process of estimating future sales.
Accurate sales estimates allow companies to
make sound business decisions and predict
short-term and long-term performance.
Companies can base their forecasts on recent
sales data, industry-wide comparisons, and
economic trends.
Quantity forecasting of sales of these
products gives insight into how companies
should manage in predicting the sales revenue
Most likely if you buy RICHOCO WAFER 50K
CHOCOLATE then buy RICHEESE WAFER
CHEESE 50g with a value of 0.801609785803.
If any product RICHEESE WAFER KEJU 50g
with a certain brand is less salable, then it can be
placed next to RICHOCO WAFER COKLAT
50g product with a certain brand that sells, it will
probably sell well.

International Journal of Engineering and Techniques - Volume 4 Issue 1, Jan – Feb 2018
ISSN: 2395-1303 http://www.ijetjournal.org Page 191
that can be achieved, efficiently allocate
resources, planing future sales product growth.
The following is the result of data mining
processing to determine the quantity forecast
of 23 products into the sample and who
managed to enter into quantity forecast only
13 products. Where the successful product is
determined quantity forecast only that has a
support value above the threshold support
value that has been determined by the authors
in this paper.
The table below is the result of the quantity
forecast of the input specified by the author as
follows:
Threshold Support: 0.2
Threshold SupportxConfidence: 0.1
Percent Forcast: 0.15
Then the value of quantity forecast
generated is 15% of the amount of quantity
that has been predetermined by the
management team before the calculation
process begins. TABEL VII
Value of Quantity Forecast
Based on the data above table then to clarify the
value of quantity forecast the authors will describe it
in the form of chart diagram, as follows:
Fig. 4 Grafik Quanity Forecast
Data mining system has been able to determine the
Quantity Forecast for each product to be sampled in
this study with the evidence of tables and graphs
generated by the system.
V. CONCLUSIONS
In this paper conducted by this author has been
able to produce the pattern of selling the most
products of interest by customers by applying data
mining system on each transaction data. By using a
priori Algorithm as the basis of which there are
methods of association rules and CRISP-DM in this
system can determine the value of support and
confidence of the implementation of data mining
based on the rules of the combination of products as
input value. Because of the value of support and
confidence obtained from association rules in data
mining has been able to assist the management team
in determining sales trend and quantity forecasting
based on transaction data from each product sold to
customers.
ACKNOWLEDGMENT
We would like to thank all academic staff in our
university for supporting us in each research projects
because this research we present for graduation
requirements.
0
50
100
150
200
250
300
350
Support Confidence Qty Forecast
Qty
Quantity Forecast
Richoco Wafer Coklat 50g Richeese Wafer Keju 50g
Richoco Nabati White Nextar Choco Brownies
Richeese Wafer Keju 8g Hansel HZL
Nabati Richoco Combo Richeese Ahh 5g
Richeese Ahh 16g Nextar Nastar
Bisvit Selimut Keju Bisvit Selimut Cklt
Richoco Wafer Coklat 19g
International Journal of Engineering and Techniques - Volume 4 Issue 1, Jan – Feb 2018
ISSN: 2395-1303 http://www.ijetjournal.org Page 192
REFERENCES
1. Song Changxin, Research ofAssociation Rule Algorithm
based on Data Mining, Big Data Analysis (ICBDA), 2016
IEEE International Conference on, 12-14 March 2016.
2. HAN J, PEI J, YIN Y. Mining Frequent Patterns without
Candidate Generation[C], Proc of the 2000 ACM SIGMOD
Internal Conferenceon Management of Data. Dallas, Texas:
ACM Press, 2000: 1-12.
3. Lu, W. et al, Data mining-aided materials discovery and
optimization, Journal of Materiomics. Elsevier Taiwan LLC,
3(3), pp. 191–201, 2017.
4. Rodiyansyah, S. F., Algoritma Apriori untuk Analisis
Keranjang Belanja pada Data Transaksi Penjualan,
Infotech, 1(1), pp. 36–39, 2015.
5. Yun Hyunyoon, Ha Danshim, Hwang Buhyun, Ryu Keun
Ho., Mining association rules on significant rare data using
relative support, The Journal of Systems and Software 67
(2003) 181–191.
6. Al-Maolegi Mohammed and Arkok Bassam, An Improved
Apriori Algorithm For Association Rules, International
Journal on Natural Language Computing (IJNLC) Vol. 3,
No.1, February 2014.
7. Lin Wu, Jin Yao Yan and Yuan Jing Fan, Data Mining
Algorithms and Statistical Analysis for Sales Data Forecast,
Computational Sciences and Optimization (CSO), 2012
Fifth International Joint Conference on june 2012.
8. Neda Khalil Zadeh, Mohammad Mehdi Sepehri and Hamid
Farvaresh, Intelligent Sales Prediction for Pharmaceutical
Distribution Companies: A Data Mining Based Approach,
Mathematical Problems in Engineering Volume 2014,
Article ID 420310, 15 pages.
9. Ankur Jain, Manghat Nitish Menon and Saurabh Chandra,
Sales Forecasting for Retail Chains, india, 2015.