data mining - poznań university of technology · course mission • data mining? • extraction of...
TRANSCRIPT

Data MiningAnaliza i eksploracja danych
Lecturer: JERZY STEFANOWSKIInstitute of Computing Science
Poznań University of TechnologyPoznań, Poland
Software Engineering – Master CourseComputer Science, PUT, 2008

Course mission• Data mining?
• Extraction of useful information patterns from data.
• Huge or complex data challenge (DB community).• Trend to data warehouses but also flat table files.
• More than typical data analysis, machine learningor classical decision support!
• Still „young” field, although quite „fashionable”.
• Teaching materials and course book …

Course mission - 2• Thus, our aims:
• To give you insight in this field, typical methods, examples of applications.
• Rather focus on algorithms and methodologyaspects, not so much on dealing with massive data.
• Choice of methods.
• Case study and applications.
• Comments to available software (WEKA, etc.)
• Data Sets – UCI Repository and others

Course information• The planned schedule of lectures (15 weeks):
• Introduction
• Data Preprocessing
• Prediction models (multivariate regression and ANN)
• Classification (evaluation)• Symbolic methods (Decision Trees and Rules)• Other on-symbolic methods
• Association rules and sequence patterns
• Clustering
• Mining complex data
• KDD Process and summary

Background literature• Han Jiawei and Kamber M. Data mining: Concepts and
techniques, Morgan Kaufmann, 2001 (1 ed.), there is 2d• Hand D., Mannila H., Smyth P. Principles of Data Mining,
MIT Press, 2001.• Kononenko I., Kukar M., Machine Learning and Data
Mining: Introduction to Priniciples and Algorithms. Horwood Pub, 2007.
• Maimon O., Rokach L., The data mining and knowledgediscovery Handbook, Springer 2005.
• Witten I., Eibe Frank, Data Mining, Practical Machine Learning Tools and Techniques with Java Implementations, Morgan Kaufmann, 1999.
• Bramer M., Principles of Data Mining, Springer 2007.• Weiss S., Indurkhya N., Predictive data mining, Morgan
Kaufmann, 1998.

Background literature [Polish translations]• Larose D., Odkrywanie wiedzy z danych. Wprowadzanie do
eskploracji danych, PWN, 2006.• Larose D., Metody i modele eksploracji danych, PWN 2008.• Hand D., Mannila H., Smyth P. Eksploracja danych, WNT,
2005.Polskie książki• Dobry podręcznik jeszcze nie istnieje …• Koronacki J., Ćwik J., Statystyczne systemy uczące się,
WNT 2005 (kolejne wydanie w drodze).• Krawiec K, Stefanowski J., Uczenie maszynowe i sieci
neuronowe, Wyd. PP, 2003.• Cichosz P., Systemy uczące się. WNT, 2000.• Lasek M., Data mining: Zastosowanie w ocenach i analizach
klientów bankowych. Biblioteka Menadżera, 2003.

Background literature

Acknowledgements:• Many of the slides are based on my earlier courses:
• Data mining and advanced data analysis; Knowledgediscovery (PUT CS; M.Sc. Course) more athttp://www.cs.put.poznan.pl/jstefanowski
• Some slides are based on ideas „borrowed” from:
• WEKA teaching materials (Witten & Frank WaikatoUniversity; Morgan Kaufmann)
• Gregory Piatetsky – Shapiro: Data mining course.
• Jiawei Han: Knowledge discovery in databases.
• T.Mitchell and P.Flach courses on ML (see their WWW).
• Other course books – see the previous slides

Lecture 1 a.
Data Mining:Introduction

L1. Introduction to Data Mining: Outline
• Motivation: Why data mining?
• What is data mining?
• Data Mining: On what kind of data and what kind
of knowledge representation?
• Basic tasks and methods.
• Examples of applications.
• WEKA and Statistica – software frameworks for
this course.

Data mining: what is it?
• Data mining is
• Extraction of useful patterns from data sources, e.g., databases, texts, web, images.
• Patterns (knowledge representation) must be:
• Valid, novel, potentially useful, understandable to the users.
A
E1
BE2
E1
If A and B then E2If not A then E1
2x1+3x2-4 > 0Data

What is data mining? More …• Data mining is the analysis of data for relationships that
have not previously been discovered or known.• A term coined for a new discipline lying at the interface
of database technology, machine learning, pattern recognition, statistics and visualization.
• The key element in much more elaborate process called „Knowledge Discovery in Databases”.
• The efficient extraction of previously unknown patterns in very large data bases.
• Data mining is the analysis of (often large) observational data sets to find unsuspected relationships and to summarize the data in novel ways that are both understandable and useful to the data owner (Hand, Mannila, Smyth).

Motivations - data explosion problem
• Automated data collection tools and mature database technology lead to tremendous amounts of data stored in databases, data warehouses and other information repositories.
• More data is generated:• Bank, telecom, other business transactions ...
• Scientific data: astronomy, biology, etc
• Web, text, and e-commerce
• Very little data will ever be looked at by a human!
• We are drowning in data, but starving for knowledge!
• Knowledge Discovery is NEEDED to make sense and use of data.

Big Data Examples
• Europe's Very Long Baseline Interferometry (VLBI) has 16 telescopes, each of which produces 1 Gigabit/second of astronomical data over a 25-day observation session
• storage and analysis a big problem
• AT&T handles billions of calls per day
• so much data, it cannot be all stored -- analysis has to be done “on the fly”, on streaming data

Largest databases in 2003• Commercial databases:
• Winter Corp. 2003 Survey: France Telecom has largest decision-support DB, ~30TB; AT&T ~ 26 TB
• Web• Alexa internet archive: 7 years of data, 500 TB
• Google searches 4+ Billion pages, many hundreds TB
• IBM WebFountain, 160 TB (2003)
• Internet Archive (www.archive.org),~ 300 TB
• UC Berkeley 2003 estimate: 5 exabytes (5 million terabytes) of new data was created in 2002.
www.sims.berkeley.edu/research/projects/how-much-info-2003/
• US produces ~40% of new stored data worldwide

We are Data Rich but Information Poor
Databases are too big
Data Mining can help discover knowledgenuggets
„Terrorbytes”

Knowledge Discovery Definition
• Knowledge Discovery in Data is the
non-trivial process of identifying
• valid
• novel
• potentially useful
• and ultimately understandable patterns in data.from Advances in Knowledge Discovery and Data Mining,
Fayyad, Piatetsky-Shapiro, Smyth, and Uthurusamy, (Chapter 1), AAAI/MIT Press 1996.
The name first used by AI, Machine Learning Community in 1989 Workshop at AAAI Conference.

Data Mining as a step in A KDD Process
• Data mining: the core step of knowledge discovery process.
Data Cleaning
Data Integration
Databases
Data Warehouse
Task-relevant Data
Selection
Data Mining
Pattern Evaluation

Steps of a KDD Process• Learning the application domain:
• relevant prior knowledge and goals of application• Creating a target data set: data selection• Data cleaning and preprocessing: (may take 60% of effort!)• Data reduction and projection:
• Find useful features, dimensionality/variable reduction, invariant representation.
• Choosing a task of a data mining step
• summarization, classification, regression, association, clustering.• Choosing proper mining algorithm(s)• Data mining: searching for patterns of interest• Interpretation: analysis of results.
• visualization, transformation, removing redundant patterns, etc.• Use of discovered knowledge

SKICAT – an example of KDD process• Sky Image Cataloging and Analysis Tool (SKICAT)• Developed by NASA's Jet Propulsion Laboratory and the California Institute of
Technology in the 90’s (Fayyad, Djorgowski, Weir et al.) . • Aim: a software system to catalog and analyze the estimated half billion sky
objects in the second Palomar Observatory sky survey• Task 1 – general classes (galaxis, stars, quasars, etc.)• Task 2 – find some interesting clusters of objects (quasars with redshift..)
• The survey of the northern sky includes more than 3,000 digitized photographic plates produced by Palomar, located in San Diego.• Over 3 terrabytes of images 13000×13000 pixels
• The SKICAT system will produce a comprehensive survey catalog database containing about one-half billion entries by automatically processing about three terabytes (24 trillion bits, 8-bits to a byte) of image data.
• SKICAT is based on state-of-the-art machine learning, high performance database and image processing techniques.
• SKICAT has a correct sky object classification rate of about 94 percent, which exceeds the performance requirement of 90 percentneeded for accurate scientific analysis of the data.

SKICAT – KDD steps• Dostępne dane i wiedza początkowa: kilkadziesiąt tysięcy fotografii o
różnych rozdzielczości ręcznie skatalogowanych przez ekspertów.• Wybór docelowych danych – identyfikacja właściwych atrybutów
charakteryzujących poszczególne klasy- konieczność uwzględnienia dodatkowej wiedzy astronomicznej andimage analysis FOCAS.
• Krok czyszczenia – identyfikacja różnych obserwacji odstających i błędów w danych.
• Krok redukcji – wybór tylko części z dostępnych danych.• Wybór zadania i algorytmu: klasyfikowanie – drzewa decyzyjne
(modyfikacja C4.5, ale także alternatywne klasyfikatory).• Ocena rezultatów (trafność klasyfikacji – tutaj ponad 94%).• Zastosowanie – wspomaganie tworzenia elektronicznego katalogu
gwiazd i galaktyk wraz z ich opisami.

Related Fields
Statistics
MachineLearning
Databases
Visualization
Data Mining and Knowledge Discovery

Related fields• Statistics – model driven approach based on a strong
mathematical background; model-hypothesis testing orestimation methods.
• Modern statistical learning.
• Machine learning – improving performance of intelligent systems; knowing concepts to be learned; stronglyrelated to AI paradigms.
• Databases systems – efficient data management and extractions; data warehouses.
• Knowledge based system – representation and AI methods.

Data mining and related disciplines
What is not data mining?
• Another statistical approach shifted into a new context!
• It is not only machine learning!
• Moreover, it is not
• (Database) query processing,
• Expert systems software.

Data Mining: On What Kind of Data?
• Attribute-value tables (standard form / data table)
• Multi-relational data / first order predicate calculus
• Structured data (graphs, workflows, ontologies, …)
• Sequence data bases
• Other more complex data repositories
• Object-oriented and object-relational databases
• Spatial databases
• Time-series data and temporal data
• Text databases and multimedia databases
• WWW resources
• …

What can be discovered?• Symbolic knowledge representations
• Decision trees• Rules• Relations / Logic forms (ILP)• Attribute generalizations• Probability distributions• Conceptual clusters and taxonomies
• Sub-symbolic• Artificial neural networks• Instance based learners• Functions / equations
• Others, …

Decision trees
Age Car Type Risk20 Combi High18 Sports High40 Sports High50 Family Low35 Minivan Low30 Combi High32 Family Low40 Combi Low
Age < 31
High
Car Type is sports
High Low
• Typical approach to the classification task.

Decision rules
Age Car Type Risk20 Combi High18 Sports High40 Sports High50 Family Low35 Minivan Low30 Combi High32 Family Low40 Combi Low
trainingdata
Classification /Learningalgorithm
if age < 31or Car Type =Sportsthen Risk = High

Rules with variables - ILP• Using variables and multiple relations:
• The top of a tower of blocks is standing:
• The whole tower is standing:
If height_and_width_of(x,h,w) and h > wthen standing(x)
If height_and_width_of(z,h,w) and h > wand is_top_of(x,z) and standing(y)and is_rest_of(x,y)
then standing(x)
If empty(x) then standing(x)
If height_and_width_of(x,h,w) and h > wand is_top_of(x,y)
then standing(x)

• Example: 209 different computer configurations
• Linear regression function
Numeric prediction – regression function
0
0
32
128
CHMAX
0
0
8
16
CHMIN
Channels PerformanceCache (Kb)
Main memory (Kb)
Cycle time (ns)
45040001000480209
67328000512480208
…
26932320008000292
19825660002561251
PRPCACHMMAXMMINMYCT
PRP = -55.9 + 0.0489 MYCT + 0.0153 MMIN + 0.0056 MMAX+ 0.6410 CACH - 0.2700 CHMIN + 1.480 CHMAX

Association rules
• Transaction data• Market basket analysis
• {Cheese, Milk} → Bread [sup=5%, conf=80%]• Association rule:
„80% of customers who buy cheese and milk also buy breadand 5% of customers buy all these products together”
TID Produce 1 MILK, BREAD, EGGS 2 BREAD, SUGAR 3 BREAD, CEREAL 4 MILK, BREAD, SUGAR 5 MILK, CEREAL 6 BREAD, CEREAL 7 MILK, CEREAL 8 MILK, BREAD, CEREAL, EGGS9 MILK, BREAD, CEREAL

Sequential Patterns
• Sequential pattern mining is the extracting of frequently occurring patterns related to time or other sequences.
• A sequential rule: A → B → C, says that event A will be followed by event B and this by event C with a certain confidence
• An example:
“A customer who bought a TV three months ago is likely to order a new DVD player within one month”

Cluster• A group of examples similar in the sense of some
distance measure.• Unsupervised data

• Single Neuron Model• Linear Threshold Unit (LTU)
inputs to unit: defined as linear combination• Output of unit: threshold (activation)
function on net input (threshold θ = w0)• Neural Networks
• Neuron is modeled using a unit connected by weighted links wi to other units
• Multi-Layer Perceptron (MLP): future lecture
Non –symbolic? Neural networks
x1
x2
xn
w1
w2
wn
Σ
x0 = 1w0
∑=
n
0iii xw
( )⎪⎪⎩
⎪⎪⎨
⎧>
=∑=
otherwise 1-
0 if 1 i
n
0ii
n21
xwxxxo ,, K
( ) ( )⎪⎩
⎪⎨⎧ >⋅
==otherwise 1-
0 if 1:notation Vector
xww ,xsgnxo
rrrrr
x1 x2 x3Input Layeru 11
h1 h2 h3 h4Hidden Layer
o1 o2 v42
Output Layer
Major Data Mining Tasks• Classification: predicting an instance class on the basis
of its description.• Prediction: predicting a continuous value.• Clustering: finding similarity groups in data.• Associations: e.g. A & B & C occur frequently.
• Sequence analysis
• Summarization: describing a group.
• Visualization: graphical methods to show patterns in data.
• Deviation or Anomaly Detection: finding important changes or anomalies
• …

Supervised classification• Discover a method / function that maps a data element /
instance into one of predefined classes• Learning how to predict the instance class from pre-
labeled (classified) examples - classifiers
Many approaches:• Discriminant Analysis, • Decision Trees or Rules,• Bayesian Approaches,• SVM...
Given a set of points from classes what is the class of new point ?

Numeric prediction• Supervised task, but “output” is numeric,
• Scheme is being provided with target value
• Evaluation - good statistical background.
……………
40FalseNormalMildRainy
55FalseHighHot Overcast
0TrueHigh Hot Sunny
5FalseHighHotSunny
Play-timeWindyHumidityTemp.Outlook

Time series – prediction of time stamped variable
• Predictive data mining – time stamped variable; typical example – stocks, financial data, production planning.

Clustering
Find “natural” grouping of un-labeled examples – similar in some well defined sense.

Clustering• Examples: customer grouping
• Finding groups of items that are similar
• Clustering is unsupervised
• The class of an example is not known
• Success often measured subjectively
…
…
…
Iris virginica1.95.12.75.8102
101
52
51
2
1
Iris virginica2.56.03.36.3
Iris versicolor1.54.53.26.4
Iris versicolor1.44.73.27.0
Iris setosa0.21.43.04.9
Iris setosa0.21.43.55.1
TypePetal widthPetal lengthSepal widthSepal length

Descriptive clustering – text mining• Discovering diverse groups of semantically related
documents described with meaningful, comprehensible and compact text labels → LINGO available in Carrot2 project.

Another problem: Link Analysis
Can we find patterns in the network/ graph structure or Can we identify communities of Web users?

Goals of Data Mining – S.Weiss and U.Fayyad views
• Two primary goals of data mining• Prediction : using some variables or fields in database to predict
unknown of future value of other variables.• strongest and practical goal of data mining and other fields as pattern
recognition, machine or statistical learning• Knowledge description : finding human-interpretable patterns
describing data • Becoming more and more important for KDD
• Technical methods for solving these problems often overlap.
Prediction Description
ClassificationRegressionTime series
Deviation DetectionClustering
Association RulesSummarizationVisualizationText mining

Components of Data Mining Algorithms• Model or pattern structure → Knowledge representation;
language determining the underlining structure forms that we seek from the data.
• Score function → estimates how well a particular patterns (or a model with its parameters) meet the criteria of KDD process.
• Optimization of parameters and search method:
• Searching for the parameters which optimize the score function (quality of the model) → optimal estimation vs. heuristic or greedy iterative ..
• Searching over different model or pattern spaces
• Data management strategy → handling data access efficiently during search/optimization
More in Hand et al. book.

Why Data Mining? -- Potential Applications• Database analysis and decision support
• Market and customer analysis; analytical CRM• target marketing and advertising, customer relation
management, market basket analysis, cross selling, market segmentation.
• Risk analysis and management• Forecasting, customer changes, quality control, loan
approval.• Diagnostics (e.g. technical conditions of objects)• Fraud detection
• Other Applications:• Text mining (news group, email, documents) and Web
analysis; Search engines; Adaptive Web servers and e-commerce systems

Customer Changes: Case Study
• Situation: Attrition rate at for mobile phone customers is around 25-30% a year (US)!
Task:
• Given customer information for the past N months, predict who is likely to attrite next month.
• Also, estimate customer value and what is the cost-effective offer to be made to this customer.

Customer Attrition Results
• Verizon Wireless (US) built a customer data warehouse
• Identified potential attriters• Developed multiple, regional models• Targeted customers with high propensity
to accept the offer• Reduced attrition rate from over 2%/month
to under 1.5%/month (huge impact, with >30 M subscribers)
(Reported in 2003)

Biology: Molecular Diagnostics
• Leukemia: Acute Lymphoblastic (ALL) vs Acute Myeloid (AML)• 72 samples, about 7,000 genes
ALL AML
Results: 33 correct (97% accuracy),1 error (sample suspected mislabelled)
Outcome predictions?

Problems Suitable for Data-Mining
• Require knowledge-based decisions.• Have a changing environment.• Have accessible, sufficient, and relevant data• Data are difficult or complex.• Problems are not trivial, cannot be solved
„manually” by humans.• Provides high payoff for the right decisions!
Privacy considerations important if personal data is involved!

Warnings!• Historically data mining was used in a pejorative sense by
statisticians for the idea that, if you search long enough, you can always find some model to fit your data arbitrarily well.
Example:
• David Rhine, a ”parapsychologist” at Duke in the 1950’s tested students for ”extrasensory perception”, by asking them to guess 10 cards—red or black. He found about 1/1000 of them guessed all 10, and instead of realizing that that is what you would expect from random guessing, declared them to have ESP. When he retested them, he found they did no better than average. His conclusion: telling people they have ESP causes them to lose it! Quote from Jeffrey Ullman, Stanford
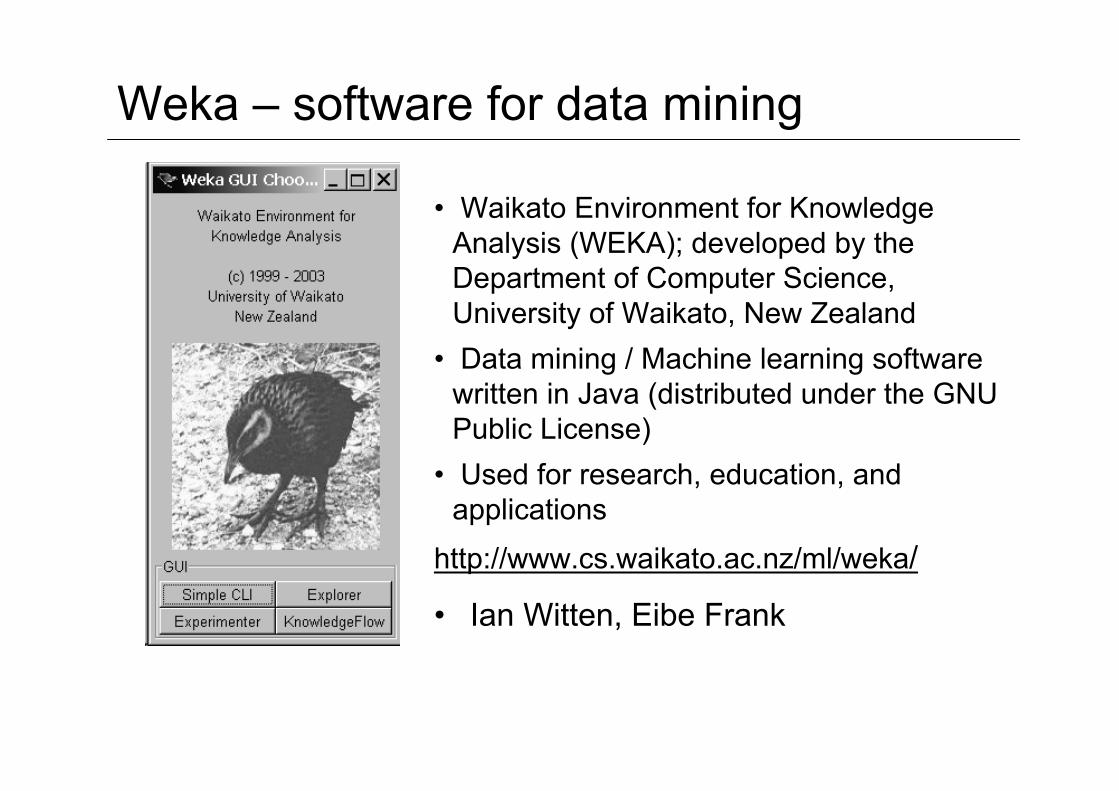
Weka – software for data mining
• Waikato Environment for Knowledge Analysis (WEKA); developed by the Department of Computer Science, University of Waikato, New Zealand
• Data mining / Machine learning software written in Java (distributed under the GNU Public License)
• Used for research, education, and applications
http://www.cs.waikato.ac.nz/ml/weka/
• Ian Witten, Eibe Frank

WEKA - Tools
• Pre-processing Filters
• Attribute selection
• Classification/Regression
• Clustering
• Association discovery
• Visualization

Examples of Systems for Data Mining
• IBM: QUEST and Intelligent Miner
• Silicon Graphics: MineSet
• SAS Institute: Enterprise Miner
• SPSS / Integral Solutions Ltd.: Clementine
• Oracle Miner
• Rapid Miner (YALE)
• Orange
• Other systems
• Information Discovery Inc.: Data Mining Suite
• SFU: DBMiner, GeoMiner, MultiMediaMiner

RapidMiner (YALE)
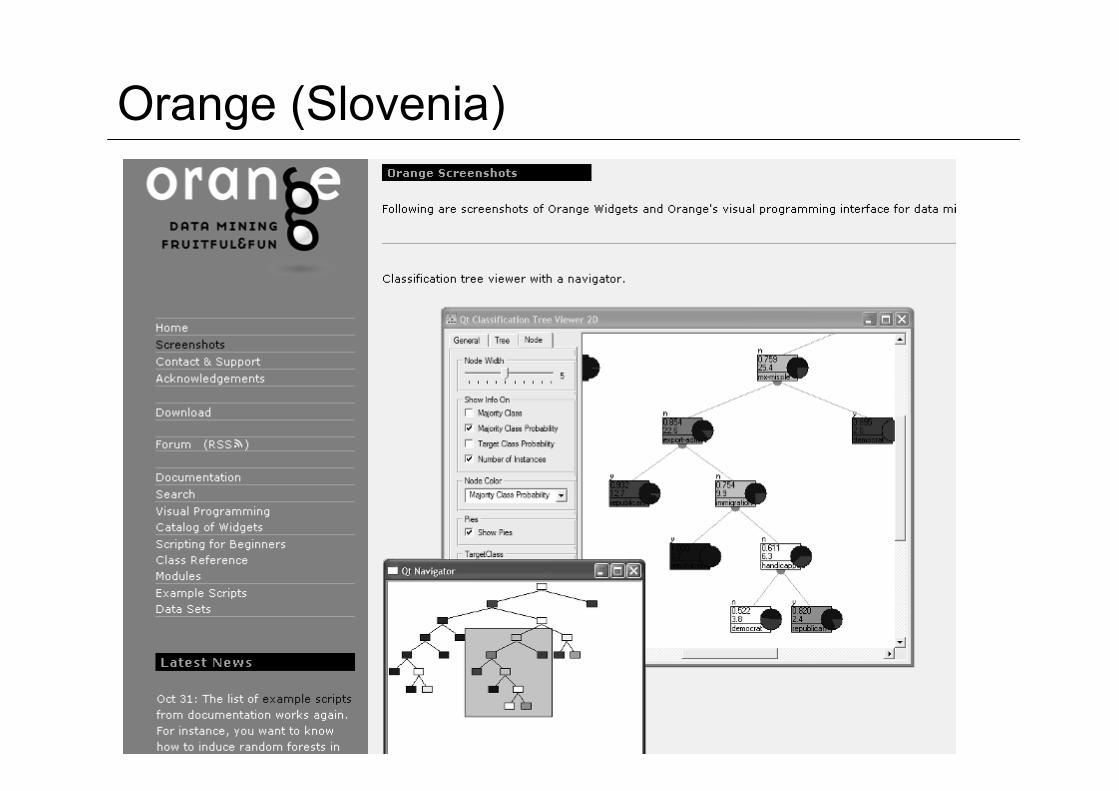
Orange (Slovenia)

Statsoft – Statistica Data Miner

Data mining: what is on the market?
• Consultancy
• There are some people which offer data mining consulting.
• SoftwareSAS, Statistica, Oracle, SGI Miner, IBM intelligent miner, …

www.KDnuggets.com - various references

Summary:• Technology trends lead to data flood
• data mining is needed to make sense of data
• Data Mining has many applications, successful and not
• Knowledge Discovery Process
• Data Mining Tasks
• classification, prediction, clustering,associations, …

Short Break

Lecture 1b.
Few remarks on the nature of data to be mined

Data Mining: On What Kind of Data?
• Flat files → Attribute-value data tables
• Relational databases and data warehouses → relations.
• Multi-relational data / first order predicate calculus
• Structured data (graphs, workflows, ontologies, …)
• Sequence data bases
• Other advanced data repositories
• Object-oriented and object-relational databases
• Spatial databases
• Time-series data and temporal data
• Text databases and multimedia databases
• WWW resources
• …

Flat files• Actually the most common data source for data mining,
especially at the research level.
• Simple data files in text or binary format with a structure known by the data mining algorithm to be applied.
• The data in these files can be transactions, time-series data, scientific measurements, etc.
• Big data – efficiency of access and management.
Vn,k+1V n,k…V n,1xn
……………
Vi,k+1V i,k…V i,1x i
……………
V1,k+1V 1,k…V 1,1x1
Yf k…f 1Instance

Typical Input → data tables concepts-classes, instances, attributes
• A data table is a set of measurements taken from some environment of process (n × k table)
• In general, the input takes the form of: concepts-classes, instances, attributes.
• Target concepts (classes): kinds of things that can be discovered
• Aim: intelligible and operational concept description.
• Instances: the individual, independent examples of a concept• „Objects” of the same type.• Note: more complicated forms of input are possible.
• Attributes: (features) measuring aspects of an instance• Could be defined on various measurement scales – however
we will focus mainly on nominal and numeric ones.• In statistics → variables.

Again how to get a data table?
• Instance: specific type of example• Thing to be classified, associated, or clustered• Individual, independent example of target concept• Characterized by a predetermined set of attributes
• Input to learning scheme: set of instances / data table• Represented as a single relation/flat file
• Rather restricted form of input • No relationships between objects
• Most common form in practical data mining• Process of flattening a file “denormalization”
• Several relations are joined together to make one• Possible with any finite set of finite relations

The weather problem (Quinaln’s play sport)
notrue9171rainyyesfalse7581overcastyestrue9072overcastyestrue7075sunnyyesfalse8075rainyyesfalse7069sunnynofalse9572sunnyyestrue6564overcastnotrue7065rainyyesfalse8068rainyyesfalse9670rainyyesfalse8683overcastnotrue9080sunnynofalse8585sunnyPlayWindyHumidityTemperatureOutlook
Given past data,Can you come upwith the rules for Play/Not Play ?
Classics in ML

Types of attributes
• The most common distinction comes from measurement scale and statistics:• Nominal (also binary)
• Ordinal
• Interval-scaled
• Ratio-scaled.
• Other names:• Categorical vs. numeric/continuous ones.
• Other types: • Criteria (preference-ordered), hierarchical, …

Transforming text documents into a standard form
• Transformation into Vector Representation
D1: Large Scale Singular Value ComputationsD2: Software for the Sparse Singular Value DecompositionD3: Introduction to Modern Information RetrievalD4: Linear Algebra for Intelligent Information RetrievalD5: Matrix ComputationsD6: Singular Value Analysis of CryptogramsD7: Automatic Information Organization
The d=7 documents:
The t=5 terms:T1: InformationT2: SingularT3: ValueT4: ComputationsT5: Retrieval
⎟⎟⎟⎟⎟⎟
⎠
⎞
⎜⎜⎜⎜⎜⎜
⎝
⎛
=
0.000.000.000.710.710.000.000.000.001.000.000.000.000.580.000.710.000.000.000.710.580.000.710.000.000.000.710.581.000.000.000.710.710.000.00
AΘ
dj
q

WEKA - the ARFF format%% ARFF file for weather data with some numeric features%@relation weather
@attribute outlook {sunny, overcast, rainy}@attribute temperature numeric@attribute humidity numeric@attribute windy {true, false}@attribute play? {yes, no}
@datasunny, 85, 85, false, nosunny, 80, 90, true, noovercast, 83, 86, false, yes...

Attribute types in WEKA
• ARFF supports numeric and nominal attributes.
• Interpretation depends on learning scheme:
• Numeric attributes are interpreted as• interval scales if less-than and greater-than are used,• ratio scales if distance calculations are performed
(normalization/standardization may be required).
• Instance-based schemes define distance between nominal values (0 if values are equal, 1 otherwise)
• Integers: nominal, ordinal, or ratio scale?

Any questions, remarks?