data mining for business intelligence: from …perso.ecp.fr/~aufaurema/data mining for bi.pdfdata...
TRANSCRIPT

Marie-Aude AUFAUREEcole Centrale Paris
Academic Chair in Business Intelligence
Data Mining for Business Intelligence:from Relational to Graph Representation
Dagstuhl Seminar on Data Warehouses

Data Mining for Business Intelligence – MA AUFAURE
« TRADITIONAL » DATA MINING
Knowledge extraction from large databases•Input: data in a tabular form•Mainly ignore relations between objects•descriptive or predictive data mining
-Clustering-Similarity inside a cluster maximized-Similarity between clusters minimized-Overlapping clusters (hierarchical, FCA)
-Association rules:-Find associations between objects
- Other methods
Data Methods
Dagstuhl Seminar on Data Warehouses

Data Mining for Business Intelligence – MA AUFAURE
Concept Lattices
Animal Preying Mammal Flying Bird
Lion X XFinch X XEagle X X XHare X
Ostrich X
Lion, Finch, Eagle, Hare, Ostrich
Finch, Eagle, Ostrich
Bird Preying
Lion, Eagle
Mammal
Lion, Hare
Finch, Eagle
Flying, Bird
Lion
Preying, Mammal
Eagle
Bird, Flying, Preying
Bird, Flying, Preying, Mammal
Context table Concept lattice
Concept table
Concept Intension Extension
Top Ø Lion, Finch, Eagle, Hare, Ostrich1 Bird Finch, Eagle, Ostrich2 Preying Lion, Eagle3 Mammal Lion, Hare4 Flying, Bird Finch, Eagle5 Preying, Mammal Lion6 Bird, Flying, Preying Eagle
Bottom Bird, Flying, Preying, Mammal Ø
Advantages and drawbacks:+ Groups objects into concepts according to their common properties+Keeps the semantics of data-Complexity-Need for understanding the way objects are clustered
Dagstuhl Seminar on Data Warehouses

Data Mining for Business Intelligence – MA AUFAURE
Conceptual classification for e-reputation
Data Mining for Business Intelligence – MA AUFAURE
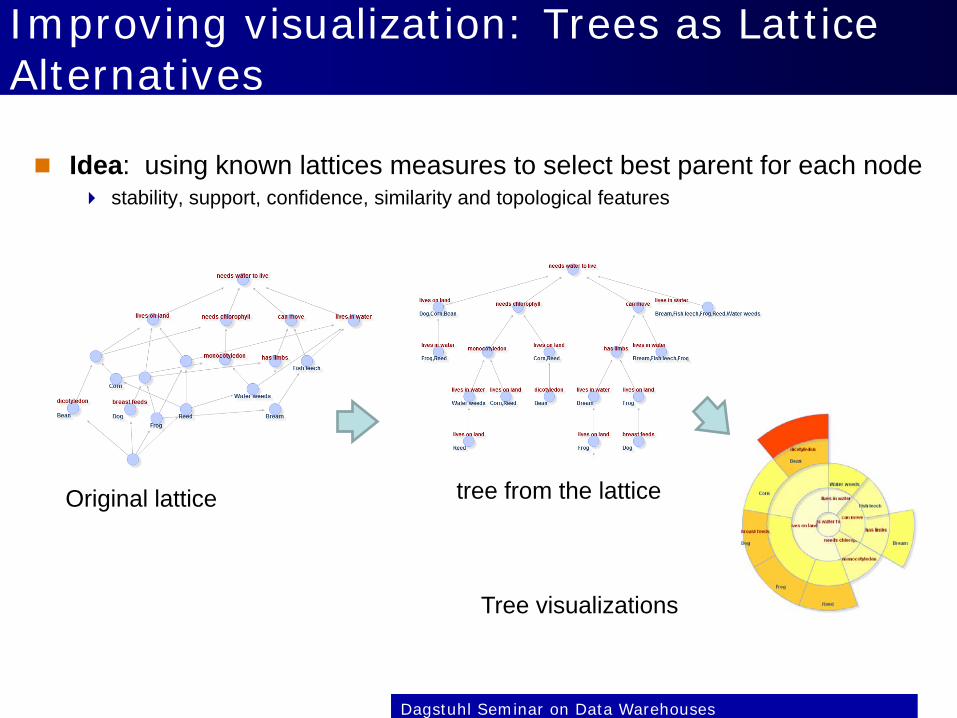
Improving visualization: Trees as Lattice Alternatives
Idea: using known lattices measures to select best parent for each node stability, support, confidence, similarity and topological features
Original lattice tree from the lattice
Tree visualizations
Dagstuhl Seminar on Data Warehouses

Data Mining for Business Intelligence – MA AUFAURE
What’s new??
Data everywhere – Big Data phenomenon Data are mainly unstructured80% of data manipulated in an enterprise are unstructured
Data are produced in real time and distributed Data come from heterogeneous sources in an
unpredictable wayMobile phone, sensors, computers, TV, etc.
⇒ Big Data phenomenon is considered as the main computer science challenge for the next decade
DaDagstuhl Seminar on Data Warehouses

Data Mining for Business Intelligence – MA AUFAURE
Graphs everywhere
7
-Social networks-Web-Enterprise databases-Biology-Etc.
Dagstuhl Seminar on Data Warehouses
Graphs can be seen as a way of managing structured and semi-structured data, as well as unstructured information.

Data Mining for Business Intelligence – MA AUFAURE
Graphs: what can we do with?
Traversing linked information, finding shortest path, doing (semantic) partition
Recommendation and discovery of potentially interesting linked information
Exploit the graph structure of large repositoriesWeb environmentDigital documents repositoriesDatabases/Data Warehouses with metadata
8Dagstuhl Seminar on Data Warehouses

Data Mining for Business Intelligence – MA AUFAURE
Variety of graphs
From simple graphs (basic mathematic definition):No information about nodes (all nodes have the same semantics, no
attributes)Mainly focus on the relations between objects
To labeled and attributed graphsAdd semantic information to nodes
And more complex structures like Hypergraphs and Hypernodes allowing nested structures (complex attributes and/or relations)
9Dagstuhl Seminar on Data Warehouses

Data Mining for Business Intelligence – MA AUFAURE
(1)Complex-nodecreation
(2)Relations Identification
Dagstuhl Seminar on Data Warehouses

Data Mining for Business Intelligence – MA AUFAURE
The corresponding instance Graph
Dagstuhl Seminar on Data Warehouses

Data Mining for Business Intelligence – MA AUFAURE
12
Dir-id 27
Director_thesis_Lochan Norman
Lab_id Laboratory_1
Same Laboratory
Student_Yen Yang
St_idIS-A
CountryForeign_StudentChina
12
Same_Director_thesis
Dir-id Director_thesis_2
Student_Mohsen Ali
St_id
Egypt
03
Dir-id Director_thesis_2
Dir-id 38Lab_id Laboratory_1
Director_thesis_Weber Jean
Thesis_1ThesisThesis_3
Thesis Thesis_1
Student_Jack Pierre
St_id 05Dir-id Director_thesis_1
Thesis Thesis_3
Thesis Thesis_2
Thesis Thesis_2
Country
IS-A Foreign_Student
Graph transformation according to the user’s point of view
Dagstuhl Seminar on Data Warehouses
A set of transformation patterns is applied to identify nodes and relations, and to extract new relations

Data Mining for Business Intelligence – MA AUFAURE
Graph Aggregation: SNAP & k-SNAPTian, Hankins and Patel (SIGMOD 2008)
● Summarization based on user-selected nodeattributes and relationships.
● Provide “drill-down” and “roll-up” abilities tonavigate multi-resolution summaries.
● Produce meaningful summaries for realapplications (and multiple points of view)
● Efficient and scalable for very large graphs
Dagstuhl Seminar on Data Warehouses

Data Mining for Business Intelligence – MA AUFAURE
SNAP Operation
AA
A A
A
A
A
A
BB B
C
C
C
Dagstuhl Seminar on Data Warehouses
Attributes first

Data Mining for Business Intelligence – MA AUFAURE
SNAP Operation
AA
A A
A
A
A
A
BB B
C
C
C
Then, relations

Data Mining for Business Intelligence – MA AUFAURE
Attributes and relationships
● Attributes and relationships together, but attributes first!
For example:●All students in the blue group have the same gender and are in the same dept●Every student in the blue group has:●at least one “friend” in the green group●at least one “classmate” in the purple group●at least one “friend” in the orange group●at least one “classmate” in the orange group
Dagstuhl Seminar on Data Warehouses

Data Mining for Business Intelligence – MA AUFAURE
Graph Aggregation: example
17
Initial graph with selected nodes and relations:Nodes: Thesis-DirectorAttribute: gradeRelations: Same_Laboratory and Same_Student
Dagstuhl Seminar on Data Warehouses
Dir-id 27
Director_thesis_Lochan Norman
Lab_id Laboratory_1
Same Laboratory
Student_Yen Yang
St_idIS-A
CountryForeign_StudentChina
12
Same_Director_thesis
Dir-id Director_thesis_2
Student_Mohsen Ali
St_id
Egypt
03
Dir-id Director_thesis_2
Dir-id 38Lab_id Laboratory_1
Director_thesis_Weber Jean
Thesis_1ThesisThesis_3
Thesis Thesis_1
Student_Jack Pierre
St_id 05Dir-id Director_thesis_1
Thesis Thesis_3
Thesis Thesis_2
Thesis Thesis_2
Country
IS-A Foreign_Student
Initial Graph
Excerpt of the graph

Data Mining for Business Intelligence – MA AUFAURE
Graph Aggregation
18
K-snap generates a summary formed by 3 groups (A-compatible grouping):HDR, co-supervisor, prof (modalities of the attribute grade)
1st iteration: subdivision of the HDR group into 2 subgroups according to the relation Same_Student: HDR_1: HDRs supervising a student with at least one professor or co-supervisor, HDR_2: HDR supervising students having only asdirector HDRs
2nd iteration: subdivision of the Prof group into 2 subgroups according to the relation Same_Laboratory
Dagstuhl Seminar on Data Warehouses
1st iteration2nd iteration

Data Mining for Business Intelligence – MA AUFAURE
Conclusion/Open problems/Challenges Graphs: towards a unified view of structured data and
unstructured content? Models: many existing models
choose the most appropriate one! find communities that not only takes into account links
between individuals, but also their similarities based on their own attributes
Combine graphs algorithms with data mining methods Add semantics – matching with a semantic layer Summarization – Aggregation Manage the consistency of the graph Allow users to easily analyze the resulting graph
19Dagstuhl Seminar on Data Warehouses

Data Mining for Business Intelligence – MA AUFAURE
QUESTIONS?
20Dagstuhl Seminar on Data Warehouses