data mining for astronauts medical autonomy - s.a.t.e. · pdf filedata mining for astronauts...
TRANSCRIPT

American Institute of Aeronautics and Astronautics
1
Data Mining for Astronauts Medical Autonomy
Jose Martinez-Heras1 Black Hat S.L., Córdoba, 14002, Spain
Alessandro Donati2 European Space Agency, Darmstadt, 64293, Germany
Volker Damann3 European Space Agency, Cologne, 51147, Germany
Jacopo Biancat4, Chiara Brighenti5 and Attilio Brighenti6, Francesca Ferrari7 and Roberto Chientaroli8 S.A.T.E. Systems and Advanced Technologies Engineering S.r.l., Venezia, 30135, Italy
and
Giovanni Arcuri9, Federico Silipo10, Tommaso Trenti11, Mauro Zennaro12 Azienda USL Modena, Modena, 41121, Italy
The European Space Agency (ESA) has recently patented and developed two data mining techniques that support non-medical telemetry monitoring and diagnostic tasks. Novelty Detection allows finding unusual behaviour in data which often is the signature of a developing anomaly. DrMUST supports characterization and anomaly investigation. It finds when similar behaviours have happened in the past and discovers possible causes for a given anomaly. Both Novelty Detection and DrMUST are highly valued by Flight Control Engineers and have become the de-facto standard data analysis tools at the European Space Operations Centre. In this work we evaluate how these ESA developed techniques and other data mining approaches can be of benefit for autonomous medical monitoring and
1 Software Engineer / Researcher, ESOC, Robert Bosch Strasse 5, Darmstadt Germany, [email protected] 2 Advanced Mission Concepts & Technology Manager, ESOC, Robert Bosch Strasse 5, Darmstadt Germany, [email protected] 3 Former Head Space Medicine Office, EAC, Geb. 12, Linder Höhe, PO Box 906096, Cologne, Germany; Visiting Professor for Human Performance in Space at the International Space University, Strasbourg, France [email protected] , [email protected] 4 Systems Identification and Control Engineer, R&D - Diagnostic systems, S.A.T.E. S. Croce 664/A Venezia Italy, [email protected] 5 Group Leader, R&D - Diagnostic systems, S.A.T.E. S. Croce 664/A Venezia Italy, [email protected]. 6 President, S.A.T.E. S. Croce 664/A Venezia Italy, [email protected] 7 Systems Identification and Control Engineer, R&D - Diagnostic systems, S.A.T.E. S. Croce 664/A Venezia Italy, [email protected] 8 Systems Identification and Control Engineer, R&D - Diagnostic systems, S.A.T.E. S. Croce 664/A Venezia Italy, [email protected] 9 Responsabile U.O. Settore Ospedali, Servizio Ingegneria Clinica, AUSLMO, Via S. Giovanni del Cantone 23, Modena, Italy, [email protected] 10 Senior Engineer, Servizio Ingegneria Clinica, AUSLMO, Via S. Giovanni del Cantone 23, Modena, Italy, [email protected] 11 Head of Dipartimento interaziendale adattività integrata di medicina di laboratorio ed anatomia patologica, AUSLMO, Via S. Giovanni del Cantone 23, Modena, Italy, [email protected] 12 Cardiologist - Interventisticacardiologica, elettrofisiologia ed emodinamica, AUSLMO, Via S. Giovanni del Cantone 23, Modena, Italy, [email protected]
Dow
nloa
ded
by 9
5.22
8.13
7.13
0 on
Jun
e 8,
201
6 | h
ttp://
arc.
aiaa
.org
| D
OI:
10.
2514
/6.2
016-
2382
14th International Conference on Space Operations
16-20 May 2016, Daejeon, Korea
AIAA 2016-2382
Copyright © 2016 by ESA. Published by the American Institute of Aeronautics and Astronautics, Inc., with permission.
SpaceOps Conferences

American Institute of Aeronautics and Astronautics
2
diagnostics with the goal of medical autonomy in mind. Medical autonomy is a precondition to enable long cruise human spaceflight missions. In unclear medical conditions or even medical contingencies, astronauts should have the means to collect their medical data and to understand if their physiological parameters are within nominal rangess, get early warnings if they are not, are provided with possible diagnoses and get practical recommendations and treatment options to efficiently solve the medical issue. The target users group are astronauts and medical teams with possible spin-off to non-space related applications in the medical domain. The scenario will be, for the astronauts and the crew medical officer, to be able to obtain early awareness and resolution proposals of their health status, much faster than if interaction with ground would be needed. The definition, design and validation of data mining algorithms that enable this medical scenario are discussed in this work. In order to prototype these scenarios, anonymised medical data with relevance to the space domain has been used from several sources. The paper describes in detail the data, process, the data mining techniques that are helpful in the context of medical autonomy and the assessment from the ESA medical team. Future work include the spin-off of this project to non-space health care.
Nomenclature AUSLMO = Azienda USL Modena (local health centre of Modena) AAMI = Association for the Advancement of Medical Instruments ECG = Electrocardiogram ESA = European Space Agency ISS = International Space Station
I. Introduction aw medical or health-related data are voluminous and heterogeneous and may be collected in a variety of ways ranging from narrative, textual data to numerical measurements, recorded signals, drawings, and even
bioimages. Data mining techniques could be in principle applied to all of them since the following domains are included:
1. Text data mining on the narrative or textual records (e.g. in the behavioural assessment);
2. Data mining on measurable parameters and recorded signals (e.g. blood analysis or ECG signal);
3. Image data mining on the visual images including photographs and drawings acquired from machines or sketched by the physician (e.g. diagnostic imaging).
Taking into account that the focus of the work here described was the investigation and, if possible, improvement of medical autonomy of astronauts during missions (i.e. in-flight), only medical data collected in the form of measurable parameters or recorded signals were considered since these are the most relevant and regularly acquired information in in-flight scenarios, thus excluding the mining of images and text.
In particular the work focused on the application of data mining techniques to Electrocardigram (ECG) and laboratory data (including urine and blood analysis), which are two of the most important medical exams used by physicians nowadays. The former can provide a great deal of information on the normal and pathological physiology of heart activity; the latter provides a broad range of diagnostic information to assess the status of the main organs (e.g. liver, kidney, blood, etc.) influencing more than 70% of health care decisions13. Moreover, given their importance in standard medical practice, a significant amount of data related to general patients can be found, which are necessary to adopt a data driven approach. Finally the analysis of the heart activity through the ECG and the analysis of blood and urine allow the diagnosis of the widest range of pathologies and diseases related to the possible in-flight scenarios.
The medical datasets analysed in the work here presented were made available by the local health centre of Modena (Azienda USL of Modena, Italy, briefly AUSLMO), consisting in a set of analyses collected from 2009 to 2014. These have been pre-processed by AUSLMO, in order to delete every reference to patient’s name, surname
13 http://www.lef.org/magazine/2006/5/report_blood/Page-01
R
Dow
nloa
ded
by 9
5.22
8.13
7.13
0 on
Jun
e 8,
201
6 | h
ttp://
arc.
aiaa
.org
| D
OI:
10.
2514
/6.2
016-
2382

American Institute of Aeronautics and Astronautics
3
and address, replacing that information with an ID, unique for each patient. In this way, datasets have been anonymized, while maintaining their uniqueness and the correspondence between analyses performed in different moments or of different types by the same patient. Other sensitive data that have been deleted are the name and the surname of the physician performing the diagnosis. Also in this case, a specific ID has been used to refer univocally to each physician.
Table 1 shows an overview of the amount of ECG and laboratory data, including an overview of the number of patients attending each type of analysis.
To carry out the scope of work both supervised14 and unsupervised15 methods were investigated, including Self-Organizing Maps, K-means, Gaussian-mixture models, Adaptive Boosting, Decision trees and Pattern nets16. Several pre-processing steps were deemed necessary for ECG data in order to improve the data used as input to the automatic classification and clustering algorithms. Moreover also cross-correlation analyses were performed both for ECG and laboratory data.
II. ECG data processing
A. The electrocardiogram Among the many measurable physiological signals (Galvanic Skin Response, Electrocardiogram, Blood
Pressure, Respiration, Electromyogram, Electroencephalogram, Electro-oculogram and Body Temperature), a special relevance has the Electrocardiogram (ECG), which qualifies the heart activity by measuring multiple electrical potentials on the surface of the skin, resulting from heart beats, as function of time. The mechanical activity of the heart is linked with this electrical activity. A rest ECG is therefore an important diagnostic tool for assessing the heart function.
Its relevance is due to the fact that it has all the three characteristics of an ideal meaningful physiological signal: - high information content; - quick dynamics; - reversibility, i.e. the possibility to return to the initial conditions once the stimulus or stimuli vanish. Figure 1 shows a
typical heartbeat recorded by the ECG, where the x-axis is the time measured in milliseconds and the y-axis is the potential measured by two electrodes, in millivolt. The figure depicts also the key features, typically waves, intervals and interwave sections, that aid in diagnosis of heart disease. The list of the main medical features are summarized in Table 2.
14 Process of creating a labeling of objects (classes) with known class labels. Classes are known in advance. 15 Process of creating a labeling of objects (classes) without a teacher, i.e. deriving the labels only from data. The number of classes and the classes themselves are not known in advance. 16Pattern nets are pattern recognition networks based on neural networks made available by the Mathworks® in the Neural Network Toolbox.
Figure 1. Convention and nomenclature of wave and interwave sections present in a heartbeat. The plotted signal is the Potential ([mV]) over Time ([s]) representation of a heatbeat.
Table 1. Total amount of ECGs and laboratory Data tests and number of patients for each type of analysis.
Data Type Number of tests1 Number of patients ECG Data 62.244 41.056 Laboratory Data 87.273.621 657.918
Dow
nloa
ded
by 9
5.22
8.13
7.13
0 on
Jun
e 8,
201
6 | h
ttp://
arc.
aiaa
.org
| D
OI:
10.
2514
/6.2
016-
2382
American Institute of Aeronautics and Astronautics
4
B. Recorded data The ECG data used in the work were
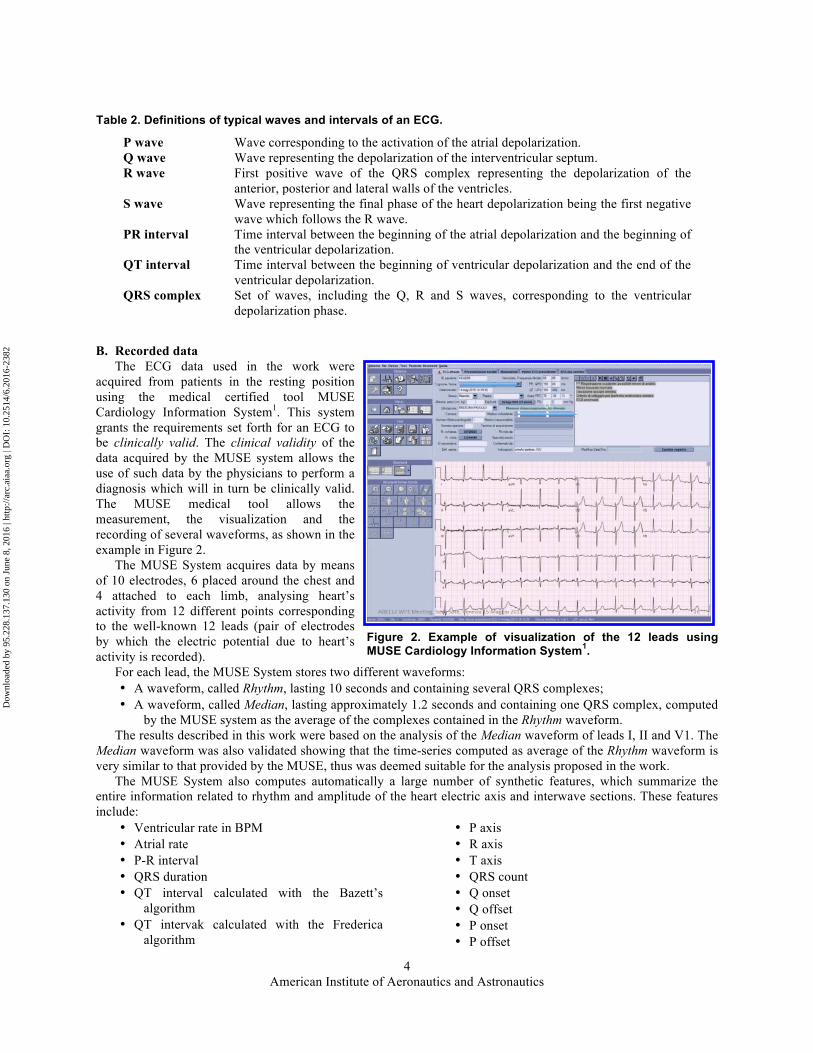
acquired from patients in the resting position using the medical certified tool MUSE Cardiology Information System1. This system grants the requirements set forth for an ECG to be clinically valid. The clinical validity of the data acquired by the MUSE system allows the use of such data by the physicians to perform a diagnosis which will in turn be clinically valid. The MUSE medical tool allows the measurement, the visualization and the recording of several waveforms, as shown in the example in Figure 2.
The MUSE System acquires data by means of 10 electrodes, 6 placed around the chest and 4 attached to each limb, analysing heart’s activity from 12 different points corresponding to the well-known 12 leads (pair of electrodes by which the electric potential due to heart’s activity is recorded).
For each lead, the MUSE System stores two different waveforms: • A waveform, called Rhythm, lasting 10 seconds and containing several QRS complexes; • A waveform, called Median, lasting approximately 1.2 seconds and containing one QRS complex, computed
by the MUSE system as the average of the complexes contained in the Rhythm waveform. The results described in this work were based on the analysis of the Median waveform of leads I, II and V1. The
Median waveform was also validated showing that the time-series computed as average of the Rhythm waveform is very similar to that provided by the MUSE, thus was deemed suitable for the analysis proposed in the work.
The MUSE System also computes automatically a large number of synthetic features, which summarize the entire information related to rhythm and amplitude of the heart electric axis and interwave sections. These features include:
• Ventricular rate in BPM • Atrial rate • P-R interval • QRS duration • QT interval calculated with the Bazett’s
algorithm • QT intervak calculated with the Frederica
algorithm
• P axis • R axis • T axis • QRS count • Q onset • Q offset • P onset • P offset
Table 2. Definitions of typical waves and intervals of an ECG.
P wave Wave corresponding to the activation of the atrial depolarization. Q wave Wave representing the depolarization of the interventricular septum. R wave First positive wave of the QRS complex representing the depolarization of the
anterior, posterior and lateral walls of the ventricles. S wave Wave representing the final phase of the heart depolarization being the first negative
wave which follows the R wave. PR interval Time interval between the beginning of the atrial depolarization and the beginning of
the ventricular depolarization. QT interval Time interval between the beginning of ventricular depolarization and the end of the
ventricular depolarization. QRS complex Set of waves, including the Q, R and S waves, corresponding to the ventricular
depolarization phase.
Figure 2. Example of visualization of the 12 leads using MUSE Cardiology Information System1.
Dow
nloa
ded
by 9
5.22
8.13
7.13
0 on
Jun
e 8,
201
6 | h
ttp://
arc.
aiaa
.org
| D
OI:
10.
2514
/6.2
016-
2382

American Institute of Aeronautics and Astronautics
5
• T offset • ECG sample rate base
• ECG sample rate base exponent
C. Dataset characterization The total number of ECGs considered in this work is 62,273 collected from 41,056 patients. Within this dataset
there were 606 ECGs that did not contain waveforms, thus the total number of analysed ECGs was 61,667. The dataset characterization for ECG data
takes into account the following factors: • Age, considering the following classes
o 0 years - 25 years o 25 years - 50 years o 50 years - 75 years o 75 years - 100 years o Not available if the age is not
provided - Gender considering:
o Male o Female
Table 3 shows the dataset characterization for the considered ECGs which is also shown in Figure 3. It is possible to see that the individuals older than 50 year account for more than 70% of data both male and female, while those spanning 25 to 50 year age, whic is the one of most interest for the Eropean Space Agency (ESA), account for only 20% of the patients. Therefore to avoid discarding the greater part of data, focusing the analyses only on the age from 25 to 50, all data were considered in the analyses.
The original dataset was divided into two main parts: the training set (used during the learning phase in which relevant information such as patterns, is generated) and the validation set (used to verify the information, e.g. patterns, generated with the training set), as specified in Table 4. This shows also the number of
Figure 3. Dataset characterization for ECG data.
Table 3. Dataset characterization for ECG data.
Gender Age
range (years)
Nr. Of ECG
% wrt gender
% wrt total
Male
0 - 25 1,449 4.65 2.35 25 - 50 6,235 20.03 10.11 50 - 75 12,984 41.70 21.06
75 - 100 9,423 30.26 15.28 Not
available 1,044 3.35 1.69
Total 31,135 100.00 50.49
Female
0 - 25 1,300 4.27 2.11 25 - 50 5,849 19.20 9.48 50 - 75 10,488 34.42 17.01
75 - 100 12,060 39.58 19.56 Not
available 771 2.53 1.25
Total 30,468 100.00 49.41 Gender not available - 64 0.10
Grand total 61,667 100.00
Dow
nloa
ded
by 9
5.22
8.13
7.13
0 on
Jun
e 8,
201
6 | h
ttp://
arc.
aiaa
.org
| D
OI:
10.
2514
/6.2
016-
2382
American Institute of Aeronautics and Astronautics
6
ECGs characterized by a null waveform which have been removed from the analysis. The total number of ECGs 61,667, representing 99% of the ECGs in the raw dataset, includes 31,078 and 30,589 ECGs in the training and validation datasets respectively.
D. A-priori medical knowledge: criteria and classes
Each available ECG contains the diagnosis written by the physician that has a clinically validity. This diagnosis has no canonical form, although a standard protocol is used to write it down.
For example, the canonical form for even a simple idea such as “adenocarcinoma of colon metastatic to liver” has no consistent form of expression. The individual medical words, of course, all have a unique spelling and meaning; but all the following distinct expressions (and many others) are medically equivalent2:
• Colon adenocarcinoma, metastatic to liver; • Colonic adenocarcinoma, metastatic to liver; • Large bowel adenocarcinoma, metastatic to liver; • Large intestine adenocarcinoma, metastatic to liver; • Large intestinal adenocarcinoma, metastatic to liver; • Colon’s adenocarcinoma, metastatic to liver; • Adenocarcinoma of colon, with metastasis to liver; • Adenocarcinoma of colon, with liver metastasis; • Adenocarcinoma of colon, with hepatic metastasis.
This makes difficult exploiting only the available diagnosis made by the physician to automatically build meaningful classes with the scope of applying supervised techniques. Indeed the application of supervised techniques require the use of a priori knowledge that allows labelling data into predefined categories aiming at building a function that assign objects to one of those predefined categories.
To do so the so-called quantitative approach was used. This is based on the evaluation of synthetic features extracted from the ECG traces that are made available by the MUSE system.
Indeed the cardiologists included in the project reported that, in the usual medical practice the visual examination of the 12 ECG leads (qualitative approach) is combined with the evaluation of the synthetic features (quantitative approach). The quantitative approach relies on the fact that an ECG allows the evaluation of two different heart’s characteristics: the rhythm of QRS complexes and the amplitude of waves. The final diagnosis performed by the physician is usually based on a combined evaluation of both these two factors.
Therefore the classification process may be simplified by considering the rhythm and amplitude separately rather than basing it on the entire number of available classes, corresponding to the total amount of the different diagnoses that could be extracted from data. The criteria that were proposed and agreed toghether with the medical physicians for the classification of the ECG data are:
• Rhythm;
• Ventricular frequency;
• Orientation of the R wave;
• Duration of the QRS complex;
• Duration of the PR interval;
• Duration of the corrected QT interval.
Each of these criteria identify a different number of classes to which an ECG may be assigned, i.e. each ECG may be labelled on the basis of its belonging to a given class, allowing the application of supervised learning methods. Table 5 lists the classes identified by each criteria. Each ECG belongs only to one class of each criteria. For example a normal ECG will belong to the class “Sinusal” of the criterion Rhythm, to the class “Normal” of the criteria
Table 4. Dataset characterization for ECG data.
Raw datasets
Null waveforms
Remaining ECGs
TRAINING 31,138 60 31,078 99.8% VALIDATION 31,135 546 30,589 98.2% TOTAL 62,273 606 61,667 99.0%
Dow
nloa
ded
by 9
5.22
8.13
7.13
0 on
Jun
e 8,
201
6 | h
ttp://
arc.
aiaa
.org
| D
OI:
10.
2514
/6.2
016-
2382

American Institute of Aeronautics and Astronautics
7
Ventricular frequency, Orientation of the R wave, Duration of the QRS complex and Duration of the PR interval and to the class “Not pathological” of the criterion Duration of the corrected QT interval.
It is highlighted that, in case of success, the supervised algorithms will allow performing automatically the diagnosis associated to each of the criteria defined.
E. Use cases The use cases for the analysis of ECG data included both the development of a classification algorithm based on
the medical features computed automatically by the MUSE system (named ECG/FEATURES) and the automatic evaluation of the ECG waveforms (named ECG/WAVEFORMS). Recalling the concepts of quantitative and qualitative approaches used by the cardiologists in the usual medical practice it may be said that the work:
• Adopted a quantitative approach in the introduction of the-priori knowledge used for the definition of the classes of the different criteria that are indeed based on the synthetic features.
• Investigated the feasibility of automatizing by data mining methods both the quantitative approach (based on synthetic features) and the qualitative approach (based on the evaluation of the entire ECG waveform).
For both use cases supervised and unsupervised methods were investigated. As already anticipated, supervised methods exploit, during the learning phase, referred to also as training, the available information on the class labels where the classes are known in advance, as listed in Table 5. On the other side, unsupervised methods aim at dividing data into groups (clusters) that are meaningful, without exploiting a-priori knowledge. Therefore the information on the classes is not used during the learning phase but may be used to evaluate the goodness of the achieved results, i.e. to verify if any of the group automatically identified may be associated to one or more classes defined in advance.
In conclusion, yet by with different approaches, the application of supervised and unsupervised methods aimed both at the generation of one or more classification model(s) for each agreed criterion.
The purpose, in both cases, is to train a model that is capable to automatically assign a class/diagnosis to every new set of input data (associated to the selected criterion, Figure 4).
Table 5. Classes defined for each criteria.
Criteria Class 1 Class 2 Class 3 Class 4 Rhythm Sinusal Not sinusal Ventricular frequency Normal Tachycardia Bradycardia
Orientation of the R wave Normal Right axis
deviation Left axis deviation Extreme right axis deviation
Duration of the QRS complex Normal
Incomplete bundle branch block
Bundle branch block Pathological
Duration of the PR interval Normal Not normal
Duration of the corrected QT interval
Not pathological Pathological
Classification model for the ith criterion
Input ClassClassification model
for the ith criterionInput Class
Classification model for the ith criterion
Input ClassClassification model
for the ith criterionInput Class
Figure 4. Proposed approach for the two use cases for the analysis of ECG data.
Dow
nloa
ded
by 9
5.22
8.13
7.13
0 on
Jun
e 8,
201
6 | h
ttp://
arc.
aiaa
.org
| D
OI:
10.
2514
/6.2
016-
2382

American Institute of Aeronautics and Astronautics
8
The two use cases differ by the type of input: the use case ECG/FEATURES uses as input a combination of medical features, generating the so-called feature-based patterns; instead the use case ECG/WAVEFORMS uses as input the entire ECG waveform (Figure 5).
For the use case ECG/FEATURES it is highlighted that the features used as input to the classification model(s)
are different from those used to build the classes; otherwise the results would be trivial. Therefore the scope, in this case, is to evaluate how-well different sets of medical features perform in the
diagnosis associated to the ith class (compared with those used to build the same ith class). The benefit for astronauts’ medical autonomy, in case of success will be that, if some medical features are not
available or cannot be computed by astronauts, then these could be replaced by others to determine the diagnosis associated to the non-available features.
On the other side, the use case ECG/WAVEFORMS allows verifying if the learning method is capable to automatically distinguish waveforms belonging to different classes, i.e. being characterised by different diagnoses.
The benefit for astronauts’ medical autonomy, in case of success will be that, if no physician may evaluate the ECG recorded by an astronaut and the relevant medical features are not available or cannot be computed by astronauts then the ECG waveform could be automatically evaluated by the supervised model, providing a diagnosis of the ECG trace.
A variety of supervised and unsupervised methods were investigated including Self-Organizing Maps, K-means, Gaussian-mixture models, Adaptive Boosting, Decision trees and Pattern nets.
F. Results and discussion The best results in terms of accuracy17, recall18 and precision19 of the classifiers have been obtained for both use
cases and all criteria by using supervised methods, confirming the importance of the a-priori knowledge represented by the classes related to the ECGs. Indeed whenever information on the classes of data are available, these should be exploited, so supervised algorithms be preferred to unsupervised ones.
In particular the best results are obtained using the Pattern nets that are pattern recognition networks based on feedforward neural networks made available by the Mathworks® in the Neural Network Toolbox. In particular, a two-layer feedforward neural network with sigmoid transfer functions in both hidden and output layer is trained to classify input according to target classes (Figure 6).
The results obtained in the two use cases showed that the two approaches based either on the features or the waveforms are complementary because they perform better on different criteria.
In particular the approach based on features (use case ECG/FEATURES) achieves good results, being characterized by high accuracies, recall and precision for
17 The accuracy is the percentage of elements which have been correctly predicted. 18 The recall is the percentage of elements, belonging to a certain condition, which have been correctly predicted. 19 The precision is the percentage of the elements, assigned to a condition by the classifier, whose actual condition coincides with the prediction.
Classification model for the ith criterion
OR Class
FB - Pattern 1FB - Pattern 2FB - Pattern 3FB - Pattern 4
Figure 5. Possible input to the classification model.
Figure 6. Example of structure of a Pattern Net classification model.
Dow
nloa
ded
by 9
5.22
8.13
7.13
0 on
Jun
e 8,
201
6 | h
ttp://
arc.
aiaa
.org
| D
OI:
10.
2514
/6.2
016-
2382

American Institute of Aeronautics and Astronautics
9
the following criteria: • Ventricular frequency • Duration of the QRS complex • Duration of the PR interval • Duration of the corrected QT interval
On the other side the approach based on waveforms (use case ECG/WAVEFORMS) achieves promising results being characterized by medium recall and precision for the following criteria:
• Rhythm • Orientation of the R wave
Table 6 shows the best results obtained for each criterion specifying: • The type of input used by the classifier, either waveform or feature; • The lowest recall achieved by the classifier in the training and validation datasets; • The overall accuracy achieved by the classifier in the training and validation datasets;
It is worth highlighting that the most representative measure of the goodness of a classifier is deemed the “lowest recall” percentage representing the worse classification percentage of a specific class by a given criterion. On the other side, the overall accuracy may be affected by an unbalanced distribution of data over the different classes. Indeed if most data belong to only one class and this class is correctly identified by the classifier, then the overall accuracy will be mainly representative of the correct identification of this class only (which will be characterized by a high recall), with modest influence of the lower recall in the other classes.
Table 6. Best results obtained for each criterion (all results refer to supervised methods).
Criteria Classes Input used Training results (%) Validation results (%)
Lowest recall
Overall accuracy
Lowest recall
Overall accuracy
Rhythm Sinusal
Waveforms 74.4 93.5 69.7 92.6 Not sinusal
Ventricular Frequency
Normal Features 79.5 95.1 79.4 95.3 Tachycardia
Bradycardia
Orientation of the R wave
Normal
Waveforms 53.0 89.2 46.6 88.7
Right axis deviation
Left axis deviation
Extreme right axis deviation
Duration of QRS complex
Normal
Features 100.0 100 99.8 100 Incomplete bundle
branch block Bundle branch
block Pathological
Duration of PR interval
Normal Features 93.3 98.6 95.7 99.3
Not normal
Duration of corrected QT
interval
Not pathological Features 90.9 95.3 90.4 95.5
Pathological
Dow
nloa
ded
by 9
5.22
8.13
7.13
0 on
Jun
e 8,
201
6 | h
ttp://
arc.
aiaa
.org
| D
OI:
10.
2514
/6.2
016-
2382

American Institute of Aeronautics and Astronautics
10
The four criteria achieving good results with the feature approach are all characterized by a lowest recall higher than 80%. On the other side, the two criteria characterized by promising results with the waveform approach are characterized by a lowest recall of 69.7% and 46.6% in the validation dataset. The 69.7% obtained with the Rhythm criterion could still be deemed as an acceptable result, while the 46.6% obtained with the Orientation of the R wave criterion is deemed too low.
For these last two criteria it is possible to conclude that enhancements are expected in order to apply these methods for the improvement of astronaut’s medical autonomy. Indeed the physicians commented that the use of a reduced number of leads in the automatic evaluation of ECG waveforms could further worsen the results quality because useful information on the ECG traces would be lost. Moreover, it is also difficult to retrieve only from the mere ECG traces all or part of other surrounding factors and elements that physicians consider to perform the diagnosis, such as the overall status of the patient and the reasons of the request of the clinical exam.
III. Laboratory data
A. Laboratory analyses Laboratory testing measures something inside the body or measures body functions by testing samples taken
from inside the body such as blood, urine, saliva, spinal fluid, and DNA20. This category of diagnostic tests are often the least expensive component of the health care pathway, while they influence more than 70% of health care decisions21.
Indeed these diagnostic tests provide objective information about a person’s health that can be used for many purposes. Some tests are used for risk assessment purposes - to determine the likelihood that a medical condition is, or will become, present. Other tests are used to monitor the course of a disease or to assess a patient’s response to treatments, or even to guide the selection of further tests and treatments.
Laboratory testing is an integral part of many medical decisions, providing clinicians with often pivotal information necessary for prevention, diagnosis, treatment, and management of disease
The value of laboratory medicine is realized through its many roles in patient care. These include screening of asymptomatic individuals to identify risk for developing disease, detecting disease at the earliest stages before symptoms occur, selecting safe and effective treatments, planning disease management strategies, estimating treatment response throughout the course of care, identifying threats to patient safety and public health, such as hospital-acquired infections, protecting the blood supply and transplant recipients from harmful pathogens, and drugs of abuse testing to support clinical care and assure public safety3.
The in-flight laboratory testing performed by the astronauts in the International Space Station (ISS) include a broad range of parameters related to blood and urine analysis which are used also in the standard medical practice and which were the focus of the analyses performed in the work here illustrated.
Indeed blood analysis is used by doctors to diagnose and monitor diseases. Because the liquid portion of the blood (plasma) carries so many substances essential to the body's functioning, blood tests can be used to find out what is happening in many parts of the body. Testing blood is easier than obtaining a tissue sample from a specific organ. For example, thyroid function can be evaluated more easily by measuring the level of thyroid hormones in the blood than by directly sampling the thyroid. Likewise, measuring liver enzymes and proteins in the blood is easier than sampling the liver. However, certain blood tests are used to measure the components and function of the blood itself. These are the tests that are mostly used to diagnose blood disorders.
Therefore blood analysis provides a broad range of diagnostic information to assess for example the vascular, liver, kidney, and blood cell status. To name one, the Complete Blood Count measures the number, variety, percentage, concentration, and quality of platelets, red blood cells, and white blood cells, thus is useful in screening for infections, anemias, other hematological abnormalities, etc.21.
Urinalysis has been an important diagnostic tool for more than hundred years. Urine remains a key indicator of many diseases such as urinary tract infection, kidney disease and diabetes. Urinalysis can reveal serious damage that is asymptomatic in early stages yet treatable when identified in time. Its diagnostic significance lies primarily in first-line diagnosis, screening during routine or preventive examinations, and treatment monitoring20.
In usual medical practice, the results of the laboratory analyses are compared with thresholds (named in the following standard medical thresholds), determining if a result is "normal" or "not normal". According to the specific test, there are two types of thresholds: 20 http://www.roche.com/media/media_releases/med-cor-2014-06-30.htm 21 http://www.lef.org/magazine/2006/5/report_blood/Page-01
Dow
nloa
ded
by 9
5.22
8.13
7.13
0 on
Jun
e 8,
201
6 | h
ttp://
arc.
aiaa
.org
| D
OI:
10.
2514
/6.2
016-
2382

American Institute of Aeronautics and Astronautics
11
• Fixed thresholds: this type of thresholds are equal for all patients not being influenced by the patient's age or gender. An example of a test with a fixed threshold is the glucose.
• Variable thresholds: this type of thresholds depends on the patient's age and/or gender, thus this latter information is also required in order to establish if the result is within the range (“normal”) or exceeding the range (“not normal”). An example of a test with variable thresholds is the White Blood Cells. Figure 7 shows the trend over time of the values of the minimum (red line) and maximum (blue line) thresholds for the Work Order "White Blood Cells" related to the gender "male". The correspondence between variable thresholds and test may be done thanks to a table containing information on gender and age of each patient.
B. Recorded data The laboratory analyses provided by AUSLMO are organized in a hierarchical structure: the elementary
laboratory analysis is the Work Order generating one and only one Result, defined as the numerical, qualitative or graphical value associated to a specific Work Order. The Work Order can be named also Test.
An Order is the analysis prescribed by the medical doctor and can be further divided into one or several Work Orders. Multiple Orders can be aggregated in order to make an Order Group. An Order Group is a set of Orders prescribed by the medical doctor.
A Panel is a set of analyses aiming at investigating a specific pathology. An example of a panel is the “red prescription” form filled by the physician. A panel may include both Orders and Order Groups.
The relationship between Work Order, Order, Order Group and Panel can be schematically summarized with the hierarchical representation shown in Figure 8.
The first layer is associated to Panels. Each Panel can be divided in Orders and Order Groups, representing the second Layer.
Both Orders and Order Groups can be divided into Work Orders, which correspond to the last layer of the hierarchical structure.
C. Dataset characterization Figure 9 shows the dataset characterization of laboratory data of all the work orders included in the different
panels. It takes into account the following factors: • Age (0-25, 25-50, 50-75, 75-100) • Gender (Male-Female) • Internal/External patients (usually associated to sick/healthy patients)
The work orders considered in the analyses were more than 42,000,000, among which there were 23,447,044 external (healthy) patients and 18,114,927 internal (sick) patients. The majority of the work orders (almost 70%) refered to patients older than 50 years. It is noted that the work orders considered for the analyses were half the
Figure 8. Hierarchical representation of the relationship between Panel, Order Group, Order and Work Order.
Figure 7. Trend over time of the variable thresholds related to the Work Order "White Blood Cells" for a male person.
Dow
nloa
ded
by 9
5.22
8.13
7.13
0 on
Jun
e 8,
201
6 | h
ttp://
arc.
aiaa
.org
| D
OI:
10.
2514
/6.2
016-
2382

American Institute of Aeronautics and Astronautics
12
number of laboratory data (more than 87,000,000) because the laboratory physicians suggested to reduce the number of work orders of the order group “emocromo con formula” contained in each panel, in order both to reduce the influence of such order group on the entire panel and to avoid the analysis of a high number of variables. Indeed such order group is surely one of the most recurrent analysis performed in laboratory analyses in hospital. Considering only 5 work orders out of the 20 available, reduces significantly the dataset, but their number remains statistically significant, given the large size of the initial dataset.
D. A-priori medical knowledge Laboratory data were analysed using unsupervised learning methods since no medical diagnosis was available in
the dataset and, given the size of the latter, including over 42,000,000 of results, it would have not been feasible to introduce a-priori medical knowledge, by evaluating manually each test. Moreover, the use of the standard medical thresholds would have allowed determining only if test results were "normal" or "not normal". However, this information was not deemed useful for the scope of the work, at least not as a-priori knowledge to be exploited during the learning phase, because the distinction between these two classes is a common medical practice already performed by simply applying such known thresholds to the test results. Therefore, the use of such knowledge during the learning phase would not have generated any added value with respect to the already available medical knowledge.
Nevertheless, even if no a-priori medical knowledge was used during the application of the data mining methods, the medical knowledge was introduced in a second phase to interpret the obtained results and validate them. This medical knowledge consisted in both:
• The standard medical thresholds determining if the value of a given work order is normal or not and; • The visual evaluation and interpretation of the results by the physicians.
E. Use case The use case for the analysis of laboratory data aimed at the development of an unsupervised (or clustering)
algorithms, based on blood and urine analysis capable of grouping data in a certain number of groups (called clusters) without the use of any a priori-knowledge.
As highlighted in the previous section, the medical knowledge was exploited a posteriori, i.e. only to interpret the results achieved by the knowledge extraction, to verify their significance from a clinical point of view and to be able to associate a diagnosis, if any, to the groups automatically identified by the unsupervised algorithm.
Therefore, this use case foresees the use of unsupervised methods, i.e., methods aiming at capturing the natural structure of data (meaningful groups) based only on information found in the data that describe the objects and their relationships with no use of a priori knowledge.
Figure 9. Dataset characterization for laboratory data of the considered work orders.
Dow
nloa
ded
by 9
5.22
8.13
7.13
0 on
Jun
e 8,
201
6 | h
ttp://
arc.
aiaa
.org
| D
OI:
10.
2514
/6.2
016-
2382
American Institute of Aeronautics and Astronautics
13
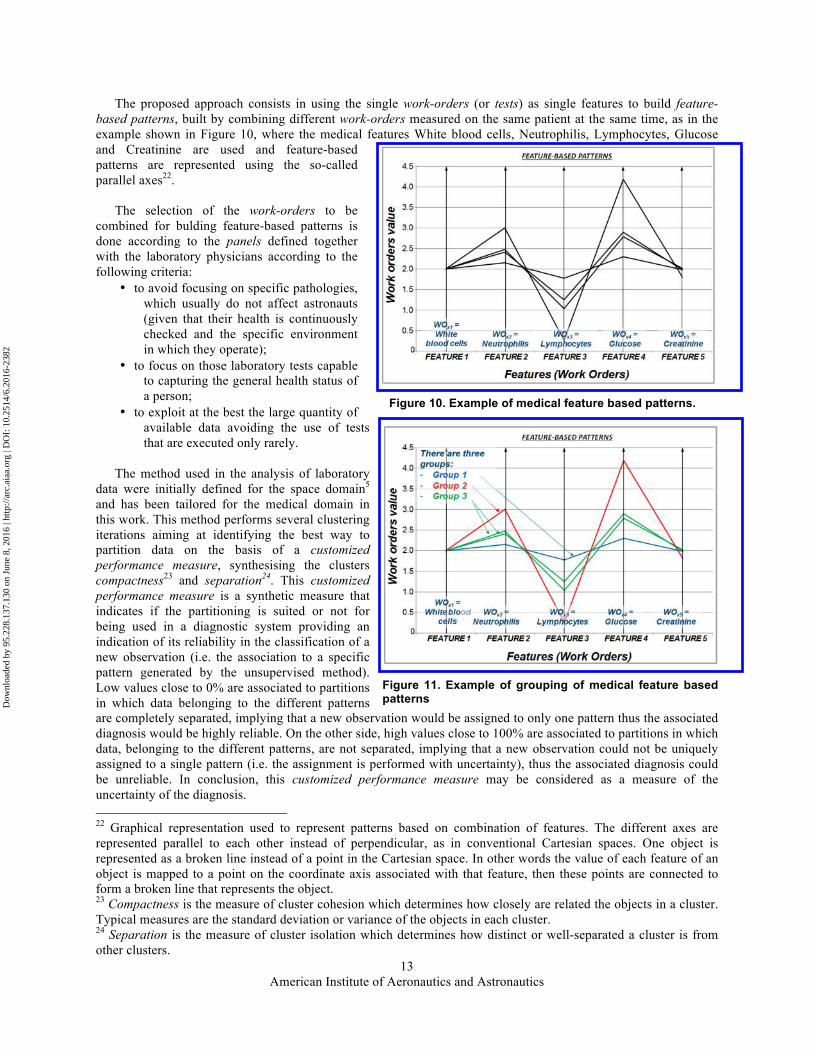
The proposed approach consists in using the single work-orders (or tests) as single features to build feature-based patterns, built by combining different work-orders measured on the same patient at the same time, as in the example shown in Figure 10, where the medical features White blood cells, Neutrophilis, Lymphocytes, Glucose and Creatinine are used and feature-based patterns are represented using the so-called parallel axes22.
The selection of the work-orders to be combined for bulding feature-based patterns is done according to the panels defined together with the laboratory physicians according to the following criteria:
• to avoid focusing on specific pathologies, which usually do not affect astronauts (given that their health is continuously checked and the specific environment in which they operate);
• to focus on those laboratory tests capable to capturing the general health status of a person;
• to exploit at the best the large quantity of available data avoiding the use of tests that are executed only rarely.
The method used in the analysis of laboratory
data were initially defined for the space domain5 and has been tailored for the medical domain in this work. This method performs several clustering iterations aiming at identifying the best way to partition data on the basis of a customized performance measure, synthesising the clusters compactness23 and separation24. This customized performance measure is a synthetic measure that indicates if the partitioning is suited or not for being used in a diagnostic system providing an indication of its reliability in the classification of a new observation (i.e. the association to a specific pattern generated by the unsupervised method). Low values close to 0% are associated to partitions in which data belonging to the different patterns are completely separated, implying that a new observation would be assigned to only one pattern thus the associated diagnosis would be highly reliable. On the other side, high values close to 100% are associated to partitions in which data, belonging to the different patterns, are not separated, implying that a new observation could not be uniquely assigned to a single pattern (i.e. the assignment is performed with uncertainty), thus the associated diagnosis could be unreliable. In conclusion, this customized performance measure may be considered as a measure of the uncertainty of the diagnosis. 22 Graphical representation used to represent patterns based on combination of features. The different axes are represented parallel to each other instead of perpendicular, as in conventional Cartesian spaces. One object is represented as a broken line instead of a point in the Cartesian space. In other words the value of each feature of an object is mapped to a point on the coordinate axis associated with that feature, then these points are connected to form a broken line that represents the object. 23 Compactness is the measure of cluster cohesion which determines how closely are related the objects in a cluster. Typical measures are the standard deviation or variance of the objects in each cluster. 24 Separation is the measure of cluster isolation which determines how distinct or well-separated a cluster is from other clusters.
Figure 10. Example of medical feature based patterns.
Figure 11. Example of grouping of medical feature based patterns
Dow
nloa
ded
by 9
5.22
8.13
7.13
0 on
Jun
e 8,
201
6 | h
ttp://
arc.
aiaa
.org
| D
OI:
10.
2514
/6.2
016-
2382

American Institute of Aeronautics and Astronautics
14
Figure 11 shows an example associated to the four observations represented in Figure 10 in the previous section. In the example the four observations are grouped into three groups, one observation each in group 1 (blue) and 2 (red) and two observations in group 3 (green).
A variety of unsupervised methods were compared including K-means, Self-Organizing Maps (SOMs) and Gaussian-mixture models. K-means is one of the simplest clustering method assigning to a same group (cluster) data that are close among each other and assigning to different groups data that are distant among each other. The method is based on a pre-defined proximity measure that quantifies the notion of “closest” for the specific data under consideration. The Self Organizing Maps (SOMs) is a clustering technique based neural networks that maps multi-dimensional data into a low-dimensional discrete space represented by the number of neurons of the SOM. A distinguishing feature of SOMs, e.g. with respect to the K-means, is that it imposes a topographic (spatial) organization to the clusters (or neurons). This means that during the training process when a data point is assigned to a neuron also the nearby neurons are updated. In other words, the neurons that are close to each other in the SOM are more closely related to each other than to the neurons that are farther away. In the end, the SOM provides a nonuniform quantization of data since this is performed according to their distribution, i.e. neurons are placed at values that are densely populated by data and correspond to the quantization levels. Gaussian Mixture Clustering includes the techniques called mixture models which model data by using a number of statistical distributions. Each distribution corresponds to a cluster, typically in terms of its center and spread. Mixture models view the data as a set of observations from a mixture of different probability distributions. The probability distributions can be any, yet are often taken as multivariate normal distributions, since this type is well understood, mathematically easy to work with and was shown to produce good results in many instances.
F. Results and discussion The panels defined in the work were investigated using different gender classes (male, female and both),
different age classes (0-25, 25-50, 50-75, 75-100, 25-100, 0-100) and a different number of clusters (2, 4, 6, 8, 9, 10, 12, 14, 15 and 16) generating over 1000 clustering iterations.
The results proved that it is possible to automatically identify groups (clusters) that may be used for diagnostic purpose to identify specific disease or to assess the overall status of a person since it is possible to separate almost completely data belonging to different groups. This reduces the uncertainty in the assignment of data to a specific pattern, i.e. increasing the reliability of the diagnosis.
Moreover the results also proved the possibility to automatically identify meaningful patterns in data without the use of any a priori knowledge which was instead used by the physicians for the validation of the patterns extraction.
These patterns can be: • recurrent in multiple panels (A, B, C…); • clearly visible only for a single panel type; • likely to correspond to specific pathologies (e.g. renal or liver failure, anaemia); • likely to correspond to healthy patients.
Finally the results also proved that the defined method may be used for the investigation of possible unknown correlations among tests. In particular this analysis could be driven by clinical markers of a specific pathology, such as heart failure, aiming at identifying patterns associated to it.
For example Figure 12 shows the patterns that were identified on a given panel by partitioning data into six groups25 on a population including male and female patients with age ranging from 25 to 50 years, including 96.363 patients totalling 174.128 panels26. The standard medical thresholds are displayed with a think black line.
The panel includes the following work orders Creatinine, White Blood Cells, Red Blood Cells, Haemoglobin, Mean Corpuscular Volume, Platelets, Glucose and Urea
The following patterns were identified and clinically validated by the physicians:
• The red pattern, characterized by very high values of Creatinine (feature number 1) and Urea (feature number 8). This group has also low values of Red Blood Cells (feature number 3) and Haemoglobin (feature number 4). The physicians recognized this pattern as associated to patients affected by renal failure (very high values of Creatinine and Urea), which is often characterized also by anaemia (low values of Red Blood Cells and Haemoglobin).
25 For each of the group a pattern is identified by the unsupervised method. 26 All accessing the AUSL Modena hospitals in the years from 2009 to 2014.
Dow
nloa
ded
by 9
5.22
8.13
7.13
0 on
Jun
e 8,
201
6 | h
ttp://
arc.
aiaa
.org
| D
OI:
10.
2514
/6.2
016-
2382

American Institute of Aeronautics and Astronautics
15
Figure 12. Patterns identified in a given panel partitioning data into six groups for patients with age between 25 and 50 years. The standard medical thresholds are shown by a thick black line.
• The green pattern, characterized by:
o Low values of Red Blood Cells and Haemoglobin
o Normal values of Mean Corpuscular Volume This pattern is associated to an anaemia due to lack of the vitamin B12, which is characterized by large Red Blood Cells.
• The blue pattern, characterized by:
o Normal values of Red Blood Cells;
o Low values of Haemoglobin and Mean Corpuscular Volume;
o Number of Platelets greater than the other patterns, even if within the standard medical thresholds.
Dow
nloa
ded
by 9
5.22
8.13
7.13
0 on
Jun
e 8,
201
6 | h
ttp://
arc.
aiaa
.org
| D
OI:
10.
2514
/6.2
016-
2382

American Institute of Aeronautics and Astronautics
16
This pattern is associated to an anaemia due to lack of iron, which is characterized by small Red Blood Cells with a consequent reduction of the Haemoglobin and the Mean Corpuscular Volume.
• The cyan, yellow and magenta patterns that may be associated to healthy patients being all characterized by work orders within the standard medical thresholds indicated by a thick black line. It is interesting to notice that the cyan pattern includes a majority of male patients (89%) while the magenta and yellow patterns include a majority of female patients (83% and 70% respectively). This confirms the fact that male and female patients are characterized by different typical values, as already known in medical practice.
It is observed that the three patterns associated with a clinical disease by the physicians (red, green and blue) are
characterized by at least one work order exceeding the standard medical thresholds. In particular, the red pattern is characterized by four work orders exceeding the thresholds while the green and blue patterns by two work orders each.
Furthermore it is also observed that these three pathological patterns are characterized by a higher percentage of internal patients, usually associated to sick persons, 93%, 52% and 41% respectively. On the opposite, the three patterns associated to healthy persons are characterized by lower percentages of internal patients (30%, 28% and 33% respectively).
Noteworthy these pathological patterns are recurrent in the several clustering iterations being detectable using also different patient age classes, different combination of patient gender and different panels.
The patterns shown in Figure 12 can be also illustrated using a pictorial representation using polygons or polar
diagrams in which each radial axis correspond to a feature (i.e. work order). This graphical representation is also known as radar chart and allows displaying multivariate data in the form of a two-dimensional chart of three or more quantitative variables represented on axes starting from the same point. The relative position and angle of the axes is typically uninformative.
The radar chart is a chart that consists of a sequence of equi-angular spokes, called radii, with each spoke representing one of the features. A line is drawn connecting the data values, associated to each pattern, for each spoke. This gives the plot a star-like appearance.
Also in this format each pattern shows a distinguishable characteristic shape.Figure 13 shows the radar chart of the patterns shown in Figure 12, where the standard medical thresholds are marked by a black dot in each axis. It is clear that the red, green and blue patterns, associated to pathological patients, are characterized by different shapes (Figure 14 left) while the three patterns associated to healthy patients (yellow, cyan and magenta) are characterized by shapes that are more similar to each other (Figure 14 right), which is ideal for anomaly detection.
Besides the identification of patterns, which may be associated to known pathologies and could be exploited for automatic diagnosis, improving also astronauts medical autonomy, the method used in the work allows also the investigation of possible unknown correlations between different laboratory data. The blue pattern in Figure 15 is an example of correlation previously unknown to physicians, as after the state of the science. This has been detected by investigating the combination of the laboratory tests including the Troponin that is a pathological marker of heart attack.
Figure 13. Radar or polar chart of the patterns shown in Figure 11.
Dow
nloa
ded
by 9
5.22
8.13
7.13
0 on
Jun
e 8,
201
6 | h
ttp://
arc.
aiaa
.org
| D
OI:
10.
2514
/6.2
016-
2382

American Institute of Aeronautics and Astronautics
17
This correlation shows that high Troponin values (feature number 10) are correlated with: • High values of the features (work orders) identified by the indexes 1, 3 and 10; • Low values of the feature (work order) identified by the index 7; • Slightly high values the feature (work order) identified by the index 8.
The physicians involved in the project commented that this is an interesting result and that the high values of the work orders identified by the indexes 1 and 10 should be further investigated since they were not aware of this correlation. This pattern was identified in 17 patients out of the 353 patients included in this investigated panel, which is therefore not occasional.
This new finding, once validated by more detailed analyses, could allow improving the interpretation of data, the diagnosis of diseases and the possible treatments.
Figure 14. Radar or polar chart of the patterns associated to pathological (left) and to healthy patients (right).
PATHOLOGICAL PATTERNS HEALTHY PATTERNS
Pattern 1 Pattern 3 Pattern 5
Pattern 2 Pattern 4 Pattern 6
Figure 15. Example of unkown correlation identified by the blue pattern. The standard medical thresholds are shown with a thick black line.
Dow
nloa
ded
by 9
5.22
8.13
7.13
0 on
Jun
e 8,
201
6 | h
ttp://
arc.
aiaa
.org
| D
OI:
10.
2514
/6.2
016-
2382

American Institute of Aeronautics and Astronautics
18
IV. Assessment of applicability to manned deep space mission The results obtained in the work both in the analysis of ECG and laboratory data proved that medical autonomy of
astronauts can be improved by the application of data mining algorithms. Therefore, the methods defined in the work could be applied to deep space missions in which astronauts might have periods without contacts with ground stations and need to face possible medical emergencies by themselves.
As concerns the applicability of the solutions defined in the work here described to manned deep space missions, it must be considered that the analysis of both ECG and laboratory data has been carried out with a broad and general character. Indeed the work adopted the so-called inter-patient approach that consists in evaluating data of a new patient according to a reference database and a model built from data from other patients. This assures a broad generality but it may limit the results because of the variability (and adaptability) of the human being, which make difficult the creation of “normal” medical references that can be exploited for the identification of pathologies of any individual.
Therefore for the applicability of these data-based techniques to build a reliable diagnostic tool for deep space missions also a different approach may be considered, referred to as intra-patient approach.
The intra-patient approach consists in evaluating data of the same patient according to a reference database and a model built from his/her own data. This allows building personal medical references that may lead to more accurate diagnosis. In this case a relevant quantity of data of that specific patient is required in order to adopt a data-centric (i.e. based on data) intra-patient approach.
This is also confirmed by the recent (2013) survey of data mining approaches for healthcare6 that reviewed the studies available in the literature on this topic. It reported accuracies that range from 45% up to 99%, according to the specific medical area addressed, proving that the results that may be achieved in the application of data mining methods to healthcare data are strongly dependent on both the dataset under investigation and on the specific topic addressed.
Indeed given that the number of astronauts is very limited and that they are under continuous health monitoring, ESA have available a large amount of health data related to each specific astronaut so making the intra-patient a viable approach.
V. Conclusions and future work Besides improving astronauts autonomy, the results of the work here presented showed that the data mining
algorithms investigated could help physicians, involved in usual clinical practice, in data interpretation supporting them in the disease diagnosis and treatment.
However, even if the achievements of the work could improve astronauts autonomy both for ECG and laboratory data analyses, as explained in the previous section, these results are deemed to have a different relevance with respect to state of the art solutions available in usual clinical practice in terrestrial technologies.
Indeed, the results obtained in the ECG data analysis do not improve the performances of available terrestrial medical tools such as the MUSE system that is able already to provide a specific suggested diagnosis of an ECG, including a variety of diagnoses and not limiting to the ones that have been considered in this work.
It must be said that this difficulty in the automatic evaluation of ECGs is known in the literature, which highlights the immense variations in the morphologies of ECG waveforms of different patients and patient groups. This unpredictability is indeed one of the major barrier preventing the use of clinical ECG processing systems7.
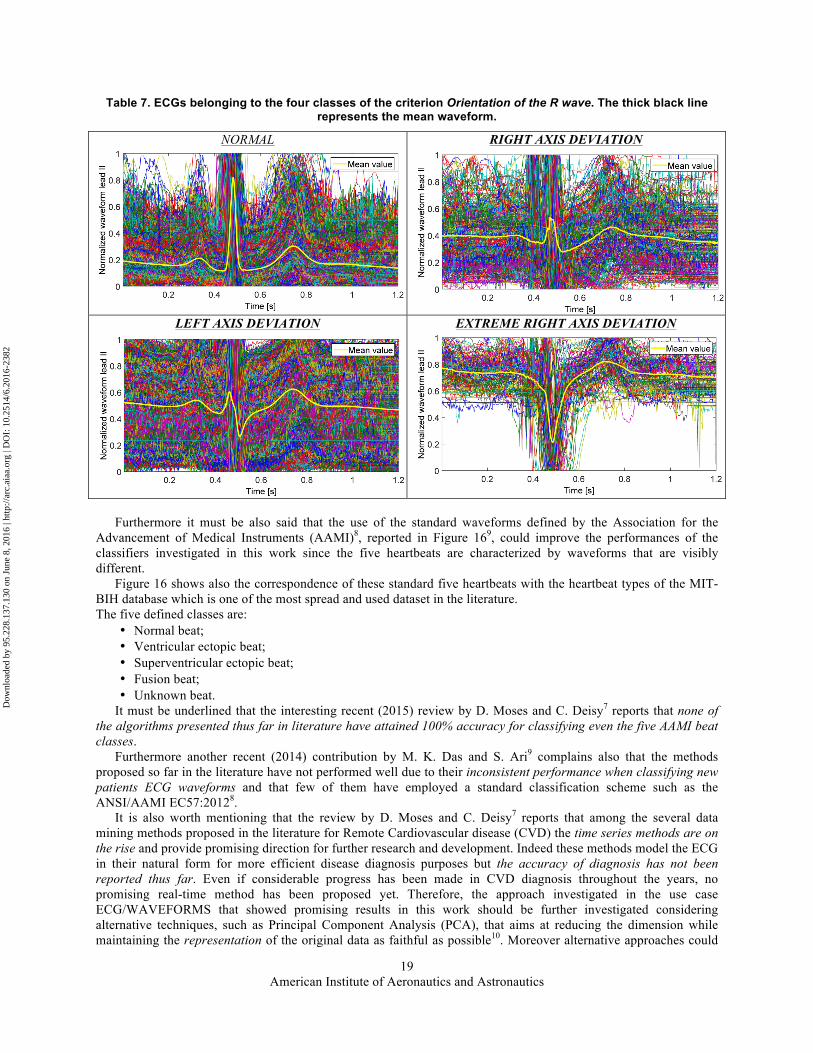
This high variability of the waveforms may be clearly seen in Table 7 where all the normalized ECGs of the 2014 of the training dataset are plotted overlapped according to their belonging to the four classes of the criterion Orientation of the R wave.
Dow
nloa
ded
by 9
5.22
8.13
7.13
0 on
Jun
e 8,
201
6 | h
ttp://
arc.
aiaa
.org
| D
OI:
10.
2514
/6.2
016-
2382
American Institute of Aeronautics and Astronautics
19
Table 7. ECGs belonging to the four classes of the criterion Orientation of the R wave. The thick black line represents the mean waveform.
NORMAL
RIGHT AXIS DEVIATION
LEFT AXIS DEVIATION
EXTREME RIGHT AXIS DEVIATION
Furthermore it must be also said that the use of the standard waveforms defined by the Association for the
Advancement of Medical Instruments (AAMI)8, reported in Figure 169, could improve the performances of the classifiers investigated in this work since the five heartbeats are characterized by waveforms that are visibly different.
Figure 16 shows also the correspondence of these standard five heartbeats with the heartbeat types of the MIT-BIH database which is one of the most spread and used dataset in the literature. The five defined classes are:
• Normal beat; • Ventricular ectopic beat; • Superventricular ectopic beat; • Fusion beat; • Unknown beat.
It must be underlined that the interesting recent (2015) review by D. Moses and C. Deisy7 reports that none of the algorithms presented thus far in literature have attained 100% accuracy for classifying even the five AAMI beat classes.
Furthermore another recent (2014) contribution by M. K. Das and S. Ari9 complains also that the methods proposed so far in the literature have not performed well due to their inconsistent performance when classifying new patients ECG waveforms and that few of them have employed a standard classification scheme such as the ANSI/AAMI EC57:20128.
It is also worth mentioning that the review by D. Moses and C. Deisy7 reports that among the several data mining methods proposed in the literature for Remote Cardiovascular disease (CVD) the time series methods are on the rise and provide promising direction for further research and development. Indeed these methods model the ECG in their natural form for more efficient disease diagnosis purposes but the accuracy of diagnosis has not been reported thus far. Even if considerable progress has been made in CVD diagnosis throughout the years, no promising real-time method has been proposed yet. Therefore, the approach investigated in the use case ECG/WAVEFORMS that showed promising results in this work should be further investigated considering alternative techniques, such as Principal Component Analysis (PCA), that aims at reducing the dimension while maintaining the representation of the original data as faithful as possible10. Moreover alternative approaches could
Dow
nloa
ded
by 9
5.22
8.13
7.13
0 on
Jun
e 8,
201
6 | h
ttp://
arc.
aiaa
.org
| D
OI:
10.
2514
/6.2
016-
2382

American Institute of Aeronautics and Astronautics
20
also foresee the possibility to combine toghether the 12 leads of the ECG which are usually analysed by the cardiologists in the qualitative approach, since, as already pointed out in the previous sections, the analysis of a reduced number of leads could worsen the results quality because useful information on the ECG traces are lost.
On the other side no general study similar to the one carried out in this work was found in the literature for the analysis of laboratory data. The majority of the contributions focus on specific pathologies such as heart diseases (accounting most of the works11), dermatological diseases12 and Liver Diseases13. An interesting and recent (August 2015) contribution14 compares clustering algorithms for predicting diseases from hemogram blood tests. The contribution uses, as input, data similar to those used in this work adopting unsupervised methods such K-mean, Fuzzy K-mean and Weighted K-mean. However the study is focused on very specific diseases since all data are related to pathological patients being affected by Leukemia, Inflammatory Disease, Bacterial or Viral Infection, HIV Infection or Pernicious Anaemia and regard a limited number of patients (524). This set is musch smaller than the medical dataset analysed in this work, with over 650,000 patients and 87,000,000 laboratory tests.
Therefore, the results achieved in this work, which were also supported by medical validation by specialized physicians, are deemed of particular relevance taking into account both the broad generality of the work and the extension of the dataset.
Indeed the relevant results obtained on the laboratory data are the following: • it is possible to automatically identify meaningful patterns without the use of any a priori knowledge, which
were validated by the physicians. For example, patterns related to renal failure, liver failure and anaemia were identified.
• these meaningful patterns highlight the presence of known correlations among clinical data, confirmed by the physicians, which demonstrated the validity of the proposed solutions (e.g. the known correlation between Creatinine and Urea in patients affected by renal failure).
Figure 16. AAMI standard waveforms and correspondence with the heart beat types of the MIT-BIH database9.
Dow
nloa
ded
by 9
5.22
8.13
7.13
0 on
Jun
e 8,
201
6 | h
ttp://
arc.
aiaa
.org
| D
OI:
10.
2514
/6.2
016-
2382
American Institute of Aeronautics and Astronautics
21
• these meaningful patterns prove to be suited for diagnostics purposes, to identify specific disease or to assess the overall status of a person since it is possible to separate almost completely data belonging to different patterns. This reduces the uncertainty in the assignment of data to a specific pattern, i.e. increasing the reliability of the diagnosis.
The results showed also that: • some laboratory tests have a different distribution according to age, gender, hospitalization status, which was
expected, but still not always considered for the definition of standard medical thresholds. • some laboratory tests have an unexpected distribution, mostly outside the standard medical thresholds, which
could be due either to a wrong definition of the standard medical thresholds, or to the methodology used during the test execution, or to a wrong test equipment set up.
The latter results proved the need to characterize laboratory data taking into account the different characteristics of a patient, such as age and gender but also other factors that have not been considered so far, such as geographic origin and race. Indeed this characterization would allow updating the standard medical thresholds that are currently used for the evaluation of the laboratory results to implement a tailored therapy improving the prevention, diagnosis and treatment of diseases. This aspect assume even greater European and worldwide importance and impact, considering the recent and ongoing massive migrations, which bring the mixing of individuals from very different origins and possible physiological “normality” differences, and the import of diseases that had disappeared in Europe long ago, in front of which the standard medical thresholds approach may fail, as also reported in hospitals practice15.
It is also worth highlighting that the laboratory physicians participating in this work underlined that usual medical research is based on a-priori hypotheses that must be verified on data. The availability of the large medical dataset pave the way to applying a non-hypothesis approach, in which the analysis of data without the application of a-priori knowledge allowed generating unknown hypotheses that have been confirmed by physicians. These unknown hypotheses may consist for example of correlation/relationships among clinical data and pathologies that can be discovered from data. These correlations were represented in the work here illustrated in the form of patterns, which were validated by the physicians associating them to specific pathologies.
In conclusion, the solutions here illustrated could be further expanded, validated and customized to enhance physicians’ ability to diagnose and treat diseases, integrating them into existing medical software, in order to help medical experts enhance the definition of the standard medical thresholds and discover new medical knowledge from data, thus improving both medical research and practice.
References 1 GE Healthcare, “MUSE™ Transactional XML Developer’s Guide, Software Version 8.0”, 2014300-082 Revision C. 2 K. J. Cios, G. W. Moore, “Uniqueness of medical data mining”, Artificial Intelligence in Medicine 26 (2002), pp. 1-24. 3 The Lewin Group Inc., “The value of Laboratory Screening and Diagnostic Tests for Prevention and Health Care
Improvement”, Prepared for American Clinical Laboratory Association and Advanced Medical Technology Association (AdvaMed), September 2009.
4 P.-N. Tan, M. Steinbach and V. Kumar, "Introduction to Data Mining", 2014, Pearson Education Limited, United Kingdom.
5 Contract N° 4000112224/14/F/MOS between S.A.T.E. and ESA on AUTOMATIC SPACECRAFT STATUS CHARACTERISATION BY DATA MINING MISSION HISTORY.
6 N.S.Nithya, K.Duraiswamy, P.Gomathy, “A Survey on Clustering Techniques in Medical Diagnosis”, International Journal of Computer Science Trends and Technology (IJCST), Vol.1, Issue 2, Nov-Dec 2013, pp. 17-22.
7 D. Moses and C. Deisy, “A survey of data mining algorithms used in cardiovascular disease diagnosis from multi-lead ECG data”, Kuwait Journal of Science, Vol. 42 Issue 2, 2015, pp. 206-235.
8 Association for the Advancement of Medical Instruments, ANSI/AAMI EC57:2012, “Testing and reporting performance results of cardiac rhythm and ST segment measurement algorithms”.
9 M. K. Das and S. Ari, “ECG Beats Classification Using Mixture of Features”, Hindawi Publishing Corporation, International Scholarly Research Notices, Vol. 2014, Article ID 178436, 12 pages.
10 J.G. Dy and C. E. Brodley, “Feature Selection for Unsupervised Learning”, Journal of Machine Learning Research 5 (2004) pp. 845-889.
11 B. Kaur and W. Singh, “Review on Heart Disease Prediction System using Data Mining Techniques”, International Journal on Recent and Innovation Trends in Computing and Communication, Vol. 2, Issue 10, October 2014.
12 E. Barati, M. Saraee, A. Mohammadi, N. Adibi and M. R. Ahamadzadeh, “A Survey on Utilization of Data Mining Approaches for Dermatological (Skin) Diseases Prediction”, Cyber Journals: Multidisciplinary Journals in Science and Technology, Journal of Selected Areas in Health Informatics (JSHI): March Edition, 2011.
13 U. Folkerts, “The Use of Cluster Analysis in Clinical Chemical Diagnosis of Liver Diseases”, Journal Clinical Chemical Clinical Biochemical, Vol. 28, 1990, Jun (6), pp. 399-406.
Dow
nloa
ded
by 9
5.22
8.13
7.13
0 on
Jun
e 8,
201
6 | h
ttp://
arc.
aiaa
.org
| D
OI:
10.
2514
/6.2
016-
2382

American Institute of Aeronautics and Astronautics
22
14 S. Vijayarani and S. Sudha, “An Efficient Clustering Algorithm for Predicting An Efficient Clustering Algorithm for Predicting”, Indian Journal of Science and Technology, Vol 8(17), 52123, August 2015.
15 JC Boyd, “Defining laboratory reference values and decision limits: populations, intervals, and interpretations”, Asian J Androl, Vol. 12, Issue 1, January 2010, pp. 83-90.
Dow
nloa
ded
by 9
5.22
8.13
7.13
0 on
Jun
e 8,
201
6 | h
ttp://
arc.
aiaa
.org
| D
OI:
10.
2514
/6.2
016-
2382