data mining applications for space mission operations ... (iverson).pdf · data mining applications...
TRANSCRIPT

Data Mining Applications for Space Mission OperationsSystem Health Monitoring
David L. Iverson*
NASA Ames Research Center, Moffett Field, California, 94035
Recent developments in data mining techniques for anomaly detection make itpossible to use the wealth of available archived spacecraft system data to produceadvanced system health monitoring applications. These “data driven” applicationsare capable of characterizing and monitoring interactions between multipleparameters and can complement existing practice to provide valuable decisionsupport for mission controllers. Data driven software tools, including Orca and theInductive Monitoring System (IMS), have been successfully applied to missionoperations for both the Space Shuttle and the International Space Station. Orca usesa nearest-neighbor approach to search for unusual data points in multivariate datasets by calculating the distance of each data point from neighboring points. The IMStool uses a data mining technique called clustering to analyze archived spacecraftdata and characterize nominal interactions between selected parameters. Thischaracterization, or model, is compared with real time or archived system data todetect off nominal behavior. Augmenting traditional mission control software withadvanced monitoring tools, such as Orca and IMS, can provide controllers withgreater insight into the health and performance of the space systems under theirwatch. We will describe how such techniques have been applied to NASA missioncontrol operations and discuss plans for future mission control system healthmonitoring software.
I. IntroductionRCHIVED spacecraft telemetry data can contain a wealth of information about complex systembehavior. Recent developments in data mining techniques for anomaly detection make it possible to
examine this archived data and extract embedded information to produce advanced system healthmonitoring applications. Such applications can aid mission controllers and engineering analysts in theirtask of ensuring that spacecraft systems under their watch are operating properly. In contrast to commonindividual parameter monitoring schemes, these “data driven” applications are capable of characterizingand monitoring interactions between multiple spacecraft parameters and can provide additional insight andvaluable decision support for controllers and engineers.
Several data driven software tools, including Orca and the Inductive Monitoring System (IMS), havebeen successfully applied to mission operations for both the Space Shuttle and the International SpaceStation. Orca1 is a data mining tool that searches for unusual data points, or outliers, in multivariate datasets by calculating the distance of each data point from neighboring points. The presence of outliers inspacecraft system data is of interest to mission controllers because they may indicate malfunctioningsystem components. The IMS tool2 uses a data mining technique called clustering to analyze archivedspacecraft data and characterize nominal interactions between selected parameters. This characterization, ormodel, of normal operation is stored in a knowledge base that can be used for real time system monitoringor analysis of archived events. Spacecraft data is compared with the nominal model built by IMS toproduce a measure of how well that data matches normal behavior captured in the training data that wasused to build the IMS knowledge base. Significant deviations from the nominal system model can alert thecontroller to a system malfunction or precursor to a significant failure.
* Computer Engineer, Intelligent Systems Division, Mail Stop 269-4
A
II. Data Mining for Mission ControlNASA maintains years of archived Space Shuttle and International Space Station telemetry data in the
Operational Data Reduction Complex (ODRC) at the Johnson Space Center (JSC). Methods from the fieldof data mining are useful for analyzing the type of data found in the ODRC and extracting informationabout typical telemetry parameter behavior and how those parameters relate to one another. In particular,recent developments in data driven anomaly detection techniques can process the data to find unusualevents, or outliers, in data for a given spacecraft subsystem. These anomaly detection techniques can alsoautomatically analyze archived nominal system data to characterize normal system performance.Comparing incoming real-time data to that nominal model can let the user know if the current systembehavior differs from previous system performance.
A. Distance-Based Anomaly DetectionOne powerful feature of many data driven anomaly detection techniques is the ability to analyze
multiple parameters simultaneously. This feature allows them to discover and model interactions betweenrelated parameters that might be difficult to notice when monitoring the parameters individually. A basicdata structure used for distance-based analysis is a vector of parameter values (Fig. 1). Vectors containingN values can be treated as points in an N-dimensional vector space. An appropriate distance metric can beused to calculate the distance between points. The familiar Euclidean distance metric has proven effectivein several applications, though other metrics may also be useful.
For system health monitoring applications, vector parameters are typically instantiated with concurrentsensor values collected from a time slice of the data stream. Additional computed (derived) or historicparameter values can be included in the vector as well. For instance, increased system insight can often beobtained by incorporating values in the vector such as the rate of change of a pressure value or thedifference between two related temperature sensors. Flight controllers and engineers familiar with themonitored system can often suggest useful telemetry and derived parameters to use in the health monitoringvectors.
An archive data set typically covers a number of dissimilar ranges for the vector parameters. Forexample, in a given data set a pressure parameter may range from 0 to 8000 kPa, while a temperatureparameter may only cover 10 to 50 degrees. This would imply that a temperature change of one degree isprobably more significant than a one kPa pressure change, since the temperature change covers a largerportion of the expected parameter range than the pressure change. Thus, data normalization within thevector is required to avoid disproportionately weighting parameters with differing ranges when calculatingdistances between vectors. One useful normalization technique represents values as a percentage of theexpected parameter range, so each vector parameter value will fall somewhere between zero and onehundred. With this normalization scheme, a 1 degree change in our example temperature data wouldtranslate to a normalized value change of 2.5%, while a 1 kPa pressure change would translate to anormalized value of 0.0125%, reflecting the greater significance of the temperature change. Another usefulmethod is a Z-score normalization using the mean and standard deviation calculated for each parameterfrom the archived data set. Z-score normalized vector values are calculated by subtracting the parametermean from the current value then dividing the difference by the standard deviation.
In some cases, it may be advantageous to increase or decrease the significance (weight) given to certainvector parameters. For instance, if maintaining a specific operating pressure is critical to a system, theweight of that pressure value could be increased so a small change in the pressure would manifest as alarger change in the associated vector parameter, increasing monitoring sensitivity to variations in thatparameter. Conversely, if the monitored system is not particularly sensitive to a certain parameter, such asambient temperature, the weight of that vector value could be decreased to reduce the chance ofunnecessary alarms when that parameter value changes by an insignificant amount.
PressureA
2857.2
Valve 1Position86.4%
PressureB
1218.4
Valve 2Position96.2%
PressureC
1104.1
Temperature149.8
Temperature237.6
Figure 1. Sample Data Vector

Each monitored system will present unique characteristics. Normalization and parameter weightingschemes can be adapted to suit the situation. Often the most effective way to determine which scheme ismost appropriate for monitoring a given system is to analyze familiar, well understood data and trycandidate normalization and weighting values until the analysis results are acceptable. If the familiar testdata is representative of typical system behavior, the normalization and weighting selected by thistechnique will usually produce reasonable results when analyzing unfamiliar data.
B. Orca Distance-Based Outlier DetectionOrca is a data mining tool that analyzes multivariate data sets.1 It uses a nearest neighbor approach for
outlier detection. For each point in the data set, Orca locates the other points in the data set that are closestto that point, called the point’s nearest neighbors. Distance between points is measured with the Euclideandistance measure for continuous parameters and the Hamming distance for discrete parameters. Theprogram outputs a score for each point representing the average distance to the nearest k neighbors in thedata set. The value of k is specified by the user. Points that have a larger average distance to their nearestneighbors than most other points in the data set are considered outliers. Orca is able to find outliers within asingle data set, or compare one data set with another to determine which points in the first data set areunusual in comparison to the second set.
One approach to using Orca with spacecraft telemetry is to form data vectors, as described previously,using sensor values from a given spacecraft subsystem and search for outliers among those vectors. Forinstance, vectors could be formed from temperature, pressure, and fuel flow rates in a rocket engine. AnOrca analysis of this data set can locate data from time periods during the engine firing that display unusualcharacteristics compared with the rest of the data. Unusual data points may be symptoms of enginemalfunctions, such as a faulty pressure regulator or an incorrect fuel-oxidizer mixture ratio.
C. IMS: Inductive Monitoring SystemThe Inductive Monitoring System (IMS) is a tool that uses a data mining technique called clustering to
extract models of normal system operation from archived data.2 Like Orca, IMS works with vectors of datavalues. IMS analyzes data collected during periods of normal system operation to build a system model. Itcharacterizes how the parameters relate to one another during normal operation by finding areas in thevector space where nominal data tends to fall. These areas are called nominal operating regions andcorrespond to clusters of similar points found by the IMS clustering algorithm. These nominal operatingregions are stored in a knowledge base that IMS uses for real-time telemetry monitoring or archived dataanalysis.
During the monitoring operation, IMS reads real-time or archived data values, formats them into thepredefined vector structure, and searches the knowledge base of nominal operating regions to see how wellthe new data fits the nominal system characterization. For each input vector, IMS returns the distance thatvector falls from the nearest nominal operating region. Data that matches the normal training data well willhave a deviation distance of zero. If one or more of the data parameters is slightly outside of expectedvalues, a small non-zero result is returned. As incoming data deviates further from the normal system data,indicating a possible malfunction, IMS will return a higher deviation value to alert users of the anomaly.IMS also calculates the contribution of each individual parameter to the overall deviation, which can helpisolate the cause of the anomaly.
III. Mission Control ApplicationsThe Orca and IMS software tools have both been applied in NASA mission control to support real-time
telemetry monitoring and engineering analysis of mission data. In support of the Johnson Space Center(JSC) Mission Evaluation Room (MER) engineering analysis activity, the tools were applied to data fromthe Space Shuttle Wing Leading Edge Impact Detection System (WLEIDS) to find potential impactsignatures. In the International Space Station (ISS) flight control room they have been used to build real-time health monitoring applications for the ISS Control Moment Gyroscopes. Applications for real-timemonitoring of ISS thermal control systems are currently under development.
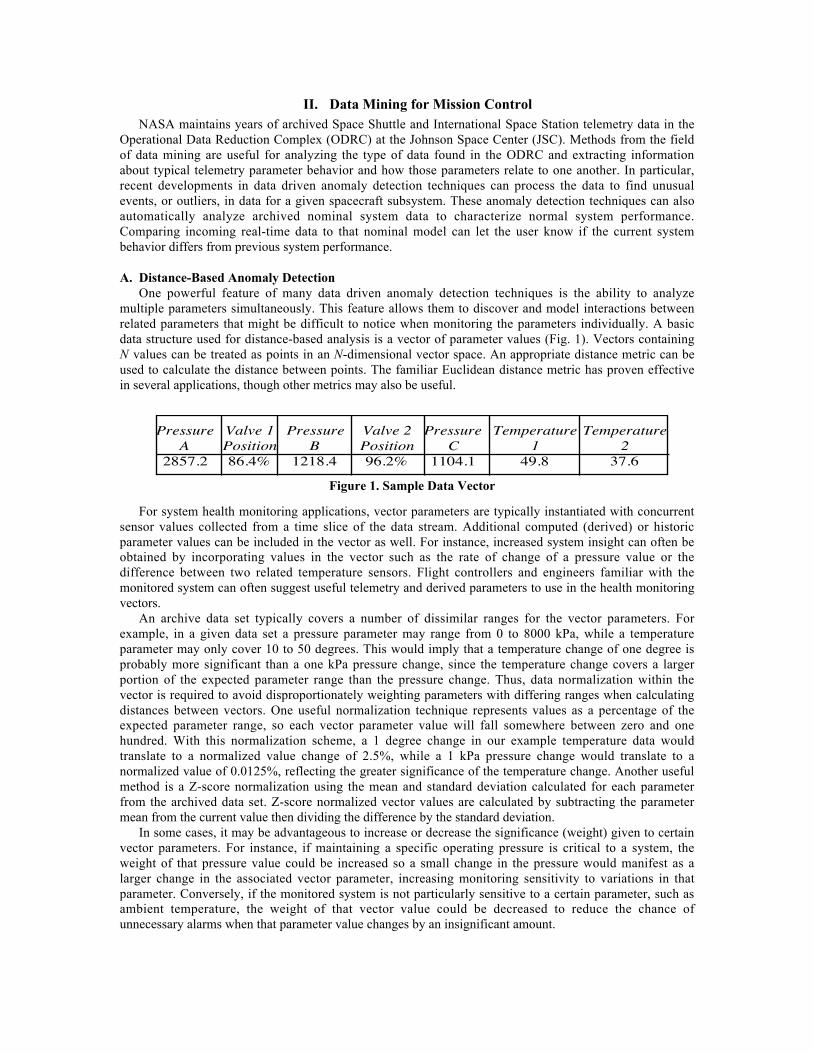
A. Space Shuttle Wing Leading Edge Impact Detection SystemThe Space Shuttle WLEID system was developed in response to the loss of the Columbia orbiter on the
STS-107 mission. During the launch of STS-107 a piece of foam shed from the Shuttle external fuel tank
struck the leading edge of the orbiter’s left wing, compromising the thermal protection system. Thisdamage resulted in the tragic loss of vehicle and crew during reentry due to overheating and failure of theinternal wing structure.3
The WLEIDS consists of 132 single axis accelerometers mounted along the length of the orbiter’sleading edge wing spars (Fig. 2). During launch, the accelerometers collect data at a rate of 20 kHz andstore that data onboard for subsequent downlink to Mission Control. Within 6 to 8 hours of launch,summary files containing periodic sub-samples of the data collected by each accelerometer are down linkedto the MER for analysis to find potential impact signatures. This analysis must be completed within 24 to48 hours of the launch so the results can be used to schedule detailed on-orbit wing leading edgeinspections using cameras mounted on the Shuttle robotic arm.
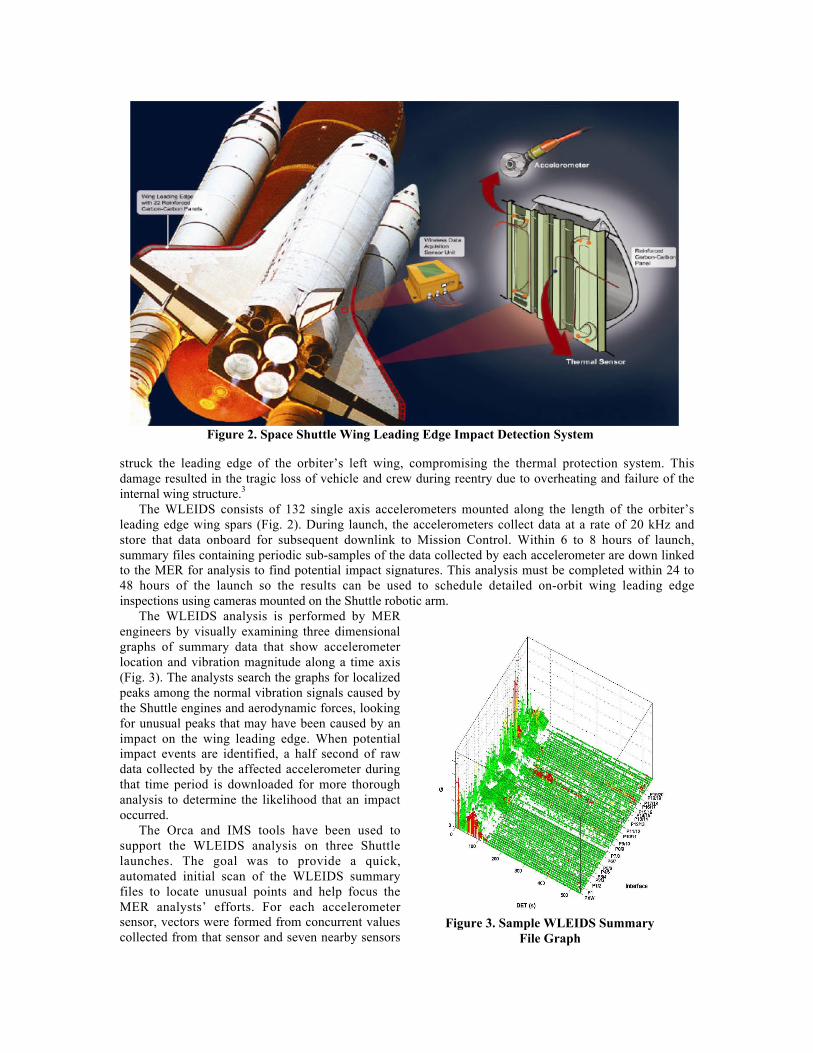
The WLEIDS analysis is performed by MERengineers by visually examining three dimensionalgraphs of summary data that show accelerometerlocation and vibration magnitude along a time axis(Fig. 3). The analysts search the graphs for localizedpeaks among the normal vibration signals caused bythe Shuttle engines and aerodynamic forces, lookingfor unusual peaks that may have been caused by animpact on the wing leading edge. When potentialimpact events are identified, a half second of rawdata collected by the affected accelerometer duringthat time period is downloaded for more thoroughanalysis to determine the likelihood that an impactoccurred.
The Orca and IMS tools have been used tosupport the WLEIDS analysis on three Shuttlelaunches. The goal was to provide a quick,automated initial scan of the WLEIDS summaryfiles to locate unusual points and help focus theMER analysts’ efforts. For each accelerometersensor, vectors were formed from concurrent valuescollected from that sensor and seven nearby sensors
Figure 2. Space Shuttle Wing Leading Edge Impact Detection System
Figure 3. Sample WLEIDS SummaryFile Graph

that might pick up radiating impact energy (Fig.4). Prior to the launch, IMS was used to analyzenormal data from previous launches tocharacterize typical vibration patterns for eachgroup of accelerometers. Data from the currentlaunch is compared to this characterization toidentify unusual vibration patterns that mighthave been caused by impact events. Orca is usedto search for outliers within the data collectedduring the current launch.
To gauge the effectiveness of the data mining tools, we compared Orca and IMS results to visualWLEIDS summary file analysis performed by MER engineers on the STS-115 launch of Space ShuttleAtlantis. The analysts classified the events they identified as critical, probable, or questionable based on thelikelihood that the data signature was caused by an impact. Their analysis of the STS-115 launch WLEIDSsummary data produced 6 critical events, 23 probable events, and 2 questionable events. The Orca analysisplaced all critical events in the top 50 outliers. IMS identified 334 interesting events, divided nearly evenlybetween the two wings. Those events included all 6 critical events, 18 of 23 probable events, and all of thequestionable events found by the MER analysts. Most of the anomalies identified by Orca and IMS thatwere not noted by analysts could be eliminated as normal global vibrations that shook the entire vehicle,leaving a small subset that included the events of interest. A technique to automatically identify and removethose global vibration events was later developed. Additionally, during all launches where Orca and IMShave been used, the tools identified several lower energy vibration signatures that did not stand out in thevisual data inspection. These events were investigated with raw WLEIDS data downloads from the affectedsensors. Fortunately all of the potential impact events identified in the WLEIDS data were shown to be theresult of non-damaging phenomena, such as aerodynamic events, sensor data spikes, or minor impacts, andall missions concluded with safe and uneventful reentry and landing.
B. ISS Control Moment GyroscopesThe International Space Station (ISS) Control Moment Gyroscope (CMG) attitude control system
consists of four large gyroscopes, each mounted in a gimbal system that can rotate the CMG about the twoaxes perpendicular to the gyroscope spin axis (Fig. 5). The CMGs operate as non-propulsive attitudecontrol devices that exchange momentum with the ISS through induced gyroscopic torques.
As they have aged, some of the CMGs havedegraded enough to malfunction and requirereplacement. A failed CMG1 was replaced with a newunit in July 2005, and a faulty CMG3 was replaced inAugust 2007. Given their history, the ISS AttitudeDetermination and Control Officer (ADCO) flightcontrollers are interested in detecting early symptoms ofdegradation in the CMGs. A deployment of data drivensystem health monitoring applications in the ISS flightcontrol room is assisting with that task.
Working with the ADCO flight controllers, 13 CMGparameters were selected for real time monitoring. Theseparameters include CMG vibration, bearingtemperatures, rotation speed, gimbal rates, electricalcurrent, and ISS rotation rates, along with derivedparameters for rates of change of temperatures andelectrical current. Archived data collected over a periodof 10 months for CMG1, 2, and 4 was analyzed. Sevenmonths of data was analyzed for the recently installed CMG3. The data was sampled at a 1 Hz rate andformed into vectors of 13 values. The vectors were normalized using a variation of the Z-score methoddescribed previously. Each CMG was analyzed individually to capture its unique characteristics.
Because IMS was trained strictly on nominal data, the first operation with the CMG data was removalof any anomalies from the archived data. This was accomplished by searching for outliers within each dataset using the Orca tool. Data records with significant deviations relative to the remainder of the data for that
Figure 4. WLEIDS Analysis Sensor Selectionon Shuttle Wing Leading Edge Panels
Figure 5. ISS Control Moment Gyroscopes

CMG were removed. These deviations were typically caused by data corruption or minor anomalies inCMG operation. Once the archived CMG data had gone through this cleaning process, the remainingnominal data was used by IMS to build a monitoring knowledge base for each CMG.
To test the IMS CMG monitoring on a known anomaly, a similar process was performed using archiveddata from 2002 when CMG1 experienced a major failure. CMG1 exhibited increasing vibration levels thatdamaged a gyroscope spin bearing, prompting controllers to shut it down for safety. The redundant CMGswere able to maintain ISS attitude control without any issues. To test IMS effectiveness on this event, anIMS monitoring knowledge base was constructed from a month of archived nominal data collected prior tothe CMG1 failure. The experiment used the same parameters, normalization, and weighting as the deployedIMS CMG monitoring systems. The results are shown in Fig. 6, plotting time on the horizontal axis andIMS results on the vertical axis. Recall that IMS outputs a measure of the distance from expected normalsystem behavior. Lower values indicate the system is behaving as expected. Increasing IMS values indicatethe monitored system is deviating from expected behavior, possibly due to a system fault. In this case, IMSbegan indicating anomalous behavior more than 14 hours in advance of the eventual CMG1 failure. Theseand other similar results showed the value of using data driven anomaly detection methods to providesystem health awareness and decision support for flight controllers.
The IMS monitoring application was integrated with the NASA Mission Control data server software toaccess real-time telemetry in the ISS flight control room. Four IMS processes, one per CMG, are run on theADCO flight control console to provide continuous monitoring. Once per second, when data is available,each IMS process will query the appropriate CMG knowledge base and return the amount of overalldeviation, if any, from the nominal training data. It will also return the contribution of each individualparameter to any deviation to aid in isolating the source of any deviation. These IMS results are publishedback to the data stream for access and monitoring by other Mission Control software applications.
C. ISS Early External Thermal Control SystemA study similar to the CMG1 analysis was performed using data from the ISS Early External Thermal
Control System (EETCS). The EETCS was used to dissipate heat onboard ISS. Excess thermal energy frominside the ISS was transferred to liquid ammonia cooling loops in the EETCS. The heated ammonia wasthen circulated to radiators and cooled as thermal energy was released into space.
The EETCS included accumulators, which are containers that compensate for the expansion andcontraction of ammonia due to temperature variation and also keep the ammonia in a liquid state viapressure regulation.4 As documented in a January 2007 ISS anomaly report, the EETCS experiencedconditions that resulted in increasing accumulator quantity sensor values for approximately 9 hours,followed by a sudden drop in accumulator quantities. The anomaly report states that symptoms of this eventwere noticed by mission controllers on the morning of January 9, 2007. After the fact, it was determinedthat the root cause was the formation of a bubble of gaseous ammonia within the normally liquid EETCS
2002 Day of Year
IMS
Dis
tanc
e fro
m N
omin
al Primary cause of deviations are high vibration withcontributions from increased electrical current draw
CMG1 Failureand Spin Downat 14:56 GMT
Figure 6: IMS monitoring results prior to CMG1 failure

ammonia fluid loop. As the bubble grew, it appeared that accumulator quantities were increasing. Thesudden drop in accumulator quantities occurred when the gaseous ammonia bubble essentially popped anddissipated back into the liquid ammonia. Although this ammonia bubble incident fell outside of normalEETCS operating conditions, there was no significant impact to ISS thermal control capabilities.
To see how a data driven monitoring system would react to the ammonia bubble event, archived datafor 23 EETCS parameters was obtained from the time period surrounding the event. These parametersincluded EETCS pressures, temperatures, accumulator quantities, and pump speeds. 185 days of datacollected between June and December 2006 were normalized with the Z-score technique and used to buildan IMS monitoring knowledge base. This knowledge base was used to analyze data from January 1 throughJanuary 9, 2007, the day the anomaly was reported. It can be seen in the results graph (Fig. 7) that the IMSanalysis detected the first signs of the anomaly near the end of day 2. As the ammonia bubble grew, theIMS deviation value steadily increased, until the bubble popped on the afternoon of day 9. (The large IMSspike on day 6 was caused by commanded temperature set point changes that briefly perturbed theEETCS.)
This EETCS study is another demonstration that data driven anomaly detection can be an effective toolfor space operations. In this case, as in the CMG1 example, the data driven monitoring process was able todetect unusual parameter interactions early in the life of the anomalous event. Such timely information onunusual system behavior can be a useful decision aid for mission operations personnel as they monitor thehealth of their spacecraft systems.
IV. Summary and Future WorkThrough practical application, it has been demonstrated that data driven system health monitoring can
be useful in a space mission operations setting. Many spacecraft have extensive archives of telemetry dataavailable that can be advantageously exploited by data mining methods. Two data mining tools, Orca andthe Inductive Monitoring System (IMS), have been used to analyze data from the Space Shuttle andInternational Space Station to search for anomalous data points that could be indications of a system faultor damage to the spacecraft. Providing information on possible system anomalies in a timely mannerprovides controllers and mission support engineers with helpful information for decision support andenables more efficient and effective execution of their duties. The examples covered here and other similarexperiments have shown the ability of these data driven anomaly detection techniques to characterizenominal interactions between multiple system parameters. This ability allows them to detect subtleanomalous parameter interactions that may not be apparent in more traditional single parameter datamonitoring tools that are frequently used in space operations settings.
The utility and effectiveness of data driven system health monitoring methods have been demonstratedin three disciplines in NASA mission control, but the applications are not limited to just these examples.There are many areas with rich archived data repositories where these and similar techniques can beapplied. Mission controllers from several additional ISS disciplines, including power management,communications, and life support, have expressed interest in developing similar system monitoringcapability. Now that the software has been integrated with Mission Control data systems, expansion of the
Figure 7. IMS monitoring results for EETCS ammonia bubble event

capability is primarily a matter of identifying relevant parameters to monitor and performing the archiveddata analysis. Following the successful demonstration of data driven tools, as described here, work hasbegun to develop real-time monitoring capability for ISS thermal control systems.
Eventually we plan to develop tools that allow mission control personnel to build and maintain theirown data driven monitoring applications. Controllers will be able to specify which parameters to monitor,what time periods to include in the nominal training data, and any computations that should be performedon the raw telemetry data. The tool set will retrieve the desired archived training data, remove spurious datapoints using outlier detection, and build a new monitoring knowledge base and an appropriate monitoringapplication configuration to run on their control console.
A useful enhancement to the current monitoring software would be the ability to automatically detectoperating mode changes in the monitored system and switch to a targeted monitoring knowledge basedeveloped specifically for that mode. For instance, the ISS is flown in different orientations andconfigurations during different mission phases. The behavior of the CMGs can differ in the variousconfigurations. Rather than building one large knowledge base per CMG that covers all cases, as in thecurrent deployment, a separate knowledge base could be built from archived data collected during each ISSconfiguration, then consulted for real-time monitoring when the ISS is in that configuration. This wouldprovide more accurate and efficient monitoring capability.
Another application of data driven monitoring to explore is the use of supervised learning methods tohelp identify fault signatures. If examples of fault behavior are available in the archived data, supervisedlearning algorithms, such as decision tree or support vector machine based techniques, may be able toanalyze the data and distinguish between different types of fault behavior and normal operation. If themonitored system exhibits unusual behavior, fault characterizations from the supervised learning algorithmcould help controllers identify the cause of the anomaly. These techniques could allow automated faultidentification in cases that are too complex to be encoded using simpler schemes.
AcknowledgmentsThe author would like to thank the following collaborators who directly supported and contributed to
the development and deployment of the mission control software described in this paper: From NASAAmes Research Center – Rick Alena, Charles Lee (EASI), Dawn McIntosh, Mark Schwabacher, LillySpirkovska, and William Taylor. From NASA Johnson Space Center – Christopher Craw (USA), TatianaDobrinskaya (USA), Ann Esbeck (USA), Jeff Fitch (USA), Tammy Gafka, Andrew Hillin (USA), JoshuaJohnson, Keith Martin (TSI), Charles McCann, and James McCarroll (USA). Funding for this work wasprovided by the NASA Exploration Technology Development Program (ETDP) Integrated Systems HealthManagement project and the NASA Exploration Systems Mission Directorate (ESMD) ConstellationMission Operations project.
References1Bay, S. D., and Schwabacher, M., “Mining Distance-Based Outliers in Near Linear Time with Randomization and
a Simple Pruning Rule,” Proceedings of The Ninth ACM SIGKDD International Conference on Knowledge Discoveryand Data Mining, 2003.
2Iverson, D. L., “Inductive System Health Monitoring,” Proceedings of The 2004 International Conference onArtificial Intelligence (IC-AI04), CSREA, Las Vegas, Nevada, June 2004.
3Columbia Accident Investigation Board Report, Volume 1, NASA, August 2003.4International Space Station Thermal Control System Training Manual, NASA Document ISS TCS TM 21109,
January 2004.5Schwabacher, M., Oza, N., and Matthews, B., “Unsupervised Anomaly Detection for Liquid-Fueled Rocket
Propulsion Health Monitoring,” Proceedings of the AIAA Infotech@Aerospace Conference, AIAA, Reston, VA, 2007.6Martin, R. A., Schwabacher, M., Oza, N., and Srivastava, A., “Comparison of Unsupervised Anomaly Detection
Methods for Systems Health Management Using Space Shuttle Main Engine Data,” Proceedings of the JANNAFPropulsion Meeting, JANNAF, Denver, CO, 2007.