data maturity curvepages.periscopedata.com › rs › 299-awk-445 › images › pd-guide...the five...
TRANSCRIPT
Data Maturity CurveHow Companies of All Sizes Can Use Data for Business Impact
2019
03
Dat
a M
atur
ity C
urve
H
ow C
ompa
nies
of A
ll Si
zes
C
an U
se D
ata
for
Bus
ines
s Im
pact
Content3 Introduction: What is Data Maturity? 4 The 5 Stages of Data Maturity 1. Business Reporting
2. Business Intelligence
3. Ad Hoc Analysis/Insights
4. Hybrid Centralized Data Teams
5. Predictive Analytics and Machine Learning
7 Determining Your Data Maturity
9 How to Advance to the Next Stage of Data Maturity
14 Conclusion
Periscope Data: Data Maturity Curve | How Companies of All Sizes Can Use Data for Business Impact 2

Answering questions with data is not a new idea, but modern methods and techniques for answering questions with large amounts of loosely related data are certainly novel, evolving rapidly and spreading widely. Companies across the world are at different stages of experimenting with data and realizing what kinds of decisions can be made via deep analysis. Since these trials and realizations are happening at differing speeds, and often start from scratch within each organization, there are significant disparities in maturity between otherwise similar organizations. We are in a period of widespread change in the role of data professionals. Instead of being an IT-owned resource for backward-facing reporting, data is evolving into an independent resource for making intelligent, forward-looking predictions and recommendations.
The Growing Importance of Data Analysts Not even five years ago, data analysts were responsible for a limited range of tasks: modeling predictable data for sales or marketing, building star schemas to enable visual-based data discovery tools, policing business logic, etc. Today, the same people are in charge of curating a single source of truth for the company, flagging abnormalities in data, applying machine learning to find patterns in data, performing exploratory data analysis to answer ad hoc questions, empowering other analysts embedded in individual business units and a lot more. Part of this new range of responsibilities is the creation of full-time data teams, staffed by a generation of highly educated data scientists, analysts and engineers.
What’s behind the change? Part of the story is that compute and storage technology has improved, making powerful analytical tools available to more people without the stringent limitations of previous generations of database technology. Another part of the story is that companies are learning to compete using data, mining their datasets for insights that will move them ahead of their competitors.
Data Innovators Have a Competitive Edge Early data innovators are already proving to be dominant in their industries. Companies like AirBnb, Uber and Netflix take data so seriously that it’s more accurate to call them data companies than to consider them traditional competitors in the hospitality, transportation or entertainment industries. Using data to tune business models precisely for their markets, they are storming past the competition.
As the developer of a data platform, every day we deal with companies that are in all stages of their data journey. Some are just realizing that they need to combine all of their data sources into one place, while others are running advanced queries in Python or preparing data for predictive machine learning models.
What is Data Maturity?
Periscope Data: Data Maturity Curve | How Companies of All Sizes Can Use Data for Business Impact 3
At Periscope Data, we have a unique perspective from which to observe the progress that data teams worldwide are collectively making.
From that bird’s eye view, we’ve been mapping the evolution of data teams and data operations. Our goal is to use these observations about the industry in general and successful data companies in specific to create a continuum of data usage that serves as both a diagnostic and prescriptive tool for future-looking businesses.
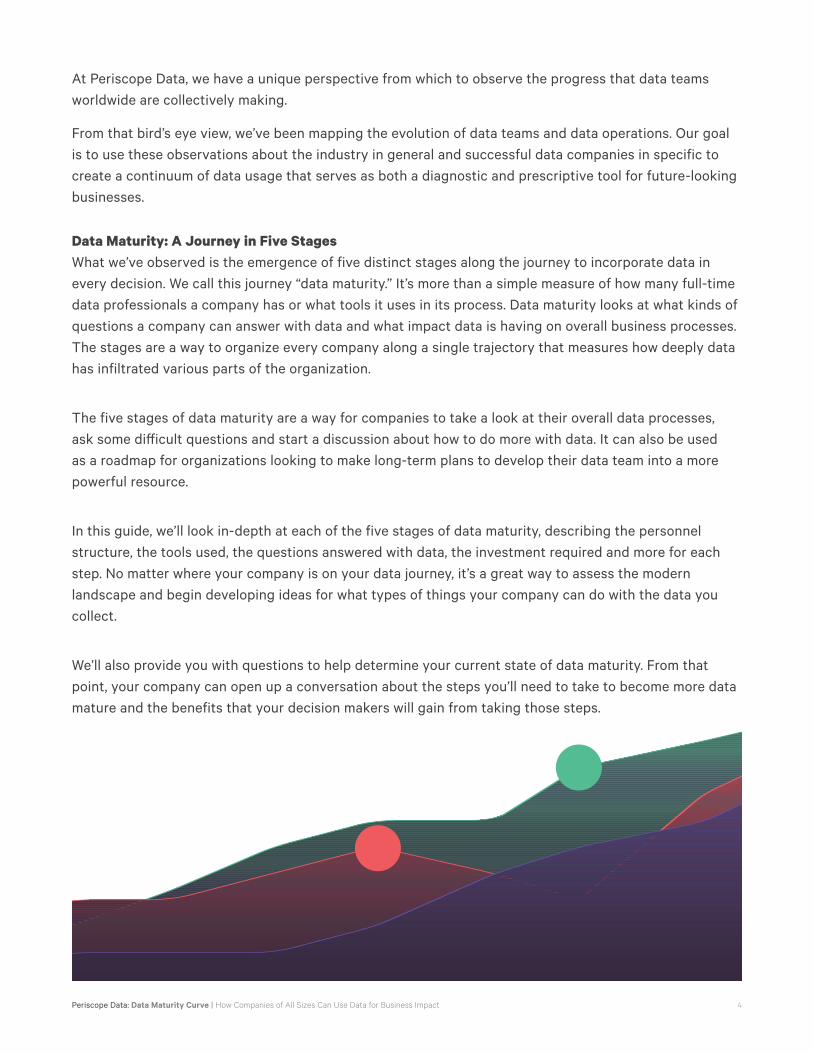
Data Maturity: A Journey in Five Stages What we’ve observed is the emergence of five distinct stages along the journey to incorporate data in every decision. We call this journey “data maturity.” It’s more than a simple measure of how many full-time data professionals a company has or what tools it uses in its process. Data maturity looks at what kinds of questions a company can answer with data and what impact data is having on overall business processes. The stages are a way to organize every company along a single trajectory that measures how deeply data has infiltrated various parts of the organization.
The five stages of data maturity are a way for companies to take a look at their overall data processes, ask some difficult questions and start a discussion about how to do more with data. It can also be used as a roadmap for organizations looking to make long-term plans to develop their data team into a more powerful resource.
In this guide, we’ll look in-depth at each of the five stages of data maturity, describing the personnel structure, the tools used, the questions answered with data, the investment required and more for each step. No matter where your company is on your data journey, it’s a great way to assess the modern landscape and begin developing ideas for what types of things your company can do with the data you collect.
We’ll also provide you with questions to help determine your current state of data maturity. From that point, your company can open up a conversation about the steps you’ll need to take to become more data mature and the benefits that your decision makers will gain from taking those steps.
Periscope Data: Data Maturity Curve | How Companies of All Sizes Can Use Data for Business Impact 4
The 5 Stages of Data Maturity
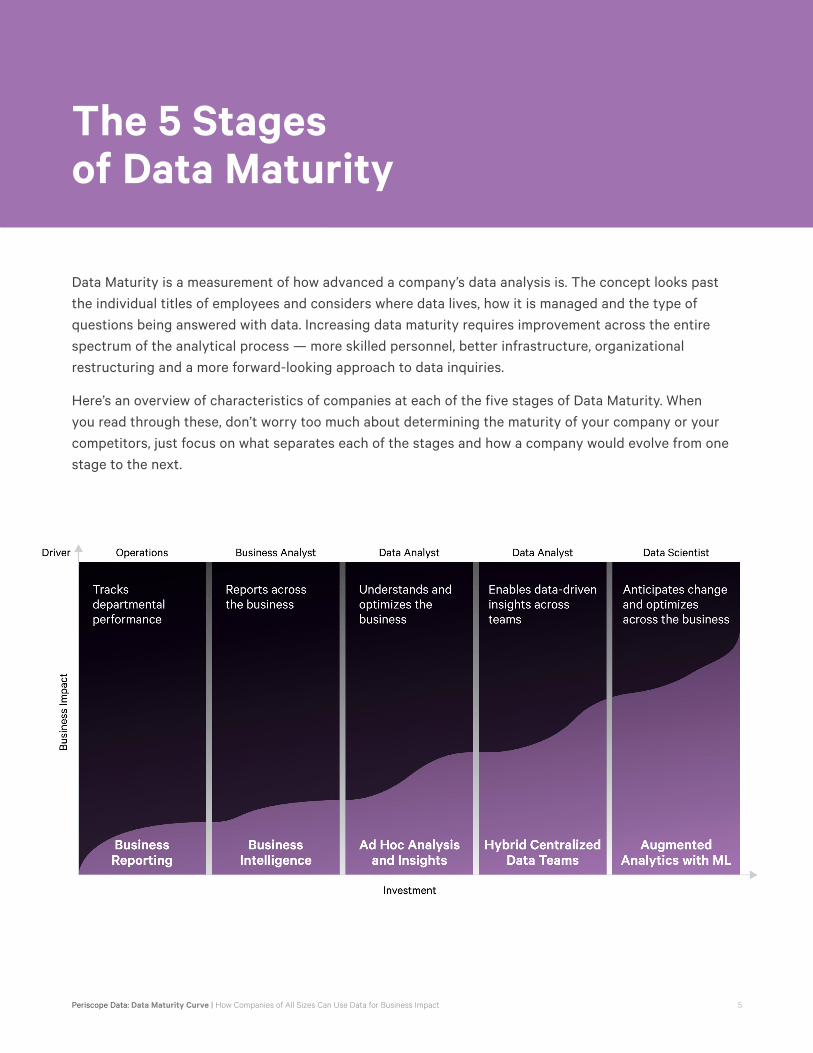
Data Maturity is a measurement of how advanced a company’s data analysis is. The concept looks past the individual titles of employees and considers where data lives, how it is managed and the type of questions being answered with data. Increasing data maturity requires improvement across the entire spectrum of the analytical process — more skilled personnel, better infrastructure, organizational restructuring and a more forward-looking approach to data inquiries.
Here’s an overview of characteristics of companies at each of the five stages of Data Maturity. When you read through these, don’t worry too much about determining the maturity of your company or your competitors, just focus on what separates each of the stages and how a company would evolve from one stage to the next.
Periscope Data: Data Maturity Curve | How Companies of All Sizes Can Use Data for Business Impact 5
• Siloed system of record reporting • Canned SFDC / GA reports • Merge data in offline spreadsheets rather than a data platform • On-demand reports only, no automated reporting • Can report on siloed data (Salesforce, GA, FB, Marketo, etc) • Business rules are consistent inside a single silo (Salesforce, for example) but not across silos• Exclusively deals with backward-looking, descriptive data
This stage is the beginning of any company’s data journey. A lot of mom-and-pop shops and early-stage startups are here. They’ve recognized the need to collect data for their records, but haven’t built any kind of structure to do serious analysis of that data, likely because they don’t need to. Stage 1 companies export their Salesforce or Marketo data and keep it siloed in a series of spreadsheets on a local device rather than blend it together for cross-functional analysis in a data platform.
Business Reporting 1
• Standardized datasets • Reporting in one place • Refresh cadence • Sales and Marketing data sources connected, aggregated • Business logic lives on the report • ETL and warehousing based on data volume • Exclusively deals with backward-looking, descriptive data
By Stage 2, companies have blended data together into a single warehouse. The result is a tool that allows them to get a more holistic view of their data and see a bigger picture emerge. The business questions being asked now can go beyond “what were sales last quarter?” to something like “how did the marketing campaigns from last quarter affect sales?” Stage 2 companies don’t have one source for their Salesforce data and another source for the Google Analytics data, etc. They have one source for all of their data.
Business Intelligence
Periscope Data: Data Maturity Curve | How Companies of All Sizes Can Use Data for Business Impact 6
2

Ad Hoc Analysis/Insights
• Reporting is sophisticated enough for investigative analysis and rapid model development • Data connected across sources, analytics environment abstracted from origin tables • Centralized business definitions in a warehouse / model • Retain ability to query across modeled and unmodeled data • Warehousing is essential at this phase, data lakes are useful • Beginning to do diagnostic analysis, moving past recording a spike in data into pinpointing the cause of
that spike
As companies advances from Stage 2 to Stage 3, they’re gaining more autonomy in the analytical question-and-answer process. Before, they could access information that their data sources had thought to build answers to, but couldn’t ask their own unique questions. That ability is a hallmark of Stage 3. It’s really important at this point that a company has an independent data team with personnel sophisticated enough to use SQL, Python or R to create their own data models.
At this stage of maturity, it’s natural that companies start to have conversations about data democratization. The concept of data democratization is an important conversation for every company to have and can be a great way to extend the reach of insights from the first two stages. But it’s important to remember that without having centralized business definitions in a warehouse or model, data democratization efforts will perpetuate the fragmented, siloed spread of data throughout the organization.
• Data landscape is holistic — business rules are versioned and managed • Central teams define systems and methods, embedded analysts provide specific value • Business model relies on harmonized data across product, sales, success, marketing and ops • Data has CXO-level representation and visibility, business-critical • Starts to analyze predictive data
By Stage 4, data analysis is sophisticated enough that it is a regular part of every team’s routine operations at a company. The demand for data is high and it’s vital to find a way to prioritize requests to make the most of the data team’s resources. At this stage, there’s a shift in organizational structure to a hybrid model. The centralized data team still exists as a means of collecting information into a single source of truth and building sound data models, but we start to see individual analysts embedded in different business functions who are in charge of answering questions specific to that line of business.
While maturation from Stage 3 to Stage 4 is marked by personnel changes, it also requires a lot more from tools and technology. There are now requirements around governance and engineering that didn’t previously exist. There are now several additional steps in the overall data analysis process, but the result is a flexible, scalable data function that can answer several pressing business questions at once.
Hybrid Centralized Data Teams 4
Periscope Data: Data Maturity Curve | How Companies of All Sizes Can Use Data for Business Impact 7
3
• Business forecasting and planning operates on projected data • Online models have product and business ops impacts • Offline models used to manage and mitigate negative business dynamics • Data lakes are required • Regularly using predictive and prescriptive data to make decisions
Stage 5 is for the most cutting-edge data operations. They have the technology and the tools to answer questions that other companies aren’t even considering yet. They’re analyzing information that they’re seeing right now as a way to make decisions about future products, markets, customers, staff, etc. At this stage, companies are investing in more than just how they run their business well, they’re looking at how to make fundamental improvements to the company based on sophisticated data models.
It’s important to note that each stage of the data maturity model takes significantly more time and resources to attain. Becoming more data mature requires a heavy investment in technology and people. It’s important to manage your own expectations and be realistic about the value that you’re getting from these investments and when you’ll reap the rewards.
Predictive Analytics and Machine Learning 5
Periscope Data: Data Maturity Curve | How Companies of All Sizes Can Use Data for Business Impact 8

Determining Your Data Maturity
Now that you know about the stages, it’s time to examine your own data process and determine how mature you are. The way to do this is to answer a series of questions. When considering your answers to these questions, be as honest as possible. It’s good to have aspirations to make your team more mature with its use of data, but you can’t skip steps in this maturation process.
On the next page is a series of questions about your data achievements. Start at the beginning and answer each question with either a yes or a no. If you answer yes, keep advancing. If you answer no to a question, stop advancing and take a note of where you are in the list.
Your company’s data maturity is the last stage where you can answer yes to every question. For example, if you answer yes to the first four questions and no to the fifth, you’re in Stage 2 of data maturity. The later questions provide a glimpse into where your data team will go as it becomes more mature.
If you answer yes to some questions in a stage, but not all of them, then you’re on the right track to attaining that level of data maturity, but you’re not there yet. For example, if your first no comes at the seventh question, you’re still at Stage 2 of data maturity, but you’re close to attaining Stage 3.
Periscope Data: Data Maturity Curve | How Companies of All Sizes Can Use Data for Business Impact 9

Assess Your Data Maturity
How It WorksAnswer the following questions in order. The last question you can answer “yes” to determines where you fall on the data maturity curve.
Stage 1 Business Reporting
Stage 2 Business
Intelligence
Stage 3 Ad Hoc Analysis
and Insights
Stage 4 Hybrid Centralized
Data Teams
Stage 5 Augmented
Analytics with ML
Do you use different platforms to report on different business functions?
Do you have a single source of truth for sales and marketing?
Can your analysts blend modeled data with raw data from multiple sources?
Do you have a governed single source of truth for 90%+ of your data?
Do you have model management and productization capabilities?
qYes qNo qYes qNo qYes qNo qYes qNo qYes qNo
Do your analytics tools need integrations with lots of business applications?
Do you have a single reporting platform?
Do you have associated data from all phases of the customer journey?
Does everyone have appropriate access to data?
Do analysts use data to train and evaluate machine learning models?
qYes qNo qYes qNo qYes qNo qYes qNo qYes qNo
Do you blend data from multiple sources into a warehouse?
Do business units hire their own analysts who use data and tools provided by a central team?
qYes qNo qYes qNo
With a clear understanding of where your company falls on the data maturity spectrum, it’s time to start thinking about the tactics you can take to improve. In the final section, we’ll cover steps you can take that will increase the maturity of your team further.
As you think about what types of personnel and tool changes you need to make to increase your data maturity, it’s also vital to think about the new types of value your data can provide as you improve your data processes. As you build a plan to mature with your data, think about the questions your data can answer today and the questions you’d like to be able to answer next.
10Periscope Data: Data Maturity Curve | How Companies of All Sizes Can Use Data for Business Impact
Identifying your company’s current stage of data maturity is important, but it’s even more vital that you put that realization into practice by creating a plan to continue maturing. The stages that we’ve outlined follow a linear progression with simple, common-sense tactics to advance from one to the other.
No matter which stage you’ve identified as your current maturation, there are things you can do today to lay the groundwork for the path to the next stage. In this section, we’ll walk through the actions necessary to become more mature with your data and start reaping even more rewards from your analysis.
As you put together a plan to increase data maturity, keep in mind adjustments you can make from both a tooling and personnel perspective. Those two elements mature in conjunction with each other, so you need to address both in your strategy.
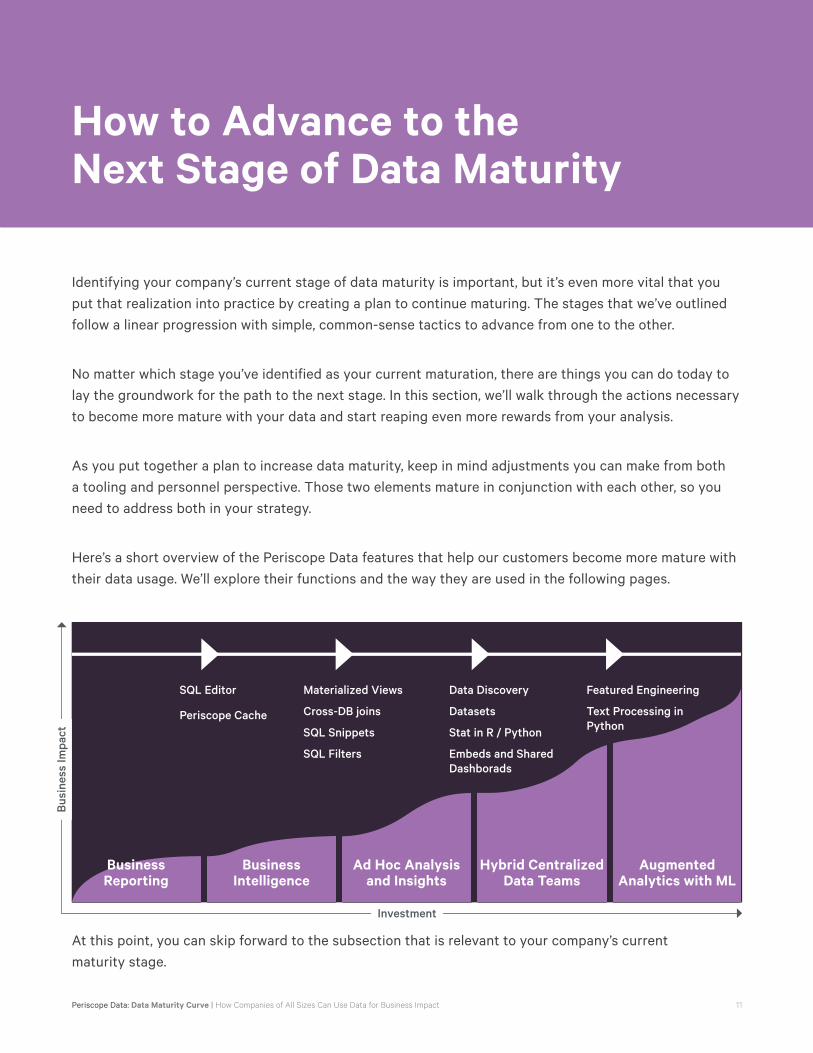
Here’s a short overview of the Periscope Data features that help our customers become more mature with their data usage. We’ll explore their functions and the way they are used in the following pages.
At this point, you can skip forward to the subsection that is relevant to your company’s current maturity stage.
Business Reporting
SQL Editor
Periscope Cache
Materialized Views
Cross-DB joins
SQL Snippets
SQL Filters
Data Discovery
Datasets
Stat in R / Python
Embeds and Shared Dashborads
Featured Engineering
Text Processing in Python
Ad Hoc Analysis and Insights
Business Intelligence
Hybrid Centralized Data Teams
Augmented Analytics with ML
Busi
ness
Impa
ct
Investment
How to Advance to the Next Stage of Data Maturity
Periscope Data: Data Maturity Curve | How Companies of All Sizes Can Use Data for Business Impact 11

If you’re in Stage 1, your company can do standard business reporting. You are pulling data from your individual sources (Salesforce, Marketo, facebook, etc.), but you’re not capable of blending that data to run queries across multiple sources.
At this stage, you’re downloading data from your solutions and using it to track progress, but you can’t ask new questions of the data. You can collect data about the questions the solutions have thought to build into their reports, but you’re not molding that data to fit the way your company uniquely operates.
The big evolution that will move a company from Stage 1 to Stage 2 is connecting all of those input sources into a single data platform, where new queries can be run across inputs. This ability to type SQL and get charts is a basic functionality of a stage 2 company. Once the data is blended, it can be combined to map out a marketing funnel, close rate or a churn calculation.
One of the big benefits of maturing to Stage 2 is the ability to create regular reporting dashboards. With all the data in a single location, dashboards can be created that pull information from all of the various sources. Rather than manually download data and enter numbers into slide decks or email templates (standard reporting processes in Stage 1), Stage 2 companies can build a reporting dashboard that routinely populates with fresh data on any cadence necessary.
These dashboards improve companywide reporting dramatically, ensuring that every individual is working from the same set of data and that manual processes (and room for error) are minimized in the creation of each report. Shared dashboards are a hallmark of Business Intelligence (Stage 2) technology, but a common data platform also enables a few other capabilities that help make data-driven decisions much faster.
Email reports are a simple way to regularly deliver key metrics to people who need data to make decisions. They take the information from those single-source-of-truth dashboards and proactively put them directly into someone’s inbox. Email reports are a great way to get decision makers exposed to data and improve their data literacy.
Companies Maturing to Stage 2
Stage 1>2 Features
• Type SQL, Get Charts • Periscope Cache • Shared Dashboards • Email Reports • SQL Alerts
Periscope Data: Data Maturity Curve | How Companies of All Sizes Can Use Data for Business Impact 12

SQL Alerts are similar, sending an email to a certain person or group of people whenever a certain KPI hits a determined threshold. It’s an easy way for a team to be notified of spikes in the data as they happen. For example, if a high percentage of your customer base churned in a short time period, it would make sense for your team to proactively investigate those accounts and make changes as soon as possible to avoid losing more customers.
An important thing to keep an eye on as you move from Stage 1 to Stage 2 is time to value. You should be getting results from your data much faster here since BI reporting is streamlined. Not only are your data-based decisions happening faster, they should also expand to address questions that require multiple data sources to answer.
12
3
4
5
Periscope Data: Data Maturity Curve | How Companies of All Sizes Can Use Data for Business Impact 13

Companies Maturing to Stage 3
Stage 2>3 Features
• SQL Views • Cross-Database joins • SQL Snippets • SQL Filters • Data Discovery
At Stage 2, companies have incorporated data into their workflow at the level of standardized BI. There are regular, uniform reports from a single source of data, dashboards that update automatically and triggers set up to alert the team if certain events happen. As you evolve into Stage 3, you’ll build a centralized data team to query the data in new ways and ask your own unique questions.
The biggest benefit of maturing from Stage 2 to Stage 3 is that you will be able to start answering questions about why your data is moving the way that it is. In Stage 2, your whole team gains access to descriptive data that tells you what is happening across all the parts of your business, but there’s no definitive way to test hypotheses about the levers that are affecting those metrics.
The first big piece of the move to Stage 3 is the establishment of a full-time data team. The move from Stage 1 to Stage 2 was primarily about getting the right tooling set up, but the move to Stage 3 is about establishing a data team to start investigating new questions about the data. Once the right people are in place, Stage 3 is a maturity level that allows companies to ask their own questions instead of just combining questions built into their original data sources. This flexibility allows the team to dig deeper on important issues and adjust to change much faster.
At Stage 3, the data team is building new models with the data to investigate explanations for KPI movement. Since so much new exploration and modeling is happening, it’s crucial that a data team is able to perform these tasks as quickly as possible. They’ll need to use SQL to perform these investigations, so tools like SQL Views, SQL Snippets and SQL Filters come into use.
These features are common code resources that let a team create a set of code blocks that are reusable in multiple different queries. With a robust library of reusable SQL, new data queries are much faster to create and new questions get answered in a fraction of the time.
Periscope Data: Data Maturity Curve | How Companies of All Sizes Can Use Data for Business Impact 14

With a data team in place and a library of these SQL building blocks established, Stage 3 companies can allow non technical professionals to explore prepared datasets through simple drag-and-drop functionality. Tools like Periscope’s Data Discovery make it easy for a data team to create a safe environment for other teams to sort through data and find their own insights.
At Stage 3, the focus begins to shift from backward-looking descriptive data to diagnostic data, which also begins to attract new audiences. For example, leaders from sales and marketing are interested in data from Stage 2’s shared BI dashboards, but product engineering professionals don’t get the same value from it. At Stage 3, that team is now compelled to join the data process because they can ask questions that provide a lot more value to their workflow.
12
3
4
5
Periscope Data: Data Maturity Curve | How Companies of All Sizes Can Use Data for Business Impact 15
Companies Maturing to Stage 4
Stage 3>4 Features
• Materialized Views • Statistics in R / Python • Embeds and Shared Dashboards • Git, Permissions & API • Quality Checks
If your company has matured to Stage 3, you’re doing something right. The good news is that you’ve already assembled an internal data team to quickly translate data into decisions, the better news is that other teams are taking notice of that team’s success and trying to get a piece of it. As your company’s data process matures, you’re also noticing more advanced requests from an increasing number of internal teams.
To avoid turning that data team into a bottleneck, the data team needs to start empowering analysts that sit within other teams. As this happens, those teams will begin to combine their specialized domain knowledge with information from the central data team to produce even deeper insights. Some companies even have their line-of-business analysts go through a training with the centralized data teams to make sure they’re working together effectively.
At the onset of this partnership, there might be growing pains. That’s normal. Ultimately, there’s a recognition that the only way to get the best of both knowledge bases is to build a hybrid data team. This structure lets data teams focus on preparing datasets for individual business teams, but then allows those teams to analyze the data with their own specific analysts, who also bring unique line-of-business knowledge to the analysis.
For example, all incoming sales data can be cleaned and modeled by the data team and then handed off to a full-time sales analyst who is embedded on the sales team to look for insights. That analyst will ideally have some background in sales or sales data and will sit with the sales team full time, so they will know about current campaigns, trends and priorities.
With this setup, that centralized data team goes through a serious shift. They’re no longer prioritizing ad hoc analysis. Instead, they’re producing uniform, clean data as a product for other teams to analyze. They’re ensuring that every team is using consistent definitions and pulling from a single source of truth. To handle this changing of responsibilities, the data team needs a new set of features that enable them to create reusable transformations that guarantee a uniform environment for all of their consumers. Features that help the central data team share datasets and manage permissions are crucial to maturing to Stage 4.
Periscope Data: Data Maturity Curve | How Companies of All Sizes Can Use Data for Business Impact 16

In Periscope Data, that means using Materialized Views, Git integration, Embeds and Shared Dashboards. It might also require a data team to use R or Python to build advanced statistical models that they can pass off to other analysts. This effectively allows every analyst to dive into data at the same depth of the most advanced data scientist.
It’s important to note that in Stage 4, the central data team might still handle some ad hoc inquiries, but they’re fundamentally different than the type on requests they’d get in Stage 3. Here, that team is using metadata: data about data. They’re planning for their own growth by tracking how other teams are using data. They’re also taking requests that are too high-level or too complicated for the business analysts to manage. These questions might be too nonspecific or too forward-looking to be answered outside the data team.
12
3
4
5
Periscope Data: Data Maturity Curve | How Companies of All Sizes Can Use Data for Business Impact 17

Companies Maturing to Stage 5
Stage 4>5 Features
• Feature Engineering • Text Processing in Python • Integration with machine learning
platforms
If you’re already in stage 4, you’ve done a pretty remarkable job managing your data so far. You already have a data team full of advanced data scientists and embedded analysts on other teams. Companies in Stage 4 don’t have a lot of work left to do in terms of personnel organization, they just need to focus on using more advanced technology to find even deeper insights in their data.
To mature to Stage 5, data teams are investing heavily in machine learning and building a massive store of data (hundreds of billions or even trillions of rows) to run these queries. You’ll also need the right technology and powerful compute resources to actually answer those questions. This will likely require an advanced technology stack, with integrations connecting at least one data prep platform to a machine learning platform.
To create successful predictive models, a Stage 5 company requires an extremely high volume of data flowing through the system. That data needs to be easy to understand and stored in a way that makes it accessible to all of the right people at the right time. It may take years for a Stage 4 company to construct a system that can handle Stage 5 operations.
Structurally, Stage 5 data teams still have the hybrid structure that we saw in Stage 4, but the centralized data team is capable of handling much more sophisticated data operations. It might even be the case that there is a standalone data science or machine learning function that exists as a consumer of the same data team that services sales, marketing, customer and product teams.
It’s important to consider that each stage of data maturity requires more time and a more significant investment before results are realized. To advance to Stage 5 requires a lot of work and a heavy foundation of infrastructure before teams start to reap benefits.
At Periscope Data, our tools can help the most with the data preparation part of the Stage 5 workflow. Our tool can assist with feature engineering for machine learning and can accomodate Python libraries that are used for text processing.
Periscope Data: Data Maturity Curve | How Companies of All Sizes Can Use Data for Business Impact 18
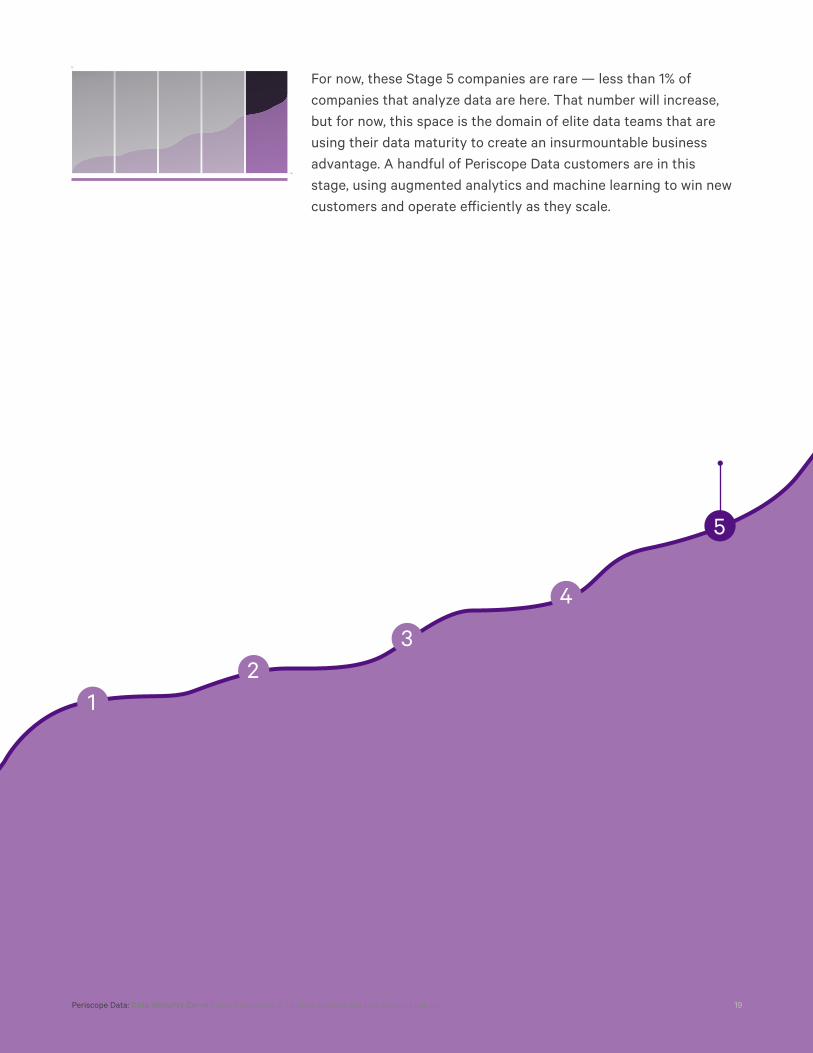
For now, these Stage 5 companies are rare — less than 1% of companies that analyze data are here. That number will increase, but for now, this space is the domain of elite data teams that are using their data maturity to create an insurmountable business advantage. A handful of Periscope Data customers are in this stage, using augmented analytics and machine learning to win new customers and operate efficiently as they scale.
12
3
4
5
Periscope Data: Data Maturity Curve | How Companies of All Sizes Can Use Data for Business Impact 19
ConclusionFor a lot of companies, the best way to succeed is to start building new ways to reap benefits from your data. It might not make sense for every organization to mature to Stage 5 and incorporate machine learning and augmented analytics into their workflow, but it’s always good to ask what more you can be doing with data.
Maturity happens one step at a time, so once you’ve diagnosed your current stage, it’s time to start thinking about what is necessary to move to the next one and thinking about the benefits of advancing through the maturity curve. The data landscape changes quickly, and the winners of the big data revolution will be the companies who are ambitious with their data plans. Keep in mind that it takes time to build your data team and structure it correctly, so you have to think ahead to be successful.
If you want to talk to one of our experts about where your data team is on the data maturity curve and the steps you can take to become more advanced, request a contact and we’ll reach out to you.
About Periscope DataPeriscope Data is an end-to-end BI and analytics platform for anyone looking to answer complex questions with data. Business professionals and data experts use Periscope Data every day to connect all of their data sources, then analyze, visualize and share insights. The platform offers the fastest time to insight, unmatched power and the flexibility to meet the demands of every part of the business. Periscope Data is trusted by more than 1,000 customers, including Adobe, Crunchbase, EY, Flexport and ZipRecruiter.
Periscope Data: Data Maturity Curve | How Companies of All Sizes Can Use Data for Business Impact 20