data management and analysis for successful...
TRANSCRIPT

Data Management and Analysis for Successful Clinical Research
Lily Wang, PhD Department of Biostatistics
Vanderbilt University

2
Goals of This Presentation
• Provide an overview on data management and analysis aspects of clinical research
• Minimize errors in datasets • Ensure statistical software packages
will recognize data correctly• Facilitate efficient data analysis for
projects

3
An Overview of the Process1. Write the protocol
- consult mentors, colleagues and visit us to finalize specific aims, testable hypothesis and study design
2. Create a Data Dictionary3. Create a Patient Directory4. Prepare datasets for statistical
analysis
4
An Overview
5. The statisticians will assist with statistical tests
6. Review results, start thinking about writing the paper
7. Additional tables and figures8. Write the paper/abstract
5
Timeline
• For abstract, please send us datasets at least 4 weeks in advance
• Please contact us even if you don’t have the dataset ready, so we can schedule other projects and leave room for yours

6
1. Writing the Proposal
• Background• Why this research is important• Be concise
• Specific Aims, Testable Hypothesis• Be focused, clearly conceptualized, and
feasible• The most important section of the proposal• Consult mentors, colleagues and visit us
7
1. Writing the Proposal
• Methods/Experimental Design• Participants• Inclusion/Exclusion Criteria• Recruiting Process• How the measurements will be made
8
1. Writing the Proposal
• Challenges/Potential Problems• Loss to follow up • Bias - Confounding variables and other
sources • Human Subjects Protection Plan
• Informed consent• Adverse events• Privacy, confidentiality issues

9
Bias
Definition - any systematic error in the design, conduct or analysis of a study that results in a mistaken estimate of an exposure’s effect on the risk of disease
10
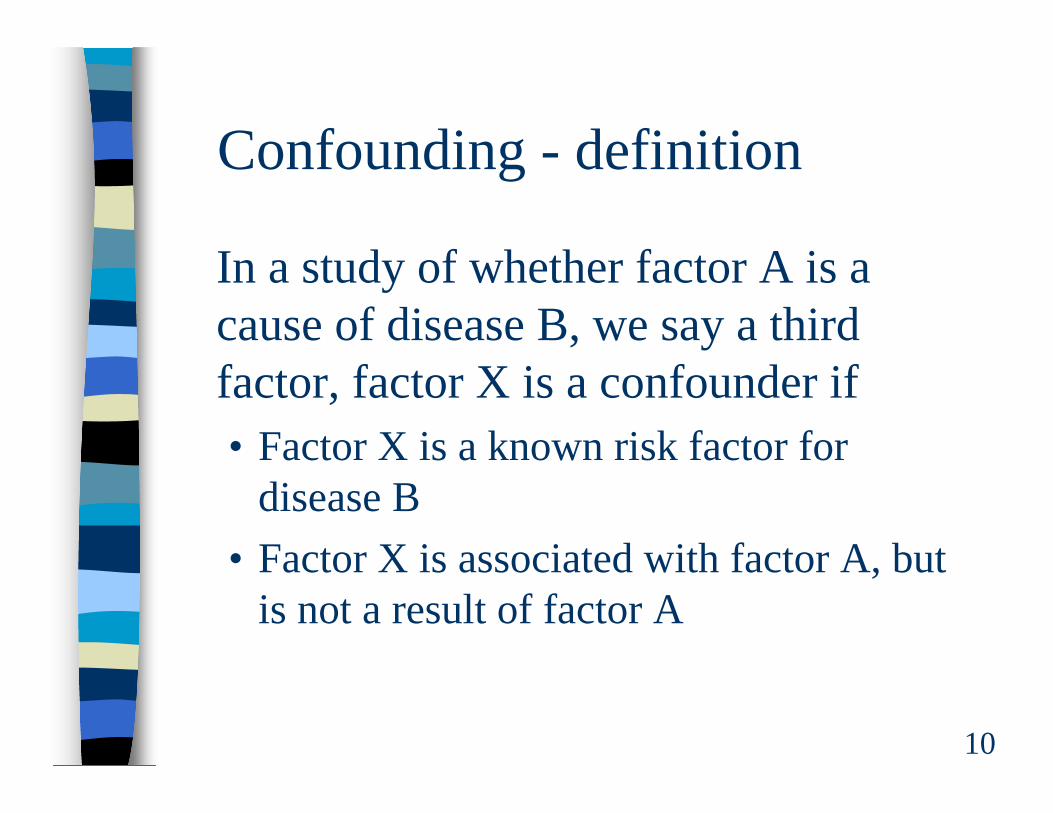
Confounding - definition
In a study of whether factor A is a cause of disease B, we say a third factor, factor X is a confounder if • Factor X is a known risk factor for
disease B• Factor X is associated with factor A, but
is not a result of factor A

11
Confounding – an examplecoffee drinking and pancreatic cancer

12
Confounding – an examplecoffee drinking and pancreatic cancer
If an association is observed between coffee drinking and pancreas cancer, then
• The coffee => canceror• Smoking is a risk factor for cancer
and smoking is associated with coffee drinking

13
1. Writing the ProposalConfounding – ways to deal with it
• in design phase• match cases to controls on confounding
variables• in analysis phase
• stratification• adjustment
14
1. Writing the Proposal
• Statistical Analysis (provided by the statisticians)• Sample size/Power calculations• Analysis Plan
15
1. Writing the Proposal
• A good example• Dr Malow’s template

16
2. Create a Data Dictionary
mm/dd/yyyydatedate for baseline assessment
date0
80 – 150continuousmmHgdiastolic blood pressure
bp_dias
100 – 160continuousmmHgsystolic blood pressure
bp_sys10 – 79continuousyearage in yearsage
1= placebo, 2=trtdiscretetreatment groupgroup
Values (Permissible ranges)
TypeUnitsDescriptionName
17
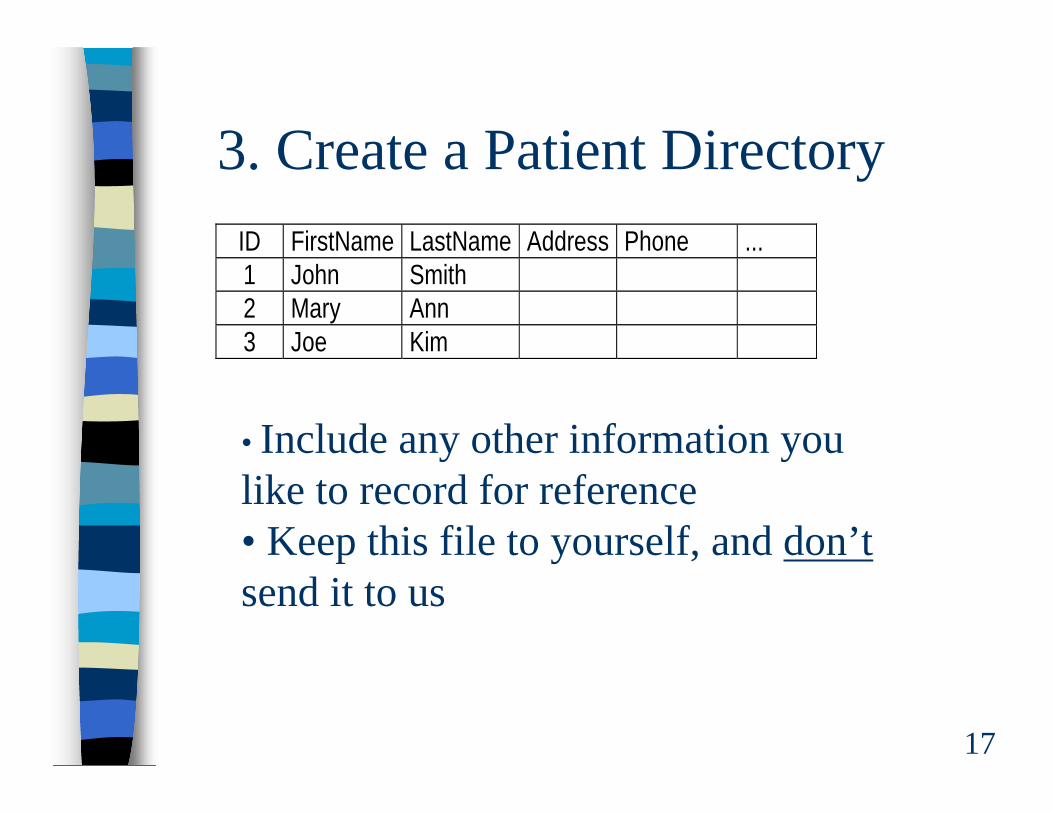
3. Create a Patient DirectoryID FirstName LastName Address Phone ... 1 John Smith 2 Mary Ann 3 Joe Kim
• Include any other information you like to record for reference• Keep this file to yourself, and don’tsend it to us

18
4. Prepare datasets for Statistical Analysis – A good example
ID group age sex ht wt bp_sys bp_dias stage race date0 complic 1 1 25 1 61 350 120 80 3 3.0 1/15/1999 0 2 1 65 2 68 161 140 90 2 1.0 2/5/1999 1 3 1 25 1 47 150 160 110 4 2.0 1/15/1998 1 4 1 31 1 66 161 140 105 2 2.0 4/1/1999 0 5 1 42 2 72 177 130 70 2 1.0 2/15/1999 0 6 1 45 2 67 160 120 80 1 2.0 3/6/1999 0 7 1 44 1 72 145 120 80 1 1.0 2/28/1999 0 8 1 55 1 72 161 120 95 4 2.0 6/15/2000 1 9 1 0.5 2 66 174 160 110 3 4.0 12/14/2000 1 10 1 21 2 60 155 190 120 2 2.0 11/14/2000 0

19
4. Prepare datasets for Statistical Analysis
• First - strip off any confidential information (name, address, phone #)
• Rows - each subject (sample, observations)
• Columns - each measurement (variable)
20
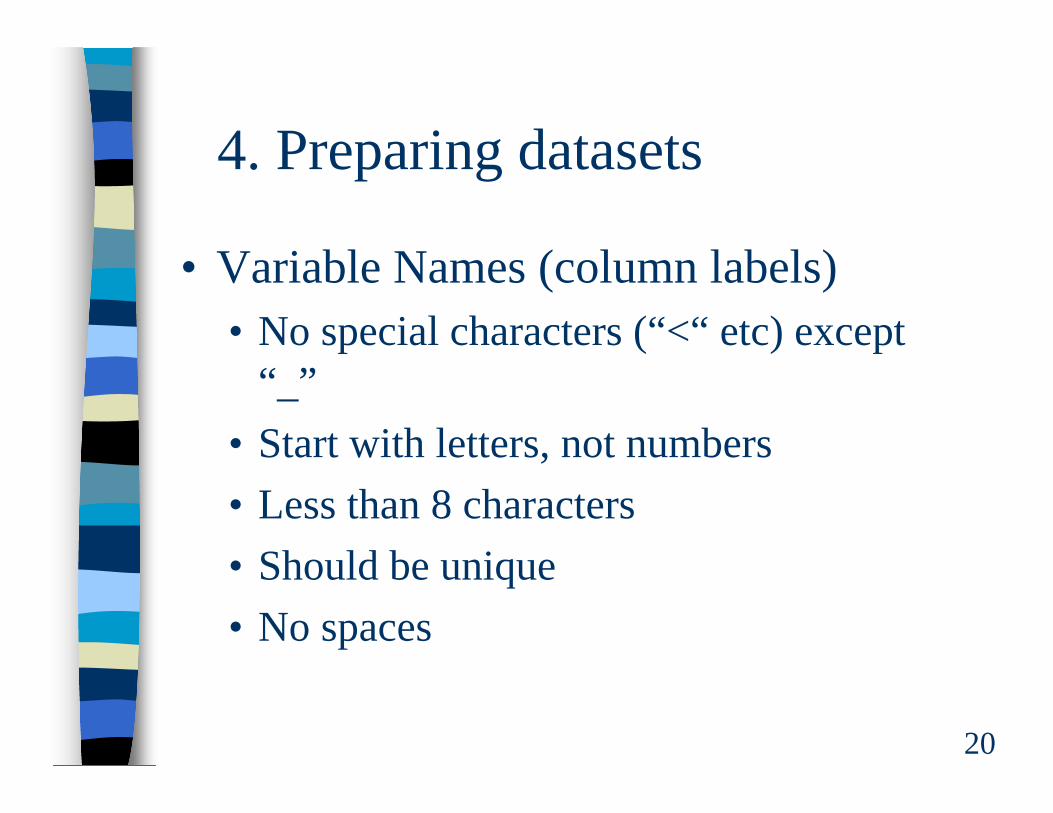
4. Preparing datasets
• Variable Names (column labels)• No special characters (“<“ etc) except
“_”• Start with letters, not numbers• Less than 8 characters• Should be unique• No spaces

21
4. Preparing datasets
• Data Values• Be consistent: “M” “m”, date format,
upper/lower case• No spaces• No embedded formula – use “paste
special”, then “paste values”• Missing data: leave it as blank
• Unless there are different reasons for missing, code them as different values
≠≠
≠
22
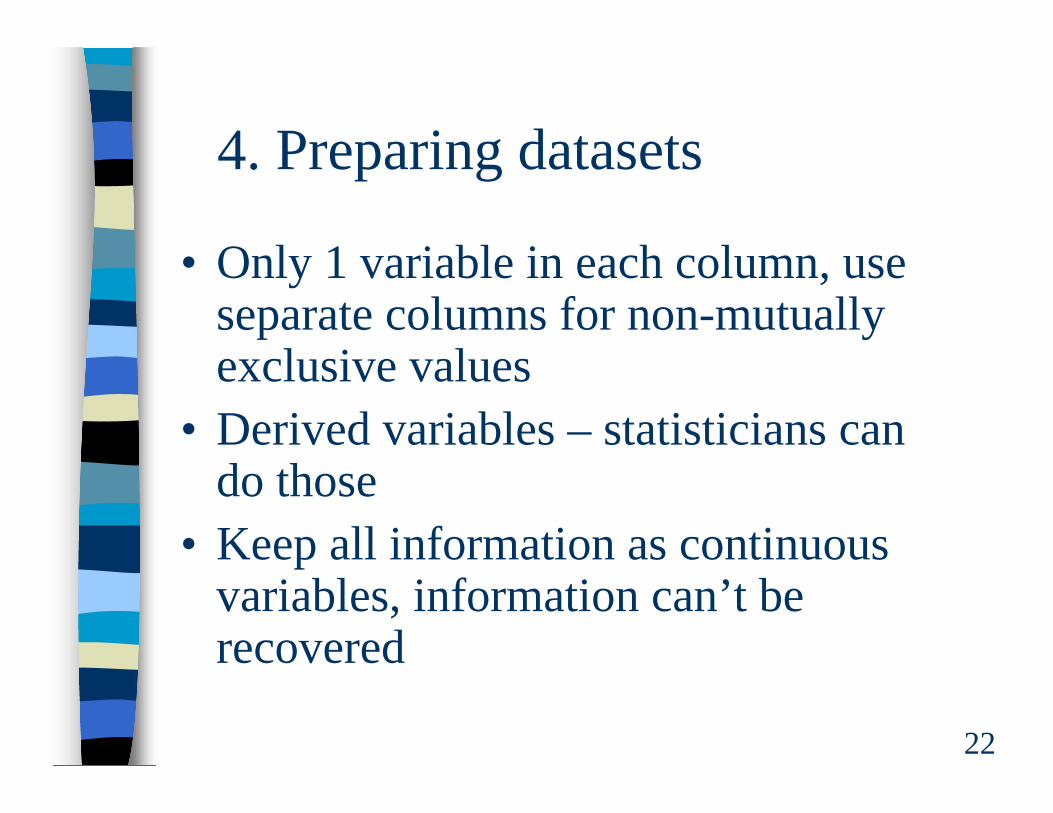
4. Preparing datasets
• Only 1 variable in each column, use separate columns for non-mutually exclusive values
• Derived variables – statisticians can do those
• Keep all information as continuous variables, information can’t be recovered

23
4.Preparing datasets
• It’s OK to have separate data sheets for demographic info and clinical measurements• As long as there is a unique identifier
(ID) that links all data sheets

24
4. Preparing Datasets
• If you are in a hurry• Record data in a file and call it “Raw_xxx.xls”• Later transform it into the desired format• It’s OK to format only those needed for
analysis and send only these variables to the statisticians
• Good idea: visit us after you’ve entered the first 5 patients and completed the data dictionary

25
What’s wrong with this data sheet? Comparison of Drug A and Drug B
Drug A Age of Patient Patient Height Weight 24hrhct blood pressure tumor Race Date complicationsGender (inches) (pound) stage enrolled
1 25 Male 61" >350 38% 120/80 2-3 Hipanic 1/15/99 no2 65+ female 5'8" 161 32 140/90 II White 2/05/1999 yes3 ? Male 120cm 12 >160/110 IV Black Jan 98 yes, pneumonia4 31 m 5'6" obse 40 140 sys 105 dias ? ican-Americ ?5 42 f >6 ft normal 39 missing =>2 W Feb 996 45 f 5.7 160 29 80/120 NA B last fall n7 unknown ? 6 145 35 normal 1 W 2/30/99 n8 55 m 72 161.45 12/39 120/95 4 ican-Americ 6-15-00 y9 6 months f 66 174 38 160/110 3 Asian 14/12/00 y10 21 f 5'
Drug B1 55 m 61 145 normal 120/80 120/90 IV ative Americ 6/20/ 32 45 f 4"11 166 ? 135/95 2b none 7/14/99 n3 32 male 5'13" 171 38 140/80 not staged NA 8/30/99 n4 44 na 65 ? 40 120/80 2 ? 09/01/00 n5 66 fem 71 0 41 140/90 4 w Sep 14th y, sepsis6 71 unknown 172 199 38 >160/110 3 b unknown y, died7 45 m ? 204 32 140 sys 105 dias 1 b 12/25/00 n8 34 m NA 145 36 130 3 w July 97 n9 13 m 66 161 39 166/115 2a w 06/06/99 n10 66 m 68 176 41 1120/80 3 w 01/21/58 n
Average 45 65 155 38

26
Acknowledgement
• Guideline for data collection and data entryhttp://biostat.mc.vanderbilt.edu/wiki/Main/TheresaScott
• “10 Data Entry Commandments”, “Spreadsheet from Heaven/Hell”http://biostat.mc.vanderbilt.edu/wiki/Main/DanielByrne