data interpretation - syracuse city school district · lesson 13 continues this exploration, with...
TRANSCRIPT

1 G R A D E
New York State Common Core
Mathematics Curriculum GRADE 1 • MODULE 3
Topic D
Data Interpretation 1.OA.1, 1.MD.2, 1.MD.4
Focus Standard: 1.OA.1 Use addition and subtraction within 20 to solve word problems involving situations of adding to, taking from, putting together, taking apart, and comparing, with unknowns in all positions, e.g., by using objects, drawings, and equations with a symbol for the unknown number to represent the problem. (See Glossary, Table 1.)
1.MD.2 Express the length of an object as a whole number of length units, by laying multiple copies of a shorter object (the length unit) end to end; understand that the length measurement of an object is the number of same-size length units that span it with no gaps or overlaps. Limit to contexts where the object being measured is spanned by a whole number of length units with no gaps or overlaps.
1.MD.4 Organize, represent, and interpret data with up to three categories; ask and answer questions about the total number of data points, how many in each category, and how many more or less are in one category than in another.
Instructional Days: 4
Coherence -Links from: GK–M3 Comparison of Length, Weight, Capacity, and Numbers to 10
-Links to: G2–M2 Addition and Subtraction of Length Units
G2–M7 Problem Solving with Length, Money, and Data
Topic D closes the module as students organize, represent, and interpret personally relevant data in Lesson 10 (1.MD.4). As students work as a class to collect, sort, and organize data into a graph, they find great purpose and excitement in data. They begin to answer, and then ask questions about, the number of data points in a given category, and in two categories.
For Lesson 11, students take a more independent role in the collecting, sorting, organizing, and representing phases involved in graphing. They work on their own to ask and answer questions about the data set, which prepares them for the comparison work of the last two lessons.
In Lesson 12, students interpret information presented in the graphs by exploring compare with difference unknown problems. They begin with visualizing these problems in their easily accessible “equalizing” contexts, by answering questions such as, “How many more students would Category A need to have the same amount as Category B?” Students use their understanding of comparing lengths from Topics A, B, and C to now compare the responses in three categories.
Topic D: Data Interpretation Date: 7/30/13 3.D.1
© 2013 Common Core, Inc. Some rights reserved. commoncore.org This work is licensed under a Creative Commons Attribution-NonCommercial-ShareAlike 3.0 Unported.License.

Topic D NYS COMMON CORE MATHEMATICS CURRICULUM 1•3
Lesson 13 continues this exploration, with students again interpreting data sets to ask and answer varied word problems including, “How many students were polled in all?” and, “How many more students are in Category C than in Category A?” (1.OA.1). Throughout Topic D, students also apply the learning from earlier in the module, as they lightly notice the connection between length units and data points on a graph.
A Teaching Sequence Towards Mastery of Data Interpretation
Objective 1: Collect, sort, and organize data, then ask and answer questions about the number of data points. (Lessons 10–11)
Objective 2: Ask and answer varied word problem types about a data set with three categories. (Lessons 12–13)
Topic D: Data Interpretation Date: 7/30/13 3.D.2
© 2013 Common Core, Inc. Some rights reserved. commoncore.org This work is licensed under a Creative Commons Attribution-NonCommercial-ShareAlike 3.0 Unported.License.

Lesson 10 NYS COMMON CORE MATHEMATICS CURRICULUM 1
Lesson 10: Collect, sort, and organize data, then ask and answer questions about the number of data points.
Date: 7/30/13
3.D.3
© 2013 Common Core, Inc. Some rights reserved. commoncore.org This work is licensed under a Creative Commons Attribution-NonCommercial-ShareAlike 3.0 Unported License.
Lesson 10
Objective: Collect, sort, and organize data, then ask and answer questions about the number of data points.
Suggested Lesson Structure
Fluency Practice (13 minutes)
Application Problem (5 minutes)
Concept Development (32 minutes)
Student Debrief (10 minutes)
Total Time (60 minutes)
Fluency Practice (13 minutes)
Happy Counting 1.OA.5, 1.NBT.5 (3 minutes)
Race and Roll Subtraction 1.OA.6 (4 minutes)
Subtraction Within 20 1.OA.6 (6 minutes)
Happy Counting (3 minutes)
Note: Practice with counting forward and backward by tens and ones strengthens students’ understanding of place value. Counting by twos and fives strengthens addition and subtraction skills.
Repeat the Happy Counting activity from G1–M3–Lesson 2. Choose a counting pattern and range based on your students’ skill level. If proficient with counting by ones, twos, fives, and tens to 40, start at 40 and go to 80. If proficient between 40 and 80, work between 80 and 120. Alternate between counting the regular way and the Say Ten way to reinforce place value.
Race and Roll Subtraction (4 minutes)
Materials: (S) 1 die per set of partners
Note: This fluency activity reviews the grade level standard of subtracting within 20.
Partners start at 20 and take turns rolling the die to subtract the number rolled from the total. (For example, Partner A rolls 3 and says, “20 – 3 = 17.” Partner B rolls 2 and says, “17 – 2 = 15.”) They continue rapidly rolling and saying number sentences until they reach 0, which they must hit precisely. Partners stand when they reach 0. Repeat the game as time permits.
Lesson 10 NYS COMMON CORE MATHEMATICS CURRICULUM 1
Lesson 10: Collect, sort, and organize data, then ask and answer questions about the number of data points.
Date: 7/30/13
3.D.4
© 2013 Common Core, Inc. Some rights reserved. commoncore.org This work is licensed under a Creative Commons Attribution-NonCommercial-ShareAlike 3.0 Unported License.
Subtraction Within 20 (6 minutes)
Materials: (T) Hide Zero cards (S) Personal white boards
Note: This review fluency helps strengthen students’ understanding of the take from ten and take from the ones subtraction strategies, as well as their ability to recognize appropriate strategies based on problem types.
T: (Show 14 with Hide Zero cards.) How can I take 14 apart to help me subtract?
S: 10 and 4.
T: I want to subtract 2 from 14. Write a number sentence to show whether I should subtract 2 from the 4 or the 10.
S: (Write 4 – 2 = 2.)
T: Why wouldn’t I take from my 10?
S: You don’t need to because you have enough ones.
T: Yes! It’s much easier to just subtract from my ones! Since 4 – 2 = 2, 14 – 2 is? Write the subtraction sentence.
S: (Write 14 – 2 = 12.)
T: (Replace the 4 Hide Zero card with a 2.) Yes!
Repeat with 14 – 5, eliciting that you need to take from ten because there are not enough ones. Repeat with similar problems.
Application Problem (5 minutes)
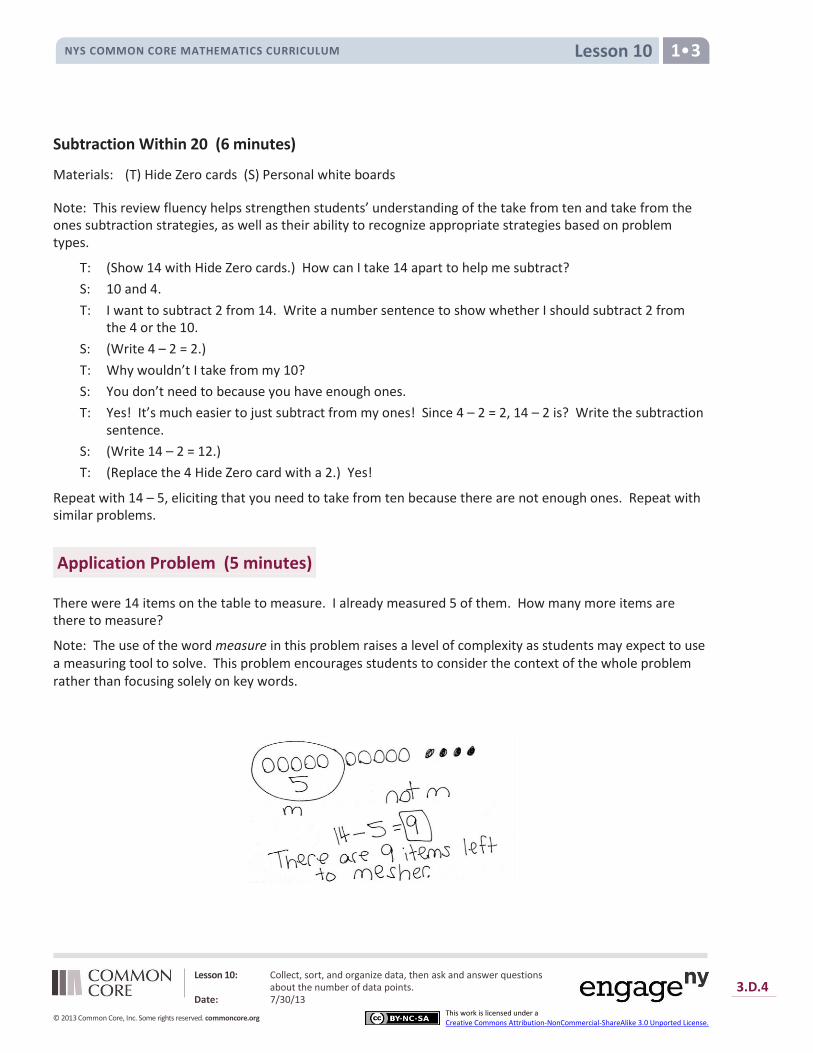
There were 14 items on the table to measure. I already measured 5 of them. How many more items are there to measure?
Note: The use of the word measure in this problem raises a level of complexity as students may expect to use a measuring tool to solve. This problem encourages students to consider the context of the whole problem rather than focusing solely on key words.

Lesson 10 NYS COMMON CORE MATHEMATICS CURRICULUM 1
Lesson 10: Collect, sort, and organize data, then ask and answer questions about the number of data points.
Date: 7/30/13
3.D.5
© 2013 Common Core, Inc. Some rights reserved. commoncore.org This work is licensed under a Creative Commons Attribution-NonCommercial-ShareAlike 3.0 Unported License.
NOTES ON
MULTIPLE MEANS OF
REPRESENTATION:
Highlight the critical vocabulary for
your students as you teach the lesson.
Vocabulary that you will want to
highlight is collecting, organize, sorting,
data, and table as this is the first time
students are being introduced to these
words in the context of math. Try
relating the vocabulary to something
they already know. This will be
especially helpful to English language
learners.
Chart 1 with popsicle sticks placed by
students.
Concept Development (32 minutes)
Materials: (T) 3 pieces of chart paper (S) 1 jumbo popsicle stick and a marker (distributed at each seat), personal white board
Note: Before today’s math lesson begins, prepare three charts:
Chart 1: Favorite Read Aloud Books
Chart 2: Favorite Read Aloud Books with a blank table labeled with Number of Students
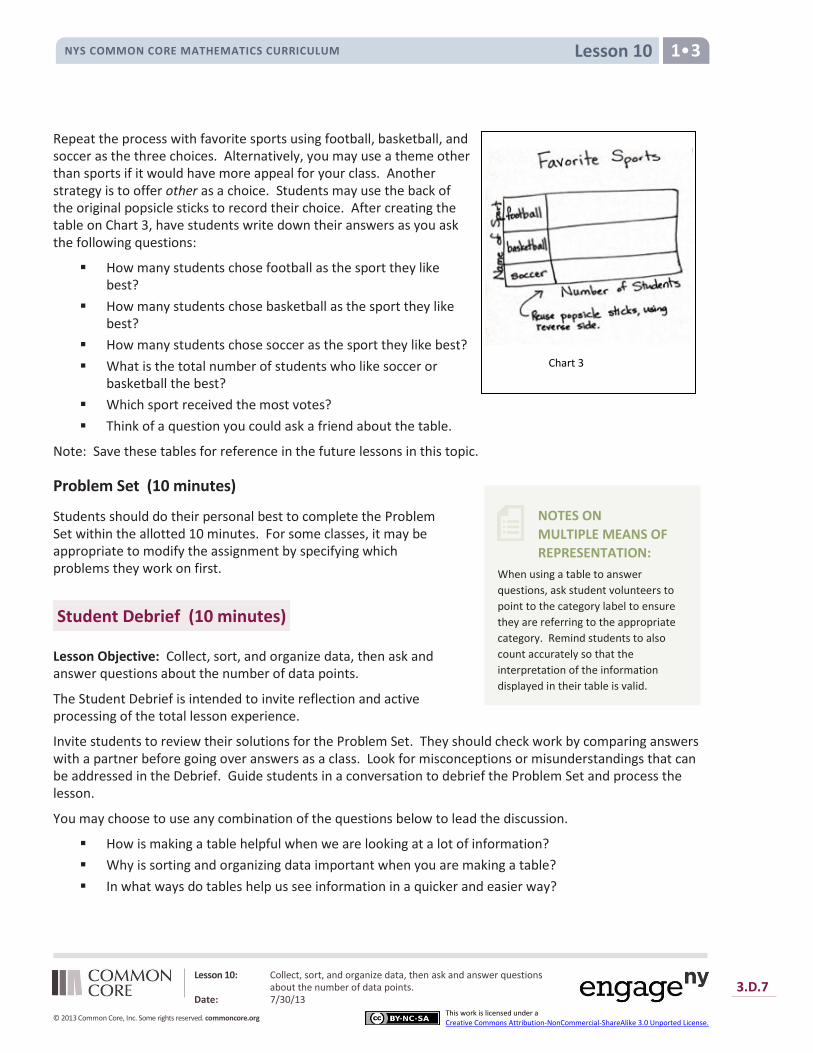
Chart 3: Favorite Sports with a blank table labeled with Name of Sport and Number of Students
Also, later in the lesson, students will be asked to vote for one of three sports. A topic other than sports can be used to match the class’s preference. The lesson requires that only three choices be provided from which the students can pick. Model for students that when making a table of information, as they will be making today, the symbols within the table all need to be the same.
Have students come to the meeting area with their personal white boards and sit in a semi-circle formation.
T: I want to find out which read aloud books from first grade you like the most. Can you name some of the books we read together this year?
S: (Answers may vary. Choose three titles and write them on Chart 1. You may want to use the most important word from the title to alleviate students from writing many words during the following activity.)
T: Let’s collect some information, or data, to find out how many students like which books the most. How should we collect our data?
S: Ask each student, and then write their name down next to the book title. Call out each title and ask us to raise our hands if it is our favorite book.
T: Each of you has a popsicle stick at your table. Decide which book you liked the most out of these three choices. Then, write the name of the book on the popsicle stick. Come up to this chart and place your stick anywhere. (Lay the chart on the floor in the middle of the meeting area.)
S: (Write down their favorite book and freely place them on the chart.)
T: Wow, this chart is filled with ___ (the number of students) popsicle sticks. How many students liked Book A? (Give five seconds for students to count.)
S: (Answers may vary.) I can’t count that fast! I need more time.

Lesson 10 NYS COMMON CORE MATHEMATICS CURRICULUM 1
Lesson 10: Collect, sort, and organize data, then ask and answer questions about the number of data points.
Date: 7/30/13
3.D.6
© 2013 Common Core, Inc. Some rights reserved. commoncore.org This work is licensed under a Creative Commons Attribution-NonCommercial-ShareAlike 3.0 Unported License.
Chart 2 with popsicle sticks arranged
as tallies.
T: We have different answers and some people didn’t even get to finish counting! How can we make counting these popsicle sticks easier?
S: After we count each popsicle stick, take it off so we can keep track of which ones we have already counted. Get all the popsicle sticks for each book and put them together. We should separate and sort them. We should organize these sticks by book titles!
T: These are great ideas. I agree! Here is a table. It will help us organize our information or data. (Lay Chart 2 on the floor and write in the titles. Ask a few student volunteers to rearrange their popsicle sticks in a horizontal line next to each book title.)
T: Now is it easier to see?
S: Yes!
T: How can we organize the data so we can count more efficiently and see more easily?
S: Group them by twos. Group them by fives. Put them in 5-group rows!
T: I love the idea of organizing them into groups of 5. In fact, we are going to arrange some of these sticks in a special way to show groups of 5. Help me count as I show you how this is done.
S: 1, 2, 3, 4, 5. (Count as the teacher points to each popsicle stick.)
T: Stop! Since we have a group of 5 here, I’m going to take the fifth stick and lay it across the others. (Model.) Show me in the air how this group of 5 is made as we count from 1 through 5 again.
S: 1, 2, 3, 4, 5. (Make tally marks in the air with teacher modeling.)
T: You just used tally marks. Tally marks come in groups of 5 where the fifth line always goes across the rest of the four lines. Let’s continue with the rest of these sticks.
Students count to 5 and make tally marks in the air as the teacher makes tally marks with popsicle sticks. After a few, ask student volunteers to rearrange the remaining popsicle sticks.
T: Great job organizing the data by sorting the information we collected. Now we can see and count our information more easily.
Count the tally marks for each book title and record the number directly on the table. Invite students to interpret the data by posing questions such as those below.
How many students liked Book A the most?
How many students liked Book A or Book B the most? (Note: Because the question says "or," students need to add the number for A and the number for B.)
Which book is most liked by our classmates? Least liked?
Lesson 10 NYS COMMON CORE MATHEMATICS CURRICULUM 1
Lesson 10: Collect, sort, and organize data, then ask and answer questions about the number of data points.
Date: 7/30/13
3.D.7
© 2013 Common Core, Inc. Some rights reserved. commoncore.org This work is licensed under a Creative Commons Attribution-NonCommercial-ShareAlike 3.0 Unported License.
NOTES ON
MULTIPLE MEANS OF
REPRESENTATION:
When using a table to answer
questions, ask student volunteers to
point to the category label to ensure
they are referring to the appropriate
category. Remind students to also
count accurately so that the
interpretation of the information
displayed in their table is valid.
Repeat the process with favorite sports using football, basketball, and soccer as the three choices. Alternatively, you may use a theme other than sports if it would have more appeal for your class. Another strategy is to offer other as a choice. Students may use the back of the original popsicle sticks to record their choice. After creating the table on Chart 3, have students write down their answers as you ask the following questions:
How many students chose football as the sport they like best?
How many students chose basketball as the sport they like best?
How many students chose soccer as the sport they like best?
What is the total number of students who like soccer or basketball the best?
Which sport received the most votes?
Think of a question you could ask a friend about the table.
Note: Save these tables for reference in the future lessons in this topic.
Problem Set (10 minutes)
Students should do their personal best to complete the Problem Set within the allotted 10 minutes. For some classes, it may be appropriate to modify the assignment by specifying which problems they work on first.
Student Debrief (10 minutes)
Lesson Objective: Collect, sort, and organize data, then ask and answer questions about the number of data points.
The Student Debrief is intended to invite reflection and active processing of the total lesson experience.
Invite students to review their solutions for the Problem Set. They should check work by comparing answers with a partner before going over answers as a class. Look for misconceptions or misunderstandings that can be addressed in the Debrief. Guide students in a conversation to debrief the Problem Set and process the lesson.
You may choose to use any combination of the questions below to lead the discussion.
How is making a table helpful when we are looking at a lot of information?
Why is sorting and organizing data important when you are making a table?
In what ways do tables help us see information in a quicker and easier way?
Chart 3

Lesson 10 NYS COMMON CORE MATHEMATICS CURRICULUM 1
Lesson 10: Collect, sort, and organize data, then ask and answer questions about the number of data points.
Date: 7/30/13
3.D.8
© 2013 Common Core, Inc. Some rights reserved. commoncore.org This work is licensed under a Creative Commons Attribution-NonCommercial-ShareAlike 3.0 Unported License.
Share the problem you made up using the favorite sports table. Solve each other’s questions and check your answers.
How are 5-group rows and tally marks similar? How are they different?
Why is using tally marks better than using 5-group rows when making a table?
Exit Ticket (3 minutes)
After the Student Debrief, instruct students to complete the Exit Ticket. A review of their work will help you assess the students’ understanding of the concepts that were presented in the lesson today and plan more effectively for future lessons. You may read the questions aloud to the students.
Lesson 10: Collect, sort, and organize data, then ask and answer questions about the number of data points.
Date: 7/30/13
3.D.9
© 2013 Common Core, Inc. Some rights reserved. commoncore.org This work is licensed under a Creative Commons Attribution-NonCommercial-ShareAlike 3.0 Unported License.
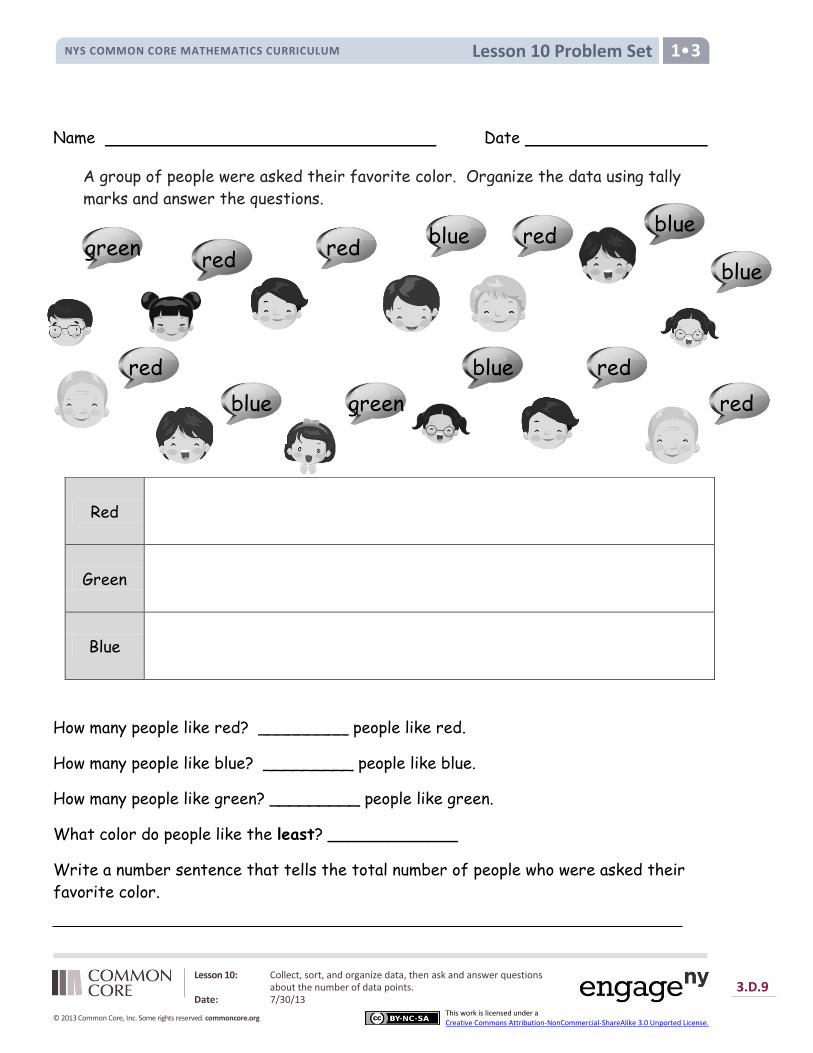
Lesson 10 Problem Set NYS COMMON CORE MATHEMATICS CURRICULUM 1
Name Date
A group of people were asked their favorite color. Organize the data using tally
marks and answer the questions.
How many people like red? _________ people like red.
How many people like blue? _________ people like blue.
How many people like green? _________ people like green.
What color do people like the least? _____________
Write a number sentence that tells the total number of people who were asked their
favorite color.
Red
Green
Blue
green red
red blue
blue
blue
red red
red green red
blue
blue
Lesson 10: Collect, sort, and organize data, then ask and answer questions about the number of data points.
Date: 7/30/13
3.D.10
© 2013 Common Core, Inc. Some rights reserved. commoncore.org This work is licensed under a Creative Commons Attribution-NonCommercial-ShareAlike 3.0 Unported License.
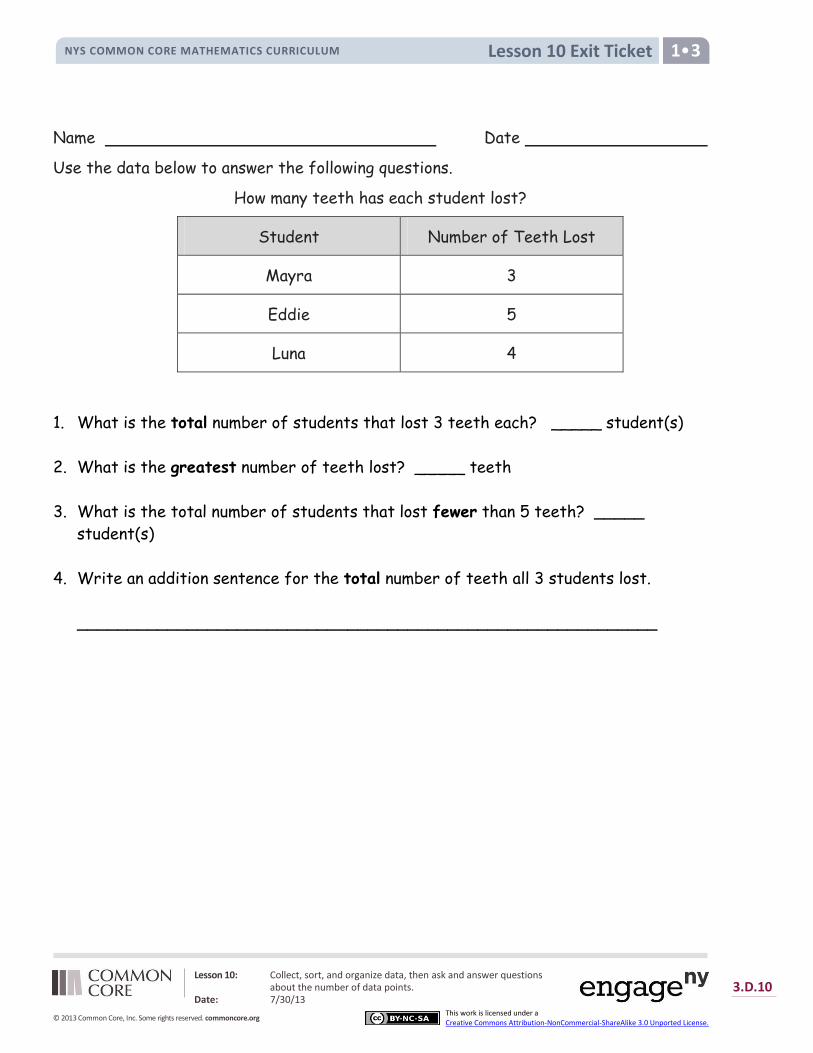
Lesson 10 Exit Ticket NYS COMMON CORE MATHEMATICS CURRICULUM 1
Name Date
Use the data below to answer the following questions.
How many teeth has each student lost?
Student Number of Teeth Lost
Mayra 3
Eddie 5
Luna 4
1. What is the total number of students that lost 3 teeth each? _____ student(s)
2. What is the greatest number of teeth lost? _____ teeth
3. What is the total number of students that lost fewer than 5 teeth? _____
student(s)
4. Write an addition sentence for the total number of teeth all 3 students lost.
__________________________________________________________
Lesson 10: Collect, sort, and organize data, then ask and answer questions about the number of data points.
Date: 7/30/13
3.D.11
© 2013 Common Core, Inc. Some rights reserved. commoncore.org This work is licensed under a Creative Commons Attribution-NonCommercial-ShareAlike 3.0 Unported License.
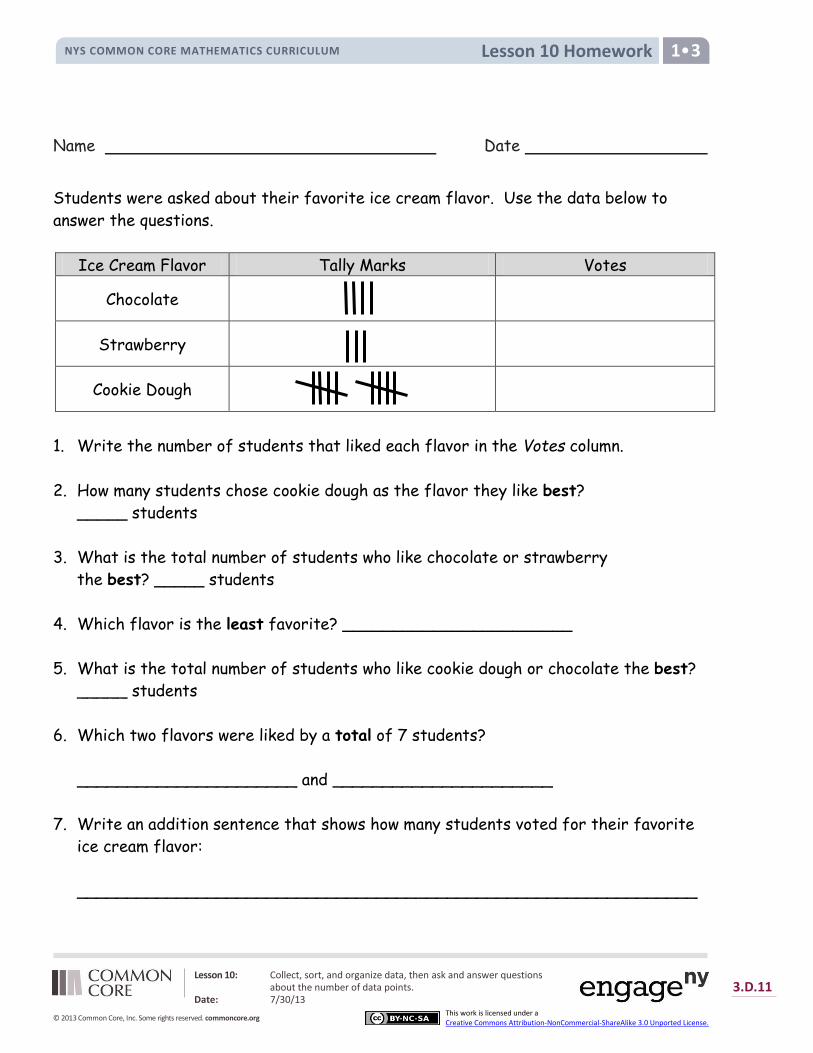
Lesson 10 Homework NYS COMMON CORE MATHEMATICS CURRICULUM 1
Name Date
Students were asked about their favorite ice cream flavor. Use the data below to
answer the questions.
Ice Cream Flavor Tally Marks Votes
Chocolate
Strawberry
Cookie Dough
1. Write the number of students that liked each flavor in the Votes column.
2. How many students chose cookie dough as the flavor they like best?
_____ students
3. What is the total number of students who like chocolate or strawberry
the best? _____ students
4. Which flavor is the least favorite? _______________________
5. What is the total number of students who like cookie dough or chocolate the best?
_____ students
6. Which two flavors were liked by a total of 7 students?
______________________ and ______________________
7. Write an addition sentence that shows how many students voted for their favorite
ice cream flavor:
______________________________________________________________

Lesson 10: Collect, sort, and organize data, then ask and answer questions about the number of data points.
Date: 7/30/13
3.D.12
© 2013 Common Core, Inc. Some rights reserved. commoncore.org This work is licensed under a Creative Commons Attribution-NonCommercial-ShareAlike 3.0 Unported License.
Lesson 10 Homework NYS COMMON CORE MATHEMATICS CURRICULUM 1
Students voted on what they like to read the most. Organize the data using tally
marks and then answer the questions.
What Students Like to Read the Most Number of People
Comic Book
Magazine
Chapter Book
1. How many students like to read chapter books? _____ students
2. Which item is the least favorite to read among the students? ________________
3. How many more students like to read chapter books than magazines?
_____students
4. What is the total number of students that like to read magazines or chapter books? _____students
5. Which two items did a total of 9 students like to read?
6. ______________________ and ______________________
7. Write an addition sentence that shows how many students voted.
comic book magazine chapter book comic book magazine magazine chapter
book comic book comic book chapter book chapter book magazine chapter
book chapter book magazine
comic book magazine chapter book comic book magazine
magazine
chapter book comic book comic book chapter book chapter book
magazine chapter book chapter book magazine

Lesson 11 NYS COMMON CORE MATHEMATICS CURRICULUM 1
Lesson 11: Collect, sort, and organize data, then ask and answer questions about the number of data points.
Date: 7/30/13
3.D.13
© 2013 Common Core, Inc. Some rights reserved. commoncore.org This work is licensed under a Creative Commons Attribution-NonCommercial-ShareAlike 3.0 Unported License.
NOTES ON
MULTIPLE MEANS OF
REPRESENTATION:
Remember that the strength of the
Sprint is in students’ on-going
experience of success. The tendency
is to want to compete with a peer
rather than with themselves. At
times, it is wise to downplay who
improved the most or who got the
most correct, but rather opt for self-
reflection:
Who felt they tried hard today?
Who feels they have improved with their subtraction since the beginning of first grade?
Who feels they are memorizing more facts?
Lesson 11
Objective: Collect, sort, and organize data, then ask and answer questions about the number of data points.
Suggested Lesson Structure
Fluency Practice (10 minutes)
Application Problem (5 minutes)
Concept Development (35 minutes)
Student Debrief (10 minutes)
Total Time (60 minutes)
Fluency Practice (10 minutes)
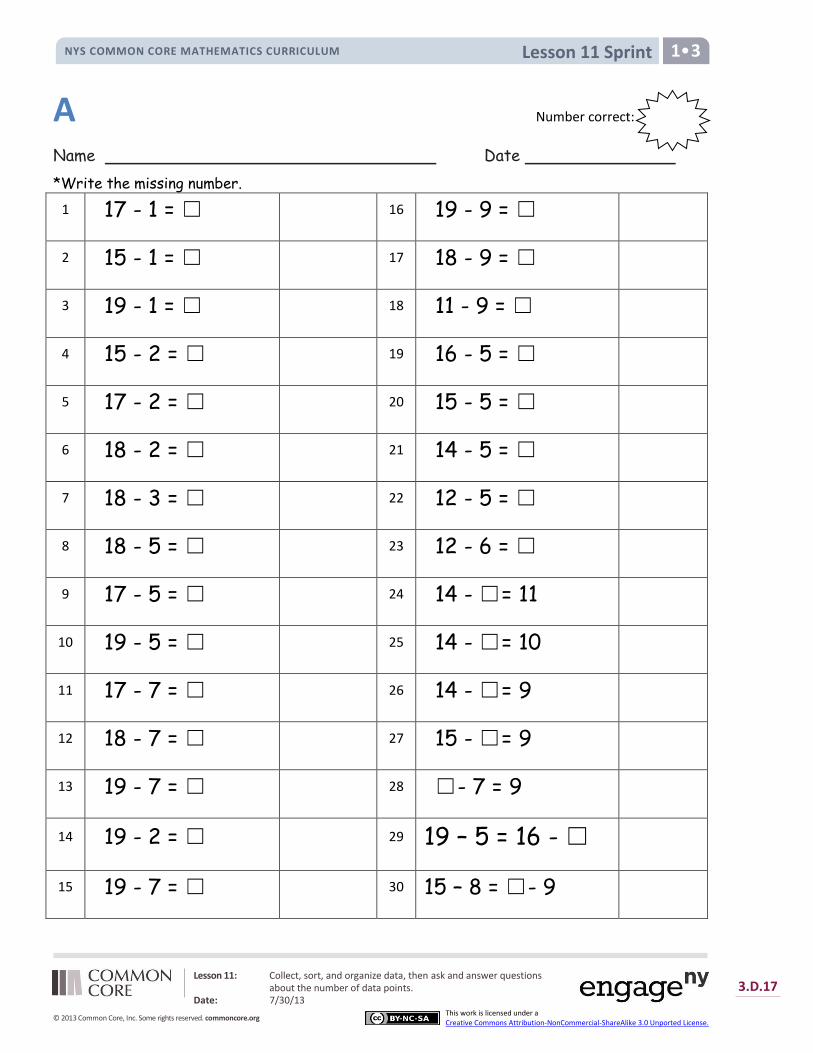
Sprint: Subtraction Within 20 1.OA.6 (10 minutes)
Sprint: Subtraction Within 20 (10 minutes)
Materials: (S) Subtraction Within 20 Sprint
Note: This Sprint addresses the Grade 1 objective of subtracting within 20. This is the second time students are seeing this Sprint. Ask students if they were able to complete more problems than the last time they tried this Sprint.
Application Problem (5 minutes)
Larry asked his friends whether dogs or cats are smarter. Nine of his friends think dogs are smarter and 6 think cats are smarter. Make a table to show Larry’s data collection. How many friends did he ask?
Note: This Application Problem reviews data collection (G1–M3–L10). Some students may show their work with simple shapes such as lines or circles, while others may experiment with tally marks.

Lesson 11 NYS COMMON CORE MATHEMATICS CURRICULUM 1
Lesson 11: Collect, sort, and organize data, then ask and answer questions about the number of data points.
Date: 7/30/13
3.D.14
© 2013 Common Core, Inc. Some rights reserved. commoncore.org This work is licensed under a Creative Commons Attribution-NonCommercial-ShareAlike 3.0 Unported License.
NOTES ON
MULTIPLE MEANS OF
ENGAGEMENT:
Connect literature with the table
students will be making in class today.
Maybe you have a favorite selection, or
you can visit your school librarian to
check one out. Read it before making
the table to get your student’s ready
with ideas.
Concept Development (35 minutes)
Materials: (T) Chart paper with a table entitled, Favorite Rainy Day Activities with Activity and Number of Students on the top line, class list (S) Clipboard, class list (preferably with first names in alphabetical order)
Have students sit in the meeting area in a semi-circle formation.
T: (Post the chart.) Let’s brainstorm some of our favorite rainy day activities and make a table to see how many students like which activity the best and compare the information. To make this table, what do we need to do first? Turn and talk to your partner.
S: (Answers may vary.) We need to figure out the choices we will vote on.
T: You are right! What are some of your favorite things to do on a rainy day?
Answers may vary. Choose three activities and write them down on the chart in the first column. For example, they could be read a book, watch a movie, and play board games.
T: Now what do we do? Turn and talk to your partner.
S: We need to ask around and get everyone to vote. We need to write down who likes which activity the best. We can use 5-group rows to show our votes. We can use tally marks to show everyone’s votes.
T: If we want to compare the information on the table, what do you think is the best way to record the information? Why?
S: (Answers may vary.) 5-group rows help me see better because I can line them up with the other rows. I like using the tally marks because I can count more quickly.
T: Good thinking! (Project the class list.) To make sure I interview everyone and get everyone’s vote, I’m going to use the class list to help me keep track of who answered my question and what they voted for. (Start from the top of the list. Model collecting data using the class list by asking the first seven to eight students on the class list. Check off each name as a student volunteer either makes tally mark or draws a circle in 5-group rows on the table to represent each vote.)
To save time, ask the rest of the students to raise their hand as you call out a choice. Elicit one to two questions to interpret the data, and have students come up with additional questions for their partners to answer including any of the following:
How many students like to [watch a movie] the most on a rainy day?
Which rainy day activity is liked the most least by our class? The least? How can you tell from the table?
How many students like to [read a book] or [play board games] the most on a rainy day?
If two more students voted for [watching a movie], how many students would like [watching a movie] the best?
MP.3

Lesson 11 NYS COMMON CORE MATHEMATICS CURRICULUM 1
Lesson 11: Collect, sort, and organize data, then ask and answer questions about the number of data points.
Date: 7/30/13
3.D.15
© 2013 Common Core, Inc. Some rights reserved. commoncore.org This work is licensed under a Creative Commons Attribution-NonCommercial-ShareAlike 3.0 Unported License.
T: Just like we created this entire table as a class, you will now get to create your own table! Let’s look at the Problem Set together to see how!
Problem Set (20 minutes)
Students should do their personal best to create questions based on their tables in the Problem Set and answering their partner’s questions within the allotted 20 minutes.
Read over the Problem Set directions and go over the steps to follow. Distribute the Problem Set and a class list. Give students approximately 20 minutes to collect and organize their data.
Students who need more structured directions can work in a small group with the teacher for step-by-step guidance.
Photocopy today’s Problem Set on two separate sheets of paper so that students can set their papers side by side as they refer to their tables and design questions.
Student Debrief (10 minutes)
Lesson Objective: Collect, sort, and organize data, then ask and answer questions about the number of data points.
The Student Debrief is intended to invite reflection and active processing of the total lesson experience.
Invite students to review their solutions for the Problem Set. They should check work by comparing answers with a partner before going over answers as a class. Look for misconceptions or misunderstandings that can be addressed in the Debrief. Guide students in a conversation to debrief the Problem Set and process the lesson.
You may choose to use any combination of the questions below to lead the discussion.
How did you organize your data?
How could you have used tallies? Pictures? Shapes? What other ways might someone organize data?
How did you solve Problem 4?

Lesson 11 NYS COMMON CORE MATHEMATICS CURRICULUM 1
Lesson 11: Collect, sort, and organize data, then ask and answer questions about the number of data points.
Date: 7/30/13
3.D.16
© 2013 Common Core, Inc. Some rights reserved. commoncore.org This work is licensed under a Creative Commons Attribution-NonCommercial-ShareAlike 3.0 Unported License.
How did you solve Problem 5? How can you solve Problem 5 by looking at your notes on the class list? Which would be easier to use to find the answer, the class list or the table?
Look at your Application Problem. How did you organize your data? How did you solve the problem?
Exit Ticket (3 minutes)
After the Student Debrief, instruct students to complete the Exit Ticket. A review of their work will help you assess the students’ understanding of the concepts that were presented in the lesson today and plan more effectively for future lessons. You may read the questions aloud to the students.
Lesson 11: Collect, sort, and organize data, then ask and answer questions about the number of data points.
Date: 7/30/13
3.D.17
© 2013 Common Core, Inc. Some rights reserved. commoncore.org This work is licensed under a Creative Commons Attribution-NonCommercial-ShareAlike 3.0 Unported License.
Lesson 11 Sprint NYS COMMON CORE MATHEMATICS CURRICULUM 1
Name Date
*Write the missing number.
1 17 - 1 = ☐ 16 19 - 9 = ☐
2 15 - 1 = ☐ 17 18 - 9 = ☐
3 19 - 1 = ☐ 18 11 - 9 = ☐
4 15 - 2 = ☐ 19 16 - 5 = ☐
5 17 - 2 = ☐ 20 15 - 5 = ☐
6 18 - 2 = ☐ 21 14 - 5 = ☐
7 18 - 3 = ☐ 22 12 - 5 = ☐
8 18 - 5 = ☐ 23 12 - 6 = ☐
9 17 - 5 = ☐ 24 14 - ☐ = 11
10 19 - 5 = ☐ 25 14 - ☐ = 10
11 17 - 7 = ☐ 26 14 - ☐ = 9
12 18 - 7 = ☐ 27 15 - ☐ = 9
13 19 - 7 = ☐ 28 ☐ - 7 = 9
14 19 - 2 = ☐ 29 19 – 5 = 16 - ☐
15 19 - 7 = ☐ 30 15 – 8 = ☐ - 9
Number correct: A

Lesson 11: Collect, sort, and organize data, then ask and answer questions about the number of data points.
Date: 7/30/13
3.D.18
© 2013 Common Core, Inc. Some rights reserved. commoncore.org This work is licensed under a Creative Commons Attribution-NonCommercial-ShareAlike 3.0 Unported License.
Lesson 11 Sprint NYS COMMON CORE MATHEMATICS CURRICULUM 1
Name Date
*Write the missing number.
B Number correct:
Lesson 11: Collect, sort, and organize data, then ask and answer questions about the number of data points.
Date: 7/30/13
3.D.19
© 2013 Common Core, Inc. Some rights reserved. commoncore.org This work is licensed under a Creative Commons Attribution-NonCommercial-ShareAlike 3.0 Unported License.
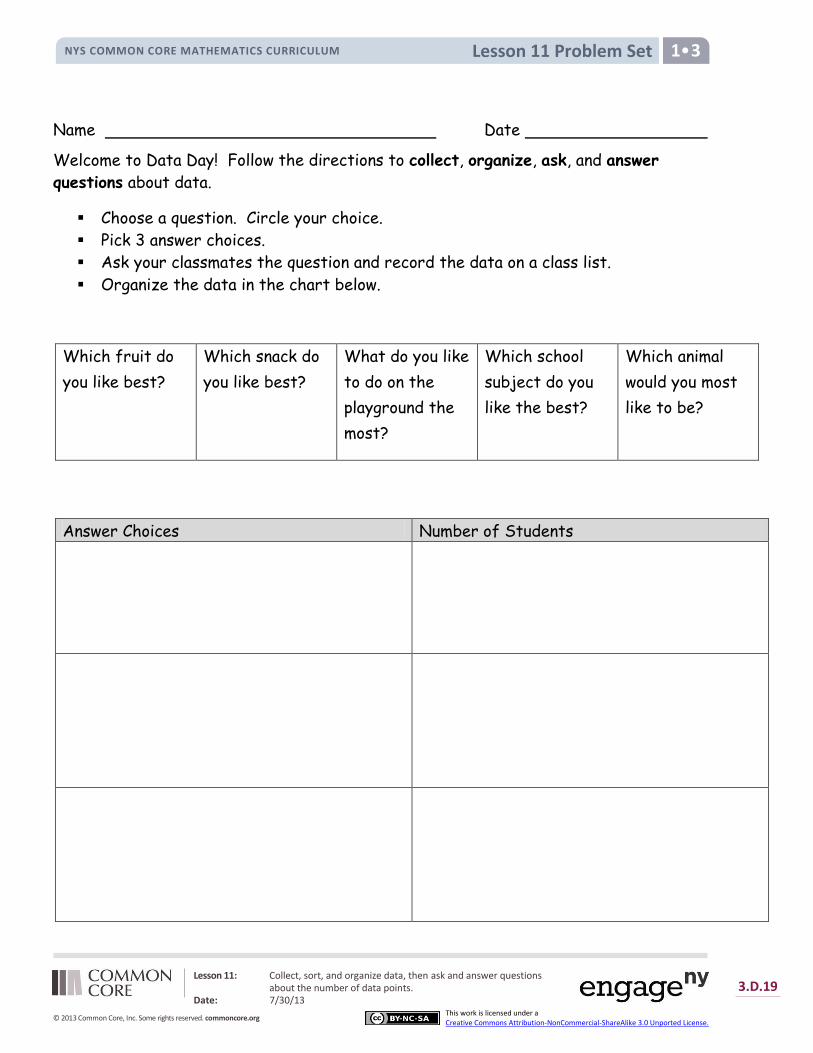
Lesson 11 Problem Set NYS COMMON CORE MATHEMATICS CURRICULUM 1
Name Date
Welcome to Data Day! Follow the directions to collect, organize, ask, and answer
questions about data.
Choose a question. Circle your choice.
Pick 3 answer choices.
Ask your classmates the question and record the data on a class list.
Organize the data in the chart below.
Which fruit do
you like best?
Which snack do
you like best?
What do you like
to do on the
playground the
most?
Which school
subject do you
like the best?
Which animal
would you most
like to be?
Answer Choices Number of Students

Lesson 11: Collect, sort, and organize data, then ask and answer questions about the number of data points.
Date: 7/30/13
3.D.20
© 2013 Common Core, Inc. Some rights reserved. commoncore.org This work is licensed under a Creative Commons Attribution-NonCommercial-ShareAlike 3.0 Unported License.
Lesson 11 Problem Set NYS COMMON CORE MATHEMATICS CURRICULUM 1
Complete the question sentence frames to ask questions about your data.
Trade papers with a partner and have your partner answer your questions.
1. How many students liked _____________ the best?
2. How many students liked _____________ the least?
3. How many more students liked _____________ than _________________?
4. What is the total number of students that liked _____________ or
_____________ the best?
5. How many total students answered the question?

Lesson 11: Collect, sort, and organize data, then ask and answer questions about the number of data points.
Date: 7/30/13
3.D.21
© 2013 Common Core, Inc. Some rights reserved. commoncore.org This work is licensed under a Creative Commons Attribution-NonCommercial-ShareAlike 3.0 Unported License.
Lesson 11 Exit Ticket NYS COMMON CORE MATHEMATICS CURRICULUM 1
Name Date
A class collected the information in the chart below. Students asked each other:
Among stuffed animals, toy cars, and blocks, which is your favorite toy?
Then, they organized the information on this chart.
Toy Students’ Favorite Toy
stuffed animals 15
toy cars 9
blocks 18
1. How many students chose toy cars? _________
2. How many more students chose blocks than stuffed animals? _________
3. How many students would need to choose toy cars to equal the number of students
who chose blocks? _________
Lesson 11: Collect, sort, and organize data, then ask and answer questions about the number of data points.
Date: 7/30/13
3.D.22
© 2013 Common Core, Inc. Some rights reserved. commoncore.org This work is licensed under a Creative Commons Attribution-NonCommercial-ShareAlike 3.0 Unported License.
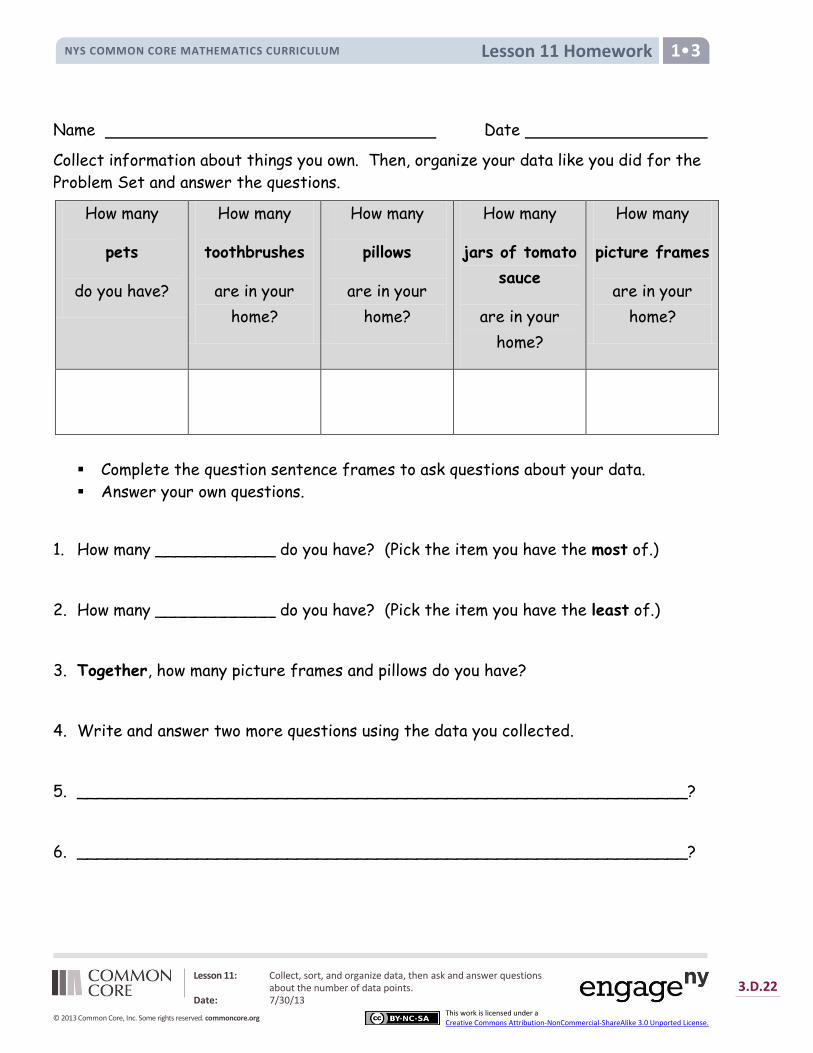
Lesson 11 Homework NYS COMMON CORE MATHEMATICS CURRICULUM 1
Name Date
Collect information about things you own. Then, organize your data like you did for the
Problem Set and answer the questions.
How many
pets
do you have?
How many
toothbrushes
are in your
home?
How many
pillows
are in your
home?
How many
jars of tomato
sauce
are in your
home?
How many
picture frames
are in your
home?
Complete the question sentence frames to ask questions about your data.
Answer your own questions.
1. How many ____________ do you have? (Pick the item you have the most of.)
2. How many ____________ do you have? (Pick the item you have the least of.)
3. Together, how many picture frames and pillows do you have?
4. Write and answer two more questions using the data you collected.
5. _____________________________________________________________?
6. _____________________________________________________________?

Lesson 11: Collect, sort, and organize data, then ask and answer questions about the number of data points.
Date: 7/30/13
3.D.23
© 2013 Common Core, Inc. Some rights reserved. commoncore.org This work is licensed under a Creative Commons Attribution-NonCommercial-ShareAlike 3.0 Unported License.
Lesson 11 Homework NYS COMMON CORE MATHEMATICS CURRICULUM 1
Students took a poll asking which museum is their favorite to visit. Each student could
only vote once. Answer the questions based on the table.
Science Museum
Art Museum
History Museum
1. How many students chose art museums? _______ students
2. How many students chose the art museum or the science museum?
_______ students
3. From this data, can you tell how many students are in this class?
Lesson 12 NYS COMMON CORE MATHEMATICS CURRICULUM 1
Lesson 12: Ask and answer varied word problem types about a data set with three categories.
Date: 7/30/13
3.D.24
© 2013 Common Core, Inc. Some rights reserved. commoncore.org This work is licensed under a Creative Commons Attribution-NonCommercial-ShareAlike 3.0 Unported License.
NOTES ON
MULTIPLE MEANS FOR
ACTION AND
EXPRESSION:
When playing games with your
students, provide a variety of ways to
respond. Oral fluency games should be
adjusted for deaf and hearing impaired
students. This can be done in many
ways including showing the answer
with fingers, using student boards to
write answers, or using a visual signal
or vibration.
Lesson 12
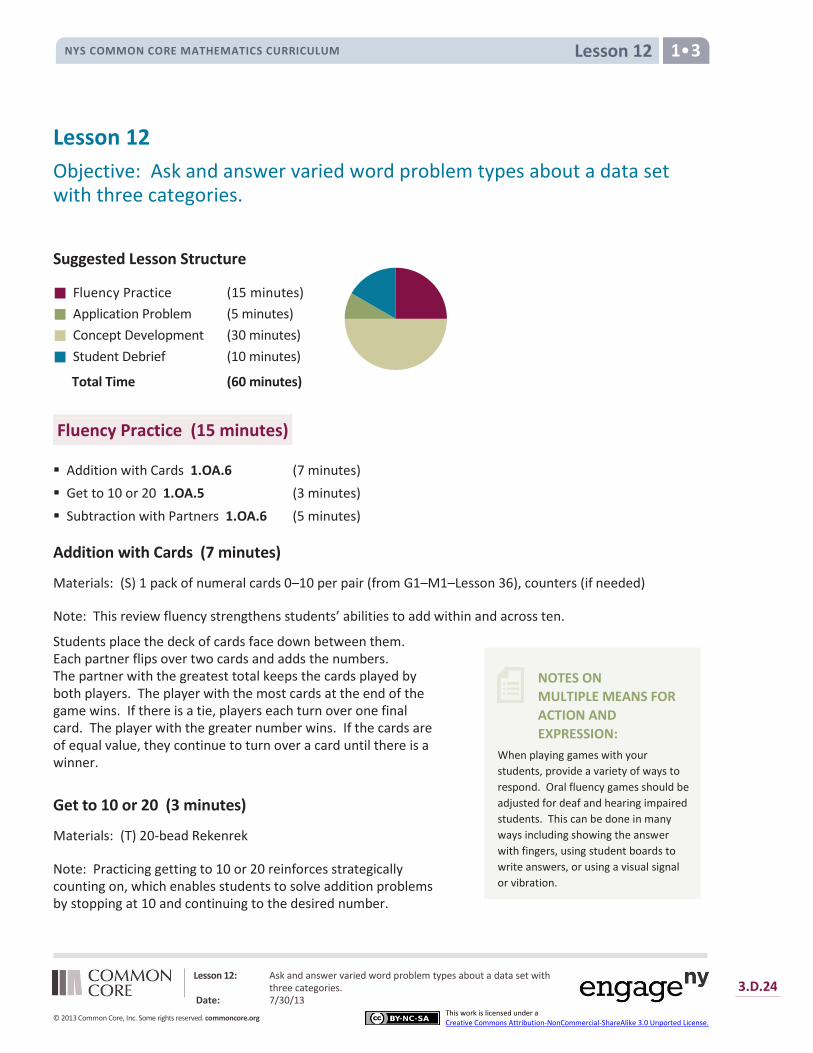
Objective: Ask and answer varied word problem types about a data set with three categories.
Suggested Lesson Structure
Fluency Practice (15 minutes)
Application Problem (5 minutes)
Concept Development (30 minutes)
Student Debrief (10 minutes)
Total Time (60 minutes)
Fluency Practice (15 minutes)
Addition with Cards 1.OA.6 (7 minutes)
Get to 10 or 20 1.OA.5 (3 minutes)
Subtraction with Partners 1.OA.6 (5 minutes)
Addition with Cards (7 minutes)
Materials: (S) 1 pack of numeral cards 0–10 per pair (from G1–M1–Lesson 36), counters (if needed)
Note: This review fluency strengthens students’ abilities to add within and across ten.
Students place the deck of cards face down between them. Each partner flips over two cards and adds the numbers. The partner with the greatest total keeps the cards played by both players. The player with the most cards at the end of the game wins. If there is a tie, players each turn over one final card. The player with the greater number wins. If the cards are of equal value, they continue to turn over a card until there is a winner.
Get to 10 or 20 (3 minutes)
Materials: (T) 20-bead Rekenrek
Note: Practicing getting to 10 or 20 reinforces strategically counting on, which enables students to solve addition problems by stopping at 10 and continuing to the desired number.
Lesson 12 NYS COMMON CORE MATHEMATICS CURRICULUM 1
Lesson 12: Ask and answer varied word problem types about a data set with three categories.
Date: 7/30/13
3.D.25
© 2013 Common Core, Inc. Some rights reserved. commoncore.org This work is licensed under a Creative Commons Attribution-NonCommercial-ShareAlike 3.0 Unported License.
T: (Show 8 on the Rekenrek.) What number do you see?
S: 8.
T: Give me the complete number sentence to get to 10.
S: 8 + 2 = 10.
T: (Move two beads to make 10.) Good. (Show 18.) What number do you see?
S: 18.
T: Give me the complete number sentence to get to 20.
S: 18 + 2 = 20.
Add two beads to confirm, then continue with other numbers within 20.
Subtraction with Partners (5 minutes)
Materials: (S) Personal white boards
Note: This fluency reviews subtracting 7, 8, and 9 from teen numbers. Allow students who still require pictorial representations to draw 5-groups to solve.
Assign partners of equal ability. Partners assign each other a number from 11 to 17 (e.g., 12). On their personal white boards, they write number sentences with 9, 8, and 7 as the subtrahend and solve them (e.g., 12 – 9 = 3, 12 – 8 = 4, 12 – 7 = 5). Partners then exchange white boards and check each other’s work.
Application Problem (5 minutes)
Kingston’s class took a trip to the zoo. He collected data about his favorite African animals. He saw 2 lions, 11 gorillas, and 7 zebras. What does his table look like? Write one question your classmate can answer by looking at the table.
Note: Students may use any of the methods to collect data from the previous lessons. As they are working, circulate and notice how students are representing the data. Encourage them to line up their shapes and focus on organization. Remind students that they need to use the same symbol to represent the information throughout their table. Representations should make counting and comparing data easy. During the Debrief, the students will share and answer their partners’ questions.

Lesson 12 NYS COMMON CORE MATHEMATICS CURRICULUM 1
Lesson 12: Ask and answer varied word problem types about a data set with three categories.
Date: 7/30/13
3.D.26
© 2013 Common Core, Inc. Some rights reserved. commoncore.org This work is licensed under a Creative Commons Attribution-NonCommercial-ShareAlike 3.0 Unported License.
NOTES ON
MULTIPLE MEANS OF
REPRESENTATION:
Students demonstrate a true
understanding of math concepts when
they can apply them in a variety of
situations. Often students learn math
concepts in an isolated fashion and
they do not see how to transfer their
application to new situations.
Celebrate student success when they
make these connections.
Concept Development (30 minutes)
Materials: (T) Chart with a three-column vertical graph entitled Our Favorite Fruits, chart with rules of proper measuring from G1–M3–Lesson 8 (post on the side of the board), Favorite Read Aloud Books from G1–M3–Lesson 10 (S) Sticky notes, personal white boards
Distribute one sticky note at each student’s seat. Have students sit in the meeting area in a semi-circle formation.
T: (Post Our Favorite Fruits graph.) What are some of your favorite fruits?
S: (Responses may vary. Choose only three, or possibly four, categories from the students’ suggestions.) Strawberries. Watermelon. Apples.
Fill in the three categories as students make suggestions. Have students go back to their seats, write their names on sticky notes, and come back to the meeting area with them.
T: My vote is for strawberry as my favorite fruit. I’m going to place it right beneath the line where it says Strawberry. (Model.) Who likes watermelon the best? (Choose a student to come up.) He’s also going to place his sticky note, right beneath the line where it says Watermelon. (Choose another student to come up and place her sticky note for Apple. Be sure to have these sticky notes aligned with each other.)
T: We need one more person who likes strawberries the most. (Have the student come up.) When he puts his sticky note, he’s going to put it right beneath my sticky note, so there are no overlap or gaps.
T: (Call up one third of the class to post their votes, encouraging them to avoid making gaps or overlaps between the sticky notes.) What do you notice about the rules of completing this chart with our votes on the sticky notes?
S: The rules are just like the rules for measuring! We had to line up our endpoints when we first started! We couldn’t have any overlaps or gaps. The sticky notes are the same size, the same length unit.
T: Excellent connections! Let’s have the rest of the class complete the graph as they put up their votes following these rules.
T: Which fruit is the most popular among our students? Which fruit has the least number of votes? How can you tell?
S: I counted. The fruit with the highest total is the most popular. I just looked at the sticky notes. The longest strip of notes means the most votes. The shortest strip means the least number of votes. This reminds me of measuring again! The one that used the most length units to measure is the longest one, and that is the most popular fruit!
T: How many students voted for strawberries? Watermelon? Apples? (Record the number amount on the graph.) When we organize our data this way, it makes it easy for us to compare. We call this a graph. A graph lets us see the data easily. In this graph, it lines up our data just like when we

Lesson 12 NYS COMMON CORE MATHEMATICS CURRICULUM 1
Lesson 12: Ask and answer varied word problem types about a data set with three categories.
Date: 7/30/13
3.D.27
© 2013 Common Core, Inc. Some rights reserved. commoncore.org This work is licensed under a Creative Commons Attribution-NonCommercial-ShareAlike 3.0 Unported License.
measure lengths of different items, so we can easily compare.
T: (Point to the corresponding parts of the graph and ask.) Which received more votes, strawberries or watermelon?
S: Category ___.
T: Did you have to look at the numbers for each, or could you see it just by looking at the lengths of the bars?
S: I just looked at the bar. The longer bar has more. T: How many more students would Category A need to have the same amount as Category B? Tell your partner how you figured it out.
S: I just counted the part that was longer, the part that was sticking out. I used subtraction. I used addition with a mystery number in the middle. This reminds me of measuring again! We used all of these strategies when we tried to figure out which length was longer when we compared two things!
T: You are right! So, how many more votes did Category ___ receive than Category ___?
T: (Using the same two categories as above, rephrase the question.) How many fewer votes did Category ___ receive than Category ___?
Continue to ask compare with difference unknown problems and put together with result unknown problems presented by this graph. Ask students to write a number sentence to show how they got their answer using their personal white boards. If time allows, use Favorite Read Aloud Books from G1–M3–Lesson 10 to answer more compare with difference unknown problems. Students may work with their partners to answer each other’s questions.
Problem Set (10 minutes)
Students should do their personal best to complete the Problem Set within the allotted 10 minutes. For some classes, it may be appropriate to modify the assignment by specifying which problems they work on first.
Student Debrief (10 minutes)
Lesson Objective: Ask and answer varied word problem types about a data set with three categories.
The Student Debrief is intended to invite reflection and active processing of the total lesson experience.
Invite students to review their solutions for the Problem Set. They should check work by comparing answers with a partner before going over answers as a class. Look for misconceptions or misunderstandings that can be addressed in the Debrief. Guide students in a conversation to debrief the Problem Set and process the lesson.
Lesson 12 NYS COMMON CORE MATHEMATICS CURRICULUM 1
Lesson 12: Ask and answer varied word problem types about a data set with three categories.
Date: 7/30/13
3.D.28
© 2013 Common Core, Inc. Some rights reserved. commoncore.org This work is licensed under a Creative Commons Attribution-NonCommercial-ShareAlike 3.0 Unported License.
You may choose to use any combination of the questions below to lead the discussion.
What are the strategies to figure out how many more or fewer votes a category received compared to the other?
How are tables and graphs similar? How are they different? (Tables and graphs both organize information. With a graph, the information can be compared in a way similar to how length units can be compared.)
How are the graphs in Problem 3 and 5 different? How are they similar?
How is measuring objects similar to creating graphs like these to compare information about different categories?
How does a graph that is created properly help you see and understand its information better? Did you follow these rules when you made your graph for Problem 1?
Look at your Application Problem. What question did you come up with? Share with your partner and answer each other’s questions.
Exit Ticket (3 minutes)
After the Student Debrief, instruct students to complete the Exit Ticket. A review of their work will help you assess the students’ understanding of the concepts that were presented in the lesson today and plan more effectively for future lessons. You may read the questions aloud to the students.
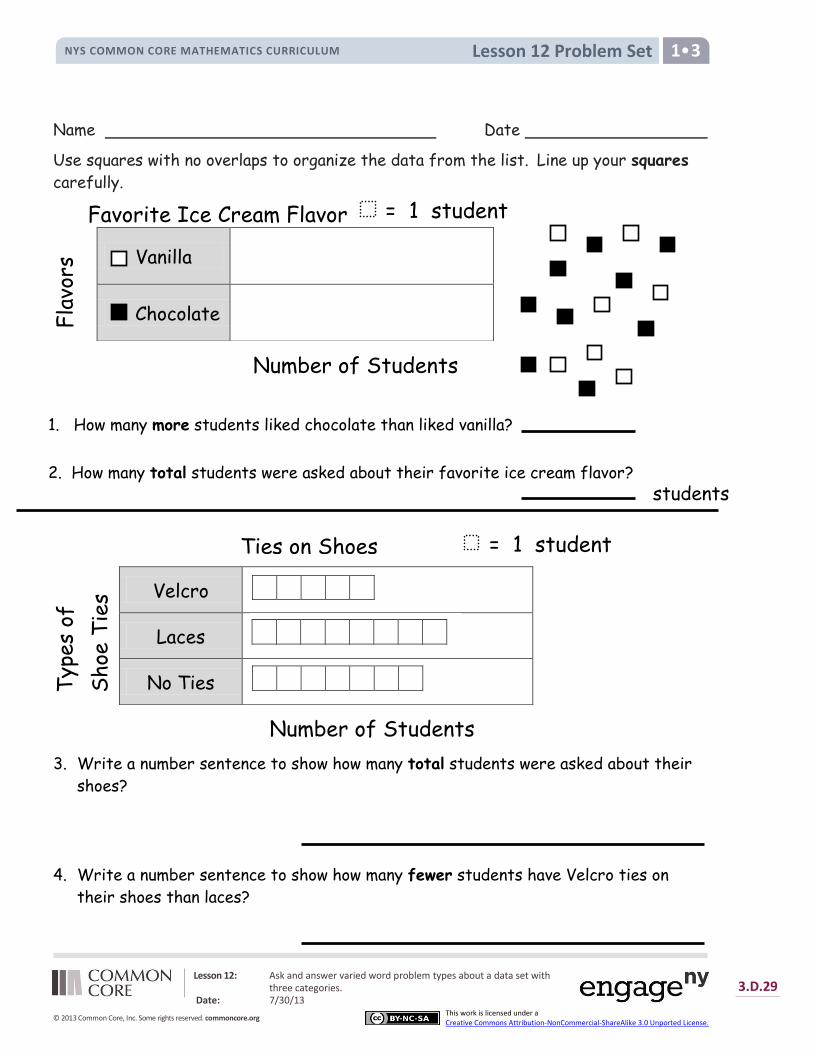
Lesson 12 Problem Set NYS COMMON CORE MATHEMATICS CURRICULUM 1
Lesson 12: Ask and answer varied word problem types about a data set with three categories.
Date: 7/30/13
3.D.29
© 2013 Common Core, Inc. Some rights reserved. commoncore.org This work is licensed under a Creative Commons Attribution-NonCommercial-ShareAlike 3.0 Unported License.
Name Date
Use squares with no overlaps to organize the data from the list. Line up your squares
carefully.
3. Write a number sentence to show how many total students were asked about their
shoes?
4. Write a number sentence to show how many fewer students have Velcro ties on
their shoes than laces?
Vanilla
Chocolate
Velcro
Laces
No Ties
Favorite Ice Cream Flavor
Ties on Shoes
Number of Students
Number of Students
Fla
vors
T
ypes
of
Shoe
Tie
s
1. How many more students liked chocolate than liked vanilla?
2. How many total students were asked about their favorite ice cream flavor?
students
= 1 student
= 1 student
Lesson 12 Problem Set NYS COMMON CORE MATHEMATICS CURRICULUM 1
Lesson 12: Ask and answer varied word problem types about a data set with three categories.
Date: 7/30/13
3.D.30
© 2013 Common Core, Inc. Some rights reserved. commoncore.org This work is licensed under a Creative Commons Attribution-NonCommercial-ShareAlike 3.0 Unported License.
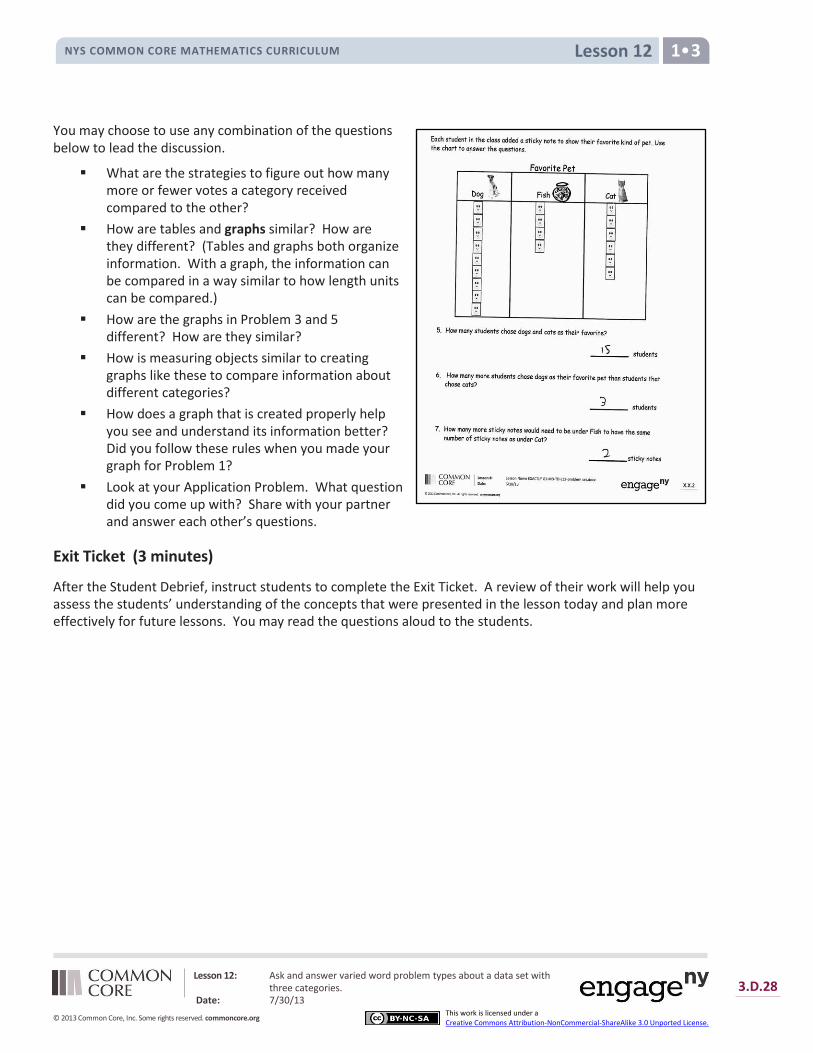
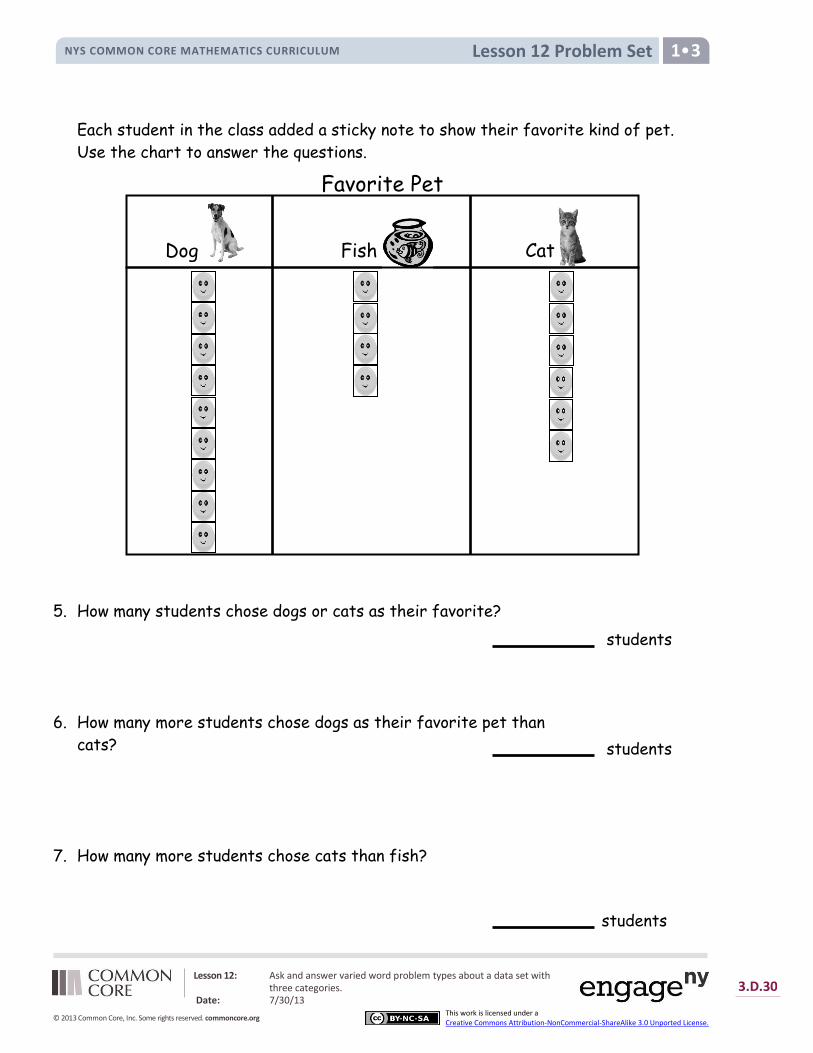
Each student in the class added a sticky note to show their favorite kind of pet.
Use the chart to answer the questions.
5. How many students chose dogs or cats as their favorite?
6. How many more students chose dogs as their favorite pet than
cats?
7. How many more students chose cats than fish?
Favorite Pet
students
students
students
Dog Cat Fish
Lesson 12 Exit Ticket NYS COMMON CORE MATHEMATICS CURRICULUM 1
Lesson 12: Ask and answer varied word problem types about a data set with three categories.
Date: 7/30/13
3.D.31
© 2013 Common Core, Inc. Some rights reserved. commoncore.org This work is licensed under a Creative Commons Attribution-NonCommercial-ShareAlike 3.0 Unported License.
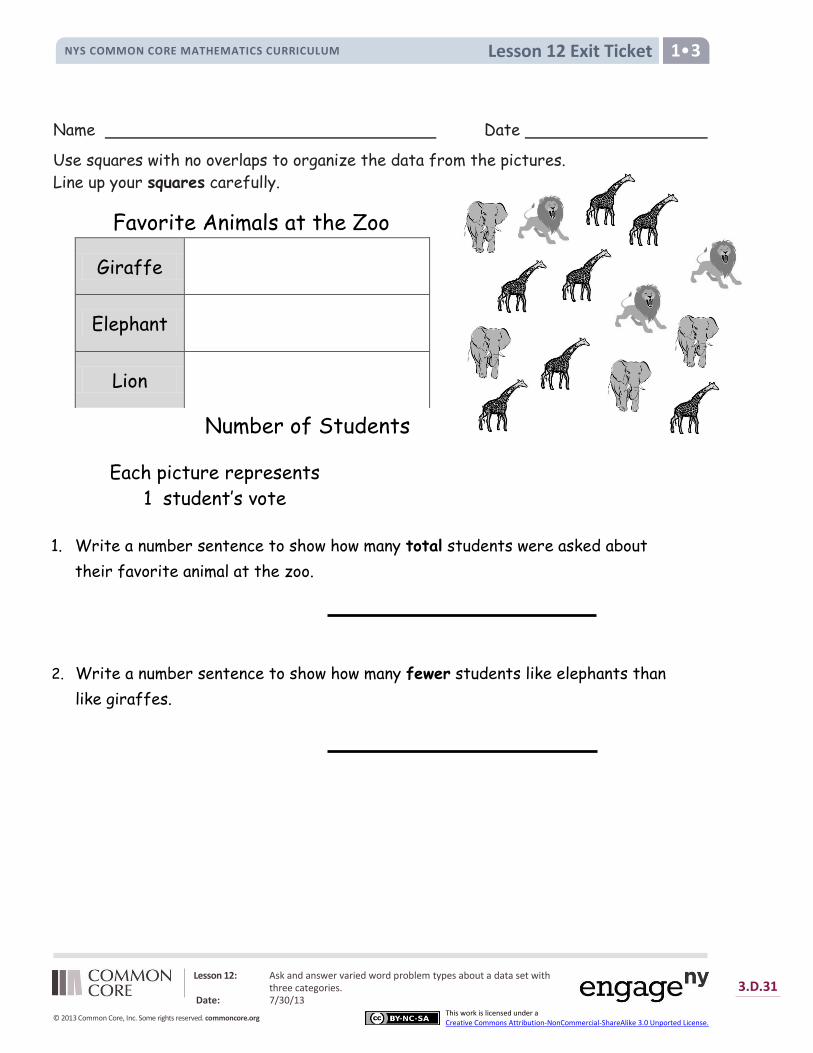
Name Date
Use squares with no overlaps to organize the data from the pictures.
Line up your squares carefully.
Giraffe
Elephant
Lion
2. Write a number sentence to show how many fewer students like elephants than
like giraffes.
Favorite Animals at the Zoo
Each picture represents
1 student’s vote
Number of Students
Ani
mal
s
1. Write a number sentence to show how many total students were asked about
their favorite animal at the zoo.
Lesson 12 Homework NYS COMMON CORE MATHEMATICS CURRICULUM 1
Lesson 12: Ask and answer varied word problem types about a data set with three categories.
Date: 7/30/13
3.D.32
© 2013 Common Core, Inc. Some rights reserved. commoncore.org This work is licensed under a Creative Commons Attribution-NonCommercial-ShareAlike 3.0 Unported License.
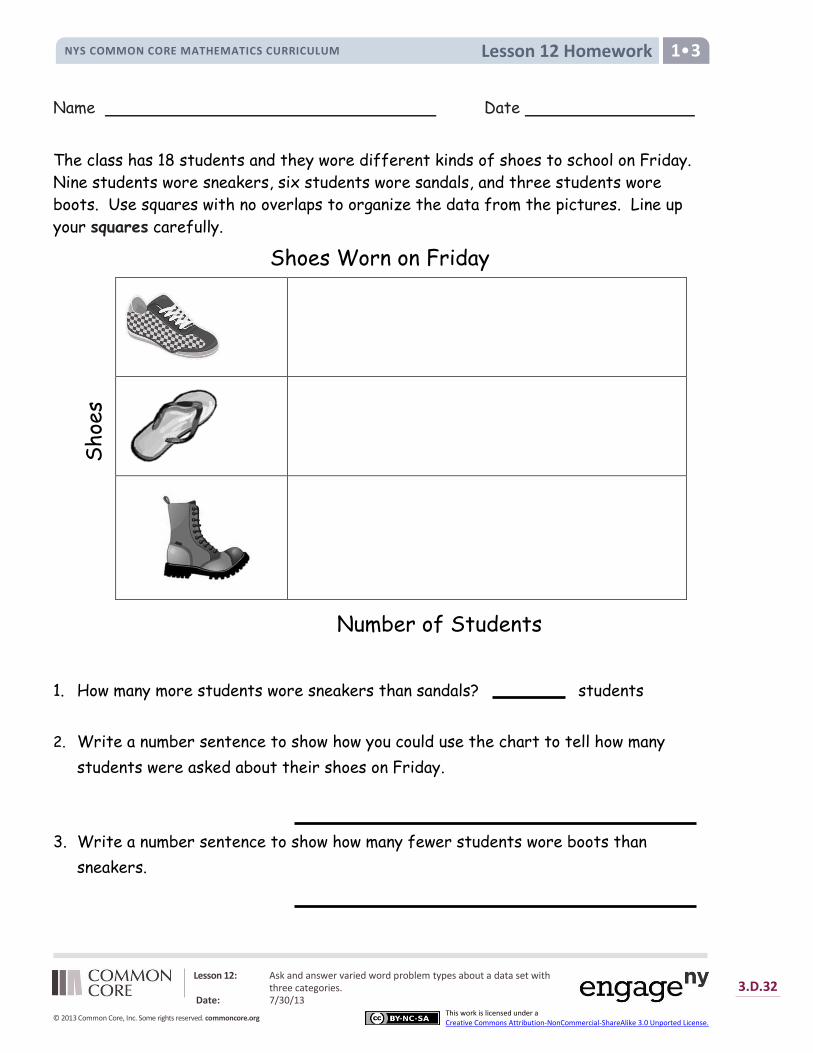
Name Date
The class has 18 students and they wore different kinds of shoes to school on Friday.
Nine students wore sneakers, six students wore sandals, and three students wore
boots. Use squares with no overlaps to organize the data from the pictures. Line up
your squares carefully.
1. How many more students wore sneakers than sandals? students
2. Write a number sentence to show how you could use the chart to tell how many
students were asked about their shoes on Friday.
3. Write a number sentence to show how many fewer students wore boots than
sneakers.
Number of Students
Shoes Worn on Friday
Shoe
s
Lesson 12 Homework NYS COMMON CORE MATHEMATICS CURRICULUM 1
Lesson 12: Ask and answer varied word problem types about a data set with three categories.
Date: 7/30/13
3.D.33
© 2013 Common Core, Inc. Some rights reserved. commoncore.org This work is licensed under a Creative Commons Attribution-NonCommercial-ShareAlike 3.0 Unported License.
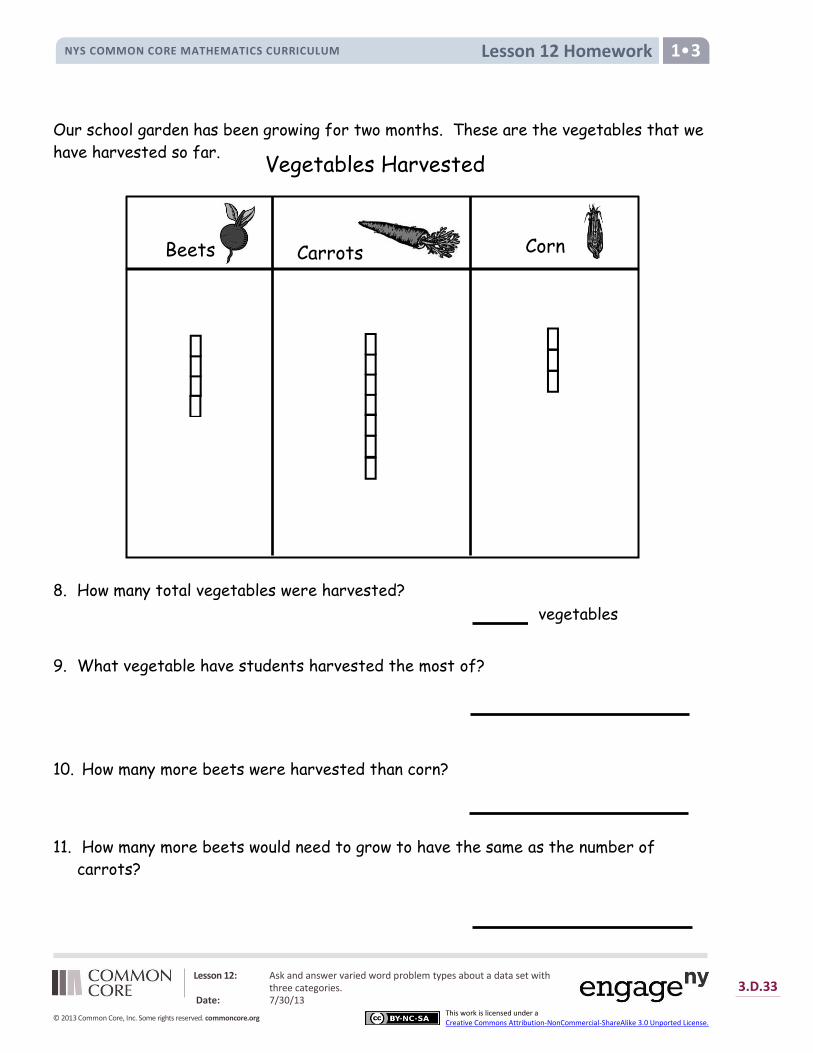
Our school garden has been growing for two months. These are the vegetables that we
have harvested so far.
8. How many total vegetables were harvested?
stud ents
9. What vegetable have students harvested the most of?
10. How many more beets were harvested than corn?
11. How many more beets would need to grow to have the same as the number of
carrots?
Vegetables Harvested
Carrots Beets Corn
Cat
vegetables
Lesson 13 NYS COMMON CORE MATHEMATICS CURRICULUM 1
Lesson 13: Ask and answer varied word problem types about a data set with three categories.
Date: 7/30/13
3.D.34
© 2013 Common Core, Inc. Some rights reserved. commoncore.org This work is licensed under a Creative Commons Attribution-NonCommercial-ShareAlike 3.0 Unported License.
Lesson 13
Objective: Ask and answer varied word problem types about a data set with three categories.
Suggested Lesson Structure
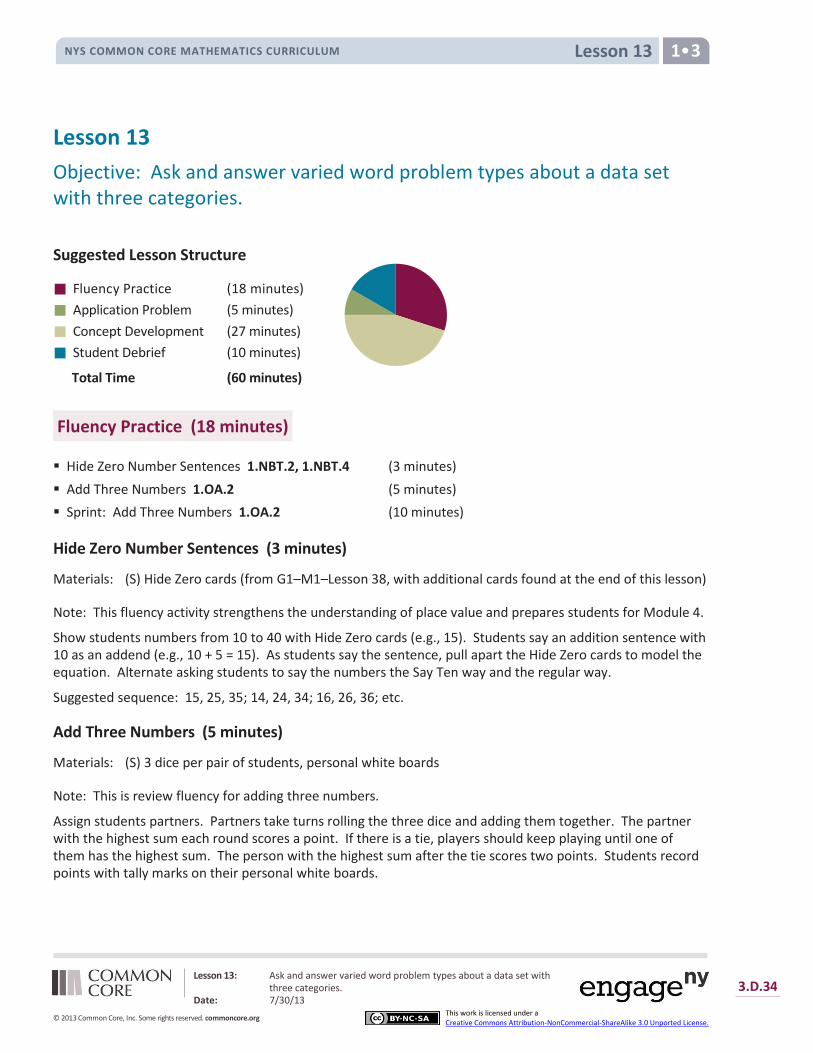
Fluency Practice (18 minutes)
Application Problem (5 minutes)
Concept Development (27 minutes)
Student Debrief (10 minutes)
Total Time (60 minutes)
Fluency Practice (18 minutes)
Hide Zero Number Sentences 1.NBT.2, 1.NBT.4 (3 minutes)
Add Three Numbers 1.OA.2 (5 minutes)
Sprint: Add Three Numbers 1.OA.2 (10 minutes)
Hide Zero Number Sentences (3 minutes)
Materials: (S) Hide Zero cards (from G1–M1–Lesson 38, with additional cards found at the end of this lesson)
Note: This fluency activity strengthens the understanding of place value and prepares students for Module 4.
Show students numbers from 10 to 40 with Hide Zero cards (e.g., 15). Students say an addition sentence with 10 as an addend (e.g., 10 + 5 = 15). As students say the sentence, pull apart the Hide Zero cards to model the equation. Alternate asking students to say the numbers the Say Ten way and the regular way.
Suggested sequence: 15, 25, 35; 14, 24, 34; 16, 26, 36; etc.
Add Three Numbers (5 minutes)
Materials: (S) 3 dice per pair of students, personal white boards
Note: This is review fluency for adding three numbers.
Assign students partners. Partners take turns rolling the three dice and adding them together. The partner with the highest sum each round scores a point. If there is a tie, players should keep playing until one of them has the highest sum. The person with the highest sum after the tie scores two points. Students record points with tally marks on their personal white boards.

Lesson 13 NYS COMMON CORE MATHEMATICS CURRICULUM 1
Lesson 13: Ask and answer varied word problem types about a data set with three categories.
Date: 7/30/13
3.D.35
© 2013 Common Core, Inc. Some rights reserved. commoncore.org This work is licensed under a Creative Commons Attribution-NonCommercial-ShareAlike 3.0 Unported License.
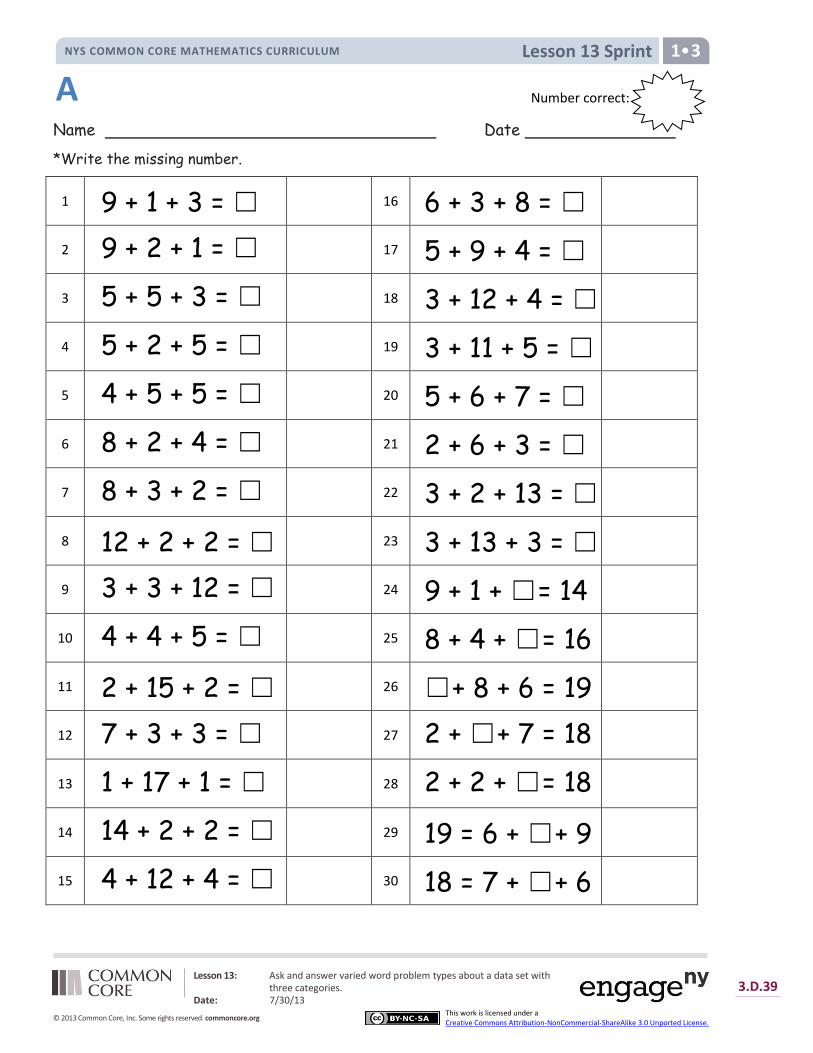
Sprint: Add Three Numbers (10 minutes)
Materials: (S) Add Three Numbers Sprint
Note: This Sprint provides students practice with adding three numbers within 20 and encourages students to apply properties of operations as strategies to add.
Application Problem (5 minutes)
Zoe wanted to make a friendship necklace for her closest friends. Make a graph to show the two colors of beads she used. She used 8 green beads for Lily, 4 purple beads for Jamilah, and 12 green beads for Sage. How many green beads did she use?
Note: As students finish, ask additional questions to help them interpret the data, focusing on Grade 1 problem types.
How many more purple beads would need to be used to have the same amount as the green beads?
How many fewer beads does Lily have than Sage?
If Lily added 3 beads to her necklace, how many more beads would she need to have the same amount as Sage?
Concept Development (27 minutes)
Materials: (T) Graph entitled Favorite Things to Make with Snow (S) Personal white boards
Note: Adjust the Concept Development as necessary based on your observations of student successes and challenges during Lesson 12, as well as during the most recent Application Problems. Today’s Concept Development is an opportunity to continue supporting student understanding of the compare with difference unknown problem types using appropriate number sentences as they interpret the given data.
Have students gather in the meeting area in a semi-circle formation with their personal white boards.
T: (Post the chart.) Here’s a graph I made yesterday after talking to the children in my neighborhood. I asked what they like to do in the snow, and this is what they said. What do you notice about this graph that is different from the graphs we used yesterday? What is similar?
S: The starting point is on the bottom on this graph. Yesterday, we started from the top. Today, they are built like towers. But it’s still following the rules. No overlaps. No gaps. The same

Lesson 13 NYS COMMON CORE MATHEMATICS CURRICULUM 1
Lesson 13: Ask and answer varied word problem types about a data set with three categories.
Date: 7/30/13
3.D.36
© 2013 Common Core, Inc. Some rights reserved. commoncore.org This work is licensed under a Creative Commons Attribution-NonCommercial-ShareAlike 3.0 Unported License.
NOTES ON
MULTIPLE MEANS FOR
ACTION AND
EXPRESSION:
Asking questions for comprehension
during this lesson is important to guide
students to evaluate their thinking.
This provides students an opportunity
to evaluate their process and analyze
errors.
endpoints.
T: Turn and talk to your partner about what you notice. What information can you gather from reading this graph?
Answers may vary. Be sure to record how many votes each category received.
T: How many people prefer building a snowman over making snow angels? How did you figure it out?
S: I looked at the snowman and snow angels columns. I counted on from 4 since they both have 3 votes. I already know that there are 3 votes for snow angels and 12 votes for the snowman, so I took away 3 from 12 and got 9.
T: I noticed that yesterday, many students counted to figure out which had more or fewer votes. What subtraction sentence can you use to solve this problem?
S: 12 – 3 = 9.
T: Explain to your partner how both of these strategies are related.
T: No matter how you solve this, we can use the number sentence 12 – 3 = 9 as a way to show how we solved the problem.
Continue to ask compare with difference unknown and put together with result unknown problems, encouraging students to include a number sentence. In all problems, have students discuss how both counting on and using a subtraction sentence are related to one another. You may use the following suggested sequence:
How many more children prefer making the snowman over building a fort? Making the snow angel over building a fort? Making the snowman or the snow angel?
How many children took this poll? (Note: Students might not be familiar with the word poll. Explain that a poll is a situation in which people vote. The teacher can give the example that, in this case, students were polled about their favorite things to make with snow.)
In the next set of questions, encourage students to visualize how the graph might change based on the information presented in the following situations:
How many more votes do we need if we want to make the number of votes for building the fort the same as making the snowman?
Some more children came by and answered the question. If there were 20 children total that answered the question, how many more children came by and voted?
If 4 more children came along and said they like building snow forts the most, then how many votes would there be for building forts?
In the beginning, you might want to use additional sticky notes or tiles for those students who need the concrete–visual support. Again, encourage students to use a number sentence to solve.
MP.2
Lesson 13 NYS COMMON CORE MATHEMATICS CURRICULUM 1
Lesson 13: Ask and answer varied word problem types about a data set with three categories.
Date: 7/30/13
3.D.37
© 2013 Common Core, Inc. Some rights reserved. commoncore.org This work is licensed under a Creative Commons Attribution-NonCommercial-ShareAlike 3.0 Unported License.
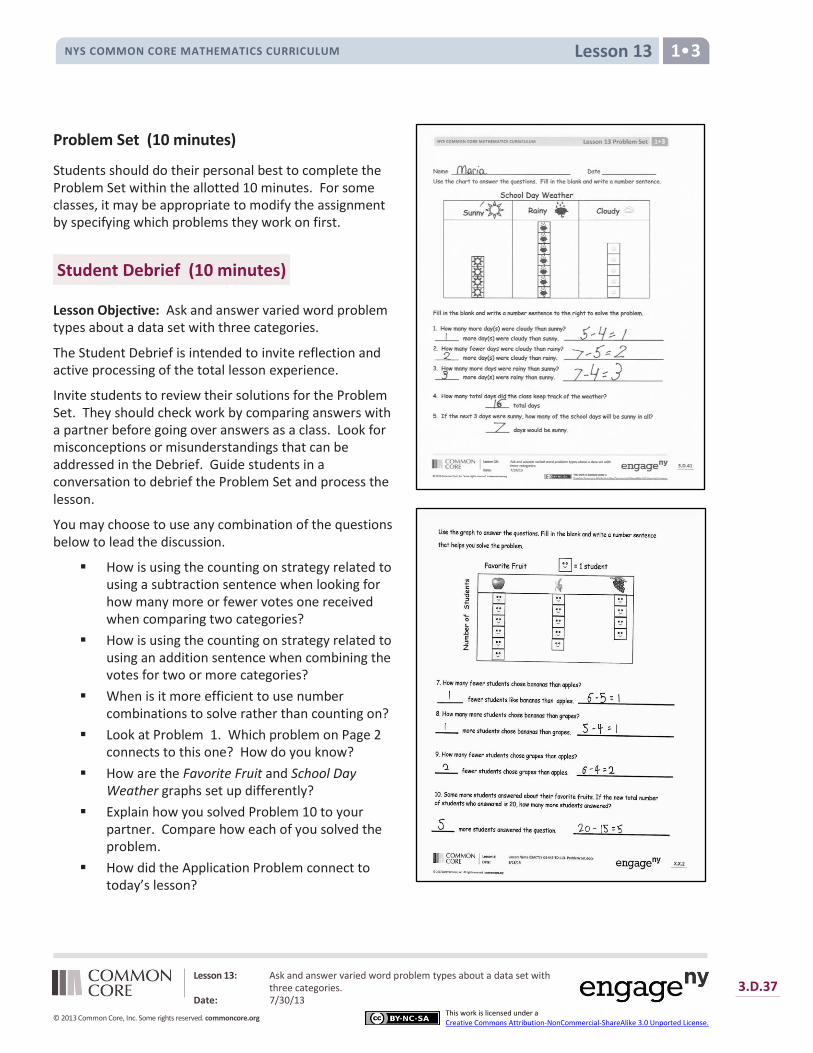
Problem Set (10 minutes)
Students should do their personal best to complete the Problem Set within the allotted 10 minutes. For some classes, it may be appropriate to modify the assignment by specifying which problems they work on first.
Student Debrief (10 minutes)
Lesson Objective: Ask and answer varied word problem types about a data set with three categories.
The Student Debrief is intended to invite reflection and active processing of the total lesson experience.
Invite students to review their solutions for the Problem Set. They should check work by comparing answers with a partner before going over answers as a class. Look for misconceptions or misunderstandings that can be addressed in the Debrief. Guide students in a conversation to debrief the Problem Set and process the lesson.
You may choose to use any combination of the questions below to lead the discussion.
How is using the counting on strategy related to using a subtraction sentence when looking for how many more or fewer votes one received when comparing two categories?
How is using the counting on strategy related to using an addition sentence when combining the votes for two or more categories?
When is it more efficient to use number combinations to solve rather than counting on?
Look at Problem 1. Which problem on Page 2 connects to this one? How do you know?
How are the Favorite Fruit and School Day Weather graphs set up differently?
Explain how you solved Problem 10 to your partner. Compare how each of you solved the problem.
How did the Application Problem connect to today’s lesson?
Lesson 13 NYS COMMON CORE MATHEMATICS CURRICULUM 1
Lesson 13: Ask and answer varied word problem types about a data set with three categories.
Date: 7/30/13
3.D.38
© 2013 Common Core, Inc. Some rights reserved. commoncore.org This work is licensed under a Creative Commons Attribution-NonCommercial-ShareAlike 3.0 Unported License.
Exit Ticket (3 minutes)
After the Student Debrief, instruct students to complete the Exit Ticket. A review of their work will help you assess the students’ understanding of the concepts that were presented in the lesson today and plan more effectively for future lessons. You may read the questions aloud to the students.
Lesson 13: Ask and answer varied word problem types about a data set with three categories.
Date: 7/30/13
3.D.39
© 2013 Common Core, Inc. Some rights reserved. commoncore.org This work is licensed under a Creative Commons Attribution-NonCommercial-ShareAlike 3.0 Unported License.
Lesson 13 Sprint NYS COMMON CORE MATHEMATICS CURRICULUM 1
Name Date
*Write the missing number.
1 9 + 1 + 3 = ☐ 16 6 + 3 + 8 = ☐
2 9 + 2 + 1 = ☐ 17 5 + 9 + 4 = ☐
3 5 + 5 + 3 = ☐ 18 3 + 12 + 4 = ☐
4 5 + 2 + 5 = ☐ 19 3 + 11 + 5 = ☐
5 4 + 5 + 5 = ☐ 20 5 + 6 + 7 = ☐
6 8 + 2 + 4 = ☐ 21 2 + 6 + 3 = ☐
7 8 + 3 + 2 = ☐ 22 3 + 2 + 13 = ☐
8 12 + 2 + 2 = ☐ 23 3 + 13 + 3 = ☐
9 3 + 3 + 12 = ☐ 24 9 + 1 + ☐ = 14
10 4 + 4 + 5 = ☐ 25 8 + 4 + ☐ = 16
11 2 + 15 + 2 = ☐ 26 ☐ + 8 + 6 = 19
12 7 + 3 + 3 = ☐ 27 2 + ☐ + 7 = 18
13 1 + 17 + 1 = ☐ 28 2 + 2 + ☐ = 18
14 14 + 2 + 2 = ☐ 29 19 = 6 + ☐ + 9
15 4 + 12 + 4 = ☐ 30 18 = 7 + ☐ + 6
Number correct: A

Lesson 13: Ask and answer varied word problem types about a data set with three categories.
Date: 7/30/13
3.D.40
© 2013 Common Core, Inc. Some rights reserved. commoncore.org This work is licensed under a Creative Commons Attribution-NonCommercial-ShareAlike 3.0 Unported License.
Lesson 13 Sprint NYS COMMON CORE MATHEMATICS CURRICULUM 1
Name Date
*Write the missing number.
1 9 + 1 + 2 = ☐ 16 6 + 3 + 9 = ☐
2 9 + 4 + 1 = ☐ 17 4 + 9 + 2 = ☐
3 5 + 5 + 1 = ☐ 18 2 + 12 + 4 = ☐
4 5 + 3 + 5 = ☐ 19 2 + 11 + 5 = ☐
5 4 + 5 + 5 = ☐ 20 6 + 6 + 7 = ☐
6 8 + 2 + 2 = ☐ 21 2 + 6 + 5 = ☐
7 8 + 3 + 2 = ☐ 22 3 + 3 + 13 = ☐
8 11 + 1 + 1 = ☐ 23 3 + 14 + 3 = ☐
9 2 + 2 + 14 = ☐ 24 9 + 1 + ☐ = 13
10 4 + 4 + 4 = ☐ 25 8 + 4 + ☐ = 15
11 2 + 13 + 2 = ☐ 26 ☐ + 8 + 6 = 18
12 6 + 3 + 3 = ☐ 27 2 + ☐ + 6 = 18
13 1 + 15 + 1 = ☐ 28 2 + 5 + ☐ = 18
14 15 + 2 + 2 = ☐ 29 19 = 5 + ☐ + 9
15 3 + 14 + 3 = ☐ 30 19 = 7 + ☐ + 6
Number correct: B

Lesson 13: Ask and answer varied word problem types about a data set with three categories.
Date: 7/30/13
3.D.41
© 2013 Common Core, Inc. Some rights reserved. commoncore.org This work is licensed under a Creative Commons Attribution-NonCommercial-ShareAlike 3.0 Unported License.
Lesson 13 Problem Set NYS COMMON CORE MATHEMATICS CURRICULUM 1
Name Date
Use the chart to answer the questions. Fill in the blank and write a number sentence.
Fill in the blank and write a number sentence to the right to solve the problem.
1. How many more day(s) were cloudy than sunny?
2. How many fewer days were cloudy than rainy?
3. How many more days were rainy than sunny?
4. How many total days did the class keep track of the weather?
5. If the next 3 days were sunny, how many of the school days will be sunny in all?
School Day Weather
more day(s) were cloudy than sunny.
more day(s) were cloudy than rainy.
Cloudy Rainy
days would be sunny.
more day(s) were rainy than sunny.
total days
Sunny
Lesson 13: Ask and answer varied word problem types about a data set with three categories.
Date: 7/30/13
3.D.42
© 2013 Common Core, Inc. Some rights reserved. commoncore.org This work is licensed under a Creative Commons Attribution-NonCommercial-ShareAlike 3.0 Unported License.
Lesson 13 Problem Set NYS COMMON CORE MATHEMATICS CURRICULUM 1
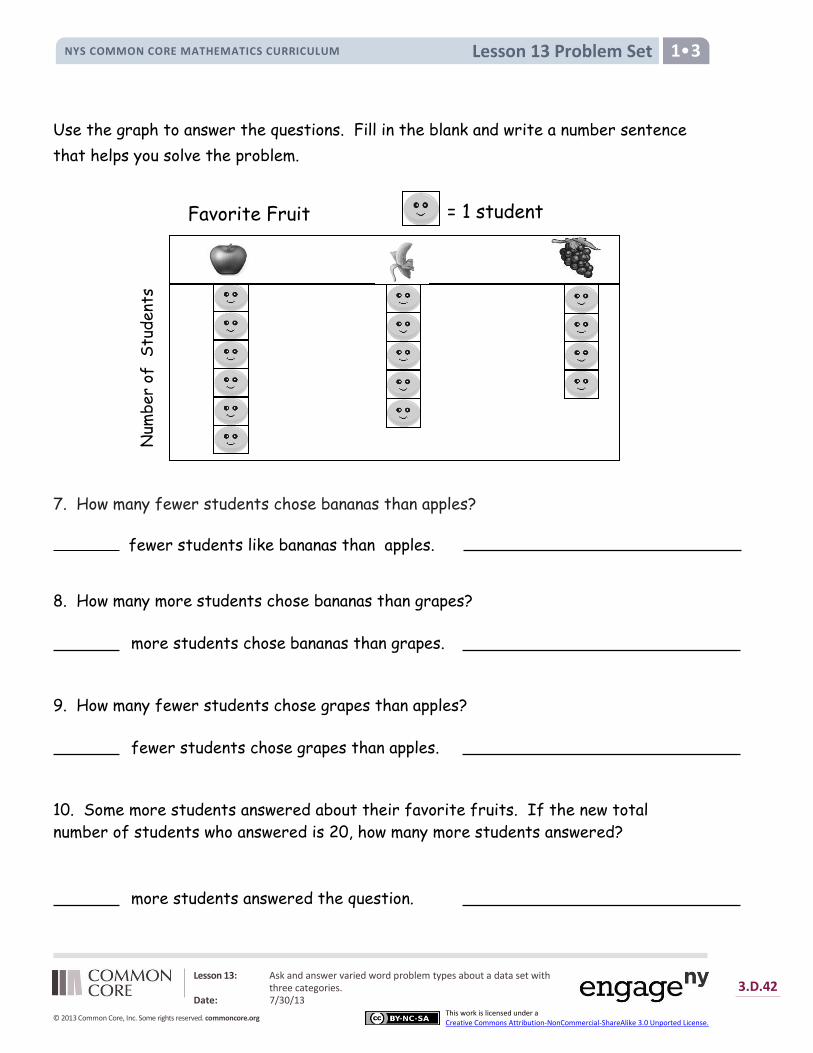
Use the graph to answer the questions. Fill in the blank and write a number sentence
that helps you solve the problem.
7. How many fewer students chose bananas than apples?
8. How many more students chose bananas than grapes?
9. How many fewer students chose grapes than apples?
10. Some more students answered about their favorite fruits. If the new total
number of students who answered is 20, how many more students answered?
more students chose bananas than grapes.
fewer students chose grapes than apples.
more students answered the question.
Favorite Fruit
Num
ber
of
Stu
dent
s
= 1 student
fewer students like bananas than apples.

Lesson 13: Ask and answer varied word problem types about a data set with three categories.
Date: 7/30/13
3.D.43
© 2013 Common Core, Inc. Some rights reserved. commoncore.org This work is licensed under a Creative Commons Attribution-NonCommercial-ShareAlike 3.0 Unported License.
Lesson 13 Exit Ticket NYS COMMON CORE MATHEMATICS CURRICULUM 1
Name Date
Use the graph to answer the questions. Write a number sentence.
Animals on Lily’s Farm
1. How many animals are on Lily’s farm in all? _____________ animals
2. How many fewer sheep than pigs are on Lily’s farm? _____________ fewer sheep
3. How many more cows are on Lily’s farm than sheep? _____________ more cows
Sheep Cows Pigs
= 1 animal
Lesson 13: Ask and answer varied word problem types about a data set with three categories.
Date: 7/30/13
3.D.44
© 2013 Common Core, Inc. Some rights reserved. commoncore.org This work is licensed under a Creative Commons Attribution-NonCommercial-ShareAlike 3.0 Unported License.
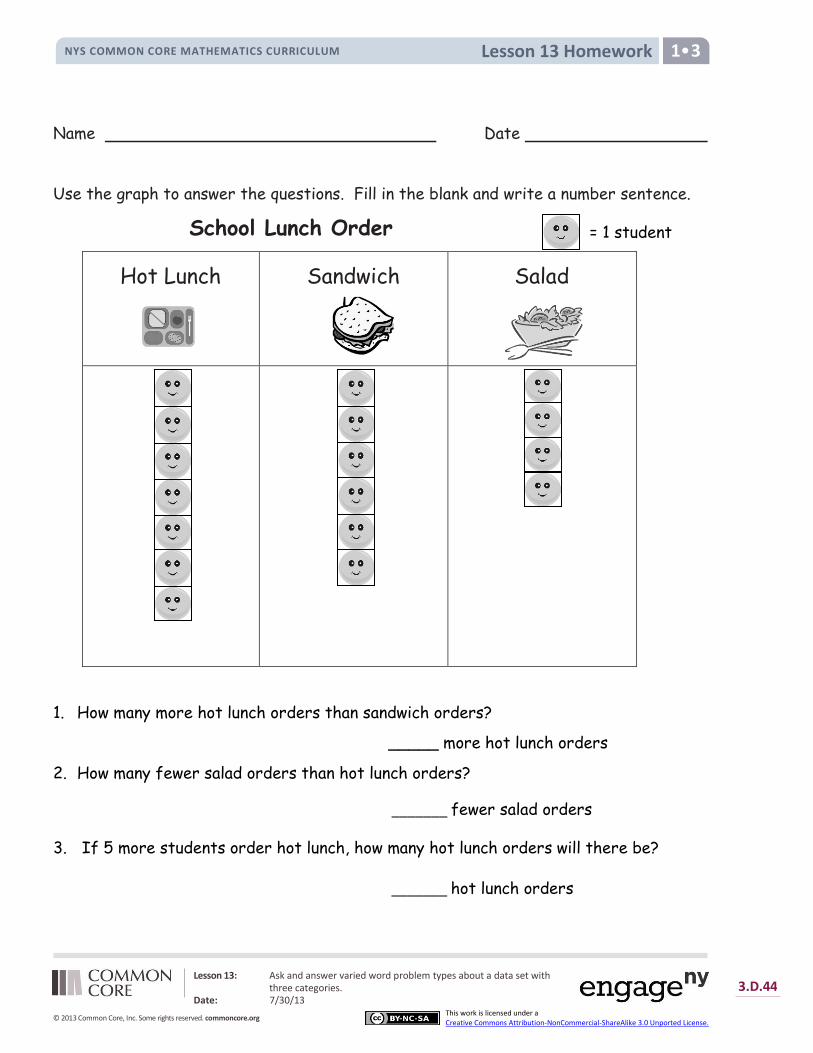
Lesson 13 Homework NYS COMMON CORE MATHEMATICS CURRICULUM 1
Name Date
Use the graph to answer the questions. Fill in the blank and write a number sentence.
School Lunch Order
1. How many more hot lunch orders than sandwich orders?
_____ more hot lunch orders
2. How many fewer salad orders than hot lunch orders?
3. If 5 more students order hot lunch, how many hot lunch orders will there be?
Hot Lunch
Sandwich Salad
_______ fewer salad orders
_______ hot lunch orders
= 1 student
Lesson 13: Ask and answer varied word problem types about a data set with three categories.
Date: 7/30/13
3.D.45
© 2013 Common Core, Inc. Some rights reserved. commoncore.org This work is licensed under a Creative Commons Attribution-NonCommercial-ShareAlike 3.0 Unported License.
Lesson 13 Homework NYS COMMON CORE MATHEMATICS CURRICULUM 1
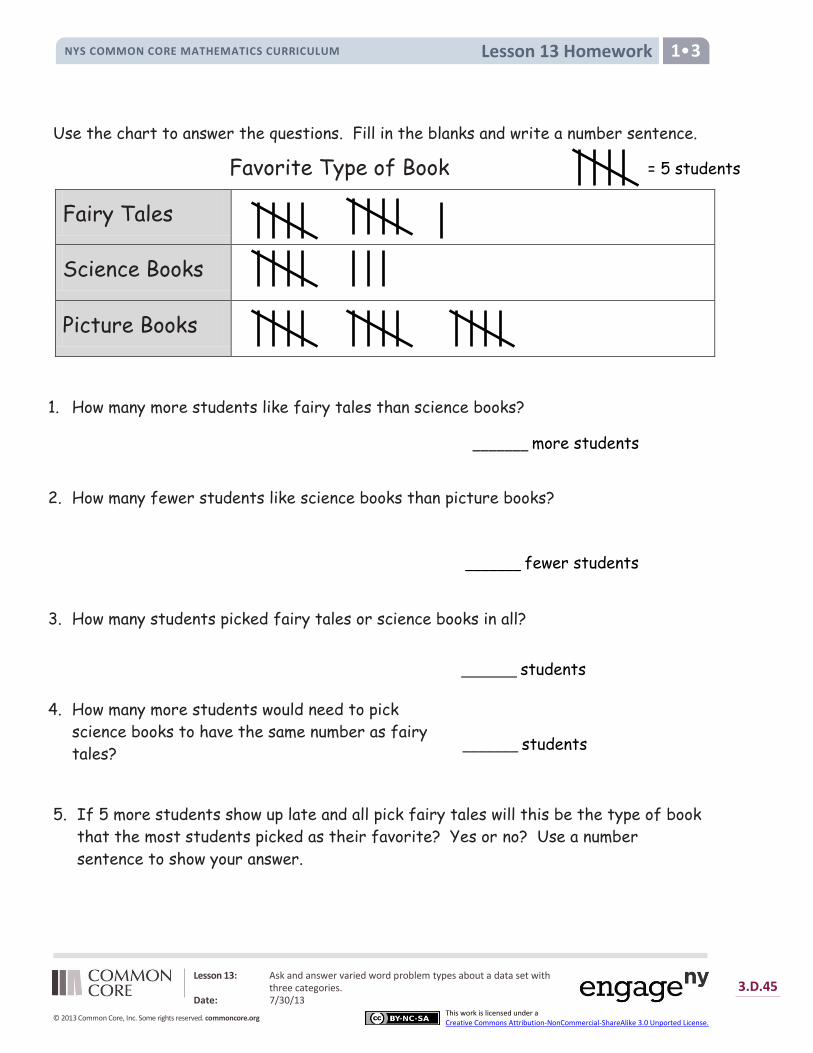
Use the chart to answer the questions. Fill in the blanks and write a number sentence.
Favorite Type of Book
Fairy Tales
Science Books
Picture Books
1. How many more students like fairy tales than science books?
2. How many fewer students like science books than picture books?
3. How many students picked fairy tales or science books in all?
4. How many more students would need to pick
science books to have the same number as fairy
tales?
5. If 5 more students show up late and all pick fairy tales will this be the type of book
that the most students picked as their favorite? Yes or no? Use a number
sentence to show your answer.
_______ more students
_______ fewer students
_______ students
_______ students
= 5 students
Lesson
End-of-Module Assessment Task NYS COMMON CORE MATHEMATICS CURRICULUM 1•32•3
Module 3: Ordering and Comparing Length Measurements as Numbers Date: 7/30/13 3.S.1
© 2013 Common Core, Inc. Some rights reserved. commoncore.org
This work is licensed under a
Creative Commons Attribution-NonCommercial-ShareAlike 3.0 Unported License.
Name Date
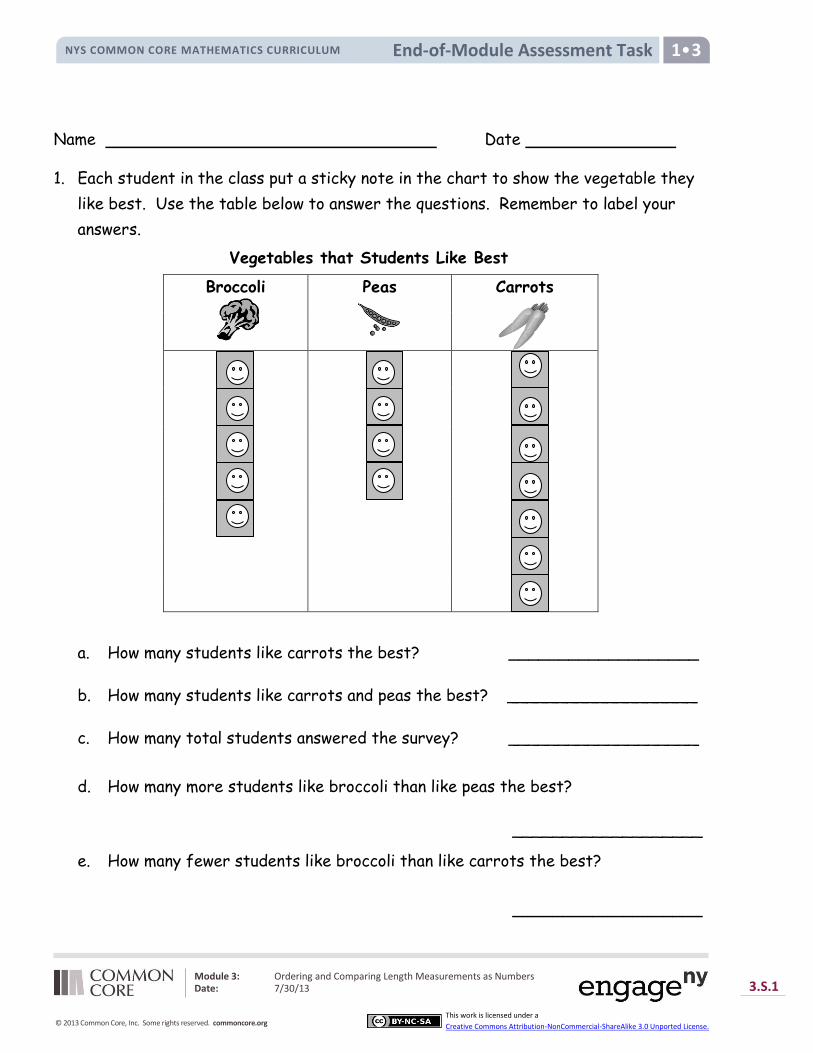
1. Each student in the class put a sticky note in the chart to show the vegetable they
like best. Use the table below to answer the questions. Remember to label your
answers.
Vegetables that Students Like Best
Broccoli Peas Carrots
a. How many students like carrots the best? ___________________
b. How many students like carrots and peas the best? ___________________
c. How many total students answered the survey? ___________________
d. How many more students like broccoli than like peas the best?
e. How many fewer students like broccoli than like carrots the best?
___________________
___________________
Lesson
New York State Common Core
End-of-Module Assessment Task NYS COMMON CORE MATHEMATICS CURRICULUM
Module 3: Ordering and Comparing Length Measurements as Numbers Date: 7/30/13 3.S.2
© 2013 Common Core, Inc. Some rights reserved. commoncore.org
This work is licensed under a
Creative Commons Attribution-NonCommercial-ShareAlike 3.0 Unported License.
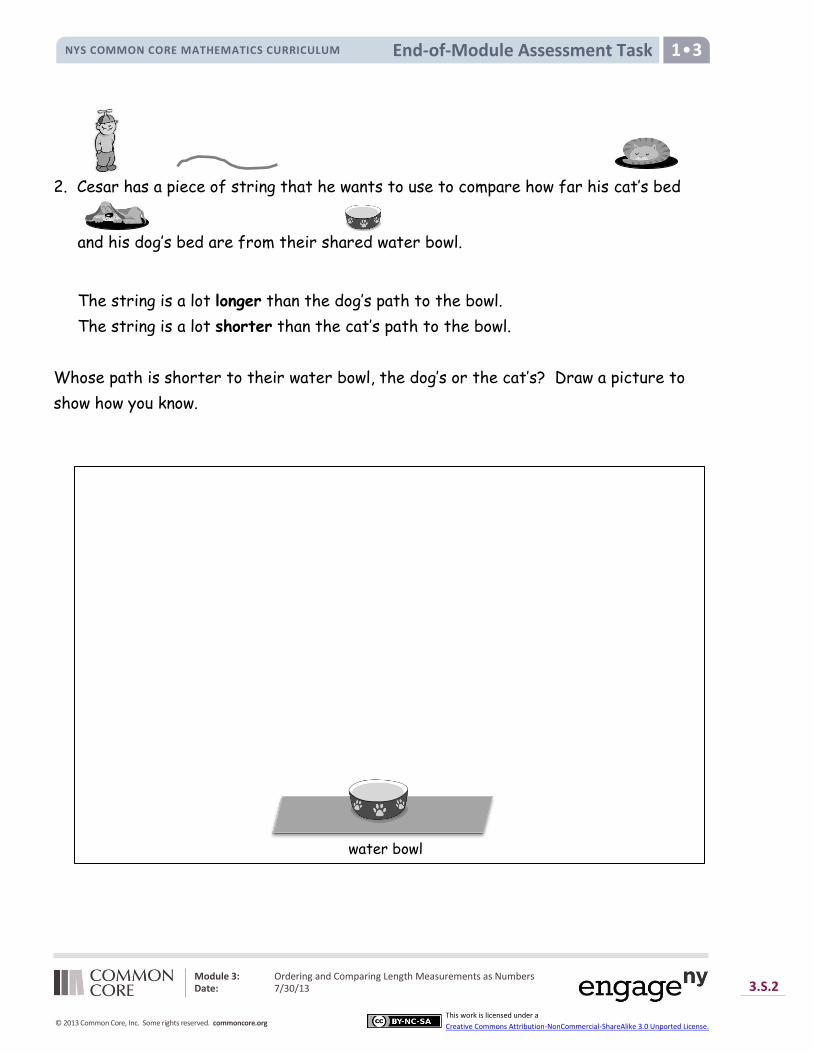
2. Cesar has a piece of string that he wants to use to compare how far his cat’s bed
and his dog’s bed are from their shared water bowl.
The string is a lot longer than the dog’s path to the bowl.
The string is a lot shorter than the cat’s path to the bowl.
Whose path is shorter to their water bowl, the dog’s or the cat’s? Draw a picture to
show how you know.
water bowl

Lesson
New York State Common Core
End-of-Module Assessment Task NYS COMMON CORE MATHEMATICS CURRICULUM
Module 3: Ordering and Comparing Length Measurements as Numbers Date: 7/30/13 3.S.3
© 2013 Common Core, Inc. Some rights reserved. commoncore.org
This work is licensed under a
Creative Commons Attribution-NonCommercial-ShareAlike 3.0 Unported License.
3. Circle the pictures that show a correct measurement.
a. b.
c. d. e.
a. Why did you pick these pictures? Explain your thinking with two reasons.
_________________________________________________________________
_________________________________________________________________
b. What was the length measurement of the bone for each correct picture?
__________________________________________________________
c. Why are the (d) and (e) measurements with paper clips different?
_________________________________________________________________
_________________________________________________________________
3 centimeters 4 centimeters
5 centimeters 2 paper clips 3 paper clips
is a centimeter cube.
Lesson
New York State Common Core
End-of-Module Assessment Task NYS COMMON CORE MATHEMATICS CURRICULUM
Module 3: Ordering and Comparing Length Measurements as Numbers Date: 7/30/13 3.S.4
© 2013 Common Core, Inc. Some rights reserved. commoncore.org
This work is licensed under a
Creative Commons Attribution-NonCommercial-ShareAlike 3.0 Unported License.
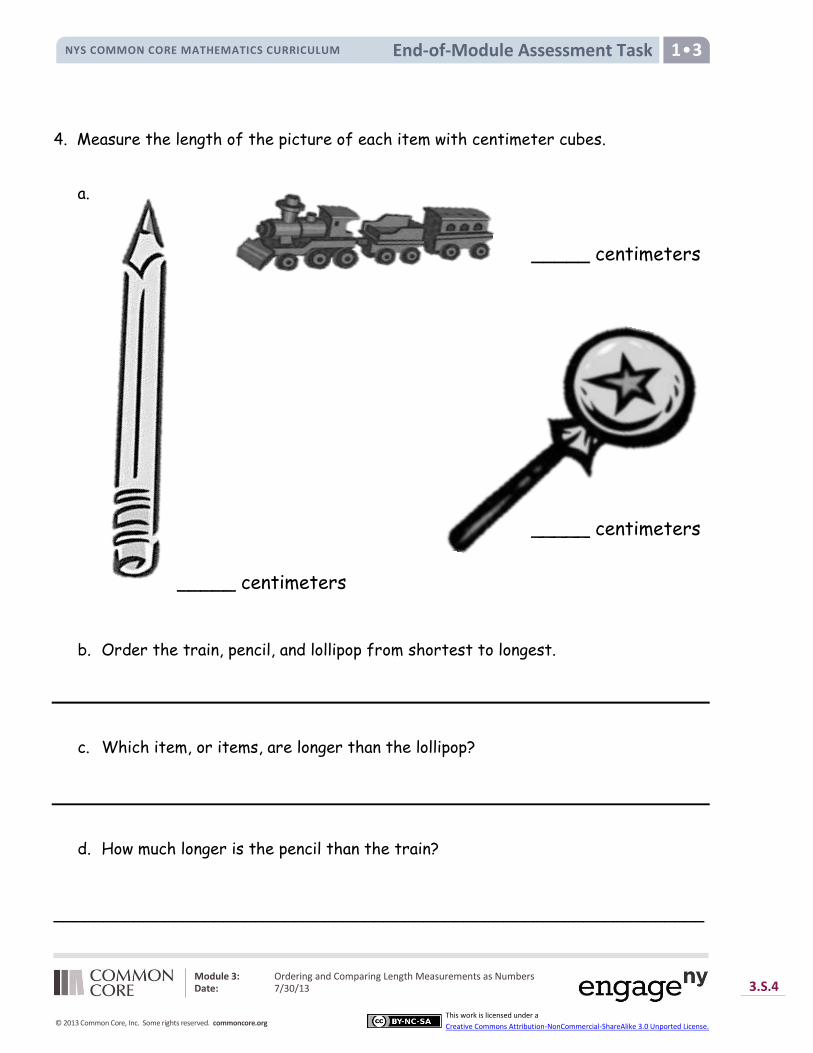
4. Measure the length of the picture of each item with centimeter cubes.
a.
b. Order the train, pencil, and lollipop from shortest to longest.
c. Which item, or items, are longer than the lollipop?
d. How much longer is the pencil than the train?
_________________________________________________________________
_____ centimeters
_____ centimeters
_____ centimeters

Lesson
New York State Common Core
End-of-Module Assessment Task NYS COMMON CORE MATHEMATICS CURRICULUM
Module 3: Ordering and Comparing Length Measurements as Numbers Date: 7/30/13 3.S.5
© 2013 Common Core, Inc. Some rights reserved. commoncore.org
This work is licensed under a
Creative Commons Attribution-NonCommercial-ShareAlike 3.0 Unported License.
End-of-Module Assessment Task Topics A–D Standards Addressed
Represent and solve problems involving addition and subtraction.
1.OA.1 Use addition and subtraction within 20 to solve word problems involving situations of adding to, taking from, putting together, taking apart, and comparing, with unknowns in all positions, e.g., by using objects, drawings, and equations with a symbol for the unknown number to represent the problem. (See Glossary, Table 1.)
Measure lengths indirectly and by iterating length units.
1.MD.1 Order three objects by length; compare the length of two objects indirectly by using a third object.
1.MD.2 Express the length of an object as a whole number of length units, by laying multiple copies of a shorter object (the length unit) end to end; understand that the length measurement of an object is the number of same-size length units that span it with no gaps or overlaps. Limit to contexts where the object being measured is spanned by a whole number of length units with no gaps or overlaps.
Represent and interpret data.
1.MD.4 Organize, represent, and interpret data with up to three categories; ask and answer questions about the total number of data points, how many in each category, and how many more or less are in one category than in another.
Evaluating Student Learning Outcomes
A Progression Toward Mastery is provided to describe steps that illuminate the gradually increasing understandings that students develop on their way to proficiency. In this chart, this progress is presented from left (Step 1) to right (Step 4). The learning goal for each student is to achieve Step 4 mastery. These steps are meant to help teachers and students identify and celebrate what the student CAN do now and what they need to work on next.

Lesson
New York State Common Core
End-of-Module Assessment Task NYS COMMON CORE MATHEMATICS CURRICULUM
Module 3: Ordering and Comparing Length Measurements as Numbers Date: 7/30/13 3.S.6
© 2013 Common Core, Inc. Some rights reserved. commoncore.org
This work is licensed under a
Creative Commons Attribution-NonCommercial-ShareAlike 3.0 Unported License.
A Progression Toward Mastery
Assessment Task Item and Standards Assessed
STEP 1 Little evidence of reasoning without a correct answer. (1 Point)
STEP 2 Evidence of some reasoning without a correct answer. (2 Points)
STEP 3 Evidence of some reasoning with a correct answer or evidence of solid reasoning with an incorrect answer. (3 Points)
STEP 4 Evidence of solid reasoning with a correct answer. (4 Points)
1
1.MD.4
1.OA.1
The student
demonstrates little to
no understanding of
how to read or
interpret the graph.
The student
demonstrates some
understanding of how
many students are
represented in the
graph in a given
category or categories
(may be off by one or
two), but is unable to
solve either of the
comparison problems
accurately.
The student correctly
solves (a), (b), and (c),
but solves (d) or (e)
incorrectly.
Or, the student solves
the comparison
problems (d) and (e)
correctly, but is unable
to correctly solve (a),
(b), and/or (c).
The student correctly:
Identifies and solves
(a) as 7, (b) as 11,
and (c) as 16.
Compares the
quantities and
writes the difference
between the two
quantities for
questions (d), 1
student, and (e), 2
students.
2
1.MD.1
The student
demonstrates little to
no understanding of
the comparison.
The student
demonstrates some
understanding of how
the string can be used
to compare the two
paths (i.e., by using
pictures), but provides
inaccurate responses.
The student identifies
that dog’s path is
shorter, but is unable
to provide a clear
explanation.
Or, the student
incorrectly identifies
the cat’s path as
shorter, but is able to
draw a picture to
explain (this may
reflect a linguistic
interpretation issue).
The student correctly:
Identifies that dog’s
path is shorter.
Explains how the
string could be used
to compare the
distance from each
desk to the door
(transitivity), by
drawing pictures.
3
1.MD.2
1.OA.1
The student
demonstrates little to
no understanding of
proper measurement
technique or reasoning
behind it.
The student
demonstrates some
understanding of
proper measurement
techniques by either
selecting or measuring
the correct items, but
cannot explain her
thinking clearly and
accurately.
The student clearly and
accurately completes
three out of the four
following components:
Identifies (b) and (d)
as having the proper
measurement.
Cites at least two
key elements to
The student clearly and
accurately:
Identifies (b) and (d)
as having the proper
measurement.
Cites at least two
key elements to
measuring
accurately (no gaps,

Lesson
New York State Common Core
End-of-Module Assessment Task NYS COMMON CORE MATHEMATICS CURRICULUM
Module 3: Ordering and Comparing Length Measurements as Numbers Date: 7/30/13 3.S.7
© 2013 Common Core, Inc. Some rights reserved. commoncore.org
This work is licensed under a
Creative Commons Attribution-NonCommercial-ShareAlike 3.0 Unported License.
A Progression Toward Mastery
Or, the student
demonstrates some
understanding of her
thinking behind
measurement
methods, but cannot
measure or identify
measurements
accurately.
measuring
accurately (no gaps,
attentive to
endpoints, same-
sized length units) in
her own words.
Identifies two
correct
measurements (2
paper clips and 4
centimeters; units
are not required).
Explains that
measuring with
different lengths of
units (small or large
paper clips) can
result in different
quantities of
measurement for
the same length
item.
attentive to
endpoints, same-
sized length units) in
her own words.
Identifies two
correct
measurements (2
paper clips and 4
centimeters; units
are required).
Explains that
measuring with
different lengths of
units (small or large
paper clips) can
result in different
quantities of
measurement for
the same length
item.
4
1.MD.1
1.MD.2
1.OA.1
The student
demonstrates little to
no understanding of
how to measure or use
the measurement to
compare.
The student
demonstrates some
understanding of how
to measure, but is
unable to manipulate
the measurements to
order or compare.
The student accurately
measures and orders
the items by length,
but is unable to solve
one or the other
comparison problems.
Or, the student is able
to solve the
comparison problems
correctly, but with
slight inaccuracy in the
measurements (i.e., he
is off by 1 or 2
centimeters, which
then impacts the
accuracy of (d)).
The student clearly and accurately:
Measures the train (8 cm), pencils (11 cm), and lollipop (9 cm).
Orders the items by length (train, lollipop, pencil).
Identifies the pencil as longer than the lollipop.
Solves the comparison problem correctly by identifying the pencil as 3 centimeters longer than the train.

Lesson
New York State Common Core
End-of-Module Assessment Task NYS COMMON CORE MATHEMATICS CURRICULUM
Module 3: Ordering and Comparing Length Measurements as Numbers Date: 7/30/13 3.S.8
© 2013 Common Core, Inc. Some rights reserved. commoncore.org
This work is licensed under a
Creative Commons Attribution-NonCommercial-ShareAlike 3.0 Unported License.
1.

Lesson
New York State Common Core
End-of-Module Assessment Task NYS COMMON CORE MATHEMATICS CURRICULUM
Module 3: Ordering and Comparing Length Measurements as Numbers Date: 7/30/13 3.S.9
© 2013 Common Core, Inc. Some rights reserved. commoncore.org
This work is licensed under a
Creative Commons Attribution-NonCommercial-ShareAlike 3.0 Unported License.

Lesson
New York State Common Core
End-of-Module Assessment Task NYS COMMON CORE MATHEMATICS CURRICULUM
Module 3: Ordering and Comparing Length Measurements as Numbers Date: 7/30/13 3.S.10
© 2013 Common Core, Inc. Some rights reserved. commoncore.org
This work is licensed under a
Creative Commons Attribution-NonCommercial-ShareAlike 3.0 Unported License.
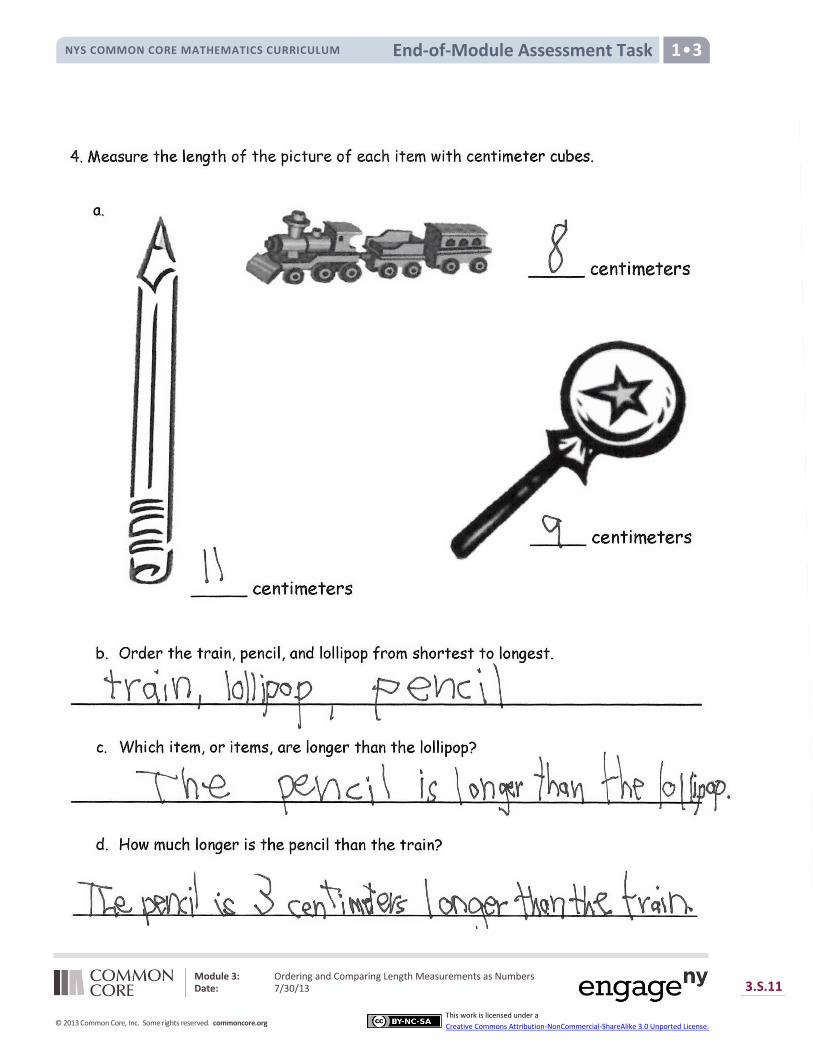
Lesson
New York State Common Core
End-of-Module Assessment Task NYS COMMON CORE MATHEMATICS CURRICULUM
Module 3: Ordering and Comparing Length Measurements as Numbers Date: 7/30/13 3.S.11
© 2013 Common Core, Inc. Some rights reserved. commoncore.org
This work is licensed under a
Creative Commons Attribution-NonCommercial-ShareAlike 3.0 Unported License.