data infrastructure to support apms at scale - hcp lan … · data infrastructure to support apms...
TRANSCRIPT

Data Infrastructure to Support APMs at Scale LAN Summit, April 2016
Dr. Richard Shonk, CMO

VISION To inspire breakthroughs in transforming health and healthcare
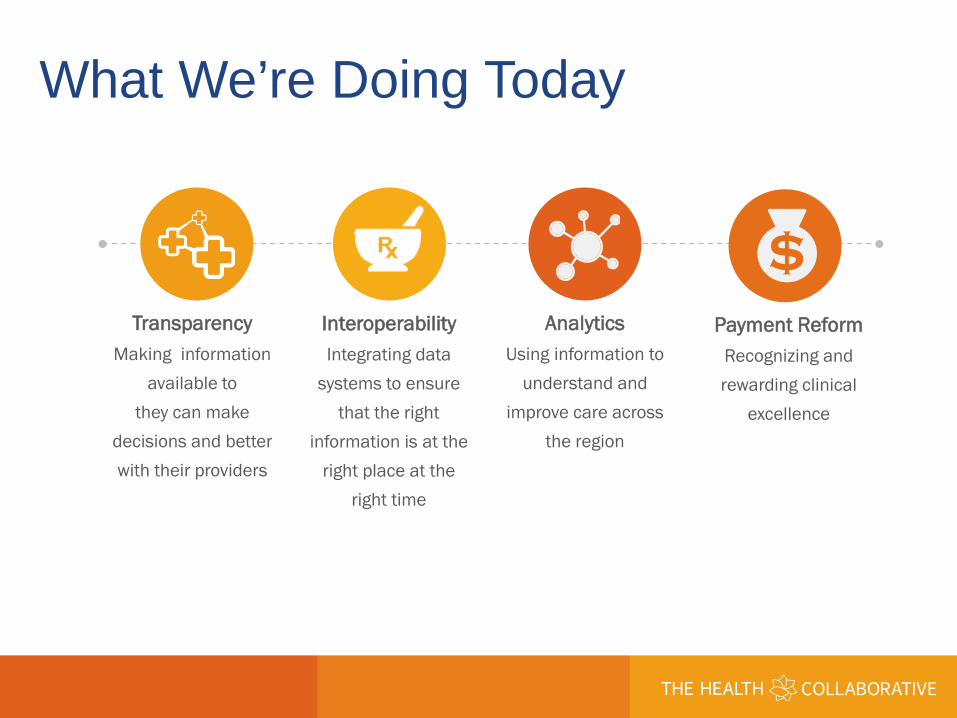
What We’re Doing Today
Transparency Interoperability Analytics Payment Reform Making information Integrating data Using information to Recognizing and
available to systems to ensure understand and rewarding clinical they can make that the right improve care across excellence
decisions and better information is at the the region with their providers right place at the
right time
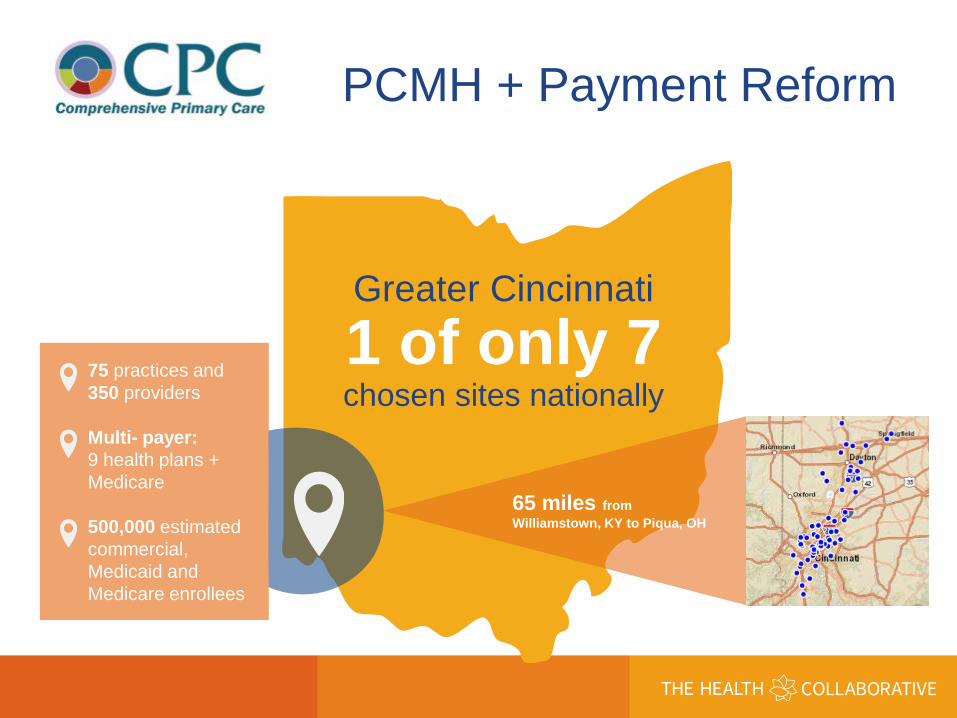
PCMH + Payment Reform
Greater Cincinnati 1 of only 7chosen sites nationally
65 miles from Williamstown, KY to Piqua, OH
75 practices and 350 providers
Multi- payer: 9 health plans + Medicare
500,000 estimated commercial, Medicaid and Medicare enrollees
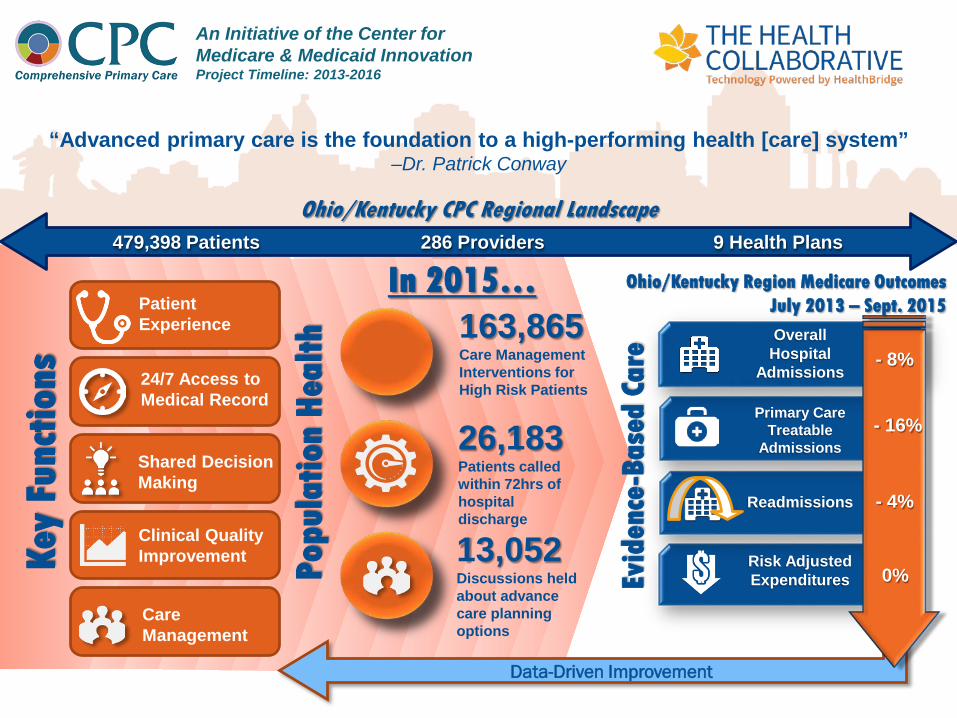
An Initiative of the Center for Medicare & Medicaid Innovation Project Timeline: 2013-2016
286 Providers 9 Health Plans 479,398 Patients
Evid
ence
-Bas
ed C
are Overall
Hospital Admissions
Primary Care Treatable
Admissions
Readmissions
Risk Adjusted Expenditures
- 8%
- 16%
- 4%
0%
Data-Driven Improvement
Patient Experience
24/7 Access to Medical Record
Shared Decision Making
Clinical Quality Improvement
Care Management
Ohio/Kentucky Region Medicare Outcomes July 2013 – Sept. 2015
Popu
latio
n He
alth
Key
Func
tions
“Advanced primary care is the foundation to a high-performing health [care] system” –Dr. Patrick Conway
26,183 Patients called within 72hrs of hospital discharge
Ohio/Kentucky CPC Regional Landscape
In 2015…
13,052 Discussions held about advance care planning options
163,865 Care Management Interventions for High Risk Patients
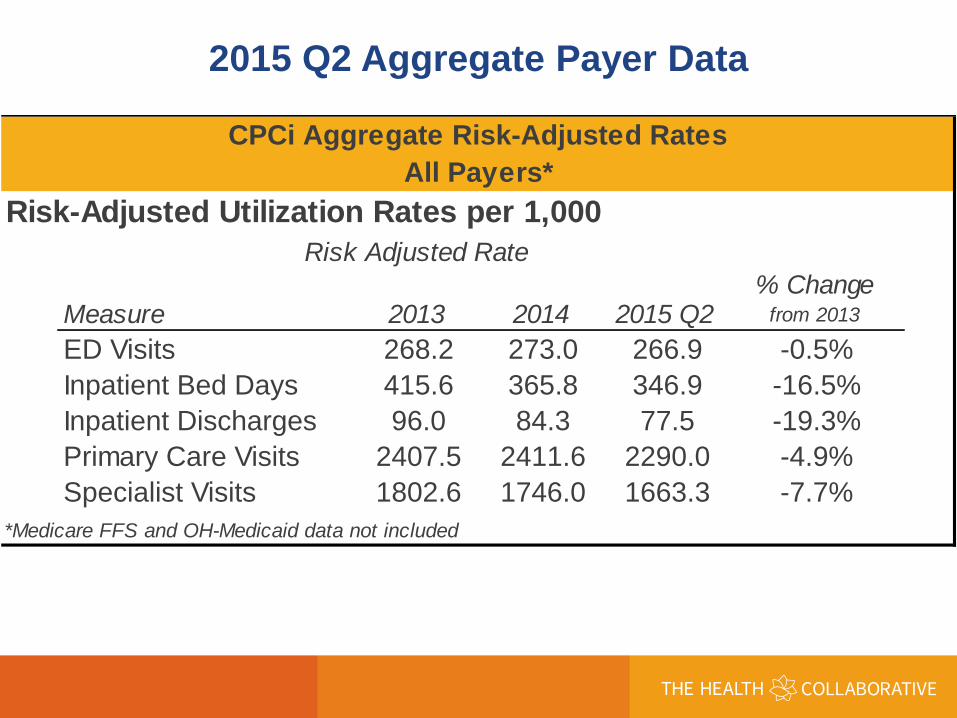
2015 Q2 Aggregate Payer Data
CPCi Aggregate Risk-Adjusted Rates All Payers*
Risk-Adjusted Utilization Rates per 1,000 Risk Adjusted Rate
% Change Measure 2013 2014 2015 Q2 from 2013
ED Visits 268.2 273.0 266.9 -0.5% Inpatient Bed Days 415.6 365.8 346.9 -16.5% Inpatient Discharges 96.0 84.3 77.5 -19.3% Primary Care Visits 2407.5 2411.6 2290.0 -4.9% Specialist Visits 1802.6 1746.0 1663.3 -7.7%
*Medicare FFS and OH-Medicaid data not included

Inpatient Discharges 2014 Q3-4 and 2015 Q1-Q2
2013 Q1-4
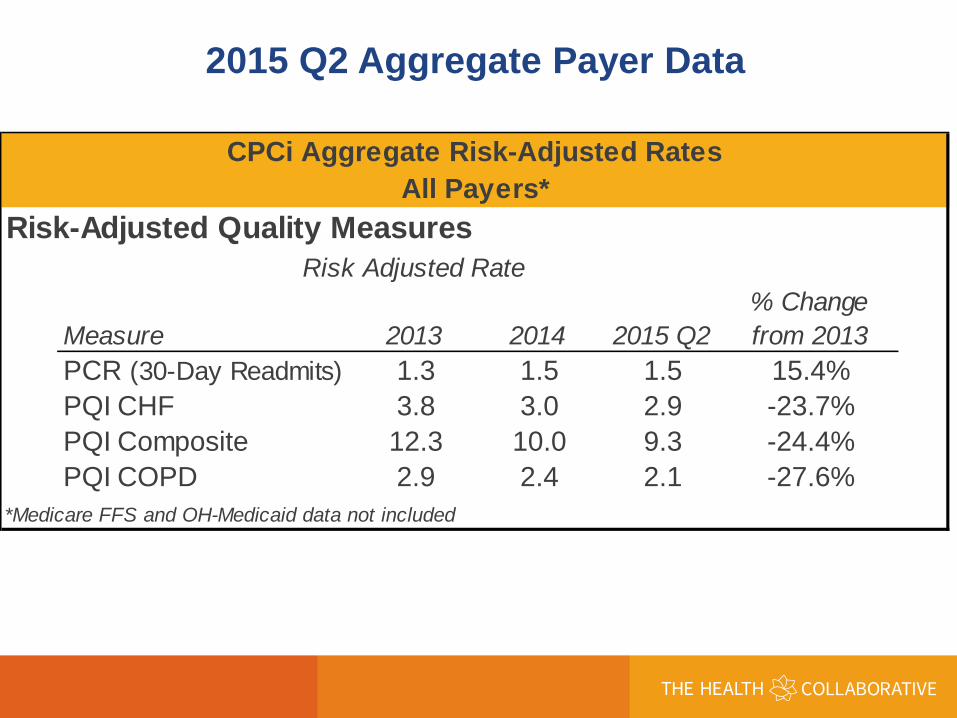
2015 Q2 Aggregate Payer Data
CPCi Aggregate Risk-Adjusted Rates All Payers*
Risk-Adjusted Quality Measures Risk Adjusted Rate
% Change Measure 2013 2014 2015 Q2 from 2013 PCR (30-Day Readmits) 1.3 1.5 1.5 15.4% PQI CHF 3.8 3.0 2.9 -23.7% PQI Composite 12.3 10.0 9.3 -24.4% PQI COPD 2.9 2.4 2.1 -27.6%
*Medicare FFS and OH-Medicaid data not included

Preventative Quality Indicators: Composite

The Case for Claims
Data Aggregation Comprehensive View
Value for Providers
Value for Payers
Statistical Validity of Aggregated Data Improves the Accuracy of Performance Comparisons
Paying for Value is Enhanced by Comprehensive Practice Level Measurement
Aggregated Data Reports Provide a “Third Party” vetted Value of the Provider’s Performance
Comprehensive Reports Provide a One Stop Shop for Practice-Wide Data at Patient Level Detail
Sustained Engagement is Made Possible With Co-Owned, Trusted, & Transparent Data
Improvement Efforts are More Efficient with Reductions in Variability and “Drill Down” Capabilities
Measurable Value Standard Approach
Sustainability
Adoption of a Standard National Accurate, Co-Owned
Data Gives Confidence Measure Set is to pay for Value in a Reliable and Valued Sustainable and by Stakeholders Scalable Approach
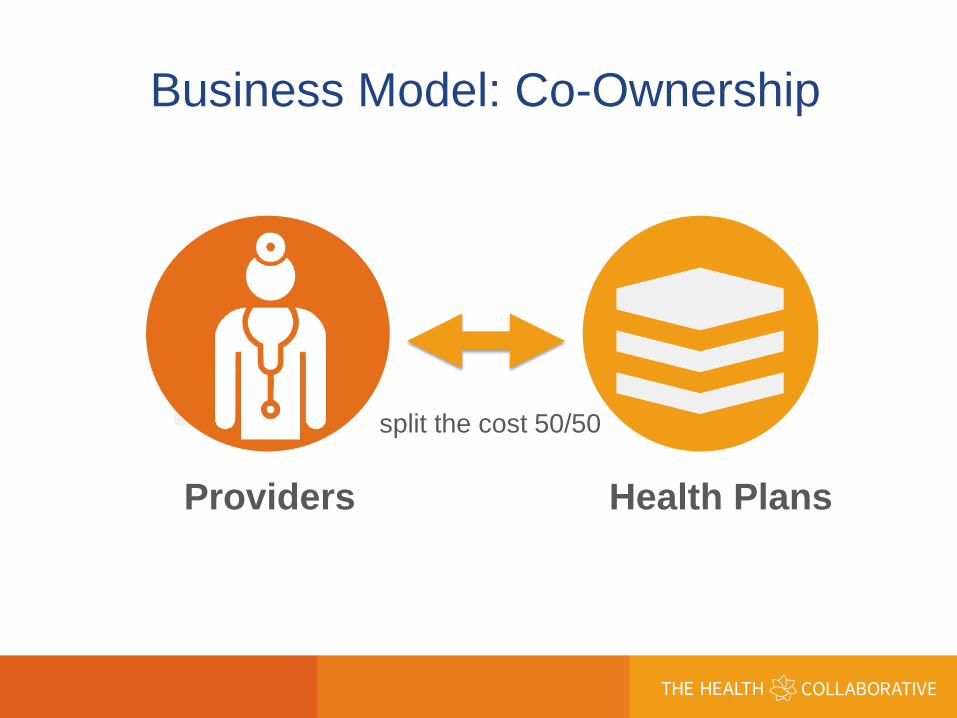
Business Model: Co-Ownership
split the cost 50/50
Providers Health Plans
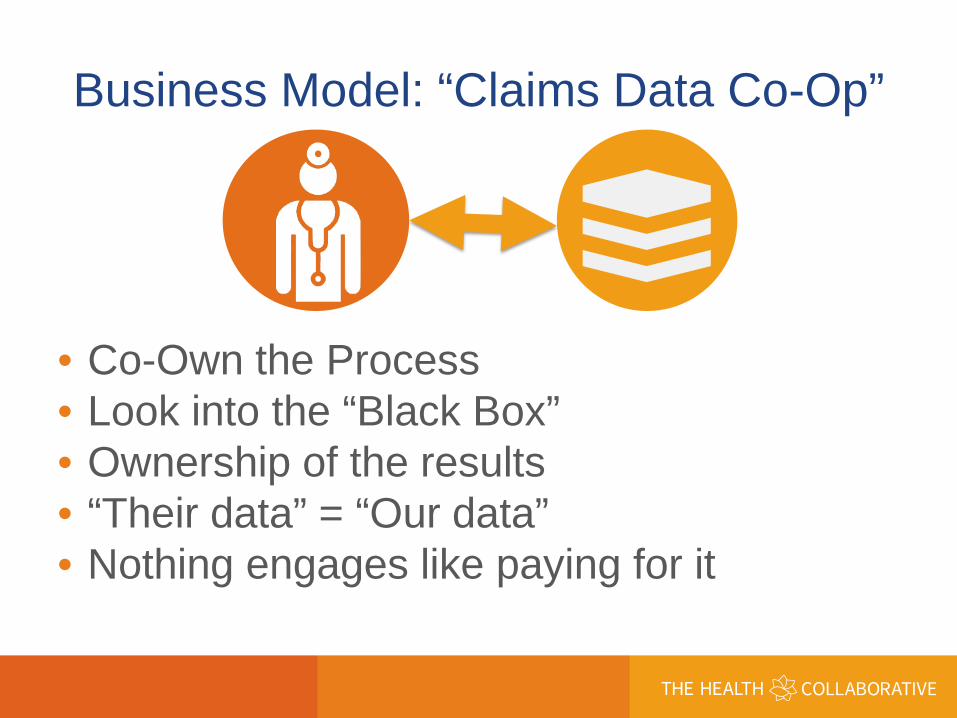
Business Model: “Claims Data Co-Op”
• Co-Own the Process • Look into the “Black Box” • Ownership of the results • “Their data” = “Our data” • Nothing engages like paying for it
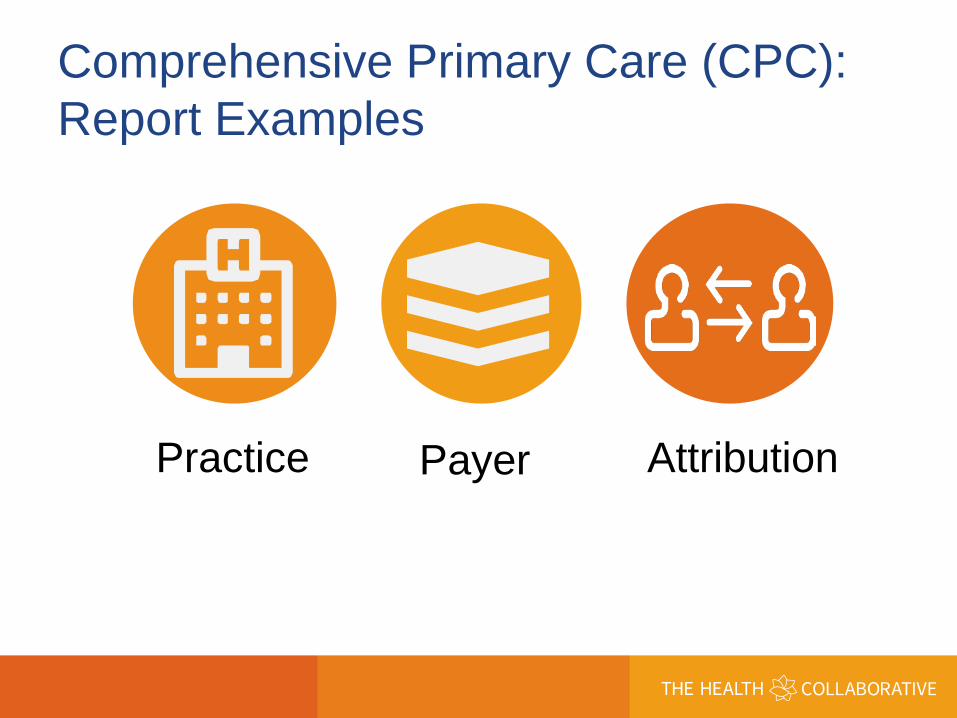
Comprehensive Primary Care (CPC): Report Examples
Practice Payer Attribution

actice Organization CPC ID LevelProvider Enterprise ID
-
OHKY CPC . OHKY CPC . OHKY CPC . OHKY CPC . OHKY CPC . OHKY CPC . OHKY CPC . OHKY CPC . OHKY CPC . OHKY CPC . OHKY CPC . OHKY CPC . OHKY CPC . OHKY CPC . OHKY CPC . OHKY CPC .
ggregated P Example
CPC A Practice
Measure ayer Report –
ED Cos t Inpa ti ent Cos t
Extract Date Measurement Year Pr Pharmacy Cos t Provider
First Name
Level Detail Measure Type Measure Risk Adjusted Rate
LCL UCL
Pri ma ry Ca re Cos t 1/29/2016 07/01/2014-06/30/2015 1/29/2016 07/01/2014-06/30/2015 1/29/2016 07/01/2014-06/30/2015 1/29/2016 07/01/2014-06/30/2015 1/29/2016 07/01/2014-06/30/2015 1/29/2016 07/01/2014-06/30/2015 1/29/2016 07/01/2014-06/30/2015 1/29/2016 07/01/2014-06/30/2015 1/29/2016 07/01/2014-06/30/2015 1/29/2016 07/01/2014-06/30/2015 1/29/2016 07/01/2014-06/30/2015 1/29/2016 07/01/2014-06/30/2015 1/29/2016 07/01/2014-06/30/2015 1/29/2016 07/01/2014-06/30/2015 1/29/2016 07/01/2014-06/30/2015 1/29/2016 07/01/2014-06/30/2015
Specia l i s t Cos t Al l Organizations Cos t ED Cos t Al l Organizations Cos t Inpa ti ent Cos t Al l Organizations Cos t Pharmacy Cos t Al l Organizations Cos t Pri ma ry Ca re Cos t Al l Organizations Cos t Specia l i s t Cos t Al l Organizations Cos t Tota l Cos t Al l Organizations Qual i ty Low Back Pa in Al l Organizations Qual i ty PCR Al l Organizations Qual i ty PQI CHF Al l Organizations Qual i ty PQI COPD Al l Organizations Qual i ty PQI Compos i te Al l Organizations Uti l i zation ED Vis i ts Al l Organizations Uti l i zation Inpa ti ent Bed Da ys Al l Organizations Uti l i zation Inpa ti ent Di s cha rges Al l Organizations Uti l i zation Primary Care Vis i ts Al l Organizations Uti l i zation Specia l i s t Vis i ts
$193 $1,185
$951 $173 $143
$5,021 73% 72% 1.49 1.42 2.93 2.61 2.13 1.91 9.31 8.84
266.92 264.38 346.87 343.97
77.53 76.17 2,289.96 2,282.52 1,663.29 1,656.95
74% 1.57 3.25 2.36 9.79
269.46 349.76
78.90 2,297.40 1,669.63
Tota l Cos t Low Back Pa in PCR PQI CHF PQI COPD PQI Compos i te ED Vis i ts Inpa ti ent Bed Da ys Inpa ti ent Di s cha rges Primary Care Vis i ts Specia l i s t Vis i ts

CPC Aggregated Payer Report – Practice Example

ggr ayer
CPC A egated P Report – Payer Example Linked tables: Clicking on one of the practice bar graphs automatically links their metrics in the other two linked tables.
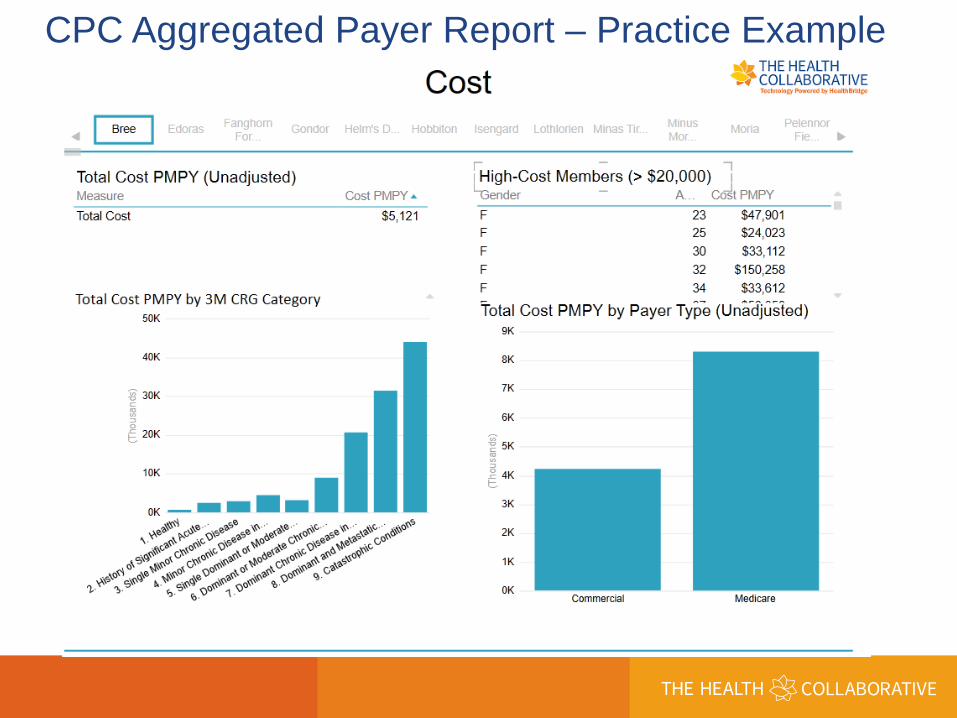
CPC Aggregated Payer Report – Practice Example
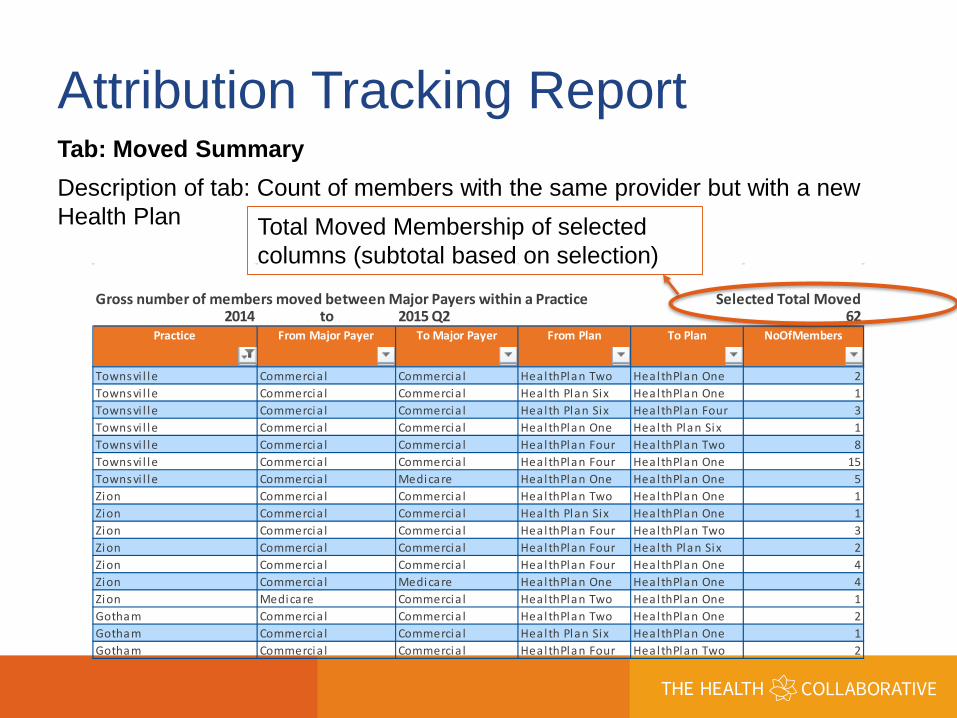
Attribution Tracking Report Tab: Moved Summary Description of tab: Count of members with the same provider but with a new Health Plan Total Moved Membership of selected
columns (subtotal based on selection) Gross number of members moved between Major Payers within a Practice
2014 to 2015 Q2 Selected Total Moved
62 Practice From Major Payer To Major Payer From Plan To Plan NoOfMembers
Towns vi l le Commercia l Commerci a l Heal thPlan Two HealthPlan One 2 Towns vi l le Commercia l Commerci a l Heal th Plan Six Heal thPlan One 1 Towns vi l le Commercia l Commerci a l Heal th Plan Six Heal thPlan Four 3 Towns vi l le Commercia l Commerci a l Heal thPlan One Health Plan Six 1 Towns vi l le Commercia l Commerci a l Heal thPlan Four Heal thPlan Two 8 Towns vi l le Commercia l Commerci a l Heal thPlan Four Heal thPlan One 15 Towns vi l le Commercia l Medicare Heal thPlan One HealthPlan One 5 Zion Commercia l Commerci a l Heal thPlan Two HealthPlan One 1 Zion Commercia l Commerci a l Heal th Plan Six Heal thPlan One 1 Zion Commercia l Commerci a l Heal thPlan Four Heal thPlan Two 3 Zion Commercia l Commerci a l Heal thPlan Four Heal th Plan Six 2 Zion Commercia l Commerci a l Heal thPlan Four Heal thPlan One 4 Zion Commercia l Medicare Heal thPlan One HealthPlan One 4 Zion Medicare Commerci a l Heal thPlan Two HealthPlan One 1 Gotha m Commercia l Commerci a l Heal thPlan Two HealthPlan One 2 Gotha m Commercia l Commerci a l Heal th Plan Six Heal thPlan One 1 Gotha m Commercia l Commerci a l Heal thPlan Four Heal thPlan Two 2

Reports: Lessons Learned
• Don’t assume they know how to use it
• Help them understand the clinical value
• Be prepared for glitches • Teach them to fish…

Primary Care Providers • Cardiovascular Health • Colon Cancer
Screening Rates • Diabetes Management • Patient Experience
Hospital • Effectiveness • Patient Experience • Emergency Department

Cost & Clinical Data Combination
Combined data set tied together via master patient and provider index

Other Innovative Initiatives
ACH