data guide - college of business & technology
TRANSCRIPT

Standard & Poor’s Research Insight North America
Data Guide


Copyright © 2004 The McGraw-Hill Companies, Inc. All rights reserved.
Compustat is a registered trademark of The McGraw-Hill Companies, Inc. Thomson I/B/E/S is a registered trademark of Thomson Financial
The product described in this document is furnished under a license agreement. The information contained in this document is intended solely for the use of clients of Standard & Poor's and may not be photocopied or distributed to third parties unless authorized under the license agreement.
Information contained in this document is subject to change without notice. Standard & Poor's assumes no responsibility or liability for any errors or omissions or for results obtained from use of such information.
7400 S. Alton Court Centennial, Colorado 80112-2394
Customer Support U.S. and Canada 800.523.4534 Mexico 01.800.288.2872; then dial 800.523.4534 International 44.20.7826.8580
http://www.compustat.com/support

Contents
Contents
Overview 1 Standard & Poor's Compustat - Your Premier Source of Fundamental Financial Data................................1 Compustat North America Database Overview............................................................................................1
Standardization and Quality Control....................................................................................................2 Rollover of Data Years and Quarters ...................................................................................................2 Database Population.............................................................................................................................2
Data Types in Compustat North America.....................................................................................................3 Items.....................................................................................................................................................3 Concepts...............................................................................................................................................4 Functions..............................................................................................................................................4
Data Presentation ..........................................................................................................................................4 Calendar Year vs. Fiscal Year..............................................................................................................4 Historical and Restated data.................................................................................................................5 Data Codes ...........................................................................................................................................5
Indexes..........................................................................................................................................................6 Sources of Data.............................................................................................................................................8
Company Specifics 11 Name, Address and Contact Information....................................................................................................11 Company Identifiers ...................................................................................................................................12 Employees and Officers..............................................................................................................................12 About the Company's Data .........................................................................................................................12 Time period (date) of financial/market data ...............................................................................................13 Company Stock...........................................................................................................................................14 Debt Ratings and Fortune 500 ....................................................................................................................15 Company Status ..........................................................................................................................................15 Index Membership ......................................................................................................................................15 Industry and Economic Sectors ..................................................................................................................16 Line of Business and Geographic Segments...............................................................................................17 Miscellaneous .............................................................................................................................................18 Data Definitions..........................................................................................................................................19 Address - City .............................................................................................................................................19 Address - State............................................................................................................................................19 Address - Street or Post Office Box............................................................................................................19 Address - ZIP Code of Company................................................................................................................19 Auditor(s)....................................................................................................................................................19 Auditor's Opinion........................................................................................................................................21 Business Segments - Actual Number..........................................................................................................22 Common Shareholders................................................................................................................................22 Company Name ..........................................................................................................................................22 Company Short Name.................................................................................................................................22 Company Status Code - Quarterly ..............................................................................................................22 Company Web Site Address .......................................................................................................................23 County - Primary Location .........................................................................................................................23 Currency Translation Rate ..........................................................................................................................23 Currency Translation Rate - Quarterly........................................................................................................23

Contents
CUSIP Number...........................................................................................................................................24 Current Period (Company)..........................................................................................................................24 Current Period - Daily (Company) .............................................................................................................25 Current Period - Weekly (Company) ..........................................................................................................25 Current Period - Monthly (Company).........................................................................................................25 Current Period - Quarterly (Company) .......................................................................................................26 Data Comparability Code - Quarterly.........................................................................................................26 Date - Day...................................................................................................................................................26 Date - Month...............................................................................................................................................27 Date - Quarter .............................................................................................................................................27 Date - Year..................................................................................................................................................27 Economic Sector Code - Current ................................................................................................................27 Economic Sector Code - Historical.............................................................................................................28 Employer Identification Number ................................................................................................................29 Employees ..................................................................................................................................................29 Employees - Note .......................................................................................................................................29 Fiscal Year ..................................................................................................................................................29 Fiscal Year - Quarterly ...............................................................................................................................30 Foreign Incorporation Code........................................................................................................................31 Format Code ...............................................................................................................................................34 Format Code - Quarterly.............................................................................................................................34 Fortune Industry Code ................................................................................................................................35 Fortune Rank ..............................................................................................................................................35 GICS Sector ................................................................................................................................................36 GICS Group................................................................................................................................................36 GICS Industry.............................................................................................................................................36 GICS Sub-Industry .....................................................................................................................................36 GLOBAL Vantage Key ..............................................................................................................................37 Industry Sector Code ..................................................................................................................................37 Industry Sector Code - Historical ...............................................................................................................37 Initial Public Offering Date ........................................................................................................................38 Internet Download Date - Scalar.................................................................................................................38 Internet Download Date - Daily..................................................................................................................38 Internet Download Date - Monthly.............................................................................................................38 Internet Download Date - Weekly ..............................................................................................................39 Internet Download Date - Quarterly ...........................................................................................................39 Internet Download Date - Annual...............................................................................................................39 Inventory Valuation Method.......................................................................................................................40 Major Index Markers - Current...................................................................................................................40 Major Index Markers - Monthly .................................................................................................................41 NASDAQ NMS Identification Code ........................................................................................................42 North American Industry Classification System Codes..............................................................................43 Officer Code(s) ...........................................................................................................................................43 Officer Name(s) ..........................................................................................................................................44 Officer Title(s) ............................................................................................................................................44 Order Backlog.............................................................................................................................................44 Period Reference - Final Quarter ................................................................................................................45 Phone Number ............................................................................................................................................45 Primary SIC Code.......................................................................................................................................45 Primary GICS Code - Annual .....................................................................................................................46 Primary GICS Code - Monthly ...................................................................................................................46 Primary GICS Code - Current ....................................................................................................................47 Research Company Reason for Deletion ....................................................................................................47 Research Company - Deletion Date............................................................................................................48 Short Business Description.........................................................................................................................49

Contents
Short-Term Issuer Credit Rating.................................................................................................................49 SIC Code - Historical..................................................................................................................................50 SIC Codes - Business Segment (Primary and Secondary)..........................................................................50 SIC Code(s) - All Products and Segments ..................................................................................................51 Source Code................................................................................................................................................51 Source Code - Quarterly .............................................................................................................................52 S&P Commercial Paper Rating ..................................................................................................................53 S&P Commercial Paper Rating - Quarterly................................................................................................54 S&P Domestic Short-Term Issuer Credit Rating - Current.........................................................................54 S&P Domestic Short-Term Issuer Credit Rating - Monthly .......................................................................55 S&P Domestic Long-Term Issuer Credit Rating - Current.........................................................................56 S&P Domestic Long-Term Issuer Credit Rating - Monthly .......................................................................57 S&P Index Code - Current..........................................................................................................................59 S&P Index Code - Historical ......................................................................................................................59 S&P Index Code - Monthly ........................................................................................................................60 S&P Industry Index Code - Current............................................................................................................60 S&P Industry Index Code - Historical ........................................................................................................60 S&P Industry Index Code - Monthly ..........................................................................................................61 S&P Quality Ranking - Monthly ................................................................................................................61 S&P Senior Debt Rating Categories ...........................................................................................................62 S&P Senior Debt Rating - Current -Note....................................................................................................64 S&P Senior Debt Rating Monthly - Note ...................................................................................................64 S&P Subordinated Debt Rating - Monthly .................................................................................................64 S&P Subordinated Debt Rating - Current...................................................................................................67 State Incorporation Code ............................................................................................................................70 State - Primary Location .............................................................................................................................72 Stock Exchange ..........................................................................................................................................74 Stock Ownership.........................................................................................................................................74 Ticker Symbol ............................................................................................................................................75 Update Code ...............................................................................................................................................76 Update Code - Quarterly.............................................................................................................................77 Value/Growth Indicator ..............................................................................................................................78
Balance Sheet 79 Assets..........................................................................................................................................................79 Liabilities ....................................................................................................................................................80 Data Definitions..........................................................................................................................................83 Accounts Payable........................................................................................................................................83 Accounts Payable - Note.............................................................................................................................83 Accounts Payable - Quarterly .....................................................................................................................84 Accounts Payable - Quarterly - Note ..........................................................................................................84 Accrued Expenses.......................................................................................................................................85 Accumulated Depreciation, Depletion, and Amortization - Total ..............................................................86 Accumulated Depreciation, Depletion, and Amortization - Total - Note ...................................................86 Accumulated Depreciation, Depletion, and Amortization - Total - Quarterly............................................86 Accumulated Depreciation, Depletion, and Amortization - Total - Quarterly - Note.................................87 Assets - Other .............................................................................................................................................87 Assets - Other - Quarterly...........................................................................................................................89 Assets - Other - Excluding Deferred Charges.............................................................................................91 Assets - Total ..............................................................................................................................................92 Assets - Total - Note ...................................................................................................................................93 Assets - Total - Quarterly............................................................................................................................93 Assets - Total - Quarterly - Note.................................................................................................................93 Capital Surplus............................................................................................................................................94

Contents
Capital Surplus - Note.................................................................................................................................95 Capital Surplus - Quarterly .........................................................................................................................95 Capital Surplus - Quarterly - Note ..............................................................................................................96 Cash ............................................................................................................................................................96 Cash and Equivalents..................................................................................................................................97 Cash and Equivalents - Quarterly ...............................................................................................................98 Common Equity - Total ..............................................................................................................................98 Common Equity - Total - Quarterly............................................................................................................99 Common Stock ...........................................................................................................................................99 Common Stock - Note ..............................................................................................................................100 Common Stock - Per Share Carrying Value .............................................................................................100 Common Stock - Quarterly.......................................................................................................................100 Common Stock - Quarterly - Note............................................................................................................101 Current Assets - Other ..............................................................................................................................101 Current Assets - Other- Quarterly.............................................................................................................102 Current Assets - Other - Excluding Prepaid Expenses..............................................................................102 Current Assets - Total ...............................................................................................................................103 Current Assets - Total - Quarterly ............................................................................................................103 Current Liabilities - Other.........................................................................................................................103 Current Liabilities - Other - Quarterly ......................................................................................................104 Current Liabilities - Other Excluding Accrued Expenses.........................................................................106 Current Liabilities - Total .........................................................................................................................106 Current Liabilities - Total - Quarterly.......................................................................................................106 Debt - Total...............................................................................................................................................106 Debt - Total - Quarterly ............................................................................................................................107 Debt Due in 1st Year ................................................................................................................................107 Debt in Current Liabilities ........................................................................................................................107 Debt in Current Liabilities - Quarterly......................................................................................................108 Debt in Current Liabilities - Quarterly - Note...........................................................................................108 Deferred Charges ......................................................................................................................................108 Deferred Taxes (Balance Sheet) ...............................................................................................................109 Deferred Taxes and Investment Tax Credit ..............................................................................................110 Deferred Taxes and Investment Tax Credit - Quarterly............................................................................110 Income Tax Refund ..................................................................................................................................110 Income Taxes Payable ..............................................................................................................................111 Income Taxes Payable - Note ...................................................................................................................111 Income Taxes Payable - Quarterly............................................................................................................111 Income Taxes Payable - Quarterly - Note.................................................................................................112 Intangibles ................................................................................................................................................112 Inventories - Total.....................................................................................................................................113 Inventories - Total - Quarterly ..................................................................................................................114 Invested Capital - Total.............................................................................................................................115 Invested Capital - Total - Quarterly ..........................................................................................................116 Investment Tax Credit (Balance Sheet) ....................................................................................................116 Investments and Advances - Equity Method ............................................................................................116 Investments and Advances - Other ...........................................................................................................117 Liabilities - Other......................................................................................................................................118 Liabilities - Other - Quarterly ...................................................................................................................119 Liabilities - Total ......................................................................................................................................119 Liabilities - Total - Quarterly....................................................................................................................120 Long-Term Debt - Total ...........................................................................................................................120 Long-Term Debt - Total - Note ................................................................................................................121 Long-Term Debt - Total - Quarterly.........................................................................................................121 Long-Term Debt - Total - Quarterly - Note..............................................................................................122 Minority Interest (Balance Sheet) .............................................................................................................122

Contents
Minority Interest (Balance Sheet) - Quarterly ..........................................................................................122 Notes Payable ...........................................................................................................................................123 Preferred Stock .........................................................................................................................................123 Preferred Stock - Note ..............................................................................................................................124 Preferred Stock - Quarterly.......................................................................................................................124 Preferred Stock - Nonredeemable.............................................................................................................125 Preferred Stock - Redeemable ..................................................................................................................125 Preferred Stock - Redeemable - Quarterly................................................................................................126 Prepaid Expenses ......................................................................................................................................126 PP&E (Gross) - Total................................................................................................................................127 PP&E (Gross) - Total - Quarterly .............................................................................................................129 PP&E (Net) - Total ...................................................................................................................................130 PP&E (Net) - Total - Note ........................................................................................................................132 PP&E (Net) - Total - Quarterly.................................................................................................................132 Real Estate Property - Total......................................................................................................................134 Real Estate Property - Total - Quarterly ...................................................................................................135 Receivables - Other Current .....................................................................................................................135 Receivables - Total ...................................................................................................................................136 Receivables - Total - Quarterly.................................................................................................................137 Receivables - Trade ..................................................................................................................................139 Retained Earnings.....................................................................................................................................139 Retained Earnings - Note..........................................................................................................................140 Retained Earnings - Quarterly ..................................................................................................................140 Retained Earnings - Quarterly - Note .......................................................................................................141 Short-Term Investments ...........................................................................................................................142 Stockholders' Equity .................................................................................................................................143 Stockholders' Equity - Quarterly...............................................................................................................143 Treasury Stock - Dollar Amount - Total...................................................................................................143 Treasury Stock - Dollar Amount - Total - Quarterly ................................................................................144
Supplemental Balance Sheet 145 Supplemental Balance Sheet Items...........................................................................................................145 Data Definitions........................................................................................................................................151 Accumulated Depreciation of Real Estate Property..................................................................................151 Accumulated Depreciation of Real Estate Property - Quarterly ...............................................................151 ADR Ratio ................................................................................................................................................151 ADR RATIO - Quarterly ..........................................................................................................................152 Assets - Long-Term - Other - Quarterly ...................................................................................................153 Average Short-Term Borrowings .............................................................................................................153 Average Short-Term Borrowings .............................................................................................................154 Average Short-Term Borrowings Rate .....................................................................................................154 Common Equity - Liquidation Value .......................................................................................................154 Common Equity - Tangible ......................................................................................................................155 Common Shares Issued.............................................................................................................................155 Common Shares Issued - Quarterly ..........................................................................................................155 Common Shares Outstanding - Company.................................................................................................156 Common Shares Outstanding - Company - Quarterly ..............................................................................156 Common Shares Outstanding - Company - Quarterly - Note ...................................................................157 Common Stock - Per Share Carrying Value .............................................................................................157 Compensating Balance .............................................................................................................................157 Contingent Liabilities - Guarantees ..........................................................................................................158 Contingent Liabilities - Guarantees - Notes..............................................................................................158 Convertible Debt and Preferred Stock ......................................................................................................158 Current Assets - Discontinued Operations................................................................................................159

Contents
Current Assets - Other - Excluding Discontinued Operations ..................................................................159 Current Deferred Tax Liab. ......................................................................................................................160 Days to Pay Accounts Payable .................................................................................................................160 Days to Pay Accounts Payable - Quarterly...............................................................................................160 Days to Sell Inventory ..............................................................................................................................160 Days to Sell Inventory - Quarterly............................................................................................................161 Debt - Capitalized Lease Obligations .......................................................................................................161 Debt - Capitalized Lease Obligations - Note ............................................................................................161 Debt - Consolidated Subsidiary ................................................................................................................162 Debt - Consolidated Subsidiary - Note .....................................................................................................162 Debt - Convertible Subordinated ..............................................................................................................162 Debt - Convertible Total ...........................................................................................................................163 Debt - Debentures .....................................................................................................................................163 Debt Due in 2nd Year ...............................................................................................................................163 Debt Due in 3rd Year................................................................................................................................164 Debt Due in 4th Year ................................................................................................................................164 Debt Due in 5th Year ................................................................................................................................164 Debt Due in 2nd, 3rd, 4th, and 5th Years - Note ......................................................................................165 Debt - Finance Subsidiary.........................................................................................................................165 Debt - Finance Subsidiary - Note..............................................................................................................165 Debt - Mortgage and Other Secured .........................................................................................................166 Debt - Notes..............................................................................................................................................166 Debt Components - Note ..........................................................................................................................167 Debt - Other Long-Term...........................................................................................................................167 Debt - Senior Convertible .........................................................................................................................168 Debt - Senior Convertible - Note ..............................................................................................................168 Debt - Subordinated..................................................................................................................................168 Debt - Unamortized Debt Discount and Other..........................................................................................169 Deferred Compensation ............................................................................................................................169 Deferred Compensation - Quarterly..........................................................................................................169 Deferred Revenue - Current......................................................................................................................170 Earning Assets - Total...............................................................................................................................171 Earning Assets - Total - Quarterly ............................................................................................................171 Goodwill ...................................................................................................................................................171 Intangibles - Other ....................................................................................................................................171 Intangibles - Other - Quarterly..................................................................................................................173 Interest Capitalized ...................................................................................................................................174 Inventories - Finished Goods....................................................................................................................175 Inventories - Other ....................................................................................................................................175 Inventories - Raw Materials......................................................................................................................175 Inventories - Work in Process...................................................................................................................176 Inventory Valuation Method.....................................................................................................................176 LIFO Reserve............................................................................................................................................177 Long-Term Assets of Discontinued Operations - Other ...........................................................................177 Long-Term Debt Tied to Prime ................................................................................................................177 Long-term Deferred Revenue ...................................................................................................................178 Long-Term Investments - Total - Quarterly .............................................................................................178 Marketable Securities Adjustment............................................................................................................178 Nonperforming Assets - Total ..................................................................................................................178 Other Accumulated Comprehensive Income ............................................................................................179 Other Accumulated Comprehensive Income - Quarterly..........................................................................179 Preferred Dividends in Arrears .................................................................................................................180 Preferred Stock .........................................................................................................................................180 Preferred Stock - Convertible ...................................................................................................................180 Preferred Stock - Liquidating Value .........................................................................................................181

Contents
Preferred Stock - Redemption Value ........................................................................................................181 Receivables - Estimated Doubtful ............................................................................................................182 Rental Commitments - Min. (1st Year) ....................................................................................................182 Rental Commitments - Min. (2nd Year) ...................................................................................................183 Rental Commitments - Min. (3rd Year)....................................................................................................183 Rental Commitments - Min. (4th Year) ....................................................................................................183 Rental Commitments - Min. (5th Year) ....................................................................................................184 Rental Commitments - Min. (5 Years Total) ............................................................................................184 Rental Commitments - Min. - Note ..........................................................................................................184 Rent Commitments - Thereafter ...............................................................................................................184 Retained Earnings - Cumulative Transaction Adjustment........................................................................185 Retained Earnings - Other Adjustments....................................................................................................185 Retained Earnings - Restatement ..............................................................................................................185 Retained Earnings - Unadjusted................................................................................................................186 Retained Earnings - Unadjusted - Quarterly .............................................................................................186 Retained Earnings - Unadjusted - Note - Quarterly ..................................................................................186 Retained Earnings - Unrestricted ..............................................................................................................187 Stockholders' Equity Adjustments ............................................................................................................187 Stockholders' Equity Adjustments - Quarterly..........................................................................................188 Tax Loss Carry Forward ...........................................................................................................................189 Treasury Stock - Dollar Amount - Common ............................................................................................189 Treasury Stock - Dollar Amount - Common - Note .................................................................................190 Treasury Stock - Dollar Amount - Preferred ............................................................................................190 Treasury Stock - Memo Entry ..................................................................................................................190 Treasury Stock - Number of Common Shares ..........................................................................................191 Working Capital (Balance Sheet) .............................................................................................................191
Income Statement 193 Basic Income Statement............................................................................................................................193 EPS and Common Shares Used to Calculate EPS ....................................................................................196 Data Definitions........................................................................................................................................199 Amortization of Intangibles ......................................................................................................................199 Cash Dividends - Preferred.......................................................................................................................199 Cash Dividends - Preferred - Quarterly ....................................................................................................200 Common Shares for 12-Months Moving Earnings Per Share...................................................................200 Common Shares for Basic Earnings Per Share .........................................................................................200 Common Shares for Basic Earnings Per Share - Quarterly ......................................................................201 Common Shares for Diluted Earnings Per Share......................................................................................201 Common Shares for Diluted EPS - Quarterly...........................................................................................202 Common Stock Equivalents - Dollar Savings...........................................................................................202 Common Stock Equivalents - Dollar Savings - Quarterly ........................................................................202 Cost of Goods Sold...................................................................................................................................203 Cost of Goods Sold - Note........................................................................................................................204 Cost of Goods Sold - Quarterly ................................................................................................................205 Cost of Goods Sold - Quarterly - Note .....................................................................................................206 Cost of Goods Sold - 12-Months Moving.................................................................................................206 Deferred Taxes - Federal ..........................................................................................................................207 Deferred Taxes - Foreign..........................................................................................................................207 Deferred Taxes - State ..............................................................................................................................207 Deferred Taxes (Income Account)............................................................................................................208 Deferred Taxes (Income Account) - Quarterly .........................................................................................208 Depreciation and Amortization.................................................................................................................209 Depreciation and Amortization - Note......................................................................................................210 Depreciation and Amortization - Quarterly - Note ...................................................................................210

Contents
Depreciation and Amortization - Quarterly ..............................................................................................210 Depreciation and Amortization - 12-Months Moving ..............................................................................212 Discontinued Operations...........................................................................................................................212 Discontinued Operations - Quarterly ........................................................................................................213 Extraordinary Items ..................................................................................................................................213 Extraordinary Items - Quarterly................................................................................................................214 Extraordinary Items and Discontinued Operations ...................................................................................214 Extraordinary Items and Discontinued Operations - Quarterly ................................................................215 Gain/Loss on Sale of Real Estate..............................................................................................................216 Gain/Loss on Sale of Real Estate - Quarterly ...........................................................................................216 Income Before Extraordinary Items..........................................................................................................217 Income Before Extraordinary Items - Quarterly .......................................................................................217 Income Before Extraordinary Items - Quarterly - Note ............................................................................218 Income Before Extraordinary Items - 12-Months Moving .......................................................................218 Income Before Extraordinary Items - Adjst. for Common Stock Equivalents..........................................219 Income Before Extraordinary Items - Adjst. for Common Stock Equivalents - Note...............................219 Income Before Extraordinary Items - Adjst. for Common Stock Equivalents - Quarterly .......................220 Income Before Extraordinary Items - Adjst. for Common Stock Equivalents - Qtly Note ......................220 Income Before Extraordinary Items - Adjusted for Common Stock Equivalents - 12MM ......................221 Income Before Extraordinary Items - Available for Common .................................................................221 Income Before Extraordinary Items - Available for Common - Quarterly ...............................................222 Income Before Extraordinary Items - Available for Common - 12 Months Moving................................222 Income Taxes - Note.................................................................................................................................223 Income Taxes - Federal.............................................................................................................................223 Income Taxes - Foreign ............................................................................................................................223 Income Taxes - Other ...............................................................................................................................224 Income Taxes - State.................................................................................................................................225 Income Taxes - Total ................................................................................................................................225 Income Taxes - Total - Note .....................................................................................................................226 Income Taxes - Total - Quarterly..............................................................................................................226 Income Taxes - Total - Quarterly - Note...................................................................................................227 Interest Expense........................................................................................................................................227 Interest Expense - Note.............................................................................................................................228 Interest Expense - 12-Months Moving......................................................................................................228 Interest Expense - Quarterly .....................................................................................................................228 Interest Expense - Quarterly - Note ..........................................................................................................229 Interest Income .........................................................................................................................................230 Minority Interest (Income Account) .........................................................................................................230 Minority Interest (Income Account) - Quarterly.......................................................................................230 Net Income Adjusted for Common Stock Equivalents .............................................................................231 Net Income (Loss) ....................................................................................................................................231 Net Income (Loss) - Note .........................................................................................................................231 Net Income (Loss) - Quarterly..................................................................................................................232 Net Income (Loss) - 12-Months Moving ..................................................................................................232 Nonoperating Income (Expense) ..............................................................................................................232 Nonoperating Income (Expense) - Quarterly............................................................................................233 Nonoperating Income (Expense) - Excluding Interest Income.................................................................234 Operating Income After Depreciation.......................................................................................................234 Operating Income After Depreciation - Note ...........................................................................................234 Operating Income After Depreciation - Quarterly ....................................................................................235 Operating Income After Depreciation - 12-Months Moving ....................................................................235 Operating Income Before Depreciation ....................................................................................................235 Operating Income Before Depreciation - 12-Months Moving..................................................................236 Operating Income Before Depreciation - Quarterly..................................................................................237 Pretax Income ...........................................................................................................................................238

Contents
Pretax Income - Note ................................................................................................................................238 Pretax Income - Quarterly.........................................................................................................................238 Pretax Income - 12-Months Moving.........................................................................................................239 Sales (Net) ................................................................................................................................................239 Sales (Net) - Note .....................................................................................................................................240 Sales (Net) - Quarterly..............................................................................................................................241 Sales (Net) - Quarterly - Note...................................................................................................................242 Sales (Net) - 12-Months Moving ..............................................................................................................244 Selling, General, and Administrative Expenses........................................................................................244 Selling, General, and Administrative Expenses - Note.............................................................................246 Selling, General, and Administrative Expenses - Quarterly .....................................................................246 Selling, General, and Administrative Expenses - Quarterly - Note ..........................................................247 Selling, General, and Administrative Expenses - 12-Months Moving......................................................247 Special Items.............................................................................................................................................247 Special Items - Quarterly ..........................................................................................................................249
Supplemental Income Statement 251 Supplementary Income Statement Items...................................................................................................251 Data Definitions........................................................................................................................................257 Accounting Changes - Cumulative Effect ................................................................................................257 Accounting Changes - Cumulative Effect - Note .....................................................................................257 Accounting Changes - Cumulative Effect - Quarterly..............................................................................258 Accounting Changes - Cumulative Effect - Note - Quarterly...................................................................258 Acquisition/Merger After-Tax ..................................................................................................................259 Acquisition/Merger After-Tax - Quarterly ...............................................................................................259 Acquisition/Merger Basic EPS Effect.......................................................................................................259 Acquisition/Merger Basic EPS Effect - Quarterly ....................................................................................259 Acquisition/Merger Diluted EPS Effect ...................................................................................................260 Acquisition/Merger Diluted EPS Effect - Quarterly.................................................................................260 Acquisition/Merger Pretax........................................................................................................................260 Acquisition/Merger Pretax - Quarterly .....................................................................................................260 Acquisitions - Income Contribution..........................................................................................................261 Acquisitions - Sales Contribution .............................................................................................................261 Acquisitions - Sales Contribution - Note ..................................................................................................262 Advertising Expense.................................................................................................................................262 Cash Dividends - Common.......................................................................................................................262 Depreciation and Amortization of Real Estate Property...........................................................................263 Depreciation and Amortization of Real Estate Property - Quarterly ........................................................264 Dilution Adjustment .................................................................................................................................264 Dilution Adjustment - Quarterly...............................................................................................................265 Dilution Available - Excluding Extraordinary Items ................................................................................265 Dilution Available - Excluding Extraordinary Items - Quarterly..............................................................265 Equity in Earnings - Unconsolidated Subsidiary ......................................................................................265 Equity in Earnings - Unconsolidated Subsidiary - Note ...........................................................................266 Excise Taxes .............................................................................................................................................266 Foreign Currency Adjustment ..................................................................................................................266 Foreign Currency Adjustment - Note .......................................................................................................267 Foreign Currency Adjustment - Quarterly ................................................................................................267 Foreign Currency Adjustment - Quarterly - Note .....................................................................................267 Gain/Loss After-Tax.................................................................................................................................267 Gain/Loss After-Tax - Quarterly ..............................................................................................................268 Gain/Loss Basic EPS Effect .....................................................................................................................268 Gain/Loss Basic EPS Effect - Quarterly ...................................................................................................268 Gain/Loss Diluted EPS Effect ..................................................................................................................268

Contents
Gain/Loss Diluted EPS Effect - Quarterly................................................................................................269 Gain/Loss Pretax.......................................................................................................................................269 Gain/Loss Pretax - Quarterly ....................................................................................................................269 Goodwill Amortization .............................................................................................................................269 Goodwill Amortization - Note ..................................................................................................................269 Goodwill Amortization - Quarterly ..........................................................................................................270 Goodwill Amortization - Note - Quarterly ...............................................................................................270 Impairments of Goodwill After-Tax.........................................................................................................270 Impairments of Goodwill After Tax Footnote ..........................................................................................270 Impairments of Goodwill After-Tax - Quarterly ......................................................................................271 Impairments of Goodwill After Tax Quarterly Footnote ..........................................................................271 Impairments of Goodwill After Tax 12MM .............................................................................................271 Impairments of Goodwill After Tax 12MM Footnote ..............................................................................272 Impairments of Goodwill Basic EPS Effect .............................................................................................272 Impairments of Goodwill Basic EPS Effect Footnote ..............................................................................272 Impairments of Goodwill Basic EPS Effect - Quarterly ...........................................................................273 Impairments of Goodwill Basic EPS Effect Quarterly Footnote ..............................................................273 Impairments of Goodwill Basic EPS Effect 12MM .................................................................................273 Impairments of Goodwill Basic EPS Effect 12MM Footnote ..................................................................274 Impairments of Goodwill Diluted EPS Effect ..........................................................................................274 Impairments of Goodwill Diluted EPS Effect Footnote ...........................................................................274 Impairments of Goodwill Diluted EPS Effect - Quarterly........................................................................274 Impairments of Goodwill Diluted EPS Effect Quarterly Footnote ...........................................................275 Impairments of Goodwill Diluted EPS Effect 12MM ..............................................................................275 Impairments of Goodwill Diluted EPS Effect 12MM Footnote ...............................................................275 Impairments of Goodwill Pretax...............................................................................................................276 Impairments of Goodwill Pretax - Quarterly ............................................................................................276 Implied Option Expense ...........................................................................................................................276 Implied Option Expense Footnote ............................................................................................................276 In Process Research & Development........................................................................................................277 In Process Research & Development - Quarterly .....................................................................................277 Interest Capitalized ...................................................................................................................................277 Interest Expense on Long-Term Debt.......................................................................................................277 Investment Tax Credit (Income Account) ................................................................................................278 Investment Tax Credit (Income Account) - Note .....................................................................................278 Labor and Related Expenses.....................................................................................................................278 Labor and Related Expenses - Note..........................................................................................................279 Net Income Effect Capitalized Interest.....................................................................................................279 Pension and Retirement Expense..............................................................................................................279 Pretax Income - Domestic.........................................................................................................................281 Pretax Income - Foreign ...........................................................................................................................281 Rental Expense .........................................................................................................................................281 Rental Expense - Note ..............................................................................................................................282 Rental Income...........................................................................................................................................282 Research and Development Expense ........................................................................................................282 Research and Development Expense - Note .............................................................................................283 Research and Development Expense - Quarterly......................................................................................283 Research and Development Expense - Quarterly - Note...........................................................................284 Restructuring Costs After-Tax..................................................................................................................284 Restructuring Costs After-Tax - Quarterly ...............................................................................................284 Restructuring Costs Basic EPS Effect ......................................................................................................284 Restructuring Costs Basic EPS Effect - Quarterly....................................................................................285 Restructuring Costs Diluted EPS Effect ...................................................................................................286 Restructuring Costs Diluted EPS Effect - Quarterly.................................................................................286 Restructuring Costs Pretax........................................................................................................................286

Contents
Restructuring Costs Pretax - Quarterly .....................................................................................................286 Settlement After-Tax ................................................................................................................................286 Settlement After-Tax - Quarterly..............................................................................................................287 Settlement Basic EPS Effect.....................................................................................................................287 Settlement Basic EPS Effect - Quarterly ..................................................................................................287 Settlement Diluted EPS Effect..................................................................................................................287 Settlement Diluted EPS Effect - Quarterly ...............................................................................................289 Settlement Pretax ......................................................................................................................................289 Settlement Pretax - Quarterly ...................................................................................................................289 Special Items After-Tax - Other ...............................................................................................................289 Special Items After-Tax - Other - Quarterly.............................................................................................289 Special Items Basic EPS Effect - Other ....................................................................................................290 Special Items Basic EPS Effect - Other - Quarterly .................................................................................290 Special Items Diluted EPS Effect - Other.................................................................................................290 Special Items Diluted EPS Effect - Other - Quarterly ..............................................................................290 Special Items Pretax - Other .....................................................................................................................291 Special Items Pretax - Other - Quarterly...................................................................................................291 Stock Compensation Expense...................................................................................................................291 Stock Compensation Expense - Quarterly ................................................................................................291 Writedowns After-Tax..............................................................................................................................292 Writedowns After-Tax - Quarterly ...........................................................................................................292 Writedowns Basic EPS Effect ..................................................................................................................292 Writedowns Basic EPS Effect - Quarterly................................................................................................293 Writedowns Diluted EPS Effect ...............................................................................................................293 Writedowns Diluted EPS Effect - Quarterly.............................................................................................293 Writedowns Pretax....................................................................................................................................293 Writedowns Pretax - Quarterly .................................................................................................................294
Business Segment 295 Business Segment Items ...........................................................................................................................295 Data Definitions........................................................................................................................................297 Availability Codes - Segment ...................................................................................................................297 Business Segment Name...........................................................................................................................297 Business Segments - Actual Number........................................................................................................297 Capital Expenditures (Business Segment) ................................................................................................297 Capital Expenditures (Business Segment) - Note .....................................................................................298 Customer Name(s) - Primary (Business Segment) ...................................................................................298 Depreciation, Depletion, and Amortization (Business Segment) .............................................................298 Employees (Business Segment)................................................................................................................298 Employees (Business Segment) - Note.....................................................................................................299 Equity in Earnings - Unconsolidated Subsidiaries (Business Segment) ...................................................299 Equity in Earnings - Unconsolidated Subsidiaries (Business Segment) - Note ........................................299 Foreign Governments (Business Segment)...............................................................................................299 Identifiable Assets - Business Segment ....................................................................................................300 Identification Codes - Segment.................................................................................................................300 Investments at Equity (Business Segment)...............................................................................................300 Operating Profit (Business Segment)........................................................................................................300 Operating Profit (Business Segment) - Note.............................................................................................301 Order Backlog (Business Segment) ..........................................................................................................301 Principle Product Names (Business Segment)..........................................................................................301 Principle Product(s) SIC(s) (Business Segment) ......................................................................................302 R&D - Company Sponsored (Business Segment) ....................................................................................302 R&D - Company Sponsored (Business Segment) - Note .........................................................................302 R&D - Customer Sponsored (Business Segment) ....................................................................................302

Contents
Sales of Principle Product(s) (Business Segment) ....................................................................................303 Sales (Net) (Business Segment)................................................................................................................303 Sales (Net) (Business Segment) - Note.....................................................................................................304 Sales to Domestic Government (Business Segment) ................................................................................305 Sales to Foreign Government (Business Segment)...................................................................................305 Sales to Principal Customer(s) (Business Segment) .................................................................................305 Sales to Principal Customer(s) (Business Segment) - Note ......................................................................306 SIC Codes - Business Segment (Primary and Secondary)........................................................................307 Source Code - Business Segment .............................................................................................................307 Update Code - Business Segment .............................................................................................................308
Canadian Data 309 Canadian Economic Data Items................................................................................................................309 Additional Canadian Data Items...............................................................................................................310 Data Definitions........................................................................................................................................311 Consumer Price Index - All Items - Canada .............................................................................................311 Employment - Canada ..............................................................................................................................311 Government Bonds 10 Year and Over - Canada.......................................................................................311 Government Bonds - 30 Year - Canada....................................................................................................311 Government Notes - 5 Year - Canada.......................................................................................................312 Government Notes - 10 Year - Canada.....................................................................................................312 Gross Domestic Product - Canada ............................................................................................................312 Housing Starts (Units) - Canada ...............................................................................................................312 Industrial Product Price Index - Canada ...................................................................................................313 Prime Interest Rate - Canada ....................................................................................................................313 Raw Material Price Index - Canada ..........................................................................................................313 Retail Sales - Total - Canada ....................................................................................................................313 Sale of Passenger Cars - Canada...............................................................................................................313 Treasury Bill - 3 Month - Canada .............................................................................................................314 Treasury Bill - 12 Month - Canada ...........................................................................................................314 Unemployment Rate - Canada ..................................................................................................................314 Common Stock Float Shares - Canada .....................................................................................................314 EPS - 12-Month Moving Historical - Canada...........................................................................................315 Market Float Value - Canada....................................................................................................................315 Market Float Value - Monthly - Canada...................................................................................................315 Price to Historical Earnings Per Share - Canada.......................................................................................315
Columbine Capital Data 317 Columbine Model Items ...........................................................................................................................317 Columbine Factor Items............................................................................................................................319 Data Definitions........................................................................................................................................321 Beta (Columbine Capital Services)...........................................................................................................321 Book Value (Columbine Capital Services)...............................................................................................321 Cash Flow (Columbine Capital Services).................................................................................................321 Columbine Alpha - Decile ........................................................................................................................322 Columbine Alpha - Score .........................................................................................................................322 Columbine/First Call - Decile...................................................................................................................322 Columbine/First Call - Score ....................................................................................................................323 Combo Model - Decile .............................................................................................................................323 Columbine Sector Model - Decile ............................................................................................................323 Combo Model - Score...............................................................................................................................324 Columbine Sector Model - Percentile.......................................................................................................324

Contents
Core Model - Decile .................................................................................................................................324 Core Model - Score...................................................................................................................................324 Dividend Yield (Columbine Capital Services) ........................................................................................325 Earnings Change.......................................................................................................................................325 Earnings Growth.......................................................................................................................................325 Earnings Surprise......................................................................................................................................326 Earnings Volatility....................................................................................................................................326 Estimate Revision .....................................................................................................................................326 Estimated Earnings Yield .........................................................................................................................326 Growth Model - Decile .............................................................................................................................327 Growth Model - Score ..............................................................................................................................327 Income Model - Decile .............................................................................................................................327 Income Model - Score...............................................................................................................................327 Market Liquidity.......................................................................................................................................328 Momentum Model - Decile.......................................................................................................................328 Momentum Model - Score........................................................................................................................328 Reported Earnings Yield...........................................................................................................................329 Small-Cap Model - Decile ........................................................................................................................329 Small-Cap Model - Score .........................................................................................................................329 Valuation Model - Score...........................................................................................................................329 Valuation Model - Decile .........................................................................................................................330 Value Model - Decile................................................................................................................................330 Value Model - Score .................................................................................................................................330
Compustat Classic Data 331 Compustat Classic Data Items ..................................................................................................................331 Date Company First Time on Compustat Database..................................................................................338
Financial Ratios 339 Liquidity and Capital Structure.................................................................................................................339 Funds Flow ...............................................................................................................................................343 Performance..............................................................................................................................................344 Data Definitions........................................................................................................................................347 Assets for Sale to Assets...........................................................................................................................347 Available for Interest ................................................................................................................................347 Available for Interest - Quarterly..............................................................................................................347 Average Collection Period........................................................................................................................347 Average Collection Period - Quarterly .....................................................................................................348 Bad Debt Reserve Ratio............................................................................................................................348 Berry Ratio ...............................................................................................................................................348 Cash Flow.................................................................................................................................................348 Cash Flow - Alternate Definition..............................................................................................................349 Cash Flow Quarterly.................................................................................................................................349 Cash Flow Margin ....................................................................................................................................349 Cash Flow Margin - Quarterly..................................................................................................................349 Cash Flow Margin - Alternate Definition .................................................................................................350 Cash Flow per Share .................................................................................................................................350 Cash Flow per Share - Quarterly ..............................................................................................................350 Cash to Current Assets..............................................................................................................................350 Cash to Current Assets - Quarterly ...........................................................................................................350 Cash to Current Liabilities ........................................................................................................................351 Cash to Current Liabilities - Quarterly .....................................................................................................351

Contents
Cash Reinvestment Ratio..........................................................................................................................351 Cash Reinvestment Ratio - Quarterly .......................................................................................................351 Cash Turnover ..........................................................................................................................................352 Cash Turnover - Quarterly........................................................................................................................352 Coefficient of Determination - Cash Flow - 3 Year..................................................................................352 Coefficient of Determination - Cash Flow - 5 Year..................................................................................352 Coefficient of Determination - Cash Flow - 10 Year................................................................................353 Coefficient of Determination - Common Equity (Book Value) - 3 Year..................................................353 Coefficient of Determination - Common Equity (Book Value) - 5 Year..................................................353 Coefficient of Determination - Common Equity (Book Value) - 10 Year................................................353 Coefficient of Determination - Dividends per Share by Ex-Date - 3 Year ...............................................354 Coefficient of Determination - Dividends per Share by Ex-Date - 5 Year ...............................................354 Coefficient of Determination - Dividends per Share by Ex-Date - 10 Year .............................................354 Coefficient of Determination - EPS Basic - Excluding - 3 Year ..............................................................354 Coefficient of Determination - EPS Basic - Excluding - 5 Year ..............................................................354 Coefficient of Determination - EPS Basic - Excluding - 10 Year.............................................................355 Coefficient of Determination - Income Before Extra Items - 3 Year........................................................355 Coefficient of Determination - Income Before Extra Items - 5 Year........................................................355 Coefficient of Determination - Income Before Extra Items - 10 Year......................................................355 Coefficient of Determination - Restated EPS Basic - Excluding - 3 Year................................................356 Coefficient of Determination - Restated EPS Basic - Excluding - 5 Year...............................................356 Coefficient of Determination - Restated EPS Basic - Excluding - 10 Year..............................................356 Coefficient of Determination - Restated Sales - 3 Year............................................................................356 Coefficient of Determination - Restated Sales - 5 Year............................................................................356 Coefficient of Determination - Restated Sales - 10 Year..........................................................................357 Coefficient of Determination - Sales - 3 Year ..........................................................................................357 Coefficient of Determination - Sales - 5 Year ..........................................................................................357 Coefficient of Determination - Sales - 10 Year ........................................................................................357 Common Equity Turnover ........................................................................................................................357 Common Equity Turnover - Quarterly......................................................................................................358 Compound Growth Rate - Five Year - Sales - Net ...................................................................................358 Compound Growth Rate - Five Year - Dividends Per Share by Ex-Date .................................................358 Compound Growth Rate - Five Year - EPS Basic - Excluding ................................................................358 Compound Growth Rate - Five Year - Income Before Extraordinary Items ............................................359 Current Ratio ............................................................................................................................................359 Current Ratio - Quarterly..........................................................................................................................359 Days to Pay Accounts Payable .................................................................................................................359 Days to Pay Accounts Payable - Quarterly...............................................................................................360 Days to Sell Inventory ..............................................................................................................................360 Days to Sell Inventory - Quarterly............................................................................................................360 Earning Assets - Total...............................................................................................................................360 Earning Assets - Total - Quarterly ............................................................................................................360 Earnings Predictability..............................................................................................................................361 Earnings Retention Rate ...........................................................................................................................361 Earnings Retention Rate - Quarterly.........................................................................................................361 Earnings Retention Rate - 3 Year Average...............................................................................................361 Earnings Retention Rate - 5 Year Average...............................................................................................362 Earnings Retention Rate - 10 Year Average.............................................................................................362 Earnings Before Taxes and Interest Margin .............................................................................................362 EBITDA Margin.......................................................................................................................................362 Equity Growth Rate ..................................................................................................................................363 Equity Growth Rate - Quarterly................................................................................................................363 Equity Growth Rate - 3 Year Average......................................................................................................363 Equity Growth Rate - 5 Year Average......................................................................................................364 Equity Growth Rate - 10 Year Average....................................................................................................364

Contents
Financial Leverage Index..........................................................................................................................364 Financial Leverage Index - Quarterly .......................................................................................................364 Fixed Assets/Common Equity ..................................................................................................................364 Fixed Assets/Common Equity - Quarterly................................................................................................365 Fixed Assets/Total Equity.........................................................................................................................365 Fixed Assets/Total Equity - Quarterly ......................................................................................................365 Fixed Assets Turnover ..............................................................................................................................365 Fixed Assets Turnover - Quarterly ...........................................................................................................365 Foreign Sales - Total as a Percentage of Sales..........................................................................................366 Free Cash Flow.........................................................................................................................................366 Free Cash Flow - Quarterly ......................................................................................................................366 Free Cash Flow - 12 Months Moving .......................................................................................................366 Free Cash Flow Per Share.........................................................................................................................366 Free Cash Flow Per Share - Quarterly ......................................................................................................367 Free Cash Flow Per Share - 12 Months Moving.......................................................................................367 Funds Flow Adequacy Ratio.....................................................................................................................367 Funds Flow Adequacy Ratio - Quarterly ..................................................................................................367 Funds Flow Adequacy Ratio 12MM.........................................................................................................368 Gross Assets .............................................................................................................................................368 Gross Assets - Quarterly ...........................................................................................................................368 Gross Profit Margin ..................................................................................................................................369 Gross Profit Margin - Quarterly................................................................................................................369 Gross Profit Margin - 12-Months Moving................................................................................................369 Income Percentage Change - 1-Year ........................................................................................................369 Income Percentage Change - 3-Year ........................................................................................................369 Income Percentage Change - 5-Year ........................................................................................................370 Income Percentage Change - 10-Year ......................................................................................................370 Interest Coverage After Tax .....................................................................................................................370 Interest Coverage After Tax - Quarterly ...................................................................................................370 Interest Coverage Before Tax ...................................................................................................................371 Interest Coverage Before Tax - Quarterly.................................................................................................371 Interest Expense (FS) % of Liabilities ......................................................................................................371 Internal Funding of Capital Expenditures.................................................................................................372 Internal Funding of Capital Expenditures - Quarterly ..............................................................................372 Inventory Turnover ...................................................................................................................................372 Inventory Turnover - Quarterly ................................................................................................................372 Invested Capital - Total.............................................................................................................................372 Invested Capital - Total - Quarterly ..........................................................................................................373 Leased Asset Turnover .............................................................................................................................373 Liquidity Index .........................................................................................................................................373 Liquidity Index - Quarterly.......................................................................................................................374 Long-Term Debt - Common Equity .........................................................................................................374 Long-Term Debt - Common Equity - Quarterly .......................................................................................374 Least Squares Growth Rate - Book Value (Common Equity) - 3 Year ....................................................374 Least Squares Growth Rate - Book Value (Common Equity) - 5 Year ....................................................375 Least Squares Growth Rate - Book Value (Common Equity) ..................................................................375 Least Squares Growth Rate - Cash Flow ..................................................................................................375 Least Squares Growth Rate - Cash Flow ..................................................................................................376 Least Squares Growth Rate - Cash Flow - 10 Year ..................................................................................376 Least Squares Growth Rate - Dividends Per Share by Ex-Date - 3 Year .................................................377 Least Squares Growth Rate - Dividends Per Share by Ex-Date ...............................................................377 Least Squares Growth Rate - Dividends Per Share by Ex-Date - 10 Year................................................377 Least Squares Growth Rate - Earnings per Share Diluted/ 3 Yr. ..............................................................378 Least Squares Growth Rate - EPS Primary - Excl. - 3 Year .....................................................................378 Least Squares Growth Rate - EPS Primary - Excl. - 5 Year .....................................................................378

Contents
Least Squares Growth Rate - EPS Primary - Excl. - 10 Year ...................................................................378 Least Squares Growth Rate - Income Before Extra. Items - 3 Year .........................................................379 Least Squares Growth Rate - Income Before Extra. Items - 5 Year .........................................................379 Least Squares Growth Rate - Income Before Extra. Items - 10 Year .......................................................380 Least Squares Growth Rate - Restated EPS Primary - Excl. - 3 Year ......................................................380 Least Squares Growth Rate - Restated EPS Primary - Excl. - 5 Year ......................................................380 Least Squares Growth Rate - Restated EPS Primary - Excl. - 10 Year ....................................................381 Least Squares Growth Rate - Restated Sales - 5 Year ..............................................................................381 Least Squares Growth Rate - Restated Sales - 3 Year ..............................................................................381 Least Squares Growth Rate - Sales - 3 Year .............................................................................................382 Least Squares Growth Rate - Sales - 5 Year .............................................................................................382 Least Squares Growth Rate - Sales - 10 Year ...........................................................................................382 Long-Term Debt/Shareholder's Equity .....................................................................................................383 Long-Term Debt/Shareholder's Equity - Quarterly...................................................................................383 Long-Term Debt/Tangible Assets.............................................................................................................383 Long-Term Debt/Total Capital .................................................................................................................383 Long-Term Debt/Total Capital - Quarterly...............................................................................................383 Net Charge-Offs........................................................................................................................................384 Net Charge-Offs % of Net Income ...........................................................................................................384 Net Interest Margin...................................................................................................................................384 Net Loans Percentage of Assets................................................................................................................385 Net Loans Percentage of Deposits ............................................................................................................385 Net Operating Assets ................................................................................................................................385 Net Operating Assets - Quarterly..............................................................................................................385 Net Profit Margin......................................................................................................................................386 Net Profit Margin - Quarterly ...................................................................................................................386 Net Trade Cycle - Quarterly .....................................................................................................................386 Net Trade Cycle........................................................................................................................................386 Nonoperating Income (Expenses) % of Net Interest Income....................................................................387 Nonperforming Assets % of Assets - Total ..............................................................................................387 Nonperforming Assets % of Common Equity ..........................................................................................387 On-Balance-Volume .................................................................................................................................387 Operating Cycle ........................................................................................................................................388 Operating Cycle - Quarterly .....................................................................................................................388 Operating Margin After Depreciation.......................................................................................................388 Operating Margin After Depreciation - Quarterly ....................................................................................388 Operating Margin Before Depreciation ....................................................................................................389 Operating Margin Before Depreciation - Quarterly..................................................................................389 Pretax Profit Margin .................................................................................................................................389 Pretax Profit Margin - Quarterly...............................................................................................................389 Pretax Return on Assets............................................................................................................................390 Pretax Return on Assets - Quarterly .........................................................................................................390 Pretax Return on Average Assets - Fixed .................................................................................................390 Pretax Return on Average Assets - Fixed - Quarterly...............................................................................390 Pretax Return on Average Assets - Total..................................................................................................391 Pretax Return on Average Assets - Total - Quarterly ...............................................................................391 Pretax Return on Average Equity .............................................................................................................391 Pretax Return on Average Equity - Quarterly...........................................................................................391 Pretax Return on Average Investment ......................................................................................................391 Pretax Return on Average Investment - Quarterly....................................................................................392 Pretax Return on Equity............................................................................................................................392 Pretax Return on Equity - Quarterly .........................................................................................................392 Pretax Return on Fixed Assets..................................................................................................................392 Pretax Return on Fixed Assets - Quarterly ...............................................................................................393 Pretax Return on Investment.....................................................................................................................393

Contents
Pretax Return on Investment - Quarterly ..................................................................................................393 Provision for Loan/Asset Losses ..............................................................................................................393 Provision for Loan/Asset Losses % of Assets ..........................................................................................394 Quick Ratio...............................................................................................................................................394 Quick Ratio - Quarterly ............................................................................................................................394 Receivables Turnover ...............................................................................................................................394 Receivables Turnover - Quarterly.............................................................................................................395 Reinvestment Rate ....................................................................................................................................395 Reinvestment Rate - Quarterly..................................................................................................................395 Reinvestment Rate - 3-Year Average .......................................................................................................395 Reinvestment Rate - 5-Year Average .......................................................................................................395 Reinvestment Rate - 10-Year Average .....................................................................................................396 Reserve for Loan/Asset Losses % of Nonperf. Assets..............................................................................396 Reserve for Loan/Asset Losses.................................................................................................................396 Reserve for Loan/Asset Losses % of Assets.............................................................................................397 Return on Assets .......................................................................................................................................397 Return on Assets - Quarterly ....................................................................................................................397 Return on Average Assets.........................................................................................................................397 Return on Average Assets - Quarterly ......................................................................................................398 Return on Average Equity ........................................................................................................................398 Return on Average Equity - Quarterly......................................................................................................398 Return on Average Investment .................................................................................................................398 Return on Average Investment - Quarterly...............................................................................................399 Return on Equity.......................................................................................................................................399 Return on Equity - Quarterly ....................................................................................................................399 Return on Investment................................................................................................................................400 Return on Investment - Quarterly .............................................................................................................400 Sales Percentage Change - 1-Year............................................................................................................400 Sales Percentage Change - 3-Year............................................................................................................400 Sales Percentage Change - 5-Year............................................................................................................401 Sales Percentage Change - 10-Year ..........................................................................................................401 Securities Percentage of Assets ................................................................................................................401 Short-Term Debt as a Percentage of Total Debt .......................................................................................401 Short-Term Debt as a Percentage of Total Debt - Quarterly.....................................................................401 Tax Rate....................................................................................................................................................402 Tax Rate - Quarterly .................................................................................................................................402 Tax Retention Rate ...................................................................................................................................402 Tax Retention Rate - Quarterly.................................................................................................................402 Tax Retention Rate - 3-Year Average.......................................................................................................403 Tax Retention Rate - 5-Year Average.......................................................................................................403 Tax Retention Rate - 10-Year Average.....................................................................................................403 Total Asset Turnover ................................................................................................................................403 Total Asset Turnover - Quarterly..............................................................................................................403 Total Assets/Common Equity ...................................................................................................................404 Total Assets/Common Equity - Quarterly ................................................................................................404 Total Assets/Total Equity .........................................................................................................................404 Total Assets/Total Equity - Quarterly.......................................................................................................404 Total Debt/Tangible Assets ......................................................................................................................404 Total Debt/Total Assets ............................................................................................................................405 Total Debt/Total Assets - Quarterly..........................................................................................................405 Total Debt/Total Capital ...........................................................................................................................405 Total Debt/Total Capital - Quarterly.........................................................................................................405 Total Debt/Total Equity ............................................................................................................................405 Total Debt/Total Equity - Quarterly .........................................................................................................406 Total Equity Turnover ..............................................................................................................................406

Contents
Total Equity Turnover - Quarterly............................................................................................................406 Working Capital (Balance Sheet) .............................................................................................................406 Working Capital Per Share .......................................................................................................................406 Working Capital Per Share - Quarterly.....................................................................................................407 Working Capital Turnover........................................................................................................................407 Working Capital Turnover - Quarterly .....................................................................................................407 Z Score - Measure of Bankruptcy.............................................................................................................407
Financial Services 409 Financial Services Balance Sheet Items....................................................................................................409 Financial Services Income Statement Items .............................................................................................409 Financial Services Ratios..........................................................................................................................410 Data Definitions........................................................................................................................................413 Interest Expense - Total (FS) ....................................................................................................................413 Interest Expense (FS) % of Liabilities ......................................................................................................413 Interest Income - Total (FS)......................................................................................................................414 Internal Funding of Capital Expenditures 12 MM....................................................................................414 Net Asset Value ........................................................................................................................................414 Net Charge-Offs........................................................................................................................................414 Net Charge-Offs % of Net Income ...........................................................................................................415 Net Interest Income...................................................................................................................................415 Net Interest Income (Tax Equivalent).......................................................................................................415 Net Interest Margin...................................................................................................................................416 Net Loans Percentage of Assets................................................................................................................416 Net Loans Percentage of Deposits ............................................................................................................416 Nonoperating Income (Expenses) % of Net Interest Income....................................................................416 Nonperforming Assets - Total ..................................................................................................................417 Nonperforming Assets % of Assets - Total ..............................................................................................417 Nonperforming Assets % of Common Equity ..........................................................................................417 Provision for Loan/Asset Losses ..............................................................................................................418 Provision for Loan/Asset Losses % of Assets ..........................................................................................418 Reserve for Loan/Asset Losses.................................................................................................................418 Reserve for Loan/Asset Losses % of Assets.............................................................................................419 Reserve for Loan/Asset Losses % of Nonperf. Assets..............................................................................419 Risk-Adjusted Capital Ratio - Tier 1 ........................................................................................................419 Risk-Adjusted Capital Ratio - Tier 2 ........................................................................................................420 Risk-Adjusted Capital Ratio - Total .........................................................................................................420 Securities Percentage of Assets ................................................................................................................421 Tax Equivalent Adjustment ......................................................................................................................421
Functions 423 Currency Functions...................................................................................................................................423 Database Control Functions......................................................................................................................423 Historical Analysis Functions ...................................................................................................................424 Growth Functions .....................................................................................................................................425 Information Functions...............................................................................................................................426 Logical Functions .....................................................................................................................................427 Mathematical Functions............................................................................................................................428 Reference Functions .................................................................................................................................428 Period Reference Functions ......................................................................................................................429 Screening Functions..................................................................................................................................429 Set Analysis Functions..............................................................................................................................430

Contents
Statistical Functions..................................................................................................................................431 Text Functions ..........................................................................................................................................431 @ABS - Absolute value............................................................................................................................432 @ALPHA - Returns the intercept of the Y axis .......................................................................................432 @AND- Logical AND..............................................................................................................................433 @BETA - Returns the slope of the line ....................................................................................................433 @CAVG - Average across a set ...............................................................................................................433 @CCOR - Correlation coefficient across a set .........................................................................................434 @CCOUNT - Counts companies containing data in a set ........................................................................434 @CGMN - Geometric mean across a set..................................................................................................434 @CHGCO - Company transformation .....................................................................................................435 @CHGSET - Set transformation ..............................................................................................................435 @CMAX - Maximum value across a set ..................................................................................................436 @CMED - Median value across a set .......................................................................................................436 @CMIN - Minimum value across a set ....................................................................................................437 @CONCATENATE Combines text strings.............................................................................................437 @CORR - Returns the R2 of the correlation coefficient ..........................................................................438 @CPROD - Multiplication across a set ....................................................................................................438 @CSIZE - Counts companies in a set.......................................................................................................438 @CSTD - Standard deviation across a set ................................................................................................438 @CSUM - Sum across a set......................................................................................................................439 @CWAVG - Weighted average across a set ............................................................................................439 @DATE - Inserts calendar date ................................................................................................................440 @DAY - Identifies period day..................................................................................................................441 @DB Return formula from the specified layer........................................................................................441 @DESC - Displays descriptions ...............................................................................................................441 @ELEMENT - Specifies Group Item.......................................................................................................442 @EXCLUDEDB Exclude Specified Database Layer..............................................................................442 @EXP - Exponent ....................................................................................................................................442 @EXPSMOOTH - Exponentially Weighted Average..............................................................................443 @FIND - Finds a specific value in a text string........................................................................................443 @FRAC - Measures relative standing within a set ...................................................................................444 @FORECAST- Returns a predicted value ...............................................................................................444 @GEO - Returns geographic segment data ..............................................................................................445 @ISMEMBER - Identifies Members of a Set ..........................................................................................445 @IF - Returns a value when conditions are met .......................................................................................445 @INRANGE - Determines membership in a range..................................................................................446 @INT - Integer .........................................................................................................................................446 @ISAF - Determines annual figure data code ..........................................................................................446 @ISCF - Determine combined figure data code.......................................................................................446 @ISIF - Determines insignificant figure data code ..................................................................................447 @ISNA - Determines not available figure data code................................................................................447 @ISNC - Determines not calculable data code.........................................................................................447 @ISNM - Determines not meaningful data code......................................................................................447 @ISS - Returns issue data.........................................................................................................................447 @ISSF - Determines semiannual figure data code ...................................................................................448 @ISVALUE - Determines existence of data ............................................................................................448 @ISXE - Determines not available currency data code............................................................................448 @LEFT - Returns the leftmost characters in a text string.........................................................................449 @LN - Natural log....................................................................................................................................449 @LOG - Log.............................................................................................................................................449 @MID - Returns the middle characters in a text string ............................................................................449 @MNT - Identifies period month .............................................................................................................450 @MRALPHA Returns the intercept of the y axis in the multiple regression equation ...........................450 @MRBETA Returns the slope of the line for the specified variable.......................................................450

Contents
@MRCORR Calculates the coefficient of multiple determination (R2) between 3 or more items from a multiple regression equation.....................................................................................................................451 @MRFSTAT Determines the f-statistic in the multiple regression equation ..........................................451 @MRSTDERR Calculates the standard error of the y (independent variable) in the multiple regression equation ....................................................................................................................................................452 @NATIVE - Displays data in native currency .........................................................................................452 @NOT - Logical NOT..............................................................................................................................452 @NTILE - Creates fractiles within a set...................................................................................................453 @OR - Logical OR...................................................................................................................................453 @PARM - Displays currency description.................................................................................................453 @PAVG - Average across time ................................................................................................................453 @PCGR - Compound growth rate ............................................................................................................454 @PCOR - Correlation Coefficient Over Time..........................................................................................455 @PCOUNT - Count Periods.....................................................................................................................455 @PDEC - Decrease across time ...............................................................................................................455 @PERCENTILE Determines the Value at a Break Point........................................................................456 @PERIOD - Displays period number.......................................................................................................456 @PFIRST Locates First Occurrence of Data...........................................................................................456 @PFRAC Measures Relative Standing Over Time .................................................................................457 @PFSTPD Locates First Time Period Occurrence of Data .....................................................................457 @PLAST Locates Last Occurrence of Data ............................................................................................457 @PLASTPD Locates Last Time Period Occurrence of Data ..................................................................458 @PNTILE Creates Fractiles Over Time ..................................................................................................459 @PRANK Calculates Relative Rank Over Time.....................................................................................459 @PGMN - Geometric mean across time ..................................................................................................459 @PINC - Increase across time ..................................................................................................................460 @PLSG - Least squares growth rate.........................................................................................................460 @PLSGR - Fit of least squares growth rate..............................................................................................460 @PMAX - Maximum value across time...................................................................................................461 @PMAXPD - Period for maximum value ................................................................................................461 @PMED - Median value across time .......................................................................................................461 @PMEDPD - Period for median value.....................................................................................................462 @PMIN - Minimum value across time.....................................................................................................462 @PMINPD - Period for minimum value ..................................................................................................463 @PPROD - Multiplication across time.....................................................................................................463 @PSTD - Standard deviation....................................................................................................................463 @PSUM - Sum across time ......................................................................................................................464 @PWAVG - Weighted average across time.............................................................................................464 @QTR - Identifies fiscal period quarter ...................................................................................................464 @RANK - Ranks order within a set .........................................................................................................465 @RIGHT - Returns the rightmost characters in a text string....................................................................465 @RND - Round ........................................................................................................................................465 @SCALE - Returns data in millions.........................................................................................................465 @SEG - Returns business segment data ...................................................................................................466 @SET - Selects companies based on condition........................................................................................466 @SIC2 and @SIC3 - Generalize SIC codes .............................................................................................466 @SQRT - Square root...............................................................................................................................467 @STDS Standard Deviation for a Sample of a Population......................................................................467 @TEXT - Returns a string of characters...................................................................................................467 @TRIMPCT - Trim Outlying Values (Percent) .......................................................................................467 @TRIMSTD - Trim Outlying Values (Standard Deviation) ....................................................................468 @VALUE - Generates a data value..........................................................................................................468 @WK - Identifies period week .................................................................................................................468 @YR-Identifies Fiscal Period Year ..........................................................................................................469 ALPHA Calculation..................................................................................................................................469

Contents
BETA Calculation ....................................................................................................................................469 Calculation of Standard Deviation for a Sample of the Population ..........................................................470 Compound Growth Rate Calculation........................................................................................................470 Correlation Coefficient Calculation..........................................................................................................471 Fit of Least Squares Growth Rate Calculation..........................................................................................471 Forecast Calculation .................................................................................................................................471 Geometric Mean Calculation ....................................................................................................................472 Least Squares Growth Rate Calculation ...................................................................................................472 Multiple Regression Alpha Calculation....................................................................................................473 Multiple Regression Beta Calculation ......................................................................................................473 Multiple Regression Standard Error Calculation ......................................................................................474 R2 Coefficient of Multiple Determination Calculation ............................................................................474 R2 Correlation Coefficient........................................................................................................................474 Standard Deviation Calculation ................................................................................................................475 Weighted Average Calculation .................................................................................................................475
Geographic Areas 477 Geographic Segment Items.......................................................................................................................477 Data Definitions........................................................................................................................................479 Availability Codes - Geographic ..............................................................................................................479 Capital Expenditures - Geographic Segment ............................................................................................479 Capital Expenditures - Geographic Segment - Note .................................................................................479 Depreciation, Depletion, and Amortization - Geographic Segment .........................................................480 Foreign Sales - Total.................................................................................................................................480 Foreign Sales - Total as a Percentage of Sales..........................................................................................480 Identification Codes - Geographic ............................................................................................................480 Geographic Segments - Actual Number ...................................................................................................481 Geographic Segment Area Code(s) ..........................................................................................................481 Identifiable Assets - Geographic Segment................................................................................................483 Operating Profit - Geographic Segment....................................................................................................483 Operating Profit - Geographic Segment - Note ........................................................................................484 Sale - Aggregate Export - Geographic Segment .......................................................................................484 Sales (Net) - Geographic Segment............................................................................................................485 Sales (Net) - Geographic Segment - Note.................................................................................................486 Source Code - Geographic Segment .........................................................................................................487 Update Code - Geographic Segment.........................................................................................................487
Index Fundamentals 489 Index Fundamental Data Items .................................................................................................................489 Index Fundamental Calculation Criteria ...................................................................................................494
Non-Share Items ..............................................................................................................................494 Per Share Items ................................................................................................................................494 Weighted Average Ratios ................................................................................................................495
Index Fundamentals Periodicities .............................................................................................................495 Data Definitions........................................................................................................................................497 Capital Expenditures - Quarterly - Index Fundamental ............................................................................497 S&P Index - Percentage of Equity Updated Annually..............................................................................497 S&P Index - Percentage of Equity Updated Quarterly .............................................................................497 S&P Index - Number of Companies Annually .........................................................................................498 S&P Index - Number of Companies Quarterly .........................................................................................498

Contents
Insider Trading Data 499 Insider Trading Items................................................................................................................................501 Buys ..........................................................................................................................................................457 Sells ..........................................................................................................................................................502 Summary Data ..........................................................................................................................................503 Total Shares Held .....................................................................................................................................504 Float Shares ..............................................................................................................................................504 Summarized Transactions.........................................................................................................................508 Form 4.......................................................................................................................................................508 Common Shares 5% Ownership Float Adjustment - Current ...................................................................508 Common Shares Float Date Adjustment - Current ...................................................................................509 Common Shares Float Note......................................................................................................................509 Common Shares Insider Ownership Diluted Float Adjustment - Current ................................................509 Common Shares Insider Ownership Float Adjustment - Current .............................................................510 Float Common ..........................................................................................................................................510 Float Common - Current Company Level ................................................................................................511 Float Common - Current Issue..................................................................................................................511 Float Common % of Shares Outstanding..................................................................................................512 Float Common % of Shares Outstanding - Current Company Level........................................................512 Float Common % of Shares Outstanding - Current Issue .........................................................................512 Float Diluted .............................................................................................................................................513 Float Diluted - Current Company Level ...................................................................................................513 Float Diluted - Current Issue ....................................................................................................................514 Float Diluted % of Shares Outstanding.....................................................................................................514 Float Diluted % of Shares Outstanding - Current Company Level...........................................................514 Float Diluted % Shares Outstanding - Current Issue ................................................................................516 Float Management Common ....................................................................................................................516 Float Management Common - Current Company Level...........................................................................516 Float Management Common - Current Issue............................................................................................517 Float Management Common % of Shares Outstanding............................................................................517 Float Management Common % of Shares Outstanding - Current Company Level ..................................518 Float Management Common % of Shares Outstanding - Current Issue ...................................................518 Float Management Diluted .......................................................................................................................518 Float Management Diluted - Current Company Level .............................................................................519 Float Management Diluted - Current Issue...............................................................................................519 Float Management Diluted % of Shares Outstanding...............................................................................520 Float Management Diluted % of Shares Outstanding - Current Company Level .....................................520 Float Management Diluted % of Shares Outstanding - Current Issue ......................................................520 Insider Amend Sells Note Available.........................................................................................................520 Insider Comb Sells Note Available...........................................................................................................521 Insider Beginning Date - Top Ten Buys ...................................................................................................521 Insider Beginning Price - Top Ten Buys ..................................................................................................522 Insider Ending Date - Top Ten Buys ........................................................................................................523 Insider Ending Price - Top Ten Buys .......................................................................................................523 Insider Name - Top Ten Buys...................................................................................................................524 Insider Rank - Top Ten Buys....................................................................................................................525 Insider Relation - Top Ten Buys...............................................................................................................526 Insider Share Holdings - Top Ten Buys....................................................................................................527 Insider Shares Executed - Top Ten Buys..................................................................................................528 Insider Transaction Note - Top Ten Buys.................................................................................................529 Insider Transaction Value - Top Ten Buys...............................................................................................529 Insider Beginning Date - Top Ten Sells....................................................................................................531 Insider Beginning Price - Top Ten Sells...................................................................................................531

Contents
Insider Ending Date - Top Ten Sells.........................................................................................................532 Insider Ending Price - Top Ten Sells ........................................................................................................533 Insider Name - Top Ten Sells ...................................................................................................................534 Insider Rank - Top Ten Sells ....................................................................................................................534 Insider Relation - Top Ten Sells ...............................................................................................................535 Insider Share Holdings - Top Ten Sells ....................................................................................................537 Insider Shares Executed - Top Ten Sells ..................................................................................................537 Insider Transaction Note - Top Ten Sells .................................................................................................538 Insider Transaction Value - Top Ten Sells ...............................................................................................539 Insider Buys Shares - Summary Data .......................................................................................................540 Insider Sells Shares - Summary Data........................................................................................................540 Insider Net Shares - Summary Data..........................................................................................................540 Insider Buys Transactions - Summary Data .............................................................................................540 Insider Sells Transactions - Summary Data..............................................................................................541 Insider Net Transactions - Summary Data................................................................................................541 Insider Number of Buys Latest Month .....................................................................................................541 Insider Number of Sells Latest Month......................................................................................................542 Insider Top 10 Buys - Note Avail.............................................................................................................543 Insider Top 10 Shares Held - Buys ...........................................................................................................543 Insider Top 10 Shares Executed - Buys....................................................................................................543 Insider Top 10 Transaction Value - Buys .................................................................................................544 Insider Top 10 Shares Held - Sells ...........................................................................................................545 Insider Top 10 Shares Executed - Sells ....................................................................................................545 Insider Top 10 Transaction Value - Sells..................................................................................................546 Insider Top 10 Sells - Note Available.......................................................................................................546 Insider Total Shares Held - Common .......................................................................................................546 Insider Total Shares Held - Date...............................................................................................................547 Insider Total Shares Held - Diluted ..........................................................................................................547 Insider Total Shares Held - Options..........................................................................................................547 Insider Total Shares Held Note.................................................................................................................548 Insider Total Shares Held - Common % of Shares Outstanding...............................................................548 Insider Total Shares Held - Diluted % of Shares Outstanding..................................................................549 Insider Transaction Note - Top Ten Buys.................................................................................................549 Market Float Management Value Common..............................................................................................550 Market Float Management Value Common - Current Company Level....................................................550 Market Float Management Value Common - Current Issue .....................................................................550 Market Float Management Value Diluted ................................................................................................551 Market Float Management Value Diluted - Current Company Level.......................................................551 Market Float Management Value Diluted - Current Issue........................................................................551 Market Float Value Common ...................................................................................................................551 Market Float Value Common - Current Company Level .........................................................................552 Market Float Value Common - Current Issue...........................................................................................552 Market Float Value Diluted ......................................................................................................................552 Market Float Value Diluted - Current Company Level ............................................................................553 Market Float Value Diluted - Current Issue..............................................................................................553
Institutional Ownership Data 555 Concepts ...................................................................................................................................................555 Top Ten Sell Transactions ........................................................................................................................558 Top Ten Buy Transactions........................................................................................................................559 Top Ten Changes in Shares Held..............................................................................................................560 Top Ten Holdings .....................................................................................................................................561 Summary Items.........................................................................................................................................561 Data Definitions........................................................................................................................................563

Contents
13F Form ..................................................................................................................................................563 Institutional Owner Percent Total Shares Outstanding - Current Quarter ................................................563 Institutional Owner Percent Total Shares Outstanding - Qtr minus 1.......................................................563 Institutional Owner Percent Total Shares Outstanding - Qtr minus 2.......................................................563 Institutional Owner Percent Total Shares Outstanding - Qtr minus 3.......................................................564 Institutional Owner Percent Total Shares Outstanding - Qtr minus 4.......................................................564 Institutional Ownership Institution Rank - Top Ten Buys........................................................................564 Institutional Ownership Institution Name - Top Ten Buys.......................................................................565 Institutional Ownership New Position Indicator - Top Ten Buys.............................................................566 Institutional Ownership Period End Date - Top Ten Buys .......................................................................567 Institutional Ownership Previous Period End Date - Top Ten Buys ........................................................567 Institutional Ownership Share Holdings - Top Ten Buys .........................................................................568 Institutional Ownership Share Holdings - Previous - Top Ten Buys........................................................569 Institutional Ownership Shares Executed - Top Ten Buys .......................................................................570 Institutional Ownership Institution Name - Top Ten Changes in Shares Held.........................................570 Institutional Ownership Institution Rank - Top Ten Changes in Shares Held ..........................................571 Institutional Ownership Period End Date - Top Ten Changes in Shares Held .........................................572 Institutional Ownership Previous Period End Date - Top Ten Changes in Shares Held...........................572 Institutional Ownership Share Holdings - Top Ten Changes in Shares Held ...........................................573 Institutional Ownership Share Holdings - Previous - Top Ten Changes in Shares Held..........................574 Institutional Ownership Shares Executed - Top Ten Changes in Shares Held .........................................575 Institutional Ownership Institution Name - Top Ten Holdings ................................................................575 Institutional Ownership Institution Rank - Top Ten Holdings .................................................................576 Institutional Ownership Period End Date - Top Ten Holdings .................................................................577 Institutional Ownership Previous Period End Date - Top Ten Holdings ..................................................578 Institutional Ownership Share Holdings - Previous - Top Ten Holdings .................................................578 Institutional Ownership Share Holdings - Top Ten Holdings...................................................................579 Institutional Ownership Closed Position Indicator - Top Ten Sells..........................................................580 Institutional Ownership Institution Name - Top Ten Sells .......................................................................581 Institutional Ownership Institution Rank - Top Ten Sells ........................................................................581 Institutional Ownership Period End Date - Top Ten Sells........................................................................582 Institutional Ownership Previous Period End Date - Top Ten Sells.........................................................583 Institutional Ownership Share Holdings - Previous - Top Ten Sells ........................................................584 Institutional Ownership Share Holdings - Top Ten Sells .........................................................................584 Institutional Ownership Shares Executed - Top Ten Sells........................................................................585 Institutional Top 10 Share Holdings - Buys..............................................................................................586 Institutional Top 10 Share Holdings - Changes ........................................................................................586 Institutional Top 10 Share Holdings - Holdings .......................................................................................587 Institutional Top 10 Share Holdings - Sells ..............................................................................................587 Institutional Top 10 Share Holdings - Previous - Buys ............................................................................588 Institutional Top 10 Share Holdings - Previous - Changes.......................................................................589 Institutional Top 10 Share Holdings - Previous - Holdings ......................................................................590 Institutional Top 10 Share Holdings - Previous - Sells.............................................................................590 Institutional Top 10 Shares Executed - Buys............................................................................................591 Institutional Top 10 Shares Executed - Changes ......................................................................................592 Institutional Top 10 Shares Executed - Sells ............................................................................................592 Institutional Total Percent Change in Shares - Buys ................................................................................593 Institutional Total Percent Change in Shares - Changes ...........................................................................594 Institutional Total Percent Change in Shares - Holdings ..........................................................................594 Institutional Total Percent Change in Shares - Sells .................................................................................594 Institutional Buys Shares - Summary Data ...............................................................................................595 Institutional Closed Positions - Summary Data ........................................................................................595 Institutional Net Shares - Summary Data .................................................................................................596 Institutional New IO Buyers - Summary Data..........................................................................................596 Institutional Percent Change from Prior Quarter - Summary Data ...........................................................597

Contents
Institutional Total IO Buyers - Summary Data .........................................................................................597 Institutional Total IO Holders - Summary Data........................................................................................598 Institutional Total IO Sellers - Summary Data .........................................................................................598 Institutional Sells Shares - Summary Data ...............................................................................................599 Institutional Total Shares Held - Summary Data ......................................................................................599 Institutions Buying....................................................................................................................................600 Institutions Selling ....................................................................................................................................600 Last Calendar Quarter End Month............................................................................................................600
Issue Data - Daily Prices 601 Issue Data - Daily Price Items ..................................................................................................................601 Issue Specifics ..........................................................................................................................................601 Prices ........................................................................................................................................................602 Dividends..................................................................................................................................................604 Earnings per Share....................................................................................................................................605 Share Data Items.......................................................................................................................................605 Market value and market returns ..............................................................................................................605 Data Definitions........................................................................................................................................607 Adjustment Factor (Issue) - Cumulative by Ex-Date - Annual.................................................................607 Adjustment Factor (Issue) - Cumulative by Ex-Date - Current ................................................................607 Adjustment Factor (Issue) - Cumulative by Ex-Date - Daily....................................................................607 Adjustment Factor (Issue) - Cumulative by Ex-Date - Monthly...............................................................607 Adjustment Factor (Issue) - Cumulative by Ex-Date - Quarterly .............................................................608 Adjustment Factor (Issue) - Cumulative by Ex-Date - Weekly ................................................................608 Adjustment Factor (Issue) - Cumulative by Payable Date - Annual.........................................................608 Adjustment Factor (Issue) - Cumulative by Payable Date - Current ........................................................608 Adjustment Factor (Issue) - Cumulative by Payable Date - Daily............................................................609 Adjustment Factor (Issue) - Cumulative by Payable Date - Monthly.......................................................609 Adjustment Factor (Issue) - Cumulative by Payable Date - Quarterly .....................................................609 Adjustment Factor (Issue) - Cumulative by Payable Date - Weekly ........................................................610 Adjustment Factor (Issue) - Current Date Daily .......................................................................................610 Availability Codes - Issue.........................................................................................................................610 Average Price - 10-Day Moving...............................................................................................................611 Average Price - 50-Day Moving...............................................................................................................611 Average Price - 200-Day Moving.............................................................................................................611 Average Trading Volume - 1 Year ...........................................................................................................611 Common Shares Outstanding - Current Issue...........................................................................................612 Common Shares Outstanding - Current Issue - Note................................................................................612 Dividend Distribution Type - Daily (Issue) - Ex-Date..............................................................................612 Dividend Distribution Type - Daily (Issue) - Payable Date......................................................................613 Dividend Payment Method - Daily (Issue) - Ex-Date...............................................................................613 Dividend Payment Method - Daily (Issue) - Payable Date.......................................................................614 Dividend Yield - Daily (Issue)..................................................................................................................615 Dividends per Share by Ex-Date - Daily (Issue).......................................................................................615 Dividends per Share by Payable Date - Daily (Issue)...............................................................................615 EPS - Current (Issue) ................................................................................................................................616 Earnings Per Share - Current (Issue) - Note .............................................................................................616 Earnings Yield - Daily ..............................................................................................................................617 High Price - Daily - 1 Year.......................................................................................................................617 Identification Codes - Issue ......................................................................................................................617 Indicated Annual Dividend - Current .......................................................................................................617 Indicated Annual Dividend - Current - Note ............................................................................................618 Issue CUSIP Number................................................................................................................................618 Issue Description ......................................................................................................................................618

Contents
Issue Trading Exchange............................................................................................................................619 Issue Trading Status Code ........................................................................................................................620 Issue Trading Symbol ...............................................................................................................................620 Issue Type Code .......................................................................................................................................621 Low Price - Daily 1-Year..........................................................................................................................621 Margin Requirement Code........................................................................................................................621 Previous Issue CUSIP...............................................................................................................................622 Price - Daily - Close .................................................................................................................................622 Price - Daily - High...................................................................................................................................622 Price - Daily - Low ...................................................................................................................................623 Price - Current Company ..........................................................................................................................623 Price Status Code - Daily..........................................................................................................................623 Trading Volume - Current ........................................................................................................................624 Trading Volume - Daily............................................................................................................................624
Market Ratios 625 Basic Market Ratios..................................................................................................................................625 Returns......................................................................................................................................................627 Relatives ...................................................................................................................................................630 Percentage Change....................................................................................................................................631 Data Definitions........................................................................................................................................633 Beta...........................................................................................................................................................633 Book Value per Share - 3 Year Average...................................................................................................633 Book Value per Share - 5 Year Average...................................................................................................633 Book Value per Share - 10 Year Average.................................................................................................633 Book Value per Share - Year-End ............................................................................................................634 Dividend Payout .......................................................................................................................................634 Dividend Payout - 3 Year Average...........................................................................................................634 Dividend Payout - 5 Year Average...........................................................................................................634 Dividend Payout - 10 Year Average.........................................................................................................634 Dividend Yield - Current ..........................................................................................................................635 Dividend Yield - Current Price (Company)..............................................................................................635 Dividend Yield - Daily (Issue)..................................................................................................................635 Dividend Yield - Fiscal Year-End (Company) .........................................................................................635 Earnings Yield - Daily ..............................................................................................................................636 Earnings Yield - Monthly .........................................................................................................................636 Enterprise Value .......................................................................................................................................636 Market Return by Ex-Date - Daily............................................................................................................636 Market Return by Ex-Date - Fiscal ...........................................................................................................637 Market Return by Ex-Date - Monthly.......................................................................................................637 Market Return by Ex-Date - Quarterly .....................................................................................................637 Market Return by Payable Date - Daily....................................................................................................638 Market Return by Payable Date - Fiscal ...................................................................................................638 Market Return by Payable Date - Quarterly .............................................................................................638 Market Value ............................................................................................................................................638 Market Value - Current.............................................................................................................................639 Market Value - Daily ................................................................................................................................639 Market Value - Fiscal Year-End...............................................................................................................640 Market Value - Monthly ...........................................................................................................................640 Market Value - Quarterly..........................................................................................................................641 Momentum................................................................................................................................................642 Net Asset Value ........................................................................................................................................642 On-Balance-Volume .................................................................................................................................642 Price Percentage Change - 1-Year Close ..................................................................................................642

Contents
Price Percentage Change - 3-Year Close ..................................................................................................643 Price Percentage Change - 5-Year Close ..................................................................................................643 Price Percentage Change - 10-Year Close ................................................................................................643 Price Percentage Change - 1-Year Low....................................................................................................643 Price Percentage Change - 3-Year Low....................................................................................................643 Price Percentage Change - 5-Year Low....................................................................................................644 Price Percentage Change - 10-Year Low..................................................................................................644 Price Percentage Change - 1-Year High ...................................................................................................644 Price Percentage Change - 3-Year High ...................................................................................................644 Price Percentage Change - 5-Year High ...................................................................................................644 Price Percentage Change - 10-Year High .................................................................................................645 Price to Book Ratio - Current ...................................................................................................................645 Price/EPS Diluted from Operations ..........................................................................................................645 Price/Cash Flow Per Share - Daily ...........................................................................................................645 Price/Cash Flow Per Share - Monthly ......................................................................................................646 Price/Earnings - Quarterly ........................................................................................................................646 Price/Free Cash Flow Per Share - Daily ...................................................................................................646 Price/Free Cash Flow Per Share - Monthly ..............................................................................................646 Price/Sales Per Share - Daily ....................................................................................................................646 Price/Sales Per Share - Monthly ...............................................................................................................647 Price to Book Ratio...................................................................................................................................647 Price to Book Ratio - Daily.......................................................................................................................647 Price to Book Ratio - Fiscal Year-End .....................................................................................................648 Price to Earnings Ratio .............................................................................................................................649 Price to Earnings Ratio - Current..............................................................................................................649 Price to Earnings Ratio - Daily .................................................................................................................649 Price to Earnings Ratio Monthly...............................................................................................................649 Price to EPS From Operations ..................................................................................................................650 Price to Historical Earnings Per Share - Canada.......................................................................................650 Price to Historical Earnings Per Share - Monthly - Canada......................................................................650 Price to Net Asset Value...........................................................................................................................650 Relative Dividend Yield - S&P500...........................................................................................................651 Relative Dividend Yield - S&P Industrials...............................................................................................651 Relative Dividend Yield - S&P MidCap ..................................................................................................651 Relative Dividend Yield - S&P Sector .....................................................................................................652 Relative Price to Book - S&P500 .............................................................................................................652 Relative Price to Book - S&P Industrials..................................................................................................652 Relative Price to Book - S&P Sector ........................................................................................................652 Relative Price to Earnings - S&P 500.......................................................................................................653 Relative Price To Earnings - S&P MidCap ..............................................................................................653 Relative Price to Earnings - S&P Industrials ............................................................................................653 Relative Price to Earnings - S&P Sector...................................................................................................653 Relative Price - S&P 500 Daily ................................................................................................................654 Relative Price - S&P 500 Monthly ...........................................................................................................654 Relative Price - S&P Industrials - Daily ...................................................................................................654 Relative Price - S&P Industrials - Monthly ..............................................................................................654 Relative Price - S&P MidCap - Daily.......................................................................................................654 Relative Price - S&P MidCap - Monthly ..................................................................................................655 Relative Price - S&P Sector......................................................................................................................655 Relative 5 YR Total Return - S&P 500 ....................................................................................................655 Relative 10 YR Total Return - S&P 500...................................................................................................655 Relative 5 YR Total Return - S&P Industrials..........................................................................................655 Relative 10 YR Total Return - S&P Industrials........................................................................................656 Relative 5 YR Total Return - S&P MidCap .............................................................................................656 Relative 10 YR Total Return - S&P MidCap ...........................................................................................656

Contents
Relative 5 YR Total Return - S&P Sector ................................................................................................656 Relative 10 YR Total Return - S&P Sector ..............................................................................................657 1 Year Indexed Total Return ....................................................................................................................657 3 Year Indexed Total Return ....................................................................................................................657 5 Year Indexed Total Return ....................................................................................................................658 10 Year Indexed Total Return...................................................................................................................658 6 Month Total Return Daily......................................................................................................................658 6 Month Total Return - On-line ................................................................................................................659 1 Year Total Return ..................................................................................................................................659 3 Year Total Return ..................................................................................................................................659 5 Year Total Return ..................................................................................................................................659 10 Year Total Return ................................................................................................................................660 Total Return Factor - Current Date...........................................................................................................660 Total Return Factor - Daily.......................................................................................................................660 Total Return Factor - Monthly..................................................................................................................661 Total Return Factor - On-line ...................................................................................................................661 Total Return - Month to Date ...................................................................................................................661 Total Return - Quarter to Date ..................................................................................................................661 Total Return - Year to Date ......................................................................................................................662 Volatility ...................................................................................................................................................662
Prices, Dividends, Earnings and Shares 663 Prices, Dividends, Earnings and Shares Items..........................................................................................663 Adjustment Factors ...................................................................................................................................663 Prices ........................................................................................................................................................664 Dividends..................................................................................................................................................665 Earnings per Share....................................................................................................................................667 Share Data Items.......................................................................................................................................668 Data Definitions........................................................................................................................................671 Adjustment Factor (Company) - Cumulative by Ex-date .........................................................................671 Adjustment Factor (Company) - Cumulative by Ex-date - Current..........................................................671 Adjustment Factor (Company) - Cumulative by Ex-date - Daily .............................................................672 Adjustment Factor (Company) - Cumulative by Ex-date - Monthly ........................................................672 Adjustment Factor (Company) - Cumulative by Ex-date - Weekly..........................................................673 Adjustment Factor (Company) - Cumulative by Ex-date - Quarterly.......................................................673 Adjustment Factor (Company) - Cumulative by Payable Date - Annual..................................................674 Adjustment Factor (Company) - Cumulative by Payable Date - Current .................................................674 Adjustment Factor (Company) - Cumulative by Payable Date - Daily ....................................................674 Adjustment Factor (Company) - Cumulative by Payable Date - Monthly................................................675 Adjustment Factor (Company) - Cumulative by Payable Date - Quarterly ..............................................675 Adjustment Factor (Company) - Cumulative by Payable Date - Weekly .................................................675 Adjustment Factor (Company) - Current Date Daily................................................................................676 Average Trading Volume - 10 Year .........................................................................................................676 Average Trading Volume - 3 Year ...........................................................................................................676 Average Trading Volume - 5 Year ...........................................................................................................676 Cash Equivalent Distributions Per Share by Ex-Date...............................................................................677 Common Shares Outstanding - Company.................................................................................................677 Common Shares Outstanding - Company - Quarterly ..............................................................................677 Common Shares Outstanding - Company - Quarterly - Note ...................................................................678 Common Shares Reserved for Conversion - Convertible Debt ................................................................678 Common Shares Reserved for Conversion - Preferred Stock ...................................................................678 Common Shares Reserved for Conversion - Stock Options .....................................................................679 Common Shares Reserved for Conversion - Total ...................................................................................679 Common Shares Reserved for Conversion - Warrants and Other.............................................................679

Contents
Dividend Rate - Current............................................................................................................................680 Dividends per Share by Ex-Date...............................................................................................................681 Dividends per Share by Ex-Date - Monthly..............................................................................................681 Dividends per Share by Ex-Date - Quarterly ............................................................................................682 Dividends per Share by Payable Date.......................................................................................................683 Dividends per Share by Payable Date - Quarterly ....................................................................................683 Earnings Before Depreciation...................................................................................................................684 Earnings Before Interest and Taxes ..........................................................................................................684 EPS - 12-Month Moving Historical - Canada...........................................................................................684 EPS Basic - Excl. Extra. Items..................................................................................................................685 EPS Basic - Excl. Extra. Items - Note ......................................................................................................685 EPS Basic - Excl. Extra. Items - Quarterly ...............................................................................................686 EPS Basic - Excl. Extra. Items - Quarterly - Note ....................................................................................686 EPS Basic - Excl. Extra. Items (12-Months Moving)...............................................................................687 EPS Basic - Incl. Extra. Items...................................................................................................................687 EPS Basic - Incl. Extra. Items - Note........................................................................................................687 EPS Basic - Incl. Extra. Items - Quarterly ................................................................................................688 EPS Basic - Incl. Extra. Items - Quarterly - Note .....................................................................................688 EPS Basic - Incl. Extra. Items (Restated) .................................................................................................689 EPS Basic from Operations ......................................................................................................................689 EPS Basic from Operations - Note ...........................................................................................................689 EPS Basic From Operations - Quarterly - Note ........................................................................................690 EPS From Operations - 12 MM................................................................................................................690 EPS Diluted - Excl. Extra. Items ..............................................................................................................691 EPS Diluted - Excl. Extra. Items Quarterly ..............................................................................................691 EPS Diluted - Excl. Extra. Items - 12 MM ...............................................................................................692 EPS Diluted from Operations ...................................................................................................................693 EPS Diluted from Operations - Quarterly.................................................................................................693 EPS Diluted from Operations - 12 MM....................................................................................................693 EPS Diluted - Incl. Extra. Items................................................................................................................694 EPS Diluted - Incl. Extra. Items - Quarterly .............................................................................................695 EPS Percentage Change - 1 Year..............................................................................................................695 EPS Percentage Change - 3 Year..............................................................................................................695 EPS Percentage Change - 5 Year..............................................................................................................696 EPS Percentage Change - 10 Year............................................................................................................696 Indicated Annual Dividends - Quarterly...................................................................................................696 Low Price - 3-Year Average.....................................................................................................................697 Low Price - 5-Year Average.....................................................................................................................697 Low Price - 10-Year Average ...................................................................................................................697 Low Price - 12-Month Moving .................................................................................................................697 High Price - 3-Year Average ....................................................................................................................697 High Price - 5-Year Average ....................................................................................................................698 High Price - 10-Year Average ..................................................................................................................698 High Price - 12-Months Moving...............................................................................................................698 Price - Calendar Year - Low .....................................................................................................................698 Price - Calendar Year - High ....................................................................................................................699 Price - Calendar Year - Close ...................................................................................................................699 Price - Fiscal Year - High .........................................................................................................................700 Price - Fiscal Year - Low..........................................................................................................................700 Price - Fiscal Year - Close ........................................................................................................................701 Price - Monthly - High..............................................................................................................................701 Price - Monthly - Low ..............................................................................................................................702 Price - Monthly - Close.............................................................................................................................702 Price - Weekly ..........................................................................................................................................703 Reported Date of Quarterly Earnings Per Share .......................................................................................704

Contents
Shares Held Portfolio................................................................................................................................704 Short Interest.............................................................................................................................................704 Trading Volume - Annual (Calendar Year) ..............................................................................................704 Trading Volume - Annual (Fiscal Year) ...................................................................................................705 Trading Volume - Current ........................................................................................................................705 Trading Volume - Daily............................................................................................................................705 Trading Volume - Monthly.......................................................................................................................706 Trading Volume - Quarterly .....................................................................................................................706 Trading Volume - Weekly ........................................................................................................................707
Pension Data 709 Pension Items............................................................................................................................................709 Defined Benefit Plan - after SFAS #132...................................................................................................709 Postretirement health care and other benefits ...........................................................................................711 Defined Benefit Plan - before SFAS #132*..............................................................................................711 Defined Benefit Plan - before SFAS #87*................................................................................................712 Data Definitions........................................................................................................................................713 Pension - Accumulated Benefit Obligation ..............................................................................................713 Pension - Accumulated Benefit Obligation (Underfunded)......................................................................713 Pension - Additional Minimum Liability (Underfunded) .........................................................................714 Pension - Other Adjustments ....................................................................................................................714 Pension - Other Adjustments (Underfunded)............................................................................................715 Pension - Prepaid/Accrued Cost ...............................................................................................................716 Pension - Prepaid/Accrued Cost - Note ....................................................................................................716 Pension - Prepaid/Accrued Cost (Underfunded).......................................................................................717 Pension - Prepaid/Accrued Cost (Underfunded) - Note............................................................................717 Pension - Projected Benefit Obligation.....................................................................................................717 Pension - Projected Benefit Obligation (Underfunded) ............................................................................718 Pension - Unrecognized Prior Service Cost..............................................................................................718 Pension - Unrecognized Prior Service Cost (Underfunded) .....................................................................719 Pension - Vested Benefit Obligation.........................................................................................................719 Pension - Vested Benefit Obligation (Underfunded) ................................................................................720 Pension Benefits - Discount Rate (Assumed Rate of Return)...................................................................720 Pension Benefits - Information Date.........................................................................................................721 Pension Benefits - Net Assets Available...................................................................................................721 Pension Benefits - Present Value Nonvested............................................................................................722 Pension Benefits - Present Value Vested..................................................................................................722 Pension Costs - Unfunded Past Service ....................................................................................................722 Pension Costs - Unfunded Vested Benefits ..............................................................................................722 Pension Plan Assets ..................................................................................................................................723 Pension Plan Assets (Underfunded)..........................................................................................................723 Pension Plans - Anticipated Long-Term Rate of Return on Plan Assets ..................................................723 Pension Plans - Expected Return on Plan Assets......................................................................................724 Pension Plans - Interest Cost ....................................................................................................................724 Pension Plans - Other Periodic Costs........................................................................................................724 Pension Plans - Rate of Compensation Increase .......................................................................................725 Pension Plans - Service Cost ....................................................................................................................725 Periodic Pension Cost ...............................................................................................................................726 Periodic Postretirement Benefit Cost........................................................................................................726 Postretirement Benefit Asset ....................................................................................................................726
Property, Plant and Equipment 729

Contents
Property, Plant and Equipment Items .......................................................................................................729 Net Components of Property Plant and Equipment ..................................................................................729 Gross Property, Plant and Equipment (formerly Schedule V) .................................................................730 Depreciation and Depletion of Property, Plant and Equipment (formerly Schedule VI)..........................731 Data Definitions........................................................................................................................................733 Accumulated Depreciation - (Schedule VI) Beginning Balance...............................................................733 Accumulated Depreciation - (Schedule VI) Buildings .............................................................................733 Accumulated Depreciation - (Schedule VI) Construction in Progress......................................................733 Accumulated Depreciation - (Schedule VI) Ending Balance....................................................................734 Accumulated Depreciation - (Schedule VI) Land and Improvements ......................................................734 Accumulated Depreciation - (Schedule VI) Leases ..................................................................................735 Accumulated Depreciation - (Scheldue VI) Machinery and Equipment...................................................735 Accumulated Depreciation - (Schedule VI) Natural Resources................................................................736 Accumulated Depreciation - (Schedule VI) Other....................................................................................736 Accumulated Depreciation - (Schedule VI) Other Changes .....................................................................737 Accumulated Depreciation - (Schedule VI) Retirements..........................................................................737 Depletion Expense (Schedule VI).............................................................................................................737 Depreciation Expense (Schedule VI)........................................................................................................738 PP&E (At Cost) - Buildings......................................................................................................................738 PP&E (At Cost) - Construction in Progress..............................................................................................738 PP&E (At Cost) - Land and Improvements ..............................................................................................739 PP&E (At Cost) - Leases ..........................................................................................................................739 PP&E (At Cost) - Machinery and Equipment...........................................................................................739 PP&E (At Cost) - Natural Resources........................................................................................................740 PP&E (At Cost) - Other ............................................................................................................................740 PP&E - Beginning Balance (Schedule V).................................................................................................741 PP&E - Capital Expenditures (Schedule V) .............................................................................................741 PP&E - Ending Balance............................................................................................................................741 PP&E - Other Changes .............................................................................................................................742 PP&E - Retirements..................................................................................................................................742 PP&E (Net) - Buildings ............................................................................................................................742 PP&E (Net) - Construction in Progress ....................................................................................................743 PP&E (Net) - Land and Improvements.....................................................................................................743 PP&E (Net) - Leases.................................................................................................................................743 PP&E (Net) - Machinery and Equipment .................................................................................................744 PP&E (Net) - Natural Resources ..............................................................................................................745 PP&E (Net) - Other ..................................................................................................................................745
Restated 747 Restated Data Items ..................................................................................................................................747 Balance Sheet Restated.............................................................................................................................747 Income Statement Restated.......................................................................................................................747 Earnings per Share and Common Shares Used - Restated........................................................................748 Supplementary Items - Restated ...............................................................................................................749 Growth Rate - Restated.............................................................................................................................749 Data Definitions........................................................................................................................................751 Assets - Total (Restated)...........................................................................................................................751 Coefficient of Determination - Restated Sales - 10 Year..........................................................................751 Capital Expenditures (Restated) ...............................................................................................................751 Coefficient of Determination - Restated EPS Basic - Excluding - 3 Year................................................751 Coefficient of Determination - Restated EPS Basic - Excluding - 5 Year...............................................752 Coefficient of Determination - Restated EPS Basic - Excluding - 10 Year..............................................752 Coefficient of Determination - Restated Sales - 3 Year............................................................................752 Coefficient of Determination - Restated Sales - 5 Year............................................................................752

Contents
Common Shares for Basic Earnings Per Share (Restated)........................................................................752 Cost of Goods Sold (Restated)..................................................................................................................753 Depreciation and Amortization (Restated) ...............................................................................................753 EPS Basic - Excl. Extra. Items (Restated) ................................................................................................753 EPS Basic - Incl. Extra. Items (Restated) .................................................................................................754 EPS Diluted - Excl. Extra. Items (Restated) .............................................................................................754 EPS Diluted - Incl. Extra. Items (Restated) ..............................................................................................755 Employees (Restated) ...............................................................................................................................755 Extra. Items and Discontinued Operations (Restated) ..............................................................................755 Income Before Extraordinary Items (Restated) ........................................................................................756 Income Taxes - Total (Restated)...............................................................................................................756 Interest Expense (Restated) ......................................................................................................................756 Least Squares Growth Rate - Restated EPS Primary - Excl. - 3 Year ......................................................757 Least Squares Growth Rate - Restated EPS Primary - Excl. - 5 Year ......................................................757 Least Squares Growth Rate - Restated EPS Primary - Excl. - 10 Year ....................................................757 Least Squares Growth Rate - Restated Sales - 3 Year ..............................................................................758 Least Squares Growth Rate - Restated Sales - 5 Year ..............................................................................758 Long-Term Debt - Total (Restated) ..........................................................................................................758 Minority Interest (Income Account) (Restated)........................................................................................759 Net Income (Loss) - Restated ...................................................................................................................759 Nonoperating Income (Expense) - (Restated)...........................................................................................759 Pretax Income (Restated)..........................................................................................................................760 PP&E (Net) - Total (Restated)..................................................................................................................760 Retained Earnings (Restated)....................................................................................................................761 Sales (Net) (Restated) ...............................................................................................................................761 Selling, General and Administrative Expenses (Restated)........................................................................761 Stockholders' Equity (Restated)................................................................................................................762 Working Capital (Restated) ......................................................................................................................762
Standard & Poor's Core Earnings 763 Standard & Poor's Core Earnings Items....................................................................................................764 Annual S&P Core Earnings and EPS Adjustments...................................................................................764 Quarterly S&P Core Earnings and EPS Adjustments Preliminary ...........................................................765 Quarterly S&P Core Earnings and EPS Adjustments Actual ...................................................................766 12-Month Moving S&P Core Earnings and EPS Adjustments Preliminary .............................................768 12-Month Moving S&P Core Earnings and EPS Adjustments Final........................................................769 As-Reported S&P Core Earnings..............................................................................................................770 Data Definitions........................................................................................................................................771 As Reported Core After Tax.....................................................................................................................771 As Reported Core After Tax Footnote......................................................................................................771 As Reported Core After Tax Quarterly.....................................................................................................771 As Reported Core After Tax Quarterly Footnote......................................................................................771 As Reported Core Basic EPS Effect .........................................................................................................772 As Reported Core Basic EPS Effect Footnote ..........................................................................................772 As Reported Core Basic EPS Effect 12MM .............................................................................................772 As Reported Core Basic EPS Effect 12MM Footnote ..............................................................................772 As Reported Core Basic EPS Effect Quarterly .........................................................................................773 As Reported Core Basic EPS Effect Quarterly Footnote..........................................................................773 As Reported Core Diluted EPS Effect ......................................................................................................773 As Reported Core Diluted EPS Effect Footnote .......................................................................................773 As Reported Core Diluted EPS Effect 12MM..........................................................................................774 As Reported Core Diluted EPS Effect 12MM Footnote...........................................................................774 As Reported Core Diluted EPS Effect Quarterly......................................................................................774 As Reported Core Diluted EPS Effect Quarterly Footnote.......................................................................774

Contents
Core Implied Option EPS Basic ...............................................................................................................775 Core Implied Option EPS Basic 12MM ...................................................................................................775 Core Implied Option EPS Basic Quarterly ...............................................................................................775 Core Implied Option EPS Diluted ............................................................................................................775 Core Implied Option EPS Diluted 12MM ................................................................................................776 Core Implied Option EPS Diluted Quarterly ............................................................................................776 Core Implied Option Expense...................................................................................................................776 Implied Option Expense Footnote ............................................................................................................776 Core Implied Option Expense Quarterly ..................................................................................................777 Implied Option Expense Quarterly Footnote ............................................................................................777 Core Implied Option Expense 12MM.......................................................................................................777 Implied Option Expense 12MM Footnote ................................................................................................778 Core Pension Adjustment .........................................................................................................................778 Core Pension Adjustment Footnote ..........................................................................................................778 Core Pension Adjustment 12MM .............................................................................................................778 Core Pension Adjustment 12MM Footnote ..............................................................................................779 Core Pension Adjustment Quarterly .........................................................................................................779 Core Pension Adjustment Quarterly Footnote ..........................................................................................779 Core Pension Adjustment Preliminary......................................................................................................779 Core Pension Adjustment Preliminary Footnote ......................................................................................780 Core Pension Adjustment Basic EPS Effect .............................................................................................780 Core Pension Adjustment Basic EPS Effect Footnote..............................................................................780 Core Pension Adjustment Basic EPS 12MM............................................................................................780 Core Pension Adjustment Basic EPS 12MM Footnote.............................................................................781 Core Pension Adjustment Basic EPS 12MM Preliminary ........................................................................781 Core Pension Adjustment Basic EPS 12MM Preliminary Footnote.........................................................781 Core Pension Adjustment Basic EPS Quarterly .......................................................................................782 Core Pension Adjustment Basic EPS Footnote.........................................................................................782 Core Pension Adjustment Basic EPS Preliminary ....................................................................................782 Core Pension Adjustment Basic EPS Preliminary Footnote.....................................................................783 Core Pension Adjustment Diluted EPS Effect ..........................................................................................783 Core Pension Adjustment Diluted EPS Effect Footnote...........................................................................783 Core Pension Adjustment Diluted EPS 12MM.........................................................................................783 Core Pension Adjustment Diluted EPS 12MM Footnote .........................................................................784 Core Pension Adjustment Diluted EPS 12MM Preliminary.....................................................................784 Core Pension Adjustment Diluted EPS 12MM Preliminary Footnote......................................................784 Core Pension Adjustment Diluted EPS Effect Quarterly..........................................................................785 Core Pension Adjustment Diluted EPS Effect Quarterly Footnote...........................................................785 Core Pension Adjustment Diluted EPS Effect Quarterly Preliminary ......................................................785 Core Pension Adjustment Diluted EPS Effect Quarterly Preliminary Footnote.......................................785 Core Pension Interest Adjustment After Tax............................................................................................786 Core Pension Interest Adjustment After Tax Footnote.............................................................................786 Core Pension Interest Adjustment After Tax Quarterly............................................................................786 Core Pension Interest Adjustment After Tax Quarterly Footnote.............................................................787 Core Pension Interest Adjustment After Tax Preliminary ........................................................................787 Core Pension Interest Adjustment After Tax Preliminary Footnote .........................................................787 Core Pension Interest Adjustment Basic EPS Effect ................................................................................787 Core Pension Interest Adjustment Basic EPS Effect Footnote .................................................................788 Core Pension Interest Adjustment Basic EPS Effect Quarterly................................................................788 Core Pension Interest Adjustment Basic EPS Effect Quarterly Footnote.................................................788 Core Pension Interest Adjustment Basic EPS Effect Preliminary ............................................................789 Core Pension Interest Adjustment Basic EPS Effect Preliminary Footnote .............................................789 Core Pension Interest Adjustment Diluted EPS Effect .............................................................................789 Core Pension Interest Adjustment Diluted EPS Effect Footnote ..............................................................789 Core Pension Interest Adjustment Diluted EPS Effect Quarterly.............................................................790

Contents
Core Pension Interest Adjustment Diluted EPS Effect Quarterly Footnote..............................................790 Core Pension Interest Adjustment Diluted EPS Effect Preliminary .........................................................790 Core Pension Interest Adjustment Diluted EPS Effect Preliminary Footnote ..........................................791 Core Pension Interest Adjustment Pretax .................................................................................................791 Core Pension Interest Adjustment Pretax Footnote ..................................................................................791 Core Pension Interest Adjustment Pretax Quarterly .................................................................................791 Core Pension Interest Adjustment Pretax Quarterly Footnote ..................................................................792 Core Pension Interest Adjustment Pretax Preliminary..............................................................................792 Core Pension Interest Adjustment Pretax Preliminary Footnote ..............................................................792 Core Pension W/O Interest Adjustment After Tax ...................................................................................792 Core Pension W/O Interest Adjustment After Tax Footnote ....................................................................793 Core Pension W/O Interest Adjustment After Tax Quarterly ...................................................................793 Core Pension W/O Interest Adjustment After Tax Quarterly Footnote....................................................793 Core Pension W/O Interest Adjustment After Tax Quarterly Preliminary ...............................................794 Core Pension W/O Interest Adjustment After Tax Quarterly Preliminary Footnote ................................794 Core Pension W/O Interest Adjustment Basic EPS Effect .......................................................................794 Core Pension W/O Interest Adjustment Basic EPS Effect Footnote ........................................................794 Core Pension W/O Interest Adjustment Basic EPS Effect Quarterly ......................................................795 Core Pension W/O Interest Adjustment Basic EPS Effect Quarterly Footnote .......................................795 Core Pension W/O Interest Adjustment Basic EPS Quarterly Preliminary ..............................................795 Core Pension W/O Interest Adjustment Basic EPS Quarterly Preliminary Footnote ...............................796 Core Pension W/O Interest Adjustment Diluted EPS Effect ....................................................................796 Core Pension W/O Interest Adjustment Diluted EPS Effect Footnote .....................................................796 Core Pension W/O Interest Adjustment Diluted EPS Effect Quarterly ...................................................796 Core Pension W/O Interest Adjustment Diluted EPS Effect Quarterly Footnote ....................................797 Core Pension W/O Interest Adjustment Diluted EPS Effect Quarterly Preliminary ...............................797 Core Pension W/O Interest Adjustment Diluted EPS Effect Quarterly Preliminary Footnote ................797 Core Pension W/O Interest Adjustment Pretax.........................................................................................798 Core Pension W/O Interest Adjustment Pretax Footnote .........................................................................798 Core Pension W/O Interest Adjustment Pretax Quarterly ........................................................................798 Core Pension W/O Interest Adjustment Pretax Quarterly Footnote .........................................................798 Core Pension W/O Interest Adjustment Pretax Preliminary.....................................................................799 Core Pension W/O Interest Adjustment Pretax Preliminary Footnote......................................................799 Core Postretirement Adjustment...............................................................................................................799 Core Postretirement Adjustment Footnote................................................................................................799 Core Postretirement Adjustment 12MM...................................................................................................800 Core Postretirement Adjustment 12MM Footnote....................................................................................800 Core Postretirement Adjustment Quarterly...............................................................................................800 Core Postretirement Adjustment Quarterly Footnote ...............................................................................800 Core Postretirement Adjustment Preliminary ...........................................................................................801 Core Postretirement Adjustment Preliminary Footnote ............................................................................801 Core Postretirement Adjustment Basic EPS Effect ..................................................................................801 Core Postretirement Adjustment Basic EPS Effect Footnote ...................................................................801 Core Postretirement Adjustment 12MM Basic EPS Effect ......................................................................802 Core Postretirement Adjustment 12MM Basic EPS Effect Footnote .......................................................802 Core Postretirement Adjustment 12MM Basic EPS Effect Preliminary...................................................802 Core Postretirement Adjustment 12MM Basic EPS Effect Preliminary Footnote....................................803 Core Postretirement Adjustment Basic EPS Effect Quarterly ..................................................................803 Core Postretirement Adjustment Basic EPS Effect Quarterly Footnote ...................................................803 Core Postretirement Adjustment Basic EPS Effect Preliminary...............................................................804 Core Postretirement Adjustment Basic EPS Effect Preliminary Footnote................................................804 Core Postretirement Adjustment Diluted EPS Effect ...............................................................................804 Core Postretirement Adjustment Diluted EPS Effect Footnote ................................................................804 Core Postretirement Adjustment Diluted EPS Effect 12MM ...................................................................805 Core Postretirement Adjustment Diluted EPS Effect 12MM Footnote ....................................................805

Contents
Core Postretirement Adjustment Diluted EPS Effect Quarterly ...............................................................805 Core Postretirement Adjustment Diluted EPS Effect Quarterly Footnote ................................................806 Core Postretirement Adjustment Diluted EPS Effect Preliminary............................................................806 Core Postretirement Adjustment Diluted EPS Effect Preliminary Footnote.............................................806 Core Postretirement Adjustment 12MM Diluted EPS Effect Preliminary................................................807 Core Postretirement Adjustment 12MM Diluted EPS Effect Preliminary Footnote ................................807 Gain/Loss on Sale After Tax ....................................................................................................................807 Gain/Loss on Sale After Tax Footnote .....................................................................................................808 Gain/Loss on Sale After Tax 12MM ........................................................................................................808 Gain/Loss on Sale After Tax 12MM Footnote .........................................................................................808 Gain/Loss on Sale After Tax - Quarterly ..................................................................................................808 Gain/Loss on Sale After Tax Quarterly Footnote .....................................................................................809 Gain/Loss on Sale Basic EPS Effect.........................................................................................................809 Gain/Loss on Sale Basic EPS Effect Footnote..........................................................................................809 Gain/Loss on Sale Basic EPS Effect 12MM.............................................................................................810 Gain/Loss on Sale Basic EPS Effect 12MM Footnote..............................................................................810 Gain/Loss on Sale Basic EPS Effect - Quarterly ......................................................................................810 Gain/Loss on Sale Basic EPS Effect Quarterly Footnote .........................................................................810 Gain/Loss on Sale Diluted EPS Effect......................................................................................................811 Gain/Loss on Sale Diluted EPS Effect Footnote.......................................................................................811 Gain/Loss on Sale Diluted EPS Effect 12MM..........................................................................................811 Gain/Loss on Sale Diluted EPS Effect 12MM Footnote ..........................................................................812 Gain/Loss on Sale Diluted EPS Effect - Quarterly ...................................................................................812 Gain/Loss on Sale Diluted EPS Effect Quarterly Footnote ......................................................................812 Gain/Loss on Sale Pretax..........................................................................................................................812 Gain/Loss on Sale Pretax Footnote...........................................................................................................813 Gain/Loss on Sale Pretax - Quarterly .......................................................................................................813 Gain/Loss on Sale Pretax Quarterly Footnote...........................................................................................813 Implied Option Expense Preliminary........................................................................................................814 Implied Option Expense Preliminary Footnote ........................................................................................814 Implied Option EPS Basic ........................................................................................................................814 Implied Option EPS Basic Footnote .........................................................................................................814 Implied Option EPS Basic 12MM ............................................................................................................815 Implied Option EPS Basic 12MM Footnote .............................................................................................816 Implied Option EPS Basic Quarterly........................................................................................................816 Implied Option EPS Basic Quarterly Footnote.........................................................................................816 Implied Option EPS Basic Preliminary ....................................................................................................816 Implied Option EPS Basic Preliminary Footnote .....................................................................................817 Implied Option 12MM EPS Basic Preliminary ........................................................................................817 Implied Option 12MM EPS Basic Preliminary Footnote .........................................................................817 Implied Option EPS Diluted .....................................................................................................................817 Implied Option EPS Diluted Footnote......................................................................................................818 Implied Option EPS Diluted 12MM.........................................................................................................818 Implied Option EPS Diluted 12MM Footnote..........................................................................................818 Implied Option EPS Diluted Quarterly.....................................................................................................818 Implied Option EPS Diluted Quarterly Footnote......................................................................................819 Implied Option EPS Diluted 12MM Preliminary .....................................................................................819 Implied Option EPS Diluted 12MM Preliminary Footnote ......................................................................819 Implied Option EPS Diluted Quarterly Preliminary .................................................................................819 Implied Option EPS Diluted Preliminary Footnote ..................................................................................820 Pension Actual Return on Plan Assets......................................................................................................820 Pension Actual Return on Plan Assets Footnote.......................................................................................820 Periodic Pension Cost (Net) Footnote.......................................................................................................820 Pension Plans Interest Cost Footnote........................................................................................................821 Pension Plans Return on Plan Assets (Expected) Footnote ......................................................................821

Contents
Pension Plans Service Cost Footnote........................................................................................................821 Periodic Postretirement Benefit Costs Footnote .......................................................................................821 Postretirement Actual Return on Plan Assets ...........................................................................................821 Postretirement Actual Return on Plan Assets Footnote ............................................................................822 Postretirement Benefit Asset (Liability) (Net) Footnote...........................................................................822 Postretirement Expected Return on Plan Assets .......................................................................................822 Postretirement Expected Return on Plan Assets Footnote ........................................................................822 Postretirement Interest Cost......................................................................................................................822 Postretirement Interest Cost Footnote.......................................................................................................823 Postretirement Service Cost......................................................................................................................823 Postretirement Service Cost Footnote.......................................................................................................823 Reversal - Restructuring/Acquisition After Tax .......................................................................................823 Reversal - Restructuring/Acquisition After Tax Footnote ........................................................................823 Reversal - Restructuring/Acquisition After Tax 12MM ...........................................................................824 Reversal - Restructuring/Acquisition After Tax 12MM Footnote ............................................................824 Reversal - Restructuring/Acquisition After Tax Quarterly .......................................................................824 Reversal - Restructuring/Acquisition After Tax Qtly Footnote ................................................................825 Reversal - Restructuring/Acquisition Basic EPS Effect ...........................................................................825 Reversal - Restructuring/Acquisition Basic EPS Footnote .......................................................................825 Reversal - Restructuring/Acquisition Basic EPS 12MM ..........................................................................825 Reversal - Restructuring/Acquisition Basic EPS 12MM Footnote ...........................................................826 Reversal - Restructuring/Acquisition Basic EPS Effect Qtly ...................................................................826 Reversal - Restructuring/Acquisition Diluted EPS Effect ........................................................................826 Reversal - Restructuring/Acquisition Diluted EPS Footnote....................................................................827 Reversal - Restructuring/Acquisition Diluted EPS 12MM.......................................................................827 Reversal - Restructuring/Acquisition Diluted EPS 12MM Footnote........................................................827 Reversal - Restructuring/Acquisition Diluted EPS Effect Quarterly ........................................................827 Reversal - Restructuring/Acquisition Diluted EPS Effect Quarterly Footnote .........................................828 Reversal - Restructuring/Acquisition Pretax.............................................................................................828 Reversal - Restructuring/Acquisition Pretax Footnote .............................................................................828 Reversal - Restructuring/Acquisition Pretax Quarterly ............................................................................828 Reversal - Restructuring/Acquisition Pretax Quarterly Footnote .............................................................829 Settlement (Litigation/Insurance) After Tax 12MM.................................................................................829 Settlement (Litigation/Insurance) After Tax 12MM Footnote..................................................................829 Settlement (Litigation/Insurance) After Tax Footnote..............................................................................830 Settlement (Litigation/Insurance) After Tax Quarterly Footnote..............................................................830 Settlement (Litigation/Insurance) Basic EPS 12MM................................................................................830 Settlement (Litigation/Insurance) Basic EPS 12MM Footnote.................................................................831 Settlement (Litigation/Insurance) Basic EPS Footnote.............................................................................831 Settlement (Litigation/Insurance) Basic EPS Quarterly Footnote ............................................................831 Settlement (Litigation/Insurance) Diluted EPS 12MM.............................................................................832 Settlement (Litigation/Insurance) Diluted EPS 12MM Footnote .............................................................832 Settlement (Litigation/Insurance) Diluted EPS Footnote..........................................................................832 Settlement (Litigation/Insurance) Diluted EPS Quarterly Footnote .........................................................833 Standard & Poor's Core Earnings - Annual ..............................................................................................833 Standard & Poor's Core Earnings Footnote ..............................................................................................834 Standard & Poor's Core Earnings 12MM .................................................................................................834 Standard & Poor's Core Earnings 12MM Footnote ..................................................................................834 Standard & Poor's Core Earnings - Quarterly...........................................................................................835 Standard & Poor's Core Earnings Preliminary Footnote...........................................................................835 Standard & Poor's Core Earnings 12MM Preliminary..............................................................................836 Standard & Poor's Core Earnings 12MM Preliminary Footnote...............................................................836 Standard & Poor's Core Earnings - Quarterly - Preliminary.....................................................................837 Standard & Poor's Core EPS - Annual Basic............................................................................................837 Standard & Poor's Core Earnings EPS Basic Footnote.............................................................................837

Contents
Standard & Poor's Core Earnings EPS Basic 12MM................................................................................838 Standard & Poor's Core Earnings EPS Basic 12MM Footnote.................................................................838 Standard & Poor's Core EPS - Basic - Quarterly ......................................................................................839 Standard & Poor's Core Earnings EPS Basic Quarterly Footnote ............................................................839 Standard & Poor's Core Earnings EPS Basic 12MM Preliminary ............................................................839 Standard & Poor's Core Earnings EPS Basic 12MM Preliminary Footnote.............................................840 Standard & Poor's Core Earnings EPS Basic Preliminary Footnote.........................................................840 Standard & Poor's Core EPS - Basic - Quarterly - Preliminary ................................................................841 Standard & Poor's Core EPS - Annual Diluted.........................................................................................841 Standard & Poor's Core Earnings EPS Diluted Footnote..........................................................................842 Standard & Poor's Core Earnings EPS Diluted 12MM.............................................................................842 Standard & Poor's Core Earnings EPS Diluted 12MM Footnote..............................................................843 Standard & Poor's Core EPS - Diluted - Quarterly...................................................................................843 Standard & Poor's Core Earnings EPS Diluted Quarterly Footnote .........................................................844 Standard & Poor's Core Earnings EPS Diluted 12MM Preliminary.........................................................844 Standard & Poor's Core EPS - Diluted - Quarterly - Preliminary.............................................................845 Standard & Poor's Core Earnings EPS Diluted Preliminary Footnote......................................................845 Standard & Poor's Core Earnings EPS Diluted 12MM Preliminary Footnote..........................................845 Stock Compensation Expense...................................................................................................................846 Stock Compensation Expense Footnote....................................................................................................846 Stock Compensation Expense - Quarterly ................................................................................................846 Stock Compensation Expense Quarterly Footnote ...................................................................................847 Standard & Poor's Core Earnings - Profit Margin ....................................................................................847 Standard & Poor's Core Earnings Return on Equity .................................................................................847
Statement of Cash Flows/Statement of Changes 849 Format Code .............................................................................................................................................850 Statement of Cash Flows Items.................................................................................................................850 Working Capital Statement.......................................................................................................................853 Cash Statement by Source and Use of Funds ...........................................................................................855 Cash Statement by Activity ......................................................................................................................858 Net Liquid Funds/Net Funds Statement Classified by Source and Use of Funds .....................................860 Data Definitions........................................................................................................................................863 Accounts Payable and Accrued Liabilities - Increase (Decrease).............................................................863 Accounts Payable and Accrued Liabilities - Increase (Decrease) - Quarterly ..........................................864 Accounts Payable and Accrued Liabilites - Increase (Decrease) - 12MM ...............................................865 Acquisitions ..............................................................................................................................................866 Acquisitions - Quarterly............................................................................................................................866 Acquisitions 12MM..................................................................................................................................867 Assets and Liabilities - Other (Net Change) .............................................................................................868 Assets and Liabilities - Other (Net Change) - Quarterly...........................................................................869 Assets and Liabilities - Other Net Change - 12MM .................................................................................870 Capital Expenditures.................................................................................................................................871 Capital Expenditures - Note......................................................................................................................872 Capital Expenditures - Quarterly ..............................................................................................................872 Capital Expenditures - Quarterly - Note ...................................................................................................873 Capital Expenditures 12MM.....................................................................................................................873 Capital Expenditures 12MM Note ............................................................................................................874 Cash and Equivalents - Changes...............................................................................................................875 Cash and Equivalents - Changes - Quarterly ............................................................................................875 Cash and Equivalents - Changes - 12MM ................................................................................................876 Cash Dividends.........................................................................................................................................877 Cash Dividends - Quarterly ......................................................................................................................877 Cash Dividends 12MM.............................................................................................................................878

Contents
Cash Reinvestment Ratio 12MM..............................................................................................................879 Current Debt - Changes ............................................................................................................................879 Current Debt - Changes - Quarterly..........................................................................................................880 Current Debt - Changes -12MM...............................................................................................................881 Deferred Taxes..........................................................................................................................................882 Deferred Taxes - Quarterly .......................................................................................................................882 Deferred Taxes - 12MM ...........................................................................................................................883 Depreciation and Amortization.................................................................................................................883 Depreciation and Amortization - Quarterly ..............................................................................................885 Depreciation - 12MM ...............................................................................................................................885 Equity in Net Loss (Earnings)...................................................................................................................886 Equity in Net Loss (Earnings) - Quarterly ................................................................................................886 Equity in Net Loss (Earnings) 12MM ......................................................................................................887 Exchange Rate Effect................................................................................................................................888 Exchange Rate Effect - Quarterly .............................................................................................................888 Exchange Rate Effect 12MM....................................................................................................................889 Extra. Items and Discontinued Operations ...............................................................................................890 Extra. Items and Discontinued Operations - Quarterly.............................................................................890 Extraordinary Items and Discontinued Operations - 12MM.....................................................................891 Financing Activities - Net Cash Flow.......................................................................................................891 Financing Activities - Net Cash Flow - Quarterly ....................................................................................892 Financing Activities - Net Cash Flow 12MM...........................................................................................892 Financing Activities - Other .....................................................................................................................893 Financing Activities - Other - Quarterly ...................................................................................................894 Financing Activities - Other 12MM .........................................................................................................895 Format Code .............................................................................................................................................896 Format Code - Quarterly...........................................................................................................................896 Funds From Operations - Other ................................................................................................................897 Funds From Operations - Other - Quarterly..............................................................................................897 Funds from Operations - Other 12MM.....................................................................................................898 Funds From Operations - Total.................................................................................................................899 Funds From Operations - Total - Quarterly ..............................................................................................900 Funds from Operations - Total 12MM......................................................................................................900 Income Before Extraordinary Items..........................................................................................................901 Income Before Extraordinary Items - Quarterly .......................................................................................901 Income Before Extraordinary Items - 12MM ...........................................................................................902 Income Taxes - Accrued - Increase (Decrease) ........................................................................................902 Income Taxes - Accrued - Increase (Decrease) - Quarterly......................................................................903 Income Tax - Accrued - Increase (Decrease) 12MM................................................................................904 Income Taxes Paid....................................................................................................................................905 Income Taxes Paid - Quarterly .................................................................................................................906 Income Taxes Paid 12MM........................................................................................................................907 Interest Paid - Net of Capitalized Interest.................................................................................................908 Interest Paid - Net of Capitalized Interest - Quarterly ..............................................................................908 Interest Paid - Net Capitalized Interest 12MM .........................................................................................909 Inventory - Decrease (Increase) ................................................................................................................910 Inventory - Decrease (Increase) ................................................................................................................910 Inventory Decrease (Increase) 12MM ......................................................................................................911 Investing Activities - Net Cash Flow 12MM............................................................................................912 Investing Activities - Net Cash Flow 12MM............................................................................................913 Investing Activities - Net Cash Flow 12MM............................................................................................913 Investing Activities - Other.......................................................................................................................914 Investing Activities - Other - Quarterly ....................................................................................................914 Investing Activities - Other - 12MM ........................................................................................................915 Investments - Increase ..............................................................................................................................916

Contents
Investments - Increase - Quarterly............................................................................................................917 Investments - Increase - 12MM ................................................................................................................917 Issuance of Long-Term Debt ....................................................................................................................918 Issuance of Long-Term Debt - Quarterly..................................................................................................919 Issuance of Long Term Debt 12MM ........................................................................................................920 Long-Term Debt - Reduction....................................................................................................................920 Long-Term Debt - Reduction - Quarterly .................................................................................................921 Long Term Debt - Reduction - 12MM......................................................................................................922 Operating Activities - Net Cash Flow.......................................................................................................923 Operating Activities - Net Cash Flow - Quarterly ....................................................................................924 Operating Activities Net Cash Flow 12MM.............................................................................................924 Purchase of Common and Preferred Stock ...............................................................................................925 Purchase of Common and Preferred Stock - Quarterly.............................................................................926 Purchase of Common and Preferred Stock 12MM ...................................................................................926 Receivables - Decrease (Increase) ............................................................................................................927 Receivables - Decrease (Increase) - Quarterly..........................................................................................928 Receivables Decrease (Increase) 12MM...................................................................................................929 Sale of Common and Preferred Stock.......................................................................................................930 Sale of Common and Preferred Stock - Quarterly ....................................................................................931 Sale of Common and Preferred Stock 12MM...........................................................................................932 Sale of Investments...................................................................................................................................933 Sale of Investments - Quarterly ................................................................................................................933 Sale of Investments 12MM.......................................................................................................................934 Sale of Property, Plant, and Equipment ....................................................................................................935 Sale of Property, Plant, and Equipment - Quarterly..................................................................................936 Sale of Property, Plant and Equipment - 12MM.......................................................................................937 Sale of PPE and Investments - Loss (Gain) ..............................................................................................938 Sale of PPE and Investments - Loss (Gain) - Quarterly............................................................................939 Sale of PP&E and Investments - Loss (Gain) 12MM...............................................................................940 Short-Term Investments - Change ............................................................................................................941 Short-Term Investments - Change - Quarterly .........................................................................................942 Short Term Investments - Change - 12MM.............................................................................................943 Sources of Funds - Other ..........................................................................................................................944 Sources of Funds - Other - Quarterly........................................................................................................944 Sources of Funds - Other 12MM ..............................................................................................................945 Sources of Funds - Total...........................................................................................................................946 Sources of Funds - Total - Quarterly ........................................................................................................946 Sources of Funds - Total 12MM...............................................................................................................947 Uses of Funds - Other ...............................................................................................................................947 Uses of Funds - Other - Quarterly.............................................................................................................948 Uses of Funds - Other 12MM ...................................................................................................................949 Use of Funds - Total .................................................................................................................................949 Use of Funds - Total - Quarterly...............................................................................................................950 Uses of Funds - Total 12MM....................................................................................................................951 Working Capital Changes - Other - Increase (Decrease)..........................................................................951 Working Capital Changes - Other - Increase (Decrease) - Quarterly .......................................................952 Working Capital - Change - Other Increase (Decrease) 12MM ...............................................................952 Working Capital Changes - Total .............................................................................................................953 Working Capital Changes - Total - Quarterly...........................................................................................953
Thomson First Call Estimates 955 Reference Items ........................................................................................................................................955 Growth Rates ............................................................................................................................................956 Fiscal year current estimates and items.....................................................................................................957

Contents
Fiscal year 1 estimates and items..............................................................................................................957 Fiscal year 2 estimates and items..............................................................................................................960 Fiscal quarter current estimates and items ................................................................................................962 Fiscal quarter 1 estimates and items .........................................................................................................963 Fiscal quarter 2 estimates and items .........................................................................................................966 Fiscal quarter 3 estimates and items .........................................................................................................968 Fiscal quarter 4 estimates and items .........................................................................................................969 Data Definitions........................................................................................................................................971 Peg Ratio with Thomson First Call Estimate - Cash Flow .......................................................................971 Thomson First Call Last Revision Date - Cash Flow ..............................................................................971 Thomson First Call Consensus Recommendation - Cash Flow................................................................971 Thomson First Call Momentum Revisions Date - Cash Flow .................................................................971 Thomson First Call Latest Report Date - Cash Flow................................................................................972 Thomson First Call Fiscal Year Current - Surprise - Cash Flow ..............................................................972 Thomson First Call Fiscal Year Current - Previous Mean Estimate - Cash Flow ....................................972 Thomson First Call Fiscal Year Current - Latest Actual - Cash Flow......................................................972 Thomson First Call Fiscal Year 1 - Coefficient of Variation - Cash Flow ...............................................972 Thomson First Call Fiscal Year 1 - Fiscal Year - Cash Flow ...................................................................973 Thomson First Call Fiscal Year 1 - 7 Day Revisions Down - Cash Flow ................................................973 Thomson First Call Fiscal Year 1 - 7 Day Revisions Mean - Cash Flow .................................................973 Thomson First Call Fiscal Year 1 - 7 Day Revisions Up - Cash Flow .....................................................973 Thomson First Call Fiscal Year 1 - 30 Day Revisions Down - Cash Flow ..............................................973 Thomson First Call Fiscal Year 1 - 30 Day Revisions Mean - Cash Flow ...............................................974 Thomson First Call Fiscal Year 1 - 30 Day Revisions Up - Cash Flow ...................................................974 Thomson First Call Fiscal Year 1 - 60 Day Revisions Down - Cash Flow ..............................................974 Thomson First Call Fiscal Year 1 - 60 Day Revisions Mean - Cash Flow ...............................................974 Thomson First Call Fiscal Year 1 - 60 Day Revisions Up - Cash Flow ...................................................975 Thomson First Call Fiscal Year 1 - 90 Day Revisions Down - Cash Flow ..............................................975 Thomson First Call Fiscal Year 1 - 90 Day Revisions Mean - Cash Flow ...............................................975 Thomson First Call Fiscal Year 1 - 90 Day Revisions Up - Cash Flow ...................................................975 Thomson First Call Fiscal Year 1 - Implied Price/Cash Flow ..................................................................975 Thomson First Call Fiscal Year 1 - High Estimate - Cash Flow...............................................................976 Thomson First Call Fiscal Year 1 - Low Estimate - Cash Flow ...............................................................976 Thomson First Call Fiscal Year 1 - Mean Estimate - Cash Flow .............................................................976 Thomson First Call Fiscal Year 1 - Median Estimate - Cash Flow ..........................................................976 Thomson First Call Fiscal Year 1 - Number of Analyst Estimates - Cash Flow ......................................976 Thomson First Call Fiscal Year 1 - Standard Deviation - Cash Flow.......................................................977 Thomson First Call Fiscal Year 2 - 7 Day Revisions Down - Cash Flow ................................................977 Thomson First Call Fiscal Year 2 - 7 Day Revisions Mean - Cash Flow .................................................977 Thomson First Call Fiscal Year 2 - 7 Day Revisions Up - Cash Flow .....................................................977 Thomson First Call Fiscal Year 2 - 30 Day Revisions Down - Cash Flow ..............................................977 Thomson First Call Fiscal Year 2 - 30 Day Revisions Mean - Cash Flow ...............................................978 Thomson First Call Fiscal Year 2 - 30 Day Revisions Up - Cash Flow ...................................................978 Thomson First Call Fiscal Year 2 - 60 Day Revisions Down - Cash Flow ..............................................978 Thomson First Call Fiscal Year 2 - 60 Day Revisions Mean - Cash Flow ...............................................978 Thomson First Call Fiscal Year 2 - 60 Day Revisions Up - Cash Flow ...................................................979 Thomson First Call Fiscal Year 2 - 90 Day Revisions Down - Cash Flow ..............................................979 Thomson First Call Fiscal Year 2 - 90 Day Revisions Mean - Cash Flow ...............................................979 Thomson First Call Fiscal Year 2 - 90 Day Revisions Up - Cash Flow ...................................................979 Thomson First Call Fiscal Year 2 - High Estimate - Cash Flow...............................................................979 Thomson First Call Fiscal Year 2 - Median Estimate - Cash Flow ..........................................................980 Thomson First Call Fiscal Year 2 - Low Estimate - Cash Flow ...............................................................980 Thomson First Call Fiscal Year 2 - Mean Estimate - Cash Flow .............................................................980 Thomson First Call Fiscal Year 2 - Number of Analyst Estimates - Cash Flow ......................................980 Thomson First Call Fiscal Year 2 - Standard Deviation - Cash Flow.......................................................980

Contents
Thomson First Call Growth Rate - High - Cash Flow ..............................................................................980 Thomson First Call Growth Rate - Low - Cash Flow...............................................................................981 Thomson First Call Growth Rate - Number of Analysts - Cash Flow......................................................981 Thomson First Call Growth Rate - Standard Deviation - Cash Flow .......................................................981 Thomson First Call Growth Rate - Variance - Cash Flow........................................................................981 Thomson First Call Mean Growth Rate - Cash Flow ...............................................................................981 Thomson First Call Median Long-Term Growth Rate - Cash Flow .........................................................982 Thomson First Call Current Quarter - 7 Day Revisions Mean - Cash Flow .............................................982 Thomson First Call Current Quarter - 30 Day Revisions Mean - Cash Flow ...........................................982 Thomson First Call Current Quarter - 60 Day Revisions Mean - Cash Flow ...........................................982 Thomson First Call Current Quarter - 90 Day Revisions Mean - Cash Flow ...........................................982 Thomson First Call Current Quarter - Latest Actual Per Share - Cash Flow............................................983 Thomson First Call Current Quarter - Previous Mean Estimate - Cash Flow...........................................983 Thomson First Call Current Quarter - Surprise - Cash Flow ....................................................................983 Thomson First Call Quarter 1 - 7 Day Revisions Down - Cash Flow.......................................................983 Thomson First Call Quarter 1 - 7 Day Revisions Mean - Cash Flow .......................................................983 Thomson First Call Quarter 1 - 7 Day Revisions Up - Cash Flow ..........................................................984 Thomson First Call Quarter 1 - 30 Day Revisions Down - Cash Flow.....................................................984 Thomson First Call Quarter 1 - 30 Day Revisions Mean - Cash Flow .....................................................984 Thomson First Call Quarter 1 - 30 Day Revisions Up - Cash Flow .........................................................984 Thomson First Call Quarter 1 - 60 Day Revisions Down - Cash Flow.....................................................984 Thomson First Call Quarter 1 - 60 Day Revisions Mean - Cash Flow .....................................................985 Thomson First Call Quarter 1 - 60 Day Revisions Up - Cash Flow .........................................................985 Thomson First Call Quarter 1 - 90 Day Revisions Down - Cash Flow.....................................................985 Thomson First Call Quarter 1 - 90 Day Revisions Mean - Cash Flow .....................................................985 Thomson First Call Quarter 1 - 90 Day Revisions Up - Cash Flow .........................................................985 Thomson First Call Quarter 1 - 12 Months Moving - Cash Flow.............................................................986 Thomson First Call Quarter 1 - Coefficient of Variation - Cash Flow .....................................................986 Thomson First Call Quarter 1 - Quarter & Fiscal Year - Cash Flow ........................................................986 Thomson First Call Quarter 1 - Implied Price/Cash Flow ........................................................................986 Thomson First Call Quarter 2 - 7 Day Revisions Down - Cash Flow.......................................................986 Thomson First Call Quarter 2 - 7 Day Revisions Mean - Cash Flow .......................................................987 Thomson First Call Quarter 2 - 7 Day Revisions Up - Cash Flow ...........................................................987 Thomson First Call Quarter 2 - 30 Day Revisions Down - Cash Flow.....................................................987 Thomson First Call Quarter 2 - 30 Day Revisions Mean - Cash Flow .....................................................987 Thomson First Call Quarter 2 - 30 Day Revisions Up - Cash Flow .........................................................987 Thomson First Call Quarter 2 - 60 Day Revisions Down - Cash Flow.....................................................988 Thomson First Call Quarter 2 - 60 Day Revisions Mean - Cash Flow .....................................................988 Thomson First Call Quarter 2 - 60 Day Revisions Up - Cash Flow .........................................................988 Thomson First Call Quarter 2 - 90 Day Revisions Down - Cash Flow.....................................................988 Thomson First Call Quarter 2 - 90 Day Revisions Mean - Cash Flow .....................................................989 Thomson First Call Quarter 2 - 90 Day Revisions Up - Cash Flow .........................................................989 Thomson First Call Quarter 4 - 12 Months Moving - Cash Flow.............................................................989 Thomson First Call Previous - 1 Year Ago - Surprise 0B - Cash Flow....................................................989 Thomson First Call Previous - 1 Year Ago - Surprise 1B - Cash Flow....................................................990 Thomson First Call Previous - 1 Year Ago - Surprise 2B - Cash Flow....................................................990 Thomson First Call Previous - 1 Year Ago - Surprise 3B - Cash Flow....................................................990 Thomson First Call Previous - 1 Year Ago - Cash Flow ..........................................................................990 Thomson First Call 1 Year Ago - Cash Flow ...........................................................................................991 Thomson First Call Expected Report Date - Cash Flow...........................................................................991 Thomson First Call Expected Report Date - Footnotes - Cash Flow........................................................991 Thomson First Call High Estimate - Cash Flow.......................................................................................992 Thomson First Call Low Estimate - Cash Flow........................................................................................992 Thomson First Call Mean Estimate - Cash Flow......................................................................................992 Thomson First Call Median Estimate - Cash Flow...................................................................................993

Contents
Thomson First Call Number of Analyst Estimates - Cash Flow...............................................................993 Thomson First Call Standard Deviation - Cash Flow ...............................................................................993 Thomson First Call High - Growth Rate...................................................................................................993 Thomson First Call Low - Growth Rate ...................................................................................................994 Thomson First Call Variance - Growth Rate ............................................................................................994 Thomson First Call Number of Analysts - Growth Rate ..........................................................................994 Thomson First Call Standard Deviation - Growth Rate............................................................................994 Thomson First Call Mean - Growth Rate..................................................................................................994 Thomson First Call Median Long-Term - Growth Rate ...........................................................................995 Peg Ratio with Thomson First Call Estimate............................................................................................995 Thomson First Call Fiscal Year Current - Latest Actual - Earnings Per Share.........................................995 Thomson First Call Fiscal Year Current - Previous Mean Estimate - Earnings Per Share .......................995 Thomson First Call Fiscal Year Current - Surprise - Earnings Per Share.................................................995 Thomson First Call Fiscal Year 1 - 7 Day Revisions Down - Earnings Per Share ...................................996 Thomson First Call Fiscal Year 1 - 7 Day Revisions Mean - Earnings Per Share....................................996 Thomson First Call Fiscal Year 1 - 7 Day Revisions Up - Earnings Per Share ........................................996 Thomson First Call Fiscal Year 1 - 30 Day Revisions Down - Earnings Per Share .................................996 Thomson First Call Fiscal Year 1 - 30 Day Revisions Mean - Earnings Per Share..................................996 Thomson First Call Fiscal Year 1 - 30 Day Revisions Up - Earnings Per Share ......................................997 Thomson First Call Fiscal Year 1 - 60 Day Revisions Down - Earnings Per Share .................................997 Thomson First Call Fiscal Year 1 - 60 Day Revisions Mean - Earnings Per Share.................................997 Thomson First Call Fiscal Year 1 - 60 Day Revisions Up - Earnings Per Share .....................................997 Thomson First Call Fiscal Year 1 - 90 Day Revisions Down - Earnings Per Share .................................997 Thomson First Call Fiscal Year 1 - 90 Day Revisions Mean - Earnings Per Share..................................998 Thomson First Call Fiscal Year 1 - 90 Day Revisions Up - Earnings Per Share ......................................998 Thomson First Call Fiscal Year 1 - Coefficient of Variation - Earnings Per Share ..................................998 Thomson First Call Fiscal Year 1 - Fiscal Year - Earnings Per Share......................................................998 Thomson First Call Fiscal Year 1 - High Estimate - Earnings Per Share .................................................999 Thomson First Call Fiscal Year 1 - Implied Price/Earnings - Earnings Per Share ...................................999 Thomson First Call Fiscal Year 1 - Low Estimate - Earnings Per Share..................................................999 Thomson First Call Fiscal Year 1 - Mean Estimate - Earnings Per Share ................................................999 Thomson First Call Fiscal Year 1 - Median Estimate - Earnings Per Share .............................................999 Thomson First Call Fiscal Year 1 - Number of Analyst Estimates - Earnings Per Share .......................1000 Thomson First Call Fiscal Year 1 - Standard Deviation - Earnings Per Share .......................................1000 Thomson First Call Fiscal Year 2 - 7 Day Revisions Down - Earnings Per Share .................................1000 Thomson First Call Fiscal Year 2 - 7 Day Revisions Mean - Earnings Per Share..................................1000 Thomson First Call Fiscal Year 2 - 7 Day Revisions Up - Earnings Per Share ......................................1000 Thomson First Call Fiscal Year 2 - 30 Day Revisions Down - Earnings Per Share ...............................1001 Thomson First Call Fiscal Year 2 - 30 Day Revisions Mean - Earnings Per Share................................1001 Thomson First Call Fiscal Year 2 - 30 Day Revisions Up - Earnings Per Share ....................................1001 Thomson First Call Fiscal Year 2 - 60 Day Revisions Down - Earnings Per Share ...............................1001 Thomson First Call Fiscal Year 2 - 60 Day Revisions Mean - Earnings Per Share................................1001 Thomson First Call Fiscal Year 2 - 60 Day Revisions Up - Earnings Per Share ....................................1002 Thomson First Call Fiscal Year 2 - 90 Day Revisions Down - Earnings Per Share ...............................1002 Thomson First Call Fiscal Year 2 - 90 Day Revisions Mean - Earnings Per Share................................1002 Thomson First Call Fiscal Year 2 - 90 Day Revisions Up - Earnings Per Share ....................................1002 Thomson First Call Fiscal Year 2 - High Estimate - Earnings Per Share ...............................................1003 Thomson First Call Fiscal Year 2 - Low Estimate - Earnings Per Share................................................1003 Thomson First Call Fiscal Year 2 - Mean Estimate - Earnings Per Share ..............................................1003 Thomson First Call Fiscal Year 2 - Median Estimate - Earnings Per Share ...........................................1003 Thomson First Call Fiscal Year 2 - Number of Analyst Estimates - Earnings Per Share .......................1003 Thomson First Call Fiscal Year 2 - Standard Deviation - Earnings Per Share .......................................1003 Thomson First Call Current Quarter - 7 Day Revisions Mean - Earnings Per Share..............................1004 Thomson First Call Current Quarter - 30 Day Revisions Mean - Earnings Per Share............................1004 Thomson First Call Current Quarter - 60 Day Revisions Mean - Earnings Per Share............................1004

Contents
Thomson First Call Current Quarter - 90 Day Revisions Mean - Earnings Per Share............................1004 Thomson First Call Current Quarter - Latest Actual - Earnings Per Share.............................................1004 Thomson First Call Current Quarter - Previous Mean Estimate - Earnings Per Share ...........................1005 Thomson First Call Current Quarter - Surprise - Earnings Per Share.....................................................1005 Thomson First Call Quarter 1 - 12 Months Moving - Earnings Per Share .............................................1005 Thomson First Call Quarter 1 - 7 Day Revisions Down - Earnings Per Share .......................................1005 Thomson First Call Quarter 1 - 7 Day Revisions Mean - Earnings Per Share........................................1005 Thomson First Call Quarter 1 - 7 Day Revisions Up - Earnings Per Share ............................................1006 Thomson First Call Quarter 1 - 30 Day Revisions Down - Earnings Per Share .....................................1006 Thomson First Call Quarter 1 - 30 Day Revisions Mean - Earnings Per Share......................................1006 Thomson First Call Quarter 1 - 30 Day Revisions Up - Earnings Per Share ..........................................1006 Thomson First Call Quarter 1 - 60 Day Revisions Down - Earnings Per Share .....................................1006 Thomson First Call Quarter 1 - 60 Day Revisions Mean - Earnings Per Share......................................1007 Thomson First Call Quarter 1 - 60 Day Revisions Up - Earnings Per Share ..........................................1007 Thomson First Call Quarter 1 - 90 Day Revisions Down - Earnings Per Share .....................................1007 Thomson First Call Quarter 1 - 90 Day Revisions Mean - Earnings Per Share......................................1007 Thomson First Call Quarter 1 - 90 Day Revisions Up - Earnings Per Share ..........................................1007 Thomson First Call Quarter 1 - Coefficient of Variation - Earnings Per Share ......................................1008 Thomson First Call Quarter 1 - Implied Price/Earnings - Earnings Per Share .......................................1008 Thomson First Call Quarter 1 - Quarter & Fiscal Year - Earnings Per Share.........................................1008 Thomson First Call Quarter 2 - 7 Day Revisions Down - Earnings Per Share .......................................1008 Thomson First Call Quarter 2 - 7 Day Revisions Mean - Earnings Per Share........................................1008 Thomson First Call Quarter 2 - 7 Day Revisions Up - Earnings Per Share ............................................1009 Thomson First Call Quarter 2 - 30 Day Revisions Down - Earnings Per Share .....................................1009 Thomson First Call Quarter 2 - 30 Day Revisions Mean - Earnings Per Share......................................1009 Thomson First Call Quarter 2 - 30 Day Revisions Up - Earnings Per Share ..........................................1009 Thomson First Call Quarter 2 - 60 Day Revisions Down - Earnings Per Share .....................................1009 Thomson First Call Quarter 2 - 60 Day Revisions Mean - Earnings Per Share......................................1010 Thomson First Call Quarter 2 - 60 Day Revisions Up - Earnings Per Share ..........................................1010 Thomson First Call Quarter 2 - 90 Day Revisions Down - Earnings Per Share .....................................1010 Thomson First Call Quarter 2 - 90 Day Revisions Mean - Earnings Per Share......................................1010 Thomson First Call Quarter 2 - 90 Day Revisions Up - Earnings Per Share ..........................................1010 Thomson First Call Quarter 4 - 12 Months Moving - Earnings Per Share .............................................1011 Thomson First Call Previous - 1 Year Ago - Surprise 0B - Earnings Per Share.....................................1011 Thomson First Call Previous - 1 Year Ago - Surprise 1B - Earnings Per Share.....................................1011 Thomson First Call Previous - 1 Year Ago - Surprise 2B - Earnings Per Share.....................................1011 Thomson First Call Previous - 1 Year Ago - Surprise 3B - Earnings Per Share.....................................1012 Thomson First Call 1 Year Ago - Earnings Per Share ............................................................................1012 Thomson First Call Previous - 1 Year Ago - Earnings Per Share...........................................................1012 Thomson First Call Expected Report Date - Footnotes - Earnings Per Share.........................................1013 Thomson First Call Last Revision Date - Earnings Per Share ...............................................................1013 Thomson First Call Momentum Revisions Date - Earnings Per Share..................................................1013 Thomson First Call Latest Report Date - Earnings Per Share.................................................................1014 Thomson First Call Note - Earnings Per Share.......................................................................................1014 Thomson First Call Consensus Recommendation - Earnings Per Share.................................................1014 Thomson First Call High Estimate - Earnings Per Share........................................................................1014 Thomson First Call Expected Report Date - Earnings Per Share ...........................................................1015 Thomson First Call Median Estimate - Earnings Per Share....................................................................1015 Thomson First Call Number of Analyst Estimates - Earnings Per Share ...............................................1015 Thomson First Call Mean Estimate - Earnings Per Share.......................................................................1016 Thomson First Call Standard Deviation - Earnings Per Share................................................................1016 Thomson First Call Low Estimate - Earnings Per Share ........................................................................1016
Thomson I/B/E/S Estimates 1019

Contents
Date of I/B/E/S estimates........................................................................................................................1019 Fiscal year 1 estimates ............................................................................................................................1019 Fiscal year 2 estimates ............................................................................................................................1020 Fiscal quarter 1 estimates........................................................................................................................1021 Fiscal quarter 2 estimates........................................................................................................................1022 Growth rate estimates .............................................................................................................................1022 Earnings per share...................................................................................................................................1023 Other estimates statistics.........................................................................................................................1024 Data Definitions......................................................................................................................................1025 Currency for IBES Estimates..................................................................................................................1025 Currency for IBES Estimates - Current ..................................................................................................1025 Peg Ratio with IBES Estimate ................................................................................................................1025 Thomson I/B/E/S EPS Actual Quarterly Average Estimate ...................................................................1025 Thomson I/B/E/S EPS Actual Quarterly Est. Standard Dev...................................................................1026 Thomson I/B/E/S EPS Actual Quarterly Number of Estimates ..............................................................1026 Thomson I/B/E/S EPS - Last 4 Quarters Actual .....................................................................................1026 Thomson I/B/E/S EPS - Latest Actual....................................................................................................1026 Thomson I/B/E/S EPS - Latest Actual - Quarterly .................................................................................1026 Thomson I/B/E/S Estimated Date - Monthly..........................................................................................1027 Thomson I/B/E/S Estimated Date - Current ...........................................................................................1027 Thomson I/B/E/S 1 Year Average Estimated - Current..........................................................................1027 Thomson I/B/E/S 1 Year Average Estimated .........................................................................................1027 Thomson I/B/E/S 1 Year - Coefficient of Variation - Current................................................................1027 Thomson I/B/E/S 1 Year - Coefficient of Variation ...............................................................................1028 Thomson I/B/E/S 1 Year Est. Standard Dev. - Current ..........................................................................1028 Thomson I/B/E/S 1 Year Est. Standard Dev...........................................................................................1028 Thomson I/B/E/S 1 Year Forecast ..........................................................................................................1028 Thomson I/B/E/S 1 Year Forecast - Current...........................................................................................1028 Thomson I/B/E/S 1 Year High Estimated - Current ...............................................................................1029 Thomson I/B/E/S 1 Year High Estimated...............................................................................................1029 Thomson I/B/E/S 1 Year - Implied P/E - Current...................................................................................1029 Thomson I/B/E/S 1 Year - Implied P/E ..................................................................................................1029 Thomson I/B/E/S 1 Year Low Estimated - Current ................................................................................1029 Thomson I/B/E/S 1 Year Low Estimated ...............................................................................................1030 Thomson I/B/E/S 1 Year Median Estimated - Current ...........................................................................1030 Thomson I/B/E/S 1 Year Median Estimated...........................................................................................1030 Thomson I/B/E/S 1 Year Number of Estimates - Current ......................................................................1030 Thomson I/B/E/S 1 Year Number of Estimates......................................................................................1030 Thomson I/B/E/S 1 Year Number of Est. Down - Current .....................................................................1031 Thomson I/B/E/S 1 Year Number of Est. Down ....................................................................................1031 Thomson I/B/E/S 1 Year Number of Estimates Up - Current.................................................................1031 Thomson I/B/E/S 1 Year Number of Estimates Up ................................................................................1031 Thomson I/B/E/S 2 Year Average Estimated - Current..........................................................................1031 Thomson I/B/E/S 2 Year Average Estimated .........................................................................................1032 Thomson I/B/E/S 2 Year - Coefficient of Variation - Current................................................................1032 Thomson I/B/E/S 2 Year - Coefficient of Variation ...............................................................................1032 Thomson I/B/E/S 2 Year Est. Standard Dev. - Current ..........................................................................1032 Thomson I/B/E/S 2 Year Est. Standard Dev...........................................................................................1032 Thomson I/B/E/S 2 Year High Estimated - Current ...............................................................................1033 Thomson I/B/E/S 2 Year High Estimated...............................................................................................1033 Thomson I/B/E/S 2 Year - Implied P/E - Current...................................................................................1033 Thomson I/B/E/S 2 Year - Implied P/E ..................................................................................................1033 Thomson I/B/E/S 2 Year Low Estimated - Current ................................................................................1034 Thomson I/B/E/S 2 Year Low Estimated ...............................................................................................1034 Thomson I/B/E/S 2 Year Median Estimated - Current ...........................................................................1034

Contents
Thomson I/B/E/S 2 Year Median Estimated...........................................................................................1034 Thomson I/B/E/S 2 Year Number of Estimates - Current ......................................................................1034 Thomson I/B/E/S 2 Year Number of Estimates......................................................................................1035 Thomson I/B/E/S 2 Year Number of Est. Down - Current .....................................................................1035 Thomson I/B/E/S 2 Year Number of Est. Down ....................................................................................1035 Thomson I/B/E/S 2 Year Number of Estimates Up - Current.................................................................1035 Thomson I/B/E/S 2 Year Number of Estimates Up ................................................................................1035 Thomson I/B/E/S 5 Year Growth Avg. Est. - Current ............................................................................1036 Thomson I/B/E/S 5 Year Growth Avg. Est.............................................................................................1036 Thomson I/B/E/S 5 Year Growth - Est. Std. Dev. - Current...................................................................1036 Thomson I/B/E/S 5 Year Growth - Est. Std. Dev. ..................................................................................1036 Thomson I/B/E/S 5 Year Growth - High Est. - Current..........................................................................1036 Thomson I/B/E/S 5 Year Growth - High Est. .........................................................................................1037 Thomson I/B/E/S 5 Year Growth - Low Est. - Current ..........................................................................1037 Thomson I/B/E/S 5 Year Growth - Low Est...........................................................................................1037 Thomson I/B/E/S 5 Year Growth - Median Est. - Current .....................................................................1037 Thomson I/B/E/S 5 Year Growth - Median Est. .....................................................................................1037 Thomson I/B/E/S 5 Year Growth - Number of Estimates ......................................................................1038 Thomson I/B/E/S 5 Year Growth - Number of Estimates - Current .......................................................1038 Thomson I/B/E/S 1 Quarter - Average Est. - Current.............................................................................1038 Thomson I/B/E/S 1 Quarter - Average Est. ............................................................................................1038 Thomson I/B/E/S 1 Quarter - Est. Std. Dev. - Current ...........................................................................1038 Thomson I/B/E/S 1 Quarter - Est. Std. Dev............................................................................................1038 Thomson I/B/E/S 1 Quarter Forecast......................................................................................................1039 Thomson I/B/E/S 1 Quarter Forecast - Current ......................................................................................1039 Thomson I/B/E/S 1 Quarter - High Est. - Current ..................................................................................1039 Thomson I/B/E/S 1 Quarter - High Est...................................................................................................1039 Thomson I/B/E/S 1 Quarter - Low Est. - Current ...................................................................................1039 Thomson I/B/E/S 1 Quarter - Low Est. ..................................................................................................1040 Thomson I/B/E/S 1 Quarter - Median Est. - Current ..............................................................................1040 Thomson I/B/E/S 1 Quarter - Median Est...............................................................................................1040 Thomson I/B/E/S 1 Quarter - Number of Estimates - Current................................................................1040 Thomson I/B/E/S 1 Quarter - Number of Estimates ...............................................................................1040 Thomson I/B/E/S 1 Quarter - Number of Estimates Down - Current .....................................................1041 Thomson I/B/E/S 1 Quarter - Number of Estimates Down ....................................................................1041 Thomson I/B/E/S 1 Quarter - Number of Estimates Up - Current..........................................................1041 Thomson I/B/E/S 1 Quarter - Number of Estimates Up .........................................................................1041 Thomson I/B/E/S 2 Quarters - Average Est. - Current ...........................................................................1041 Thomson I/B/E/S 2 Quarters - Average Est............................................................................................1042 Thomson I/B/E/S 2 Quarters - Est. Std. Dev. - Current ..........................................................................1042 Thomson I/B/E/S 2 Quarters - Est. Std. Dev. .........................................................................................1042 Thomson I/B/E/S 2 Quarters - High Est. - Current.................................................................................1042 Thomson I/B/E/S 2 Quarters - High Est. ................................................................................................1042 Thomson I/B/E/S 2 Quarters - Low Est. - Current..................................................................................1043 Thomson I/B/E/S 2 Quarters - Low Est. .................................................................................................1043 Thomson I/B/E/S 2 Quarters - Median Est. - Current.............................................................................1043 Thomson I/B/E/S 2 Quarters - Median Est. ............................................................................................1043 Thomson I/B/E/S 2 Quarters - Number of Estimates - Current ..............................................................1043 Thomson I/B/E/S 2 Quarters - Number of Estimates..............................................................................1044 Thomson I/B/E/S 2 Quarters - Number of Estimates Down - Current ...................................................1044 Thomson I/B/E/S 2 Quarters - Number of Estimates Down...................................................................1044 Thomson I/B/E/S 2 Quarters - Number of Estimates Up - Current ........................................................1044 Thomson I/B/E/S 2 Quarters - Number of Estimates Up........................................................................1044 Thomson I/B/E/S Percentage of Unexpected Earnings ..........................................................................1045 Thomson I/B/E/S Standard Unexpected Earnings ..................................................................................1045

Contents
U.S. Economic Data 1047 U.S. Economic Data Items......................................................................................................................1047 Data Definitions......................................................................................................................................1049 Capital Asset Pricing Model ...................................................................................................................1049 Consumer Price Index - All Urban - All Items .......................................................................................1049 Employment - Nonfarm..........................................................................................................................1049 Federal Funds Rate .................................................................................................................................1050 Government Bonds .................................................................................................................................1050 Government Notes ..................................................................................................................................1051 Gross Domestic Product .........................................................................................................................1051 Housing Starts.........................................................................................................................................1052 Inflation Rate ..........................................................................................................................................1052 LIBOR - 1 Month ...................................................................................................................................1052 LIBOR - 2 Month ...................................................................................................................................1052 Market Indicator .....................................................................................................................................1053 Money Supply - M1................................................................................................................................1053 Money Supply - M2................................................................................................................................1053 Prime Interest Rate .................................................................................................................................1053 Producer Price Index - Finished Goods - All Items ................................................................................1054 Retail Sales - Total..................................................................................................................................1054 Sale of Passenger Cars............................................................................................................................1055 Treasury Bills..........................................................................................................................................1055 Unemployment Rate ...............................................................................................................................1056
Glossary of Terms 1057
Index 1061


1
Chapter 1 Overview
Overview
Standard & Poor's Compustat - Your Premier Source of Fundamental Financial Data Standard & Poor’s, a division of The McGraw-Hill Companies, is the premier supplier of financial information and produces a variety of databases and software products. Our specialized expertise in collecting, standardizing and presenting financial data, coupled with our commitment to quality, customer support and service, has earned Standard & Poor’s a level of trust and confidence unsurpassed in the financial information industry.
Money managers, investment bankers, corporations, financial institutions, consultants, universities and the government are among the customers who rely on the extensive financial, statistical and market information found in the Compustat databases.
Compustat North America Database Overview The Standard & Poor’s Compustat North America database covers over 21,000 active and inactive U.S. and Canadian industrial corporations, banks and savings and loans. Available data includes:
Company identification, name and address, officer data, auditor information, index membership, GICS economic and industry sector and many more company-specific items
Fundamental financial data: annual and quarterly Income Statement, Balance Sheet, Statement of Cash Flows, supplementary items, pension, property, plant and equipment, taxes, restated
Growth and fundamental ratios
Insider trading and institutional ownership data
Market ratios, share data, prices, dividends and earnings
Earnings and Cash Flow Estimates from Thomson I/B/E/S* and FIRST CALL*
Business segments and geographic area data
Indexes and S&P index fundamentals
Canadian data, financial services items, daily prices, U.S. and Canadian economic data, Columbine Capital Services items*, Stern Stewart’s EVAntageTM * model
*Requires a separate subscription
Financial information is available on an annual basis for the past 20 years and on a quarterly basis up to 48 quarters. Also provided are 240 months of monthly items, United States and Canadian economic data, and, with a separate subscription, daily issue data.
CHAPTER 1

Research Insight North America Data Guide
2
Standardization and Quality Control
Standard & Poor’s Compustat standardized data collection techniques ensure that comparability exists among similar types of data items, as well as financial results in current and prior time frames. Standard & Poor’s closely follows the rulings of the Financial Accounting Standards Board (FASB) and the Securities and Exchange Commission, in developing our standardized data definitions, and further refines data collection techniques based on specific industry practices.
To ensure data quality, more than 2500 validity checks are performed on each company entered into the COMPUSTAT database.
Rollover of Data Years and Quarters
The Compustat database for Research Insight contains a maximum of 20 years of annual data. At June month-end, a new data year is added and the earliest year is deleted from the Compustat database and is added to the Back Data* database.
During the first production in July, four new quarters of data are added to the quarterly files. The oldest four quarters are then removed from the quarterly files and added to the Back Data database.
Seven years of Business Information data is presented, when available. As each year is added to the database to accommodate newly reporting fiscal years, the earliest year is deleted.
The number of years of data available for each company depends upon the company’s history, and when it first published public financial statements.
* Requires a separate subscription.
Database Population
Compustat North America company data is derived from publicly-traded companies, specifically those trading on the New York Stock Exchange (NYSE), American Stock Exchange (ASE), National Association of Securities Dealers Automated Quotations (NASDAQ), Over-the-Counter (OTC), Toronto Stock Exchange, Quebec Stock Exchange, Montreal Stock Exchange, etc. and wholly-owned subsidiaries of companies that are required to file with the Securities and Exchange Commission (SEC).
Compustat data is categorized into sets in Research Insight: $ADR Companies that trade ADRs and
ADSs $C All actively traded companies in
the database $CG Geographic segments $CI Active issues $CS Business segments $I Indexes – active and inactive $II Index issues $NAS_100 NASDAQ 100 Index $NAS_FINL NASDAQ Financial Index $R All inactive companies in the
database $RI All inactive issues

3
Chapter 1 Overview
$T Canadian $TI Canadian Issue $R1000 Russell 1000 Index $R1000G Russell Growth 1000 Index $R1000V Russell Value 1000 Index $R2000 Russell 2000 Index $R2000G Russell Growth 2000 Index $R2000V Russell Value 2000 Index $R3000 Russell 3000 Index $R3000G Russell Growth 3000 Index $R3000V Russell Value 3000 Index $SP_100 S&P 100 Index $SP_500 S&P 500 Index $SP_IND S&P Industrials Index $SP_MID S&P MidCap 400 Index $SP_SMALL S&P SmallCap 600 Index $SP_SUPER S&P 1500 Super Composite
Index $SP_400BV S&P 400/Barra Value Index $SP_400BG S&P 400/Barra Growth Index $SP_500BV S&P 500/Barra Value Index $SP_500BG S&P 500/Barra Growth Index $SP_600BV S&P 600/Barra Value Index $SP_600BG S&P 600/Barra Growth Index $SP_GICS Global Industry Classification
System $TSE100I S&P/TSX 100 Index $TSE200I S&P/TSX 200 Index $TSE300I S&P/TSX Composite Index
Data Types in Compustat North America
Items
Data items are collected according to standardized definitions and stored in the database. Data is collected from shareholders’ reports, 10-K reports and other reliable sources (see Sources of Data in this chapter). Items include, for example, annual and quarterly Income Statement, Balance Sheet and Cash Flow data, Company Name, Country of Incorporation, IPO Date, Auditor, CUSIP number.
Items can be identified by name, such as “Cost of Goods Sold” or by mnemonic COGS.
Items may contain numbers, such as the 2001 annual Sales (Net) for IBM

Research Insight North America Data Guide
4
descriptions, e.g., the name of the company auditor, or the stock exchange where a company is listed
codes, e.g., an 02 code for the S&P Domestic Long-Term Issuer Credit Rating item equals a “AAA” rating assigned to an issuer by Standard & Poor’s
The Research Insight Lookup List/Items tab contains a list of all items by name and mnemonic.
Footnotes
Footnote codes provide additional information about a data item, or the company’s financial situation for the year. Footnote mnemonics always end in the letter F.
Some footnote examples are:
The TC footnote on Accumulated Depreciation (mnemonic DPACTF) means the company uses the accelerated method of depreciation.
The TL footnote on Assets – Total (ATF) means the company is in liquidation or bankruptcy.
Concepts
Concepts are calculated figures such as growth rates, ratios and market returns; they are mathematical or logical combinations of data items. Concepts are stored as mathematical expressions that are evaluated whenever they are referred to in an operation.
Concepts do not contain data values. They are used to manipulate data in routine, repetitious, or complex situations. You can also edit concepts to suit your needs, or create your own concepts.
The Research Insight Lookup List/Items tab contains a list of all concepts by name and mnemonic, under the Concept category.
Functions
Functions are pre-defined calculations that contain a combination of items, concepts, companies, time periods, or other functions. For example, you can use the @PAVG function to calculate an average across time for any data item, for a specified time period. All function names in Research Insight are preceded by the @ symbol.
The Research Insight Lookup List/Functions tab contains a list of all functions.
Data Presentation
Calendar Year vs. Fiscal Year
Data may be presented on either a calendar year basis or a fiscal year basis. Many annual market data items (including high, low and close prices and shares traded) are presented on a calendar-year rather than a fiscal year basis. These calendar year items are adjusted for stock splits and dividends that occur at the end of a company’s fiscal year and calendar quarter. The calendar year basis allows you to compare market data among companies for a particular point in time.
Compustat includes up to 48 quarters of quarterly data on a fiscal quarter basis.

5
Chapter 1 Overview
Historical and Restated data
The Compustat North America database includes both historical and restated data. The historical presentation for annual data allows analysts to evaluate a company’s actual performance in relation to market data (market data is never restated). Historical data includes Income Statement items, Balance Sheet items, Statement of Cash Flows items, pension items and supplementary data.
Standard & Poor’s presents restated annual data items on a current-year basis. Since companies may restate data for acquisitions, accounting changes and/or discontinued operations, all years of restated data are presented on a basis comparable to the current year. For annual data items, restated data is collected from summary presentations reported by the company. Compustat data provides up to 10 years of restated data and presents prior years as Not Available. The restated data contains the most commonly reported Income Statement and Balance Sheet items.
Data Codes
Not all companies will disclose information for every data item contained in Research Insight; sometimes a company will combine two or more items, or perhaps the results of a calculated item are not meaningful. In these situations, a data item will contain a data code, rather than a data value. For example, if a company has interest income, but includes it in interest expense, the Interest Income item will contain a combined figure code (@CF).
Research Insight uses the following data codes:
Code Description @AF Annual Figure (only annual data is available
for quarterly items). Applies only to the Compustat North America database.
@CF Combined Figure (the figure is combined in another item)
@IF Insignificant Figure (the number is immaterial) @NA Not Available (company does not disclose
information about the item) @NC Not Calculable (rules for calculation were not
met) @NM Not Meaningful (item is not meaningful for a
company) @SF Semi-annual Figure (only semi-annual data is
available for quarterly items). Applies only to the Compustat North America database.
@XE Not Available Currency (currency exchange rate is not available to translate data); applies only to the Compustat Global database

Research Insight North America Data Guide
6
Indexes Indexes may represent the entire market or a specific portion of the market, such as the Standard & Poor’s 500 (S&P 500). More than 600 S&P Industry Indexes based on GICS are available in Research Insight. A list of active and inactive indexes can be found in the Lookup List/Companies tab, in the $I set. Research Insight provides current index market data and index fundamentals for the active indexes in this list.
To find index constituents, use the index sets in the Lookup List/Company tab, such as $SP_600, to run a report or screen on the current members of the S&P 600 Small Cap index. You can also use the S&P Index Code data items (SPMI,SPMIM,SPMIX) to find index holdings for certain indexes whose constituents are marked in Research Insight (see the index data availability table below).
This table contains a list of index market data items. The second table below indicates which of these items is available for particular indexes in Research Insight.
Mnemonic Description AJEXM Adjustment Factor (Company) – Cumulative by Ex-Date – Monthly BKVLPS Book Value per Share DVPSXM Dividends per Share by Ex-Date – Monthly EPSX12 Earnings per Share (Primary) – Excluding Extraordinary Items – 12 Months Moving PRCHM Price – High – Monthly PRCLM Price – Low – Monthly PRCCM Price – Close – Monthly CSHTRM Common Shares Traded – Monthly
The chart below indicates the availability ( ) of data items for a particular index.
Ticker
A J E X M
B K V L P S
D V P S X M
E P S X 1 2
P R C H M
P R C L M
P R C C M
C S H T R M
Consti-tuent Mark-ings
American Stock Exchange I0004 Amex – Biotechnology Indexes I0041 Amex – Computer Technology I0042 Amex Intl Market Index – ADR I0034 Amex Reduced Value Pharm I0116 Dow Jones Industrials – 30 I0005 Dow Jones Transportation – 20 I0006 Dow Jones Utilities – 15 I0007 JP Morgan Hambrecht & Quist Computr Soft I0044 Ishares Index DJ US Financial I0072 Ishares Index DJ US Internet I0077 Ishares Index DJ US Tech Sec I0076 Ishares Index DJ US Telecomm I0071 Ishares Index Russell 1000 I0075 Ishares Index Russell 1000 Growth I0067 Ishares Index Russell 1000 Value I0080

7
Chapter 1 Overview
Ticker
A J E X M
B K V L P S
D V P S X M
E P S X 1 2
P R C H M
P R C L M
P R C C M
C S H T R M
Consti-tuent Mark-ings
Ishares Index Russell 2000 Growth I0079 Ishares Index Russell 3000 Growth I0074 Ishares Index S&P 500 I0078 Ishares Index S&P/Barra Growth I0069 Ishares Index S&P/Barra Value I0073 Ishares Index S&P MidCap 400 I0070 Ishares Index S&P SmallCap 600 I0068 Morgan Stanley High Tech 35 I0040 NASDAQ 100 I0028 NASDAQ – Index Composite I0008 NASDAQ Finl I0115 NASDAQ National Market Composite I0011 NY Stock Exchange Composite I0009 Russell 1000 Growth I0021 Russell 1000 Index I0025 Russell 1000 Value I0023 Russell 2000 Index I0026 Russell 3000 Index I0024 Russell MidCap I0022 S&P 100 – Last Trading Day I0014 S&P 100 – Last Trading Wednesday I0015 S&P 400/BARRA Growth Index I0036 S&P 400/BARRA Value Index I0037 S&P 500 Composite – Last Trading Day I0003 S&P 500 Composite – Last Trading Wed I0010 S&P 500/BARRA Growth Index I0017 S&P 500/BARRA Value Index I0018 S&P 600/BARRA Growth Index I0038 S&P 600/BARRA Value Index I0039 S&P 1000 I0119 S&P 1500 Super Composite I0020 S&P Commodity I0117 S&P Industrials – Last Trading Day I0002 S&P Industrials – Last Trading Wednesday I0001 S&P Industries S&P Indl Invt Gr Credit I0113 S&P Indl Spec Gr Credit I0114 S&P MidCap 400 I0016 S&P REIT Composite I0027 S&P SmallCap 600 I0019 S&P/TSX 60 S&P/TSX 100 Composite CI0066 S&P/TSX 200 Composite CI0067

Research Insight North America Data Guide
8
Ticker
A J E X M
B K V L P S
D V P S X M
E P S X 1 2
P R C H M
P R C L M
P R C C M
C S H T R M
Consti-tuent Mark-ings
Thestreet Com E-Commerce I0043 S&P/TSX Composite CI0051 Toronto Stock Exchange Industries Value Line Composite I0045 Value Line Industrial I0046 Value Line Utilities I0047 Webs Index Fd-IOPV Australia I0048 Webs Index Fd-IPOV Austria I0049 Webs Index Fd-IPOV Belgium I0066 Webs Index Fd-IPOV Canada I0051 Webs Index Fd-IOPV France I0052 Webs Index Fd-IOPV Germany I0053 Webs Index Fd-IOPV Hong Kong I0054 Webs Index Fd-IOPV Italy I0055 Webs Index Fd-IOPV Japan I0056 Webs Index Fd-IOPV Malaysia I0057 Webs Index Fd-IOPV Mexico I0058 Webs Index Fd-IOPV Netherland I0059 Webs Index Fd-IOPV Singapore I0061 Webs Index Fd-IOPV Spain I0062 Webs Index Fd-IOPV Sweden I0063 Webs Index Fd-IOPV Switzerland I0064 Webs IndexFd-IOPV United Kingdom I0065 Wilshire 5000 Equity I0112
High, Low and Close Prices and Adjustment Factors are also available for the S&P Industry Indexes based on GICS. For a list of these indexes, please see the $SP_GICS set in the Lookup List/Companies tab.
Sources of Data Standard & Poor’s uses a variety of sources to update the COMPUSTAT database and to provide you the most current information possible. These sources are described below:
Shareholders’ Reports Standard & Poor’s receives annual and quarterly reports to shareholders. On an annual basis, the company’s report is designated as the preliminary source document. On a quarterly basis, both the company’s quarterly report and the 10Q are considered as the final source documents.
10K and 10Q Reports Corporate information filed with the Securities and Exchange Commission (SEC). Standard & Poor’s considers these reports a final source of information.
EDGAR 10Ks and 10Qs, filed electronically with the SEC.

9
Chapter 1 Overview
Company contacts Standard & Poor’s maintains an active file of contacts with various corporations. These contacts allow us to clarify information or obtain information not available in shareholders’ reports.
Computershare Analytics N.A, Inc. Institutional Ownership data. Data Resources, Inc. Canadian prices, dividends, shares-traded and adjustment
factor data for U.S. industrial and non-industrial companies.
FT Interactive Prices, dividends, shares-traded and adjustment factor data for U.S. industrial and non-industrial companies. Also provides ticker symbols and CUSIP information, along with company name changes.
NASDAQ Market data on major National Association of Securities Dealers Automated Quotients system companies.
Uniform Statistical Reports Detailed financial information on electric, utility and gas companies and is often used in conjunction with the shareholders’ reports.
Standard & Poor’s Publications Standard & Poor’s uses several Standard & Poor’s publications in conjunction with shareholders’ report, including Corporation Stock Guide, Dividend Records and Corporation Records. The S&P Corporation Stock Guide provides market information for certain NASDAQ and listed companies. The S&P Dividend Records are used to collect information about stock splits and dividends. The S&P Corporation Records provide additional information about companies.
Fortune Used to find constituents of the Fortune 500 and Fortune Service 500, as well as a breakdown of the Fortune Service 500 into eight groups based on industry.
S&P Ratings Research Department Source for ratings changes and new issue ratings on senior bonds, subordinated bonds and commercial paper.
S&P Index Products Division Source for finding which companies are the constituents of the S&P 100, S&P MidCap 400, S&P SmallCap 600 and S&P 500 indexes, as well as an industry breakdown.
S&P Comstock An on-line information service used to obtain updates on mergers and acquisitions.
S&P CUSIP Provides CUSIP numbers for companies on the database.
Washington Services Association Insider Trading data.


11
Chapter 2 Company Specifics
Company Specifics
The data items in this chapter cover company-specific information such as identifiers, address, auditor opinions, index membership, industry, update status, etc.
This chapter also includes concepts to help you determine the current period for the company (the year, quarter, month and day of latest available data).
Name, Address and Contact Information
Data Item Name
Current Mnemonic . . . page
Company Name CONM . . . 22 Company Short Name CONMSH . . . 22 Address - Street or P.O. Box ADD1 . . . 19 Address - City ADD2 . . . 19 Address - State ADD3 . . . 19 Address - Zip Code ADDZIP . . . 151 County CNTY . . . 23 Primary Location STATE . . . 72 State Incorporation Code INCORP . . . 70 Country of Incorporation FIC . . . 31 Phone Number PHONE . . . 45 Web Site Address WEBURL . . . 23
Company Identifiers
Data Item Name
Current Mnemonic . . . page
CUSIP Number CUSIP . . . 24 Global Vantage Key GVKEY . . . 37 Employer Identification Number EIN . . . 29 Stock Ticker Symbol TIC . . . 75
Employees and Officers
Data Item Name
Current Mnemonic . . . page
Employees EMP . . . 29 Officer Code OFCD . . . 43
CHAPTER 2

Research Insight North America Data Guide
12
Officer Names OFNM . . . 44 Officer Titles OFTL . . . 44
About the Company's Data
Data Item Name
Mnemonic . . . page
Auditor's Opinion AUOP . . . 21 Auditors AU . . . 19 Currency Translation Rate CURRTR . . . 23 Currency Translation Rate Quarterly CURRTRQ . . . 23 Data Comparability Code CPRQ . . . 26 Format Code SCF . . . 34 Format Code Quarterly SCFQ . . . 34 Inventory Valuation Method INVVAL . . . 40 Source Code SRC . . . 51 Source Code Quarterly SCRQ . . . 52 Update Code UPD . . . 76 Update Code Quarterly UPDQ . . . 77
Time period (date) of financial/market data
Data Item Name
Mnemonic . . . page
Current Period (Company) CPD . . . 24 Current Period (Company) Daily CPDD . . . 25 Current Period (Company) Weekly CPDW . . . 25 Current Period (Company) Monthly CPDM . . . 25 Current Period (Company) Quarterly CPDQ . . . 26 Date - Day DATEDAY . . . 26 Date - Month DATEMNT . . . 27 Date - Quarter DATEQTR . . . 27 Date - Year DATEYR . . . 27 Fiscal Year FYR . . . 29 Fiscal Year Quarterly FYRQ . . . 30 Initial Public Offering Date IPODTE . . . 38 Internet Download Date Scalar (Current)
UPDDTS . . . 38
Internet Download Date Daily UPDDTD . . . 38

13
Chapter 2 Company Specifics
Internet Download Date Weekly UPDDTW . . . 39 Internet Download Date Monthly UPDDTM . . . 38 Internet Download Date Quarterly UPDDTQ . . . 39 Internet Download Date Annual UPDDTA . . . 39 Period Reference Final Quarter TIMEQ . . . 45
Company Stock
Data Item Name
Mnemonic . . . page
ADR Ratio - Annual ADRR . . . 151 ADR Ratio - Quarterly ADRRQ . . . 152 Common Shareholders CSHR . . . 22 NASDAQ NMS Identification Code NASDAQ . . . 42 S&P Quality Rank - Monthly SPCSRM . . . 61 Stock Exchange EXCHG . . . 74 Stock Ownership STKO . . . 74 Ticker Symbol TIC . . . 75 Value/Growth Indicator VALGROW . . . 78
Debt Ratings and Fortune 500
Data Item Name
Mnemonic . . . page
Fortune Industry Code FORI . . . 35 Fortune Rank FORRK . . . 35 S&P Domestic Short Term Issuer Credit Rating - Current
SPCPRC . . . 54
S&P Domestic Short Term Issuer Credit Rating - Monthly
SPCPRM . . . 55
S&P Domestic Long Term Issuer Credit Rating - Current
SPDRC . . . 56
S&P Domestic Long Term Issuer Credit Rating - Monthly
SPDRM . . . 57
Company Status
Data Item Name
Mnemonic . . . page
Company Status Code STSQ . . . 22 Research Company - Deletion Date DLDTE . . . 48 Research Company - Reason for Deletion
DLRSN . . . 47

Research Insight North America Data Guide
14
Index Membership
Data Item Name
Mnemonic . . . page
S&P Major Index Markers - Current SPIDXC . . . 40 S&P Major Index Markers - Monthly SPIDXM . . . 41 S&P Index Code - Current SPMIX . . . 59 S&P Index Code - Historical SPMI . . . 59 S&P Index Code - Monthly SPMIM . . . 60 S&P Industry Index Code - Current SPIIX . . . 60 S&P Industry Index Code - Historical SPII . . . 60 S&P Industry Index Code - Monthly SPIIM . . . 61
Industry and Economic Sectors
Data Item Name
Mnemonic . . . page
GICS Sector Current GSECTOR . . . 36 GICS Sector Monthly GSECTORM . . . 36 GICS Group Current GGROUP . . . 36 GICS Group Monthly GGROUPM . . . 36 GICS Industry Current GIND . . . 36 GICS Industry Monthly GINDM . . . 36 GICS Sub-Industry Current GSUBIND . . . 36 GICS Sub-Industry Monthly GSUBINDM . . . 36 Economic Sector Code - Current ECNSEC . . . 27 Economic Sector Code - Historical ECNSECH . . . 28 Industry Sector Code - Current SECTOR . . . 37 Industry Sector Code - Historical SECTORH . . . 37
Line of Business and Geographic Segments
Data Item Name
Mnemonic . . . page
Business Segments - Actual Number SEGNUM . . . 22 Geographic Segments- Actual Number
GEONUM . . . 481
NAICS Codes NAICS . . . 43 Primary GICS Code - Annual SPGIC . . . 46 Primary GICS Code - Current SPGICX . . . 47 Primary GICS Code - Monthly SPGICM . . . 46 Primary SIC Code SIC . . . 45

15
Chapter 2 Company Specifics
SIC Code - Historical SICH . . . 50 SIC Code - Business Segment SICPS . . . 50 SIC Code(s) - All Products and Segments
SICALL . . . 51
Business Descriptions 1 BUSDESC1 . . . 49 Business Descriptions 2 BUSDESC2 . . . 49 Short Business Descriptions SHORTDESC . . . 49
Miscellaneous
Data Item Name
Mnemonic . . . page
Order Backlog OB . . . 44


17
Chapter 2 Company Specifics
Data Definitions
Address - City Mnemonic ADD2
Units Text
This item represents the city of a company’s corporate headquarters or home office.
Address - State Mnemonic ADD3
Units Text
This item represents the state of a company’s corporate headquarters or home office. For U.S. addresses, a two-letter postal code indicates the state in which a headquarters or home office is located.
Address - Street or Post Office Box Mnemonic ADD1
Units Text
This item represents the street address or post office box of a company’s corporate headquarters or home office.
Address - ZIP Code of Company Mnemonic ADDZIP
Units Text
This item represents the ZIP code of a company’s corporate headquarters or home office.
Auditor(s) Mnemonic AU
Units Code
This item is a code that indicates the auditing firms that audited the financial statements of a company. If more than one auditor evaluated the financial statements, one code will appear in each of up to four elements for this item.
Elements are specified numerically, such as 1 for the first element, 2 for the second element, and so on. When you use this item you can specify a particular element using the @ELEMENT function. For example, to specify the second element for the auditor code, type @ELEMENT (AU,2).

Research Insight North America Data Guide
18
If you do not specify an element for a multiple element item in a report, Research Insight evaluates whether values exist for more than one element. If there is a value for only one element, Research Insight automatically returns that value. Otherwise, Research Insight displays an error message.
Code Description
0 Unaudited
1 Arthur Andersen
2 Arthur Young (Merged with Ernst & Whinney on October 1, 1989)
3 Coopers & Lybrand (Coopers & Lybrand Deloitte in United Kingdom since April 29, 1990) (Coopers & Lybrand merged with Price Waterhouse on July 1, 1998)
4 Ernst & Young (Ernst & Whinney from July 1, 1979 to September 29,1989; Ernst and Ernst prior to July 1979)
5 Deloitte & Touche (Deloitte, Haskins, & Sells prior to December 1989; Haskins & Sells prior to May 1, 1978)
6 KPMG Peat Marwick (Peat, Marwick, and Mitchell prior to April 1, 1987)
7 PricewaterhouseCoopers (Price Waterhouse prior to July 1, 1998 merger with Coopers & Lybrand)
8 Touche Ross (Merged with Deloitte, Haskins & Sells on December 4, 1989)
9 Other
10 Altschuler, Melvoin and Glasser
11 BDO Seidman (Seidman & Seidman prior to September 1, 1988)
12 Baird, Kurtz & Dobson
13 Cherry, Bekaert & Holland
14 Clarkson, Gordon
15 Clifton Gunderson
16 Crowe Chizek
17 Grant Thornton
18 J H Cohn
19 Kenneth Leventhal
20 Laventhol & Horwath
21 McGladrey & Pullen (McGladrey, Hendrickson, and Pullen prior to May 1988)
22 Moore Stephens
23 Moss Adams
24 Pannell Kerr Forster
25 Plante & Moran
26 Richard A. Eisner
27 Spicer & Oppenheim
Codes 10 through 27 available from 1988 forward.

19
Chapter 2 Company Specifics
The descriptions for these codes can be viewed by choosing the Databases » Descriptions command from the menu bar and entering the mnemonic in the Item text box. To include a textual description of a code in a report, you can use the @DESC function. For example, to include a description of this item, type @DESC (AU).
Auditor's Opinion Mnemonic AUOP
Data availability 1975
Units Code
This item is a code that indicates whether the auditor's opinion is qualified or unqualified.
The codes used are as follows:
Code Description
0 Unaudited
1 Unqualified. Financial statements reflect no unresolvable restrictions and auditor has no significant exceptions as to the accounting principles, the consistency of their application, and the adequacy of information disclosed.
2 Qualified. Financial statements reflect the effects of some limitation on the scope of the examination or some unsatisfactory presentation of financial information, but are otherwise presented fairly. Standard & Poor's assigns this code when a company is in the process of liquidating (even if opinion is not actually qualified) or when an opinion states that the financial statements do not present fairly the financial position of the company.
3 No Opinion. Auditor refuses to express an opinion regarding the company’s ability to sustain operations as a going concern.
4 Unqualified with Additional Language. Auditor has expressed an unqualified opinion regarding the financial statements but has added explanatory language to the auditor’s standard report.
5 Adverse Opinion. Auditor has expressed an adverse opinion regarding the financial statements of the company.
Codes 4 and 5 available from 1988 forward.
The descriptions for these codes can be viewed by choosing the Databases » Descriptions command from the menu bar and entering the mnemonic in the Item text box. To include a textual description of a code in a report, you can use the @DESC function. For example, to include a description of this item, type @DESC (AUOP).
Business Segments - Actual Number Mnemonic SEGNUM
This two-digit number indicates how many industry segments collected by Standard & Poor's are available for the company in the given data year. Since each company may have up to 10 industry segments per year, the SEGNUM variable will contain values from 01 to 10. If, for example, ABC Corporation reports three industry segments for fiscal year 1987, SEGNUM will carry a value of 3.

Research Insight North America Data Guide
20
Common Shareholders Mnemonic CSHR
Annual Data Item Number A100
Units Thousands
This item represents the number of shareholders of common stock as reported by the company.
This item excludes preferred shareholders.
If a company reports more than one class of common stock and gives the number of shareholders by class, the figures are added and the total is presented.
Company Name Mnemonic CONM
This is a 28-character field printing the company's name.
Company Short Name Mnemonic CONMSH
This is an 11-character field printing the company's short name.
Company Status Code - Quarterly Mnemonic STSQ
This two-character code identifies companies that have undergone leveraged buyouts since December 31, 1984.
Code Company Status
TL Company in bankruptcy or liquidation
TO Company has undergone a leveraged buyout
Company Web Site Address Mnemonic WEBURL
Units Text
This is the address for a company’s home page on the Internet. For example, McGraw-Hill’s web site address is http://www.mcgraw-hill.com.

21
Chapter 2 Company Specifics
County - Primary Location Mnemonic CNTY
Units Code
This code identifies Primary location and conforms to the National Bureau of Standards' Federal Information Processing Standards (FIPS) codes. Under the FIPS classification system, a unique code is assigned to every county or county equivalent in the United States. To be meaningful, this County code must be used in conjunction with a FIPS State code (see the definition for State – Primary Location, mnemonic STATE). Together these codes identify a company's Primary location.
For a company whose principal location is in a foreign country the CNTY code will represent the corresponding country. This code is preceded by the code 99 signifying that the principal location of the company is in a foreign country. In these cases, to interpret the CNTY codes, please see the definition for Foreign Incorporation Code.
A list of county codes can be found under Help » Data and Reference.
Currency Translation Rate Mnemonic CURRTR
Annual Data Item Number A228
Units Dollars and cents
This item represents the rate of exchange used to translate foreign currency amounts into U.S. dollar amounts. The conversion rate used is the rate in effect as of the company's balance sheet date.
This item is not available for banks or utilities.
If a foreign company reports in U.S. dollars, the translation rate is 1.000.
Currency Translation Rate - Quarterly Mnemonic CURRTQ
Quarterly Data Item Number Q121
Units Dollars and cents
This item represents the rate of exchange used to translate foreign currency amounts into U.S. dollar amounts. The conversion rate used is the rate in effect as of the company's balance sheet date.
This item is not available for banks or utilities.
If a foreign company reports in U.S. dollars, the translation rate is 1.000.
CUSIP Number Mnemonic CUSIP
This item is a unique identifier for each company on Compustat®. It is a nine-digit code: the first six digits identify the issuer, the seventh and eighth digit identify the issue, and the ninth digit is the check digit. (For further information, contact the CUSIP Service Bureau, 25 Broadway, New York, NY 10004)

Research Insight North America Data Guide
22
The CUSIP Issuer Code is contained in the first six digits and identifies each company in the database. It consists of numbers in the first three positions and either an alpha or numeric character in the forth, fifth, and/or sixth positions.
In instances where Standard & Poor’s follows more than one class of stock for a company, multiple records for that company are maintained under the same CUSIP Issuer Code. Differences between the classes of stock appear in the CUSIP Issue Number. Standard & Poor’s Compustat-assigned CUSIP Issuer Codes contain 99 in the fourth and fifth positions of the CUSIP Issuer Code.
The CUSIP Issue Number is contained in the seventh and eighth positions and identifies a specific security issue of a company, such as stocks, bonds, and notes. Standard & Poor’s Compustat-assigned CUSIP Issue Numbers begin with 93, followed by 94, 95, and so on if more than one issue has been assigned a CUSIP Issue Number by Standard & Poor’s Compustat.
Subsidiaries are identified by 00 in the CUSIP Issue Number.
The last character represents the CUSIP Check Digit, which ensures accuracy of the entire CUSIP Number.
The CUSIP Issuer Codes, CUSIP Issue Numbers, and the Check Digits conform to the Committee on Uniform Security Identification Procedures (CUSIP).
If you are using CUSIP in place of a ticker symbol to upload data or retrieve a report, you need to input only the first eight digits.
Current Period (Company) Mnemonic CPD
Units Date
This item indicates the latest year for which data is available.
The current period will differ among companies, depending on the most current data available for each.
If you request an item that has not yet been updated for the current year, the system returns a Not Available data code (@NA).
This item is presented as YY (for example, "Y00").
Current Period - Daily (Company) Mnemonic CPDD
Units Date
This item indicates the most recent day, month, and year for which market data is available; specifically, the most current day for which a price, dividend, or trading volume is available.
Only trading days are valid dates.
The current day will differ among companies, depending on the most current data available for each.
If you request an item that has not yet been updated for the current day, the system returns a Not Available Code (@NA).
This item is presented as 29 Jun 90.
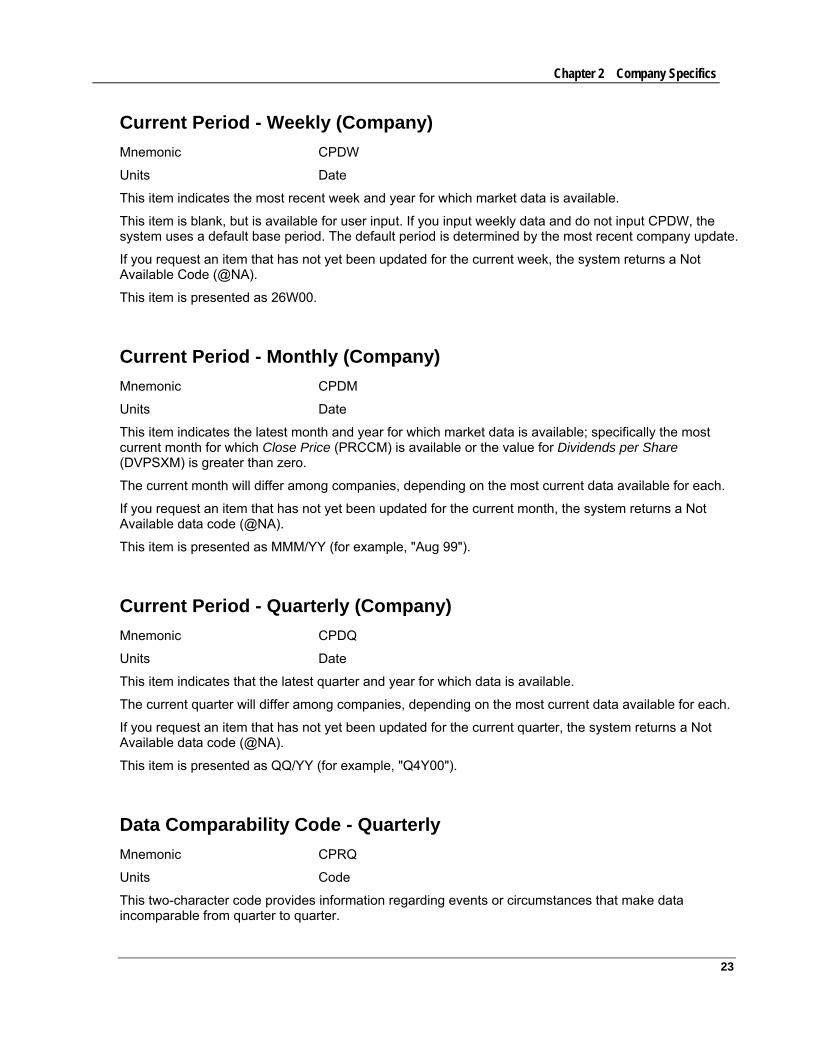
23
Chapter 2 Company Specifics
Current Period - Weekly (Company) Mnemonic CPDW
Units Date
This item indicates the most recent week and year for which market data is available.
This item is blank, but is available for user input. If you input weekly data and do not input CPDW, the system uses a default base period. The default period is determined by the most recent company update.
If you request an item that has not yet been updated for the current week, the system returns a Not Available Code (@NA).
This item is presented as 26W00.
Current Period - Monthly (Company) Mnemonic CPDM
Units Date
This item indicates the latest month and year for which market data is available; specifically the most current month for which Close Price (PRCCM) is available or the value for Dividends per Share (DVPSXM) is greater than zero.
The current month will differ among companies, depending on the most current data available for each.
If you request an item that has not yet been updated for the current month, the system returns a Not Available data code (@NA).
This item is presented as MMM/YY (for example, "Aug 99").
Current Period - Quarterly (Company) Mnemonic CPDQ
Units Date
This item indicates that the latest quarter and year for which data is available.
The current quarter will differ among companies, depending on the most current data available for each.
If you request an item that has not yet been updated for the current quarter, the system returns a Not Available data code (@NA).
This item is presented as QQ/YY (for example, "Q4Y00").
Data Comparability Code - Quarterly Mnemonic CPRQ
Units Code
This two-character code provides information regarding events or circumstances that make data incomparable from quarter to quarter.

Research Insight North America Data Guide
24
Code Reason
AA Data reflects merger or acquisition
AB Data reflects major merger resulting in the formation of a new company
AC Data reflects an accounting change
AR Combination of AA and AZ
AS Combination of AA and AC
AT Combination of AZ and AC
AZ Data excludes discontinued operations
DB Some or all data is not available due to a fiscal year change
DZ Some or all data is not available because the company has been in operation less than one year or presents more than one year or less than 12 months of data
Date - Day Mnemonic DATEDAY
Concept Calculation @DAY(0D)
This concept returns the calendar day of the period. The date is formatted as DDMMMYY, for example 21Dec93.
Date - Month Mnemonic DATEMNT
Concept Calculation @MNT(0M)
This concept returns the calendar month of the period. The date is formatted as MMMYY, for example Dec93.
Date - Quarter Mnemonic DATEQTR
Concept Calculation @MNT(0Q)
This concept returns the quarter of the period. The date is formatted as MMMYY, for example, Sep93.
Date - Year Mnemonic DATEYR
Concept Calculation @MNT(0Y)

25
Chapter 2 Company Specifics
This concept returns the year of the period. The date is formatted as MMMYY, for example, Dec92.
Economic Sector Code - Current Mnemonic ECNSEC
Units Code
This code is used to identify all companies in any of the broad economic industry groups. This scalar item represents the most current sector.
Code Economic Sector
1000 Materials [Basic Materials prior to 12/31/94]
2000 Consumer Discretionary [Consumer Cyclicals prior to 12/31/94]
3000 Consumer Staples
3500 Health Care
4000 Energy
5000 Financials
6000 Industrials [Capital Goods prior to 12/31/94]
8000 Information Technology (Technology prior to 12/31/1994)
8600 Telecommunication Services (Communication Services prior to 12/31/1994)
9000 Utilities
9500 Transportation (discontinued after 12/31/94)
The descriptions for these codes can be seen by choosing the Databases >> Descriptions command from the menu bar and entering the mnemonic in the Item text box. To include a textual description of a code in a report, you can use the @DESC function. For example, to include a description of this item, type @DESC (ECNSEC).
Economic Sector Code - Historical Mnemonic ECNSECH
Units Code
This code is used to identify all companies in any of the 11 broad economic industry groups. This item represents the economic sector that a company belonged to in a specified year.
Historical Economic Sector Codes provide a clearer perspective for your backtesting models, by allowing you to benchmark performance of companies against the broad sectors to which they belonged in a given year.
This item is not available for banks, savings institutions or unit investment trusts.

Research Insight North America Data Guide
26
Code Economic Sector
1000 Materials [Basic Materials prior to 12/31/94]
2000 Consumer Discretionary [Consumer Cyclicals prior to 12/31/94]
3000 Consumer Staples
3500 Health Care
4000 Energy
5000 Financials
6000 Industrials [Capital Goods prior to 12/31/94]
7000 Other Services*
8000 Information Technology (Technology prior to 12/31/1994)
8600 Telecommunication Services (Communication Services prior to 12/31/1994)
9000 Utilities
9500 Transportation**
*This code was discontinued after 1995.
**This code was discontinued after 12/31/1994.
Employer Identification Number Mnemonic EIN
Units Text
Every business that pays wages to one or more employees must have an Employer Identification Number. The first two digits of this 9-digit number issued by the Internal Revenue Service identify the IRS district where the business was located at the time the number was issued.
Employees Mnemonic EMP
Annual Data Item Number A29
Units Thousands
This item represents the number of company workers as reported to shareholders. This is reported by some firms as an average number of employees and by some as the number of employees at year-end. No attempt has been made to differentiate between these bases of reporting. If both are given, the year-end figure is used.
This item, for banks, always represents the number of year-end employees.
This item includes: 1. All part-time and seasonal employees

27
Chapter 2 Company Specifics
2. All employees of consolidated subsidiaries, both domestic and foreign
This item excludes: 1. Contract workers
2. Consultants
3. Employees of unconsolidated subsidiaries
Employees - Note Mnemonic EMPF
Code Description IE Includes seasonal or part-time employees
Fiscal Year Mnemonic FYR
Units Integer
This code designates the month-end for each company's accounting year. Fiscal years ending January 1 through May 31 are treated as ending in the prior calendar year. Thus, the data for a fiscal year beginning on June 1, 1987 and ending on May 31, 1988 would be reported as the year 1987, whereas a fiscal year beginning on July 1, 1987 and ending on June 30, 1988, would be reported as the year 1988.
Examples If fiscal year is January - (1) ...
Calendar Year
Data Year
Data Quarter
Fiscal Year Code
April 1998 98 1 1
July 1998 98 2 1
October 1998 98 3 1
January 1999 98 4 1
If fiscal year is June - (6) ...
Calendar Year
Data Year
Data Quarter
Fiscal Year Code
September 1998 99 1 6
December 1998 99 2 6
March 1999 99 3 6
June 1999 99 4 6

Research Insight North America Data Guide
28
Fiscal Year - Quarterly Mnemonic FYRQ
Units Integer
This code designates the month-end for each company's accounting year. Fiscal years ending January 1 through May 31 are treated as ending in the prior calendar year. Thus, the data for a fiscal year beginning on June 1, 1987 and ending on May 31, 1988 would be reported as the year 1987, whereas a fiscal year beginning on July 1, 1987 and ending on June 30, 1988, would be reported as the year 1988.
Examples If fiscal year is January - (1) ...
Calendar Year
Data Year
Data Quarter
Fiscal Year Code
April 1998 98 1 1
July 1998 98 2 1
October 1998 98 3 1
January 1999 98 4 1
If fiscal year is June - (6) ...
Calendar Year
Data Year
Data Quarter
Fiscal Year Code
September 1998 99 1 6
December 1998 99 2 6
March 1999 99 3 6
June 1999 99 4 6
Fiscal Year Quarterly (FYRQ) is an annual item.
Foreign Incorporation Code Mnemonic FIC
Units Code
The Foreign Incorporation Code indicates the country in which a company is incorporated. The codes and their meanings are as follows:
FIC Country of Incorporation
0 United States
9 Canada
10 Belize

29
Chapter 2 Company Specifics
11 China
12 Argentina
13 British Virgin Islands
14 Australia
15 Austria
16 Belgium
17 Bahrain
18 Bermuda
19 Bolivia
20 Brazil
21 Bahamas
22 Chile
23 Cayman Islands
24 Colombia
25 Congo
26 Denmark
27 Dominican Republic
28 Ecuador
29 Egypt
30 El Salvador
31 United Kingdom
32 Ethiopia
33 Guatemala
34 Finland
35 France
36 Germany
37 Ghana
38 Russia
39 Greece
40 Hong Kong
41 Honduras
42 Iceland
43 Hungary
44 India
45 Indonesia
46 Iran
47 Cook Islands

Research Insight North America Data Guide
30
48 Republic of Ireland
49 Israel
50 Italy
51 Jordan
52 Japan
53 Cyprus
54 Antigua
55 Kenya
56 South Korea
58 Kuwait
59 Lebanon
60 Luxembourg
61 Liberia
62 Malaysia
63 Liechtenstein
64 Mexico
65 Monaco
66 Morocco
67 Netherlands Antilles
68 Netherlands
69 New Zealand
70 Norway
71 Nigeria
72 Pakistan
73 Papua New Guinea
74 Panama
75 Peru
76 Philippines
77 Portugal
78 Puerto Rico
79 Zimbabwe
80 Saudi Arabia
-81 Poland
82 Marshall Islands
84 Singapore
85 South Africa
86 Spain

31
Chapter 2 Company Specifics
88 Sweden
89 Switzerland
90 Taiwan
91 Tanzania
92 Thailand
93 United Arab Emirates
94 Turkey
95 Uruguay
96 Venezuela
98 Zaire
99 Zambia
To include a description of the code in a report, use the @DESC function. For example, enter @DESC(FIC).
Format Code Mnemonic SCF
Statement Statement of Cash Flows/Statement of Changes
Annual Data Item Number A318
Units Code
This code represents the format used by a company to report either its Statement of Changes or Statement of Cash Flows.
This item contains a Not Available data code (@NA) if a company does not report a Statement of Changes or Statement of Cash Flows.
This item is available from 1971 forward for companies in which Format Code = 1 or 2. It is available from 1984 or 1987 forward for companies reporting a Cash Statement by Activity (Format Code = 3) or a Statement of Cash Flows (Format Code = 7) respectively.
Prior to 1984, a Cash Statement by Activity (Format Code = 3) will be coded as a Cash by Source and Use of Funds (Format Code = 2) since the differentiation in cash formats was not broken out until 1984.
All Canadian companies began reporting a Statement of Cash Flows (Format Code = 7) in the first quarter of 1999 to comply with standards set by the Canadian Institute of Chartered Accountants’ (CICA).
Code Format Code
1 Working Capital Statement
2 Cash Statement by Source and Use of Funds
3 Cash Statement by Activity
4 Other
5 Net Liquid Funds/Net Funds by Source & Use
7 Statement of Cash Flows

Research Insight North America Data Guide
32
Format Code - Quarterly Mnemonic SCFQ
Statement Statement of Cash Flows/Statement of Changes
Units Code
This code represents the format used by a company to report either its Statement of Changes or Statement of Cash Flows.
This item contains a Not Available data code (@NA) if a company does not report a Statement of Changes or Statement of Cash Flows.
This item is available from 1971 forward for companies in which Format Code = 1 or 2. It is available from 1984 or 1987 forward for companies reporting a Cash Statement by Activity (Format Code = 3) or a Statement of Cash Flows (Format Code = 7) respectively.
Prior to 1984, a Cash Statement by Activity (Format Code = 3) will be coded as a Cash by Source and Use of Funds (Format Code = 2) as the differentiation in cash formats was not broken out until 1984.
Code Format Code
1 Working Capital Statement
2 Cash Statement by Source and Use of Funds
3 Cash Statement by Activity
4 Other
7 Statement of Cash Flows
Fortune Industry Code Mnemonic FORI
The Fortune 500 is a single list combining industrial and service companies, ranked in size by revenues. Prior to 1994, this list was divided into two major categories: the Fortune 500 Industrial and the Fortune 500 Service groups. The former service breakouts will only be available for 1993 and prior periods.
Research Insight uses the following codes to identify the Fortune companies:
1993 and Prior Years Industry Code and Description
1994 Forward Industry Code and Description
10 - Fortune 500 10 - Fortune 500 (Industrial and Service companies
40 - Transportation
49 - Utilities
53 - Retailing
60 - Commercial Banking
61 - Diversified Financial (1984 and prior years)
61 - Diversified Financial (from 1985 - 1993)

33
Chapter 2 Company Specifics
62 - Savings Institutions
63 - Life Insurance
70 - Diversified Service
The descriptions for these codes can be viewed by choosing the Databases » Descriptions command from the menu bar and entering the mnemonic in the Item text box. To include a textual description of a code in a report, you can use the @DESC function. For example, to include a description of this item, type @DESC (FORI).
Standard & Poor’s follows the majority of companies listed in the Fortune 500.
This item is reported on a calendar-year basis regardless of the company’s fiscal year-end.
Fortune Rank Mnemonic FORRK
Annual Data Item Number A279
Units Integer
Company rankings are identified by numbers 1-500, with 1 designating the largest company. Prior to 1994, companies were ranked within each industry listing.
This item is reported on a calendar-year basis regardless of the company's fiscal year-end.
GICS Sector Mnemonic GSECTOR
Concept Calculation @LEFT(SPGICX,2)
This concept breaks down the Primary GICS Code – Current (SPGICX) for a company into its components. In the hierarchy of the GICS code design, Economic Sector is the first level and is represented by the leftmost 2 digits of the total GICS code.
Additionally, using the @DESC function, you can get the description of the appropriate GICS level for a company, i.e., @DESC(GSECTOR) for Applied Materials gives you Information Technology.
GICS Group Mnemonic GGROUP
Concept Calculation @LEFT(SPGICX,4)
This concept breaks down the Primary GICS Code – Current (SPGICX) for a company into its components. In the hierarchy of the GICS code design, Industry Group is the second level and is represented by the leftmost 4 digits of the total GICS code.
Additionally, using the @DESC function, you can get the description of the appropriate GICS level for a company, i.e., @DESC(GGROUP) for Applied Materials gives you Technology Hardware & Equipment.

Research Insight North America Data Guide
34
GICS Industry Mnemonic GIND
Concept Calculation @LEFT(SPGICX,6)
This concept breaks down the Primary GICS Code – Current (SPGICX) for a company into its components. In the hierarchy of the GICS code design, Industry is the third level and is represented by the leftmost 6 digits of the total GICS code.
Additionally, using the @DESC function, you can get the description of the appropriate GICS level for a company, i.e., @DESC(GIND) for Applied Materials gives you Semiconductor Equipment & Products.
GICS Sub-Industry Mnemonic GSUBIND
Concept Calculation @LEFT(SPGICX,8)
This concept breaks down the Primary GICS Code – Current (SPGICX) for a company into its components. In the hierarchy of the GICS code design, Sub-Industry is the fourth level and is represented by all 8 digits of the GICS code.
Additionally, using the @DESC function, you can get the description of the appropriate GICS level for a company, i.e., @DESC(GSUBIND) for Applied Materials gives you Semiconductor Equipment.
GLOBAL Vantage Key Mnemonic GVKEY
GLOBAL Vantage key uniquely identifies all Compustat companies. GVKEY can be used in place of company tickers or CUSIPs. GVKEY is not an editable item and cannot be added for user companies.
Industry Sector Code Mnemonic SECTOR
Units Code
This code is used to identify all companies in any of the specific industry groups. This scalar item represents the most current sector.
Industry Sector Codes are 4-digit items that represent current classification only and there is no history. It should be noted that Industry Sector Codes are not parallel to SIC Codes.
Research Insight provides you with Industry Sector Codes so that you can benchmark performance of companies against broad industry sectors. You can evaluate any company's stock performance against its appropriate sector even if that company is not in any of the S&P indexes.
The descriptions for these codes can be viewed by choosing the Databases >> Descriptions command from the menu bar and entering the mnemonic in the Item text box. To include a textual description of a code in a report, you can use the @DESC function. For example, to include a description of this item, type @DESC (SECTOR).

35
Chapter 2 Company Specifics
Industry Sector Code - Historical Mnemonic SECTORH
Units Code
This code is used to identify all companies in any of the specific industry groups. This item represents the industry sector for a company for a specified year.
The Industry Sector Code – Historical item is a 4-digit code representing a company’s industry classification for a specific year. It should be noted that Industry Sector Codes are not parallel to SIC Codes.
Historical Industry Sector Codes provide a clearer perspective for your backtesting models, by allowing you to benchmark performance of companies against the broad industry sectors to which they belonged in a given year.
This item in not available for banks, savings institutions or unit investment trusts.
Initial Public Offering Date Mnemonic IPODTE
Units Date MM/DD/YY
This item is the date of a company’s initial public stock offering. This item is useful in historical price analyses and in screening a population.
Internet Download Date - Scalar Mnemonic UPDDTS
This item tells you the date that the scalar company data was updated via Internet download. If this item is blank, the most recent company data available is on your Research Insight core database.
Screening examples:
@DAY(UPDDTS)>5dec96
Use this formula to screen the database for scalar items updated since 12/05/96.
UPDDTS=@DATE(96,12,5)
Use this formula to screen the database for scalar items updated on 12/05/96.
Internet Download Date - Daily Mnemonic UPDDTD
This item tells you the date that the daily company data was updated via Internet download. If this item is blank, the most recent company data available is on your Research Insight core database.
Screening examples:
@DAY(UPDDTD)>5dec96

Research Insight North America Data Guide
36
Use this formula to screen the database for daily items updated since 12/05/96.
UPDDTD=@DATE(96,12,5)
Use this formula to screen the database for daily items updated on 12/05/96.
Internet Download Date - Monthly Mnemonic UPDDTM
This item tells you the date that the monthly company data was updated via Internet download. If this item is blank, the most recent company data available is on your Research Insight core database.
Screening examples:
@DAY(UPDDTM)>5dec96
Use this formula to screen the database for monthly items updated since 12/05/96.
UPDDTM=@DATE(96,12,5)
Use this formula to screen the database for monthly items updated on 12/05/96.
Internet Download Date - Weekly Mnemonic UPDDTW
This item tells you the date that the weekly company data was updated via Internet download. If this item is blank, the most recent company data available is on your Research Insight core database.
Screening examples:
@DAY(UPDDTW)>5dec96
Use this formula to screen the database for weekly items updated since 12/05/96.
UPDDTW=@DATE(96,12,5)
Use this formula to screen the database for weekly items updated on 12/05/96.
Internet Download Date - Quarterly Mnemonic UPDDTQ
This item tells you the date that the quarterly company data was updated via Internet download. If this item is blank, the most recent company data available is on your Research Insight core database.
Screening examples:
@DAY(UPDDTQ)>5dec96
Use this formula to screen the database for quarterly items updated since 12/05/96.
UPDDTQ=@DATE(96,12,5)
Use this formula to screen the database for quarterly items updated on 12/05/96.

37
Chapter 2 Company Specifics
Internet Download Date - Annual Mnemonic UPDDTA
This item tells you the date that the annual company data was updated via Internet download. If this item is blank, the most recent company data available is on your Research Insight core database.
Screening examples:
@DAY(UPDDTA)>5dec96
Use this formula to screen the database for annual items updated since 12/05/96.
UPDDTA=@DATE(96,12,5)
Use this formula to screen the database for annual items updated on 12/05/96.
Inventory Valuation Method Mnemonic INVVAL
Units Code
This item represents the method used to value inventory. The following codes are used:
Code Method
0 No Inventory
1 First In, First Out (FIFO)
2 Last In, First Out (LIFO)
3 Specific Identification
4 Average Cost
5 Retail Method
6 Standard Cost
7 Current or Replacement Cost
Beginning in 1972, if a company uses more than one valuation method, one code will appear in each of up to four elements for this item. If reported by the company, the methods are listed in order of relative amounts of inventory valued by each method.
Prior to 1972, the method that valued the majority of the inventory was used.
This item is not available for banks, utilities, savings and loans or real estate investment trust (REIT) companies.
The retail method may be described as a way of applying cost percentages to related selling prices. The descriptive method will appear first, then the retail code. For example, "Valued by the retail method of FIFO" would appear as 15.000.
Major Index Markers - Current Mnemonic SPIDXC
Units Code

Research Insight North America Data Guide
38
This is a three-element group item that identifies constituents of primary, secondary, and subset S&P Indexes and constituents of the S&P/TSX Composite Index (formerly TSE 300 Index).
The first element consists of a two-character code. Standard & Poor's uses the following codes to identify constituents of the corresponding index:
Code Index Name
01 S&P 500
02 S&P MidCap 400
03 S&P SmallCap 600
81 TSE 300
(blank) not in a major S&P Index
The second element consists of a two-character code. Standard & Poor's uses the following codes to identify constituents of the corresponding index:
Code Index Name
10 S&P 500 (S&P Industrials prior to 12/31/1994)*
91 S&P MidCap 400
92 S&P SmallCap 600
(blank) not in a subset S&P Index
The third element consists of a two-character code. Standard & Poor's uses the following code to identify constituents of the corresponding index:
Code Index Name
15 S&P 100
(blank) not in S&P 100
Major Index Markers - Monthly Mnemonic SPIDXM
Units Code
This is a three-element group item that identifies constituents of primary, secondary, and subset S&P Indexes and constituents of the S&P/TSX Composite Index (formerly TSE 300 Index). The third element is currently not used for this item.
The first element consists of a two-character code. Standard & Poor's uses the following codes to identify constituents of the corresponding index:
Code Index Name
01 S&P 500
02 S&P MidCap 400
03 S&P SmallCap 600
81 TSE 300

39
Chapter 2 Company Specifics
(blank) not in a major S&P Index
The second element consists of a two-character code. Standard & Poor's uses the following codes to identify constituents of the corresponding index. Beginning January 1, 2002, the indexes were reclassified. Only the codes 10, 91 and 92 continue to exist. History was reclassified back to December 31, 1994.
Code Index Name
10 S&P 500 (S&P Industrials prior to 12/31/1994)*
40* S&P Transportation*
49* S&P Utilities*
60* S&P Financial*
91 S&P MidCap 400
92 S&P SmallCap 600
(blank) not in a subset S&P Index
*This code discontinued after 12/31/93.
NASDAQ NMS Identification Code Mnemonic NASDAQ
Units Code
The presence of a company's ticker symbol in this item indicates that it is included in the NASDAQ National Market System. If a ticker symbol does not appear in the item, the company is not a NASDAQ-NMS security. Active stocks traded with the aid of the National Association of Securities Dealers' Automated Quotations fall into two distinct categories:
NASDAQ stocks and NASDAQ National Market stocks. NASDAQ National Market issues differ from NASDAQ securities in the way the prices are quoted. Transactions in securities designated as National Market issues quote the actual high, low and last prices. For non-National Market issues, the highest and lowest bid prices are available. In order to determine which securities qualify for the electronically linked National Market System, standards have been set by the National Association of Securities Dealers.
These standards fall into two main categories:
Category 1 - Established Companies Company must have 800,000 or more publicly held shares.
Company must have a market value of $8.0 million.
Company must have a net worth of $8.0 million or greater.
Company must have operating history of at least four years.
Company must have at least two market-makers.
Category 2 - Newer Companies Company must have 350,000 or more publicly held shares.
Stock must have at least a $3.00 bid price.
Company must have at least two market-makers.

Research Insight North America Data Guide
40
Company must have had net income of at least $300,000 in the year previous to listing on the National Market System.
North American Industry Classification System Codes Mnemonic NAICS
Units Code
Mnemonic NAICSH
Units Code
NAICS is a 6-digit coding system for classifying establishments on a production/process-oriented basis.
Example of the NAICS code hierarchy:
Sector 51 Information
Subsector 513 Broadcasting & Telecommunications
Industry Group 5133 Telecommunications
NAICS Industry 51332 Wireless Telecommunications Carriers except Satellite
National 513321 Paging
Not all banks, savings institutions, unit investment trusts or Canadian companies have a code.
Officer Code(s) Mnemonic OFCD
Units Text
This code is a four-element group item that represents the officer(s) of a company There can be up to four officer codes per company. The codes used are as follows:
Code Officer
AS Assistant Secretary
AT Assistant Treasurer
CB Chairman
CE Chief Executive
CF Chief Finance Officer
CK Clerk
CM Comptroller
CO Chief Operating Officer
CR Controller
DI Director

41
Chapter 2 Company Specifics
EP Executive Vice President
FI Finance
GC General Counsel
IR Investor Relations
IC Investor Contact
PR President
SC Secretary
SP Senior Vice President
TE Trustee
TR Treasurer
VC Vice Chairman
VF Vice President Finance
VP Vice President
ZZ Other (doesn’t fit into any other category)
Officer Name(s) Mnemonic OFNM
This item is a four-element group item which represents the first two initials and the last name(s) of the officer(s) for a company. The maximum number of characters available in this item field is 39.
Officer Title(s) Mnemonic OFTL
This item is a four-element group item which represents the officer title(s) for a company. There are up to four officer titles available per company. The maximum number of characters available in this item field is 39.
Order Backlog Mnemonic OB
Annual Data Item Number A98
Units Millions of dollars
This item represents the dollar amount of backlog of orders believed to be firm as of the end of the company's fiscal year.
This item includes 1. Sales backlog
2. Unfunded backlog

Research Insight North America Data Guide
42
This figure for REITs includes unfunded loan commitments.
This item is not available for banks, railroads, finance, savings and loan or airline companies.
Period Reference - Final Quarter Mnemonic TIMEQ
Concept Calculation @IF(@OR(@AND(UPDQ=3,@NOT(@ISNA(NOPIQ))),@AND(@PERIOD(0Q)=4,@VALUE(UPD[@YR(0Q)],1)>=2)),@QTR(0Q),@QTR(-1Q))
This concept returns a quarterly time period which can be used as a quarterly time period reference. If the current quarter is on a preliminary basis the time period for the prior quarter is returned. If not the time period for the current quarter is returned.
Phone Number Mnemonic PHONE
This item represents the area code and phone number for a company. The maximum number of characters available in this item field is 14.
Primary SIC Code Mnemonic SIC
The Primary SIC Code assigned to companies on the Compustat® database conforms as nearly as possible to the Office of Management and Budget's Standard Industry Classification (SIC) Codes. SIC is a four-digit system of classification under which a concern may be identified according to its activity.
Individual companies are assigned a four-digit Primary SIC Code by analyzing the product line breakdown provided in each 10-K. Additional sources such as stock reports and Annual Reports are used when necessary. The product line accounting for the largest percent of sales will determine the Primary SIC Code. The assigned classification is reviewed each year when the company is updated.
Certain Primary SIC Codes for companies are determined in the following ways: 1. General codes such as 1000 (Metal Mining), 2000 (Food and Kindred Products), 2600 (Paper and
Allied Products), 2700 (Printing, Publishing, and Allied), etc., have been assigned to companies involved in more than one aspect of an industry. For instance, a company in the 2600 (Paper and Allied Products) category might manufacture pulp, then paper, paperboard, and other paper products from the pulp. These general Primary SIC Codes agree with the numbers assigned in the SIC book.
2. In an effort to consolidate SIC groupings and eliminate industry classifications with only a small number of companies, Primary SIC Codes with two or three digits are used. For instance, 2072 (Fats and Oils) is a general category which encompasses five specific SIC categories: 2074, 2075, 2076, 2077, and 2079. Also, 7500 (Serv - Automotive Repair and Ser), is a general category which covers four specific SIC categories: 7510, 7520, 7530, and 7540.
3. Four-digit classifications are used when warranted by a large number of companies and/or the need to be specific and differentiate between codes. For instance, the 2080 (Beverage) category is broken into three groups:
2082 Malt Beverages
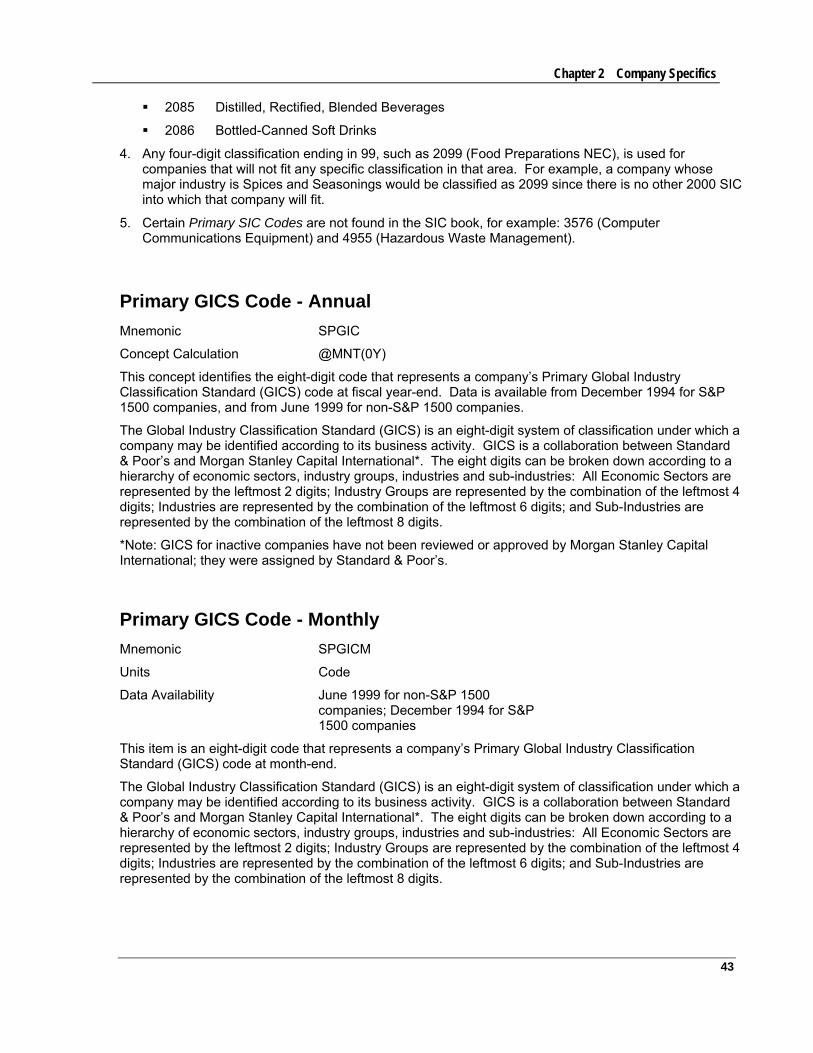
43
Chapter 2 Company Specifics
2085 Distilled, Rectified, Blended Beverages
2086 Bottled-Canned Soft Drinks
4. Any four-digit classification ending in 99, such as 2099 (Food Preparations NEC), is used for companies that will not fit any specific classification in that area. For example, a company whose major industry is Spices and Seasonings would be classified as 2099 since there is no other 2000 SIC into which that company will fit.
5. Certain Primary SIC Codes are not found in the SIC book, for example: 3576 (Computer Communications Equipment) and 4955 (Hazardous Waste Management).
Primary GICS Code - Annual Mnemonic SPGIC
Concept Calculation @MNT(0Y)
This concept identifies the eight-digit code that represents a company’s Primary Global Industry Classification Standard (GICS) code at fiscal year-end. Data is available from December 1994 for S&P 1500 companies, and from June 1999 for non-S&P 1500 companies.
The Global Industry Classification Standard (GICS) is an eight-digit system of classification under which a company may be identified according to its business activity. GICS is a collaboration between Standard & Poor’s and Morgan Stanley Capital International*. The eight digits can be broken down according to a hierarchy of economic sectors, industry groups, industries and sub-industries: All Economic Sectors are represented by the leftmost 2 digits; Industry Groups are represented by the combination of the leftmost 4 digits; Industries are represented by the combination of the leftmost 6 digits; and Sub-Industries are represented by the combination of the leftmost 8 digits.
*Note: GICS for inactive companies have not been reviewed or approved by Morgan Stanley Capital International; they were assigned by Standard & Poor’s.
Primary GICS Code - Monthly Mnemonic SPGICM
Units Code
Data Availability June 1999 for non-S&P 1500 companies; December 1994 for S&P 1500 companies
This item is an eight-digit code that represents a company’s Primary Global Industry Classification Standard (GICS) code at month-end.
The Global Industry Classification Standard (GICS) is an eight-digit system of classification under which a company may be identified according to its business activity. GICS is a collaboration between Standard & Poor’s and Morgan Stanley Capital International*. The eight digits can be broken down according to a hierarchy of economic sectors, industry groups, industries and sub-industries: All Economic Sectors are represented by the leftmost 2 digits; Industry Groups are represented by the combination of the leftmost 4 digits; Industries are represented by the combination of the leftmost 6 digits; and Sub-Industries are represented by the combination of the leftmost 8 digits.

Research Insight North America Data Guide
44
Additionally, GICS history for research (inactive) companies is based upon Primary GICS Codes – Current (SPGICX)*. GICS history will be retained only for the month that the company became inactive. For companies that were moved to the Research File prior to June 30, 1999, the Primary GICS Code is based upon the SIC and/or NAICS classification at the month-end that they became inactive. For example, Company ABC was moved to the Research File effective October 31, 1997. The Primary GICS Code for this company is based upon its NAICS code at October 31, 1997, which was 333995. This NAICS code correlates to the GICS code 20106020. The Primary GICS Code for Company ABC would be 20106020.
*Note: GICS for inactive companies have not been reviewed or approved by Morgan Stanley Capital International; they were assigned by Standard & Poor’s.
Primary GICS Code - Current Mnemonic SPGICX
Units Code
Data Availability Current (latest available)
This item is a scalar code that represents a company’s current Primary Global Industry Classification Standard (GICS) code. This item is updated daily and can be obtained through the Internet Daily Fundamental download.
The Global Industry Classification Standard (GICS) is an eight-digit system of classification under which a company may be identified according to its business activity. GICS is a collaboration between Standard & Poor’s and Morgan Stanley Capital International. The eight digits can be broken down according to a hierarchy of economic sectors, industry groups, industries and sub-industries: All Economic Sectors are represented by the leftmost 2 digits; Industry Groups are represented by the combination of the leftmost 4 digits; Industries are represented by the combination of the leftmost 6 digits; and Sub-Industries are represented by the combination of the leftmost 8 digits.
Additionally, GICS history for research (inactive) companies is based upon Primary GICS Codes – Current (SPGICX)*. GICS history will be retained only for the month that the company became inactive.
*Note: GICS for inactive companies have not been reviewed or approved by Morgan Stanley Capital International; they were assigned by Standard & Poor’s.
Research Company Reason for Deletion Mnemonic DLRSN
Units Code
This item is a two-digit code representing the reason a company has been moved from the active file to the research file. The codes and their meanings are as follows:
Code Reason for Deletion
1 Acquisition or merger
2 Bankruptcy
3 Liquidation
4 Reverse acquisition (1983 forward)
5 No longer fits original format (1978 forward)

45
Chapter 2 Company Specifics
6
7
Leveraged buyout (1982 forward)
Other (no longer files SEC among other possible reasons), but pricing continues
9 Now a private company
10 Other (no longer files with SEC among other possible reasons)
Research Company - Deletion Date Mnemonic DLDTE
Units MMM YY
This item represents the effective date (month and year) of the acquisition, merger, liquidation, or other reason for deletion. The date will be determined by the type of transaction involved. Below is a brief description of what the date represents for each of the following transactions:
Reason for Deletion Date of Deletion
Acquisition/Merger Date of the transaction
Bankruptcy Date the company is deleted from the active database
Liquidation Date of last liquidating dividend, or when deleted from the active database (Company is deleted approximately 27 months after receipt of the last annual source document)
Reverse acquisition Date of the transaction
No longer fits original format Date the company is deleted from the active database (Company is deleted approximately 27 months after receipt of the last annual source document)
Leveraged Buyout Date of the transaction
Now a private company Date of the transaction
Other (no long files with SEC) Date the company is deleted from the active database (Company is deleted approximately 27 months after receipt of the last annual source document)
Short Business Description Mnemonic 1 BUSDESC
Mnemonic 2 BUSDESC1

Research Insight North America Data Guide
46
Format Text
Concept Mnemonic SHORTDESC
Concept Calculation @CONCATENATE(BUSDESC, BUSDESC1)
These text items are a brief textual description of a company’s business operations:
BUSDESC contains the first 256 characters of a company’s short business description.
BUSDESC1 contains characters 257 and beyond.
The concept SHORTDESC concatenates the descriptions to present a complete short business description.
Short-Term Issuer Credit Rating
Code Rating Description
101
102
A1+
A1
Highest rating. The obligor’s capacity to meet its financial commitment on the obligation is strong. Within this category, certain obligations are designated with a plus sign (+) to connote that the obligor’s capacity to meet its financial commitments is extremely strong.
103 A2 Satisfactory capacity to meet financial commitments. Somewhat more susceptible to the adverse effects of changes in circumstances and economic conditions than obligors in higher-rated categories.
104 A3 Adequate protection parameters. However, adverse economic conditions or changing circumstances are more likely to lead to a weakened capacity of the obligor to meet its financial commitments.
105 B Vulnerable. Significant speculative characteristics. The obligor currently has the capacity to meet its financial commitments. However, it faces major ongoing uncertainties, which could lead to its inadequate capacity to meet its financial commitments.
106 C Currently vulnerable to nonpayment and is dependent upon favorable business, financial, and economic conditions for the obligor to meet its financial commitments.

47
Chapter 2 Company Specifics
SIC Code - Historical Mnemonic SICH
Units Code
This item identifies a company’s SIC Code in prior years. For example, to display the historical Standard Industrial Classification as it appeared in 1988, enter SICH[Y88]. You can use this item to identify a company’s peer group as it was in the past.
This item is not available for banks, savings institutions or unit investment trusts.
SIC Codes - Business Segment (Primary and Secondary) Mnemonic SICS
Units Code
This two-element group item presents the two SIC codes assigned to each business segment. These SIC codes are assigned by Standard & Poor's based on the activities of each segment as described in the company's 10-K and Annual Report. When possible, a four-digit specific SIC code (for example, 2911) will be assigned; however, if segment activities are more broadly described, a more general two-digit or three-digit specific classification is made.
Standard & Poor's will attempt to assign both a primary and secondary SIC code for each industry segment. However, either one or both SIC items will be zero in some cases: 1. Only one SIC code will be assigned whenever one of the following situations occur:
Only one SIC category's operations of an industry segment is reported by the company
Only a general description of an industry segment's activities is reported by the company
2. Both SIC code fields will be zero when a company that reports an industry segment which is classified as "other" and no description of this industry segment's activity is provided
SIC Code(s) - All Products and Segments Mnemonic SICALL
Units Code
This 60-element group item contains a list of up to 60 SIC codes assigned to a company for the current year. The SIC codes are assigned by Standard & Poor's and present the industries in which a company provides goods and services.
Source Code Mnemonic SRC
Units Code
The Source Code indicates the most recent source from which Standard & Poor's obtained data for each year or quarter. As database information is updated from additional sources, the Source Code will change.

Research Insight North America Data Guide
48
The codes are as follows:
Annual Code Source
0 No Source document
3 Annual Report/Auditor's Report
4 Uniform Statistical Report (USR)
5 10-K/20-F
3 10K-A Amendment
8 10K-A or 10Q-A Amendment
9 Summary Annual Report
13 Annual Report + Statistical or Quarterly Supplement
14 10-K + Statistical or Quarterly Supplement
15 Annual Report + 10-K + Statistical or Quarterly Supplement
37 Prospectus
43 Annual Report + USR
47 Annual Report + 10-K + P-1.2 + T2-A (supplemental reports for airlines)
53 Annual Report + 10-K
54 10-K + USR
55 Annual Report + 10-K + USR
56 Annual Report + 10-K + USR + Statistical Supplement
88 Subsequent period source (newswire)
99 No Source document - gap in data collection
To include a description of the code in a report, use the @DESC function. For example, enter @DESC(SRC).
Source Code - Quarterly Mnemonic SRCQ
Units Code
The Source Code indicates the most recent source from which Standard & Poor's obtained data for each year or quarter. As database information is updated from additional sources, the Source Code will change.
The codes are as follows:
Quarterly Code Source
0 No Source document
2 Wall Street Journal

49
Chapter 2 Company Specifics
3 Quarterly Report
4 Uniform Statistical Report (USR)
5 10-Q
8 10K-A or 10Q-A Amendment
9 Quarterly Report (from a Summary Annual Report)
13 Quarterly Report + Quarterly Supplement
14 10-Q + Quarterly Supplement
15 Quarterly Report + 10-Q + Quarterly Supplement
20 Newswire
30 News Release
33 Quarterly Report + News Release
35 10-Q + News Release
37 Prospectus
38 Quarterly Report + 10-Q + News Release
43 Annual Report + USR
46 10-Q + P-1.2 + T2-A (supplemental reports for airlines)
47 10-Q + Quarterly Report + P-1.2 + T2-A (supplemental reports for airlines)
53 Quarterly Report + 10-Q
54 10-Q + USR
55 Quarterly Report + 10-Q + USR
88 Subsequent period source - gap in data collection
To include a description of the code in a report, use the @DESC function. For example, enter @DESC(SRCQ).
S&P Commercial Paper Rating Mnemonic SPCPR
Annual Data Item 283
Units Code
This item represents the commercial paper rating assigned to a company by Standard & Poor's as of the end of a company's fiscal year. This rating assesses the likelihood of timely payment of debt having an original maturity of no more than 365 days. The ratings are based on information furnished to Standard & Poor's by the issuer or obtained from other sources.
The following class of debt codes identify companies with commercial paper ratings. The codes appear to the left of the decimal.

Research Insight North America Data Guide
50
Code Rating Definition
101 A1+ Issue has the greatest capacity for timely payment
102 A1 Capacity for timely payment is very strong or degree of safety is overwhelming
103 A2 Capacity for timely payment is strong. However, the relative degree of safety is not as high as for issues rated A1
104 A3 Capacity for payment is satisfactory. Issues rated A3 are somewhat more vulnerable to the adverse effects of changes in circumstances than obligations assigned a higher designation
105 B Capacity for timely payment is adequate. However, such capacity may be damaged by changing conditions or short-term adversities
106 C Capacity for timely payment of short-term obligations is doubtful
107 D Issue is in default or is expected to be in default upon maturity
S&P Commercial Paper Rating - Quarterly Mnemonic SPCPRQ
Units Code
This item represents the commercial paper rating assigned to a company by Standard & Poor's as of the end of a company's fiscal year. This rating assesses the likelihood of timely payment of debt having an original maturity of no more than 365 days. The ratings are based on information furnished to Standard & Poor's by the issuer or obtained from other sources.
The following class of debt codes identify companies with commercial paper ratings. The codes appear to the left of the decimal.
Code Rating Definition
101 A1+ Issue has the greatest capacity for timely payment
102 A1 Capacity for timely payment is very strong or degree of safety is overwhelming
103 A2 Capacity for timely payment is strong. However, the relative degree of safety is not as high as for issues rated A1

51
Chapter 2 Company Specifics
104 A3 Capacity for payment is satisfactory. Issues rated A3 are somewhat more vulnerable to the adverse effects of changes in circumstances than obligations assigned a higher designation
105 B Capacity for timely payment is adequate. However, such capacity may be damaged by changing conditions or short-term adversities
106 C Capacity for timely payment of short-term obligations is doubtful
107 D Issue is in default or is expected to be in default upon maturity
S&P Domestic Short-Term Issuer Credit Rating - Current Mnemonic SPCPRC
Units Code
As of September 1, 1998
The Standard & Poor’s Issuer Credit Rating (ICR) is a current opinion of an issuer’s overall creditworthiness, apart from its ability to repay individual obligations. This opinion focuses on the obligor’s capacity and willingness to meet its short-term financial commitments (those with maturities of one year or less) as they come due. This item represents the current rating assigned to the company by S & P.
In the case of non-U.S. companies, the ICR is based on the local currency from the country of origin. Local currency credit ratings incorporate the critical consideration of country risks.
Short-term ICR’s range from A-1 (strong capacity to meet financial obligations) to C (currently vulnerable). See also: List of Short-Term Issuer Credit Ratings . . . 49
The ICR is not a recommendation to purchase, sell, or hold a financial obligation issued by an obligor, as it does not comment on market price or suitability for a particular investor.
An ICR is withdrawn upon the first occurrence of any of the following: 1. Payment default on any financial obligation, rated or unrated, other than a financial obligation subject
to legitimate commercial dispute
2. Voluntary bankruptcy filing or similar action
3. Seizure of the bank by a regulator if the issuer is a bank
4. Placement under regulatory supervision because of its financial status if the issuer is an insurance company
Prior to September 1, 1998 (S&P Commercial Paper Rating – Current) This item represents the issuer commercial paper rating which has been assigned to a company by Standard & Poor's. An S&P commercial paper rating is a current assessment of the likelihood of timely payment of debt that has an original maturity of no more than 365 days.

Research Insight North America Data Guide
52
A commercial paper rating is not a recommendation to purchase, sell, or hold a security inasmuch as it does not comment as to market price or suitability for a particular investor. The ratings are based on current information furnished to Standard & Poor's from other sources that it considers reliable. S&P does not perform an audit in connection with any rating and may, on occasion, rely on unaudited financial information. The ratings may be changed, suspended, or withdrawn as a result of changes in, or unavailability of, such information, or based on other circumstances.
Standard & Poor's defines current as the close of business on the day prior to the update cut-off for weekly productions and two days prior to the last trading day for monthly productions.
Standard & Poor's grades ratings into several categories ranging from "A1" (the highest quality obligation) to "D" (the lowest quality obligation). Standard & Poor's assigns codes that correspond to the S&P Commercial Paper Rating Categories . . . 53.
S&P Domestic Short-Term Issuer Credit Rating - Monthly Mnemonic SPCPRM
Units Code
As of September 1, 1998
The Standard & Poor’s Issuer Credit Rating (ICR) is a current opinion of an issuer’s overall creditworthiness, apart from its ability to repay individual obligations. This opinion focuses on the obligor’s capacity and willingness to meet its short-term financial commitments (those with maturities of one year or less) as they come due. You can use this monthly item to find the rating for a specified month and year.
In the case of non-U.S. companies, the ICR is based on the local currency from the country of origin. Local currency credit ratings incorporate the critical consideration of country risks.
Short-term ICR’s range from A1 (strong capacity to meet financial obligations) to C (currently vulnerable). See also: List of Short-Term Issuer Credit Ratings . . . 49
The ICR is not a recommendation to purchase, sell, or hold a financial obligation issued by an obligor, as it does not comment on market price or suitability for a particular investor.
An ICR is withdrawn upon the first occurrence of any of the following: 1. Payment default on any financial obligation, rated or unrated, other than a financial obligation subject
to legitimate commercial dispute
2. Voluntary bankruptcy filing or similar action
3. Seizure of the bank by a regulator if the issuer is a bank
4. Placement under regulatory supervision because of its financial status if the issuer is an insurance company
Prior to September 1, 1998 (S&P Commercial Paper Rating – Monthly) This item represents the issuer commercial paper rating which has been assigned to a company by Standard & Poor's. An S&P commercial paper rating is a current assessment of the likelihood of timely payment of debt that has an original maturity of no more than 365 days.
A commercial paper rating is not a recommendation to purchase, sell, or hold a security inasmuch as it does not comment as to market price or suitability for a particular investor. The ratings are based on current information furnished to Standard & Poor's from other sources that it considers reliable. S&P does not perform an audit in connection with any rating and may, on occasion, rely on unaudited financial information. The ratings may be changed, suspended, or withdrawn as a result of changes in, or unavailability of, such information, or based on other circumstances.
Standard & Poor's defines current as the close of business on the day prior to the update cut-off for weekly productions and two days prior to the last trading day for monthly productions.

53
Chapter 2 Company Specifics
Standard & Poor's grades ratings into several categories ranging from "A1" (the highest quality obligation) to "D" (the lowest quality obligation). Standard & Poor's assigns codes that correspond to the actual S&P commercial paper rating categories . . . 53.
S&P Domestic Long-Term Issuer Credit Rating - Current Mnemonic SPDRC
Units Code
As of September 1, 1998
The Standard & Poor’s Issuer Credit Rating (ICR) is a current opinion of an issuer’s overall creditworthiness, apart from its ability to repay individual obligations. This opinion focuses on the obligor’s capacity and willingness to meet its long-term financial commitments (those with maturities of more than one year) as they come due. This item represents the current rating assigned to the company by S & P.
In the case of non-U.S. companies, the ICR is based on the local currency from the country of origin. Local currency credit ratings incorporate the critical consideration of country risks.
See the complete list of Issuer Credit Ratings.
The ICR is not a recommendation to purchase, sell, or hold a financial obligation issued by an obligor, as it does not comment on market price or suitability for a particular investor.
An ICR is withdrawn upon the first occurrence of any of the following: 1. Payment default on any financial obligation, rated or unrated, other than a financial obligation subject
to legitimate commercial dispute
2. Voluntary bankruptcy filing or similar action
3. Seizure of the bank by a regulator if the issuer is a bank
4. Placement under regulatory supervision because of its financial status if the issuer is an insurance company
Prior to September 1, 1998: S&P Senior Debt Rating – Current This item represents the issuer senior debt rating that has been assigned to a company by Standard & Poor's. An S&P corporate debt rating is a current assessment of the creditworthiness of an obligor with respect to a senior or subordinated debt obligation. This assessment may take into consideration obligors such as guarantors, insurers, or lessees.
Senior debt represents long-term debt issues that are not subordinate to any other long-term debt issues.
Standard & Poor's defines "current" as the close of business on the day prior to the weekly production date and two days prior to the monthly production date.
A debt rating is not a recommendation to purchase, sell, or hold a security inasmuch as it does not comment as to market price or suitability for a particular investor. The ratings are based on current information furnished to Standard & Poor's from the issuer or other sources that it considers reliable. S&P does not perform an audit in connection with any rating and may, on occasion, rely on unaudited financial information. The ratings may be changed, suspended, or withdrawn as a result of changes in, or unavailability of, such information, or based on other circumstances.
Standard & Poor's bases the ratings, in varying degrees, on the following considerations... 1. Likelihood of default (the capacity and willingness of the obligor as to the timely payment of interest
and repayment of principal in accordance with the terms of the obligation.)
2. Nature of and provisions of the obligation.

Research Insight North America Data Guide
54
3. Protection afforded by, and relative position of, the obligation in the event of bankruptcy, reorganization, or other arrangement under the laws of bankruptcy and other laws affecting creditors' rights.
Under present commercial bank regulations issued by the Comptroller of the Currency, bonds rated in the top four categories ("AAA," "AA," "A," and "BBB") are commonly known as investment grade ratings and generally are regarded as eligible for bank investment. In addition, the laws of various states governing legal investments impose certain rating or other standards for obligations eligible for investment by savings banks, trust companies, insurance companies, and fiduciaries.
Debt obligations of issuers outside of the United States and its territories are rated on the same basis as domestic corporate and municipal issues. The ratings measure the creditworthiness of the obligor but do not take into account the currency exchange or related uncertainties.
To provide more detailed indications of credit quality, S&P may modify ratings from "AA" to "CCC" with the addition of a plus sign (+) or minus sign (-) to show relative standing within the senior debt rating categories . . . 62.
S&P Domestic Long-Term Issuer Credit Rating - Monthly Mnemonic SPDRM
Units Code
As of September 1, 1998
The Standard & Poor’s Issuer Credit Rating (ICR) is a current opinion of an issuer’s overall creditworthiness, apart from its ability to repay individual obligations. This opinion focuses on the obligor’s capacity and willingness to meet its long-term financial commitments (those with maturities of more than one year) as they come due. You can use this monthly item to find the rating for a specified month and year.
In the case of non-U.S. companies, the ICR is based on the local currency from the country of origin. Local currency credit ratings incorporate the critical consideration of country risks.
See the complete list of Issuer Credit Ratings . . . 49.
The ICR is not a recommendation to purchase, sell, or hold a financial obligation issued by an obligor, as it does not comment on market price or suitability for a particular investor.
An ICR is withdrawn upon the first occurrence of any of the following: 1. Payment default on any financial obligation, rated or unrated, other than a financial obligation subject
to legitimate commercial dispute
2. Voluntary bankruptcy filing or similar action
3. Seizure of the bank by a regulator if the issuer is a bank
4. Placement under regulatory supervision because of its financial status if the issuer is an insurance company
Prior to September 1, 1998: S&P Senior Debt Rating – Monthly This item represents the issuer senior debt rating that has been assigned to a company by Standard & Poor's. An S&P corporate debt rating is a current assessment of the creditworthiness of an obligor with respect to a senior or subordinated debt obligation. This assessment may take into consideration obligors such as guarantors, insurers, or lessees.
Senior debt represents long-term debt issues that are not subordinate to any other long-term debt issues.

55
Chapter 2 Company Specifics
Standard & Poor's defines "current" as the close of business on the day prior to the weekly production date and two days prior to the monthly production date.
A debt rating is not a recommendation to purchase, sell, or hold a security inasmuch as it does not comment as to market price or suitability for a particular investor. The ratings are based on current information furnished to Standard & Poor's from the issuer or other sources that it considers reliable. S&P does not perform an audit in connection with any rating and may, on occasion, rely on unaudited financial information. The ratings may be changed, suspended, or withdrawn as a result of changes in, or unavailability of, such information, or based on other circumstances.
Standard & Poor's bases the ratings, in varying degrees, on the following considerations ... 1. Likelihood of default (the capacity and willingness of the obligor as to the timely payment of interest
and repayment of principal in accordance with the terms of the obligation.)
2. Nature of and provisions of the obligation.
3. Protection afforded by, and relative position of, the obligation in the event of bankruptcy, reorganization, or other arrangement under the laws of bankruptcy and other laws affecting creditors' rights.
Under present commercial bank regulations issued by the Comptroller of the Currency, bonds rated in the top four categories ("AAA," "AA," "A," and "BBB") are commonly known as investment grade ratings and generally are regarded as eligible for bank investment. In addition, the laws of various states governing legal investments impose certain rating or other standards for obligations eligible for investment by savings banks, trust companies, insurance companies, and fiduciaries.
Debt obligations of issuers outside of the United States and its territories are rated on the same basis as domestic corporate and municipal issues. The ratings measure the creditworthiness of the obligor but do not take into account the currency exchange or related uncertainties.
To provide more detailed indications of credit quality, S&P may modify ratings from "AA" to "CCC" with the addition of a plus sign (+) or minus sign (-) to show relative standing within the senior debt rating categories . . . 62.
S&P Index Code - Current Mnemonic SPMIX
Units Code
The following codes identify the corresponding index constituents:
Code Index Name
10 S&P 500 (S&P Industrials prior to 1/1/2002)
91 S&P MidCap 400
92 S&P SmallCap 600
(blank) not in a subset S&P Index
S&P Index Code - Historical Mnemonic SPMI
Units Code

Research Insight North America Data Guide
56
The following codes identify the corresponding index constituents. Beginning January 1, 2002, the indexes were reclassified. Only the codes 10, 91 and 92 continue to exist. History was reclassified back to December 31, 1994.
Code Index Name
10 S&P 500 (S&P Industrials prior to 1/1/2002)
40** S&P Transportation
49** S&P Utilities
60** S&P Financial
90** S&P 500 Supplementary
91 S&P MidCap 400
92 S&P SmallCap 600
(blank) not in a subset S&P Index
**This code discontinued after 12/31/93.
S&P Index Code - Monthly Mnemonic SPMIM
Concept calculation @ELEMENT(SPIDXM,2)
Units Code
The following codes identify the corresponding index constituents of any given month. Beginning January 1, 2002, the indexes were reclassified. Only the codes 10, 91 and 92 continue to exist. History was reclassified back to December 31, 1994.
Code Index Name
10 S&P 500 (S&P Industrials prior to 1/1/2002)
40** S&P Transportation
49** S&P Utilities
60** S&P Financial
91 S&P MidCap 400
92 S&P SmallCap 600
(blank) not in a subset S&P Index
**This code discontinued after 12/31/93.
S&P Industry Index Code - Current Mnemonic SPIIX
Annual Data Item 276
Units Code

57
Chapter 2 Company Specifics
This item is a three or four-digit code used to identify the industry group to which a company is assigned in the current year.
The codes are similar to the Economic Sector Codes (ECNSEC) and the Industry Sector Codes (SECTOR); however, Economic Sector Codes categorize every company in the Industrial database ($C), Canadian database ($T), and Index database ($I) into one of eleven broad economic groups, and Industry Sector Codes further refine each classification into a more specific industry group. Only companies that are members of the S&P Super Composite Index (Industrial, Utilities, Transportation, Financial and the S&P 500) will have a value for the S&P Industry Index Code – Current (SPIIX); all others will contain a Not Available data code (@NA).
S&P Industry Index Code - Historical Mnemonic SPII
Annual Data Item 277
Units Code
This 4-digit code identifies the particular industry grouping to which an S&P Major Index company is assigned. All companies in the S&P Industrial, Utilities, Transportation, Financial, and S&P 500 Supplementary Indexes have S&P Industry Index Codes.
This item is reported as of December month-end. To determine a company's current industry index assignment, check the S&P Industry Index Relative Code.
The industry classification for these codes will be modified with respect to GICS at the Sub-Industries level. The history was reclassified back to December 31, 1994. The codes prior to 1994 will be on the old S&P classification structure.
S&P Industry Index Code - Monthly Mnemonic SPIIM
Units Code
This 4-digit code identifies the particular industry grouping to which an S&P Major Index company is assigned. All companies in the S&P Industrial, Utilities, Transportation, Financial, and S&P 500 Supplementary Indexes have S&P Industry Index Codes.
To determine a company's current industry index assignment, check the S&P Industry Index Relative Code.
The industry classification for these codes will be modified with respect to GICS at the sub-industries level. The history was reclassified back to December 31, 1994. The codes prior to 1994 will be on the old S&P classification structure.
S&P Quality Ranking - Monthly Mnemonic SPCSRM

Research Insight North America Data Guide
58
Units Code
This item is an appraisal of past performance of a stock's earnings and dividends and the stock's relative standing as of a company's current fiscal year-end. Growth and stability of earnings and dividends are key elements in establishing Standard & Poor's earnings and dividends rankings for common stocks.
Standard & Poor's uses a computerized scoring system to compute basic scores for earnings and dividends, then adjusts the scores by a set of predetermined modifiers for growth, stability within long-term trend, and cyclicality. Adjusted scores for earnings and dividends are combined to yield a final score. The final score for each stock is measured against a scoring matrix determined by analyzing the scores of a large representative sample of stocks. Standard & Poor's codes, description of rankings, and the S&P ranking are presented below.
Code Description Ranking
7 Highest A+
8 High A
9 Above Average A-
16 Average B+
17 Below Average B
18 Lower B-
21 Lowest C
22 In Reorganization D
99 Liquidation LIQ
Standard & Poor's does not consider these rankings to be market recommendations.
S&P Senior Debt Rating Categories Standard & Poor's assigns the following codes to correspond with the actual S&P debt rating categories:
Code Rating Description
1 Unassigned
2 AAA "AAA" indicates the highest rating assigned by Standard & Poor's. Capacity to pay interest and repay principal is extremely strong.
3 Unassigned
4
5
6
AA+
AA
AA-
"AA" indicates a very strong capacity to pay interest and repay , and differs from the higher rated issues only in small degree.

59
Chapter 2 Company Specifics
7
8
9
A+
A
A-
"A" indicates a strong capacity to pay interest and repay principal, although it is somewhat more susceptible to adverse effects of changes in circumstances and economic conditions than debt in higher rated categories.
10
11
12
BBB+
BBB
BBB-
"BBB" indicates an adequate capacity to pay interest and repay principal. Although it normally exhibits adequate protection parameters, adverse economic conditions or changing circumstances are more likely to lead to a weakened capacity to pay interest and repay principal than debt in higher rated categories.
13
14
15
BB+
BB
BB-
"BB" indicates less near-term vulnerability to default that other speculative issues. However, it faces major ongoing uncertainties or exposure to adverse business, financial, or economic conditions which could lead to inadequate capacity to meet timely interest and principal payments. S&P also uses the "BB" rating category for debt subordinated to senior debt that is assigned an actual or implied "BBB-" rating.
16
17
18
B+
B
B-
"B" indicates a greater vulnerability to default but currently has the capacity to meet interest payments and principal repayments. Adverse business, financial, or economic conditions will likely impair capacity or willingness to pay interest and repay principal. S&P also uses the "B" rating category to debt subordinated to senior debt that is assigned an actual or implied "BB" or "BB-" rating.
19
20
21
CCC+
CCC
CCC-
"CCC" indicates a current identifiable vulnerability to default, and is dependent upon favorable business, financial, and economic conditions to meet timely payment of interest and repayment of principal. In the event of adverse business, financial, or economic conditions, it is not likely to have the capacity to pay interest and repay principal. S&P also assigns the "CCC" rating category to debt subordinated to senior debt that is assigned an actual or implied "B" or "B-" rating.
22 Unassigned

Research Insight North America Data Guide
60
23 CC "CC" is typically applied to debt subordinated to senior debt that is assigned an actual or implied "CCC" rating.
24 C "C" is typically applied to debt subordinated to senior debt that is assigned an actual or implied "CCC-" rating. S&P also uses the "C" rating to cover a situation where a bankruptcy petition has been filed, but debt service payments are continued.
25 Unassigned
26 CI "CI" is reserved for income bonds on which no interest is being paid.
27 D "D" indicates that payment is in default. S&P uses the "D" rating category when interest payments or principal payments are not made on the date due even if the applicable grace period has not expired, unless S&P believes that such payments will be made during such grace periods. S&P also uses the "D" rating upon the filing of a bankruptcy petition if debt service payments are jeopardized.
28 Not Meaningful
90 Suspended S&P suspended the bond rating on a class of debt.
S&P Senior Debt Rating - Current -Note Mnemonic SPDRCF
Code Description
GQ The latest available S&P Senior Debt Rating is implied even though the company does not actually have outstanding senior debt issues.
S&P Senior Debt Rating Monthly - Note Mnemonic SPDRMF

61
Chapter 2 Company Specifics
Code Description
GQ The latest available S&P Senior Debt Rating is implied even though the company does not actually have outstanding senior debt issues.
S&P Subordinated Debt Rating - Monthly Mnemonic SPSDRM
Units Code
Prior to September 1, 1998:
This item represents the issuer subordinated debt rating that has been assigned to a company by Standard & Poor's. An S&P corporate debt rating is a current assessment of the creditworthiness of an obligor with respect to a senior or subordinated debt obligation. This assessment may take into consideration obligors such as guarantors, insurers, or lessees.
Subordinated debt represents long-term debt issues with claims to interest and principal that are subordinate to that of ordinary debt.
Standard & Poor's defines "current" as the close of business on the day prior to the weekly production date and two days prior to the monthly production date.
A debt rating is not a recommendation to purchase, sell, or hold a security inasmuch as it does not comment as to market price or suitability for a particular investor. The ratings are based on current information furnished to Standard & Poor's from the issuer or other sources that it considers reliable. S&P does not perform an audit in connection with any rating and may, on occasion, rely on unaudited financial information. The ratings may be changed, suspended, or withdrawn as a result of changes in, or unavailability of, such information, or based on other circumstances.
Standard & Poor's bases the ratings, in varying degrees, on the following considerations ... 1. Likelihood of default (the capacity and willingness of the obligor as to the timely payment of interest
and repayment of principal in accordance with the terms of the obligation.)
2. Nature of and provisions of the obligation.
3. Protection afforded by, and relative position of, the obligation in the event of bankruptcy, reorganization, or other arrangement under the laws of bankruptcy and other laws affecting creditors' rights.
Under present commercial bank regulations issued by the Comptroller of the Currency, bonds rated in the top four categories ("AAA," "AA," "A," and "BBB") are commonly known as investment grade ratings and generally are regarded as eligible for bank investment. In addition, the laws of various states governing legal investments impose certain rating or other standards for obligations eligible for investment by savings banks, trust companies, insurance companies, and fiduciaries.
Debt obligations of issuers outside of the United States and its territories are rated on the same basis as domestic corporate and municipal issues. The ratings measure the creditworthiness of the obligor but do not take into account the currency exchange or related uncertainties.
To provide more detailed indications of credit quality, S&P may modify ratings from "AA" to "CCC" with the addition of a plus sign (+) or minus sign (-) to show relative standing within the major debt rating categories. Standard & Poor's assigns the following codes to correspond with the actual S&P debt rating categories:

Research Insight North America Data Guide
62
Code Rating Description
1 Unassigned
2 AAA "AAA" indicates the highest rating assigned by Standard & Poor's. Capacity to pay interest and repay principal is extremely strong.
3 Unassigned
4
5
6
AA+
AA
AA-
"AA" indicates a very strong capacity to pay interest and repay , and differs from the higher rated issues only in small degree.
7
8
9
A+
A
A-
"A" indicates a strong capacity to pay interest and repay principal, although it is somewhat more susceptible to adverse effects of changes in circumstances and economic conditions than debt in higher rated categories.
10
11
12
BBB+
BBB
BBB-
"BBB" indicates an adequate capacity to pay interest and repay principal. Although it normally exhibits adequate protection parameters, adverse economic conditions or changing circumstances are more likely to lead to a weakened capacity to pay interest and repay principal than debt in higher rated categories.
13
14
15
BB+
BB
BB-
"BB" indicates less near-term vulnerability to default that other speculative issues. However, it faces major ongoing uncertainties or exposure to adverse business, financial, or economic conditions which could lead to inadequate capacity to meet timely interest and principal payments. S&P also uses the "BB" rating category for debt subordinated to senior debt that is assigned an actual or implied "BBB-" rating.
16
17
18
B+
B
B-
"B" indicates a greater vulnerability to default but currently has the capacity to meet interest payments and principal repayments. Adverse business, financial, or economic conditions will likely impair capacity or willingness to pay interest and repay principal. S&P also uses the "B" rating category to debt subordinated to senior debt that is assigned an actual or implied "BB" or "BB-" rating.

63
Chapter 2 Company Specifics
19
20
21
CCC+
CCC
CCC-
"CCC" indicates a current identifiable vulnerability to default, and is dependent upon favorable business, financial, and economic conditions to meet timely payment of interest and repayment of principal. In the event of adverse business, financial, or economic conditions, it is not likely to have the capacity to pay interest and repay principal. S&P also assigns the "CCC" rating category to debt subordinated to senior debt that is assigned an actual or implied "B" or "B-" rating.
22 Unassigned
23 CC "CC" is typically applied to debt subordinated to senior debt that is assigned an actual or implied "CCC" rating.
24 C "C" is typically applied to debt subordinated to senior debt that is assigned an actual or implied "CCC-" rating. S&P also uses the "C" rating to cover a situation where a bankruptcy petition has been filed, but debt service payments are continued.
25 Unassigned
26 CI "CI" is reserved for income bonds on which no interest is being paid.
27 D "D" indicates that payment is in default. S&P uses the "D" rating category when interest payments or principal payments are not made on the date due even if the applicable grace period has not expired, unless S&P believes that such payments will be made during such grace periods. S&P also uses the "D" rating upon the filing of a bankruptcy petition if debt service payments are jeopardized.
28 Not Meaningful
29 SD Selective Default
90 Suspended S&P suspended the bond rating on a class of debt.
S&P Subordinated Debt Rating - Current Mnemonic SPSDRC
Units Code

Research Insight North America Data Guide
64
Prior to September 1, 1998:
This item represents the issuer subordinated debt rating that has been assigned to a company by Standard & Poor's. An S&P corporate debt rating is a current assessment of the creditworthiness of an obligor with respect to a senior or subordinated debt obligation. This assessment may take into consideration obligors such as guarantors, insurers, or lessees.
Subordinated debt represents long-term debt issues with claims to interest and principal that are subordinate to that of ordinary debt.
Standard & Poor's defines "current" as the close of business on the day prior to the weekly production date and two days prior to the monthly production date.
A debt rating is not a recommendation to purchase, sell, or hold a security inasmuch as it does not comment as to market price or suitability for a particular investor. The ratings are based on current information furnished to Standard & Poor's from the issuer or other sources that it considers reliable. S&P does not perform an audit in connection with any rating and may, on occasion, rely on unaudited financial information. The ratings may be changed, suspended, or withdrawn as a result of changes in, or unavailability of, such information, or based on other circumstances.
Standard & Poor's bases the ratings, in varying degrees, on the following considerations ... 1. Likelihood of default (the capacity and willingness of the obligor as to the timely payment of interest
and repayment of principal in accordance with the terms of the obligation.)
2. Nature of and provisions of the obligation.
3. Protection afforded by, and relative position of, the obligation in the event of bankruptcy, reorganization, or other arrangement under the laws of bankruptcy and other laws affecting creditors' rights.
Under present commercial bank regulations issued by the Comptroller of the Currency, bonds rated in the top four categories ("AAA," "AA," "A," and "BBB") are commonly known as investment grade ratings and generally are regarded as eligible for bank investment. In addition, the laws of various states governing legal investments impose certain rating or other standards for obligations eligible for investment by savings banks, trust companies, insurance companies, and fiduciaries.
Debt obligations of issuers outside of the United States and its territories are rated on the same basis as domestic corporate and municipal issues. The ratings measure the creditworthiness of the obligor but do not take into account the currency exchange or related uncertainties.
To provide more detailed indications of credit quality, S&P may modify ratings from "AA" to "CCC" with the addition of a plus sign (+) or minus sign (-) to show relative standing within the major debt rating categories. Standard & Poor's assigns the following codes to correspond with the actual S&P debt rating categories:
Code Rating Description
1 Unassigned
2 AAA "AAA" indicates the highest rating assigned by Standard & Poor's. Capacity to pay interest and repay principal is extremely strong.
3 Unassigned
4
5
6
AA+
AA
AA-
"AA" indicates a very strong capacity to pay interest and repay , and differs from the higher rated issues only in small degree.

65
Chapter 2 Company Specifics
7
8
9
A+
A
A-
"A" indicates a strong capacity to pay interest and repay principal, although it is somewhat more susceptible to adverse effects of changes in circumstances and economic conditions than debt in higher rated categories.
10
11
12
BBB+
BBB
BBB-
"BBB" indicates an adequate capacity to pay interest and repay principal. Although it normally exhibits adequate protection parameters, adverse economic conditions or changing circumstances are more likely to lead to a weakened capacity to pay interest and repay principal than debt in higher rated categories.
13
14
15
BB+
BB
BB-
"BB" indicates less near-term vulnerability to default that other speculative issues. However, it faces major ongoing uncertainties or exposure to adverse business, financial, or economic conditions which could lead to inadequate capacity to meet timely interest and principal payments. S&P also uses the "BB" rating category for debt subordinated to senior debt that is assigned an actual or implied "BBB-" rating.
16
17
18
B+
B
B-
"B" indicates a greater vulnerability to default but currently has the capacity to meet interest payments and principal repayments. Adverse business, financial, or economic conditions will likely impair capacity or willingness to pay interest and repay principal. S&P also uses the "B" rating category to debt subordinated to senior debt that is assigned an actual or implied "BB" or "BB-" rating.
19
20
21
CCC+
CCC
CCC-
"CCC" indicates a current identifiable vulnerability to default, and is dependent upon favorable business, financial, and economic conditions to meet timely payment of interest and repayment of principal. In the event of adverse business, financial, or economic conditions, it is not likely to have the capacity to pay interest and repay principal. S&P also assigns the "CCC" rating category to debt subordinated to senior debt that is assigned an actual or implied "B" or "B-" rating.
22 Unassigned

Research Insight North America Data Guide
66
23 CC "CC" is typically applied to debt subordinated to senior debt that is assigned an actual or implied "CCC" rating.
24 C "C" is typically applied to debt subordinated to senior debt that is assigned an actual or implied "CCC-" rating. S&P also uses the "C" rating to cover a situation where a bankruptcy petition has been filed, but debt service payments are continued.
25 Unassigned
26 CI "CI" is reserved for income bonds on which no interest is being paid.
27 D "D" indicates that payment is in default. S&P uses the "D" rating category when interest payments or principal payments are not made on the date due even if the applicable grace period has not expired, unless S&P believes that such payments will be made during such grace periods. S&P also uses the "D" rating upon the filing of a bankruptcy petition if debt service payments are jeopardized.
28 Not Meaningful
90 Suspended S&P suspended the bond rating on a class of debt.
State Incorporation Code Mnemonic INCORP
Units Code
The State Incorporation Code indicates the state in which a company is incorporated.
The codes and their meanings are as follows:
Code State Postal Abbreviation
1 Alabama AL
2 Alaska AK
4 Arizona AZ
5 Arkansas AR
6 California CA
8 Colorado CO
9 Connecticut CT
10 Delaware DE

67
Chapter 2 Company Specifics
11 District of Columbia DC
12 Florida FL
13 Georgia GA
15 Hawaii HI
16 Idaho ID
17 Illinois IL
18 Indiana IN
19 Iowa IA
20 Kansas KS
21 Kentucky KY
22 Louisiana LA
23 Maine ME
24 Maryland MD
25 Massachusetts MA
26 Michigan MI
27 Minnesota MN
28 Mississippi MS
29 Missouri MO
30 Montana MT
31 Nebraska NE
32 Nevada NV
33 New Hampshire NH
34 New Jersey NJ
35 New Mexico NM
36 New York NY
37 North Carolina NC
38 North Dakota ND
39 Ohio OH
40 Oklahoma OK
41 Oregon OR
42 Pennsylvania PA
44 Rhode Island RI
45 South Carolina SC
46 South Dakota SD
47 Tennessee TN
48 Texas TX
49 Utah UT

Research Insight North America Data Guide
68
50 Vermont VT
51 Virginia VA
53 Washington WA
54 West Virginia WV
55 Wisconsin WI
56 Wyoming WY
60 American Samoa AS
66 Guam GU
69 Northern Mariana Islands MP
72 Puerto Rico PR
75 Trust Territories
78 Virgin Islands VI
0 Foreign Country
To include a description of the code in a report, use the @DESC function. For example, enter @DESC(INCORP).
State - Primary Location Mnemonic STATE
Units Code
This code conforms to the National Bureau of Standards' Federal Information Processing Standards (FIPS) codes. Under the FIPS classification system, a unique code is assigned to every state in the United States. Standard & Poor's uses this code to identify a company's primary location. Companies whose principal location is in a foreign country are identified by the state equivalent code 99. The codes and their meanings are as follows:
Code State
1 Alabama
2 Alaska
4 Arizona
5 Arkansas
6 California
8 Colorado
9 Connecticut
10 Delaware
11 District of Columbia
12 Florida
13 Georgia

69
Chapter 2 Company Specifics
15 Hawaii
16 Idaho
17 Illinois
18 Indiana
19 Iowa
20 Kansas
21 Kentucky
22 Louisiana
23 Maine
24 Maryland
25 Massachusetts
26 Michigan
27 Minnesota
28 Mississippi
29 Missouri
30 Montana
31 Nebraska
32 Nevada
33 New Hampshire
34 New Jersey
35 New Mexico
36 New York
37 North Carolina
38 North Dakota
39 Ohio
40 Oklahoma
41 Oregon
42 Pennsylvania
44 Rhode Island
45 South Carolina
46 South Dakota
47 Tennessee
48 Texas
49 Utah
50 Vermont
51 Virginia
53 Washington

Research Insight North America Data Guide
70
54 West Virginia
55 Wisconsin
56 Wyoming
60 American Samoa
66 Guam
69 Northern Mariana Islands
72 Puerto Rico
75 Trust Territories
78 Virgin Islands
99 Foreign Country
Stock Exchange Mnemonic EXCHG
Units Code
This code identifies the major exchange on which the company's common stock is traded. The codes are as follows:
Code Stock Exchange
1 New York Stock Exchange
2 American Stock Exchange
3 NASDAQ, including NMS
4 Regional Stock Exchange
5 LBO, Subsidiary or Other
6 Toronto Exchange
7 Montreal Exchange
8 Canadian Venture Exchange
9 Not on Major Exchange (Canadian only)
To include a description of the footnote code in a report, use the @DESC function. For example, enter @DESC(EXCHG).
Stock Ownership Mnemonic STKO
Units Code
This code identifies the ownership of each company.
Code Stock Ownership
0 Publicly traded company

71
Chapter 2 Company Specifics
1 Subsidiary of a publicly traded company
2 Subsidiary of a company that is not publicly traded
3 Company that is publicly traded but not on a major exchange
4 Company has undergone a Leveraged Buyout
Ticker Symbol Mnemonic TIC
Common stock ticker symbols for publicly traded companies on the New York and American Stock Exchanges, and those traded over-the-counter are taken from the S&P Stock Guide. Over-the-counter ticker symbols which are not in the S&P Stock Guide are obtained from the NASDAQ system.
Standard & Poor's has devised pseudo-tickers for certain classes of companies as follows: 1. It is possible for duplicate ticker symbols to exist for companies on the Active ($C) and Research ($R)
databases. If this does occur, the research company will carry a period (.) at the end of the ticker symbol. The active company will carry the ticker symbol obtained from the S&P Stock Guide or the NASDAQ system.
Albany Int'l Corp (active company) ABY
Byers (AM) Co (research company) ABY.
ABC Company (when multiple research companies have the same ABY.1 original ticker symbol, a .1 is added to the end of the ticker symbol of the company most recently inactivated.) 2. Companies which trade a particular class of stock on the New York or American Stock Exchanges
and are followed by Compustat will carry the ticker symbol listed in the S&P Stock Guide. These tickers are composed of the ticker symbol identifying the company, a period (.), and an alpha character. For example:
American Maize Products - C1 A AZE.A
American Petrofina - C1 A API.A
Brown-Forman Distillers - C1 B BFD.B 3. Wholly owned subsidiaries of publicly traded companies will have pseudo-tickers using the following
scheme: Pn where P is the parent company's ticker symbol and n is a unique number identifying a particular subsidiary of that parent.
4. Subsidiaries of companies which have no publicly traded common stock have been assigned pseudo-tickers of four digits followed by an A. For example, 1020A, 1059A, etc.
5. Publicly held companies trading common stock but not on the NYSE, ASE, NASDAQ, or regional exchange are assigned pseudo-tickers of four digits followed by a B. For example, 1015B, 1064B, etc.
6. It is possible for companies trading in Canada to have the same ticker symbol as a company trading in the U.S. Therefore, in order to provide unique ticker symbols for all in Research Insight, Standard & Poor’s has added a period (.) at the end of those Canadian ticker symbols on the Canadian file that have duplicated U.S. ticker symbols. For example:
Barnes Group Inc. (U.S. company) B
BCE Inc. (Canadian company) B.

Research Insight North America Data Guide
72
7. Standard & Poor’s assigns special tickers to companies that have undergone leveraged buyouts but continue to file reports. These tickers consist of four digits followed by a C. For example:
Formica Corp. 6061C 8. Upon introduction of FASB #94, many companies presented both pre- and post-FASB #94 data.
Standard & Poor’s assigns special tickers to companies that present current data that is consistent with historical data. These tickers are followed by a period and an F:
Ford Motor Co. (post-FASB #94) F
Ford Motor Co. (pre-FASB #94) F.F 9. Companies trading Pink Sheets or Over-the-Counter (OTC) Bulletin Board are assigned a ticker by
the NASDAQ system. Standard & Poor’s precedes this ticker with the number 3, for example:
Allstar Inns 3ALST
Note: Standard & Poor’s also precedes the tickers of delisted companies that formerly traded on NASDAQ with the number 3.
10. Emerging marketplace companies are companies that trade on the American Stock Exchange that were allowed to meet lower requirements than all other companies on the American Stock Exchange. These ticker symbols end in the suffix .EC, for example:
Encore Marketing Int'l Inc. EMI.EC 11. Standard & Poor’s assigns special tickers to companies who are not trading and whose financials
represent consolidated statements of two other divisions who actively trade and file separate financial reports. The ticker is four characters - two characters from one division's ticker symbol and two characters from the other division's ticker symbol - followed by a .CM, for example:
Unilever Combined UNUL.CM
Unilever N V - NY Shares UN
Unilever PLC - Amer Shares UL
1. When a Canadian company ($T) becomes inactive, the ticker symbol is modified by adding an underscore ( _ ) at the end. The ticker symbol will include the underscore until the company is removed from the Canadian File ($T). For example:
AMB. changes to AMB._
2. When a major merger occurs for entities in the S&P 1500, a Pro Forma entity is created in the
database, i.e., the Pro Forma company name ends in -pro forma and the ticker ends with a .P). Standard & Poor’s continues to collect data for both entities as well as the "pro forma merged entity". When the transaction is completed, both the nonsurvivor and the Pro Forma entities are inactivated.
3. For a Canadian Unit (a group of shares) the ticker symbol is followed by a (.U). Acclaim Energy Trust AE.U
Update Code Mnemonic UPD
Units Code

73
Chapter 2 Company Specifics
The Update Code is provided for each year or quarter and may be either 0, 1, 2, or 3.
Code Update
0 Company has not been updated for that year or quarter but may have market-related data available such as prices
1 Companies may have an adjustment figure other than 1.000000
2 Data is preliminary for that year or quarter
3 Data is final for that year or quarter
There will be an Update Code of 0 for those years or quarters before data other than market-related data is available for a company. For example, if a company went public in 1970, all years prior to 1970 would have a 0 update code. A "1" update code indicates that the company has not been updated for a given year or quarter and that the only data available will be the Adjustment Factor (Cumulative) and, in some cases, market data such as price and/or dividend information. A "2" update code indicates that the company has been updated from a preliminary source, but data is still not available which is expected to become available or has historically been available. A "3" update code indicates that the company has been updated from its final source (usually the 10K or 10Q), and no further data will be available.
To include a description of the code in a report, use the @DESC function. For example, enter @DESC(UPD).
Update Code - Quarterly Mnemonic UPDQ
Units Code
The Update Code is provided for each year or quarter and may be either 0, 1, 2, or 3.
Code Update
0 Company has not been updated for that year or quarter but may have market-related data available such as prices
1 Companies may have an adjustment figure other than 1.000000
2 Data is preliminary for that year or quarter
3 Data is final for that year or quarter
There will be an Update Code of 0 for those years or quarters before data other than market-related data is available for a company. For example, if a company went public in 1970, all years prior to 1970 would have a 0 update code. A "1" update code indicates that the company has not been updated for a given year or quarter and that the only data available will be the Adjustment Factor (Cumulative) and, in some cases, market data such as price and/or dividend information. A "2" update code indicates that the company has been updated from a preliminary source, but data is still not available which is expected to become available or has historically been available. A "3" update code indicates that the company has been updated from its final source (usually the 10K or 10Q), and no further data will be available.
To include a description of the code in a report, use the @DESC function. For example, enter @DESC(UPDQ).

Research Insight North America Data Guide
74
Value/Growth Indicator Mnemonic VALGROW
Units Code
This item compares a company’s price-to-book ratio to the median price-to-book ratio for its industry sector. The median is calculated using all active U.S. companies in the COMPUSTAT database. If the company’s ratio is greater than or equal to the industry median, it is classified as a growth stock. If the company’s ratio is less than the industry median, it is classified as a value stock. If MKBK is @NA or the industry’s median is @NA, this item will return @NA.
Code Description
0 Value
1 Growth

75
Chapter 3 Balance Sheet
Balance Sheet
This chapter presents data definitions for fundamental balance sheet data collected from companies' annual reports. You'll find definitions for data shown in the following statement model.
The basic balance sheet model provides a detailed presentation of various line items. Where available, items that comprise a specific line item are indented below the item to which they apply.
Assets
Data Item Name
Annual Mnemonic . . . page
Quarterly Mnemonic . . . page
Cash and Equivalents CHE . . . 97 CHEQ . . . 98 Cash CH . . . 96 Short-Term Investments IVST . . . 142 Receivables - Total RECT . . . 136 RECTQ . . . 137 Receivables - Trade RECTR . . . 139
Income Tax Refund TXR . . . 110 Receivables - Current - Other RECCO . . . 135 Inventories - Total INVT . . . 113 INVTQ . . . 114 Current Assets - Other ACO . . . 101 ACOQ . . . 102 Prepaid Expense XPP . . . 126 Current Assets - Other - Excl Prepaid Expense
ACOX . . . 102
Current Assets - Total ACT . . . 103 ACTQ . . . 103 Property, Plant and Equipment (Net) - Total
PPENT . . . 130 PPENTQ . . . 132
Accumulated Depreciation, Depletion and Amort.
DPACT . . . 86 DPACTQ . . . 86
Property, Plant and Equipment (Gross) Total
PPEGT . . . 127 PPEGTQ . . . 129
Investments and Advances - Equity Method
IVAEQ . . . 116
Investments and Advances - Other IVAO . . . 117 Intangibles INTAN . . . 112
Assets - Other AO . . . 87 AOQ . . . 89 Deferred Charges DC . . . 108
CHAPTER 3

Research Insight North America Data Guide
76
Assets - Other - Excluding Deferred Charges
AOX . . . 91
Assets - Total AT . . . 92 ATQ . . . 93
Liabilities
Data Item Name
Annual Mnemonic . . . page
Quarterly Mnemonic . . . page
Debt in Current Liabilities DLC . . . 107 DLCQ . . . 108 Notes Payable NP . . . 123 Debt Due in 1st Year DD1 . . . 107 Accounts Payable AP . . . 83 APQ . . . 84 Income Taxes Payable TXP . . . 111 TXPQ . . . 111 Current Liabilities - Other LCO . . . 103 LCOQ . . . 103 Accrued Expense XACC . . . 85 Current Liabilities - Other Excl. Accrued Expense
LCOX . . . 105
Current Liabilities - Total LCT . . . 106 LCTQ . . . 106 Long-Term Debt - Total DLTT . . . 120 DLTTQ . . . 121 Debt - Total DT . . . 106 DTQ . . . 107 Liabilities - Other LO . . . 118 LOQ . . . 119 Deferred Taxes and Investment Tax Credit
TXDITC . . . 110 TXDITQ . . . 110
Deferred Taxes TXDB . . . 109 Investment Tax Credit ITCB . . . 116 Minority Interest MIB . . . 122 MIBQ . . . 122 Liabilities - Total LT . . . 119 LTQ . . . 120 Stockholders' Equity SEQ . . . 143 SEQQ . . . 143 Preferred Stock - Total PSTK . . . 123 PSTKQ . . . 124 Preferred Stock - Redeemable PSTKR . . . 125 PSTKRQ . . . 126 Preferred Stock - Nonredeemable PSTKN . . . 125 Common Equity - Total CEQ . . . 98 CEQQ . . . 99 Common Stock CSTK . . . 99 CSTKQ . . . 100 Capital Surplus CAPS . . . 94 CAPSQ . . . 95 Retained Earnings RE . . . 139 REQ . . . 140 Treasury Stock - Total Dollar Amount TSTK . . . 143 TSTKQ . . . 144 Liabilities and Stockholders' Equity - Total AT . . . 92 ATQ . . . 93

77
Chapter 3 Balance Sheet
Data Definitions
Accounts Payable Mnemonic AP
Data Item Number A70
Units Millions of dollars
This item represents only trade obligations due within one year or the normal operating cycle of the company.
This item includes: 1. Accounts and notes payable when listed together
2. Accounts payable due to unconsolidated subsidiaries (such as, affiliates)
3. Banks and savings and loans’ total deposits
4. Brokerage houses’ accounts payable to brokers, dealers, and clients
5. Oil and gas companies’ production proceeds payable
6. Trade acceptances
7. Trade accounts payable not yet billed (when included as current)
8. Trade notes payable
9. Checks outstanding unless presented net of cash or in excess of cash
This item excludes 1. Accounts due to factors (included in Current Liabilities – Other) (LCO)
2. Accounts payable to parents and consolidated subsidiaries (included in Current Liabilities – Other) (LCO)
3. Oil and gas companies’ production payables (included in Current Liabilities – Other) (LCO)
4. Other accounts payable (included in Current Liabilities – Other) (LCO)
5. Notes payable when listed separately (unless specified as trade) (included in Current Liabilities – Other) (LCO)
A Combined Figure data code (@CF) is entered if this item is combined with one or more of the following data items:
Current Liabilities – Other (LCO)
Current Liabilities – Other – Excluding Accrued Expense (LCOX)
Accounts Payable - Note Mnemonic APF
Code Description BK includes other expenses

Research Insight North America Data Guide
78
The descriptions for these codes can be viewed by choosing the Databases » Descriptions command from the menu bar and entering the mnemonic in the Item text box. To include a textual description of a code in a report, you can use the @DESC function. For example, to include a description of this footnote, type @DESC (APF).
Accounts Payable - Quarterly Mnemonic APQ
Data Item Number Q46
Units Millions of dollars
This item represents only trade obligations due within one year or the normal operating cycle of the company.
This item includes: 1. Accounts and notes payable when listed together
2. Accounts payable due to unconsolidated subsidiaries (such as, affiliates)
3. Banks and savings and loans’ total deposits
4. Brokerage houses’ accounts payable to brokers, dealers, and clients
5. Oil and gas companies’ production proceeds payable
6. Trade acceptances
7. Trade accounts payable not yet billed (when included as current)
8. Trade notes payable
9. Checks outstanding unless presented net of cash or in excess of cash
This item excludes 1. Accounts due to factors (included in Current Liabilities – Other) (LCOQ)
2. Accounts payable to parents and consolidated subsidiaries (included in Current Liabilities – Other) (LCOQ)
3. Oil and gas companies’ production payables (included in Current Liabilities – Other) (LCOQ)
4. Other accounts payable (included in Current Liabilities – Other) (LCOQ)
5. Notes payable when listed separately (unless specified as trade) (included in Current Liabilities – Other) (LCOQ)
A Combined Figure data code (@CF) is entered if this item is combined with Current Liabilities – Other (LCOQ).
Accounts Payable - Quarterly - Note Mnemonic APQF
Code Description BK Includes other expenses

79
Chapter 3 Balance Sheet
The descriptions for these codes can be viewed by choosing the Databases » Descriptions command from the menu bar and entering the mnemonic in the Item text box. To include a textual description of a code in a report, you can use the @DESC function. For example, to include a description of this footnote, type @DESC (APQF).
Accrued Expenses Mnemonic XACC
Data Item Number A153
Units Millions of dollars
This item represents expenses incurred with the passage of time.
This item includes: 1. Accrued costs on contracts
2. Accrued liabilities
3. Accrued taxes (when income taxes are reported separately)
4. Advertising
5. Commissions
6. Employee withholding
7. Interest payable reported as a separate line item
8. Pensions
9. Rents
10. Royalties
11. Salaries
12. Sales taxes (state and local)
13. Warranties
This item excludes 1. Accrued income taxes (included in Income Taxes Payable) (TXP)
2. Accrued taxes (when a separate income tax figure is not reported)
3. Advances
4. Deferred compensation (included in Current Liabilities – Other) (LCO)
5. Deferred credits
6. Deferred taxes (included in Current Liabilities – Other) (LCO)
7. Deposits
8. Interest payable combined with notes payable (included in notes)
9. Other liabilities (included in Current Liabilities – Other) (LCO)
10. Sales taxes when not identified as accrued
A Combined Figure data code (@CF) in this data item indicates that Accrued Expense are included in either Current Liabilities – Other (LCO) or Accounts Payable (AP).

Research Insight North America Data Guide
80
This item is not available for banks.
Accumulated Depreciation, Depletion, and Amortization - Total Mnemonic DPACT
Data Item Number A196
Units Millions of dollars
This item represents the total portion of asset cost written off by periodic depreciation charges since the assets were acquired.
This item includes: 1. Amortization of tangible assets
2. Amortization of tools and dies
3. Depletion
4. Depreciation
5. Reserve for possible future loss on disposals (when included in depreciation and amortization)
This item is not available for banks.
Accumulated Depreciation, Depletion, and Amortization - Total - Note Mnemonic DPACTF
Code Description TB Combination of TC and TS TC Computed using accelerated method TS Computed using straight-line method
The descriptions for these codes can be viewed by choosing the Databases » Descriptions command from the menu bar and entering the mnemonic in the Item text box. To include a textual description of a code in a report, you can use the @DESC function. For example, to include a description of this footnote, type @DESC (DPACTF).
Accumulated Depreciation, Depletion, and Amortization - Total - Quarterly Mnemonic DPACTQ
Data Item Number Q41
Units Millions of dollars
This item represents the total portion of asset cost written off by periodic depreciation charges since the assets were acquired.
This item includes: 1. Amortization of tangible assets
2. Amortization of tools and dies

81
Chapter 3 Balance Sheet
3. Depletion
4. Depreciation
5. Reserve for possible future loss on disposals (when included in depreciation and amortization)
This item is not available for banks.
Accumulated Depreciation, Depletion, and Amortization - Total - Quarterly - Note Mnemonic DPATQF
Code Description ER Does not reflect exact amount of depreciation and
amortization TB Combination of TC and TS TC Computed using accelerated method TS Computed using straight-line method TU Combination of ER and TB TV Combination of ER and TC TX Combination of ER and TS
The descriptions for these codes can be viewed by choosing the Databases » Descriptions command from the menu bar and entering the mnemonic in the Item text box. To include a textual description of a code in a report, you can use the @DESC function. For example, to include a description of this footnote, type @DESC (DPATQF).
Assets - Other Mnemonic AO
Data Item Number A69
Units Millions of dollars
This item represents those long-term assets that are not property, plant and equipment, investments and advances, or intangibles.
This item includes: 1. Acquisition costs
2. Advances to sales staff
3. Amounts due from directors, officers, employees, and principal holders of equity securities other than unconsolidated subsidiaries
4. Assets of discontinued operations
5. Banks and savings and loans’ acceptances and all other assets
6. Broadcasters’ program rights, film productions, film rights
7. Cash on deposit pursuant to loan agreements

Research Insight North America Data Guide
82
8. Cash surrender value of life insurance policies
9. Claims in litigation
10. Computer software, software costs (when not included in property, plant, and equipment on the balance sheet or on Schedules V and VI by the company)
11. Contracts
12. Deferred financing costs
13. Deferred policy costs
14. Deferred taxes
15. Deposits
16. Equity in consolidated joint ventures when held for loan collateral
17. Finance service companies’ deferred finance charges on installment obligations when presented as a deduction from receivables
18. Idle land
19. Investments in a company’s own securities
20. Long-term inventory
21. Long-term prepaid expenses
22. Materials and supplies
23. Minority interest in consolidated subsidiaries
24. Motion picture companies’ film distribution systems
25. Negative goodwill
26. Pension and other special funds
27. Preopening expenses or of discontinued operations
28. Prepaid pension costs (if reported as a separate line item in long-term assets)
29. Property not used in operations or of discontinued operations
30. Publishing and prepublication costs
31. Publishing companies’ royalty advances to authors
32. Purchased technology
33. Restricted cash
34. Start-up costs
35. Stock issuance costs
36. Timberlands other than those owned by forest and paper companies
37. Tooling costs
38. Treasury stock reported on the asset side of the balance sheet
This item excludes 1. All items specifically labeled as intangibles by Standard & Poor's definitions
2. Computer software included in property, plant, and equipment on the balance sheet or on Schedules V and VI by the company

83
Chapter 3 Balance Sheet
3. Prepaid pension costs when included by the company in another item
Assets - Other - Quarterly Mnemonic AOQ
Data Item Number Q43
Units Millions of dollars
This item represents those long-term assets that are not property, plant and equipment. On a quarterly basis, this item will include Investments and Advances – Equity Method, Investments and Advances – Other, Intangibles, Deferred Charges and other long-term assets.
This item includes 1. Acquisition costs (Deferred Charges)
2. Advances to sales staff
3. Amounts due from directors, officers, employees, and principal holders of equity securities other than unconsolidated subsidiaries
4. Assets of discontinued operations
5. Banks and savings and loans’ acceptances and all other assets
6. Banks and savings and loans’ investment securities (available for sale and held for maturity (Investments and Advances – Other)
7. Broadcasters’ program rights, film productions, film rights (Deferred Charges)
8. Cash on deposit pursuant to loan agreements
9. Cash surrender value of life insurance policies
10. Claims in litigation
11. Client lists (Intangibles)
12. Computer software, software costs (when not included in property, plant, and equipment on the balance sheet or on Schedules V and VI by the company)
13. Computer software patent costs (Intangibles)
14. Contracts
15. Copyrights (Intangibles)
16. Costs associated with approved patents (Intangibles)
17. Costs associated with pending patents (Deferred Charges)
18. Covenants not to compete (Intangibles)
19. Debt acquisition costs (Deferred Charges)
20. Debt issuance costs (Deferred Charges)
21. Deferred development costs (Deferred Charges)
22. Deferred financing costs (Deferred Charges)
23. Deferred policy costs (Deferred Charges)
24. Deferred taxes
25. Deposits
26. Design costs (Intangibles)

Research Insight North America Data Guide
84
27. Direct financing leases (when the company is the lessor)(Investments and Advances – Other)
28. Distribution rights and agreements (Intangibles)
29. Easements (gas rights, mineral rights, water rights) (Intangibles)
30. Engineering drawings (Intangibles)
31. Equity in consolidated joint ventures when held for loan collateral
32. Excess of cost or premium of acquisition (except for unconsolidated subsidiaries) (Intangibles)
33. Favorable leases, beneficial lease rights and leasehold interest advantages (Intangibles)
34. Finance service companies’ deferred finance charges on installment obligations when presented as a deduction from receivables
35. Franchise and franchise fees (Intangibles)
36. Goodwill (Intangibles)
37. Idle land
38. Intangible pension assets (Intangibles)
39. Investments and advances to former subsidiaries (Investments and Advances – Other)
40. Investments and advances to subsidiaries to be sold (Investments and Advances – Other)
41. Investments in a company’s own securities
42. Land and property held for resale (for companies whose primary business is not land development) (Investments and Advances – Other)
43. Leasehold expense (when company is the lessee) (Intangibles)
44. Leveraged leases (when the company is the lessor) (Investments and Advances – Other)
45. Long-term inventory
46. Long-term prepaid expenses (Deferred Charges)
47. Long-term receivables (Investments and Advances – Other)
48. Marketable securities (Investments and Advances – Other)
49. Materials and supplies
50. Minority interest in consolidated subsidiaries
51. Motion picture companies’ film distribution systems
52. Negative goodwill
53. Operating rights (Intangibles)
54. Organizational expense (Intangibles)
55. Patent costs (excluding pending patent costs) (Intangibles)
56. Pension and other special funds
57. Preopening expenses or of discontinued operations (Deferred Charges)
58. Prepaid pension costs (if reported as a separate line item in long-term assets)
59. Property not used in operations or of discontinued operations
60. Publication rights (Intangibles)
61. Publishing and prepublication costs (Deferred Charges)

85
Chapter 3 Balance Sheet
62. Publishing companies’ royalty advances to authors (Deferred Charges)
63. Purchased technology
64. Receivables from investments carried at equity (Investments and Advances – Equity Method)
65. Restricted cash
66. Royalty interests (Investments and Advances – Other)
67. Sales-type leases (Investments and Advances – Other)
68. Start-up costs (Deferred Charges)
69. Stock issuance costs (Deferred Charges)
70. Subleases (when the company is the lessor) (Investments and Advances – Other)
71. Sundry investments (Investments and Advances – Other)
72. Tax benefit leases (Investments and Advances – Other)
73. Timberlands other than those owned by forest and paper companies
74. Tooling costs (Deferred Charges)
75. Trademarks and tradenames (Intangibles)
76. Treasury stock reported on the asset side of the balance sheet
77. Unamortized debt discount and expenses (Deferred Charges)
This item excludes 1. Computer software included in property, plant and equipment on the balance sheet or on Schedules V
and VI by the company
2. Film development costs [included in Property, Plant and Equipment – Total (Net)]
3. Intangibles included in property, plant and equipment by the company
Assets - Other - Excluding Deferred Charges Mnemonic AOX
Data Item Number A205
Units Millions of dollars
This item represents long-term assets not included in property, plant, and equipment, investments and advances, intangibles or deferred charges.
This item includes 1. Advances to sales staff
2. Amounts due from directors, officers, and principal holders of equity securities
3. Assets of discontinued operations
4. Cash on deposit pursuant to loan agreements
5. Cash surrender value of life insurance policies
6. Claims in litigation
7. Computer software and software costs not included in property, plant, and equipment by the company
8. Computer software licenses

Research Insight North America Data Guide
86
9. Contracts
10. Deferred taxes
11. Deposits
12. Finance service companies’ deferred charges on installment obligations (when presented as a deduction from receivables)
13. Idle lands (not an investment)
14. Investments in company’s own securities
15. Long-term inventory
16. Negative goodwill
17. Material and supplies
18. Pension and other special funds
19. Property not used in operations
20. Purchased technology
21. Restricted cash
22. Software costs of internally developed and purchased software to be marketed
23. Software costs reimbursable under third-party contracts
24. Timberlands (except for forest and paper companies)
25. Treasury stock on the asset side of the balance sheet
This item excludes 1. Computer software and software costs included in property, plant, and equipment by the company
2. Computer software patent costs
3. This item is not available for banks.
Assets - Total Mnemonic AT
Data Item Number A6
Units Millions of dollars
This item represents current assets plus net property, plant, and equipment plus other noncurrent assets (including intangible assets, deferred items and investments and advances).
Total liabilities and stockholders’ equity represents current liabilities plus long-term debt plus other long-term liabilities plus stockholders’ equity.
Assets - Total - Note Mnemonic ATF
Code Description AG Reflects post Chapter 11 adoption of fresh-start
accounting

87
Chapter 3 Balance Sheet
GB Certain classifications such as Current Assets, Current Liabilities, and Debt Due in One Year are estimated by Standard & Poor's since the company reports an unclassified balance sheet
GL Combination of GB and TL TL Company in bankruptcy or liquidation UB Combination UG and GB UG Non-U.S. company; data collected in U.S. GAAP
The descriptions for these codes can be viewed by choosing the Databases » Descriptions command from the menu bar and entering the mnemonic in the Item text box. To include a textual description of a code in a report, you can use the @DESC function. For example, to include a description of this footnote, type @DESC (ATF).
Assets - Total - Quarterly Mnemonic ATQ
Data Item Number Q44
Units Millions of dollars
This quarterly item represents current assets plus net property, plant, and equipment plus other noncurrent assets (including intangible assets, deferred items and investments and advances).
Total liabilities and stockholders’ equity represents current liabilities plus long-term debt plus other long-term liabilities plus stockholders’ equity.
Assets - Total - Quarterly - Note Mnemonic ATQF
Code Description AY Some of all balance sheet items are restated AG Reflects post Chapter 11 adoption of fresh-start
accounting GB Certain classifications such as Current Assets,
Current Liabilities, and Debt Due in One Year are estimated by Standard & Poor's since the company reports an unclassified balance sheet
GL Combination of GB and TL JG Combination of GB and JR JR The income statement data not comparable with the
balance sheet data due to restatement JW Combination of AY, GB, and JR JY Combination of AY and JR TL Company in bankruptcy or liquidation UB Combination UG and GB, UG and JG, or UG and JR UG Non-U.S. company; data collected in U.S. GAAP WG Combination of GB and AY

Research Insight North America Data Guide
88
The descriptions for these codes can be viewed by choosing the Databases » Descriptions command from the menu bar and entering the mnemonic in the Item text box. To include a textual description of a code in a report, you can use the @DESC function. For example, to include a description of this footnote, type @DESC (ATQF).
Capital Surplus Mnemonic CAPS
Data Item Number A210
Units Millions of dollars
This item represents a group of capital accounts other than capital stock or retained earnings.
This item includes the effect of and is adjusted for: 1. Capital recorded upon reorganization or recapitalization of the company
2. Donations received from stockholders
3. Gain on resale or cancellation of reacquired capital stock
4. Installments on common stock
5. Miscellaneous paid-in-capital
6. Notes receivable from sale of subscription stock
7. Premium on capital stock (excess over par or stated value)
8. Reduction in par or stated value of capital stock
9. Reserve account for shares to be repurchased (reported in the equity section)
10. Residual from conversion of a class of common into the main class
11. Stock of a subsidiary held by the parent company (reported in the Equity section)
12. Unrealized stock appreciation
This item excludes 1. Excess over par of common treasury stock (included in Treasury Stock - Total Dollar Amount)
2. Excess over par of nonredeemable preferred treasury stock (included in Treasury Stock - Total Dollar Amount)
3. Issuable stock (included in Retained Earnings)
4. Miscellaneous notes receivable (included in Retained Earnings)
5. Reserve for shares to be issued (included in Retained Earnings)
If a company does not maintain a capital surplus account, Standard & Poor's will make adjustments to Retained Earnings for those items normally netted against Capital Surplus.
Prior to fiscal periods 1982 on the annual database and first quarter, 1986 on the quarterly database, Standard & Poor's adjusted this item for the excess over par of both common and nonredeemable preferred treasury stock shown as a reduction to equity on the balance sheet.
This item is not available for banks or utilities.

89
Chapter 3 Balance Sheet
Capital Surplus - Note Mnemonic CAPSF
Code Description JD Reflects adjustments for stock splits or dividends
Capital Surplus - Quarterly Mnemonic CAPSQ
Data Item Number Q57
Units Millions of dollars
This item represents a group of capital accounts other than capital stock or retained earnings.
This item includes the effect of and is adjusted for: 1. Capital recorded upon reorganization or recapitalization of the company
2. Donations received from stockholders
3. Gain on resale or cancellation of reacquired capital stock
4. Installments on common stock
5. Miscellaneous paid-in-capital
6. Notes receivable from sale of subscription stock
7. Premium on capital stock (excess over par or stated value)
8. Reduction in par or stated value of capital stock
9. Reserve account for shares to be repurchased (reported in the equity section)
10. Residual from conversion of a class of common into the main class
11. Stock of a subsidiary held by the parent company (reported in the Equity section)
12. Unrealized stock appreciation
This item excludes 1. Excess over par of common treasury stock (included in Treasury Stock - Total Dollar Amount)
2. Excess over par of nonredeemable preferred treasury stock (included in Treasury Stock - Total Dollar Amount)
3. Issuable stock (included in Retained Earnings)
4. Miscellaneous notes receivable (included in Retained Earnings)
5. Reserve for shares to be issued (included in Retained Earnings)
If a company does not maintain a capital surplus account, Standard & Poor's will make adjustments to Retained Earnings for those items normally netted against Capital Surplus.

Research Insight North America Data Guide
90
Prior to fiscal periods 1982 on the annual database and first quarter, 1986 on the quarterly database, Standard & Poor's adjusted this item for the excess over par of both common and nonredeemable preferred treasury stock shown as a reduction to equity on the balance sheet.
This item is not available for banks or utilities.
Capital Surplus - Quarterly - Note Mnemonic CAPSQF
Code Description JD Reflects adjustments for stock splits or dividends
Cash Mnemonic CH
Data Item Number A162
Units Millions of dollars
This item represents any immediately negotiable medium of exchange. It includes money and any instruments normally accepted by banks for deposit and immediate credit to a customer's account.
This item includes 1. Bank drafts
2. Cash
3. Checks (cashiers or certified)
4. Demand certificates of deposit
5. Demand deposits
6. Letters of credit
7. Money orders
This item excludes 1. Commercial paper
2. Government securities
3. Legally restricted cash
4. Marketable securities
5. Short-term investments
6. Time deposits
7. Time certificates of deposit
This item is not available for utilities.

91
Chapter 3 Balance Sheet
Cash and Equivalents Mnemonic CHE
Data Item Number A1
Units Millions of dollars
This item represents cash and all securities readily transferable to cash as listed in the Current Asset section.
This item includes, but is not limited to: 1. Cash in escrow (unless legally restricted, in which case it is included in Current Assets - Other)
2. Good faith and clearing house deposits for brokerage firms
3. Government and other marketable securities, including stocks and bonds, listed as short-term
4. Letters of credit
5. Margin deposits on commodity futures contracts
6. Time, demand and certificates of deposit
7. The total of a bank's currency and coin, plus its reserves with the Federal Reserve Bank and balances with other banks
This item excludes 1. Money due from sale of debentures (included in Receivables - Other Current)
2. Commercial paper issued by unconsolidated subsidiaries to the parent company (included in Receivables - Other Current)
3. Bullion, bullion in transit, uranium in transit, etc. (included in Inventories - Raw Materials)
This item is not available for utilities.
Cash and Equivalents - Quarterly Mnemonic CHEQ
Data Item Number Q36
Units Millions of dollars
This item represents cash and all securities readily transferable to cash as listed in the Current Asset section.
This item includes, but is not limited to: 1. Cash in escrow (unless legally restricted, in which case it is included in Current Assets - Other)
2. Good faith and clearing house deposits for brokerage firms
3. Government and other marketable securities, including stocks and bonds, listed as short-term
4. Letters of credit
5. Margin deposits on commodity futures contracts
6. Time, demand and certificates of deposit
7. The total of a bank's currency and coin, plus its reserves with the Federal Reserve Bank and balances with other banks

Research Insight North America Data Guide
92
This item excludes 1. Money due from sale of debentures (included in Receivables - Other Current)
2. Commercial paper issued by unconsolidated subsidiaries to the parent company (included in Receivables - Other Current)
3. Bullion, bullion in transit, uranium in transit, etc. (included in Inventories - Raw Materials)
This item is not available for utilities.
Common Equity - Total Mnemonic CEQ
Annual Data Item Number A60
Units Millions of dollars
This item represents the common shareholders' interest in the company.
This item includes ... 1. Common stock outstanding (including treasury stock adjustments)
2. Capital surplus
3. Retained earnings
4. Treasury stock adjustments for both common and non-redeemable preferred stock
This figure is not adjusted for excess liquidating value over carrying value of preferred stock or for intangibles.
Common Equity - Total - Quarterly Mnemonic CEQQ
Quarterly Data Item Number Q59
Units Millions of dollars
This item represents the common shareholders' interest in the company.
This item includes ... 1. Common stock outstanding (including treasury stock adjustments)
2. Capital surplus
3. Retained earnings
4. Treasury stock adjustments for both common and non-redeemable preferred stock
This figure is not adjusted for excess liquidating value over carrying value of preferred stock or for intangibles.
Common Stock Mnemonic CSTK

93
Chapter 3 Balance Sheet
Annual Data Item Number A85
Units Millions of dollars
This item represents the total par or carrying value of common shares issued. Par usually equals the carrying value. However, when they are not identical, Standard & Poor's uses the carrying value to calculate this item.
This item includes ... 1. Classes of common convertible into the main class of common. If convertible on a one-to-one basis,
they are added together. If convertible on any other basis, the class is converted into the main class of common and the carrying value of the main class is applied to calculate Common Stock. Capital Surplus is adjusted by any residual
2. Common stock subscriptions at par or carrying value and the excess of these subscriptions over par or carrying value
3. Common treasury stock reported on the asset side of the Balance Sheet
4. Common treasury stock reported as part of stockholders' equity at par or carrying value beginning in 1982 and 1986, first quarter on the annual and quarterly databases respectively
5. Escrow shares when included in the earnings per share calculation
This item excludes ... 1. Installments on common stock (included in Capital Surplus)
2. Issuable stock (included in Retained Earnings)
3. Special stock not convertible into common (included in Capital Surplus.)
Prior to fiscal period 1982, this item was reduced by the dollar amount of common treasury stock when presented as a reduction to equity on the Balance Sheet.
Common Stock - Note Mnemonic CSTKF
Code Description JD Reflects adjustments for stock splits or dividends JN Recapitalization of Common Stock reflected in the
Adjustment Factor (Cumulative) Ex-date and Adjustment Factor
JP Recapitalization of Common Stock is not reflected in the Adjustment Factor (Cumulative) Payable Date
JZ Combination of JD and JP LO Combination of JD and TO TO Reflects Leveraged Buyout
Common Stock - Per Share Carrying Value Mnemonic CSTKCV

Research Insight North America Data Guide
94
Annual Data Item Number A232
Units Dollars and cents
This item represents the amount specified in a company's articles of incorporation for each share of common stock as imprinted on the face of each stock certificate. In most cases, common stock is carried on the balance sheet at its nominal or par value. If a nominal or par value is not actually reported, Standard & Poor's inputs the carrying value.
If a company has two or more classes of common stock, a Not Available data code (@NA) will appear.
This item is not available for banks or utilities.
Common Stock - Quarterly Mnemonic CSTKQ
Quarterly Data Item Number Q56
Units Millions of dollars
This item represents the total par or carrying value of common shares issued. Par usually equals the carrying value. However, when they are not identical, Standard & Poor's uses the carrying value to calculate this item.
This item includes 1. Classes of common convertible into the main class of common. If convertible on a one-to-one basis,
they are added together. If convertible on any other basis, the class is converted into the main class of common and the carrying value of the main class is applied to calculate Common Stock. Capital Surplus is adjusted by any residual
2. Common stock subscriptions at par or carrying value and the excess of these subscriptions over par or carrying value
3. Common treasury stock reported on the asset side of the Balance Sheet
4. Common treasury stock reported as part of stockholders' equity at par or carrying value beginning in 1982 and 1986, first quarter on the annual and quarterly databases respectively
5. Escrow shares when included in the earnings per share calculation
This item excludes ... 1. Installments on common stock (included in Capital Surplus)
2. Issuable stock (included in Retained Earnings)
3. Special stock not convertible into common (included in Capital Surplus.)
Prior to fiscal period 1982, this item was reduced by the dollar amount of common treasury stock when presented as a reduction to equity on the Balance Sheet.
Prior to first quarter 1986, this item was reduced by the dollar amount of common treasury stock when presented as a reduction to equity on the Balance Sheet.
Common Stock - Quarterly - Note Mnemonic CSTKQF

95
Chapter 3 Balance Sheet
Code Description JD Reflects adjustments for stock splits or dividends JN Recapitalization of Common Stock reflected in both
the Adjustment Factor (Cumulative) Ex-date and Adjustment Factor (Cumulative) Payable Date
JP Recapitalization of Common Stock is not reflected in either the Adjustment Factor (Cumulative) by Ex-Date or the Adjustment Factor (Cumulative) Payable Date
JZ Combination of JD and JP
Current Assets - Other Mnemonic ACO
Annual Data Item Number A68
Units Millions of dollars
This item represents current assets that are not included in cash, cash equivalents, receivables or inventory on the Balance Sheet.
This item includes 1. Deferred charges when listed as current
2. Estimated future income tax benefits
3. Deferred or prepaid taxes
4. Property and assets related to discontinued operations
5. Security deposits
6. Supplies when listed separately from inventory items or when combined with prepaid expenses
7. Tools listed as current assets
8. Total of current amounts of advances due from parents and consolidated subsidiaries
9. Prepaid insurance, advertising, and rent
This item is not available for banks or utilities.
Current Assets - Other- Quarterly Mnemonic ACOQ
Quarterly Data Item 39
Units Millions of dollars
This item represents current assets that are not included in cash, cash equivalents, receivables or inventory on the Balance Sheet.
This item includes 1. Deferred charges when listed as current
2. Estimated future income tax benefits
3. Deferred or prepaid taxes

Research Insight North America Data Guide
96
4. Property and assets related to discontinued operations
5. Security deposits
6. Supplies when listed separately from inventory items or when combined with prepaid expenses
7. Tools listed as current assets
8. Total of current amounts of advances due from parents and consolidated subsidiaries
9. Prepaid insurance, advertising, and rent
This item is not available for banks or utilities.
Current Assets - Other - Excluding Prepaid Expenses Mnemonic ACOX
Annual Data Item Number A195
Units Millions of dollars
This item represents other current assets not included in cash, cash equivalents, receivables, inventory or prepaid expenses on the Balance Sheet.
This item is not available for banks or utilities.
Current Assets - Total Mnemonic ACT
Annual Data Item Number A4
Units Millions of dollars
This item represents cash and other assets that are expected to be realized in cash or used in the production of revenue within the next 12 months.
This item includes 1. Planters' growing crops and advances when listed as current assets
2. Real estate companies' land purchase option deposits, land held for development and completed homes, and developed land for sale to customers when listed as current assets
This item is not available for banks.
Current Assets - Total - Quarterly Mnemonic ACTQ
Quarterly Data Item Number Q40
Units Millions of dollars
This item represents cash and other assets that are expected to be realized in cash or used in the production of revenue within the next 12 months.
This item includes 1. Planters' growing crops and advances when listed as current assets
2. Real estate companies' land purchase option deposits, land held for development and completed homes, and developed land for sale to customers when listed as current assets
This item is not available for banks.

97
Chapter 3 Balance Sheet
Current Liabilities - Other Mnemonic LCO
Annual Data Item Number A72
Units Millions of dollars
This item is a residual item representing those current liabilities that are not debt, trade accounts payable, or income taxes payable.
This item includes 1. Accounts payable due to parents and consolidated subsidiaries
2. Accrued expenses
3. Advances
4. Assets of discontinued operations included in current liabilities
5. Billings in excess of cost
6. Contracts payable
7. Customer deposits
8. Deferred income taxes payable
9. Dividends declared
10. Due to factor
11. Estimated claims and other liabilities under Chapter XI
12. Interest in default
13. Loss and damage claims
14. Other accounts payable
15. Preferred stock sinking fund
16. Redeemable preferred stock - current portion
17. Reserves
18. Traveler's checks
19. Broadcasting companies' film contracts and rights payable
20. Race track companies' unredeemed pari-mutuel tickets
21. Retailing companies' unredeemed gift certificates
This item excludes accounts payable to unconsolidated subsidiaries (included in Accounts Payable).
This item is not available for banks or utilities.
Current Liabilities - Other - Quarterly Mnemonic LCOQ
Quarterly Data Item Number Q48

Research Insight North America Data Guide
98
Units Millions of dollars
This item is a residual item representing those current liabilities that are not debt, trade accounts payable, or income taxes payable.
This item includes 1. Accounts payable due to parents and consolidated subsidiaries
2. Accrued expenses
3. Advances
4. Assets of discontinued operations included in current liabilities
5. Billings in excess of cost
6. Contracts payable
7. Customer deposits
8. Deferred income taxes payable
9. Dividends declared
10. Due to factor
11. Estimated claims and other liabilities under Chapter XI
12. Interest in default
13. Loss and damage claims
14. Other accounts payable
15. Preferred stock sinking fund
16. Redeemable preferred stock - current portion
17. Reserves
18. Traveler's checks
19. Broadcasting companies' film contracts and rights payable
20. Race track companies' unredeemed pari-mutuel tickets
21. Retailing companies' unredeemed gift certificates
This item excludes accounts payable to unconsolidated subsidiaries (included in Accounts Payable).
This item is not available for banks or utilities.

99
Chapter 3 Balance Sheet
Current Liabilities - Other Excluding Accrued Expenses Mnemonic LCOX
Annual Data Item Number A207
Units Millions of dollars
This item represents current liabilities other than debt trade accounts payable, income taxes payable, or accrued expenses on the Balance Sheet.
This item is not available for banks or utilities.
Current Liabilities - Total Mnemonic LCT
Annual Data Item Number A5
Units Millions of dollars
This item represents all liabilities due within one year, including short-term debt and the current portion of long-term debt.
This item is not available for banks.
Current Liabilities - Total - Quarterly Mnemonic LCTQ
Quarterly Data Item Number Q49
Units Millions of dollars
This item represents all liabilities due within one year, including short-term debt and the current portion of long-term debt.
This item is not available for banks.
Debt - Total Mnemonic DT
Concept Calculation DLTT+DLC
Units Millions of dollars
This concept is the sum of Total Long-Term Debt, which is defined as debt obligations due more than one year from the company's balance sheet date, plus Debt in Current Liabilities, which is defined as the total amount of short-term notes and the current portion of long-term debt (debt due in one year).

Research Insight North America Data Guide
100
Debt - Total - Quarterly Mnemonic DTQ
Concept calculation @VALUE(DLTTQ+DLCQ, (DLTTQ+DLCQ)[-1])
Units Millions of dollars
This concept is the sum of Total Long-Term Debt - Quarterly plus Debt in Current Liabilities - Quarterly. (If Total Long-Term Debt and Debt in Current Liabilities for the current quarter are not available, the values for the previous quarter will be used.)
Debt Due in 1st Year Mnemonic DD1
Annual Data Item Number A44
Units Millions of dollars
This item represents the current portion of long-term debt (included in Current Liabilities).
This item includes 1. The installments on a loan
2. The sinking fund payments
3. The current portion of any item defined as long-term debt (for example, the current portion of a long-term lease obligation)
This item is not available for banks.
Debt in Current Liabilities Mnemonic DLC
Annual Data Item Number A34
Units Millions of dollars
This item represents the total amount of short-term notes and the current portion of long-term debt, which is also stated as Notes Payable (NP) + Debt Due in 1st Year (DD1).
This item includes 1. Bank acceptances and overdrafts
2. Loans payable to the officers of the company
3. Loans payable to stockholders
4. Loans payable to parents, and consolidated and unconsolidated subsidiaries
5. Notes payable to banks and others
6. Installments on a loan
7. Sinking fund payments

101
Chapter 3 Balance Sheet
8. Brokerage companies' drafts payable
This item may include mortgage indebtedness for banks (included in Current Liabilities - Other if identifiable).
This item excludes notes payable to subsidiaries (included in Current Liabilities - Other).
Debt in Current Liabilities - Quarterly Mnemonic DLCQ
Quarterly Data Item Number Q45
This item represents the total amount of short-term notes and the current portion of long-term debt.
This item includes 1. Bank acceptances and overdrafts
2. Loans payable to the officers of the company
3. Loans payable to stockholders
4. Loans payable to parents, and consolidated and unconsolidated subsidiaries
5. Notes payable to banks and others
6. Installments on a loan
7. Sinking fund payments
8. Brokerage companies' drafts payable
This item may include mortgage indebtedness for banks (included in Current Liabilities - Other if identifiable).
This item excludes notes payable to subsidiaries (included in Current Liabilities - Other).
Debt in Current Liabilities - Quarterly - Note Mnemonic DLCQF
Code Description XN Excludes short-term borrowings (notes are presented
with accounts payable)
Deferred Charges Mnemonic DC
Annual Data Item Number A152
Units Millions of dollars

Research Insight North America Data Guide
102
This item represents assets that derive value because they represent long-term prepayments of expenses that contribute to the production of revenue in the future.
This item includes 1. Acquisition costs (except for goodwill)
2. Debt acquisition costs
3. Deferred development costs (except for software costs)
4. Deferred financing costs
5. Deferred policy costs
6. Long-term prepaid expenses
7. Preopening expenses
8. Prepaid pension costs reported separately in long-term assets
9. Publishing and prepublication costs
10. Start-up costs
11. Stock issuance costs
12. Tooling costs
13. Unamortized debt discount and expense
14. Unamortized research and development expense
15. Broadcasting companies' program rights, film productions, and film rights
16. Publishing companies' royalty advances to authors
This item excludes ... 1. All items specifically labeled as intangibles by Standard & Poor's definition
2. Computer software (included in Assets - Other Excluding Deferred Charges)
3. Deferred income taxes (included in Income Taxes - Deferred)
4. Finance service companies' deferred finance charges on installment obligations when presented as a deduction from receivables (included in Assets - Other Excluding Deferred Charges)
5. Motion picture production companies' film distribution systems (included in Assets - Other Excluding Deferred Charges)
This item is not available for banks or utilities.
Deferred Taxes (Balance Sheet) Mnemonic TXDB
Annual Data Item Number A74
Units Millions of dollars
This item represents the accumulated tax deferrals due to timing differences between the reporting of revenues and expenses for financial reporting and tax purposes.
This item includes deferred investment tax credits (when combined with deferred taxes and a separate figure is not available).
This item excludes

103
Chapter 3 Balance Sheet
1. Deferred taxes reported as current liabilities (included in Current Liabilities - Other)
2. Deferred investment tax credit (when a separate figure is available) (included in Investment Tax Credit [Balance Sheet])
3. Mining taxes (included in Liabilities - Other)
4. Resource taxes (included in Liabilities - Other)
5. Production taxes (included in Liabilities - Other)
This item is not available for banks.
Deferred Taxes and Investment Tax Credit Mnemonic TXDITC
Annual Data Item Number A35
Units Millions of dollars
This item represents the accumulated tax deferrals due to timing differences between the reporting of revenues and expenses for financial statements and tax forms and investment tax credit.
This item excludes deferred taxes reported as current liabilities (included in Current Liabilities - Other).
This item is not available for banks.
Deferred Taxes and Investment Tax Credit - Quarterly Mnemonic TXDITQ
Quarterly Data Item Number Q52
Units Millions of dollars
This item represents the accumulated tax deferrals due to timing differences between the reporting of revenues and expenses for financial statements and tax forms and investment tax credit.
This item excludes deferred taxes reported as current liabilities (included in Current Liabilities - Other).
This item is not available for banks.
Income Tax Refund Mnemonic TXR
Annual Data Item Number A161
Units Millions of dollars
This item represents the amount due from the Internal Revenue Service because of overpayment of taxes or the results of auditing previous years’ taxes.
This item includes 1. Income tax refund claims
2. Recoverable income taxes
Taxes recoverable or refundable on discontinued operations

Research Insight North America Data Guide
104
This item excludes 1. Deferred or prepaid taxes (included in Current Assets – Other)
2. Future income tax benefits (included in Current Assets – Other)
This item is not available for banks.
Income Taxes Payable Mnemonic TXP
Annual Data Item Number A71
Units Millions of dollars
This item represents the accrued tax liability on income due within one year.
This item includes state and local taxes not classified by type.
This item excludes 1. Other taxes (included in Current Liabilities - Other)
2. Deferred Taxes (included in Current Liabilities - Other)
This item is not available for banks or utilities.
Income Taxes Payable - Note Mnemonic TXPF
Code Description BH Includes other taxes
Income Taxes Payable - Quarterly Mnemonic TXPQ
Quarterly Data Item Number Q47
Units Millions of dollars
This item represents the accrued tax liability on income due within one year.
This item includes state and local taxes not classified by type.
This item excludes 1. Other taxes (included in Current Liabilities - Other)
2. Deferred Taxes (included in Current Liabilities - Other)
This item is not available for banks or utilities.

105
Chapter 3 Balance Sheet
Income Taxes Payable - Quarterly - Note Mnemonic TXPQF
Code Description BH Includes other taxes
Intangibles Mnemonic INTAN
Annual Data Item Number A33
Units Millions of dollars
This item represents the unamortized value of intangible assets.
This item includes 1. Blueprints or building designs
2. Copyrights
3. Covenants not to compete
4. Design costs
5. Distribution rights and agreements
6. Easements (gas rights, mineral rights, water rights)
7. Engineering drawings
8. Excess of cost or premium of acquisition (except on unconsolidated subsidiaries)
9. Franchise and franchise fees
10. Goodwill (except on unconsolidated subsidiaries)
11. Import quotas
12. Leases and lease acquisition costs when company is the lessee
13. Leasehold expense when company is the lessee
14. Licenses
15. Operating rights
16. Organizational expense
17. Patents
18. Subscription lists
19. Trademarks and tradenames
20. Transportation companies' route acquisition costs
21. Computer software patents

Research Insight North America Data Guide
106
This item excludes 1. Contracts (included in Assets - Other Excluding Deferred Charges)
2. Deferred charges (included in Deferred Charges)
3. Deferred financing costs (included in Deferred Charges)
4. Film development costs (included in Property, Plant, and Equipment - Net)
5. Goodwill on unconsolidated subsidiaries (included in Investments and Advances - Equity Method)
6. Intangibles included in property, plant, and equipment by the company
7. Preopening expenses (included in Deferred Charges)
8. Prepaid expenses (included in Deferred Charges)
9. Software or software costs (included in Assets - Other Excluding Deferred Charges)
10. Start-up costs (included in Deferred Charges)
11. Unamortized debt discount and expense (included in Deferred Charges)
12. Unamortized research and development expense (included in Deferred Charges)
This item is not available for banks or utilities.
Inventories - Total Mnemonic INVT
Annual Data Item Number A3
Units Millions of dollars
This item represents merchandise bought for resale and materials and supplies purchased for use in production of revenue.
This item includes 1. Advance manufacturing costs
2. Agricultural companies' advances to planters (when classified as current assets)
3. Agricultural companies' growing crops (when classified as current assets)
4. Banks and savings and loans’ assets held for sale and other real estate owned
5. Bottles, cases, and kegs (when reported in the Current Assets section)
6. Brokerage firms' securities and commodities
7. Contracts in progress (costs in excess of related billing on completed contracts)
8. Deposits and advances on material purchases
9. Distillers’ storage charges
10. Lumber companies' short-term lumber leases
11. Merchandise in transit
12. Mining companies’ supplies (when reported separately from other inventories)
13. Motion picture companies' advances to other producers

107
Chapter 3 Balance Sheet
14. Motion picture companies' film costs and distribution rights
15. Real estate companies' land purchase option deposits, land held for development, and completed homes and developed land for sales to customers (when reported in the Current Assets section)
16. Rental companies’ rental vehicles or equipment
17. Supplies and materials (when included in inventory)
18. Tools (when reported in the Current Assets section)
19. Work in process and advances to subcontractors (net of progress payments)
This item excludes 1. Contract billings and expensed contracts (included in Receivables - Trade)
2. Real estate companies' land purchase option deposits, land held for development, and completed homes and developed land for sales to customers (when reported outside the Current Assets) (included in Property, Plant and Equipment - Total [Net])
3. Supplies (when reported separately from inventory) (included in Prepaid Expenses)
4. Trucking companies’ prepaid tires (included in Prepaid Expense)
5. Unbilled shipments received by customers (included in Receivables - Trade)
A Combined Figure data code (@CF) is entered if this item is combined with one or more of the following data items: 1. Property, Plant and Equipment (Net) - Total (PPENT) (when included on an unclassified Balance
Sheet)
2. Assets (Other)
3. Current Assets - Other - Excluding Prepaid Expense (ACOX)
4. Assets - Other - Excluding Deferred Charges (AOX)
Inventories - Total - Quarterly Mnemonic INVTQ
Quarterly Data Item Number Q38
Units Millions of dollars
This item represents merchandise bought for resale and materials and supplies purchased for use in production of revenue.
This item includes, but is not limited to ... 1. Deposits and/or advances on material purchases
2. Work in process and advances to subcontractors (net of progress payments)
3. Advance manufacturing costs
4. Bullion in transit, bullion, uranium in transit, etc.
5. Revenue stamps
6. Motion picture companies' advances to other producers
7. Agricultural companies' advances to planters (when classified as current assets)
8. Merchandise in transit

Research Insight North America Data Guide
108
9. Real estate companies' land purchase option deposits, land held for development, and completed homes and developed land for sales to customers. If these are classified as non-current assets, then they are included in Property, Plant and equipment
10. Distiller's storage charges
11. Motion picture companies' film costs and distribution rights
12. Agricultural companies' growing crops (when classified as current assets)
13. Bottles, cases, and kegs (when classified as current assets)
14. Brokerage firms' securities inventory
15. Lumber companies' short-term lumber leases
16. Supplies and materials and supplies included in inventory
17. Tools when classified as current assets
18. Unbilled costs on contracts and costs in excess of related billings when a company uses the fixed price method of inventory valuation
This item excludes 1. Supplies when listed separately from inventory (included in Prepaid Expenses)
2. Contract billings and expense contracts (included in Receivables - Trade)
3. Unbilled shipments received by customers (included in Receivables - Trade)
4. Unbilled costs on contracts and costs in excess of related billings (included in Receivables - Trade)
The components of inventories may not total to Inventories - Total in some cases because of adjustments to the method of inventory or because nonmanufacturing inventories are not included in the components.
Invested Capital - Total Mnemonic ICAPT
Annual Data Item Number A37
Units Millions of dollars
This item represents the sum of these data items ... 1. Long-Term Debt - Total
2. Preferred Stock - Carrying Value
3. Minority Interest (Balance Sheet)
4. Common Equity - Total
This item may include the current portion of long-term debt when long-term debt is footnoted indicating long-term debt includes the current portion.
This item excludes 1. Deferred income tax reserve
2. Investment tax credit

109
Chapter 3 Balance Sheet
Invested Capital - Total - Quarterly Mnemonic ICAPTQ
Quarterly Data Item Number Q62
Units Millions of dollars
Invested Capital - Total - Quarterly represents the sum of these data items: 1. Long-Term Debt - Total
2. Preferred Stock - Carrying Value
3. Minority Interest (Balance Sheet)
4. Common Equity - Total
This item excludes 1. Deferred income taxes
2. Investment tax credit
Investment Tax Credit (Balance Sheet) Mnemonic ITCB
Annual Data Item Number A208
Units Millions of dollars
This item represents accumulated tax deferrals of investment tax credits generated by new capital investments.
This data item is not available for banks.
Investments and Advances - Equity Method Mnemonic IVAEQ
Annual Data Item Number A31
Units Millions of dollars
This item represents long-term investments and advances to unconsolidated subsidiaries and affiliates in which the parent company has significant control, as stated in the consolidated financial statements.
This item for 1972 and forward (after Accounting Principles Board Opinion No. 18), includes all investments carried at equity. Investments carried at cost of less than 20%, of more than 20% but uncertain control (such as, unconsolidated subsidiaries subject to possible expropriation), joint ventures not yet operating, and partnerships in which there is no control will be excluded from this item.
Prior to 1972 (before Accounting Principles Board Opinion No. 18), this item included investments in and advances to affiliates (at cost or equity), stock ownership of 50% or more, and unconsolidated subsidiaries. Associates, joint ventures and partnerships were excluded.
This item is not available for utilities.

Research Insight North America Data Guide
110
Investments and Advances - Other Mnemonic IVAO
Annual Data Item Number A32
Units Millions of dollars
This item represents long-term receivables and other investments and advances including investments in unconsolidated companies in which there is no control.
This item includes 1. All investments carried at cost
2. Direct financing leases when the company is the lessor
3. Investments and advances to former subsidiaries
4. Investments and advances to subsidiaries to be sold
5. Joint ventures not yet operating
6. Land held for resale (for companies whose primary business is not land development)
7. Leveraged leases when the company is the lessor
8. Long-term receivables (including receivables from parent)
9. Marketable securities (unless restricted or held for collateral)
10. Investments in securities and mortgage loans
11. Seat on or membership in a securities exchange
12. Finance companies' assets held strictly for investment purposes
13. Publishing companies' royalty advances to authors
14. Real estate investment trust companies'
15. Equity investments in real estate
16. Mortgage loans on real estate
17. Property acquired through foreclosure
18. Extractive industries' oil and gas royalties
This item excludes 1. Advances to salesmen (included in Assets - Other)
2. Equity in consolidated joint ventures when held for loan collateral (included in Assets - Other)
3. Investments carried at equity (included in Investments and Advances - Equity Method)
4. Investments in a company's own securities (included in Assets - Other)
5. Receivables from officers and directors (included in Assets - Other)
6. Film production companies' film costs (included in Property, Plant and Equipment)
7. Land development companies' land held for development and sale
8. Publishing companies' royalty advances to authors (included in Deferred Charges)

111
Chapter 3 Balance Sheet
Prior to 1972, this item included investments and advances to associates, joint ventures and partnerships (Accounting Principles Board Opinion No. 18). Those excluded were investments and advances to affiliates and to unconsolidated subsidiaries. After Accounting Principles Board Opinion No. 18 (1972 and forward), only investments at cost are included, and all investments at equity are treated as Investments and Advances - Equity Method.
This item is not available for banks.
Liabilities - Other Mnemonic LO
Annual Data Item Number A75
Units Millions of dollars
This item represents all noncurrent liabilities that are not debt, deferred taxes, investment tax credits, minority interest or shareholders' equity.
This item includes 1. Accounts payable due after one year
2. Contingent liabilities
3. Accounts receivable assigned
4. Notes receivable discounted
5. Guarantees
6. Customers' deposits on bottles, cases, and kegs
7. Negative goodwill
8. Reserves not shown elsewhere
9. Foreign exchange losses
10. Facility realignment and relocation
11. Reserves for self-insurance (when reported in Liabilities - Other)
12. Film producers' film contracts
This item excludes 1. Deferred taxes
2. Investment tax credit
3. Long-term debt
4. Minority interest
5. Shareholders' equity
This item is not available for banks.
Liabilities - Other - Quarterly Mnemonic LOQ
Quarterly Data Item Number Q50

Research Insight North America Data Guide
112
Units Millions of dollars
This item represents all noncurrent liabilities that are not debt, deferred taxes, investment tax credits, minority interest or shareholders' equity.
This item includes 1. Accounts payable due after one year
2. Contingent liabilities
3. Accounts receivable assigned
4. Notes receivable discounted
5. Guarantees
6. Customers' deposits on bottles, cases, and kegs
7. Negative goodwill
8. Reserves not shown elsewhere
9. Foreign exchange losses
10. Facility realignment and relocation
11. Reserves for self-insurance (when reported in Liabilities - Other)
12. Film producers' film contracts
This item excludes 1. Deferred taxes
2. Investment tax credit
3. Long-term debt
4. Minority interest
5. Shareholders' equity
This item is not available for banks.
Liabilities - Total Mnemonic LT
Annual Data Item Number A181
Units Millions of dollars
This item represents current liabilities plus long-term debt plus other noncurrent liabilities (including deferred taxes, investment tax credit, and minority interest).
Liabilities - Total - Quarterly Mnemonic LTQ
Quarterly Data Item Number Q54
Units Millions of dollars

113
Chapter 3 Balance Sheet
This item represents current liabilities plus long-term debt plus other noncurrent liabilities (including deferred taxes, investment tax credit, and minority interest).
Long-Term Debt - Total Mnemonic DLTT
Annual Data Item Number A9
Units Millions of dollars
The item represents debt obligations due more than one year from the company's balance sheet date.
This item includes 1. Purchase obligations and payments to officers (when listed as long-term liabilities)
2. Notes payable, due within one year and to be refunded by long-term debt when carried as a non-current liability
3. Long-term lease obligations (capitalized lease obligations)
4. Industrial revenue bonds
5. Advances to finance construction
6. Loans on insurance policies
7. Indebtedness to affiliates
8. Bonds, mortgages, and similar debt
9. All obligations that require interest payments
10. Publishing companies' royalty contracts payable
11. Timber contracts for forestry and paper
12. Extractive industries' advances for exploration and development
13. Production payments and advances for exploration and development
This item excludes 1. Subsidiary preferred stock (included in Minority Interest)
2. The current portion of long-term debt (included in Current Liabilities)
3. Accounts payable due after one year (included in Liabilities - Other)
4. Accrued interest on long-term debt (included in Liabilities - Other)
5. Customers' deposits on bottles, kegs, and cases (included in Liabilities - Other)
6. Deferred compensation
Long-term debt should be reported net of premium or discount. Standard and Poor's Compustat will collect the net figure.
Long-Term Debt - Total - Note Mnemonic DLTTF

Research Insight North America Data Guide
114
Code Description ES Includes current portion of Long-Term Debt QT This year's data reflects an accounting change to
conform with FASB #21 (Net of Discount Premium). Effective 10/01/71
Long-Term Debt - Total - Quarterly Mnemonic DLTTQ
Quarterly Data Item Number Q51
Units Millions of dollars
The item represents debt obligations due more than one year from the company's balance sheet date.
This item includes 1. Purchase obligations and payments to officers (when listed as long-term liabilities)
2. Notes payable, due within one year and to be refunded by long-term debt when carried as a non-current liability
3. Long-term lease obligations (capitalized lease obligations)
4. Industrial revenue bonds
5. Advances to finance construction
6. Loans on insurance policies
7. Indebtedness to affiliates
8. Bonds, mortgages, and similar debt
9. All obligations that require interest payments
10. Publishing companies' royalty contracts payable
11. Timber contracts for forestry and paper
12. Extractive industries' advances for exploration and development
13. Production payments and advances for exploration and development
This item excludes 1. Subsidiary preferred stock (included in Minority Interest)
2. The current portion of long-term debt (included in Current Liabilities)
3. Accounts payable due after one year (included in Liabilities - Other)
4. Accrued interest on long-term debt (included in Liabilities - Other)
5. Customers' deposits on bottles, kegs, and cases (included in Liabilities - Other)
6. Deferred compensation
Long-term debt should be reported net of premium or discount. Standard and Poor's Compustat will collect the net figure.

115
Chapter 3 Balance Sheet
Long-Term Debt - Total - Quarterly - Note Mnemonic DLTTQF
Code Description ES Includes current portion of Long-Term Debt
Minority Interest (Balance Sheet) Mnemonic MIB
Annual Data Item Number A38
Units Millions of dollars
This item represents par or stated value of the subsidiary preferred or common stock not owned by the parent company, plus the minority interest's equity in the surplus of the subsidiary.
Dividends in arrears on subsidiary preferred stock not owned by the parent company are included.
Subsidiary preferred stock is excluded for utility companies (included in Preferred Stock - Carrying Value).
Minority Interest (Balance Sheet) - Quarterly Mnemonic MIBQ
Quarterly Data Item Number Q53
Units Millions of dollars
This item represents par or stated value of the subsidiary preferred or common stock not owned by the parent company, plus the minority interest's equity in the surplus of the subsidiary.
Dividends in arrears on subsidiary preferred stock not owned by the parent company are included.
Subsidiary preferred stock is excluded for utility companies (included in Preferred Stock - Carrying Value).
This item is not available for utilities.
Notes Payable Mnemonic NP
Annual Data Item Number A206
Units Millions of dollars
This item represents the total amount of short-term notes.
This item includes 1. Bank acceptances
2. Bank overdrafts

Research Insight North America Data Guide
116
3. Loans payable to officers of the company
4. Loans payable to parents, and consolidated and unconsolidated subsidiaries
5. Loans payable to stockholders
6. Notes payable - banks, others
7. Brokerage houses' drafts payable
8. Telephone companies' interim notes payable and advances from parent company
9. Commercial paper
This item excludes 1. Current portion of long-term notes payable (included in Debt Due In One Year)
2. Due to factor (included in Current Liabilities - Other)
This item is not available for banks or utilities.
Preferred Stock Mnemonic PSTK
Annual Data Item Number A130
Units Millions of dollars
This item represents the net number of preferred shares at year-end multiplied by the par or stated value per share as presented in the company's Balance Sheet.
This item includes 1. Preferred stock subscriptions
2. Utilities subsidiary preferred stock
3. Redeemable preferred stock
4. Preference stock
5. Receivables on preferred stock
This item excludes 1. Preferred stock sinking funds reported in current liabilities
2. Secondary classes of common stock
3. Subsidiary preferred stock
This item is reduced by the effects of ... 1. Par or carrying value of nonredeemable preferred treasury stock which was netted against this item
prior to annual and quarterly fiscal periods of 1982 and 1986, 1st quarter, respectively
2. Cost of redeemable preferred treasury stock which is netted against Preferred Stock - Redeemable
Preferred Stock - Note Mnemonic PSTKF

117
Chapter 3 Balance Sheet
Code Description ET Includes dividends in arrears
Preferred Stock - Quarterly Mnemonic PSTKQ
Quarterly Data Item Number Q55
Units Millions of dollars
This item represents the net number of preferred shares at yearend multiplied by the par or stated value per share as presented in the company's Balance Sheet.
This item includes 1. Preferred stock subscriptions
2. Utilities subsidiary preferred stock
3. Redeemable preferred stock
4. Preference stock
5. Receivables on preferred stock
This item excludes 1. Preferred stock sinking funds reported in current liabilities
2. Secondary classes of common stock
3. Subsidiary preferred stock
This item is reduced by the effects of ... 1. Par or carrying value of nonredeemable preferred treasury stock which was netted against this item
prior to annual and quarterly fiscal periods of 1982 and 1986, 1st quarter, respectively
2. Cost of redeemable preferred treasury stock which is netted against Preferred Stock - Redeemable
Preferred Stock - Nonredeemable Mnemonic PSTKN
Annual Data Item Number A209
Units Millions of dollars
This item represents the number of the company's nonredeemable preferred shares issued at yearend multiplied by the par or stated value per share.
This item includes 1. Nonredeemable preferred stock subscriptions at par value
2. Nonredeemable preferred treasury shares beginning in 1982
3. Receivables on nonredeemable preferred stock
This item excludes 1. Dividends in arrears

Research Insight North America Data Guide
118
2. Redeemable preferred stock
3. Subsidiary stock (included in Minority Interest)
Prior to 1982, this item was reduced by the dollar amount of nonredeemable preferred treasury shares.
Preferred Stock - Redeemable Mnemonic PSTKR
Annual Data Item Number A175
Units Millions of dollars
This item represents any stock which the issuer undertakes to redeem at a fixed or determinable price on a fixed or determinable date or dates by operation of a sinking fund or other methods.
This item includes 1. Stock which is redeemable at the option of the holder
2. Stock which has conditions for redemption which are not solely within the control of the issuer, such as stocks which must be redeemed out of future earnings
This item excludes 1. Redeemable preferred stock figures for subsidiary stock when reported separately (included in
Minority Interest)
2. Redeemable stock when reported by the company as a current liability
For utilities, this item includes redeemable subsidiary preferred stock.
Preferred Stock - Redeemable - Quarterly Mnemonic PSTKRQ
Quarterly Data Item Number Q71
Units Millions of dollars
This item represents any stock which the issuer undertakes to redeem at a fixed or determinable price on a fixed or determinable date or dates by operation of a sinking fund or other methods.
This item includes 1. Stock which is redeemable at the option of the holder
2. Stock which has conditions for redemption which are not solely within the control of the issuer, such as stocks which must be redeemed out of future earnings
This item excludes 1. Redeemable preferred stock figures for subsidiary stock when reported separately (included in
Minority Interest)
2. Redeemable stock when reported by the company as a current liability
For utilities, this item includes redeemable subsidiary preferred stock.

119
Chapter 3 Balance Sheet
Prepaid Expenses Mnemonic XPP
Annual Data Item Number A160
Units Millions of dollars
This item represents advance payments for services or benefits that are to be received within one operating cycle.
This item includes 1. Advances and/or deposits on material purchases
2. Advances on purchase contracts
3. Advances to suppliers
4. Prepaid advertising
5. Prepaid commissions
6. Prepaid insurance
7. Prepaid interest
8. Prepaid rent
9. Prepaid taxes (unless presented with deferred taxes or as prepaid income taxes)
10. Royalty advances; prepaid royalties
11. Supplies when listed separately from inventory
12. Agriculture companies' advances to planters (when classified as current)
13. Construction companies' advances to subcontractors
14. Motion picture companies'
Advances to other producers
Exhibition rights
Feature film productions
Film rights
Films owned or in production
Production costs and advances
Program rights
Television films
15. Trucking companies' prepaid tires
This item excludes 1. Advances not classified by type unless included in prepaid expenses by the company (included in
Current Assets - Other)
2. Deferred or prepaid taxes when presented together (included in Current Assets -Other)
3. Deferred taxes (included in Current Assets - Other)
4. Deposits (included in Current Assets -Other)
5. Prepaid income taxes (included in Current Assets - Other)

Research Insight North America Data Guide
120
A Combined Figure data code (@CF) in this item indicates that prepaid expenses are included with Current Assets - Other.
This item is not available for banks or utilities.
PP&E (Gross) - Total Mnemonic PPEGT
Annual Data Item Number A7
Units Millions of dollars
This item represents the cost of tangible fixed property used in the production of revenue.
This item includes 1. Advances to vendors for plant expansion programs
2. Capitalized leases
3. Construction in progress and funds for construction (including funds held by trustees)
4. Display fixtures
5. Equipment leased to others
6. Improvements to leased or rental properties
7. Intangibles (included on Schedule V by the company)
8. Leaseholds and leasehold improvements (unless presented as an intangible by the company)
9. Patterns
10. Pollution abatements
11. Property held for future use
12. Tools and dies
13. Unexpended proceeds of industrial revenue bonds
14. Airline companies' deposits and advances on flight equipment
15. Banking companies' and savings and loan companies' office premises and equipment (net only)
16. Beverage producers' bottles, kegs, and cases
17. Broadcasting companies' broadcast rights
18. Extractive industries'
Exploration and development expenditures
Investment in oil and gas properties at cost
Mining concessions and undeveloped leases
Patents and franchises on foreign property
Prepaid mine development and stripping
Seismic libraries
19. Finance and insurance companies' title plants
20. Forestry and paper companies' timberlands and timber rights

121
Chapter 3 Balance Sheet
21. Motion picture production companies'
Noncurrent film costs
Noncurrent inventory
Franchise rights and broadcast licenses
22. Real estate companies' and land developers' land held for development and sale
23. Shipping companies' statutory reserve funds and allowances from the Maritime Administration for vessels traded in (to be used for vessels under construction)
24. Computer software included in property, plant, and equipment by the company
This item excludes 1. Computer software excluded from property, plant and equipment by the company (included in Assets
- Other)
2. Excess cost over value of property (included in Intangibles)
3. Idle land (included in Assets -Other)
4. Goodwill, patents, and other intangibles (included in Intangibles)
5. Long term inventory (included in Assets - Other)
6. Non-real estate companies'
Property purchased and held for investment (included in Investments and Advances - Other)
Land held for resale (included in Investments and Advances - Other)
7. Property not used in operations (included in Assets - Other)
8. Property of discontinued operations (included in Assets - Other)
9. Broadcasting companies'
Program rights (included in Deferred Charges)
Film productions (included in Deferred Charges)
Film rights (included in Deferred Charges)
10. Motion picture industries' film distribution systems (included in Assets - Other)
This item is not available for banks.
PP&E (Gross) - Total - Quarterly Mnemonic PPEGTQ
Quarterly Data Item Number Q118
Units Millions of dollars
This item represents the cost of tangible fixed property used in the production of revenue.
This item includes 1. Advances to vendors for plant expansion programs
2. Capitalized leases
3. Construction in progress and funds for construction (including funds held by trustees)

Research Insight North America Data Guide
122
4. Display fixtures
5. Equipment leased to others
6. Improvements to leased or rental properties
7. Intangibles (included on Schedule V by the company)
8. Leaseholds and leasehold improvements (unless presented as an intangible by the company)
9. Patterns
10. Pollution abatements
11. Property held for future use
12. Tools and dies
13. Unexpended proceeds of industrial revenue bonds
14. Airline companies' deposits and advances on flight equipment
15. Banking companies' and savings and loan companies' office premises and equipment (net only)
16. Beverage producers' bottles, kegs, and cases
17. Broadcasting companies' broadcast rights
18. Extractive industries'
Exploration and development expenditures
Investment in oil and gas properties at cost
Mining concessions and undeveloped leases
Patents and franchises on foreign property
Prepaid mine development and stripping
Seismic libraries
19. Finance and insurance companies' title plants
20. Forestry and paper companies' timberlands and timber rights
21. Motion picture production companies'
Noncurrent film costs
Noncurrent inventory
Franchise rights and broadcast licenses
22. Real estate companies' and land developers' land held for development and sale
23. Shipping companies' statutory reserve funds and allowances from the Maritime Administration for vessels traded in (to be used for vessels under construction)
24. Computer software included in property, plant, and equipment by the company
This item excludes 1. Computer software excluded from property, plant and equipment by the company (included in Assets
- Other)
2. Excess cost over value of property (included in Intangibles)
3. Idle land (included in Assets -Other)
4. Goodwill, patents, and other intangibles (included in Intangibles)

123
Chapter 3 Balance Sheet
5. Long term inventory (included in Assets - Other)
6. Non-real estate companies'
Property purchased and held for investment (included in Investments and Advances - Other)
Land held for resale (included in Investments and Advances - Other)
7. Property not used in operations (included in Assets - Other)
8. Property of discontinued operations (included in Assets - Other)
9. Broadcasting companies'
Program rights (included in Deferred Charges)
Film productions (included in Deferred Charges)
Film rights (included in Deferred Charges)
10. Motion picture industries' film distribution systems (included in Assets - Other)
This item is not available for banks.
PP&E (Net) - Total Mnemonic PPENT
Annual Data Item Number A8
Units Millions of dollars
This item represents the cost, less accumulated depreciation, of tangible fixed property used in the production of revenue.
This item includes 1. Advances to vendors for plant expansion programs
2. Capitalized leases
3. Construction in progress and funds for construction (including funds held by trustees)
4. Display fixtures
5. Equipment leased to others
6. Improvements to leased or rental properties
7. Intangibles (included on Schedule V by the company)
8. Leaseholds and leasehold improvements (unless presented as an intangible by the company)
9. Patterns
10. Pollution abatements
11. Property held for future use
12. Tools and dies
13. Unexpended proceeds of industrial revenue bonds
14. Airline companies' deposits and advances on flight equipment
15. Banking companies' and savings and loan companies' office premises and equipment (net only)
16. Beverage producers' bottles, kegs and cases

Research Insight North America Data Guide
124
17. Broadcasting companies' broadcast rights
18. Extractive industries'
Exploration and development expenditures
Investment in oil and gas properties at cost
Mining concessions and undeveloped leases
Patents and franchises on foreign property
Prepaid mine development and stripping
Seismic libraries
19. Finance and insurance companies' title plants
20. Forestry and paper companies' timberlands and timber rights
21. Motion picture production companies'
Noncurrent film costs
Noncurrent inventory
Franchise rights and broadcast licenses
22. Real estate companies' and land developers' land held for development and sale
23. Shipping companies' statutory reserve funds and allowances from the Maritime Administration for vessels traded in (to be used for vessels under construction)
24. Computer software included in property, plant, and equipment by the company
This item excludes 1. Computer software excluded from property, plant, and equipment by the company (included in Assets
- Other)
2. Excess cost over value of property (included in Intangibles)
3. Idle land (included in Assets - Other)
4. Goodwill, patents, and other intangibles (included in Intangibles)
5. Long-term inventory (included in Assets - Other)
6. Non-real estate companies'
Property purchased and held for investment (included in Investments and Advances - Other)
Land held for resale (included in Investment and Advances - Other)
7. Property not used in operations (included in Assets - Other)
8. Property of discontinued operations (included in Assets - Other)
9. Broadcasting companies'
Program rights (included in Deferred Charges)
Film productions (included in Deferred Charges)
Film rights (included in Deferred Charges)
10. Motion picture industries' film distribution systems (included in Assets - Other)

125
Chapter 3 Balance Sheet
PP&E (Net) - Total - Note Mnemonic PPENTF
Code Description TG Company uses successful efforts method of
accounting TH Company uses full-cost method of accounting
PP&E (Net) - Total - Quarterly Mnemonic PPENTQ
Quarterly Data Item Number Q42
Units Millions of dollars
This item represents the cost, less accumulated depreciation, of tangible fixed property used in the production of revenue.
This item includes 1. Advances to vendors for plant expansion programs
2. Capitalized leases
3. Construction in progress and funds for construction (including funds held by trustees)
4. Display fixtures
5. Equipment leased to others
6. Improvements to leased or rental properties
7. Intangibles (included on Schedule V by the company)
8. Leaseholds and leasehold improvements (unless presented as an intangible by the company)
9. Patterns
10. Pollution abatements
11. Property held for future use
12. Tools and dies
13. Unexpended proceeds of industrial revenue bonds
14. Airline companies' deposits and advances on flight equipment
15. Banking companies' and savings and loan companies' office premises and equipment (net only)
16. Beverage producers' bottles, kegs and cases
17. Broadcasting companies' broadcast rights
18. Extractive industries'
Exploration and development expenditures
Investment in oil and gas properties at cost

Research Insight North America Data Guide
126
Mining concessions and undeveloped leases
Patents and franchises on foreign property
Prepaid mine development and stripping
Seismic libraries
19. Finance and insurance companies' title plants
20. Forestry and paper companies' timberlands and timber rights
21. Motion picture production companies'
Noncurrent film costs
Noncurrent inventory
Franchise rights and broadcast licenses
22. Real estate companies' and land developers' land held for development and sale
23. Shipping companies' statutory reserve funds and allowances from the Maritime Administration for vessels traded in (to be used for vessels under construction)
24. Computer software included in property, plant, and equipment by the company
This item excludes 1. Computer software excluded from property, plant, and equipment by the company (included in Assets
- Other)
2. Excess cost over value of property (included in Intangibles)
3. Idle land (included in Assets - Other)
4. Goodwill, patents, and other intangibles (included in Intangibles)
5. Long-term inventory (included in Assets - Other)
6. Non-real estate companies'
Property purchased and held for investment (included in Investments and Advances - Other)
Land held for resale (included in Investment and Advances - Other)
7. Property not used in operations (included in Assets - Other)
8. Property of discontinued operations (included in Assets - Other)
9. Broadcasting companies'
Program rights (included in Deferred Charges)
Film productions (included in Deferred Charges)
Film rights (included in Deferred Charges)
10. Motion picture industries' film distribution systems (included in Assets - Other)
Real Estate Property - Total Mnemonic RET
Statement Balance Sheet
Annual Data Item Number A391

127
Chapter 3 Balance Sheet
This item represents investment in real estate less accumulated depreciation and amortization reported on the Balance Sheet. For Real Estate Investment companies, property is considered investments at cost.
This items includes 1. Real Estate
2. Real Estate held for Sale
3. Real Estate available for Sales
4. Rental Properties
5. Property under development
6. Real Estate Investments
7. Total Properties
8. Undeveloped property held for investment or sale
9. Operating Real Estate Assets
10. Real Estate Owned
This items excludes 1. Personal Property (PPE that the company is using, not revenue producing)
2. Investment in unconsolidated real estate entities
3. Mortgage Loans
4. Investment in direct financing leases
5. Investment in Real Estate Joint Ventures
This item is available for Real Estate Investment Trust companies, only.
Real Estate Property - Total - Quarterly Mnemonic RETQ
Statement Balance Sheet
Data Item Number Q270
This item represents investment in real estate less accumulated depreciation and amortization reported on the Balance Sheet. For Real Estate Investment companies, property is considered investments at cost.
This items includes 1. Real Estate
2. Real Estate held for Sale
3. Real Estate available for Sales
4. Rental Properties
5. Property under development
6. Real Estate Investments
7. Total Properties

Research Insight North America Data Guide
128
8. Undeveloped property held for investment or sale
9. Operating Real Estate Assets
10. Real Estate Owned
This items excludes 1. Personal Property (PPE that the company is using, not revenue producing)
2. Investment in unconsolidated real estate entities
3. Mortgage Loans
4. Investment in direct financing leases
5. Investment in Real Estate Joint Ventures
This item is available for Real Estate & Investment Trust companies, only.
Receivables - Other Current Mnemonic RECCO
Annual Data Item Number A194
Units Millions of dollars
This item represents claims against others collectible in cash, generally within one year of the Balance Sheet date.
This item includes 1. Trade receivables when combined with current receivables
2. Accrued interest
3. Amounts due from officers and employees when listed as current
4. Receivables due from unconsolidated subsidiaries/associate companies
5. Claims against others
6. Claims in litigation
7. Commercial paper issued by unconsolidated subsidiaries to parent company
8. Dividends receivable
9. Investment in bank participation notes
10. Money due from sale of securities
11. Pension trust fund payments recoverable from employees
12. Retainages
13. Sundry and miscellaneous receivables when stated separately
14. Notes receivable when listed separately from accounts receivable
15. Taxes receivable other than income taxes
This item excludes 1. Trade receivables (claims owed by customers for goods and services sold in the ordinary course of
business)
2. Advances on material purchases

129
Chapter 3 Balance Sheet
3. Estimated future income tax benefits
4. Income tax refunds
This item is not available for banks or utilities.
Receivables - Total Mnemonic RECT
Annual Data Item Number A2
Units Millions of dollars
This item represents claims against others (after applicable reserves) collectible in money, generally within one year.
This item includes 1. Trade, miscellaneous, and other receivables
2. Amounts due from unconsolidated subsidiaries
3. Income tax refunds, recoverable income taxes, etc.
4. Money due from sales of securities
5. Unbilled shipments received by customers
6. Amounts listed as current assets due from officers and employees
7. Property to be sold under lease-back arrangements
8. Commercial paper issued by unconsolidated subsidiaries to the parent company
9. U.S. government contract billings and expensed contracts
10. Accrued operating differential subsidies (shipping companies)
11. Miscellaneous receivables when stated separately
12. Claims in litigation
13. Dividends receivable
14. Costs and estimated profit on uncompleted contracts (if billed)
15. Accrued interest
16. Amount of discount due from a third party for discounting receivables (due from factor)
17. Investment in bank participation notes
18. Recoverable costs on lease-back agreements
19. Unbilled lease revenues
20. Expenditures billable to clients for advertising agencies
21. Unbilled costs on contracts and costs in excess of related billings when treated as trade receivables by the company
This item excludes 1. Advances on material purchases (treated as an inventory item)
2. Work in process and advances to subcontractors (treated as an inventory item)
3. Estimated future income tax benefits (included in Current Assets - Other)

Research Insight North America Data Guide
130
4. Reserves for unearned charges on commercial installment and equipment lease receivables (Receivables - Total are stated after deducting these items)
5. Allowance for doubtful accounts (Receivables - Total are stated after deducting these items)
6. Reserves for losses for finance companies (Receivables - Total are stated after deducting these items)
7. Unbilled costs on contracts and costs in excess of related billings when treated as inventory items by the company
This item is not available for utilities.
Receivables - Total - Quarterly Mnemonic RECTQ
Quarterly Data Item Number Q37
Units Millions of dollars
This item represents claims against others (after applicable reserves) collectible in money, generally within one year.
This item includes 1. Trade, miscellaneous, and other receivables
2. Amounts due from unconsolidated subsidiaries
3. Income tax refunds, recoverable income taxes, etc.
4. Money due from sales of securities
5. Unbilled shipments received by customers
6. Amounts listed as current assets due from officers and employees
7. Property to be sold under lease-back arrangements
8. Commercial paper issued by unconsolidated subsidiaries to the parent company
9. U.S. government contract billings and expensed contracts
10. Accrued operating differential subsidies (shipping companies)
11. Miscellaneous receivables when stated separately
12. Claims in litigation
13. Dividends receivable
14. Costs and estimated profit on uncompleted contracts (if billed)
15. Accrued interest
16. Amount of discount due from a third party for discounting receivables (due from factor)
17. Investment in bank participation notes
18. Recoverable costs on lease-back agreements
19. Unbilled lease revenues
20. Expenditures billable to clients for advertising agencies

131
Chapter 3 Balance Sheet
21. Unbilled costs on contracts and costs in excess of related billings when treated as trade receivables by the company
This item excludes 1. Advances on material purchases (treated as an inventory item)
2. Work in process and advances to subcontractors (treated as an inventory item)
3. Estimated future income tax benefits (included in Current Assets - Other)
4. Reserves for unearned charges on commercial installment and equipment lease receivables (Receivables - Total are stated after deducting these items)
5. Allowance for doubtful accounts (Receivables - Total are stated after deducting these items)
6. Reserves for losses for finance companies (Receivables - Total are stated after deducting these items)
7. Unbilled costs on contracts and costs in excess of related billings when treated as inventory items by the company
This item is not available for utilities.
Receivables - Trade Mnemonic RECTR
Annual Data Item Number A151
Units Millions of dollars
This item represents amounts on open account (net of applicable reserves) owed by customers for goods and services sold in the ordinary course of business.
This item includes 1. Trade accounts receivable
2. Trade notes and acceptances receivable
3. Receivables (when not specifically classified by type); for example, unbilled shipments received by customers
4. Accounts and notes receivable only when a company identifies them as principally trade accounts and notes
5. Equity in installment accounts sold to finance subsidiaries
6. Dealer accounts receivable
7. Unbilled costs on contracts and costs in excess of related billings when treated as trade receivables by the company.
This item is not available for banks or utilities.
Retained Earnings Mnemonic RE
Annual Data Item Number A36
Units Millions of dollars

Research Insight North America Data Guide
132
This item represents the cumulative earnings of the company less total dividend distributions to shareholders. Stock adjustments made to this item relate to unissued shares.
This item includes 1. Accumulated earnings/deficit
2. Accumulated other comprehensive loss/gain
3. Additional Minimum Liability for underfunded pension plans
4. Appropriated retained earnings
5. Cumulative translation adjustments effect
6. Deferred compensation effect when reported in the Equity section of the Balance Sheet
7. Dividends paid on Employee Stock Ownership Plan (ESOP) shares
8. Earnings retained for use in the business – earned surplus
9. Employee stock ownership plan shares purchased with debt
10. Issuable stock
11. Miscellaneous notes receivable (except for subscription stock receivables)
12. Noncorporate proprietorship
13. Notes receivable under stock purchase plan
14. Reacquired capital stock
15. Reserve for self insurance
16. Reserve for shares to be issued when included in the Equity section of the Balance Sheet
17. Stock options, warrants, and rights
18. Unappropriated retained earnings
19. Unrealized gain/loss on investments
This item excludes 1. Notes receivable under all common stock purchase plans, including stock purchase plans (included in
Capital Surplus)
2. Notes receivable under all preferred stock purchase plans
3. ESOPs and Notes Receivables from ESOPs
4. Reserve account for shares to be repurchased (included in Capital Surplus)
5. Subscription stock receivables (included in Capital Surplus)
Prior to fiscal period 1982 on the annual file and 1986, 1st quarter on the quarterly file, Standard & Poor's deducted the excess over par of both common and nonredeemable preferred treasury stock from this item when a company did not maintain a capital surplus account or when the excess of treasury stock over par exceeded the capital surplus account.
Retained Earnings - Note Mnemonic REF

133
Chapter 3 Balance Sheet
Code Description JD Reflects adjustment for stock splits or dividends
Retained Earnings - Quarterly Mnemonic REQ
Quarterly Data Item Number Q58
Units Millions of dollars
This item represents the cumulative earnings of the company less total dividend distributions to shareholders.
This item includes 1. Accumulated earnings/deficit
2. Accumulated other comprehensive loss/gain
3. Additional Minimum Liability for underfunded pension plans
4. Appropriated retained earnings
5. Cumulative translation adjustments effect
6. Deferred compensation effect when reported in the Equity section of the Balance Sheet
7. Dividends paid on Employee Stock Ownership Plans (ESOP) shares
8. Earnings retained for use in the business – earned surplus
9. Issuable stock
10. Miscellaneous notes receivable (except for subscription stock receivables)
11. Noncorporate proprietorship
12. Reacquired capital stock
13. Reserve for self insurance
14. Reserve for shares to be issued when included in the Equity section of the Balance Sheet
15. Stock options, warrants, and rights
16. Surplus arising from the re-valuation of assets
17. Unappropriated retained earnings
18. Unrealized gain/loss on investments
This item excludes 1. Notes receivables under all common stock purchase plans, including restrictive stock purchase plans
(included in Capital Surplus)
2. Notes receivable under all preferred stock purchase plans
3. ESOPs and Notes Receivable from ESOPs
4. Reserve account for shares to be repurchased (included in Capital Surplus)
5. Subscription stock receivables (included in Capital Surplus)

Research Insight North America Data Guide
134
Prior to fiscal period 1982 on the annual file and 1986, 1st quarter on the quarterly file, Standard & Poor's deducted the excess over par of both common and nonredeemable preferred treasury stock from this item when a company did not maintain a capital surplus account or when the excess of treasury stock over par exceeded the capital surplus account.
Retained Earnings - Quarterly - Note Mnemonic REQF
Code Description JD Reflects adjustment for stock splits or dividends
Short-Term Investments Mnemonic IVST
Annual Data Item Number A193
Units Millions of dollars
This item represents currently marketable investments as presented in the current asset section of the Balance Sheet. Such investments may be converted to cash within a relatively short period of time.
This item includes 1. Accrued interest included with short-term investments by the company
2. Cash in escrow
3. Cash segregated under federal and other regulations
4. Certificates of deposit included in short-term investments by the company
5. Certificates of deposit reported as a separate item in current assets
6. Commercial paper
7. Gas transmission companies' special deposits
8. Good faith and clearing house deposits for brokerage firms
9. Government and other marketable securities-including stocks and bonds-listed as short-term
10. Margin deposits on commodity futures contracts
11. Marketable securities
12. Money market fund
13. Real estate investment trusts' shares of beneficial interest
14. Repurchase agreements (when shown as a current asset)
15. Restricted cash (when shown as a current asset)
16. Time deposits and time certificates of deposit (savings accounts when shown as a current asset)

135
Chapter 3 Balance Sheet
17. Treasury bills - listed as short-term
This item excludes 1. Accrued interest not included in short-term investments by the company (included in Receivables -
Other Current)
2. Bullion, bullion in transit, uranium in transit, among others (included in Inventories - Total)
3. Cash, demand deposits (included in Cash and Short-Term Investments)
4. Certificates of deposit included in cash by the company (included in Cash and Short-Term Investments)
5. Commercial paper issued by unconsolidated subsidiaries to parent company (included in Receivables - Other Current)
6. Demand certificates of deposit (included in Cash and Short-Term Investments)
7. Money due from sale of debentures (included in Receivables - Other Current)
8. Short-term investment at equity (included in Current Assets - Other)
This item is not available for banks or utilities.
Stockholders' Equity Mnemonic SEQ
Annual Data Item Number A216
Units Millions of dollars
This item represents the common and preferred shareholders' interest in the company.
This item includes 1. Capital surplus
2. Common stock
3. Nonredeemable preferred stock
4. Redeemable preferred stock
5. Retained earnings
6. Treasury Stock - Total Dollar Amount (reduces Stockholder's Equity)
Stockholders' Equity - Quarterly Mnemonic SEQQ
Quarterly Data Item Number Q60
Units Millions of dollars
This item represents the common and preferred shareholders' interest in the company.
This item includes 1. Capital surplus
2. Common stock

Research Insight North America Data Guide
136
3. Nonredeemable preferred stock
4. Redeemable preferred stock
5. Retained earnings
6. Treasury Stock - Total Dollar Amount (reduces Stockholder's Equity)
Treasury Stock - Dollar Amount - Total Mnemonic TSTK
Annual Data Item Number A88
Units Millions of dollars
This item represents the dollar amount of a company's common stock and nonredeemable preferred stock which has been reacquired and placed into treasury. A company uses the cost method to account for this stock and shows it on the Balance Sheet as a deduction to equity.
This item excludes redeemable preferred treasury stock which is netted against Preferred Stock - Redeemable.
Prior to 1982 on the annual file and 1986, first quarter on the quarterly file, this item will contain a Combined Figure data code (@CF) if a company's common treasury stock and nonredeemable preferred treasury stock was netted against Common Stock or Preferred Stock - Carrying Value. Standard & Poor's will represent a zero for the fiscal periods previously mentioned if a company either used the retirement method of accounting for treasury stock or did not have any treasury stock.
If a company uses the cost method to account for treasury stock, this item will present actual figures for use in equity balancing models beginning in 1982 on the annual file and 1986, first quarter on the quarterly file.
Treasury Stock - Dollar Amount - Total - Quarterly Mnemonic TSTKQ
Quarterly Data Item Number Q98
Units Millions of dollars
This item represents the dollar amount of a company's common stock and nonredeemable preferred stock which has been reacquired and placed into treasury. A company uses the cost method to account for this stock and shows it on the Balance Sheet as a deduction to equity.
This item excludes redeemable preferred treasury stock which is netted against Preferred Stock - Redeemable.
Prior to 1982 on the annual file and 1986, first quarter on the quarterly file, this item will contain a Combined Figure data code (@CF) if a company's common treasury stock and nonredeemable preferred treasury stock was netted against Common Stock or Preferred Stock - Carrying Value. Standard & Poor's will represent a zero for the fiscal periods previously mentioned if a company either used the retirement method of accounting for treasury stock or did not have any treasury stock.
If a company uses the cost method to account for treasury stock, this item will present actual figures for use in equity balancing models beginning in 1982 on the annual file and 1986, first quarter on the quarterly file.

137
Chapter 4 Supplemental Balance Sheet
Supplemental Balance Sheet
This chapter presents supplementary balance sheet items collected from companies' notes to the financial statements.
Supplemental Balance Sheet Items
Data Item Name
Annual Mnemonic . . . page
Quarterly Mnemonic . . . page
ADR Ratio ADRR . . . 151 Accumulated Depreciation of Real Estate Property
DPACRE . . . 151 DPACREQ . . . 151
Assets - Long Term - Other ALTOQ . . . 153 Assets - Other - Excluding Discontinued Operations
AODO . . . 153
Average Collection Period COLLECT . . . 347 COLLECTQ . . . 348 Bad Debt Reserve Ratio RECDR . . . 348 Book Value per Share BKVLPS . . . 634 Book Value per Share - Average 3 Yr BKVLPS3 . . . 633 Book Value per Share - Average 5 Yr BKVLPS5 . . . 633 Book Value per Share - Average 10 Yr BKVLPS10 . . . 633 Common Equity - Liquidation Value CEQL . . . 154 Common Equity - Tangible CEQT . . . 155 Common Shares Issued CSHI . . . 155 CSHIQ . . . 155 Common Shares Outstanding - Company
CSHO . . . 156 CSHOQ . . . 156
Common Stock per Share Carrying Value
CSTKCV . . . 100
Compensating Balance CB . . . 157 Contingent Liabilities - Guarantees CLG . . . 158 Convertible Debt and Preferred Stock DCPSTK . . . 158 Current Assets - Discontinued Operations
ACDO . . . 159
Current Assets - Other - Excl. Discontinued Operations
ACODO . . . 159
Current Deferred Tax Liability DTLC . . . 160 Days to Pay Accounts Payable PAYAP . . . 160 PAYAPQ . . . 160 Days to Sell Inventory SELLINV . . . 160 SELLINVQ . . . 161 Debt - Capitalized Lease Obligation DCLO . . . 161
CHAPTER 4

Research Insight North America Data Guide
138
Debt - Consolidated Subsidiary DCS . . . 162 Debt - Convertible Total DCVT . . . 163 Debt - Debentures DD . . . 163 Debt - Finance Subsidiary DFS . . . 165 Debt - Mortgage and Other Secured DM . . . 166 Debt - Notes DN . . . 166 Debt - Senior Convertible DCVSR . . . 168 Debt - Subordinated DS . . . 168 Debt - Subordinated Convertible DCVSUB . . . 162 Debt - Unamortized Debt Discount and Other
DUDD . . . 169
Debt - Other - Long-Term DLTO . . . 167 Debt Due in 2nd Year DD2 . . . 163 Debt Due in 3rd Year DD3 . . . 164 Debt Due in 4th Year DD4 . . . 164 Debt Due in 5th Year DD5 . . . 164 Deferred Compensation DCOM . . . 169 DCOMQ . . . 169 Deferred Revenue - Current DRC . . . 170 Earnings Assets - Total EAT . . . 170 EATQ . . . 171 Goodwill GDWL . . . 171 Intangibles - Other INTANO . . . 171 INTANOQ . . . 173 Interest Capitalized INTC . . . 174 Inventories - Finished Goods INVFG . . . 175 Inventories - Other INVO . . . 175 Inventories - Raw Materials INVRM . . . 175 Inventories - Work in Process INVWIP . . . 176 Inventory Valuation Method INVVAL . . . 40 Invested Capital - Total ICAPT . . . 115 ICAPTQ . . . 116 LIFO Reserve LIFR . . . 177 Long-Term Assets of Discontinued Operations- Other
ALDO . . . 177
Long-Term Debt - Tied to Prime DLTP . . . 177 Long-Term Deferred Revenue DRLT . . . 178 Long-Term Investments - Total - Quarterly
IVLTQ . . . 178
Marketable Securities Adjustment MSA . . . 178 Net Charge-Offs NCO . . . 384 NCOQ . . . 384 Nonperforming Assets - Total NPAT . . . 178 NPATQ . . . 178 Other Accumulated Comprehensive Income
ACOMINC . . . 179 ACOMINCQ . . . 179
Preferred Dividends in Arrears DVPA . . . 180 Preferred Stock - Convertible PSTKC . . . 180

139
Chapter 4 Supplemental Balance Sheet
Preferred Stock - Liquidating Value PSTKL . . . 181 Preferred Stock - Redemption Value PSTKRV . . . 181 Receivables - Estimated Doubtful RECD . . . 182 Rental Commitments - Minimum (5 Years Total)
MRCT . . . 184
Rental Commitments - Minimum (1st Year)
MRC1 . . . 182
Rental Commitments - Minimum (2nd Year)
MRC2 . . . 183
Rental Commitments - Minimum (3rd Year)
MRC3 . . . 183
Rental Commitments - Minimum (4th Year)
MRC4 . . . 183
Rental Commitments - Minimum (5th Year)
MRC5 . . . 184
Rent Commitments - Thereafter MRCTA . . . 184 Reserve for Loan/Asset Losses RLL . . . 396 RLLQ . . . 396 Retained Earnings - Cumulative Translation Adjustment
RECTA . . . 185
Retained Earnings - Other Adjustments REAJO . . . 185 Retained Earnings - Unadjusted REUNA . . . 186 Retained Earnings - Unrestricted REUNR . . . 187 Retained Earnings - Restatement REA . . . 185 Short-Term Borrowings - Average BAST . . . 154 Short-Term Borrowings - Average Interest Rate
BASTR . . . 154
Stockholders' Equity Adjustments SEQO . . . 187 Tax Loss Carry Forward TLCF . . . 189 Treasury Stock - Dollar Amount - Common
TSTKC . . . 189
Treasury Stock - Dollar Amount - Preferred
TSTKP . . . 190
Treasury Stock - Memo Entry TSTKME . . . 190 Treasury Stock - Number of Common Shares
TSTKN . . . 191
Working Capital (Balance Sheet) WCAP . . . 191


141
Chapter 4 Supplemental Balance Sheet
Data Definitions
Accumulated Depreciation of Real Estate Property Mnemonic DPACRE
Statement Balance Sheet
Data Item number A390
This item represents the accumulated depreciation and amortization of the property at cost value as reported on the Balance Sheet.
This items includes 1. Accumulated depreciation and amortization of Real Estate Properties
2. Accumulated Depreciation of Rental Properties
This items excludes: 1. Depreciation or amortization of personal property
2. Amortization of intangibles
This item is available for Real Estate & Investment Trust companies only.
Accumulated Depreciation of Real Estate Property - Quarterly Mnemonic DPACREQ
Statement Balance Sheet
Data Item Number Q269
This item represents the accumulated depreciation and amortization of the property at cost value as reported on the Balance Sheet.
This items includes 1. Accumulated depreciation and amortization of Real Estate Properties
2. Accumulated Depreciation of Rental Properties
This items excludes: 1. Depreciation or amortization of personal property
2. Amortization of intangibles
This item is available for Real Estate & Investment Trust companies, only.
ADR Ratio Mnemonic ADRR
Data Item Number A234
Units Ratio
This item represents the number of a foreign company’s common or ordinary shares that are equivalent to one American Depositary Receipt (ADR) or one American Depositary Share (ADS). The ADR ratio is used to convert share and per-share data that is expressed in terms of the company's common stock into data expressed in terms of American Depositary Receipts.

Research Insight North America Data Guide
142
The ADR ratio is usually a whole number. For example, if two shares of common stock are equivalent to one American Depositary Receipt, this item has a data value of 2.00.
This item is available only for foreign companies that trade American Depositary Receipts or American Depositary Shares in the U.S.
Companies that trade ADRs usually have an "-ADR" or "-ADS" suffix following the company names. However, variations exist, and a few companies have other suffixes indicating that the company trades ADRs. Examples of the suffixes are:
-ADR NEW
-AM SHARES
-AMER SH
-NY REG
-NY SH
-NY SHARES
-SPON ADR
This item is available for Industrial companies, only. It is not available for Banks or Utility companies.
ADR RATIO - Quarterly Mnemonic ADRRQ
Units Ratio
Data Item Number Q273
This item represents the number of a foreign company’s common or ordinary shares that are equivalent to one American Depositary Receipt (ADR) or one American Depositary Share (ADS).
The ADR ratio is usually a whole number. For example, if two shares of common stock are equivalent to one American Depositary Receipt, this item has a data value of 2.00.
This item is available only for foreign companies that trade American Depositary Receipts or American Depositary Shares in the U.S.
Companies that trade ADRs usually have an "-ADR" or "-ADS" suffix following the company names. However, variations exist, and a few companies have other suffixes indicating that the company trades ADRs. Examples of the suffixes are:
-ADR NEW
-AM SHARES
-AMER SH
-NY REG
-NY SH
-NY SHARES
-SPON ADR
This item is available for Industrial companies, only. It is not available for Banks or Utility companies.

143
Chapter 4 Supplemental Balance Sheet
Assets - Long-Term - Other - Quarterly Mnemonic ALTOQ
Statement Balance Sheet
Data Item Number Q236
This item is the sum of:
Deferred Charges (DC)
Long-Term Assets of Discontinued Operations (ALDO)
Assets - Other (AO)
Average Short-Term Borrowings Mnemonic AODO
Data Item Number A355
Units Millions of dollars
This item represents long term assets that are not PP&E, Investments and Advances, Intangibles, Deferred Charges, or Long-term assets of Discontinued Operations.
This item includes 1. Advances to sales staff
2. Amounts due from directors, officers, employees and all holders of equity securities other than unconsolidated subsidiaries
3. Assets Held for Sale
4. Capitalized/Purchased Software
5. Cash on deposit pursuant to loan agreements
6. Cash surrender value of life insurance policies
7. Cemetery Property
8. Claims in litigation
9. Computer software licenses
10. Contracts
11. Deferred Taxes
12. Deferred finance charges on installment obligations when deducted from receivables for Finance Service companies
13. Film distribution systems for Motion Picture companies
14. Deposits
15. Idle land
16. Investments in company's own securities
17. Long-term inventory
18. Materials and supplies
19. Minority interest in consolidated subsidiaries

Research Insight North America Data Guide
144
20. Negative goodwill
21. Pension and other special funds
22. Property not used in operations
23. Restricted cash & Restricted Investments
24. Timberlands (except for Forest and Paper companies - PP&E)
25. Treasury stock (on the asset side)
This item excludes: 1. Computer software if included in PP&E on the balance sheet or on Schedules V and VI.
2. Computer software patent costs
3. Technology and Technological know-how (include in Intagibles prior to 12/31/01)
4. Intellectual Property (include in Intagibles prior to 12/31/01)
Average Short-Term Borrowings Mnemonic BAST
Data Item Number A104
Units Millions of dollars
This item represents the approximate aggregate short-term financing outstanding during the company's reporting year. Short-term borrowings are usually in the form of credit with banks.
Average Short-Term Borrowings Rate Mnemonic BASTR
Data Item Number A105
Units Percentage
This item represents the approximate weighted average interest rate for aggregate short-term borrowings for the reporting year.
Common Equity - Liquidation Value Mnemonic CEQL
Annual Data Item Number A235
Units Millions of dollars
This item represents the common shareholders' interest in a company in the event of liquidation of company assets. Common equity is adjusted by the preferred stockholders' legal claims against the company.
This item is not available for utilities.

145
Chapter 4 Supplemental Balance Sheet
Common Equity - Tangible Mnemonic CEQT
Annual Data Item Number A11
Units Millions of dollars
This item represents common stock plus the following items ... 1. Retained earnings
2. Capital surplus
3. Self-insurance reserves (when included in the Equity section)
4. Capital stock premium
Common equity deductions are ... 1. Treasury stock adjustments
2. Intangibles (except for property and casualty companies)
3. Accumulated unpaid preferred dividends
4. Excess of involuntary liquidating value of outstanding preferred stock over carrying value (not deducted on banks, utilities, or property and casualty companies)
Deferred Taxes and Investment Tax Credit are not included in this figure.
Negative equity figures are shown where applicable.
Common Shares Issued Mnemonic CSHI
Data Item Number A396
This item represents the total number of common shares purchased by the public and the number of common shares purchased and held by the issuing corporation.
This item is the sum of:
Common Shares Outstanding (CSHO)
Treasury Stock - Number of Common Shares (TSTKN)
Common Shares Issued - Quarterly Mnemonic CSHIQ
Data Item Number Q277
This item represents the total number of common shares purchased by the public and the number of common shares purchased and held by the issuing corporation.
This item includes
Common Shares Outstanding
Treasury Stock - Number of Common Shares

Research Insight North America Data Guide
146
Common Shares Outstanding - Company Mnemonic CSHO
Annual Data Item Number A25
Units Millions
This item represents the net number of all common shares outstanding at yearend, excluding treasury shares and scrip.
Common treasury shares carried on the asset side of the balance sheet are netted against the number of common shares issued.
Common shares paid in stock dividends are included when the ex-dividend date falls within the year and the payment date the next year.
Common Shares Outstanding will not be the same as Common Shares for Basic Earnings per Share when the company reports earnings per share based on average shares, when there has been a change in the shares over the year, when more than one class of common stock is outstanding or when the company reports earnings per share based on common stock equivalents.
Common shares will be excluded when a company nets shares held by a consolidated subsidiary against the capital account.
Common Shares Outstanding - Company - Quarterly Mnemonic CSHOQ
Quarterly Data Item Number Q61
Units Millions
This item represents the net number of all common shares outstanding at the end of the quarter, excluding treasury shares and scrip.
Common treasury shares carried on the asset side of the balance sheet are netted against the number of common shares issued.
Common shares paid in stock dividends are included when the ex-dividend date falls within the year and the payment date the next year.
Common Shares Outstanding will not be the same as Common Shares for Basic Earnings per Share when the company reports earnings per share based on average shares, when there has been a change in the shares over the year, when more than one class of common stock is outstanding or when the company reports earnings per share based on common stock equivalents.
Common shares will be excluded when a company nets shares held by a consolidated subsidiary against the capital account.
Common Shares Outstanding - Company - Quarterly - Note Mnemonic CSHOQF

147
Chapter 4 Supplemental Balance Sheet
Code Description JI Reflects current shares outstanding from FT
Interactive Data JQ Report date differs from balance sheet date ZF Shares carried forward from previous quarter
Common Stock - Per Share Carrying Value Mnemonic CSTKCV
Annual Data Item Number A232
Units Dollars and cents
This item represents the amount specified in a company's articles of incorporation for each share of common stock as imprinted on the face of each stock certificate. In most cases, common stock is carried on the balance sheet at its nominal or par value. If a nominal or par value is not actually reported, Standard & Poor's inputs the carrying value.
If a company has two or more classes of common stock, a Not Available data code (@NA) will appear.
This item is not available for banks or utilities.
Compensating Balance Mnemonic CB
Annual Data Item Number A168
Units Millions of dollars
This item represents cash balances required by a lending institution to support notes payable and lines of credit extended to a company.
This item includes compensating balances held in demand deposits, time deposits and any other instruments of the bank.
This item is not available for banks or utilities.
Contingent Liabilities - Guarantees Mnemonic CLG
Annual Data Item Number A327
Units Millions of dollars
This item represents the company's potential obligation for payment to a third party if customers or subscribers fail to perform under the terms of various credit or debt agreements that the company has guaranteed. This obligation is not recognized until the outcome is probable (in the company's opinion).
This item includes 1. Guarantees issued to back debt (commercial paper) and securities.
2. Commodity/margin support guarantees.

Research Insight North America Data Guide
148
3. Foreign guarantees.
4. Guarantees on both principal and interest.
5. Lines of credit guarantees (on amounts actually outstanding).
6. Redeemable preferred stock guarantees.
7. Stand-by letters of credit.
This item excludes ... 1. Contingencies unrelated to financial or debt instruments.
2. Guarantees, reported in other liabilities on of the Balance Sheet.
3. Performance guarantees.
Contingent Liabilities - Guarantees - Notes Mnemonic CLGF
Code Description ER Does not represent an exact amount
Convertible Debt and Preferred Stock Mnemonic DCPSTK
Annual Data Item 39
Units Millions of dollars
This item represents the balance sheet amount of outstanding convertible debt and the carrying value of convertible preferred stock that is reported as being convertible into common stock.
This item is not available for banks.
For utilities, this item also includes subsidiary preferred stock.
Current Assets - Discontinued Operations Mnemonic ACDO
Data Item Number A351
Discontinued operations represent a major line of business that a company plans to dispose of. Companies report assets related to these segments separately.
This item includes all assets of discontinued operations classified as current.
This item excludes assets held for sale if they do not specifically apply to discontinued operations
This item is available for Industrial companies, only. It is not available for Banks or Utility companies.

149
Chapter 4 Supplemental Balance Sheet
Current Assets - Other - Excluding Discontinued Operations Mnemonic ACODO
Annual Data Item Number A354
Units Millions of dollars
This item represent those items that are not cash and equivalents, receivables, and/or inventory, prepaid expenses.
This item includes 1. Advances not classified by type
2. Cash Surrender value of life insurance policies
3. Deferred charges when listed as current
4. Deferred or prepaid taxes
5. Deferred Taxes
6. Deposits
7. Estimated claims and other liabilities under Chapter XI Bankruptcy proceedings
8. Estimated future income tax benefits
9. Joint ventures at equity for Construction companies
10. Leases held for sale for Oil companies
11. Prepaid expenses when combined with other current assets
12. Prepaid income taxes
13. Properties held for development and sale (within one year for non-real estate companies)
14. Total of current amounts of advances due from parents and consolidated subsidiaries
15. This item excludes:
16. Property and assets related to discontinued operations
17. Prepaid taxes
18. Supplies
19. Tools listed as current assets
Current Deferred Tax Liab. Mnemonic DTLC
This item represents the current portion of a Deferred Tax Liability that arises as an indeterminate term liability when the pretax income shown on the tax return is less than what it should have been had the same accounting principles and cost basis for assets and liabilities been used in tax returns as was used for financial reporting.
Days to Pay Accounts Payable Mnemonic PAYAP

Research Insight North America Data Guide
150
Concept Calculation AP/((INVT+COGS+DP-INVT[-1]-DP [-1])/360)
This concept is Accounts Payable divided by the sum of Inventories - Total plus Cost of Goods Sold plus Depreciation and Amortization minus the previous value for Inventories - Total minus the previous value for Depreciation and Amortization. This total is divided by 360.
Days to Pay Accounts Payable - Quarterly Mnemonic PAYAPQ
Concept Calculation APQ/((INVTQ+COGS12+DP12-INVTQ[-1]-DP12[-1])/360)
This concept is Accounts Payable - Quarterly divided by the sum of Inventories - Total - Quarterly plus Cost of Goods Sold - 12-Months Moving plus Depreciation & Amortization – 12 Months Moving minus the previous value for Inventories - Total – Quarterly minus the previous value for Depreciation & Amortization – 12 Months Moving. This total is divided by 360.
Days to Sell Inventory Mnemonic SELLINV
Concept Calculation @PAVG(INVT,-1,0)/(COGS/360)
This concept is the average of the most current two years of Inventories - Total. This is divided by the sum of Cost of Goods Sold divided by 360.
Days to Sell Inventory - Quarterly Mnemonic SELLINVQ
Concept Calculation @PAVG(INVTQ,-3,0)/(COGS12/360)
This concept is the average of the most recent four quarters of Inventories - Total - Quarterly. This is divided by the sum of Cost of Goods Sold - 12-Months Moving divided by 360.
Debt - Capitalized Lease Obligations Mnemonic DCLO
Annual Data Item Number A84
Units Millions of dollars
This item represents the debt obligation a company incurs when capitalizing leases. Standard & Poor's considers a lease to be capitalized if it meets one or more of the following criteria: 1. Terms of the lease transfer property ownership to the company (lessee)
2. Lease contains a bargain purchase option
3. Lease term is equal to 75% or more of the estimated economic life of the leased property

151
Chapter 4 Supplemental Balance Sheet
4. Present value of the minimum lease payments (excluding executory costs) equals or exceeds 90% of the fair value of the leased property
This item includes 1. All items specifically classified as leases
2. A capitalized lease in the form of a bond
This item is not available for banks or utilities.
Debt - Capitalized Lease Obligations - Note Mnemonic DCLOF
Code Description AC Reflects retroactive adoption of FASB 13 IB Combination of IC and ID IC Components of Long-Term Debt include current
portion of Long-Term Debt ID Components of Long-Term Debt or Debt Tied To
Prime include unamortized debt discount or premium. The sum of components is not equal to total debt
Debt - Consolidated Subsidiary Mnemonic DCS
Annual Data Item Number A329
Units Millions of dollars
This item represents the amount of domestic or foreign long-term debt, specifically reported as subsidiary debt.
This item excludes unconsolidated subsidiary debt.
Debt - Consolidated Subsidiary - Note Mnemonic DCSF
Code Description ER Does not represent an exact amount QE Net of eliminations

Research Insight North America Data Guide
152
QI Combination ER and QE
Debt - Convertible Subordinated Mnemonic DCVSUB
Annual Data Item Number A154
Units Millions of dollars
This item represents the portion of long-term debt that is both convertible and subordinated.
This item excludes 1. Convertible debt (included in Debt - Convertible)
2. Subordinated debt (included in Debt - Subordinated)
This item is not available for banks or utilities.
Debt - Convertible Total Mnemonic DCVT
Annual Data Item Number A79
Units Millions of dollars
This item represents all long-term debt convertible to the company's common or preferred stock and not subordinated to any other long-term debt.
This items includes 1. Convertible notes
2. Convertible bonds
3. Convertible debentures
4. Convertible subordinated debt
This items excludes debt convertible into stock of a subsidiary.
This item is not available for banks or utilities.
Debt - Debentures Mnemonic DD
Annual Data Item Number A82
Units Millions of dollars

153
Chapter 4 Supplemental Balance Sheet
This item represents long-term debt containing a promise to pay a specific amount of money on a fixed date - usually more than 10 years after issuance and a promise to pay interest on stated dates.
This item includes 1. All long-term debentures or bonds which are neither convertible nor subordinated
2. Mortgage bonds
3. Subordinated debentures and other debentures when presented together
This item excludes a capitalized lease in the form of a bond (included in Debt - Capitalized Lease Obligations).
This item is not available for banks or utilities.
Debt Due in 2nd Year Mnemonic DD2
Annual Data Item Number A91
Units Millions of dollars
This item (along with those for those for the third, fourth and fifth year) represents the dollar amount of long-term debt payable in the second (or third, fourth, or fifth) year from the balance sheet date. This is the amount payable in each year. The amounts are not cumulative.
The amount of capitalized lease/rental obligations payable in the second, third, fourth and fifth years are included.
This item is not available for banks or utilities.
Debt Due in 3rd Year Mnemonic DD3
Annual Data Item Number A92
Units Millions of dollars
This item (along with those for those for the second, fourth and fifth year) represents the dollar amount of long-term debt payable in the second (or third, fourth, or fifth) year from the balance sheet date. This is the amount payable in each year. The amounts are not cumulative.
The amount of capitalized lease/rental obligations payable in the second, third, fourth and fifth years are included.
This item is not available for banks or utilities.

Research Insight North America Data Guide
154
Debt Due in 4th Year Mnemonic DD4
Annual Data Item Number A93
Units Millions of dollars
This item (along with those for those for the second, third and fifth year) represents the dollar amount of long-term debt payable in the second (or third, fourth, or fifth) year from the balance sheet date. This is the amount payable in each year. The amounts are not cumulative.
The amount of capitalized lease/rental obligations payable in the second, third, fourth and fifth years are included.
This item is not available for banks or utilities.
Debt Due in 5th Year Mnemonic DD5
Annual Data Item Number A94
Units Millions of dollars
This item (along with those for those for the second, third and fourth year) represents the dollar amount of long-term debt payable in the second (or third, fourth, or fifth) year from the balance sheet date. This is the amount payable in each year. The amounts are not cumulative.
The amount of capitalized lease/rental obligations payable in the second, third, fourth and fifth years are included.
This item is not available for banks or utilities.
Debt Due in 2nd, 3rd, 4th, and 5th Years - Note Mnemonic DDF
Code Description EA Debt commitments include interest on capitalized
leases
Debt - Finance Subsidiary Mnemonic DFS
Annual Data Item Number A328
Units Millions of dollars

155
Chapter 4 Supplemental Balance Sheet
This item represents the amount of long-term debt specifically reported as debt of consolidated finance subsidiaries.
This item excludes unconsolidated subsidiary debt.
Debt - Finance Subsidiary - Note Mnemonic DFSF
Code Description ER Does not represent an exact amount QE Net of eliminations QI Combination ER and QE
Debt - Mortgage and Other Secured Mnemonic DM
Annual Data Item Number A241
Units Millions of dollars
This item represents all long-term debt secured or collateralized by a mortgage, property, receivables, stock or other assets.
This item includes 1. Capitalized leases
2. Collateralized debt
3. Construction loans
4. Equipment notes or contracts
5. Equipment trust obligations
6. Installment purchase agreement obligations
7. Mortgage notes/bonds
8. Purchase contracts
9. Real estate lien notes
10. Trust deed notes
This item is not available for banks or utilities.

Research Insight North America Data Guide
156
Debt - Notes Mnemonic DN
Annual Data Item Number A81
Units Millions of dollars
This item represents long-term debt possibly secured by the pledge of property or securities owned by the company. The major difference between notes and bonds is that notes have shorter maturities.
This item includes 1. All long-term debt, labeled notes, which is neither convertible nor subordinated
2. All notes and debentures (bonds) presented together
3. All mortgages and mortgage notes
4. All revolving credit notes
5. Subordinated notes and other notes when presented together
This item excludes 1. Mortgage bonds (included in Debt - Debentures)
2. Notes and other debt (included in Debt - Other)
3. Revolving credit agreements (included in Debt - Other)
This item is not available for banks or utilities.
Debt Components - Note Mnemonic DF
Code Description IB Combination of IC and ID IC Components of Long-Term Debt include current
portion of Long-Term Debt ID Components of Long-Term Debt and Debt Tied To
Prime include unamortized debt discount or premium. The sum of components is not equal to total debt
Debt - Other Long-Term Mnemonic DLTO
Annual Data Item Number A83
Units Millions of dollars
This item represents all other long-term debt of the company not fitting one of the other classifications.

157
Chapter 4 Supplemental Balance Sheet
This item includes 1. Revolving credit agreements
2. Eurodollar loans (unless they specifically include notes, bonds, or debentures)
3. Notes and other debt (when presented together)
4. Construction loans
5. Equipment obligations
6. Debt classified by currency only
7. Accrued interest (when included by the company in long-term debt)
8. Commercial paper
This item excludes revolving credit notes (included in Debt - Notes).
This item is not available for banks or utilities.
Debt - Senior Convertible Mnemonic DCVSR
Annual Data Item Number A188
Units Millions of dollars
This item includes long-term debt convertible into a company's common or preferred stock. This debt is not subordinated to any other long-term debt.
This items includes 1. Convertible notes
2. Convertible debentures
3. Convertible bonds
This item excludes 1. Subordinated convertible debt
2. Debt convertible into stock of a subsidiary
This item is not available for banks or utilities.
Debt - Senior Convertible - Note Mnemonic DCFSRF
Code Description IB Combination of IC and ID

Research Insight North America Data Guide
158
IC Components of Long-Term Debt include current portion of Long-Term Debt
ID Components of Long-Term Debt and Debt Tied To Prime include unamortized debt discount or premium. The sum of components is not equal to total debt
Debt - Subordinated Mnemonic DS
Annual Data Item Number A80
Units Millions of dollars
This item represents long-term debt with claims to interest and principal junior to that of ordinary debt. All debt specifically labeled subordinated but not convertible is included.
This item excludes subordinated convertible debt.
This item is not available for banks or utilities.
Debt - Unamortized Debt Discount and Other Mnemonic DUDD
Data Item Number A268
Units Millions of dollars
This item represents the dollar amount of adjustments made to the principal amount of debt.
This item is not available for banks or utilities.
Deferred Compensation Mnemonic DCOM
Statement Balance Sheet
Data Item Number A358
This item represents unearned or deferred compensation expense specifically shown as a reduction to Stockholders’ Equity.
This item includes 1. Deferred Stock Awards
2. Deferred Stock Compensation
3. Unearned portion of incentive compensation
4. Retention plan stock rewards
5. Unearned Compensation

159
Chapter 4 Supplemental Balance Sheet
6. Unamortized Stock Awards
7. Unamortized Stock Compensation
8. Unrestricted stock compensation
This item is available for Industrial companies, only. It is not available for Banks or Utility companies.
Deferred Compensation - Quarterly Mnemonic DCOMQ
Statement Balance Sheet
Data Item Number Q239
This item represents unearned or deferred compensation expense specifically shown as a reduction to Stockholders’ Equity.
This item includes 1. Deferred Stock Awards
2. Deferred Stock Compensation
3. Unearned portion of incentive compensation
4. Retention plan stock rewards
5. Unearned Compensation
6. Unamortized Stock Awards
7. Unamortized Stock Compensation
8. Unrestricted stock compensation
This item is available for Industrial companies, only. It is not available for Banks or Utility companies.
Deferred Revenue - Current Mnemonic DRC
Data Item Number A356
This item represents revenue which has not yet been earned, but is expected to be classified as earned during the current year.
This item includes 1. Current unearned revenue/income
2. Current deferred rent
3. Deferred Gains
This item excludes other types of deferred items, such as taxes.

Research Insight North America Data Guide
160
Earning Assets - Total Mnemonic EAT
Concept Calculation PPENT+ACT
Units Millions of dollars
Earning Assets - Total is the sum of Property, Plant, and Equipment (Net) and Total Current Assets, which represent cash and other assets which, in the next 12 months, are expected to be realized in cash or used in the production of revenue.
Earning Assets - Total - Quarterly Mnemonic EATQ
Concept Calculation @VALUE(PPENTQ+ACTQ, (PPENTQ+ACTQ) [-1])
Units Millions of dollars
This concept is the sum of Property, Plant and Equipment (Net) - Quarterly and Total Current Assets - Quarterly. (If Property, Plant, and Equipment (Net) and Total Current Assets for the current quarter are not available, the values for the previous quarter will be used.)
Goodwill Mnemonic GDWL
Units Millions of dollars
This item represents the excess cost over equity of an acquired company.
This item is a supplementary Balance Sheet item.
Intangibles - Other Mnemonic INTANO
Statement Balance Sheet
Data Item Number A352
This item includes all intangible assets except for goodwill. Intangibles are assets having no physical existence in themselves, but represent rights to enjoy some privilege. These rights have a monetary value to the company.
This item includes 1. Blueprints or building designs
2. Client lists
3. Computer software patents
4. Contract rights
5. Copyrights

161
Chapter 4 Supplemental Balance Sheet
6. Covenants not to compete
7. Design costs
8. Distribution rights and agreements
9. Easements: gas rights, mineral rights, water rights
10. Engineering drawings
11. Excess of cost or premium of acquisition (Goodwill), except on unconsolidated subsidiaries
12. Favorable leases, beneficial lease rights, and leasehold interest advantages
13. Film license rights - except for radio and TV broadcasters
14. Franchises, franchise fees and repurchased franchise rights
15. Leases and lease acquisition costs, when the company is the lessee
16. Leasehold expense, when the company is the lessee
17. Licenses, except for software licenses
18. Management/advisory contracts for Finance companies
19. Offsetting intangible pension asset account
20. Offsetting unrecognized postretirement benefit obligation assets.
21. Operating rights
22. Organizational expense
23. Options to purchase low-power TV rights for Broadcasting/TV companies
24. Patent costs, except when specifically reported to be costs of pending patents
25. Publication rights
26. Reorganization Value in Excess of Amounts Allocable to Identifiable Assets
27. Route Acquisition Costs for Transportation companies
28. Routes, gates, and landing slots for Airlines
29. Subscription lists
30. Technology & Technological know-how intellectual property
31. Trademarks and tradenames
This item excludes: 1. Goodwill
2. Contracts (include in Other Assets)
3. Costs of pending patents (include in Deferred Charges)
4. Deferred charges
5. Deferred financing costs (include in Deferred Charges)
6. Film development costs (include in Net PP&E)
7. Goodwill on unconsolidated subsidiaries (include in Investment & Advances - Equity)
8. Intangibles included in PP&E by the company on Schedule V or on the Balance Sheet (include in Net PP&E)
9. Long-term prepaid expenses (include in Deferred Charges)

Research Insight North America Data Guide
162
10. Negative intangibles (include in Other Assets)
11. Pre-opening expenses (include in Deferred Charges)
12. Software, software costs (include in Other Assets)
13. Software licenses (include in Other Assets)
14. Start-up costs (include in Deferred Charges)
15. Timber Rights for Forestry and Paper companies (include in Net PP&E)
16. Unamortized debt discount and expense (include in Deferred Charges)
17. Unamortized research and development expense (include in Other Assets)
This item is available for Industrial companies, only. It is not available for Banks or Utility companies.
Intangibles - Other - Quarterly Mnemonic INTANOQ
Statement Balance Sheet
Data Item Number Q235
This item includes all intangible assets except for goodwill. Intangibles are assets having no physical existence in themselves, but represent rights to enjoy some privilege. These rights have a monetary value to the company.
This item includes 1. Blueprints or building designs
2. Client lists
3. Computer software patents
4. Contract rights
5. Copyrights
6. Covenants not to compete
7. Design costs
8. Distribution rights and agreements
9. Easements: gas rights, mineral rights, water rights
10. Engineering drawings
11. Excess of cost or premium of acquisition (Goodwill), except on unconsolidated subsidiaries
12. Favorable leases, beneficial lease rights, and leasehold interest advantages
13. Film license rights - except for radio and TV broadcasters
14. Franchises, franchise fees and repurchased franchise rights
15. Leases and lease acquisition costs, when the company is the lessee
16. Leasehold expense, when the company is the lessee
17. Licenses, except for software licenses
18. Management/advisory contracts for Finance companies
19. Offsetting intangible pension asset account

163
Chapter 4 Supplemental Balance Sheet
20. Offsetting unrecognized postretirement benefit obligation assets.
21. Operating rights
22. Organizational expense
23. Options to purchase low-power TV rights for Broadcasting/TV companies
24. Patent costs, except when specifically reported to be costs of pending patents
25. Publication rights
26. Reorganization Value in Excess of Amounts Allocable to Identifiable Assets
27. Route Acquisition Costs for Transportation companies
28. Routes, gates, and landing slots for Airlines
29. Subscription lists
30. Technology & Technological know-how intellectual property
31. Trademarks and tradenames
This item excludes: 1. Goodwill
2. Contracts (include in Other Assets)
3. Costs of pending patents (include in Deferred Charges)
4. Deferred charges
5. Deferred financing costs (include in Deferred Charges)
6. Film development costs (include in Net PP&E)
7. Goodwill on unconsolidated subsidiaries (include in Investment & Advances - Equity)
8. Intangibles included in PP&E by the company on Schedule V or on the Balance Sheet (include in Net PP&E)
9. Long-term prepaid expenses (include in Deferred Charges)
10. Negative intangibles (include in Other Assets)
11. Pre-opening expenses (include in Deferred Charges)
12. Software, software costs (include in Other Assets)
13. Software licenses (include in Other Assets)
14. Start-up costs (include in Deferred Charges)
15. Timber Rights for Forestry and Paper companies (include in Net PP&E)
16. Unamortized debt discount and expense (include in Deferred Charges)
17. Unamortized research and development expense (include in Other Assets)
This item is available for Industrial companies, only. It is not available for Banks or Utility companies.
Interest Capitalized Mnemonic INTC
Annual Data Item Number A147
Units Millions of dollars

Research Insight North America Data Guide
164
This item represents interest charges deferred to the company's property, plant and equipment account, amortized over the life of related assets.
This item is not available for banks or utilities.
Inventories - Finished Goods Mnemonic INVFG
Annual Data Item Number A78
Units Millions of dollars
This item represents manufactured goods ready for sale. Merchandise in transit to customers is included.
This item is not available for banks, utilities or savings and loan companies.
Inventories - Other Mnemonic INVO
Annual Data Item Number A186
Units Millions of dollars
This item represents the amount of inventory that cannot be categorized as raw materials, work in process or finished goods.
This item includes adjustments for LIFO reserve.
This item excludes 1. Progress payments (included in Inventories - Work in Process)
2. Allowance for slow moving, obsolete, or surplus inventory (included in Inventories - Finished Goods)
This item is not available for banks or utilities.
Inventories - Raw Materials Mnemonic INVRM
Annual Data Item Number A76
Units Millions of dollars
This item represents those industrial goods used in manufacturing still in a natural or unmanufactured state except for the processing incidental to their preparation, packaging or transportation. They are that part of a company's inventory which has been purchased for use in manufacturing the products (finished goods) of the company.
This item includes 1. Advances and/or deposits on material purchases
2. Bottles, cases, kegs, and other reusable containers
3. Bullion and/or uranium in transit to manufacturer
4. Parts

165
Chapter 4 Supplemental Balance Sheet
5. Purchase contract advances
6. Supplies
This item is not available for banks or utilities.
Inventories - Work in Process Mnemonic INVWIP
Annual Data Item Number A77
Units Millions of dollars
This item represents inventory consisting of partially manufactured goods. The raw materials have been partially processed, but the product (finished goods) is not complete and ready for sale. This item (as reported) will include material, labor manufacturing overhead applicable to the goods, and advance manufacturing costs.
This item includes 1. Advance manufacturing goods
2. Unbilled costs on contracts (costs in excess of related billings)
3. Unbilled receivables
4. Work in process and advances to subcontractors (net of progress payments)
This item is not available for banks or utilities.
Inventory Valuation Method Mnemonic INVVAL
Units Code
This item represents the method used to value inventory. The following codes are used:
Code Method
0 No Inventory
1 First In, First Out (FIFO)
2 Last In, First Out (LIFO)
3 Specific Identification
4 Average Cost
5 Retail Method
6 Standard Cost
7 Current or Replacement Cost
Beginning in 1972, if a company uses more than one valuation method, one code will appear in each of up to four elements for this item. If reported by the company, the methods are listed in order of relative amounts of inventory valued by each method.

Research Insight North America Data Guide
166
Prior to 1972, the method that valued the majority of the inventory was used.
This item is not available for banks, utilities, savings and loans or real estate investment trust (REIT) companies.
The retail method may be described as a way of applying cost percentages to related selling prices. The descriptive method will appear first, then the retail code. For example, "Valued by the retail method of FIFO" would appear as 15.000.
LIFO Reserve Mnemonic LIFR
Annual Data Item Number A240
Units Millions of dollars
This item represents the change in the dollar amount of inventory when valued on a method other than LIFO.
This item is not available for banks or utilities.
Long-Term Assets of Discontinued Operations - Other Mnemonic ALDO
Statement Balance Sheet
Data Item Number A353
This item represents long-term assets that are not PP&E, Investments and Advances, Intangibles, Deferred Charges, or Long-term assets of Discontinued Operations.
This item includes assets specifically described as "of discontinued operations."
Long-Term Debt Tied to Prime Mnemonic DLTP
Annual Data Item Number A148
Units Millions of dollars
This item represents the amount of long-term debt on which the interest rate fluctuates with the prime interest rate.
This item includes any long-term debt tied to a fluctuating or floating rate.
This item is not available for banks or utilities.
Long-Term Deferred Revenue Mnemonic DRLT
Data Item Number A397

167
Chapter 4 Supplemental Balance Sheet
This Item represents revenue which has not yet been earned
This item includes 1. Unearned revenue/income
2. Unearned rent
3. Deferred Gains
This item excludes other types of deferred items, such as taxes.
Long-Term Investments - Total - Quarterly Mnemonic IVLTQ
Statement Balance Sheet
Data Item Number Q233
This item is the sum of: 1. Investments and Advances - Equity Method (IVAEQ)
2. Investments and Advances - Other (IVAO)
Marketable Securities Adjustment Mnemonic MSA
Annual Data Item Number A238
Units Millions of dollars
This statement of cash flows item represents total adjustments to marketable securities, classified as long-term investments, which are carried at the lower of historical cost or current market value.
This item is not available for banks or utilities.
Nonperforming Assets - Total Annual mnemonic NPAT
Quarterly mnemonic NPATQ
Annual Data Item Number A341
Quarterly Data Item Number Q99
Units (companies) Millions
This item represents the reported amount of assets that are considered nonperforming. This item includes 1. Loans and leases carried on a non-accrual basis
2. Loans which are 90 days past due both accruing and nonaccruing
3. Renegotiated loans
4. Real estate acquired through foreclosure
5. Repossessed movable property

Research Insight North America Data Guide
168
This item excludes past due loans not yet placed on non-accrual status (unless specifically included in nonperforming assets by the bank).
Other Accumulated Comprehensive Income Mnemonic ACOMINC
Statement Balance Sheet
Data Item Number A357
This item represents the accumulated change in equity of a business from transactions and other events and circumstances from non-owner sources.
This item includes 1. Marketable Securities Adjustments
2. Cumulative Translation Adjustments
3. Minimum Pension Liability Adjustments
4. Accumulated Other Comprehensive Income (Loss) - Derivative adjustments
5. Any other adjustments listed under a heading of Accumulated Other Comprehensive Income (Loss)
Other Accumulated Comprehensive Income - Quarterly Mnemonic ACOMINCQ
Statement Balance Sheet
Data Item Number Q238
This item represents the accumulated change in equity of a business from transactions and other events and circumstances from non-owner sources.
This item includes 1. Marketable Securities Adjustments
2. Cumulative Translation Adjustments
3. Minimum Pension Liability Adjustments
4. Accumulated Other Comprehensive Income (Loss) - Derivative adjustments
5. Any other adjustments listed under a heading of Accumulated Other Comprehensive Income (Loss)
Preferred Dividends in Arrears Mnemonic DVPA
Annual Data Item Number A242
Units Millions of dollars
This item represents the dollar amount of preferred dividends on cumulative preferred stock which have not been paid and are considered to be in arrears.
This item is not available for banks or utilities.

169
Chapter 4 Supplemental Balance Sheet
Preferred Stock Mnemonic PSTK
Annual Data Item Number A130
Units Millions of dollars
This item represents the net number of preferred shares at year-end multiplied by the par or stated value per share as presented in the company's Balance Sheet.
This item includes 1. Preferred stock subscriptions
2. Utilities subsidiary preferred stock
3. Redeemable preferred stock
4. Preference stock
5. Receivables on preferred stock
This item excludes 1. Preferred stock sinking funds reported in current liabilities
2. Secondary classes of common stock
3. Subsidiary preferred stock
This item is reduced by the effects of ... 1. Par or carrying value of nonredeemable preferred treasury stock which was netted against this item
prior to annual and quarterly fiscal periods of 1982 and 1986, 1st quarter, respectively
2. Cost of redeemable preferred treasury stock which is netted against Preferred Stock - Redeemable
Preferred Stock - Convertible Mnemonic PSTKC
Annual Data Item Number A214
Units Millions of dollars
This item represents the carrying value of outstanding preferred stock which is reported as being convertible into common stock of a company.
This item includes 1. Company convertible redeemable preferred stock
2. Convertible redeemable preferred stock reported as a current liability
This item excludes 1. Redeemable and nonredeemable subsidiary convertible preferred stock
2. Convertible redeemable common stock
3. Preferred dividends in arrears when not included as part of the balance sheet value for redeemable stock
This item is not available for banks or utilities.

Research Insight North America Data Guide
170
Preferred Stock - Liquidating Value Mnemonic PSTKL
Annual Data Item Number A10
Units Millions of dollars
This item represents the total dollar value of the net number of preferred shares outstanding in the event of involuntary liquidation (such as, bankruptcy) multiplied by the per share involuntary liquidating value.
This item includes 1. Company redeemable stock
2. Preferred dividends in arrears
This item excludes 1. Subsidiary redeemable stock
2. Preferred stock presented in current liabilities
When a company does not report a specific involuntary liquidation figure, the carrying value will be used.
Preferred Stock - Redemption Value Mnemonic PSTKRV
Annual Data Item Number A56
Units Millions of dollars
This item represents the total dollar value of the net number of preferred shares outstanding multiplied by the voluntary liquidation or redemption value per share - whichever is greater.
Standard & Poor's uses the involuntary liquidation or redemption value when the voluntary liquidation or redemption value is not reported. When an involuntary liquidation figure is not reported, Standard & Poor's uses the carrying value.
This item includes 1. Company redeemable stock
2. Preferred dividends in arrears
This item excludes 1. Subsidiary redeemable stock
2. Preferred stock presented in current liabilities
This item is not available for banks or utilities.
Receivables - Estimated Doubtful Mnemonic RECD
Annual Data Item Number A67
Units Millions of dollars

171
Chapter 4 Supplemental Balance Sheet
This item represents the provision for bad debts. This is the dollar amount of receivables estimated to be uncollectable based on historical and industry averages. This account allows for a practical presentation of the realizable value of the customer receivables.
This item excludes 1. Allowance for cash discounts
2. Allowance for refunds on returnable containers
3. Allowance for cancellations
This item is not available for banks or utilities.
Rental Commitments - Min. (1st Year) Mnemonic MRC1
Annual Data Item Number A96
Units Millions of dollars
This item represents the minimum rental expense due in the first, second, third, fourth, and fifth years from the Balance Sheet date under all existing noncancelable leases. The figure is gross (before rental or sublease income is deducted) excluding capital leases. This is the amount payable in each of the years, not cumulative figures.
This item is not available for banks or utilities.
Rental Commitments - Min. (2nd Year) Mnemonic MRC2
Annual Data Item Number A164
Units Millions of dollars
This item represents the minimum rental expense due in the first, second, third, fourth, and fifth years from the Balance Sheet date under all existing noncancelable leases. The figure is gross (before rental or sublease income is deducted) excluding capital leases. This is the amount payable in each of the years, not cumulative figures.
This item is not available for banks or utilities.
Rental Commitments - Min. (3rd Year) Mnemonic MRC3
Annual Data Item Number A165
Units Millions of dollars

Research Insight North America Data Guide
172
This item represents the minimum rental expense due in the first, second, third, fourth, and fifth years from the Balance Sheet date under all existing noncancelable leases. The figure is gross (before rental or sublease income is deducted) excluding capital leases. This is the amount payable in each of the years, not cumulative figures.
This item is not available for banks or utilities.
Rental Commitments - Min. (4th Year) Mnemonic MRC4
Annual Data Item Number A166
Units Millions of dollars
This item represents the minimum rental expense due in the first, second, third, fourth, and fifth years from the Balance Sheet date under all existing noncancelable leases. The figure is gross (before rental or sublease income is deducted) excluding capital leases. This is the amount payable in each of the years, not cumulative figures.
This item is not available for banks or utilities.
Rental Commitments - Min. (5th Year) Mnemonic MRC5
Annual Data Item Number A167
Units Millions of dollars
This item represents the minimum rental expense due in the first, second, third, fourth, and fifth years from the Balance Sheet date under all existing noncancelable leases. The figure is gross (before rental or sublease income is deducted) excluding capital leases. This is the amount payable in each of the years, not cumulative figures.
This item is not available for banks or utilities.
Rental Commitments - Min. (5 Years Total) Mnemonic MRCT
Annual Data Item Number A95
Units Millions of dollars
This item represents the cumulative minimum rental expense due in five years under all existing noncancelable leases. The figure is gross (before rental or sublease income).
This item represents noncapitalized, noncancelable leases (including finance leases). Excluded from this item are capitalized leases.
This item is not available for banks or utilities.

173
Chapter 4 Supplemental Balance Sheet
Rental Commitments - Min. - Note Mnemonic MRCF
Code Description
QH Net of rental income
Rent Commitments - Thereafter Mnemonic MRCTA
Data Item Number A389
This represents the cumulative total of all future rental commitments after year five.
This item excludes Capitalized Lease Obligations (DCLO)
Retained Earnings - Cumulative Transaction Adjustment Mnemonic RECTA
Annual Data Item Number A230
Units Millions of dollars
This item represents the translation adjustment reported by a company as a separate component of stockholder's equity. The amount is accumulated from the beginning of the year in which a company first applied the provisions of Financial Accounting Standards Board Opinion #52 (FASB #52). This opinion requires a company to report the cumulative amount of adjustment resulting from translating annual statements of subsidiaries reporting in foreign currency into the currency of the incorporated entity.
This item is not available for banks or utilities.
Retained Earnings - Other Adjustments Mnemonic REAJO
Annual Data Item Number A231
Units Millions of dollars
This item represents all adjustments to retained earnings except cumulative translation adjustments and marketable security adjustments.
This item includes 1. Notes receivable other than subscription stock receivables when presented in the Equity section
2. Net effect of adjustments to retained earnings due to a stock split or dividend
This item excludes 1. Cumulative translation adjustments (included in Translation Adjustments - Cumulative)
2. Marketable securities adjustment (included in Marketable Securities Adjustment)

Research Insight North America Data Guide
174
This item is not available for banks or utilities.
Retained Earnings - Restatement Mnemonic REA
Annual Data Item Number A99
Units Millions of dollars
This item is the amount by which the prior year's retained earnings figure has been adjusted for a restatement due to acquisitions, accounting changes, or discontinued operations.
A restatement to retained earnings is the difference between the Balance Sheet retained earnings as it is originally reported for a year, and the retained earnings for that year as reported in the following year's Balance Sheet.
This item is not available for banks, utilities or foreign companies.
Retained Earnings - Unadjusted Mnemonic REUNA
Annual Data Item Number A259
Units Millions of dollars
This item represents the retained earnings figure as reported on the Balance Sheet, since it does not reflect adjustments.
For foreign companies, this item includes both allocated and unallocated retained earnings.
This item includes adjustments for stock splits or dividends.
This item excludes: 1. Deferred Compensation
2. Foreign Currency Translation Adjustments
3. Marketable Securities Adjustments
This item is available for Banks.
Retained Earnings - Unadjusted - Quarterly Mnemonic REUNAQ
Statement Balance Sheet
Data Item Number Q237
This item represents the unadjusted retained earnings figure.
For foreign companies, this item includes both allocated and unallocated retained earnings.
This item includes adjustments for stock splits or dividends.
This item excludes: 1. Deferred Compensation

175
Chapter 4 Supplemental Balance Sheet
2. Foreign Currency Translation Adjustments
3. Marketable Securities Adjustments
Retained Earnings - Unadjusted - Note - Quarterly Mnemonic REUNAQF
Code Description JD Reflects adjustment for stock split or dividend
The descriptions for these codes can be viewed by choosing the Databases » Descriptions command from the menu bar and entering the mnemonic in the Item text box. To include a textual description of a code in a report, you can use the @DESC function. For example, to include a description of the footnote, type @DESC (ACCGQF).
Retained Earnings - Unrestricted Mnemonic REUNR
Annual Data Item Number A97
Units Millions of dollars
This item represents the dollar amount of retained earnings on the Balance Sheet which is not restricted by debt agreements.
This item will not always match Retained Earnings (RE item A36) because Retained Earnings - Unrestricted is adjusted for items other than debt restrictions.
This item is not available for banks or utilities.
Stockholders' Equity Adjustments Mnemonic SEQO
Statement Balance Sheet
Data Item Number A359
This item represents all adjustments made to Stockholders’ Equity except those that apply to the stock accounts (common and preferred), Capital Surplus, Deferred Compensation, and Accumulated Other Comprehensive Income.
This item includes 1. Dividends paid on ESOP shares
2. Issuable stock
3. Notes receivable other than subscription stock receivables when shown in the equity section
4. Net effect of FDR adjustments made to reported Retained Earnings due to unadjusting for a retroactive stock split or dividend
5. Reacquired capital stock

Research Insight North America Data Guide
176
6. Reserve for self insurance
7. Reserve for share to be issued, when included in the Equity section
8. Stock options, warrants and rights
9. Surplus arising from the re-valuation of assets
10. Derivative adjustments not listed under a heading of Accumulated Other Comprehensive Income (Loss)
This item excludes: 1. Marketable Securities Adjustments
2. Unrealized gains/losses on company-held investments (marketable securities
3. Cumulative Translation
4. Additional Minimum Liability for underfunded pension plans
5. Dividends to shareholders
6. Cumulative distributions to stockholders
7. Deferred Compensation
8. Accumulated Other Comprehensive Income (Loss)
9. Derivative market value adjustment, interest rate swap agreement
10. Change in unrecognized gain on derivative instruments
11. Net unrealized gains (losses) on certain derivative
Stockholders' Equity Adjustments - Quarterly Mnemonic SEQOQ
Statement Balance Sheet
Data Item Number Q240
This item represents all adjustments made to Stockholders’ Equity except those that apply to the stock accounts (common and preferred), Capital Surplus, Deferred Compensation, and Accumulated Other Comprehensive Income.
This item includes 1. Dividends paid on ESOP shares
2. Issuable stock
3. Notes receivable other than subscription stock receivables when shown in the equity section
4. Net effect of FDR adjustments made to reported Retained Earnings due to unadjusting for a retroactive stock split or dividend.
5. Reacquired capital stock
6. Reserve for self insurance
7. Reserve for share to be issued, when included in the Equity section
8. Stock options, warrants and rights
9. Surplus arising from the re-valuation of assets

177
Chapter 4 Supplemental Balance Sheet
10. Derivative adjustments not listed under a heading of Accumulated Other Comprehensive Income (Loss)
This item excludes: 1. Marketable Securities Adjustments
2. Unrealized gains/losses on company-held investments (marketable securities
3. Cumulative Translation
4. Additional Minimum Liability for underfunded pension plans
5. Dividends to shareholders
6. Cumulative distributions to stockholders
7. Deferred Compensation
8. Accumulated Other Comprehensive Income (Loss)
9. Derivative market value adjustment, interest rate swap agreement
10. Change in unrecognized gain on derivative instruments
11. Net unrealized gains (losses) on certain derivative
Tax Loss Carry Forward Mnemonic TLCF
Annual Data Item Number A52
Units Millions of dollars
This item represents the portion of prior and current year losses applied as a reduction of taxable income in the next succeeding year or years. When available and applicable, this item is usually reported in the notes to financial statements.
This item includes 1. Carry-over tax loss
2. Carry-forward tax loss of both domestic and foreign consolidated subsidiaries
3. Carry-forward tax loss incurred prior to acquisition of a consolidated subsidiary (unless the company specifies that it does not expect to be able to utilize the amount)
4. Book value of carry-forward tax loss if the amounts for both tax and book purposes are reported
This item excludes 1. Capital loss carry-forward
2. Carry-back tax loss
3. Carry-forward tax loss of unconsolidated subsidiaries
4. Investment tax credit carry-forward
5. Tax credit carry-forward
This item is not available for banks, utilities, or REIT companies.

Research Insight North America Data Guide
178
Treasury Stock - Dollar Amount - Common Mnemonic TSTKC
Annual Data Item Number A226
Units Millions of dollars
This item represents the cost of common stock held in treasury by the company and reduces stockholder's equity.
This item is not available for banks or utilities.
Treasury Stock - Dollar Amount - Common - Note Mnemonic TSTKCF
Code Description TR Company uses retirement method to account for
common treasury stock
Treasury Stock - Dollar Amount - Preferred Mnemonic TSTKP
Annual Data Item Number A227
Units Millions of dollars
This item represents the cost of nonredeemable preferred stock held in treasury by the company and appears as a deduction from stockholder's equity.
This item is not available for banks or utilities.
Treasury Stock - Memo Entry Mnemonic TSTKME
Annual Data Item Number A86
Units Millions of dollars
This item represents the cost of all common and preferred stock held in treasury by the company prior to 1982. From 1982 forward, this item will contain a Not Available data code (@NA).
Beginning in 1982, Treasury Stock - Total Dollar Amount represents the total amount of common and preferred treasury stock as a separate component for use in balancing models.

179
Chapter 4 Supplemental Balance Sheet
Prior to 1982, this item was useful only as a memorandum since treasury stock was netted against various equity components. Now, Standard & Poor's includes the dollar amount of common treasury in Common Stock and the dollar amount of nonredeemable preferred in Preferred Stock - Carrying Value. The total dollar amount of both common and nonredeemable preferred treasury stock is now presented in Treasury Stock - Total Dollar Amount (for use in equity balancing models from 1982 forward).
Treasury Stock - Number of Common Shares Mnemonic TSTKN
Annual Data Item Number A87
Units Millions
This item represents the number of common shares held in treasury.
This item includes the number of common treasury stock held on the asset side of the Balance Sheet.
This item is not available for utilities.
Working Capital (Balance Sheet) Mnemonic WCAP
Annual Data Item Number A179
Units Millions of dollars
This item represents the difference between total current assets minus total current liabilities as reported on a company's Balance Sheet.
This item is not available for banks or utilities.


181
Chapter 5 Income Statement
Income Statement
This chapter presents data definitions for fundamental income statement data collected from companies' annual reports. The basic income statement model provides a detailed presentation of various line items. Where available, items that comprise a specific line item are indented below the item to which they apply.
Basic Income Statement
Data Item
Annual Mnemonic . . . page
Quarterly Mnemonic . . . page
12 Month Moving Mnemonic . . . page
Sales (Net) SALE . . . 239 SALEQ . . . 241 SALE12 . . . 244 Cost of Goods Sold COGS . . . 203 COGSQ . . . 205 COGS12 . . . 206 Selling, General and Admin. Exp. XSGA . . . 244 XSGAQ . . . 246 XSGA12 . . . 247 Operating Income Before Depreciation (EBITDA)
OIBDP . . . 235 OIBDPQ . . . 237 OIBDP12 . . . 236
Depreciation and Amortization DP . . . 209 DPQ . . . 210 DP12 . . . 212 Amortization of Intangibles AM . . . 199 Depreciation Expense (Sched VI)
XDP . . . 738
Depletion Expense (Sched VI) XDEPL . . . 737 Operating Income After Depreciation OIADP . . . 234 OIADPQ . . . 235 OIADP12 . . . 235 Interest Expense XINT . . . 227 XINTQ . . . 228 XINT12 . . . 228 Nonoperating Income (Expense) NOPI . . . 232 NOPIQ . . . 233 Nonop. Income (Exp) - Excl Interest
NOPIX . . . 234
Interest Income IINT . . . 230 Special Items SPI . . . 247 SPIQ . . . 249 Pretax Income PI . . . 238 PIQ . . . 238 PI12 . . . 239 Pretax Income - Domestic PIDOM . . . 281 Pretax Income - Foreign PIFO . . . 281 Income Taxes - Total TXT . . . 225 TXTQ . . . 226 Deferred Taxes TXDI . . . 109 TXDIQ . . . 882 Deferred Taxes - Federal TXDFED . . . 207 Deferred Taxes - Foreign TXDFO . . . 207 Deferred Taxes - State TXDS . . . 207 Income Taxes - Federal TXFED . . . 223 Income Taxes - Foreign TXFO . . . 223 Income Taxes - State TXS . . . 225
CHAPTER 5

Research Insight North America Data Guide
182
Income Taxes - Other TXO . . . 224 Minority Interest MII . . . 122 MIIQ . . . 122 Income Before Extraordinary Items IB . . . 217 IBQ . . . 217 IB12 . . . 218 Cash Dividends - Preferred DVP . . . 199 DVPQ . . . 200 Income Before Extra. Items Available for Common
IBCOM . . . 221 IBCOMQ . . . 222 IBCOM12 . . . 222
Common Stock Equivalents - Dollar Savings
CSTKE . . . 202 CSTKEQ . . . 202
Income Before Extra. Items - Adjusted for Common Stock Equivalents
IBADJ . . . 219 IBADJQ . . . 220 IBADJ12 . . . 221
Extraordinary Items and Disc. Opers.
XIDO . . . 214 XIDOQ . . . 215
Extraordinary Items XI . . . 213 XIQ . . . 214 Discontinued Operations DO . . . 212 DOQ . . . 213 Net Income Adjusted for Common Stock Equivalents
NIADJ . . . 231
Net Income (Loss) NI . . . 231 NIQ . . . 232 NI12 . . . 232
EPS and Common Shares Used to Calculate EPS
Data Item
Annual Mnemonic . . . page
Quarterly Mnemonic . . . page
12 Month Moving Mnemonic . . . page
Common Shares for 12MM EPS CSH12Q . . . 200 Common Shares for Basic EPS CSHPRI . . . 200 CSHPRQ . . . 201 Common Shares for Diluted EPS CSHFD . . . 201 CSHFDQ . . . 202 EPS 12 Months Moving Historical - Canada
EPSH12 . . . 315
EPS Basic Excluding Extraordinary Items
EPSPX . . . 685 EPSPXQ . . . 686 EPSX12 . . . 687
EPS Basic Including Extraordinary Items
EPSPI . . . 687 EPSPIQ . . . 688
EPS Basic from Operations OPEPS . . . 689 OPEPSQ . . . 689 OEPS12 . . . 690 EPS Diluted Excluding Extraordinary Items
EPSFX . . . 691 EPSFXQ . . . 691 EPSF12 . . . 692
EPS Diluted Including Extraordinary Items
EPSFI . . . 694 EPSFIQ . . . 695
EPS Diluted from Operations OPEPSX . . . 693 OEPSXQ . . . 693 OEPF12 . . . 693

183
Chapter 5 Income Statement
Data Definitions
Amortization of Intangibles Mnemonic AM
Data Item Number A65
Units Millions of dollars
This item represents a non-cash charge for the systematic write-off of the cost of intangible assets over the period for which there is an economic benefit.
This item excludes 1. Amortization of deferred charges
2. Amortization of goodwill on unconsolidated subsidiaries
3. Amortization on discontinued operations
4. Special write-offs of intangibles
This item is not available for banks.
Cash Dividends - Preferred Mnemonic DVP
Data Item Number A19
Units Millions of dollars
This item represents the total amount of the preferred dividend requirement on cumulative preferred stock and dividends paid on noncumulative preferred stock of the company during the year.
This item includes 1. The amount of dividend requirements used by the company in calculating Available for Common
2. Preferred dividends of a merged company accounted for by the pooling of interest method are included for the year of the merger, unless the preferred stock was exchanged for common stock of the acquiring company (included in Cash Dividends - Common)
Utility companies' subsidiary preferred dividends are included.
This item excludes 1. Preferred dividends deducted only for that portion of the year the stock was outstanding, if an entire
issuance of convertible preferred stock is converted into common during the year
2. The dividends on the old preferred stock treated as common dividends, if common stock is issued by the company in exchange for preferred stock of another company
3. Subsidiary preferred dividends (included in Minority Interest)
Cash Dividends - Preferred - Quarterly Mnemonic DVPQ

Research Insight North America Data Guide
184
Data Item Number Q24
Units Millions of dollars
This item represents the total amount of the preferred dividend requirement on cumulative preferred stock and dividends paid on noncumulative preferred stock of the company during the year.
This item includes 1. The amount of dividend requirements used by the company in calculating Available for Common
2. Preferred dividends of a merged company accounted for by the pooling of interest method are included for the year of the merger, unless the preferred stock was exchanged for common stock of the acquiring company (included in Cash Dividends - Common)
Utility companies' subsidiary preferred dividends are included.
This item excludes 1. Preferred dividends deducted only for that portion of the year the stock was outstanding, if an entire
issuance of convertible preferred stock is converted into common during the year
2. The dividends on the old preferred stock treated as common dividends, if common stock is issued by the company in exchange for preferred stock of another company
3. Subsidiary preferred dividends (included in Minority Interest)
Common Shares for 12-Months Moving Earnings Per Share Mnemonic CSH12Q
Quarterly Data Item Number Q28
Units Millions
This item is derived by dividing the sum of four quarters of quarterly shares used to calculate earnings per share by four.
This will be the same (at fiscal yearend) as the shares used to calculate earnings per share given in the annual report.
Common Shares for Basic Earnings Per Share Mnemonic CSHPRI
Annual Data Item Number A54
Units Millions
Effective December 15, 1997, Statement of Financial Accounting Standards (SFAS) #128 requires companies to report Basic and Diluted Earnings Per Share, replacing Primary and Fully Diluted Earnings Per Share.The change will affect financial statements issued after this date.
Prior to the adoption of SFAS #128, this item represented the average or actual number of common shares outstanding, adjusted for conversion of convertible preferred stock, convertible debentures, and options and warrants which have been identified as common stock equivalents according to Accounting Principles Board Opinion No. 15.
After the adoption of SFAS #128, this item represents the average or actual number of common shares outstanding, excluding dilution (conversion of convertible preferred stock, convertible debentures, options and warrants).

185
Chapter 5 Income Statement
Standard & Poor's calculated this item (when sufficient information was not reported) by dividing Income Before Extraordinary Items - Adjusted for Common Stock Equivalents, by Earnings per Share (Basic) - Excluding Extraordinary Items.
Common Shares for Basic Earnings Per Share - Quarterly Mnemonic CSHPRQ
Quarterly Data Item Number Q15
Units Millions
Effective December 15, 1997, Statement of Financial Accounting Standards (SFAS) #128 requires companies to report Basic and Diluted Earnings Per Share, replacing Primary and Fully Diluted Earnings Per Share. The change will affect financial statements issued after this date.
Prior to the adoption of SFAS #128, this item represented the average or actual number of common shares outstanding, adjusted for conversion of convertible preferred stock, convertible debentures, and options and warrants which have been identified as common stock equivalents according to Accounting Principles Board Opinion No. 15.
After the adoption of SFAS #128, this item represents the average or actual number of common shares outstanding, excluding dilution (conversion of convertible preferred stock, convertible debentures, options and warrants).
This item is calculated by dividing Income Before Extraordinary Items - Adjusted for Common Stock Equivalents, by Earnings Per Share Basic - Excluding Extraordinary Items.
The shares used for quarterly Basic earnings per share will not be the same as shares used for 12-months moving earnings per share ending in the same period unless the company uses actual shares or there has been no change in Basic shares in the last year.
This item is always brought forward into the most recent fiscal quarter with prices available (and adjusted for subsequent stock splits and dividends) from the most recent fiscal quarter reported. This allows for easy estimation of total market value of shares outstanding based on the most recent monthly price.
Common Shares for Diluted Earnings Per Share Mnemonic CSHFD
Annual Data Item Number A171
Units Millions
This item represents the number of common shares used by the company to calculate diluted earnings per share. This figure reflects the potential dilution that could occur if debt, stocks, options and/or warrants were exercised or converted into common stock or resulted in the issuance of common stock that then shared in earnings in equity.
This item will not be available when the company reports the calculation of diluted earnings per share as anti-dilutive.
Common Shares for Diluted EPS - Quarterly Mnemonic CSHFDQ

Research Insight North America Data Guide
186
Units Millions
This item is the shares used to calculate Basic Earnings Per Share plus additional shares that would be outstanding if dilutive debt, stocks, options and warrants were converted.
Common Stock Equivalents - Dollar Savings Mnemonic CSTKE
Annual Data Item Number A191
Units Millions of dollars
This item represents the dollar savings associated with the theoretical conversion of all options and warrants, and any convertible debt and convertible preferred stock designated by the company as common stock equivalents at the time of their issuance.
Expenses included are ... 1. Preferred dividends on convertible preferred stock identified as common stock equivalents
2. Interest expense (after application of the tax rate) paid on convertible debt
3. Interest (after application of the tax rate) saved from retirement of debt or earned from investments made with proceeds from conversion of options and warrants
Common Stock Equivalents - Dollar Savings - Quarterly Mnemonic CSTKEQ
Units Millions of dollars
This item represents the dollar savings associated with the theoretical conversion of all options and warrants, and any convertible debt and convertible preferred stock designated by the company as common stock equivalents at the time of their issuance.
Expenses included are ... 1. Preferred dividends on convertible preferred stock identified as common stock equivalents
2. Interest expense (after application of the tax rate) paid on convertible debt
3. Interest (after application of the tax rate) saved from retirement of debt or earned from investments made with proceeds from conversion of options and warrants
Cost of Goods Sold Mnemonic COGS
Annual Data Item A41
Units Millions of dollars
This item represents all costs directly allocated by the company to production, such as material, labor and overhead.
The total operating costs for non-manufacturing companies are considered as cost of goods sold if a breakdown is not available.

187
Chapter 5 Income Statement
This item includes the following expenses when broken out separately. However, if a company allocates any of these items to selling, general and administrative expenses, Standard & Poor's will not include them in Cost of Goods Sold. 1. Agricultural, aircraft, automotive, radio and television manufacturers' amortization of tools and dies
2. Airlines' mutual aid agreements
3. Amortization of deferred costs (for example, start-up costs)
4. Amortization of tools and dies where the useful life is two years or less
5. Cooperatives' patronage dividends
6. Direct costs - when a separate selling, general and administrative expenses figure is reported
7. Direct labor
8. Expenses associated with sales-related income from software development
9. Extractive industries' lease and mineral rights charged off and development costs written off
10. Freight-in
11. Heat, light and power
12. Improvements to leased properties
13. Insurance and safety
14. Land developers' investment real estate expense
15. Licenses
16. Maintenance and repairs
17. Motion picture industries' amortization of film expense
18. Operating expenses
19. Pension, retirement, profit sharing, provision for bonus and stock options, and other employee benefits (for manufacturing companies). For non-manufacturing companies, this expense goes into Selling, General, and Administrative Expenses
20. Real estate investment trusts' advisory fees
21. Rent and royalty
22. Salary expense
23. Supplies
24. Taxes, other than income taxes
25. Terminals and traffic
26. Transportation
27. Warehouse expense
28. Writedowns of oil and gas properties
This item excludes 1. Amortization of intangibles (included in Depreciation)
2. Amortization of negative intangibles (included in Nonoperating Income/Expense)
3. Depreciation allocated to cost of goods sold (included in Depreciation)
4. Excise taxes

Research Insight North America Data Guide
188
5. Foreign exchange adjustments above this line (included in Nonoperating Income/Expense)
6. Idle plant expense (included in Nonoperating Income/Expense)
7. Miscellaneous expense (included in Nonoperating Income/ Expense)
8. Moving expense (included in Nonoperating Income/Expense)
9. Operating expenses when no selling, general, and administrative expenses figure is reported but a cost of goods sold figure is reported
10. Purchase discounts (netted against Cost of Goods Sold)
This item is not available for utilities.
Cost of Goods Sold - Note Mnemonic COGSF
Code Description AC Reflects an accounting change BD Reduced by an amount of depreciation which should
be allocated to Selling, General, and Administrative Expenses
FI Combination of AC and BD
Cost of Goods Sold - Quarterly Mnemonic COGSQ
Quarterly Data Item Q30
Units Millions of dollars
This item represents all costs directly allocated by the company to production, such as material, labor and overhead.
The total operating costs for non-manufacturing companies are considered as cost of goods sold if a breakdown is not available.
This item includes the following expenses when broken out separately. However, if a company allocates any of these items to selling, general and administrative expenses, Standard & Poor's will not include them in Cost of Goods Sold. 1. Agricultural, aircraft, automotive, radio and television manufacturers' amortization of tools and dies
2. Airlines' mutual aid agreements
3. Amortization of deferred costs (for example, start-up costs)
4. Amortization of tools and dies where the useful life is two years or less
5. Cooperatives' patronage dividends
6. Direct costs - when a separate selling, general and administrative expenses figure is reported

189
Chapter 5 Income Statement
7. Direct labor
8. Expenses associated with sales-related income from software development
9. Extractive industries' lease and mineral rights charged off and development costs written off
10. Freight-in
11. Heat, light and power
12. Improvements to leased properties
13. Insurance and safety
14. Land developers' investment real estate expense
15. Licenses
16. Maintenance and repairs
17. Motion picture industries' amortization of film expense
18. Operating expenses
19. Pension, retirement, profit sharing, provision for bonus and stock options, and other employee benefits (for manufacturing companies). For non-manufacturing companies, this expense goes into Selling, Genera, and Administrative Expenses
20. Real estate investment trusts' advisory fees
21. Rent and royalty
22. Salary expense
23. Supplies
24. Taxes, other than income taxes
25. Terminals and traffic
26. Transportation
27. Warehouse expense
28. Writedowns of oil and gas properties
This item excludes 1. Amortization of intangibles (included in Depreciation)
2. Amortization of negative intangibles (included in Nonoperating Income/Expense)
3. Depreciation allocated to cost of goods sold (included in Depreciation)
4. Excise taxes
5. Foreign exchange adjustments above this line (included in Nonoperating Income/Expense)
6. Idle plant expense (included in Nonoperating Income/Expense)
7. Miscellaneous expense (included in Nonoperating Income/Expense)
8. Moving expense (included in Nonoperating Income/Expense)
9. Operating expenses when no selling, general, and administrative expenses figure is reported but a cost of goods sold figure is reported
10. Purchase discounts (netted against Cost of Goods Sold)
This item is not available for utilities.

Research Insight North America Data Guide
190
Cost of Goods Sold - Quarterly - Note Mnemonic COGSQF
Code Description AC Reflects an accounting change BD Reduced by an amount of depreciation which should
be allocated to Selling, General, and Administrative Expenses
FI Combination of AC and BD
Cost of Goods Sold - 12-Months Moving Mnemonic COGS12
Concept Calculation COGSQ+COGSQ[-1]+ COGSQ[-2]+COGSQ[-3]
Units Millions of dollars
This concept is the sum of Cost of Goods Sold for the current quarter and the three previous quarters. Cost of Goods Sold is defined as all costs directly allocated by the company to production, such as material, labor and overhead.
Deferred Taxes - Federal Mnemonic TXDFED
Annual Data Item Number A269
Units Millions of dollars
This item represents the deferred amount of income taxes allocated to a company's domestic government.
This item includes 1. Domestic International Sales Corporation (DISC) taxes (when included with deferred income taxes)
2. Effects of flow-through investment tax credits
3. Net investment tax credit calculated by the amortized method
4. This item excludes net amortized investment tax credits of foreign companies (included in Deferred Taxes - Foreign)
This item is not available for banks.
Deferred Taxes - Foreign Mnemonic TXDFO

191
Chapter 5 Income Statement
Annual Data Item Number A270
Units Millions of dollars
This item represents the deferred amount of income taxes allocated to governments outside a company's country of incorporation.
For foreign companies, this item includes deferred income taxes payable to governments outside their country.
This item is not available for banks.
Deferred Taxes - State Mnemonic TXDS
Annual Data Item Number A271
Units Millions of dollars
This item represents the deferred amount of income taxes allocated to state and local governments.
This item includes 1. Deferred local taxes
2. Deferred state and other taxes when reported together
This item excludes 1. Deferred state income taxes classified as part of Cost of Goods Sold or Selling, General and
Administrative Expense
2. Other deferred income taxes when presented separately
This item is not available for banks.
Deferred Taxes (Income Account) Mnemonic TXDI
Annual Data Item Number A50
Units Millions of dollars
This item represents the net tax deferrals (current year's deferrals less the amortization of prior year's deferrals) due to timing differences between the reporting of revenues and expenses for financial statements and tax forms.
This item includes 1. All deferred taxes that are included in income taxes
2. Deferred investment tax credit (net)
3. Prepaid taxes included in income taxes
This item excludes 1. Amortization of deferred investment tax credit (included in Investment Tax Credit [Income Account])
2. Deferred taxes associated with discontinued operations or extraordinary items
This item is not available for banks.

Research Insight North America Data Guide
192
Deferred Taxes (Income Account) - Quarterly Mnemonic TXDIQ
Quarterly Data Item Number Q35
Units Millions of dollars
This item represents the net tax deferrals (current year's deferrals less the amortization of prior year's deferrals) due to timing differences between the reporting of revenues and expenses for financial statements and tax forms.
This item includes 1. All deferred taxes that are included in income taxes
2. Deferred investment tax credit (net)
3. Prepaid taxes included in income taxes
This item excludes 1. Amortization of deferred investment tax credit (included in Investment Tax Credit [Income Account])
2. Deferred taxes associated with discontinued operations or extraordinary items
This item is not available for banks.
Depreciation and Amortization Mnemonic DP
Annual Data Item Number A14
Units Millions of dollars
This item represents non-cash charges for obsolescence of and wear and tear on property, allocation of the current portion of capitalized expenditures, and depletion charges.
This item includes 1. Amortization of patents, trademarks, and other intangibles
2. Amortization of book plates
3. Amortization of capitalized leases
4. Amortization of leasehold improvements
5. Amortization of tools and dies
6. Depletion charges
7. Real estate companies' amortization of development and production expense if not part of property, plant and equipment
8. Airlines' provision for obsolescence of materials and supplies even if the associated item is a current asset
9. Extractive industries' abandonments, retirements, intangible drilling costs and dry-hole expense for companies using the full-cost method of accounting for oil assets.
10. Motion picture industries' amortization of film costs

193
Chapter 5 Income Statement
11. Utilities' amortization charges to operation
This item excludes dry-hole expense for companies using the successful-efforts method of accounting for oil assets (included in Selling, General, and Administrative Expenses). When dry-hole expense is combined with an item properly classified as depreciation (for example, dry holes and abandonments), Standard & Poor's will determine whether dry holes or abandonments constitute the greater figure and the Combined Figure data code (@CF) will be placed in either Depreciation and Amortization or included in the calculation for Selling, General and Administrative Expenses.
This item also excludes 1. Amortization of debt discount or premium (included in Interest Expense)
2. Amortization of deferred cost (included in Cost of Goods Sold)
3. Amortization of deferred investment tax credits
4. Amortization of negative intangibles (included in Nonoperating Income [Expense])
5. Amortization of research and development expenses (included in Selling, General, and Administrative Expenses)
6. Amortization of software costs (included in Selling, General, and Administrative Expenses)
7. Depreciation on discontinued operations (included in Special Items or Extraordinary Items when presented below taxes)
8. Depreciation on property, plant, and equipment not used in operations
9. Depreciation and amortization of unconsolidated subsidiaries (included in Nonoperating Income [Expense])
10. Telephone industries' depreciation charged to clearing accounts (included in Selling, General, and Administrative Expenses)
11. Writedowns of oil and gas properties (included in Cost of Goods Sold)
12. Accretion (from 11/01 forward)
This item contains a Combined Figure data code (@CF) when combined with accretion.
Depreciation and Amortization - Note Mnemonic DPF
Code Description AC Reflects an accounting change ER Does not reflect exact amount LR Combination of AC and ER
Depreciation and Amortization - Quarterly - Note Mnemonic DPQF

Research Insight North America Data Guide
194
Code Description AC Reflects an accounting change ER Does not reflect an exact amount LR Combination of AC and ER
Depreciation and Amortization - Quarterly Mnemonic DPQ
Quarterly Data Item Number Q5
Units Millions of dollars
This item represents non-cash charges for obsolescence of and wear and tear on property, allocation of the current portion of capitalized expenditures, and depletion charges.
This item includes 1. Amortization of patents, trademarks, and other intangibles
2. Amortization of book plates
3. Amortization of capitalized leases
4. Amortization of leasehold improvements
5. Amortization of tools and dies
6. Depletion charges
7. Real estate companies' amortization of development and production expense if not part of property, plant, and equipment
8. Airlines' provision for obsolescence of materials and supplies even if the associated item is a current asset
9. Extractive industries' abandonments, retirements, intangible drilling costs and dry-hole expense for companies using the full-cost method of accounting for oil assets.
10. Motion picture industries' amortization of film costs
11. Utilities' amortization charges to operation
This item excludes dry-hole expense for companies using the successful-efforts method of accounting for oil assets (included in Selling, General, and Administrative Expenses). When dry-hole expense is combined with an item properly classified as depreciation (for example, dry holes and abandonments), Standard & Poor's will determine whether dry holes or abandonments constitute the greater figure and the Combined Figure data code (@CF) will be placed in either Depreciation and Amortization or included in the calculation for Selling, General and Administrative Expenses.
This item also excludes 1. Amortization of debt discount or premium (included in Interest Expense)
2. Amortization of deferred cost (included in Cost of Goods Sold)
3. Amortization of deferred investment tax credits
4. Amortization of negative intangibles (included in Nonoperating Income [Expense])
5. Amortization of research and development expenses (included in Selling, General, and Administrative Expenses)

195
Chapter 5 Income Statement
6. Amortization of software costs (included in Selling, General, and Administrative Expenses)
7. Depreciation on discontinued operations (included in Special Items or Extraordinary Items when presented below taxes)
8. Depreciation on property, plant, and equipment not used in operations
9. Depreciation and amortization of unconsolidated subsidiaries (included in Nonoperating Income [Expense])
10. Telephone industries' depreciation charged to clearing accounts (included in Selling, General, and Administrative Expenses)
11. Writedowns of oil and gas properties (included in Cost of Goods Sold)
12. Accretion (from 11/01 forward)
This item contains a Combined Figure data code (@CF) when combined with accretion.
Depreciation and Amortization - 12-Months Moving Mnemonic DP12
Concept Calculation DPQ+DPQ[-1]+DPQ[-2]+DPQ[-3]
Units Millions of dollars
This item represents the total portion of asset cost written off by periodic depreciation charges since the assets were acquired.
This item includes 1. Amortization of tangible assets
2. Amortization of tools and dies
3. Depletion
4. Depreciation
5. Reserve for possible future loss on disposals (when included in depreciation and amortization)
This item is not available for banks.
This concept is the sum of Depreciation and Amortization for the current quarter and the three previous quarters. Depreciation and Amortization is defined as non-cash charges for obsolescence of and wear and tear on property, allocation of the current portion of capitalized expenditures, and depletion charges.
Discontinued Operations Mnemonic DO
Annual Data Item Number A66
Units Millions of dollars
This item represents the total of the income/loss from operations of the discontinued division and the gain/loss on the disposal of the division.
This item includes 1. All discontinued operations reported after continuing income and before extraordinary items

Research Insight North America Data Guide
196
2. Discontinued operations for which separate taxes are not reported (one tax figure is given for both discontinued operations and extraordinary items)
This item excludes 1. Additional expense/gain associated with the current year's discontinued operations shown as an
extraordinary item by the company (included in Extraordinary Items)
2. Additional gain/loss from a preceding year's discontinued operations (included in Extraordinary Items)
3. Discontinued operations reported in the body of the income statement with continuing operations (included in Special Items)
This item is not available for banks or utilities.
Discontinued Operations - Quarterly Mnemonic DOQ
Quarterly Data Item Number Q33
Units Millions of dollars
This item represents the total of the income/loss from operations of the discontinued division and the gain/loss on the disposal of the division.
This item includes 1. All discontinued operations reported after continuing income and before extraordinary items
2. Discontinued operations for which separate taxes are not reported (one tax figure is given for both discontinued operations and extraordinary items)
This item excludes 1. Additional expense/gain associated with the current year's discontinued operations shown as an
extraordinary item by the company (included in Extraordinary Items)
2. Additional gain/loss from a preceding year's discontinued operations (included in Extraordinary Items)
3. Discontinued operations reported in the body of the income statement with continuing operations (included in Special Items)
This item is not available for banks or utilities.
Extraordinary Items Mnemonic XI
Annual Data Item Number A192
Units Millions of dollars
This item represents unusual items designated by the company as extraordinary and presented after net income from continuing operations and discontinued operations.
An item must be both unusual in nature and occur infrequently to qualify as extraordinary.
Any item that could be classified as an extraordinary item can also be shown before taxes and would be included in Special Items.
This item includes

197
Chapter 5 Income Statement
1. Flood losses, fire losses, etc.
2. Profit or loss on repurchase of debentures
3. Adjustments applicable to prior years
4. Tax carry-forwards and carry-backs
This item excludes 1. Amortization of intangibles (included in Depreciation and Amortization)
2. After-tax adjustments to net income for the purchase portion of net income of partly pooled companies
3. Shipping firms' prior years operating differential subsidies and estimated profit adjustments; prior years' operating differential subsidies are treated as Nonoperating Income (Expense); the current year's operating differential subsidy is included in Sales (Net); adjustments to estimated profits by shipping companies reporting by this method are ignored
4. Operations labeled as discontinued and reported as a separate item by the company
5. Equity in earnings of an unconsolidated subsidiary (included in Nonoperating Income [Expense])
6. Gain or loss on securities when they are a regular part of a company's operations.
This item is not available for banks or utilities.
Extraordinary Items - Quarterly Mnemonic XIQ
Units Millions of dollars
This item represents unusual items designated by the company as extraordinary and presented after net income from continuing operations and discontinued operations.
An item must be both unusual in nature and occur infrequently to qualify as extraordinary.
Any item that could be classified as an extraordinary item can also be shown before taxes and would be included in Special Items.
This item includes 1. Flood losses, fire losses, etc.
2. Profit or loss on repurchase of debentures
3. Adjustments applicable to prior years
4. Tax carry-forwards and carry-backs
This item excludes 1. Amortization of intangibles (included in Depreciation and Amortization)
2. After-tax adjustments to net income for the purchase portion of net income of partly pooled companies
3. Shipping firms' prior years operating differential subsidies and estimated profit adjustments; prior years' operating differential subsidies are treated as Nonoperating Income (Expense); the current year's operating differential subsidy is included in Sales (Net); adjustments to estimated profits by shipping companies reporting by this method are ignored
4. Operations labeled as discontinued and reported as a separate item by the company
5. Equity in earnings of an unconsolidated subsidiary (included in Nonoperating Income [Expense])
6. Gain or loss on securities when they are a regular part of a company's operations.

Research Insight North America Data Guide
198
This item is not available for banks or utilities.
Extraordinary Items and Discontinued Operations Mnemonic XIDO
Annual Data Item Number A48
Units Millions of dollars
This item represents extraordinary items and/or discontinued operations.
This item includes 1. Income or loss from operations of a discontinued division
2. Profit or loss on the disposal of a division
3. Adjustments applicable to prior years
4. Flood losses, fire losses, etc.
5. Tax carry-forwards and carry-backs
6. Profit or loss on repurchase of debentures
This item excludes 1. Special items (unusual and/or non-recurring items considered special items by the company)
2. Amortization of intangibles (included in Depreciation and Amortization)
3. Equity in earnings of an unconsolidated subsidiary (included in Nonoperating Income [Expense])
4. Gain or loss on securities when they are a regular part of a company's operation
5. After-tax adjustments to net income for the purchase portion of net income of partly pooled companies.
6. Shipping firms' prior years operating differential subsidies that are treated as Nonoperating Income (Expense). The current year's operating differential subsidy is included in Sales-Net. Shipping companies' adjustments to estimated profits reported by this method are ignored.
Extraordinary Items and Discontinued Operations - Quarterly Mnemonic XIDOQ
Quarterly Data Item Number Q26
Units Millions of dollars
This item represents extraordinary items and/or discontinued operations.
This item includes 1. Income or loss from operations of a discontinued division
2. Profit or loss on the disposal of a division
3. Adjustments applicable to prior years
4. Flood losses, fire losses, etc.

199
Chapter 5 Income Statement
5. Tax carry-forwards and carry-backs
6. Profit or loss on repurchase of debentures
This item excludes 1. Special items (unusual and/or non-recurring items considered special items by the company)
2. Amortization of intangibles (included in Depreciation and Amortization)
3. Equity in earnings of an unconsolidated subsidiary (included in Nonoperating Income [Expense])
4. Gain or loss on securities when they are a regular part of a company's operation
5. After-tax adjustments to net income for the purchase portion of net income of partly pooled companies.
6. Shipping firms' prior years operating differential subsidies that are treated as Nonoperating Income (Expense). The current year's operating differential subsidy is included in Sales-Net. Shipping companies' adjustments to estimated profits reported by this method are ignored.
Gain/Loss on Sale of Real Estate Mnemonic SRET
Statement Income Statement
Data Item Number A392
This item represents the gain or loss on a sale of property reported on a company’s Income Statement.
This items includes 1. Gain and loss on sale of Real Estate
2. Gain or Loss on sale of Property (other than Personal property)
3. Gain or Loss on disposition of Real Estate and Real Estate Investments
4. Gain on Sale of Investment Properties
This items excludes 1. Gain/Loss on sale of personal property or PPE
2. Gain/Loss on Sale of Securities Available
3. Gain/Loss on marketable securities
4. Gain/Loss on sale of other assets
5. Gain/Loss on discontinued operations
This item is available for Real Estate & Investment Trust companies, only.
Gain/Loss on Sale of Real Estate - Quarterly Mnemonic SRETQ
Statement Income Statement
Data Item Number Q271

Research Insight North America Data Guide
200
This item represents the gain or loss on a sale of property reported on a company’s Income Statement.
This items includes 1. Gain and loss on sale of Real Estate
2. Gain or Loss on sale of Property (other than Personal property)
3. Gain or Loss on disposition of Real Estate and Real Estate Investments
4. Gain on Sale of Investment Properties
This items excludes 1. Gain/Loss on sale of personal property or PPE
2. Gain/Loss on Sale of Securities Available
3. Gain/Loss on marketable securities
4. Gain/Loss on sale of other assets
5. Gain/Loss on discontinued operations
This item is available for Real Estate & Investment Trust companies, only.
Income Before Extraordinary Items Mnemonic IB
Annual Data Item Number A18
Units Millions of dollars
This item represents the income of a company after all expenses, including special items, income taxes, and minority interest - but before provisions for common and/or preferred dividends. This item does not reflect discontinued operations (appearing below taxes) or extraordinary items.
This item includes (when reported below taxes): 1. Amortization of intangibles
2. Equity in earnings of unconsolidated subsidiaries
3. Gain or loss on the sale of securities when they are a regular part of a company's operations
4. Shipping companies' operating differential subsidies (current and prior years)
This item, for banks, includes net after-tax and after-minority interest profit or loss on securities sold or redeemed.
Income Before Extraordinary Items - Quarterly Mnemonic IBQ
Quarterly Data Item Number Q8
Units Millions of dollars
This item represents the income of a company after all expenses, including special items, income taxes, and minority interest - but before provisions for common and/or preferred dividends. This item does not reflect discontinued operations (appearing below taxes) or extraordinary items.

201
Chapter 5 Income Statement
This item includes (when reported below taxes): 1. Amortization of intangibles
2. Equity in earnings of unconsolidated subsidiaries
3. Gain or loss on the sale of securities when they are a regular part of a company's operations
4. Shipping companies' operating differential subsidies (current and prior years)
This item, for banks, includes net after-tax and after-minority interest profit or loss on securities sold or redeemed.
Income Before Extraordinary Items - Quarterly - Note Mnemonic IBQF
Code Description AC Reflects an accounting change AU Combination of AC and US, GP and US, or GI and US
(for companies in the $T set). GI Combination of AC and GP GP Some or all data is pro forma US Company reports in U.S. dollars (for companies in the
$T set).
Income Before Extraordinary Items - 12-Months Moving Mnemonic IB12
Concept Calculation IBQ+IBQ[-1]+IBQ[-2]+IBQ[-3]
Units Millions of dollars
Income Before Extraordinary Items - 12-Months Moving is the sum of Income Before Extraordinary Items for the current quarter and the three previous quarters. Income Before Extraordinary Items is defined as income before extraordinary items and discontinued operations.
Income Before Extraordinary Items - Adjst. for Common Stock Equivalents Mnemonic IBADJ
Annual Data Item Number A20
Units Millions of dollars

Research Insight North America Data Guide
202
This item represents income before extraordinary items and discontinued operations less preferred dividend requirements and is adjusted for the additional dollar savings due to common stock equivalents as outlined in Accounting Principles Board Opinion No. 15.
The preferred dividend requirements used in this calculation will normally be the same as the preferred dividends declared. 1. If more or less than four quarterly preferred dividends are declared in one year (where preferred
dividends are normally declared quarterly), then either preferred dividend requirements or actual preferred dividends paid will be used, depending on the method used by the company in reporting.
2. If all convertible preferred stock is converted into common during the year, preferred dividends are deducted only for that portion of the year in which the stock was outstanding.
The adjustments for additional dollar savings due to common stock equivalents include ... 1. Preferred dividends on convertible preferred stock identified as common stock equivalents
2. Interest expense (after application of the tax rate) paid on convertible debt identified as common stock equivalents
3. Interest (after application of the tax rate) saved from retirement of debt or earned from investments made with the proceeds from conversion of options and warrants identified as common stock equivalents
Income Before Extraordinary Items - Adjst. for Common Stock Equivalents - Note Mnemonic IBADJF
Code Description BZ Includes effect of conversion of preferred stock and/or
convertible debt
Income Before Extraordinary Items - Adjst. for Common Stock Equivalents - Quarterly Mnemonic IBADJQ
Quarterly Data Item Number Q10
Units Millions of dollars
This item represents income before extraordinary items and discontinued operations less preferred dividend requirements and is adjusted for the additional dollar savings due to common stock equivalents as outlined in Accounting Principles Board Opinion No. 15.
The preferred dividend requirements used in this calculation will normally be the same as the preferred dividends declared.

203
Chapter 5 Income Statement
1. If more or less than four quarterly preferred dividends are declared in one year (where preferred dividends are normally declared quarterly), then either preferred dividend requirements or actual preferred dividends paid will be used, depending on the method used by the company in reporting.
2. If all convertible preferred stock is converted into common during the year, preferred dividends are deducted only for that portion of the year in which the stock was outstanding.
The adjustments for additional dollar savings due to common stock equivalents include ... 1. Preferred dividends on convertible preferred stock identified as common stock equivalents
2. Interest expense (after application of the tax rate) paid on convertible debt identified as common stock equivalents
3. Interest (after application of the tax rate) saved from retirement of debt or earned from investments made with the proceeds from conversion of options and warrants identified as common stock equivalents
This item, on a preliminary basis, may be obtained by multiplying per-share earnings as reported by the number of shares as reported (which may be average shares).
Income Before Extraordinary Items - Adjst. for Common Stock Equivalents - Qtly Note Mnemonic IBADQF
Code Description
BZ Includes effect of conversion of preferred stock and/or convertible debt
Income Before Extraordinary Items - Adjusted for Common Stock Equivalents - 12MM Mnemonic IBADJ12
Units Millions of dollars
This item represents income before extraordinary items and discontinued operations less preferred dividend requirements and is adjusted for the additional dollar savings due to common stock equivalents as outlined in Accounting Principles Board Opinion No. 15. The 12 Month-Moving value is the current quarter plus the three previous quarters.
The preferred dividend requirements used in this calculation will normally be the same as the preferred dividends declared.
1. If more or less than four quarterly preferred dividends are declared in one year (where preferred dividends are normally declared quarterly), then either preferred dividend requirements or actual preferred dividends paid will be used, depending on the method used by the company in reporting.
2. If all convertible preferred stock is converted into common during the year, preferred dividends are deducted only for that portion of the year in which the stock was outstanding.

Research Insight North America Data Guide
204
The adjustments for additional dollar savings due to common stock equivalents include: 1. Preferred dividends on convertible preferred stock identified as common stock equivalents
2. Interest expense (after application of the tax rate) paid on convertible debt identified as common stock equivalents
Interest (after application of the tax rate) saved from retirement of debt or earned from investments made with the proceeds from conversion of options and warrants identified as common stock equivalents
Income Before Extraordinary Items - Available for Common Mnemonic IBCOM
Annual Data Item Number A237
Units Millions of dollars
This item represents income before extraordinary items and discontinued operations less preferred dividend requirements, but before adding savings due to common stock equivalents.
The preferred dividend requirements used in this calculation will normally be the same as the preferred dividends declared. 1. If more or less than one quarterly preferred dividend is declared in one quarter (where preferred
dividends are normally declared quarterly), then either preferred dividend requirements or actual preferred dividends paid will be used, depending on the method used by the company in reporting
2. If all convertible preferred stock is converted into common during the year, preferred dividends are deducted only for that portion of the year in which the stock was outstanding
3. If the pooling of interest method was used to account for a merger, preferred dividends of the acquired company are included. If preferred stock was exchanged for common stock of the acquiring company, preferred dividends of the merger company are treated as common dividends
On a preliminary basis, this item may be obtained by subtracting the latest reported dividend requirements on preferred shares outstanding from net income.
Income Before Extraordinary Items - Available for Common - Quarterly Mnemonic IBCOMQ
Quarterly Data Item Number Q25
Units Millions of dollars
This item represents income before extraordinary items and discontinued operations less preferred dividend requirements, but before adding savings due to common stock equivalents.
The preferred dividend requirements used in this calculation will normally be the same as the preferred dividends declared. 1. If more or less than one quarterly preferred dividend is declared in one quarter (where preferred
dividends are normally declared quarterly), then either preferred dividend requirements or actual preferred dividends paid will be used, depending on the method used by the company in reporting

205
Chapter 5 Income Statement
2. If all convertible preferred stock is converted into common during the year, preferred dividends are deducted only for that portion of the year in which the stock was outstanding
3. If the pooling of interest method was used to account for a merger, preferred dividends of the acquired company are included. If preferred stock was exchanged for common stock of the acquiring company, preferred dividends of the merger company are treated as common dividends
On a preliminary basis, this item may be obtained by subtracting the latest reported dividend requirements on preferred shares outstanding from net income.
Income Before Extraordinary Items - Available for Common - 12 Months Moving Mnemonic IBCOM12
Concept Calculation IBCOMQ+IBCOMQ[-1]+IBCOMQ[-2] +IBCOMQ[-3]
Units Millions of dollars
This concept is the sum of Income Before Extraordinary Items - Available for Common for the current quarter and the three previous quarters.
Income Taxes - Note Mnemonic TXF
Code Description TN Federal, State and Foreign Income taxes not
classified by current and deferred
Income Taxes - Federal Mnemonic TXFED
Annual Data Item Number A63
Units Millions of dollars
This item represents the current amount of taxes payable to the federal government and is net of investment tax credits.
This items includes 1. DISC (Domestic International Sales Corporation) taxes (when included with income taxes)
2. Effect of flow-through investment tax credit
3. Foreign companies’ taxes payable to their governments
4. Investment tax credit recapture (when presented separately)
5. Territorial income taxes (for example, Puerto Rico)

Research Insight North America Data Guide
206
This item excludes 1. Any federal tax provision that is clearly not current or deferred (included in Income Taxes – Other)
2. Net investment tax credit (when the amortized method is used)
For non-U.S. companies, this item represents taxes payable to their government.
This item is not available for banks.
Income Taxes - Foreign Mnemonic TXFO
Annual Data Item Number A64
Units Millions of dollars
This item represents the current amount of income taxes payable to foreign governments.
This item excludes deferred taxes.
For non-U.S. companies, this item represents taxes payable to governments outside their country.
This item is not available for banks.
Income Taxes - Other Mnemonic TXO
Annual Data Item Number A211
Units Millions of dollars
This item presents the residual effects of adjustments to current and deferred local, state, federal, and foreign income tax components.
This item includes 1. Provision for income taxes applicable to a carry forward tax loss for companies that have not adopted
FASB #96
2. Provision for taxes relating to minority interest
3. Provision for taxes that are neither current nor deferred
4. Tax benefit of stock options reported separately
For shipping companies, this item includes the tax benefit of Safe Harbor leases (unless specifically included in deferred taxes by the company).

207
Chapter 5 Income Statement
This item excludes 1. Investment tax credits
2. Income taxes from discontinued operations
3. Provision for income taxes applicable to a carry forward tax loss for companies that have adopted FASB #96
4. Residuals due to rounding
This item is not available for banks.
Income Taxes - State Mnemonic TXS
Annual Data Item Number A173
Units Millions of dollars
This item represents the current amount of taxes payable to state and local governments (included in income taxes by the company).
This item is not broken out separately for banks, utilities or property and casualty companies, but is included in Income Taxes - Total.
Income Taxes - Total Mnemonic TXT
Annual Data Item Number A16
Units Millions of dollars
This item represents all income taxes imposed by federal, state and foreign governments.
This item includes 1. Charges equivalent to investment tax credit
2. Charges in lieu of income taxes
3. Deferred income taxes
4. Federal income taxes
5. Foreign income taxes
6. Income taxes on dividends or earnings of unconsolidated subsidiaries
7. Other income taxes
8. State income taxes
9. Territorial income taxes
This item excludes 1. Franchise taxes (included in Cost of Goods Sold)

Research Insight North America Data Guide
208
2. Other taxes (included in Cost of Goods Sold)
3. Prior year's tax adjustments (included in Special Items)
4. Tax carry-backs and tax carry-forwards appearing after income before extraordinary items (included in Extraordinary Items)
Income Taxes - Total - Note Mnemonic TXTF
Code Description AC Reflects an accounting change BH Includes other taxes FP Combination of AC and BH
Income Taxes - Total - Quarterly Mnemonic TXTQ
Quarterly Data Item Number Q6
Units Millions of dollars
This item represents all income taxes imposed by federal, state, and foreign governments.
This item includes 1. Charges equivalent to investment tax credit
2. Charges in lieu of income taxes
3. Deferred income taxes
4. Federal income taxes
5. Foreign income taxes
6. Income taxes on dividends or earnings of unconsolidated subsidiaries
7. Other income taxes
8. State income taxes
9. Territorial income taxes
This item excludes 1. Franchise taxes (included in Cost of Goods Sold)
2. Other taxes (included in Cost of Goods Sold)
3. Prior year's tax adjustments (included in Special Items)
4. Tax carry-backs and tax carry-forwards appearing after income before extraordinary items (included in Extraordinary Items)

209
Chapter 5 Income Statement
A tax included in the first three quarters of income taxes, which should be excluded by definition (for example, it is included because its amount cannot be identified) is also included in fourth quarter. All four quarters will be footnoted.
Income Taxes - Total - Quarterly - Note Mnemonic TXTQF
Code Description AC Reflects an accounting change BH Includes other taxes FP Combination of AC and BH
Interest Expense Mnemonic XINT
Annual Data Item Number A15
Units Millions of dollars
This item represents the periodic expense to the company of securing short- and long-term debt. Where possible, this item is collected as a gross figure (for example, if interest expense is reported net by the company, interest income and/or interest capitalized will be added back to arrive at a gross figure).
This item includes 1. Amortization of debt discount or premium
2. Amortization of deferred financing costs
3. Discount on the sale of receivables of a finance subsidiary
4. Dividends/interest expense on securities of Subsidiary Trusts
5. Expenses related to the issuance of debt (such as, underwriting fees, brokerage costs, advertising costs, etc.)
6. Factoring charges (unless included in Cost of Goods Sold or Selling, General, and Administrative Expenses)
7. Financing charges
8. Interest expense net of income of unconsolidated finance subsidiaries for Retail companies
9. Interest expense on both short- and long-term debt
10. Interest expense on deferred compensation
11. Interest on tax settlements, when included with other interest expense
12. Non-debt interest expense, when it is not a Special Item
13. Underwriting fees
This item excludes

Research Insight North America Data Guide
210
1. Interest expense on deposits for Savings and Loan companies (include in Cost of Goods Sold)
2. Interest income
3. Interest on tax settlements, when reported as a separate line item (include in Special Items)
This item may be estimated if not reported.
Interest Expense - Note Mnemonic XINTF
Code Description AC Reflects an accounting change GA Estimated (beginning with 1973, Standard & Poor's no
longer estimates interest expense) QA Net of either interest income, interest capitalized, or
both WA Combination of AC and QA
Interest Expense - 12-Months Moving Mnemonic XINT12
Concept Calculation XINTQ+XINTQ[-1]+XINTQ[-2]+ XINTQ[-3]
Units Millions of dollars
Interest Expense - 12-Months Moving is the sum of Interest Expense for the current quarter and the three previous quarters. Interest Expense is defined as the periodic expense to the company of securing short- and long-term debt.
Interest Expense - Quarterly Mnemonic XINTQ
Quarterly Data Item Number Q22
Units Millions of dollars
This item represents the periodic expense to the company of securing short- and long-term debt. Where possible, this item is collected as a gross figure (for example, if interest expense is reported net by the company, interest income and/or interest capitalized will be added back to arrive at a gross figure).
This item includes 1. Amortization of debt discount or premium
2. Amortization of deferred financing costs

211
Chapter 5 Income Statement
3. Discount on the sale of receivables of a finance subsidiary
4. Dividends/interest expense on securities of Subsidiary Trusts
5. Expenses related to the issuance of debt (such as, underwriting fees, brokerage costs, advertising costs, etc.)
6. Factoring charges (unless included in Cost of Goods Sold or Selling, General, and Administrative Expenses)
7. Financing charges
8. Interest expense net of income of unconsolidated finance subsidiaries for Retail companies
9. Interest expense on both short- and long-term debt
10. Interest expense on deferred compensation
11. Interest on tax settlements, when included with other interest expense
12. Non-debt interest expense, when it is not a Special Item
13. Underwriting fees
This item excludes 1. Interest expense on deposits for Savings and Loan companies (include in Cost of Goods Sold)
2. Interest income
3. Interest on tax settlements, when reported as a separate line item (include in Special Items)
This item may be estimated if not reported.
Interest expense is net of interest income for those companies which do not report interest expense separately on a quarterly basis (all four quarters will be handled consistently and footnoted).
Interest Expense - Quarterly - Note Mnemonic XINTQF
Code Description AC Reflects an accounting change GA Estimated (beginning with 1973, Standard & Poor's no
longer estimates interest expense) QA Net of either interest income, interest capitalized, or
both WA Combination of AC and QA
Interest Income Mnemonic IINT
Annual Data Item Number A62

Research Insight North America Data Guide
212
Units Millions of dollars
This item represents the revenue received from interest-bearing obligations held by the company (included in Nonoperating Income [Expense]).
This item excludes 1. Capitalized interest
2. Dividend income
3. The interest charged to construction (utilities)
Minority Interest (Income Account) Mnemonic MII
Annual Data Item Number A49
Units Millions of dollars
This item represents the portion of the consolidated subsidiary income applicable to common stock not owned by the parent company. A negative number in this item increases Net Income (Loss) and a positive number decreases Net Income (Loss).
This item includes subsidiary preferred dividends.
Participating departments are included for life insurance companies.
Subsidiary preferred dividends are excluded for utility companies (included in Cash Dividends - Preferred).
A Combined Figure data code (@CF) is entered in the income statement data item if minority interest appears on the Balance Sheet and an amount cannot be identified on the Income Statement.
Minority Interest (Income Account) - Quarterly Mnemonic MIIQ
Quarterly Data Item Number Q3
Units Millions of dollars
This item represents the portion of the consolidated subsidiary income applicable to common stock not owned by the parent company. A negative number in this item increases Net Income (Loss) and a positive number decreases Net Income (Loss).
This item includes subsidiary preferred dividends.
Participating departments are included for life insurance companies.
Subsidiary preferred dividends are excluded for utility companies (included in Cash Dividends - Preferred).
A Combined Figure data code (@CF) is entered in the income statement data item if minority interest appears on the Balance Sheet and an amount cannot be identified on the Income Statement.

213
Chapter 5 Income Statement
Net Income Adjusted for Common Stock Equivalents Mnemonic NIADJ
Annual Data Item Number A258
Units Millions of dollars
This item represents the company's net income available to common shareholders after preferred dividend requirements have been met.
This item includes 1. Effect of savings due to common stock equivalents
2. Discontinued operations
3. Extraordinary items
This item is not available for banks or utilities.
Net Income (Loss) Mnemonic NI
Annual Data Item Number A172
Units Millions of dollars
This item represents the income or loss reported by a company after expenses and losses have been subtracted from all revenues and gains for the fiscal period including extraordinary items and discontinued operations.
This item, for banks, includes securities gains and losses.
Net Income (Loss) - Note Mnemonic NIF
Code Description AC Reflects an accounting change GI Combination of AC and GP GP Some data is pro forma
Net Income (Loss) - Quarterly Mnemonic NIQ
Quarterly Data Item Number Q69
Units Millions of dollars

Research Insight North America Data Guide
214
This item represents the income or loss reported by a company after expenses and losses have been subtracted from all revenues and gains for the fiscal period including extraordinary items and discontinued operations.
This item, for banks, includes securities gains and losses.
Net Income (Loss) - 12-Months Moving Mnemonic NI12
Concept Calculation NIQ+NIQ[-1]+NIQ[-2]+NIQ[-3]
Units Millions of dollars
Net Income (Loss) - 12-Months Moving is the sum of Net Income (Loss) for the current quarter and the three previous quarters. Net Income (Loss) is defined as the income or loss reported by a company after expenses and losses have been subtracted from all revenues and gains for the fiscal period including extraordinary items and discontinued operations.
Nonoperating Income (Expense) Mnemonic NOPI
Annual Data Item Number A61
Units Millions of dollars
This item represents any income or expense items resulting from secondary business-related activities, excluding those considered part of the normal operations of the business. Nonoperating income and expense will be reported as a net figure with nonoperating income treated as a positive number and nonoperating expense treated as a negative number.
This item includes 1. Income
Discount on debt reacquired
Dividend income
Equity in earnings of a nonconsolidated subsidiary
Franchise income when corresponding expenses are not included in the Income Statement
Interest charged to construction (interest capitalized)
Leased department income when corresponding expenses are not included in the Income Statement
Other income
Rental income
Royalty income
Interest income
2. Expense
Amortization of deferred credit
Amortization of negative intangibles

215
Chapter 5 Income Statement
Foreign exchange adjustments
Idle plant expense
Miscellaneous expense
Moving expense
Other expense
Nonoperating Income (Expense) - Quarterly Mnemonic NOPIQ
Quarterly Data Item Number Q31
Units Millions of dollars
This item represents any income or expense items resulting from secondary business-related activities, excluding those considered part of the normal operations of the business. Nonoperating income and expense will be reported as a net figure with nonoperating income treated as a positive number and nonoperating expense treated as a negative number.
This item includes 1. Income
Discount on debt reacquired
Dividend income
Equity in earnings of a nonconsolidated subsidiary
Franchise income when corresponding expenses are not included in the Income Statement
Interest charged to construction (interest capitalized)
Leased department income when corresponding expenses are not included in the Income Statement
Other income
Rental income
Royalty income
Interest income
2. Expense
Amortization of deferred credit
Amortization of negative intangibles
Foreign exchange adjustments
Idle plant expense
Miscellaneous expense
Moving expense
Other expense

Research Insight North America Data Guide
216
Nonoperating Income (Expense) - Excluding Interest Income Mnemonic NOPIX
Annual Data Item Number A190
Units Millions of dollars
This item represents any income or expense items resulting from secondary business-related activities, excluding those activities considered a normal part of company operations.
This item excludes interest income.
This item is not available for banks or utilities.
Operating Income After Depreciation Mnemonic OIADP
Annual Data Item Number A178
Units Millions of dollars
This item represents the operating income of a company after deducting expenses for cost of goods sold, selling, general, and administrative expenses, and depreciation.
This item is not available for utilities.
Operating Income After Depreciation - Note Mnemonic OIADPF
Code Description AC Reflects an accounting change ER Does not reflect exact amount of depreciation and
amortization LR Combination of AC and ER
Operating Income After Depreciation - Quarterly Mnemonic OIADPQ

217
Chapter 5 Income Statement
Concept Calculation @VALUE(@IF(@ISNA(OIBDPQ), SALEQ-COGSQ-@IF(@ISCF (XSGAQ),.0,XSGAQ),OIBDPQ)-@IF(@ISCF(DPQ),.0,DPQ),(@IF (@ISNA(OIBDPQ),SALEQ-COGSQ-@IF(@ISCF(XSGAQ),.0,XSGAQ), OIBDPQ)-@IF(@ISCF(DPQ), .0,DPQ))[-1])
Units Millions of dollars
This concept is Sales (Net) - Quarterly minus Cost of Goods Sold - Quarterly minus Selling, General, and Administrative Expenses - Quarterly minus Depreciation, Depletion, and Amortization - Quarterly. (If Sales (Net), Cost of Goods Sold, Selling, General, and Administrative Expenses, and Depreciation, Depletion, and Amortization for the current quarter are not available, the values for the previous quarter will be used.
Operating Income After Depreciation - 12-Months Moving Mnemonic OIAD12
Concept Calculation OIADPQ+OIADPQ[-1]+ OIADPQ[-2]+0IADPQ[-3]
Units Millions of dollars
This item is the sum of Operating Income After Depreciation for the current quarter and the three previous quarters. Operating Income After Depreciation is defined as Net Sales less Cost of Goods Sold and Selling, General, and Administrative Expenses after deducting Depreciation, Depletion and Amortization.
Operating Income Before Depreciation Mnemonic OIBDP
Annual Data Item Number A13
Units Millions of dollars
This item represents Net Sales less Cost of Goods Sold and Selling, General, and Administrative Expenses before deducting Depreciation, Depletion and Amortization.
This item includes the effects of adjustments for Cost of Goods Sold and Selling, General, and Administrative Expenses. A partial listing of items which comprise Cost of Goods Sold and Selling, General, And Administrative Expenses is as follows: 1. Cost of Goods Sold
Rent and royalty expense
General taxes (other than income taxes)
Profit sharing contributions
Pension costs, including past service pension costs (except when written off in one year)
Motion picture and entertainment companies' amortization of film costs
2. Selling, General, and Administrative Expenses
Research and development expense

Research Insight North America Data Guide
218
Strike expense
Bad debt expense (provisions for doubtful accounts)
Exploration expense
Parent company charges for administrative service
The following items, when separately listed, are treated as Nonoperating Income (Expense) rather than as operating expenses: 1. Moving expenses
2. Recurring foreign exchange adjustments
3. Idle plant expenses
4. Profit on sales of properties (except for securities, etc.) for the companies in the oil, coal, airline, and other industries where these transactions are considered a normal part of doing business
5. Amortization of negative intangibles
Finance companies' operating income is stated after deducting additions to reserves for losses.
The current year's results of discontinued operations are not considered operating expenses and are shown as an extraordinary item.
Operating Income Before Depreciation - 12-Months Moving Mnemonic OIBD12
Concept Calculation OIBDPQ+OIBDPQ[-1]+ OIBDPQ[-2]+OIBDPQ[-3]
Units Millions of dollars
Operating Income Before Depreciation - 12-Months Moving is the sum of Operating Income Before Depreciation for the current quarter and the three previous quarters. Operating Income Before Depreciation is defined as Net Sales less Cost of Goods Sold and Selling, General, and Administrative Expenses before deducting Depreciation, Depletion, and Amortization.
Operating Income Before Depreciation - Quarterly Mnemonic OIBDPQ
Quarterly Data Item Number Q21
Units Millions of dollars
This item represents Net Sales less Cost of Goods Sold and Selling, General, and Administrative Expenses before deducting Depreciation, Depletion, and Amortization.
This item includes the effects of adjustments for Cost of Goods Sold and Selling, General, and Administrative Expenses. A partial listing of items which comprise Cost of Goods Sold and Selling, General, And Administrative Expenses is as follows: 1. Cost of Goods Sold
Rent and royalty expense
General taxes (other than income taxes)

219
Chapter 5 Income Statement
Profit sharing contributions
Pension costs, including past service pension costs (except when written off in one year)
Motion picture and entertainment companies' amortization of film costs
2. Selling, General, and Administrative Expenses
Research and development expense
Strike expense
Bad debt expense (provisions for doubtful accounts)
Exploration expense
Parent company charges for administrative service
The following items, when separately listed, are treated as Nonoperating Income (Expense) rather than as operating expenses: 1. Moving expenses
2. Recurring foreign exchange adjustments
3. Idle plant expenses
4. Profit on sales of properties (except for securities, etc.) for the companies in the oil, coal, airline, and other industries where these transactions are considered a normal part of doing business
5. Amortization of negative intangibles
Finance companies' operating income is stated after deducting additions to reserves for losses.
The current year's results of discontinued operations are not considered operating expenses and are shown as an extraordinary item.
This item is not available for banks.
Pretax Income Mnemonic PI
Annual Data Item Number A170
Units Millions of dollars
This item represents operating and nonoperating income before provisions for income taxes and minority interest.
This item specifically excludes 1. Extraordinary items
2. Discontinued operations
Pretax Income - Note Mnemonic PIF

Research Insight North America Data Guide
220
Code Description
JJ The sum of Domestic Pretax Income and Foreign Pretax Income differs from Pretax Income on the Income Statement
Pretax Income - Quarterly Mnemonic PIQ
Quarterly Data Item Number Q23
Units Millions of dollars
This item represents operating and nonoperating income before provisions for income taxes and minority interest.
This item specifically excludes 1. Extraordinary items
2. Discontinued operations
For banks, this item includes net pretax profit or loss on securities sold or redeemed.
Pretax income will be reported after deduction of minority interest when minority interest is not known and is included in nonoperating expense. If this is the case in the first three quarters, the fourth quarter will also be handled this way for consistency.
Pretax Income - 12-Months Moving Mnemonic PI12
Concept Calculation PIQ+PIQ[-1]+PIQ[-2]+PIQ[-3]
Units Millions of dollars
Pretax Income - 12-Months Moving is the sum of Pretax Income for the current quarter and the three previous quarters. Pretax Income is defined as operating and nonoperating income before provisions for income taxes and minority interest.
Sales (Net) Mnemonic SALE
Annual Data Item Number A12
Units Millions of dollars
This item represents gross sales (the amount of actual billings to customers for regular sales completed during the period) reduced by cash discounts, trade discounts, and returned sales and allowances for which credit is given to customers.
This item is scaled in millions. For example the 1999 annual sales for GM is 173215.000 (or 173 billion, 215 million dollars).
This item includes

221
Chapter 5 Income Statement
1. Any revenue source that is expected to continue for the life of the company
2. Other operating revenue
3. Installment sales
4. Franchise sales (when corresponding expenses are available)
Special cases (by industry) include ... 1. Royalty income when considered operating income (such as, oil companies, extractive industries,
publishing companies, etc.)
2. Retail companies' sales of leased departments when corresponding costs are available and included in expenses (if costs are not available, the net figure is included in Nonoperating Income [Expense])
3. Shipping companies' operating differential subsidies and income on reserve fund securities when shown separately
4. Finance companies' earned insurance premiums and interest income for finance companies, the sales are counted only after net losses on factored receivables purchased
5. Airline companies, net mutual aid assistance and federal subsidies
6. Cigar, cigarette, oil, rubber, and liquor companies' net sales are after deducting excise taxes
7. Income derived from equipment rental is considered part of operating revenue
8. Utilities' net sales are total current operating revenue
9. For banks, this item includes total current operating revenue and net pretax profit or loss on securities sold or redeemed
10. Life insurance, and property and casualty companies' net sales are total income
11. Advertising companies' net sales are commissions earned, not gross billings
12. Franchise operations' franchise and license fees
13. Leasing companies' rental or leased income
14. Hospitals' sales net of provision for contractual allowances (will sometimes include doubtful accounts)
15. Security brokers' other income
This item excludes 1. Nonoperating income
2. Interest income (included in Nonoperating Income [Expense])
3. Equity in earnings of unconsolidated subsidiaries (included in Nonoperating Income [Expense])
4. Other income (included in Nonoperating Income [Expense])
5. Rental income (included in Nonoperating Income [Expense])
6. Gain on sale of securities or fixed assets (included in Special Items)
7. Discontinued operations (included in Special Items)
8. Excise taxes (excluded from sales and also deducted from Cost of Goods Sold)
9. Royalty income (included in Nonoperating Income [Expense])

Research Insight North America Data Guide
222
Sales (Net) - Note Mnemonic SALEF
Code Description
AA This year's data reflects a merger or acquisition
AB This year's data reflects a significant merger/acquisition whereby the effects on the prior year's sales constitute 50% or more of the reported sales for that year
AC This year's data reflects an accounting change
AG Reflects post Chapter 11 adoption of fresh-start accounting
AR Combination of AA and AZ
AS Combination of AA and AC
AT Combination of AZ and AC
AZ Data excludes discontinued operations
BA Includes excise taxes
BB Includes other income/excludes some operating revenues
BC Includes sale of leased departments
BS Combination of BA and BB
BT Combination of BB and BC
DB Data deleted because of a fiscal year change
DZ Some or all data is not available because the company has been in operation less than one year or presents more than or less than 12 months of data in their statements. If presented, data represents either 9-11 months or 13-15 months of information
FA Combination of AA and BA
FB Combination of AA and BB
FC Combination of AA and BC
FD Combination of AB and BA
FE Combination of AB and BB
FF Combination of AB and BC
FG Combination of AC and BA
FH Combination of AC and BB
FJ Combination of AC and BC
FK Combination of AC and BS

223
Chapter 5 Income Statement
FL Combination of AZ and BS
FW Combination of AR and BB
FX Combination of AZ and BA
FY Combination of AZ and BB
FZ Combination of AZ and BC
Sales (Net) - Quarterly Mnemonic SALEQ
Quarterly Data Item Number Q2
Units Millions of dollars
This item represents gross sales (the amount of actual billings to customers for regular sales completed during the period) reduced by cash discounts, trade discounts, and returned sales and allowances for which credit is given to customers.
This item includes 1. Any revenue source that is expected to continue for the life of the company
2. Other operating revenue
3. Installment sales
4. Franchise sales (when corresponding expenses are available)
Special cases (by industry) include ... 1. Royalty income when considered operating income (such as, oil companies, extractive industries,
publishing companies)
2. Retail companies' sales of leased departments when corresponding costs are available and included in expenses (if costs are not available, the net figure is included in Nonoperating Income [Expense])
3. Shipping companies' operating differential subsidies and income on reserve fund securities when shown separately
4. Finance companies' earned insurance premiums and interest income for finance companies, the sales are counted only after net losses on factored receivables purchased
5. Airline companies, net mutual aid assistance and federal subsidies
6. Cigar, cigarette, oil, rubber, and liquor companies' net sales are after deducting excise taxes
7. Income derived from equipment rental is considered part of operating revenue
8. Utilities' net sales are total current operating revenue
9. For banks, this item includes total current operating revenue and net pretax profit or loss on securities sold or redeemed
10. Life insurance, and property and casualty companies' net sales are total income
11. Advertising companies' net sales are commissions earned, not gross billings
12. Franchise operations' franchise and license fees
13. Leasing companies' rental or leased income
14. Hospitals' sales net of provision for contractual allowances (will sometimes include doubtful accounts)

Research Insight North America Data Guide
224
15. Security brokers' other income
This item excludes 1. Nonoperating income
2. Interest income (included in Nonoperating Income [Expense])
3. Equity in earnings of unconsolidated subsidiaries (included in Nonoperating Income [Expense])
4. Other income (included in Nonoperating Income [Expense])
5. Rental income (included in Nonoperating Income [Expense])
6. Gain on sale of securities or fixed assets (included in Special Items)
7. Discontinued operations (included in Special Items)
8. Excise taxes (excluded from sales and also deducted from Cost of Goods Sold)
9. Royalty income (included in Nonoperating Income [Expense])
Sales (Net) includes other income for those companies which do not report other income separately on a quarterly basis (all four quarters are handled consistently and footnoted).
Sales (Net) includes excise taxes for those companies which do not report excise taxes separately on a quarterly basis (all four quarters are handled consistently and footnoted).
Sales (Net) - Quarterly - Note Mnemonic SALEQF
Code Description AA This year's data reflects a merger or acquisition AB This year's data reflects a significant
merger/acquisition whereby the effects on the prior year's sales constitute 50% or more of the reported sales for that year
AC This year's data reflects an accounting change AG Reflects post Chapter 11 adoption of fresh-start
accounting AR Combination of AA and AZ AS Combination of AA and AC AT Combination of AZ and AC AZ Data excludes discontinued operations BA Includes excise taxes BB Includes other income/excludes some operating
revenues BC Includes sale of leased departments BS Combination of BA and BB BT Combination of BB and BC

225
Chapter 5 Income Statement
CA Includes 6 months of a merger or acquisition CB Includes 9 months of a merger or acquisition CC Includes 12 months of a merger or acquisition CE Excludes 6 months of discontinued operations CF Excludes 9 months of discontinued operations CG Excludes 12 months of discontinued operations DB Data deleted because of a fiscal year change DZ Some or all data is not available because the
company has been in operation less than one year or presents more than or less than 12 months of data in their statements. If presented, data represents either 9-11 months or 13-15 months of information
FA Combination of AA and BA FB Combination of AA and BB FC Combination of AA and BC FD Combination of AB and BA FE Combination of AB and BB FF Combination of AB and BC FG Combination of AC and BA FH Combination of AC and BB FJ Combination of AC and BC FK Combination of AC and BS FL Combination of AZ and BS FW Combination of AR and BB FX Combination of AZ and BA FY Combination of AZ and BB FZ Combination of AZ and BC KA Combination of BA and CA KB Combination of BA and CB KC Combination of BA and CC KD Combination of BB and CA KE Combination of BB and CB KF Combination of BB and CC KG Combination of BC and CA KH Combination of BC and CB KJ Combination of BC and CC KL Combination of BA and CE KM Combination of BA and CF KN Combination of BA and CG KO Combination of BB and CE KP Combination of BB and CF KR Combination of BB and CG

Research Insight North America Data Guide
226
KS Combination of BC and CE KT Combination of BC and CF KU Combination of BC and CG
Sales (Net) - 12-Months Moving Mnemonic SALE12
Concept Calculation SALEQ+SALEQ[-1]+ SALEQ[-2]+SALEQ[-3]
Units Millions of dollars
This item is the sum of Net Sales for the current quarter and the three previous quarters. Net Sales is defined as gross sales (the amount of actual billings to customers for regular sales completed during the period) reduced by cash discounts, trade discounts, and returned sales and allowances for which credit is given to customers.
Selling, General, and Administrative Expenses Mnemonic XSGA
Annual Data Item Number A189
Units Millions of dollars
This item represents all commercial expenses of operation (such as, expenses not directly related to product production) incurred in the regular course of business pertaining to the securing of operating income.
This item includes the following expenses when broken out separately. However, if a company allocates any of these expenses to cost of goods sold, Standard & Poor's will not include them in Selling, General, and Administrative Expenses. 1. Advertising expense
2. Amortization of research and development costs (including software costs)
3. Bad debt expense (provision for doubtful accounts)
4. Commissions
5. Directors' fees and remuneration
6. Engineering expense
7. Foreign currency adjustments when included by the company
8. Freight-out expense
9. Indirect costs when a separate cost of goods sold figure is given
10. Lease expense
11. Marketing expense
12. Operating expenses when a separate cost of goods sold figure is given and there is no selling, general, and administrative expenses
13. Parent company charges for administrative services

227
Chapter 5 Income Statement
14. Pension, retirement, profit sharing, provision of bonus and stock options, employee insurance, and other employee benefit expenses (for non-manufacturing companies)
15. Research and development expenses (unless included in cost of goods sold by the company)
16. Research revenue that is less that 50% of total revenues for 2 years
17. Software expense
18. Strike expense
19. Extractive industries' lease rentals or expense, exploration expense, research and development expense, and geological and geophysical expenses
This item includes the related expenses of sales from companies with software development operations.
This item also includes dry-hole expenses for those companies using the successful-efforts method of accounting for oil assets. However, when dry-hole expense is combined with another item properly classified as depreciation (such as, abandonments and dry holes), Standard & Poor's will determine whether abandonment or dry holes constitutes the more significant figure and the Combined Figure data code (@CF) will be placed in either Depreciation or included in the calculation for Selling, General, and Administrative Expenses.
This item excludes depreciation allocated to Selling, General, and Administrative Expenses (included in Depreciation).
This item is not available for banks or utilities.
Selling, General, and Administrative Expenses - Note Mnemonic XSGAF
Code Description AC This year's data reflects an accounting change
Selling, General, and Administrative Expenses - Quarterly Mnemonic XSGAQ
Quarterly Data Item Number Q1
Units Millions of dollars
This item represents all commercial expenses of operation (such as, expenses not directly related to product production) incurred in the regular course of business pertaining to the securing of operating income.
This item includes the following expenses when broken out separately. However, if a company allocates any of these expenses to cost of goods sold, Standard & Poor's will not include them in Selling, General, and Administrative Expenses. 1. Advertising expense
2. Amortization of research and development costs (including software costs)
3. Bad debt expense (provision for doubtful accounts)

Research Insight North America Data Guide
228
4. Commissions
5. Directors' fees and remuneration
6. Engineering expense
7. Foreign currency adjustments when included by the company
8. Freight-out expense
9. Indirect costs when a separate cost of goods sold figure is given
10. Lease expense
11. Marketing expense
12. Operating expenses when a separate cost of goods sold figure is given and there is no selling, general, and administrative expenses
13. Parent company charges for administrative services
14. Pension, retirement, profit sharing, provision of bonus and stock options, employee insurance, and other employee benefit expenses (for non-manufacturing companies)
15. Research and development expenses (unless included in cost of goods sold by the company)
16. Research revenue that is less that 50% of total revenues for 2 years
17. Software expense
18. Strike expense
19. Extractive industries' lease rentals or expense, exploration expense, research and development expense, and geological and geophysical expenses
This item includes the related expenses of sales from companies with software development operations.
This item also includes dry-hole expenses for those companies using the successful-efforts method of accounting for oil assets. However, when dry-hole expense is combined with another item properly classified as depreciation (such as, abandonments and dry holes), Standard & Poor's will determine whether abandonment or dry holes constitutes the more significant figure and the Combined Figure data code (@CF) will be placed in either Depreciation or included in the calculation for Selling, General, and Administrative Expenses.
This item excludes depreciation allocated to Selling, General, and Administrative Expenses (included in Depreciation).
This item is not available for banks or utilities.
Selling, General, and Administrative Expenses - Quarterly - Note Mnemonic XSGAQF
Code Description AC This year's data reflects an accounting change

229
Chapter 5 Income Statement
Selling, General, and Administrative Expenses - 12-Months Moving Mnemonic XSGA12
Concept calculation XSGAQ+XSGAQ[-1]+ XSGAQ[-2]+XSGAQ[-3]
Units Millions of dollars
This item is the sum of Selling, General, and Administrative Expense for the current quarter and the three previous quarters. Selling, General, and Administrative Expense is defined as all commercial expenses of operation (such as, expenses not directly related to product production) incurred in the regular course of business pertaining to the securing of operating income.
Special Items Mnemonic SPI
Annual Data Item Number A17
Units Millions of dollars
This item represents unusual or nonrecurring items presented above taxes by the company.
This item (when reported above taxes) includes 1. Adjustments applicable to prior years (except recurring prior year income tax adjustments)
2. After-tax adjustments to net income for the purchase portion of net income of partly pooled companies when the adjustment is carried over to retained earnings
3. Any significant nonrecurring items
4. Current year's results of discontinued operations and operations to be discontinued
5. Flood, fire, and other natural disaster losses
6. Interest on tax settlements (when reported separately from other interest expense)
7. Inventory writedowns when reported separately or called "nonrecurring"
8. Nonrecurring profit or loss on the sale of assets, investments, securities, among others
9. Profit or loss on the repurchase of debentures
10. Purchased research and development
11. Relocation and moving expense
12. Reserve for litigation
13. Restructuring charges
14. Severance pay when reported separately on the Income Statement
15. Special allowances for facilities under construction
16. Transfers from reserves provided for in prior years
17. Write-down of assets
18. Write-downs or write-offs of receivables, intangibles, among others
19. Write-offs of capitalized computer software costs
20. Year 2000 expenses
This item excludes

Research Insight North America Data Guide
230
1. Any special item listed above as "include" that appears every year for the last three years, unless it has specifically been called Restructuring, Special or Non-recurring. (Additionally, this does not apply to Year 2000 Expenses, Impairment of Goodwill, Extinguishment of Debt, Settlements, In Process R&D or Purchased R&D.)
2. Foreign exchange (currency) adjustments (included in Nonoperating Income [Expense])
3. Gain/Loss on Sale of Marketable Securities for companies that have adopted SFAS #115
4. Idle plant expense (included in Nonoperating Income [Expense])
5. Interest on tax settlements, when included by the company with other interest expense (included in Interest Expense)
6. Milestone Payments or One-Time Contract Reimbursements for R&D companies
7. Nonrecurring items that are included in equity in earnings
8. Profit or loss on sale of properties (except for securities, etc.) for the companies in the oil, coal, transportation, and other industries where these transactions are considered a normal part of doing business (included in Nonoperating Income [Expense])
9. Shipping firms' operating differential subsidies and estimated profit adjustments for preceding years. Prior years' operating differential subsidies are included in Nonoperating Income (Expense). Current year operating differential subsidy is included in sales. Adjustments by shipping companies to estimated profits reported by this method are ignored
Special Items - Quarterly Mnemonic SPIQ
Quarterly Data Item Number Q32
Units Millions of dollars
This item represents unusual or nonrecurring items presented above taxes by the company.
This item (when reported above taxes) includes ... 1. Adjustments applicable to prior years (except recurring prior year income tax adjustments)
2. After-tax adjustments to net income for the purchase portion of net income of partly pooled companies when the adjustment is carried over to retained earnings
3. Current year's results of discontinued operations and operations to be discontinued
4. Flood, fire, and other natural disaster losses
5. Any significant nonrecurring items
6. Nonrecurring profit or loss on the sale of assets, investments, securities, among others
7. Profit or loss on the repurchase of debentures
8. Special allowance for facilities under construction
9. Transfers from reserves provided for in prior years
10. Write-downs or write-offs of receivables, intangibles, among others
11. Write-offs of capitalized computer software costs
This item excludes 1. Recurring foreign exchange (currency) adjustments (included in Nonoperating Income [Expense])

231
Chapter 5 Income Statement
2. Profit or loss on sale of properties (except for securities, etc.) for the companies in the oil, coal, transportation, and other industries where these transactions are considered a normal part of doing business (included in Nonoperating Income [Expense])
3. Shipping firms' operating differential subsidies and estimated profit adjustments for preceding years. Prior years' operating differential subsidies are included in Nonoperating Income (Expense). Current year operating differential subsidy is included in sales. Adjustments by shipping companies to estimated profits reported by this method are ignored
4. Idle plant expense (included in Nonoperating Income [Expense])


233
Chapter 6 Supplemental Income Statement
Supplemental Income Statement
This chapter contains supplemental income statement items collected from companies' notes to the financial statements.
Supplemental Income Statement Items
Data Item Name
Annual Mnemonic . . . page
Quarterly Mnemonic . . . page
12-Month Moving Mnemonic . . . page
Accounting Changes - Cumulative Effect
ACCHG . . . 257 ACCHGQ . . . 258
Acquisition/Merger After-Tax AQA . . . 259 AQAQ . . . 259 Acquisition/Merger Basic EPS Effect
AQEPS . . . 259 AQEPSQ . . . 259
Acquisition/Merger Diluted EPS Effect
AQD . . . 260 AQDQ . . . 260
Acquisition/Merger Pretax AQP . . . 260 APQP . . . 260 Acquisitions - Income Contribution
AQI . . . 261
Acquisitions - Sales Contribution AQS . . . 261 Advertising Expense XAD . . . 262 Cash Dividends - Common DVC . . . 262 Depreciation and Amortization of Real Estate Property
DPRET . . . 263 DPRETQ . . . 264
Dilution Adjustment DILADJ . . . 264 DILADQ . . . 265 Dilution Available - Excluding Extraordinary Items
DILAVX . . . 265 DILAVQ . . . 265
Earnings Assets - Total EAT . . . 170 EATQ . . . 171 Earnings Before Interest and Taxes
EBIT . . . 684 EBITQ . . . 684
Equity in Earnings - Unconsolidated Subsidiary
ESUB . . . 265
Excise Taxes TXE . . . 266 Foreign Currency Adjustment FCA . . . 266 FCAQ . . . 267 Gain/Loss After-Tax GLA . . . 267 GLAQ . . . 268 Gain/Loss Basic EPS Effect GLEPS . . . 268 GLEPSQ . . . 268 Gain/Loss Diluted EPS Effect GLD . . . 268 GLDQ . . . 269 Gain/Loss Pretax GLP . . . 269 GLPQ . . . 269 Goodwill Amortization GDWLAM . . . 269
CHAPTER 6

Research Insight North America Data Guide
234
Impairments of Goodwill After-Tax
GDWLIA . . . 270 GDWLIAQ . . . 271 GDWLIA12 . . . 271
Impairments of Goodwill Basic EPS Effect
GDWLIEPS . . . 272 GDWLEPSQ . . . 273 GDWLIB12 . . . 273
Impairments of Goodwill Diluted EPS Effect
GDWLID . . . 274 GDWLIDQ . . . 274 GDWLID12 . . . 275
Impairments of Goodwill Pretax GDWLIP . . . 276 GDWLIPQ . . . 276 Implied Option Expense XINTOPT . . . 276 In Process Research & Development
RDIP . . . 277 RDIPQ . . . 277
Interest Capitalized INTC . . . 174 Interest Capitalized - Net Income Effect
NIECI . . . 279
Interest Expense on Long-Term Debt
XINTD . . . 277
Interest Income IINT . . . 230 Investment Tax Credit ITCI . . . 116 Labor and Related Expense XLR . . . 278 Pension and Retirement Expense
XPR . . . 279
Pretax Income - Domestic PIDOM . . . 281 Pretax Income - Foreign PIFO . . . 281 Rental Expense XRENT . . . 281 Rental Income IRENT . . . 282 Research and Development Expense
XRD . . . 282
Restructuring Costs After-Tax RCA . . . 284 RCAQ . . . 284 Restructuring Costs Basic EPS Effect
RCEPS . . . 284 RCEPSQ . . . 285
Restructuring Costs Diluted EPS Effect
RCD . . . 285 RCDQ . . . 286
Restructuring Costs Pretax RCP . . . 286 RCPQ . . . 286 Settlement After-Tax SETA . . . 286 SETAQ . . . 287 Settlement Basic EPS Effect SETEPS . . . 287 SETEPSQ . . . 287 Settlement Diluted EPS Effect SETD . . . 287 SETDQ . . . 288 Settlement Pretax SETP . . . 289 SETPQ . . . 289 Special Items After-Tax - Other SPIOQ . . . 289 SPIOAQ . . . 289 Special Items Basic EPS Effect - Other
SPIEPS . . . 290 SPIEPSQ . . . 290
Special Items Diluted EPS Effect - Other
SPID . . . 290 SPIDQ . . . 290
Special Items Pretax - Other SPIOP . . . 291 SPIOPQ . . . 291 Stock Compensation Expense STKCO . . . 291 STKCOQ . . . 291 Writedowns After-Tax WDA . . . 292 WDAQ . . . 292

235
Chapter 6 Supplemental Income Statement
Writedowns Basic EPS Effect WDEPS . . . 292 WDEPSQ . . . 293 Writedowns Diluted EPS Effect WDD . . . 293 WDDQ . . . 293 Writedowns Pretax WDP . . . 293 WDPQ . . . 294


237
Chapter 6 Supplemental Income Statement
Data Definitions
Accounting Changes - Cumulative Effect Mnemonic ACCHG
Data item number A183
Units Millions of dollars
This item represents the cumulative effect of company adjustments due to accounting changes on prior period earnings. The item reflects adjustments during the period(s) in which an accounting change occurs.
This item includes 1. Cumulative effect of accounting changes (when reported after net income)
2. Cumulative effects reported as expense or within income taxes
3. Extraordinary items specifically reported as the cumulative effect of an accounting change
4. Prior year accounting change adjustments
This item excludes 1. Discontinued operations
2. Extraordinary items not specifically identified as the result of the cumulative effect of accounting changes
3. Prior period adjustments not specifically identified as the result of the cumulative effect of accounting changes
4. Tax loss carry forwards
Accounting Changes - Cumulative Effect - Note
Annual Footnote Mnemonic
Data item
Units
ACCHGF AF49 Code
Code Description
TY FASB #106 transition obligation amortized
TZ FASB #106 transition obligation not amortized
The descriptions for these codes can be viewed by choosing the Databases » Descriptions command from the menu bar and entering the mnemonic in the Item text box. To include a textual description of a code in a report, you can use the @DESC function. For example, to include a description of the footnote, type @DESC (ACCHGF).

Research Insight North America Data Guide
238
Accounting Changes - Cumulative Effect - Quarterly Mnemonic ACCHGQ
Data item number Q117
Units Millions of dollars
This item represents the cumulative effect of company adjustments due to accounting changes on prior period earnings. The item reflects adjustments during the period(s) in which an accounting change occurs.
This item includes 1. Cumulative effect of accounting changes (when reported after net income)
2. Cumulative effects reported as expense or within income taxes
3. Extraordinary items specifically reported as the cumulative effect of an accounting change
4. Prior year accounting change adjustments
This item excludes 1. Discontinued operations
2. Extraordinary items not specifically identified as the result of the cumulative effect of accounting changes
3. Prior period adjustments not specifically identified as the result of the cumulative effect of accounting changes
4. Tax loss carry forwards
Accounting Changes - Cumulative Effect - Note - Quarterly
Quarterly Footnote Mnemonic
Data item
Units
ACCGQF QF23 Code
Code Description TY FASB #106 transition obligation amortized TZ FASB #106 transition obligation not amortized
The descriptions for these codes can be viewed by choosing the Databases » Descriptions command from the menu bar and entering the mnemonic in the Item text box. To include a textual description of a code in a report, you can use the @DESC function. For example, to include a description of the footnote, type @DESC (ACCGQF).

239
Chapter 6 Supplemental Income Statement
Acquisition/Merger After-Tax Mnemonic AQA
Statement Income Statement
Data Item number A361
This item is the sum of all special items after taxes that correspond to Acquisition/Merger.
This item contains a Combined Figure data code (@CF) if any of the Acquisition/Merger After-tax special items contains a Combined Figure (@CF) data code.
Acquisition/Merger After-Tax - Quarterly Mnemonic AQAQ
Statement Income Statement
Data Item number Q242
This item is the sum of all special items after taxes that correspond to Acquisition/Merger.
This item contains a Combined Figure data code (@CF) if any of the Acquisition/Merger After-tax special items contains a Combined Figure (@CF) data code.
Acquisition/Merger Basic EPS Effect Mnemonic AQEPS
Statement Income Statement
Data Item number A362
This item is the sum of all basic EPS effect items for all Acquisition/Merger items.
This item contains a Combined Figure data code (@CF) if any of the Acquisition/Merger Basic EPS Effect items contains a Combined Figure (@CF) data code.
Acquisition/Merger Basic EPS Effect - Quarterly Mnemonic AQEPSQ
Statement Income Statement
Data Item number Q243
This item is the sum of all basic EPS effect items for all Acquisition/Merger items.
This item contains a Combined Figure data code (@CF) if any of the Acquisition/Merger Basic EPS Effect items contains a Combined Figure (@CF) data code.
Acquisition/Merger Diluted EPS Effect Mnemonic AQD
Statement Income Statement
Data Item number A363
This item is the sum of all diluted EPS effect items for all Acquisition/Merger items.

Research Insight North America Data Guide
240
This item contains a Combined Figure data code (@CF) if any of the Acquisition/Merger Diluted EPS Effect items contains a Combined Figure (@CF) data code.
Acquisition/Merger Diluted EPS Effect - Quarterly Mnemonic AQDQ
Statement Income Statement
Data Item number Q244
This item is the sum of all diluted EPS effect items for all Acquisition/Merger items.
This item contains a Combined Figure data code (@CF) if any of the Acquisition/Merger Diluted EPS Effect items contains a Combined Figure (@CF) data code.
Acquisition/Merger Pretax Mnemonic AQP
Statement Income Statement
Data Item number A360
This item is the sum of all Acquisition/Merger special items reported before taxes.
This item contains a Combined Figure data code (@CF) if any Acquisition/Merger Pretax special items is not reported or contains a Combined Figure (@CF) data code.
Acquisition/Merger Pretax - Quarterly Mnemonic AQPQ
Statement Income Statement
Data Item number Q241
This item is the sum of all Acquisition/Merger special items reported before taxes.
This item contains a Combined Figure data code (@CF) if any of the Acquisition/Merger Pretax special items is not reported or contains a Combined Figure data code.
Acquisitions - Income Contribution Mnemonic AQI
Data item number A248
Units Millions of dollars
This item represents the effect of a purchase or pooling of interest acquisition in the current year on a company’s income for the prior year.
This item excludes 1. Discontinued operations
2. Extraordinary items
This item is not available for banks.

241
Chapter 6 Supplemental Income Statement
Acquisitions - Sales Contribution Mnemonic AQS
Data Item Number A249
Units Millions of dollars
This item represents the effect upon the prior year’s sales of all acquisitions (either purchase and/or pooling of interest) that occurred in and/or were accounted for in the current year.
This item includes 1. Acquisition of a majority-owned consolidated subsidiary (not additional ownership)
2. Consolidation of a subsidiary previously carried at cost
This item excludes 1. Acquisition of additional ownership in a consolidated subsidiary, not 100% owned
2. Acquisition of assets of a company without the liabilities
3. Acquisitions carried at equity (not consolidated)
4. Consolidation of a subsidiary previously carried at equity
This item is not available for banks.
Acquisitions - Sales Contribution - Note Mnemonic AQSF
Code Description AE Combination of purchase method and pooling of
interest method AI Pooling of interest method of acquisition AP Purchase method acquisition RP Reverse purchase method acquisition RO Combination of reverse purchase method and pooling
of interest method acquisition RU Combination of reverse purchase method and
purchase method acquisition RW Combination AE and RP
The descriptions for these codes can be viewed by choosing the Databases » Descriptions command from the menu bar and entering the mnemonic in the Item text box. To include a textual description of a code in a report, you can use the @DESC function. For example, to include a description of this footnote, type @DESC (AQSF).

Research Insight North America Data Guide
242
Advertising Expense Mnemonic XAD
Data Item Number A45
Units Millions of dollars
This item represents the cost of advertising media (such as, radio, television, and periodicals) and promotional expenses.
This item is not available for banks.
Cash Dividends - Common Mnemonic DVC
Data Item Number A21
Units Millions of dollars
This item represents the total dollar amount of dividends (other than stock dividends) declared on the common stock of the company during the year.
This item includes 1. Cash paid in lieu of fractional shares
2. Dividends declared by a pooled company prior to acquisition in the year of the merger, including dividends on preferred stock of a merged company which was exchanged for common stock
3. Cash dividends to all classes of common stock by companies with more than one class of common stock
4. Other cash distributions to stockholders
This item excludes 1. Consolidated subsidiary dividends
2. Dividends declared in stock of other companies
3. Dollar value of stock dividends
This item is common dividends paid for life insurance companies.
Depreciation and Amortization of Real Estate Property Mnemonic DPRET
Statement Income Statement
Data Item Number A393
This item represent the depreciation and amortization of Real Estate reported on a company’s Income Statement.
This items includes 1. Depreciation and amortization of real estate related property

243
Chapter 6 Supplemental Income Statement
2. Depreciation of leasing costs
3. Amortization of deferred tenant costs
4. Amortization of lease costs
5. Depreciation related to wholly owned and consolidated partnerships
6. Depreciation and amortization of property and improvements
This items excludes 1. Amortization of deferred charges
2. Depreciation of personal property
3. Amortization of debt
4. Depreciation of Securities available
5. Amortization of Loan costs
6. Amortization of Intangibles
7. Operating Covenant Amortization
8. Corporate Depreciation
9. Depreciation of unconsolidated subs/affiliates
This item is available for Real Estate & Investment Trust companies, only.
Depreciation and Amortization of Real Estate Property - Quarterly Mnemonic DPRETQ
Statement Income Statement
Data Item Number Q272
This item represent the depreciation and amortization of Real Estate reported on a company’s Income Statement.
This items includes 1. Depreciation and amortization of real estate related property
2. Depreciation of leasing costs
3. Amortization of deferred tenant costs
4. Amortization of lease costs
5. Depreciation related to wholly owned and consolidated partnerships
6. Depreciation and amortization of property and improvements
This items excludes 1. Amortization of deferred charges
2. Depreciation of personal property
3. Amortization of debt
4. Depreciation of Securities available
5. Amortization of Loan costs
6. Amortization of Intangibles

Research Insight North America Data Guide
244
7. Operating Covenant Amortization
8. Corporate Depreciation
9. Depreciation of unconsolidated subs/affiliates
This item is available for Real Estate & Investment Trust companies, only.
Dilution Adjustment Mnemonic DILADJ
Units Millions of dollars
These are the total adjustments added to the company’s Net Income used for Basic EPS, in order to determine the Net Income used to calculate Diluted EPS.
This item includes 1. Savings from convertible preferred dividends
2. Savings from after-tax amount of interest recognized in the period associated with any convertible debt
3. Other adjustments to net income/loss as reported by the company
Dilution Adjustment - Quarterly Mnemonic DILADQ
Units Millions of dollars
These are the total adjustments added to the company’s Net Income used for Basic EPS, in order to determine the Net Income used to calculate Diluted EPS.
This item includes 1. Savings from convertible preferred dividends
2. Savings from after-tax amount of interest recognized in the period associated with any convertible debt
3. Other adjustments to net income/loss as reported by the company
Dilution Available - Excluding Extraordinary Items Mnemonic DILAVX
Units Millions of dollars
This is the net income used by the company to calculate Diluted Earnings per Share – Excluding Extraordinary Items.
Dilution Available - Excluding Extraordinary Items - Quarterly Mnemonic DILAVQ
Units Millions of dollars
This is the net income used by the company to calculate Diluted Earnings per Share – Excluding Extraordinary Items.

245
Chapter 6 Supplemental Income Statement
Equity in Earnings - Unconsolidated Subsidiary Mnemonic ESUB
Annual Data Item Number A55
Units Millions of dollars
This item represents the parent company's portion of unremitted earnings from an unconsolidated subsidiary.
This item includes 1. Dividends in excess of equity in earnings
2. Equity in earnings of a subsidiary sold during the year
3. Amortization of goodwill on unconsolidated subsidiaries
This item excludes ... 1. Undistributed earnings
2. Equity in earnings shown as an extraordinary item
3. Equity in earnings presented as discontinued operations
This item is not available for banks or utilities.
Equity in Earnings - Unconsolidated Subsidiary - Note Mnemonic ESUBF
Code Description AC Reflects an accounting change for adoption of FASB
#94 LL Combination AC and TE TE Equity is reported below taxes (used only when the
majority of the equity figure is reported below taxes)
Excise Taxes Mnemonic TXE
Annual Data Item Number A102
Units Millions of dollars
This item represents the amount of excise tax collected by the company for the period. It is a government-levied tax on the manufacture, sale or consumption of a commodity (for example, liquor, tobacco, rubber, oil) and is included in the sales price, collected by the seller and remitted to the government. This tax is applicable to companies engaged in the manufacture, sale or consumption of the commodities listed above.

Research Insight North America Data Guide
246
Foreign Currency Adjustment Mnemonic FCA
Annual Data Item Number A150
Units Millions of dollars
This item represents the realized and unrealized foreign exchange gains and/or losses included in the determination of income for the period.
This item is not available for banks or utilities.
Foreign Currency Adjustment - Note Mnemonic FCAF
Code Description AC Reflects an accounting change
Foreign Currency Adjustment - Quarterly Mnemonic FCAQ
Quarterly Data Item Number Q34
Units Millions of dollars
This item represents the realized and unrealized foreign exchange gains and/or losses included in the determination of income for the period.
This item is not available for banks or utilities.
Foreign Currency Adjustment - Quarterly - Note Mnemonic FCAQF
Code Description AC Reflects an accounting change

247
Chapter 6 Supplemental Income Statement
Gain/Loss After-Tax Mnemonic GLA
Statement Income Statement
Data Item Number A365
This item is the sum of all after-tax special items associated with gain/loss.
This item contains a Combined Figure data code (@CF) if any of the Gain/Loss After-Tax Items contains a Combined Figure (@CF) data code.
Gain/Loss After-Tax - Quarterly Mnemonic GLAQ
Statement Income Statement
Data Item Number Q246
This item is the sum of all after-tax special items associated with gain/loss.
This item contains a Combined Figure data code (@CF) if any of the Gain/Loss After-Tax Items is not reported or contains a Combined Figure (@CF) data code.
Gain/Loss Basic EPS Effect Mnemonic GLEPS
Statement Income Statement
Data Item Number A366
This item is the sum of all basic EPS effect for special items that have gain/loss reported.
This item contains a Combined Figure data code (@CF) if any of the Gain/Loss basic EPS items contains a Combined Figure (@CF) data code.
Gain/Loss Basic EPS Effect - Quarterly Mnemonic GLEPSQ
Statement Income Statement
Data Item Number Q248
This item is the sum of all basic EPS effect for special items that have gain/loss reported.
This item contains a Combined Figure data code (@CF) if any of the Gain/Loss basic EPS items contains a Combined Figure (@CF) data code.
Gain/Loss Diluted EPS Effect Mnemonic GLD
Statement Income Statement
Data Item Number A367
This item is the sum of all diluted EPS effect for special items that have gain/loss reported.

Research Insight North America Data Guide
248
This item contains a Combined Figure data code (@CF) if any of the Gain/Loss Diluted EPS Effect items contains a Combined Figure (@CF) data code.
Gain/Loss Diluted EPS Effect - Quarterly Mnemonic GLDQ
Statement Income Statement
Data Item Number Q249
This item is the sum of all diluted EPS effect for special items that have gain/loss reported.
This item contains a Combined Figure data code (@CF) if any of the Gain/Loss Diluted EPS Effect items contains a Combined Figure (@CF) data code.
Gain/Loss Pretax Mnemonic GLP
Statement Income Statement
Data Item Number A364
This item is the sum of all pretax special items associated with gain/loss.
This item contains a Combined Figure data code (@CF) if any of the Gain/Loss Pretax Items is not reported or contains a Combined Figure (@CF) data code.
Gain/Loss Pretax - Quarterly Mnemonic GLPQ
Statement Income Statement
Data Item Number Q245
This item is the sum of all pretax special items associated with gain/loss.
This item contains a Combined Figure data code (@CF) if any of the Gain/Loss Pretax Items is not reported or contains a Combined Figure (@CF) data code.
Goodwill Amortization Mnemonic GDWLAM
Statement Income Statement
Data Item Number A394
This item is the amount of goodwill and other intangible amortization that is added back to net income in the prior year to make it consistent with how the company is reporting it in the year that it adopts SFAS #142.
Goodwill Amortization - Note Mnemonic GDWLAMF

249
Chapter 6 Supplemental Income Statement
Code Description GZ Gross amount of amortization of goodwill collected
Goodwill Amortization - Quarterly Mnemonic GDWLAMQ
Statement Income Statement
Data Item Number Q275
This item is the adjustment to goodwill and other intangible amortization reported by the company that will make the Goodwill Amortization figure consistent with how they reported it in the year that it adopts SFAS #142.
Goodwill Amortization - Note - Quarterly Mnemonic GDWLAMQF
Code Description GZ Gross amount of amortization of goodwill collected
Impairments of Goodwill After-Tax Mnemonic GDWLIA
Statement Income Statement
Data Item Number A369
This item is the sum of all Impairment of Goodwill special items reported after taxes.
This item contains a Combined Figure data code (@CF) if an amount for any of the Impairment of Goodwill After-Tax Items contains a Combined Figure (@CF) data code.
Impairments of Goodwill After Tax Footnote Mnemonic GDWLIAF
Code Description NC This is a Standard & Poor’s calculation and may
disagree with company reports.

Research Insight North America Data Guide
250
NR This is a Standard & Poor’s calculation and may disagree with company reports. Statutory rate (35%) used in calculation.
Impairments of Goodwill After-Tax - Quarterly Mnemonic GDWLIAQ
Statement Income Statement
Data Item Number Q250
This item is the sum of all Impairment of Goodwill special items reported after taxes.
This item contains a Combined Figure data code (@CF) if an amount for any of the Impairment of Goodwill After-Tax Items contains a Combined Figure (@CF) data code.
Impairments of Goodwill After Tax Quarterly Footnote Mnemonic GDWLIAQF
Code Description NC This is a Standard & Poor’s calculation and may
disagree with company reports. NR This is a Standard & Poor’s calculation and may
disagree with company reports. Statutory rate (35%) used in calculation.
Impairments of Goodwill After Tax 12MM Mnemonic GDWLIA12
Units Millions of dollars
This item is the sum of all Impairment of Goodwill special items reported after taxes.
Special Items represent unusual and/or non-recurring items reported by the company above taxes and are presented as a net figure. Special item income/gains are positive and special item expense/losses are negative.
This item includes
Write off of goodwill
Impairment of goodwill and other intangibles when combined
Impairment of unamortized intangibles
Positive impairments of goodwill and/or unamortized intangibles that indicate company is reversing part of a previous charge.
This item contains the Combined Figure data code if any of the Impairment of Goodwill After-Tax Items contains the Combined Figure data code.
The 12-Month Moving figure is equal to the current quarter plus the three previous quarters.

251
Chapter 6 Supplemental Income Statement
Impairments of Goodwill After Tax 12MM Footnote Mnemonic GDWLIA12F
Code Description NC This is a Standard & Poor’s calculation and may
disagree with company reports. NR This is a Standard & Poor’s calculation and may
disagree with company reports. Statutory rate (35%) used in calculation.
Impairments of Goodwill Basic EPS Effect Mnemonic GDWLIEPS
Statement Income Statement
Data Item Number A370
This item is the sum of all basic EPS effect special items that correspond to impairments of goodwill.
This item contains a Combined Figure data code (@CF) if an amount for any of the Impairment of Goodwill Basic EPS Effect items contains a Combined Figure (@CF) data code.
Impairments of Goodwill Basic EPS Effect Footnote Mnemonic GDWLIBF
Code Description NC Earnings per Share is a Standard & Poor’s
calculation and may disagree with company reports. NR This is a Standard & Poor’s calculation and may
disagree with company reports. Statutory rate (35%) used in calculation.
Impairments of Goodwill Basic EPS Effect - Quarterly Mnemonic GDWLIEPSQ
Statement Income Statement
Data Item Number Q251
This item is the sum of all basic EPS effect special items that correspond to impairments of goodwill.

Research Insight North America Data Guide
252
This item contains a Combined Figure data code (@CF) if an amount for any of the Impairment of Goodwill Basic EPS Effect items contains a Combined Figure (@CF) data code.
Impairments of Goodwill Basic EPS Effect Quarterly Footnote Mnemonic GDWLIBQF
Code Description NC Earnings per Share is a Standard & Poor’s
calculation and may disagree with company reports. NR This is a Standard & Poor’s calculation and may
disagree with company reports. Statutory rate (35%) used in calculation.
Impairments of Goodwill Basic EPS Effect 12MM Mnemonic GDWLIB12
Units Dollars and cents
This item is the sum of all basic EPS effect special items that correspond to Impairments of Goodwill.
The 12-Month Moving figure is equal to the current quarter plus the three previous quarters.
This item contains a Combined Figure data code (@CF) if an amount for any of the Impairment of Goodwill Basic EPS Effect items contains a Combined Figure (@CF) data code.
Impairments of Goodwill Basic EPS Effect 12MM Footnote Mnemonic GDWLIB12F
Code Description NC Earnings per Share is a Standard & Poor’s
calculation and may disagree with company reports. NR This is a Standard & Poor’s calculation and may
disagree with company reports. Statutory rate (35%) used in calculation.
Impairments of Goodwill Diluted EPS Effect Mnemonic GDWLID
Statement Income Statement
Data Item Number A371

253
Chapter 6 Supplemental Income Statement
This item is the sum of all Impairment of Goodwill Diluted EPS effect items reported.
This item contains a Combined Figure data code (@CF) if an amount for any of the Impairment of Goodwill Diluted EPS Effect items contains a Combined Figure (@CF) data code.
Impairments of Goodwill Diluted EPS Effect Footnote Mnemonic GDWLIDF
Code Description NC Earnings per Share is a Standard & Poor’s
calculation and may disagree with company reports. NR This is a Standard & Poor’s calculation and may
disagree with company reports. Statutory rate (35%) used in calculation.
Impairments of Goodwill Diluted EPS Effect - Quarterly Mnemonic GDWLIDQ
Statement Income Statement
Data Item Number Q252
This item is the sum of all Impairment of Goodwill Diluted EPS effect items reported.
Impairments of Goodwill Diluted EPS Effect Quarterly Footnote Mnemonic GDWLIDQF
Code Description NC Earnings per Share is a Standard & Poor’s
calculation and may disagree with company reports. NR This is a Standard & Poor’s calculation and may
disagree with company reports. Statutory rate (35%) used in calculation.
Impairments of Goodwill Diluted EPS Effect 12MM Mnemonic GDWLID12
Units Dollars and cents
This item is the sum of all Impairments of Goodwill Diluted EPS effect items reported.
The 12-Month Moving figure is equal to the current quarter plus the three previous quarters.
This item contains a Combined Figure data code (@CF) if an amount for any of the Impairment of Goodwill Diluted EPS Effect items contains a Combined Figure (@CF) data code.

Research Insight North America Data Guide
254
Impairments of Goodwill Diluted EPS Effect 12MM Footnote Mnemonic GDWLID12F
Code Description NC Earnings per Share is a Standard & Poor’s
calculation and may disagree with company reports. NR This is a Standard & Poor’s calculation and may
disagree with company reports. Statutory rate (35%) used in calculation.
Impairments of Goodwill Pretax Mnemonic GDWLIP
Statement Income Statement
Data Item Number A368
This item is the sum of all Impairment of Goodwill special items reported before taxes.
This item contains a Combined Figure data code (@CF) if an amount for any of the Impairment of Goodwill Pretax Items is not reported or contains a Combined Figure (@CF) data code.
Impairments of Goodwill Pretax - Quarterly Mnemonic GDWLIPQ
Statement Income Statement
Data Item Number Q249
This item is the sum of all Impairment of Goodwill special items reported before taxes.
This item contains a Combined Figure data code (@CF) if an amount for any of the Impairment of Goodwill Pretax Items is not reported or contains a Combined Figure (@CF) data code.
Implied Option Expense Mnemonic XINTOPT
Data Item Number A399
Units Millions of dollars
This item represents the decrease in net income attributed to the added expense of stock based compensation, such as stock options, restricted stock, stock appreciation rights, and stock purchase plans, that are not fully recognized on the Income Statement. Implied Option Expense is an after-tax value.

255
Chapter 6 Supplemental Income Statement
Stock options granted with a strike price greater than or equal to the current stock price are not recognized as a current period expense using the "intrinsic value" methodology for GAAP. Companies that do not record an options expense based on this methodology also report pro-forma earnings accounting for options as a period expense using the "fair value" method (based on Black-Scholes) footnoted in the annual report. Implied Option Expense = Pro Forma Net Income – Net Income. Implied Option Expense represents an amount that is not expensed. But, the amount would have been reflected if the company had reported under the fair value method.
Implied Option Expense Footnote Mnemonic XINTOPTF
Code Description NC This is a Standard & Poor’s calculation and may
disagree with company reports.
In Process Research & Development Mnemonic RDIP
This item represents the portion of R&D considered to be "purchased" and written off immediately upon acquisition if the R&D items are deemed not to have an alternative use.
In Process Research & Development - Quarterly Mnemonic RDIPQ
Data Item Number Q274
Data Availability Back to 1990
This item represents the portion of R&D considered to be "purchased" and written off immediately upon acquisition if the R&D items are deemed not to have an alternative use.
Interest Capitalized Mnemonic INTC
Annual Data Item Number A147
Units Millions of dollars
This item represents interest charges deferred to the company's property, plant and equipment account, amortized over the life of related assets.
This item is not available for banks or utilities.
Interest Expense on Long-Term Debt Mnemonic XINTD
Annual Data Item Number A101
Units Millions of dollars
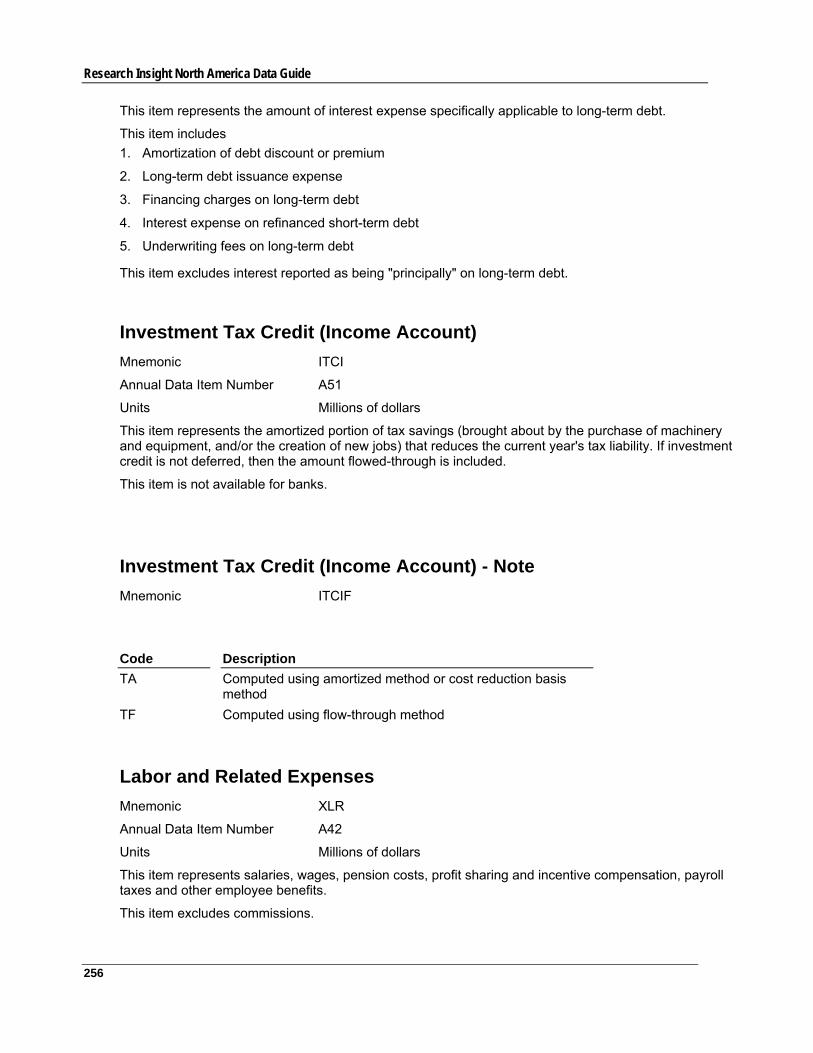
Research Insight North America Data Guide
256
This item represents the amount of interest expense specifically applicable to long-term debt.
This item includes 1. Amortization of debt discount or premium
2. Long-term debt issuance expense
3. Financing charges on long-term debt
4. Interest expense on refinanced short-term debt
5. Underwriting fees on long-term debt
This item excludes interest reported as being "principally" on long-term debt.
Investment Tax Credit (Income Account) Mnemonic ITCI
Annual Data Item Number A51
Units Millions of dollars
This item represents the amortized portion of tax savings (brought about by the purchase of machinery and equipment, and/or the creation of new jobs) that reduces the current year's tax liability. If investment credit is not deferred, then the amount flowed-through is included.
This item is not available for banks.
Investment Tax Credit (Income Account) - Note Mnemonic ITCIF
Code Description TA Computed using amortized method or cost reduction basis
method TF Computed using flow-through method
Labor and Related Expenses Mnemonic XLR
Annual Data Item Number A42
Units Millions of dollars
This item represents salaries, wages, pension costs, profit sharing and incentive compensation, payroll taxes and other employee benefits.
This item excludes commissions.

257
Chapter 6 Supplemental Income Statement
Labor and Related Expenses - Note Mnemonic XLRF
Code Description
XB Excludes employee benefits
Net Income Effect Capitalized Interest Mnemonic NIECI
Annual Data Item Number A239
Units Millions of dollars
This item represents the effect of capitalized interest on net income.
This item includes the effects on net income of ... 1. Capitalized interest for the current year
2. Amortization of capitalized interest for prior years
This item is not available for banks or utilities.
Pension and Retirement Expense Mnemonic XPR
Annual Data Item Number A43
Units Millions of dollars
This item represents the pension and retirement expense included as an expense in the Income Statement. For defined benefit pension plans, this item represents either pension expense (pre-FASB #87) or net periodic pension cost (post-FASB #87).
Pension expense and net periodic pension cost differ significantly in content and may invalidate comparisons of values for this item. This holds true both for intra-company and inter-company comparisons prior to and following adoption of FASB #87.
If a company reports pension expense for defined benefit pension plans (pre-FASB #87), then the following data items will contain data ... 1. Pension Costs - Unfunded Vested Benefits
2. Pension Costs - Unfunded Past Service
3. Pension Benefits - Present Value Vested
4. Pension Costs - Present Value Nonvested
5. Pension Benefits - Assumed Rate of Return
6. Pension Benefits - Information Date
If a company adopts FASB #87, then the following data items will contain data ...

Research Insight North America Data Guide
258
1. Pension - Vested Benefit Obligation (Overfunded)
2. Pension - Vested Benefit Obligation (Underfunded)
3. Pension - Accumulated Benefit Obligation (Overfunded)
4. Pension - Accumulated Benefit Obligation (Underfunded)
5. Pension - Projected Benefit Obligation (Overfunded)
6. Pension - Projected Benefit Obligation (Underfunded)
7. Pension Plan Assets (Overfunded)
8. Pension Plan Assets (Underfunded)
9. Pension - Unrecognized Prior Service Cost (Overfunded)
10. Pension - Unrecognized Prior Service Cost (Underfunded)
11. Pension - Other Adjustments (Overfunded)
12. Pension - Other Adjustments (Underfunded)
13. Pension - Prepaid/Accrued Cost (Overfunded)
14. Pension - Prepaid/Accrued Cost (Underfunded)
15. Pension - Additional Minimum Liability (Underfunded)
For nondefined benefit pension plans and defined benefit pension plans prior to FASB #87, this item includes 1. Service cost
2. Interest cost
3. Amortization of prior service cost
In addition to the above components, post-FASB #87 defined benefit pension plans include 1. Actual return on assets
2. Amortization of net gains and losses
3. Amortization of net assets or obligations arising at transition
This item also encompasses 1. Profit-sharing retirement plans
2. Pension and retirement cost of consolidated subsidiaries
This item excludes 1. Employee benefit plans
2. Straight profit-sharing plans
Pretax Income - Domestic Mnemonic PIDOM
Annual Data Item Number A272
Units Millions of dollars

259
Chapter 6 Supplemental Income Statement
This item represents the income of a company's domestic operations before taxes.
This item includes minority interest reported above taxes.
This item excludes equity in earnings reported below taxes.
This item is not available for banks or utilities.
Pretax Income - Foreign Mnemonic PIFO
Annual Data Item Number A273
Units Millions of dollars
This item represents the income of a company's foreign operations before taxes as reported by the company.
This item includes minority interest reported above taxes.
This item excludes equity in earnings reported below taxes.
This item is not available for banks or utilities.
Rental Expense Mnemonic XRENT
Annual Data Item Number A47
Units Millions of dollars
This item represents all costs charged to operations for the rental of space and/or equipment. If only rental and royalty expenses are reported, then this figure will be used.
This item includes contingent rentals associated with capitalized lease obligations.
This item excludes principal lease or rental payments under capitalized lease obligations.
For banks, this figure is net of rental income.
For airlines, this item includes landing fees.
For oil and gas companies, this item excludes delay rentals (included in Selling, General, and Administrative Expenses)
Rental Expense - Note Mnemonic XRENTF
Code Description BR Includes royalties

Research Insight North America Data Guide
260
QH Net of rental income RH Combination of BR and QH
Rental Income Mnemonic IRENT
Annual Data Item Number A163
Units Millions of dollars
This item represents the amount of income generated from the rental of property, plant, and equipment.
This item excludes rental income that is part of sales.
Research and Development Expense Mnemonic XRD
Annual Data Item Number A46
Units Millions of dollars
This item represents all costs incurred during the year that relate to the development of new products or services. This amount is only the company's contribution.
This item includes 1. Software expenses
2. Amortization of software costs
3. In Process Research & Development when reported by the company
This item excludes 1. Customer or government-sponsored research and development (including reimbursable indirect
costs)
2. Extractive industry activities, such as prospecting, acquisition of mineral rights, drilling, mining, etc.
3. Engineering expense - routine, ongoing efforts to define, enrich, or improve the qualities of existing products
4. Inventory royalties
5. Market research and testing
This item is not available for banks or utilities.
Research and Development Expense - Note Mnemonic XRDF
Code Description BF Includes customer or government sponsored research
and development

261
Chapter 6 Supplemental Income Statement
BG Includes engineering expense BW Includes in-process, acquired or purchased research
and development BV Combination BW and BF or BW and BG
Research and Development Expense - Quarterly Mnemonic XRDQ
Quarterly Data Item Number Q4
Units Millions of dollars
This item represents all costs incurred during the year that relate to the development of new products or services. This amount is only the company's contribution.
This item includes 1. Software expenses
2. Amortization of software costs
3. In Process Research & Development when reported by the company
This item excludes 1. Customer or government-sponsored research and development (including reimbursable indirect
costs)
2. Extractive industry activities, such as prospecting, acquisition of mineral rights, drilling, mining, etc.
3. Engineering expense - routine, ongoing efforts to define, enrich, or improve the qualities of existing products
4. Inventory royalties
5. Market research and testing
This item is not available for banks or utilities.
Research and Development Expense - Quarterly - Note Mnemonic XRDQF
Code Description BF Includes customer or government sponsored research
and development BG Includes engineering expense BW Includes in-process, acquired or purchased research
and development BV Combination BW and BF or BW and BG

Research Insight North America Data Guide
262
Restructuring Costs After-Tax Mnemonic RCA
Statement Income Statement
Data Item Number A377
This item is the sum of all Restructuring special items reported after taxes.
This item contains a Combined Figure data code (@CF) if an amount for any of the Restructuring After-tax special items contains a Combined Figure (@CF) data code.
This item is available from 2001 forward, when reported. This item contains a zero only when the company specifically reports the item amount as zero. If the company does not mention restructuring costs after-tax, this item contains an @NA (Not Available) data code.
Restructuring Costs After-Tax - Quarterly Mnemonic RCAQ
Statement Income Statement
Data Item Number Q258
This item is the sum of all Restructuring special items reported after taxes.
This item contains a Combined Figure data code (@CF) if an amount for any of the Restructuring After-tax special items contains a Combined Figure (@CF) data code.
Restructuring Costs Basic EPS Effect Mnemonic RCEPS
Statement Income Statement
Data Item Number A378
This item is the sum of all Restructuring Basic EPS effect items reported.
This item contains a Combined Figure data code (@CF) if an amount for any of the Restructuring Basic EPS Effect special items contains a Combined Figure (@CF) data code.
Restructuring Costs Basic EPS Effect - Quarterly Mnemonic RCEPSQ
Statement Income Statement
Data Item Number Q259
This item is the sum of all Restructuring Basic EPS effect items reported.
This item contains a Combined Figure data code (@CF) if an amount for any of the Restructuring Basic EPS Effect special items contains a Combined Figure (@CF) data code.

263
Chapter 6 Supplemental Income Statement
Restructuring Costs Diluted EPS Effect Mnemonic RCD
Statement Income Statement
Data Item Number A379
This item is the sum of all Restructuring Diluted EPS effect items reported.
This item contains a Combined Figure data code (@CF) if an amount for any of the Restructuring Diluted EPS Effect special items contains a Combined Figure (@CF) data code.
Restructuring Costs Diluted EPS Effect - Quarterly Mnemonic RCDQ
Statement Income Statement
Data Item Number Q260
This item is the sum of all Restructuring Diluted EPS effect items reported.
This item contains a Combined Figure data code (@CF) if an amount for any of the Restructuring Diluted EPS Effect special items contains a Combined Figure (@CF) data code.
Restructuring Costs Pretax Mnemonic RCP
Statement Income Statement
Data Item Number A376
This item is the sum of all Restructuring special items reported before taxes.
This item contains a Combined Figure data code (@CF) if an amount for any of the Restructuring Pretax special items is not reported or contains a Combined Figure (@CF) data code.
Restructuring Costs Pretax - Quarterly Mnemonic RCPQ
Statement Income Statement
Data Item Number Q258
This item is the sum of all Restructuring special items reported before taxes.
This item contains a Combined Figure data code (@CF) if an amount for any of the Restructuring Pretax special items is not reported or contains a Combined Figure (@CF) data code.
Settlement After-Tax Mnemonic SETA
Statement Income Statement
Data Item Number A373
This item is the sum of all Settlement special items reported after taxes.

Research Insight North America Data Guide
264
This item contains a Combined Figure data code (@CF) if an amount for any of the Settlement After-tax special items contains a Combined Figure (@CF) data code.
Settlement After-Tax - Quarterly Mnemonic SETAQ
Statement Income Statement
Data Item Number Q254
This item is the sum of all Settlement special items reported after taxes.
This item contains a Combined Figure data code (@CF) if an amount for any of the Settlement After-tax special items contains a Combined Figure (@CF) data code.
Settlement Basic EPS Effect Mnemonic SETEPS
Statement Income Statement
Data Item Number A374
This item is the sum of all Settlement Basic EPS effect items reported.
This item contains a Combined Figure data code (@CF) if an amount for any of the Settlement Basic EPS Effect special items contains a Combined Figure (@CF) data code.
Settlement Basic EPS Effect - Quarterly Mnemonic SETEPSQ
Statement Income Statement
Data Item Number Q255
This item is the sum of all Settlement Basic EPS effect items reported.
This item contains a Combined Figure data code (@CF) if an amount for any of the Settlement Basic EPS Effect special items contains a Combined Figure (@CF) data code.
Settlement Diluted EPS Effect Mnemonic SETD
Statement Income Statement
Data Item Number A375
This item is the sum of all Settlement Diluted EPS effect items reported.
This item contains a Combined Figure data code (@CF) if an amount for any of the Settlement Diluted EPS Effect special items contains a Combined Figure (@CF) data code.

265
Chapter 6 Supplemental Income Statement
Settlement Diluted EPS Effect - Quarterly Mnemonic SETDQ
Statement Income Statement
Data Item Number Q256
This item is the sum of all Settlement Diluted EPS effect items reported.
This item contains a Combined Figure data code (@CF) if an amount for any of the Settlement Diluted EPS Effect special items contains a Combined Figure (@CF) data code.
Settlement Pretax Mnemonic SETP
Statement Income Statement
Data Item Number A372
This item is the sum of all Settlement special items reported before taxes.
This item contains a Combined Figure data code (@CF) if an amount for any of the Settlement Pretax special items is not reported or contains a Combined Figure (@CF) data code.
Settlement Pretax - Quarterly Mnemonic SETPQ
Statement Income Statement
Data Item Number Q253
This item is the sum of all Settlement special items reported before taxes.
This item contains a Combined Figure data code (@CF) if an amount for any of the Settlement Pretax special items is not reported or contains a Combined Figure (@CF) data code.
Special Items After-Tax - Other Mnemonic SPIOA
Statement Income Statement
Data Item Number A385
This item is the sum of all other Special items reported after taxes.
This item contains a Combined Figure data code (@CF) if an amount for any of the Other After-tax special items contains a Combined Figure (@CF) data code.
Special Items After-Tax - Other - Quarterly Mnemonic SPIOAQ
Statement Income Statement
Data Item Number Q266
This item is the sum of all other Special items reported after taxes.

Research Insight North America Data Guide
266
This item contains a Combined Figure data code (@CF) if an amount for any of the Other After-tax special items contains a Combined Figure (@CF) data code.
Special Items Basic EPS Effect - Other Mnemonic SPIEPS
Statement Income Statement
Data Item Number A386
This item is the sum of all other Basic EPS effect special items reported.
This item contains a Combined Figure data code (@CF) if an amount for any of the Other Basic EPS Effect special items contains a Combined Figure (@CF) data code.
Special Items Basic EPS Effect - Other - Quarterly Mnemonic SPIEPSQ
Statement Income Statement
Data Item Number Q267
This item is the sum of all other Basic EPS effect special items reported.
This item contains a Combined Figure data code (@CF) if an amount for any of the Other Basic EPS Effect special items contains a Combined Figure (@CF) data code.
Special Items Diluted EPS Effect - Other Mnemonic SPID
Statement Income Statement
Data Item Number A387
This item is the sum of all other Diluted EPS effect special items reported.
This item contains a Combined Figure data code (@CF) if an amount for any of the Other Diluted EPS Effect special items contains a Combined Figure (@CF) data code.
Special Items Diluted EPS Effect - Other - Quarterly Mnemonic SPIDQ
Statement Income Statement
Data Item Number Q268
This item is the sum of all other Diluted EPS effect special items reported.
This item contains a Combined Figure data code (@CF) if an amount for any of the Other Diluted EPS Effect special items contains a Combined Figure (@CF) data code.
Special Items Pretax - Other Mnemonic SPIOP
Statement Income Statement
Data Item Number A384

267
Chapter 6 Supplemental Income Statement
This item is the sum of all other Special items reported before taxes.
This item contains a Combined Figure data code (@CF) if an amount for any of the Other Pretax special items is not reported or contains a Combined Figure (@CF) data code.
Special Items Pretax - Other - Quarterly Mnemonic SPIOPQ
Statement Income Statement
Data Item Number Q265
This item is the sum of all other Special items reported before taxes.
This item contains a Combined Figure data code (@CF) if an amount for any of the Pretax special items is not reported or contains a Combined Figure (@CF) data code.
Stock Compensation Expense Mnemonic STKCO
Statement Income Statement
Data Item Number A398
This item represents compensation to employees/executives in the form of company stock.
This item includes 1. Stock Bonus
2. Deferred Compensation
3. Amortization of Deferred Compensation
4. Non-cash compensation expense that is expensed in the current period.
This item can also include options given to consultants in addition to other stock based compensation that a company voluntarily elects to expense.
Stock Compensation Expense - Quarterly Mnemonic STKCOQ
Statement Income Statement
Data Item Number Q278
This item represents compensation to employees/executives in the form of company stock.
This item includes 1. Stock Bonus
2. Deferred Compensation
3. Amortization of Deferred Compensation
4. Non-cash compensation expense that is expensed in the current period.
This item can also include options given to consultants in addition to other stock based compensation that a company voluntarily elects to expense.

Research Insight North America Data Guide
268
Writedowns After-Tax Mnemonic WDA
Statement Income Statement
Data Item Number A381
This item is the sum of all Writedown special items reported after taxes.
This item contains a Combined Figure data code (@CF) if an amount for any of the Writedown After-tax special items contains a Combined Figure (@CF) data code.
Writedowns After-Tax - Quarterly Mnemonic WDAQ
Statement Income Statement
Data Item Number Q262
This item is the sum of all Writedown special items reported after taxes.
This item contains a Combined Figure data code (@CF) if an amount for any of the Writedown After-tax special items contains a Combined Figure (@CF) data code.
Writedowns Basic EPS Effect Mnemonic WDEPS
Statement Income Statement
Data Item Number A382
This item is the sum of all Writedown Basic EPS effect items reported.
This item contains a Combined Figure data code (@CF) if an amount for any of the Writedown Basic EPS Effect special items contains a Combined Figure (@CF) data code.
Writedowns Basic EPS Effect - Quarterly Mnemonic WDEPSQ
Statement Income Statement
Data Item Number Q263
This item is the sum of all Writedown Basic EPS effect items reported.
This item contains a Combined Figure data code (@CF) if an amount for any of the Writedown Basic EPS Effect special items contains a Combined Figure (@CF) data code.
Writedowns Diluted EPS Effect Mnemonic WDD
Statement Income Statement
Data Item Number A383
This item is the sum of all Writedown Diluted EPS effect items reported.

269
Chapter 6 Supplemental Income Statement
This item contains a Combined Figure data code (@CF) if an amount for any of the Writedown Diluted EPS Effect special items contains a Combined Figure (@CF) data code.
Writedowns Diluted EPS Effect - Quarterly Mnemonic WDDQ
Statement Income Statement
Data Item Number Q264
This item is the sum of all Writedown Diluted EPS effect items reported.
This item contains a Combined Figure data code (@CF) if an amount for any of the Writedown Diluted EPS Effect special items contains a Combined Figure (@CF) data code.
Writedowns Pretax Mnemonic WDP
Statement Income Statement
Data Item Number A380
This item is the sum of all Writedown special items reported before taxes.
This item contains a Combined Figure data code (@CF) if an amount for any of the Writedown Pretax special items is not reported or contains a Combined Figure (@CF) data code.
Writedowns Pretax - Quarterly Mnemonic WDPQ
Statement Income Statement
Data Item # Q261
This item is the sum of all Writedown special items reported before taxes.
This item contains a Combined Figure data code (@CF) if an amount for any of the Writedown Pretax special items is not reported or contains a Combined Figure (@CF) data code.


271
Chapter 7 Business Segment
Business Segment
A business segment is an industry segment or product line reported by a company.
Business Segment Items
Data Item Mnemonic . . . page Availability Code AVLS . . . 297 Business Segment Name SNMS . . . 297 Business Segment - Actual Number SEGNUM . . . 22 Capital Expenditures CAPXS . . . 297 Customer Name - Primary Business Segment
CNMS . . . 298
Depreciation, Depletion and Amortization DPS . . . 298 Employees EMPS . . . 298 Equity in Earnings - Unconsolidated Subsidiary
ESUBS . . . 299
Foreign Governments FGOVS . . . 299 Identifiable Assets IAS . . . 300 Identification Code SID . . . 300 Investments at Equity IVEQS . . . 300 Operating Profit OPS . . . 300 Order Backlog OBS . . . 301 Principal Product Name PNMS . . . 301 Principal Product SIC SICPS . . . 302 Research and Development - Company Sponsored
RDCS . . . 302
Research and Development - Customer Sponsored
RDS . . . 302
Sales (Net) SALES . . . 303 Sales of the Principal Product SALEPS . . . 303 Sales to Domestic Government SALEDS . . . 305 Sales to Foreign Government SALEFS . . . 305 Sales to Principal Customer SALECS . . . 305 SIC Codes (Primary and Secondary) SICS . . . 50 Source Code SRCS . . . 51 Update Code UPDS . . . 76
CHAPTER 7

Research Insight North America Data Guide
272

273
Chapter 7 Business Segment
Data Definitions
Availability Codes - Segment Mnemonic AVLS
Units Code
This code indicates the status of a business for a company. A code of 1 indicates that information is available for the specified time period. The available codes are:
Code Description
0 Not a reporting category
1 Available
The descriptions for these codes can be viewed by choosing the Databases » Descriptions command from the menu bar and entering the mnemonic in the Item text box. To include a textual description of a code in a report, you can use the @DESC function. For example, to include a description of the availability code, type @DESC (AVLS).
For user-created data the appropriate availability code will be set to 1.
Business Segment Name Mnemonic SNMS
This is the name that the company gives to describe a particular industry segment. The industry segment name is assigned as it is reported by the company, unless the company uses a subsidiary name or a brand name. In those cases, a generic name is used for the industry segment name.
Business Segments - Actual Number Mnemonic SEGNUM
This two-digit number indicates how many industry segments collected by Standard & Poor's are available for the company in the given data year. Since each company may have up to 10 industry segments per year, the SEGNUM variable will contain values from 01 to 10. If, for example, ABC Corporation reports three industry segments for fiscal year 1987, SEGNUM will carry a value of 3.
Capital Expenditures (Business Segment) Mnemonic CAPXS
Units Millions of dollars
This item represents the funds used for additions to the industry segment's property, plant and equipment, excluding amounts arising from acquisitions (for example, fixed assets of purchased companies).
Capital Expenditures (Business Segment) - Note Mnemonic CAPXFF

Research Insight North America Data Guide
274
Code Description QB Net of current year's retirements and disposals
Customer Name(s) - Primary (Business Segment) Mnemonic CNMS
This item is a four-element group item containing the names of up to four principal customers to which the company sold goods or services from this industry segment during the year.
Up to four customers can be available for each of up to 10 industry segments reported each year.
If a company derives 10 percent or more of its revenue from a single customer, the customer's name must be reported by the company.
The order in which customers are listed is random and does not necessarily correspond to the relative importance of the customers.
Depreciation, Depletion, and Amortization (Business Segment) Mnemonic DPS
Units Millions of dollars
This item represents non-cash charges for obsolescence and wear and tear on property, allocation of the current portion of capitalized expenditures and depletion charges for the industry segment.
Employees (Business Segment) Mnemonic EMPS
Units Actual
This item represents the actual number of people employed by the identified industry segments reported by the company.
Employees (Business Segment) - Note Mnemonic EMPSFF
Code Description LD Includes significant seasonal or part-time employees
Equity in Earnings - Unconsolidated Subsidiaries (Business Segment) Mnemonic ESUBS

275
Chapter 7 Business Segment
Units Millions of dollars
This item represents the consolidated company's equity in the net income of unconsolidated subsidiaries and affiliates, carried at equity in the consolidated financial statements, whose operations are vertically integrated with the reported industry segment.
Equity in Earnings - Unconsolidated Subsidiaries (Business Segment) - Note Mnemonic ESUBSF
Code Description TE Equity reported after taxes
Foreign Governments (Business Segment) Mnemonic FGOVS
This is the name(s) of the foreign government(s) to which the company has sold products or services in the past year. If no specific country or region is mentioned by the company, this item will contain "FOREIGN GOVT."
Identifiable Assets - Business Segment Mnemonic IAS
Units Millions of dollars
Identifiable Assets are the tangible and intangible assets that are used by, or directly associated with, each business segment.
Identification Codes - Segment Mnemonic SID
This code identifies the segment for a company or industry for a country.
This item is not editable. For user-created entities, the system will determine the Identification Code based on the entity ticker, using the following scheme.
Entity Ticker Identification Code
IBM\S99 SID = 99

Research Insight North America Data Guide
276
Investments at Equity (Business Segment) Mnemonic IVEQS
Units Millions of dollars
This item represents the consolidated company's ownership interest in the net assets of unconsolidated subsidiaries and affiliates, carried at equity in the consolidated financial statements, whose operations are integral to the reported industry segment.
Operating Profit (Business Segment) Mnemonic OPS
Units Millions of dollars
Operating Profit is sales of the identified industry segment minus its allocated share of operating costs and expenses (such as, cost of goods sold, selling, general, and administrative expenses and depreciation, depletion and amortization).
Differences which exist between the data as reported by the company and the Compustat® definitions will be indicated by a footnote.
Operating Profit (Business Segment) - Note Mnemonic OPSF
Code Description MA Net of income taxes MB Pretax income MC Net Income/Loss MD Operating Profit/Loss After Depreciation ME Operating Profit/Loss Before Depreciation
Order Backlog (Business Segment) Mnemonic OBS
Units Millions of dollars
Order Backlog is the dollar amount of orders believed to be firm for the industry segment as of the company's fiscal yearend.

277
Chapter 7 Business Segment
Principle Product Names (Business Segment) Mnemonic PNMS
This four-element group item contains up to four 20-character names which identify the principal products of the industry segment, with any unused elements being blank.
If a company derives 10 percent or more of consolidated revenue (15 percent or more if revenue did not exceed $50,000,000 during the fiscal year) from any class of similar products or services in an industry segment, this data must be reported by the company. The Principal Product Name(s) are assigned as they are reported by the company, except as follows: 1. If a company reports a subsidiary name or a brand name, a generic name is assigned to the PNMS
2. If a company reports more than four principal products for the industry segment, the three largest, by sales, are assigned to the PNMS (1) through PNMS (3), and PNMS (4) will contain "OTHER"
"OTHER" may also be assigned to any element of the PNMS variable if: 1. A company specifically reports products or services for the industry segment which are identified as
"OTHER"
2. If the sum of the sales for the principal products of the industry segment which are reported by the company do not equal the total sales for the industry segment, the residual amount will be classified by Standard & Poor's as "OTHER"
Principle Product(s) SIC(s) (Business Segment) Mnemonic SICPS
Units Code
This item represents the Standard Industrial Classification (SIC) Code which best describes the corresponding principal product of the industry segment. The Principal Product SIC Codes are assigned by Standard & Poor's. The current Standard Industrial Classification Manual, which defines industries in accordance with the composition and structure of the economy and covers the entire field of economic activities, is the reference source for most SIC code assignments. The Principal Product SIC Code is assigned based on the description of the product which is reported in the company's Annual Report or 10-K. This code will be the most specific of the SICs on file. For the principal product with the largest sales, this item will match the first two digits of one of the Primary SIC Codes for the corresponding industry segment.
This item will be available for all company segments for the last seven years.
R&D - Company Sponsored (Business Segment) Mnemonic RDCS
Units Millions of dollars
This item represents the estimated costs incurred during the year, by the industry segment, for the development of new products or services which were paid by the company and were not reimbursed by a customer.
R&D - Company Sponsored (Business Segment) - Note Mnemonic RDCSF

Research Insight North America Data Guide
278
Code Description BG Includes engineering expense
R&D - Customer Sponsored (Business Segment) Mnemonic RDS
Units Millions of dollars
This item represents the estimated costs incurred during the year, by the industry segment, for the development of new products or services, which were subsequently paid by a customer or a government agency. If this item is combined with company-sponsored research and development, a Combined Figure data code (@CF) will appear.
Sales of Principle Product(s) (Business Segment) Mnemonic SALEPS
Units Millions of dollars
This item represents the contribution of the identified principal products to the industry segment's revenue. Up to four principal products will be identified for the industry segment's revenue.
Sales (Net) (Business Segment) Mnemonic SALES
Units Millions of dollars
This item consists of the industry segment's gross sales (the amount of actual billings to customers for regular sales completed during the period) reduced by cash discounts, trade discounts, and returned sales and allowances for which credit is given to customers.
Differences which exist between the data as reported by the company and the Compustat® definition will be indicated by a footnote.
This item includes ... 1. Any revenue source that is expected to continue for the life of the company
2. Other operating revenue
3. Installment sales
4. Franchise sales (when corresponding expenses are available)
This item excludes ... 1. Inter-company sales
2. Nonoperating income
3. Interest income
4. Equity in earnings of unconsolidated subsidiaries

279
Chapter 7 Business Segment
5. Other income
6. Rental income
7. Gain on sale of securities or fixed assets
8. Discontinued operations
9. Excise taxes
10. Royalty income
Special cases (by industry) ... 1. Oil and extractive companies:
Mineral royalty income is included in Sales (Net)
Sales (Net) is after deducting excise taxes
2. Retail companies: Sales (Net) includes sales of leased departments, when the corresponding costs are available and are included in operating expenses which are reported by the company
3. Shipping companies:
Includes income on reserve fund securities, when it is reported as a separate item in the company's financial statements
Includes operating differential subsidies
4. Finance companies:
Sales (Net) is after deducting net losses on factored receivables purchased
Includes earned insurance premiums
Includes interest income
5. Airline companies: Includes net mutual aid assistance and federal subsidies
6. Insurance companies: Sales (Net) is total income
7. Advertising companies: Sales (Net) are commissions earned, not gross billings
8. Leasing companies: Includes rental or lease income
9. Security brokers: Includes other income
10. Franchise companies: Includes franchise and license fees
11. Hospitals: Sales (Net) is net of provision for contractual allowance (will sometimes include doubtful accounts)
12. Cigar, cigarette, rubber and liquor companies: Excludes excise taxes
Sales (Net) (Business Segment) - Note Mnemonic SALESF
Code Description BA Includes excise taxes BB Includes other income/excludes some operating
revenues

Research Insight North America Data Guide
280
BS Combination of BA and BB DB Some or all data is Not Available due to a fiscal year
change EN Includes inter-company sales HG Excludes other operating income HH Includes unconsolidated subsidiaries HK Unaudited data UA Combination of EN and BA UB Combination of BB and EN YA Combination of HK and BB YB Combination of HK and HG YC Combination of HK and EN YD Combination of HK and BA YE Combination of HK and BS YF Combination of HK and UA YG Combination of HK and UB
Sales to Domestic Government (Business Segment) Mnemonic SALEDS
Units Millions of dollars
This item represents the amount of revenue derived from sales to the domestic government of the company. For example, a Swedish company's sales to the Swedish government would be considered the company's domestic sales.
This item includes sales to Federal, state and municipal agencies, and may include indirect sales (for example, sales to subcontractors or sales for government end-use). If the domestic and foreign government sales are combined, the total will be reported in Sales to Domestic Government. A Combined Figure data code (@CF) will subsequently appear in Sales to Foreign Government.
Sales to Foreign Government (Business Segment) Mnemonic SALEFS
Units Millions of dollars
This item represents the amount of revenue derived from sales to individual foreign government agencies. The name of the specific government(s) will be given when available; otherwise, they will appear as "FOREIGN GOVT." If foreign and domestic government sales are combined, a Combined Figure data code (@CF) will appear in Sales to Foreign Government, with the total appearing in Sales to Domestic Government.
Sales to Principal Customer(s) (Business Segment) Mnemonic SALECS
Units Millions of dollars

281
Chapter 7 Business Segment
This four-element group item identifies up to four principal customers for each industry segment. In most cases, this item represents the portion of the industry segment's net sales which was derived from products or services sold to the identified principal customers. In some cases, however, the company will report a breakdown of sales to their principal customers which only applied to their entire company as opposed to each industry segment. In those cases, each industry segment for the given year will contain the aggregate data for all industry segments.
Combined Data Items A Combined Figure data code (@CF) in an item indicates that the item has been reported by the company combined into, or as a part of, one or more data items, making it impossible to break the item out separately.
The following indicates items which may contain a Combined Figure data code (@CF)and the item or items with which they may be combined:
If Combined Figure ... Combined with ...
Research and Development - Customer Sponsored
Research and Development - Company Sponsored
Sales to Foreign Government Sales to Domestic Government
Sales to Principal Customer #2 Sales to Principal Customer #1
Sales to Principal Customer #3 Sales to Principal Customer #1 or #2
Sales to Principal Customer #4 Sales to Principal Customer #1, #2, or #3
Sales to Principal Customer(s) (Business Segment) - Note Mnemonic SALECF
Code Description MC Sales to the Domestic Government represents an
aggregate of all industry segments MD Sales to Foreign Government(s) represents an
aggregate of all industry segments ME Sales to Principal Customers(s) represents an aggregate
of all industry segments MG Combination of MC and ME MH Combination of MD and ME MI Combination of MC, MD, and ME
SIC Codes - Business Segment (Primary and Secondary) Mnemonic SICS
Units Code

Research Insight North America Data Guide
282
This two-element group item presents the two SIC codes assigned to each business segment. These SIC codes are assigned by Standard & Poor's based on the activities of each segment as described in the company's 10-K and Annual Report. When possible, a four-digit specific SIC code (for example, 2911) will be assigned; however, if segment activities are more broadly described, a more general two-digit or three-digit specific classification is made.
Standard & Poor's will attempt to assign both a primary and secondary SIC code for each industry segment. However, either one or both SIC items will be zero in some cases: 1. Only one SIC code will be assigned whenever one of the following situations occur:
Only one SIC category's operations of an industry segment is reported by the company
Only a general description of an industry segment's activities is reported by the company
2. Both SIC code fields will be zero when a company that reports an industry segment which is classified as "other" and no description of this industry segment's activity is provided
Source Code - Business Segment Mnemonic SRCS
Units Code
This item is a two-digit code which indicates the most recent source, or combination of sources, from which Standard & Poor's obtained this data.
The codes are as follows:
Code Source
3 Annual Report/Auditor's Report
4 Uniform Statistical Report (USR)
5 10-K/20-F
9 Annual Report (Summary Annual Report)
13 Annual Report + Statistical Supplement
14 10-K + Statistical Supplement
15 Annual Report + 10-K + Statistical Supplement
37 Prospectus
43 Annual Report + USR
53 Annual Report + 10-K
54 10-K + USR
55 Annual Report + 10-K + USR
56 Annual Report + 10-K + USR + Statistical Supplement
Update Code - Business Segment Mnemonic UPDS
Units Code

283
Chapter 7 Business Segment
An Update Code is provided for each industry segment and geographic segment and may be either 1, 2, or 3.
Code Description
1 Data is not yet available for the year because the company has changed its fiscal year end
2 Data has been updated from a preliminary source, but some data is still Not Available that is expected to become available or has historically been available
3 Data has been updated from the final source or sources and no further data will be available for that year


285
Chapter 8 Canadian Data
Canadian Data
Research Insight offers the same data items for Canadian companies ($T set) as for Active North American companies ($C set). In addition, certain share and per share items specifically pertain to Canadian companies.
Canadian Economic Data Items
Data Item
Mnemonic . . . page
Consumer Price Index - All Items CCPI . . . 311 Employment CEMPLOY . . . 311 Government Bonds - 10 Years and over CBOND10YR . . . 311 Government Bonds - 30 Year CBOND30YR . . . 311 Government Notes - 5 Year CNOTE5YR . . . 312 Government Notes - 10 Year CNOTE10YR . . . 312 Gross Domestic Product CGDP . . . 312 Housing Starts Units CHOUSE . . . 312 Industrial Product Price Index CIPPI . . . 313 Prime Interest Rate CPRIME . . . 313 Raw Material Price Index CRAWMAT . . . 313 Retail Sales - Total CRTLSALES . . . 313 Sale of Passenger Cars CAUTO . . . 313 Treasury Bill - 3 Month CTBILL3M . . . 314 Treasury Bill - 12 Month CTBILL12M . . . 314 Unemployment Rate CUNEMP . . . 314
Additional Canadian Data Items
Data Item Mnemonic . . . page Common Stock Float Shares CSFSM . . . 314 EPS - 12-Month Moving Historical EPSH12 . . . 315 Market Float Value MKFVAL . . . 315 Market Float Value - Monthly MKFVLM . . . 315 Price to Historical Earnings Per Share PEH . . . 315
CHAPTER 8


287
Chapter 8 Canadian Data
Data Definitions
Consumer Price Index - All Items - Canada Mnemonic CCPI
Units Millions of 1992 Canadian Dollars
This item is the monthly Consumer Price Index for All Items as determined by Statistics Canada via Dow Jones. The Index base is 1.0, and the current index period is 1990 - 1997. A monthly index of 1.155 after 1997 would indicate a Consumer Price Index that is 15.5 higher than the base period.
Employment - Canada Mnemonic CEMPLOY
Units Thousands of persons
This monthly item is seasonally adjusted and represents employed persons over fifteen in thousands of persons. It is provided by the "Monthly Labour Force Data" through Statistics Canada.
Government Bonds 10 Year and Over - Canada Mnemonic CBOND10YR
Units Percentage
The 10 year and over government bonds represent the percent per-annum available for the last Wednesday of the month. These percentages are Canada Government Issue as reported by Statistics Canada, Bank of Canada Review, Reuters America Inc. and MMS International.
Government Bonds - 30 Year - Canada Mnemonic CBOND30YR
Units Percentage
These percentages are Canada Government Issue as reported by Statistics Canada, Bank of Canada Review, Reuters America Inc. and MMS International.
Government Notes - 5 Year - Canada Mnemonic CNOTE5YR
Units Percentage

Research Insight North America Data Guide
288
These percentages are Canada Government Issue as reported by Reuters America Incorporated and MMS International.
Government Notes - 10 Year - Canada Mnemonic CNOTE10YR
Units Percentage
These percentages are Canada Government Issue as reported by Reuters America Incorporated and MMS International.
Gross Domestic Product - Canada Mnemonic CGDP
Units Millions of 1992 Canadian Dollars
This item is the monthly Canadian Gross Domestic Product (CGDP) as determined by Statistics Canada, Industry Measures and Analysis Division. The CGDP is adjusted seasonally at annual rates and is represented in millions of 1992 dollars.
Housing Starts (Units) - Canada Mnemonic CHOUSE
Units Thousands of units
This item is the monthly dwelling starts for all areas in Canada as determined by Statistics Canada and Canada Mortgage & Housing Corporation adjusted seasonally at annual rates.
Industrial Product Price Index - Canada Mnemonic CIPPI
Units Index Points
This item is the Industrial Product Price Index for manufacturing industries as determined by Statistics Canada Prices Division and is not adjusted seasonally. The index base is 1.0 and the current index period is 1990 - 1997.
Prime Interest Rate - Canada Mnemonic CPRIME

289
Chapter 8 Canadian Data
Units Percentage
This item is the Canadian Prime Interest Rate as reported by Reuters America, Incorporated.
Raw Material Price Index - Canada Mnemonic CRAWMAT
Units Index Points
This item is the Canadian Raw Materials Price Index as determined by Statistics Canada Prices Division. The index base is 1.0, and the current index period is 1992 - 1997.
Retail Sales - Total - Canada Mnemonic CRTLSALES
Units Millions of Canadian Dollars
This is the total retail sales of all Canadian stores as determined by Statistics Canada via Dow Jones. This item is not seasonally adjusted and is represented in millions of Canadian dollars.
Sale of Passenger Cars - Canada Mnemonic CAUTO
Units Millions of Canadian dollars
This item is the total sales of passenger cars for Canada as determined by Statistics Canada, not seasonally adjusted.
Treasury Bill - 3 Month - Canada Mnemonic CTBILL3M
Units Percentage
These percentages are Canada Government Issue as reported by Bank of Canada.
The 3 month Treasury Bill is based on a percent per-annum average yield at auction on the last Tuesday of the month.

Research Insight North America Data Guide
290
Treasury Bill - 12 Month - Canada Mnemonic CTBILL12M
Units Percentage
These percentages are Canada Government Issue as reported by Bank of Canada.
Unemployment Rate - Canada Mnemonic CUNEMP
Units Thousands of persons
These percentages are based on the total monthly unemployment for Canada as determined by Statistics Canada via Dow Jones and is not seasonally adjusted.
Common Stock Float Shares - Canada Mnemonic CSFSM
Units Millions
Common Stock Float Shares represent all common shares outstanding less controlled block shares as of month end.
This item is available only for Canadian (*T) S&P/TSX companies.
EPS - 12-Month Moving Historical - Canada Mnemonic EPSH12
Units Dollars and cents
This item represents Basic earnings per share applicable to the last 12-month period for Canadian companies (*T).
Standard & Poor's presents earnings per share as originally reported (not restated).
This item takes into account the effects of extraordinary items and discontinued operations.
Standard & Poor's presents only consolidated earnings per share on a fiscal year or interim quarter basis.
Market Float Value - Canada Mnemonic MKFVAL
Concept Calculation PRCCM*@VALUE (CSFSM,CSFSM[-1])
Units Millions of dollars

291
Chapter 8 Canadian Data
Market Float Value-Canada is the Close Price for the month multiplied by the company's Common Stock Float Shares. (If the most recent monthly float shares are not available, multiply by the previous month's Common Stock Float Shares.)
This concept is available only for Canadian (*T) companies.
Market Float Value - Monthly - Canada Mnemonic MKFVLM
Units Millions of dollars
This item is available on a monthly basis beginning in 1982. For each month, the month end close price is multiplied by the company's Common Stock Float Shares.
This item is available only for Canadian (*T) companies.
Price to Historical Earnings Per Share - Canada Mnemonic PEH
Concept Calculation PRCCM/@VALUE(EPSH12 [@QTR(-3M)],EPSH12 [@QTR(-3M)-1])
Units Decimal
Price to Historical Earnings per Share-Canada is the Price-Close Monthly divided by 12-Months Moving Historical Earnings Per Share. (If the most recent earnings are not available, divide by the previous quarter's 12-Months Moving Historical Earnings Per Share.)
This concept is available only for Canadian ($T) companies.


293
Chapter 9 Columbine Capital Data
Columbine Capital Data
Columbine Capital Services, Inc. provides quantitative equity analysis services, specializing in the development of quantitative models of expected excess return. Columbine analyzes stocks on a series of individual return and risk factors and combines those factor measures according to proprietary weighting structures creating multi-factor-forecasting models.
Each week Columbine Capital Services analyzes over 12,000 stocks on a series of individual return and risk factors and assigns rankings from 1 (best) through 10 (worst) for each factor. Using a particular multifactor model’s proprietary weighting structure, Columbine combines these individual factor rankings to compute raw model scores. The stocks in that model’s universe are then sorted from most-to-least attractive by the raw scores and divided into deciles (equal 10% groupings). Issues ranked 1 (1st decile) are most likely to outperform the universe; those ranked 10 (10th decile) are most likely to underperform.
Multifactor Models (Combo, Growth, Income, Value, Small-Cap, and Core Models) rankings are predictive throughout their range (i.e. 2’s are likely to outperform 3’s and so on down the rankings).
Component Models (Momentum, Valuation, Columbine Alpha, and Columbine/First Call Expectational Models) are predictive only in the top and bottom 20%; those ranked 1 and 2 tend to outperform the market, while those ranked 9 or 10 tend to underperform. The middle ranks (3 through 8) have only modest forecasting ability.
These items require a separate subscription.
Columbine Model Items
Data Item Mnemonic . . . page Periodicity Columbine Alpha - Decile ALPHA . . . 322 Weekly Columbine Alpha - Score ALPHAS . . . 322 Weekly Columbine/First Call - Decile EXP . . . 322 Daily Columbine/First Call - Score EXPS . . . 323 Daily Combo Model - Decile COMBO . . . 323 Weekly Combo Model - Score COMBOS . . . 324 Weekly Core Model - Decile CORE . . . 324 Weekly Core Model - Score CORES . . . 324 Weekly Growth Model - Decile GROW . . . 327 Weekly Growth Model - Score GROWS . . . 327 Weekly Income Model - Decile INCOME . . . 327 Weekly Income Model - Score INCOMES . . . 327 Weekly Momentum Model - Score MMTM . . . 328 Weekly Momentum Model - Score MMTMS . . . 328 Weekly Small-Cap Model - Decile SMCAP . . . 329 Weekly
CHAPTER 9

Research Insight North America Data Guide
294
Small-Cap Model - Score SMCAPS . . . 329 Weekly Valuation Model - Decile VALUTN . . . 330 Weekly Valuation Model - Score VALUTNS . . . 329 Weekly Value Model - Decile VALUE . . . 330 Weekly Value Model - Score VALUES . . . 330 Weekly
Columbine Factor Items
Data Item Mnemonic . . . page Periodicity Beta - Decile BETAD . . . 321 Weekly Book Value - Decile BOOKV . . . 321 Weekly Cash Flow - Decile CFD . . . 321 Weekly Dividend Yield - Decile DY . . . 325 Weekly Earnings Change - Decile ECHG . . . 325 Weekly Earnings Growth - Decile EGRO . . . 325 Weekly Earnings Surprise - Decile ESPRS . . . 326 Weekly Earnings Volatility - Decile EVOLAT . . . 326 Weekly Estimate Revision - Decile ER . . . 326 Weekly Estimated Earnings Yield - Decile EEY . . . 326 Weekly Market Liquidity - Decile MKTLQD . . . 328 Weekly Reported Earnings Yield - Decile REY . . . 329 Weekly

295
Chapter 9 Columbine Capital Data
Data Definitions
Beta (Columbine Capital Services) Mnemonic BETAD
Data Type Decile
Units Integer
This item is the standard measure of a stock’s market risk. Columbine Capital Services’ beta rankings are based on the past three years of stock prices and market returns. Stocks ranked 1 have the lowest beta.
The Columbine Capital items are available with a separate subscription from Columbine Capital Services, Inc. For more information see Columbine Capital Forecasting models under the Help menu/Reference Tables or call (719) 635-5174.
Book Value (Columbine Capital Services) Mnemonic BOOKV
Data Type Decile
Units Integer
This item is updated weekly and is a variant on the book value to price ratio. Stocks ranked 1 are high book value to price.
The Columbine Capital items are available with a separate subscription from Columbine Capital Services, Inc. For more information see Columbine Capital Forecasting models under the Help menu/Reference Tables or call (719) 635-5174.
Cash Flow (Columbine Capital Services) Mnemonic CFD
Data Type Decile
Units Integer
This item is a relative value measure based on the company’s reported earnings for the past twelve months net of dividends paid, with depreciation added back in. Stocks ranked 1 have a high cash flow relative to their current share price. This item is updated weekly.
The Columbine Capital items are available with a separate subscription from Columbine Capital Services, Inc. For more information see Columbine Capital Forecasting models under the Help menu/Reference Tables or call (719) 635-5174.
Columbine Alpha - Decile Mnemonic ALPHA
Units Integer

Research Insight North America Data Guide
296
This item is Columbine Capital Services’ objective measure of each stock’s market behavior. Based on a volatility and risk-adjusted model of equity price momentum, the Columbine Alpha Factor uses stock price and market data for the past year to forecast each issue’s probable performance over the next six to twelve months. Only the extremes of the Columbine Alpha rankings display significant predictive power.
This ranking is updated weekly and is relative to the Columbine Universe.
The Columbine Capital items are available with a separate subscription from Columbine Capital Services, Inc. For more information see Columbine Capital Forecasting models under the Help menu/Reference Tables or call (719) 635-5174.
Columbine Alpha - Score Mnemonic ALPHAS
Units Number
This item is Columbine Capital Services’ objective measure of each stock’s market behavior. Based on a volatility and risk-adjusted model of equity price momentum, the Columbine Alpha Factor uses stock price and market data for the past year to forecast each issue’s probable performance over the next six to twelve months. Only the extremes of the Columbine Alpha rankings display significant predictive power.
This ranking is updated weekly and is relative to the Columbine Universe.
The Columbine Capital items are available with a separate subscription from Columbine Capital Services, Inc. For more information see Columbine Capital Forecasting models under the Help menu/Reference Tables or call (719) 635-5174.
Columbine/First Call - Decile Mnemonic EXP
Units Integer
The Columbine/First Call Expectational Model distills the raw data of analyst earnings estimates and their revisions down to an objective, single-number measure of the impact those expectations are likely to have on a stock’s future performance. This it is updated daily.
This item is relative to the Columbine 1500 Universe.
The Columbine Capital items are available with a separate subscription from Columbine Capital Services, Inc. For more information see Columbine Capital Forecasting models under the Help menu/Reference Tables or call (719) 635-5174.
Columbine/First Call - Score Mnemonic EXPS
Units Number
The Columbine/First Call Expectational Model distills the raw data of analyst earnings estimates and their revisions down to an objective, single-number measure of the impact those expectations are likely to have on a stock’s future performance. This it is updated daily.
This item is relative to the Columbine 1500 Universe.

297
Chapter 9 Columbine Capital Data
The Columbine Capital items are available with a separate subscription from Columbine Capital Services, Inc. For more information see Columbine Capital Forecasting models under the Help menu/Reference Tables or call (719) 635-5174.
Combo Model - Decile Combo Model - Decile
Mnemonic COMBO
Units Integer
The Combo Model is intended for use as a style-diversified or general purpose stock selection tool. This item maintains a balance between value-oriented and growth-oriented input factors and is designed to be effective in both large and small-cap stocks.
These rankings are updated weekly and are relative to the Columbine Universe.
The Columbine Capital items are available with a separate subscription from Columbine Capital Services, Inc. For more information see Columbine Capital Forecasting models under the Help menu/Reference Tables or call (719) 635-5174.
Columbine Sector Model - Decile Mnemonic SECTORRNK
Units Integer
The Sector Model is intended for use as a style-diversified or general purpose stock selection tool. The model capitalizes on the observed fact that companies in different economic sectors often have very different characteristics and need to be judged by different standards. The Sector Model accomplishes this by identifying each sector's distinctive response to momentum and valuation forces in the markets, and using that information to forecast each individual stock's probable active return (alpha) for the next 1-3 years.
These rankings are updated weekly and are relative to the Columbine Universe.
The Columbine Capital items are available with a separate subscription from Columbine Capital Services, Inc. For more information see Columbine Capital Forecasting models under the Help menu/Reference Tables or call (719) 635-5174.
Combo Model - Score Mnemonic COMBOS
Units Number
The Combo Model is intended for use as a style-diversified or general purpose stock selection tool. This item maintains a balance between value-oriented and growth-oriented input factors and is designed to be effective in both large and small-cap stocks.
These rankings are updated weekly and are relative to the Columbine Universe.

Research Insight North America Data Guide
298
The Columbine Capital items are available with a separate subscription from Columbine Capital Services, Inc. For more information see Columbine Capital Forecasting models under the Help menu/Reference Tables or call (719) 635-5174.
Columbine Sector Model - Percentile Mnemonic SECTORPCT
Units Percent
The Sector Model is intended for use as a style-diversified or general purpose stock selection tool. The model capitalizes on the observed fact that companies in different economic sectors often have very different characteristics and need to be judged by different standards. The Sector Model accomplishes this by identifying each sector's distinctive response to momentum and valuation forces in the markets, and using that information to forecast each individual stock's probable active return (alpha) for the next 1-3 years.
These rankings are updated weekly and are relative to the Columbine Universe.
The Columbine Capital items are available with a separate subscription from Columbine Capital Services, Inc. For more information see Columbine Capital Forecasting models under the Help menu/Reference Tables or call (719) 635-5174.
Core Model - Decile Mnemonic CORE
Units Integer
The Core Model is designed for use with big-cap, highly liquid securities. It is designed to help managers who run large, diversified portfolios that serve as the foundation or central "core" of active equity management.
These rankings are updated weekly and are relative to the Columbine Big-Cap Universe.
The Columbine Capital items are available with a separate subscription from Columbine Capital Services, Inc. For more information see Columbine Capital Forecasting models under the Help menu/Reference Tables or call (719) 635-5174.
Core Model - Score Mnemonic CORES
Units Number
The Core Model is designed for use with big-cap, highly liquid securities. It is designed to help managers who run large, diversified portfolios that serve as the foundation or central "core" of active equity management.
These rankings are updated weekly and are relative to the Columbine Big-Cap Universe.
The Columbine Capital items are available with a separate subscription from Columbine Capital Services, Inc. For more information see Columbine Capital Forecasting models under the Help menu/Reference Tables or call (719) 635-5174.

299
Chapter 9 Columbine Capital Data
Dividend Yield (Columbine Capital Services) Mnemonic DY
Units Decile
This item is the ratio of a stock’s dividends paid during the past year to its current price. Stocks ranked 1 have the highest dividend yields. This item is updated weekly.
The Columbine Capital items are available with a separate subscription from Columbine Capital Services, Inc. For more information see Columbine Capital Forecasting models under the Help menu/Reference Tables or call (719) 635-5174.
Earnings Change Mnemonic ECHG
Units Decile
This item is updated weekly and is a price-relative comparison of the latest reported earnings (trailing 12 months) with last quarter’s figure.
The Columbine Capital items are available with a separate subscription from Columbine Capital Services, Inc. For more information see Columbine Capital Forecasting models under the Help menu/Reference Tables or call (719) 635-5174.
Earnings Growth Mnemonic EGRO
Units Decile
This item represents growth (or decline) in earnings at a price. The factor uses reported earnings over the past three years. Stocks ranked 1 had a large positive growth in their earnings for a given stock price.
The Columbine Capital items are available with a separate subscription from Columbine Capital Services, Inc. For more information see Columbine Capital Forecasting models under the Help menu/Reference Tables or call (719) 635-5174.
Earnings Surprise 2037Mnemonic ESPRS
Units Decile
This item compares a company’s reported earnings to the latest First Call median estimate. Stocks ranked 1 had the largest positive earnings surprises; those ranked 10 have had the largest negative surprises.
The Columbine Capital items are available with a separate subscription from Columbine Capital Services, Inc. For more information see Columbine Capital Forecasting models under the Help menu/Reference Tables or call (719) 635-5174.

Research Insight North America Data Guide
300
Earnings Volatility Mnemonic EVOLAT
Units Decile
The Columbine Capital items are available with a separate subscription from Columbine Capital Services, Inc. For more information see Columbine Capital Forecasting models under the Help menu/Reference Tables or call (719) 635-5174.
Estimate Revision Mnemonic ER
Units Decile
This item is a multifaceted measure of earnings estimate revision. The analysis included the number of positive and negative revisions, the highest and lowest estimates and the change in the First Call median estimate. Stocks ranked 1 have had large positive revisions.
The Columbine Capital items are available with a separate subscription from Columbine Capital Services, Inc. For more information see Columbine Capital Forecasting models under the Help menu/Reference Tables or call (719) 635-5174.
Estimated Earnings Yield Mnemonic EEY
Units Decile
This item is an earnings yield based on the First Call median estimated earnings figures. Stocks ranked 1 have high estimated earnings yields, making them estimated low P/E issues.
The Columbine Capital items are available with a separate subscription from Columbine Capital Services, Inc. For more information see Columbine Capital Forecasting models under the Help menu/Reference Tables or call (719) 635-5174.
Growth Model - Decile Mnemonic GROW
Units Decile
The Growth Model is optimized to maximize forecasting power among stocks that display strong growth characteristics, regardless of their cap size.
These rankings are updated weekly and are relative to the Columbine Growth Universe.

301
Chapter 9 Columbine Capital Data
The Columbine Capital items are available with a separate subscription from Columbine Capital Services, Inc. For more information see Columbine Capital Forecasting models under the Help menu/Reference Tables or call (719) 635-5174.
Growth Model - Score Mnemonic GROWS
Units Decile
The Growth Model is optimized to maximize forecasting power among stocks that display strong growth characteristics, regardless of their cap size.
These rankings are updated weekly and are relative to the Columbine Growth.
The Columbine Capital items are available with a separate subscription from Columbine Capital Services, Inc. For more information see Columbine Capital Forecasting models under the Help menu/Reference Tables or call (719) 635-5174.
Income Model - Decile Mnemonic INCOME
Units Decile
The Income Model is designed to operate among stocks with high dividend yields.
These rankings are updated weekly and are relative to the Columbine Income Universe.
The Columbine Capital items are available with a separate subscription from Columbine Capital Services, Inc. For more information see Columbine Capital Forecasting models under the Help menu/Reference Tables or call (719) 635-5174.
Income Model - Score Mnemonic INCOMES
Units Decile
The Income Model is designed to operate among stocks with high dividend yields.
These rankings are updated weekly and are relative to the Columbine Income Universe.
The Columbine Capital items are available with a separate subscription from Columbine Capital Services, Inc. For more information see Columbine Capital Forecasting models under the Help menu/Reference Tables or call (719) 635-5174.
Market Liquidity Mnemonic MKTLQD
Units Decile
Data Availability March 1998

Research Insight North America Data Guide
302
This item is a measure of the difficulty in trading a given stock. The factor is based on the number of days needed to establish a fixed dollar position in a stock given its average daily dollar volume over the past month. Stocks ranked 1 are the most liquid.
These rankings are updated weekly and are relative to the Columbine 1500 Universe.
The Columbine Capital items are available with a separate subscription from Columbine Capital Services, Inc. For more information see Columbine Capital Forecasting models under the Help menu/Reference Tables or call (719) 635-5174.
Momentum Model - Decile Mnemonic MMTM
Units Decile
The Momentum Model is a multifaceted measure of equity dynamics that combines diverse expressions of earnings and price momentum into a single predictor of future stock return.
These rankings are updated weekly and are relative to the Columbine 1500 Universe.
The Columbine Capital items are available with a separate subscription from Columbine Capital Services, Inc. For more information see Columbine Capital Forecasting models under the Help menu/Reference Tables or call (719) 635-5174.
Momentum Model - Score Mnemonic MMTMS
Units Number
The Momentum Model is a multifaceted measure of equity dynamics that combines diverse expressions of earnings and price momentum into a single predictor of future stock return.
These rankings are updated weekly and are relative to the Columbine 1500 Universe.
The Columbine Capital items are available with a separate subscription from Columbine Capital Services, Inc. For more information see Columbine Capital Forecasting models under the Help menu/Reference Tables or call (719) 635-5174.
Reported Earnings Yield Mnemonic REY
Units Decile
This measure uses trailing 12 month reported earnings divided by the current stock price. Stocks ranked 1 have high earnings yields that make them low price to earnings issues.
The Columbine Capital items are available with a separate subscription from Columbine Capital Services, Inc. For more information see Columbine Capital Forecasting models under the Help menu/Reference Tables or call (719) 635-5174.

303
Chapter 9 Columbine Capital Data
Small-Cap Model - Decile Mnemonic SMCAP
Units Decile
The Small-Cap Model is optimized for use with the often illiquid stocks of smaller companies.
These rankings are updated weekly and are relative to the Columbine Small-Cap Universe.
The Columbine Capital items are available with a separate subscription from Columbine Capital Services, Inc. For more information see Columbine Capital Forecasting models under the Help menu/Reference Tables or call (719) 635-5174.
Small-Cap Model - Score Mnemonic SMCAPS
Units Score
The Small-Cap Model is optimized for use with the often illiquid stocks of smaller companies.
These rankings are updated weekly and are relative to the Columbine Small-Cap Universe.
The Columbine Capital items are available with a separate subscription from Columbine Capital Services, Inc. For more information see Columbine Capital Forecasting models under the Help menu/Reference Tables or call (719) 635-5174.
Valuation Model - Score Mnemonic VALUTNS
Units Score
The Valuation Model is a multifaceted evaluation of equity value that compares diverse expressions of intrinsic value with current price to arrive at a single predictor of future stock return.
These rankings are updated weekly and are relative to the Columbine 1500 Universe.
The Columbine Capital items are available with a separate subscription from Columbine Capital Services, Inc. For more information see Columbine Capital Forecasting models under the Help menu/Reference Tables or call (719) 635-5174.
Valuation Model - Decile Mnemonic VALUTN
Units Decile
The Valuation Model is a multifaceted evaluation of equity value that compares diverse expressions of intrinsic value with current price to arrive at a single predictor of future stock return.
These rankings are updated weekly and are relative to the Columbine 1500 Universe.
The Columbine Capital items are available with a separate subscription from Columbine Capital Services, Inc. For more information see Columbine Capital Forecasting models under the Help menu/Reference Tables or call (719) 635-5174.

Research Insight North America Data Guide
304
Value Model - Decile Mnemonic VALUE
Units Decile
The Value Model is intended for use with stocks of any size that display strong value characteristics.
These rankings are updated weekly and are relative to the Columbine Value Universe.
The Columbine Capital items are available with a separate subscription from Columbine Capital Services, Inc. For more information see Columbine Capital Forecasting models under the Help menu/Reference Tables or call (719) 635-5174.
Value Model - Score Mnemonic VALUES
Units Score
The Value Model is intended for use with stocks of any size that display strong value characteristics.
These rankings are updated weekly and are relative to the Columbine Value Universe.
The Columbine Capital items are available with a separate subscription from Columbine Capital Services, Inc. For more information see Columbine Capital Forecasting models under the Help menu/Reference Tables or call (719) 635-5174.

305
Chapter 10 Compustat Classic Data
Compustat Classic Data
Population and Coverage
Standard & Poor’s Compustat Classic provides you with 48 quarters of non-restated historical quarterly data for more than 20,400 U.S. and Canadian companies. The data described here is available through Standard and Poor’s Research Insight with a separate subscription.
Compustat Classic includes: More than 10,000 U.S. Active Companies More than 9,400 U.S. Inactive Companies More than 1,000 Canadian Companies Items are updated monthly through an Internet download
Quarterly Restatements vs. Non-Restated Data
The Compustat core database provides quarterly data on a restated basis. Data may be restated due to mergers, acquisitions, discontinued operations or accounting changes. Restated data is valuable for determining financial trends, growth rates and year-to-year changes using comparable data.
In contrast, the Compustat Classic database contains non-restated quarterly data. The Classic database gives you a true picture of the market’s past by filtering out the influences of subsequent mergers and acquisitions, survivorship bias, etc. Therefore the Classic database is particularly suited to the needs of quantitative analysts concerned with building accurate historical models.
Excel Templates for Backtesting
For backtesting your investment theories over time, Research Insight also provides two Excel templates that you can use in conjunction with Compustat Classic data items, Backtest Model Basic – Quarterly (mnemonic basicqtr.xls) and Backtest Model Summary – Quarterly (mnemonic summqtr.xls). These spreadsheets are available through Excel, in the C:/Program Files/Research Insight/Excel/Excel 8/Classic folder (in the directory where you have Research Insight installed).
Compustat Classic Data Items
General Company Information Update Code . . . 77 Format Code . . . 34 Date Company first time on database . . . 338
Indicated Annual Dividend . . . 696
Company Status Code . . . 22
Reported Date of Quarterly Earnings per Share . . . 704
CHAPTER 10

Research Insight North America Data Guide
306
Currency Translation Rate . . . 23
Source Code . . . 52
Quarterly Income Statement Sales – Net . . . 241
Common Stock Equivalents – Dollar Savings . . . 202
Cost of Goods Sold . . . 205
Income Before Extraordinary Items – Adjusted for Common Stock Equivalents . . . 220
Selling, General & Admin. Expenses . . . 246
Extraordinary Items & Discontinued Operations . . . 215
Operating Income Before Depreciation . . . 237
Extraordinary Items . . . 214
Depreciation & Amortization . . . 210
Discontinued Operations . . . 213
Interest Expense . . . 228
Earnings Per Share – Basic – Including Extra Items . . . 688
Nonoperating Income (Expense) . . . 233
Earnings Per Share – Basic – Excluding Extra Items . . . 686
Special Items . . . 249
Earnings Per Share – Diluted - Excluding Extra Items . . . 691
Pretax Income . . . 238
Earnings Per Share – Diluted – Including Extra Items . . . 695
Income Taxes – Total . . . 226
Common Shares Used to Calculate Basic EPS . . . 201
Deferred Taxes – Income Account . . . 208
Income Before Extraordinary Items – Available for Common . . . 222
Minority Interest . . . 230 Income Before Extraordinary Items . . . 217
Cash Dividends – Preferred . . . 200
Net Income (Loss) . . . 232
Quarterly Balance Sheet

307
Chapter 10 Compustat Classic Data
Cash and Equivalents . . . 98
Long-Term Debt – Total . . . 121
Receivables – Total . . . 137
Liabilities – Other . . . 119
Current Assets – Other . . . 102 Redeemable Preferred Stock . . . 126
Current Assets – Total . . . 103 Minority Interest . . . 122
Inventories – Total . . . 114 Liabilities – Total . . . 120
PP&E – Gross . . . 129 Preferred Stock . . . 124
PP&E – Net . . . 132
Common Equity - Total . . . 99
Assets – Other . . . 89
Common Stock . . . 100
Assets – Total . . . 93
Capital Surplus . . . 95
Debt in Current Liabilities . . . 108
Retained Earnings . . . 140
Accumulated Depr, Depletion, & Amort . . . 86
Stockholders' Equity . . . 143
Accounts Payable . . . 84
Treasury Stock – Total Dollar Amount . . . 144
Income Taxes Payable . . . 111 Common Shares Outstanding . . . 156
Current Liabilities – Other . . . 104
Invested Capital – Total . . . 116
Current Liabilities – Total . . . 106

Research Insight North America Data Guide
308
Quarterly Cash Flow
Indirect Operating Activities Financing Activities Accounts Payable and Accrued Liabilities – Increase (Decrease) . . . 864
Current Debt – Changes . . . 880
Assets and Liabilities – Other (Net Change) . . . 869
Cash and Equivalents – Changes . . . 875
Deferred Taxes . . . 882
Purchase of Common & Preferred Stock . . . 926
Depreciation and Amortization . . . 884
Issuance of Long-Term Debt . . . 919
Equity in Net Loss (Earnings) . . . 886
Sale of Common & Preferred Stock . . . 931
Extraordinary Items and Disc. Ops . . . 890
Exchange Rate Effect . . . 888
Funds from Operations – Other . . . 897
Reduction of Long-Term Debt . . . 921
Income Before Extraordinary Items . . . 901
Financing Activities – Other . . . 894
Income Taxes Accrued – Increase (Decrease) . . . 903
Financing Activities – Net Cash Flow . . . 892
Inventory – Decrease (Increase) . . . 910
Operating Activities – Net Cash Flow . . . 924
Other
Receivables – Decrease (Increase) . . . 928
Funds from Operations – Total . . . 897
Sale of PPE & Sale of Inv. – Loss (Gain) . . . 939
Uses of Funds – Other . . . 948
Cash Dividends . . . 877
Use of Funds – Total . . . 950
Sources of Funds – Other . . . 944

309
Chapter 10 Compustat Classic Data
Investing Activities Sources of Funds – Total . . . 946
Investing Activities – Other . . . 914
Working Capital Changes – Other – Increase(Decrease) . . . 952
Investments – Increase . . . 917 Working Capital Changes – Total . . . 953
Investing Activities – Net Cash Flow . . . 913
Sale of Investments . . . 933
Direct Operating Activities
Short-Term Investments – Change . . . 942
Interest Paid – Net of Capitalized Interest . . . 908
Sale of Property, Plant & Equipment . . . 936
Income Taxes Paid . . . 906
Capital Expenditures . . . 872
Acquisitions . . . 866
12 Months Moving Information Earnings Per Share from Operations . . . 690
Earnings Per Share Basic from Operations . . . 689
Earnings Per Share – Basic – Excluding Extra Items . . . 687
Earnings Per Share 12MM Historical – Canada. . . 315
Common Shares Used to Calculate 12MM Earnings Per Share . . . 200
Income Statement Supplementary Cash Dividends – Common . . . 877
Cumulative Effect of Accounting Changes . . . 258
R&D Expense . . . 283
Financial Services Items Interest Income – Total . . . 414 Reserve for Loan/Asset Losses . . . 396
Interest Expense – Total . . . 413 Provision for Loan/Asset Losses . . . 393
Nonperforming Assets – Total . . . 178
Net Charge-Offs . . . 384

Research Insight North America Data Guide
310
Risk-Adjusted Capital Ratio – Tier 1 . . . 419
Net Interest Margin . . . 384
Risk-Adjusted Capital Ratio – Total . . . 420
Net Interest Income (Tax Equivalent) . . . 415
Market Data Dividends per Share by Payable Date . . . 683
Dividends per Share by Ex-Date . . . 682
Date Company First Time on Compustat Database Mnemonic START
Data Availability 1987 forward
This item shows the production date of the core database when a company first appeared in Compustat North America. You can use this item to avoid backfilled data from company additions. This item is only available in the Compustat Classic database.

311
Chapter 11 Financial Ratios
Financial Ratios
This chapter presents fundamental ratios, statistics and growth rates.
Liquidity and Capital Structure
Data Item
Annual Mnemonic . . . page
Quarterly Mnemonic . . . page
Available for Interest AFI . . . 347 AFIQ . . . 347 Berry Ratio BERRY . . . 348 BERRYQ . . . 348 Berry Ratio - 12-Month Moving BERRY12 . . . 348 Book Value per Share BKVLPS . . . 634 Book Value per Share - Average - 3 Year BKVLPS3 . . . 633 Book Value per Share - Average - 5 Year BKVLPS5 . . . 633 Book Value per Share - Average - 10 Year
BKVLPS10 . . . 633
Cash as a Percentage of Current Assets CHEACT . . . 350 CHEACTQ . . . 350 Cash as Percentage of Current Liabilities
CHELCT . . . 351 CHELCTQ . . . 351
Cash Reinvestment Ratio CHRR . . . 351 CHRRQ . . . 351 Cash Turnover CHETO . . . 352 CHETOQ . . . 352 Current Ratio CR . . . 359 CRQ . . . 359 Days to Pay Accounts Payable PAYAP . . . 160 PAYAPQ . . . 160 Days to Sell Inventory SELLINV . . . 160 SELLINVQ . . . 161 Dividend Payout DVPOR . . . 634 Dividend Rate - Current DVRATE . . . 680 Earning Assets - Total EAT . . . 170 EATQ . . . 171 Earnings Before Interest and Taxes Margin
EBITM . . . 362 EBITMQ . . . 362
Earnings Before Int. and Taxes Margin-12MM
EBITM12 . . . 362
Earnings Retention Rate IBRR . . . 361 IBRRQ . . . 361 Earnings Retention Rate - Average - 3 Year
IBRR3 . . . 361
Earnings Retention Rate - Average - 5 Year
IBRR5 . . . 362
Earnings Retention Rate - Average - 10 Year
IBRR10 . . . 362
Equity Growth Rate EQGROW . . . 363 EQGROWQ . . . 363
CHAPTER 11

Research Insight North America Data Guide
312
Equity Growth Rate - Average - 3 Year EQGROW3 . . . 363 Equity Growth Rate - Average - 5 Year EQGROW5 . . . 364 Equity Growth Rate - Average - 10 Year EQGROW10 . . . 364 Financial Leverage Index LEVIDX . . . 364 LEVIDXQ . . . 364 Fixed Assets as a Percentage of Common Equity
FXACEQ . . . 364 FXACEQQ . . . 365
Fixed Assets as a Percentage of Total Equity
FXASEQ . . . 365 FXASEQQ . . . 365
Fixed Assets Turnover FXATO . . . 365 FXATOQ . . . 365 Gross Assets GA . . . 368 GAQ . . . 368 Interest Coverage After Tax IC . . . 370 ICQ . . . 370 Interest Coverage Before Tax ICBT . . . 371 ICBTQ . . . 371 Inventory Turnover INVX . . . 372 INVXQ . . . 372 Leased Asset Turnover LATTO . . . 373 Liquidity Index LIQIDX . . . 373 LIQIDXQ . . . 374 Long-Term Debt to Common Equity DCE . . . 374 DCEQ . . . 374 Long-Term Debt to Shareholders' Equity DSE . . . 383 DSEQ . . . 383 Long-Term Debt to Tangible Assets LTDTAT . . . 383 Long-Term Debt to Total Capital LTDCAP . . . 383 LTDCAPQ . . . 383 Net Operating Assets NOA . . . 385 NOAQ . . . 385 Net Trade Cycle TRCYCLE . . . 386 TRCYCLEQ . . . 386 Operating Cycle OPCYCLE . . . 388 OPCYCLEQ . . . 388 Quick Ratio QR . . . 394 QRQ . . . 394 Receivables Turnover RECX . . . 394 RECXQ . . . 395 Reinvestment Rate RVSTR . . . 395 RVSTRQ . . . 395 Reinvestment Rate - Average 3 Year RVSTR3 . . . 395 Reinvestment Rate - Average 5 Year RVSTR5 . . . 395 Reinvestment Rate - Average 10 Year RVSTR10 . . . 396 Return on Assets ROA . . . 397 ROAQ . . . 397 Return on Average Assets ROAA . . . 397 ROAAQ . . . 398 Return on Average Equity ROAE . . . 398 ROAEQ . . . 398 Return on Average Investment ROAI . . . 398 ROAIQ . . . 399 Return on Equity ROE . . . 399 ROEQ . . . 399 Return on Investment ROI . . . 400 ROIQ . . . 400 Sales Percentage Change - 1 Year SALECHG1 . . . 400 Sales Percentage Change - 3 Year SALECHG3 . . . 400 Sales Percentage Change - 5 Year SALECHG5 . . . 401 Sales Percentage Change - 10 Year SALECHG10 . . . 401 Short-Term Debt as a Percentage of Total Debt
STDLTD . . . 401 STDLTDQ . . . 401
Total Asset Turnover ATT . . . 403 ATTQ . . . 403

313
Chapter 11 Financial Ratios
Total Assets as a Percentage of Common Equity
ATCEQ . . . 404 ATCEQQ . . . 404
Total Assets as a Percentage of Total Equity
ATSEQ . . . 404 ATSEQQ . . . 404
Total Debt to Tangible Assets DTAT . . . 404 Total Debt to Total Assets DAT . . . 405 DATQ . . . 405 Total Debt to Total Capital DTCAP . . . 405 DTCAPQ . . . 405 Total Debt to Total Equity DTEQ . . . 405 DTEQQ . . . 406 Z Score - Measure of Bankruptcy ZSCORE . . . 407
Funds Flow
Data Item
Annual Mnemonic . . . page
Quarterly Mnemonic . . . page
Cash Flow CFL . . . 348 CFLQ . . . 349 Cash Flow (Alternate Definition) CFL1 . . . 349 Cash Flow Margin CFLM . . . 349 CFLMQ . . . 349 Cash Flow Margin (Alternate Definition) CFLM1 . . . 350 Cash Flow per Share CFLPS . . . 350 CFLPSQ . . . 350 Free Cash Flow FREECFL . . . 366 FREECFLQ . . . 366 Free Cash Flow per Share FCFLPS . . . 366 FCFLPSQ . . . 367 Funds Flow Adequacy Ratio FFAR . . . 367 FFARQ . . . 367 Internal Funding of Capital Expenditures IFCAPX . . . 372 IFCAPXQ . . . 372 Working Capital (Balance Sheet) WCAP . . . 191 Working Capital per Share WCAPPS . . . 406 WCAPPSQ . . . 407 Working Capital Turnover WCAPTO . . . 407 WCAPTOQ . . . 407
Performance
Data Item
Annual Mnemonic . . . page
Quarterly Mnemonic . . . page
Common Equity Turnover CEQTO . . . 357 CEQTOQ . . . 358 EBITDA Margin EBITDAM . . . 362 EBITDAMQ . . . 362 Foreign Sales - Total as a Percentage of Sales (Net)
TFSALEP . . . 366
Gross Profit Margin GPM . . . 369 GPMQ . . . 369 Gross Profit Margin - 12 Months Moving GPM12 . . . 369 Income Percentage Change - 1 Year IBCHG1 . . . 369 Income Percentage Change - 3 Year IBCHG3 . . . 369 Income Percentage Change - 5 Year IBCHG5 . . . 370 Income Percentage Change - 10 Year IBCHG10 . . . 370

Research Insight North America Data Guide
314
Net Profit Margin NPM . . . 386 NPMQ . . . 386 Nonoperating Income (Expense) as a Percentage of Net Interest Income
NOPN . . . 387 NOPNQ . . . 387
Operating Margin After Depreciation OMAD . . . 388 OMADQ . . . 388 Operating Margin Before Depreciation OMBD . . . 389 OMBDQ . . . 389 Pretax Profit Margin PPM . . . 389 PPMQ . . . 389 Pretax Return on Fixed Assets PROAF . . . 392 PROAFQ . . . 393 Pretax Return on Assets PROA . . . 390 PROAQ . . . 390 Pretax Return on Average Assets - Fixed PROAAF . . . 390 PROAAFQ . . . 390 Pretax Return on Average Assets - Total PROAA . . . 391 PROAAQ . . . 391 Pretax Return on Average Equity PROAE . . . 391 PROAEQ . . . 391 Pretax Return on Average Investment PROAI . . . 391 PROAIQ . . . 392 Pretax Return on Equity PROE . . . 392 PROEQ . . . 392 Pretax Return on Investment PROI . . . 393 PROIQ . . . 393 Reinvestment Rate RVSTR . . . 395 RVSTRQ . . . 395 Reinvestment Rate - Average - 3 Year RVSTR3 . . . 395 Reinvestment Rate - Average - 5 Year RVSTR5 . . . 395 Reinvestment Rate - Average - 10 Year RVSTR10 . . . 396 Return on Assets ROA . . . 397 ROAQ . . . 397 Return on Average Assets ROAA . . . 397 ROAAQ . . . 398 Return on Average Equity ROAE . . . 398 ROAEQ . . . 398 Return on Average Investment ROAI . . . 398 ROAIQ . . . 399 Return on Equity ROE . . . 399 ROEQ . . . 399 Return on Investment ROI . . . 400 ROIQ . . . 400 Sales Percentage Change - 1 Year SALECHG1 . . . 400 Sales Percentage Change - 3 Year SALECHG3 . . . 400 Sales Percentage Change - 5 Year SALECHG5 . . . 401 Sales Percentage Change - 10 Year SALECHG10 . . . 401 Total Equity Turnover SEQTO . . . 406 SEQTOQ . . . 406

315
Chapter 11 Financial Ratios
Data Definitions
Assets for Sale to Assets Annual mnemonic AHSA
Quarterly mnemonic AHSAQ
Annual concept calculation INVT/AT*100
Quarterly concept calculation INVTQ/ATQ*100
Units Percentage
The annual concept is Inventories - Total divided by Assets - Total multiplied by 100.
The quarterly concept is Inventories - Total - Quarterly divided by Assets - Total - Quarterly multiplied by 100.
Available for Interest Mnemonic AFI
Concept calculation PI+XINT
Units Millions of dollars
The annual concept is the sum of Pretax Income, which is operating and nonoperating income before provisions for income taxes and minority interest, plus Interest Expense, or the periodic expense to the company of securing short- and long-term debt.
Available for Interest - Quarterly Mnemonic AFIQ
Concept calculation @VALUE(PIQ,PIQ[-1])+ @VALUE(XINTQ,XINTQ[-1])
Units Millions of dollars
The quarterly concept is the sum of Pretax Income – Quarterly, which is operating and nonoperating income before provisions for income taxes and minority interest, plus Interest Expense – Quarterly, or the periodic expense to the company of securing short- and long-term debt. (If Pretax Income and Interest Expense for the current quarter are not available, the values for the previous quarter will be used.)
Average Collection Period Mnemonic COLLECT
Concept calculation @PAVG(RECT,-1,0)/(SALE/360)
Units Integer
The annual concept is the average of the most recent two years of Receivables – Total divided by the sum of Sales (Net) divided by 360.

Research Insight North America Data Guide
316
Average Collection Period - Quarterly Mnemonic COLLECTQ
Concept calculation @PAVG(RECTQ,-3,0)/(SALE12/360)
Units Integer
The quarterly concept is the average of the most recent four quarters of Receivables – Total – Quarterly divided by the sum of Sales (Net) – 12 Months Moving divided by 360.
Bad Debt Reserve Ratio Mnemonic RECDR
Concept calculation RECD/(RECT+RECD)*100
This concept is Receivables - Estimated Doubtful, divided by the sum of Receivables - Total plus Receivables - Estimated Doubtful. This total is multiplied by 100.
Berry Ratio Annual Concept BERRY (SALE-COGS)/XSGA
Quarterly Concept BERRYQ (SALEQ-COGSQ)/XSGAQ
12MM Concept BERRY12 (SALE12-COGS12)/XSGA12
Units Dollars and cents
The annual concept is Sales minus Cost of Goods Sold divided by Selling, General and Administrative Expenses.
The quarterly concept is Sales quarterly minus Cost of Goods Sold quarterly divided by Selling, General and Administrative Expenses quarterly.
The 12-month moving concept is Sales 12-month moving minus Cost of Goods Sold 12-month moving divided by Selling, General, and Administrative Expenses 12-month moving.
Cash Flow Mnemonic CFL
Concept calculation IB+DP
Units Millions of dollars
This concept includes Income Before Extraordinary Items, which represents the income of a company after all expenses except provisions for common and or preferred dividends, plus Depreciation and Amortization, which is the non-cash charges for obsolescence of and wear and tear on property.

317
Chapter 11 Financial Ratios
Cash Flow - Alternate Definition Mnemonic CFL1
Concept calculation IBC+DPC+TXDC+ESUBC+XIDOC+MII
Units Millions of dollars
An alternate definition for Cash Flow is the sum of the following items: Income Before Extraordinary Items (Statement of Changes); Depreciation and Amortization (Statement of Changes); Deferred Taxes (Statement of Changes); Equity in Earnings of Unconsolidated Subsidiaries (Statement of Changes); Extraordinary Items and Discontinued Operations (Statement of Changes); and Minority Interest.
Cash Flow Quarterly Mnemonic CFLQ
Concept calculation @VALUE(IBQ,IBQ[-1])+ @VALUE(DPQ,DPQ[-1])
Units Millions of dollars
This concept is the sum of Income Before Extraordinary Items - Quarterly, which represents the income of a company after all expenses except provisions for common and or preferred dividends, plus Depreciation and Amortization - Quarterly, which is the non-cash charges for obsolescence of wear and tear on property. (If Income Before Extraordinary Items and Depreciation and Amortization for the current quarter are not available, the values for the previous quarter will be used.)
Cash Flow Margin Mnemonic CFLM
Concept calculation 100*(CFL/SALE)
Units Percentage
This concept is Cash Flow, which is the sum of Income Before Extraordinary Items and Depreciation and Amortization, divided by Net Sales. This is then multiplied by 100.
Cash Flow Margin - Quarterly Mnemonic CFLMQ
Concept calculation @VALUE(CFLQ,CFLQ[-1])/@VALUE(SALEQ,SALEQ[-1])*100
Units Percentage
This concept is Cash Flow - Quarterly divided by Sales (Net) - Quarterly. The result is multiplied by 100. (If Cash Flow and Sales (Net) for the current quarter are not available, the values for the previous quarter will be used.)
Cash Flow Margin - Alternate Definition Mnemonic CFLM1

Research Insight North America Data Guide
318
Concept Calculation 100*(CFL1/SALE)
Units Percentage
An alternate definition of Cash Flow Margin is Cash Flow - Alternate Definition divided by Net Sales. This is then multiplied by 100.
Cash Flow per Share Mnemonic CFLPS
Concept Calculation CFL/CSHO
This concept is Cash Flow divided by Common Shares Outstanding - Company.
Cash Flow per Share - Quarterly Mnemonic CFLPSQ
Concept Calculation @VALUE(CFLQ/CSHOQ,(CFLQ/CSHOQ)[-1])
This concept is Cash Flow - Quarterly divided by Common Shares Outstanding - Company - Quarterly. (If Cash Flow and Common Shares Outstanding - Company for the current quarter are not available, the values for the previous quarter will be used.)
Cash to Current Assets Mnemonic CHEACT
Concept Calculation CHE/ACT*100
This concept is Cash and Equivalents divided by Current Assets - Total, multiplied by 100.
Cash to Current Assets - Quarterly Mnemonic CHEACTQ
Concept Calculation @VALUE(CHEQ/ACTQ,(CHEQ/ACTQ)[-1])*100
This concept is Cash and Equivalents - Quarterly divided by Current Assets - Total - Quarterly multiplied by 100. (If Cash and Equivalents and Current Assets - Total for the current quarter are not available, the values for the previous quarter will be used.)
Cash to Current Liabilities Mnemonic CHELCT
Concept Calculation CHE/LCT*100
This concept is Cash and Equivalents divided by Current Liabilities - Total, multiplied by 100.

319
Chapter 11 Financial Ratios
Cash to Current Liabilities - Quarterly Mnemonic CHELCTQ
Concept Calculation @VALUE(CHEQ/LCTQ,(CHEQ/LCTQ)[-1])*100
This concept is Cash and Equivalents - Quarterly divided by Current Liabilities - Total - Quarterly multiplied by 100. (If Cash and Equivalents and Current Liabilities - Total for the current quarter are not available, the values for the previous quarter will be used.)
Cash Reinvestment Ratio Mnemonic CHRR
Concept Calculation (OANCF-DV)/(PPEGT+@VALUE(IVAEQ,0)+ @VALUE(IVAO,0)+@VALUE(INTAN,0)+AO+ ACT-LCT)*100
This concept is the Operating Activities - Net Cash Flow minus Cash Dividends. This is divided by the sum of Property Plant, and Equipment (Gross) Total plus Investments and Advances - Equity Method plus Investments and Advances - Other plus Intangibles plus Assets - Other plus Current Assets - Total less Current Liabilities - Total. This total is multiplied by 100.
Cash Reinvestment Ratio - Quarterly Mnemonic CHRRQ
Concept Calculation @VALUE((OANCFQ-DVQ)/ (PPEGTQ+AOQ+ACTQ-LCTQ), ((OANCFQ-DVQ)/(PPEGTQ+ACTQ-LCTQ))[1])*100
This concept is the difference of Operating Activities - Net Cash Flow - Quarterly less Cash Dividends - Quarterly. This is divided by the sum of Property, Plant and Equipment (Gross) Total - Quarterly plus Assets - Other - Quarterly plus Current Assets - Total - Quarterly less Current Liabilities - Total - Quarterly. This total is multiplied by 100.
Cash Turnover Mnemonic CHETO
Concept Calculation SALE/@PAVG(CHE,-1,0)
This concept is Sales (Net) divided by the average of the most current two years of Cash and Equivalents.
Cash Turnover - Quarterly Mnemonic CHETOQ

Research Insight North America Data Guide
320
Concept Calculation SALE12/@PAVG(CHEQ,-3,0)
This concept is Sales (Net) - 12-Months Moving divided by the average of the most current four quarters of Cash and Equivalents - Quarterly.
Coefficient of Determination - Cash Flow - 3 Year Mnemonic RCF3
The Coefficient of Determination measures the stability of the 3-, 5-, and 10-year least squares growth rates of each observation. Often referred to as R2, this measure of correlation measures the "goodness of fit" of the plotted points about the regression line or trend.
Calculated by adding Income Before Extraordinary Items (Statement of Changes) plus Depreciation and Amortization (Statement of Changes). If either of these items is a code, then the sum for that year will also be a code.
Coefficient of Determination - Cash Flow - 5 Year Mnemonic RCF5
The Coefficient of Determination measures the stability of the 3-, 5-, and 10-year least squares growth rates of each observation. Often referred to as R2, this measure of correlation measures the "goodness of fit" of the plotted points about the regression line or trend.
Calculated by adding Income Before Extraordinary Items (Statement of Changes) plus Depreciation and Amortization (Statement of Changes). If either of these items is a code, then the sum for that year will also be a code.
Coefficient of Determination - Cash Flow - 10 Year Mnemonic RCF10
The Coefficient of Determination measures the stability of the 3-, 5-, and 10-year least squares growth rates of each observation. Often referred to as R2, this measure of correlation measures the "goodness of fit" of the plotted points about the regression line, or trend.
Calculated by adding Income Before Extraordinary Items (Statement of Changes) plus Depreciation and Amortization (Statement of Changes). If either of these items is a code, then the sum for that year will also be a code.
Coefficient of Determination - Common Equity (Book Value) - 3 Year Mnemonic RBV3
The Coefficient of Determination measures the stability of the 3-, 5-, and 10-year least squares growth rates of each observation. Often referred to as R2, this measure of correlation measures the "goodness of fit" of the plotted points about the regression line or trend.

321
Chapter 11 Financial Ratios
Coefficient of Determination - Common Equity (Book Value) - 5 Year Mnemonic RBV5
The Coefficient of Determination measures the stability of the 3-, 5-, and 10-year least squares growth rates of each observation. Often referred to as R2, this measure of correlation measures the "goodness of fit" of the plotted points about the regression line or trend.
Coefficient of Determination - Common Equity (Book Value) - 10 Year Mnemonic RBV10
The Coefficient of Determination measures the stability of the 3-, 5-, and 10-year least squares growth rates of each observation. Often referred to as R2, this measure of correlation measures the "goodness of fit" of the plotted points about the regression line or trend.
Coefficient of Determination - Dividends per Share by Ex-Date - 3 Year Mnemonic RDV3
The Coefficient of Determination measures the stability of the 3-, 5-, and 10-year least squares growth rates of each observation. Often referred to as R2, this measure of correlation measures the "goodness of fit" of the plotted points about the regression line or trend.
Coefficient of Determination - Dividends per Share by Ex-Date - 5 Year Mnemonic RDV5
The Coefficient of Determination measures the stability of the 3-, 5-, and 10-year least squares growth rates of each observation. Often referred to as R2, this measure of correlation measures the "goodness of fit" of the plotted points about the regression line or trend.
Coefficient of Determination - Dividends per Share by Ex-Date - 10 Year Mnemonic RDV10
The Coefficient of Determination measures the stability of the 3-, 5-, and 10-year least squares growth rates of each observation. Often referred to as R2, this measure of correlation measures the "goodness of fit" of the plotted points about the regression line or trend.
Coefficient of Determination - EPS Basic - Excluding - 3 Year Mnemonic REPS3
The Coefficient of Determination measures the stability of the 3-, 5-, and 10-year least squares growth rates of each observation. Often referred to as R2, this measure of correlation measures the "goodness of fit" of the plotted points about the regression line or trend.

Research Insight North America Data Guide
322
Coefficient of Determination - EPS Basic - Excluding - 5 Year Mnemonic REPS5
The Coefficient of Determination measures the stability of the 3-, 5-, and 10-year least squares growth rates of each observation. Often referred to as R2, this measure of correlation measures the "goodness of fit" of the plotted points about the regression line or trend.
Coefficient of Determination - EPS Basic - Excluding - 10 Year Mnemonic REPS10
The Coefficient of Determination measures the stability of the 3-, 5-, and 10-year least squares growth rates of each observation. Often referred to as R2, this measure of correlation measures the "goodness of fit" of the plotted points about the regression line or trend.
Coefficient of Determination - Income Before Extra Items - 3 Year Mnemonic RNI3
The Coefficient of Determination measures the stability of the 3-, 5-, and 10-year least squares growth rates of each observation. Often referred to as R2, this measure of correlation measures the "goodness of fit" of the plotted points about the regression line or trend.
Coefficient of Determination - Income Before Extra Items - 5 Year Mnemonic RNI5
The Coefficient of Determination measures the stability of the 3-, 5-, and 10-year least squares growth rates of each observation. Often referred to as R2, this measure of correlation measures the "goodness of fit" of the plotted points about the regression line or trend.
Coefficient of Determination - Income Before Extra Items - 10 Year Mnemonic RNI10
The Coefficient of Determination measures the stability of the 3-, 5-, and 10-year least squares growth rates of each observation. Often referred to as R2, this measure of correlation measures the "goodness of fit" of the plotted points about the regression line or trend.
Coefficient of Determination - Restated EPS Basic - Excluding - 3 Year Mnemonic REPSR3
The Coefficient of Determination measures the stability of the 3-, 5-, and 10-year least squares growth rates of each observation. Often referred to as R2, this measure of correlation measures the "goodness of fit" of the plotted points about the regression line or trend.

323
Chapter 11 Financial Ratios
Coefficient of Determination - Restated EPS Basic - Excluding - 5 Year Mnemonic REPSR5
The Coefficient of Determination measures the stability of the 3 and 5 year least squares growth rates of each observation. Often referred to as R2, this measure of correlation measures the "goodness of fit" of the plotted points about the regression line or trend.
Coefficient of Determination - Restated EPS Basic - Excluding - 10 Year Mnemonic REPSR10
The Coefficient of Determination measures the stability of the 3-, 5-, and 10-year least squares growth rates of each observation. Often referred to as R2, this measure of correlation measures the "goodness of fit" of the plotted points about the regression line or trend.
Coefficient of Determination - Restated Sales - 3 Year Mnemonic RSALR3
The Coefficient of Determination measures the stability of the 3-, 5-, and 10-year least squares growth rates of each observation. Often referred to as R2, this measure of correlation measures the "goodness of fit" of the plotted points about the regression line or trend.
Coefficient of Determination - Restated Sales - 5 Year Mnemonic RSALR5
The Coefficient of Determination measures the stability of the 3-, 5-, and 10-year least squares growth rates of each observation. Often referred to as R2, this measure of correlation measures the "goodness of fit" of the plotted points about the regression line or trend.
Coefficient of Determination - Restated Sales - 10 Year Mnemonic RSALR10
The Coefficient of Determination measures the stability of the 3-, 5-, and 10-year least squares growth rates of each observation. Often referred to as R2, this measure of correlation measures the "goodness of fit" of the plotted points about the regression line or trend.
Coefficient of Determination - Sales - 3 Year Mnemonic RSALE3

Research Insight North America Data Guide
324
The Coefficient of Determination measures the stability of the 3-, 5-, and 10-year least squares growth rates of each observation. Often referred to as R2, this measure of correlation measures the "goodness of fit" of the plotted points about the regression line or trend.
Coefficient of Determination - Sales - 5 Year Mnemonic RSALE5
The Coefficient of Determination measures the stability of the 3-, 5-, and 10-year least squares growth rates of each observation. Often referred to as R2, this measure of correlation measures the "goodness of fit" of the plotted points about the regression line or trend.
Coefficient of Determination - Sales - 10 Year Mnemonic RSAL10
The Coefficient of Determination measures the stability of the 3-, 5-, and 10-year least squares growth rates of each observation. Often referred to as R2, this measure of correlation measures the "goodness of fit" of the plotted points about the regression line or trend.
Common Equity Turnover Mnemonic CEQTO
Concept Calculation SALE/@PAVG(CEQ,-1,0)
This concept is Sales (Net) divided by the average of the most current two years of Common Equity - Total.
Common Equity Turnover - Quarterly Mnemonic CEQTOQ
Concept Calculation SALE12/@PAVG(CEQQ,-3,0)
This concept is Sales (Net) - 12-Months Moving divided by the average of the most current four quarters of Common Equity - Total - Quarterly.
Compound Growth Rate - Five Year - Sales - Net Mnemonic CSALE5
Units Percentage
Units Percentage
A Compound Growth Rate is an average growth that calculates the rate of movement between the first observation and the last observation and then compounds this rate over five years. Any observation between these two points is not taken into consideration.
To calculate, the first and last observations must be positive.

325
Chapter 11 Financial Ratios
Compound Growth Rate - Five Year - Dividends Per Share by Ex-Date Mnemonic CDV5
Units Percentage
A Compound Growth Rate is an average growth that calculates the rate of movement between the first observation and the last observation and then compounds this rate over five years. Any observation between these two points is not taken into consideration.
To calculate, the first and last observations must be positive.
Compound Growth Rate - Five Year - EPS Basic - Excluding Mnemonic CEPS5
Units Percentage
A Compound Growth Rate is an average growth that calculates the rate of movement between the first observation and the last observation and then compounds this rate over five years. Any observation between these two points is not taken into consideration.
To calculate, the first and last observations must be positive.
Compound Growth Rate - Five Year - Income Before Extraordinary Items Mnemonic CNI5
A Compound Growth Rate is an average growth that calculates the rate of movement between the first observation and the last observation and then compounds this rate over five years. Any observation between these two points is not taken into consideration.
To calculate, the first and last observations must be positive.
Current Ratio Mnemonic CR
Concept Calculation ACT/LCT
Units Ratio
This concept is Current Assets - Total, which represents cash and other assets that in the next 12 months are expected to be realized or used in the production of revenue, divided by Current Liabilities - Total, which represents liabilities due within one year, including the current portion of long term debt.
Current Ratio - Quarterly Mnemonic CRQ

Research Insight North America Data Guide
326
Concept Calculation @VALUE(ACTQ/LCTQ,(ACTQ/LCTQ)[-1])
Units Ratio
This concept is Current Assets - Total - Quarterly divided by Current Liabilities - Total - Quarterly. (If Current Assets - Total and Current Liabilities - Total for the current quarter are not available, the values for the previous quarter will be used.)
Days to Pay Accounts Payable Mnemonic PAYAP
Concept Calculation AP/((INVT+COGS+DP-INVT[-1]-DP [-1])/360)
This concept is Accounts Payable divided by the sum of Inventories - Total plus Cost of Goods Sold plus Depreciation and Amortization minus the previous value for Inventories - Total minus the previous value for Depreciation and Amortization. This total is divided by 360.
Days to Pay Accounts Payable - Quarterly Mnemonic PAYAPQ
Concept Calculation APQ/((INVTQ+COGS12+DP12-INVTQ[-1]-DP12[-1])/360)
This concept is Accounts Payable - Quarterly divided by the sum of Inventories - Total - Quarterly plus Cost of Goods Sold - 12-Months Moving plus Depreciation & Amortization – 12 Months Moving minus the previous value for Inventories - Total – Quarterly minus the previous value for Depreciation & Amortization – 12 Months Moving. This total is divided by 360.
Days to Sell Inventory Mnemonic SELLINV
Concept Calculation @PAVG(INVT,-1,0)/(COGS/360)
This concept is the average of the most current two years of Inventories - Total. This is divided by the sum of Cost of Goods Sold divided by 360.
Days to Sell Inventory - Quarterly Mnemonic SELLINVQ
Concept Calculation @PAVG(INVTQ,-3,0)/(COGS12/360)
This concept is the average of the most recent four quarters of Inventories - Total - Quarterly. This is divided by the sum of Cost of Goods Sold - 12-Months Moving divided by 360.

327
Chapter 11 Financial Ratios
Earning Assets - Total Mnemonic EAT
Concept Calculation PPENT+ACT
Units Millions of dollars
Earning Assets - Total is the sum of Property, Plant, and Equipment (Net) and Total Current Assets, which represent cash and other assets which, in the next 12 months, are expected to be realized in cash or used in the production of revenue.
Earning Assets - Total - Quarterly Mnemonic EATQ
Concept Calculation @VALUE(PPENTQ+ACTQ, (PPENTQ+ACTQ) [-1])
Units Millions of dollars
This concept is the sum of Property, Plant and Equipment (Net) - Quarterly and Total Current Assets - Quarterly. (If Property, Plant, and Equipment (Net) and Total Current Assets for the current quarter are not available, the values for the previous quarter will be used.)
Earnings Predictability Mnemonic EPSPRED
Concept Calculation @ABS(@PSTD((EPSPXQ-EPSPXQ [-4])/@ABS(EPSPXQ[-4]),-19,0)/ @PAVG((EPSPXQ-EPSPXQ[-4])/ @ABS(EPSPXQ[-4]),-19,0))
This concept is a relative measure of earnings dispersion, which is calculated by taking the absolute of a company’s Standard Deviation for 4 quarter percentage change for EPS Basic Quarterly (EPSPXQ) over 20 quarters and dividing it by the Company’s average 4 quarter percentage change for 20 quarters.
Earnings Predictability can also be used to predict how accurate an earnings forecast will be. The formula is a variation of the standard Coefficient of Variation formula. It is based on the stability of year-to-year earnings comparisons. The closer the Earnings Predictability value is to zero, the more reliable an earnings forecast will be.
Earnings Retention Rate Mnemonic IBRR
Concept Calculation (IB-DV)/IB*100
This concept is Income Before Extraordinary Items minus Cash Dividends. This total is divided by Income Before Extraordinary Items and then multiplied by 100.

Research Insight North America Data Guide
328
Earnings Retention Rate - Quarterly Mnemonic IBRRQ
Concept Calculation (IBQ-@IF(@PERIOD(0Q)=1,DVQ,DVQ-DVQ [-1])) / IBQ*100
This concept is Income Before Extraordinary Items - Quarterly minus Cash Dividends - Quarterly divided by Income Before Extraordinary Items - Quarterly. This total is multiplied by 100. (If Cash Dividends for the current quarter is not available, the value for the previous quarter will be used.)
Earnings Retention Rate - 3 Year Average Mnemonic IBRR3
Concept Calculation @PAVG((IB-DV)/IB,-2,0)*100
This concept is the average of Income Before Extraordinary Items minus Cash Dividends. This total is divided by the most recent three years of Income Before Extraordinary Items, and then multiplied by 100.
Earnings Retention Rate - 5 Year Average Mnemonic IBRR5
Concept Calculation @PAVG((IB-DV)/IB,-4,0)*100
This concept is the average of Income Before Extraordinary Items minus Cash Dividends. This total is divided by the most recent five years of Income Before Extraordinary Items, and then multiplied by 100.
Earnings Retention Rate - 10 Year Average Mnemonic IBRR10
Concept Calculation @PAVG((IB-DV)/IB,-9,0)*100
This concept is the average of Income Before Extraordinary Items minus Cash Dividends. This total is divided by the most recent 10 years of Income Before Extraordinary Items, and then multiplied by 100.
Earnings Before Taxes and Interest Margin Mnemonic Concept Calculation Units
Annual EBITM OIADP/SALE *100 Percentage
Quarterly EBITMQ EBITQ/SALEQ *100 Percentage
12 Month Moving
EBITM12 EBIT12/SALE12*100 Percentage

329
Chapter 11 Financial Ratios
This concept is Operating Income After Depreciation Annual, Quarterly, or 12-month moving (Sales/(Net) less Cost of Goods Sold and Selling, General, and Administrative Expense before deducting Depreciation, Depletion, and Amortization) divided by Net Sales Annual, Quarterly, or 12-month moving. This total is then multiplied by 100.
EBITDA Margin Mnemonic Concept Calculation Units
Annual EBITDAM EBITDA/SALE*100 Percentage
Quarterly EBITDAMQ EBITDAQ/SALEQ*100 Percentage
12MM EBITDAM12 EBITDA12/SALE12*100 Percentage
This concept is Earnings Before Interest and Taxes and Depreciation Annual, Quarterly, or 12-month moving (Sales (Net) less Cost of Goods Sold and Selling, General, and Administrative Expense before deducting Depreciation, Depletion, and Amortization) divided by Net Sales Annual, Quarterly, or 12-month moving. This total is then multiplied by 100.
Equity Growth Rate Mnemonic EQGROW
Concept Calculation @IF(@PAVG(CEQ,-1,0)>0,((IB-DV)/@PAVG(CEQ,-1,0))*100,1/0)
This concept is Income Before Extraordinary Items less Cash Dividends; the difference is then divided by the average Common Equity Quarterly for the current and prior quarters. The resulting quotient is multiplied by 100.
Equity Growth Rate - Quarterly Mnemonic EQGROWQ
Concept Calculation (IB12-@IF(@PERIOD(0Q)=4,DVQ, (DVQ+DVQ[@QTR(0Q)-@PERIOD(0Q)]-DVQ[-4]))) / @VALUE(@PAVG(CEQQ,-1,0), @PAVG(CEQQ,-1,0)[-1])*100
This concept is Income Before Extraordinary Items - 12-Months Moving minus Cash Dividends - Quarterly. This is divided by the average of the most current quarter of Common Equity - Total - Quarterly and multiplied by 100. (If Cash Dividends and Common Equity - Total for the current quarter are not available, the values for the previous quarter will be used.)
Equity Growth Rate - 3 Year Average Mnemonic EQGROW3

Research Insight North America Data Guide
330
Concept Calculation @PAVG(EQGROW,-2,0)
This concept is the average Equity Growth Rate for the last three years, multiplied by 100.
Equity Growth Rate - 5 Year Average Mnemonic EQGROW5
Concept Calculation @PAVG(EQGROW,-4,0)
This concept is the average Equity Growth Rate for the last five years, multiplied by 100.
Equity Growth Rate - 10 Year Average Mnemonic EQGROW10
Concept Calculation @PAVG(EQGROW,-9,0)
This concept is the average Equity Growth Rate for the last 10 years, multiplied by 100.
Financial Leverage Index Mnemonic LEVIDX
Concept Calculation ROAE/ROAA
This concept is Return on Average Equity divided by Return on Average Assets.
Financial Leverage Index - Quarterly Mnemonic LEVIDXQ
Concept Calculation ROAEQ/ROAAQ
This concept is Return on Average Equity - Quarterly divided by Return on Average Assets - Quarterly.
Fixed Assets/Common Equity Mnemonic FXACEQ
Concept Calculation PPENT/CEQ
This concept is Property, Plant and Equipment (Net) - Total divided by Common Equity - Total.
Fixed Assets/Common Equity - Quarterly Mnemonic FXACEQQ
Concept Calculation @VALUE(PPENTQ/CEQQ,(PPENTQ/CEQQ)[-1])

331
Chapter 11 Financial Ratios
This concept is Property, Plant, and Equipment (Net) - Total - Quarterly divided by Common Equity - Total - Quarterly. (If Property, Plant and Equipment (Net) - Total and Common Equity - Total for the current quarter are not available, the values for the previous quarter will be used.)
Fixed Assets/Total Equity Mnemonic FXASEQ
Concept Calculation PPENT/SEQ
This concept is Property, Plant and Equipment (Net) - Total divided by Stockholders' Equity.
Fixed Assets/Total Equity - Quarterly Mnemonic FXASEQQ
Concept Calculation @VALUE(PPENTQ/SEQQ,(PPENTQ/SEQQ)[-1])
This concept is Property, Plant, and Equipment (Net) - Total - Quarterly divided by Stockholders' Equity - Quarterly. (If Property, Plant and Equipment (Net) - Total and Stockholders' Equity for the current quarter are not available, the values for the previous quarter will be used.)
Fixed Assets Turnover Mnemonic FXATO
Concept Calculation SALE/@PAVG(PPENT,-1,0)
This concept is Sales (Net) divided by the average of the most current two years of Property, Plant and Equipment (Net) - Total
Fixed Assets Turnover - Quarterly Mnemonic FXATOQ
Concept Calculation SALE12/@PAVG(PPENTQ,-3,0)
This concept is Sales (Net) - 12-Months Moving divided by the average of the most recent quarters of Property, Plant and Equipment (Net) - Total - Quarterly
Foreign Sales - Total as a Percentage of Sales Mnemonic TFSALEP
Concept Calculation @CSUM(SALEG,@SET(@CHGCO (GEO),GAREAG=98))/SALE*100
This concept sums Net Geographic Sales for the set of all geographic segments with a Geographic Segment Area Code of 98 (all foreign segments), and divides it by Net Sales. This result is then multiplied by 100.

Research Insight North America Data Guide
332
Free Cash Flow Mnemonic FREECFL
Concept Calculation OANCF-DV-CAPX
This concept is Operating Activities - Net Cash Flow minus Cash Dividends minus Capital Expenditures.
Free Cash Flow - Quarterly Mnemonic FREECFLQ
Concept Calculation @IF(@PERIOD(0Q)=1,OANCFQ-DVQ-CAPXQ,(OANCFQ-DVQ- CAPXQ)-(OANCFQ-DVQ-CAPXQ)[-1]
This concept is Operating Activities - Net Cash Flow - Quarterly minus Cash Dividends - Quarterly minus Capital Expenditures - Quarterly. (If Operating Activities - Net Cash Flow, Cash Dividends and Capital Expenditures for the current quarter are not available, the values for the previous quarter will be used.)
Free Cash Flow - 12 Months Moving Mnemonic FREECF12
Concept Calculation (OANCFQ-DVQ-CAPXQ)+@IF(@PERIOD(0Q)= 4,0,(OANCFQ-DVQ-CAPXQ)[@QTR(0Q)-@PERIOD(0Q)]- (OANCFQ-DVQ-CAPXQ)[-4])
This concept is Operating Activities - Net Cash Flow - 12 Months Moving minus Cash Dividends - 12 Months Moving minus Capital Expenditures - 12 Months Moving.
Free Cash Flow Per Share Mnemonic FCFLPS
Concept Calculation (OANCF-DV-CAPX)/CSHO
This concept is Operating Activities - Net Cash Flow minus Cash Dividends minus Capital Expenditures. This is divided by Common Shares Outstanding - Company.
Free Cash Flow Per Share - Quarterly Mnemonic FCFLPSQ
Concept Calculation @IF(@PERIOD(0Q)=1,(OANCFQ-DVQ-CAPXQ)/CSHOQ,((OANCFQ-DVQ-CAPXQ)-(OANCFQ-DVQ-CAPXQ)[-1])/CHOQ)

333
Chapter 11 Financial Ratios
This concept is Operating Activities - Net Cash Flow - Quarterly minus Cash Dividends - Quarterly minus Capital Expenditures - Quarterly. This is divided by Common Shares Outstanding - Company - Quarterly. (If Operating Activities - Net Cash Flow, Cash Dividends, Capital Expenditures and Common Shares Outstanding - Company for the current quarter are not available, the values for the previous quarter will be used.)
Free Cash Flow Per Share - 12 Months Moving Mnemonic FCFLPS12
Concept Calculation ((OANCFQ-DVQ-CAPXQ)+@IF(@PERIOD(0Q)=4,0, (OANCFQ-DVQ-CAPXQ)[@QTR(0Q)-@PERIOD(0Q)]-(OANCFQ-DVQ-CAPXQ)[-4]))/CSHOQ
This concept is Operating Activities - Net Cash Flow - 12 Months Moving minus Cash Dividends - 12 Months Moving minus Capital Expenditures - 12 Months Moving. This is divided by Current Common Shares Outstanding - Company.
Funds Flow Adequacy Ratio Mnemonic FFAR
Concept Calculation OANCF/(CAPX+INVCH+DV)
This concept is Operating Activities - Net Cash Flow divided by the sum of Capital Expenditures plus Inventory - Decrease (Increase) plus Cash Dividends.
Funds Flow Adequacy Ratio - Quarterly Mnemonic FFARQ
Concept Calculation @VALUE(OANCFQ/(CAPXQ+ INVCHQ+DVQ),(OANCFQ/ (CAPXQ+INVCHQ+DVQ))[-1])
This concept is Operating Activities - Net Cash Flow - Quarterly divided by the sum of Capital Expenditures - Quarterly plus Inventory - Decrease (Increase) - Quarterly plus Cash Dividends - Quarterly. (If Operating Activities - Net Cash Flow, Capital Expenditures, Inventory - Decrease (Increase), and Cash Dividends for the current quarter are not available, the values for the previous quarter will be used.)
Funds Flow Adequacy Ratio 12MM Mnemonic FFAR12
Concept calculation @VALUE((OANCF12/(CAPX12+INVCH12+DV12)), (OANCF12/(CAPX12+INVCH12+DV12))[-1])
Units Millions of dollars

Research Insight North America Data Guide
334
This concept is Operating Activities - Net Cash Flow 12-Month Moving divided by the sum of Capital Expenditures 12-Month Moving plus Inventory - Decrease (Increase) 12-Month Moving plus Cash Dividends 12-Month Moving. If a value for the current period is not available, this concept will be calculated using values from the prior period.
Gross Assets Mnemonic GA
Concept Calculation AT+(PPEGT-PPENT)
Units Millions of dollars
Gross Assets is Property, Plant and Equipment (Gross) minus Property, Plant and Equipment (Net) plus Total Assets, which are defined as the sum of current assets, net plant, and other non-current assets (intangible assets, deferred assets, and investments and advances).
Gross Assets - Quarterly Mnemonic GAQ
Concept Calculation @VALUE(ATQ+DPACTQ, (ATQ+DPACTQ)[-1])
Units Millions of dollars
This concept is Gross Assets - Quarterly plus Accumulated Depreciation, Depletion, and Amortization - Total - Quarterly. (If Gross Assets and Accumulated Depreciation, Depletion, and Amortization - Total for the current quarter are not available, the values for the previous quarter will be used.)
Gross Profit Margin Mnemonic GPM
Concept Calculation (SALE-COGS)/SALE*100
This concept is Sales (Net) minus Cost of Goods Sold. This total is divided by Sales (Net) and multiplied by 100.
Gross Profit Margin - Quarterly Mnemonic GPMQ
Concept Calculation (SALEQ-@VALUE(COGSQ,COGSQ[-1])) /SALEQ*100
This concept is Sales (Net) - Quarterly minus Cost of Goods Sold - Quarterly. This total is divided by Sales (Net) - Quarterly and multiplied by 100. (If Cost of Goods Sold for the current quarter is not available, the value for the previous quarter will be used.

335
Chapter 11 Financial Ratios
Gross Profit Margin - 12-Months Moving Mnemonic GPM12
Concept Calculation (SALE12-@VALUE(COGS12, COGS12[-1])) /SALE12*100
This concept is Sales (Net) - 12-Months Moving minus Cost of Goods Sold - 12-Months Moving. This total is divided by Sales (Net) - 12-Months Moving and multiplied by 100. (If Cost of Goods Sold for the current quarter is not available, the value for the previous quarter will be used.
Income Percentage Change - 1-Year Mnemonic IBCHG1
Concept Calculation ((IB-IB[-1])/@ABS(IB[-1]))*100
This concept is Income Before Extraordinary Items minus the previous value of Income Before Extraordinary Items divided by the absolute value of the previous value of Income Before Extraordinary Items. This total is multiplied by 100.
Income Percentage Change - 3-Year Mnemonic IBCHG3
Concept Calculation ((IB-IB[-3])/@ABS(IB[-3]))*100
This concept is Income Before Extraordinary Items minus the previous three year values of Income Before Extraordinary Items divided by the absolute value of the previous three year values of Income Before Extraordinary Items. This total is multiplied by 100.
Income Percentage Change - 5-Year Mnemonic IBCHG5
Concept Calculation ((IB-IB[-5])/@ABS(IB[-5]))*100
This concept is Income Before Extraordinary Items minus the previous five year values of Income Before Extraordinary Items divided by the absolute value of the previous five year values of Income Before Extraordinary Items. This total is multiplied by 100.
Income Percentage Change - 10-Year Mnemonic IBCHG10
Concept Calculation ((IB-IB[-10])/@ABS(IB[-10]))*100
This concept is Income Before Extraordinary Items minus the previous ten year values of Income Before Extraordinary Items divided by the absolute value of the previous ten year values of Income Before Extraordinary Items. This total is multiplied by 100.
Interest Coverage After Tax Mnemonic IC

Research Insight North America Data Guide
336
Concept Calculation @VALUE(IB+XINT)/XINT
Units Decimal
Interest Coverage After Tax is Income Before Extraordinary Items, which is the income of a company after all expenses, but before provisions for common and/or preferred dividends plus Interest Expense, divided by Interest Expense, which is defined as the periodic expense to the company of securing short- and long-term debt.
Interest Coverage After Tax - Quarterly Mnemonic ICQ
Concept Calculation (@VALUE(IBQ,IBQ[-1])+ @VALUE(XINTQ,XINTQ [-1]))/@VALUE(XINTQ,XINTQ[-1])
Units Decimal
This concept is Income Before Extraordinary Items - Quarterly plus Interest Expense - Quarterly divided by Interest Expense - Quarterly. (If Income Before Extraordinary Items and Interest Expense for the current quarter are not available, the values for the previous quarter will be used.)
Interest Coverage Before Tax Mnemonic ICBT
Concept Calculation @VALUE(ICBTX,(AFI/XINT))
Units Decimal
Interest Coverage Before Tax is Pretax Income, defined as operating and non-operating income before provisions for income taxes and minority interest, plus Interest Expense, defined as the periodic expense to the company of securing short- and long-term debt, divided by Interest Expense.
Interest Coverage Before Tax - Quarterly Mnemonic ICBTQ
Concept Calculation @VALUE(ICBTXQ,(@VALUE(PIQ,PIQ[-1])+@VALUE(XINTQ,XINTQ[-1]))/@VALUE(XINTQ,XINTQ[-1]))
Units Decimal
This concept is Pretax Income - Quarterly plus Interest Expense - Quarterly divided by Interest Expense - Quarterly. (If Pretax Income and Interest Expense for the current quarter are not available, the values for the previous quarter will be used.)

337
Chapter 11 Financial Ratios
Interest Expense (FS) % of Liabilities Annual mnemonic TIED
Quarterly mnemonic TIEDQ
Annual concept calculation TIE/LT*100
Quarterly concept calculation (TIEQ+TIEQ[-1]+TIEQ[-2]+ TIEQ[-3])/LTQ*100
The annual concept is Interest Expense - Total (FS) divided by Liabilities - Total multiplied by 100.
The quarterly concept is the sum of the most recent four quarters of Interest Expense - Total (FS) - Quarterly divided by Liabilities - Total - Quarterly. This sum is then multiplied by 100.
Internal Funding of Capital Expenditures Mnemonic IFCAPX
Concept Calculation CAPX/(RE+DP)*100
This concept is Capital Expenditures divided by the sum of Retained Earnings plus Depreciation and Amortization. This total is multiplied by 100.
Internal Funding of Capital Expenditures - Quarterly Mnemonic IFCAPXQ
Concept Calculation @VALUE(CAPXQ/(REQ+DP12), (CAPXQ/(REQ+DP12))[-1])*100
This concept is Capital Expenditures - Quarterly divided by the sum of Retained Earnings - Quarterly plus Depreciation and Amortization - 12-Months Moving. This total is multiplied by 100. (If Capital Expenditures, Retained Earnings, and Depreciation and Amortization for the current quarter are not available, the values for the previous quarter will be used.)
Inventory Turnover Mnemonic INVX
Concept Calculation COGS/@PAVG(INVT,-1,0)
Units Ratio
Inventory Turnover is Cost of Goods Sold divided by the average of the current year's Total Inventories and the prior year's Total Inventories.
Inventory Turnover - Quarterly Mnemonic INVXQ
Concept Calculation @VALUE(COGS12,COGS12 [-1])/@PAVG(INVTQ,-3,0)

Research Insight North America Data Guide
338
Units Ratio
This concept is Cost of Goods Sold - 12-Months Moving divided by the average of the most recent quarters' of Inventories - Total -Quarterly.
Invested Capital - Total Mnemonic ICAPT
Annual Data Item Number A37
Units Millions of dollars
This item represents the sum of these data items ... 1. Long-Term Debt - Total
2. Preferred Stock - Carrying Value
3. Minority Interest (Balance Sheet)
4. Common Equity - Total
This item may include the current portion of long-term debt when long-term debt is footnoted indicating long-term debt includes the current portion.
This item excludes 1. Deferred income tax reserve
2. Investment tax credit
Invested Capital - Total - Quarterly Mnemonic ICAPTQ
Quarterly Data Item Number Q62
Units Millions of dollars
Invested Capital - Total - Quarterly represents the sum of these data items: 1. Long-Term Debt - Total
2. Preferred Stock - Carrying Value
3. Minority Interest (Balance Sheet)
4. Common Equity - Total
This item excludes 1. Deferred income taxes
2. Investment tax credit
Leased Asset Turnover Mnemonic LATTO
Concept Calculation SALE/@PAVG(DCLO,-1,0)

339
Chapter 11 Financial Ratios
This concept is Sales (Net) divided by the average of the most recent two years of Debt - Capitalized Lease Obligations.
Liquidity Index Mnemonic LIQIDX
Concept Calculation ((COLLECT*RECT)+(SELLINV* INVT))/ACT
This concept is Average Collection Period multiplied by Receivables - Total plus the total of Days to Sell Inventory multiplied by Inventories - Total. This total is divided by Current Assets - Total.
Liquidity Index - Quarterly Mnemonic LIQIDXQ
Concept Calculation ((COLLECTQ*RECTQ)+ (SELLINVQ*INVTQ))/ACTQ
This concept is Average Collection Period - Quarterly multiplied by Receivables - Total - Quarterly plus the total of Days to Sell Inventory - Quarterly multiplied by Inventories - Total - Quarterly. This total is divided by Current Assets - Total - Quarterly.
Long-Term Debt - Common Equity Mnemonic DCE
Concept Calculation 100*(DLTT/CEQ)
Units Percentage
Long-Term Debt/Common Equity is Total Long-Term Debt, or debt obligations due more than one year from the company's balance sheet date, divided by Common Equity as reported, which represents the common shareholders' interest in the company. This is then multiplied by 100.
Long-Term Debt - Common Equity - Quarterly Mnemonic DCEQ
Concept Calculation @VALUE(DLTTQ/CEQQ,(DLTTQ/CEQQ)[-1])*100
Units Percentage
This concept is Long-Term Debt - Total - Quarterly divided by Common Equity - Total - Quarterly, and then multiplied by 100. (If Long-Term Debt - Total and Common Equity - Total for the current quarter are not available, the values for the previous quarter will be used.)

Research Insight North America Data Guide
340
Least Squares Growth Rate - Book Value (Common Equity) - 3 Year Mnemonic GBV3
Units Percentage
A Least Squares Growth Rate is an average annual growth rate that takes into consideration each observation over a three-, five-, or 10-year period. This growth rate calculates a line of best fit for all observations. This is a log linear growth rate.
The following conditions must be met before a Least Squares Growth Rate is calculated: 1. At least 60% of the observations must be available and positive
2. The most recent observation must be positive. If any other observation is negative or a data code, then the supporting variables for that observation become zero, providing the prior condition is met.
Least Squares Growth Rate - Book Value (Common Equity) - 5 Year Mnemonic GBV5
Units Percentage
A Least Squares Growth Rate is an average annual growth rate that takes into consideration each observation over a three-, five-, or 10-year period. This growth rate calculates a line of best fit for all observations. This is a log linear growth rate.
The following conditions must be met before a Least Squares Growth Rate is calculated: 1. At least 60% of the observations must be available and positive
2. The most recent observation must be positive. If any other observation is negative or a data code, then the supporting variables for that observation become zero, providing the prior condition is met.
Least Squares Growth Rate - Book Value (Common Equity) Mnemonic GBV10
Units Percentage
A Least Squares Growth Rate is an average annual growth rate that takes into consideration each observation over a three-, five-, or 10-year period. This growth rate calculates a line of best fit for all observations. This is a log linear growth rate.
The following conditions must be met before a Least Squares Growth Rate is calculated: 1. At least 60% of the observations must be available and positive
2. The most recent observation must be positive. If any other observation is negative or a data code, then the supporting variables for that observation become zero, providing the prior condition is met.
Least Squares Growth Rate - Cash Flow Mnemonic GCF3
Units Percentage

341
Chapter 11 Financial Ratios
A Least Squares Growth Rate is an average annual growth rate that takes into consideration each observation over a three-, five-, or 10-year period. This growth rate calculates a line of best fit for all observations. This is a log linear growth rate.
The following conditions must be met before a Least Squares Growth Rate is calculated: 1. At least 60% of the observations must be available and positive
2. The most recent observation must be positive. If any other observation is negative or a data code, then the supporting variables for that observation become zero, providing the prior condition is met.
Cash Flow is calculated by adding Income Before Extraordinary Items (Statement of Changes) plus Depreciation and Amortization (Statement of Changes). If either of these items is a data code, then the sum for that year will also be a data code.
Least Squares Growth Rate - Cash Flow Mnemonic GCF5
Units Percentage
A Least Squares Growth Rate is an average annual growth rate that takes into consideration each observation over a three-, five-, or 10-year period. This growth rate calculates a line of best fit for all observations. This is a log linear growth rate.
The following conditions must be met before a Least Squares Growth Rate is calculated: 1. At least 60% of the observations must be available and positive
2. The most recent observation must be positive. If any other observation is negative or a data code, then the supporting variables for that observation become zero, providing the prior condition is met.
Cash Flow is calculated by adding Income Before Extraordinary Items (Statement of Changes) plus Depreciation and Amortization (Statement of Changes). If either of these items is a data code, then the sum for that year will also be a data code.
Least Squares Growth Rate - Cash Flow - 10 Year Mnemonic GCF10
Units Percentage
A Least Squares Growth Rate is an average annual growth rate that takes into consideration each observation over a three-, five-, or 10-year period. This growth rate calculates a line of best fit for all observations. This is a log linear growth rate.
The following conditions must be met before a Least Squares Growth Rate is calculated: 1. At least 60% of the observations must be available and positive
2. The most recent observation must be positive. If any other observation is negative or a data code, then the supporting variables for that observation become zero, providing the prior condition is met.
Cash Flow is calculated by adding Income Before Extraordinary Items (Statement of Changes) plus Depreciation and Amortization (Statement of Changes). If either of these items is a data code, then the sum for that year will also be a data code.

Research Insight North America Data Guide
342
Least Squares Growth Rate - Dividends Per Share by Ex-Date - 3 Year Mnemonic GDV3
Units Percentage
A Least Squares Growth Rate is an average annual growth rate that takes into consideration each observation over a three-, five-, or 10-year period. This growth rate calculates a line of best fit for all observations. This is a log linear growth rate.
The following conditions must be met before a Least Squares Growth Rate is calculated: 1. At least 60% of the observations must be available and positive
2. The most recent observation must be positive. If any other observation is negative or a data code, then the supporting variables for that observation become zero, providing the prior condition is met.
Least Squares Growth Rate - Dividends Per Share by Ex-Date Mnemonic GDV5
Units Percentage
A Least Squares Growth Rate is an average annual growth rate that takes into consideration each observation over a three-, five-, or 10-year period. This growth rate calculates a line of best fit for all observations. This is a log linear growth rate.
The following conditions must be met before a Least Squares Growth Rate is calculated: 1. At least 60% of the observations must be available and positive
2. The most recent observation must be positive. If any other observation is negative or a data code, then the supporting variables for that observation become zero, providing the prior condition is met.
Least Squares Growth Rate - Dividends Per Share by Ex-Date - 10 Year Mnemonic GDV10
Units Percentage
A Least Squares Growth Rate is an average annual growth rate that takes into consideration each observation over a three-, five-, or 10-year period. This growth rate calculates a line of best fit for all observations. This is a log linear growth rate.
The following conditions must be met before a Least Squares Growth Rate is calculated: 1. At least 60% of the observations must be available and positive
2. The most recent observation must be positive. If any other observation is negative or a data code, then the supporting variables for that observation become zero, providing the prior condition is met.
Least Squares Growth Rate - Earnings per Share Diluted/ 3 Yr. Mnemonic GDEPS3

343
Chapter 11 Financial Ratios
Concept Calculation @PLSG(OPEPSX,-3,0)
This concept is the Least Square Growth Rate of EPS from Operations Diluted over the last 3 years.
Least Squares Growth Rate - EPS Primary - Excl. - 3 Year Mnemonic GEPS3
Units Percentage
A Least Squares Growth Rate is an average annual growth rate that takes into consideration each observation over a three-, five-, or 10-year period. This growth rate calculates a line of best fit for all observations. This is a log linear growth rate.
The following conditions must be met before a Least Squares Growth Rate is calculated: 1. At least 60% of the observations must be available and positive
2. The most recent observation must be positive. If any other observation is negative or a data code, then the supporting variables for that observation become zero, providing the prior condition is met.
Least Squares Growth Rate - EPS Primary - Excl. - 5 Year Mnemonic GEPS5
Units Percentage
A Least Squares Growth Rate is an average annual growth rate that takes into consideration each observation over a three-, five-, or 10-year period. This growth rate calculates a line of best fit for all observations. This is a log linear growth rate.
The following conditions must be met before a Least Squares Growth Rate is calculated: 1. At least 60% of the observations must be available and positive
2. The most recent observation must be positive. If any other observation is negative or a data code, then the supporting variables for that observation become zero, providing the prior condition is met.
Least Squares Growth Rate - EPS Primary - Excl. - 10 Year Mnemonic GEPS10
Units Percentage
A Least Squares Growth Rate is an average annual growth rate that takes into consideration each observation over a three-, five-, or 10-year period. This growth rate calculates a line of best fit for all observations. This is a log linear growth rate.
The following conditions must be met before a Least Squares Growth Rate is calculated: 1. At least 60% of the observations must be available and positive
2. The most recent observation must be positive. If any other observation is negative or a data code, then the supporting variables for that observation become zero, providing the prior condition is met.

Research Insight North America Data Guide
344
Least Squares Growth Rate - Income Before Extra. Items - 3 Year Mnemonic GNI3
Units Percentage
A Least Squares Growth Rate is an average annual growth rate that takes into consideration each observation over a three-, five-, or 10-year period. This growth rate calculates a line of best fit for all observations. This is a log linear growth rate.
The following conditions must be met before a Least Squares Growth Rate is calculated: 1. At least 60% of the observations must be available and positive
2. The most recent observation must be positive. If any other observation is negative or a data code, then the supporting variables for that observation become zero, providing the prior condition is met.
Least Squares Growth Rate - Income Before Extra. Items - 5 Year Mnemonic GNI5
Units Percentage
A Least Squares Growth Rate is an average annual growth rate that takes into consideration each observation over a three-, five-, or 10-year period. This growth rate calculates a line of best fit for all observations. This is a log linear growth rate.
The following conditions must be met before a Least Squares Growth Rate is calculated: 1. At least 60% of the observations must be available and positive
2. The most recent observation must be positive. If any other observation is negative or a data code, then the supporting variables for that observation become zero, providing the prior condition is met.
Least Squares Growth Rate - Income Before Extra. Items - 10 Year Mnemonic GNI10
Units Percentage
A Least Squares Growth Rate is an average annual growth rate that takes into consideration each observation over a three-, five-, or 10-year period. This growth rate calculates a line of best fit for all observations. This is a log linear growth rate.
The following conditions must be met before a Least Squares Growth Rate is calculated: 1. At least 60% of the observations must be available and positive
2. The most recent observation must be positive. If any other observation is negative or a data code, then the supporting variables for that observation become zero, providing the prior condition is met.
Least Squares Growth Rate - Restated EPS Primary - Excl. - 3 Year Mnemonic GEPSR3
Units Percentage

345
Chapter 11 Financial Ratios
A Least Squares Growth Rate is an average annual growth rate that takes into consideration each observation over a three-, five-, or 10-year period. This growth rate calculates a line of best fit for all observations. This is a log linear growth rate.
The following conditions must be met before a Least Squares Growth Rate is calculated: 1. At least 60% of the observations must be available and positive
2. The most recent observation must be positive. If any other observation is negative or a data code, then the supporting variables for that observation become zero, providing the prior condition is met.
Least Squares Growth Rate - Restated EPS Primary - Excl. - 5 Year Mnemonic GEPSR5
Units Percentage
A Least Squares Growth Rate is an average annual growth rate that takes into consideration each observation over a three-, five-, or 10-year period. This growth rate calculates a line of best fit for all observations. This is a log linear growth rate.
The following conditions must be met before a Least Squares Growth Rate is calculated: 1. At least 60% of the observations must be available and positive
2. The most recent observation must be positive. If any other observation is negative or a data code, then the supporting variables for that observation become zero, providing the prior condition is met.
Least Squares Growth Rate - Restated EPS Primary - Excl. - 10 Year Mnemonic GEPS10
Units Percentage
A Least Squares Growth Rate is an average annual growth rate that takes into consideration each observation over a three-, five-, or 10-year period. This growth rate calculates a line of best fit for all observations. This is a log linear growth rate.
The following conditions must be met before a Least Squares Growth Rate is calculated: 1. At least 60% of the observations must be available and positive
2. The most recent observation must be positive. If any other observation is negative or a data code, then the supporting variables for that observation become zero, providing the prior condition is met.
Least Squares Growth Rate - Restated Sales - 5 Year Mnemonic GSALR5
Units Percentage
A Least Squares Growth Rate is an average annual growth rate that takes into consideration each observation over a three-, five-, or 10-year period. This growth rate calculates a line of best fit for all observations. This is a log linear growth rate.
The following conditions must be met before a Least Squares Growth Rate is calculated: 1. At least 60% of the observations must be available and positive

Research Insight North America Data Guide
346
2. The most recent observation must be positive. If any other observation is negative or a data code, then the supporting variables for that observation become zero, providing the prior condition is met.
Least Squares Growth Rate - Restated Sales - 3 Year Mnemonic GSALR3
Units Percentage
A Least Squares Growth Rate is an average annual growth rate that takes into consideration each observation over a three-, five-, or 10-year period. This growth rate calculates a line of best fit for all observations. This is a log linear growth rate.
The following conditions must be met before a Least Squares Growth Rate is calculated: 1. At least 60% of the observations must be available and positive
2. The most recent observation must be positive. If any other observation is negative or a data code, then the supporting variables for that observation become zero, providing the prior condition is met.
Least Squares Growth Rate - Sales - 3 Year Mnemonic GSALE3
Units Percentage
A Least Squares Growth Rate is an average annual growth rate that takes into consideration each observation over a three-, five-, or 10-year period. This growth rate calculates a line of best fit for all observations. This is a log linear growth rate.
The following conditions must be met before a Least Squares Growth Rate is calculated: 1. At least 60% of the observations must be available and positive
2. The most recent observation must be positive. If any other observation is negative or a data code, then the supporting variables for that observation become zero, providing the prior condition is met.
Least Squares Growth Rate - Sales - 5 Year Mnemonic GSALE5
Units Percentage
A Least Squares Growth Rate is an average annual growth rate that takes into consideration each observation over a three-, five-, or 10-year period. This growth rate calculates a line of best fit for all observations. This is a log linear growth rate.
The following conditions must be met before a Least Squares Growth Rate is calculated: 1. At least 60% of the observations must be available and positive
2. The most recent observation must be positive. If any other observation is negative or a data code, then the supporting variables for that observation become zero, providing the prior condition is met.

347
Chapter 11 Financial Ratios
Least Squares Growth Rate - Sales - 10 Year Mnemonic GSAL10
Units Percentage
A Least Squares Growth Rate is an average annual growth rate that takes into consideration each observation over a three-, five-, or 10-year period. This growth rate calculates a line of best fit for all observations. This is a log linear growth rate.
The following conditions must be met before a Least Squares Growth Rate is calculated: 1. At least 60% of the observations must be available and positive
2. The most recent observation must be positive. If any other observation is negative or a data code, then the supporting variables for that observation become zero, providing the prior condition is met.
Long-Term Debt/Shareholder's Equity Mnemonic DSE
Concept Calculation 100*DLTT/(CEQ+PSTK)
Units Percentage
Long-Term Debt/Shareholders' Equity is Total Long-Term Debt, or debt obligations due more than one year from the company's balance sheet date, divided by the sum of Common Equity as Reported, or the common shareholders' interest in the company, plus Preferred Stock, or the net number of preferred shares at yearend multiplied by the par or stated value per share. The ratio is multiplied by 100.
Long-Term Debt/Shareholder's Equity - Quarterly Mnemonic DSEQ
Concept Calculation @VALUE(DLTTQ/SEQQ,(DLTTQ/SEQQ)[-1])*100
Units Percentage
This concept is Long-Term Debt - Total - Quarterly divided by Stockholders' Equity - Quarterly, and then multiplied by 100. (If Long-Term Debt - Total and Stockholders' Equity for the current quarter are not available, the values for the previous quarter will be used.)
Long-Term Debt/Tangible Assets Mnemonic LTDTAT
Concept Calculation DLTT/(AT-INTAN)*100
This concept is Long-Term Debt - Total divided by the difference of Assets - Total minus Intangibles, and multiplied by 100.
Long-Term Debt/Total Capital Mnemonic LTDCAP

Research Insight North America Data Guide
348
Concept Calculation DLTT/ICAPT*100
This concept is Long-Term Debt - Total divided by Invested Capital - Total, and multiplied by 100.
Long-Term Debt/Total Capital - Quarterly Mnemonic LTDCAPQ
Concept Calculation @VALUE(DLTTQ/ ICAPTQ,(DLTTQ/ICAPTQ)[-1])* 100
This concept is Long-Term Debt - Total - Quarterly divided by Invested Capital - Total - Quarterly, and multiplied by 100. (If Long-Term Debt - Total and Invested Capital - Total for the current quarter are not available, the values for the previous quarter will be used.
Net Charge-Offs Annual mnemonic NCO
Quarterly mnemonic NCOQ
Annual data item number A349
Quarterly data item number Q176
Units Millions
This item represents the reported amount of asset write-downs minus recoveries of previous write downs. If losses exceed recoveries, this value is shown as a negative amount.
Net Charge-Offs % of Net Income Annual mnemonic NCON
Quarterly mnemonic NCONQ
Annual concept calculation NCO/IB*100
Quarterly concept calculation NCOQ/IBQ*100
The annual concept is Net Charge-Offs divided by Income Before Extraordinary Items multiplied by 100.
The quarterly concept is Net Charge-Offs - Quarterly divided by Income Before Extraordinary Items - Quarterly multiplied by 100.
Net Interest Margin Annual mnemonic NIM
Quarterly mnemonic NIMQ
Annual data item number A344
Quarterly data item number Q173

349
Chapter 11 Financial Ratios
Units Ratio
This item is a reported ratio consisting of net interest income on a tax equivalent basis as a percent of average earning assets. This item represents the measure of how effectively the bank is utilizing its interest earning assets in relationship to the interest cost of funding them. Net interest margin is computed by dividing net tax equivalent interest income by average interest earning assets.
Net Loans Percentage of Assets Annual mnemonic NLA
Quarterly mnemonic NLAQ
Annual concept calculation RECT/AT*100
Quarterly concept calculation RECTQ/ATQ*100
The annual concept is Receivables - Total divided by Assets - Total multiplied by 100.
The quarterly concept is Receivables - Total - Quarterly divided by Assets - Total - Quarterly multiplied by 100.
Net Loans Percentage of Deposits Annual mnemonic NLD
Quarterly mnemonic NLDQ
Annual concept calculation RECT/AP*100
Quarterly concept calculation RECTQ/APQ*100
The annual concept is Receivables - Total divided by Accounts Payable multiplied by 100.
The quarterly concept is Receivables - Total - Quarterly divided by Accounts Payable - Quarterly multiplied by 100.
Net Operating Assets Mnemonic NOA
Concept Calculation PPENT+ACT-LCT
Units Millions of dollars
Net Operating Assets is the sum of Property, Plant, and Equipment (Net) plus Total Current Assets, which represent cash and other assets expected to be realized in cash within one year, less Total Current Liabilities, which are liabilities due within one year.
Net Operating Assets - Quarterly Mnemonic NOAQ
Concept Calculation @VALUE(PPENTQ+ACTQ-LCTQ, (PPENTQ+ACTQ-LCTQ)[-1])

Research Insight North America Data Guide
350
Units Millions of dollars
This concept is Property, Plant, and Equipment (Net) - Total - Quarterly plus Current Assets - Total - Quarterly minus Current Liabilities - Total - Quarterly. (If Property, Plant and Equipment (Net) - Total, Current Assets - Total, and Current Liabilities - Total for the current quarter are not available, the values for the previous quarter will be used.)
Net Profit Margin Mnemonic NPM
Concept Calculation (IB/SALE)*100
Units Percentage
Net Profit Margin is Income before Extraordinary Items, which represents income of a company after all expenses but before provisions for common and/or preferred dividends, divided by Net Sales. This is then multiplied by 100.
Net Profit Margin - Quarterly Mnemonic NPMQ
Concept Calculation @VALUE(IBQ,IBQ[-1])/ @VALUE(SALEQ,SALEQ[-1])*100
Units Percentage
This concept is Income Before Extraordinary Items - Quarterly divided by Sales (Net) - Quarterly, and then multiplied by 100. (If Income Before Extraordinary Items and Sales (Net) for the current quarter are not available, the values for the previous quarter will be used.)
Net Trade Cycle - Quarterly Mnemonic TRCYCLEQ
Concept Calculation SELLINVQ+COLLECTQ-PAYAPQ
This concept is Days to Sell Inventory - Quarterly plus Average Collection Period - Quarterly minus Days to Accounts Payable - Quarterly.
Net Trade Cycle Mnemonic TRCYCLE
Concept Calculation SELLINV+COLLECT-PAYAP
This concept is Days to Sell Inventory plus Average Collection Period minus Days to Accounts Payable.

351
Chapter 11 Financial Ratios
Nonoperating Income (Expenses) % of Net Interest Income Annual mnemonic NOPN
Quarterly mnemonic NOPNQ
Annual concept calculation NOPI/NIIT*100
Quarterly concept calculation NOPIQ/NIITQ*100
The annual concept is Nonoperating Income (Expenses) divided Net Interest Income (Tax Equivalent) multiplied by 100.
The quarterly concept is Nonoperating Income (Expenses) - Quarterly divided by Net Interest Income (Tax Equivalent) - Quarterly multiplied by 100.
Nonperforming Assets % of Assets - Total Annual mnemonic NPAA
Quarterly mnemonic NPAAQ
Annual concept calculation NPAT/AT*100
Quarterly concept calculation NPATQ/ATQ*100
The annual concept is Nonperforming Assets - Total divided by Assets - Total multiplied by 100.
The quarterly concept is Nonperforming Assets - Total - Quarterly divided by Assets - Total - Quarterly multiplied by 100.
Nonperforming Assets % of Common Equity Annual mnemonic NPAE
Quarterly mnemonic NPAEQ
Annual concept calculation NPAT/CEQ*100
Quarterly concept calculation NPATQ/CEQQ*100
The annual concept is Nonperforming Assets - Total divided by Common Equity - Total multiplied by 100.
The quarterly concept is Nonperforming Assets - Total - Quarterly divided by Common Equity - Total - Quarterly multiplied by 100.
On-Balance-Volume Mnemonic OBVD
Concept Calculation @PSUM(@IF(PRCCD> PRCCD[-1],1*CSHTRD,@IF (PRCCD<PRCCD[-1],-1* CSHTRD,0*CSHTRD)),-49,0)
Units Millions

Research Insight North America Data Guide
352
On-Balance-Volume is 50-day sum of Common Shares Traded based on the following set of rules:
if price > previous day's price - Shares Traded are added.
if price < previous day's price - Shares Traded are subtracted.
if price = previous day's price - Shares Traded are not included.
Operating Cycle Mnemonic OPCYCLE
Concept Calculation SELLINV+COLLECT
This concept is Days to Sell Inventory plus Average Collection Period.
Operating Cycle - Quarterly Mnemonic OPCYCLEQ
Concept Calculation SELLINVQ+COLLECTQ
This concept is Days to Sell Inventory - Quarterly plus Average Collection Period - Quarterly.
Operating Margin After Depreciation Mnemonic OMAD
Concept Calculation 100*((OIBDP-DP)/SALE)
Units Percentage
Operating Margin After Depreciation is Operating Income Before Depreciation minus Depreciation, Depletion, and Amortization divided by Net Sales. This is then multiplied by 100.
Operating Margin After Depreciation - Quarterly Mnemonic OMADQ
Concept Calculation (@VALUE(OIBDPQ-DPQ, (OIBDPQ-DPQ)[-1]))/ SALEQ*100
Units Percentage
This concept is Operating Income Before Depreciation - Quarterly minus Depreciation, Depletion, and Amortization - Quarterly divided by Sales (Net) - Quarterly, and multiplied by 100. (If Operating Income Before Depreciation and Depreciation, Depletion, and Amortization for the current quarter are not available, the values for the previous quarter will be used.

353
Chapter 11 Financial Ratios
Operating Margin Before Depreciation Mnemonic OMBD
Concept Calculation 100*(OIBDP/SALE)
Units Percentage
Operating Margin Before Depreciation is Operating Income Before Depreciation divided by Net Sales. This is then multiplied by 100.
Operating Margin Before Depreciation - Quarterly Mnemonic OMBDQ
Concept Calculation @VALUE(OIBDPQ,OIBDPQ[-1])/SALEQ*100
Units Percentage
This concept is Operating Income Before Depreciation - Quarterly divided by Sales (Net) - Quarterly, and multiplied by 100. (If Operating Income Before Depreciation for the current quarter is not available, the value for the previous quarter will be used.
Pretax Profit Margin Mnemonic PPM
Concept Calculation 100*(PI/SALE)
Units Percentage
Pretax Profit Margin is Pretax Income, which is operating and nonoperating income before taxes and minority interest, divided by Net Sales. This is then multiplied by 100.
Pretax Profit Margin - Quarterly Mnemonic PPMQ
Concept Calculation @VALUE(PIQ,PIQ[-1])/SALEQ*100
Units Percentage
This concept is Pretax Income - Quarterly divided by Sales (Net) - Quarterly, and multiplied by 100. (If Pretax Income for the current quarter is not available, the value for the previous quarter will be used.)
Pretax Return on Assets Mnemonic PROA
Concept Calculation PI/AT*100
This concept is Pretax Income divided by Assets - Total and multiplied by 100.

Research Insight North America Data Guide
354
Pretax Return on Assets - Quarterly Mnemonic PROAQ
Concept Calculation @VALUE(PI12,PI12[-1])/ @VALUE(ATQ,ATQ[-1])*100
This concept is Pretax Income - 12-Months Moving divided by Assets - Total - Quarterly, and multiplied by 100. (If Pretax Income and Assets - Total for the current quarter are not available, the values for the previous quarter will be used.)
Pretax Return on Average Assets - Fixed Mnemonic PROAAF
Concept Calculation PI/@PAVG(PPENT,-1,0)*100
This concept is Pretax Income divided by the average of the most recent two years' of Property, Plant, and Equipment (Net) - Total, multiplied by 100.
Pretax Return on Average Assets - Fixed - Quarterly Mnemonic PROAAFQ
Concept Calculation @VALUE(PI12,PI12[-1])/ @VALUE(@PAVG (PPENTQ,-1,0),@PAVG (PPENTQ,-1,0)[-1])*100
This concept is Pretax Income - 12-Months Moving divided by the average of the most recent two quarters' of Property, Plant, and Equipment (Net) - Total - Quarterly, multiplied by 100. (If Pretax Income - 12-Months Moving and Property, Plant, and Equipment (Net) - Total for the current quarter are not available, the values for the previous quarter will be used.)
Pretax Return on Average Assets - Total Mnemonic PROAA
Concept Calculation PI/@PAVG(AT,-1,0)*100
This concept is Pretax Income divided by the average of the most recent two years' of Assets - Total, multiplied by 100.
Pretax Return on Average Assets - Total - Quarterly Mnemonic PROAAQ
Concept Calculation PI12/@PAVG(ATQ,-1,0)*100
This concept is Pretax Income - 12-Months Moving divided by the average of the most recent two quarters' of Assets - Total - Quarterly, multiplied by 100.

355
Chapter 11 Financial Ratios
Pretax Return on Average Equity Mnemonic PROAE
Concept Calculation PI/@PAVG(CEQ,-1,0)*100
This concept is Pretax Income divided by the average of the most recent two years' of Common Equity - Total, multiplied by 100.
Pretax Return on Average Equity - Quarterly Mnemonic PROAEQ
Concept Calculation @VALUE(PI12,PI12[-1])/ @VALUE(@PAVG (CEQQ,-1,0),@PAVG (CEQQ,-1,0)[-1])*100
This concept is Pretax Income - 12-Months Moving divided by the average of the most recent two years' of Common Equity - Total - Quarterly, multiplied by 100. (If Pretax Income - 12-Months Moving and Common Equity - Total for the current quarter are not available, the values for the previous quarter will be used.)
Pretax Return on Average Investment Mnemonic PROAI
Concept Calculation PI/@PAVG(ICAPT,-1,0)*100
This concept is Pretax Income divided by the average of the most recent two years of Invested Capital - Total, multiplied by 100.
Pretax Return on Average Investment - Quarterly Mnemonic PROAIQ
Concept Calculation @VALUE(PI12,PI12[-1])/ @VALUE(@PAVG (ICAPTQ,-1,0),@PAVG (ICAPTQ,-1,0)[-1])*100
This concept is Pretax Income - 12-Months Moving divided by the average of the most recent two quarters' of Invested Capital - Total - Quarterly, multiplied by 100. (If Pretax Income - 12-Months Moving and Invested Capital - Total for the current quarter are not available, the values for the previous quarter will be used.)
Pretax Return on Equity Mnemonic PROE
Concept Calculation PI/CEQ*100

Research Insight North America Data Guide
356
This concept is Pretax Income divided by Common Equity - Total, multiplied by 100.
Pretax Return on Equity - Quarterly Mnemonic PROEQ
Concept Calculation @VALUE(PI12,PI12[-1])/ @VALUE(CEQQ,CEQQ[-1])*100
This concept is Pretax Income - 12-Months Moving divided by Common Equity - Total - Quarterly, multiplied by 100. (If Pretax Income - 12-Months Moving and Common Equity - Total for the current quarter are not available, the values for the previous quarter will be used.)
Pretax Return on Fixed Assets Mnemonic PROAF
Concept Calculation PI/PPENT*100
This concept is Pretax Income divided by Property, Plant, and Equipment (Net) - Total, multiplied by 100.
Pretax Return on Fixed Assets - Quarterly Mnemonic PROAFQ
Concept Calculation @VALUE(PI12,PI12[-1])/ @VALUE (PPENTQ,PPENTQ[-1])*100
This concept is Pretax Income - 12-Months Moving divided by Property, Plant, and Equipment (Net) - Total - Quarterly, multiplied by 100.
Pretax Return on Investment Mnemonic PROI
Concept Calculation PI/ICAPT*100
This concept is Pretax Income divided by Invested Capital - Total, multiplied by 100.
Pretax Return on Investment - Quarterly Mnemonic PROIQ
Concept Calculation @VALUE(PI12,PI12[-1])/ @VALUE (ICAPTQ,ICAPTQ[-1])*100
This concept is Pretax Income -12-Months Moving divided by Invested Capital - Total - Quarterly, multiplied by 100. (If Pretax Income - 12-Months Moving and Invested Capital - Total for the current quarter are not available, the values for the previous quarter will be used.)

357
Chapter 11 Financial Ratios
Provision for Loan/Asset Losses Annual mnemonic PLL
Quarterly mnemonic PLLQ
Annual data item number A342
Quarterly data item number Q171
Units Millions of dollars
This item represents an expense charged to earnings which increases the allowance for possible losses on assets owned due to the decline in value of collaterized assets or foreclosed assets. This item includes 1. Provision for loan losses
2. Provision for other real estate owned losses
3. Specific and general provision for other real estate owned losses
4. Provision for loss on assets held for sale
Provision for Loan/Asset Losses % of Assets Annual mnemonic PLLA
Quarterly mnemonic PLLAQ
Annual concept calculation PLL/AT*100
Quarterly concept calculation (PLLQ+PLLQ[-1]+PLLQ[-2]+PLLQ[-3])/ATQ*100
The annual concept is Provision for Loan/Asset Losses divided by Assets - Total multiplied by 100.
The quarterly concept is the sum of the most recent four quarters Provision for Loan/Asset Losses - Quarterly divided by Assets - Total - Quarterly. This sum is then multiplied by 100.
Quick Ratio Mnemonic QR
Concept Calculation (CHE+RECT)/LCT
Units Ratio
Quick Ratio is the sum of Cash and Equivalents, which represent cash and all securities readily transferable to cash, plus Total Receivables, which are claims against other collectible in money (within one year), divided by Total Current Liabilities, which are liabilities due within one year.
Quick Ratio - Quarterly Mnemonic QRQ
Concept Calculation @VALUE((CHEQ+RECTQ)/LCTQ, ((CHEQ+RECTQ)/LCTQ)[-1])
Units Ratio

Research Insight North America Data Guide
358
This concept is Cash and Equivalents - Quarterly plus Receivables - Total - Quarterly divided by Current Liabilities - Total - Quarterly. (If Cash and Equivalents, Receivables - Total, and Current Liabilities - Total for the current quarter are not available, the values for the previous quarter will be used.)
Receivables Turnover Mnemonic RECX
Concept Calculation SALE/@PAVG(RECT,-1,0)
Units Ratio
Receivables Turnover is Net Sales, divided by the average of the current year's Total Receivables, and the prior year's Total Receivables.
Receivables Turnover - Quarterly Mnemonic RECXQ
Concept Calculation SALE12/@PAVG(RECTQ,-3,0)
Units Ratio
Receivables Turnover Quarterly is the sum of the four most current quarters of Sales divided by the average of the most current four quarters of Total Receivables.
Reinvestment Rate Mnemonic RVSTR
Concept Calculation (IB-DV)/SEQ*100
This concept is Income Before Extraordinary Items minus Cash Dividends, and divided by Stockholders' Equity. This quantity is multiplied by 100.
Reinvestment Rate - Quarterly Mnemonic RVSTRQ
Concept Calculation (IB12-@VALUE (DVQ,DVQ[-1]))/@VALUE (SEQQ,SEQQ[-1])*100
This concept is Income Before Extraordinary Items - 12-Months Moving minus Cash Dividends - Quarterly divided by Stockholders' Equity - Quarterly. This quantity is multiplied by 100. (If Cash Dividends and Stockholders' Equity for the current quarter are not available, the values for the previous quarter will be used.)

359
Chapter 11 Financial Ratios
Reinvestment Rate - 3-Year Average Mnemonic RVSTR3
Concept Calculation @PAVG((IB-DV)/SEQ,-2,0)*100
This concept is the average of the most recent three years of Income Before Extraordinary Items minus Cash Dividends divided by Stockholders' Equity. This quantity is multiplied by 100.
Reinvestment Rate - 5-Year Average Mnemonic RVSTR5
Concept Calculation @PAVG((IB-DV)/SEQ,-4,0)*100
This concept is the average of the most recent five years of Income Before Extraordinary Items minus Cash Dividends divided by Stockholders' Equity. This quantity is multiplied by 100.
Reinvestment Rate - 10-Year Average Mnemonic RVSTR10
Concept Calculation @PAVG((IB-DV)/SEQ,-9,0)*100
This concept is the average of the most recent 10 years of Income Before Extraordinary Items minus Cash Dividends divided by Stockholders' Equity. This quantity is multiplied by 100.
Reserve for Loan/Asset Losses % of Nonperf. Assets Annual mnemonic RLLNA
Quarterly mnemonic RLLNAQ
Annual concept calculation RLL/NPAT*100
Quarterly concept calculation RLLQ/NPATQ*100
The annual concept is Reserve for Loan/Asset Losses divided by Nonperforming Assets - Total multiplied by 100.
The quarterly concept is Reserve for Loan/Asset Losses - Total - Quarterly divided by Nonperforming Assets - Total - Quarterly multiplied by 100.
Reserve for Loan/Asset Losses Annual mnemonic RLL
Quarterly mnemonic RLLQ
Annual data item number A343
Quarterly data item number Q172
Units Millions
This item represents all value adjustment reserves.

Research Insight North America Data Guide
360
This item includes 1. Allowance for Loan Losses
2. Other real estate owned reserves
3. Other real estate owned held for sale reserves
4. Real estate investment allowance reserves
5. Securities held for sale valuation allowance reserves
Reserve for Loan/Asset Losses % of Assets Annual mnemonic RLLA
Quarterly mnemonic RLLAQ
Annual concept calculation RLL/AT*100
Quarterly concept calculation RLLQ/ATQ*100
The annual concept is Reserve for Loan/Asset Losses divided by Assets - Total multiplied by 100.
The quarterly concept is Reserve for Loan/Asset Losses - Total - Quarterly divided by Assets - Total - Quarterly multiplied by 100.
Return on Assets Mnemonic ROA
Concept Calculation (IBCOM/AT)*100
Units Percentage
Return on Assets is Income Before Extraordinary Items - Available for Common, divided by Total Assets, which is defined as the sum of current assets, net property, plant, and equipment, and other noncurrent assets. This is then multiplied by 100.
Return on Assets - Quarterly Mnemonic ROAQ
Concept Calculation @VALUE(IBCOM12,IBCOM12[-1])/@VALUE(ATQ,ATQ[-1])*100
Units Percentage
This concept is Income Before Extraordinary Items - Available for Common - 12 Months Moving divided by Assets - Total - Quarterly, and multiplied by 100. (If Income Before Extraordinary Items - Available for Common - 12-Months Moving and Assets - Total for the current quarter are not available, the values for the previous quarter will be used.)
Return on Average Assets Mnemonic ROAA

361
Chapter 11 Financial Ratios
Concept Calculation (IBCOM/@PAVG(AT,-1,0))*100
Units Percentage
Return on Average Assets is Income Before Extraordinary Items - Available for Common, divided by the average of the current year's Total Assets and the prior year's Total Assets. This is then multiplied by 100.
Return on Average Assets - Quarterly Mnemonic ROAAQ
Concept Calculation @VALUE(IBCOM12,IBCOM12[-1])/@PAVG(ATQ,-3,0)*100
Units Percentage
This concept is Income Before Extraordinary Items - Available for Common - 12-Months Moving divided by the average of the most recent four quarters of Assets - Total - Quarterly, and multiplied by 100. (If Income Before Extraordinary Items - Available for Common - 12-Months Moving for the current quarter is not available, the value for the previous quarter will be used.)
Return on Average Equity Mnemonic ROAE
Concept Calculation (IBCOM/@PAVG(CEQ,-1,0))*100
Units Percentage
Return on Average Equity is Income Before Extraordinary Items - Available for Common, divided by the average of the most current year's Common Equity as Reported and the prior year's Common Equity as Reported. This is then multiplied by 100.
Return on Average Equity - Quarterly Mnemonic ROAEQ
Concept Calculation @VALUE((IBCOM12),(IBCOM12)[-1])/@PAVG(CEQQ,-3,0)*100
Units Percentage
This concept is Income Before Extraordinary Items - Available for Common - 12-Months Moving divided by the average of the most recent four quarters of Common Equity - Total - Quarterly, and multiplied by 100. (If Income Before Extraordinary Items - Available for Common - 12-Months Moving for the current quarter is not available, the value for the previous quarter will be used.)
Return on Average Investment Mnemonic ROAI
Concept Calculation (IBCOM/@PAVG(ICAPT,-1,0))*100
Units Percentage

Research Insight North America Data Guide
362
Return on Average Investment is Income Before Extraordinary Items - Available for Common, divided by the average of the most current year's Total Invested Capital and the prior year's Total Invested Capital. This is then multiplied by 100.
Return on Average Investment - Quarterly Mnemonic ROAIQ
Concept Calculation @VALUE(IBCOM12,IBCOM12[-1])/@PAVG(ICAPTQ,-3,0)*100
Units Percentage
This concept is Income Before Extraordinary Items - Available for Common - 12-Months Moving divided by the average of the most recent four quarters' of Invested Capital - Total - Quarterly, and multiplied by 100. (If Income Before Extraordinary Items - Available for Common - 12-Months Moving for the current quarter is not available, the value for the previous quarter will be used.)
Return on Equity Mnemonic ROE
Concept Calculation (IBCOM/CEQ)*100
Units Percentage
Return on Equity is Income Before Extraordinary Items - Available for Common, which is defined as income before extraordinary items and discontinued operations less preferred dividend requirements, but before adding savings due to common stock equivalents, divided by Common Equity as Reported, which is defined as the common shareholders' interest in the company. This is then multiplied by 100.
Return on Equity - Quarterly Mnemonic ROEQ
Concept Calculation @VALUE(IBCOM12,IBCOM12[-1])/@VALUE(CEQQ,CEQQ[-1])*100
Units Percentage
This concept is Income Before Extraordinary Items - Available for Common - 12-Months Moving divided by Common Equity - Total - Quarterly, and multiplied by 100. (If Income Before Extraordinary Items - Available for Common - 12-Months Moving and Common Equity for the current quarter are not available, the values for the previous quarter will be used.)
Return on Investment Mnemonic ROI
Concept Calculation (IBCOM/ICAPT)*100
Units Percentage

363
Chapter 11 Financial Ratios
Return on Investment is Income Before Extraordinary Items - Available for Common, divided by Total Invested Capital, which is the sum of the following items: Total Long-Term Debt; Preferred Stock; Minority Interest; and Total Common Equity. This is then multiplied by 100.
Return on Investment - Quarterly Mnemonic ROIQ
Concept Calculation @VALUE(IBCOM12,IBCOM12[-1])/@VALUE (ICAPTQ,ICAPTQ[-1])*100
Units Percentage
This concept is Income Before Extraordinary Items - Available for Common - 12-Months Moving divided by Invested Capital - Total - Quarterly, and multiplied by 100. (If Income Before Extraordinary Items - Available for Common - 12-Months Moving and Invested Capital - Total for the current quarter are not available, the values for the previous quarter will be used.)
Sales Percentage Change - 1-Year Mnemonic SALECHG1
Concept Calculation ((SALE/SALE[-1])-1)*100
This concept is Sales (Net) divided by the previous year value of Sales (Net) minus one (1). This total is multiplied by 100.
Sales Percentage Change - 3-Year Mnemonic SALECHG3
Concept Calculation ((SALE/SALE[-3])-1)*100
This concept is Sales (Net) divided by the value from three years ago of Sales (Net) minus one (1). This total is multiplied by 100.
Sales Percentage Change - 5-Year Mnemonic SALECHG5
Concept Calculation ((SALE/SALE[-5])-1)*100
This concept is Sales (Net) divided by the value from five years ago of Sales (Net) minus one (1). This total is multiplied by 100.
Sales Percentage Change - 10-Year Mnemonic SALECHG10
Concept Calculation ((SALE/SALE[-10])-1)*100

Research Insight North America Data Guide
364
This concept is Sales (Net) divided by the value from 10 years ago of Sales (Net) minus one (1). This total is multiplied by 100.
Securities Percentage of Assets Mnemonic SA
Concept calculation IVAO/AT*100
This concept is Investments and Assets - Other divided by Assets - Total multiplied by 100.
Short-Term Debt as a Percentage of Total Debt Mnemonic STDLTD
Concept calculation DLC/DT*100
This concept is Debt in Current Liabilities divided by Debt - Total.
Short-Term Debt as a Percentage of Total Debt - Quarterly Mnemonic STDLTDQ
Concept calculation @VALUE (DLCQ/DTQ,(DLCQ/ DTQ)[-1])*100
This concept is Debt in Current Liabilities - Quarterly divided by Debt - Total - Quarterly, and multiplied by 100. (If Debt in Current Liabilities and Debt - Total for the current quarter are not available, the values for the previous quarter will be used.)
Tax Rate Mnemonic TR
Concept Calculation 100*(TXT/PI)
Units Percentage
This item is Total Income Taxes, which include income taxes imposed by federal, state, and foreign governments, divided by Pretax Income, which is operating and nonoperating income before provisions for income taxes and minority interest. This is then multiplied by 100.
Tax Rate - Quarterly Mnemonic TRQ
Concept calculation @VALUE(TXTQ,TXTQ[-1])/ @VALUE(PIQ,PIQ[-1])*100

365
Chapter 11 Financial Ratios
Units Percentage
This concept is Income Taxes - Total - Quarterly divided by Pretax Income - Quarterly, and multiplied by 100. (If Income Taxes - Total and Pretax Income for the current quarter are not available, the values for the previous quarter will be used.)
Tax Retention Rate Mnemonic TRR
Concept calculation IB/PI*100
This concept is Income Before Extraordinary Items divided by Pretax Income, and multiplied by 100.
Tax Retention Rate - Quarterly Mnemonic TRRQ
Concept calculation IBQ/@VALUE(PIQ,PIQ[-1])*100
This concept is Income Before Extraordinary Items - Quarterly divided by Pretax Income - Quarterly, and multiplied by 100. (If Pretax Income for the current quarter is not available, the value for the previous quarter will be used.)
Tax Retention Rate - 3-Year Average Mnemonic TRR3
Concept calculation @PAVG(IB/PI,-2,0)*100
This concept is the average of the most recent three years of Income Before Extraordinary Items divided by Pretax Income. This quantity is multiplied by 100.
Tax Retention Rate - 5-Year Average Mnemonic TRR5
Concept calculation @PAVG(IB/PI,-4,0)*100
This concept is the average of the most recent five years of Income Before Extraordinary Items divided by Pretax Income. This quantity is multiplied by 100.
Tax Retention Rate - 10-Year Average Mnemonic TRR10
Concept calculation @PAVG(IB/PI,-9,0)*100
This concept is the average of the most recent 10 years of Income Before Extraordinary Items divided by Pretax Income. This quantity is multiplied by 100.

Research Insight North America Data Guide
366
Total Asset Turnover Mnemonic ATT
Concept calculation SALE/@PAVG(AT,-1,0)
Units Ratio
This item is Net Sales divided by the average of the current year's Total Assets and prior year's Total Assets.
Total Asset Turnover - Quarterly Mnemonic ATTQ
Concept calculation SALE12/@PAVG(ATQ,-3,0)
Units Ratio
This item is the sum of the four most current quarters of Net Sales, divided by the average of the four most current quarters of Total Assets.
Total Assets/Common Equity Mnemonic ATCEQ
Concept calculation AT/CEQ
This concept is Assets - Total divided by Common Equity - Total.
Total Assets/Common Equity - Quarterly Mnemonic ATCEQQ
Concept calculation @VALUE(ATQ/CEQQ,(ATQ/CEQQ)[-1])
This concept is Assets - Total - Quarterly divided by Common Equity - Total - Quarterly. (If Assets - Total and Common Equity for the current quarter are not available, the values for the previous quarter will be used.)
Total Assets/Total Equity Mnemonic ATSEQ
Concept calculation AT/SEQ
This concept is Assets - Total divided by Stockholders' Equity.
Total Assets/Total Equity - Quarterly Mnemonic ATSEQQ

367
Chapter 11 Financial Ratios
Concept calculation @VALUE(ATQ/SEQQ,(AT/SEQQ)[-1])
This concept is Assets - Total - Quarterly divided by Stockholders' Equity - Quarterly. (If Assets - Total and Stockholders' Equity for the current quarter are not available, the values for the previous quarter will be used.)
Total Debt/Tangible Assets Mnemonic DTAT
Concept calculation DT/(AT-INTAN)*100
This concept is Debt - Total divided by Assets - Total minus Intangibles. This quantity is multiplied by 100.
Total Debt/Total Assets Mnemonic DAT
Concept calculation (DT/AT)*100
Units Percentage
This item is defined as the sum of Long-Term Debt and Debt in Current Liabilities, divided by Total Assets, which represent the sum of current assets, net plant, and other noncurrent assets. This is then multiplied by 100.
Total Debt/Total Assets - Quarterly Mnemonic DATQ
Concept calculation @VALUE(DTQ/ATQ,(DTQ/ATQ)[-1])*100
Units Percentage
This concept is Debt - Total - Quarterly divided by Assets - Total - Quarterly, and multiplied by 100. (If Debt - Total and Assets - Total for the current quarter are not available, the values for the previous quarter will be used.)
Total Debt/Total Capital Mnemonic DTCAP
Concept calculation (DT/ICAPT)*100
This concept is Debt - Total divided by Invested Capital - Total, and multiplied by 100.
Total Debt/Total Capital - Quarterly Mnemonic DTCAPQ
Concept calculation @VALUE(DTQ/ICAPTQ,(DTQ/ICAPTQ)[-1])*100

Research Insight North America Data Guide
368
This concept is Debt - Total - Quarterly divided by Invested Capital - Quarterly, and multiplied by 100. (If Debt - Total and Invested Capital for the current quarter are not available, the values for the previous quarter will be used.)
Total Debt/Total Equity Mnemonic DTEQ
Concept calculation (DT/SEQ)*100
This concept is Debt - Total divided by Stockholders' Equity, and multiplied by 100.
Total Debt/Total Equity - Quarterly Mnemonic DTEQQ
Concept calculation @VALUE(DTQ/SEQQ,(DTQ/SEQQ)[-1])*100
This concept is Debt - Total - Quarterly divided by Stockholders' Equity - Quarterly, and multiplied by 100. (If Debt - Total and Stockholders' Equity for the current quarter are not available, the values for the previous quarter will be used.)
Total Equity Turnover Mnemonic SEQTO
Concept calculation SALE/@PAVG(SEQ,-1,0)
This concept is Sales (Net) divided by the average of the most recent two years of Stockholders' Equity.
Total Equity Turnover - Quarterly Mnemonic SEQTOQ
Concept calculation SALE12/@PAVG(SEQQ,-3,0)
This concept is Sales (Net) - 12-Months Moving divided by the average of the most recent four quarters of Stockholders' Equity.
Working Capital (Balance Sheet) Mnemonic WCAP
Annual Data Item Number A179
Units Millions of dollars
This item represents the difference between total current assets minus total current liabilities as reported on a company's Balance Sheet.
This item is not available for banks or utilities.

369
Chapter 11 Financial Ratios
Working Capital Per Share Mnemonic WCAPPS
Concept Calculation (ACT-LCT)/CSHO
This concept is Current Assets - Total minus Current Liabilities - Total divided by Common Shares Outstanding - Company.
Working Capital Per Share - Quarterly Mnemonic WCAPPSQ
Concept Calculation @VALUE((ACTQ-LCTQ)/ CSHOQ,((ACTQ- LCTQ)/ CSHOQ)[-1]
This concept is Current Assets - Total - Quarterly minus Current Liabilities - Total - Quarterly divided by Common Shares Outstanding - Company - Quarterly. (If Current Assets - Total, Current Liabilities - Total, and Common Shares Outstanding - Company for the current quarter are not available, the values for the previous quarter will be used.)
Working Capital Turnover Mnemonic WCAPTO
Concept Calculation SALE/@PAVG(ACT-LCT,-1,0)
This concept is Sales (Net) divided by the average of the most recent two years of Current Assets - Total minus Current Liabilities - Total.
Working Capital Turnover - Quarterly Mnemonic WCAPTOQ
Concept Calculation SALE12/@PAVG(ACTQ-LCTQ,-3,0)
This concept is Sales (Net) - 12-Months Moving divided by the average of the most recent four quarters of Current Assets - Total - Quarterly minus Current Liabilities - Total - Quarterly.
Z Score - Measure of Bankruptcy Mnemonic ZSCORE
Concept Calculation 1.2*(WCAP/AT)+1.4*(RE/AT)+ 3.3*(EBIT/AT)+.6*(@VALUE (PRCCF*CSHO,CEQ)+PSTK)/ (AT-CEQ-PSTK)+.999*(SALE/AT)
This concept is a bankruptcy prediction model developed by Edward Altman at New York University. • If a value less than 1.81 is returned, than there is a high probability of bankruptcy.
• If a value greater than 3.0 is returned, than there is a low probability of bankruptcy.
This item is designed to forecast failure in the short-term (up to two years).

Research Insight North America Data Guide
370

371
Chapter 12 Financial Services
Financial Services
This chapter contains definitions for industry-specific financial services data, primarily for banks and savings and loans. Net Asset Value is available for closed-end funds.
Financial Services Balance Sheet Items
Data Item
Annual Mnemonic . . . page
Quarterly Mnemonic . . . page
Net Charge-Offs NCO . . . 384 NCOQ . . . 384 Non-performing Assets - Total NPAT . . . 178 NPATQ . . . 178 Reserve for Loan/Asset Losses RLL . . . 396 RLLQ . . . 396
Financial Services Income Statement Items
Data Item
Annual Mnemonic . . . page
Quarterly Mnemonic . . . page
Interest Expense - Total (FS) TIE . . . 413 TIEQ . . . 413 Net Interest Income NIINT . . . 415 NIINTQ . . . 415 Interest Income - Total (FS) TII . . . 414 TIIQ . . . 414 Net Interest Income (Tax Equivalent) NIIT . . . 415 NIITQ . . . 415 Provision for Loan/Asset Losses PLL . . . 393 PLLQ . . . 393 Tax Equivalent Adjustment TEA . . . 421 TEAQ . . . 421
Financial Services Ratios
Data Item
Annual Mnemonic . . . page
Quarterly Mnemonic . . . page
Percentage of Total Assets Assets for Sale/Total Assets AHSA . . . 347 AHSAQ . . . 347 Net Charge-Offs/Net Income NCON . . . 384 NCONQ . . . 384 Net Loans/Total Assets NLA . . . 385 NLAQ . . . 385 Nonoperating Income (Exp)/Net Interest Income
NOPN . . . 387 NOPNQ . . . 387
Non-performing Assets/Total Assets NPAA . . . 387 NPAAQ . . . 387 Provision for Loan/Asset Losses/Total Assets
PLLA . . . 394 PLLAQ . . . 394
CHAPTER 12

Research Insight North America Data Guide
372
Assets Reserve for Loan/Asset Losses/Total Assets
RLLA . . . 397 RLLAQ . . . 397
Securities/Total Assets SA . . . 401 Other Interest Expense/Total Liabilities TIED . . . 371 TIEDQ . . . 371 Net Interest Margin NIM . . . 384 NIMQ . . . 384 Net Loans/Total Deposits NLD . . . 385 NLDQ . . . 385 Nonperforming Assets/Common Equity NPAE . . . 387 NPAEQ . . . 387 Reserve for Loan/Asset Losses/Nonperforming Assets
RLLNA . . . 396 RLLNAQ . . . 396
Risk-Adjusted Capital Ratio - Total CAPRT . . . 420 CAPRTQ . . . 420 Risk-Adjusted Capital Ratio - Tier 1 CAPR1 . . . 419 CAPR1Q . . . 419 Risk-Adjusted Capital Ratio - Tier 2 CAPR2 . . . 420

373
Chapter 12 Financial Services
Data Definitions
Interest Expense - Total (FS) Annual mnemonic TIE
Quarterly mnemonic TIEQ
Annual data item number A339
Quarterly data item number Q70
Units Millions
This item represents the interest expense on deposits, long-term debt, and all other borrowings.
This item includes 1. Amortization of debt discount or premium
2. Debt issuance expense (such as underwriting fees, brokerage costs, and advertising costs)
3. Discount on the sale of receivables
4. Finance charges relating to finance leases
5. Financing charges
6. Interest on customer advances
7. Total interest and related expense
This item excludes 1. Interest and related income
2. Interest capitalized
Interest Expense (FS) % of Liabilities Annual mnemonic TIED
Quarterly mnemonic TIEDQ
Annual concept calculation TIE/LT*100
Quarterly concept calculation (TIEQ+TIEQ[-1]+TIEQ[-2]+ TIEQ[-3])/LTQ*100
The annual concept is Interest Expense - Total (FS) divided by Liabilities - Total multiplied by 100.
The quarterly concept is the sum of the most recent four quarters of Interest Expense - Total (FS) - Quarterly divided by Liabilities - Total - Quarterly. This sum is then multiplied by 100.
Interest Income - Total (FS) Annual mnemonic TII
Quarterly mnemonic TIIQ
Annual data item number A321

Research Insight North America Data Guide
374
Quarterly data item number Q29
Units Millions
This item represents the revenue received from all earning assets.
This item includes interest and dividends from earning assets.
This item excludes interest and dividend income from unconsolidated subsidiary/affiliate.
Internal Funding of Capital Expenditures 12 MM Mnemonic IFCAPX12
Concept calculation @VALUE((CAPX12/(REQ+DP12)), (CAPX12/(REQ+DP12))[-1])*100
Units Millions of dollars
This concept is Capital Expenditures - 12-Month Moving divided by the sum of Retained Earnings -12-Month Moving plus Depreciation and Amortization - 12-Month Moving. This total is multiplied by 100. If a value is not available for the current period, this concept will be calculated using data from the prior period.
Net Asset Value Mnemonic NAVM
This item applies to closed-end funds only. It is the market value of the fund’s assets minus liabilities divided by the shares outstanding.
This is a monthly item from the Prices, Dividends and Earnings file.
Net Charge-Offs Annual mnemonic NCO
Quarterly mnemonic NCOQ
Annual data item number A349
Quarterly data item number Q176
Units Millions
This item represents the reported amount of asset write-downs minus recoveries of previous write downs. If losses exceed recoveries, this value is shown as a negative amount.
Net Charge-Offs % of Net Income Annual mnemonic NCON
Quarterly mnemonic NCONQ

375
Chapter 12 Financial Services
Annual concept calculation NCO/IB*100
Quarterly concept calculation NCOQ/IBQ*100
The annual concept is Net Charge-Offs divided by Income Before Extraordinary Items multiplied by 100.
The quarterly concept is Net Charge-Offs - Quarterly divided by Income Before Extraordinary Items - Quarterly multiplied by 100.
Net Interest Income Annual mnemonic NIINT
Quarterly mnemonic NIINTQ
Annual concept calculation TII-TIE
Quarterly concept calculation TIIQ-TIEQ
The annual concept is Interest Income - Total (FS) minus Interest Expense - Total (FS).
The quarterly concept is Interest Income - Total (FS) - Quarterly minus Interest Expense - Total (FS) - Quarterly.
Net Interest Income (Tax Equivalent) Annual mnemonic NIIT
Quarterly mnemonic NIITQ
Annual data item number A340
Quarterly data item number Q97
Units Millions
This item represents net interest income with the interest income on non-taxable securities adjusted to a taxable equivalent amount. The difference between net interest income on a Tax Equivalent basis and total interest income less total interest expense is the Tax Equivalent Adjustment.
Net Interest Margin Annual mnemonic NIM
Quarterly mnemonic NIMQ
Annual data item number A344
Quarterly data item number Q173
Units Ratio
This item is a reported ratio consisting of net interest income on a tax equivalent basis as a percent of average earning assets. This item represents the measure of how effectively the bank is utilizing its interest earning assets in relationship to the interest cost of funding them. Net interest margin is computed by dividing net tax equivalent interest income by average interest earning assets.

Research Insight North America Data Guide
376
Net Loans Percentage of Assets Annual mnemonic NLA
Quarterly mnemonic NLAQ
Annual concept calculation RECT/AT*100
Quarterly concept calculation RECTQ/ATQ*100
The annual concept is Receivables - Total divided by Assets - Total multiplied by 100.
The quarterly concept is Receivables - Total - Quarterly divided by Assets - Total - Quarterly multiplied by 100.
Net Loans Percentage of Deposits Annual mnemonic NLD
Quarterly mnemonic NLDQ
Annual concept calculation RECT/AP*100
Quarterly concept calculation RECTQ/APQ*100
The annual concept is Receivables - Total divided by Accounts Payable multiplied by 100.
The quarterly concept is Receivables - Total - Quarterly divided by Accounts Payable - Quarterly multiplied by 100.
Nonoperating Income (Expenses) % of Net Interest Income Annual mnemonic NOPN
Quarterly mnemonic NOPNQ
Annual concept calculation NOPI/NIIT*100
Quarterly concept calculation NOPIQ/NIITQ*100
The annual concept is Nonoperating Income (Expenses) divided Net Interest Income (Tax Equivalent) multiplied by 100.
The quarterly concept is Nonoperating Income (Expenses) - Quarterly divided by Net Interest Income (Tax Equivalent) - Quarterly multiplied by 100.
Nonperforming Assets - Total Annual mnemonic NPAT
Quarterly mnemonic NPATQ
Annual Data Item Number A341
Quarterly Data Item Number Q99
Units (companies) Millions

377
Chapter 12 Financial Services
This item represents the reported amount of assets that are considered nonperforming. This item includes 1. Loans and leases carried on a non-accrual basis
2. Loans which are 90 days past due both accruing and nonaccruing
3. Renegotiated loans
4. Real estate acquired through foreclosure
5. Repossessed movable property
This item excludes past due loans not yet placed on non-accrual status (unless specifically included in nonperforming assets by the bank).
Nonperforming Assets % of Assets - Total Annual mnemonic NPAA
Quarterly mnemonic NPAAQ
Annual concept calculation NPAT/AT*100
Quarterly concept calculation NPATQ/ATQ*100
The annual concept is Nonperforming Assets - Total divided by Assets - Total multiplied by 100.
The quarterly concept is Nonperforming Assets - Total - Quarterly divided by Assets - Total - Quarterly multiplied by 100.
Nonperforming Assets % of Common Equity Annual mnemonic NPAE
Quarterly mnemonic NPAEQ
Annual concept calculation NPAT/CEQ*100
Quarterly concept calculation NPATQ/CEQQ*100
The annual concept is Nonperforming Assets - Total divided by Common Equity - Total multiplied by 100.
The quarterly concept is Nonperforming Assets - Total - Quarterly divided by Common Equity - Total - Quarterly multiplied by 100.
Provision for Loan/Asset Losses Annual mnemonic PLL
Quarterly mnemonic PLLQ
Annual data item number A342
Quarterly data item number Q171
Units Millions of dollars
This item represents an expense charged to earnings which increases the allowance for possible losses on assets owned due to the decline in value of collaterized assets or foreclosed assets. This item includes

Research Insight North America Data Guide
378
1. Provision for loan losses
2. Provision for other real estate owned losses
3. Specific and general provision for other real estate owned losses
4. Provision for loss on assets held for sale
Provision for Loan/Asset Losses % of Assets Annual mnemonic PLLA
Quarterly mnemonic PLLAQ
Annual concept calculation PLL/AT*100
Quarterly concept calculation (PLLQ+PLLQ[-1]+PLLQ[-2]+PLLQ[-3])/ATQ*100
The annual concept is Provision for Loan/Asset Losses divided by Assets - Total multiplied by 100.
The quarterly concept is the sum of the most recent four quarters Provision for Loan/Asset Losses - Quarterly divided by Assets - Total - Quarterly. This sum is then multiplied by 100.
Reserve for Loan/Asset Losses Annual mnemonic RLL
Quarterly mnemonic RLLQ
Annual data item number A343
Quarterly data item number Q172
Units Millions
This item represents all value adjustment reserves.
This item includes 1. Allowance for Loan Losses
2. Other real estate owned reserves
3. Other real estate owned held for sale reserves
4. Real estate investment allowance reserves
5. Securities held for sale valuation allowance reserves
Reserve for Loan/Asset Losses % of Assets Annual mnemonic RLLA
Quarterly mnemonic RLLAQ
Annual concept calculation RLL/AT*100
Quarterly concept calculation RLLQ/ATQ*100
The annual concept is Reserve for Loan/Asset Losses divided by Assets - Total multiplied by 100.

379
Chapter 12 Financial Services
The quarterly concept is Reserve for Loan/Asset Losses - Total - Quarterly divided by Assets - Total - Quarterly multiplied by 100.
Reserve for Loan/Asset Losses % of Nonperf. Assets Annual mnemonic RLLNA
Quarterly mnemonic RLLNAQ
Annual concept calculation RLL/NPAT*100
Quarterly concept calculation RLLQ/NPATQ*100
The annual concept is Reserve for Loan/Asset Losses divided by Nonperforming Assets - Total multiplied by 100.
The quarterly concept is Reserve for Loan/Asset Losses - Total - Quarterly divided by Nonperforming Assets - Total - Quarterly multiplied by 100.
Risk-Adjusted Capital Ratio - Tier 1 Annual mnemonic CAPR1
Quarterly mnemonic CAPR1Q
Annual data item number A337
Quarterly data item number Q174
Units Ratio
This item represents the core capital ratio calculation established for banks by the 1988 Basle Accord for reporting risk-adjusted capital adequacy. Interim calculation guidelines have been established effective for 1990, which are less stringent than the final guidelines effective for 1992. The ratio based on 1992 criteria is collected in this item when reported. This item represents data collected as an actual percentage, as reported by the company.
Tier 1 Capital Definition:
Equity capital plus minority interests less portion of perpetual preferred stock and goodwill as a percent of adjusted risk-weighted assets. Regulatory minimum is 4%.
Minimum Interim and Final Ratio Targets:
1990 1992
Tier I 3.625% 4.000%
Note: Referred to as Core Capital by Savings and Loans with a regulatory minimum of 3%.
Risk-Adjusted Capital Ratio - Tier 2 Mnemonic CAPR2
Concept calculation CAPRT-CAPR1
This concept is Risk-Adjusted Capital Ratio - Total minus Risk-Adjusted Capital Ratio - Tier 1.

Research Insight North America Data Guide
380
Risk-Adjusted Capital Ratio - Total Annual mnemonic CAPRT
Quarterly mnemonic CAPRTQ
Annual data item number A348
Quarterly data item number Q175
Units Ratio
This item represents the combined core and supplementary capital ratio calculation established for banks by the 1988 Basle Accord for reporting risk-adjusted capital adequacy. The purpose of risk-adjusted guidelines was to establish minimum capital standards for multi-national banks and to incorporate risk adjusted assets into the calculation of capital adequacy. These guidelines assign risk to bank assets and off-balance sheet items for the purpose of calculating capital ratios. Interim calculation guidelines have been established effective for 1990, which are less stringent than the final guidelines effective for 1992. The ratio based on 1992 criteria is collected in this item when reported. This item represents data collected as an actual percentage, as reported by the company.
Securities Percentage of Assets Mnemonic SA
Concept calculation IVAO/AT*100
This concept is Investments and Assets - Other divided by Assets - Total multiplied by 100.
Tax Equivalent Adjustment Annual mnemonic TEA
Quarterly mnemonic TEAQ
Annual concept calculation NIIT-NIINT
Quarterly concept calculation NIITQ-NIINTQ
The annual concept is Net Interest Income (Tax Equivalent) minus Net Interest Income.
The quarterly concept is Net Interest Income (Tax Equivalent) - Quarterly minus Net Interest Income - Quarterly.

381
Chapter 13 Functions
Functions
Functions are predefined calculation tools you can use to perform numerous tasks, from something as simple as averaging data for an industry, to more sophisticated analyses using fractiles. You can use functions in your screening, reporting, spreadsheet and concept formulas individually, or combine them for more complex analysis.
Every function begins with @, followed by a short name, such as CAVG. Additionally, each function requires instructions for what you want evaluated. We refer to these instructions as arguments and they are always enclosed in parenthesis following the function name.
Research Insight categorizes functions by the particular type of analysis you want to perform. Functions are listed by category in the Look Up List under the Functions tab.
Currency Functions Currency functions allow you to display data in its native currency and to change units of representation.
For example, the @NATIVE function allows you to display data in its native currency, alongside the same data that has been translated in the same report.
Use the @SCALE function to change values in any currency to millions, regardless of their units of representation. This applies to those currencies that have characteristically large currency units, such as the Japanese Yen and Italian Lira.
Function . . . page Description @NATIVE . . . 452 Display data in native currency @SCALE . . . 465 Return data in millions
Database Control Functions Database Control functions enable you to target or exclude a specific database layer so you can specify the type of data Research Insight will return [i.e., data from the Compustat database, or Compustat Classic data].
Function . . . page Description @DB . . . 441 Returns data from specified database layer @EXCLUDEDB . . . 442 Excludes specified database layer
Historical Analysis Functions Historical Analysis functions can be used to evaluate data over a period of time. For example, you can calculate 5-year average sales, or find out how many times a company increased its dividend over time.
CHAPTER 13

Research Insight North America Data Guide
382
Function . . . page Description @EXPSMOOTH . . . 443 Calculates exponentially weighted average @PAVG . . . 453 Calculates average across time @PCOR . . . 455 Calculates correlation Coefficient @PCOUNT . . . 455 Counts Periods @PDEC . . . 455 Decrease across time @PFIRST . . . 456 Locates first occurrence of data @PFSTPD . . . 457 Locates first time period occurrence of data @PGMN . . . 459 Calculates geometric mean across time @PINC . . . 460 Increase across time @PLAST . . . 457 Locates last occurrence of data @PLASTPD . . . 458 Locates last time period occurrence of data @PMAX . . . 461 Calculates maximum value across time @PMAXPD . . . 461 Returns period for maximum value @PMED . . . 461 Calculates median value across time @PMEDPD . . . 462 Returns period for median value @PMIN . . . 462 Calculates minimum value across time @PMINPD . . . 463 Returns period for minimum value @PPROD . . . 463 Multiplication across time @PSTD . . . 463 Calculates standard deviation @PSUM . . . 464 Sum across time @PWAVG . . . 464 Calculates weighted average across time
Growth Functions Growth functions can be used to measure growth of an item over time. Research Insight contains several different growth functions to help you in your financial analysis.
Function . . . page Description @ALPHA . . . 432 Returns the intercept of the y axis @BETA . . . 433 Returns the slope of the line @CORR . . . 438 Returns the R2 of the correlation coefficient @FORECAST . . . 444 Returns a predicted value @MRALPHA . . . 450 Returns the intercept of the y axis in the multiple regression
equation @MRBETA . . . 450 Returns the slope of the line for the specified variable @MRCORR . . . 451 Calculates the coefficient of multiple determination @MRFSTAT . . . 451 Determines the f-statistic in the multiple regression equation @MRSTDERR . . . 452 Calculates the standard error of the independent variable (y) in
the multiple regression equation @PCGR . . . 454 Calculates compound growth rate

383
Chapter 13 Functions
@PLSG . . . 460 Calculates least squares growth rate @PLSGR . . . 460 Calculates fit of least squares growth rate
Information Functions Information functions perform tasks that return data for a specific element of a group item or generalize data.
Function . . . page Description @DATE . . . 440 Inserts calendar date @ELEMENT . . . 442 Specifies group element @PARM . . . 453 Displays currency description @SIC2 and @SIC3 . . . 466
Generalize SIC codes
Logical Functions Logical functions test items and formulas to determine whether or not they meet selected conditions.
This category of functions is called logical because they evaluate a condition to be true or false, and return data depending on specified conditions. Use these functions in screening as well as financial models you create in reports or spreadsheets. As with any function, you can combine them with other functions for more complex formulas.
Function . . . page Description @AND . . . 433 Logical AND @IF . . . 445 Returns a value when conditions are met @INRANGE . . . 446 Determines membership in a range @ISAF . . . 446 Determines annual figure data code @ISCF . . . 446 Determines combined figure data code @ISIF . . . 447 Determines insignificant figure data code @ISNA . . . 447 Determines not available data code @ISNC . . . 447 Determines not calculable data code @ISNM . . . 447 Determines not meaningful data code @ISSF . . . 448 Determines semiannual figure data code @ISVALUE . . . 448 Determines existence of data @NOT . . . 452 Logical NOT @OR . . . 453 Logical OR @VALUE . . . 468 Generates a data value

Research Insight North America Data Guide
384
Mathematical Functions Mathematical functions perform many of the same calculations available on your pocket calculator, such as logarithm, square root and exponent.
Function . . . page Description @ABS . . . 432 Absolute value @EXP . . . 442 Exponent @INT . . . 446 Integer @LN . . . 449 Natural log @LOG . . . 449 Log @PERCENTILE . . . 456 Determines the value at the break point @RND . . . 465 Round @SQRT . . . 467 Square root
Reference Functions Reference functions return data for specified segments and issues.
Function . . . page Description @GEO . . . 445 Returns geographic segment data @ISS . . . 447 Returns issue data @SEG . . . 466 Returns business segment data
Period Reference Functions Period Reference functions allow you to specify the time period for which you want to evaluate data. If you do not specify a time period, the default is the current time period.
Another important feature of period reference functions is the ability to change the time period associated with an item. For example, you can change the time reference for a monthly item to a quarterly time period using the @MNT function. See also Mixing Time Periods.
Function . . . page Description @DAY . . . 440 Identify period day @MNT . . . 450 Identify period month @PERIOD . . . 456 Display period number @QTR . . . 464 Identify fiscal period quarter @WK . . . 468 Identify period week @YR . . . 469 Identify fiscal period year

385
Chapter 13 Functions
Screening Functions Screening functions create a set of companies, and can be used within set analysis functions, the Base Set column of screen criteria, and in Set Builder to create a new set. Certain screening functions also change the company or set type from company to respective business segments, geographic segments and common stock issues, and from segment or issue to respective companies.
Function . . . page Description @CHGCO . . . 435 Company transformation @CHGSET . . . 435 Set transformation @ISMEMBER . . . 445 Identifies members of a set @SET . . . 466 Select companies based on condition @TRIMPCT . . . 467 Trim outlying values (percent) @TRIMSTD . . . 468 Trim outlying values (standard deviation)
Set Analysis Functions Set Analysis Functions perform a variety of calculations that simplify your analysis using data results for a set of companies. You can save time using these functions in your set analysis for industry studies. The set functions return the same value for each company in the set evaluated.
Function . . . page Description @CAVG . . . 433 Average across a set @CCOR . . . 434 Correlation coefficient across a set @CCOUNT . . . 434 Count companies containing data in a set @CGMN . . . 434 Geometric mean across a set @CMAX . . . 436 Maximum value across a set @CMED . . . 436 Median value across a set @CMIN . . . 437 Minimum value across a set @CPROD . . . 438 Multiplication across a set @CSIZE . . . 438 Count companies in a set @CSTD . . . 438 Standard deviation across a set @CSUM . . . 439 Sum across a set @CWAVG . . . 439 Weighted average across a set @STDS . . . 467 Standard deviation for a sample of a population
Statistical Functions Statistical Functions provide you with the tools you need to generate statistical measures such as least squares growth rate, the fit of least squares growth, and relative standing of companies within a set.
Function . . . page Description @FRAC . . . 444 Measure relative standing within a set

Research Insight North America Data Guide
386
@RANK . . . 465 Rank order within a set @NTILE . . . 453 Creates fractiles within a set @PFRAC . . . 456 Measures relative standing over time @PNTILE . . . 459 Creates fractiles over time @PRANK . . . 459 Calculates relative rank over time
Text Functions Text functions return the value of a formula as a character string (textual data). For example, you can display the description of an SIC Code or S&P Bond Rating in a report.
Function . . . page Description @CONCATENATE . . . 437
Combines text strings
@DESC . . . 441 Display descriptions @FIND . . . 443 Find a specific value in a text string @LEFT . . . 449 Return the leftmost characters in text string @MID . . . 449 Return the middle characters in a text string @RIGHT . . . 465 Return the rightmost characters in a text string @TEXT . . . 467 Return a string of characters
@ABS - Absolute value @ABS(formula) - Absolute value
Calculates the absolute value of any numerical formula.
Example:
@ABS(PI)-DVP Calculates the dollar amount difference between pretax income and dividends paid.
@ALPHA - Returns the intercept of the Y axis @ALPHA(formula1, period1, period2, [formula2]) - Returns the intercept of the Y axis.
Calculates A in the equation A = (∑Y/n) - (B*(∑X/n) where:
A = The Y-Intercept (also stated as the estimated value of Y where the regression line crosses the Y-axis when X is 0
Y = The value of the independent variable
B = The slope (BETA)
X = The value of the dependent variable
n = The number of periods
Example:
@ALPHA(PRCCM/PRCCM[-1], -59, 0, "I0003":(PRCCM/PRCCM[-1]))

387
Chapter 13 Functions
Returns the difference between a company’s return and the fluctuation of the Standard & Poor’s 500 Index over the last 60 months.
@AND- Logical AND @AND(logical, logical) - Logical AND
Returns true if each argument is true, but false if one or more arguments are false. Therefore, if each argument is true a value of 1 will be returned and if one or more arguments are false a value of 0 will be returned. This function can contain up to 30 logical conditions.
Example:
@AND(SALE>500,SIC=2834) This formula finds all companies with sales greater than $500 million with an SIC Code of 2834.
@BETA - Returns the slope of the line @BETA(formula1, period1, period2, [formula2]) - Returns the slope of the line.
Calculates B in the equation Y = A + B(X), the equation for a straight line. B is the slope of the line.
Example:
@BETA(PRCCM/PRCCM[-1], -59, 0, "I0003":(PRCCM/PRCCM[-1]))
@CAVG - Average across a set @CAVG(formula, set, [match_formula]) - Average across a set
Calculates the average value of a formula across a set. This function returns a decimal.
@CAVG returns a value if the following is true: Number of data values >n/2 where n = the number of companies in the set [if the match formula is used n = the number of companies in the set that met the match criterion].
If this criterion is not met, @NC is returned.
Examples:
@CAVG(ROA,$MYSET) Calculates the average return on assets for the companies in the set MYSET.
SALE>@CAVG(SALE,@SET($C,SIC=2800)) Finds the set of companies in the chemicals industry and calculates the average sales for the set. Identifies companies in the database with sales greater than the average sales for the chemicals industry.
@CAVG (ROE,$MYSET,SECTOR)
Calculates the average return on equity for the companies in $MYSET that are in the same sector as your target company.

Research Insight North America Data Guide
388
@CCOR - Correlation coefficient across a set @CCOR(formulaX, formulaY, set, [match_formula]) - Correlation coefficient across a set
Calculates the correlation coefficient between two formulas within a set. This returns a decimal between -1.0 and 1.0, such as .98. A return of 0 to 1.0 indicates a positive correlation; a return of -1.0 to 0 indicates an inverse correlation.
@CCOR returns a value if the following is true:
Number of companies for which both X and Y have a data value >= n/2 where n = the number of companies in the set [if the match formula is used n = the number of companies in the set that met the match criterion].
If this criterion is not met, @NC is returned
Examples:
@CCOR(SALE,PI,$C) Calculates the correlation coefficient of sales and pretax income for all active companies.
@CCOR(INVX,PI,@SET($C,SPMIX<60)) Calculates the correlation coefficient of inventory turnover and pretax income for companies in the S&P 500.
@CCOUNT - Counts companies containing data in a set @CCOUNT(formula, set, [match_formula]) - Counts companies containing data in a set
Counts the number of companies in a set with data for an item. This function returns an integer.
Examples:
@CCOUNT(EPSPXQ[Q3Y94],$C) Counts the number of active companies with a value for earnings per share for 3rd quarter, 1994.
@CCOUNT(XRD,@SET($C,SPMIX=91)) Counts the number of companies in the S&P MidCap 400 that have a value for R&D expense in the current year.
@CGMN - Geometric mean across a set @CGMN(formula, set, [match_formula]) - Geometric mean across a set
Calculates the geometric mean of a formula across a set. This function returns a decimal.

389
Chapter 13 Functions
@CGMN returns a value if the following is true:
Number of data values >= n/2 where n = the number of companies in the set [if the match formula is used n = the number of companies in the set that met the match criterion] being evaluated.
If this criterion is not met, @NC is returned.
Examples:
@CGMN(TRT5Y,$TOP20) Calculates the geometric mean of the 5-year total return for the set TOP20.
@CGMN(DVPSXQ[Q4Y94],$MYSET) Calculates the geometric mean of dividends per share for the set MYSET for the 4th quarter of 1994.
@CGMN(PEM,$LOWCAP) Calculates the geometric mean of the price to earnings ratio for the companies in the set LOWCAP.
@CHGCO - Company transformation @CHGCO(co_type) - Company transformation
Changes a company to its respective business segments, geographic segments or issues. You can also change a business segment, geographic segment or issue to the respective company.
The valid arguments for co_type are: • BUS (business segment)
• GEO (geographic segment)
• ISSUE (issue segment)
• COMPANY
Examples:
ROE>=@CAVG(ROE,@SET($C,SIC=@CHGCO(COMPANY):SIC)) Evaluates Return on Equity for a company and compares it to the average Return on Equity for all companies with the same SIC Code.
@CMAX(SALES,@CHGCO(BUS)) Evaluates all business segments of the company and returns the largest sales figures.
@CHGSET - Set transformation @CHGSET(set, set_type) - Set transformation
Changes set of companies to business segments, geographic segments or issues. You can also change a set of business segments, geographic segments or issues to companies.
The valid arguments for set_type are: • BUS (business segment)
• GEO (geographic segment)
• ISSUE (issue segment)
• COMPANY

Research Insight North America Data Guide
390
Example:
@CHGSET($MYSET,ISSUE) Changes the company set ($MYSET) to a set of issues.
@CMAX - Maximum value across a set @CMAX(formula, set, [match_formula]) - Maximum value across a set
Extracts the largest value of a formula across a set.
If there is no value for any of the companies in the set, @NC is returned.
Examples:
@CMAX(SALE,$CGloss_C.314.5) Finds the largest value for sales across all active companies.
@CMAX(SALE/EMP,$C) Finds the largest value of sales to employees in the active company set.
@CMED - Median value across a set @CMED(formula, set, [match_formula]) - Median value across a set
Extracts the median value of a formula across a set.
Returns the median value of a formula across a set. To find the median value you must first array the values in ascending or descending order. To find the position of the median value, apply the formula below:
n / 2 + ½
n = number of observations
With an even number of observations, the formula will return a result with a fractional remainder. This indicates that the median lies between two values. In this case a median can be calculated. In Sample 2, the median is at position 3.5, or between the values 4 and 5. When this occurs, the median can be calculated by averaging the two middle observations.
Sample 1 Sample 2
1 1
3 3
4 4
5 5
9 7
9
N = 5 6
Median Position = 3 3.5
Median Value = 4 4.5

391
Chapter 13 Functions
@CMED returns a value if the following is true:
Number of data values >= n/2
where n = the number of companies in the set being evaluated [if the match formula is used n = the number of companies in the set that met the match criterion].
If this criterion is not met, @NC is returned.
Examples:
@CMED(SALE,$C) Finds the median value for sales across all active companies.
@CMED(PEM,$SP_500) Finds the median value for monthly price to earnings ratio for the companies in the set SP500.
@CMIN - Minimum value across a set @CMIN(formula, set, [match_formula]) - Minimum value across a set
Extracts the smallest value of a formula across a set.
If there is no value for any of the companies in the set, @NC is returned.
Examples:
@CMIN(SALE,$C) Finds the minimum value for sales across the set of active companies.
@CMIN(@PAVG(ROI,-4,0),$MYSET) Calculates the lowest average return on investment in the last five years for the companies in the set MYSET.
@CONCATENATE Combines text strings @CONCATENATE(text1,text2) Combines multiple text strings into one string.
Example:
@CONCATENATE("GICS:",SPGICX)
Returns the title “GICS:” followed by the current company GICS code.
@CORR - Returns the R2 of the correlation coefficient @CORR(formula1, period1, period2, [formula2]) - Returns the R2 of the correlation coefficient.
Calculates the coefficient of determination, which is the portion of the variability of the dependent variable that is explained by the variability of the independent variable. This returns a decimal between 0 and 1.0, such as .74. A value of .74 would indicate that 74% of the variable in the dependent variable is explained by variability of the independent variable.

Research Insight North America Data Guide
392
Example:
@CORR(SALE, -4, 0, EPSPX)
Returns the variability in sales that is explained by the variability in earnings per share over a five-year period.
@CPROD - Multiplication across a set @CPROD(formula, set, [match_formula]) - Multiplication across a set
Calculates the product of a formula across a set. This function returns a decimal.
If there is no value for any of the companies in the set, the function returns a "1".
Examples:
@CPROD(ROA,$TOP10) Multiplies return on assets for all companies in the set TOP10.
@CSIZE - Counts companies in a set @CSIZE(set, [match_formula]) - Counts companies in a set
Returns the total number of companies in a set [if the match formula is used, returns the number of companies in set that met the match criterion]. This function returns 0 or a positive integer.
Examples:
@CSIZE($MYSET) Counts the number of companies in the set MYSET.
@CSIZE($R) Counts the number of companies in the Research Insight $R set (Research Companies).
@CSTD - Standard deviation across a set @CSTD(formula, set, [match_formula]) - Standard deviation across a set
Calculates standard deviation for formula values across a set. This function returns a decimal.
@CSTD returns a value if the following is true: Number of data values >= n/2 where n = the number of companies in the set being evaluated [if the match formula is used n = the number of companies in the set that met the match criterion]. If this criterion is not met, @NC is returned.
Examples:
@CSTD(SALE/SALE[-1],$MYSET) Calculates the standard deviation of sales growth for companies in the set MYSET.
@CSTD(PIQ[Q1Y95],$MYSET) Calculates the standard deviation of pretax income for the 1st quarter of 1995 for the companies in the set MYSET.

393
Chapter 13 Functions
@CSUM - Sum across a set @CSUM(formula, set, [match_formula]) - Sum across a set
Sums the value of a formula across a set. This function returns a decimal.
Examples:
@CSUM(SALE,$MYSET) Sums the annual sales for the companies in the set MYSET.
@CSUM(SALE,@SET($C,SALE>500)) Sums the sales of companies in the active set with annual sales greater than $500 million.
@CWAVG - Weighted average across a set @CWAVG(formulaX, formulaY, set, [match_formula]) - Weighted average across a set
Calculates a weighted (scaled) average of a formula across a set; formulaX is weighted by formulaY. The importance of each set member depends on the value of formulaY, which is used to determine weighting.
@CWAVG returns a value if the following is true:
Number of companies for which both X and Y have a data value >= n/2 where n = the number of companies in the set being evaluated [if the match formula is used n = the number of companies in the set that met the match criterion].
If this criterion is not met, @NC is returned.
Examples:
@CWAVG(PRCCM,MKVALM,$MYSET) Calculates the average price weighted by market value for the set MYSET.
@CWAVG(PI,CSHO,$MYSET) Calculates the average pretax income weighted by common shares outstanding for the set MYSET.
@DATE - Inserts calendar date @DATE (YY,MM,DD) - Inserts calendar date
Inserts a calendar date into a report. Months, days, and years that are a single digit can be expressed as @DATE(95,4,17) or @DATE(95,04,17).
Example:
@DATE(94,12,24) Returns the date 12/24/94.
@SET($C,RDQ=@DATE(94,12,24)) Returns companies with a quarterly report date of 12/24/94.

Research Insight North America Data Guide
394
@DAY - Identifies period day @DAY(period, fiscal year) - Identifies calendar date within period
Returns the last calendar day of the time period. "Calendar day" within Research Insight refers to a Monday through Friday date. The time period can be an absolute or relative day, week, month, quarter, or year. Fiscal Year is an optional parameter that overrides the company’s fiscal year. It is possible to obtain a day that falls on the same date as a holiday in which the markets are closed, such as 1Jan00. In this case, corresponding trading data woud be unavailable or @NM (not meaningful).
Examples:
@DAY(CPDQ) Returns the last business day of the current fiscal quarter.
@DAY(0Y) Returns the last business day of the fiscal year, 0Y.
@DB Return formula from the specified layer @DB(database group layer, formula) Returns the formula from the specified layer of the active database group. Use this function when you know which layer you want to retrieve the formula from.
Important: We recommend that you use this function to target the COMPUSTATDB (core database) database
layer. Specifying a database layer other than the COMPUSTATDB layer may cause adjustment factors to be dropped and may also cause problems with current period alignments.
We also recommend that you use absolute time referencing with this function since daily downloads of quarterly items will affect the current period used in relative time referencing.
Example:
@DB(COMPUSTATDB,SALE[Y99])
Returns the value for SALE from the core database for 1999.
@DESC - Displays descriptions @DESC(value, dict_key,expression) - Displays descriptions
Displays the definition of a code, footnote, or SIC Code in reporting applications.
The following rules apply to the arguments: value is the item that contains a code value; value must be a single mnemonic and cannot contain
other formula components dict_key is optional and is used to specify a particular element for group items expression is optional; if expression is blank, value and expression are assumed to be the same
Examples:
@DESC(SALEF,2) Displays the description of the second element of the footnote, SALEF.
@DESC(SIC) Displays the description of the SIC Code.

395
Chapter 13 Functions
@DESC(EXCHG) Displays the description of the stock exchange of a company (for example, New York Stock Exchange).
@DESC(SPDRM) Displays the description for the S&P Bond Rating code.
@ELEMENT - Specifies Group Item @ELEMENT(item, element) - Specifies group item
Directs a group item to a specific element. This function returns the value of the specified element.
Example:
@ELEMENT(INVVAL,1) Returns the inventory valuation code for the first element. Inventory valuation is a group item containing four codes that correspond to accounting methods.
@ELEMENT(SICALL,2)=1311
Returns the segment SIC code for the second element if the SIC is equal to 1311.
@EXCLUDEDB Exclude Specified Database Layer @EXCLUDEDB(database group layer, formula) Returns the formula from whichever database layer it is found in, but not from the specified layer. Use this function when you’re not sure in which layer the data you want to retrieve is contained.
Important: We recommend that you do not use this function to exclude the COMPUSTATDB (core) database layer. Excluding the COMPUSTATDB layer may cause adjustment factors to be dropped and may also cause problems with current period alignments.
We suggest that you use this function to exclude either the CSUSER, the CLASSIC or the CSPRICE database layer, as in the following example.
Example:
@EXCLUDEDB(CLASSIC,GPMQ[Q2Y99])
Returns the gross profit margin - quarterly item from the first database layer it is found in, excluding the Classic layer, for the second quarter of 1999. Research Insight reads sequentially through the database layers, and it will retrieve a value for GPMQ from the first layer where it finds a value for the specified item.
Note: A time reference is required in order for Research Insight to retrieve the correct data.
@EXP - Exponent @EXP(formula) - Exponent
Calculates the number 2.718 raised to the power specified. This can be any decimal or integer. The result is a decimal. To raise a formula to a power (n), use the mathematical operator " ^ ", such as X ^ n. Note that the operation X ^ n is not a function.
@EXP returns "e" raised to the power of the formula. The number 2.718 is an approximation of "e" which is the base of the natural log.

Research Insight North America Data Guide
396
Note: @EXP is the reverse of @LN.
Examples:
@EXP(1) Returns 2.718^1
@EXP(10) Returns 2.718^10
@EXP(SALE) Returns 2.718^Sale
@EXPSMOOTH - Exponentially Weighted Average @EXPSMOOTH(formula, weight, period1, period2) - Calculates an exponentially weighted average.
This function allows you to apply greater weight to more recent values.
Example:
@EXPSMOOTH(SALE, .9,-4,0)
Returns the exponential average sales for 5 years.
The table illustrates how this example is calculated.
Sales Weighting Factor Sales*Factor
Y96
Y95
Y94
Y93
Y92
8671
5937
4649
3753
2759
1
1*.9
1*.9*.9
1*.9*.9*.9
1*.9*.9*.9
1
0.9
0.81
0.729
0.6561
8671
5343.3
3765.69
2735.937
1810
Total 4.0951
exponential avg. average
22325.93
5451.864
5154
@FIND - Finds a specific value in a text string @FIND(find_text, within_text, start_at) - Finds a specific value in a text string
Searches a textual item beginning at the indicated starting character (start_at) for a specific value. In a screen formula this function returns a company. In a report this function returns the position of the beginning character of the search text.
The following rules apply to the arguments: • The find_text argument must be enclosed in quotes; it will return both upper and lower case instances
of the text string.
• The within_text argument must be a formula that returns a textual value, such as the mnemonic CONM for company name.
• The start_at argument is optional; the default is 1.

397
Chapter 13 Functions
Example:
@FIND("CHEM",CONM) In screening criteria, this returns companies with the characters CHEM anywhere in the company name. In a report formula, this returns a number representing the beginning character position.
For example, in a screen the company Biochem International Inc. would be included in the passed set. The same formula in a report would return the number 4.
@FRAC - Measures relative standing within a set @FRAC(formula, set) - Measures relative standing within a set
Measures the relative standing of a company for a formula in a set as a percentile. This function returns a decimal.
Example:
@FRAC(PI/SALE,$C)>.75 Identifies the companies in the database for which pretax income to sales ratio ranks in the top 25%.
@FORECAST- Returns a predicted value @FORECAST(formula1, period1, period2, period3, [formula2]) - Returns a predicted value.
Calculates a predicted future value based on linear regression of an item’s past values, or based on a linear regression between the two items. You can use this function to predict future sales, inventory requirements or consumer trends.
Example:
@FORECAST(SALE, -11, 0, 1)
Returns next year’s sales based on sales from the last 12 years.
@FORECAST(EPSPX, -11, 0, XRD*1.05, XRD[-1])
Returns forecasted earnings per share when research and development is 5% greater than the current research and development figure. This is based on the relationship between the current earnings per share and research and development expense from one year ago.
@GEO - Returns geographic segment data @GEO(formula,reference) - Returns geographic segment data
Returns data for the referenced geographic segment. For example, for a company that has multiple geographic segments, the reference argument specifies the geographic segment to which the formula applies.
The following rules apply: • reference is optional; the default is 1.
• If you do not specify a geographic segment reference, then the formula value for the first geographic segment is returned.
Example:

Research Insight North America Data Guide
398
@GEO(SALEG,3) Returns geographic sales for the third geographic segment of a company.
@GEO(SALEG,3)[Y98]
Returns geographic sales for fiscal 1998 for a company’s third geographic segment.
@ISMEMBER - Identifies Members of a Set @ISMEMBER(set_formula) - Identifies companies that are members of the specified set.
With this function you can, for example, run a report for the S&P 100 and flag the companies that are also in your portfolio.
Example:
@IF(@ISMEMBER($SP_500), "*","")
In a table report, will print an "*" next to each company that is a member of the S&P 500.
@IF - Returns a value when conditions are met @IF(condition, then_formula, else_formula) - Returns a value when conditions are met.
Provides two data values for an operation with a condition for choosing between them. If the condition is true, then Research Insight uses the first choice; otherwise Research Insight uses the second choice.
Examples:
@IF(SALE<1,0,SALE) If sales are less than $1 million, returns a 0. If sales are greater than or equal to $1 million, then returns sales.
@IF(PEM<=6,PEM,0) If the price to earnings ratio is less than or equal to six, returns the PE ratio; otherwise returns a zero.
@IF(SEQQ>SEQQ[-1],"UP",@IF(SEQQ<SEQQ[-1],"DOWN","NO CHANGE")) Compares the current quarter's stockholders' equity to the previous quarter and will return the word UP is there is an increase, or the word DOWN if a decrease; otherwise returns NO CHANGE. If stockholders' equity is not available for either quarter, the formula cannot be evaluated and Research Insight will display a Not Available Code (@NA) in the report cell.
PIQ[@IF(UPDQ=3,0,@IF(UPDQ[-1]=3,-1,-2))] Returns the current quarter's pretax income if the update code for the quarter indicates that the update is final (3). If not, checks the previous quarter's update code and returns that quarter's pretax income if the update is final; otherwise returns the pretax income from two quarters prior.
@INRANGE - Determines membership in a range @INRANGE(formula, value1, value2) - Determines membership in a range
Determines whether a formula value is within a range of two other values. This function returns a 1 for true or a 0 for false.
Examples:
@INRANGE(MKBK,1.0,2.0) Finds those companies with a market to book ratio between 1.0 and 2.0, (inclusive).

399
Chapter 13 Functions
@INRANGE(SALE[Y94],500,1000) Returns a 1 if 1994 sales were between $500 million and $1 billion, (inclusive).
@INT - Integer @INT(formula) - Integer
Identifies the digits to the left of the decimal in a numerical formula.
Example:
@INT(CHE) This example returns the value of cash and cash equivalents as an integer. For example, if CHE=113.235, then this function returns 113.
@ISAF - Determines annual figure data code @ISAF(formula) - Determines annual figure data code
Determine if a formula is an annual figure data code (@AF).
Example:
@ISAF(DPQ) Returns a 1 if quarterly depreciation is an @AF data code.
@ISCF - Determine combined figure data code @ISCF(formula) - Determines combined figure data code
Determines if a formula is a combined figure data code (@CF).
Examples:
@ISCF(DPQ) Returns a 1 if quarterly depreciation is an @CF data code.
@IF(@ISCF(DPQ),"COMBINED FIGURE",DPQ) If quarterly depreciation is an @CF data code, this function returns the text COMBINED FIGURE; otherwise this function returns the depreciation value.
@ISIF - Determines insignificant figure data code @ISIF(formula) - Determines insignificant figure data code
Determine if a formula is an insignificant figure data code (@IF).
Example:
@ISIF(XRD) Returns a 1 if research and development is an @IF data code.
@ISNA - Determines not available figure data code @ISNA(formula) - Determines not available data code
Determine if a formula is a not available data code (@NA).
Example:
@ISNA(EMP) Returns a 1 if the employees is an @NA data code.

Research Insight North America Data Guide
400
@ISNC - Determines not calculable data code @ISNC(formula) - Determines not calculable data code
Determine if a formula is a not calculable data code (@NC).
Example:
@ISNC(CFL/SALE) Returns a 1 if the cash flow margin is an @NC data code.
@ISNM - Determines not meaningful data code @ISNM(formula) - Determines not meaningful data code
Determine if a formula is a not meaningful data code (@NM).
Example:
@ISNM(CEPS5) Returns a 1 if the 5-year compound growth rate for primary earnings per share is an @NM data code.
@ISS - Returns issue data @ISS(item,reference) - Returns issue data for an item
Returns data for the referenced issue. For example, for a company that has multiple issues of common stock, the reference argument specifies the common stock issue to which the formula applies.
The following rules apply: • reference is optional; the default is 1.
• If you do not specify an issue reference, then the formula value for the first issue is returned.
Example:
@ISS(DSCI,2) Returns the issue description and par value for the second common stock issue of a company.
@ISS(PRCCD,2)[24MAR01]
Returns the issue Price-Close Daily for March 24, 2001 of the second common stock issue of a company.
@ISSF - Determines semiannual figure data code @ISSF(formula) - Determines semiannual figure data code
Determine if a formula is a semiannual figure data code (@SF).
Example:
@ISSF(COGSQ[Q1Y95]) Returns a 1 if quarterly cost of goods sold for 1st quarter 1995 is an @SF data code.
@ISVALUE - Determines existence of data @ISVALUE(formula) - Determines the existence of data
Determine whether data exists for a formula.
Example:

401
Chapter 13 Functions
@ISVALUE(CAPX) Returns a 1 if the item, capital expenditures, contains a value.
@ISXE - Determines not available currency data code @ISXE(formula) - Determines not available currency data code
This function determines when the exchange rate is not available. If the currency exchange rate is not available the function returns a 1.
This function allows you to distinguish between data availability and currency translation availability. When data is not available, the specific item contains a Not Available data code (@NA). When the data cannot be evaluated because the currency translation is unavailable, the specific item returns a Currency Translation Not Available data code (@XE).
Example:
@ISXE(REVT) Returns a 1 if the currency exchange rate is not available to translate Revenue - Total into the target currency.
@LEFT - Returns the leftmost characters in a text string @LEFT(formula, num_count) - Returns the leftmost characters in a text string
Displays the results of a search using the leftmost characters as the criteria of the search. For example, you could search for a company by specifying the first three letters (num_count) of its name. All companies beginning with those three letters will be displayed. This function is not case sensitive.
Example:
@LEFT(CONM,2)="AM" In a screen, this returns all companies that contain AM in the 2 leftmost characters of the company name.
@SET($I,@LEFT(CONM,3)="S&P") In a set formula, this returns indexes that contain S&P in the 3 leftmost characters of the index name.
@LN - Natural log @LN(formula) - Natural log
Calculates the natural log (base e) of any positive numerical formula.
Example:
@LN(PRCCM) Calculates the natural logarithm of monthly closing price.
@LOG - Log @LOG(formula) - Log
Calculates the log (base 10) of any positive numerical formula.
Example:
@LOG(SALE) Calculates the common logarithm of sales.

Research Insight North America Data Guide
402
@MID - Returns the middle characters in a text string @MID(formula, start_at, num_count) - Returns the middle characters in a text string
Displays the results of a search using characters within a search string as the criteria of the search.
The following rules apply to the arguments: • The start_at argument refers to the character at which to begin the search, such as 3 for the third
character.
• The num_count argument specifies the number of characters to include in your search. If num_count is larger than the text returned in the formula value, then the entire text string is evaluated.
An example using this function formula is: @MID(cusip,4,2)="99". This formula looks for any company with the digits 99 in the 4th and 5th position in the CUSIP.
@MNT - Identifies period month @MNT(period, fiscal year) - Identifies period month
Returns the last calendar month of the time period. The time period can be an absolute or relative day, week, month, quarter, or year. Fiscal Year is an optional parameter that overrides the company’s fiscal year.
Examples:
@MNT(Q3Y94) Returns the last month of the third fiscal 1994 quarter.
@MNT(0Q) Returns the last month of the fiscal quarter, 0Q.
@MNT(0Y,6) Returns June as the last month of a company’s fiscal year regardless of the company’s original fiscal year.
@MRALPHA Returns the intercept of the y axis in the multiple regression equation @MRALPHA(period1,period2,formula1[formulaN]…) Returns the intercept of the y axis in the multiple regression equation.
Calculates the value of a in the multiple regression equation: y=a + b1x1 + b2x2 + bnxn . . .
Multiple regression is a tool for examining the relationship between a dependent variable and several independent variables. For example, multiple regression functions can be used to study which of several variables is the best predictor of the price of a stock.
Examples:
@MRALPHA(-5,0,PRCCM,CPI,HOUSE,MKBK)
Returns the stock price for a company that results from the multiple regression of the variables Consumer Price Index, Housing Starts, and Price to Book value.
@MRALPHA(-5,0,PRCCM,SALE,COGS,EPSPX)
Returns the stock price for a company that results from the multiple regression of the variables Sales, Cost of Goods Sold, and Earnings per Share.

403
Chapter 13 Functions
@MRBETA Returns the slope of the line for the specified variable @MRBETA(period1,period2,variable-num,formula1[formulaN]…) Returns the slope of the line for the specified variable in the multiple regression equation.
Calculates the value of b for the specified variable in the multiple regression equation: y=a + b1x1 + b2x2 + bnxn . . .
Multiple regression is a tool for examining the relationship between a dependent variable and several independent variables. For example, multiple regression functions can be used to study which of several variables is the best predictor of the price of a stock.
Examples:
@MRBETA(-14,0,1,PRCCM,CPI,HOUSE,MKBK)
Returns the stock price for a company that results from the multiple regression of the variables Consumer Price Index, Housing Starts, and Price to Book value.
@MRBETA(-14,0,1,PRCCM,SALE,COGS,EPSPX)
Returns the stock price for a company that results from the multiple regression of the variables Sales, Cost of Goods Sold, and Earnings per Share.
@MRCORR Calculates the coefficient of multiple determination (R2) between 3 or more items from a multiple regression equation @MRCORR(period1,period2,variable-num,formula1[formulaN]…) Calculates the coefficient of determination between 3 or more items in the multiple regression equation
Returns the coefficient of determination (R2) of the multiple correlation analysis. In other words, this function calculates how much of the variation in y is explained by the combination of all the independent variables in the multiple regression equation: y=a + b1x1 + b2x2 + bnxn . . .
Multiple regression is a tool for examining the relationship between a dependent variable and several independent variables. For example, multiple regression functions can be used to study which of several variables is the best predictor of the price of a stock.
Examples:
@MRCORR(-14,0,PRCCM,CPI,HOUSE,MKBK)
Indicates how much of the variation in the stock price (PRCCM) is accounted for by the combination of the effect of Consumer Price Index (CPI), Housing Starts (House), and Market to Book (MKBK).
@MRCORR(-14,0,1,PRCCM,SALE,COGS,EPSPX)
Indicates how much of the variation in the stock price (PRCCM) is accounted for by the combination of the company’s Net Sales (SALE), Cost of Goods Sold (COGS), and Earnings per Share (EPSPX).

Research Insight North America Data Guide
404
@MRFSTAT Determines the f-statistic in the multiple regression equation @MRFSTAT(period1,period2,formula1[formulaN]…) Determines the f statistic or the f observed value in the multiple regression equation
Use the f statistic to determine whether the observed relationship between the dependent and independent variables occurs by chance in the multiple regression equation: y=a + b1x1 + b2x2 + bnxn . . .
Multiple regression is a tool for examining the relationship between a dependent variable and several independent variables. For example, multiple regression functions can be used to study which of several variables is the best predictor of the price of a stock.
Examples:
@MRFSTAT(-5,0,PRCCM,CPI,HOUSE,MKBK)
Indicates whether the observed relationship between Price – Close – Monthly and the independent variables (CPI, HOUSE, MKBK) occurs by chance.
@MRFSTAT(-5,0,PRCCM,SALE,COGS,EPSPX)
Indicates whether the observed relationship between Price – Close – Monthly and the independent variables (SALE, COGS, EPSPX) occurs by chance.
@MRSTDERR Calculates the standard error of the y (independent variable) in the multiple regression equation @MRSTDERR(period1,period2,formula1[formulaN]…) Calculates the standard error of the y (independent variable) in the multiple regression equation
Evaluates the quality of the estimated regression equation by measuring the dispersion of observed y values about the regression plane in the multiple regression equation: y=a + b1x1 + b2x2 + bnxn . . .
Multiple regression is a tool for examining the relationship between a dependent variable and several independent variables. For example, multiple regression functions can be used to study which of several variables is the best predictor of the price of a stock.
Examples:
@MRSTDERR(-5,0,PRCCM,CPI,HOUSE,MKBK)
Calculates the variation between the predicted Price – Close – Monthly (PRCCM), resulting from the multiple regression equation, and the actual Price – Close – Monthly.
@NATIVE - Displays data in native currency @NATIVE(formula) - Displays data in native currency
Displays data in native currency, even if you have already selected a currency for translating data using the Currency Translation Command from the Options menu.
Example:
@NATIVE(PRCCM) Displays the monthly closing price in native currency, instead of the currency selected.

405
Chapter 13 Functions
@NOT - Logical NOT @NOT(logical) - Logical NOT
Determines whether the reverse of the condition is true. Returns a 1 if the condition is true, or 0 if false.
Example:
@NOT(STATE=36) This formula finds all companies except those located in New York.
@NTILE - Creates fractiles within a set @NTILE(formula, num_fractiles, set) - Creates fractiles within a set
Divides your frequency distributions into deciles, quartiles, quintiles or a setting that you specify and returns the number of the fractile in which the value for each member of the set lies.
Example:
@NTILE(SALE, 4, $SET1) Creates four fractiles, evaluates the item SALE for every company in the set, and returns a value of "1" for the top quarter companies in the set, a value of 2 for the next quarter, etc.
For quartiles, the 4th quartile range is <25%, the 3rd quartile range is =>25% and <50%, the 2nd quartile range is >=50% and <75%, and the 1st quartile range is >=75%.
@OR - Logical OR @OR(logical, logical) - Logical OR
Determines if either of the logical arguments is true. Returns a 1 if the condition is true, or 0 if false. This function can contain up to 30 logical conditions.
Example:
@OR(SIC=2911,ROA>5)
This formula finds all companies with an SIC Code of 2911 or a return on assets greater than 5%.
@PARM - Displays currency description @PARM( ) - Displays currency description
Displays the currency in which data is displayed in your report. You choose whether to translate data, and if so, into which currency using the Currency Translation Command from the Options menu. If you choose not to translate currency, this function returns "In Native Currency." If you choose to translate data, then that currency description is displayed, such as "In Millions of HONG KONG DOLLARS."
This function has no arguments.
Example:
@PARM( ) Displays the description of the currency you are using to translate data in your report.

Research Insight North America Data Guide
406
@PAVG - Average across time @PAVG(formula, period1, period2) - Average across time
Calculates the average value of a formula over time using those time periods for which data exists. This function returns a decimal.
@PAVG returns a value if the following is true: Number of data values >n/2 where n = the number of time periods being evaluated. If this criterion is not met, @NC is returned.
Examples:
@PAVG(XRD/SALE,Y85,Y94) Calculates the 10-year average R&D to sales ratio.
@PAVG(ROE,-9,0) Calculates the average return on equity over a 10-year period.
@PAVG(SALEQ,IV89,IV94,4) Calculates the average 4th quarter sales from 4th calendar quarter 1989 through 4th calendar quarter 1994. This application might be used to measure performance of a seasonal business, such as retail. Only the 4th calendar quarter of each year will be used in the calculation of average quarterly sales.
@PCGR - Compound growth rate @PCGR(formula, period1, period2) - Compound growth rate
Calculates compound growth rate as the percent change in a formula over a period of time (P1,P2). This function returns a percent.
This calculation returns an annualized number. For example, if you perform a quarter-over-quarter sales percent change, the result will be compounded for 4 quarters.
@PCGR returns a value if the following is true:
Number of data values >= n/2 where n = the number of time periods being evaluated.
If the first or last period have no data available, computes the compound growth rate over the period from the first time for which data is available to the last time for which data is available.
If this criterion is not met, @NC is returned. If the first and last values have opposite signs an @NC is returned.
Examples:
@PCGR(SALEQ,-3,0) Calculates sales growth for the last three quarters.
@PCGR(IB/SALE,Y88,Y94) Calculates a 6-year compound growth rate in net profit margin from 1988 to 1994.
@PCGR((PRCC/PRCC[-1])-1,Y90,Y94) Calculates the compound growth rate of the change in calendar year close price from 1990 to 1994.

407
Chapter 13 Functions
@PCOR - Correlation Coefficient Over Time @PCOR(formulaX, formulaY, period1, period2) - Correlation Coefficient over time
Measures the relationship between 2 formulas over time using a correlation coefficient. This returns a decimal between -1.0 and 1.0, such as .98. A return between 0 and 1.0 indicates a positive correlation; a return between -1.0 and 0 indicates an inverse correlation.
@PCOR returns a value if the following is true: Number of time periods for which both X and Y have a data value >= n/2 where n = the number of time periods being evaluated.
If this criterion is not met, @NC is returned.
Examples:
@PCOR(SALE,PI,-9,0) Calculates the correlation coefficient of sales and pretax income over the last 10 years.
@PCOR(PI,PRCCF,-9,0) Calculates the correlation coefficient of pretax income and fiscal year-end price over the last 10 years.
@PCOR(EPSPXQ,DVPSXQ,Q1Y92,Q4Y94) Calculates the correlation coefficient of quarterly net earnings and quarterly dividends over the 12 fiscal quarters from 1st quarter 1992 to 4th quarter 1994.
@PCOUNT - Count Periods @PCOUNT(formula, period1, period2) - Count periods
Counts the number of periods that contain data for an item over a period of time. This function cannot evaluate an equation, so must be a single item or concept. This function returns an integer.
Examples:
@PCOUNT(DVQ,-11,0) Calculates the number of quarters with a data value for cash dividends paid over the last 12 quarters.
SALE[-@PCOUNT(SALE,-9,0)+1] Counts the number of years sales is available over the last 10 years and returns the oldest number available. If eight years are available, Research Insight counts SALE[-(8)+1] or SALE[-7].
@PDEC - Decrease across time @PDEC(formula, period1, period2) - Decrease across time
Determines the number of occurrences over time where the value of a formula goes down from the immediately previous period. This function returns an integer.
If there are no two consecutive periods with values the function returns a "0".
Examples:
@PDEC(EMP,-6,0) Counts the times the number of employees has decreased from the previous year during the last seven years. This returns a number between zero and six.

Research Insight North America Data Guide
408
@PDEC(EPSPX,-9,0) Returns the number of times primary earnings per share excluding extraordinary items has decreased from the previous year over the last 10 years. This returns a number between zero and nine.
@PDEC(SALE/SALE[-1],-9,0) Returns the number of times the annual sales growth decreased from the previous year over the last 10 years. This returns a number between zero and nine.
@PERCENTILE Determines the Value at a Break Point @PERCENTILE (formula, set, breakpoint) Determines the value at a break point
Returns the data value that lies at a specified break point. If no value lies exactly at the indicated break point, a value is extrapolated.
Example:
@PERCENTILE(PEM,$SP_500,.75)
Returns the Price/Earnings-Monthly for the S&P 500 that lies at the 75th percentile.
@PERIOD - Displays period number @PERIOD(period, fiscal year) - Displays period number
Returns an integer representing the time period. The time period can be an absolute or relative day, week, month, quarter, or year. Fiscal Year is an optional parameter that overrides the company’s fiscal year.
Examples:
@PERIOD(@QTR(0M)) Returns the digit of the quarter in which the month, 0M, falls.
@PERIOD(CPDM) Returns the digit for the most current month on a fiscal year end basis. For a December fiscal year-end company, returns 5 when the current month is May; for an April fiscal year-end company, returns 1 when the current month is May.
@PFIRST Locates First Occurrence of Data @PFIRST (formula, period1, period2) Locates first occurrence of data
Returns the first occurrence of a non-zero data value in a specified time series.
Example:
@PFIRST(SALE,-19,0)
Returns the first net sales figure reported by a company in the last 20 years.
@PFIRST(DVPSXM,-240,0)
Returns the first amount of dividends paid.

409
Chapter 13 Functions
@PFRAC Measures Relative Standing Over Time @PFRAC (formula, period1, period2[, target period]) Measures relative standing over time
Measures relative standing of an item for a company over time as a percentile. This function returns a decimal. "Target period" is optional. If no target period is specified, Research Insight uses the last available period.
Example:
@PFRAC(CHE,-19,0,0)
Shows the relative standing of a company’s current cash and equivalents compared to the past 20 years.
@PFRAC(PRSALEM,-60,0,0)
Shows the relative standing of a company’s current price to sales per share – monthly compared to the past 5 years.
@PFSTPD Locates First Time Period Occurrence of Data @PFSTPD (formula, period1, period2) Locates first time period occurrence of data
Returns the first time period that a non-zero data value occurs in a time series.
Example:
@PFSTPD(DVPSXM>0,-239,0)
Returns the first time period in the last 20 years that a company’s dividend was greater than zero. Since DVPSXM is a monthly item, this function returns a monthly time period.
@PFSTPD(@ISVALUE(DVPSXM),-239,0)
This example identifies the first time period in the last 20 years that any dividend value is reported, including both zero and non-zero values.
@PLAST Locates Last Occurrence of Data @PLAST (formula, period1, period2) Locates last occurrence of data
Returns the last occurrence of a non-zero data value in a specified time series.
Example:
@PLAST(SALE,-19,0)
Returns the last net sales figure reported by a company in the last 20 years.
@PLAST(DVPSXM,-240,0)
Returns the last amount of dividends paid.
@PLASTPD Locates Last Time Period Occurrence of Data @PLASTPD (formula, period1, period2) Locates last time period occurrence of data
Returns the last time period that a non-zero data value occurs in a time series.

Research Insight North America Data Guide
410
Example:
@PLASTPD(DVPSXM>0,-239,0)
Returns the last time period in the last 20 years that a company’s dividend was greater than zero. Since DVPSXM is a monthly item, this function returns a monthly time period.
@PNTILE Creates Fractiles Over Time @PNTILE (formula, tiles, period1, period2[, target period]) Creates Fractiles Over Time
Determines what fractile an item is in for a specified time period. "Target period" is optional. If no target period is specified, Research Insight uses the last available period.
Example:
@PNTILE(PEM,10,-59,0,0)
Determines which decile a company’s current price/earnings ratio is in compared to the past 5 years.
@PRANK Calculates Relative Rank Over Time @PRANK (formula, period1, period2[, target period]) Calculates relative rank over time
Determines the relative rank of an item for one company over a specified time period. "Target period" is optional. If no target period is specified, Research Insight uses the last available period.
Example:
@PRANK(IB,-19,0,0)
Ranks a company’s current income before extraordinary items compared to the past 20 years.
@PGMN - Geometric mean across time @PGMN(formula, period1, period2) - Geometric mean across time
Calculates the geometric mean of a formula value over time. This function returns a decimal.
@PGMN returns a value if the following is true: Number of data values >= n/2 where n = the number of time periods being evaluated. If this criterion is not met, @NC is returned.
Examples:
@PGMN(SALEQ,I93,IV94) Calculates the geometric mean sales across eight calendar quarters.
SALE>@PGMN(SALE,Y90,Y94)*1.10
If you use this formula in a screening criterion, Research Insight finds all companies whose current annual sales is 10% greater than its geometric mean of sales from 1990 to 1994.
@PINC - Increase across time @PINC(formula, period1, period2) - Increase across time

411
Chapter 13 Functions
Determines the number of occurrences over time where the value of a formula goes up from the immediately previous period. This function returns an integer.
If there are no two consecutive periods with values the function returns a "0".
Examples:
@PINC(SALE,-5,0) Counts the number of times sales has increased from the previous year during the last six years. This returns a number between zero and five because there is a maximum of five intervals in six years.
@PINC(MKBK,JUN90,DEC94) Counts the number of times the monthly market to book ratio increased from June 1990 through December 1994.
@PINC(CEQQ,-7,0) Counts the number of times quarterly common equity increased in the last eight quarters. This returns a number between zero and seven. If you use this formula in a screening criterion, type 7 in the minimum column to find companies that had seven increases in eight quarters.
@PLSG - Least squares growth rate @PLSG(formula, period1, period2) - Least squares growth rate
Calculates the percent change in a formula over time (P1,P2), using a least squares regression line. This function returns a percent.
Examples:
@PLSG(SALEQ,Q4Y92,Q4Y94) Calculates quarterly sales growth for the seven quarterly periods between 4th quarter 1992 and 4th quarter 1994.
@PLSG(SALEQ,Q4Y88,Q4Y94,4) Calculates sales growth every 4th quarter from 4th quarter 1988 to 4th quarter 1994.
@PLSG(EPSPX,-3,0) Calculates earnings per share growth for the last three years.
@PLSGR - Fit of least squares growth rate @PLSGR(formula, period1, period2) - Fit of least squares growth rate (R-squared, coefficient of determination)
Returns the fit of the least squares regression line to a formula over time (P1,P2). This function returns a decimal between 0 and 1.0.
Examples:
@PLSGR(SALE,-3,0) Calculates fit of sales growth for three years.
@PLSGR(SALEQ,Q4Y92,Q4Y94) Calculates fit of sales growth for seven quarterly periods from 4th quarter of 1992 to 4th quarter of 1994.
@PMAX - Maximum value across time @PMAX(formula, period1, period2) - Maximum value across time
Determines the largest value of a formula over time. This function returns a decimal.
Examples:

Research Insight North America Data Guide
412
@PMAX(CFL/CSHO,Y87,Y94) Finds the largest value of cash flow per share over the 8-year period from 1987 to 1994.
@PMAX(PEM,-11,0) Finds the largest value for monthly price to earnings ratio for the last 12 months.
@PMAXPD - Period for maximum value @PMAXPD(formula, period1, period2) - Period for maximum value across time
Returns the period for the largest value of a formula over time.
Examples:
@PMAXPD(ROEQ,-7,0) Identifies the period in which the highest quarterly return on equity occurs over the last eight quarters.
@PMAXPD(SALE,Y89,Y94) Returns the year in which the largest value for sales occurs between 1989 and 1994.
@PMED - Median value across time @PMED (formula, beginning period, ending period) - Median value across time
Returns the median value of a formula over time. To find the median value you must first array the values in ascending or descending order. To find the position of the median value, apply the formula below:
n / 2 + ½
n = number of observations
With an even number of observations, the formula will return a result with a fractional remainder. This indicates that the median lies between two values. In this case a median can be calculated. In Sample 2, the median is at position 3.5, or between the values 4 and 5. When this occurs, the median can be calculated by averaging the two middle observations.
Sample 1 Sample 2
1 1
3 3
4 4
5 5
9 7
9
N = 5 6
Median Position = 3 3.5
Median Value = 4 4.5

413
Chapter 13 Functions
@PMED returns a value if the following is true: Number of data values >n/2 where n = the number of time periods being evaluated. If this criterion is not met, @NC is returned.
Example:
@PMED (PRCCM,-239,0) Returns the median monthly close price over 20 years.
@PMEDPD - Period for median value @PMEDPD (formula, beginning period, ending period) - Period for median value
Returns the time period associated with the middle value in an array of numbers. For information on how to calculate the median, see @PMED - Middle value across time.
The periodicity is based on the item being evaluated in the formula. If there are an even number of observations, @PMEDPD will return the time period associated with the higher of the two middle values.
@PMEDPD returns a value if the following is true: Number of data values >n/2 where n = the number of time periods being evaluated. If this criterion is not met, @NA is returned.
Example:
@PMEDPD (PRCCD,-150,0) Returns the date associated with the median value for Daily Close Price.
@PMIN - Minimum value across time @PMIN(formula, period1, period2) - Minimum value across time
Determines the smallest value of a formula over time.
Examples:
@PMIN(ROA,-4,0) Returns the smallest value of return on assets for the last five fiscal years.
@PMIN(PRCLM,OCT93,SEP94) Finds the lowest monthly closing price for October 1993 through September 1994.
@PMIN(PRCCM/EPSX12[@QTR(-2M)],-23,0,3) Calculates the minimum value of price to earnings ratio for the first month of each quarter over the last 24 months. The monthly price to earnings ratio from every 3rd month will be evaluated in the identification of the minimum value over a 2-year period.
@PMINPD - Period for minimum value @PMINPD(formula, period1, period2) - Period for minimum value across time
Returns the period for the smallest value of a formula over time.
Examples:

Research Insight North America Data Guide
414
@PMINPD(MKBK,SEP93,SEP94) Returns the month in which the smallest market to book ratio occurs between September 1993 and September 1994.
@PMINPD(SALE,-4,0) Returns the year in which the smallest sales occurs in the past five years.
@PPROD - Multiplication across time @PPROD(formula, period1, period2) - Multiplication across time
Calculates the product of a formula multiplied over time. This function returns a decimal.
If no values are found for any period, the function returns a "1".
Example:
@PPROD(EPSPXQ,Q1Y94,Q1Y95) Multiplies earnings per share quarterly from 1st quarter of 1994 to 1st quarter of 1995.
@PSTD - Standard deviation @PSTD(formula, period1, period2) - Standard deviation
Measures the standard deviation of a formula value over time. This function returns a decimal.
@PSTD returns a value if the following is true: Number of data values >= n/2 where n = the number of time periods being evaluated. If this criterion is not met, @NC is returned.
Examples:
@PSTD(XRD/SALE,Y85,Y94) Calculates the standard deviation of R&D to sales from 1985 to 1994.
@PSTD(ROE,-4,0) Calculates the standard deviation of return on equity over the last five years.
@PSTD(SALEQ,I92,IV94) Calculates the standard deviation of quarterly sales from the 1st calendar quarter of 1992 to the 4th calendar quarter of 1994.
@PSUM - Sum across time @PSUM(formula, period1, period2) - Sum across time
Sums the value of a formula over time. Items containing a data code for a period are excluded from the calculation.
Examples:
@PSUM(DVC,Y83,Y94) Calculates total common dividends paid from 1983 to 1994.
@PSUM(@IF((SALE/SALE[-1])>1.1,1,0),-5,0) Calculates the number of times sales increased by more than 10% in the last six years. This returns a number between zero and six.

415
Chapter 13 Functions
@PSUM(IBQ+DPQ,-3,0) Calculates cash flow over the most recent four quarters.
@PWAVG - Weighted average across time @PWAVG(formulaX, formulaY, period1, period2) - Weighted average across time
Calculates a weighted average of a formula across time. The importance given to each period depends on the value of another formula (Y). This function returns a decimal.
@PWAVG returns a value if the following is true: Number of periods for which both X and Y have a data value >=n/2 where n = the number of time periods being evaluated.
If this criterion is not met, @NC is returned.
Examples:
@PWAVG(XRD/SALE,SALE,Y85,Y94) Calculates the 10-year average R&D to sales ratio from 1985 to 1994 weighted by annual sales.
@PWAVG(SALEQ,COGSQ,-7,0) Calculates the 2-year average quarterly sales weighted by quarterly cost of goods sold.
@PWAVG(PRCCM,MKVALM,-11,0) Calculates the average monthly close price over the last year weighted by market value.
@QTR - Identifies fiscal period quarter @QTR(period, fiscal year) - Identifies fiscal period quarter
Returns the last fiscal quarter of the time period. The time period can be an absolute or relative day, week, month, quarter, or year. Fiscal Year is an optional parameter that overrides the company’s fiscal year.
Examples:
@QTR(11NOV94) Returns the quarter in which November 11, 1994 falls.
@QTR(-2M) Returns the quarter in which the month, -2M, falls.
@RANK - Ranks order within a set @RANK(formula, set) - Ranks order within a set
Determines the relative rank of a company for a formula within a set. Companies are ranked in descending order with data codes placed at the end. This function returns an integer. @RANK screening results return in alphabetical order of the companies.
Examples:
@RANK(MKVAL,$SP_500) Ranks companies in the $SP 500 based on market value.

Research Insight North America Data Guide
416
@RANK(CSHO*-1,$C)<=100 Ranks all companies in the database based on common shares outstanding and returns the bottom 100 companies. (Multiplying shares outstanding by –1 reverses the order of the CSHO values, bringing the lowest ranked companies to the top of the list.)
@RIGHT - Returns the rightmost characters in a text string @RIGHT(formula, num_count) - Returns the rightmost characters in a text string
Displays the results of a search using the rightmost characters as the criteria of the search. For example, you could search for a company by specifying the last three letters (num_count) of its name. All companies ending with those three letters will be displayed. This function is not case sensitive.
Example:
@RIGHT(CONM,3)="ADR" In screening criteria, this returns companies with the letters ADR appearing in the rightmost characters of the company name.
@RND - Round @RND(formula) - Round
Rounds to the nearest whole number of a formula.
Examples:
@RND(SALE) Rounds sales to the nearest whole number.
@RND(CSHOQ*PRCCM) Rounds the product of quarterly common shares outstanding and monthly price to the nearest whole number.
@RND(452.5) Rounds the number to the nearest whole number, 453.
@SCALE - Returns data in millions @SCALE(formula) - Returns data in millions
Returns units of representation for data in millions. This function is useful for scaling those currencies presented in Research Insight in billions of currency units, such as the Japanese Yen or Italian Lira. Most other currencies are already presented in millions of currency units.
Example:
@SCALE(CEQ)/CSHO Changes common equity to millions, then divides it by shares outstanding which is already in millions. If data for the company is already presented in millions of currency units, then the currency units remain in millions.
@SEG - Returns business segment data @SEG(formula,reference) - Returns business segment data
Returns the data for the referenced business segment. For example, for a company that has multiple business segments, the reference argument specifies the business segment to which the formula applies.
The following rules apply:

417
Chapter 13 Functions
• reference is optional; the default is 1.
• If you do not specify a business segment reference, then the formula value for the first business segment is returned.
Example:
@SEG(SALES,4) Returns business segment sales for the fourth business segment of a company.
@SEG(SALES,4)[Y98]
Returns business segment sales for fiscal 1998 for a company’s fourth business segment.
@SET - Selects companies based on condition @SET(base_set, logical) - Selects companies based on condition
Creates a temporary set by evaluating the base set for the condition. This function is commonly used with Set Analysis functions.
Examples:
ROE>=@CAVG(ROE,@SET($C,SIC=@CHGCO(COMPANY):SIC)) Evaluates Return on Equity for a company and compares it to the average Return on Equity for all companies with the same SIC Code.
@SET($C,@AND(BETA<1,SALE>200)) Creates a set of companies with a Beta less than 1 and annual sales greater than $200 million.
@SIC2 and @SIC3 - Generalize SIC codes @SIC2(sic_code) and @SIC3(sic_code) - Generalize SIC codes
Provides progressively more general SIC categories. For example, @SIC2 generalizes the SIC code of 2834 to the first 2 digits, or 2800. These functions return a set of companies in screening, and an SIC code or an integer in reporting applications.
Examples:
@SIC2(SIC)=3500 If you use this formula in a screening criterion, it identifies companies with 35 as the 1st two digits in their SIC Code.
@SET($C,@SIC3(SIC)=@SIC3("MSFT":SIC)) Identifies all companies with the same 1st three digits in their SIC Codes as Microsoft Corp.
@SQRT - Square root @SQRT(formula) - Square root
Calculates the square root of any positive numerical formula.
Example:
@SQRT(144) Calculates the square root of 144; the result is 12.
@STDS Standard Deviation for a Sample of a Population @STDS(formula, set, [match_formula]) Standard deviation for a sample of a population

Research Insight North America Data Guide
418
Calculates the standard deviation for a sample set of the entire population.
Example:
@STDS(SALE, $MYSET)
Calculates the standard deviation for net sales for $MYSET, when $MYSET is a subset of the whole population.
@TEXT - Returns a string of characters @TEXT(formula, format, width) -Returns a string of characters
Returns the value of an expression as a character string. The format argument is optional; you can specify standard formats such as ###0.000.
Example:
@TEXT(SALE,"###0.00",12) Evaluates a string of up to 12 characters (including placeholders such as commas and periods) and returns a company’s sales in the format specified.
@TRIMPCT - Trim Outlying Values (Percent) @TRIM%(formula, percentage) - Trims outlying values based on a percentage.
This function helps prevent outlying values from distorting an average.
Example:
@CAVG(PEM,@SET($SP_500,@TRIMPCT(PEM,5)))
Returns average Price/Earnings ratio for the S&P 500, excluding values for companies that are within the top or bottom 5 percent.
@CAVG(ROE,@SET($SP_Super,@TRIMPCT(ROE,1))
For example, say that the average ROE for the S&P Supercomposite is 9.4. This average is distorted by a few outlying values; one company’s ROE is over 4000 and another company’s ROE is below -7000. By trimming off just 1% of the values, the average ROE for the S&P Supercomposite is 11.5.
@TRIMSTD - Trim Outlying Values (Standard Deviation) @TRIMSTD(formula, trim_factor) - Trims outlying values based on standard deviation.
This function helps prevent outlying values from distorting an average.
Example:
@IF(@TRIMSTD(ROE,2), " ","*" )
Returns a "*" for each company whose Return on Equity is more than 2 standard deviations away from the base set’s mean. The "*" lets you identify the outliers.
@CAVG(PEM,@SET($SP_500,@TRIMSTD(PEM,3)))
Returns the average Price/Earnings ratio for the S&P 500, excluding values for companies that are more than 3 standard deviations away from the base set’s mean.

419
Chapter 13 Functions
@VALUE - Generates a data value @VALUE(formula1, formula2) - Generates a data value
Returns a value for formula1. If there is no value for formula1, then returns the value for formula2.
Examples:
@VALUE(PRCCD,PRCCM)/EPSX12 Divides daily closing price by 12-months moving earnings per share. If daily closing price is not available, divides monthly close price by 12-months moving earnings per share.
@VALUE(DPQ,DPQ[-1],DPQ[-2],DP)
Returns the most recent Depreciation and Amortization - Quarterly from the last 3 quarters; if no quarterly figure is available, returns the annual figure for Depreciation and Amortization.
@WK - Identifies period week @WK(period, fiscal year) - Identifies period week
Returns the last calendar week of the time period. The time period can be an absolute or relative day, week, month, quarter, or year. Fiscal Year is an optional parameter that overrides the company’s fiscal year.
Examples:
@WK(11NOV94) Returns the week in which November 11, 1994 falls.
@WK(0Q) Returns the week of the quarter, 0Q.
@YR-Identifies Fiscal Period Year @YR(period, fiscal year) - Identifies fiscal period year
Returns the fiscal year of the time period. The time period can be an absolute or relative day, week, month, quarter or year. Fiscal Year is an optional parameter that overrides the company’s fiscal year.
Examples:
@YR(OCT94) Returns the fiscal year in which October 1994 falls.
@YR(-3M) Returns the fiscal year in which the month, -3M, falls.
ALPHA Calculation
Y - b X

Research Insight North America Data Guide
420
Y = 1st variable
X = 2nd variable
b = Beta (slope)
BETA Calculation n xy x y
n x x
∑ − ∑ ∑
∑ − ∑
( )( )
( )2 2
x = 1st variable
y = 2nd variable
n = number of observations
Σ = sum
Calculation of Standard Deviation for a Sample of the Population
( )x
X2
2
∑ ∑
−
-N
N 1
X = 1st variable
N = number of observations
Σ = Sum
Compound Growth Rate Calculation
( )XNX
PN
11 100
1⎛
⎝⎜
⎞
⎠⎟
⎛
⎝
⎜⎜⎜⎜
⎞
⎠
⎟⎟⎟⎟
−
⎡
⎣
⎢⎢⎢⎢
⎤
⎦
⎥⎥⎥⎥
∗ −⎛⎝⎜
⎞⎠⎟∆
*
X = 1st variable

421
Chapter 13 Functions
P = periodicity (12 for monthly, 4 for quarterly, and 1 for annual)
N = number of observations
∆ = time counter, i.e., @PCGR(SALE,-11,0,4) = 4
Correlation Coefficient Calculation
( ) ( )
Σ Σ Σ
Σ Σ Σ Σ
XY X YN
YYN X
XN
−
− −
*
*22
22
X = 1st variable
Y = 2nd variable
N = number of observations
Σ = sum
Fit of Least Squares Growth Rate Calculation
( )( )
( ) ( )⎟⎟⎟
⎠
⎞
⎜⎜⎜
⎝
⎛ Σ−Σ
⎟⎟⎟
⎠
⎞
⎜⎜⎜
⎝
⎛ Σ−Σ
⎟⎟⎟
⎠
⎞
⎜⎜⎜
⎝
⎛ ΣΣ−Σ
⎟⎠⎞⎜
⎝⎛⎟
⎠⎞⎜
⎝⎛
⎟⎠⎞
⎜⎝⎛ ⎟
⎠⎞⎜
⎝⎛
N
2XLOG2XLOG*N
2T2T
2
NXLOG*T
XLOG*T
X = 1st variable
N = number of observations
T = time
Σ = sum
Forecast Calculation Forecast=a+bx where:

Research Insight North America Data Guide
422
a = Y - b X
and:
b n xy x yn x x
= ∑ − ∑ ∑∑ − ∑
( )( )( )2 2
x = 1st variable
y = 2nd variable
n = number of observations
Σ = Sum
Geometric Mean Calculation
Actual Calculation Performed: Can also be calculated as:
ANTILOG
ΣLOG XN
⎛⎝⎜
⎞⎠⎟⎛
⎝⎜⎞⎠⎟
X X X X
NN
1 2 3* * K
X = 1st variable
N = number of observations
Σ = sum
Note: The antilog of a number, using base 10 logs, is 10^number
Least Squares Growth Rate Calculation
( )( )Β
ΣΣ Σ
Σ Σ=
−
−
⎛⎝⎜
⎞⎠⎟
⎛⎝⎜
⎞⎠⎟
⎛⎝⎜
⎞⎠⎟
T LOG XT LOG X
N
TTN
**
22

423
Chapter 13 Functions
GROWTH RATE = ( )( )ANTILOG B P* *∆ − 1 100
X = 1st variable
N = number of observations
Σ = Sum
P = periodicity (12 for monthly, 4 for quarterly, and 1 for annual)
B = Beta (slope)
T = time counter
Note: The antilog of a number, using base 10 logs, is 10 ^number
Multiple Regression Alpha Calculation
X1,
X2
Observed values of the two independent variables (for a multiple regression equation with two independent variables)
Y Observed value of the dependent variable
B1,B2 Multiple Regression Beta Calculation
Multiple Regression Beta Calculation
X1, X2 Observed values of the two independent variables (for a multiple regression equation with two independent variables)
Y Associated observed values of the dependent variable
Y Average value of the dependent variable
N Number of observations

Research Insight North America Data Guide
424
Multiple Regression Standard Error Calculation
standard error = KnYY′−
−∑ 2)ˆ(
Y Observed value of the dependent variable
Y Predicted value of the dependent variable
K Number of independent variables
N Number of observations
R2 Coefficient of Multiple Determination Calculation
R2= ∑∑
−
−2
2
)(
)ˆ(
YY
YY
Y Observed value of the dependent variable
Y Predicted value of the dependent variable
Y Average value of the dependent variable
R2 Correlation Coefficient
r n X X n Y Yn XY X Y
= ∑ − ∑ ∑ − ∑∑ − ∑ ∑
[ ( ) ][ ( ) ]( ) ( )( )
2 2 2 2
x = 1st variable
y = 2nd variable
n = number of observations
Σ = Sum

425
Chapter 13 Functions
Standard Deviation Calculation
Σ Σx
xN
N
22
−⎛⎝⎜
⎞⎠⎟
X = 1st variable
N = number of observations
Σ = Sum
Weighted Average Calculation
ΣΣXY
Y
X = 1st variable
Y = 2nd variable
Σ = sum


427
Chapter 14 Geographic Areas
Geographic Areas
A geographic segment is a defined region, territory or area for which a company reports financial results.
Geographic Segment Items
Data Item Mnemonic . . . page Availability Code AVLG . . . 479 Capital Expenditures CAPXG . . . 479 Depreciation, Depletion and Amortization
DPG . . . 480
Foreign Sales - Total as % of Sales TFSALEP . . . 366 Foreign Sales - Total TFSALE . . . 480 Geographic Area Code GAREAG . . . 481 Geographic Segments - Actual Number
GEONUM . . . 481
Identifiable Assets IAG . . . 483 Identification Code GID . . . 480 Operating Profit OPG . . . 483 Sale - Aggregate Export SALEXG . . . 484 Sales (Net) SALEG . . . 485 Source Code SRCG . . . 487 Update Code UPDG . . . 487
CHAPTER 14


429
Chapter 14 Geographic Areas
Data Definitions
Availability Codes - Geographic Mnemonic AVLG
Units Code
This code indicates the status of a geographic segment for a company. A code of 1 indicates that information is available for the specified time period. The available codes are:
Code Description
0 Not a reporting category
1 Available
The descriptions for these codes can be viewed by choosing the Databases » Descriptions command from the menu bar and entering the mnemonic in the Item text box. To include a textual description of a code in a report, you can use the @DESC function. For example, to include a description of the availability code, type @DESC (AVLG).
For user-created data the appropriate availability code will be set to 1.
Capital Expenditures - Geographic Segment Mnemonic CAPXG
Units Millions of dollars
This item represents the funds used for additions to the geographic segment's property, plant and equipment, excluding amounts arising from acquisitions (for example, fixed assets of purchased companies).
Capital Expenditures - Geographic Segment - Note Mnemonic CAPXGF
Code Description QB Net of current year's retirements and disposals CH Includes acquisition amounts
Depreciation, Depletion, and Amortization - Geographic Segment Mnemonic DPG
Units Millions of dollars

Research Insight North America Data Guide
430
This item represents non-cash charges for obsolescence and wear and tear on property, allocation of the current portion of capitalized expenditures, and depletion charges for the geographic segment.
Foreign Sales - Total Mnemonic TFSALE
Concept Calculation @CSUM(SALEG,@SET(@CHGCO(GEO), GAREAG=98))
This concept sums Net Geographic Sales for the set of all geographic segments with a Geographic Segment Area Code of 98, or all foreign segments.
Foreign Sales - Total as a Percentage of Sales Mnemonic TFSALEP
Concept Calculation @CSUM(SALEG,@SET(@CHGCO (GEO),GAREAG=98))/SALE*100
This concept sums Net Geographic Sales for the set of all geographic segments with a Geographic Segment Area Code of 98 (all foreign segments), and divides it by Net Sales. This result is then multiplied by 100.
Identification Codes - Geographic Mnemonic GID
This code identifies the company or industry’s geographic segment. This item cannot be edited.
If you add a geographic area for a company, Research Insight will assign the Identification Code based on the company ticker. For example:
Company Ticker Identification Code
SLE\G07 GID = 07
Geographic Segments - Actual Number Mnemonic GEONUM
This two-digit code indicates how many geographic segments collected by Standard & Poor's are available for the company in the given data year. Since each company may have up to five geographic segments per year, the GEONUM variable will contain values from 1 to 5.
Geographic Segment Area Code(s) Mnemonic GAREAG

431
Chapter 14 Geographic Areas
Units Code
This five-element group item contains up to five geographic area codes for each of up to five geographic segments for any year. These codes represent geographic regions in which a company has foreign operations and/or significant sales/service offices. The regions are those reported by the company. The codes are:
Code Geographic Area
10 Africa
11 South Africa
20 Asia
21 Japan
22 Philippines
23 Middle East
30 Europe
31 Great Britain
32 France
33 Germany
40 Pacific
41 Australia
50 South America
51 Brazil
60 North America
61 United States
62 Canada
63 Mexico
70 Domestic
80 Foreign Countries
98 Total Foreign (applies to the first element of the last geographic segment for any year)
99 Foreign
Special Codes 70 Represents the domestic operations of a company
Note: Domestic operations are defined as operations located in the country of incorporation.
80 Assigned to a geographic area that is identified by the company only as Other Foreign operations. For example if a company reports data for Domestic, Europe and Other Foreign, the Other Foreign data is assigned an 80 code.

Research Insight North America Data Guide
432
98 The sum of all foreign operations is provided in the first element of the last geographic segment for any year. If reported domestic operations include any foreign operations, this sum will not be calculated.
99 Assigned to a geographic area that is identified by the company as the only foreign operation. For example, if a company reports data for Domestic ad Foreign, the Foreign data is assigned a 99 code.
Note: Data for this region will be identical to data in the last segment for that year (code 98).
Combined Geographic Regions-some companies report data for a geographic segment comprised of several geographic regions. In those cases, Standard & Poor's will assign up to five regional codes that represent the segment as reported by the company.
Example: A company incorporated in the U.S. reports three geographic segments:
Segment 1 As Reported
GAREAG Element
GAREAG Code
GAREAG Description
U.S. Operations 1 70 Domestic
2
3
4
5
Segment 2 As Reported
GAREAG Element
GAREAG Code
GAREAG Description
England and Italy 1 70 Great Britain
2 30 Europe
3
4
5
Segment 3 As Reported
GAREAG Element
GAREAG Code
GAREAG Description
Other Foreign Countries
1 80 Foreign Countries
2 30
3
4

433
Chapter 14 Geographic Areas
5
Segment 4 Provided by S&P
GAREAG Element
GAREAG Code
GAREAG Description
England and Italy 1 98 Total Foreign
2
3
4
5
In Segment 2, Standard & Poor's assigns a 30 combination code (Europe) since the geographic area as reported contains more than one specific area (both England and Italy).
Identifiable Assets - Geographic Segment Mnemonic IAG
Units Millions of dollars
Identifiable Assets are the tangible and intangible assets that are used by, or directly associated with, each geographic segment.
Operating Profit - Geographic Segment Mnemonic OPG
Units Millions of dollars
Operating Profit is sales of the identified geographic area segment minus its allocated share of operating costs and expenses, such as, cost of goods sold; selling, general, and administrative expenses, and depreciation, depletion and amortization.
This item excludes ... 1. Revenues which are earned at the corporate level and are not derived from the operations of any
geographic segment
2. General corporate expenses
3. Interest expense
4. Domestic and foreign income taxes
5. Equity in income or loss from unconsolidated subsidiaries
6. Gain or loss on discontinued operations
7. Extraordinary items
8. Minority interest
9. The cumulative effect of a change in accounting principles

Research Insight North America Data Guide
434
Differences which exist between the data as reported by the company and the Compustat® definition will be indicated by a footnote.
Operating Profit - Geographic Segment - Note Mnemonic OPGF
Code Description MA Net of income taxes MB Pretax income
Sale - Aggregate Export - Geographic Segment Mnemonic SALEXG
Units Millions of dollars
This item represents the revenue generated by the export of domestically produced goods and/or services provided by domestic offices for companies, export sales represent sales to customers from outside of its home country.
Sales (Net) - Geographic Segment Mnemonic SALEG
Units Millions of dollars
This item consists of the geographic segments gross sales (the amount of actual billings to customers for regular sales completed during the period) reduced by cash discounts, trade discounts, and returned sales and allowances for which credit is given to customers. Sales - Aggregate Export are included in the domestic sales figure.
Differences which exist between the data as reported by the company and the Compustat® definition will be indicated by a footnote.
This item includes ... 1. Any revenue source that is expected to continue for the life of the company
2. Other operating revenue
3. Installment sales
4. Franchise sales (when corresponding expenses are available)
This item excludes ... 1. Nonoperating income
2. Interest income
3. Equity in earnings of unconsolidated subsidiaries

435
Chapter 14 Geographic Areas
4. Other income
5. Rental income
6. Gain on sale of securities of fixed assets
7. Discontinued operations
8. Excise taxes
9. Royalty Income
Special cases (by industry) ... 1. Oil and extractive companies:
Mineral royalty income is included in sales
Sales (Net) are after deducting excise taxes
2. Retail companies: Sales (Net) includes sales of leased departments, when corresponding costs are available and are included in operating expenses which are reported by the company.
3. Shipping companies:
Includes income on reserve fund securities, when it is reported as a separate item in the company's financial statements
Includes operating differential subsidies
4. Finance companies:
Sales is after deducting net losses on factored receivables purchased
Includes earned insurance premiums and interest income
Includes interest income
5. Airline companies: Includes net mutual aid assistance and federal subsidies
6. Insurance companies: Sales (Net) is total income
7. Advertising companies: Sales (Net) are commissions earned, not gross billings
8. Leasing companies: Includes rental or leasing income
10. Security brokers: Includes other income
11. Franchise companies: Includes franchising and licensing fees
12. Hospitals: Sales is net of provision of contractual allowances (will sometimes include doubtful accounts)
13. Cigar, cigarette, rubber and liquor companies: Excludes excise taxes
Sales (Net) - Geographic Segment - Note Mnemonic SALEGF

Research Insight North America Data Guide
436
Code Description BA Includes excise taxes BB Includes other income/excludes some operating
revenues BS Combination of BA and BB DB Some or all data is Not Available due to a fiscal year
change EN Includes inter-company sales HG Excludes other operating income HH Includes unconsolidated subsidiaries HK Unaudited data HL Geographic areas are based on market locations HM Combination of EN and HL UA Combination of EN and BA UB Combination of BB and EN YA Combination of HK and BB YB Combination of HK and HG YC Combination of HK and EN YD Combination of HK and BA YE Combination of HK and BS YF Combination of HK and UA YG Combination of HK and UB
Source Code - Geographic Segment Mnemonic SRCG
Units Code
This item is a two-digit code which indicates the most recent source, or combination of sources, from which Standard & Poor's obtained this data.
The codes are as follows:
Code Source
3 Annual Report/Auditor's Report
4 Uniform Statistical Report (USR)
5 10-K/20-F
9 Annual Report (Summary Annual Report)
13 Annual Report + Statistical Supplement
14 10-K + Statistical Supplement
15 Annual Report + 10-K + Statistical Supplement
37 Prospectus

437
Chapter 14 Geographic Areas
43 Annual Report + USR
53 Annual Report + 10-K
54 10-K + USR
55 Annual Report + 10-K + USR
56 Annual Report + 10-K + USR + Statistical Supplement
Update Code - Geographic Segment Mnemonic UPDG
Units Code
An Update Code is provided for each industry segment and geographic segment and may be either 1, 2, or 3.
Code Update
1 Data is not yet available for the year because the company has changed its fiscal year end
2 Data has been updated from a preliminary source, but some data is still Not Available that is expected to become available or has historically been available
3 Data has been updated from the final source or sources and no further data will be available for that year


439
Chapter 15 Index Fundamentals
Index Fundamentals
Index Fundamentals integrates S&P Index data with Research Insight, allowing you to create benchmarks to compare to your target companies and to search out industries that are high performers. Index Fundamental data provides you with fundamental financial data (i.e. Sales, Cost of Goods Sold, etc.), per share data and ratios for the S&P Indexes. Index Fundamental Data is information that is calculated by taking an item for each of the companies in an S&P Major Index or S&P Industry Index, summing that value and dividing this number by S&P’s base Divisor. All these values have been pre-calculated for quicker access and easier use.
For example, to generate an Index Sales number for the Auto Parts & Equipment Industry Index, the 1996 Sales for the companies in the group would be summed and then divided by S&P’s base divisor for the Auto Parts & Equipment Index.
Index Fundamental Data Items Index Fundamental data is calculated for the S&P 500, S&P MidCap 400, S&P SmallCap 600, and S&P 1500 Super Composite, and all available S&P Industry Indexes for the following data items:
Balance Sheet
Data Item Mnemonic Type of Calculation
Cash Equivalents - Annual CHE Non-Share Item
Cash Equivalents - Quarterly CHEQ Non-Share Item
Total Receivables - Annual RECT Non-Share Item
Total Receivables - Quarterly RECTQ Non-Share Item
Inventories - Annual INVT Non-Share Item
Inventories - Quarterly INVTQ Non-Share Item
Other Current Assets - Annual ACO Non-Share Item
Other Current Assets - Quarterly ACOQ Non-Share Item
Total Current Assets - Annual ACT Non-Share Item
Total Current Assets - Quarterly ACTQ Non-Share Item
Income Tax Refund - Annual TXR Non-Share Item
Net PP&E - Annual PPENT Non-Share Item
Net PP&E - Quarterly PPENTQ Non-Share Item
Investments & Advancements to Uncons. Subs. - Annual
IVAEQ Non-Share Item
Intangibles - Annual INTAN Non-Share Item
CHAPTER 15

Research Insight North America Data Guide
440
Other Assets - Annual AO Non-Share Item
Other Assets - Quarterly AOQ Non-Share Item
Total Assets - Annual AT Non-Share Item
Total Assets - Quarterly ATQ Non-Share Item
Adjustment Factor - Annual AJEX Per-Share Item *
Adjustment Factor - Quarterly AJEXQ Per-Share Item *
Current Portion of LTD - Annual DLC Non-Share Item
Current Portion of LTD - Quarterly DLCQ Non-Share Item
Debt Due in One Year Current Portion of LTD
DD1 Non-Share Item
Notes Payable - Annual NP Non-Share Item
Accounts Payable - Annual AP Non-Share Item
Accounts Payable - Quarterly APQ Non-Share Item
Income Tax Payable - Annual TXP Non-Share Item
Income Tax Payable - Quarterly TXPQ Non-Share Item
Accrued Expense - Annual XACC Non-Share Item
Other Current Liabilities - Annual LCO Non-Share Item
Other Current Liabilities - Quarterly LCOQ Non-Share Item
Total Current Liabilities - Annual LCT Non-Share Item
Total Current Liabilities - Quarterly LCTQ Non-Share Item
Long Term Debt - Annual DLTT Non-Share Item
Long Term Debt - Quarterly DLTTQ Non-Share Item
Deferred Income Tax - Annual TXDB Non-Share Item
Deferred Income Taxes & Investment Tax Credit
TXDITC Non-Share Item
Deferred Income Tax & Investment Tax Credit - Quarterly
TXDITQ Non-Share Item
Investment Tax Credit - Annual ITCB Non-Share Item
Minority Interest - Annual MIB Non-Share Item
Minority Interest - Quarterly MIBQ Non-Share Item
Other Liabilities - Annual LO Non-Share Item
Other Liabilities - Quarterly LOQ Non-Share Item
Total Liabilities - Annual LT Non-Share Item
Total Liabilities - Quarterly LTQ Non-Share Item
Total Preferred Stock - Annual PSTK Non-Share Item
Total Preferred Stock - Quarterly PSTKQ Non-Share Item

441
Chapter 15 Index Fundamentals
Common Stock - Annual CSTK Non-Share Item
Common Stock - Quarterly CSTKQ Non-Share Item
Capital Surplus - Annual CAPS Non-Share Item
Capital Surplus - Quarterly CAPSQ Non-Share Item
Retained Earnings - Annual RE Non-Share Item
Retained Earnings - Quarterly REQ Non-Share Item
Less Treasury Stock - Annual TSTK Non-Share Item
Less Treasury Stock - Quarterly TSTKQ Non-Share Item
Common Equity - Annual CEQ Non-Share Item
Common Equity - Quarterly CEQQ Non-Share Item
Stockholders Equity - Annual SEQ Non-Share Item
Stockholders Equity - Quarterly SEQQ Non-Share Item
Invested Capital - Annual ICAPT Non-Share Item
Invested Capital - Quarterly ICAPTQ Non-Share Item
Shares Outstanding - Annual CSHO Per-Share Item *
Shares Outstanding - Quarterly CSHOQ Per-Share Item *
Income Statement
Data Item Mnemonic Type of Calculation
Sales - Annual SALE Non-Share Item
Sales - Quarterly SALEQ Non-Share Item
Cost of Goods Sold - Annual COGS Non-Share Item
Cost of Goods Sold - Quarterly COGSQ Non-Share Item
Selling, General, & Administrative Expense - Annual
XSGA Non-Share Item
Selling, General, & Administrative Expense - Quarterly
XSGAQ Non-Share Item
Operating Income Before Depreciation - Annual
OIBDP Non-Share Item
Operating Income Before Depreciation - Quarterly
OIBDPQ Non-Share Item
Depreciation - Annual DP Non-Share Item
Depreciation - Quarterly DPQ Non-Share Item
Operating Profit - Annual OIADP Non-Share Item
Interest Expense - Annual XINT Non-Share Item
Interest Expense - Quarterly XINTQ Non-Share Item
Nonoperating Expense - Annual NOPI Non-Share Item

Research Insight North America Data Guide
442
Nonoperating Expense - Quarterly NOPIQ Non-Share Item
Special Items - Annual SPI Non-Share Item
Special Items - Quarterly SPIQ Non-Share Item
Income Taxes - Annual TXT Non-Share Item
Income Taxes - Annual TXT Non-Share Item
Minority Interest - Annual MII Non-Share Item
Minority Interest - Quarterly MIIQ Non-Share Item
Net Income - Annual NI Non-Share Item
Net Income - Quarterly NIQ Non-Share Item
Income Before Extraordinary Items - Annual
IB Non-Share Item
Income Before Extraordinary Items - Quarterly
IBQ Non-Share Item
Preferred Dividends - Annual DVP Non-Share Item
Preferred Dividends - Quarterly DVPQ Non-Share Item
$ Savings-Common Stock Equivalents - Annual
CSTKE Non-Share Item
$ Savings-Common Stock Equivalents - Quarterly
CSTKEQ Non-Share Item
Income Available for Common - Annual
IBCOM Non-Share Item
Income Available for Common - Quarterly
IBCOMQ Non-Share Item
Pretax Income - Annual PI Non-Share Item
Pretax Income - Quarterly PIQ Non-Share Item
Income Before Extraordinary Items & Discontinued Operations - Adjusted for CSE - Annual
IBADJ Non-Share Item
Income Before Extraordinary Items & Discontinued Operations - Adjusted for CSE - Quarterly
IBADJQ Non-Share Item
Earnings Per Share (Basic) Excluding Extra Items - Annual
EPSPX Per-Share Item
Earnings Per Share (Basic) Excluding Extra Items-Quarterly
EPSPXQ Per-Share Item
Earnings Per Share (Basic) Including Extra Items - Annual
EPSPI Per-Share Item
Earnings Per Share (Basic) Including Extra Items -Quarterly
EPSPIQ Per-Share Item
Earnings Per Share (Basic) from Operations - Annual
OPEPS Per-Share Item

443
Chapter 15 Index Fundamentals
Earnings Per Share (Basic) from Operations - Quarterly
OPEPSQ Per-Share Item
Earnings Per Share (Diluted) Excluding Extra Items - Annual
EPSFX Per-Share Item
Earnings Per Share (Diluted) Excluding Extra Items-Quarterly
EPSFXQ Per-Share Item
Earnings Per Share (Diluted) Including Extra Items - Annual
EPSFI Per-Share Item
Earnings Per Share (Diluted) Including Extra Items -Quarterly
EPSFIQ Per-Share Item
Earnings Per Share (Diluted) from Operations - Annual
OPEPSX Per-Share Item
Earnings Per Share (Diluted) from Operations - Quarterly
OEPSXQ Per-Share Item
Cash Flow
Data Item Mnemonic Type of Calculation
Capital Expenditures - Annual CAPX Non-Share Item
Capital Expenditures - Quarterly CAPXQX Non-Share Item
Deprecation and Amortization - Annual
DPC Non-Share Item
Operating Activities - Net Cash Flow - Annual
OANCF Non-Share Item
Investing Activities - Net Cash Flow - Annual
IVNCF Non-Share Item
Financing Activities - Net Cash Flow - Annual
FINCF Non-Share Item
Sale of Property, Plant, and Equipment - Annual
SPPE Non-Share Item
Cash Dividends - Annual DV Non-Share Item
Sale of common and Preferred Stock - Annual
SSTK Non-Share Item
Miscellaneous
Data Item Mnemonic Type of Calculation
S&P Index - Number of Companies Annually
SPNOA N/A
S&P Index - Number of Companies Quarterly
SPNOQ N/A
S&P Index - Percentage of Equity Updated Annually
SPEQA Weighted Average Ratio

Research Insight North America Data Guide
444
S&P Index - Percentage of Equity Updated Quarterly
SPEQQ Weighted Average Ratio
*This value is set to 1.0000 for all records; all index items are on a per share basis. As a result, this item
is being set to 1.0000 for per share concepts in Research Insight.
Index Fundamental Calculation Criteria Index Fundamentals are calculated in one of three ways.
Non-Share Items
1. Non-share Items
The following is the calculation for all non-share items:
ΣX
-------
D
where: X = company data item value
D = S&P index base divisor
Example: Automobiles Group 1996 Sales
Sum fiscal 1996 Sales for all companies included in the Automobiles group as of December.
This number would then be divided by the Automobiles group December 1996 base divisor to derive the 1996 indexed Sales number.
Per Share Items
The following is the calculation for all per share items:
Σ( X * S )
------------------
D
where: X = company data item value
S = S&P company shares outstanding
D = S&P index base divisor

445
Chapter 15 Index Fundamentals
Example: Automobiles Group 1996 EPS
Each company’s fiscal 1996 shares outstanding is multiplied by the company’s fiscal year EPS and then summed together for all companies included in the Automobiles group as of December 1996. This number would then be divided by the Automobiles group December 1996 base divisor to derive the 1996 indexed EPS number.
Weighted Average Ratios
The following is the calculation for all weighted average ratios:
Σ( R * W )
--------------------
ΣW
where: R = company ratio value
W = S&P company weighting (percent of equity)
Example: Automobiles Group 1996 Current Ratio
Each company’s fiscal 1996 current ratio is multiplied by the company’s year-end weighting and then summed together for all companies included in the Automobiles group as of December 1996. This number would then be divided by the sum of all weightings for the Automobiles group as of December 1996 to derive the 1996 weighted average Current Ratio.
Index Fundamentals Periodicities The Index Fundamentals are being provided in two periodicities, annual and quarterly.
Annual Periodicity
The annual number is calculated on a fiscal year basis. This means that the annual data used in the index fundamental calculation for a particular year must come from the corresponding fiscal year of the company. The fiscal policy being used is the same as the Standard & Poor’s Compustat standard method. For example, if the data year is 1996, the data selected will be pulled for the periods June 1996, through May 1997. The data is presented in the regular annual item field, as is currently the case for company level information.

Research Insight North America Data Guide
446
For example, in order to calculate the index fundamental value of sales for the 1996 Auto Parts & Equipment Industry Index, only the sales values for fiscal year 1996 for the constituents of this index will be included in the final calculation. Standard & Poor’s has provided an item, Annual Percent of Equity (SPEQA), which will let you monitor the percentage of equity that has been reported for each specific index.
Quarterly Periodicity
Quarterly figures will be calculated on a calendar basis. The calculation for the quarterly Income Statement and Balance Sheet data items reflect pure quarterly figures. Cash Flow data items are represented as 12 Month Moving values. The 12MM method is used to minimize the inclusion of restatements that take place during the last 12 months.
Standard & Poor’s has provided the Quarterly Percent of Equity (SPEQQ) item, which will let you monitor the percentage of equity that has been reported for each specific index on a quarterly basis.

447
Chapter 15 Index Fundamentals
Data Definitions
Capital Expenditures - Quarterly - Index Fundamental Mnemonic CAPXQX
Units Millions
This item represents cash outflow or the funds used for additions to the company's property, plant and equipment during the quarter. This item is a true quarterly value containing three months of data as opposed to company level quarterly cash flow data items which contain period data. (Company-level period data items contain 3-, 6-, 9-, and 12-month values for 1st, 2nd, 3rd and 4th quarters, respectively).
See also: the company-level Capital Expenditures item.
S&P Index - Percentage of Equity Updated Annually
Mnemonic Units
Annual SPEQA Percentage
The calculation of the S&P Index - Percentage of Equity Reported is separated into two components, the percent of equity for each index holding for a period, and the percent of total index equity reported for a period.
The percent of equity for each index holding for a period is the market capitalization of the holding divided by the sum of the market capitalization for all holdings.
The percent of total index equity reported for a period is the sum of the percent of equity for each reported holding in the index divided by the sum of the percent of equity for each holding in the index.
The annual concept is calculated on a fiscal year basis. The annual data used in the index fundamental calculation must correspond with the fiscal year of the company.
S&P Index - Percentage of Equity Updated Quarterly
Mnemonic Units
Quarterly SPEQQ Percentage
The calculation of the S&P Index - Percentage of Equity Reported is separated into two components, the percent of equity for each index holding for a period, and the percent of total index equity reported for a period.
The percent of equity for each index holding for a period is the market capitalization of the holding divided by the sum of the market capitalization for all holdings.
The percent of total index equity reported for a period is the sum of the percent of equity for each reported holding in the index divided by the sum of the percent of equity for each holding in the index.

Research Insight North America Data Guide
448
The quarterly concept is calculated on a calendar basis and represents a 12 Month Moving value. Quarterly Index Fundamentals are set on a calendar quarterly basis and do not change with a company’s fiscal period. This data is calculated for the last two quarters and accumulates up to 12 years.
This concept will always equal 100% for the current quarter and the prior quarter unless a new company, which hasn’t yet reported financial statements, is added to the index.
S&P Index - Number of Companies Annually Mnemonic Units
Annual SPNOA Integer
The annual figure represents the total number of companies in the index for the period.
S&P Index - Number of Companies Quarterly
Mnemonic Units
Quarterly SPNOQ Integer The quarterly figure represents the total number of companies in the index for the period.

449
Chapter 16 Insider Trading Data
Insider Trading Data
An insider is a director or an officer who has a policy-making role or a person who is directly or indirectly the beneficial owner of more than 10% of a certain company’s stock. An insider may be either an individual or a corporation.
Insiders are required to disclose their purchase/sale transactions to the SEC in which a change in beneficial ownership has occurred. The filings must be submitted before the end of the second business day following the day on which the transaction had been executed (a new change in filing frequently went into effect August 29, 2002).
Insider Trading Data is provided by Washington Services Association (WSA).
Insider Trading data features Detail Top Ten Buys and Top Ten Sells Aggregated Summary – Multiple buy transactions on the same Form 4 are aggregated into one
transaction; likewise, multiple sell transactions on a Form 4 are also aggregated. Open market transactions of 100 or more shares History – Total of 13 months; current month data is preliminary, plus a rolling 13 months of history.
Data is updated monthly. Issue-level data Data in Actual Numbers – Actual share and dollar values are reported, since transactions frequently fall
below the 1,000 share mark. Amended data – Reported as a separate record at the detail level. The ITS#NOTE footnote indicates
that the data was amended.
Insider Trading Summary data has not been adjusted for stock splits and dividends. Top 10 Detail data can be adjusted or unadjusted at the user’s preference.
Current month information is based on the most recent Form 4s filed. Data may in a preliminary stage.
CHAPTER 16


451
Chapter 16 Insider Trading Data
Insider Trading Items
Buys
Data Item Name
Mnemonic . . . page
Insider Beginning Date - Top Ten Buys ITB#BDTE . . . 521 Insider Beginning Price - Top Ten Buys ITB#LPRC . . . 522 Insider Ending Date - Top Ten Buys ITB#EDTE . . . 523 Insider Ending Price - Top Ten Buys ITB#HPRC . . . 523 Insider Name - Top Ten Buys ITB#NAME . . . 524 Insider Rank - Top Ten Buys ITB#RANK . . . 525 Insider Relation - Top Ten Buys ITB#RLTN . . . 526 Insider Share Holdings - Top Ten Buys ITB#HLDG . . . 527 Insider Shares Executed - Top Ten Buys ITB#SHRS . . . 528 Insider Transaction Value - Top Ten Buys ITB#VAL . . . 529 Insider Top 10 Shares Held - Buys ITBTHLDG . . . 543 Insider Top 10 Transaction Value - Buys ITBTVAL . . . 544 Insider Top 10 Shares Executed - Buys ITBTSHRS . . . 543 Insider Number of Buys in Latest Month ITBRANK . . . 541
Sells
Data Item Name Mnemonic . . . page Insider Beginning Date - Top Ten Sells ITS1BDTE . . . 530 Insider Beginning Price - Top Ten Sells ITS1LPRC . . . 531 Insider Ending Date - Top Ten Sells ITS1EDTE . . . 532 Insider Ending Price - Top Ten Sells ITS1HPRC . . . 533 Insider Name - Top Ten Sells ITS1NAME . . . 534 Insider Rank - Top Ten Sells ITS1RANK . . . 534 Insider Relation - Top Ten Sells ITS1RLTN . . . 535 Insider Share Holdings - Top Ten Sells ITS1HLDG . . . 537 Insider Shares Executed - Top Ten Sells ITS1SHRS . . . 537 Insider Transaction Value - Top Ten Sells ITS1VAL . . . 539 Insider Top 10 Shares Held - Sells ITSTHLDG . . . 545 Insider Top 10 Transaction Value - Sells ITSTVAL . . . 546

Research Insight North America Data Guide
452
Insider Top 10 Shares Executed - Sells ITSTSHRS . . . 545 Insider Number of Sells in Latest Month ITSRANK . . . 542
Summary Data
Data Item Name Mnemonic . . . page Insider Buys Shares ITBYSHR# . . . 540 Insider Buys Transactions ITBUYS# . . . 540 Insider Net Shares ITNTSHR# . . . 540 Insider Net Transactions ITNET# . . . 541 Insider Sells Shares ITSLSHR# . . . 540 Insider Sells Transactions ITSELLS# . . . 541
Total Shares Held
Data Item Name Mnemonic . . . page Insider Total Shares Held - Common ITTLSHRC . . . 546 Insider Total Shares Held - Common % of Shares Outstanding
ITTLSHRCS . . . 548
Insider Total Shares Held - Date ITTLDTE . . . 547 Insider Total Shares Held - Diluted ITTLSHRD . . . 547 Insider Total Shares Held - Diluted % of Shares Outstanding
ITTLSHRDS . . . 549
Insider Total Shares Held - Options ITTLSHRO . . . 547
Float Shares
Data Item Name Mnemonic . . . page Common Shares 5% Ownership Float Adjustment - Current
CSH5OFLC . . . 508
Common Shares Float Date Adjustment - Current
FLOATDTEC . . . 509
Common Shares Insider Ownership Diluted Float Adjustment - Current
CSHDFLC . . . 509
Common Shares Insider Ownership Float Adjustment - Current
CSHFLC . . . 510
Float Common FLOATC . . . 510 Float Common - Current Company Level FLOATCCC . . . 511 Float Common - Current Issue FLOATCC . . . 511

453
Chapter 16 Insider Trading Data
Float Common % of Shares Outstanding FLTCS . . . 512 Float Common % Of Shares Outstanding - Current Company Level
FLTCSCC . . . 512
Float Common % of Shares Outstanding - Current Issue
FLTCSC . . . 512
Float Diluted FLOATD . . . 513 Float Diluted - Current Company Level FLOATDCC . . . 513 Float Diluted - Current Issue FLOATDC . . . 514 Float Diluted % of Shares Outstanding FLTDS . . . 514 Float Diluted % of Shares Outstanding - Current Company Level
FLTDSCC . . . 514
Float Diluted % Shares Outstanding - Current Issue
FLTDSC . . . 515
Float Management Common FLOATMC . . . 516 Float Management Common - Current Company Level
FLOATMCCC . . . 516
Float Management Common - Current Issue FLOATMCC . . . 517 Float Management Common % of Shares Outstanding
FLTMCS . . . 517
Float Management Common % of Shares Outstanding - Current Company Level
FLTMCSCC . . . 518
Float Management Common % of Shares Outstanding - Current Issue
FLTMCSC . . . 518
Float Management Diluted FLOATMD . . . 518 Float Management Diluted - Current Company Level
FLOATMDCC . . . 519
Float Management Diluted - Current Issue FLOATMDC . . . 519 Float Management Diluted % of Shares Outstanding
FLTMDS . . . 520
Float Management Diluted % of Shares Outstanding - Current Company Level
FLTMDSCC . . . 520
Float Management Diluted % of Shares Outstanding - Current Issue
FLTMDSC . . . 520
Market Float Management Value Common MKFMVC . . . 550 Market Float Management Value Common - Current Company Level
MKFMVCCC . . . 550
Market Float Management Value Common - Current Issue
MKFMVCC . . . 550
Market Float Management Value Diluted MKFMVD . . . 552 Market Float Management Value Diluted - Current Company Level
MKFMVDCC . . . 553
Market Float Management Value Diluted - Current Issue
MKFMVDC . . . 551
Market Float Value Common MKFVC . . . 551 Market Float Value Common - Current Company Level
MKFVCCC . . . 552

Research Insight North America Data Guide
454
Market Float Value Common - Current Issue MKFVCC . . . 552 Market Float Value Diluted MKFVD . . . 552 Market Float Value Diluted - Current Company Level
MKFVDCC . . . 553
Market Float Value Diluted - Current Issue MKFVDC . . . 553
Summarized Transactions Each insider’s sale transactions from the Form 4 filings reported during a particular month have been added together to give an aggregate figure for that reporting month. Likewise, each insider’s purchase transaction has been added together to give an aggregate figure for that reporting month.
Form 4 The Form 4 is the Statement of Changes of Beneficial Ownership of Securities form insiders are required to file with the SEC when they buy or sell company stock, or exercise options.
Common Shares 5% Ownership Float Adjustment - Current Mnemonic CSH5OFLC
Units Millions
This is the underlying data that is used in calculating the various company float formulas.
It represents the total number of shares held by any 5% beneficial owner in the company’s outstanding common stock per the 13D, 13G or 14D SEC filings. Shares for any individual or group that may exist in more than one of these filings are only counted once, using whichever shares exist in the most recent filing.
This item is reported for each issue for any company reporting more than one class of common stock which trade.
Common Shares Float Date Adjustment - Current Mnemonic FLOATDTEC
Units MM/DD/YY
This date item reflects the date of the most recent SEC filing from either the: DEF 14A- Definitive Proxy Statement, 13D, 13G, or 13F Form filings and corresponds to the public float concepts.

455
Chapter 16 Insider Trading Data
To search for the Date item for the public management float concepts, refer to Insider Total Shares Held-Date, ITTLDTE.
Common Shares Float Note Mnemonic FLOATNOTE
This note is used to explain any additional insight or unusual cases in the collection of the underlying data* that is used in calculating the various company float formulas.
For some companies, the notes will represent cases where multiple shares exist and they are included with the primary issue of traded stock.
*The Common Shares Float Note applies to the following data items:
CSHFLC: Common Shares Insider Ownership Float Adjustment – Current CSHDFLC: Common Shares Insider Ownership Diluted Float Adjustment - Current
Common Shares Insider Ownership Diluted Float Adjustment - Current Mnemonic CSHDFLC
Units Millions
This is the underlying data that is used in calculating the various company float formulas.
It represents the diluted total number of shares held by management and any 5% beneficial owners in the company’s outstanding common stock per the DEF 14A, Definitive Proxy Statement that may be adjusted for any subsequent 13D, 13G, or 13F Form filings that have been submitted to the SEC after the DEF14A Proxy filing. This will apply when there may be an individual or group that exists in more than one of these filings, including the DEF14A.
It includes stock options exercised.
This item is reported for each issue for any company reporting more than one class of common stock which trade. For multiple issues that do not trade, they are aggregated with the primary trading issue. Refer to Common Shares Float Note - FLOATNOTE for additional comments.
Common Shares Insider Ownership Float Adjustment - Current Mnemonic CSHFLC
Units Millions
This is the underlying data that is used in calculating the various company float formulas.
It represents the total number of shares held by management and any 5% beneficial owners in the company’s outstanding common stock per the DEF 14A, Definitive Proxy Statement that may be adjusted for any subsequent 13D, 13G, or 13F Form filings that have been submitted to the SEC after the DEF14A Proxy filing. This will apply when there may be an individual or group that exists in more than one of these filings, including the DEF14A.
It excludes stock options exercised.

Research Insight North America Data Guide
456
This item is reported for each issue for any company reporting more than one class of common stock which trade. For multiple issues that do not trade, they are aggregated with the primary trading issue. Refer to Common Shares Float Note - FLOATNOTE for additional comments.
Float Common Mnemonic FLOATC
Concept calculation (@VALUE(CSHOQ[@QTR(FLOATDTEC)],CSHOQ[@QTR(FLOATDTEC)-1],CSHOQ[@QTR (FLOATDTEC)-2])) - @CSUM((CSHFLC+@IF (@ISNA(CSH5OFLC),0,CSH50FLC)),@SET (@CHGCO(ISSUE),TPCI=0))
Units Millions
This concept is company level public float using quarterly shares closest to the latest SEC filing date*. For any companies reporting more than one class of common stock, each issue will be aggregated. To search for an issue level public float, refer to Float Common-Current Issue – FLOATCC .
It excludes stock options exercised.
It is taking Common Shares Outstanding - Company – Quarterly less the aggregated Common Shares Insider Ownership Float Adjustment –Current less the aggregated Common Shares 5% Ownership Float Adjustment –Current.
Common Shares Outstanding is aligned to the latest Common Shares Float Date Adjustment –Current date. If that shares outstanding is not available, the value for the previous quarter will be used. This calculation will search up to 2 prior quarters. If a company’s CSHOQ is not available for any of these time periods, no float will appear.
For this float calculation, the Insider Ownership & 5% Ownership utilizes the latest SEC filings*: DEF 14A-Definitive Proxy Statement , 13D, 13G, or 13F Form filings taking into account occurrences where an individual or group might exist in more than one of these filings and are adjusted accordingly. To search for float shares that are more of a point in time using the DEF 14A only, then refer to Float Management Common-Current Company Level-FLOATMCCC.
Float Common - Current Company Level Mnemonic FLOATCCC
Concept calculation @CSUM(CSHOC –(CSHFLC+@IF(@ISNA (CSH5OFLC),0,CSH5OFLC)),@SET(@CHGCO (ISSUE),TPCI=0))
Units Millions
This concept is the latest available company level public float. For any companies reporting more than one class of common stock, each issue will be aggregated. To search an issue level public float, refer to Float Common-Current Issue – FLOATCC .
It excludes stock options exercised.

457
Chapter 16 Insider Trading Data
It is taking aggregated Current Common Shares Outstanding less the aggregated Common Shares Insider Ownership Float Adjustment –Current less the aggregated Common Shares 5% Ownership Float Adjustment –Current.
For this float calculation, the Insider Ownership & 5% Ownership utilizes the latest SEC filings: DEF 14A-Definitive Proxy Statement , 13D, 13G, or 13F Form filings taking into account occurrences where an individual or group might exist in more than one of these filings and are adjusted accordingly. To search for float shares that are more of a point in time using the DEF 14A only, then refer to Float Management Common-Current Company Level-FLOATMCCC.
Float Common - Current Issue Mnemonic FLOATCC
Concept calculation CSHOC - (CSHFLC+@IF(@ISNA(CSH5OFLC),0, CSH5OFLC))
Units Millions
This concept is the latest available issue level public float. For any companies reporting more than one class of common stock which trade, each issue will be broken out. To search for a company level public float, refer to Float Common-Current Company Level – FLOATCCC.
It excludes stock options exercised.
It is taking Current Common Shares Outstanding less Common Shares Insider Ownership Float Adjustment –Current less Common Shares 5% Ownership Float Adjustment –Current
For this float calculation, the Insider Ownership & 5% Ownership utilizes the latest SEC filings: DEF 14A-Definitive Proxy Statement , 13D, 13G, or 13F Form filings taking into account occurrences where an individual or group might exist in more than one of these filings and are adjusted accordingly. To search for float shares that are more of a point in time using the DEF 14A only, then refer to Float Management Common-Current Issue-FLOATMCC.
Float Common % of Shares Outstanding Mnemonic FLTCS
Concept calculation (FLOATC/ @VALUE(CSHOQ[@QTR (FLOATDTEC)],CSHOQ[@QTR(FLOATDTEC)- 1],CSHOQ[@QTR(FLOATDTEC)-2]))*100
Units Percent
This company level concept divides Float Common by the company’s Common Shares Outstanding - Company – Quarterly and multiplies by 100.
Common Shares Outstanding is aligned to the latest Common Shares Float Date Adjustment –Current date. If that shares outstanding is not available, the value for the previous quarter will be used. This calculation will search up to 2 prior quarters. If a company’s CSHOQ is not available for any of these time periods, no float will appear.

Research Insight North America Data Guide
458
Float Common % of Shares Outstanding - Current Company Level Mnemonic FLTCSCC
Concept calculation (FLOATCCC/ @CSUM(CSHOC,@SET (@CHGCO(ISSUE),TPCI=0)))*100
Units Percent
This company level concept divides Float Common-Current Company Level by the company’s aggregated Current Common Shares Outstanding and multiplies by 100.
Float Common % of Shares Outstanding - Current Issue Mnemonic FLTCSC
Concept calculation ((FLOATCC/CSHOC))*100
Units Percent
This issue level concept divides Float Common-Current Issue by the company’s Current Common Shares Outstanding and multiplies by 100.
Float Diluted Mnemonic FLOATD
Concept calculation (@VALUE(CSHOQ[@QTR(FLOATDTEC)],CSHOQ [@QTR(FLOATDTEC)-1], CSHOQ[@QTR (FLOATDTEC)-2]))-@CSUM ( (CSHDFLC+@IF (@ISNA(CSH5OFLC),0,CSH5OFLC)), @SET(@CHGCO(ISSUE),TPCI=0))
Units Millions
This concept is company level public float on a diluted basis using quarterly shares closest to the SEC filing date*. For any companies reporting more than one class of common stock, each issue will be aggregated. To search for an issue level public float, refer to Float Diluted-Current Issue – FLOATDC .
It includes stock options exercised.
It is taking Common Shares Outstanding - Company – Quarterly less the aggregated Common Shares Insider Ownership Diluted Float Adjustment –Current less the aggregated Common Shares 5% Ownership Float Adjustment –Current.
Common Shares Outstanding is aligned to the latest Common Shares Float Date Adjustment –Current date. If that shares outstanding is not available, the value for the previous quarter will be used. This calculation will search up to 2 prior quarters. If a company’s CSHOQ is not available for any of these time periods, no float will appear.

459
Chapter 16 Insider Trading Data
For this float calculation, the Insider Ownership & 5% Ownership utilizes the latest SEC filings*: DEF 14A- Definitive Proxy Statement , 13D, 13G, or 13F Form filings taking into account occurrences where an individual or group might exist in more than one of these filings and are adjusted accordingly. To search for float shares that are more of a point in time using the DEF 14A only, then refer to Float Management Diluted-Current Company Level-FLOATMDCC.
Float Diluted - Current Company Level Mnemonic FLOATDCC
Concept calculation @CSUM(CSHOC- (CSHDFLC+@IF(@ISNA (CSH5OFLC),0,CSH5OFLC)),@SET(@CHGCO (ISSUE),TPCI=0))
Units Millions
This concept is the latest available company level public float on a diluted basis. For any companies reporting more than one class of common stock, each issue will be aggregated. To search for an issue level public float, refer to Float Diluted-Current Issue – FLOATDC .
It includes stock options exercised.
It is taking aggregated Current Common Shares Outstanding less the aggregated Common Shares Insider Ownership Diluted Float Adjustment –Current less the aggregated Common Shares 5% Ownership Float Adjustment –Current.
For this float calculation, the Insider Ownership & 5% Ownership utilizes the latest SEC filings: DEF 14A-Definitive Proxy Statement , 13D, 13G, or 13F Form filings taking into account occurrences where an individual or group might exist in more than one of these filings and are adjusted accordingly. To search for float shares that are more of a point in time using the DEF 14A only, then refer to Float Management Diluted-Current Company Level-FLOATMDCC.
Float Diluted - Current Issue Mnemonic FLOATDC
Concept calculation CSHOC - (CSHDFLC+@IF(@ISNA(CSH5OFLC),0, CSH5OFLC))
Units Millions
This concept is the latest available issue level public float on a diluted basis. For any companies reporting more than one class of common stock which trade, each issue will be broken out. To search for a company level public float, refer to Float Diluted-Current Company Level – FLOATDCC.
It includes stock options exercised.
It is taking Current Common Shares Outstanding less Common Shares Insider Ownership Diluted Float Adjustment –Current less Common Shares 5% Ownership Float Adjustment –Current.
For this float calculation, the Insider Ownership & 5% Ownership utilizes the latest SEC filings: DEF 14A-Definitive Proxy Statement , 13D, 13G, or 13F Form filings taking into account occurrences where an individual or group might exist in more than one of these filings and are adjusted accordingly. To search for float shares that are more of a point in time using the DEF 14A only, then refer to Float Management Diluted-Current Issue-FLOATMDC.

Research Insight North America Data Guide
460
Float Diluted % of Shares Outstanding Mnemonic FLTDS
Concept calculation (FLOATD/@value(CSHOQ[@QTR (FLOATDTEC)],CSHOQ[@QTR(FLOATDTEC)- 1],CSHOQ[@QTR(FLOATDTEC)-2]))*100
Units Percent
This company level concept divides Float Diluted by the company’s Common Shares Outstanding - Company – Quarterly and multiplies by 100.
Common Shares Outstanding is aligned to the latest Common Shares Float Date Adjustment –Current date. If that shares outstanding is not available, the value for the previous quarter will be used. This calculation will search up to 2 prior quarters. If a company’s CSHOQ is not available for any of these time periods, no float will appear.
Float Diluted % of Shares Outstanding - Current Company Level Mnemonic FLTDSCC
Concept calculation (FLOATDCC/@CSUM(CSHOC,@SET(@CHGCO (ISSUE),TPCI=0)))*100
Units Percent
This company level concept divides Float Diluted-Current Company Level by the company’s aggregated Current Common Shares Outstanding and multiplies by 100.

461
Chapter 16 Insider Trading Data
Float Diluted % Shares Outstanding - Current Issue Mnemonic FLTDSC
Concept calculation ((FLOATDC/CSHOC))*100
Units Percent
This issue level concept divides Float Common-Diluted Issue by the company’s Current Common Shares Outstanding and multiplies by 100.
Float Management Common Mnemonic FLOATMC
Concept calculation (@VALUE(CSHOQ[@QTR(ITTLDTE)],CSHOQ [@QTR(ITTLDTE)-1],CSHOQ[@QTR(ITTLDTE)-2]))-@CSUM(ITTLSHRC,@SET(@CHGCO (ISSUE),TPCI=0))
Units Millions
This concept is a company level public float. For any companies reporting more than one class of common stock, each issue will be aggregated. To search for an issue level public float, refer to Float Management Common-Current Issue – FLOATMCC .
It excludes stock options exercised.
It is aligning the Common Shares Outstanding - Company – Quarterly shares to the DEF 14A, Definitive Proxy Statement latest filing and subtracting an aggregated Insider Total Shares Held-Common that is taken from the latest DEF 14A, Definitive Proxy Statement only.
If Common Shares Outstanding for the current quarter is not available, the value for the previous quarter will be used. This calculation will search up to 2 prior quarters. If a company’s CSHOQ is not available for any of these time periods, no float will appear.
For this float calculation, the Insider Total Shares used is a point in time. To search for latest available float shares instead, then refer to Float Common-FLOATC.
It is based on the total number of shares held by management in the company’s outstanding common stock per the DEF 14A, Definitive Proxy Statement.
Float Management Common - Current Company Level Mnemonic FLOATMCCC
Concept calculation @CSUM(CSHOC-ITTLSHRC,@SET (@CHGCO(ISSUE),TPCI=0))
Units Millions
This concept is a company level public float. For any companies reporting more than one class of common stock, each issue will be aggregated. To search for an issue level public float, refer to Float Management Common-Current Issue – FLOATMCC .
It excludes stock options exercised.
It is taking an aggregated Current Common Shares Outstanding less the aggregated Insider Total Shares Held-Common that is taken from the latest DEF 14A, Definitive Proxy Statement only.

Research Insight North America Data Guide
462
For this float calculation, the Insider Total Shares used is a point in time. To search for latest available float shares instead, then refer to Float Common-Current Company Level-FLOATCCC.
It is based on the total number of shares held by management in the company’s outstanding common stock per the DEF 14A, Definitive Proxy Statement.
Float Management Common - Current Issue Mnemonic FLOATMCC
Concept calculation CSHOC-ITTLSHRC
Units Millions
This concept is an issue level public float. For any companies reporting more than one class of common stock which trade, each issue will be broken out. To search for a company level public float, refer to Float Management Common-Current Company Level – FLOATMCCC.
It excludes stock options exercised.
It is taking Current Common Shares Outstanding less Insider Total Shares Held-Common that is taken from the latest DEF 14A, Definitive Proxy Statement only.
For this float calculation, the Insider Total Shares used is a point in time. To search for latest available float shares instead, then refer to Float Common-Current Issue-FLOATCC.
It is based on the total number of shares held by management in the company’s outstanding common stock per the DEF 14A, Definitive Proxy Statement.
Float Management Common % of Shares Outstanding Mnemonic FLTMCS
Concept calculation (FLOATMC/@VALUE(CSHOQ[@QTR (ITTLDTE)],CSHOQ[@QTR(ITTLDTE)- 1],CSHOQ[@QTR(ITTLDTE)-2]))*100
Units Percent
This company level concept divides Float Management Common by the company’s Common Shares Outstanding - Company – Quarterly and multiplies by 100.
Common Shares Outstanding is aligned to the latest Insider Total Shares Held-Date. If that shares outstanding is not available, the value for the previous quarter will be used. This calculation will search up to 2 prior quarters. If a company’s CSHOQ is not available for any of these time periods, no float will appear.
Float Management Common % of Shares Outstanding - Current Company Level Mnemonic FLTMCSCC

463
Chapter 16 Insider Trading Data
Concept calculation (FLOATMCCC/CSUM(CSHOC,@SET(@CHGCO (ISSUE),TPCI=0)))*100
Units Percent
This company level concept divides Float Management Common-Current Company Level by the company’s aggregated Current Common Shares Outstanding and multiplies by 100.
Float Management Common % of Shares Outstanding - Current Issue Mnemonic FLTMCSC
Concept calculation ((FLOATMCC/CSHOC))*100
Units Percent
This issue level concept divides Float Management Common-Current Issue by the company’s Current Common Shares Outstanding and multiplies by 100.
Float Management Diluted Mnemonic FLOATMD
Concept calculation (@VALUE(CSHOQ[@QTR(ITTLDTE)],CSHOQ [@QTR(ITTLDTE)-1],CSHOQ[@QTR(ITTLDTE)-2]))-@CSUM(ITTLSHRD,@SET(@CHGCO (ISSUE),TPCI=0))
Units Millions
This concept is a company level public float on a diluted basis. For any companies reporting more than one class of common stock, each issue will be aggregated. To search for an issue level public float, refer to Float Management Diluted-Current Issue – FLOATMDC .
It includes stock options exercised.
It is aligning the Common Shares Outstanding - Company – Quarterly shares to the DEF 14A, Definitive Proxy Statement latest filing and subtracting an aggregated Insider Total Shares Held-Diluted that is taken from the latest DEF 14A, Definitive Proxy Statement only.
If Common Shares Outstanding for the current quarter is not available, the value for the previous quarter will be used. This calculation will search up to 2 prior quarters. If a company’s CSHOQ is not available for any of these time periods, no float will appear.
For this float calculation, the Insider Total Shares used is a point in time. To search for latest available float shares instead, then refer to Float Diluted-FLOATD.
It is based on the total number of shares held by management in the company’s outstanding common stock per the DEF 14A, Definitive Proxy Statement.
Float Management Diluted - Current Company Level Mnemonic FLOATMDCC

Research Insight North America Data Guide
464
Concept calculation @CSUM(CSHOC-ITTLSHRD,@SET (@CHGCO(ISSUE),TPCI=0))
Units Millions
This concept is company level public float on a diluted basis. For any companies reporting more than one class of common stock, each issue will be aggregated. To search for an issue level public float, refer to Float Management Diluted-Current Issue – FLOATMDC .
It includes stock options exercised.
It is taking an aggregated Current Common Shares Outstanding less the aggregated Insider Total Shares Held-Diluted that is taken from the latest DEF 14A, Definitive Proxy Statement only.
For this float calculation, the Insider Total Shares used is a point in time. To search for latest available float shares instead, then refer to Float Diluted-Current Company Level-FLOATDCC.
It is based on the total number of shares held by management in the company’s outstanding common stock per the DEF 14A, Definitive Proxy Statement.
Float Management Diluted - Current Issue Mnemonic FLOATMDC
Concept calculation CSHOC-ITTLSHRD
Units Millions
This concept is an issue level public float on a diluted basis. For any companies reporting more than one class of common stock which trade, each issue will be broken out. To search for a company level public float, refer to Float Management Diluted-Current Company Level – FLOATMDCC.
It includes stock options exercised.
It is taking Current Common Shares Outstanding less Insider Total Shares Held-Diluted that is taken from the latest DEF 14A, Definitive Proxy Statement only.
For this float calculation, the Insider Total Shares used is a point in time. To search for latest available float shares instead, then refer to Float Diluted-Current Issue-FLOATDC.
It is based on the total number of shares held by management in the company’s outstanding common stock per the DEF 14A, Definitive Proxy Statement.
Float Management Diluted % of Shares Outstanding Mnemonic FLTMDS
Concept calculation (FLOATMD/@VALUE(CSHOQ[@QTR (ITTLDTE)],CSHOQ[@QTR(ITTLDTE)- 1],CSHOQ[@QTR(ITTLDTE)-2]))*100
Units Percent
This company level concept divides Float Management Diluted by the company’s Common Shares Outstanding - Company – Quarterly and multiplies by 100.

465
Chapter 16 Insider Trading Data
Common Shares Outstanding is aligned to the latest Insider Total Shares Held-Date. If that shares outstanding is not available, the value for the previous quarter will be used. This calculation will search up to 2 prior quarters. If a company’s CSHOQ is not available for any of these time periods, no float will appear.
Float Management Diluted % of Shares Outstanding - Current Company Level Mnemonic FLTMDSCC
Concept calculation (FLOATMDCC/@CSUM(CSHOC,@SET(@CHGCO (ISSUE),TPCI=0)))*100
Units Percent
This company level concept divides Float Management Diluted-Current Company Level by the company’s aggregated Current Common Shares Outstanding and multiplies by 100.
Float Management Diluted % of Shares Outstanding - Current Issue Mnemonic FLTMDSC
Concept calculation (FLOATMDC/CSHOC))*100
Units Percent
This issue level concept divides Float Management Common-Diluted Issue by the company’s Current Common Shares Outstanding and multiplies by 100.
Insider Amend Sells Note Available Mnemonic ITSANOTE
Concept calculation @OR(ITS1NOTE="A",ITS2NOTE="A",ITS3NOTE ="A",ITS4NOTE="A",ITS5NOTE="A",ITS6NOTE= "A",ITS7NOTE="A",ITS8NOTE="A",ITS9NOTE= "A",ITS10NOTE="A")
Data Availability 13 months
Insider Comb Sells Note Available Mnemonic ITSCNOTE
Concept calculation @or(ITS1NOTE="C",ITS2NOTE="C",ITS3NOTE ="C",ITS4NOTE="C",ITS5NOTE="C",ITS6NOTE= "C",ITS7NOTE="C",ITS8NOTE="C",ITS9NOTE= "C",ITS10NOTE="C")
Data Availability 13 months

Research Insight North America Data Guide
466
Insider Beginning Date - Top Ten Buys Mnemonic ITB1BDTE Rank 1
ITB2BDTE Rank 2
ITB3BDTE Rank 3
ITB4BDTE Rank 4
ITB5BDTE Rank 5
ITB6BDTE Rank 6
ITB7BDTE Rank 7
ITB8BDTE Rank 8
ITB9BDTE Rank 9
ITB10BDTE Rank 10
Units MM/DD/YY
Data Availability 13 months
This is the first day on which part of a summarized purchase transaction occurred as reported on any Form 4’s filed during a particular month. For example, if the insider made more than one purchase transaction within a certain month, each of the Form 4 filings are taken into consideration for that entire month. This item is the date of when the first purchase transaction occurred for that particular month.
Insiders are ranked by number of shares purchased. This item is reported for up to 10 individuals having an insider relationship with a company.
Insider Beginning Price - Top Ten Buys Mnemonic ITB1LPRC Rank 1
ITB2LPRC Rank 2
ITB3LPRC Rank 3
ITB4LPRC Rank 4

467
Chapter 16 Insider Trading Data
ITB5LPRC Rank 5
ITB6LPRC Rank 6
ITB7LPRC Rank 7
ITB8LPRC Rank 8
ITB9LPRC Rank 9
ITB10LPRC Rank 10
Units Dollars and cents
Data Availability 13 months
This is the lowest price at which part of a summarized purchase transaction occurred as reported on any Form 4’s filed during a particular month. For example, if the insider made more than one purchase transaction within a certain month, each of the Form 4 filings are taken into consideration for that entire month. This item is the lowest price of when any purchase transactions occurred for that particular month.
Insiders are ranked by number of shares purchased. This item is reported for up to 10 individuals having an insider relationship with a company.
Insider Ending Date - Top Ten Buys Mnemonic ITB1EDTE Rank 1
ITB2EDTE Rank 2
ITB3EDTE Rank 3
ITB4EDTE Rank 4
ITB5EDTE Rank 5
ITB6EDTE Rank 6
ITB7EDTE Rank 7
ITB8EDTE Rank 8
ITB9EDTE Rank 9
ITB10EDTE Rank 10

Research Insight North America Data Guide
468
Units MM/DD/YY
Data Availability 13 months
This is the last day on which part of a summarized purchase transaction occurred as reported on any Form 4’s filed during a particular month. For example, if the insider made more than one purchase transaction within a certain month, each of the Form 4 filings are taken into consideration for that entire month. This item is the date of when the last purchase transaction occurred for that particular month.
Insiders are ranked by number of shares purchased. This item is reported for up to 10 individuals having an insider relationship with a company.
Insider Ending Price - Top Ten Buys Mnemonic ITB1HPRC Rank 1
ITB2HPRC Rank 2
ITB3HPRC Rank 3
ITB4HPRC Rank 4
ITB5HPRC Rank 5
ITB6HPRC Rank 6
ITB7HPRC Rank 7
ITB8HPRC Rank 8
ITB9HPRC Rank 9
ITB10HPRC Rank 10
Units Dollars and cents
Data Availability 13 months
This is the highest price at which part of a summarized purchase transaction occurred as reported on any Form 4’s filed during a particular month. For example, if the insider made more than one purchase transaction within a certain month, each of the Form 4 filings are taken into consideration for that entire month. This item is the highest price of when any purchase transaction occurred for that particular month.
Insiders are ranked by number of shares purchased. This item is reported for up to 10 individuals having an insider relationship with a company.

469
Chapter 16 Insider Trading Data
Insider Name - Top Ten Buys Mnemonic ITB1NAME Rank 1
ITB2NAME Rank 2
ITB3NAME Rank 3
ITB4NAME Rank 4
ITB5NAME Rank 5
ITB6NAME Rank 6
ITB7NAME Rank 7
ITB8NAME Rank 8
ITB9NAME Rank 9
ITB10NAME Rank 10
Units Text
Data Availability 13 months
This is the name of the individual reporting the purchase of shares on the Form 4.
Insiders are ranked by number of shares purchased. This item is reported for up to 10 individuals having an insider relationship with a company.
Insider Rank - Top Ten Buys Mnemonic ITB1RANK Rank 1
ITB2RANK Rank 2
ITB3RANK Rank 3
ITB4RANK Rank 4
ITB5RANK Rank 5
ITB6RANK Rank 6
ITB7RANK Rank 7
ITB8RANK Rank 8

Research Insight North America Data Guide
470
ITB9RANK Rank 9
ITB10RANK Rank 10
Units Integer
Data Availability 13 months
This item ranks insiders by number of shares purchased, from the highest number of shares to the lowest number, as reported on the Form 4. This item is reported for up to 10 individuals having an insider relationship with a company.
If the number of shares purchased is equal to any other insider, then additional ranking criteria are applied in the following hierarchy: 1. Number of Share Holdings (highest to lowest)
2. Insider Ending Date (earliest to latest)
3. Insider Name (in reverse alphabetical order, Z to A)
Insider Relation - Top Ten Buys Mnemonic ITB1RLTN Rank 1
ITB2RLTN Rank 2
ITB3RLTN Rank 3
ITB4RLTN Rank 4
ITB5RLTN Rank 5
ITB6RLTN Rank 6
ITB7RLTN Rank 7
ITB8RLTN Rank 8
ITB9RLTN Rank 9
ITB10RLTN Rank 10
Units Text
Data Availability 13 months

471
Chapter 16 Insider Trading Data
This item describes the individual’s position in the company or relationship to the company. Insiders are ranked by number of shares purchased. This item is reported for up to 10 individuals having an insider relationship with a company.
The codes are as follows:
Code Description
AF Affiliated Person
AI Affiliate of Investment Advisor
B Beneficial Owner of more than 10% of a class of a company’s equity security
BC Beneficial Owner as Custodian
BT Beneficial Owner as Trustee
CB Chairman of the Board
CE Chief Executive Officer
CF Chief Financial Officer
CO Chief Operating Officer
CP Controlling Person
D Director
DO Director and Beneficial Owner
GP General Partner
H Officer, Director and Beneficial Owner
IA Investment Advisor
IS Indirect Shareholder
LP Limited Partner
MC Member of Committee or Advisory Board
N None
O Officer
OB Officer and Beneficial Owner
OD Officer and Director
OS Officer of a Subsidiary
OT Officer and Treasurer
OX Divisional Officer
P President
SH Shareholder
TR Treasurer
TT Trustee
UK Unknown
VP Vice President
VT Voting Trustee

Research Insight North America Data Guide
472
Insider Share Holdings - Top Ten Buys Mnemonic ITB1HLDG Rank 1
ITB2HLDG Rank 2
ITB3HLDG Rank 3
ITB4HLDG Rank 4
ITB5HLDG Rank 5
ITB6HLDG Rank 6
ITB7HLDG Rank 7
ITB8HLDG Rank 8
ITB9HLDG Rank 9
ITB10HLDG Rank 10
Units Actual
Data Availability 13 months
This is the remaining shares held, both directly and indirectly, by an insider after taking into account all purchase transactions reported on any Form 4’s filed during a particular month. It is an as reported number.
Insiders are ranked by number of shares purchased. This item is reported for up to 10 individuals having an insider relationship with a company.
Insider Shares Executed - Top Ten Buys
Mnemonic ITB1SHRS Rank 1
ITB2SHRS Rank 2
ITB3SHRS Rank 3
ITB4SHRS Rank 4
ITB5SHRS Rank 5
ITB6SHRS Rank 6

473
Chapter 16 Insider Trading Data
ITB7SHRS Rank 7
ITB8SHRS Rank 8
ITB9SHRS Rank 9
ITB10SHRS Rank 10
Units Actual
Data Availability 13 months
This is the aggregate number of shares purchased for each insider as reported on any Form 4’s filed during a particular month.
Insiders are ranked by number of shares purchased. This item is reported for up to 10 individuals having an insider relationship with a company.
Insider Transaction Note - Top Ten Buys
Mnemonic ITB1NOTE RANK 1
ITB2NOTE RANK 2
ITB3NOTE RANK 3
ITB4NOTE RANK 4
ITB5NOTE RANK 5
ITB6NOTE RANK 6
ITB7NOTE RANK 7
ITB8NOTE RANK 8
ITB9NOTE RANK 9
ITB10NOTE RANK 10
Units Code
Data Availability 13 months
This is a footnote indicating that the transaction was an amended filing. Insiders are ranked by number of shares purchased. This item is reported for up to 10 individuals having an insider relationship with a company.

Research Insight North America Data Guide
474
Code Description
A Amended filing
Insider Transaction Value - Top Ten Buys
Mnemonic ITB1VAL Rank 1
ITB2VAL Rank 2
ITB3VAL Rank 3
ITB4VAL Rank 4
ITB5VAL Rank 5
ITB6VAL Rank 6
ITB7VAL Rank 7
ITB8VAL Rank 8
ITB9VAL Rank 9
ITB10VAL Rank 10
Units Actual
Data Availability 13 months
This is the total value of all purchase transactions by an insider after taking into account all transactions reported on any Form 4’s filed during a particular month. This item is calculated by multiplying the number of shares purchased by the price on the transaction date for each transaction, and then aggregating the results.
Insiders are ranked by number of shares purchased. This item is reported for up to 10 individuals having an insider relationship with a company.

475
Chapter 16 Insider Trading Data
Insider Beginning Date - Top Ten Sells Mnemonic ITS1BDTE Rank 1
ITS2DBTE Rank 2
ITS3BDTE Rank 3
ITS4BDTE Rank 4
ITS5BDTE Rank 5
ITS6BDTE Rank 6
ITS7BDTE Rank 7
ITS8BDTE Rank 8
ITS9BDTE Rank 9
ITS10BDTE Rank 10
Units MM/DD/YY
Data Availability 13 months
This is the first day on which part of a summarized sale transaction occurred as reported on any Form 4’s filed during a particular month. For example, if the insider made more than one sale transaction within a certain month, each of the Form 4 filings are taken into consideration for that entire month. This item is the date of when the first sale transaction occurred for that particular month.
Insiders are ranked by number of shares sold. This item is reported for up to 10 individuals having an insider relationship with a company.
Insider Beginning Price - Top Ten Sells Mnemonic ITS1LPRC Rank 1
ITS2LPRC Rank 2
ITS3LPRC Rank 3
ITS4LPRC Rank 4
ITS5LPRC Rank 5
ITS6LPRC Rank 6
ITS7LPRC Rank 7
ITS8LPRC Rank 8

Research Insight North America Data Guide
476
ITS9LPRC Rank 9
ITS10LPRC Rank 10
Units Dollars and cents
Data Availability 13 months
This is the lowest price at which part of a summarized sale transaction occurred as reported on any Form 4’s filed during a particular month. For example, if the insider made more than one sale transaction within a certain month, each of the Form 4 filings are taken into consideration for that entire month. This is the lowest price of when any sale transactions occurred for that particular month.
Insiders are ranked by number of shares sold. This item is reported for up to 10 individuals having an insider relationship with a company.
Insider Ending Date - Top Ten Sells Mnemonic ITS1EDTE Rank 1
ITS2EDTE Rank 2
ITS3EDTE Rank 3
ITS4EDTE Rank 4
ITS5EDTE Rank 5
ITS6EDTE Rank 6
ITS7EDTE Rank 7
ITS8EDTE Rank 8
ITS9EDTE Rank 9
ITS10EDTE Rank 10
Units MM/DD/YY
Data Availability 13 months
This is the last day on which part of a summarized sale transaction occurred as reported on any Form 4’s filed during a particular month. For example, if the insider made more than one sale transaction within a certain month, each of the Form 4 filings are taken into consideration for that entire month. This item is the date of when the last sale transaction occurred for that particular month.

477
Chapter 16 Insider Trading Data
Insiders are ranked by number of shares sold. This item is reported for up to 10 individuals having an insider relationship with a company.
Insider Ending Price - Top Ten Sells Mnemonic ITS1HPRC Rank 1
ITS2HPRC Rank 2
ITS3HPRC Rank 3
ITS4HPRC Rank 4
ITS5HPRC Rank 5
ITS6HPRC Rank 6
ITS7HPRC Rank 7
ITS8HPRC Rank 8
ITS9HPRC Rank 9
ITS10HPRC Rank 10
Units Dollars and cents
Data Availability 13 months
This is the highest price at which part of a summarized sale transaction occurred as reported on any Form 4’s filed during a particular month. For example, if the insider made more than one sale transaction within a certain month, each of the Form 4 filings are taken into consideration for that entire month. This item is the highest price of when any sale transactions occurred for that particular month.
Insiders are ranked by number of shares sold. This item is reported for up to 10 individuals having an insider relationship with a company.
Insider Name - Top Ten Sells Mnemonic ITS1NAME Rank 1
ITS2NAME Rank 2
ITS3NAME Rank 3

Research Insight North America Data Guide
478
ITS4NAME Rank 4
ITS5NAME Rank 5
ITS6NAME Rank 6
ITS7NAME Rank 7
ITS8NAME Rank 8
ITS9NAME Rank 9
ITS10NAME Rank 10
Units Text
Data Availability 13 months
This is the name of the individual reporting the sale of shares on the Form 4.
Insiders are ranked by number of shares sold. This item is reported for up to 10 individuals having an insider relationship with a company.
Insider Rank - Top Ten Sells Mnemonic ITS1RANK Rank 1
ITS2RANK Rank 2
ITS3RANK Rank 3
ITS4RANK Rank 4
ITS5RANK Rank 5
ITS6RANK Rank 6
ITS7RANK Rank 7
ITS8RANK Rank 8
ITS9RANK Rank 9
ITS10RANK Rank 10
Units Integer
Data Availability 13 months

479
Chapter 16 Insider Trading Data
This item ranks insiders by number of shares sold, from the highest number of shares to the lowest number, as reported on the Form 4.
If the number of shares sold is equal to any other insider, then additional ranking criteria are applied in the following hierarchy: 1. Number of Share Holdings (highest to lowest)
2. Insider Ending Date (earliest to latest)
3. Insider Name (in reverse alphabetical order, Z to A)
Insider Relation - Top Ten Sells Mnemonic ITS1RLTN Rank 1
ITS2RLTN Rank 2
ITS3RLTN Rank 3
ITS4RLTN Rank 4
ITS5RLTN Rank 5
ITS6RLTN Rank 6
ITS7RLTN Rank 7
ITS8RLTN Rank 8
ITS9RLTN Rank 9
ITS10RLTN Rank 10
Units Code
Data Availability 13 months
This item describes the individual’s position in the company or relationship to the company. Insiders are ranked by number of shares sold. This item is reported for up to 10 individuals having an insider relationship with a company.
The codes are as follows:
Code Description
AF Affiliated Person
AI Affiliate of Investment Advisor
B Beneficial Owner of more than 10% of a class of a company’s equity security

Research Insight North America Data Guide
480
BC Beneficial Owner as Custodian
BT Beneficial Owner as Trustee
CB Chairman of the Board
CE Chief Executive Officer
CF Chief Financial Officer
CO Chief Operating Officer
CP Controlling Person
D Director
DO Director and Beneficial Owner
GP General Partner
H Officer, Director and Beneficial Owner
IA Investment Advisor
IS Indirect Shareholder
LP Limited Partner
MC Member of Committee or Advisory Board
N None
O Officer
OB Officer and Beneficial Owner
OD Officer and Director
OS Officer of a Subsidiary
OT Officer and Treasurer
OX Divisional Officer
P President
SH Shareholder
TR Treasurer
TT Trustee
UK Unknown
VP Vice President
VT Voting Trustee
Insider Share Holdings - Top Ten Sells Mnemonic ITS1HLDG Rank 1
ITS2HLDG Rank 2

481
Chapter 16 Insider Trading Data
ITS3HLDG Rank 3
ITS4HLDG Rank 4
ITS5HLDG Rank 5
ITS6HLDG Rank 6
ITS7HLDG Rank 7
ITS8HLDG Rank 8
ITS9HLDG Rank 9
ITS10HLDG Rank 10
Units Actual
Data Availability 13 months
This is the remaining shares held, both directly and indirectly, by an insider after taking into account all sale transactions reported on any Form 4’s filed during a particular month. It is an as reported number.
Insiders are ranked by number of shares sold. This item is reported for up to 10 individuals having an insider relationship with a company.
Insider Shares Executed - Top Ten Sells Mnemonic ITS1SHRS Rank 1
ITS2SHRS Rank 2
ITS3SHRS Rank 3
ITS4SHRS Rank 4
ITS5SHRS Rank 5
ITS6SHRS Rank 6
ITS7SHRS Rank 7
ITS8SHRS Rank 8
ITS9SHRS Rank 9
ITS10SHRS Rank 10

Research Insight North America Data Guide
482
Units Actual
Data Availability 13 months
This is the aggregate number of shares sold for each insider as reported on any Form 4’s filed during a particular month.
Insiders are ranked by number of shares sold. This item is reported for up to 10 individuals having an insider relationship with a company.
Insider Transaction Note - Top Ten Sells Mnemonic ITS1NOTE Rank 1
ITS2NOTE Rank 2
ITS3NOTE Rank 3
ITS4NOTE Rank 4
ITS5NOTE Rank 5
ITS6NOTE Rank 6
ITS7NOTE Rank 7
ITS8NOTE Rank 8
ITS9NOTE Rank 9
ITS10NOTE Rank 10
Units Code
Data Availability 13 months
This is a footnote indicating either that the transaction was an option-related sale or is an amended filing. Insiders are ranked by number of shares sold. This item is reported for up to 10 individuals having an insider relationship with a company.
Code Description
O Option-related sale
A Amended filing
C Combination O & A

483
Chapter 16 Insider Trading Data
Insider Transaction Value - Top Ten Sells Mnemonic ITS1VAL Rank 1
ITS2VAL Rank 2
ITS3VAL Rank 3
ITS4VAL Rank 4
ITS5VAL Rank 5
ITS6VAL Rank 6
ITS7VAL Rank 7
ITS8VAL Rank 8
ITS9VAL Rank 9
ITS10VAL Rank 10
Units Actual
Data Availability 13 months
This is the total value of all sale transactions by an insider after taking into account all transactions reported on any Form 4’s filed during a particular month. This item is calculated by multiplying the number of shares sold by the price on the transaction date for each transaction, and then aggregating the results.
Insiders are ranked by number of shares sold. This item is reported for up to 10 individuals having an insider relationship with a company.
Insider Buys Shares - Summary Data Mnemonic ITBYSHR3
ITBYSHR6
ITBYSHR12
Units Integer
This is the total number of shares purchased during the latest 3-month, 6-month or 12-month period. This item includes all purchases over 100 shares and is an actual figure.

Research Insight North America Data Guide
484
Insider Sells Shares - Summary Data Mnemonic ITSLSHR3
ITSLSHR6
ITSLSHR12
Units Integer
This is the total number of shares sold during the latest 3-month, 6-month or 12-month period. This item includes all sales over 100 shares and is an actual figure.
Insider Net Shares - Summary Data Mnemonic ITNTSHR3
ITNTSHR6
ITNTSHR12
Units Integer
This is the total net number of shares purchased minus shares sold during the latest 3-month, 6-month or 12-month period. This item includes all sales over 100 shares and is an actual figure. The aggregate-level data is based on all of the shareholders for which data is available, not just the top 10.
Insider Buys Transactions - Summary Data Mnemonic ITBUYS3
ITBUYS6
ITBUYS12
Units Integer
This is the total number of buy transactions during the latest 3-month, 6-month or 12-month period. This item includes all transactions over 100 shares and is an actual figure.
Insider Sells Transactions - Summary Data Mnemonic ITSELLS3
ITSELLS6
ITSELLS12

485
Chapter 16 Insider Trading Data
Units Integer
This is the total number of sell transactions during the latest 3-month, 6-month or 12-month period. This item includes all transactions over 100 shares and is an actual figure.
Insider Net Transactions - Summary Data Mnemonic ITNET3
ITNET6
ITNET12
Units Integer
This is the total net number of buy transactions minus sell transactions during the latest 3-month, 6-month or 12-month period. This item includes all transactions over 100 shares and is an actual figure.
Insider Number of Buys Latest Month Mnemonic ITBRANK
Concept Calculation
@isvalue(itb1rank)+@isvalue(itb2rank)+ @isvalue(itb3rank)+@isvalue(itb4rank)+ @isvalue(itb5rank)+@isvalue(itb6rank)+ @isvalue(itb7rank)+@isvalue(itb8rank)+ @isvalue(itb9rank)+@isvalue(itb10rank)
Data Availability 13 months
This concept returns the total number of insiders having a position in a company for the latest month or can be used to go back in time.
For example, if this concept returns a value of "7" for a company at a particular time period, then there are a total of seven insiders having a stake in the company.
Examples:
ITBRANK[-13] will return the total number of insiders a year ago from the current monthly period (CPDM) for actively traded companies.
ITBRANK[sep02] will return the total number of insiders September 2002.
Insider Number of Sells Latest Month Mnemonic ITSRANK

Research Insight North America Data Guide
486
Concept Calculation
@isvalue(its1rank)+@isvalue(its2rank)+ @isvalue(its3rank)+@isvalue(its4rank)+ @isvalue(its5rank)+@isvalue(its6rank)+ @isvalue(its7rank)+@isvalue(its8rank)+ @isvalue(its9rank)+@isvalue(its10rank)
Data Availability 13 months
This concept returns the total number of insiders having a position in a company for the latest month or can be used to go back in time.
For example, if this concept returns a value of "7" for a company at a particular time period, then there are a total of seven insiders having a stake in the company.
Examples:
ITSRANK[-13] will return the total number of insiders a year ago from the current monthly period (CPDM) for actively traded companies.
ITSRANK[Sep02] will return the total number of insiders September 2002.
Insider Top 10 Buys - Note Avail Mnemonic ITBTNOTE
Concept calculation @VALUE(ITB1NOTE,ITB2NOTE,ITB3NOTE, ITB4NOTE,ITB5NOTE,ITB6NOTE,ITB7NOTE, ITB8NOTE,ITB9NOTE,ITB10NOTE)
Data Availability 13 months
This concept checks to see if a footnote exists in any of the Insider Transaction Note - Top Ten Buys in the current month or can be used to go back in time.
It is used in other Insider Top 10 concepts for additional data checks.
Insider Top 10 Shares Held - Buys
Mnemonic ITBTHLDG
Concept Calculation
@value(itb1hldg,0)+@value(itb2hldg,0) +@value(itb3hldg,0)+@value(itb4hldg,0) +@value(itb5hldg,0)+@value(itb6hldg,0) +@value(itb7hldg,0)+@value(itb8hldg,0) +@value(itb9hldg,0)+@value(itb10hldg,0) [@mnt(0m)]
Data Availability 13 months

487
Chapter 16 Insider Trading Data
This concept gives the aggregate number of remaining shares held, of the Top 10 Insider Buyers for the current month or can be used to go back in time.
Examples:
ITBTHLDG[-13] will return the total aggregated Top 10 remaining shares held a year ago from the current monthly period (CPDM) for actively traded companies.
ITBTHLDG[Sep02] will return the total aggregated Top 10 remaining shares held for September 2002.
Insider Top 10 Shares Executed - Buys Mnemonic ITBTSHRS
Concept Calculation
@value(itb1shrs,0)+@value(itb2shrs,0)+ @value(itb3shrs,0)+@value(itb4shrs,0)+ @value(itb5shrs,0)+@value(itb6shrs,0)+ @value(itb7shrs,0)+@value(itb8shrs,0)+ @value(itb9shrs,0)+@value(itb10shrs,0) [@mnt(0m)]
Data Availability 13 months
This concept gives the aggregate number of insider shares executed by the Top 10 Insider Buyers for the current month or can be used to go back in time.
Examples:
ITBTSHRS[-13] will return the total aggregated shares purchased of all Top 10 insiders a year ago from the current monthly period (CPDM) for actively traded companies.
ITBTSHRS[Sep02] will return the total aggregated shares purchased of all Top 10 insiders for September 2002.
Insider Top 10 Transaction Value - Buys
Mnemonic ITBTVAL
Concept Calculation
@value(itb1val,0)+@value(itb2val,0)+ @value(itb3val,0)+@value(itb4val,0)+ @value(itb5val,0)+@value(itb6val,0)+ @value(itb7val,0)+@value(itb8val,0)+ @value(itb9val,0)+@value(itb10val,0) [@mnt(0m)]
Data Availability 13 months

Research Insight North America Data Guide
488
This concept gives the aggregate total value of purchase transactions made by the top 10 Insider Buyers for the current month or can be used to go back in time.
Examples:
ITBTVAL[-13] will return the total aggregated value of share transactions of all Top 10 insiders a year ago from the current monthly period (CPDM) for actively traded companies.
ITBTVAL[Sep02] will return the total aggregated value of share purchased of all Top 10 insiders for September 2002.
Insider Top 10 Shares Held - Sells Mnemonic ITSTHLDG
Concept Calculation
@value(its1hldg,0)+@value(its2hldg,0)+ @value(its3hldg,0)+@value(its4hldg,0)+ @value(its5hldg,0)+@value(its6hldg,0)+ @value(its7hldg,0)+@value(its8hldg,0)+ @value(its9hldg,0)+@value(its10hldg,0) [@mnt(0m)]
Data Availability 13 months
This concept gives the aggregate number of remaining shares held, of the Top 10 Insider Sellers for the current month or can be used to go back in time.
Examples:
ITSTHLDG[-13] will return the total aggregated Top 10 remaining shares held a year ago from the current monthly period )CPDM) for actively traded companies.
ITSTHLDG[Sep02] will return the total aggregated Top 10 remaining shares held for September 2002.
Insider Top 10 Shares Executed - Sells Mnemonic ITSTSHRS
Concept Calculation
@value(its1shrs,0)+@value(its2shrs,0)+ @value(its3shrs,0)+@value(its4shrs,0)+ @value(its5shrs,0)+@value(its6shrs,0)+ @value(its7shrs,0)+@value(its8shrs,0)+ @value(its9shrs,0)+@value(its10shrs,0) [@mnt(0m)]
Data Availability 13 months

489
Chapter 16 Insider Trading Data
This concept gives the aggregate number of insider shares executed by the Top 10 Insider Sellers for the current month or can be used to go back in time.
Examples:
ITSTSHRS[-13] will return the total aggregated shares sold of all Top 10 insiders a year ago from the current monthly period (CPDM) for actively traded companies.
ITSTSHRS[Sep02] will return the total aggregated shares sold of all Top 10 insiders for September 2002.
Insider Top 10 Transaction Value - Sells Mnemonic ITSTVAL
Concept Calculation
@value(its1val,0)+@value(its2val,0)+ @value(its3val,0)+@value(its4val,0)+ @value(its5val,0)+@value(its6val,0)+ @value(its7val,0)+@value(its8val,0)+ @value(its9val,0)+@value(its10val,0) [@mnt(0m)]
Data Availability 13 months
This concept gives the aggregate total value of sale transactions made by the top 10 Insider Sellers for the current month or can be used to go back in time.
Examples:
ITSTVAL[-13] will return the total aggregated value of all share transactions of all Top 10 insiders a year ago from the current monthly period (CPDM) for actively traded companies.
ITSTVAL[Sep02] will return the total aggregated value of all the shares sold of all Top 10 insiders for September 2002.
Insider Top 10 Sells - Note Available Mnemonic ITSTNOTE
Concept calculation @VALUE(@OR(ITSANOTE,ITSCNOTE),0)
Data Availability 13 months
This concept checks to see if a footnote exists in any of the Insider Transaction Note - Top Ten Sells in the current month or can be used to go back in time.
It is used in other Insider Top 10 concepts for additional data checks.

Research Insight North America Data Guide
490
Insider Total Shares Held - Common Mnemonic ITTLSHRC
Units Millions
This item is the total number of shares held by management in the company’s outstanding common stock per the DEF 14A, Definitive Proxy Statement.
It excludes stock options exercised.
Data is as of the latest DEF14A – Insider Total Shares Held-Date, ITTLDTE.
This item is reported for each issue for any company reporting more than one class of common stock which trade. For multiple issues that do not trade, they are aggregated with the primary trading issue. Refer to Insider Total Shares Held Note - ITTLNOTE for additional comments.
Insider Total Shares Held - Date Mnemonic ITTLDTE
Units MM/DD/YY
Data related to this date item is the Insider Total Shares Held data (ITTLSHRC, ITTLSHRD, and ITTLSHRO). This data is collected from the DEF 14A, Definitive Proxy Statement.
This item is the beneficial ownership date from the latest DEF 14A Proxy and corresponds to the related data, Insider Total Shares Held.
Note: If the as-reported Proxy beneficial ownership date falls on a weekend, then this date will be adjusted and reset to the previous weekday (Friday).
Insider Total Shares Held - Diluted Mnemonic ITTLSHRD
Units Millions
This item is the total number of shares held by management in the company’s outstanding common stock per the DEF 14A, Definitive Proxy Statement.
It includes stock options exercised.
Data is as of the latest DEF14A – Insider Total Shares Held-Date, ITTLDTE.
This item is reported for each issue for any company reporting more than one class of common stock which trade. For multiple issues that do not trade, they are aggregated with the primary trading issue. Refer to Insider Total Shares Held Note - ITTLNOTE for additional comments.

491
Chapter 16 Insider Trading Data
Insider Total Shares Held - Options Mnemonic ITTLSHRO
Concept calculation ittlshrd - ittlshrc
Units Millions
This item is the total number of stock options held by management in the company’s outstanding common stock per the DEF 14A, Definitive Proxy Statement.
Data is as of the latest DEF14A – Insider Total Shares Held-Date, ITTLDTE.
This item is reported for each issue for any company reporting more than one class of common stock which trade. For multiple issues that do not trade, they are aggregated with the primary trading issue. Refer to Insider Total Shares Held Note - ITTLNOTE for additional comments.
Insider Total Shares Held Note Mnemonic ITTLNOTE
This is used to explain any additional insight or unusual cases in the collection of the number of shares held by management* that is used in calculating the various company float formulas or the Total Insider Shares Held data.
For some companies, the notes will represent cases where multiple shares exist and they are included with the primary traded stock.
*The Insider Total Shares Held Note applies to the following data items:
ITTLSHRC: Insider Total Shares Held – Common ITTLSHRD: Insider Total Shares Held – Diluted ITTLSHRO: Insider Total Shares Held – Options
Insider Total Shares Held - Common % of Shares Outstanding Mnemonic ITTLSHRCS
Concept calculation (ITTLSHRC/CSHOC)*100
Units Percent
This concept is Insider Total Shares Held-Common divided by Common Shares Outstanding - Current Issue multiplied by 100.
It excludes stock options exercised.
Insider Total Shares Held - Diluted % of Shares Outstanding Mnemonic ITTLSHRDS

Research Insight North America Data Guide
492
Concept calculation (ITTLSHRD/CSHOC)*100
Units Percent
This concept is Insider Total Shares Held-Diluted divided by Common Shares Outstanding - Current Issue multiplied by 100.
It includes stock options exercised.
Insider Transaction Note - Top Ten Buys Mnemonic ITB1NOTE Rank 1
ITB2NOTE Rank 2
ITB3NOTE Rank 3
ITB4NOTE Rank 4
ITB5NOTE Rank 5
ITB6NOTE Rank 6
ITB7NOTE Rank 7
ITB8NOTE Rank 8
ITB9NOTE Rank 9
ITB10NOTE Rank 10
Units Code
Data Availability 13 months
This is a footnote indicating that the transaction was an amended filing. Insiders are ranked by number of shares purchased. This item is reported for up to 10 individuals having an insider relationship with a company.
Code Description
A Amended filing
Market Float Management Value Common Mnemonic MKFMVC
Concept calculation PRCCM[@MNT(ITTLDTE)]*FLOATMC

493
Chapter 16 Insider Trading Data
Units Millions
This company level concept multiplies monthly close price aligned to the latest DEF 14A, Definitive Proxy Statement SEC filing by the company's Float Management Common Shares.
Market Float Management Value Common - Current Company Level Mnemonic MKFMVCCC
Concept calculation @CSUM(PRCCD*(CSHOC-ITTLSHRC),@SET (@CHGCO(ISSUE),TPCI=0))
Units Millions
This company level concept multiplies daily close price by the company's Float Management Common-Current Issue-FLOATMCC.
For any companies reporting more than one class of common stock which trade, each issue will be aggregated.
Market Float Management Value Common - Current Issue Mnemonic MKFMVCC
Concept calculation PRCCD*FLOATMCC
Units Millions
This issue level concept multiplies daily close price by the company's Float Management Common-Current Issue.
Market Float Management Value Diluted Mnemonic MKFMVD
Concept calculation PRCCM[@MNT(ITTLDTE)]*FLOATMD
Units Millions
This company level concept multiplies monthly close price aligned to the latest DEF 14A, Definitive Proxy Statement SEC filing by the company's Float Management Diluted Shares.
Market Float Management Value Diluted - Current Company Level Mnemonic MKFMVDCC
Concept calculation @CSUM(PRCCD*(CSHOC- ITTLSHRD),@SET (@CHGCO(ISSUE),TPCI=0))

Research Insight North America Data Guide
494
Units Millions
This company level concept multiplies daily close price by the company's Float Management Diluted-Current Issue-FLOATMDC.
For any companies reporting more than one class of common stock which trade, each issue will be aggregated.
Market Float Management Value Diluted - Current Issue Mnemonic MKFMVDC
Concept calculation PRCCD*FLOATMDC
Units Millions
This issue level concept multiplies daily close price by the company's Float Management Diluted-Current Issue.
Market Float Value Common Mnemonic MKFVC
Concept calculation PRCCM[@MNT(FLOATDTEC)]*FLOATC
Units Millions
This company level concept multiplies monthly close price aligned to the either of these latest SEC filings: DEF 14A, Definitive Proxy Statement, 13D, 13G, or 13F Form by the company's Float Common Shares.
Market Float Value Common - Current Company Level Mnemonic MKFVCCC
Concept calculation @CSUM(PRCCD*(CSHOC - (CSHFLC+@IF (@ISNA(CSH5OFLC),0,CSH5OFLC))), @SET(@CHGCO(ISSUE),TPCI=0))
Units Millions
This company level concept multiplies daily close price by the company's Float Common-Current Issue-FLOATCC.
For any companies reporting more than one class of common stock that trades, each issue will be aggregated.

495
Chapter 16 Insider Trading Data
Market Float Value Common - Current Issue Mnemonic MKFVCC
Concept calculation PRCCD*FLOATDC
Units Millions
This issue level concept multiplies daily close price by the company's Float Common-Current Issue.
Market Float Value Diluted Mnemonic MKFVD
Concept calculation PRCCM[@MNT(FLOATDTEC)]*FLOATD
Units Millions
This company level concept multiplies monthly close price aligned to the either of these latest SEC filings: DEF 14A, Definitive Proxy Statement, 13D, 13G, or 13F Form by the company's Float Diluted Shares.
Market Float Value Diluted - Current Company Level Mnemonic MKFVDCC
Concept calculation @CSUM(PRCCD*(CSHOC - (CSHDFLC+@IF (@ISNA(CSH5OFLC),0, CSH5OFLC))),@SET (@CHGCO(ISSUE),TPCI=0))
Units Millions
This company level concept multiplies daily close price by the company's Float Diluted-Current Issue-FLOATDC.
For any companies reporting more than one class of common stock which trade, each issue will be aggregated.
Market Float Value Diluted - Current Issue Mnemonic MKFVDC
Concept calculation (PRCCD*FLOATDC)
Units Millions
This issue level concept multiplies daily close price by the company's Float Diluted-Current Issue.


497
Chapter 17 Institutional Ownership Data
Institutional Ownership Data
Institutional holders are those investment managers having a fair market value of equity assets under management of $100 million or more. Certain banks, insurance companies, investment advisers, investment companies, foundations and pension funds are included in this category. Institutional managers are required to disclose their holdings and submit their 13F filings with the SEC quarterly.
Institutional Data in Research Insight is provided by Computershare Analytics, N.A., Inc.. which collects and adds value to a vast amount of proprietary financial data and distributes that data through subscriptions and partnerships with internet financial networks and leading data providers.
Institutional data features: Detail Top Ten Buys, Top Ten Sells, Top Ten Changes and Top Ten Holders Aggregate Summary data 5 quarters of data stored as monthly items; updated weekly Issue-level data Data in Actual Numbers Available through Internet daily download
Institutional Ownership Summary data has been adjusted for stock splits and dividends. Top 10 Detail data can be adjusted or unadjusted at the user’s preference.
Current quarter information is based on the most recent 13Fs filed. Data may be in a preliminary stage until the 8th week after the calendar quarter ending period.
Concepts
Data Item Name
Mnemonic . . . page
Institutional Owner Percent Total Shares Outstanding - Current Quarter
IOTSHR0 . . . 563
Institutional Owner Percent Total Shares Outstanding - Quarter minus 1
IOTSHR1 . . . 563
Institutional Owner Percent Total Shares Outstanding - Quarter minus 2
IOTSHR2 . . . 563
Institutional Owner Percent Total Shares Outstanding - Quarter minus 3
IOTSHR3 . . . 564
Institutional Owner Percent Total Shares Outstanding - Quarter minus 4
IOTSHR4 . . . 565
Institutional Top 10 Share Holdings - Sells
IOSTHLD . . . 587
CHAPTER 17

Research Insight North America Data Guide
498
Institutional Top 10 Share Holdings - Buys
IOBTHLD . . . 586
Institutional Top 10 Share Holdings - Changes
IOCTHLD . . . 586
Institutional Top 10 Share Holdings - Holdings
IOHTHLD . . . 587
Institutional Top 10 Share Holdings - Previous - Sells
IOSTHLDP . . . 590
Institutional Top 10 Share Holdings - Previous - Buys
IOBTHLDP . . . 588
Institutional Top 10 Share Holdings - Previous - Changes
IOCTHLDP . . . 589
Institutional Top 10 Share Holdings - Previous - Holdings
IOHTHLDP . . . 590
Institutional Top 10 Shares Executed - Sells
IOSTSHRS . . . 592
Institutional Top 10 Shares Executed - Buys
IOBTSHRS . . . 591
Institutional Top 10 Shares Executed - Changes
IOCTSHRS . . . 592
Institutional Total Percent Change in Shares - Sells
IOSTCHLD . . . 594
Institutional Total Percent Change in Shares - Buys
IOBTCHLD . . . 593
Institutional Total Percent Change in Shares - Changes
IOCTCHLD . . . 593
Institutional Total Percent Change in Shares – Holdings
IOHTCHLD . . . 594
Institutions Buying INSTBUY . . . 600 Institutions Selling INSTSELL . . . 600 Last Calendar Quarter End Month CALQTR . . . 600
Top Ten Sell Transactions
Data Item Name Mnemonic . . . page Closed Position Indicator IOS#POS . . . 580 Institution Name IOS#NAME . . . 581 Institution Rank IOS#RANK . . . 581 Period End Date IOS#PDT . . . 582 Previous Period End Date IOS#PPDT . . . 583 Share Holdings IOS#HLD . . . 584 Share Holdings – Previous IOS#HLDP . . . 584 Shares Executed IOS#SHRS . . . 585

499
Chapter 17 Institutional Ownership Data
Top Ten Buy Transactions
Data Item Name Mnemonic . . . page New Position Indicator IOB#POS . . . 566 Institution Name IOB#NAME . . . 565 Institution Rank IOB#RANK . . . 564 Period End Date IOB#PDT . . . 567 Previous Period End Date IOB#PPDT . . . 567 Share Holdings IOB#HLD . . . 568 Share Holdings - Previous IOB#HLDP . . . 569 Shares Executed IOB#SHRS . . . 570
Top Ten Changes in Shares Held
Data Item Name Mnemonic . . . page Institution Name IOC#NAME . . . 570 Institution Rank IOC#RANK . . . 571 Period End Date IOC#PDT . . . 572 Previous Period End Date IOC#PPDT . . . 572 Share Holdings IOC#HLD . . . 573 Share Holdings - Previous IOC#HLDP . . . 574 Shares Executed IOC#SHRS . . . 575
Top Ten Holdings
Data Item Name Mnemonic . . . page Institution Name IOH#NAME . . . 575 Institution Rank IOH#RANK . . . 576 Period End Date IOH#PDT . . . 577 Previous Period End Date IOH#PPDT . . . 578 Share Holdings IOH#HLD . . . 579 Share Holdings - Previous IOH#HLDP . . . 578
Summary Items
Data Item Name Mnemonic . . . page Institutional Closed Positions IOCLPOSN# . . . 595 Institutional New IO Buyers IONWHLDR# . . . 596

Research Insight North America Data Guide
500
Institutional Total IO Buyers IOTLBYS# . . . 597 Institutional Total IO Holders IOTLHLDR# . . . 598 Institutional Total IO Sellers IOTLSLS# . . . 598 Institutional Total Shares Held IOTLSHR# . . . 599 Institutional Buys Shares IOBYSHR# . . . 595 Institutional Sells Shares IOSLSHR# . . . 599
Institutional Net Shares IONTSHR# . . . 596 Institutional Percent Change from Prior Quarter
IOSHRCHG# . . . 597

501
Chapter 17 Institutional Ownership Data
Data Definitions
13F Form 13F Form quarterly filings are required to be submitted by institutional investment managers who exercise investment discretion of exchange-traded or NASDAQ-quoted equity securities while having, in the aggregate, a fair market value of these equity assets under management of $100 million or more.
Institutional Owner Percent Total Shares Outstanding - Current Quarter Mnemonic IOTSHR0
Concept Calculation
((IOTLSHR0/1000000)/@VALUE(CSHOQ, CSHOC))*100
Data Availability 5 Quarters (as Monthly Time Series)
This concept is the percent of a company’s aggregate number of shares held by institutions to common shares outstanding for the latest available calendar quarter.
Institutional Owner Percent Total Shares Outstanding - Qtr minus 1 Mnemonic IOTSHR1
Concept Calculation ((IOTLSHR1/1000000)/CSHOQ[-1])*100
Data Availability 5 Quarters (as Monthly Time Series)
This concept is the percent of a company’s aggregate number of shares held by institutions to common shares outstanding for the time period that is one calendar quarter prior to the latest available calendar quarter .
Institutional Owner Percent Total Shares Outstanding - Qtr minus 2 Mnemonic IOTSHR2
Concept Calculation ((IOTLSHR2/1000000)/CSHOQ[-2])*100
Data Availability 5 Quarters (as Monthly Time Series)
This concept is the percent of a company’s aggregate number of shares held by institutions to common shares outstanding for the time period that is two calendar quarters prior to the latest available calendar quarter.

Research Insight North America Data Guide
502
Institutional Owner Percent Total Shares Outstanding - Qtr minus 3 Mnemonic IOTSHR3
Concept Calculation ((IOTLSHR3/1000000)/CSHOQ[-3])*100
Data Availability 5 Quarters (as Monthly Time Series)
This concept is the percent of a company’s aggregate number of shares held by institutions to common shares outstanding .
for the time period that is three calendar quarters prior to the latest available calendar quarter.
Institutional Owner Percent Total Shares Outstanding - Qtr minus 4 Mnemonic IOTSHR4 **
Concept Calculation ((IOTLSHR4/1000000)/CSHOQ[-4])*100
Data Availability 5 Quarters (as Monthly Time Series)
This concept is the percent of a company’s aggregate number of shares held by institutions to common shares outstanding for the time period that is four calendar quarters prior to the latest available calendar quarter.
* IOTSHR4 concept will be available with next release; only detail data for this time period is available.
Institutional Ownership Institution Rank - Top Ten Buys Mnemonic IOB1RANK Rank 1
IOB2RANK Rank 2
IOB3RANK Rank 3
IOB4RANK Rank 4
IOB5RANK Rank 5
IOB6RANK Rank 6
IOB7RANK Rank 7
IOB8RANK Rank 8
IOB9RANK Rank 9
IOB10RANK Rank 10

503
Chapter 17 Institutional Ownership Data
Units Integer
Data Availability 5 Quarters (as Monthly Time Series)
The numerical ranking of institutions is based on the top purchases as determined by the total number of net shares purchased by an institution as of the Period End Date.
Institutional Ownership Institution Name - Top Ten Buys Mnemonic IOB1NAME Rank 1
IOB2NAME Rank 2
IOB3NAME Rank 3
IOB4NAME Rank 4
IOB5NAME Rank 5
IOB6NAME Rank 6
IOB7NAME Rank 7
IOB8NAME Rank 8
IOB9NAME Rank 9
IOB10NAME Rank 10
Units Text
Data Availability 5 Quarters (as Monthly Time Series)
This item is the name of the institutional investment manager reporting its portfolio with the SEC in the 13F Form.
This item is reported for up to 10 institutions, ranked by the total number of net shares purchased, from highest to lowest, as of the Period End Date.

Research Insight North America Data Guide
504
Institutional Ownership New Position Indicator - Top Ten Buys Mnemonic IOB1POS Rank 1
IOB2POS Rank 2
IOB3POS Rank 3
IOB4POS Rank 4
IOB5POS Rank 5
IOB6POS Rank 6
IOB7POS Rank 7
IOB8POS Rank 8
IOB9POS Rank 9
IOB10POS Rank 10
Units Code
Data Availability 5 Quarters (as Monthly Time Series)
This item reflects a new position when a value of ‘1’ exists in the field. It is when an institutional investment manager has purchased their first share holdings.
This item is reported for up to 10 institutions, ranked by the total number of net shares purchased, from highest to lowest, as of the Period End Date.
Institutional Ownership Period End Date - Top Ten Buys Mnemonic IOB1PDT Rank 1
IOB2PDT Rank 2
IOB3PDT Rank 3
IOB4PDT Rank 4
IOB5PDT Rank 5
IOB6PDT Rank 6

505
Chapter 17 Institutional Ownership Data
IOB7PDT Rank 7
IOB8PDT Rank 8
IOB9PDT Rank 9
IOB10PDT Rank 10
Units MM/DD/YY
Data Availability 5 Quarters (as Monthly Time Series)
This item is the last day of the calendar quarter, which is the date of an institution’stinstitution’s holdings. It is reported for up to 10 institutions. The institutions are ranked by the total number of net shares purchased, from highest to lowest, as of the Period End Date.
Institutional Ownership Previous Period End Date - Top Ten Buys Mnemonic IOB1PPDT Rank 1
IOB2PPDT Rank 2
IOB3PPDT Rank 3
IOB4PPDT Rank 4
IOB5PPDT Rank 5
IOB6PPDT Rank 6
IOB7PPDT Rank 7
IOB8PPDT Rank 8
IOB9PPDT Rank 9
IOB10PPDT Rank 10
Units MM/DD/YY
Data Availability 5 Quarters (as Monthly Time Series)

Research Insight North America Data Guide
506
This item is the previous calendar quarter end date for which an institution’s shareholdings are reported. It is reported for up to 10 institutions. The institutions are ranked by the total number of net shares purchased, from highest to lowest, as of the Period End Date.
Institutional Ownership Share Holdings - Top Ten Buys Mnemonic IOB1HLD Rank 1
IOB2HLD Rank 2
IOB3HLD Rank 3
IOB4HLD Rank 4
IOB5HLD Rank 5
IOB6HLD Rank 6
IOB7HLD Rank 7
IOB8HLD Rank 8
IOB9HLD Rank 9
IOB10HLD Rank 10
Units Actual
Data Availability 5 Quarters (as Monthly Time Series)
This item is the total number of shares held by an institution as of the Period End Date.
This item is reported for up to 10 institutions, ranked by the total number of net shares purchased, from highest to lowest, as of the Period End Date.
Institutional Ownership Share Holdings - Previous - Top Ten Buys Mnemonic IOB1HLDP Rank 1
IOB2HLDP Rank 2
IOB3HLDP Rank 3
IOB4HLDP Rank 4
IOB5HLDP Rank 5

507
Chapter 17 Institutional Ownership Data
IOB6HLDP Rank 6
IOB7HLDP Rank 7
IOB8HLDP Rank 8
IOB9HLDP Rank 9
IOB10HLDP Rank 10
Units Actual
Data Availability 5 Quarters (as Monthly Time Series)
This item is the total number of shares held by an institution as of a Previous Period End Date.
This item is reported for up to 10 institutions, ranked by the total number of net shares purchased, from highest to lowest, as of the Period End Date.
Institutional Ownership Shares Executed - Top Ten Buys Mnemonic
Concept Calculation
Rank
IOB1SHRS (IOB1HLD – (IOB1HLDP*AJEXMI[-3])) Rank 1
IOB2SHRS (IOB2HLD – (IOB2HLDP*AJEXMI[-3])) Rank 2
IOB3SHRS (IOB3HLD – (IOB3HLDP*AJEXMI[-3])) Rank 3
IOB4SHRS (IOB4HLD – (IOB4HLDP*AJEXMI[-3])) Rank 4
IOB5SHRS (IOB5HLD – (IOB5HLDP*AJEXMI[-3])) Rank 5
IOB6SHRS (IOB6HLD – (IOB6HLDP*AJEXMI[-3])) Rank 6
IOB7SHRS (IOB7HLD – (IOB7HLDP*AJEXMI[-3])) Rank 7
IOB8SHRS (IOB8HLD – (IOB8HLDP*AJEXMI[-3])) Rank 8
IOB9SHRS (IOB9HLD – (IOB9HLDP*AJEXMI[-3])) Rank 9
IOB10SHRS (IOB10HLD – (IOB10HLDP*AJEXMI[-3])) Rank 10
Units Actual Data Availability 5 Quarters (as Monthly Time Series)
This item is the total number of net shares purchased by an institution as of the Period End Date.

Research Insight North America Data Guide
508
This item is reported for up to 10 institutions, ranked by the total number of net shares purchased, from highest to lowest, as of the Period End Date.
Institutional Ownership Institution Name - Top Ten Changes in Shares Held Mnemonic IOC1NAME Rank 1
IOC2NAME Rank 2
IOC3NAME Rank 3
IOC4NAME Rank 4
IOC5NAME Rank 5
IOC6NAME Rank 6
IOC7NAME Rank 7
IOC8NAME Rank 8
IOC9NAME Rank 9
IOC10NAME Rank 10
Units Text
Data Availability 5 Quarters (as Monthly Time Series)
This item is the name of the institutional investment manager reporting its portfolio with the SEC in the 13F Form.
This item is reported for up to 10 institutions, ranked by the absolute number of shares transacted by an institution, from highest to lowest, as of the Period End Date.
Institutional Ownership Institution Rank - Top Ten Changes in Shares Held Mnemonic IOC1RANK Rank 1
IOC2RANK Rank 2
IOC3RANK Rank 3

509
Chapter 17 Institutional Ownership Data
IOC4RANK Rank 4
IOC5RANK Rank 5
IOC6RANK Rank 6
IOC7RANK Rank 7
IOC8RANK Rank 8
IOC9RANK Rank 9
IOC10RANK Rank 10
Units Integer
Data Availability 5 Quarters (as Monthly Time Series)
This item ranks institutions by the absolute number of shares transacted by an institution as of the Period End Date. This item is reported for up to 10 institutions.
Institutional Ownership Period End Date - Top Ten Changes in Shares Held Mnemonic IOC1PDT Rank 1
IOC2PDT Rank 2
IOC3PDT Rank 3
IOC4PDT Rank 4
IOC5PDT Rank 5
IOC6PDT Rank 6
IOC7PDT Rank 7
IOC8PDT Rank 8
IOC9PDT Rank 9
IOC10PDT Rank 10
Units MM/DD/YY

Research Insight North America Data Guide
510
Data Availability 5 Quarters (as Monthly Time Series)
This item is the last day of the calendar quarter, which is the date of an institution’s holdings. It is reported for up to 10 institutions. The institutions are ranked by the absolute number of shares transacted, from highest to lowest, as of the Period End Date.
Institutional Ownership Previous Period End Date - Top Ten Changes in Shares Held Mnemonic IOC1PPDT Rank 1
IOC2PPDT Rank 2
IOC3PPDT Rank 3
IOC4PPDT Rank 4
IOC5PPDT Rank 5
IOC6PPDT Rank 6
IOC7PPDT Rank 7
IOC8PPDT Rank 8
IOC9PPDT Rank 9
IOC10PPDT Rank 10
Units MM/DD/YY
Data Availability 5 Quarters (as Monthly Time Series)
This item is the previous calendar quarter end date for which an institution’s shareholdings are reported. It is reported for up to 10 institutions. The institutions are ranked by the absolute number of shares transacted, from highest to lowest, as of the Period End Date.
Institutional Ownership Share Holdings - Top Ten Changes in Shares Held Mnemonic IOC1HLD Rank 1

511
Chapter 17 Institutional Ownership Data
IOC2HLD Rank 2
IOC3HLD Rank 3
IOC4HLD Rank 4
IOC5HLD Rank 5
IOC6HLD Rank 6
IOC7HLD Rank 7
IOC8HLD Rank 8
IOC9HLD Rank 9
IOC10HLD Rank 10
Units Actual
Data Availability 5 Quarters (as Monthly Time Series)
This item is the total number of shares held by an institution as of the Period End Date.
This item is reported for up to 10 institutions, ranked by the absolute number of shares transacted by an institution, from highest to lowest, as of the Period End Date.
Institutional Ownership Share Holdings - Previous - Top Ten Changes in Shares Held Mnemonic IOC1HLDP Rank 1
IOC2HLDP Rank 2
IOC3HLDP Rank 3
IOC4HLDP Rank 4
IOC5HLDP Rank 5
IOC6HLDP Rank 6
IOC7HLDP Rank 7
IOC8HLDP Rank 8
IOC9HLDP Rank 9

Research Insight North America Data Guide
512
IOC10HLDP Rank 10
Units Actual
Data Availability 5 Quarters (as Monthly Time Series)
This item is the total number of shares held by an institution as of the Previous Period End Date.
This item is reported for up to 10 institutions, ranked by the absolute number of shares transacted by an institution, from highest to lowest, as of the Period End Date.
Institutional Ownership Shares Executed - Top Ten Changes in Shares Held Mnemonic IOC1SHRS Rank 1
IOC2SHRS Rank 2
IOC3SHRS Rank 3
IOC4SHRS Rank 4
IOC5SHRS Rank 5
IOC6SHRS Rank 6
IOC7SHRS Rank 7
IOC8SHRS Rank 8
IOC9SHRS Rank 9
IOC10SHRS Rank 10
Units Actual
Data Availability 5 Quarters (as Monthly Time Series)
This item is the quarterly "absolute" change in the number of shares held by an institution.
This item is reported for up to 10 institutions, ranked by the absolute number of shares transacted by an institution, from highest to lowest, as of the Period End Date.

513
Chapter 17 Institutional Ownership Data
Institutional Ownership Institution Name - Top Ten Holdings Mnemonic IOH1NAME Rank 1
IOH2NAME Rank 2
IOH3NAME Rank 3
IOH4NAME Rank 4
IOH5NAME Rank 5
IOH6NAME Rank 6
IOH7NAME Rank 7
IOH8NAME Rank 8
IOH9NAME Rank 9
IOH10NAME Rank 10
Units Text
Data Availability 5 Quarters (as Monthly Time Series)
This item is the name of the institutional investment manager reporting its portfolio with the SEC in the 13F Form.
This item is reported for up to 10 institutions, ranked by the total number of shares of a particular company’s stock held by an institution as of the Period End Date.
Institutional Ownership Institution Rank - Top Ten Holdings Mnemonic IOH1RANK Rank 1
IOH2RANK Rank 2
IOH3RANK Rank 3
IOH4RANK Rank 4
IOH5RANK Rank 5

Research Insight North America Data Guide
514
IOH6RANK Rank 6
IOH7RANK Rank 7
IOH8RANK Rank 8
IOH9RANK Rank 9
IOH10RANK Rank 10
Units Integer
Data Availability 5 Quarters (as Monthly Time Series)
This item ranks institutions by the number of shares of a particular company’s stock, from highest to lowest, as of the Period End Date. This item is reported for up to ten institutions.
Institutional Ownership Period End Date - Top Ten Holdings Mnemonic IOH1PDT Rank 1
IOH2PDT Rank 2
IOH3PDT Rank 3
IOH4PDT Rank 4
IOH5PDT Rank 5
IOH6PDT Rank 6
IOH7PDT Rank 7
IOH8PDT Rank 8
IOH9PDT Rank 9
IOH10PDT Rank 10
Units MM/DD/YY
Data Availability 5 Quarters (as Monthly Time Series)

515
Chapter 17 Institutional Ownership Data
This item is the last day of the calendar quarter, which is the date of an institution’s holdings. It is reported for up to 10 institutions. The institutions are ranked by the total number of shares of a particular company’s stock held.
Institutional Ownership Previous Period End Date - Top Ten Holdings Mnemonic IOH1PPDT Rank 1
IOH2PPDT Rank 2
IOH3PPDT Rank 3
IOH4PPDT Rank 4
IOH5PPDT Rank 5
IOH6PPDT Rank 6
IOH7PPDT Rank 7
IOH8PPDT Rank 8
IOH9PPDT Rank 9
IOH10PPDT Rank 10
Units MM/DD/YY
Data Availability 5 Quarters (as Monthly Time Series)
This item is the previous calendar quarter end date for which an institution's shareholdings are reported. It is reported for up to 10 institutions. The institutions are ranked by the total number of shares of a particular company’s stock held as of the Period End Date.
Institutional Ownership Share Holdings - Previous - Top Ten Holdings Mnemonic IOH1HLDP Rank 1

Research Insight North America Data Guide
516
IOH2HLDP Rank 2
IOH3HLDP Rank 3
IOH4HLDP Rank 4
IOH5HLDP Rank 5
IOH6HLDP Rank 6
IOH7HLDP Rank 7
IOH8HLDP Rank 8
IOH9HLDP Rank 9
IOH10HLDP Rank 10
Units Actual
Data Availability 5 Quarters (as Monthly Time Series)
This item is the total number of shares held by an institution as of a Previous Period End Date.
This item is reported for up to 10 institutions, ranked by the total number of shares of a particular company’s stock held by an institution as of the Period End Date.
Institutional Ownership Share Holdings - Top Ten Holdings Mnemonic IOH1HLD Rank 1
IOH2HLD Rank 2
IOH3HLD Rank 3
IOH4HLD Rank 4
IOH5HLD Rank 5
IOH6HLD Rank 6
IOH7HLD Rank 7
IOH8HLD Rank 8
IOH9HLD Rank 9
IOH10HLD Rank 10

517
Chapter 17 Institutional Ownership Data
Units Actual
Data Availability 5 Quarters (as Monthly Time Series)
This item is the total number of shares held by an institution as of the Period End Date.
This item is reported for up to 10 institutions, ranked by the total number of shares of a particular company’s stock held by an institution.
Institutional Ownership Closed Position Indicator - Top Ten Sells Mnemonic IOS1POS Rank 1
IOS2POS Rank 2
IOS3POS Rank 3
IOS4POS Rank 4
IOS5POS Rank 5
IOS6POS Rank 6
IOS7POS Rank 7
IOS8POS Rank 8
IOS9POS Rank 9
IOS10POS Rank 10
Units Code
Data Availability 5 Quarters (as Monthly Time Series)
This item reflects a closed position when a value of ‘1’ exists in the field. It is when an institutional investment manager has sold all their share holdings.
This item is reported for up to 10 institutions, ranked by the total number of net shares sold, from highest to lowest, as of the Period End Date.
Institutional Ownership Institution Name - Top Ten Sells Mnemonic IOS1NAME Rank 1

Research Insight North America Data Guide
518
IOS2NAME Rank 2
IOS3NAME Rank 3
IOS4NAME Rank 4
IOS5NAME Rank 5
IOS6NAME Rank 6
IOS7NAME Rank 7
IOS8NAME Rank 8
IOS9NAME Rank 9
IOS10NAME Rank 10
Units Text
Data Availability 5 Quarters (as Monthly Time Series)
This item is the name of the institutional investment manager reporting its portfolio with the SEC in the 13F Form.
This item is reported for up to 10 institutions, ranked by the total number of net shares sold, from highest to lowest, as of the Period End Date.
Institutional Ownership Institution Rank - Top Ten Sells Mnemonic IOS1RANK Rank 1
IOS2RANK Rank 2
IOS3RANK Rank 3
IOS4RANK Rank 4
IOS5RANK Rank 5
IOS6RANK Rank 6
IOS7RANK Rank 7
IOS8RANK Rank 8
IOS9RANK Rank 9

519
Chapter 17 Institutional Ownership Data
IOS10RANK Rank 10
Units Integer
Data Availability 5 Quarters (as Monthly Time Series)
This item ranks institutions by the total number of net shares sold, from highest to lowest, as of the Period End Date. This item is reported for up to 10 institutions.
Institutional Ownership Period End Date - Top Ten Sells Mnemonic IOS1PDT Rank 1
IOS2PDT Rank 2
IOS3PDT Rank 3
IOS4PDT Rank 4
IOS5PDT Rank 5
IOS6PDT Rank 6
IOS7PDT Rank 7
IOS8PDT Rank 8
IOS9PDT Rank 9
IOS10PDT Rank 10
Units MM/DD/YY
Data Availability 5 Quarters (as Monthly Time Series)
This item is the last day of the calendar quarter, which is the date of an institution‘s holdings. It is reported for up to 10 institutions. The institutions are ranked by the total number of net shares sold, from highest to lowest, as of the Period End Date.

Research Insight North America Data Guide
520
Institutional Ownership Previous Period End Date - Top Ten Sells Mnemonic IOS1PPDT Rank 1
IOS2PPDT Rank 2
IOS3PPDT Rank 3
IOS4PPDT Rank 4
IOS5PPDT Rank 5
IOS6PPDT Rank 6
IOS7PPDT Rank 7
IOS8PPDT Rank 8
IOS9PPDT Rank 9
IOS10PPDT Rank 10
Units MM/DD/YY
Data Availability 5 Quarters (as Monthly Time Series)
This item is the previous calendar quarter end date for which an institution’s shareholdings are reported. It is reported for up to 10 institutions. The institutions are ranked by the total number of net shares sold, from highest to lowest, as of the Period End Date.
Institutional Ownership Share Holdings - Previous - Top Ten Sells Mnemonic IOS1HLDP Rank 1
IOS2HLDP Rank 2
IOS3HLDP Rank 3
IOS4HLDP Rank 4
IOS5HLDP Rank 5
IOS6HLDP Rank 6
IOS7HLDP Rank 7

521
Chapter 17 Institutional Ownership Data
IOS8HLDP Rank 8
IOS9HLDP Rank 9
IOS10HLDP Rank 10
Units Actual
Data Availability 5 Quarters (as Monthly Time Series)
This item is the total number of shares held by an institution as of the Previous Period End Date.
This item is reported for up to 10 institutions, ranked by the total number of net shares sold, from highest to lowest, as of the Period End Date.
Institutional Ownership Share Holdings - Top Ten Sells Mnemonic IOS1HLD Rank 1
IOS2HLD Rank 2
IOS3HLD Rank 3
IOS4HLD Rank 4
IOS5HLD Rank 5
IOS6HLD Rank 6
IOS7HLD Rank 7
IOS8HLD Rank 8
IOS9HLD Rank 9
IOS10HLD Rank 10
Units Actual
Data Availability 5 Quarters (as Monthly Time Series)

Research Insight North America Data Guide
522
This item is the total number of shares held by an institution as of the Period End Date This item is reported for up to 10 institutions, ranked by the total number of net shares sold, from highest to lowest, as of the Period End Date.
Institutional Ownership Shares Executed - Top Ten Sells Mnemonic Concept Calculation Rank
IOS1SHRS ((IOS1HLDP*AJEXMI[-3])-IOS1HLD) Rank 1
IOS2SHRS ((IOS2HLDP*AJEXMI[-3])-IOS2HLD) Rank 2
IOS3SHRS ((IOS3HLDP*AJEXMI[-3])-IOS3HLD) Rank 3
IOS4SHRS ((IOS4HLDP*AJEXMI[-3])-IOS4HLD) Rank 4
IOS5SHRS ((IOS5HLDP*AJEXMI[-3])-IOS5HLD) Rank 5
IOS6SHRS ((IOS6HLDP*AJEXMI[-3])-IOS6HLD) Rank 6
IOS7SHRS ((IOS7HLDP*AJEXMI[-3])-IOS7HLD) Rank 7
IOS8SHRS ((IOS8HLDP*AJEXMI[-3])-IOS8HLD) Rank 8
IOS9SHRS ((IOS9HLDP*AJEXMI[-3])-IOS9HLD) Rank 9
IOS10SHRS ((IOS10HLDP*AJEXMI[-3])-IOS10HLD) Rank 10
Units Actual Data Availability 5 Quarters (as Monthly Time Series)
This item is the total number of net shares sold by an institution as of the Period End Date.
This item is reported for up to 10 institutions, ranked by the total number of net shares sold, from highest to lowest, as of the Period End Date.
Institutional Top 10 Share Holdings - Buys Mnemonic IOBTHLD
Concept Calculation
(@value(iob1hld,0)+@value (iob2hld,0)+@value(iob3hld,0)+ @value(iob4hld,0)+@value (iob5hld,0)+@value(iob6hld,0)+ @value(iob7hld,0)+@value (iob8hld,0)+@value(iob9hld,0)+ @value(iob10hld,0))
Data Availability 5 Quarters (as Monthly Time Series)

523
Chapter 17 Institutional Ownership Data
This concept returns the aggregate number of total share holdings of the Top Ten Institutional Buyers for the latest available calendar quarter or can be used to go back in time. Examples:
IOBTHLD [CALQTR]
Will return the total aggregated Top 10 shares held a year ago from the latest available calendar quarter institutional data.
IOBTHLD [Sep02]
will return the total aggregated Top 10 shares held that for September 2002.
Institutional Top 10 Share Holdings - Changes Mnemonic IOCTHLD
Concept Calculation
(@value(ioc1hld,0)+@value (ioc2hld,0)+@value(ioc3hld,0)+ @value(ioc4hld,0)+@value (ioc5hld,0)+@value(ioc6hld,0)+ @value(ioc7hld,0)+@value (ioc8hld,0)+@value(ioc9hld,0)+ @value(ioc10hld,0))
Data Availability 5 Quarters (as Monthly Time Series)
This concept returns the aggregate number of total share holdings of the institutions with the Top Ten Changes in Shares Held for the latest available calendar quarter or can be used to go back in time.
Examples:
IOCTHLD [CALQTR]
Will return the total aggregated Top 10 Changes in shares held a year ago from the latest available calendar quarter institutional data.
IOCTHLD [Sep02]
will return the total aggregated Top 10 Changes in shares held for September 2002.
Institutional Top 10 Share Holdings - Holdings Mnemonic IOHTHLD

Research Insight North America Data Guide
524
Concept Calculation
(@value(ioh1hld,0)+@value (ioh2hld,0)+@value(ioh3hld,0)+ @value(ioh4hld,0)+@value (ioh5hld,0)+@value(ioh6hld,0)+ @value(ioh7hld,0)+@value (ioh8hld,0)+@value(ioh9hld,0)+ @value(ioh10hld,0))
Data Availability 5 Quarters (as Monthly Time Series)
This concept returns the aggregate number of total share holdings for the institutions with the Top Ten Holdings for thefor latest available calendar quarter or can be used to go back in time.
Examples:
IOHTHLD [CALQTR]
Will return the total aggregated Top 10 shares held a year ago from the latest available calendar quarter institutional data.
IOHTHLD [Sep02]
will return the total aggregated Top 10 shares held for September 2002.
Institutional Top 10 Share Holdings - Sells Mnemonic IOSTHLD
Concept Calculation
(@value(ios1hld,0)+@value (ios2hld,0)+@value(ios3hld,0)+ @value(ios4hld,0)+@value (ios5hld,0)+@value(ios6hld,0)+ @value(ios7hld,0)+@value (ios8hld,0)+@value(ios9hld,0)+ @value(ios10hld,0))
Data Availability 5 Quarters (as Monthly Time Series)
This concept returns the aggregate number of total share holdings of the Top Ten Institutional Sellers for the latest available calendar quarter or can be used to go back in time.
Examples:
IOSTHLD [CALQTR]
Will return the total aggregated Top 10 shares held a year ago from the latest available calendar quarter institutional data.

525
Chapter 17 Institutional Ownership Data
IOSTHLD [Sep02]
will return the total aggregated Top 10 shares held that for September 2002.
Institutional Top 10 Share Holdings - Previous - Buys Mnemonic IOBTHLDP
Concept Calculation
(@value(iob1hldp,0)+@value (iob2hldp,0)+@value(iob3hldp,0) +@value(iob4hldp,0)+Value (iob5hldp,0)+@value(iob6hldp,0) +@value(iob7hldp,0)+@value (iob8hldp,0)+@value(iob9hldp,0)+ @value(iob10hldp,0))
Data Availability 5 Quarters (as Monthly Time Series)
This concept returns the aggregate number of total share holdings of the Top Ten Institutional Buyers for the Previous calendar quarter from the latest available calendar quarter or can be used to go back in time.
Examples:
IOBTHLDP [CALQTR]
Will return the total aggregated Top 10 shares held a year ago for the Previous calendar quarter based from the latest available calendar quarter institutional data .
IOBTHLDP [Sep02]
will return the total aggregated Top 10 shares held for the Previous calendar quarter from September 2002.
Institutional Top 10 Share Holdings - Previous - Changes Mnemonic IOCTHLDP
Concept Calculation
(@value(ioc1hldp,0)+@value (ioc2hldp,0)+@value(ioc3hldp,0)+ @value(ioc4hldp,0)+@value (ioc5hldp,0)+@value(ioc6hldp,0)+ @value(ioc7hldp,0)+@value (ioc8hldp,0)+@value(ioc9hldp,0)+ @value(ioc10hldp,0))

Research Insight North America Data Guide
526
Data Availability 5 Quarters (as Monthly Time Series)
This concept returns the aggregate number of total share holdings of the of the institutions with the Top Ten Changes in Shares Held for the Previous calendar quarter from the latest available calendar quarter or can be used to go back in time.
Examples:
IOCTHLDP [CALQTR]
Will return the total aggregated Top 10 Changes in shares held from a year ago for the Previous calendar quarter based from the latest available calendar quarter institutional data .
IOCTHLDP [Sep02]
will return the total aggregated Top 10 Changes in shares held for the Previous calendar quarter from September 2002.
Institutional Top 10 Share Holdings - Previous - Holdings Mnemonic IOHTHLDP
Concept Calculation
(@value(ioh1hldp,0)+@value (ioh2hldp,0)+@value(ioh3hldp,0)+ @value(ioh4hldp,0)+@value (ioh5hldp,0)+@value(ioh6hldp,0)+ @value(ioh7hldp,0)+@value (ioh8hldp,0)+@value(ioh9hldp,0)+ @value(ioh10hldp,0))
Data Availability 5 Quarters (as Monthly Time Series)
This concept returns the aggregate number of total share holdings for the institutions with the Top Ten Holdings for the previous calendar quarter from the latest available calendar quarter or can be used to go back in time.
Examples:
IOHTHLDP [CALQTR]
Will return the total aggregated Top 10 shares held a year ago for the Previous calendar quarter based from the latest available calendar quarter institutional data.
IOHTHLDP [Sep02]
will return the total aggregated Top 10 shares held for the Previous calendar quarter from September 2002.

527
Chapter 17 Institutional Ownership Data
Institutional Top 10 Share Holdings - Previous - Sells Mnemonic IOSTHLDP
Concept Calculation
(@value(ios1hldp,0)+@value (ios2hldp,0)+@value(ios3hldp,0)+ @value(ios4hldp,0)+@value (ios5hldp,0)+@value(ios6hldp,0) +@value(ios7hldp,0)+@value (ios8hldp,0)+@value(ios9hldp,0) +@value(ios10hldp,0))[@mnt(0q)]
Data Availability 5 Quarters (as Monthly Time Series)
This concept returns the aggregate number of total share holdings of the Top Ten Institutional Sellers for the Previous calendar quarter from the latest available calendar quarter or can be used to go back in time.
Examples:
IOSTHLDP [CALQTR]
Will return the total aggregated Top 10 shares held a year ago for the Previous calendar quarter based from the latest available calendar quarter institutional data .
IOSTHLDP [Sep02]
will return the total aggregated Top 10 shares held for the Previous calendar quarter from September 2002.
Institutional Top 10 Shares Executed - Buys Mnemonic IOBTSHRS
Concept Calculation
(@value(iob1shrs,0)+@value (iob2shrs,0)+@value(iob3shrs,0)+@value(iob4shrs,0)+@value (iob5shrs,0)+@value(iob6shrs,0) +@value(iob7shrs,0)+@value (iob8shrs,0)+@value(iob9shrs,0) +@value(iob10shrs,0))
Data Availability 5 Quarters (as Monthly Time Series)

Research Insight North America Data Guide
528
This concept returns the Top Ten Institutional Buyers as an aggregated number of total shares that were purchased for the latest available calendar quarter or can be used to go back in time.
Examples:
IOBTSHRS [CALQTR]
Will return the total aggregated Top 10 shares purchased a year ago from the latest available calendar quarter institutional data.
IOBTSHRS [Sep02]
will return the total aggregated Top 10 shares purchased for September 2002.
Institutional Top 10 Shares Executed - Changes Mnemonic IOCTSHRS
Concept Calculation
(@value(ioc1shrs,0)+@value (ioc2shrs,0)+@value(iobcshrs,0)+ @value(ioc4shrs,0)+@value (ioc5shrs,0)+@value(ioc6shrs,0)+ @value(ioc7shrs,0)+@value (ioc8shrs,0)+@value(ioc9shrs,0)+ @value(ioc10shrs,0))
Data Availability 5 Quarters (as Monthly Time Series)
This concept returns the Top Ten Institutional "absolute" changes as an aggregated number of total shares that were executed for the latest available calendar quarter or can be used to go back in time.
Examples:
IOCTSHRS [CALQTR]
Will return the total aggregated Top 10 Changes in shares executed a year ago from the latest available calendar quarter institutional data.
IOCTSHRS [Sep02]
will return the total aggregated Top 10 Changes in shares executed for September 2002.

529
Chapter 17 Institutional Ownership Data
Institutional Top 10 Shares Executed - Sells Mnemonic IOSTSHRS
Concept Calculation
(@value(ios1shrs,0)+@value (ios2shrs,0)+@value(ios3shrs,0)+ @value(ios4shrs,0)+@value (ios5shrs,0)+@value(ios6shrs,0) +@value(ios7shrs,0)+@value (ios8shrs,0)+@value(ios9shrs,0) +@value(ios10shrs,0))
Data Availability 5 Quarters (as Monthly Time Series)
This concept returns the Top Ten Institutional Sellers as an aggregated number of total shares that were sold for the latest available calendar quarter or can be used to go back in time.
Examples:
IOSTSHRS [CALQTR]
Will return the total aggregated Top 10 shares sold a year ago from the latest available calendar quarter institutional data.
IOSTSHRS [Sep02]
will return the total aggregated Top 10 shares sold for September 2002.
Institutional Total Percent Change in Shares - Buys Mnemonic IOBTCHLD
Concept Calculation ((IOBTHLD-IOBTHLDP)/@ABS(IOBTHLDP))*100
Data Availability 5 Quarters (as Monthly Time Series)
This concept is the percent change in share holdings from the previous quarter to the current quarter, for the Top Ten Institutional Buyers.

Research Insight North America Data Guide
530
Institutional Total Percent Change in Shares - Changes Mnemonic IOCTCHLD
Concept Calculation ((IOCTHLD-IOCTHLDP)/@ABS(IOCTHLDP))*100
Data Availability 5 Quarters (as Monthly Time Series)
This concept is the percent change in share holdings from the previous quarter to the current quarter for the institutions with the Top Ten Changes in Shares Held.
Institutional Total Percent Change in Shares - Holdings Mnemonic IOHTCHLD
Concept Calculation ((IOHTHLD-IOHTHLDP)/@ABS(IOHTHLDP))*100
Data Availability 5 Quarters (as Monthly Time Series)
This concept is the percent change in share holdings from the previous quarter to the current quarter for the institutions with the Top Ten Holdings.
Institutional Total Percent Change in Shares - Sells Mnemonic IOSTCHLD
Concept Calculation ((IOSTHLD-IOSTHLDP)/@ABS(IOSTHLDP))*100
Data Availability 5 Quarters (as Monthly Time Series)
This concept is the percent change in share holdings from the previous month to the current month for the institutions with the Top Ten Sells.
Institutional Buys Shares - Summary Data Mnemonic IOBYSHR0 (Current Quarter)
IOBYSHR1 (Current Quarter minus 1)

531
Chapter 17 Institutional Ownership Data
IOBYSHR2 (Current Quarter minus 2)
IOBYSHR3 (Current Quarter minus 3)
IOBYSHR4* (Current Quarter minus 4)
Units Actual
Data Availability Current
This item is the aggregate number of net shares purchased by institutions during the latest available calendar quarter (or for time periods: one/two/three/four calendar quarters prior to the latest available calendar quarter.)
* IOBYSHR4 aggregate data will be available with next release; only detail data for this time period is available.
Institutional Closed Positions - Summary Data Mnemonic IOCLPOSN0 (Current Quarter)
IOCLPOSN1 (Current Quarter minus 1)
IOCLPOSN2 (Current Quarter minus 2)
IOCLPOSN3 (Current Quarter minus 3)
IOCLPOSN4* (Current Quarter minus 4)
Units Integer
Data Availability Current
This item is the aggregate number of institutions that do not report an investment position in the company’s stock at the end of the latest available calendar quarter (or for time periods:
one/two/three/four calendar quarters prior to the latest available calendar quarter;)
* IOCLPOSN4 aggregate data will be available with next release; only detail data for this time period is available.
Institutional Net Shares - Summary Data Mnemonic IONTSHR0 (Current Quarter)
IONTSHR1 (Current Quarter minus 1)
IONTSHR2 (Current Quarter minus 2)
IONTSHR3 (Current Quarter minus 3)

Research Insight North America Data Guide
532
IONTSHR4* (Current Quarter minus 4)
Units Actual
Data Availability Current
This item is the net difference between the sum of shares purchased by institutions and the sum of shares sold by institutions for the latest available calendar quarter (or for time periods:
one/two/three/four calendar quarters prior to the latest available calendar quarter;)
* IONTSHR4 aggregate data will be available with next release; only detail data for this time period is available.
Institutional New IO Buyers - Summary Data Mnemonic IONWHLDR0 (Current Quarter)
IONWHLDR1 (Current Quarter minus 1)
IONWHLDR2 (Current Quarter minus 2)
IONWHLDR3 (Current Quarter minus 3)
IONWHLDR4* (Current Quarter minus 4)
Units Integer
Data Availability Current
This item is the aggregate number of institutions that reported an investment position in the company’s stock at the end the latest available calendar quarter (or for time periods:
one/two/three/four calendar quarters prior to the latest available calendar quarter;)but did not hold shares at the end of the previous quarter.
* IONWHLDR4 aggregate data will be available with next release; only detail data for this time period is available.
Institutional Percent Change from Prior Quarter - Summary Data Mnemonic IOSHRCHG0 (Current Quarter)
IOSHRCHG1 (Current Quarter minus 1)
IOSHRCHG2 (Current Quarter minus 2)
IOSHRCHG3 (Current Quarter minus 3)
IOSHRCHG4* (Current Quarter minus 4)

533
Chapter 17 Institutional Ownership Data
Units Actual
Data Availability Current
This item is the quarterly percent change in the aggregate number of shares held by institutions for the latest available calendar quarter (or for time periods:
one/two/three/four calendar quarters prior to the latest available calendar quarter;)
* IOSHRCHG4 aggregate data will be available with next release; only detail data for this time period is available.
Institutional Total IO Buyers - Summary Data Mnemonic IOTLBYS0 (Current Quarter)
IOTLBYS1 (Current Quarter minus 1)
IOTLBYS2 (Current Quarter minus 2)
IOTLBYS3 (Current Quarter minus 3)
IOTLBYS4* (Current Quarter minus 4)
Units Integer
Data Availability Current
This item is the aggregate number of institutions purchasing shares of the stock for the latest available calendar quarter (or for time periods:
one/two/three/four calendar quarters prior to the latest available calendar quarter;)
* IOTLBYS4 aggregate data will be available with next release; only detail data for this time period is available.
Institutional Total IO Holders - Summary Data Mnemonic IOTLHLDR0 (Current Quarter)
IOTLHLDR1 (Current Quarter minus 1)
IOTLHLDR2 (Current Quarter minus 2)
IOTLHLDR3 (Current Quarter minus 3)

Research Insight North America Data Guide
534
IOTLHLDR4* (Current Quarter minus 4)
Units Integer
Data Availability Current
This item is the aggregate number of institutions that report an investment position in the company’s stock for the latest available calendar quarter (or for time periods:
one/two/three/four calendar quarters prior to the latest available calendar quarter;)
* IOTLHLDR4 aggregate data will be available with next release; only detail data for this time period is available.
Institutional Total IO Sellers - Summary Data Mnemonic IOTLSLS0 (Current Quarter)
IOTLSLS1 (Current Quarter minus 1)
IOTLSLS2 (Current Quarter minus 2)
IOTLSLS3 (Current Quarter minus 3)
IOTLSLS4* (Current Quarter minus 4)
Units Integer
Data Availability Current
This item is the aggregate number of institutions selling shares of the stock for the latest available calendar quarter (or for time periods:
one/two/three/four calendar quarters prior to the latest available calendar quarter;)
* IOTLSLS4 aggregate data will be available with next release; only detail data for this time period is available.
Institutional Sells Shares - Summary Data Mnemonic IOSLSHR0 (Current Quarter)
IOSLSHR1 (Current Quarter minus 1)
IOSLSHR2 (Current Quarter minus 2)
IOSLSHR3 (Current Quarter minus 3)
IOSLSHR4* (Current Quarter minus 4)
Units Actual

535
Chapter 17 Institutional Ownership Data
Data Availability Current
This item is the aggregate number of net shares sold by institutions during the latest available calendar quarter (or for time periods:
one/two/three/four calendar quarters prior to the latest available calendar quarter;)
* IOSLSHR4 aggregate data will be available with next release; only detail data for this time period is available.
Institutional Total Shares Held - Summary Data Mnemonic IOTLSHR0 (Current Quarter)
IOTLSHR1 (Current Quarter minus 1)
IOTLSHR2 (Current Quarter minus 2)
IOTLSHR3 (Current Quarter minus 3)
IOTLSHR4* (Current Quarter minus 4)
Units Actual
Data Availability Current
This item is the aggregate number of shares held by institutions that report their holdings to the SEC for the latest available calendar quarter (or for time periods:
one/two/three/four calendar quarters prior to the latest available calendar quarter;)
*IOTLSHR4 aggregate data will be available with next release; only detail data for this time period is available.
Institutions Buying Mnemonic INSTBUY
Concept Calculation
@value(iob1pos,0)+@value(iob2pos,0)+ @value(iob3pos,0)+@value(iob4pos,0)+ @value(iob5pos,0)+@value(iob6pos,0)+ @value(iob7pos,0)+@value(iob8pos,0)+ @value(iob9pos,0)+@value(iob10pos,0)
This concept is the number of institutions taking a new position in a company. For example, if this concept returns "6", then 6 of the Top Ten Institutional Buyers have taken a new position in the company.

Research Insight North America Data Guide
536
Institutions Selling Mnemonic INSTSELL
Concept Calculation
@value(ios1pos,0)+@value(ios2pos,0)+ @value(ios3pos,0)+@value(ios4pos,0)+ @value(ios5pos,0)+@value(ios6pos,0)+ @value(ios7pos,0)+@value(ios8pos,0)+ @value(ios9pos,0)+@value(ios10pos,0)
This concept is the number of institutions selling all of their shares in a company. For example, if this concept returns "4", then 4 of the Top Ten Institutional Sellers have closed out their position in a company.
Last Calendar Quarter End Month Mnemonic CALQTR
Concept Calculation @PLASTPD(IOH1PDT,-12,0)
This concept returns the latest calendar quarter month end for institutional data.

537
Chapter 18 Issue Data - Daily Prices
Issue Data - Daily Prices
This chapter presents issue data definitions for Daily prices such as dividends, volume traded, price ratios, and total returns. Unlike monthly prices, dividends and earnings data, Issue data allows you to evaluate multiple issue of stock for a company. (Monthly market data is available for the primary issue only.)
Issue Data - Daily Price Items
Issue Specifics
Data Item
Current mnemonic . . . page
Availability Code AVLI . . . 610 Identification Code IID . . . 617 Issue CUSIP Number CUSIPI . . . 618 Issue Description DSCI . . . 618 Issue Trading Exchange EXCHGI . . . 619 Issue Trading Status Code TSCI . . . 620 Issue Trading Ticker Symbol TICI . . . 620 Issue Type Code TPCI . . . 621 Margin Requirement Code MARGNI . . . 621 Previous Issue CUSIP PCUSPI . . . 622
Data Item
Weekly mnemonic . . . page
Daily mnemonic . . . page
Current mnemonic . . . page
Adjustment Factor (Company) - Cumulative by Ex-Date
AJEXW . . . 605 AJEXD . . . 672 AFEX . . . 671
Adjustment Factor (Company) - Cumulative by Payable Date
AJPW . . . 675 AJPD . . . 674 AFP . . . 674
Adjustment Factor (Company) - Current Date Daily
AFDTE . . . 676
Adjustment Factor (Issue) - Cumulative by Ex-Date
AJEXWI . . . 608 AJEXDI . . . 607 AFEXD . . . 607
Adjustment Factor (Issue) - Cumulative by Payable Date
AJPWI . . . 610 AJPDI . . . 609 AFPD . . . 608
CHAPTER 18

Research Insight North America Data Guide
538
Adjustment Factor (Issue) - Current Date Daily
AFDTED . . . 610
Prices
Data Item
Daily mnemonic . . . page
Current mnemonic . . . page
Momentum MMNTMD . . . 641 Price - Average Moving - 10 Day MAP10D . . . 611 Price - Average Moving - 50 Day MAP50D . . . 611 Price - Average Moving - 200 Day MAP200 . . . 611 Price - Current PRCCUR . . . 623 Price - Daily - 1 Year - Low PRCLD1 . . . 621 Price - Daily - 1 Year - High PRCHD1 . . . 617 Price - Daily - Close PRCCD . . . 622 same as daily Price - Daily - High PRCHD . . . 622 same as daily Price - Daily - Low PRCLD . . . 623 same as daily Price Status Code PRCSTD . . . 623 Price to Cash Flow per Share PRCFD . . . 645 Price to Earnings Ratio PED . . . 649 PECUR . . . 649 Price to Free Cash Flow per Share PRFCFD . . . 646 Price to Sales per Share PRSALED . . . 646 Relative Price - S&P 500 PR500D . . . 654 Relative Price - S&P Industrials PRINDD . . . 654 Relative Price - S&P MidCap PRMIDD . . . 654 Volatility VOLTD . . . 662
Dividends
Data Item
Daily mnemonic . . . page
Current mnemonic . . . page
Dividend Distribution Type - Daily (Issue) by Ex-Date
DVDIXD . . . 612 same as daily
Dividend Distribution Type - Daily (Issue) by Payable Date
DVDIPD . . . 613 same as daily
Dividend Payment Method - Daily (Issue) by Ex-Date
DVMEXD . . . 613 same as daily

539
Chapter 18 Issue Data - Daily Prices
Dividend Payment Method - Daily (Issue) by Payable Date
DVMEPD . . . 614 same as daily
Dividend Yield - Daily (Issue) DVYD . . . 615 Dividends per Share by Ex-Date (Issue)
DVPSXD . . . 615 same as daily
Dividends per Share by Payable Date - Daily (Issue)
DVPSPD . . . 615 same as daily
Indicated Annual Dividends - Current
DVI . . . 617
Earnings per Share
Data Item
Daily mnemonic . . . page
Current mnemonic . . . page
Earnings per Share - Current (Issue) EPS . . . 616 Earnings Yield EPSYLDD . . . 617
Share Data Items
Data Item
Daily mnemonic . . . page
Current mnemonic . . . page
Common Shares Outstanding - Current (Issue)
CSHOC . . . 612
On-Balance Volume OBVD . . . 387 Average Trading Volume - 1 Year CSHTRD1 . . . 611 Trading Volume (Issue) CSHTRD . . . 624 CSHCUR . . . 624
Market value and market returns
Data Item
Daily mnemonic . . . page
Current mnemonic . . . page
Market Return by Ex-Date MKRTXD . . . 636 Market Return by Payable Date MKRTPD . . . 638 Market Value MKVALD . . . 639 MKVALC . . . 639 Price to Book Ratio MKBKF . . . 645 Total Return Daily TRT6MD . . . 658 Total Return Factor TRFD . . . 660


541
Chapter 18 Issue Data - Daily Prices
Data Definitions
Adjustment Factor (Issue) - Cumulative by Ex-Date - Annual Mnemonic AJEXI
This item is identical to Adjustment Factor (Company) - Cumulative by Ex-Date with the exception that factors are for company issues and are available only to On-line subscribers.
This item cannot be modified.
Adjustment Factor (Issue) - Cumulative by Ex-Date - Current Mnemonic AFEXD
This item is identical to Adjustment Factor (Company) - Cumulative by Ex-Date - Current with the exception that factors are for company issues and are available only to On-line subscribers.
This item cannot be modified.
AFEXD is only available for On-line subscribers.
Adjustment Factor (Issue) - Cumulative by Ex-Date - Daily Mnemonic AJEXDI
This item is identical to Adjustment Factor (Company) - Cumulative by Ex-Date with the exception that factors are for company issues and are available only to On-line subscribers.
This item cannot be modified.
Adjustment Factor (Issue) - Cumulative by Ex-Date - Monthly Mnemonic AJEXMI
This item is identical to Adjustment Factor (Company) - Cumulative by Ex-Date with the exception that factors are for company issues and are available only to On-line subscribers.
This item cannot be modified.
Adjustment Factor (Issue) - Cumulative by Ex-Date - Quarterly Mnemonic AJEXQI
This item is identical to Adjustment Factor (Company) - Cumulative by Ex-Date with the exception that factors are for company issues and are available only to On-line subscribers.
This item cannot be modified.

Research Insight North America Data Guide
542
Adjustment Factor (Issue) - Cumulative by Ex-Date - Weekly Mnemonic AJEXWI
This item is identical to Adjustment Factor (Company) - Cumulative by Ex-Date with the exception that factors are for company issues and are available only to On-line subscribers.
This item cannot be modified.
Adjustment Factor (Issue) - Cumulative by Payable Date - Annual Mnemonic AJPI
This item is identical to Adjustment Factor (Company) - Cumulative by Ex-Date with the following exceptions:
Factors are for company issues and are available only to On-line subscribers.
The payable date, rather than the ex-date, is used in the determination of adjustment of Dividends Per Share by Payable Date – Daily (Issue).
Dividends per Share by Payable Date – Daily (Issue) is the only item to which the factor is applied.
This item cannot be modified.
Adjustment Factor (Issue) - Cumulative by Payable Date - Current Mnemonic AFPD
This item is identical to Adjustment Factor (Company) - Cumulative by Ex-Date with the following exceptions:
Factors are for company issues and are available only to On-line subscribers.
The payable date, rather than the ex-date, is used in the determination of adjustment of Dividends Per Share by Payable Date – Daily (Issue).
Dividends per Share by Payable Date – Daily (Issue) is the only item to which the factor is applied.
This item cannot be modified.
Adjustment Factor (Issue) - Cumulative by Payable Date - Daily Mnemonic AJPDI
This item is identical to Adjustment Factor (Company) - Cumulative by Ex-Date with the following exceptions:
Factors are for company issues and are available only to On-line subscribers.
The payable date, rather than the ex-date, is used in the determination of adjustment of Dividends Per Share by Payable Date – Daily (Issue).
Dividends per Share by Payable Date – Daily (Issue) is the only item to which the factor is applied.

543
Chapter 18 Issue Data - Daily Prices
This item cannot be modified.
Adjustment Factor (Issue) - Cumulative by Payable Date - Monthly Mnemonic AJPMI
This item is identical to Adjustment Factor (Company) - Cumulative by Ex-Date with the following exceptions:
Factors are for company issues and are available only to On-line subscribers.
The payable date, rather than the ex-date, is used in the determination of adjustment of Dividends Per Share by Payable Date – Daily (Issue).
Dividends per Share by Payable Date – Daily (Issue) is the only item to which the factor is applied.
This item cannot be modified.
Adjustment Factor (Issue) - Cumulative by Payable Date - Quarterly Mnemonic AJPQI
This item is identical to Adjustment Factor (Company) - Cumulative by Ex-Date with the following exceptions:
Factors are for company issues and are available only to On-line subscribers.
The payable date, rather than the ex-date, is used in the determination of adjustment of Dividends Per Share by Payable Date – Daily (Issue).
Dividends per Share by Payable Date – Daily (Issue) is the only item to which the factor is applied.
This item cannot be modified.
Adjustment Factor (Issue) - Cumulative by Payable Date - Weekly Mnemonic AJPWI
This item is identical to Adjustment Factor (Company) - Cumulative by Ex-Date with the following exceptions:
Factors are for company issues and are available only to On-line subscribers.
The payable date, rather than the ex-date, is used in the determination of adjustment of Dividends Per Share by Payable Date – Daily (Issue).
Dividends per Share by Payable Date – Daily (Issue) is the only item to which the factor is applied.
This item cannot be modified.

Research Insight North America Data Guide
544
Adjustment Factor (Issue) - Current Date Daily Mnemonic AFDTED
This item represents the date for current prices. It is presented as mm/dd/yy (for example, 12/20/96).
This item cannot be modified.
Availability Codes - Issue Mnemonic AVLI
Units Code
This code indicates the status of a business segment, geographic segment or issue for a company or industry for a country. A code of 1 indicates that information is available for the specified time period. The available codes are:
Code Description
0 Not a reporting category
1 Available
The descriptions for these codes can be viewed by choosing the Databases » Descriptions command from the menu bar and entering the mnemonic in the Item text box. To include a textual description of a code in a report, you can use the @DESC function. For example, to include a description of the availability code, type @DESC (AVLI).
For user-created data the appropriate availability code will be set to 1.
Average Price - 10-Day Moving Mnemonic MAP10D
Concept calculation @PAVG (PRCCD,-9,0)
Units Decimal
This concept is 10-day average of Daily Close Prices.
Average Price - 50-Day Moving Mnemonic MAP50D
Concept calculation @PAVG (PRCCD,-49,0)
Units Decimal
This concept is 50-day average of Daily Close Prices.
Average Price - 200-Day Moving Mnemonic MAP200

545
Chapter 18 Issue Data - Daily Prices
Concept calculation @PAVG (PRCCD,-199,0)
Units Decimal
This concept is 200-day average of Daily Close Prices.
Average Trading Volume - 1 Year Mnemonic CSHTRD1
Concept calculation @PAVG(CSHTRD,-262,0)
This concept is the average of the Common Shares Traded - Daily (Issue) for the last year.
Common Shares Outstanding - Current Issue Mnemonic CSHOC
Units Millions
This item represents the total number of common shares outstanding for the issue. It is net of treasury stock. It is adjusted for stock splits.
This item is a scalar variable. It is only available to users who subscribe to Daily Prices.
Notes: This item may differ from Common Shares Outstanding – Company (CSHO) and Common Shares
Outstanding – Company – Quarterly (CSHOQ) for ADR companies. This item is collected as reported in the source, and is not adjusted for the ADR ratio, while CSHO and CSHOQ are adjusted for the ADR ratio.
This item is not available for $R (Research) companies which are no longer pricing.
This item is available for $R (Research) companies with bid/ask prices.
Common Shares Outstanding - Current Issue - Note Mnemonic CSHOCF
1 Giving effect to new financing 2 Includes two or more capital issues 3 Pro-forma
Dividend Distribution Type - Daily (Issue) - Ex-Date Mnemonic DVDIXD
Units Code

Research Insight North America Data Guide
546
This code identifies the type of dividend payment distribution for Dividends per Share-Daily. The codes used are as follows:
Code Method
1 Cash Dividend
2 Cash Equivalent
3 Stock Dividend
4 Stock Split
7 Combination cash
8 Cash and stock
9 Combination stock
This item is only available to users who subscribe to Daily Prices.
Dividend Distribution Type - Daily (Issue) - Payable Date Mnemonic DVDIPD
Units Code
This code identifies the type of dividend payment distribution for Dividends per Share-Daily. The codes used are as follows:
Code Method
1 Cash Dividend
2 Cash Equivalent
3 Stock Dividend
4 Stock Split
7 Combination cash
8 Cash and stock
9 Combination stock
This item is only available to users who subscribe to Daily Prices.
Dividend Payment Method - Daily (Issue) - Ex-Date Mnemonic DVMEXD
Units Code
This code identifies the type of dividend payment for Dividends per Share-Daily. The codes used are as follows:
Code Method
0 Not Available
1 Payable in U.S. currency

547
Chapter 18 Issue Data - Daily Prices
2 Payable in Canadian currency
3 Payable in other currency
4 Optional dividend; rate given in cash
5 Stock Dividend
6 Stock Split
7 Payable in stock of another issuer
8 Payable by exchange of stock
9 Optional dividend; rate given is in stock
10 Rights
11 Warrants
12 Dividend omitted
20 Combination cash
21 Combination stock
22 Combination cash and stock
99 Converted to U.S./Canadian currency
This item is only available to users who subscribe to Daily Prices.
Dividend Payment Method - Daily (Issue) - Payable Date Mnemonic DVMEPD
Units Code
This code identifies the type of dividend payment for Dividends per Share-Daily. The codes used are as follows:
Code Method
0 Not Available
1 Payable in U.S. currency
2 Payable in Canadian currency
3 Payable in other currency
4 Optional dividend; rate given in cash
5 Stock Dividend
6 Stock Split
7 Payable in stock of another issuer
8 Payable by exchange of stock
9 Optional dividend; rate given is in stock
10 Rights
11 Warrants
12 Dividend omitted

Research Insight North America Data Guide
548
20 Combination cash
21 Combination stock
22 Combination cash and stock
99 Converted to U.S./Canadian currency
This item is only available to users who subscribe to Daily Prices.
Dividend Yield - Daily (Issue) Mnemonic DVYD
Concept Calculation (DVI/PRCCD)*100
Units Percentage
This concept is the Current Dividend Rate divided by Close Price at the end of the day, and the result is then multiplied by 100.
Dividends per Share by Ex-Date - Daily (Issue) Mnemonic DVPSXD
Units Dollars and cents
This item represents the amount of cash or cash-equivalent dividend payment, or the ratio of a stock split or stock dividend.
Dividend Payment Method - Daily and Dividend Distribution Type - Daily can be accessed to determine the type of dividend payment.
This item includes special dividends, spin-offs, among others.
This item is gross of tax.
Dividends will be zero for days when no dividends are paid.
This item is only available to users who subscribe to Daily Prices.
Dividends per Share by Payable Date - Daily (Issue) Mnemonic DVPSPD
Units Dollars and cents
This item represents the amount of cash or cash-equivalent dividend payment, or the ratio of a stock split or stock dividend.
Dividend Payment Method - Daily and Dividend Distribution Type - Daily can be accessed to determine the type of dividend payment.
This item includes special dividends, spin-offs, among others.
This item is gross of tax.
Dividends will be zero for days when no dividends are paid.
This item is only available to users who subscribe to Daily Prices.

549
Chapter 18 Issue Data - Daily Prices
EPS - Current (Issue) Mnemonic EPS
Units Dollars and cents
This item is the most recent four-quarter moving Earnings Per Share. It is calculated quarterly by adding the most recent fiscal yearend EPS and all subsequent quarterly EPS and subtracting quarterly EPS prior to the most recent four quarters.
This item is automatically adjusted for stock splits.
This item is supplied by FT Interactive Data for domestic financial services companies and by Standard & Poor’s for all other companies.
This item is a scalar variable. It is only available to users who subscribe to Daily Prices.
Earnings Per Share - Current (Issue) - Note Mnemonic EPSF
Code Description 1 Basic EPS (Company reported) 2 Diluted EPS 4 Preliminary 5 Estimate 6 Pro-forma statement of earnings 7 Net investment income 8 Company only 9 Deficit 10 Currency of country of origin 11 Comparison of second year with first 12 Interim not comparable with annual earnings 13 Net asset value 14 Combined various classes 15 Before tax loss carry forward 16 Partial year 17 Net gain from operations 18 Excluding extraordinary income 19 Including extraordinary income 20 Excluding extraordinary charge 21 Including extraordinary charge 22 Before depletion

Research Insight North America Data Guide
550
Earnings Yield - Daily Mnemonic EPSYLDD
Concept Calculation @VALUE(EPSX12[@QTR (@MNT(0D)-3)],EPSX12[@QTR (@MNT(0D)-3)-1])/PRCCD*100
This concept is the most recent daily Earnings per Share Basic - Excluding Extraordinary Items (12-Months Moving) minus one. This total is divided by Price - Daily - Close, and then multiplied by 100.
High Price - Daily - 1 Year Mnemonic PRCHD1
Concept Calculation @IF(@PMAX(PRCHD,-22,0)> @PMAX(PRCHM,-11,0),@PMAX (PRCHD,-22,0),@PMAX (PRCHM,-11,0))
This concept is the largest value of Price - Daily - High in the last year.
Identification Codes - Issue Mnemonic IID
This code identifies the issue for a company or industry for a country.
This item is not editable. For user-created entities, the system will determine the Identification Code based on the entity ticker, using the following scheme.
Entity Ticker Identification Code
MYL\I09 IID = 09
Indicated Annual Dividend - Current Mnemonic DVI
Units Dollars and cents
This item reflects the projected annual dividends per share. It is calculated by multiplying the latest dividend paid per share by the number of times it is paid per year. This item is updated whenever a new dividend is announced or recorded.
Special or irregular dividends are included by accumulating 12 months and then adding to regular distributions.
This item is also known as ADR (annualized dividend rate).
This item is a scalar variable. It is only available to users who subscribe to Daily Prices.

551
Chapter 18 Issue Data - Daily Prices
Indicated Annual Dividend - Current - Note Mnemonic DVIF 1 Regular Rate 2 Includes extra, special, or additional dividends 3 12 months of irregular dividends, including Extras 4 Stock dividends only 5 12 months of irregular dividends, including Extras but
excluding capital gains 6 Excludes Extras 7 Dividends from capital gains included 8 Dividends from capital gains excluded 9 Not available.
Issue CUSIP Number Mnemonic CUSIPI
This item is a unique identifier for each issue on Compustat®. It is an eight-digit code: the first six digits identify the issuer the seventh and eighth digits identify the issue.
If you are using ISSUE CUSIP in place of a ticker symbol, you need to input all eight digits.
Issue Description Mnemonic DSCI
Issue Description identifies an issue and its par value. All issues have an Issue Description.
The following lists the Issue Description codes:
Code Description
ADR American Depository Receipts
ADS American Depository Shares
BD Bonds
CAP Capital
CL Class
COM Common
CNV Convertible
CVTG Cumulative Voting
DEP Depository
EXCH Exchange
GDR Global Depository Receipts
LVTG Limited Voting
LP Limited Partnership

Research Insight North America Data Guide
552
MVTG Multiple Voting
NPV No Par Value
NON CNV Nonconvertible
NVTG Nonvoting
ORD Ordinary
PTG Participating
PFD Preferred
RCPT Receipts
RED Redeemable
REGD Registered
RES Restricted
SER Series
SHS Shares
SPL Special
SPON Sponsored
SVTG Sub Voting
TR Trust
UNTS Units
VTG Voting
The following lists the ISO codes:
Code Description
CAD Canadian Dollar
USD U.S. Dollar
Issue Trading Exchange Mnemonic EXCHGI
Units Code
This code identifies the major trading exchange for an issue.
Code Stock Exchange
1 New York Stock Exchange
2 American Stock Exchange
3 NASDAQ, including NMS
4 Regional Stock Exchange
5 LBO or Subsidiary
6 Toronto Exchange

553
Chapter 18 Issue Data - Daily Prices
7 Montreal Exchange
8 Canadian Venture Exchange
9 Not on Major Exchange (Canadian only)
10 NASD OTC Bul/Brd/Pink Sheet
Issue Trading Status Code Mnemonic TSCI
Units Code
This code identifies the trading status of the issue.
Code Status
0 Active
1 Inactive-Trading, suspended or halted
2 Inactive-Called, expired or matured
3 Inactive-Merger
4 Inactive-Acquisition
5 Inactive-Untraded or unquoted
6 Inactive-Delisted
7 Active-New security, not yet trading
8 Active-Call has been scheduled
9 Active- In bankruptcy, receivership, reorganization, or a bond is trading flat
10 Active- A partial call has been scheduled
Issue Trading Symbol Mnemonic TICI
This is a unique symbol which identifies the issue.
Issue Type Code Mnemonic TPCI
Units Code
This code identifies the category of an issue.
Code Category
0 Common, ordinary
1 Preferred, preference, etc.

Research Insight North America Data Guide
554
2 Warrant or right
3 Convertible bond
4 Unit
5 Municipal bond
6 Corporate debt issue
7 Mutual fund
8 Certificate
9 Index
10 Put option
11 Call option
12 When option
13 Convertible preferred
14 U.S. Government or agency debt issue
15 Bond Evaluation data only
Low Price - Daily 1-Year Mnemonic PRCLD1
Concept Calculation @IF(@PMIN(PRCLD,- 22,0)<@PMIN(PRCLM,- 11,0),@PMIN(PRCLD,- 22,0),@PMIN(PRCLM,-11,0))
This concept is the lowest value of Price - Daily - Low in the last year.
Margin Requirement Code Mnemonic MARGNI
Units Code
This code identifies the marginability status of an issue. Margin requirements are set by the Federal Reserve Board.
Code Requirement
0 No special status
1 Not marginable (NYSE or AMEX)
2 Marginable (OTC equity)

555
Chapter 18 Issue Data - Daily Prices
Previous Issue CUSIP Mnemonic PCUSPI
This is the previously-assigned CUSIP for an issue before a name change or reclassification caused a change.
Price - Daily - Close Mnemonic PRCCD
Units Dollars and cents
These items represent either the high, low and close prices of the day, or the ask, bid or average of ask/bid prices. Pricing Status Code - Daily can be accessed to determine the form in which prices are available.
If the high price is asking price, it is generally the last asking price by prospective sellers prior to market close.
If the low price is bid price, it is generally the last bid by prospective buyers prior to market close.
If the close price is the average price, it is the average of the bid and ask prices.
These items are updated daily.
These items are issue-level items.
These items are only available to users who subscribe to Daily Prices.
The default presentation of this data is for it to be adjusted. You can choose to have pricing data presented as adjusted or unadjusted by defining your criteria under Tools/Options and then select the Adjustment Factors tab. Check the Apply Current Adjustment Factor box to ensure that data is presented as adjusted.
Price - Daily - High Mnemonic PRCHD
Units Dollars and cents
These items represent either the high, low, and close prices of the day, or the ask, bid, or average of ask/bid prices. Pricing Status Code - Daily can be accessed to determine the form in which prices are available.
If the high price is asking price, it is generally the last asking price by prospective sellers prior to market close.
If the low price is bid price, it is generally the last bid by prospective buyers prior to market close.
If the close price is the average price, it is the average of the bid and ask prices.
These items are updated daily for company issues and weekly for index issues.
These items are only available to users who subscribe to Daily Prices.

Research Insight North America Data Guide
556
Price - Daily - Low Mnemonic PRCLD
Units Dollars and cents
These items represent either the high, low, and close prices of the day, or the ask, bid, or average of ask/bid prices. Pricing Status Code - Daily can be accessed to determine the form in which prices are available.
If the high price is asking price, it is generally the last asking price by prospective sellers prior to market close.
If the low price is bid price, it is generally the last bid by prospective buyers prior to market close.
If the close price is the average price, it is the average of the bid and ask prices.
These items are updated daily for company issues and weekly for index issues.
These items are only available to users who subscribe to Daily Prices.
Price - Current Company Mnemonic PRCCUR
This item is an adjusted closing price on the most recent trading day prior to the day of the last online download.
This item is company-level scalar data.
Data for this item will be available only to online subscribers.
Price Status Code - Daily Mnemonic PRCSTD
Units Code
This code describes the form in which prices are available.
Codes are available for each trading day of the month.
Data is supplied by Merrill Lynch Pierce Fenner & Smith.
This item is only available to users who subscribe to Daily Prices.
Code Status
1 Holiday
2 No prices available
3 High, low, and close
4 Ask, bid, average
5 Prices "filled" from a previous date

557
Chapter 18 Issue Data - Daily Prices
Trading Volume - Current Mnemonic CSHCUR
Units Thousands
This is the volume of shares traded on the same day as Price-Current (PRCCUR).
Data for this item will be available only to on-line subscribers.
Trading Volume - Daily Mnemonic CSHTRD
Units Thousands
This item represents the number of shares traded for companies listed on national stock exchanges and over-the-counter companies in the NASDAQ system. This item includes the composite volume across all exchanges. This item is available only to on-line subscribers. When a company trades stock on more than one exchange, the shares traded are added together and Standard & Poor's presents the composite figure. Standard & Poor’s does not make any additional adjustments to the data to account for American Depositary Receipts (ADR); however, it may be further adjusted for stock splits.
The shares traded will be reported even if only a partial period is available (such as, a company goes public in the middle of the year, quarter, or month).
When a company is not traded in a given period, the price figures and shares traded contain a Not Available data code (@NA).
For some companies, there will be gaps in the data series, or periods where price figures and shares traded are not available. Generally, these will be periods in which earnings per share and other fundamental data have been restated due to a major merger involving companies of similar size. Since the major merger fundamentally changes the nature of the company, the original price, shares traded, and dividend data are not comparable to the earnings per share and other fundamental data. Therefore, the price, dividend, and shares traded are removed.


559
Chapter 19 Market Ratios
Market Ratios
This chapter presents definitions for market ratios used for analysis of common stock issues, such as beta, dividend yields, prices, total returns and indexed total returns plus relative calculations for much of the same data for S&P Indexes.
Basic Market Ratios
Data Item
Daily Mnemonic . . . page
Annual Mnemonic . . . page
Quarterly Mnemonic . . . page
Beta Dividend Payout DVPOR . . . 634 Dividend Payout - Average - 3 Year
DVPOR3 . . . 634
Dividend Payout - Average - 5 Year
DVPOR5 . . . 634
Dividend Payout - Average - 10 Year
DVPOR10 . . . 634
Dividend Yield DVYD . . . 615 DVYDF . . . 635 Dividend Yield - Current DVYDC . . . 635 Dividend Yield - Current Price (Company)
DVYDCR . . . 635
Dividends per Share by Ex-Date
DVPSX . . . 681 DVPSXQ . . . 682
EPS Basic - Excl. Extraordinary Items
EPSPX . . . 685 EPSPXQ . . . 686
EPS Basic - Excl Extraordinary Items 12 MM
EPSX12 . . . 687
EPS Basic - Incl Extraordinary Items
EPSPI . . . 687 EPSPIQ . . . 688
EPS Diluted - Excl Extraordinary Items
EPSFX . . . 691 EPSFXQ . . . 691
EPS Diluted - Incl Extraordinary Items
EPSFI . . . 694 EPSFIQ . . . 695
Earnings Yield EPSYLDD . . . 617 Enterprise Value ENTVALUE . . . 636 Market Value MKVALD . . . 639 MKVAL . . . 638 MKVALQ . . . 641 Market Value - Fiscal Year End
MKVALF . . . 640
Net Asset Value
CHAPTER 19

Research Insight North America Data Guide
560
Price as % of Net Asset Value Price to Book Ratio MKBKD . . . 647 MKBKF . . . 648 MKBKCR . . . 645 Price to EPS from Operations Price to Earnings PED . . . 649 PE . . . 648 Price to Earnings - Current PECUR . . . 649
Data Item
Monthly Mnemonic . . . page
Beta BETA . . . 633 Dividends per Share by Ex-Date
DVPSXM . . . 681
Earnings Yield EPSYLDM . . . 636 Enterprise Value Market Value MKVALM . . . 640 Net Asset Value NAVM . . . 414 Price as % of Net Asset Value
PNAV . . . 650
Price to Book Ratio MKBK . . . 647 Price to EPS from Operations
OPPE . . . 650
Price to Earnings PEM . . . 649
Returns
Data Item
Daily/Current Mnemonic . . . page
Annual Mnemonic . . . page
Quarterly Mnemonic . . . page
Indexed Total Return - 1 Year Indexed Total Return - 3 Year Indexed Total Return - 5 Year Indexed Total Return - 10 Year
Market Return by Ex-Date MKRTXD . . . 636 MKRTX . . . 637 MKRTXQ . . . 637 Market Return by Payable Date
MKRTPD . . . 638 MKRTP . . . 638 MKRTPQ . . . 637
Relative Total Return - S&P 500 - 5 Year
Relative Total Return - S&P 500 - 10 Year
Relative Total Return - S&P Industrials - 5 Year

561
Chapter 19 Market Ratios
Relative Total Return - S&P Industrials - 10 Year
Relative Total Return - S&P MidCap - 5 Year
Relative Total Return - S&P MidCap - 10 Year
Relative Total Return - S&P Sector - 5 Year
Relative Total Return - S&P Sector - 10 Year
Total Return - 6 Month - Daily TRT6MD . . . 658 Total Return - 6 Month - Online
TRT6M1 . . . 659
Total Return - 1 Year Total Return - 3 Year Total Return - 5 Year Total Return - 10 Year Total Return Factor Current TRFDAT . . . 660 Total Return Factor TRFD . . . 660 Total Return Factor Online TRFD1 . . . 661 Total Return to Date TRTYTD . . . 662 TRTQTD . . . 661
Data Item
Monthly Mnemonic . . . page
Indexed Total Return - 1 Year
IDRT1Y . . . 657
Indexed Total Return - 3 Year
IDRT3Y . . . 657
Indexed Total Return - 5 Year
IDRT5Y . . . 658
Indexed Total Return - 10 Year
IDRT10Y . . . 658
Market Return by Ex-Date MKRTXM . . . 637 Relative Total Return - S&P 500 - 5 Year
TRT5Y500 . . . 655
Relative Total Return - S&P 500 - 10 Year
TRT10Y500 . . . 655
Relative Total Return - S&P Industrials - 5 Year
TRT5YIND . . . 655
Relative Total Return - S&P Industrials - 10 Year
TRT10YIND . . . 656
Relative Total Return - S&P MidCap - 5 Year
TRT5YMID . . . 656

Research Insight North America Data Guide
562
Relative Total Return - S&P MidCap - 10 Year
TRT10YMID . . . 656
Relative Total Return - S&P Sector - 5 Year
TRT5YIDX . . . 656
Relative Total Return - S&P Sector - 10 Year
TRT10YIDX . . . 657
Total Return - 1 Year TRT1Y . . . 659 Total Return - 3 Year TRT3Y . . . 659 Total Return - 5 Year TRT5Y . . . 659 Total Return - 10 Year TRT10Y . . . 660 Total Return Factor TRFM . . . 661 Total Return to Date TRTMTD . . . 661
Relatives
Data Item
Daily Mnemonic . . . page
Annual Mnemonic . . . page
Monthly Mnemonic . . . page
Relative Dividend Yield - S&P 500
DVYLD500 . . . 651
Relative Dividend Yield - S&P Industrials
DVYLDIND . . . 651
Relative Dividend Yield - S&P MidCap
DVYLDMID . . . 651
Relative Dividend Yield - S&P Sector
DVYLDIDX . . . 652
Relative Price - S&P 500 PR500D . . . 654 PR500M . . . 654 Relative Price - S&P Industrials
PRINDD . . . 654 PRINDM . . . 654
Relative Price - S&P MidCap PRMIDD . . . 654 PRMIDM . . . 655 Relative Price - S&P Sector PRIDX . . . 655 Relative Price to Book - S&P 500
MKBK500 . . . 652
Relative Price to Book - S&P Industrials
MKBKIND . . . 652
Relative Price to Book - S&P Sector
MKBKIDX . . . 652
Relative Price to Earnings - S&P 500
PE500 . . . 653
Relative Price to Earnings - S&P Indls.
PEIND . . . 653
Relative Price to Earnings - S&P MidCap
PEMID . . . 653
Relative Price to Earnings - S&P Sector
PEIDX . . . 653

563
Chapter 19 Market Ratios
Percentage Change
Data Item
Monthly Mnemonic . . . page
Price Percentage Change - Close - 1 Year PCCHG1 . . . 642 Price Percentage Change - Close - 3 Year PCCHG3 . . . 643 Price Percentage Change - Close - 5 Year PCCHG5 . . . 643 Price Percentage Change - Close - 10 Year PCCHG10 . . . 643 Price Percentage Change - High - 1 Year PCHG1 . . . 644 Price Percentage Change - High - 3 Year PCHG3 . . . 644 Price Percentage Change - High - 5 Year PCHG5 . . . 644 Price Percentage Change - High - 10 Year PCHG10 . . . 645 Price Percentage Change - Low - 1 Year PLCHG1 . . . 643 Price Percentage Change - Low - 3 Year PLCHG3 . . . 643 Price Percentage Change - Low - 5 Year PLCHG5 . . . 644 Price Percentage Change - Low - 10 Year PLCHG10 . . . 644


565
Chapter 19 Market Ratios
Data Definitions
Beta Mnemonic BETA
Units Decimal
The monthly fundamental beta is a measurement of the sensitivity of a company's stock price to the overall fluctuation in the Standard & Poor's 500 (S&P 500) Index Price for U.S Companies, or the S&P/TSX Composite Index (formerly TSE 300 Index) Price for Canadian Companies. For example, a beta of 1.5 indicates that a company's stock price tends to rise (or fall) 1.5%, with a 1% rise (or fall) in the index price. Beta is an historical slope.
Beta is calculated for a 5-year (60-month) time period. If less than 60 months of data is available, Beta will be calculated for as few as 24 months. Month end closing prices (including dividends) are used in the calculation.
Book Value per Share - 3 Year Average Mnemonic BKVLPS3
Concept calculation @PAVG(CEQ/CSHO,-2,0)
This concept is the average of Common Equity - Total divided by the Common Shares Outstanding - Company for the most recent three years.
Book Value per Share - 5 Year Average Mnemonic BKVLPS5
Concept calculation @PAVG(CEQ/CSHO,-4,0)
This concept is the average of Common Equity - Total divided by the Common Shares Outstanding - Company for the most recent five years.
Book Value per Share - 10 Year Average Mnemonic BKVLPS10
Concept calculation @PAVG(CEQ/CSHO,-9,0)
This concept is the average of Common Equity - Total divided by the Common Shares Outstanding - Company for the most recent 10 years.
Book Value per Share - Year-End Mnemonic BKVLPS
Units Dollars and cents

Research Insight North America Data Guide
566
For companies, Book Value Per Share is based on fiscal yearend data and represents Common Equity - Liquidation Value (CEQL) divided by Common Shares Outstanding (CSHO)
For indexes, Book Value Per Share is an annual figure calculated from the calendar yearend index data. This item is carried on an annual basis and is obtained from the Standard & Poor's Analyst's Handbook and Barron's.
Dividend Payout Mnemonic DVPOR
Concept Calculation (DVC/IBADJ)*100
Units Percentage
This concept is Cash Dividends-Common, defined as the total dollar amount of dividends (other than stock dividends) declared on the common stock, divided by Income Before Extraordinary Items - Adjusted For Common Stock Equivalents, which represents income before extraordinary items and discontinued operations less preferred dividend requirements (adjusted for common stock equivalents). This figure is then multiplied by 100.
Dividend Payout - 3 Year Average Mnemonic DVPOR3
Concept Calculation @PAVG(DVPOR,-2,0)
This concept is the average of Dividend Payout for the last three years.
Dividend Payout - 5 Year Average Mnemonic DVPOR5
Concept Calculation @PAVG(DVPOR,-4,0)
This concept is the average of Dividend Payout for the last five years.
Dividend Payout - 10 Year Average Mnemonic DVPOR10
Concept Calculation @PAVG(DVPOR,-9,0)
This concept is the average of Dividend Payout for the last 10 years.
Dividend Yield - Current Mnemonic DVYDC
Concept Calculation 100*(DVRATE/PRCCM)
Units Percentage

567
Chapter 19 Market Ratios
This concept represents the Current Annual Dividend Rate, which is determined by multiplying the latest dividend paid per share by the number of times it is paid during the year, divided by the Current Monthly Close Price. This figure is then multiplied by 100.
Dividend Yield - Current Price (Company) Mnemonic DVYDCR
Concept Calculation 100*(DVRATE/@VALUE(PRCCUR,PRCCM))
Units Percentage
This concept is the Current Dividend Rate divided by the Current Price multiplied by 100. (If the Current Price is not available, the Dividend Rate will be divided by the Price - Close Monthly.)
Dividend Yield - Daily (Issue) Mnemonic DVYD
Concept Calculation (DVI/PRCCD)*100
Units Percentage
This concept is the Current Dividend Rate divided by Close Price at the end of the day, and the result is then multiplied by 100.
Dividend Yield - Fiscal Year-End (Company) Mnemonic DVYDF
Concept Calculation 100*(DVPSX/PRCCF)
Units Percentage
This concept is the Dividend Per Share By Ex-Date, defined as the cash dividends per share for which the ex-dividend dates occurred during the reporting period, divided by the company's close price for the fiscal year. This figure is then multiplied by 100.
Earnings Yield - Daily Mnemonic EPSYLDD
Concept Calculation @VALUE(EPSX12[@QTR (@MNT(0D)-3)],EPSX12[@QTR (@MNT(0D)-3)-1])/PRCCD*100
This concept is the most recent daily Earnings per Share Basic - Excluding Extraordinary Items (12-Months Moving) minus one. This total is divided by Price - Daily - Close, and then multiplied by 100.
Earnings Yield - Monthly Mnemonic EPSYLDM

Research Insight North America Data Guide
568
Concept Calculation @VALUE(EPSX12[@QTR(-3M)], EPSX12[@QTR(-3M)-1])/ PRCCM*100
This concept is the most recent monthly Earnings per Share Basic - Excluding Extraordinary Items (12-Months Moving) divided by Price - Monthly - Close, and then multiplied by 100.
Enterprise Value Mnemonic ENTVALUE
Concept Calculation MKVALM+@VALUE((DTQ+@VALUE(PSTKQ,0)-CHEQ)[@QTR(-3M)],(DTQ+ @VALUE (PSTKQ,0)- CHEQ)[@QTR(-3M)-1])
Units Millions of dollars
This item represents the Market Value - Monthly plus the sum of the set of Debt Total - Quarterly and Current Preferred Stock Quarterly minus Cash and Equivalents Quarterly.
Market Return by Ex-Date - Daily Mnemonic MKRTXD
Calculation (((PRCCD+DVPSXD)/PRCCD[-1])-1)*100
Units Percentage
Market Return by Ex-Date - Daily is the Close Price at the end of the day plus Daily Dividends per Share Ex-Date, divided by the prior day's Close Price. One (1) is subtracted from this quantity, and the result is multiplied by 100.
Market Return by Ex-Date - Fiscal Mnemonic MKRTX
Concept Calculation (((PRCCF+DVPSX+@VALUE (@PSUM(CHEQVM,-11,0) [@MNT(0Y)],0))/PRCCF[-1])-1)*100
Units Percentage
This concept is Price - Fiscal Year - Close plus Dividends per Share by Ex-Date plus Cash Equivalent Distributions per Share by Ex-Date divided by Price - Fiscal Year - Close. One (1) is subtracted from this quantity and the result is multiplied by 100.

569
Chapter 19 Market Ratios
Market Return by Ex-Date - Monthly Mnemonic MKRTXM
Concept Calculation (((PRCCM+DVPSXM+@VALUE (CHEQVM,0))/PRCCM[-1])-1)*100
Units Percentage
Market Return by Ex-Date Monthly is the Close Price at the end of the calendar month plus Dividends Per Share by Ex-Date, divided by the prior month's Close Price. One (1) is subtracted from this quantity, and the result is then multiplied by 100.
Market Return by Ex-Date - Quarterly Mnemonic MKRTXQ
Concept Calculation (((PRCCM[@MNT(0Q)]+DVPSXQ+ @VALUE(@PSUM(CHEQVM,-2,0) [@MNT(0Q)],0))/PRCCM[@MNT (-1Q)])-1)*100
Units Percentage
This concept is Price - Fiscal Year - Close plus Dividends per Share by Ex-Date - Quarterly divided by Price - Monthly - Close. One (1) is subtracted from this quantity and the result is multiplied by 100.
Market Return by Payable Date - Daily Mnemonic MKRTPD
Concept Calculation (((PRCCD+DVPSPD)/PRCCD[-1])-1)*100
Units Percentage
Market Return by Payable Date - Daily is the Close Price at the end of the day plus Daily Dividends per Share Payable Date, divided by the prior day's Close Price. One (1) is subtracted from this quantity, and the result is multiplied by 100.
Market Return by Payable Date - Fiscal Mnemonic MKRTP
Concept Calculation (((PRCCF+DVPSP+@VALUE (@PSUM(CHEQVM,-11,0) [@MNT(0Y)],0))/PRCCF[-1])-1)*100
Units Percentage
This concept is Price - Fiscal Year - Close plus Dividends per Share by Payable Date plus Cash Equivalent Distributions divided by Price - Fiscal Year - Close. One (1) is subtracted from this quantity and the result is multiplied by 100.

Research Insight North America Data Guide
570
Market Return by Payable Date - Quarterly Mnemonic MKRTPQ
Concept Calculation (((PRCCM[@MNT(0Q)]+DVPSPQ+ @VALUE(@PSUM(CHEQVM,-2,0) [@MNT(0Q)],0))/PRCCM[@MNT (-1Q)])-1)*100
Units Percentage
This concept is Price - Monthly - Close plus Dividends per Share by Payable Date - Quarterly plus Cash Equivalent Distributions per Share by Ex-Date divided by Price - Monthly - Close. One (1) is subtracted from this quantity and the result is multiplied by 100.
Market Value Mnemonic MKVAL
Concept Calculation PRCCM*@VALUE (CSHOQ[@QTR(-3M)], CSHOQ[@QTR(-3M)-1])
Units Millions of dollars
Market Value is the Monthly Close Price multiplied by the Quarterly Common Shares Outstanding.
The MKVAL concept provides company-level information based upon the monthly close price (PRCCM) for the company’s primary trading issue and multiplies it by the company’s shares outstanding. The common shares outstanding used in this calculation are those collected by Standard & Poor’s from the company quarterly reports. [It is also important to notice that a 3-month reporting lag on shares outstanding has been built into this concept, whereas the shares used in the calculation are the ones for the fiscal quarter in effect 3-months prior to the monthly price used. If shares outstanding are not available for that quarter, the previous quarter figure will be used.] This concept is accessed using a company-level key (Ex: IBM).
If Common Shares Outstanding for the current quarter is not available, the value for the previous quarter will be used. This calculation will search up to 2 prior quarters. If a company’s CSHOQ is not available for any of these time periods, no market value will appear.
To search for more than 2 prior quarters, use MKVALM.
Note: MKVAL and MKVALM are both monthly market calculations, but MKVAL uses CSHOQ and MKVALM uses CSHOC. It is because two different data items are used between the two market value calculations that there could potentially be different values reported. For example, if a company has multiple issues of common stock, there can be a difference in the value obtained by these calculations. If an issue isn’t actively traded daily, that issue’s outstanding shares will not be included in the CSHOC value. If only the Cl A issue is actively traded, the value for CSHOC will reflect the Cl A issue only. By contrast, CSHOQ will include the sum of all outstanding common stock whether it is actively traded or not. In this case, MKVAL will differ from MKVALM. However, if the company actively trades both Cl A and Cl B, CSHOC will include both values, in which case, MKVAL and MKVALM will have the same value.
Market Value - Current Mnemonic MKVALC

571
Chapter 19 Market Ratios
Concept Calculation @CSUM(CSHOC*PRCCD,@SET (@CHGCO(ISSUE),tpci=0))
Units Millions of dollars
This concept calculates the sum of the market value of all trading classes of common ordinary shares outstanding for a company. The current or most up-to-date number of shares outstanding for a specific issue is multiplied by its latest daily price. This concept is accessed using a company-level key. A special consideration should be given to the calculation time of this concept when run on a large set.
Market Value - Daily Mnemonic MKVALD
Concept Calculation PRCCD*CSHOC
Units Millions of dollars
This concept calculates the market value for a specific issue by multiplying the Close Price at the end of the day by the Current Common Shares Outstanding for that issue. This concept requires an issue-level key (ex: RNT\I02).
Market Value - Fiscal Year-End Mnemonic MKVALF
Concept Calculation mkvalm[@mnt(0y)]
Units Millions of dollars
This concept returns the market value as of the company’s fiscal year end.
Note: MKVAL and MKVALM are both monthly market calculations, but MKVAL uses CSHOQ and MKVALM uses CSHOC. It is because two different data items are used between the two market value calculations that there could potentially be different values reported. For example, if a company has multiple issues of common stock, there can be a difference in the value obtained by these calculations. If an issue isn’t actively traded daily, that issue’s outstanding shares will not be included in the CSHOC value. If only the Cl A issue is actively traded, the value for CSHOC will reflect the Cl A issue only. By contrast, CSHOQ will include the sum of all outstanding common stock whether it is actively traded or not. In this case, MKVAL will differ from MKVALM. However, if the company actively trades both Cl A and Cl B, CSHOC will include both values, in which case, MKVAL and MKVALM will have the same value.
Market Value - Monthly Mnemonic MKVALM
Units Millions of dollars
This data item provides a pre-calculated company-level market value based upon the sum of all the company’s trading issues multiplied by their respective monthly closing price (PRCCM). This item is available on a monthly basis for up to 20 years.
If a company has multiple issues of stock, all actively traded issues for the company are factored into the calculation. For example, if a company has two classes of issues, A & B, that are actively traded, the company market value will be calculated as follows:

Research Insight North America Data Guide
572
MKVALM= [(Price Cl A * CSHOC Cl A) + (Price Cl B * CSHOC Cl B)]
From April 1998 forward, Market Value - Monthly is based upon the month-end close price multiplied by the Common Shares Outstanding – Current Issue (CSHOC) as provided by FT Interactive Data. (If the current Common Shares Outstanding value is not available, the most recent quarterly value during the last four quarters is used. If no value exists in any of the previous four quarters, then the value for annual shares outstanding isused.)
Prior to April 1998, for each month, the month-end close price is multiplied by the appropriate current value for common shares outstanding. (If the most recent current Common Shares Outstanding is not available, then the next current value during the last four quarters is used. If no value exists in any of the previous four quarters, then the value for annual shares outstanding is used.)
Note: MKVALM and MKVAL are both monthly market calculations, but MKVALM uses CSHOC and MKVAL uses CSHOQ. It is because two different data items are used between the two market value calculations that there could potentially be different values reported. For example, if a company has multiple issues of common stock, there can be a difference in the value obtained by these calculations. If an issue isn’t actively traded daily, that issue’s outstanding shares will not be included in the CSHOC value. If only the Cl A issue is actively traded, the value for CSHOC will reflect the Cl A issue only. By contrast, CSHOQ will include the sum of all outstanding common stock whether it is actively traded or not. In this case, MKVAL will differ from MKVALM. However, if the company actively trades both Cl A and Cl B, CSHOC will include both values, in which case, MKVAL and MKVALM will have the same value.
ADR Companies: The Market Value – Monthly calculation will apply the ADR ratio to CSHOC as a third factor in the market value formula. The ADR ratios are provided by Standard & Poor’s. MKVALM= [(Price Cl A * (CSHOC Cl A/ADRRC Cl A) + (Price Cl B * CSHOC Cl B/ADRRC Cl B)]
Market Value - Quarterly Mnemonic MKVALQ
Concept Calculation MKVALM[@MNT(0Q)]
This concept returns the market value (MKVALM) as of the end of the fiscal quarter Just like MKVALM, this concept uses a company-level key but needs to be referenced using the appropriate periodicity. For example, to get the market value at the end of IBM’s second fiscal quarter 2000, you should use MKVALQ[Q2Y00] which is the equivalent to MKVALM[JUN00].
Note: MKVAL and MKVALM are both monthly market calculations, but MKVAL uses CSHOQ and MKVALM uses CSHOC. It is because two different data items are used between the two market value calculations that there could potentially be different values reported. For example, if a company has multiple issues of common stock, there can be a difference in the value obtained by these calculations. If an issue isn’t actively traded daily, that issue’s outstanding shares will not be included in the CSHOC value. If only the Cl A issue is actively traded, the value for CSHOC will reflect the Cl A issue only. By contrast, CSHOQ will include the sum of all outstanding common stock whether it is actively traded or not. In this case, MKVAL will differ from MKVALM. However, if the company actively trades both Cl A and Cl B, CSHOC will include both values, in which case, MKVAL and MKVALM will have the same value.

573
Chapter 19 Market Ratios
Momentum Mnemonic MMNTMD
Concept Calculation PRCCD/PRCCD[-10]
Units Decimal
Momentum is the Current Daily Closing Price divided by the Closing Daily Price from 11 days ago.
Net Asset Value Mnemonic NAVM
This item applies to closed-end funds only. It is the market value of the fund’s assets minus liabilities divided by the shares outstanding.
This is a monthly item from the Prices, Dividends and Earnings file.
On-Balance-Volume Mnemonic OBVD
Concept Calculation @PSUM(@IF(PRCCD> PRCCD[-1],1*CSHTRD,@IF (PRCCD<PRCCD[-1],-1* CSHTRD,0*CSHTRD)),-49,0)
Units Millions
On-Balance-Volume is 50-day sum of Common Shares Traded based on the following set of rules:
if price > previous day's price - Shares Traded are added.
if price < previous day's price - Shares Traded are subtracted.
if price = previous day's price - Shares Traded are not included.
Price Percentage Change - 1-Year Close Mnemonic PCCHG1
Concept Calculation ((PRCCM/PRCCM[-12])-1)*100
This concept is Price - Monthly - Close divided by the previous year value of Price - Monthly - Close. One (1) is subtracted from this quantity, and the result is multiplied by 100.
Price Percentage Change - 3-Year Close Mnemonic PCCHG3
Concept Calculation ((PRCCM/PRCCM[-36])-1)*100

Research Insight North America Data Guide
574
This concept is Price - Monthly - Close divided by the value three years ago of Price - Monthly - Close. One (1) is subtracted from this quantity, and the result is multiplied by 100.
Price Percentage Change - 5-Year Close Mnemonic PCCHG5
Concept Calculation ((PRCCM/PRCCM[-60])-1)*100
This concept is Price - Monthly - Close divided by the value five years ago of Price - Monthly - Close. One (1) is subtracted from this quantity, and the result is multiplied by 100.
Price Percentage Change - 10-Year Close Mnemonic PCCHG10
Concept Calculation ((PRCCM/PRCCM[-120])-1)*100
This concept is Price - Monthly - Close divided by the value 10 years ago of Price - Monthly - Close. One (1) is subtracted from this quantity, and the result is multiplied by 100.
Price Percentage Change - 1-Year Low Mnemonic PLCHG1
Concept Calculation ((PRCLM/PRCLM[-12])-1)*100
This concept is Price - Monthly - Low divided by the previous year value of Price - Monthly - Low. One (1) is subtracted from this quantity, and the result is multiplied by 100.
Price Percentage Change - 3-Year Low Mnemonic PLCHG3
Concept Calculation ((PRCLM/PRCLM[-36])-1)*100
This concept is Price - Monthly - Low divided by the value three years ago of Price - Monthly - Low. One (1) is subtracted from this quantity, and the result is multiplied by 100.
Price Percentage Change - 5-Year Low Mnemonic PLCHG5
Concept Calculation ((PRCLM/PRCLM[-60])-1)*100
This concept is Price - Monthly - Low divided by the value five years ago of Price - Monthly - Low. One (1) is subtracted from this quantity, and the result is multiplied by 100.

575
Chapter 19 Market Ratios
Price Percentage Change - 10-Year Low Mnemonic PLCHG10
Concept Calculation ((PRCLM/PRCLM[-120])-1)*100
This concept is Price - Monthly - Low divided by the value 10 years ago of Price - Monthly - Low. One (1) is subtracted from this quantity, and the result is multiplied by 100.
Price Percentage Change - 1-Year High Mnemonic PHCHG1
Concept Calculation ((PRCHM/PRCHM[-12])-1)*100
This concept is Price - Monthly - High divided by the previous year value of Price - Monthly - High. One (1) is subtracted from this quantity, and the result is multiplied by 100.
Price Percentage Change - 3-Year High Mnemonic PHCHG3
Concept Calculation ((PRCHM/PRCHM[-36])-1)*100
This concept is Price - Monthly - High divided by the value three years ago of Price - Monthly - High. One (1) is subtracted from this quantity, and the result is multiplied by 100.
Price Percentage Change - 5-Year High Mnemonic PHCHG5
Concept Calculation ((PRCHM/PRCHM[-60])-1)*100
This concept is Price - Monthly - High divided by the value five years ago of Price - Monthly - High. One (1) is subtracted from this quantity, and the result is multiplied by 100.
Price Percentage Change - 10-Year High Mnemonic PHCHG10
Concept Calculation ((PRCHM/PRCHM[-120])-1)*100
This concept is Price - Monthly - High divided by the value 10 years ago of Price - Monthly - High. One (1) is subtracted from this quantity, and the result is multiplied by 100.
Price to Book Ratio - Current Mnemonic MKBKCR

Research Insight North America Data Guide
576
Concept Calculation @VALUE(PRCCUR,PRCCM)* (@VALUE(CSHOQ/CEQQ, CSHOQ[-1]/CEQQ[-1]))
Units Percentage
Price to Book Ratio - Current is Common Shares Outstanding for the current quarter divided by the Common Equity - As Reported for the current quarter multiplied by the Current Price. (If the Common Shares Outstanding and the Common Equity - As Reported for the current quarter are not available, the values for the previous quarter will be used. If the current price is not available, the Price-Close Monthly will be used.)
Price/EPS Diluted from Operations Mnemonic OPDPE
Concept Calculation PRCCM/@VALUE(OEPF12[@QTR (-3M)],OEPF12[@QTR(-3M)-1])
This concept is Price – Monthly Close divided by Earnings per Share Diluted from Operations – 12 MM.
Price/Cash Flow Per Share - Daily Mnemonic PRCFD
Concept Calculation PRCCD/((@VALUE(IB12,IB12[-1]+@VALUE (DP12,DP12[-1]))/@VALUE(CSHOQ,CSHOQ [-1]))[@QTR(@MNT(0D)-3)]
This concept is Price - Daily - Close divided by Cash Flow per Share - Quarterly.
Price/Cash Flow Per Share - Monthly Mnemonic PRCFM
Concept Calculation PRCCM/((@VALUE(IB12,IB12[-1])+@VALUE (DP12,DP12[-1]))/@VALUE(CSHOQ,CSHOQ [-1]))[@QTR(-3M)]
This concept is Price - Monthly - Close divided by Cash Flow per Share - Quarterly. (If Cash Flow per Share for the current quarter is not available, the value for the previous quarter will be used.)
Price/Earnings - Quarterly Mnemonic PEQ
Concept Calculation @VALUE(PEXQ,PEM[@MNT(0Q)])
This concept is the Price to Earnings Ratio at the month-end of the quarter.

577
Chapter 19 Market Ratios
Price/Free Cash Flow Per Share - Daily Mnemonic PRFCFD
Concept Calculation PRCCD/@VALUE(FCFLPSQ [@QTR(@MNT(0D)-3)], FCFLPSQ[@QTR(@MNT(0D)-3)-1])
This concept is Price - Daily - Close divided by Free Cash Flow per Share - Quarterly.
Price/Free Cash Flow Per Share - Monthly Mnemonic PRFCFM
Concept Calculation PRCCM/@VALUE(FCFLPSQ [@QTR(-3M)],FCFLPSQ[@QTR (-3M)-1])
This concept is Price - Monthly - Close divided by Free Cash Flow per Share - Quarterly. (If Free Cash Flow per Share for the current quarter is not available, the value for the previous quarter will be used.)
Price/Sales Per Share - Daily Mnemonic PRSALED
Concept Calculation PRCCD/(@VALUE(SALE12 [@QTR(@MNT(0D)-3)], SALE12[@QTR (@MNT(0D)-3)-1])/@VALUE (CSHOQ[@QTR (@MNT(0D)-3)],CSHOQ[@QTR (@MNT(0D)-3)-1]))
This concept is Price - Daily - Close divided by Sales (Net) - 12-Months Moving, and divided by Common Shares Outstanding - Company - Quarterly. (If Sales (Net) - 12-Months Moving and Common Shares Outstanding - Company for the current quarter are not available, the values for the previous quarter will be used.)
Price/Sales Per Share - Monthly Mnemonic PRSALEM
Concept Calculation PRCCM/(@VALUE (SALE12[@QTR(-3M)], SALE12[@QTR(-3M)-1])/ @VALUE(CSHOQ[@QTR (-3M)],CSHOQ[@QTR(-3M)-1]))
This concept is Price - Monthly - Close divided by Sales (Net) - 12-Months Moving, and divided by Common Shares Outstanding - Company - Quarterly. (If Sales (Net) - 12-Months Moving and Common Shares Outstanding - Company for the current quarter are not available, the values for the previous quarter will be used.)

Research Insight North America Data Guide
578
Price to Book Ratio Mnemonic MKBK
Concept Calculation mkvalm/@value(ceqq[@qtr (-3m)],ceqq[@qtr(-3m)-1])
Units Percentage
Price to Book Ratio is defined as Market Value - Monthly divided by Quarterly Common Equity - Total, which represents the common shareholder's interest in the company, including common stock, capital surplus, retained earnings and treasury stock adjustments. (If Common Equity for the current quarter is not available, the values for the previous quarter will be used.)
Price to Book Ratio - Daily Mnemonic MKBKD
Concept Calculation PRCCD/@VALUE((CEQQ/ CSHOQ)[@QTR(@MNT(0D)- 3)],(CEQQ/CSHOQ)[@QTR (@MNT(0D)-3)-1])
Units Percentage
Price to Book - Daily is the Close Price at the end of the day divided by Quarterly Common Equity, divided by Quarterly Common Shares Outstanding. (If Common Equity and Common Shares Outstanding for the current quarter are not available, the values for the previous quarter will be used.)
Price to Book Ratio - Fiscal Year-End Mnemonic MKBKF
Concept Calculation MKVALF/CEQ
Units Percentage
Price to Book Ratio - Fiscal Year-End is Market Value - Fiscal Year-End (or the close price for the fiscal year) multiplied by the company's common shares outstanding, divided by Common Equity as Reported, which represents the common shareholders' interest in the company.

579
Chapter 19 Market Ratios
Price to Earnings Ratio Mnemonic PE
Concept Calculation PRCCM/@VALUE (EPSX12[@QTR(-3M)], EPSX12[@QTR(-3M)-1])
Units Decimal
Price to Earnings Ratio is the Price-Close Monthly divided by 12-Months Moving Earnings Per Share. (If the most recent earnings are not available, divide by the previous quarter's 12-Months Moving Earnings Per Share.)
Price to Earnings Ratio - Current Mnemonic PECUR
Concept Calculation @VALUE(PRCCUR,PRCCM)/EPSX12
Units Decimal
Price to Earnings Ratio - Current is the Current Price divided by 12-Months Moving Earnings Per Share. (If Current Price is not available, divide Close Price by 12-Months Moving Earnings Per Share. If the most recent earnings are not available, divide by the previous quarter's 12-Months Moving Earning per Share.)
Price to Earnings Ratio - Daily Mnemonic PED
Concept Calculation PRCCD/EPS
Units Decimal
Price to Earnings - Daily is the Close Price at the end of the day divided by Current 12-Months Moving Earnings per Share.
Price to Earnings Ratio Monthly Mnemonic PEM
Units Decimal
This item is available on a monthly basis for up to 20 years. For each month, the month-end close price is divided by the appropriate 12-Months Moving Earnings Per Share. If the most recent Earnings Per Share figure is not available, the Close Price will be divided by the sum of the previous quarter's value of 12-Months Moving Earnings per Share. If Earnings per Share is less than or equal to zero, a "Not Meaningful" data code (@NM) will be returned.

Research Insight North America Data Guide
580
Price to EPS From Operations Mnemonic OPPE
Concept calculation PRCCM/@VALUE(OEPS12[@QTR (-3M)],OEPS12[@QTR(-3M)-1])
This concept is Price - Monthly - Close divided by Earnings per Share from Operations - 12MM.
If Earnings per Share from Operations - 12MM for the current quarter is not available, the value for the previous quarter will be used.
Price to Historical Earnings Per Share - Canada Mnemonic PEH
Concept Calculation PRCCM/@VALUE(EPSH12 [@QTR(-3M)],EPSH12 [@QTR(-3M)-1])
Units Decimal
Price to Historical Earnings per Share-Canada is the Price-Close Monthly divided by 12-Months Moving Historical Earnings Per Share. (If the most recent earnings are not available, divide by the previous quarter's 12-Months Moving Historical Earnings Per Share.)
This concept is available only for Canadian ($T) companies.
Price to Historical Earnings Per Share - Monthly - Canada Mnemonic PEHM
Data Availability 1982
Units Decimal
For each month, the month-end close price is divided by the appropriate 12-Months Moving Historical Earnings Per Share. If the most recent Earnings Per Share figure is not available, the month-end close price will be divided by the sum of the previous quarter’s value of 12-Months Moving Earnings Per Share. If Earnings Per Share is less than or equal to zero, a "Not Meaningful" data code (@NM) will be returned.
This item is available only for Canadian ($T) companies.
Price to Net Asset Value Mnemonic PNAV
Concept calculation PRCCM/NAVM
This concept is Price - Monthly - Close divided by Net Asset Value.
Relative Dividend Yield - S&P500 Mnemonic DVYLD500
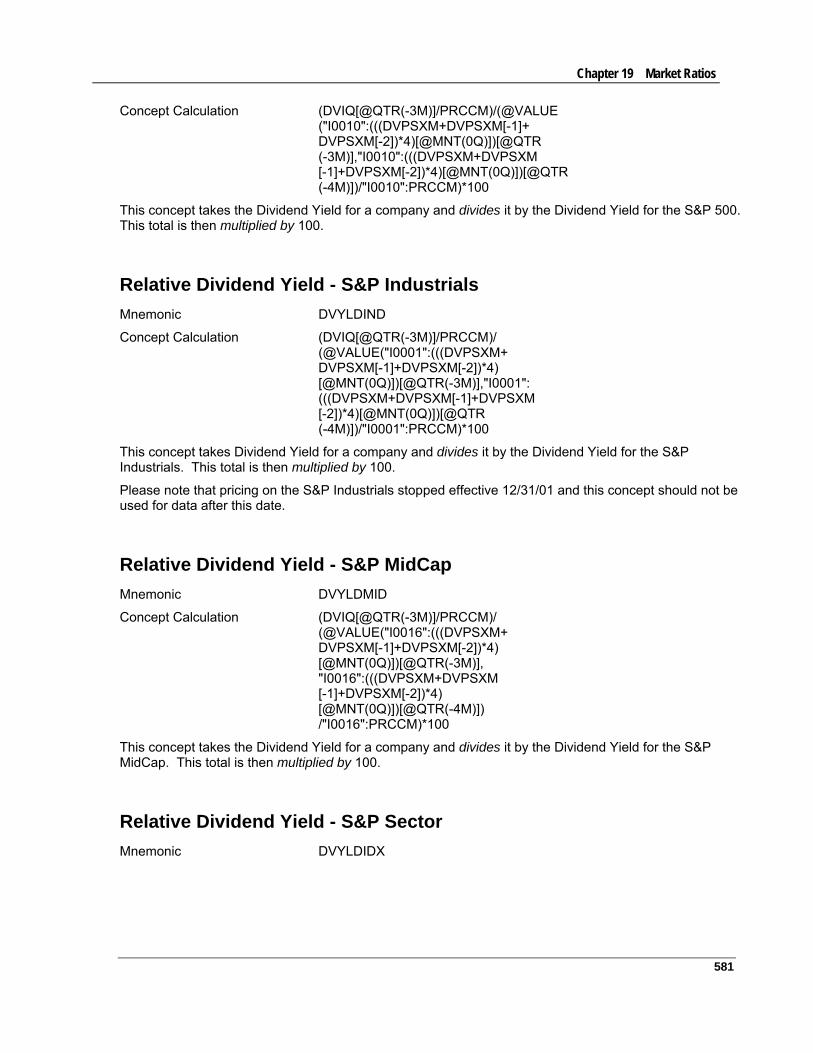
581
Chapter 19 Market Ratios
Concept Calculation (DVIQ[@QTR(-3M)]/PRCCM)/(@VALUE ("I0010":(((DVPSXM+DVPSXM[-1]+ DVPSXM[-2])*4)[@MNT(0Q)])[@QTR (-3M)],"I0010":(((DVPSXM+DVPSXM [-1]+DVPSXM[-2])*4)[@MNT(0Q)])[@QTR (-4M)])/"I0010":PRCCM)*100
This concept takes the Dividend Yield for a company and divides it by the Dividend Yield for the S&P 500. This total is then multiplied by 100.
Relative Dividend Yield - S&P Industrials Mnemonic DVYLDIND
Concept Calculation (DVIQ[@QTR(-3M)]/PRCCM)/ (@VALUE("I0001":(((DVPSXM+ DVPSXM[-1]+DVPSXM[-2])*4) [@MNT(0Q)])[@QTR(-3M)],"I0001": (((DVPSXM+DVPSXM[-1]+DVPSXM [-2])*4)[@MNT(0Q)])[@QTR (-4M)])/"I0001":PRCCM)*100
This concept takes Dividend Yield for a company and divides it by the Dividend Yield for the S&P Industrials. This total is then multiplied by 100.
Please note that pricing on the S&P Industrials stopped effective 12/31/01 and this concept should not be used for data after this date.
Relative Dividend Yield - S&P MidCap Mnemonic DVYLDMID
Concept Calculation (DVIQ[@QTR(-3M)]/PRCCM)/ (@VALUE("I0016":(((DVPSXM+ DVPSXM[-1]+DVPSXM[-2])*4) [@MNT(0Q)])[@QTR(-3M)], "I0016":(((DVPSXM+DVPSXM [-1]+DVPSXM[-2])*4) [@MNT(0Q)])[@QTR(-4M)]) /"I0016":PRCCM)*100
This concept takes the Dividend Yield for a company and divides it by the Dividend Yield for the S&P MidCap. This total is then multiplied by 100.
Relative Dividend Yield - S&P Sector Mnemonic DVYLDIDX

Research Insight North America Data Guide
582
Concept Calculation (DVIQ[@QTR(-3M)]/prccm)/ @csum((@value(dvpsxm+ dvpsxm[-1]+dvpsxm[-2],dvpsxm [-1]+dvpsxm[-2]+dvpsxm[-3]) [@mnt(@qtr(-2m))]*4)/prccm, @SET($I,@and(gsubind=@chgco (company):gsubind,@right (conm,3)=".SI",@mid(@right (tic,3),2,1)="i")))*100
This concept takes the Dividend Yield for a company and divides it by the Dividend Yield for the GICS Sub-Industry of which the company is a member. This total is then multiplied by 100.
Relative Price to Book - S&P500 Mnemonic MKBK500
Concept Calculation MKBK/"I0010":(PRCCM/@VALUE(BKVLPS, BKVLPS[-1],BKVLPS[-2])[@YR(-11m)]*100
This concept is Market to Book Ratio divided by the total of Price - Monthly - Close divided by Book Value per Share - Year-End for the S&P 500. This total is then multiplied by 100. This calculation will return data for the most current month-end.
Relative Price to Book - S&P Industrials Mnemonic MKBKIND
Concept Calculation MKBK/"I0001":(PRCCM/BKVLPS [@YR(-11M)])*100
This concept is Market to Book Ratio divided by the total of Price - Monthly - Close divided by Book Value per Share - Year-End for the S&P Industrials. This total is then multiplied by 100.
Relative Price to Book - S&P Sector Mnemonic MKBKIDX
Concept Calculation MKBK/@CSUM(PRCCM/@VALUE(CEQQ,CEQQ [-1],CEQQ[-2])[@QTR(-3M)],@SET($I, @AND(GSUBIND=@CHGCO(COMPANY): GSUBIND,@RIGHT(CONM,3)=".SI",@MID (@RIGHT(TIC,3),2,1)="I")))*100
This concept is Market to Book Ratio divided by the total of Price - Monthly - Close divided by Common Equity – Total – Quarterly for the GICS Sub-Industry Index that the company is a member of. This total is then multiplied by 100.
Relative Price to Earnings - S&P 500 Mnemonic PE500
Concept Calculation PEM/"I0010":PEM*100
This concept is Price to Earnings Ratio Monthly for a company divided by the Price to Earnings Ratio Monthly for the S&P 500. This total is then multiplied by 100.

583
Chapter 19 Market Ratios
Relative Price To Earnings - S&P MidCap Mnemonic PEMID
Concept Calculation PEM/"I0016":PEM*100
This concept is Price to Earnings Ratio Monthly for a company divided by the Price to Earnings Ratio Monthly for the S&P MidCap. This total is then multiplied by 100.
Relative Price to Earnings - S&P Industrials Mnemonic PEIND
Concept Calculation PEM/"I0010":PEM*100
This concept is Price to Earnings Ratio Monthly divided by the Price to Earnings Ratio Monthly for the S&P Industrials. This total is then multiplied by 100.
Relative Price to Earnings - S&P Sector Mnemonic PEIDX
Concept Calculation PEM/@CSUM(PEM,@SET ($I,@and((SIC=@CHGCO(COMPANY):SPIIM),@find("500",conm))))*100
This concept is Price to Earnings Ratio Monthly for a company divided by the Price to Earnings Ratio Monthly for the S&P Industry Index that the company is a member of. This total is then multiplied by 100.
Relative Price - S&P 500 Daily Mnemonic PR500D
Concept Calculation PRCCD/"I0010\I01":PRCCD*100
This concept is Price - Daily - Close divided by the Price - Daily - Close for the S&P 500, and the result is multiplied by 100.
Relative Price - S&P 500 Monthly Mnemonic PR500M
Concept Calculation PRCCM/"I0010":PRCCM*100
This concept is Price - Monthly - Close divided by the Price - Monthly - Close for the S&P 500, and the result is multiplied by 100.

Research Insight North America Data Guide
584
Relative Price - S&P Industrials - Daily Mnemonic PRINDD
Concept Calculation PRCCD/"I0001\I01":PRCCD*100
This concept is Price - Daily - Close divided by the Price - Daily - Close for the S&P Industrials, and the result is multiplied by 100.
Relative Price - S&P Industrials - Monthly Mnemonic PRINDM
Concept Calculation PRCCM/"I0001":PRCCM*100
This concept is Price - Monthly - Close divided by the Price - Monthly - Close for the S&P Industrials, and the result is multiplied by 100.
Relative Price - S&P MidCap - Daily Mnemonic PRMIDD
Concept Calculation PRCCD/"I0016/I01":PRCCD*100
This concept is Price - Daily - Close divided by the Price - Daily - Close for the S&P MidCap, and the result is multiplied by 100.
Relative Price - S&P MidCap - Monthly Mnemonic PRMIDM
Concept Calculation PRCCM/"I0016":PRCCM*100
This concept is Price - Monthly - Close divided by the Price - Monthly - Close for the S&P MidCap, and the result is multiplied by 100.
Relative Price - S&P Sector Mnemonic PRIDX
Concept Calculation PRCCM/@CSUM(PRCCM,@SET($I,@AND(GSUBIND= @CHGCO(COMPANY):GSUBIND,@RIGHT(CONM,3)= ".SI",@MID(@RIGHT(TIC,3),2,1)="I")))*100
Units Percentage
This concept is the Price - Monthly - Close for a company divided by the Price - Monthly - Close for the GICS Sub-Industry of which the company is a member. This total is then multiplied by 100.

585
Chapter 19 Market Ratios
Relative 5 YR Total Return - S&P 500 Mnemonic TRT5Y500
Concept calculation (TRT5Y/"I0010":TRT5Y)*100
This concept is the 5 Year Total Return divided by the 5 Year Total Return for the S&P 500. This total is then multiplied by 100.
Relative 10 YR Total Return - S&P 500 Mnemonic TRT10Y500
Concept calculation (TRT10Y/"I0010":TRT10Y)*100
This concept is the 10 Year Total Return divided by the 10 Year Total Return for the S&P 500. This total is then multiplied by 100.
Relative 5 YR Total Return - S&P Industrials Mnemonic TRT5YIND
Concept calculation (TRT5Y/"I0001":TRT5Y)*100
This concept is the 5 Year Total Return divided by the 5 Year Total Return for the S&P Industrials. This total is then multiplied by 100.
Relative 10 YR Total Return - S&P Industrials Mnemonic TRT10YIND
Concept calculation (TRT10Y/"I0001":TRT10Y)*100
This concept is the 10 Year Total Return divided by the 10 Year Total Return for the S&P Industrials. This total is then multiplied by 100.
Relative 5 YR Total Return - S&P MidCap Mnemonic TRT5YMID
Concept calculation (TRT5Y/"I0016":TRT5Y)*100
This concept is the 5 Year Total Return divided by the 5 Year Total Return for the S&P MidCap. This total is then multiplied by 100.
Relative 10 YR Total Return - S&P MidCap Mnemonic TRT10YMID
Concept calculation (TRT10Y/"I0016":TRT10Y)*100

Research Insight North America Data Guide
586
This concept is the 10 Year Total Return divided by the 10 Year Total Return for the S&P MidCap. This total is then multiplied by 100.
Relative 5 YR Total Return - S&P Sector Mnemonic TRT5YIDX
Concept calculation (TRT5Y/@CSUM(TRT5Y,@SET($I,@AND(GSUBIND=@CHGCO(COMPANY):GSUBIND,@RIGHT(CONM,3)=".SI",@MID(@RIGHT(TIC,3),2,1)="i")))*100)
This concept is the 5 Year Total Return divided by the 5 Year Total Return for the S&P Industry Index that the company is a member of. This total is then multiplied by 100.
Relative 10 YR Total Return - S&P Sector Mnemonic TRT10YIDX
Concept calculation (TRT10Y/@CSUM(TRT10Y,@SET($I,@AND(GSUBIND=@CHGCO(COMPANY):GSUBIND,@RIGHT(CONM,3)=".SI",@MID(@RIGHT(TIC,3),2,1)="i")))*100) :SPIIM),@find("500",conm))))*100
This concept is the 10 Year Total Return divided by the 10 Year Total Return for the S&P Industry Index that the company is a member of. This total is then multiplied by 100.
1 Year Indexed Total Return Mnemonic IDRT1Y
Concept calculation (PRCCM*TRFM)/ (PRCCM*TRFM)[-12]*100
Units Percentage
The Total Return concepts are annualized rates of return reflecting monthly price appreciation plus reinvestment of monthly dividends and the compounding effect of dividends paid on reinvested dividends.
The 1 Year Indexed Total Return concept is a monthly indexed value that reflects the percentage change of the value 12 months previous (base period). The value of the base period is equal to 100 percent.
Total returns on the S&P Indexes that have been calculated using Research Insight may differ from the total returns on the S&P Indexes calculated by Standard & Poor's.
3 Year Indexed Total Return Mnemonic IDRT3Y

587
Chapter 19 Market Ratios
Concept calculation ((PRCCM*TRFM)/ (PRCCM*TRFM)[-36])*100
Units Percentage
The Total Return concepts are annualized rates of return reflecting monthly price appreciation plus reinvestment of monthly dividends and the compounding effect of dividends paid on reinvested dividends.
The 3 Year Indexed Total Return concept is a monthly indexed value that reflects the percentage change of the value 36 months previous (base period). The value of the base period is equal to 100 percent.
Total returns on the S&P Indexes that have been calculated using Research Insight may differ from the total returns on the S&P Indexes calculated by Standard & Poor's.
5 Year Indexed Total Return Mnemonic IDRT5Y
Concept calculation ((PRCCM*TRFM)/ (PRCCM*TRFM)[-60])*100
Units Percentage
The Total Return concepts are annualized rates of return reflecting monthly price appreciation plus reinvestment of monthly dividends and the compounding effect of dividends paid on reinvested dividends.
The 5 Year Indexed Total Return concept is a monthly indexed value that reflects the percentage change of the value 60 months previous (base period). The value of the base period is equal to 100 percent.
Total returns on the S&P Indexes that have been calculated using Research Insight may differ from the total returns on the S&P Indexes calculated by Standard & Poor's.
10 Year Indexed Total Return Mnemonic IDRT10
Concept calculation ((PRCCM*TRFM)/ (PRCCM*TRFM)[-120])*100
Units Percentage
The Total Return concepts are annualized rates of return reflecting monthly price appreciation plus reinvestment of monthly dividends and the compounding effect of dividends paid on reinvested dividends.
The 10 Year Indexed Total Return concept is a monthly indexed value that reflects the percentage change of the value 120 months previous (base period). The value of the base period is equal to 100 percent.
Total returns on the S&P Indexes that have been calculated using Research Insight may differ from the total returns on the S&P Indexes calculated by Standard & Poor's.

Research Insight North America Data Guide
588
6 Month Total Return Daily Mnemonic TRT6MD
Concept Calculation ((((PRCCD*TRFD)/(PRCCD*TRFD) [-131])^2.0)-1)*100
Units Percentage
This concept represents the annualized rate of return reflecting daily price appreciation plus reinvestment of daily dividends and the compounding effect of dividends paid on reinvested dividends.
6 Month Total Return - On-line Mnemonic TRT6M1
Concept calculation ((((PRCCD * TRFD1) / (PRCCD * TRFD)[-131])^2.0)-1) * 100
Units Percentage
This concept represents the annualized rate of return reflecting price appreciation plus reinvestment of dividends and the compounding effect of dividends paid on reinvestment dividends, using the most current downloaded pricing information.
1 Year Total Return Mnemonic TRT1Y
Concept calculation (((PRCCM*TRFM)/(PRCCM*TRFM) [-12])-1)*100
Units Percentage
The Total Return concepts are annualized rates of return reflecting price appreciation plus reinvestment of monthly dividends and the compounding effect of dividends paid on reinvested dividends.
Total returns on the S&P Indexes that have been calculated using Research Insight may differ from the total returns on the S&P Indexes calculated by Standard & Poor's.
3 Year Total Return Mnemonic TRT3Y
Concept calculation ((((PRCCM*TRFM)/ (PRCCM*TRFM)[-36]) ^(1.0/3.0))-1)*100
Units Percentage
The Total Return concepts are annualized rates of return reflecting monthly price appreciation plus reinvestment of monthly dividends and the compounding effect of dividends paid on reinvested dividends.
The Indexed Total Return concepts are an indexed number that represents a comparison between a present measurement and a measurement at some previous point in time (base period). The base period is equal to 100.

589
Chapter 19 Market Ratios
Total returns on the S&P Indexes that have been calculated using Research Insight may differ from the total returns on the S&P Indexes calculated by Standard & Poor's.
5 Year Total Return Mnemonic TRT5Y
Concept calculation ((((PRCCM*TRFM)/ (PRCCM*TRFM)[-60]) ^(1.0/5.0))-1)*100
Units Percentage
The Total Return concepts are annualized rates of return reflecting monthly price appreciation plus reinvestment of monthly dividends and the compounding effect of dividends paid on reinvested dividends.
The Indexed Total Return concepts are an indexed number that represents a comparison between a present measurement and a measurement at some previous point in time (base period). The base period is equal to 100.
Total returns on the S&P Indexes that have been calculated using Research Insight may differ from the total returns on the S&P Indexes calculated by Standard & Poor's.
10 Year Total Return Mnemonic TRT10Y
Concept calculation ((((PRCCM*TRFM)/ (PRCCM*TRFM)[-120]) ^(1.0/10.0))-1)*100
Units Percentage
The Total Return concepts are annualized rates of return reflecting monthly price appreciation plus reinvestment of monthly dividends and the compounding effect of dividends paid on reinvested dividends.
The Indexed Total Return concepts are an indexed number that represents a comparison between a present measurement and a measurement at some previous point in time (base period). The base period is equal to 100.
Total returns on the S&P Indexes that have been calculated using Research Insight may differ from the total returns on the S&P Indexes calculated by Standard & Poor's.
Total Return Factor - Current Date Mnemonic TRFDAT
Concept calculation @IF(@ISNA(TRFD[1]),@PMAXPD(@AND (@ISVALUE(TRFD), @ISNA(TRFD[1])),-14,0), @DAY(0D))
This concepts returns the date of the most recent Total Return Factor - Daily.

Research Insight North America Data Guide
590
Total Return Factor - Daily Mnemonic TRFD
Units Percentage
This item represents the multiplication factor for calculating the total return to shareholders of any time period.
Includes Cash Equivalent Distributions along with reinvestment of dividends and the compounding effect of dividends paid on reinvested dividends.
Total Return Factor - Monthly Mnemonic TRFM
Units Percentage
This item represents the multiplication factor for calculating the total return to shareholders of any time period.
Includes Cash Equivalent Distributions along with reinvestment of dividends and the compounding effect of dividends paid on reinvested dividends.
Total returns on the S&P Indexes that have been calculated using Research Insight may differ from the total returns on the S&P Indexes calculated by Standard & Poor's.
Total Return Factor - On-line Mnemonic TRFD1
Concept calculation TRFD[TRFDAT] + @PSUM(@IF(@ISNA(TRFD), DVPSXD * (TRFD[TRFDAT] / PRCCD),0),-14,0)
This item represents the multiplication factor for calculating the total return to shareholders of any time period.
Includes Cash Equivalent Distributions along with price appreciation plus reinvestment of dividends and the compounding effect of dividends paid on reinvested dividends.
Total Return - Month to Date Mnemonic TRTMTD
Concept calculation (prccd*trfd1)/(prccd*@value(trfd, trfd1))[@day(@mnt(0d,12)-1,12)]-1
The Total Return concepts are annualized rates of return reflecting price appreciation plus reinvestment of monthly dividends and the compounding effect of dividends paid on reinvested dividends.

591
Chapter 19 Market Ratios
Total Return - Quarter to Date Mnemonic TRTQTD
Concept calculation (prccd*trfd1)/(prccd*@value(trfd, trfd1))[@day(@qtr(0d,12)-1,12)]-1
The Total Return concepts are annualized rates of return reflecting price appreciation plus reinvestment of monthly dividends and the compounding effect of dividends paid on reinvested dividends.
Total Return - Year to Date Mnemonic TRTYTD
Concept calculation (prccd*trfd1)/(prccd*@value(trfd, trfd1))[@day(@yr(0d,12)-1,12)]-1
The Total Return concepts are annualized rates of return reflecting price appreciation plus reinvestment of monthly dividends and the compounding effect of dividends paid on reinvested dividends.
Volatility Mnemonic VOLTD
Concept Calculation ((@PAVG(PRCHD-PRCLD, -9,0)/@PAVG(PRCHD- PRCLD,-19,-10))-1)*100
Units Percentage
This item is 10-day average Daily High Price minus Daily Low Price, divided by the previous 10-day average Daily High Price minus Daily Low Price. One (1) is subtracted from this quantity, and the result is multiplied by 100.


593
Chapter 20 Prices, Dividends, Earnings and Shares
Prices, Dividends, Earnings and Shares
This chapter presents data definitions for prices, dividends, earnings and share items. This chapter includes monthly, quarterly, fiscal year and calendar year market data. Monthly market data is available only for the primary issue of company stock.
Prices, Dividends, Earnings and Shares Items
Adjustment Factors
Data Item
Annual mnemonic . . . page
Quarterly mnemonic . . . page
Monthly mnemonic . . . page
Adjustment Factor (Company) - Cumulative by Payable Date
AJP . . . 674 AJPQ . . . 675 AJPM . . . 675
Adjustment Factor (Company) - Cumulative by Ex Date
AJEX . . . 671 AJEXQ . . . 673 AJEXM . . . 672
Data Item
Weekly mnemonic . . . page
Daily mnemonic . . . page
Current mnemonic . . . page
Adjustment Factor (Company) - Cumulative by Payable Date
AJPW . . . 675 AJPD . . . 674 AFP . . . 674
Adjustment Factor (Company) - Cumulative by Ex Date
AJEXW . . . 605 AJEXD . . . 672 AFEX . . . 671
Prices
Data Item
Annual mnemonic . . . page
Monthly mnemonic . . . page
Daily High Price PRCHD . . . 622 Daily Low Price PRCLD . . . 623 Daily Close Price PRCCD . . . 622 Fiscal Year Price - High PRCHF . . . 700 Fiscal Year Price - Low PRCLF . . . 700 Fiscal Year Price - Close PRCCF . . . 701 High Price - 3 Year Average PRCH3 . . . 697 High Price - 5 Year Average PRCH5 . . . 698 High Price - 10 Year Average PRCH10 . . . 698 Low Price - 3 Year Average PRCL3 . . . 697
CHAPTER 20

Research Insight North America Data Guide
594
Low Price - 5 Year Average PRCL5 . . . 697 Low Price - 10 Year Average PRCL10 . . . 697 Price - Calendar Year - Close PRCC . . . 699 Price - Calendar Year - High PRCH . . . 699 Price - Calendar Year - Low PRCL . . . 698 Price - Fiscal Year - Close PRCCF . . . 701 Price - Fiscal Year - High PRCHF . . . 700 Price - Fiscal Year - Low PRCLF . . . 700 Price - Monthly - Close PRCCM . . . 702 Price - Monthly - High PRCHM . . . 701 Price - Monthly - High 12MM PRCHM12 . . . 698 Price - Monthly - Low PRCLM . . . 702 Price - Monthly - Low 12MM PRCLM12 . . . 697 Price - Weekly - Close PRCCW . . . 703
Dividends
Data Item
Annual mnemonic . . . page
Quarterly/Weekly mnemonic . . . page
Monthly mnemonic . . . page
Cash Dividends - Common DVC . . . 262 Cash Dividends - Preferred DVP . . . 199 Cash Equivalent Distributions per Share
CHEQVM . . . 677
Dividend Payout DVPOR . . . 634 Dividend Payout - Average - 3 Year
DVPOR3 . . . 634
Dividend Payout - Average - 5 Year
DVPOR5 . . . 634
Dividend Payout - Average - 10 Year
DVPOR10 . . . 634
Dividend Rate - Current DVRATE . . . 680 Dividend Yield - Current DVYDC . . . 635 Dividend Yield - Fiscal Year-end DVYDF . . . 635 Dividends per Share by Ex-Date DVPSX . . . 681 DVPSXQ . . . 682 DVPSXM . . . 681 Dividends per Share by Payable Date
DVPSP . . . 683 DVPSPQ . . . 683
Indicated Annual Dividends - Quarterly
DVIQ . . . 696
Relative Dividend Yield - S&P500
DVYLD500 . . . 651
Relative Dividend Yield - S&P Industrials
DVYLDIND . . . 651

595
Chapter 20 Prices, Dividends, Earnings and Shares
Relative Dividend Yield - S&P Midcap
DVYLDMID . . . 651
Relative Dividend Yield - S&P Sector
DVYLDIDX . . . 652
Earnings per Share
Data Item
Annual mnemonic . . . page
Quarterly mnemonic . . . page
EPS Basic - Excl. Extraordinary Items
EPSPX . . . 685 EPSPXQ . . . 686
EPS Basic - Excl. Extra. Items - 12MM
EPSX12 . . . 687
EPS Basic - Incl. Extraordinary Items
EPSPI . . . 687 EPSPIQ . . . 688
EPS Basic from Operations OPEPS . . . 689 OPEPSQ . . . 689 EPS Diluted - Excl. Extraordinary Items
EPSFX . . . 691 EPSFXQ . . . 691
EPS Diluted - Excl. Extra. Items 12MM
EPSF12 . . . 692
EPS Diluted - Incl. Extraordinary Items
EPSFI . . . 694 EPSFIQ . . . 695
EPS from Operations - 12MM OEPS12 . . . 690 EPS Percentage Change - 1 Year EPSCHG1 . . . 695 EPS Percentage Change - 3 Year EPSCHG3 . . . 695 EPS Percentage Change - 5 Year EPSCHG5 . . . 696 EPS Percentage Change - 10 Year
EPSCHG10 . . . 696
Earnings Predictability EPSPRED . . . 361
Share Data Items
Data Item
Annual mnemonic . . . page
Quarterly mnemonic . . . page
Monthly/Weekly mnemonic . . . page
Common Shares for 12MM EPS CSH12Q . . . 200 Common Shares for Basic EPS CSHPRI . . . 200 CSHPRQ . . . 201 Common Shares for Diluted EPS CSHFD . . . 201 CSHFDQ . . . 202 Common Shares Outstanding - Company
CSHO . . . 156 CSHOQ . . . 156
Common Shares Reserved for Conversion - Convertible Debt
CSHRC . . . 678
Common Shares Reserved for Conversion - Preferred Stock
CSHRP . . . 678

Research Insight North America Data Guide
596
Common Shares Reserved for Conversion - Stock Options
CSHRSO . . . 679
Common Shares Reserved for Conversion - Total
CSHRT . . . 679
Common Shares Reserved for Conversion - Warrants and Others
CSHRW . . . 679
Common Stock Float Shares - Canada
CSFSM . . . 314
Trading Volume CSHTR . . . 704 CSHTRQ . . . 706 CSHTRM . . . 706 CSHTRW . . . 707
Trading Volume - Fiscal Year CSHTRF . . . 705 Trading Volume - Average - 1 Year CSHTR1 . . . 611 Trading Volume - Average - 3 Year CSHTR3 . . . 676 Trading Volume - Average - 5 Year CSHTR5 . . . 676 Trading Volume - Average - 10 Year
CSHTR10 . . . 676
Treasury Stock - Number of Common Shares
TSTKN . . . 191

597
Chapter 20 Prices, Dividends, Earnings and Shares
Data Definitions
Adjustment Factor (Company) - Cumulative by Ex-date Mnemonic AJEX
Data item number A27
Units Ratio
This item represents a ratio that enables you to adjust per-share data (such as, price, earnings per share, and dividends per share), as well as share data (such as, shares outstanding and shares traded) for all stock splits and stock dividends that occur subsequent to the end of a given period. By default, Research Insight adjusts all data for stock splits. The default can be changed using the Options » Adjustment Factors command from the menu bar.
The cumulative adjustment factors for all periods are changed whenever a stock split or stock dividend occurs. The change will be reflected when you receive your next CD or when you download current prices.
The factors are carried to six decimal places to minimize rounding errors. If for example, a two-for-one split occurred in fiscal 1994, the adjustment factor for 1993 would be indicated as 2.000000. If, in addition, a 2 percent stock dividend occurred in 1993, the adjustment factor for 1992 would be indicated as cumulative adjustment, 2.040000 (2.000000 X 1.020000).
The adjustment factors are indicated as 1.000000 when no changes in capitalization have occurred due to splits and dividends.
The ex-dividend date is used to determine the adjustment of per-share data.
This item cannot be modified.
Adjustment Factor (Company) - Cumulative by Ex-date - Current Mnemonic AFEX
Units Ratio
This item represents a ratio, which enables you to adjust per-share data (such as, price, earnings per share, and dividends per share), as well as share data (such as, shares outstanding and shares traded) for all stock splits and stock dividends that occur subsequent to the end of a given period. By default, Research Insight adjusts all data for stock splits. The default can be changed using the Options » Adjustment Factors command from the menu bar.
The cumulative adjustment factors for all periods are changed whenever a stock split or stock dividend occurs. The change will be reflected when you receive your next CD or when you download current prices.
The factors are carried to six decimal places to minimize rounding errors. If for example, a two-for-one split occurred in fiscal 1994, the adjustment factor for 1993 would be indicated as 2.000000. If, in addition, a 2 percent stock dividend occurred in 1993, the adjustment factor for 1992 would be indicated as cumulative adjustment, 2.040000 (2.000000 X 1.020000).
The adjustment factors are indicated as 1.000000 when no changes in capitalization have occurred due to splits and dividends.
The ex-dividend date is used to determine the adjustment of per-share data.

Research Insight North America Data Guide
598
AFEX will be available only to On-line subscribers.
This item cannot be modified.
Adjustment Factor (Company) - Cumulative by Ex-date - Daily Mnemonic AJEXD
Units Ratio
This item represents a ratio, which enables you to adjust per-share data (such as, price, earnings per share, and dividends per share), as well as share data (such as, shares outstanding and shares traded) for all stock splits and stock dividends that occur subsequent to the end of a given period. By default, Research Insight adjusts all data for stock splits. The default can be changed using the Options » Adjustment Factors command from the menu bar.
The cumulative adjustment factors for all periods are changed whenever a stock split or stock dividend occurs. The change will be reflected when you receive your next CD or when you download current prices.
The factors are carried to six decimal places to minimize rounding errors. If for example, a two-for-one split occurred in fiscal 1994, the adjustment factor for 1993 would be indicated as 2.000000. If, in addition, a 2 percent stock dividend occurred in 1993, the adjustment factor for 1992 would be indicated as cumulative adjustment, 2.040000 (2.000000 X 1.020000).
The adjustment factors are indicated as 1.000000 when no changes in capitalization have occurred due to splits and dividends.
The ex-dividend date is used to determine the adjustment of per-share data.
This item cannot be modified.
Adjustment Factor (Company) - Cumulative by Ex-date - Monthly Mnemonic AJEXM
Units Ratio
This item represents a ratio, which enables you to adjust per-share data (such as, price, earnings per share, and dividends per share), as well as share data (such as, shares outstanding and shares traded) for all stock splits and stock dividends that occur subsequent to the end of a given period. By default, Research Insight adjusts all data for stock splits. The default can be changed using the Options » Adjustment Factors command from the menu bar.
The cumulative adjustment factors for all periods are changed whenever a stock split or stock dividend occurs. The change will be reflected when you receive your next CD or when you download current prices.
The factors are carried to six decimal places to minimize rounding errors. If for example, a two-for-one split occurred in fiscal 1994, the adjustment factor for 1993 would be indicated as 2.000000. If, in addition, a 2 percent stock dividend occurred in 1993, the adjustment factor for 1992 would be indicated as cumulative adjustment, 2.040000 (2.000000 X 1.020000).
The adjustment factors are indicated as 1.000000 when no changes in capitalization have occurred due to splits and dividends.
The ex-dividend date is used to determine the adjustment of per-share data.
This item cannot be modified.

599
Chapter 20 Prices, Dividends, Earnings and Shares
Adjustment Factor (Company) - Cumulative by Ex-date - Weekly Mnemonic AJEXW
Units Ratio
This item will be blank, but is available for user input.
Adjustment Factor (Company) - Cumulative by Ex-date - Quarterly Mnemonic AJEXQ
Data item number Q17
Units Ratio
This item represents a ratio, which enables you to adjust per-share data (such as, price, earnings per share, and dividends per share), as well as share data (such as, shares outstanding and shares traded) for all stock splits and stock dividends that occur subsequent to the end of a given period. By default, Research Insight adjusts all data for stock splits. The default can be changed using the Options » Adjustment Factors command from the menu bar.
The cumulative adjustment factors for all periods are changed whenever a stock split or stock dividend occurs. The change will be reflected when you receive your next CD or when you download current prices.
The factors are carried to six decimal places to minimize rounding errors. If for example, a two-for-one split occurred in fiscal 1994, the adjustment factor for 1993 would be indicated as 2.000000. If, in addition, a 2 percent stock dividend occurred in 1993, the adjustment factor for 1992 would be indicated as cumulative adjustment, 2.040000 (2.000000 X 1.020000).
The adjustment factors are indicated as 1.000000 when no changes in capitalization have occurred due to splits and dividends.
The ex-dividend date is used to determine the adjustment of per-share data.
This item cannot be modified.
Adjustment Factor (Company) - Cumulative by Payable Date - Annual Mnemonic AJP
Data item number A202
Units Ratio
This item is identical in definition to Adjustment Factor (Company) - Cumulative by Ex-Date with the following exceptions: 1. The payable date, rather than the ex-date, is used in the determination of adjustment of Dividends per
Share by Payable Date
2. Dividends per Share by Payable Date is the only item to which the Adjustment Factor – Cumulative by Payable Date is applied
This item cannot be modified.

Research Insight North America Data Guide
600
Adjustment Factor (Company) - Cumulative by Payable Date - Current Mnemonic AFP
Units Ratio
This item is identical in definition to Adjustment Factor (Company) - Cumulative by Ex-Date with the following exceptions:
The payable date, rather than the ex-date, is used in the determination of adjustment of Dividends per Share by Payable Date
Dividends per Share by Payable Date is the only item to which the Adjustment Factor – Cumulative by Payable Date is applied
AFP will be available only to On-line subscribers.
This item cannot be modified.
Adjustment Factor (Company) - Cumulative by Payable Date - Daily Mnemonic AJPD
Units Ratio
This item is identical in definition to Adjustment Factor (Company) - Cumulative by Ex-Date with the following exceptions:
1. The payable date, rather than the ex-date, is used in the determination of adjustment of Dividends per Share by Payable Date
2. Dividends per Share by Payable Date is the only item to which the Adjustment Factor – Cumulative by Payable Date is applied
This item cannot be modified.
Adjustment Factor (Company) - Cumulative by Payable Date - Monthly Mnemonic AJPM
Units Ratio
This item is identical in definition to Adjustment Factor (Company) - Cumulative by Ex-Date with the following exceptions: 1. The payable date, rather than the ex-date, is used in the determination of adjustment of Dividends per
Share by Payable Date
2. Dividends per Share by Payable Date is the only item to which the Adjustment Factor – Cumulative by Payable Date is applied
This item cannot be modified.

601
Chapter 20 Prices, Dividends, Earnings and Shares
Adjustment Factor (Company) - Cumulative by Payable Date - Quarterly Mnemonic AJPQ
Data item number Q100
Units Ratio
This item is identical in definition to Adjustment Factor (Company) - Cumulative by Ex-Date with the following exceptions: 1. The payable date, rather than the ex-date, is used in the determination of adjustment of Dividends per
Share by Payable Date
2. Dividends per Share by Payable Date is the only item to which the Adjustment Factor – Cumulative by Payable Date is applied
This item cannot be modified.
Adjustment Factor (Company) - Cumulative by Payable Date - Weekly Mnemonic AJPW
Units Ratio
This item is identical in definition to Adjustment Factor (Company) - Cumulative by Ex-Date with the following exceptions: 1. The payable date, rather than the ex-date, is used in the determination of adjustment of Dividends per
Share by Payable Date
2. Dividends per Share by Payable Date is the only item to which the Adjustment Factor – Cumulative by Payable Date is applied
This item cannot be modified.
Adjustment Factor (Company) - Current Date Daily Mnemonic AFDTE
This item represents the date for current prices. It is presented as mm/dd/yy (for example, 12/20/96).
This item cannot be modified.
Average Trading Volume - 10 Year Mnemonic CSHTR10
Concept calculation @PAVG(CSHTRM,-119,0)
This concept is the average of the Common Shares Traded - Monthly (Company) for the last 10 years.

Research Insight North America Data Guide
602
Average Trading Volume - 3 Year Mnemonic CSHTR3
Concept calculation @PAVG(CSHTRM,-35,0)
This concept is the average of the Common Shares Traded - Monthly (Company) for the last three years.
Average Trading Volume - 5 Year Mnemonic CSHTR5
Concept calculation @PAVG(CSHTRM,-59,0)
This concept is the average of the Common Shares Traded - Monthly (Company) for the last five years.
Cash Equivalent Distributions Per Share by Ex-Date Mnemonic CHEQVM
Units Dollars and cents
This item represents a per share stock distribution in stock of another company. This may reflect a stock distribution in warrants, debentures or rights.
This figure is fully adjustable for all stock splits and stock dividends occurring during that month.
Distributions are presented in the same currency as prices. If necessary, a distribution is converted into the same currency as the price.
Distributions are zero in months when no distribution is paid.
Common Shares Outstanding - Company Mnemonic CSHO
Annual Data Item Number A25
Units Millions
This item represents the net number of all common shares outstanding at yearend, excluding treasury shares and scrip.
Common treasury shares carried on the asset side of the balance sheet are netted against the number of common shares issued.
Common shares paid in stock dividends are included when the ex-dividend date falls within the year and the payment date the next year.
Common Shares Outstanding will not be the same as Common Shares for Basic Earnings per Share when the company reports earnings per share based on average shares, when there has been a change in the shares over the year, when more than one class of common stock is outstanding or when the company reports earnings per share based on common stock equivalents.
Common shares will be excluded when a company nets shares held by a consolidated subsidiary against the capital account.

603
Chapter 20 Prices, Dividends, Earnings and Shares
Common Shares Outstanding - Company - Quarterly Mnemonic CSHOQ
Quarterly Data Item Number Q61
Units Millions
This item represents the net number of all common shares outstanding at the end of the quarter, excluding treasury shares and scrip.
Common treasury shares carried on the asset side of the balance sheet are netted against the number of common shares issued.
Common shares paid in stock dividends are included when the ex-dividend date falls within the year and the payment date the next year.
Common Shares Outstanding will not be the same as Common Shares for Basic Earnings per Share when the company reports earnings per share based on average shares, when there has been a change in the shares over the year, when more than one class of common stock is outstanding or when the company reports earnings per share based on common stock equivalents.
Common shares will be excluded when a company nets shares held by a consolidated subsidiary against the capital account.
Common Shares Outstanding - Company - Quarterly - Note Mnemonic CSHOQF
Code Description JI Reflects current shares outstanding from FT
Interactive Data JQ Report date differs from balance sheet date ZF Shares carried forward from previous quarter
Common Shares Reserved for Conversion - Convertible Debt Mnemonic CSHRC
Annual Data Item Number A200
Units Millions
This item is no longer collected as of August 22, 1996.
This item represents the maximum number of common shares available at year-end that would be issued by the company if all debt with conversion privileges were converted into common stock.
This item is not available for banks or utilities.

Research Insight North America Data Guide
604
Common Shares Reserved for Conversion - Preferred Stock Mnemonic CSHRP
Annual Data Item Number A203
Units Millions
This item is no longer collected as of August 22, 1996.
This item represents the maximum number of common shares at yearend that would be issued by the company if all preferred stock with conversion privileges was converted into common stock.
This item is not available for banks or utilities.
Common Shares Reserved for Conversion - Stock Options Mnemonic CSHRSO
Annual Data Item Number A215
Units Millions
This item is no longer collected as of August 22, 1996.
This item represents shares reserved for stock options outstanding as of year-end plus options that are available for future grants.
Prior to August 22, 1996, this item included: 1. Shares subject to shareholder approval
2. Stock appreciation rights attached to or associated with stock options
This item excludes plans contingent on shareholder approval unless specifically included by the company in a total shares reserved figure.
This item is not available for banks or utilities.
Common Shares Reserved for Conversion - Total Mnemonic CSHRT
Annual Data Item Number A40
Units Millions
This item is no longer collected as of August 22, 1996.
This item represents the maximum number of common shares required if all the outstanding convertible debt and preferred stock with conversion privileges were converted into common shares; if all stock options, warrants and rights were exercised, and if contingently issuable shares were issued.
This item is not available for property and casualty companies.
Common Shares Reserved for Conversion - Warrants and Other Mnemonic CSHRW

605
Chapter 20 Prices, Dividends, Earnings and Shares
Annual Data Item Number A229
Units Millions
This item is no longer collected as of August 22, 1996.
This item represents all common shares reserved for warrants and other shares reserved not included elsewhere.
This item includes 1. Warrants and rights
2. Stock purchase contracts
3. Stock subscription agreements
4. Contingent issue agreements
This item excludes 1. Subsidiary stock reserved for conversion
2. Employee Stock Ownership Plans (ESOP)
3. Stock appreciation rights
This item is not available for banks or utilities.
Dividend Rate - Current Mnemonic DVRATE
Units Dollars and cents
The dividend rate reflected by this item depends upon the manner in which the company reports its dividend information. If a company reports its dividends on a consistent basis (i.e., it always reports a 12 cent dividend), then this data item is determined by multiplying the latest dividend paid per share by the number of times it is paid during the year. In most cases the dividend is paid quarterly, and is therefore, multiplied by four. If the company subsequently changes its dividend amount (i.e., from 12 cents to 15 cents), the annual rate will be projected by multiplying the new amount by the number of times paid during the year, rather than wait until 12 months have passed to confirm that the company did indeed report the new rate each quarter. The Dividend Rate – Current also includes any consistent extra or special year-end dividends. An extra is considered to be consistent when it is paid for two consecutive time periods. The extra is not included the first time it is paid.
If a company does not report its dividends on a consistent basis (i.e., the dividends are always different each quarter), then the dividends are added together to get the exact sum of the past 12 months.
The Dividend Rate - Current is carried in dollars and cents. For example, a one dollar and 321/2 cent dividend would be carried as 1.325. This figure is fully adjusted for all stock splits and stock dividends subsequent to the last dividend paid. The Cumulative Adjustment Factor can be used to unadjust this item to its originally reported state.
For indexes, the figure carried in this file identifies the anticipated annual dividend rate. Dividends are collected on a monthly basis. The applicable quarterly dividend is obtained by adding the monthly dividends for the three months making up the calendar quarter (i.e., January, February and March for the first calendar quarter; April, Mary and June for the second calendar quarter, etc.). This quarterly dividend is multiplied by four to get the anticipated annual dividend rate. The annualized dividend figures are entered in the quarter-end months (March, June, September and December) and are brought forward into the succeeding months. For example, the same annualized dividend entered for March is also entered for April and May, until it is recalculated based upon the end of the second calendar quarter in June.

Research Insight North America Data Guide
606
Dividends per Share by Ex-Date Mnemonic DVPSX
Annual Data Item Number A26
Units Dollars and cents
This item represents the cash dividends per share for which the ex-dividend dates occurred during the reporting period, adjusted for all stock splits and stock dividends that occurred during the period. This item, unlike Common Dividends, excludes payments in preferred stock in lieu of cash, spin-offs and stock of other corporations.
The ex-dividend date of the cash dividend is, in all cases, used to determine the reporting period in which the dividend is included. In cases where dividends are normally paid quarterly, but the ex-dividend dates of two dividend payments fall in the same quarter, both dividends will be included in that quarter.
Any extra dividend whose ex-dividend date occurred during the period will be included in this item.
Common Dividends is the sum of all classes outstanding when there is more than one class of common stock outstanding, but dividends per share is the major class outstanding.
The dividends are adjusted by the Adjustment Factor - Cumulative by Ex-Date that appears for that year or quarter.
This data item is updated the week after the fiscal yearend.
The dividends per share for companies having more than one class of common stock outstanding will be based on the stock class that is most widely traded (based on volume of shares traded).
The current sources for this data item are FT Interactive Data and Standard & Poor's Dividend Record.
Dividends will always be zero until a company goes public.
This item is gross of tax.
Dividends per Share by Ex-Date - Monthly Mnemonic DVPSXM
Units Dollars and cents
Dividends per Share by Ex-Date represents the cash dividends per share for which the ex-dividend dates occurred during the month, adjusted for all stock splits and stock dividends that occurred during the month. This item excludes payments in preferred stock in lieu of cash, spin-offs and stock of other corporations.
The ex-dividend date of the cash dividends is used to determine the month in which the dividend is included. In cases where the ex-dividend dates of two dividend payments fall in the same month, both dividends are included in that month.
Any extra dividend whose ex-dividend date occurred during the month are included in dividends per share.
Dividends per share for companies having more than one class of common stock outstanding are based on the class of stock most widely traded (based on volume of shares traded).
Dividends are always zero until a company goes public or for months when no dividend is paid.

607
Chapter 20 Prices, Dividends, Earnings and Shares
Sources for this data are FT Interactive Data and Standard & Poor's Dividend Record.
For some companies, there will be gaps in the dividend series. Generally, these will be periods in which earnings per share and other fundamental data have been restated due to a major merger. Since the major merger fundamentally changes the nature of the company, the original price, shares traded and dividend data are not comparable to earnings per share and other fundamental data and are removed from the database.
For foreign Active Industrial companies (*C) and Research Industrial companies (*R), dividends are stated in U.S. dollars and cents. For Canadian companies (*T), dividends are stated in Canadian dollars and cents.This item is gross of tax.
Dividends per Share by Ex-Date - Quarterly Mnemonic DVPSXQ
Quarterly Data Item Number Q16
Units Dollars and cents
This item represents the cash dividends per share for which the ex-dividend dates occurred during the reporting period, adjusted for all stock splits and stock dividends that occurred during the period. This item, unlike Common Dividends, excludes payments in preferred stock in lieu of cash, spin-offs and stock of other corporations.
The ex-dividend date of the cash dividend is, in all cases, used to determine the reporting period in which the dividend is included. In cases where dividends are normally paid quarterly, but the ex-dividend dates of two dividend payments fall in the same quarter, both dividends will be included in that quarter.
Any extra dividend whose ex-dividend date occurred during the period will be included in this item.
Common Dividends is the sum of all classes outstanding when there is more than one class of common stock outstanding, but dividends per share is the major class outstanding.
The dividends are adjusted by the Adjustment Factor - Cumulative by Ex-Date that appears for that year or quarter.
The dividends per share for companies having more than one class of common stock outstanding will be based on the stock class that is most widely traded (based on volume of shares traded).
The current sources for this data item are FT Interactive Data and Standard & Poor's Dividend Record.
Dividends will always be zero until a company goes public.
This item is updated the week after the end of the month.
This item will be available regardless of whether or not the quarter has been updated.
This item is always presented on a historical basis.
This item is gross of tax.
Dividends per Share by Payable Date Mnemonic DVPSP
Annual Data Item Number A201
Units Dollars and cents

Research Insight North America Data Guide
608
This item represents the cash dividends per share for which the payable dates occurred during the reporting period, adjusted for all stock splits and stock dividends that occurred during the period. This item, unlike Common Dividends, excludes payments in preferred stock in lieu of cash, spin-offs and stock of other corporations.
Any extra dividend whose payable date occurred during the period will be included in this data item.
Common Dividends is the sum of all classes of stock outstanding when there is more than one class of common stock outstanding. Dividends per Share by Payable Date for companies having more than one class of common stock outstanding will be based upon the class of stock that is most widely traded (based on volume of shares traded).
The current sources of information for this data item are Interactive Data Services, Inc. and Standard & Poor's Dividend Record.
Dividends per Share by Payable Date will always be zero until a company goes public.
The dividends per share by payable date are adjusted by the Adjustment Factor - Cumulative by Payable Date for that period.
This item is gross of tax.
Dividends per Share by Payable Date - Quarterly Mnemonic DVPSPQ
Quarterly Data Item Number Q72
Units Dollars and cents
This item represents the cash dividends per share for which the payable dates occurred during the reporting period, adjusted for all stock splits and stock dividends that occurred during the period. This item, unlike Common Dividends, excludes payments in preferred stock in lieu of cash, spin-offs and stock of other corporations.
Any extra dividend whose payable date occurred during the period will be included in this data item.
Common Dividends is the sum of all classes of stock outstanding when there is more than one class of common stock outstanding. Dividends per Share by Payable Date for companies having more than one class of common stock outstanding will be based upon the class of stock that is most widely traded (based on volume of shares traded).
The current sources of information for this data item are Interactive Data Services, Inc. and Standard & Poor's Dividend Record.
Dividends per Share by Payable Date will always be zero until a company goes public.
The dividends per share by payable date are adjusted by the Adjustment Factor - Cumulative by Payable Date for that period.
The payable date of the cash dividend is used to determine the reporting period in which the dividend is included. If the payable dates of more than one dividend payment fall in the same quarter, all dividends will be included in that quarter.
This item includes all dividends paid to date for the quarter and will be available regardless of whether or not the quarter has reported.
This item is gross of tax.

609
Chapter 20 Prices, Dividends, Earnings and Shares
Earnings Before Depreciation Mnemonic Concept Calculation Units
Annual EBITDA OIBDP Millions of Dollars
Quarterly EBITDAQ @VALUE(OIBDPQ,OIBDPQ[-1]) Millions of Dollars
12 Month Moving
EBITDA12 @VALUE(OIBD12,OIBD12[-1]) Millions of Dollars
This item represents Operating Income Before Depreciation Annual, Quarterly, or 12-months moving. (If the current quarter or 12-months is not available, the values from the previous quarter or 12 months will be used.)
Earnings Before Interest and Taxes Mnemonic Concept Calculation Units
Annual EBIT OIADP Millions of Dollars
Quarterly EBITQ @VALUE(OIADPQ,OIADPQ[-1]) Millions of Dollars
12 Month Moving
EBIT12 @VALUE(OIAD12,OIAD12[-1]) Millions of Dollars
This concept is Operating Income After Depreciation - Annual, Quarterly, or 12-months moving. (If Operating Income After Depreciation for the current quarter or current 12 months is not available, the values for the previous quarter or previous 12 months will be used.)
EPS - 12-Month Moving Historical - Canada Mnemonic EPSH12
Units Dollars and cents
This item represents Basic earnings per share applicable to the last 12-month period for Canadian companies (*T).
Standard & Poor's presents earnings per share as originally reported (not restated).
This item takes into account the effects of extraordinary items and discontinued operations.
Standard & Poor's presents only consolidated earnings per share on a fiscal year or interim quarter basis.
EPS Basic - Excl. Extra. Items Mnemonic EPSPX

Research Insight North America Data Guide
610
Annual Data Item Number A58
Units Dollars and cents
This item represents Basic earnings per share before extraordinary items and discontinued operations.
The Basic earnings figures should be reported by the company (as outlined in Accounting Principles Board Opinion No. 15) after the effect of conversion of convertible preferred, convertible debentures, and options and warrants which have been identified as common stock equivalents and before extraordinary items.
Effective December 15, 1997, Federal Accounting Standards Board (FASB) rule 128 requires companies to report Basic and Diluted EPS, replacing Primary and Fully Diluted EPS. The change will affect financial statements issued after this date.
This figure may differ from company reports in the following instances ... 1. Company reports include extraordinary items and/or discontinued operations
2. Company reports before the equity in earnings of nonconsolidated subsidiaries
The historical earnings per share are adjusted by the Adjustment Factor - Cumulative by Ex-Date for that year or quarter.
EPS Basic - Excl. Extra. Items - Note Mnemonic EPSPF
Code Description AC Reflects an accounting change BJ Includes equity in earnings of nonconsolidated
subsidiaries NB Combination of NC and BJ NC Earnings per Share is a Standard & Poor's calculation
and may disagree with company reports NQ Combination of NC and QJ NS Combination of NC and RA QJ Earnings per Share is based on the effect of common
stock equivalents RA Combination of BJ and QJ
EPS Basic - Excl. Extra. Items - Quarterly Mnemonic EPSPXQ
Quarterly Data Item Number Q19
Units Dollars and cents
This item represents Basic earnings per share before extraordinary items and discontinued operations.

611
Chapter 20 Prices, Dividends, Earnings and Shares
The Basic earnings figures should be reported by the company (as outlined in Accounting Principles Board Opinion No. 15) after the effect of conversion of convertible preferred, convertible debentures, and options and warrants which have been identified as common stock equivalents and before extraordinary items.
Effective December 15, 1997, Federal Accounting Standards Board (FASB) rule 128 requires companies to report Basic and Diluted EPS, replacing Primary and Fully Diluted EPS. The change will affect financial statements issued after this date.
This figure may differ from company reports in the following instances ... 1. Company reports include extraordinary items and/or discontinued operations
2. Company reports before the equity in earnings of nonconsolidated subsidiaries
The historical earnings per share are adjusted by the Adjustment Factor - Cumulative by Ex-Date for that year or quarter.
The quarterly earnings are available for up to 80 quarters for active (*C) and Research (*R) companies.
EPS Basic - Excl. Extra. Items - Quarterly - Note Mnemonic EPSPQF
Code Description NC Earnings per Share is a Standard & Poor's calculation
and may disagree with company reports NL Combination of NC and QL NQ Combination of NC and QJ QJ Earnings per Share is based on the effect of common
stock equivalents QL Earnings per Share is net of all dilution as the
company reports only Diluted earnings per share
EPS Basic - Excl. Extra. Items (12-Months Moving) Mnemonic EPSX12
Quarterly Data Item Number Q27
Units Dollars and cents
This item represents Basic earnings per share applicable to the last 12-month period.
This figure is calculated by adding four quarters of available for common and dividing by the 12-months moving share figure. 1. At year end, this will be the same as the annual earnings figure reported to shareholders
2. In interim quarters, this figure will equal (within four cents deviation) the sum of four quarters of Earnings per share Basic - Excluding Extraordinary Items adjusted for subsequent stock splits and dividends

Research Insight North America Data Guide
612
For utility companies, this figure is as reported by the company.
EPS Basic - Incl. Extra. Items Mnemonic EPSPI
Annual Data Item Number A53
Units Dollars and cents
This item represents Basic earnings per share including all extraordinary items and discontinued operations as reported by the company.
The Basic earnings figures should be reported by the company (as outlined in Accounting Principles Board Opinion No. 15) after the effect of conversion of convertible preferred stock, convertible debt and options and warrants that have been identified as common stock equivalents.
Effective December 15, 1997, Federal Accounting Standards Board (FASB) rule 128 requires companies to report Basic and Diluted EPS, replacing Primary and Fully Diluted EPS. The change will affect financial statements issued after this date.
This item, for banks, includes securities gains and losses.
EPS Basic - Incl. Extra. Items - Note Mnemonic EPSPF
Code Description AC Reflects an accounting change BJ Includes equity in earnings of nonconsolidated
subsidiaries NB Combination of NC and BJ NC Earnings per Share is a Standard & Poor's calculation
and may disagree with company reports NQ Combination of NC and QJ NS Combination of NC and RA QJ Earnings per Share is based on the effect of common
stock equivalents RA Combination of BJ and QJ
EPS Basic - Incl. Extra. Items - Quarterly Mnemonic EPSPIQ
Quarterly Data Item Number Q11
Units Dollars and cents
This item represents Basic earnings per share including all extraordinary items and discontinued operations as reported by the company.

613
Chapter 20 Prices, Dividends, Earnings and Shares
The Basic earnings figures should be reported by the company (as outlined in Accounting Principles Board Opinion No. 15) after the effect of conversion of convertible preferred stock, convertible debt and options and warrants that have been identified as common stock equivalents.
Effective December 15, 1997, Federal Accounting Standards Board (FASB) rule 128 requires companies to report Basic and Diluted EPS, replacing Primary and Fully Diluted EPS. The change will affect financial statements issued after this date.
This item, for banks, includes securities gains and losses.
EPS Basic - Incl. Extra. Items - Quarterly - Note Mnemonic EPSPQF
Code Description NC Earnings per Share is a Standard & Poor's calculation
and may disagree with company reports NL Combination of NC and QL NQ Combination of NC and QJ NS Combination of NC and RA QJ Earnings per Share is based on the effect of common
stock equivalents QL Earnings per Share is net of all dilution as the
company reports only Diluted earnings per share
EPS Basic - Incl. Extra. Items (Restated) Mnemonic EPSPIR
Annual Data Item Number A137
Units Dollars and cents
This item represents Earnings per Share Basic - Including Extraordinary Items restated up to ten years for acquisitions, accounting changes, discontinued operations, and/or stock splits/dividends occurring through the end of the current fiscal year. Restated data is collected from summary presentations and is as reported by the company.
Due to the adoption of FASB 128 accounting standards, this item represents historical Earnings per Share Basic – Excluding Extraordinary Items.
This item is not available for banks or utilities.
EPS Basic from Operations Annual mnemonic OPEPS
Quarterly mnemonic OPEPSQ

Research Insight North America Data Guide
614
Annual data item number A233
Quarterly data item number Q177
Units Dollars
This item represents Basic Earnings per Share adjusted to remove the effect of all Special Items from the calculation. This item reflects an Earnings per Share figure which excludes the effect of all nonrecurring events.
This item excludes: 1. Cumulative effect of accounting change
2. Discontinued operations
3. Extraordinary items
4. Special items
5. One-time income tax expenses/benefits
EPS Basic from Operations - Note Mnemonic OPEPSF
Code Description ER Not a total amount NC Earnings per Share is an Standard & Poor's calculation and may
disagree with company reports NR Statutory rate used in calculation RC Combination of NC and NR RD Combination of NC and ER RE Combination of NR and ER RF Combination of NC, ER, and NR
EPS Basic From Operations - Quarterly - Note Mnemonic OEPSQF
Code Description ER Not a total amount NC Earnings per Share is a Standard & Poor’s calculation and may
disagree with company reports NR Statutory rate used in calculation RC Combination of NC and NR

615
Chapter 20 Prices, Dividends, Earnings and Shares
RD Combination of NC and ER RE Combination of NR and ER RF Combination of NC, ER, and NR
EPS From Operations - 12 MM Quarterly mnemonic OEPS12
Quarterly data item number Q178
Units Dollars
This item represents Basic earnings per share applicable to the last 12-month period.
This item represents Basic Earnings per Share adjusted to remove the effect of all Special Items from the calculation. This item reflects an Earnings per Share which excludes the effect of all nonrecurring events.
This item excludes: 1. Cumulative effect of accounting change
2. Discontinued operations
3. Extraordinary items
4. Special items
EPS Diluted - Excl. Extra. Items Mnemonic EPSFX
Annual Data Item Number A57
Units Dollars and cents
This item represents earnings per share after allowing for the conversion of convertible senior stock and debt, and the exercise of warrants, options outstanding, and agreements for issuance of common shares upon satisfaction of certain conditions. This item is calculated in accordance with Accounting Principles Board Opinion No. 15.
Effective December 15, 1997, Federal Accounting Standards Board (FASB) rule 128 requires companies to report Basic and Diluted EPS, replacing Primary and Fully Diluted EPS. The change will affect financial statements issued after this date.
The figure is reported the same as Basic earnings per share if dilution is immaterial (less than 3%).
The figure will always be presented if a diluted earnings per share is reported by the company.
This item excludes 1. Extraordinary items
2. Discontinued operations
The anti-diluted earnings per share for fiscal periods 1997 and forward will be presented if reported by the company. When a company reports that the calculation of dilutive earnings per share results in anti-dilution, but does not report the anti-dilutive earnings per share, the Earnings Per-Share Basic will be carried down into Earnings Per-Share Diluted. Prior to 1997, anti-diluted earnings are not presented.
The historical earnings per share are adjusted by the Adjustment Factor (Cumulative) Ex-Date for that year or quarter.

Research Insight North America Data Guide
616
EPS Diluted - Excl. Extra. Items Quarterly Mnemonic EPSFXQ
Quarterly Data Item Number Q9
Units Dollars and cents
This item represents earnings per share for common shares after allowing for the conversion of convertible senior stock and debt, and the exercise of warrants, options outstanding, and agreements for issuance of common shares upon satisfaction of certain conditions. This item is calculated in accordance with Accounting Principles Board Opinion No. 15.
Effective December 15, 1997, Federal Accounting Standards Board (FASB) rule 128 requires companies to report Basic and Diluted EPS, replacing Primary and Fully Diluted EPS. The change will affect financial statements issued after this date.
The figure is reported the same as Basic earnings per share if dilution is immaterial (less than 3%).
The figure will always be presented if a diluted earnings per share is reported by the company.
This item excludes 1. Extraordinary items
2. Discontinued operations
3. Preferred dividends
The anti-diluted earnings per share for fiscal periods 1997 and forward will be presented if reported by the company. When a company reports that the calculation of dilutive earnings per share results in anti-dilution, but does not report the anti-dilutive earnings per share, the Earnings Per-Share Basic will be carried down into Earnings Per-Share Diluted. Prior to 1997, anti-diluted earnings are not presented.
The historical earnings per share are adjusted by the Adjustment Factor (Cumulative) Ex-Date for that year or quarter.
EPS Diluted - Excl. Extra. Items - 12 MM Mnemonic EPSF12
Units Dollars and cents
This item represents earnings per share after allowing for the conversion of convertible senior stock and debt, and the exercise of warrants, options outstanding and agreements for issuance of common shares upon satisfaction of certain conditions. This item is calculated in accordance with Accounting Principles Board Opinion No. 15.
Effective December 15, 1997, Federal Accounting Standards Board (FASB) rule 128 requires companies to report Basic and Diluted EPS, replacing Primary and Fully Diluted EPS. The change will affect financial statements issued after this date.
The figure is reported the same as Basic earnings per share if dilution is immaterial (less than 3%).
The figure will always be presented if a diluted earnings per share is reported by the company.
This item represents Diluted Earnings Per Share excluding extraordinary items applicable to the last 12-month period.
This item excludes 1. Extraordinary items

617
Chapter 20 Prices, Dividends, Earnings and Shares
2. Discontinued operations
3. Preferred dividends
The anti-diluted earnings per share for fiscal periods 1997 and forward will be presented if reported by the company. When a company reports that the calculation of dilutive earnings per share results in anti-dilution, but does not report the anti-dilutive earnings per share, the Earnings Per-Share Basic will be carried down into Earnings Per-Share Diluted. Prior to 1997, anti-diluted earnings are not presented.
The historical earnings per share are adjusted by the Adjustment Factor (Cumulative) Ex-Date for that year or quarter.
EPS Diluted from Operations Mnemonic OPEPSX
Units Dollars and cents
This item represents Diluted Earnings per Share excluding extra items and adjusted to remove the effect of all Special Items from the calculation. The effects of all nonrecurring events are excluded from the calculation.
Effective December 15, 1997, Federal Accounting Standards Board (FASB) rule 128 requires companies to report Basic and Diluted EPS, replacing Primary and Fully Diluted EPS. The change will affect financial statements issued after this date.
This item excludes 1. Cumulative effect of accounting change
2. Discontinued operations
3. Extraordinary items
4. Special items
EPS Diluted from Operations - Quarterly Mnemonic OEPSXQ
Units Dollars and cents
This item represents Diluted Earnings per Share excluding extra items and adjusted to remove the effect of all Special Items from the calculation. The effects of all nonrecurring events are excluded from the calculation.
Effective December 15, 1997, Federal Accounting Standards Board (FASB) rule 128 requires companies to report Basic and Diluted EPS, replacing Primary and Fully Diluted EPS. The change will affect financial statements issued after this date.
This item excludes: 1. Cumulative effect of accounting change
2. Discontinued operations
3. Extraordinary items
4. Special items

Research Insight North America Data Guide
618
EPS Diluted from Operations - 12 MM Mnemonic OEPF12
Units Dollars and cents
This item represents Diluted Earnings per Share excluding extra items and adjusted to remove the effect of all Special Items from the calculation. The effects of all nonrecurring events are excluded from the calculation.
Effective December 15, 1997, Federal Accounting Standards Board (FASB) rule 128 requires companies to report Basic and Diluted EPS, replacing Primary and Fully Diluted EPS. The change will affect financial statements issued after this date.
This item represents Diluted Earnings per Share applicable to the last 12-month period.
This item excludes: 1. Cumulative effect of accounting change
2. Discontinued operations
3. Extraordinary items
4. Special items
EPS Diluted - Incl. Extra. Items Mnemonic EPSFI
Annual Data Item Number A169
Units Dollars and cents
This item represents earnings per share after allowing for the conversion of convertible senior stock and debt, and the exercise of warrants, options and agreements for issuance of common shares upon satisfaction of certain conditions. This item is calculated in accordance with Accounting Principles Board Opinion No. 15.
Effective December 15, 1997, Federal Accounting Standards Board (FASB) rule 128 requires companies to report Basic and Diluted EPS, replacing Primary and Fully Diluted EPS. The change will affect financial statements issued after this date.
The figure is reported the same as Basic earnings per share including extraordinary items and discontinued operations if dilution is immaterial (less than 3%).
The figure will always be presented if a diluted earnings per share is reported by the company.
This item includes 1. Extraordinary items

619
Chapter 20 Prices, Dividends, Earnings and Shares
2. Discontinued operations
The anti-diluted earnings per share for fiscal periods 1997 and forward will be presented if reported by the company. When a company reports that the calculation of dilutive earnings per share results in anti-dilution, but does not report the anti-dilutive earnings per share, the Earnings Per-Share Basic will be carried down into Earnings Per-Share Diluted. Prior to 1997, anti-diluted earnings are not presented.
The historical earnings per share items are adjusted by the Adjustment Factor (Cumulative) - Ex-Date for that year or quarter.
EPS Diluted - Incl. Extra. Items - Quarterly Mnemonic EPSFIQ
Quarterly Data Item Number Q7
Units Dollars and cents
This item represents earnings per share after allowing for the conversion of convertible senior stock and debt, and the exercise of warrants, options, and agreements for issuance of common shares upon satisfaction of certain conditions. This item is calculated in accordance with Accounting Principles Board Opinion No. 15.
Effective December 15, 1997, Federal Accounting Standards Board (FASB) rule 128 requires companies to report Basic and Diluted EPS, replacing Primary and Fully Diluted EPS. The change will affect financial statements issued after this date.
The figure is reported the same as Basic earnings per share including extraordinary items and discontinued operations if dilution is immaterial (less than 3%).
The figure will always be presented if a diluted earnings per share is reported by the company.
This item includes 1. Extraordinary items
2. Discontinued operations
The anti-diluted earnings per share for fiscal periods 1997 and forward will be presented if reported by the company. When a company reports that the calculation of dilutive earnings per share results in anti-dilution, but does not report the anti-dilutive earnings per share, the Earnings Per-Share Basic will be carried down into Earnings Per-Share Diluted. Prior to 1997, anti-diluted earnings are not presented.
The historical earnings per share items are adjusted by the Adjustment Factor (Cumulative) - Ex-Date for that year or quarter.
EPS Percentage Change - 1 Year Mnemonic EPSCHG1
Concept Calculation ((EPSPX-EPSPX[-1]) /@ABS(EPSPX[-1]))*100
This concept is Earnings per Share Basic Excluding Extraordinary Items minus the previous year’s values of Earnings per Share Basic Excluding Extraordinary Items divided by the absolute value of the previous year’s values of Earnings per Share Basic - Excluding Extraordinary Items. The figure is then multiplied by 100.

Research Insight North America Data Guide
620
EPS Percentage Change - 3 Year Mnemonic EPSCHG3
Concept Calculation ((EPSPX-EPSPX[-3]) /@ABS(EPSPX[-3]))*100
This concept is Earnings per Share Basic Excluding Extraordinary Items minus the previous three year’s values of Earnings per Share Basic Excluding Extraordinary Items divided by the absolute value of the previous three year’s values of Earnings per Share Basic - Excluding Extraordinary Items. The figure is then multiplied by 100.
EPS Percentage Change - 5 Year Mnemonic EPSCHG5
Concept Calculation ((EPSPX-EPSPX[-5]) /@ABS(EPSPX[-5))*100
This concept is Earnings per Share Basic Excluding Extraordinary Items minus the previous five year’s values of Earnings per Share Basic Excluding Extraordinary Items divided by the absolute value of the previous five year’s values of Earnings per Share Basic - Excluding Extraordinary Items. The figure is then multiplied by 100.
EPS Percentage Change - 10 Year Mnemonic EPSCHG10
Concept Calculation ((EPSPX-EPSPX[-10]) /@ABS(EPSPX[-10))*100
This concept is Earnings per Share Basic Excluding Extraordinary Items minus the previous ten year’s values of Earnings per Share Basic Excluding Extraordinary Items divided by the absolute value of the previous ten year’s values of Earnings per Share Basic - Excluding Extraordinary Items. The figure is then multiplied by 100.
Indicated Annual Dividends - Quarterly Mnemonic DVIQ
Quarterly Data Item Number Q20
Units Dollars and cents
This item represents the applicable dividend, multiplied by the number of times dividends were paid during the year. In most cases, the dividend is paid quarterly and is, therefore, multiplied by 4.
Only consistent extra or special year-end dividends are included.
This item will be based on the major class of common stock outstanding when there is more than one class of common stock outstanding.
For foreign companies not reporting dividends per share on a quarterly basis, the Indicated Annual Dividend will be a 12-months moving average.

621
Chapter 20 Prices, Dividends, Earnings and Shares
Low Price - 3-Year Average Mnemonic PRCL3
Concept Calculation @PAVG(PRCLM,-35,0)
This concept is the average of Price - Monthly - Low in the last three years.
Low Price - 5-Year Average Mnemonic PRCL5
Concept Calculation @PAVG(PRCLM,-59,0)
This concept is the average of Price - Monthly -Low in the last five years.
Low Price - 10-Year Average Mnemonic PRCL10
Concept Calculation @PAVG(PRCLM,-119,0)
This concept is the average of Price - Monthly -Low in the last 10 years.
Low Price - 12-Month Moving Mnemonic PRCLM12
Concept Calculation @PMIN(PRCLM,-11,0)
This concept is the lowest value of Price -Monthly -Low in the last year.
High Price - 3-Year Average Mnemonic PRCH3
Concept Calculation @PAVG (PRCHM,-35,0)
This concept is the average of Price - Monthly - High in the last three years.
High Price - 5-Year Average Mnemonic PRCH5
Concept Calculation @PAVG(PRCHM,-59,0)
This concept is the average of Price - Monthly - High in the last five years.

Research Insight North America Data Guide
622
High Price - 10-Year Average Mnemonic PRCH10
Concept Calculation @PAVG(PRCHM,-119,0)
This concept is the average of Price - Monthly - High for the last 10 years.
High Price - 12-Months Moving Mnemonic PRCHM12
Concept Calculation @PMAX(PRCHM,-11,0)
This concept returns the highest Price – Monthly – High (PRCHM) value from the past rolling 12 month period.
Price - Calendar Year - Low Mnemonic PRCL
Annual Data Item Number A23
Units Dollars and cents
This item represents the absolute low transactions during the year for companies on national stock exchanges and bid prices for over-the-counter issues.
Prices are reported on a calendar-year basis.
Prices are adjusted for all stock splits and stock dividends that occurred in the calendar year, except for 06-11 fiscal year companies which have declared stock splits and stock dividends between the end of their fiscal year and the end of the calendar year. In those instances, the stated prices are not adjusted. When a 01-05 fiscal year company has a stock split or a stock dividend after the calendar yearend but before the fiscal yearend, prices will be adjusted.
Prices are reported as a Not Available data code (@NA) for those periods in which a major merger of companies of similar size occurs. This handling of the merging companies is necessary because the prices of one company will not be representative of the newly formed company.
If a company suspends trading, the close price of the stock will be presented as of the last trading day.
Price - Calendar Year - High Mnemonic PRCH
Annual Data Item Number A22
Units Dollars and cents
This item represents the absolute high transactions during the year for companies on national stock exchanges and bid prices for over-the-counter issues.
Prices are reported on a calendar-year basis.

623
Chapter 20 Prices, Dividends, Earnings and Shares
Prices are adjusted for all stock splits and stock dividends that occurred in the calendar year, except for 06-11 fiscal year companies which have declared stock splits and stock dividends between the end of their fiscal year and the end of the calendar year. In those instances, the stated prices are not adjusted. When a 01-05 fiscal year company has a stock split or a stock dividend after the calendar yearend but before the fiscal yearend, prices will be adjusted.
Prices are reported as a Not Available data code (@NA) for those periods in which a major merger of companies of similar size occurs. This handling of the merging companies is necessary because the prices of one company will not be representative of the newly formed company.
If a company suspends trading, the close price of the stock will be presented as of the last trading day.
Price - Calendar Year - Close Mnemonic PRCC
Annual Data Item Number A24
Units Dollars and cents
This item represents the absolute close transactions during the year for companies on national stock exchanges and bid prices for over-the-counter issues.
Prices are reported on a calendar-year basis.
Prices are adjusted for all stock splits and stock dividends that occurred in the fiscal year, except for 06-11 fiscal year companies which have declared stock splits and stock dividends between the end of their fiscal year and the end of the calendar year. In those instances, the stated prices are not adjusted. When a 01-05 fiscal year company has a stock split or a stock dividend after the calendar yearend but before the fiscal year-end, prices will be adjusted.
Prices are reported as a Not Available data code (@NA) for those periods in which a major merger of companies of similar size occurs. This handling of the merging companies is necessary because the prices of one company will not be representative of the newly formed company.
If a company suspends trading, the close price of the stock will be presented as of the last trading day.
Price - Fiscal Year - High Mnemonic PRCHF
Annual Data Item Number A197
Units Dollars and cents
This item represents the absolute high market prices for the company's fiscal year. Bid prices are reported for over-the-counter issues that are not traded on NASDAQ National Market System.
Prices are reported as of a company's fiscal year-end and are adjusted for all stock splits and stock dividends occurring during the fiscal year.
Prices are carried in dollars and cents. The following table indicates the method used:
Exchange Stock Price Standard & Poor's Stock Price
20 20.000
20 1/8 20.125
20 1/4 20.250

Research Insight North America Data Guide
624
20 3/8 20.375
20 1/2 20.500
20 5/8 20.625
20 3/4 20.750
20 7/8 20.875
Prices for Canadian companies ($T) are presented in Canadian dollars and cents.
If a company suspends trading, the high prices will be presented as of the last trading day.
Price - Fiscal Year - Low Mnemonic PRCLF
Annual Data Item Number A198
Units Dollars and cents
This item represents the absolute low market prices for the company's fiscal year. Bid prices are reported for over-the-counter issues that are not traded on NASDAQ National Market System.
Prices are reported as of a company's fiscal year-end and are adjusted for all stock splits and stock dividends occurring during the fiscal year.
Prices are carried in dollars and cents. The following table indicates the method used:
Exchange Stock Price Standard & Poor's Stock Price
20 20.000
20 1/8 20.125
20 1/4 20.250
20 3/8 20.375
20 1/2 20.500
20 5/8 20.625
20 3/4 20.750
20 7/8 20.875
Prices for Canadian companies ($T) are presented in Canadian dollars and cents.
If a company suspends trading, the low prices will be presented as of the last trading day.
Price - Fiscal Year - Close Mnemonic PRCCF
Annual Data Item Number A199
Units Dollars and cents
This item represents the actual fiscal year-end close price for a company’s stock. Bid prices are reported for over-the-counter issues that are not traded on NASDAQ National Market System.

625
Chapter 20 Prices, Dividends, Earnings and Shares
Prices are reported as of a company's fiscal year-end and are adjusted for all stock splits and stock dividends occurring during the fiscal year.
Prices are carried in dollars and cents. The following table indicates the method used:
Exchange Stock Price Standard & Poor's Stock Price
20 20.000
20 1/8 20.125
20 1/4 20.250
20 3/8 20.375
20 1/2 20.500
20 5/8 20.625
20 3/4 20.750
20 7/8 20.875
Prices for Canadian companies ($T) are presented in Canadian dollars and cents.
If a company suspends trading, the close price of the stock will be presented as of the close prices of the last trading day.
Price - Monthly - High Mnemonic PRCHM
Units Dollars and cents
This item contains the absolute high market prices for each calendar month. Bid prices are reported for over-the-counter issues which are not traded on NASDAQ National Market System. (Generally, only the close price is available for over-the-counter companies prior to 1971.)
Prices are carried in dollars and cents. The following table indicates the method used:
Exchange Stock Price Standard & Poor's Stock Price
20 20.000
20 1/8 20.125
20 1/4 20.250
20 3/8 20.375
20 1/2 20.500
20 5/8 20.625
20 3/4 20.750
20 7/8 20.875
Standard & Poor's presents prices for Canadian companies ($T) in Canadian dollars and cents.
When a company is not traded in a given month or months, the price figures appear as Not Available (@NA).

Research Insight North America Data Guide
626
Price - Monthly - Low Mnemonic PRCLM
Units Dollars and cents
This item contains the absolute low market prices for each calendar month. Bid prices are reported for over-the-counter issues which are not traded on NASDAQ National Market System. (Generally, only the close price is available for over-the-counter companies prior to 1971.)
Prices are carried in dollars and cents. The following table indicates the method used:
Exchange Stock Price Standard & Poor's Stock Price
20 20.000
20 1/8 20.125
20 1/4 20.250
20 3/8 20.375
20 1/2 20.500
20 5/8 20.625
20 3/4 20.750
20 7/8 20.875
Standard & Poor's presents prices for Canadian companies ($T) in Canadian dollars and cents.
When a company is not traded in a given month or months, the price figures appear as Not Available (@NA).
Price - Monthly - Close Mnemonic PRCCM
Units Dollars and cents
This item contains the absolute close market prices for each calendar month. Bid prices are reported for over-the-counter issues which are not traded on NASDAQ National Market System. (Generally, only the close price is available for over-the-counter companies prior to 1971.)
Prices are carried in dollars and cents. The following table indicates the method used:
Exchange Stock Price Standard & Poor's Stock Price
20 20.000
20 1/8 20.125
20 1/4 20.250
20 3/8 20.375
20 1/2 20.500
20 5/8 20.625
20 3/4 20.750
20 7/8 20.875

627
Chapter 20 Prices, Dividends, Earnings and Shares
Standard & Poor's presents prices for Canadian companies ($T) in Canadian dollars and cents.
When a company is not traded in a given month or months, the price figures appear as Not Available (@NA).
Price - Weekly Mnemonic PRCCW
Concept Calculation PRCCD[@DAY(0W)]
Units Dollars and cents
This item contains the absolute close market prices for each calendar week. Bid prices are reported for over-the-counter issues which are not traded on NASDAQ National Market System.
Prices are carried in dollars and cents. The following table indicates the method used:
Exchange Stock Price Standard & Poor's Stock Price
20 20.00
20 1/8 20.125
20 1/4 20.250
20 3/8 20.375
20 1/2 20.500
20 5/8 20.625
20 3/4 20.750
20 7/8 20.875
When a company is not traded in a given week or weeks, the price figures contain a Not Available data code (@NA).
Reported Date of Quarterly Earnings Per Share Mnemonic RDQ
Units MM/DD/YY
This item represents the date on which quarterly earnings per share is first publicly reported in the various news media (such as the Wall Street Journal or the Dow Jones News Service). This date is carried in the form MM/DD/YY, representing the year and cumulative day of the year.
Shares Held Portfolio
Mnemonic 1 HOLD1
Mnemonic 2 HOLD2

Research Insight North America Data Guide
628
These are placeholder items used for importing portfolio share holdings.
Short Interest Mnemonic SHORTINT
Units Thousands
Periodicity Monthly
Data Availability 13 months
This item represents the total amount of shares of stock that have been sold short and have not yet been repurchased to close out short positions. All trades are reported based on short positions as of the close of business on the settlement date closest to the 15th of the month.
This item is provided by FT Interactive. Population coverage includes the New York Stock Exchange, American Stock Exchange, and NASDAQ. Data for this item will be available the 4th week of every month.
*NASDAQ’s data availability begins in July 2003.
Trading Volume - Annual (Calendar Year) Mnemonic CSHTR
Annual Data Item Number A28
Units Millions
This item represents the annual number of shares traded for companies listed on national stock exchanges and over-the-counter companies in the NASDAQ system on a calendar year basis. When a company trades stock on more than one exchange, the shares traded are added together and Standard & Poor's presents the composite figure.
The shares traded will be reported even if only a partial period is available (such as, a company goes public in the middle of the year, quarter, or month).
When a company is not traded in a given period, the price figures and shares traded contain a Not Available data code (@NA).
For some companies, there will be gaps in the data series, or periods where price figures and shares traded are not available. Generally, these will be periods in which earnings per share and other fundamental data have been restated due to a major merger involving companies of similar size. Since the major merger fundamentally changes the nature of the company, the original price, shares traded, and dividend data are not comparable to the earnings per share and other fundamental data. Therefore, the price, dividend, and shares traded are removed.
Trading Volume - Annual (Fiscal Year) Mnemonic CSHTRF

629
Chapter 20 Prices, Dividends, Earnings and Shares
Concept calculation (@psum(cshtrm,-11,0) [@mnt(0y)])/1000
Units Millions
This concept sums the monthly number of shares traded for companies listed on national stock exchanges and over-the-counter companies in the NASDAQ system for 12 months from the company’s fiscal year end.
Standard & Poor’s does not make any additional adjustments to the data to account for American Depositary Receipts (ADR); however, it may be further adjusted for stock splits.
Trading Volume - Current Mnemonic CSHCUR
Units Thousands
This is the volume of shares traded on the same day as Price-Current (PRCCUR).
Data for this item will be available only to on-line subscribers.
Trading Volume - Daily Mnemonic CSHTRD
Units Thousands
This item represents the number of shares traded for companies listed on national stock exchanges and over-the-counter companies in the NASDAQ system. This item includes the composite volume across all exchanges. This item is available only to on-line subscribers. When a company trades stock on more than one exchange, the shares traded are added together and Standard & Poor's presents the composite figure. Standard & Poor’s does not make any additional adjustments to the data to account for American Depositary Receipts (ADR); however, it may be further adjusted for stock splits.
The shares traded will be reported even if only a partial period is available (such as, a company goes public in the middle of the year, quarter, or month).
When a company is not traded in a given period, the price figures and shares traded contain a Not Available data code (@NA).
For some companies, there will be gaps in the data series, or periods where price figures and shares traded are not available. Generally, these will be periods in which earnings per share and other fundamental data have been restated due to a major merger involving companies of similar size. Since the major merger fundamentally changes the nature of the company, the original price, shares traded, and dividend data are not comparable to the earnings per share and other fundamental data. Therefore, the price, dividend, and shares traded are removed.
Trading Volume - Monthly Mnemonic CSHTRM
Units Thousands

Research Insight North America Data Guide
630
This item represents the monthly number of shares traded for companies listed on national stock exchanges and over-the-counter companies in the NASDAQ system. When a company trades stock on more than one exchange, the shares traded are added together and Standard & Poor’s presents the composite figure. Standard & Poor’s does not make any additional adjustments to the data to account for American Depositary Receipts (ADR); however, it may be further adjusted for stock splits.
The shares traded will be reported even if only a partial period is available (such as, a company goes public in the middle of the year, quarter, or month).
When a company is not traded in a given period, the price figures and shares traded contain a Not Available data code (@NA).
For some companies, there will be gaps in the data series, or periods where price figures and shares traded are not available. Generally, these will be periods in which earnings per share and other fundamental data have been restated due to a major merger involving companies of similar size. Since the major merger fundamentally changes the nature of the company, the original price, shares traded, and dividend data are not comparable to the earnings per share and other fundamental data. Therefore, the price, dividend, and shares traded are removed.
Trading Volume - Quarterly Mnemonic CSHTRQ
Quarterly Data Item Number Q18
Units Millions
This item represents the quarterly number of shares traded for companies listed on national stock exchanges and over-the-counter companies in the NASDAQ system on a fiscal rather than calendar-quarter basis. When a company trades stock on more than one exchange, the shares traded are added together and Standard & Poor's presents the composite figure. Standard & Poor’s does not make any additional adjustments to the data to account for American Depositary Receipts (ADR); however, it may be further adjusted for stock splits.
The shares traded will be reported even if only a partial period is available (such as, a company goes public in the middle of the year, quarter, or month).
When a company is not traded in a given period, the price figures and shares traded contain a Not Available data code (@NA).
For some companies, there will be gaps in the data series, or periods where price figures and shares traded are not available. Generally, these will be periods in which earnings per share and other fundamental data have been restated due to a major merger involving companies of similar size. Since the major merger fundamentally changes the nature of the company, the original price, shares traded, and dividend data are not comparable to the earnings per share and other fundamental data. Therefore, the price, dividend, and shares traded are removed.
Trading Volume - Weekly Mnemonic CSHTRW
Units Thousands
This item returns the Trading Volume – Daily (CSHTRD) figure from the Friday of the corresponding week. This item is available only to On-line subscribers. When a company trades stock on more than one exchange, the shares traded are added together and Standard & Poor's presents the composite figure.

631
Chapter 20 Prices, Dividends, Earnings and Shares
The shares traded will be reported even if only a partial period is available (such as, a company goes public in the middle of the year, quarter, or month).
When a company is not traded in a given period, the price figures and shares traded contain a Not Available data code (@NA).
For some companies, there will be gaps in the data series, or periods where price figures and shares traded are not available. Generally, these will be periods in which earnings per share and other fundamental data have been restated due to a major merger involving companies of similar size. Since the major merger fundamentally changes the nature of the company, the original price, shares traded, and dividend data are not comparable to the earnings per share and other fundamental data. Therefore, the price, dividend, and shares traded are removed.


633
Chapter 21 Pension Data
Pension Data
This chapter presents various pension components and related pension data. Data items are obtained from the companies' financial statements and notes to the financial statements.
Defined benefit pension plans Financial Accounting Standards Board (FASB) #87 established new disclosure requirements for companies with defined benefit pension plans and is effective for fiscal years beginning after December 15, 1986, (December 15, 1988, for plans outside the United States and for plans with less than 100 participants).
This statement supersedes previous standards for employers accounting for pension. It recognizes the compensation cost of an employee’s pension over that employee’s approximate service period (accrual accounting).
Pension Items
Defined Benefit Plan - after SFAS #132
Description Mnemonic . . . page Status of Pension Plans
Pension - Vested Benefit Obligation PBVNO . . . 719 Pension - Accumulated Benefit Obligation PBACO . . . 713 Pension - Projected Benefit Obligation PBPRO . . . 717 Pension Plan Assets PPLAO . . . 723 Over/Underfunded Assets PPLAO . . . 723 minus
PBPRO . . . 723 Pension - Unrecognized Prior Service Cost PCUPSO . . . 717 Pension - Other Adjustments POAJO . . . 714 Pension - Prepaid/Accrued Cost PCPPAO . . . 716 Assumptions Used for Pension Plans Pension Benefits - Discount Rate (Assumed Rate of Return)
PBARR . . . 720
Pension Plans - Rate of Compensation Increase PPRCI . . . 725 Anticipated Long-Term Rate of Return PPROR . . . 723 Net Pension Cost (Credit) Pension Plans - Service Cost PPSC . . . 725
CHAPTER 21

Research Insight North America Data Guide
634
Pension Plans - Interest Cost PPIC . . . 724 Pension Plans - Expected Return on Plan Assets PPRPA . . . 724 Pension Plans - Other Periodic Costs PPOPCC . . . 724 Periodic Pension Cost (Credit) PPC . . . 726 Other Pension Benefits - Information Date PBID . . . 721 Pension and Retirement Expense XPR . . . 279
Postretirement health care and other benefits
Description Mnemonic . . . page Periodic Postretirement Benefit Cost PPRBC . . . 726 Postretirement Benefit Asset (Liability) PRBA . . . 726
Defined Benefit Plan - before SFAS #132*
Description Mnemonic . . . page Pension - Accumulated Benefit Obligation - Underfunded
PBACU . . . 713
Pension - Additional Minimum Liability - Underfunded PADDML . . . 714 Pension - Other Adjustments - Underfunded POAJU . . . 715 Pension - Prepaid/Accrued Cost - Underfunded PCPPAU . . . 717 Pension - Projected Benefit Obligation - Underfunded PBPRU . . . 718 Pension - Unrecognized Prior Service Cost - Underfunded
PCUPSU . . . 719
Pension - Vested Benefit Obligation - Underfunded PBVNU . . . 719 Pension Plan Assets - Underfunded PPLAU . . . 723
* SFAS #132, effective for fiscal years beginning after December 15, 1997. Companies were no longer required to break out overfunded vs. underfunded pension data.
Defined Benefit Plan - before SFAS #87*
Description Mnemonic . . . page Pension Benefits - Net Assets Available PBNAA . . . 721 Pension Benefits - Present Value Nonvested PBPVN . . . 722 Pension Benefits - Present Value Vested PBNVV . . . 722 Pension Costs - Unfunded Prior Service PCUP . . . 722 Pension Costs - Unfunded Vested Benefits PCUV . . . 722

635
Chapter 21 Pension Data
Pension Benefits - Discount Rate (Assumed Rate of Return)
PBARR . . . 720
Pension Benefits - Information Date PBID . . . 721
*SFAS #87 was effective for fiscal years beginning after December 15, 1986.


637
Chapter 21 Pension Data
Data Definitions
Pension - Accumulated Benefit Obligation Mnemonic PBACO
Annual Data Item Number A285
Units Millions of dollars
Prior to January 1999, this item was called Pension – Accumulated Benefit Obligation (Overfunded).
In February 1998, FASB issued a new statement that standardized employers’ disclosures of pensions and other post-retirement benefits. Effective for companies whose fiscal years began after December 15, 1997, Statement of Financial Accounting Standards (SFAS) #132 permits companies to combine their disclosures regarding over- and underfunded accounts in particular circumstances. Previously, companies were required to report a breakout between over- and underfunded plans on the pension side. This breakout is no longer required under SFAS 132. Due to this accounting change, Standard & Poor’s will no longer differentiate pension information between over- and underfunded, regardless of company presentation.
This item represents the actuarial present value of vested and nonvested benefits earned by employees for services rendered to date of pension plan report.
Amount of benefits is determined by a plan's pension benefit formula which establishes payments participants are entitled to receive. Measurement of the accumulated benefit obligation is based on current and past compensation levels.
Pension - Accumulated Benefit Obligation (Underfunded) Mnemonic PBACU
Annual Data Item Number A293
Units Millions of dollars
This item is no longer collected as of January 1999.
In February 1998, FASB issued a new statement that standardized employers’ disclosures of pensions and other post-retirement benefits. Effective for companies whose fiscal years began after December 15, 1997, Statement of Financial Accounting Standards (SFAS) #132 permits companies to combine their disclosures regarding over- and underfunded accounts in particular circumstances. Previously, companies were required to report a breakout between over- and underfunded plans on the pension side. This breakout is no longer required under SFAS 132. Due to this accounting change, Standard & Poor’s will no longer differentiate pension information between over- and underfunded, regardless of company presentation.
This item represents the actuarial present value of vested and nonvested benefits earned by employees for services rendered to date of pension plan report.
Amount of benefits is determined by a plan's pension benefit formula which establishes payments participants are entitled to receive. Measurement of the accumulated benefit obligation is based on current and past compensation levels.

Research Insight North America Data Guide
638
Pension - Additional Minimum Liability (Underfunded) Mnemonic PADDML
Annual Data Item Number A298
Units Millions of dollars
This item is no longer collected as of January 1999.
In February 1998, FASB issued a new statement that standardized employers’ disclosures of pensions and other post-retirement benefits. Effective for companies whose fiscal years began after December 15, 1997, Statement of Financial Accounting Standards (SFAS) #132 permits companies to combine their disclosures regarding over- and underfunded accounts in particular circumstances. Previously, companies were required to report a breakout between over- and underfunded plans on the pension side. This breakout is no longer required under SFAS 132. Due to this accounting change, Standard & Poor’s will no longer differentiate pension information between over- and underfunded, regardless of company presentation.
This item represents the minimum amount of additional liability necessary for pension liability on the Balance Sheet to at least equal the unfunded accumulated benefit obligation.
This item is available in the following situations ... 1. Prepaid pension cost is recognized as an asset. In this instance, additional minimum liability equals
the sum of the unfunded accumulated benefit obligation plus prepaid pension cost.
2. Unfunded accrued pension cost as a liability is less than the unfunded accumulated benefit obligation. In this instance, additional minimum liability equals the difference between the unfunded accumulated benefit obligation and the unfunded accrued pension cost.
3. There is no accrued or prepaid pension cost. In this instance, additional minimum liability equals the unfunded accumulated benefit obligation.
Pension - Other Adjustments Mnemonic POAJO
Annual Data Item Number A289
Units Millions of dollars
Prior to January 1999, this item was called Pension – Other Adjustments (Overfunded).
In February 1998, FASB issued a new statement that standardized employers’ disclosures of pensions and other post-retirement benefits. Effective for companies whose fiscal years began after December 15, 1997, Statement of Financial Accounting Standards (SFAS) #132 permits companies to combine their disclosures regarding over- and underfunded accounts in particular circumstances. Previously, companies were required to report a breakout between over- and underfunded plans on the pension side. This breakout is no longer required under SFAS 132. Due to this accounting change, Standard & Poor’s will no longer differentiate pension information between over- and underfunded, regardless of company presentation.
This item represents all other adjustments to prepaid/accrued pension cost which are not included in other pension data items.
This item includes

639
Chapter 21 Pension Data
1. Unrecognized net gains (losses) including those from experience different from the assumed and from changes in assumptions.
2. Unrecognized asset gains (losses) including those from difference between the actual return on assets and the assumed return on assets.
3. Unrecognized net obligation (asset) existing at date of initial pension plan application.
4. Additional liability from early retirement termination benefits.
This item excludes 1. Unrecognized prior service cost (included in either Pension - Unrecognized Prior Service Cost
(Overfunded) or Pension - Unrecognized Prior Service Cost (Underfunded)).
2. Adjustments to recognize minimum liability (included in Pension - Additional Minimum Liability (Underfunded)).
Net gains/assets will appear as negative numbers.
Net losses/obligation will appear as positive numbers.
Pension - Other Adjustments (Underfunded) Mnemonic POAJU
Annual Data Item Number A299
Units Millions of dollars
This item is no longer collected as of January 1999.
In February 1998, FASB issued a new statement that standardized employers’ disclosures of pensions and other post-retirement benefits. Effective for companies whose fiscal years began after December 15, 1997, Statement of Financial Accounting Standards (SFAS) #132 permits companies to combine their disclosures regarding over- and underfunded accounts in particular circumstances. Previously, companies were required to report a breakout between over- and underfunded plans on the pension side. This breakout is no longer required under SFAS 132. Due to this accounting change, Standard & Poor’s will no longer differentiate pension information between over- and underfunded, regardless of company presentation.
This item represents all other adjustments to prepaid/accrued pension cost which are not included in other pension data items.
This item includes 1. Unrecognized net gains (losses) including those from experience different from the assumed and from
changes in assumptions.
2. Unrecognized asset gains (losses) including those from difference between the actual return on assets and the assumed return on assets.
3. Unrecognized net obligation (asset) existing at date of initial pension plan application.
4. Additional liability from early retirement termination benefits.
This item excludes 1. Unrecognized prior service cost (included in either Pension - Unrecognized Prior Service Cost
(Overfunded) or Pension - Unrecognized Prior Service Cost (Underfunded)).
2. Adjustments to recognize minimum liability (included in Pension - Additional Minimum Liability (Underfunded)).

Research Insight North America Data Guide
640
Net gains/assets will appear as negative numbers.
Net losses/obligation will appear as positive numbers.
Pension - Prepaid/Accrued Cost Mnemonic PCPPAO
Annual Data Item Number A290
Units Millions of dollars
Prior to January 1999, this item was called Pension – Prepaid/Accrued Cost (Overfunded).
In February 1998, FASB issued a new statement that standardized employers’ disclosures of pensions and other post-retirement benefits. Effective for companies whose fiscal years began after December 15, 1997, Statement of Financial Accounting Standards (SFAS) #132 permits companies to combine their disclosures regarding over- and underfunded accounts in particular circumstances. Previously, companies were required to report a breakout between over- and underfunded plans on the pension side. This breakout is no longer required under SFAS 132. Due to this accounting change, Standard & Poor’s will no longer differentiate pension information between over- and underfunded, regardless of company presentation.
Prepaid pension cost represents cumulative employer contributions in excess of accrued net pension cost and is equal to the difference between plan assets and the projected benefit obligation. It is adjusted for unrecognized net gains and losses, unrecognized net assets, and obligations, among others.
Prepaid pension cost is an asset on the Balance Sheet and appears as a positive number.
Accrued pension cost represents cumulative net pension cost in excess of the employer's contributions and is equal to the excess of the projected benefit obligation over the plan assets. It is adjusted for unrecognized prior service cost, unrecognized net gains and losses, unrecognized net assets, and obligations, etc.
Accrued pension cost is a liability on the Balance Sheet and appears as a negative number.
Pension - Prepaid/Accrued Cost - Note Mnemonic PCPAOF
Code Description AC Reflects the adoption of SFAS 132 IK Includes foreign plans as reported by the company or
as calculated by Standard & Poor's.
Pension - Prepaid/Accrued Cost (Underfunded) Mnemonic PCPPAU
Annual Data Item Number A300

641
Chapter 21 Pension Data
Units Millions of dollars
This item is no longer collected as of January 1999.
In February 1998, FASB issued a new statement that standardized employers’ disclosures of pensions and other post-retirement benefits. Effective for companies whose fiscal years began after December 15, 1997, Statement of Financial Accounting Standards (SFAS) #132 permits companies to combine their disclosures regarding over- and underfunded accounts in particular circumstances. Previously, companies were required to report a breakout between over- and underfunded plans on the pension side. This breakout is no longer required under SFAS 132. Due to this accounting change, Standard & Poor’s will no longer differentiate pension information between over- and underfunded, regardless of company presentation.
Prepaid pension cost represents cumulative employer contributions in excess of accrued net pension cost and is equal to the difference between plan assets and the projected benefit obligation. It is adjusted for unrecognized net gains and losses, unrecognized net assets, and obligations, among others.
Prepaid pension cost is an asset on the Balance Sheet and appears as a positive number.
Accrued pension cost represents cumulative net pension cost in excess of the employer's contributions and is equal to the excess of the projected benefit obligation over the plan assets. It is adjusted for unrecognized prior service cost, unrecognized net gains and losses, unrecognized net assets, and obligations, etc.
Accrued pension cost is a liability on the Balance Sheet and appears as a negative number.
Pension - Prepaid/Accrued Cost (Underfunded) - Note Mnemonic PCPAUF
Code Description IK Includes foreign plans as reported by the company or
as calculated by Standard & Poor's.
This item is no longer collected as of January 1999 due to SFAS 132.
Pension - Projected Benefit Obligation Mnemonic PBPRO
Annual Data Item Number A286
Units Millions of dollars
Prior to January 1999, this item was called Pension – Projected Benefit Obligation (Overfunded).

Research Insight North America Data Guide
642
In February 1998, FASB issued a new statement that standardized employers’ disclosures of pensions and other post-retirement benefits. Effective for companies whose fiscal years began after December 15, 1997, Statement of Financial Accounting Standards (SFAS) #132 permits companies to combine their disclosures regarding over- and underfunded accounts in particular circumstances. Previously, companies were required to report a breakout between over- and underfunded plans on the pension side. This breakout is no longer required under SFAS 132. Due to this accounting change, Standard & Poor’s will no longer differentiate pension information between over- and underfunded, regardless of company presentation.
These items represent actuarial present value of all benefits earned by an employee as of a specified date for service rendered prior to that date plus projected benefits attributable to future salary increases.
If the pension benefit formula is based on future compensation levels, the projected benefit obligation includes assumption as to future increases in those levels.
If the pension benefit formula is not based on future compensation levels, the projected benefit obligation includes assumption as to future increases in those levels.
Pension - Projected Benefit Obligation (Underfunded) Mnemonic PBPRU
Annual Data Item Number A294
Units Millions of dollars
This item is no longer collected as of January 1999.
In February 1998, FASB issued a new statement that standardized employers’ disclosures of pensions and other post-retirement benefits. Effective for companies whose fiscal years began after December 15, 1997, Statement of Financial Accounting Standards (SFAS) #132 permits companies to combine their disclosures regarding over- and underfunded accounts in particular circumstances. Previously, companies were required to report a breakout between over- and underfunded plans on the pension side. This breakout is no longer required under SFAS 132. Due to this accounting change, Standard & Poor’s will no longer differentiate pension information between over- and underfunded, regardless of company presentation.
These items represent actuarial present value of all benefits earned by an employee as of a specified date for service rendered prior to that date plus projected benefits attributable to future salary increases.
If the pension benefit formula is based on future compensation levels, the projected benefit obligation includes assumption as to future increases in those levels.
If the pension benefit formula is not based on future compensation levels, the projected benefit obligation includes assumption as to future increases in those levels.
Pension - Unrecognized Prior Service Cost Mnemonic PCUPSO
Annual Data Item Number A288
Units Millions of dollars
Prior to January 1999, this item was called Pension – Unrecognized Prior Service Cost (Overfunded).

643
Chapter 21 Pension Data
In February 1998, FASB issued a new statement that standardized employers’ disclosures of pensions and other post-retirement benefits. Effective for companies whose fiscal years began after December 15, 1997, Statement of Financial Accounting Standards (SFAS) #132 permits companies to combine their disclosures regarding over- and underfunded accounts in particular circumstances. Previously, companies were required to report a breakout between over- and underfunded plans on the pension side. This breakout is no longer required under SFAS 132. Due to this accounting change, Standard & Poor’s will no longer differentiate pension information between over- and underfunded, regardless of company presentation.
These items represent the amount of prior service cost not yet recognized as part of net periodic pension cost.
These items exclude unrecognized net gain (loss) from past experience different from that assumed.
Pension - Unrecognized Prior Service Cost (Underfunded) Mnemonic PCUPSU
Annual Data Item Number A297
Units Millions of dollars
This item is no longer collected as of January 1999.
In February 1998, FASB issued a new statement that standardized employers’ disclosures of pensions and other post-retirement benefits. Effective for companies whose fiscal years began after December 15, 1997, Statement of Financial Accounting Standards (SFAS) #132 permits companies to combine their disclosures regarding over- and underfunded accounts in particular circumstances. Previously, companies were required to report a breakout between over- and underfunded plans on the pension side. This breakout is no longer required under SFAS 132. Due to this accounting change, Standard & Poor’s will no longer differentiate pension information between over- and underfunded, regardless of company presentation.
These items represent the amount of prior service cost not yet recognized as part of net periodic pension cost.
These items exclude unrecognized net gain (loss) from past experience different from that assumed.
Pension - Vested Benefit Obligation Mnemonic PBVNO
Annual Data Item Number A284
Units Millions of dollars
Prior to January 1999, this item was called Pension – Vested Benefit Obligation (Overfunded).
In February 1998, FASB issued a new statement that standardized employers’ disclosures of pensions and other post-retirement benefits. Effective for companies whose fiscal years began after December 15, 1997, Statement of Financial Accounting Standards (SFAS) #132 permits companies to combine their disclosures regarding over- and underfunded accounts in particular circumstances. Previously, companies were required to report a breakout between over- and underfunded plans on the pension side. This breakout is no longer required under SFAS 132. Due to this accounting change, Standard & Poor’s will no longer differentiate pension information between over- and underfunded, regardless of company presentation.

Research Insight North America Data Guide
644
This item represents the actuarial present value of the vested portion of the accumulated benefit obligation.
This item includes 1. Accumulated benefit obligation when fully vested.
2. Accumulated benefit obligation when substantially vested.
Pension - Vested Benefit Obligation (Underfunded) Mnemonic PBVNU
Annual Data Item Number A291
Units Millions of dollars
This item is no longer collected as of January 1999.
In February 1998, FASB issued a new statement that standardized employers’ disclosures of pensions and other post-retirement benefits. Effective for companies whose fiscal years began after December 15, 1997, Statement of Financial Accounting Standards (SFAS) #132 permits companies to combine their disclosures regarding over- and underfunded accounts in particular circumstances. Previously, companies were required to report a breakout between over- and underfunded plans on the pension side. This breakout is no longer required under SFAS 132. Due to this accounting change, Standard & Poor’s will no longer differentiate pension information between over- and underfunded, regardless of company presentation.
This item represents the actuarial present value of the vested portion of the accumulated benefit obligation.
This item includes 1. Accumulated benefit obligation when fully vested.
2. Accumulated benefit obligation when substantially vested.
Pension Benefits - Discount Rate (Assumed Rate of Return) Mnemonic PBARR
Annual Data Item Number A246
Units Percentage
Before the adoption of Financial Accounting Standards Board Statement #87 (1980-1990), this item represents the assumed rate of return used to determine the actuarial present value of accumulated pension plan benefits.
Accumulated pension plan benefits are reflected at present value to remain on a comparable basis with plan assets. The assumed rate of return on assets is the discount rate used to arrive at the present value of plan benefits.
After adoption of Financial Accounting Standards Board Statement #87 (1991 forward), this item represents a weighted average assumed discount rate. It is an estimated rate used to determine the present value at which the projected benefit obligation could be effectively settled. The discount rate is also referred to as the settlement rate.
This item includes

645
Chapter 21 Pension Data
1. Discount rate or settlement rate (for years 1991 forward)
2. Projected benefit obligation discount rate (for years 1991 forward)
This item excludes 1. Weighted average expected long-term rate of return on pension plan assets
2. Rate of compensation increase
Pension Benefits - Information Date Mnemonic PBID
Annual Data Item Number A247
Units Date
Before adoption of Financial Accounting Standards Board Statement #87 (1980-1990), this item represents the actuarial valuation data as of which benefit information was determined.
After adoption of Financial Accounting Standards Board Statement #87 (1991 forward) this item represents the date at which pension plan assets and obligations are measured.
This date appears as MMDDYY (representing the calendar month, day, and year).
Pension Benefits - Net Assets Available Mnemonic PBNAA
Annual Data Item Number A245
Units Millions of dollars
This item represents a pension plan's assets (as of the benefit information date) available to pay benefits when due.
This item is not available for banks or utilities.
Pension Benefits - Present Value Nonvested Mnemonic PBPVN
Annual Data Item Number A244
Units Millions of dollars
This item represents future pension benefits, based on employees' service rendered to date, contingent upon employees' obligation to fulfill a specified future service requirement.
This item is not available for banks or utilities.
Pension Benefits - Present Value Vested Mnemonic PBNVV
Annual Data Item Number A243

Research Insight North America Data Guide
646
Units Millions of dollars
This item represents future pension benefit payments to legally entitled plan beneficiaries, based on employees' service rendered to date.
Vested benefits are not contingent on an employees' future service.
This item is not available for banks or utilities.
Pension Costs - Unfunded Past Service Mnemonic PCUP
Annual Data Item Number A90
Units Millions of dollars
This item represents the unfunded portion of a company's pension plan generated from employee service before the plan was started, change since actuarial assumptions, changes in plan benefits, and changes in market values.
This item is not available for banks or utilities.
Pension Costs - Unfunded Vested Benefits Mnemonic PCUV
Annual Data Item Number A89
Units Millions of dollars
This item represents the unfunded portion of vested benefits of a company's pension plan.
This item is not available for banks or utilities.
Pension Plan Assets Mnemonic PPLAO
Annual Data Item Number A287
Units Millions of dollars
Prior to January 1999, this item was called Pension Plan Assets (Overfunded).
In February 1998, FASB issued a new statement that standardized employers’ disclosures of pensions and other post-retirement benefits. Effective for companies whose fiscal years began after December 15, 1997, Statement of Financial Accounting Standards (SFAS) #132 permits companies to combine their disclosures regarding over- and underfunded accounts in particular circumstances. Previously, companies were required to report a breakout between over- and underfunded plans on the pension side. This breakout is no longer required under SFAS 132. Due to this accounting change, Standard & Poor’s will no longer differentiate pension information between over- and underfunded, regardless of company presentation.
This item represents the fair value of a pension plan's assets (stocks, bonds and other investments). Such assets are normally set aside and restricted in a trust to pay benefits when due.

647
Chapter 21 Pension Data
Pension Plan Assets (Underfunded) Mnemonic PPLAU
Annual Data Item Number A296
Units Millions of dollars
This item is no longer collected as of January 1999.
In February 1998, FASB issued a new statement that standardized employers’ disclosures of pensions and other post-retirement benefits. Effective for companies whose fiscal years began after December 15, 1997, Statement of Financial Accounting Standards (SFAS) #132 permits companies to combine their disclosures regarding over- and underfunded accounts in particular circumstances. Previously, companies were required to report a breakout between over- and underfunded plans on the pension side. This breakout is no longer required under SFAS 132. Due to this accounting change, Standard & Poor’s will no longer differentiate pension information between over- and underfunded, regardless of company presentation.
This item represents the fair value of a pension plan's assets (stocks, bonds, and other investments). Such assets are normally set aside and restricted in a trust to pay benefits when due.
Pension Plans - Anticipated Long-Term Rate of Return on Plan Assets Mnemonic PPROR
Annual Data Item Number A336
Units Percentage
This item represents a company's assumptions about anticipated interest rates earned by pension plan assets. Companies compute this rate using both current and projected rates of return for different types of investments. Companies use this rate to estimate the value of pension plan assets in future years.
This item includes domestic and foreign plans.
Pension Plans - Expected Return on Plan Assets Mnemonic PPRPA
Annual Data Item Number A333
Units Millions of dollars
This item represents the expected change in market value of pension plan assets, excluding contributions to the plan or payments by the plan. It is the expected return on plan assets.
This item is a component of Periodic Pension Cost.
This item includes 1. Expected/estimated return on pension assets after the adoption of SFAS 132
2. Realized and unrealized losses (gains) on plan assets
3. Return on assets for domestic and foreign plans
This item excludes 1. Losses (gains) not specifically related to plan assets

Research Insight North America Data Guide
648
2. Deferred Return on Plan Assets
Pension Plans - Interest Cost Mnemonic PPIC
Annual Data Item Number A332
Units Millions of dollars
This item represents the accrual of interest for the year on the projected pension benefit obligation. The interest cost reflects the effect of the passage of time on the present value of the obligation.
This item is a component of Periodic Pension Cost.
This item includes interest cost for domestic and foreign pension plans.
Pension Plans - Other Periodic Costs Mnemonic PPOPCC
Annual Data Item Number A334
Units Millions of dollars
This item represents any additional components of Periodic Pension Cost other than Pension Plans - Interest Cost, Pension Plans - Service Cost, and Pension Plans - Return on Plan Assets.
This item includes 1. Amortization of unrecognized prior service cost.
2. Amortization of unrecognized transition assets (liabilities).
3. Changes in the projected benefit obligation (when included in net periodic pension cost, but not reported as interest cost).
4. Domestic and foreign amounts.
5. Gains and losses not reported as part of Pension Plans - Return on Plan Assets
6. Gains and losses (when not included in actual return on plan assets).
7. Net amortization and deferrals.
8. Net periodic pension cost for foreign plans.
After the adoption of SFAS 132, this item no longer includes Deferred Return on Pension Assets.
Pension Plans - Rate of Compensation Increase Mnemonic PPRCI
Annual Data Item Number A335
Units Percentage

649
Chapter 21 Pension Data
This item represents the company's estimates concerning future increases in employees' salaries which will affect future pension plan payments to employees. FASB #87 requires companies to report this rate if they have pay-related pension plans. Companies use this rate to calculate the projected benefit obligation.
This item includes both domestic and foreign plans.
Pension Plans - Service Cost Mnemonic PPSC
Annual Data Item Number A331
Units Millions of dollars
This item represents the present value of expected future pension payments attributed to employee services performed during the current year.
This item is a component of Periodic Pension Cost.
This item includes 1. Benefits earned during the year
2. Service cost for domestic and foreign plans
This item excludes amortization of unrecognized prior service cost.
Periodic Pension Cost Mnemonic PPC
Annual Data Item Number A295
Units Millions of dollars
This item represents the cost of all pension plans covered by SFAS #87 as reflected in the financial statements. SFAS #132 does not affect this data item.
This item includes periodic pension cost for domestic and foreign plans.
This item excludes 1. Pension cost for any plans to which SFAS #87 does not apply.
2. Net periodic postretirement benefit cost.
Note: This item is an expense/cost. If a negative number is returned, the figure represents income/positive value.
Periodic Postretirement Benefit Cost Mnemonic PPRBC
Annual Data Item Number A292
Units Millions of dollars
This item represents the company's cost of postretirement benefit plans that is recognized on the Income Statement. Postretirement benefits include all benefits other than pensions paid to retirees.

Research Insight North America Data Guide
650
This item includes subsidiary postretirement benefit cost.
This item excludes pensions paid to retirees.
Postretirement Benefit Asset Mnemonic PRBA
Annual Data Item Number A330
Units Millions of dollars
This item represents the company's prepaid cost or obligation for postretirement benefits that is recognized on the Balance Sheet.
This item includes 1. Accrued postretirement benefit cost.
2. Current and long-term amounts of unpaid premiums.

651
Chapter 22 Property, Plant and Equipment
Property, Plant and Equipment
This chapter presents definitions for property, plant and equipment components depreciation and depletion of property, plant and equipment. This section represents data formerly required by the SEC to be reported in Schedules V and VI (data no longer collected by Standard & Poor's after 01/27/97)
Property, Plant and Equipment Items
Net Components of Property Plant and Equipment
Description Mnemonic . . . page Property, Plant and Equipment (Net) Property, Plant and Equipment (Net) - Buildings PPENB . . . 742 Property, Plant and Equipment (Net) - Construction in Progress PPENC . . . 743
Property, Plant and Equipment (Net) - Land and Improvements PPENLI . . . 743 Property, Plant and Equipment (Net) - Leases PPENLS . . . 743 Property, Plant and Equipment (Net) - Machinery and Equipment PPENME . . . 744 Property, Plant and Equipment (Net) - Natural Resources PPENNR . . . 745 Property, Plant and Equipment (Net) - Other PPENO . . . 745
Gross Property, Plant and Equipment (formerly Schedule V)
Description Mnemonic . . . page Property, Plant and Equipment
Property, Plant and Equipment - Beginning Balance PPEVBB . . . 741 Property, Plant and Equipment - Capital Expenditures CAPXV . . . 741 Property, Plant and Equipment - Retirements PPEVR . . . 742 Property, Plant and Equipment - Other Changes PPEVO . . . 742 Property, Plant and Equipment - Ending Balance PPEVEB . . . 741 Property, Plant and Equipment (at Cost) Property, Plant and Equipment (at Cost) - Buildings PPECB . . . 738 Property, Plant and Equipment (at Cost) - Construction in Progress
PPECC . . . 738
CHAPTER 22

Research Insight North America Data Guide
652
Property, Plant and Equipment (at Cost) - Land and Improvements
PPECLI . . . 739
Property, Plant and Equipment (at Cost) - Leases PPECLS . . . 739 Property, Plant and Equipment (at Cost) - Machinery and Equipment
PPECME . . . 739
Property, Plant and Equipment (at Cost) - Natural Resources PPECNR . . . 740 Property, Plant and Equipment (at Cost) - Other PPECO . . . 740
Depreciation and Depletion of Property, Plant and Equipment (formerly Schedule VI)
Description Mnemonic . . . page Accumulated Depreciation on Property, Plant and Equipment Depreciation (Accumulated) - (Schedule VI) Beginning Balance DPVIBB . . . 733 Depreciation Expense (Schedule VI) XDP . . . 738 Depletion Expense (Schedule VI) XDEPL . . . 737 Depreciation (Accumulated) - (Schedule VI) Retirements DPVIR . . . 737 Depreciation (Accumulated) - (Schedule VI) Other Changes DPVIO . . . 737 Depreciation (Accumulated) - (Schedule VI) Ending Balance DPVIEB . . . 734 Accumulated Depreciation on Components of Property, Plant and Equipment
Depreciation (Accumulated) - (Schedule VI) Buildings DPACB . . . 733 Depreciation (Accumulated) - (Schedule VI) Construction in Progress
DPACC . . . 733
Depreciation (Accumulated) - (Schedule VI) Land and Improvements
DPACLI . . . 734
Depreciation (Accumulated) - (Schedule VI) Leases DPACLS . . . 735 Depreciation (Accumulated) - (Schedule VI) Machinery and Equipment
DPACME . . . 735
Depreciation (Accumulated) - (Schedule VI) Natural Resources DPACNR . . . 736 Depreciation (Accumulated) - (Schedule VI) Other DPACO . . . 736

653
Chapter 22 Property, Plant and Equipment
Data Definitions
Accumulated Depreciation - (Schedule VI) Beginning Balance Mnemonic DPVIBB
Statement Schedule VI
Data item number A220
Units Millions of dollars
This item is no longer collected as of January 21, 1997.
This item represents the beginning balance of a company’s accumulated depreciation account as reported on Schedule VI. This item includes the effect of pooling of interest acquisitions.
This item is not available for banks.
Accumulated Depreciation - (Schedule VI) Buildings Mnemonic DPACB
Data item number A253
Units Millions of dollars
This item is no longer collected as of January 21, 1997.
This item represents the accumulated depreciation of buildings used in company operations and reported on Schedule VI.
This item includes: 1. Depreciation on buildings used to house the activities of people and equipment for continuing
operations
2. Storage buildings
3. Improvements, leases, and leasehold improvements (when classified with buildings)
4. Parking structures that do not generate revenue
This item is not available for banks.
Accumulated Depreciation - (Schedule VI) Construction in Progress Mnemonic DPACC
Data item number A256
Units Millions of dollars
This item is no longer collected as of January 21, 1997.
This item represents the accumulated depreciation on the capitalized amount of incomplete construction of plant and equipment as reported on Schedule VI.
This item includes depreciation on funds for construction.
This item excludes depreciation on property held for future use.

Research Insight North America Data Guide
654
A Combined Figure data code (@CF) is entered if this item is combined with one or more of the following data items:
Depreciation (Accumulated) – (Schedule VI) Buildings (DPACB)
Depreciation (Accumulated) – (Schedule VI) Land and Improvements (DPACLI)
Depreciation (Accumulated) – (Schedule VI) Leases (DPACLS)
Depreciation (Accumulated) – (Schedule VI) Machinery and Equipment (DPACME)
Depreciation (Accumulated) – (Schedule VI) Natural Resources (DPACNR)
This item is not available for banks.
Accumulated Depreciation - (Schedule VI) Ending Balance Mnemonic DPVIEB
Statement Schedule VI
Data item number A223
Units Millions of dollars
This item represents the ending balance of the accumulated depreciation account.
This item is not available for banks.
Accumulated Depreciation - (Schedule VI) Land and Improvements Mnemonic DPACLI
Data item number A251
Units Millions of dollars
This item is no longer collected as of January 21, 1997.
This item represents the amount of depreciation on land as reported on Schedule VI. Since land does not generally depreciate, this item represents a combination of depreciation on both land and other assets such as natural resources.
This item includes: 1. Land improvements (including roads)
2. Land combined with natural resources
This item is not available for banks.
Accumulated Depreciation - (Schedule VI) Leases Mnemonic DPACLS
Data item number A255
Units Millions of dollars
This item is no longer collected as of January 21, 1997.

655
Chapter 22 Property, Plant and Equipment
This item represents the accumulated depreciation on the capitalized value of leases and leasehold improvements as reported on Schedule VI.
A Combined Figure data code (@CF) is entered if this item is combined with one or more of the following Annual data items:
Depreciation (Accumulated) – (Schedule VI) Buildings (DPACB)
Depreciation (Accumulated) – (Schedule VI) Construction in Progress (DPACC)
Depreciation (Accumulated) – (Schedule VI) Land and Improvements (DPACLI)
Depreciation (Accumulated) – (Schedule VI) Machinery and Equipment (DPACME)
Depreciation (Accumulated) – (Schedule VI) Natural Resources (DPACNR)
This item is not available for banks.
Accumulated Depreciation - (Scheldue VI) Machinery and Equipment Mnemonic DPACME
Data item number A254
Units Millions of dollars
This item is no longer collected as of January 21, 1997.
This item represents the accumulated depreciation on the capitalized amount of equipment used in the production of revenue and reported on Schedule VI.
This item includes depreciation on: 1. Bottles, kegs and containers.
2. Equipment leased to others (when included in property, plant, and equipment on the schedules)
3. Furniture and fixtures
4. Industrial and office machinery
5. Tools, dies, patterns, and bookplates
6. Transportation equipment - trucks and aircraft
A Combined Figure data code (@CF) is entered if this item is combined with Depreciation (Accumulated) – (Schedule VI) Building (DPACB).
This item is not available for banks.
Accumulated Depreciation - (Schedule VI) Natural Resources Mnemonic DPACNR
Data item number A252
Units Millions of dollars
This item is no longer collected as of January 21, 1997.
This item represents accumulated depreciation on natural resources as reported on Schedule VI.
This item includes accumulated depreciation on:

Research Insight North America Data Guide
656
1. Natural resources extracted from either open pit or shaft mines, including metals such as copper, iron, lead, silver, and gold, and minerals such as coal, salt, potash, and limestone
2. Oil and gas reserves from wells drilled below the earth's surface
3. Timberlands
A Combined Figure data code (@CF) is entered if this item is combined with Depreciation (Accumulated) – (Schedule VI) Land and Improvements (DPACLI).
This item is not available for banks.
Accumulated Depreciation - (Schedule VI) Other Mnemonic DPACO
Data item number A257
Units Millions of dollars
This item is no longer collected as of January 21, 1997.
This item represents accumulated depreciation on other property, plant and equipment that is not classified as land, natural resources, buildings, machinery and equipment, leases or construction in progress. The amount of deprecation is collected from Schedule VI.
This item includes depreciation on: 1. Golf courses
2. Intangibles
3. Property held for future use
4. Property to be discontinued
5. Rental properties
6. Revenue-producing parking lots
This item excludes accumulated depreciation on investment tax credits.
This item is not available for banks.
Accumulated Depreciation - (Schedule VI) Other Changes Mnemonic DPVIO
Statement Schedule VI
Data item number A222
Units Millions of dollars
This item is no longer collected as of January 21, 1997.
This item represents changes to accumulated depreciation not classified elsewhere on Schedule VI.
This item is not available for banks.

657
Chapter 22 Property, Plant and Equipment
Accumulated Depreciation - (Schedule VI) Retirements Mnemonic DPVIR
Statement Schedule VI
Data item number A221
Units Millions of dollars
This item is no longer collected as of January 21, 1997.
This item represents a deduction in accumulated depreciation due to the retirement of property, plant and equipment.
This item is not available for banks.
Depletion Expense (Schedule VI) Mnemonic XDEPL
Statement Schedule VI
Annual Data Item Number A174
Units Millions of dollars
This item is no longer collected as of January 21, 1997.
This item represents the non-cash charge for the removal, extinguishment or exhaustion of natural resources from producing properties.
A Combined Figure data code (@CF) is entered if this item is combined with Depreciation Expense (Schedule VI) (XDP).
This item is not available for banks or utilities.
Depreciation Expense (Schedule VI) Mnemonic XDP
Statement Schedule VI
Annual Data Item Number A103
Units Millions of dollars
This item is no longer collected as of January 21, 1997.
This item represents the amount of depreciation charged to the accumulated depreciation account by the company.
This item excludes any depreciation charged to the asset account.
This item is not available for banks or utilities.
PP&E (At Cost) - Buildings Mnemonic PPECB
Annual Data Item Number A263

Research Insight North America Data Guide
658
Units Millions of dollars
This item represents the cost of all buildings included in a company's property, plant, and equipment account. The first year of data availability is 1984.
This item includes 1. Improvements, leaseholds and leasehold improvements when classified with buildings
2. Parking structures that do not generate revenue
This item is not available for banks or utilities.
PP&E (At Cost) - Construction in Progress Mnemonic PPECC
Annual Data Item Number A266
Units Millions of dollars
This item represents the capitalized amount of plant and equipment construction which has not been completed.
This item includes funds for construction.
This item excludes property held for future use (included in Property, Plant, and Equipment - Other)
Utility companies' net construction in progress is available.
This item is not available for banks or property and casualty companies.
PP&E (At Cost) - Land and Improvements Mnemonic PPECLI
Annual Data Item Number A260
Units Millions of dollars
This item represents the cost of land used in the production of revenue.
This item includes: 1. Land and improvements (including roads)
2. Leases and leasehold improvements (when classified with land)
3. Parking lots that do not generate revenue
This item is not available for banks, property and casualty, or utilities companies.
PP&E (At Cost) - Leases Mnemonic PPECLS
Annual Data Item Number A265
Units Millions of dollars

659
Chapter 22 Property, Plant and Equipment
This item represents the capitalized value of leases and leasehold improvements included in property, plant, and equipment.
This item includes leases and leasehold improvements when classified separately.
This item excludes equipment leased to others (included in Property, Plant, and Equipment - Machinery and Equipment)
This item is not available for banks or utilities.
PP&E (At Cost) - Machinery and Equipment Mnemonic PPECME
Annual Data Item Number A264
Units Millions of dollars
This item represents the capitalized cost of machinery used to generate revenue.
This item includes 1. Bottles, kegs, containers
2. Equipment leased to others
3. Furniture and fixtures
4. Industrial and office machinery
5. Tools, dies, patterns, bookplates, etc.
6. Transportation equipment - trucks, aircraft, etc.
This item is not available for banks or utilities.
PP&E (At Cost) - Natural Resources Mnemonic PPECNR
Annual Data Item Number A261
Units Millions of dollars
This item represents the cost of irreplaceable natural resources. The first year of data availability is 1984.
This item includes 1. Mining properties
2. Oil fields
3. Timberlands
This item is not available for banks or utilities.
PP&E (At Cost) - Other Mnemonic PPECO
Annual Data Item Number A267

Research Insight North America Data Guide
660
Units Millions of dollars
This item represents other components of property, plant, and equipment which cannot be categorized as land, natural resources, buildings, machinery and equipment, leases, or construction in progress.
This item includes 1. Other property (if less than 10% of the total property, plant, and equipment account)
2. Golf courses
3. Tangibles
4. Property held for future use
5. Property to be discontinued
6. Rental properties
7. Revenue producing parking lots
8. Software costs from software developed or purchased for future internal use
This item excludes investment tax credits.
This item is not available for banks or utilities.
PP&E - Beginning Balance (Schedule V) Mnemonic PPEVBB
Statement Schedule V
Annual Data Item Number A182
Units Millions of dollars
This item is no longer collected as of January 21, 1997.
This item represents the beginning balance of a company's property, plant, and equipment account as reported on Schedule V. Adjustments for acquisitions (pooling of interest) are also included.
This item includes assets of recently consolidated subsidiaries previously carried as unconsolidated when a company uses the "pooling of interest" acquisition method.
This item is not available for banks or utilities.
PP&E - Capital Expenditures (Schedule V) Mnemonic CAPXV
Statement Schedule V
Annual Data Item Number A30
Units Millions of dollars
This item represents funds used for the construction and/or acquisition of property, plant, and equipment.
This item includes 1. Capital expenditures of pooled companies
2. Property, plant, and equipment of purchased companies

661
Chapter 22 Property, Plant and Equipment
3. Assets of recently consolidated subsidiaries previously carried as unconsolidated when a company uses the "pooling of interest" acquisition method
The sources of data for this item are ... 1. Preliminary - Annual Report (Statement of Cash Flows/Statement of Changes)
NOTE: This figure will not include amounts arising from acquisitions (such as, property, plant, and equipment of a purchased company)
2. Final - 10-K (Schedule V, Column C - Additions At Cost) NOTE: Preliminary or final update can be determined by the Update Code
Utility companies' fixed assets acquired through merger or acquisition are included.
This item is not available for banks or property and casualty companies.
PP&E - Ending Balance Mnemonic PPEVEB
Statement Schedule V
Annual Data Item Number A187
Units Millions of dollars
This item represents the ending balance of a company's property, plant, and equipment account.
This item is not available for banks, utilities, property and casualty, or savings and loan companies.
PP&E - Other Changes Mnemonic PPEVO
Statement Schedule V
Annual Data Item Number A185
Units Millions of dollars
This item is no longer collected as of January 21, 1997.
This item represents changes to the property, plant, and equipment account not elsewhere classified on Schedule V.
This item is not available for banks or utilities.
PP&E - Retirements Mnemonic PPEVR
Statement Schedule V
Annual Data Item Number A184
Units Millions of dollars
This item is no longer collected as of January 21, 1997.

Research Insight North America Data Guide
662
This item represents a deduction from a company's property, plant, and equipment account resulting from the retirement of obsolete or damaged goods and/or physical structures.
This item is not available for banks or utilities.
PP&E (Net) - Buildings Mnemonic PPENB
Annual Data Item Number A155
Units Millions of dollars
This item is no longer collected as of January 21, 1997.
This item represents the cost, minus accumulated depreciation, of all buildings included in a company's property, plant, and equipment account.
This item includes 1. Improvements, leaseholds, and leasehold improvements when classified with buildings
2. Parking structures that do not generate revenue
This item is not available for banks, utilities, property and casualty, or REIT companies.
PP&E (Net) - Construction in Progress Mnemonic PPENC
Annual Data Item Number A73
Units Millions of dollars
This item is no longer collected as of January 21, 1997.
This item represents the capitalized amount of plant and equipment construction, less accumulated depreciation, which has not been completed.
This item includes funds for construction.
This item excludes property held for future use (included in Property, Plant, and Equipment - Other).
Utility companies' net construction in progress is available.
A Combined Figure data code (@CF) is entered if this item is combined with one or more of the following Annual data items: Property, Plant and Equipment (Net) – Buildings (PPENB) Property, Plant and Equipment (Net) – Land and improvements (PPENL) Property, Plant and Equipment (Net) – Leases (PPENLS) Property, Plant and Equipment (Net) – Machinery and Equipment (PPENME) Property, Plant and Equipment (Net) – Natural Resources (PPENNR)
This item is not available for banks or property and casualty companies.

663
Chapter 22 Property, Plant and Equipment
PP&E (Net) - Land and Improvements Mnemonic PPENLI
Annual Data Item Number A158
Units Millions of dollars
This item represents the cost of land, less accumulated depreciation, used in the production of revenue.
This item includes 1. Land and improvements (including roads)
2. Leases and leasehold improvements (when classified with land)
3. Parking lots that do not generate revenue
This item is not available for banks or utilities.
PP&E (Net) - Leases Mnemonic PPENLS
Annual Data Item Number A159
Units Millions of dollars
This item is no longer collected as of January 21, 1997.
This item represents the capitalized value of leases and leasehold improvements, less accumulated depreciation, included in property, plant, and equipment.
This item includes leases and leasehold improvements when classified separately.
This item excludes equipment leased to others (included in Property, Plant, and Equipment - Machinery and Equipment)
A Combined Figure data code (@CF) is entered if this item is combined with one or more of the following Annual data items: Property, Plant and Equipment (Net) – Building (PPENB) Property, Plant and Equipment (Net) – Construction in Progress (PPENC) Property, Plant and Equipment (Net) – Land and Improvements (PPENL) Property, Plant and Equipment (Net) – Machinery and Equipment (PPENME) Property, Plant and Equipment (Net) – Natural Resources (PPENNR)
This item is not available for banks or utilities.
PP&E (Net) - Machinery and Equipment Mnemonic PPENME
Annual Data Item Number A156
Units Millions of dollars
This item is no longer collected as of January 21, 1997.

Research Insight North America Data Guide
664
This item represents the capitalized cost, less accumulated depreciation, of machinery and equipment used to generate revenue.
This item includes 1. Bottles, kegs, and containers
2. Equipment leased to others
3. Furniture and fixtures
4. Industrial and office machinery
5. Tools, dies, patterns, bookplates, etc.
6. Transportation equipment - trucks, aircraft, etc.
A Combined Figure data code (@CF) is entered if this item is combined with Property, Plant and Equipment (Net) – Land and Improvements (PPENLI)
This item is not available for banks or utilities.
PP&E (Net) - Natural Resources Mnemonic PPENNR
Annual Data Item Number A157
Units Millions of dollars
This item is no longer collected as of January 21, 1997.
This item represents the cost of irreplaceable assets created by the work of nature (e.g. products that are extracted or removed directly from the earth or sea) less accumulated depreciation.
This item includes 1. Extraction through mining from either open-pit or shaft mines (metals: copper, iron, gold, silver, etc.;
minerals: coal, salt, limestone, etc.)
2. Harvesting of growing products (e.g. timberlands)
3. Mining properties
4. Oil fields
3. Production through wells drilled below the earth’s surface (i.e., oil and gas)
A Combined Figure data code (@CF) is entered if this item is combined with Property, Plant and Equipment (Net) – Land and Improvements (PPENLI).
This item is not available for banks or utilities.
PP&E (Net) - Other Mnemonic PPENO
Annual Data Item Number A250
Units Millions of dollars
This item is no longer collected as of January 21, 1997.

665
Chapter 22 Property, Plant and Equipment
This item represents other components of property, plant, and equipment, less accumulated depreciation, which cannot be categorized as land, natural resources, buildings, machinery and equipment, leases, or construction in progress.
This item includes 1. Other property (if less than 10% of the total property, plant, and equipment account)
2. Golf courses
3. Intangibles
4. Property held for future use
5. Property to be discontinued
6. Rental properties
7. Revenue producing parking lots
8. Software costs from software developed or purchased for future internal use.
This item excludes investment tax credits.
This item is not available for banks or utilities.


667
Chapter 23 Restated
Restated
Restated annual data items are presented on a current-year basis. Since companies may restate data for acquisitions, accounting changes, and/or discontinued operations, all years of restated data are presented on a basis comparable to the current year.
Restated data may not be strictly comparable to historical data. Although Standard & Poor’s Compustat applies the same definitional standards to restated data collection as it does to historical, exceptions can occur. Every effort is made to collect restated and historical data on a consistent basis.
Read the restated data item definition in conjunction with the historical definition for the same item. Deviations from the historical definition are specifically noted in the restated definition.
Restated Data Items
Balance Sheet Restated
Description Mnemonic . . . page Assets - Total ATR . . . 751 Long-Term Debt - Total DLTTR . . . 758 Property, Plant and Equipment (Net) - Total PPENTR . . . 760 Retained Earnings RER . . . 761 Stockholders' Equity SEQR . . . 762 Working Capital WCAPR . . . 762
Income Statement Restated
Description Mnemonic . . . page Cost of Goods Sold COGSR . . . 753 Depreciation and Amortization DPR . . . 753 Operating Income Before Depreciation Sales SALER . . . 761 Selling, General and Administrative Expense XSGAR . . . 761 Extraordinary Items and Discontinued Operations XIDOR . . . 755 Income Before Extraordinary Items IBR . . . 756 Income Taxes TXTR . . . 756 Interest Expense XINTR . . . 756 Minority Interest (Income Account) MIIR . . . 759 Nonoperating Income (Expense) NOPIR . . . 759
CHAPTER 23

Research Insight North America Data Guide
668
Pretax Income PIR . . . 760 Net Income (Loss) NIR . . . 759
Earnings per Share and Common Shares Used - Restated
Description Mnemonic . . . page Common Shares Used to Calculate EPS (Basic) CSHPRR . . . 752 EPS Basic - Excluding Extraordinary Items EPSPXR . . . 753 EPS Basic - Including Extraordinary Items EPSPIR . . . 689 EPS Diluted - Excluding Extraordinary Items EPSFXR . . . 754 EPS Diluted - Including Extraordinary Items EPSFIR . . . 755
Supplementary Items - Restated
Description Mnemonic . . . page Capital Expenditures CAPXR . . . 751 Employees EMPR . . . 755
Growth Rate - Restated
Description Mnemonic . . . page Coefficient of Determination - EPS Basic - 3 Year REPSR3 . . . 354 Coefficient of Determination - EPS Basic - 5 Year REPSR5 . . . 354 Coefficient of Determination - EPS Basic - 10 Year REPSR10 . . . 355 Coefficient of Determination - Sales - 3 Year RSALR3 . . . 356 Coefficient of Determination - Sales - 5 Year RSALR5 . . . 356 Coefficient of Determination - Sales - 10 Year RSALR10 . . . 357 Least Squares Growth Rate - EPS Primary Excl - 3 Year GEPSR3 . . . 380 Least Squares Growth Rate - EPS Primary Excl - 5 Year GEPSR5 . . . 380 Least Squares Growth Rate - EPS Primary Excl - 10 Year GEPSR10 . . . 380 Least Squares Growth Rate - Sales - 3 Year GSALR3 . . . 381 Least Squares Growth Rate - Sales - 5 Year GSALR5 . . . 381

669
Chapter 23 Restated
Data Definitions
Assets - Total (Restated) Mnemonic ATR
Annual Data Item Number A120
Units Millions of dollars
This item represents Assets – Total restated up to 10 years for acquisitions, accounting changes and/or discontinued operations. Restated data is collected from summary presentations and is as reported by the company.
Due to company presentation, this item may differ from the historical Assets – Total.
For banks, this is an average figure restated up to six years for banks.
Coefficient of Determination - Restated Sales - 10 Year Mnemonic RSALR10
The Coefficient of Determination measures the stability of the 3-, 5-, and 10-year least squares growth rates of each observation. Often referred to as R2, this measure of correlation measures the "goodness of fit" of the plotted points about the regression line or trend.
Capital Expenditures (Restated) Mnemonic CAPXR
Data item number A145
Units Millions of dollars
This item represents Capital Expenditures restated up to ten years for acquisitions, accounting changes and/or discontinued operations. Restated data is collected from summary presentations and is as reported by the company.
Due to company presentation, this item may differ from the historical Capital Expenditures.
This item is not available for banks or utilities.
Coefficient of Determination - Restated EPS Basic - Excluding - 3 Year Mnemonic REPSR3
The Coefficient of Determination measures the stability of the 3-, 5-, and 10-year least squares growth rates of each observation. Often referred to as R2, this measure of correlation measures the "goodness of fit" of the plotted points about the regression line or trend.

Research Insight North America Data Guide
670
Coefficient of Determination - Restated EPS Basic - Excluding - 5 Year Mnemonic REPSR5
The Coefficient of Determination measures the stability of the 3 and 5 year least squares growth rates of each observation. Often referred to as R2, this measure of correlation measures the "goodness of fit" of the plotted points about the regression line or trend.
Coefficient of Determination - Restated EPS Basic - Excluding - 10 Year Mnemonic REPSR10
The Coefficient of Determination measures the stability of the 3-, 5-, and 10-year least squares growth rates of each observation. Often referred to as R2, this measure of correlation measures the "goodness of fit" of the plotted points about the regression line or trend.
Coefficient of Determination - Restated Sales - 3 Year Mnemonic RSALR3
The Coefficient of Determination measures the stability of the 3-, 5-, and 10-year least squares growth rates of each observation. Often referred to as R2, this measure of correlation measures the "goodness of fit" of the plotted points about the regression line or trend.
Coefficient of Determination - Restated Sales - 5 Year Mnemonic RSALR5
The Coefficient of Determination measures the stability of the 3-, 5-, and 10-year least squares growth rates of each observation. Often referred to as R2, this measure of correlation measures the "goodness of fit" of the plotted points about the regression line or trend.
Common Shares for Basic Earnings Per Share (Restated) Mnemonic CSHPRR
Annual Data Item Number A138
Units Millions
This item represents Common Shares for Basic Earnings Per Share restated up to 10 years for acquisitions and/or accounting changes.
This item is not available for utilities.

671
Chapter 23 Restated
Cost of Goods Sold (Restated) Mnemonic COGSR
Annual Data Item 131
Units Millions of dollars
This item represents Cost Of Goods Sold restated up to 10 years for acquisitions, accounting changes and/or discontinued operations. Restated data is collected from summary presentations and is as reported by the company.
Due to company presentation, this item may differ from the historical Cost Of Goods Sold.
This item may include ... 1. Depreciation
2. Interest expense
3. Selling, general, and administrative expenses
This item is not available for banks or utilities.
Depreciation and Amortization (Restated) Mnemonic DPR
Annual Data Item Number A133
Units Millions of dollars
This item represents Depreciation and Amortization restated up to 10 years for acquisitions, accounting changes and/or discontinued operations. Restated data is collected from summary presentations and is as reported by the company.
Due to company presentation, this item may differ from the historical Depreciation and Amortization.
This item is not available for banks or utilities.
EPS Basic - Excl. Extra. Items (Restated) Mnemonic EPSPXR
Annual Data Item Number A119
Units Dollars and cents
This item represents Earnings per Share Basic - Excluding Extraordinary Items restated up to ten years for acquisitions, accounting changes, discontinued operations and/or stock splits/dividends occurring through the end of the current fiscal year. Restated data is collected from summary presentations and is as reported by the company.
Due to the adoption of FASB 128 accounting standards, this item represents historical Earnings per Share Basic – Excluding Extraordinary Items.
The item represents, for banks, net current operating earnings per share excluding extraordinary items restated up to five years and includes net after-tax and after minority interest profit or loss on securities sold or redeemed.
This item is not available for utilities.

Research Insight North America Data Guide
672
EPS Basic - Incl. Extra. Items (Restated) Mnemonic EPSPIR
Annual Data Item Number A137
Units Dollars and cents
This item represents Earnings per Share Basic - Including Extraordinary Items restated up to ten years for acquisitions, accounting changes, discontinued operations, and/or stock splits/dividends occurring through the end of the current fiscal year. Restated data is collected from summary presentations and is as reported by the company.
Due to the adoption of FASB 128 accounting standards, this item represents historical Earnings per Share Basic – Excluding Extraordinary Items.
This item is not available for banks or utilities.
EPS Diluted - Excl. Extra. Items (Restated) Mnemonic EPSFXR
Annual Data Item Number A139
Units Dollars and cents
This item represents Earnings Per Share Diluted - Excluding Extraordinary Items restated up to 10 years for acquisitions, accounting changes, discontinued operations and/or stock splits/dividends occurring through the end of the current fiscal year.
Effective December 15, 1997, Federal Accounting Standards Board (FASB) rule 128 requires companies to report Basic and Diluted EPS, replacing Primary and Fully Diluted EPS. The change will affect financial statements issued after this date.
Due to the adoption of FASB 128 accounting standards, this item represents historical Earnings per Share Basic – Excluding Extraordinary Items.
If the company reports no dilution or immaterial dilution, and the historical figure represents less than 3% of Basic earnings per share, the restated figure will represent Basic earnings per share.
This item is not available for banks or utilities.
EPS Diluted - Incl. Extra. Items (Restated) Mnemonic EPSFIR
Annual Data Item Number A140
Units Dollars and cents
This item represents Earnings per Share Diluted - Including Extraordinary Items, restated up to 10 years for acquisitions, accounting changes, discontinued operations and/or stock splits/dividends occurring through the end of the current fiscal year. Restated data is collected from summary presentations and is as reported by the company.

673
Chapter 23 Restated
Effective December 15, 1997, Federal Accounting Standards Board (FASB) rule 128 requires companies to report Basic and Diluted EPS, replacing Primary and Fully Diluted EPS. The change will affect financial statements issued after this date.
Due to the adoption of FASB 128 accounting standards, this item represents historical Earnings per Share Basic – Excluding Extraordinary Items.
If the company reports no dilution or immaterial dilution, and the historical figure represents less than 3% of Basic earnings per share, the restated figure will represent Basic earnings per share.
This item is not available for banks or utilities.
Employees (Restated) Mnemonic EMPR
Annual Data Item Number A146
Units Actual
This item represents Employees restated up to 10 years for acquisitions, accounting changes and/or discontinued operations. Restated data is collected from summary presentations and is as reported by the company.
Due to company presentation, this item may differ from the historical Employees item.
If the reporting differences between historical and restated figures exceed 10% in the current year, this item will be a Not Available data code (@NA).
Employees (Restated) may represent an average for the year, or may exclude part-time or seasonal employees.
This item is not available for utilities.
Extra. Items and Discontinued Operations (Restated) Mnemonic XIDOR
Annual Data Item Number A136
Units Millions of dollars
This item represents Extraordinary Items and Discontinued Operations restated up to 10 years for acquisitions and/or accounting changes.
This item is not available for banks or utilities.
Income Before Extraordinary Items (Restated) Mnemonic IBR
Annual Data Item Number A118
Units Millions of dollars
This item represents Income Before Extraordinary Items restated up to 10 years for acquisitions and/or accounting changes and is as reported by the company.

Research Insight North America Data Guide
674
This item, for banks, includes net after-tax and after-minority interest profit or loss on securities sold or redeemed.
This item is not available for utilities.
Income Taxes - Total (Restated) Mnemonic TXTR
Annual Data Item Number A135
Units Millions of dollars
This item represents Income Taxes - Total restated up to 10 years for acquisitions and/or accounting changes.
This item is not available for utilities.
Interest Expense (Restated) Mnemonic XINTR
Annual Data Item Number A134
Units Millions of dollars
This item represents Interest Expense restated up to 10 years for acquisitions, accounting changes and/or discontinued operations. Restated data is collected from summary presentations and is as reported by the company.
Due to company presentation, this item may differ from the historical Interest Expense.
Interest Expense (Restated) may be reported net of interest income or net of interest capitalized.
This item is not available for utilities.
Least Squares Growth Rate - Restated EPS Primary - Excl. - 3 Year Mnemonic GEPSR3
Units Percentage
A Least Squares Growth Rate is an average annual growth rate that takes into consideration each observation over a three-, five-, or 10-year period. This growth rate calculates a line of best fit for all observations. This is a log linear growth rate.
The following conditions must be met before a Least Squares Growth Rate is calculated: 1. At least 60% of the observations must be available and positive
2. The most recent observation must be positive. If any other observation is negative or a data code, then the supporting variables for that observation become zero, providing the prior condition is met.

675
Chapter 23 Restated
Least Squares Growth Rate - Restated EPS Primary - Excl. - 5 Year Mnemonic GEPSR5
Units Percentage
A Least Squares Growth Rate is an average annual growth rate that takes into consideration each observation over a three-, five-, or 10-year period. This growth rate calculates a line of best fit for all observations. This is a log linear growth rate.
The following conditions must be met before a Least Squares Growth Rate is calculated: 1. At least 60% of the observations must be available and positive
2. The most recent observation must be positive. If any other observation is negative or a data code, then the supporting variables for that observation become zero, providing the prior condition is met.
Least Squares Growth Rate - Restated EPS Primary - Excl. - 10 Year Mnemonic GEPS10
Units Percentage
A Least Squares Growth Rate is an average annual growth rate that takes into consideration each observation over a three-, five-, or 10-year period. This growth rate calculates a line of best fit for all observations. This is a log linear growth rate.
The following conditions must be met before a Least Squares Growth Rate is calculated: 1. At least 60% of the observations must be available and positive
2. The most recent observation must be positive. If any other observation is negative or a data code, then the supporting variables for that observation become zero, providing the prior condition is met.
Least Squares Growth Rate - Restated Sales - 3 Year Mnemonic GSALR3
Units Percentage
A Least Squares Growth Rate is an average annual growth rate that takes into consideration each observation over a three-, five-, or 10-year period. This growth rate calculates a line of best fit for all observations. This is a log linear growth rate.
The following conditions must be met before a Least Squares Growth Rate is calculated: 1. At least 60% of the observations must be available and positive
2. The most recent observation must be positive. If any other observation is negative or a data code, then the supporting variables for that observation become zero, providing the prior condition is met.
Least Squares Growth Rate - Restated Sales - 5 Year Mnemonic GSALR5
Units Percentage

Research Insight North America Data Guide
676
A Least Squares Growth Rate is an average annual growth rate that takes into consideration each observation over a three-, five-, or 10-year period. This growth rate calculates a line of best fit for all observations. This is a log linear growth rate.
The following conditions must be met before a Least Squares Growth Rate is calculated: 1. At least 60% of the observations must be available and positive
2. The most recent observation must be positive. If any other observation is negative or a data code, then the supporting variables for that observation become zero, providing the prior condition is met.
Long-Term Debt - Total (Restated) Mnemonic DLTTR
Annual Data Item Number A142
Units Millions of dollars
This item represents Long-Term Debt - Total restated up to 10 years for acquisitions, accounting changes and/or discontinued operations. Restated data is collected from summary presentations and is as reported by the company.
Due to company presentation, this item may differ from the historical Long-Term Debt - Total.
If the reporting differences between historical and restated figures exceed 10% in the current year, this item will contain a Not Available data code (@NA).
Long-Term Debt - Total Restated may exclude types of long-term debt that are not reported by the company, such as capitalized leases.
This data item does not include short-term debt or the current portion of long-term debt.
This is an average figure restated up to six years for banks.
This item is not available for utilities.
Minority Interest (Income Account) (Restated) Mnemonic MIIR
Annual Data Item Number A225
Units Millions of dollars
This item represents Minority Interest (Income Account) restated for up to 10 years for acquisition and/or accounting changes. A negative number in this item increases Net Income (Loss) and a positive number decreases Net Income (Loss).
This item is not available for utilities.
Net Income (Loss) - Restated Mnemonic NIR
Annual Data Item Number A177
Units Millions of dollars

677
Chapter 23 Restated
This item represents Net Income (Loss) restated for up to 10 years for acquisitions and/or accounting changes.
This item is not available for utilities.
Nonoperating Income (Expense) - (Restated) Mnemonic NOPIR
Annual Data Item Number A224
Units Millions of dollars
This item represents Nonoperating Income (Expense) restated up to 10 years for acquisitions, accounting changes and/or discontinued operations. Restated data is collected from summary presentations and is as reported by the company.
Due to company presentation, this item may differ from the historical Nonoperating Income (Expense).
This item may include 1. Interest expense, if combined with Nonoperating Income (Expense), or if net interest is positive in one
or more years
2. Minority interest
3. Special Items when not combined with another item
This item may exclude 1. Interest income when combined with interest expense
2. Interest capitalized when combined with interest expense
3. Other income when combined with sales
4. Special items when combined with sales, with costs of goods sold, or with selling, general, and administrative expenses
This item is not available for banks or utilities.
Pretax Income (Restated) Mnemonic PIR
Annual Data Item Number A122
Units Millions of dollars
This item represents Pretax Income restated up to 10 years for acquisitions and/or accounting changes and is as reported by the company.
This item, for banks, is restated up to five years and includes the net after-tax and after-minority interest profit or loss on securities sold or redeemed.
This item is not available for utilities.
PP&E (Net) - Total (Restated) Mnemonic PPENTR

Research Insight North America Data Guide
678
Annual Data Item Number A141
Units Millions of dollars
This item represents Property, Plant, and Equipment (Net) - Total restated up to 10 years for acquisitions, accounting changes, and/or discontinued operations. Restated data is collected from summary presentations and is as reported by the company.
Due to company presentation, this item may differ from the historical Property, Plant, and Equipment (Net) - Total.
If the reporting differences between historical and restated figures exceed 10% in the current year, this item will be a Not Available data code (@NA).
Property, Plant, and Equipment (Net) - Total (Restated) may exclude items included in the historical definition which the company does not report, such as timberlands, rental properties, or funds for construction.
This item is not available for banks or utilities.
Retained Earnings (Restated) Mnemonic RER
Annual Data Item Number A143
Units Millions of dollars
This item represents Retained Earnings restated up to 10 years for acquisitions, accounting changes, and/or discontinued operations. Restated data is collected from summary presentations in the most current source, and is as reported by the company.
Retained Earnings (Restated) may differ from the historical Retained Earnings by excluding some or all of the adjustments to retained earnings noted in the historical definition.
Restated figures will not be readjusted due to stock splits/dividends which occur after the current yearend.
This item is not available for banks or utilities.
Sales (Net) (Restated) Mnemonic SALER
Annual Data Item Number A117
Units Millions of dollars
This item represents Sales (Net) restated up to 10 years for acquisitions and/or accounting changes.
This item will be as reported by the company and may include other items (such as, other income or excise taxes).
This item, for banks, is the total current operating revenue restated up to five years plus the net after tax and after minority interest profit or loss on securities sold or redeemed.
This item is not available for banks or utilities.

679
Chapter 23 Restated
Selling, General and Administrative Expenses (Restated) Mnemonic XSGAR
Annual Data Item Number A132
Units Millions of dollars
This item represents Selling, General, and Administrative Expenses restated up to 10 years for acquisitions, accounting changes, and/or discontinued operations. Restated data is collected from summary presentations and is as reported by the company.
Due to company presentation, this item may differ from the historical Selling, General, and Administrative Expenses (XSGA, item 189).
This item is not available for banks or utilities.
Stockholders' Equity (Restated) Mnemonic SEQR
Annual Data Item Number A144
Units Millions of dollars
This item represents Stockholders' Equity restated up to 10 years for acquisitions and/or accounting changes.
This is an average figure restated up to six years for banks.
This item is not available for utilities.
Working Capital (Restated) Mnemonic WCAPR
Annual Data Item Number A121
Units Millions of dollars
This item represents Working Capital restated up to 10 years for acquisitions and/or accounting changes and is as reported by the company.
This item is not available for banks or utilities.


681
Chapter 24 Standard & Poor's Core Earnings
Standard & Poor's Core Earnings
Standard & Poor’s Core Earnings™ is a uniform methodology for calculating operating earnings that allows clients to identify the true earnings power of a company. Standard & Poor's Core Earnings is the after-tax earnings generated from a corporation’s principal business(es).
Standard & Poor’s Core Earnings values, and their accompanying adjustments, are now available for the S&P 400, S&P 500, S&P 600 and the Russell 3000 for the period beginning 1st quarter 2001 and forward. For all other U.S. companies in the Standard & Poor’s Compustat databases, values will be available for 2003 as they are reported. The Standard & Poor’s Core Earnings values are available simultaneously with the companies’ 10K and 10Q updates in the Compustat databases.
Standard & Poor’s Core Earnings methodology includes and excludes the following data:
Included in Standard & Poor’s Core Earnings
Excluded in Standard & Poor’s Core Earnings
Employee stock option grant expense Goodwill impairment charges Restructuring charges from ongoing operations
Gains/losses from asset sales
Write-downs of depreciable or amortizable operating assets
Pension gains and Post-retirement benefit gains
Pension costs Litigation or insurance settlements and proceeds
Purchased research & development expenses
Reversal of prior-year charges and provisions
Merger/acquisition related expenses Unrealized gains/losses from hedging activities
Some companies have volunteered to expense their stock options on their income statements; therefore, there is no option adjustment in the Core Earnings calculation because the expense was already taken out of the company’s net income. To identify the option expense, you would need to utilize the Stock Compensation Expense (STKCO), a pre-tax value reported by the company that includes both options given to employees and consultants.
Another important item to note in the Standard & Poor’s Core Earnings calculation is the Pension Cost adjustment. The Pension Cost adjustment is comprised of two items: Pension Interest Cost and Pension without Interest. Interest cost represents the increase in the value of the benefit obligation as time passes and benefit payment times get closer. To the extent that the interest cost is covered by the actual returns generated by the pension fund, interest costs will not be considered an adjustment to Core Earnings. However, if the actual returns fall short of the interest costs, the difference will be charged against Core Earnings. The Pension without Interest adjustment represents the reversal of any pension gain (or loss) that is booked on the income statement. As a company’s pension gain/loss does not relate to a company’s primary business, the value is negated from a company’s net income.
Pension Cost components are not reported by the companies on a quarterly basis. Standard & Poor’s creates a preliminary value by taking the company’s most recent fiscal year values divided by 4.
CHAPTER 24

Research Insight North America Data Guide
682
For more information regarding the Standard & Poor’s Core Earnings methodology and related research and data, please visit http://www.coreearnings.standardandpoors.com.
Standard & Poor's Core Earnings Items
Annual S&P Core Earnings and EPS Adjustments
Description
Earnings Mnemonic . . . page
EPS Basic Mnemonic . . . page
EPS Diluted Mnemonic . . . page
Adjusted Net Income Before Extraordinary Items
IBADJ . . . 219 EPSPX . . . 685 EPSFX . . . 691
S&P Core Earnings Adjustments: Option Expense COREOPTX . . . 776 COREOPTB . . . 775 COREOPTD . . . 775 Gain/Loss CEGLA . . . 267 CEGLB . . . 268 CEGLD . . . 268 Impairment of Goodwill GDWLIA . . . 270 GDWLIEPS . . . 272 GDWLID . . . 274 Settlement SETA . . . 286 SETEPS . . . 287 SETD . . . 287 Reversals for Provisions RRA . . . 823 RRB . . . 825 RRD . . . 826 Postretirement Cost CEPRA . . . 799 CEPRAB . . . 801 CEPRAD . . . 804 Pension Cost CEPNA . . . 778 CEPNAB . . . 780 CEPNAD . . . 783 Pension Interest Cost CEPNIA . . . 786 CEPNIB . . . 787 CEPNID . . . 789 Pension w/o Interest CEPNWIA . . . 792 CEPBWIB . . . 794 CEPNWID . . . 796 Standard & Poor's Core Earnings - Annual
COREEARN . . . 833 COREEPSB . . . 837 COREEPSD . . . 841
Quarterly S&P Core Earnings and EPS Adjustments Preliminary
Description
Earnings Mnemonic . . . page
EPS Basic Mnemonic . . . page
EPS Diluted Mnemonic . . . page
Adjusted Net Income Before Extraordinary Items - Quarterly
IBADJQ . . . 220 EPSPXQ . . . 686 EPSFXQ . . . 691
S&P Core Earnings Adjustments: Option Expense XOPTQP . . . 814 XOPTBQP . . . 816 XOPTDQP . . . 819 Gain/Loss CEGLAQ . . . 808 CEGLBQ . . . 268 CEGLDQ . . . 269 Impairment of Goodwill GDWLIAQ . . . 271 GDWLIEPSQ . . . 273 GDWLIDQ . . . 274 Settlement SETAQ . . . 287 SETEPSQ . . . 287 SETDQ . . . 288 Reversals for Provisions RRAQ . . . 824 RRBQ . . . 826 RRDQ . . . 827 Postretirement Cost CEPRQP . . . 801 CEPRBQP . . . 804 CEPRPDQ . . . 806 Pension Cost CEPNQP . . . 779 CEPNBQP . . . 782 CEPNDQP . . . 785 Pension Interest Cost CEPNIAQP . . . 787 CEPNIBQP . . . 789 CEPNIDQP . . . 790

683
Chapter 24 Standard & Poor's Core Earnings
Pension w/o Interest CPNWIAQP . . . 794 CPNWIEQP . . . 795 CPNWIDQP . . . 797 Standard & Poor's Core Earnings - Quarterly
COREEARNQP . . . 837
COREEPSBQP . . . 841
COREEPSDQP . . . 845
Companies do not always report quarterly figures, including those affecting Core Earnings. Consequently, in order for Standard & Poor’s to provide quarterly Standard & Poor’s Core Earnings data for the current time periods, preliminary data items were created. These preliminary values represent items (such as pension adjustments) that are not reported by a company on a quarterly basis. The preliminary values are calculated by dividing the most recent final annual value by 4. When the current year’s 10-K report is released, the actual quarterly value is calculated by dividing the current annual value for the data item(s) by 4 and backfilling in the previous quarters.
Research Insight clients can use the Preliminary Quarterly Core Earnings & EPS Adjustments reports for all four quarters of a company’s current fiscal year and the Actual Quarterly Core Earnings & EPS Adjustments reports for periods prior to the current fiscal year for their Core Earnings analysis. Following is an example of the Preliminary Quarterly Core Earnings report for IBM for first quarter 2003:
Quarterly S&P Core Earnings and EPS Adjustments Actual
Description
Earnings Mnemonic . . . page
EPS Basic Mnemonic . . . page
EPS Diluted Mnemonic . . . page
Adjusted Net Income Before Extraordinary Items - Quarterly
IBADJQ . . . 220 EPSPXQ . . . 686 EPSFXQ . . . 691
S&P Core Earnings Adjustments: Option Expense COREOPTXQ . . .
777 COREOPTBQ . . . 775
COREOPTDQ . . . 776
Gain/Loss CEGLAQ . . . 808 CEGLBQ . . . 810 CEGLDQ . . . 812 Impairment of Goodwill GDWLIAQ . . . 271 GDWLIEPSQ . . . 273 GDWLIDQ . . . 274 Settlement SETAQ . . . 287 SETEPSQ . . . 287 SETDQ . . . 288 Reversals for Provisions RRAQ . . . 824 RRBQ . . . 826 RRDQ . . . 827 Post-Retirement Cost CEPRQ . . . 800 CEPRBQ . . . 803 CEPRDQ . . . 805 Pension Cost CEPNQ . . . 779 CEPNBQ . . . 782 CEPNDQ . . . 785 Pension Interest Cost CEPNIAQ . . . 786 CEPNIBQ . . . 790 CEPNIDQ . . . 790 Pension w/o Interest CPNWIAQ . . . 793 CPNWIBQ . . . 795 CPNWIDQ . . . 796 Standard & Poor's Core Earnings - Quarterly
COREEARNQ . . . 835
COREEPSBQ . . . 839
COREEPSDQ . . . 843
12-Month Moving S&P Core Earnings and EPS Adjustments Preliminary
Description
Earnings Mnemonic . . . page
EPS Basic Mnemonic . . . page
EPS Diluted Mnemonic . . . page
Adjusted Net Income Before Extraordinary Items - 12MM
IBADJ12 . . . 221 * *
S&P Core Earnings Adjustments: Option Expense * XOPTBP12 . . . 817 XOPTD12P . . . 819

Research Insight North America Data Guide
684
Gain/Loss CEGLA12 . . . 808 CEGLB12 . . . 810 CEGLD12 . . . 811 Impairment of Goodwill GDWLIA12 . . . 271 GDWLIB12 . . . 273 GDWLID12 . . . 275 Settlement SETA12 . . . 829 SETB12 . . . 830 SETD12 . . . 832 Reversals for Provisions RRA12 . . . 824 RRB12 . . . 825 RRD12 . . . 827 Post-Retirement Cost * CEPRB12P . . . 802 CEPRPD12 . . . 807 Pension Cost * CEPNB12P . . . 781 CEPND12P . . . 784 Standard & Poor's Core Earnings - Quarterly
COREEARN12P . . . 836
COREEPSB12P . . . 839
COREEPSD12P . . . 844
*Available as a formula calculation.
12-Month Moving S&P Core Earnings and EPS Adjustments Final
Description
Earnings Mnemonic . . . page
EPS Basic Mnemonic . . . page
EPS Diluted Mnemonic . . . page
Adjusted Net Income Before Extraordinary Items - Quarterly
IBADJ12 . . . 221 * *
S&P Core Earnings Adjustments: Option Expense COREOPTX12 . . .
777 COREOPTB12 . . . 775
COREOPTD12 . . . 776
Gain/Loss CEGLA12 . . . 808 CEGLB12 . . . 808 CEGLD12 . . . 811 Impairment of Goodwill GDWLIA12 . . . 271 GDWLIB12 . . . 273 GDWLID12 . . . 275 Settlement SETA12 . . . 829 SETB12 . . . 830 SETD12 . . . 832 Reversals for Provisions RRA12 . . . 824 RRB12 . . . 825 RRD12 . . . 827 Post-Retirement Cost CEPR12 . . . 800 CEPRB12 . . . 802 CEPRD12 . . . 805 Pension Cost CEPN12 . . . 778 CEPNB12 . . . 780 CEPND12 . . . 783 Standard & Poor's Core Earnings - Quarterly
COREEARN12 . . . 834
COREEPSB12 . . . 838
COREEPSD12 . . . 842
*Available as a formula calculation.
As-Reported S&P Core Earnings
Description
Earnings Mnemonic . . . page
EPS Basic Mnemonic . . . page
EPS Diluted Mnemonic . . . page
As-Reported S&P Core Earnings CEAR . . . 771 CEARB . . . 772 CEARD . . . 773 As-Reported S&P Core Earnings After-Tax Quarterly
CEARQ . . . 771 CEARBQ . . . 773 CEARDQ . . . 774
As-Reported S&P Core Earnings After-Tax 12MM
CEARB12 . . . 772 CEARD12 . . . 774

685
Chapter 24 Standard & Poor's Core Earnings
Data Definitions
As Reported Core After Tax Mnemonic CEAR
Units Millions of dollars
This item represents the value calculated and reported by the company as their core earnings after-tax figure, which may not be the same as the Standard & Poor’s Core Earnings after-tax figure.
As Reported Core After Tax Footnote Mnemonic CEARF
Code Description NC Earnings per Share is a Standard & Poor’s
calculation and may disagree with company reports. SP Standard & Poor’s Core Earnings methodology SQ Combination of NC and SP
As Reported Core After Tax Quarterly Mnemonic CEARQ
Units Millions of dollars
This item represents the value calculated and reported by the company as their quarterly core earnings after-tax figure, which may not be the same as the Standard & Poor’s Core Earnings after-tax figure.
As Reported Core After Tax Quarterly Footnote Mnemonic CEARQF
Code Description NC Earnings per Share is a Standard & Poor’s
calculation and may disagree with company reports.
As Reported Core Basic EPS Effect Mnemonic CEARB
Units Dollars and cents

Research Insight North America Data Guide
686
This item represents the value calculated and reported by the company as their core earnings basic earnings per share figure, which may not be the same as the Standard & Poor’s Core Earnings basic earnings per share figure.
As Reported Core Basic EPS Effect Footnote Mnemonic CEARBF
Code Description NC Earnings per Share is a Standard & Poor’s
calculation and may disagree with company reports.
As Reported Core Basic EPS Effect 12MM Mnemonic CEARB12
Units Dollars and cents
This item represents the value calculated and reported by the company as their core earnings basic earnings per share figure, which may not be the same as the Standard & Poor’s Core Earnings basic earnings per share figure.
The 12-Month Moving figure is equal to the current quarter plus the three previous quarters.
As Reported Core Basic EPS Effect 12MM Footnote Mnemonic CEARB12F
Code Description NC Earnings per Share is a Standard & Poor’s
calculation and may disagree with company reports.
As Reported Core Basic EPS Effect Quarterly Mnemonic CEARBQ
Units Dollars and cents
This item represents the value calculated and reported by the company as their quarterly core earnings basic earnings per share figure, which may not be the same as the Standard & Poor’s Core Earnings basic earnings per share figure.

687
Chapter 24 Standard & Poor's Core Earnings
As Reported Core Basic EPS Effect Quarterly Footnote Mnemonic CEARBQF
Code Description NC Earnings per Share is a Standard & Poor’s
calculation and may disagree with company reports.
As Reported Core Diluted EPS Effect Mnemonic CEARD
Units Dollars and cents
This item represents the value calculated and reported by the company as their core earnings diluted earnings per share figure, which may not be the same as the Standard & Poor’s Core Earnings diluted earnings per share figure.
As Reported Core Diluted EPS Effect Footnote Mnemonic CEARDF
Code Description NC Earnings per Share is a Standard & Poor’s
calculation and may disagree with company reports.
As Reported Core Diluted EPS Effect 12MM Mnemonic CEARD12
Units Dollars and cents
This item represents the value calculated and reported by the company as their core earnings diluted earnings per share figure, which may not be the same as the Standard & Poor’s Core Earnings diluted earnings per share figure.
The 12-Month Moving figure is equal to the current quarter plus the three previous quarters.
As Reported Core Diluted EPS Effect 12MM Footnote Mnemonic CEARD12F

Research Insight North America Data Guide
688
Code Description NC Earnings per Share is a Standard & Poor’s
calculation and may disagree with company reports.
As Reported Core Diluted EPS Effect Quarterly Mnemonic CEARDQ
Units Dollars and cents
This item represents the value calculated and reported by the company as their quarterly core earnings diluted earnings per share figure, which may not be the same as the Standard & Poor’s Core Earnings diluted earnings per share figure.
As Reported Core Diluted EPS Effect Quarterly Footnote Mnemonic CEARDQF
Code Description NC Earnings per Share is a Standard & Poor’s
calculation and may disagree with company reports.
Core Implied Option EPS Basic Mnemonic COREOPTB
Concept calculation @IF(XOPTB>0,XOPTB,0)
Units Dollars and cents
If Implied Option EPS Basic (XOPTB) is a gain instead of an expense, then this concept returns a zero for Core Implied Option EPS Basic.
Core Implied Option EPS Basic 12MM Mnemonic COREOPTB12
Concept calculation @IF(XOPTB12>0,XOPTB12,0)
Units Dollars and cents
If Implied Option EPS Basic 12MM (XOPTB12) is a gain instead of an expense, then this concept returns a zero for Core Implied Option EPS Basic 12MM.

689
Chapter 24 Standard & Poor's Core Earnings
Core Implied Option EPS Basic Quarterly Mnemonic COREOPTBQ
Concept calculation @IF(XOPTBQ>0,XOPTBQ,0)
Units Dollars and cents
If Implied Option EPS Basic Quarterly (XOPTBQ) is a gain instead of an expense, then this concept returns a zero for Core Implied Option EPS Basic Quarterly
Core Implied Option EPS Diluted Mnemonic COREOPTD
Concept calculation @IF(XOPTD>0,XOPTD,0)
Units Dollars and cents
If Implied Option EPS Diluted (XOPTD) is a gain instead of an expense, then this concept returns a zero for Core Implied Option EPS Diluted.
Core Implied Option EPS Diluted 12MM Mnemonic COREOPTD12
Concept calculation @IF(XOPTD12>0,XOPTD12,0)
Units Dollars and cents
If Implied Option EPS Diluted 12MM (XOPTD12) is a gain instead of an expense, then this concept returns a zero for Core Implied Option EPS Diluted 12MM.
Core Implied Option EPS Diluted Quarterly Mnemonic COREOPTDQ
Concept calculation @IF(XOPTDQ>0,XOPTDQ,0)
Units Dollars and cents
If Implied Option EPS Diluted Quarterly (XOPTDQ) is a gain instead of an expense, then this concept returns a zero for Core Implied Option EPS Diluted Quarterly
Core Implied Option Expense Mnemonic COREOPTX
Concept calculation @IF(XINTOPT>0,XINTOPT,0)
Units Millions of dollars
If Implied Option Expense (XINTOPT) is a gain instead of an expense, then this concept returns a zero for Core Implied Option Expense.

Research Insight North America Data Guide
690
Implied Option Expense Footnote Mnemonic XINTOPTF
Code Description NC This is a Standard & Poor’s calculation and may
disagree with company reports.
Core Implied Option Expense Quarterly Mnemonic COREOPTXQ
Concept calculation @IF(XOPTQ>0,XOPTQ,0)
Units Millions of dollars
If Implied Option Expense Quarterly (XOPTQ) is a gain instead of an expense, then this concept returns a zero for Core Implied Option Expense Quarterly.
Implied Option Expense Quarterly Footnote Mnemonic XOPTQF
Code Description NC This is a Standard & Poor’s calculation and may
disagree with company reports.
Core Implied Option Expense 12MM Mnemonic COREOPTX12
Concept calculation @IF(XOPT12>0,XOPT12,0)
Units Millions of dollars
If Implied Option Expense 12MM (XOPT12) is a gain instead of an expense, then this concept returns a zero for Core Implied Option Expense 12MM.

691
Chapter 24 Standard & Poor's Core Earnings
Implied Option Expense 12MM Footnote Mnemonic XOPT12F
This footnote is not currently populated.
Core Pension Adjustment Mnemonic CEPNA
Units Millions of dollars
This item represents the after-tax adjustment to net income for the company's Standard & Poor’s Core Earnings calculation. The Quarterly Core Pension Adjustment is calculated by using the Core Pension Adjustment for that reported year divided by 4. A negative value indicates a negative adjustment to core earnings.
This item includes:
actual pension w/o interest adjustment – after-tax
actual pension interest adjustment – after-tax
Core Pension Adjustment Footnote Mnemonic CEPNAF
Code Description NR This is a Standard & Poor’s calculation and may
disagree with company reports. Statutory rate (35%) used in calculation.
Core Pension Adjustment 12MM Mnemonic CEPN12
Units Millions of dollars
This item represents the after-tax adjustment to net income for the company's Standard & Poors Core Earnings calculation. The Quarterly Core Pension Adjustment is calculated by using the Core Pension Adjustment for that reported year divided by 4. A negative value indicates a negative adjustment to core earnings.
This item includes:
actual pension w/o interest adjustment – after-tax
actual pension interest adjustment – after-tax
The 12-Month Moving figure is equal to the current quarter plus the three previous quarters.

Research Insight North America Data Guide
692
Core Pension Adjustment 12MM Footnote Mnemonic CEPN12F
This footnote is not currently populated.
Core Pension Adjustment Quarterly Mnemonic CEPNQ
Units Millions of dollars
This item represents the after-tax adjustment to net income for the company's Standard & Poor’s Core Earnings calculation. The Quarterly Core Pension Adjustment is the annual figure divided by 4. A negative value indicates a negative adjustment to core earnings.
Core Pension Adjustment Quarterly Footnote Mnemonic CEPNQF
Code Description NR This is a Standard & Poor’s calculation and may
disagree with company reports. Statutory rate (35%) used in calculation.
Core Pension Adjustment Preliminary Mnemonic CEPNQP
Units Millions of dollars
This item represents the prior year annual amount for Core Pension Adjustment divided by 4, which provides a preliminary number that can be used for the current quarters' estimated adjustment. This adjustment is used to calculate the Standard & Poor’s Core Earnings Preliminary figure. A negative value indicates a negative adjustment to core earnings.
Core Pension Adjustment Preliminary Footnote Mnemonic CEPNQPF
Code Description NR This is a Standard & Poor’s calculation and may
disagree with company reports. Statutory rate (35%) used in calculation.

693
Chapter 24 Standard & Poor's Core Earnings
Core Pension Adjustment Basic EPS Effect Mnemonic CEPNAB
Units Dollars and cents
This item represents Core Pension Adjustment divided by Shares Used for Basic EPS to calculate the annual figure. The quarterly figure is calculated by dividing Core Pension Adjustment Quarterly divided by Shares Used for Basic EPS Quarterly. A negative value indicates a negative adjustment to Standard & Poor’s Core Earnings.
Core Pension Adjustment Basic EPS Effect Footnote Mnemonic CEPNABF
Code Description NC Earnings per Share is a Standard & Poor’s
calculation and may disagree with company reports. NR This is a Standard & Poor’s calculation and may
disagree with company reports. Statutory rate (35%) used in calculation.
Core Pension Adjustment Basic EPS 12MM Mnemonic CEPNB12
Units Dollars and cents
This item represents Core Pension Adjustment divided by Shares Used for Basic EPS to calculate the annual figure. The quarterly figure is calculated by dividing Core Pension Adjustment Quarterly divided by Shares Used for Basic EPS Quarterly. A negative value indicates a negative adjustment to Standard & Poor’s Core Earnings.
The 12-Month Moving figure is equal to the current quarter plus the three previous quarters.
Core Pension Adjustment Basic EPS 12MM Footnote Mnemonic CEPNB12F

Research Insight North America Data Guide
694
Code Description NC Earnings per Share is a Standard & Poor’s
calculation and may disagree with company reports. NR This is a Standard & Poor’s calculation and may
disagree with company reports. Statutory rate (35%) used in calculation.
Core Pension Adjustment Basic EPS 12MM Preliminary Mnemonic CEPNB12P
Units Dollars and cents
This item represents Core Pension Adjustment Preliminary divided by Shares Used for Basic EPS, which provides a preliminary number that can be used for the current quarters' estimated adjustment. This adjustment is used to calculate the Standard & Poor’s Core Earnings Basic EPS- Preliminary figure. A negative value indicates a negative adjustment to Standard & Poor’s Core Earnings.
Core Pension Adjustment Basic EPS 12MM Preliminary Footnote Mnemonic CEPNB12PF
Code Description NC Earnings per Share is a Standard & Poor’s
calculation and may disagree with company reports. NR This is a Standard & Poor’s calculation and may
disagree with company reports. Statutory rate (35%) used in calculation.
Core Pension Adjustment Basic EPS Quarterly Mnemonic CEPNBQ
Units Dollars and cents
This item represents Core Pension Adjustment divided by Shares Used for Basic EPS to calculate the annual figure. The quarterly figure is calculated by dividing Core Pension Adjustment Quarterly divided by Shares Used for Basic EPS Quarterly. A negative value indicates a negative adjustment to Standard & Poor’s Core Earnings.
Core Pension Adjustment Basic EPS Footnote Mnemonic CEPNBQF

695
Chapter 24 Standard & Poor's Core Earnings
Code Description NC Earnings per Share is a Standard & Poor’s
calculation and may disagree with company reports. NR This is a Standard & Poor’s calculation and may
disagree with company reports. Statutory rate (35%) used in calculation.
Core Pension Adjustment Basic EPS Preliminary Mnemonic CEPNBQP
Units Dollars and cents
This item represents Core Pension Adjustment Preliminary divided by Shares Used for Basic EPS, which provides a preliminary number that can be used for the current quarters' estimated adjustment. This adjustment is used to calculate the Standard & Poor’s Core Earnings Basic EPS- Preliminary figure. A negative value indicates a negative adjustment to Standard & Poor’s Core Earnings.
Core Pension Adjustment Basic EPS Preliminary Footnote Mnemonic CEPNBQPF
Code Description NC Earnings per Share is a Standard & Poor’s
calculation and may disagree with company reports. NR This is a Standard & Poor’s calculation and may
disagree with company reports. Statutory rate (35%) used in calculation.
Core Pension Adjustment Diluted EPS Effect Mnemonic CEPNAD
Units Dollars and cents
This item represents Core Pension Adjustment divided by Shares Used for Diluted EPS to calculate the annual figure. The quarterly figure is calculated by dividing Core Pension Adjustment Quarterly by Shares Used for Diluted EPS Quarterly. A negative value indicates a negative adjustment to Standard & Poor’s Core Earnings.
Core Pension Adjustment Diluted EPS Effect Footnote Mnemonic CEPNADF

Research Insight North America Data Guide
696
Code Description NC Earnings per Share is a Standard & Poor’s
calculation and may disagree with company reports. NR This is a Standard & Poor’s calculation and may
disagree with company reports. Statutory rate (35%) used in calculation.
Core Pension Adjustment Diluted EPS 12MM Mnemonic CEPND12
Units Dollars and cents
This item represents Core Pension Adjustment divided by Shares Used for Diluted EPS to calculate the annual figure. The quarterly figure is calculated by dividing Core Pension Adjustment Quarterly by Shares Used for Diluted EPS Quarterly. A negative value indicates a negative adjustment to Standard & Poor’s Core Earnings.
The 12-Month Moving figure is equal to the current quarter plus the three previous quarters.
Core Pension Adjustment Diluted EPS 12MM Footnote Mnemonic CEPND12F
Code Description NC Earnings per Share is a Standard & Poor’s
calculation and may disagree with company reports. NR This is a Standard & Poor’s calculation and may
disagree with company reports. Statutory rate (35%) used in calculation.
Core Pension Adjustment Diluted EPS 12MM Preliminary Mnemonic CEPND12P
Units Dollars and cents
This item represents Core Pension Adjustment Preliminary divided by Shares Used for Diluted EPS, which provides a preliminary number that can be used for the current quarters' estimated adjustment. This adjustment is used to calculate the Standard & Poor’s Core Earnings Diluted EPS- Preliminary figure. A negative value indicates a negative adjustment to Standard & Poor’s Core Earnings.

697
Chapter 24 Standard & Poor's Core Earnings
Core Pension Adjustment Diluted EPS 12MM Preliminary Footnote Mnemonic CEPND12PF
Code Description NC Earnings per Share is a Standard & Poor’s
calculation and may disagree with company reports. NR This is a Standard & Poor’s calculation and may
disagree with company reports. Statutory rate (35%) used in calculation.
Core Pension Adjustment Diluted EPS Effect Quarterly Mnemonic CEPNDQ
Units Dollars and cents
This item represents Core Pension Adjustment divided by Shares Used for Diluted EPS to calculate the annual figure. The quarterly figure is calculated by dividing Core Pension Adjustment Quarterly by Shares Used for Diluted EPS Quarterly. A negative value indicates a negative adjustment to Standard & Poor’s Core Earnings.
Core Pension Adjustment Diluted EPS Effect Quarterly Footnote Mnemonic CEPNDQF
Code Description NC Earnings per Share is a Standard & Poor’s
calculation and may disagree with company reports. NR This is a Standard & Poor’s calculation and may
disagree with company reports. Statutory rate (35%) used in calculation.
Core Pension Adjustment Diluted EPS Effect Quarterly Preliminary Mnemonic CEPNDQP
Units Dollars and cents
This item represents Core Pension Adjustment Preliminary divided by Shares Used for Diluted EPS, which provides a preliminary number that can be used for the current quarters' estimated adjustment. This adjustment is used to calculate the Standard & Poor’s Core Earnings Diluted EPS- Preliminary figure. A negative value indicates a negative adjustment to Standard & Poor’s Core Earnings.

Research Insight North America Data Guide
698
Core Pension Adjustment Diluted EPS Effect Quarterly Preliminary Footnote Mnemonic CEPNDQPF
Code Description NC Earnings per Share is a Standard & Poor’s
calculation and may disagree with company reports. NR This is a Standard & Poor’s calculation and may
disagree with company reports. Statutory rate (35%) used in calculation.
Core Pension Interest Adjustment After Tax Mnemonic CEPNIA
Units Millions of dollars
This item represents the amount of after-tax interest cost that is not covered by the actual return on plan assets. A negative value indicates a negative adjustment to Standard & Poor’s Core Earnings.
Core Pension Interest Adjustment After Tax Footnote Mnemonic CEPNIAF
Code Description NR This is a Standard & Poor’s calculation and may
disagree with company reports. Statutory rate (35%) used in calculation.
Core Pension Interest Adjustment After Tax Quarterly Mnemonic CEPNIAQ
Units Millions of dollars
This item represents the amount of after-tax interest cost that is not covered by the actual return on plan assets. The quarterly after-tax interest cost is the annual Core Pension Interest Adjustment After Tax divided by 4. A negative value indicates a negative adjustment to Standard & Poor’s Core Earnings
Core Pension Interest Adjustment After Tax Quarterly Footnote Mnemonic CEPNIAQF

699
Chapter 24 Standard & Poor's Core Earnings
Code Description NR This is a Standard & Poor’s calculation and may
disagree with company reports. Statutory rate (35%) used in calculation.
Core Pension Interest Adjustment After Tax Preliminary Mnemonic CEPNIAQP
Units Millions of dollars
This item represents the prior year annual amount for Core Pension Interest Adjustment After-Tax divided by 4, which provides a preliminary number that can be used for the current quarters' estimated adjustment. A negative value indicates a negative adjustment to Standard & Poor’s Core Earnings.
Core Pension Interest Adjustment After Tax Preliminary Footnote Mnemonic CEPNIAQPF
Code Description NR This is a Standard & Poor’s calculation and may
disagree with company reports. Statutory rate (35%) used in calculation.
Core Pension Interest Adjustment Basic EPS Effect Mnemonic CEPNIB
Units Dollars and cents
This item represents Core Pension Interest Adjustment divided by Shares Used for Basic EPS for the annual calculation. The quarterly calculation is Core Pension Interest Adjustment Basic EPS Effect divided by Shares Used for Basic. A negative value indicates a negative adjustment to Standard & Poor’s Core Earnings.
Core Pension Interest Adjustment Basic EPS Effect Footnote Mnemonic CEPNIBF

Research Insight North America Data Guide
700
Code Description NC Earnings per Share is a Standard & Poor’s
calculation and may disagree with company reports. NR This is a Standard & Poor’s calculation and may
disagree with company reports. Statutory rate (35%) used in calculation.
Core Pension Interest Adjustment Basic EPS Effect Quarterly Mnemonic CEPNIBQ
Units Dollars and cents
This item represents Core Pension Interest Adjustment divided by Shares Used for Basic EPS for the annual calculation. The quarterly calculation is Core Pension Interest Adjustment Basic EPS Effect divided by Shares Used for Basic. A negative value indicates a negative adjustment to Standard & Poor’s Core Earnings.
Core Pension Interest Adjustment Basic EPS Effect Quarterly Footnote Mnemonic CEPNIBQF
Code Description NC Earnings per Share is a Standard & Poor’s
calculation and may disagree with company reports. NR This is a Standard & Poor’s calculation and may
disagree with company reports. Statutory rate (35%) used in calculation.
Core Pension Interest Adjustment Basic EPS Effect Preliminary Mnemonic CEPNIBQP
Units Dollars and cents
This item represents Core Pension Interest Adjustment After-Tax Preliminary divided by Shares Used for Basic EPS, which provides a preliminary number that can be used for the current quarters' estimated adjustment. A negative value indicates a negative adjustment to Standard & Poor’s Core Earnings.
Core Pension Interest Adjustment Basic EPS Effect Preliminary Footnote Mnemonic CEPNIBQPF

701
Chapter 24 Standard & Poor's Core Earnings
Code Description NC Earnings per Share is a Standard & Poor’s
calculation and may disagree with company reports. NR This is a Standard & Poor’s calculation and may
disagree with company reports. Statutory rate (35%) used in calculation.
Core Pension Interest Adjustment Diluted EPS Effect Mnemonic CEPNID
Units Millions of dollars
This item represents Core Pension Interest Adjustment divided by Shares Used for Diluted EPS for the annual calculation. A negative value indicates a negative adjustment to Standard & Poor’s Core Earnings.
Core Pension Interest Adjustment Diluted EPS Effect Footnote Mnemonic CEPNIDF
Code Description NC Earnings per Share is a Standard & Poor’s
calculation and may disagree with company reports. NR This is a Standard & Poor’s calculation and may
disagree with company reports. Statutory rate (35%) used in calculation.
Core Pension Interest Adjustment Diluted EPS Effect Quarterly Mnemonic CEPNIDQ
Units Dollars and cents
The quarterly calculation is annual Core Pension Interest Adjustment After-Tax divided by Shares Used for Diluted EPS, divided by four. A negative value indicates a negative adjustment to Standard & Poor’s Core Earnings.
Core Pension Interest Adjustment Diluted EPS Effect Quarterly Footnote Mnemonic CEPNIDQF

Research Insight North America Data Guide
702
Code Description NC Earnings per Share is a Standard & Poor’s
calculation and may disagree with company reports. NR This is a Standard & Poor’s calculation and may
disagree with company reports. Statutory rate (35%) used in calculation.
Core Pension Interest Adjustment Diluted EPS Effect Preliminary Mnemonic CEPNIDQP
Units Dollars and cents
This item represents Core Pension Interest Adjustment After-Tax Preliminary divided by Shares Used for Diluted EPS, which provides a preliminary number that can be used for the current quarters' estimated adjustment. A negative value indicates a negative adjustment to Standard & Poor’s Core Earnings.
Core Pension Interest Adjustment Diluted EPS Effect Preliminary Footnote Mnemonic CEPNIDQPF
Code Description NC Earnings per Share is a Standard & Poor’s
calculation and may disagree with company reports. NR This is a Standard & Poor’s calculation and may
disagree with company reports. Statutory rate (35%) used in calculation.
Core Pension Interest Adjustment Pretax Mnemonic CEPNIP
Units Millions of dollars
This item represents the amount of interest cost that is not covered by the actual return on plan assets. A negative value indicates a negative adjustment to Standard & Poor’s Core Earnings.
Core Pension Interest Adjustment Pretax Footnote Mnemonic CEPNIPF
This footnote is not currently populated.

703
Chapter 24 Standard & Poor's Core Earnings
Core Pension Interest Adjustment Pretax Quarterly Mnemonic CEPNIPQ
Units Millions of dollars
This item represents the amount of interest cost that is not covered by the actual return on plan assets. The quarterly item is the annual calculation divided by four. A negative value indicates a negative adjustment to Standard & Poor’s Core Earnings.
Core Pension Interest Adjustment Pretax Quarterly Footnote Mnemonic CEPNIPQF
This footnote is not currently populated.
Core Pension Interest Adjustment Pretax Preliminary Mnemonic CEPNIPPQ
Units Millions of dollars
This item represents the prior year annual amount for Core Pension Interest Adjustment Pretax divided by 4, which provides a preliminary number that can be used for the current quarters' estimated adjustment. A negative value indicates a negative adjustment to Standard & Poor’s Core Earnings.
Core Pension Interest Adjustment Pretax Preliminary Footnote Mnemonic CEPNIPPQF
This footnote is not currently populated.
Core Pension W/O Interest Adjustment After Tax Mnemonic CEPNWIA
Units Millions of dollars
This item represents the amount of all pension charges/credits that were included in net income other than service cost. A negative value represents income.
This item includes:
Interest cost
Expected return

Research Insight North America Data Guide
704
Other non-operating adjustments included in net periodic costs
Core Pension W/O Interest Adjustment After Tax Footnote Mnemonic CEPNWIAF
Code Description NR This is a Standard & Poor’s calculation and may
disagree with company reports. Statutory rate (35%) used in calculation.
Core Pension W/O Interest Adjustment After Tax Quarterly Mnemonic CPNWIAQ
Units Millions of dollars
This item represents the amount of all pension charges/credits that were included in net income other than service cost. A negative value represents income.
This item includes:
Interest cost
Expected return
Other non-operating adjustments included in net periodic costs
Core Pension W/O Interest Adjustment After Tax Quarterly Footnote Mnemonic CPNWIAQF
Units Millions of dollars
Code Description NR This is a Standard & Poor’s calculation and may
disagree with company reports. Statutory rate (35%) used in calculation.

705
Chapter 24 Standard & Poor's Core Earnings
Core Pension W/O Interest Adjustment After Tax Quarterly Preliminary Mnemonic CPNWIAQP
Units Millions of dollars
This item represents the prior year annual amount for Core Pension w/o Interest Adjustment After-Tax divided by 4, which provides a preliminary number that can be used for the current quarters' estimated adjustment. A negative value represents income.
Core Pension W/O Interest Adjustment After Tax Quarterly Preliminary Footnote Mnemonic CPNWIAQPF
Code Description NR This is a Standard & Poor’s calculation and may
disagree with company reports. Statutory rate (35%) used in calculation.
Core Pension W/O Interest Adjustment Basic EPS Effect Mnemonic CEPNWIB
Units Dollars and cents
This item represents Core Pension w/o Interest Adjustment divided by Shares Used for Basic EPS to arrive at the annual value. This is a Standard & Poor’s Core Earnings item.
Core Pension W/O Interest Adjustment Basic EPS Effect Footnote Mnemonic CEPNWIBF
Code Description NC Earnings per Share is a Standard & Poor’s
calculation and may disagree with company reports. NR This is a Standard & Poor’s calculation and may
disagree with company reports. Statutory rate (35%) used in calculation.
Core Pension W/O Interest Adjustment Basic EPS Effect Quarterly Mnemonic CPNWIBQ

Research Insight North America Data Guide
706
Units Dollars and cents
This item represents annual Core Pension w/o Interest Adjustment divided by Shares Used for Basic EPS, divided by four. This is a Standard & Poor’s Core Earnings item.
Core Pension W/O Interest Adjustment Basic EPS Effect Quarterly Footnote Mnemonic CPNWIBQF
Code Description NC Earnings per Share is a Standard & Poor’s
calculation and may disagree with company reports. NR This is a Standard & Poor’s calculation and may
disagree with company reports. Statutory rate (35%) used in calculation.
Core Pension W/O Interest Adjustment Basic EPS Quarterly Preliminary Mnemonic CPNWIEQP
Units Dollars and cents
This item represents Core Pension w/o Interest Adjustment After-Tax Preliminary divided by Shares Used for Basic EPS, which provides a preliminary number that can be used for the current quarters' estimated adjustment.
Core Pension W/O Interest Adjustment Basic EPS Quarterly Preliminary Footnote Mnemonic CPNWIEQPF
Code Description NC Earnings per Share is a Standard & Poor’s
calculation and may disagree with company reports. NR This is a Standard & Poor’s calculation and may
disagree with company reports. Statutory rate (35%) used in calculation.

707
Chapter 24 Standard & Poor's Core Earnings
Core Pension W/O Interest Adjustment Diluted EPS Effect Mnemonic CEPNWID
Units Dollars and cents
This item represents Core Pension w/o Interest Adjustment divided by Shares Used for Diluted EPS.
Core Pension W/O Interest Adjustment Diluted EPS Effect Footnote Mnemonic CEPNWIDF
Code Description NC Earnings per Share is a Standard & Poor’s
calculation and may disagree with company reports. NR This is a Standard & Poor’s calculation and may
disagree with company reports. Statutory rate (35%) used in calculation.
Core Pension W/O Interest Adjustment Diluted EPS Effect Quarterly Mnemonic CPNWIDQ
Units Dollars and cents
This item represents annual Core Pension w/o Interest Adjustment divided by Shares Used for Diluted EPS, divided by four.
Core Pension W/O Interest Adjustment Diluted EPS Effect Quarterly Footnote Mnemonic CPNWIDQF
Code Description NC Earnings per Share is a Standard & Poor’s
calculation and may disagree with company reports. NR This is a Standard & Poor’s calculation and may
disagree with company reports. Statutory rate (35%) used in calculation.
Core Pension W/O Interest Adjustment Diluted EPS Effect Quarterly Preliminary Mnemonic CPNWIDQP

Research Insight North America Data Guide
708
Units Millions of dollars
This item represents Core Pension w/o Interest Adjustment After-Tax Preliminary divided by Shares Used for Diluted EPS, which provides a preliminary number that can be used for the current quarters' estimated adjustment.
Core Pension W/O Interest Adjustment Diluted EPS Effect Quarterly Preliminary Footnote Mnemonic CPNWIDQPF
Code Description
This footnote is not currently populated.
Core Pension W/O Interest Adjustment Pretax Mnemonic CEPNWIP
Units Millions of dollars
This item represents the amount of all pension charges/credits that were included in pretax income other than service cost. A negative value represents income.
This item includes:
Interest cost
Expected return
Other non-operating adjustments included in net periodic costs
Core Pension W/O Interest Adjustment Pretax Footnote Mnemonic CEPNWIPF
This footnote is not currently populated.
Core Pension W/O Interest Adjustment Pretax Quarterly Mnemonic CPNWIPQ
Units Millions of dollars
This item represents the amount of all pension charges/credits that were included in pretax income other than service cost. A negative value represents income.
This item includes:
Interest cost
Expected return

709
Chapter 24 Standard & Poor's Core Earnings
Other non-operating adjustments included in net periodic costs
Core Pension W/O Interest Adjustment Pretax Quarterly Footnote Mnemonic CPNWIPQF
This footnote is not currently populated.
Core Pension W/O Interest Adjustment Pretax Preliminary Mnemonic CPNWIPQP
Units Millions of dollars
This item represents the prior year annual amount for Core Pension w/o Interest Adjustment Pretax divided by 4, which provides a preliminary number that can be used for the current quarters' estimated adjustment.
Core Pension W/O Interest Adjustment Pretax Preliminary Footnote Mnemonic CPNWIPQPF
This footnote is not currently populated.
Core Postretirement Adjustment Mnemonic CEPRA
Units Millions of dollars
This item represents the adjustment to eliminate the inclusion of all postretirement charges/credits that are part of net periodic postretirement cost other than service cost and interest cost not covered by actual return. A negative value indicates the adjustment is a reduction to the Standard & Poor’s Core Earnings value.
Core Postretirement Adjustment Footnote Mnemonic CEPRAF
Code Description NR This is a Standard & Poor’s calculation and may
disagree with company reports. Statutory rate (35%) used in calculation.

Research Insight North America Data Guide
710
Core Postretirement Adjustment 12MM Mnemonic CEPR12
Units Millions of dollars
This item represents the adjustment to eliminate the inclusion of all postretirement charges/credits that are part of net periodic postretirement cost other than service cost and interest cost not covered by actual return. The quarterly calculation is the annual figure divided by four. A negative value indicates the adjustment is a reduction to the Standard & Poor’s Core Earnings value.
The 12-Month Moving figure is equal to the current quarter plus the three previous quarters.
Core Postretirement Adjustment 12MM Footnote Mnemonic
Code Description NR This is a Standard & Poor’s calculation and may
disagree with company reports. Statutory rate (35%) used in calculation.
Core Postretirement Adjustment Quarterly Mnemonic CEPRQ
Units Millions of dollars
This item represents the adjustment to eliminate the inclusion of all postretirement charges/credits that are part of net periodic postretirement cost other than service cost and interest cost not covered by actual return. The quarterly calculation is the current year Core Postretirement Adjustment divided by four. A negative value indicates the adjustment is a reduction to the Standard & Poor’s Core Earnings value.
Core Postretirement Adjustment Quarterly Footnote Mnemonic CEPRQF
Code Description NR This is a Standard & Poor’s calculation and may
disagree with company reports. Statutory rate (35%) used in calculation.
Core Postretirement Adjustment Preliminary Mnemonic CEPRQP
Units Millions of dollars

711
Chapter 24 Standard & Poor's Core Earnings
This item represents the prior year annual amount for Core Post Retirement Adjustment divided by 4, which provides a preliminary number that can be used for the current quarters' estimated adjustment. A negative value represents income.
Core Postretirement Adjustment Preliminary Footnote Mnemonic CEPRQPF
Code Description NR This is a Standard & Poor’s calculation and may
disagree with company reports. Statutory rate (35%) used in calculation.
Core Postretirement Adjustment Basic EPS Effect Mnemonic CEPRAB
Units Dollars and cents
This item represents Core Postretirement Adjustment divided by Shares Used for Basic EPS in order to calculate the annual value. A negative value indicates a negative adjustment to Standard & Poor’s Core Earnings.
Core Postretirement Adjustment Basic EPS Effect Footnote Mnemonic CEPRABF
Code Description NC Earnings per Share is a Standard & Poor’s
calculation and may disagree with company reports. NR This is a Standard & Poor’s calculation and may
disagree with company reports. Statutory rate (35%) used in calculation.
Core Postretirement Adjustment 12MM Basic EPS Effect Mnemonic CEPRB12
Units Dollars and cents
This item represents Core Postretirement Adjustment divided by Shares Used for Basic EPS in order to calculate the annual value. The quarterly value is Core Postretirement Adjustment divided by the shares used to calculate Basic EPS. A negative value indicates a negative adjustment to Standard & Poor’s Core Earnings.

Research Insight North America Data Guide
712
The 12-Month Moving figure is equal to the current quarter plus the three previous quarters.
Core Postretirement Adjustment 12MM Basic EPS Effect Footnote Mnemonic CEPRB12F
Code Description NC Earnings per Share is a Standard & Poor’s
calculation and may disagree with company reports. NR This is a Standard & Poor’s calculation and may
disagree with company reports. Statutory rate (35%) used in calculation.
Core Postretirement Adjustment 12MM Basic EPS Effect Preliminary Mnemonic CEPRB12P
Units Dollars and cents
This item represents Core Postretirement Adjustment Preliminary divided by Shares Used for Basic EPS, which provides a preliminary number that can be used for the current quarters' estimated adjustment. A negative value indicates a negative adjustment to Standard & Poor’s Core Earnings.
The 12-Month Moving figure is equal to the current quarter plus the three previous quarters.
Core Postretirement Adjustment 12MM Basic EPS Effect Preliminary Footnote Mnemonic CEPRB12PF
Code Description NC Earnings per Share is a Standard & Poor’s
calculation and may disagree with company reports. NR This is a Standard & Poor’s calculation and may
disagree with company reports. Statutory rate (35%) used in calculation.
Core Postretirement Adjustment Basic EPS Effect Quarterly Mnemonic CEPRBQ
Units Dollars and cents

713
Chapter 24 Standard & Poor's Core Earnings
This item represents Core Postretirement Adjustment divided by Shares Used for Basic EPS in order to calculate the annual value. The quarterly value is Core Postretirement Adjustment divided by the shares used to calculate Basic EPS. A negative value indicates a negative adjustment to Standard & Poor’s Core Earnings.
Core Postretirement Adjustment Basic EPS Effect Quarterly Footnote Mnemonic CEPRBQF
Code Description NC Earnings per Share is a Standard & Poor’s
calculation and may disagree with company reports. NR This is a Standard & Poor’s calculation and may
disagree with company reports. Statutory rate (35%) used in calculation.
Core Postretirement Adjustment Basic EPS Effect Preliminary Mnemonic CEPRBQP
Units Dollars and cents
This item represents Core Postretirement Adjustment Preliminary divided by Shares Used for Basic EPS, which provides a preliminary number that can be used for the current quarters' estimated adjustment. A negative value indicates a negative adjustment to Standard & Poor’s Core Earnings.
Core Postretirement Adjustment Basic EPS Effect Preliminary Footnote Mnemonic CEPRBQPF
Code Description NC Earnings per Share is a Standard & Poor’s
calculation and may disagree with company reports. NR This is a Standard & Poor’s calculation and may
disagree with company reports. Statutory rate (35%) used in calculation.
Core Postretirement Adjustment Diluted EPS Effect Mnemonic CEPRAD

Research Insight North America Data Guide
714
Units Dollars and cents
This item represents Core Postretirement Adjustment divided by Shares Used for Diluted EPS to calculate the annual value. A negative value indicates a negative adjustment to Standard & Poor’s Core Earnings.
Core Postretirement Adjustment Diluted EPS Effect Footnote Mnemonic CEPRADF
Code Description NC Earnings per Share is a Standard & Poor’s
calculation and may disagree with company reports. NR This is a Standard & Poor’s calculation and may
disagree with company reports. Statutory rate (35%) used in calculation.
Core Postretirement Adjustment Diluted EPS Effect 12MM Mnemonic CEPRD12
Units Dollars and cents
This item represents Core Postretirement Adjustment divided by Shares Used for Diluted EPS to calculate the annual value. The quarterly value Core Postretirement Adjustment Quarterly divided by the shares used to calculated diluted EPS. A negative value indicates a negative adjustment to Standard & Poor’s Core Earnings.
The 12-Month Moving figure is equal to the current quarter plus the three previous quarters.
Core Postretirement Adjustment Diluted EPS Effect 12MM Footnote Mnemonic CEPRD12F
Code Description NC Earnings per Share is a Standard & Poor’s
calculation and may disagree with company reports. NR This is a Standard & Poor’s calculation and may
disagree with company reports. Statutory rate (35%) used in calculation.
Core Postretirement Adjustment Diluted EPS Effect Quarterly Mnemonic CEPRDQ

715
Chapter 24 Standard & Poor's Core Earnings
Units Dollars and cents
This item represents Core Postretirement Adjustment divided by Shares Used for Diluted EPS to calculate the annual value. The quarterly value is Core Postretirment Adjustment Quarterly divided by the shares used to calculated diluted EPS. A negative value indicates a negative adjustment to Standard & Poor’s Core Earnings.
Core Postretirement Adjustment Diluted EPS Effect Quarterly Footnote Mnemonic CEPRDQF
Code Description NC Earnings per Share is a Standard & Poor’s
calculation and may disagree with company reports. NR This is a Standard & Poor’s calculation and may
disagree with company reports. Statutory rate (35%) used in calculation.
Core Postretirement Adjustment Diluted EPS Effect Preliminary Mnemonic CEPRPDQ
Units Dollars and cents
This item represents Core Postretirement Adjustment Preliminary divided by Shares Used for Diluted EPS, which provides a preliminary number that can be used for the current quarters' estimated adjustment. A negative value indicates a negative adjustment to Standard & Poor’s Core Earnings.
Core Postretirement Adjustment Diluted EPS Effect Preliminary Footnote Mnemonic CEPRPDQF
Code Description NC Earnings per Share is a Standard & Poor’s
calculation and may disagree with company reports. NR This is a Standard & Poor’s calculation and may
disagree with company reports. Statutory rate (35%) used in calculation.

Research Insight North America Data Guide
716
Core Postretirement Adjustment 12MM Diluted EPS Effect Preliminary Mnemonic CEPRPD12
Units Dollars and cents
This item represents Core Postretirement Adjustment Preliminary divided by Shares Used for Diluted EPS, which provides a preliminary number that can be used for the current quarters' estimated adjustment. A negative value indicates a negative adjustment to Standard & Poor’s Core Earnings.
The 12-Month Moving figure is equal to the current quarter plus the three previous quarters.
Core Postretirement Adjustment 12MM Diluted EPS Effect Preliminary Footnote Mnemonic CEPRPD12F
Code Description NC Earnings per Share is a Standard & Poor’s
calculation and may disagree with company reports. NR This is a Standard & Poor’s calculation and may
disagree with company reports. Statutory rate (35%) used in calculation.
Gain/Loss on Sale After Tax Mnemonic CEGLA
Units Millions of dollars
This item represents the after-tax gain or loss on a sale that is excluded from the Standard & Poor’s Core Earnings calculation. This represents all gains/losses that a company incurs that are not part of its core operations. This item includes write-downs and impairment of investments in addition to gains and losses on sales.
Gain/Loss on Sale After Tax Footnote Mnemonic CEGLAF
Code Description NC Earnings per Share is a Standard & Poor’s
calculation and may disagree with company reports.

717
Chapter 24 Standard & Poor's Core Earnings
NR This is a Standard & Poor’s calculation and may disagree with company reports. Statutory rate (35%) used in calculation.
Gain/Loss on Sale After Tax 12MM Mnemonic CEGLA12
Units Millions of dollars
This item represents the after-tax gain or loss on a sale that is excluded from the Standard & Poor’s Core Earnings calculation. This represents all gains/losses that a company incurs that are not part of its core operations. This item includes write-downs and impairment of investments in addition to gains and losses on sales.
The 12-Month Moving figure is equal to the current quarter plus the three previous quarters.
Gain/Loss on Sale After Tax 12MM Footnote Mnemonic CEGLA12F
Code Description NC Earnings per Share is a Standard & Poor’s
calculation and may disagree with company reports. NR This is a Standard & Poor’s calculation and may
disagree with company reports. Statutory rate (35%) used in calculation.
Gain/Loss on Sale After Tax - Quarterly Mnemonic CEGLAQ
Units Millions of dollars
This item represents the quarterly after-tax gain or loss on a sale that is excluded from the Standard & Poor’s Core Earnings calculation. This represents all gains/losses that a company incurs that are not part of its core operations for the quarter. This item includes write-downs and impairment of investments in addition to gains and losses on sales.
Gain/Loss on Sale After Tax Quarterly Footnote Mnemonic CEGLAQF

Research Insight North America Data Guide
718
Code Description NC Earnings per Share is a Standard & Poor’s
calculation and may disagree with company reports. NR This is a Standard & Poor’s calculation and may
disagree with company reports. Statutory rate (35%) used in calculation.
Gain/Loss on Sale Basic EPS Effect Mnemonic CEGLB
Units Dollars and cents
This item represents the Basic EPS after-tax value for a gain or loss on a sale that is excluded from the Standard & Poor’s Core Earnings calculation. This represents all gains/losses that a company incurs that are not part of its core operations. This item includes write-downs and impairment of investments in addition to gains and losses on sales.
Gain/Loss on Sale Basic EPS Effect Footnote Mnemonic CEGLBF
Code Description NC Earnings per Share is a Standard & Poor’s
calculation and may disagree with company reports. NR This is a Standard & Poor’s calculation and may
disagree with company reports. Statutory rate (35%) used in calculation.
Gain/Loss on Sale Basic EPS Effect 12MM Mnemonic CEGLB12
Units Dollars and cents
This item represents the Basic EPS after-tax value for a gain or loss on a sale that is excluded from the Standard & Poor’s Core Earnings calculation. This represents all gains/losses that a company incurs that are not part of its core operations. This item includes write-downs and impairment of investments in addition to gains and losses on sales.
The 12-Month Moving figure is equal to the current quarter plus the three previous quarters.

719
Chapter 24 Standard & Poor's Core Earnings
Gain/Loss on Sale Basic EPS Effect 12MM Footnote Mnemonic CEGLB12F
Code Description NC Earnings per Share is a Standard & Poor’s
calculation and may disagree with company reports. NR This is a Standard & Poor’s calculation and may
disagree with company reports. Statutory rate (35%) used in calculation.
Gain/Loss on Sale Basic EPS Effect - Quarterly Mnemonic CEGLBQ
Units Dollars and cents
This item represents the quarterly Basic EPS after-tax value for a gain or loss on a sale that is excluded from the Standard & Poor’s Core Earnings calculation. This represents all gains/losses that a company incurs that are not part of its core operations for the quarter. This item includes write-downs and impairment of investments in addition to gains and losses on sales.
Gain/Loss on Sale Basic EPS Effect Quarterly Footnote Mnemonic CEGLBQF
Code Description NC Earnings per Share is a Standard & Poor’s
calculation and may disagree with company reports. NR This is a Standard & Poor’s calculation and may
disagree with company reports. Statutory rate (35%) used in calculation.
Gain/Loss on Sale Diluted EPS Effect Mnemonic CEGLD
Units Dollars and cents
This item represents the Diluted EPS after-tax value for a gain or loss on a sale that is excluded from the Standard & Poor’s Core Earnings calculation. This represents all gains/losses that a company incurs that are not part of its core operations. This item includes write-downs and impairment of investments in addition to gains and losses on sales.

Research Insight North America Data Guide
720
Gain/Loss on Sale Diluted EPS Effect Footnote Mnemonic CEGLDF
Code Description NC Earnings per Share is a Standard & Poor’s
calculation and may disagree with company reports. NR This is a Standard & Poor’s calculation and may
disagree with company reports. Statutory rate (35%) used in calculation.
Gain/Loss on Sale Diluted EPS Effect 12MM Mnemonic CEGLD12
Units Dollars and cents
This item represents the Diluted EPS after-tax value for a gain or loss on a sale that is excluded from the Standard & Poor’s Core Earnings calculation. This represents all gains/losses that a company incurs that are not part of its core operations. This item includes write-downs and impairment of investments in addition to gains and losses on sales.
The 12-Month Moving figure is equal to the current quarter plus the three previous quarters.
Gain/Loss on Sale Diluted EPS Effect 12MM Footnote Mnemonic CEGLD12F
Code Description NC Earnings per Share is a Standard & Poor’s
calculation and may disagree with company reports. NR This is a Standard & Poor’s calculation and may
disagree with company reports. Statutory rate (35%) used in calculation.
Gain/Loss on Sale Diluted EPS Effect - Quarterly Mnemonic CEGLDQ
Units Dollars and cents

721
Chapter 24 Standard & Poor's Core Earnings
This item represents the quarterly Diluted EPS after-tax value for a gain or loss on a sale that is excluded from the Standard & Poor’s Core Earnings calculation. This represents all gains/losses that a company incurs that are not part of its core operations for the quarter. This item includes write-downs and impairment of investments in addition to gains and losses on sales.
Gain/Loss on Sale Diluted EPS Effect Quarterly Footnote Mnemonic CEGLDQF
Code Description NC Earnings per Share is a Standard & Poor’s
calculation and may disagree with company reports. NR This is a Standard & Poor’s calculation and may
disagree with company reports. Statutory rate (35%) used in calculation.
Gain/Loss on Sale Pretax Mnemonic CEGLP
Units Millions of dollars
This item represents the Pretax value for a gain or loss on a sale that is excluded from the Standard & Poor’s Core Earnings calculation. This represents all gains/losses that a company incurs that are not part of its core operations. This item includes write-downs and impairment of investments in addition to gains and losses on sales.
Gain/Loss on Sale Pretax Footnote Mnemonic CEGLPF
Code Description NR This is a Standard & Poor’s calculation and may
disagree with company reports. Statutory rate (35%) used in calculation.
Gain/Loss on Sale Pretax - Quarterly Mnemonic CEGLPQ
Units Millions of dollars

Research Insight North America Data Guide
722
This quarterly item represents the Pretax value for a gain or loss on a sale that is excluded from the Standard & Poor’s Core Earnings calculation. This represents all gains/losses that a company incurs that are not part of its core operations. This item includes write-downs and impairment of investments in addition to gains and losses on sales.
Gain/Loss on Sale Pretax Quarterly Footnote Mnemonic CEGLPQF
Code Description AC Reflects an accounting change NR This is a Standard & Poor’s calculation and may
disagree with company reports. Statutory rate (35%) used in calculation.
Implied Option Expense Preliminary Mnemonic XOPTQP
Units Millions of dollars
This item represents the prior year annual amount for Implied Option Expense divided by 4, which provides a preliminary number that can be used for the current quarters' estimated quarterly adjustment.
Implied Option Expense Preliminary Footnote Mnemonic XOPTQPF
Code Description NC This is a Standard & Poor’s calculation and may
disagree with company reports.
Implied Option EPS Basic Mnemonic XOPTB
Units Dollars and cents
This item represents the diluted per share effect of implied option expense.

723
Chapter 24 Standard & Poor's Core Earnings
Implied Option EPS Basic Footnote Mnemonic XOPTBF
Code Description NC Earnings per Share is a Standard & Poor’s
calculation and may disagree with company reports.
Implied Option EPS Basic 12MM Mnemonic XOPTB12
Units Dollars and cents
This item represents the diluted per share effect of implied option expense.
The 12-Month Moving figure is equal to the current quarter plus the three previous quarters.

Research Insight North America Data Guide
724
Implied Option EPS Basic 12MM Footnote Mnemonic XOPTB12F
Code Description NC Earnings per Share is a Standard & Poor’s
calculation and may disagree with company reports.
Implied Option EPS Basic Quarterly Mnemonic XOPTBQ
Units Dollars and cents
This item represents the diluted per share effect of implied option expense for the quarter.
Implied Option EPS Basic Quarterly Footnote Mnemonic XOPTBQF
Code Description NC Earnings per Share is a Standard & Poor’s
calculation and may disagree with company reports.
Implied Option EPS Basic Preliminary Mnemonic XOPTBQP
Units Dollars and cents
This item represents the prior year annual amount for Implied Option Expense Preliminary divided by Shares Used for Basic EPS, which provides a preliminary number that can be used for the current quarters' estimated quarterly adjustment.
Implied Option EPS Basic Preliminary Footnote Mnemonic XOPTBQPF

725
Chapter 24 Standard & Poor's Core Earnings
Code Description NC Earnings per Share is a Standard & Poor’s
calculation and may disagree with company reports.
Implied Option 12MM EPS Basic Preliminary Mnemonic XOPTBP12
Units Dollars and cents
This item represents the prior year annual amount for Implied Option Expense Preliminary divided by Shares Used for Basic EPS, which provides a preliminary number that can be used for the current quarters' estimated quarterly adjustment.
The 12-Month Moving figure is equal to the current quarter plus the three previous quarters.
Implied Option 12MM EPS Basic Preliminary Footnote Mnemonic XOPTBP12F
Code Description NC Earnings per Share is a Standard & Poor’s
calculation and may disagree with company reports.
Implied Option EPS Diluted Mnemonic XOPTD
Units Dollars and cents
This item represents the diluted per share effect of implied option expense.
Implied Option EPS Diluted Footnote Mnemonic XOPTDF
Code Description NC Earnings per Share is a Standard & Poor’s
calculation and may disagree with company reports.

Research Insight North America Data Guide
726
Implied Option EPS Diluted 12MM Mnemonic XOPTD12
Units Dollars and cents
This item represents the diluted per share effect of implied option expense.
The 12-Month Moving figure is equal to the current quarter plus the three previous quarters.
Implied Option EPS Diluted 12MM Footnote Mnemonic XOPTD12F
Code Description NC Earnings per Share is a Standard & Poor’s
calculation and may disagree with company reports.
Implied Option EPS Diluted Quarterly Mnemonic XOPTDQ
Units Dollars and cents
This item represents the diluted per share effect of implied option expense for the quarter.
Implied Option EPS Diluted Quarterly Footnote Mnemonic XOPTDQF
Code Description NC Earnings per Share is a Standard & Poor’s
calculation and may disagree with company reports.
Implied Option EPS Diluted 12MM Preliminary Mnemonic XOPTD12P
Units Dollars and cents

727
Chapter 24 Standard & Poor's Core Earnings
This item represents the prior year annual amount for Implied Option Expense Preliminary divided by Shares Used for Diluted EPS, which provides a preliminary number that can be used for the current quarters' estimated quarterly adjustment.
Implied Option EPS Diluted 12MM Preliminary Footnote Mnemonic XOPTD12PF
Code Description NC Earnings per Share is a Standard & Poor’s
calculation and may disagree with company reports.
Implied Option EPS Diluted Quarterly Preliminary Mnemonic XOPTDQP
Units Dollars and cents
This item represents the prior year annual amount for Implied Option Expense Preliminary divided by Shares Used for Diluted EPS, which provides a preliminary number that can be used for the current quarters' estimated quarterly adjustment.
Implied Option EPS Diluted Preliminary Footnote Mnemonic XOPTDQPF
Code Description NC Earnings per Share is a Standard & Poor’s
calculation and may disagree with company reports.
Pension Actual Return on Plan Assets Mnemonic PBARAT
Units Millions of dollars
This item represents the change in the market value of the pension plan assets during the year, excluding contributions to the plan and payments by the plan.
This item includes:
Realized and unrealized gains and losses
Return on assets for domestic and foreign plans

Research Insight North America Data Guide
728
Estimated Return on Assets which includes a deferred portion.
This item excludes:
Gains and losses not specifically described as applying to plan assets
Deferred Return on Plan Assets
Pension Actual Return on Plan Assets Footnote Mnemonic PBARATF
This footnote is not currently populated.
Periodic Pension Cost (Net) Footnote Mnemonic PPCF
This footnote is not currently populated.
Pension Plans Interest Cost Footnote Mnemonic PPICF
This footnote is not currently populated.
Pension Plans Return on Plan Assets (Expected) Footnote Mnemonic PPRPAF
This footnote is not currently populated.
Pension Plans Service Cost Footnote Mnemonic PPSCF
This footnote is not currently populated.
Periodic Postretirement Benefit Costs Footnote Mnemonic PPRBCF
This footnote is not currently populated.
Postretirement Actual Return on Plan Assets Mnemonic PRARAT

729
Chapter 24 Standard & Poor's Core Earnings
Units Millions of dollars
This item represents the change during the year in the value of the assets designated for postretirement benefit plan(s).
This item is a component of Net Periodic Postretirement Benefit Cost.
This item excludes Deferred Return on Plan Assets.
Postretirement Actual Return on Plan Assets Footnote Mnemonic PRARATF
This footnote is not currently populated.
Postretirement Benefit Asset (Liability) (Net) Footnote Mnemonic PRBAF
This footnote is not currently populated.
Postretirement Expected Return on Plan Assets Mnemonic PRRPE
Units Millions of dollars
This item represents the change during the year in the value of the assets designated for postretirement benefit plan(s). It is a component of Net Periodic Postretirement Benefit Cost.
This item can be either income or expense.
Postretirement Expected Return on Plan Assets Footnote Mnemonic PRRPEF
This footnote is not currently populated.
Postretirement Interest Cost Mnemonic PRIC
Units Millions of dollars
This item represents the accrual of interest for the year on the postretirement benefit obligation
This item is a component of Net Periodic Postretirement Benefit Cost.

Research Insight North America Data Guide
730
This item includes Interest Costs on projected benefit obligations.
Postretirement Interest Cost Footnote Mnemonic PRICF
This footnote is not currently populated.
Postretirement Service Cost Mnemonic PRSC
Units Millions of dollars
This item represents the expected future postretirement benefits attributed to employee services performed during the current year.
This item is a component of Net Periodic Postretirement Benefit Cost.
This item includes:
Service Costs of Health Care Benefits
Service Costs of Life Insurance Benefits
Service Costs of Deferred Compensation
This item includes Amortization of unrecognized prior service costs.
Postretirement Service Cost Footnote Mnemonic PRSCF
This footnote is not currently populated.
Reversal - Restructuring/Acquisition After Tax Mnemonic RRA
Units Millions of dollars
This item represents the reversals of restructuring, acquisitions, and/or divestitures after-tax value.
Reversal - Restructuring/Acquisition After Tax Footnote Mnemonic RRAF

731
Chapter 24 Standard & Poor's Core Earnings
Code Description NC This is a Standard & Poor’s calculation and may
disagree with company reports. NR This is a Standard & Poor’s calculation and may
disagree with company reports. Statutory rate (35%) used in calculation.
Reversal - Restructuring/Acquisition After Tax 12MM Mnemonic RRA12
Units Millions of dollars
This item represents the reversals of restructuring, acquisitions, and/or divestitures after-tax value.
The 12-Month Moving figure is equal to the current quarter plus the three previous quarters.
Reversal - Restructuring/Acquisition After Tax 12MM Footnote Mnemonic RRA12F
Code Description NC This is a Standard & Poor’s calculation and may
disagree with company reports. NR This is a Standard & Poor’s calculation and may
disagree with company reports. Statutory rate (35%) used in calculation.
Reversal - Restructuring/Acquisition After Tax Quarterly Mnemonic RRAQ
Units Millions of dollars
This item represents the reversals of restructuring, acquisitions, and/or divestitures after-tax quarterly value.
Reversal - Restructuring/Acquisition After Tax Qtly Footnote Mnemonic RRAQF
Code Description NC This is a Standard & Poor’s calculation and may
disagree with company reports.

Research Insight North America Data Guide
732
NR This is a Standard & Poor’s calculation and may disagree with company reports. Statutory rate (35%) used in calculation.
Reversal - Restructuring/Acquisition Basic EPS Effect Mnemonic RRB
Units Dollars and cents
This item represents the reversals of restructuring, acquisitions, and/or divestitures basic EPS value.
Reversal - Restructuring/Acquisition Basic EPS Footnote Mnemonic RRBF
Code Description NC Earnings per Share is a Standard & Poor’s
calculation and may disagree with company reports. NR This is a Standard & Poor’s calculation and may
disagree with company reports. Statutory rate (35%) used in calculation.
Reversal - Restructuring/Acquisition Basic EPS 12MM Mnemonic RRB12
Units Dollars and cents
This item represents the reversals of restructuring, acquisitions, and/or divestitures basic EPS value.
The 12-Month Moving figure is equal to the current quarter plus the three previous quarters.
Reversal - Restructuring/Acquisition Basic EPS 12MM Footnote Mnemonic RRB12F
Code Description NC Earnings per Share is a Standard & Poor’s
calculation and may disagree with company reports. NR This is a Standard & Poor’s calculation and may
disagree with company reports. Statutory rate (35%) used in calculation.

733
Chapter 24 Standard & Poor's Core Earnings
Reversal - Restructuring/Acquisition Basic EPS Effect Qtly Mnemonic RRBQ
Units Dollars and cents
This item represents the reversals of restructuring, acquisitions, and/or divestitures quarterly basic EPS value.
Reversal - Restructuring/Acquisition Basic EPS Effect Qtly Footnote
Mnemonic RRBQF
Code Description
NC Earnings per Share is a Standard & Poor’s calculation and may disagree with company reports.
NR This is a Standard & Poor’s calculation and may disagree with company reports. Statutory rate (35%) used in calculation.
Reversal - Restructuring/Acquisition Diluted EPS Effect Mnemonic RRD
Units Dollars and cents
This item represents the reversals of restructuring, acquisitions, and/or divestitures diluted EPS value.
Reversal - Restructuring/Acquisition Diluted EPS Footnote Mnemonic RRDQF
Code Description NC Earnings per Share is a Standard & Poor’s
calculation and may disagree with company reports. NR This is a Standard & Poor’s calculation and may
disagree with company reports. Statutory rate (35%) used in calculation.
Reversal - Restructuring/Acquisition Diluted EPS 12MM Mnemonic RRD12
Units Dollars and cents
This item represents the reversals of restructuring, acquisitions, and/or divestitures diluted EPS value.

Research Insight North America Data Guide
734
The 12-Month Moving figure is equal to the current quarter plus the three previous quarters.
Reversal - Restructuring/Acquisition Diluted EPS 12MM Footnote Mnemonic RRD12F
Code Description NC Earnings per Share is a Standard & Poor’s
calculation and may disagree with company reports. NR This is a Standard & Poor’s calculation and may
disagree with company reports. Statutory rate (35%) used in calculation.
Reversal - Restructuring/Acquisition Diluted EPS Effect Quarterly Mnemonic RRDQ
Units Dollars and cents
This item represents the reversals of restructuring, acquisitions, and/or divestitures quarterly diluted EPS value.
Reversal - Restructuring/Acquisition Diluted EPS Effect Quarterly Footnote Mnemonic RRDF
Code Description NC Earnings per Share is a Standard & Poor’s
calculation and may disagree with company reports. NR This is a Standard & Poor’s calculation and may
disagree with company reports. Statutory rate (35%) used in calculation.
Reversal - Restructuring/Acquisition Pretax Mnemonic RRP
Units Millions of dollars
This item represents the reversals of restructuring, acquisitions, and/or divestitures pretax value.

735
Chapter 24 Standard & Poor's Core Earnings
Reversal - Restructuring/Acquisition Pretax Footnote Mnemonic RRPF
Code Description NR This is a Standard & Poor’s calculation and may
disagree with company reports. Statutory rate (35%) used in calculation.
Reversal - Restructuring/Acquisition Pretax Quarterly Mnemonic RRPQ
Units Millions of dollars
This item represents the reversals of restructuring, acquisitions, and/or divestitures quarterly pretax value.
Reversal - Restructuring/Acquisition Pretax Quarterly Footnote Mnemonic RRPQF
Code Description AC Reflects an accounting change
Settlement (Litigation/Insurance) After Tax 12MM Mnemonic SETA12
Units Millions of dollars
This item is the sum of all Settlement special items reported after taxes.
Special Items represent unusual and/or non-recurring items reported by the company above taxes. This item is a net figure. Special income/gains are positive and special expense/losses are negative.
This item includes:
Provisions to boost reserves for litigation and settlements
Insurance recovery/proceeds
Reversal of reserve for litigation/settlements
This item excludes settlements relating to pension plans.
This item contains the Combined Figure data code if any of the Settlement After-tax special items contains the Combined Figure data code.
The 12-Month Moving figure is equal to the current quarter plus the three previous quarters.

Research Insight North America Data Guide
736
Settlement (Litigation/Insurance) After Tax 12MM Footnote Mnemonic SETA12F
Code Description NC This is a Standard & Poor’s calculation and may
disagree with company reports. NR This is a Standard & Poor’s calculation and may
disagree with company reports. Statutory rate (35%) used in calculation.
Settlement (Litigation/Insurance) After Tax Footnote Mnemonic SETAF
Code Description NC This is a Standard & Poor’s calculation and may
disagree with company reports. NR This is a Standard & Poor’s calculation and may
disagree with company reports. Statutory rate (35%) used in calculation.
Settlement (Litigation/Insurance) After Tax Quarterly Footnote Mnemonic SETAQF
Code Description NC This is a Standard & Poor’s calculation and may
disagree with company reports. NR This is a Standard & Poor’s calculation and may
disagree with company reports. Statutory rate (35%) used in calculation.
Settlement (Litigation/Insurance) Basic EPS 12MM Mnemonic SETB12
Units Millions of dollars
This item is the sum of all Settlement Basic EPS effect items reported.

737
Chapter 24 Standard & Poor's Core Earnings
Special Items represent unusual and/or non-recurring items reported by the company above taxes. This item is a net figure. Special income/gains are positive and special expense/losses are negative.
This item includes:
Provisions to boost reserves for litigation and settlements
Insurance recovery/proceeds
Reversal of reserve for litigation/settlements
This item excludes settlements relating to pension plans.
This item contains the Combined Figure data code if any of the Settlement Basic EPS Effect special items contains the Combined Figure data code.
The 12-Month Moving figure is equal to the current quarter plus the three previous quarters.
Settlement (Litigation/Insurance) Basic EPS 12MM Footnote Mnemonic SETB12F
Code Description NC Earnings per Share is a Standard & Poor’s
calculation and may disagree with company reports. NR This is a Standard & Poor’s calculation and may
disagree with company reports. Statutory rate (35%) used in calculation.
Settlement (Litigation/Insurance) Basic EPS Footnote Mnemonic SETBF
Code Description NC Earnings per Share is a Standard & Poor’s
calculation and may disagree with company reports. NR This is a Standard & Poor’s calculation and may
disagree with company reports. Statutory rate (35%) used in calculation.
Settlement (Litigation/Insurance) Basic EPS Quarterly Footnote Mnemonic SETBQF

Research Insight North America Data Guide
738
Code Description NC Earnings per Share is a Standard & Poor’s
calculation and may disagree with company reports. NR This is a Standard & Poor’s calculation and may
disagree with company reports. Statutory rate (35%) used in calculation.
Settlement (Litigation/Insurance) Diluted EPS 12MM Mnemonic SETD12
Units Millions of dollars
This item is the sum of all Settlement Diluted EPS effect items reported for the current quarter plus the three previous quarters.
This item contains the Combined Figure data code if any of the Settlement Basic EPS Effect special items contains the Combined Figure data code.
Settlement (Litigation/Insurance) Diluted EPS 12MM Footnote Mnemonic SETD12F
Code Description NC Earnings per Share is a Standard & Poor’s
calculation and may disagree with company reports. NR This is a Standard & Poor’s calculation and may
disagree with company reports. Statutory rate (35%) used in calculation.
Settlement (Litigation/Insurance) Diluted EPS Footnote Mnemonic SETDF
Code Description NC Earnings per Share is a Standard & Poor’s
calculation and may disagree with company reports. NR This is a Standard & Poor’s calculation and may
disagree with company reports. Statutory rate (35%) used in calculation.

739
Chapter 24 Standard & Poor's Core Earnings
Settlement (Litigation/Insurance) Diluted EPS Quarterly Footnote Mnemonic SETDQF
Code Description NC Earnings per Share is a Standard & Poor’s
calculation and may disagree with company reports. NR This is a Standard & Poor’s calculation and may
disagree with company reports. Statutory rate (35%) used in calculation.
Standard & Poor's Core Earnings - Annual Mnemonic COREEARN
Units Millions
Standard & Poor’s Core Earnings’ methodology has been revised following its introduction on May 14, 2002 based on additional feedback Standard & Poor's received from the financial and investment communities. Included in the revised definition of Standard & Poor's Core Earnings are employee stock option grant expenses, pension costs, restructuring charges from on-going operations, write downs of depreciable or amortizable operating assets, purchased research and development, M&A related expenses, and unrealized gains/losses from hedging activities. Excluded from this definition are pension gains, impairment of goodwill charges, gains or losses from asset sales, reversal of prior-year charges and provisions and litigation or insurance settlements. For further detail regarding the definition and methodology, please see the Technical Bulletin on www.coreearnings.com.
This data item is:
Income Before Extraordinary Items – Adjusted for Common Stock Equivalents
– Implied Option Expense
– Gain/Loss After-tax
– Impairments of Goodwill After-tax:
– Settlement (Litigation/Insurance) After-tax
– Reversal of Restructuring Plans
+ Post retirement Gains
+ Periodic Pension Costs
S&P Core Earnings
Standard & Poor's Core Earnings Footnote Mnemonic CSPF

Research Insight North America Data Guide
740
Code Description NC This is a Standard & Poor’s calculation and may
disagree with company reports. NR This is a Standard & Poor’s calculation and may
disagree with company reports. Statutory rate (35%) used in calculation.
Standard & Poor's Core Earnings 12MM Mnemonic COREEARN12
Units Millions of dollars
This item is Standard & Poor's actual core earnings value.
This item includes:
Net Income Adjusted Available for Common – Excluding minus
Impairment of Goodwill After-Tax minus
Settlements (Litigation/Insurance) After-Tax minus
Implied Option Expense After-Tax minus
Gain/Loss on Sale After-Tax minus
Reversal – Restructuring/Acquisition After-Tax plus
Core Pension Adjustment After-Tax plus
Core Post Retirement Adjustment After-Tax
The 12-Month Moving figure is equal to the current quarter plus the three previous quarters.
Standard & Poor's Core Earnings 12MM Footnote Mnemonic CSP12F
Code Description AC Reflects an accounting change NC Earnings per Share is a Standard & Poor’s
calculation and may disagree with company reports.

741
Chapter 24 Standard & Poor's Core Earnings
NR This is a Standard & Poor’s calculation and may disagree with company reports. Statutory rate (35%) used in calculation.
Standard & Poor's Core Earnings - Quarterly Mnemonic COREEARNQ
Units Millions
This item represents the calculation of Standard & Poor’s Core Earnings EPS Basic on a quarterly basis, taking into account that not all components are reported by companies on a quarterly basis. This item adjusts Income Before Extraordinary Items – Adjusted for Common Stock Equivalents – Quarterly with the following components:
Gain/Loss After-tax – Quarterly
Impairments of Goodwill After-tax – Quarterly
Settlement (Litigation/Insurance) After-tax – Quarterly
Adjustment for reversal of Restructuring Plans
Additionally, this item includes 1. adjustment for pension gains from the most recent year end or if not available,
pension gains from the prior year, divided by 4
2. adjustment for post-retirement benefits from the most recent year end or if not available, post-retirement benefits from the prior year, divided by 4
3. implied stock options reported at the most recent quarter end, or if not available, stock options from the prior year, divided by 4.
Standard & Poor's Core Earnings Preliminary Footnote Mnemonic CSPQPF
Code Description NC This is a Standard & Poor’s calculation and may
disagree with company reports. NR This is a Standard & Poor’s calculation and may
disagree with company reports. Statutory rate (35%) used in calculation.
Standard & Poor's Core Earnings 12MM Preliminary Mnemonic COREEARN12P
Units Millions of dollars
This item is the Standard & Poor's Core Earnings preliminary value. For more information on the operating methodology created by Standard & Poor’s, please visit www.coreearnings.standardandpoors.com
This item includes:

Research Insight North America Data Guide
742
Net Income Adjusted Available for Common – Excluding minus
Impairment of Goodwill After-Tax minus
Settlements (Litigation/Insurance) After-Tax minus
Implied Option Expense Preliminary minus
Gain/Loss on Sale After-Tax minus
Reversal – Restructuring/Acquisition After-Tax plus
Core Pension Adjustment Preliminary plus
Core Post Retirement Adjustment Preliminary
Standard & Poor's Core Earnings 12MM Preliminary Footnote Mnemonic CSPP12F
Code Description NC This is a Standard & Poor’s calculation and may
disagree with company reports. NR This is a Standard & Poor’s calculation and may
disagree with company reports. Statutory rate (35%) used in calculation.
Standard & Poor's Core Earnings - Quarterly - Preliminary Mnemonic COREEARNQP
Units Millions
Standard & Poor's Core Earnings is calculated on an actual or "all available data" basis; however, we understand that the market reacts to data as it is reported. Standard & Poor’s Core Earnings – Quarterly – Preliminary is based on projected data that is used to calculate the quarterly core earnings until the next year’s annual data is reported.
This item calculates quarterly Standard & Poor’s Core Earnings using annual data for Pension and Post Retirement data from the prior year, or on a projected basis. Additionally, in years prior to Fiscal 2002, Stock Option Expense may not be reported on a quarterly basis. In these cases, we use the prior years’ reported annual stock option expense to project into the next year what the new years’ quarterly option expense will be.

743
Chapter 24 Standard & Poor's Core Earnings
Standard & Poor's Core EPS - Annual Basic Mnemonic COREEPSB
Units Dollars and cents
This item represents basic earnings per share when Standard & Poor’s Core Earnings – Annual (COREEARN) is used in the calculation.
This data item is:
EPS Basic Excluding Extraordinary Items
– Implied Option Expense – Basic EPS Effect
– Gain/Loss After-tax – Basic EPS Effect
– Impairments of Goodwill After-tax: – Basic EPS Effect
– Settlement (Litigation/Insurance) After-tax – Basic EPS Effect
– Reversal of Restructuring Plans– Basic EPS Effect
+ Post retirement Gains– Basic EPS Effect
+ Periodic Pension Costs– Basic EPS Effect
S&P Core Earnings EPS Basic
Standard & Poor's Core Earnings EPS Basic Footnote Mnemonic CSPBF
Code Description NC Earnings per Share is a Standard & Poor’s
calculation and may disagree with company reports. NR This is a Standard & Poor’s calculation and may
disagree with company reports. Statutory rate (35%) used in calculation.
Standard & Poor's Core Earnings EPS Basic 12MM Mnemonic COREEPSB12
Units Dollars and cents
This item is the Standard & Poor's Core Earnings EPS basic value. For more information on the operating methodology created by Standard & Poor’s, please visit www.coreearnings.standardandpoors.com
This item includes:
Basic EPS – Excluding minus
Impairment of Goodwill Basic EPS Effect minus
Settlements (Litigation/Insurance) Basic EPS Effect minus

Research Insight North America Data Guide
744
Implied Option Expense Basic EPS Effect minus
Gain/Loss on Sale Basic EPS Effect minus
Reversal – Restructuring/Acquisition Basic EPS Effect plus
Core Pension Adjustment Basic EPS Effect plus
Core Post Retirement Adjustment Diluted EPS Effect
Standard & Poor's Core Earnings EPS Basic 12MM Footnote Mnemonic CSPB12F
Code Description NC Earnings per Share is a Standard & Poor’s
calculation and may disagree with company reports. NR This is a Standard & Poor’s calculation and may
disagree with company reports. Statutory rate (35%) used in calculation.
Standard & Poor's Core EPS - Basic - Quarterly Mnemonic COREEPSBQ
Units Dollars and cents
This item represents the calculation of Standard & Poor’s Core Earnings on a quarterly basis, taking into account that not all components are reported by companies on a quarterly basis. This item adjusts EPS Basic Excluding Extraordinary Items – Quarterly with the following components:
Gain/Loss After-tax – Quarterly Basic EPS Effect
Impairments of Goodwill After-tax – Quarterly Basic EPS Effect
Settlement (Litigation/Insurance) After-tax – Quarterly Basic EPS Effect
Adjustment for reversal of Restructuring Plans Basic EPS Effect
Additionally, this item includes 1. adjustment for pension gains from the most recent year end or if not available,
pension gains from the prior year, divided by 4, Basic EPS Effect
2. adjustment for post-retirement benefits from the most recent year end or if not available, post-retirement benefits from the prior year, divided by 4, Basic EPS Effect
3. implied stock options reported at the most recent quarter end, or if not available, stock options from the prior year, divided by 4, Basic EPS Effect.

745
Chapter 24 Standard & Poor's Core Earnings
Standard & Poor's Core Earnings EPS Basic Quarterly Footnote Mnemonic CSPBQF
Code Description NC Earnings per Share is a Standard & Poor’s
calculation and may disagree with company reports. NR This is a Standard & Poor’s calculation and may
disagree with company reports. Statutory rate (35%) used in calculation.
Standard & Poor's Core Earnings EPS Basic 12MM Preliminary Mnemonic COREEPSB12P
Units Dollars and cents
This item is the Standard & Poor's Core Earnings EPS basic value. For more information on the operating methodology created by Standard & Poor’s, please visit www.coreearnings.standardandpoors.com
This item includes:
Basic EPS – Excluding minus
Impairment of Goodwill Basic EPS Effect minus
Settlements (Litigation/Insurance) Basic EPS Effect minus
Implied Option Expense Basic EPS Effect Preliminary minus
Gain/Loss on Sale Basic EPS Effect minus
Reversal – Restructuring/Acquisition Basic EPS Effect plus
Core Pension Adjustment Basic EPS Effect Preliminary plus
Core Post Retirement Adjustment Diluted EPS Effect Preliminary
Standard & Poor's Core Earnings EPS Basic 12MM Preliminary Footnote Mnemonic CSPBS12PF

Research Insight North America Data Guide
746
Code Description NC Earnings per Share is a Standard & Poor’s
calculation and may disagree with company reports. NR This is a Standard & Poor’s calculation and may
disagree with company reports. Statutory rate (35%) used in calculation.
Standard & Poor's Core Earnings EPS Basic Preliminary Footnote Mnemonic CSPBPQF
Code Description NC Earnings per Share is a Standard & Poor’s
calculation and may disagree with company reports. NR This is a Standard & Poor’s calculation and may
disagree with company reports. Statutory rate (35%) used in calculation.
Standard & Poor's Core EPS - Basic - Quarterly - Preliminary Mnemonic COREEPSBQP
Units Dollars and cents
This item uses the Standard & Poor’s Core Earnings – Quarterly – Preliminary figure (COREEARNQP) to calculate projected Standard & Poor’s Core Earnings basic earnings per share.
Standard & Poor’s Core Earnings – Quarterly – Preliminary is based on projected data that is used to calculate the quarterly core earnings until the next year’s annual data is reported. It calculates quarterly Standard & Poor’s Core Earnings using annual data for Pension and Post Retirement data from the prior year, or on a projected basis. Additionally, in years prior to Fiscal 2002, Stock Option Expense may not be reported on a quarterly basis. In these cases, the prior years’ reported annual stock option expense is used to project into the next year what the new years’ quarterly option expense will be. Therefore, in addition to components reported at quarter end, this item includes 1. adjustment for pension gains from the prior year divided by 4
2. adjustment for post-retirement benefits from prior year divided by 4
3. implied stock options reported at the most recent quarter end, or if not available, stock options from the prior year 10K, divided by 4.
Standard & Poor's Core EPS - Annual Diluted Mnemonic COREEPSD
Units Dollars and cents
This item uses Standard & Poor’s Core Earnings – Annual (COREEARN) in the calculation of Standard & Poor’s Core Earnings diluted earnings per share.

747
Chapter 24 Standard & Poor's Core Earnings
This data item is:
EPS Diluted Excluding Extraordinary Items
– Implied Option Expense – Diluted EPS Effect
– Gain/Loss After-tax – Diluted EPS Effect
– Impairments of Goodwill After-tax – Diluted EPS Effect
– Settlement (Litigation/Insurance) After-tax – Diluted EPS Effect
– Reversal of Restructuring Plans– Diluted EPS Effect
+ Post retirement Gains– Diluted EPS Effect
+ Periodic Pension Costs– Diluted EPS Effect
S&P Core Earnings EPS Basic
Standard & Poor's Core Earnings EPS Diluted Footnote Mnemonic CSPDF
Code Description NC Earnings per Share is a Standard & Poor’s
calculation and may disagree with company reports. NR This is a Standard & Poor’s calculation and may
disagree with company reports. Statutory rate (35%) used in calculation.
Standard & Poor's Core Earnings EPS Diluted 12MM Mnemonic COREEPSD12
Units Dollars and cents
This item is the Standard & Poor's Core Earnings EPS diluted value. For more information on the operating methodology created by Standard & Poor’s, please visit www.coreearnings.standardandpoors.com
This item includes:
Diluted EPS – Excluding minus
Impairment of Goodwill Diluted EPS Effect minus
Settlements (Litigation/Insurance) Diluted EPS Effect minus
Implied Option Expense Diluted EPS Effect minus
Gain/Loss on Sale Diluted EPS Effect minus

Research Insight North America Data Guide
748
Reversal – Restructuring/Acquisition Diluted EPS Effect plus
Core Pension Adjustment Diluted EPS Effect plus
Core Post Retirement Adjustment Diluted EPS Effect
The 12-Month Moving figure is equal to the current quarter plus the three previous quarters.
Standard & Poor's Core Earnings EPS Diluted 12MM Footnote Mnemonic CSPD12F
Code Description NC Earnings per Share is a Standard & Poor’s
calculation and may disagree with company reports. NR This is a Standard & Poor’s calculation and may
disagree with company reports. Statutory rate (35%) used in calculation.
Standard & Poor's Core EPS - Diluted - Quarterly Mnemonic COREEPSDQ
Units Dollars and cents
This item represents the calculation of Standard & Poor’s Core Earnings on a quarterly basis, taking into account that not all components are reported by companies on a quarterly basis. This item adjusts EPS Diluted Excluding Extraordinary Items – Quarterly with the following components:
Gain/Loss After-tax – Quarterly Diluted EPS Effect
Impairments of Goodwill After-tax – Quarterly Diluted EPS Effect
Settlement (Litigation/Insurance) After-tax – Quarterly Diluted EPS Effect
Adjustment for reversal of Restructuring Plans - Diluted EPS Effect
Additionally, this item includes 1. adjustment for pension gains from the most recent year end or if not available,
pension gains from the prior year, divided by 4, Diluted EPS Effect
2. adjustment for post-retirement benefits from the most recent year end or if not available, post-retirement benefits from the prior year, divided by 4, Diluted EPS Effect
3. implied stock options reported at the most recent quarter end, or if not available, stock options from the prior year, divided by 4, Diluted EPS Effect.

749
Chapter 24 Standard & Poor's Core Earnings
Standard & Poor's Core Earnings EPS Diluted Quarterly Footnote Mnemonic CSPDQF
Code Description NC Earnings per Share is a Standard & Poor’s
calculation and may disagree with company reports. NR This is a Standard & Poor’s calculation and may
disagree with company reports. Statutory rate (35%) used in calculation.
Standard & Poor's Core Earnings EPS Diluted 12MM Preliminary Mnemonic COREEPSD12P
Units Dollars and cents
This item is the Standard & Poor's Core Earnings EPS diluted value. For more information on the operating methodology created by Standard & Poor’s, please visit www.coreearnings.standardandpoors.com
This item includes:
Diluted EPS – Excluding minus
Impairment of Goodwill Diluted EPS Effect minus
Settlements (Litigation/Insurance) Diluted EPS Effect minus
Implied Option Expense Diluted EPS Effect Preliminary minus
Gain/Loss on Sale Diluted EPS Effect minus
Reversal – Restructuring/Acquisition Diluted EPS Effect plus
Core Pension Adjustment Diluted EPS Effect Preliminary plus
Core Post Retirement Adjustment Diluted EPS Effect Preliminary
The 12-Month Moving figure is equal to the current quarter plus the three previous quarters.
Standard & Poor's Core EPS - Diluted - Quarterly - Preliminary Mnemonic COREEPSDQP
Units Dollars and cents
This item uses the Standard & Poor’s Core Earnings – Quarterly – Preliminary figure (COREEARNQP) to calculate projected Standard & Poor’s Core Earnings diluted earnings per share.

Research Insight North America Data Guide
750
Standard & Poor’s Core Earnings – Quarterly – Preliminary is based on projected data that is used to calculate the quarterly core earnings until the next year’s annual data is reported. It calculates quarterly Standard & Poor’s Core Earnings using annual data for Pension and Post Retirement data from the prior year, or on a projected basis. Additionally, in years prior to Fiscal 2002, Stock Option Expense may not be reported on a quarterly basis. In these cases, the prior years’ reported annual stock option expense is used to project into the next year what the new years’ quarterly option expense will be. Therefore, in addition to components reported at quarter end, this item includes
• adjustment for pension gains from the prior year divided by 4
• adjustment for post-retirement benefits from prior year divided by 4
• implied stock options reported at the most recent quarter end, or if not available, stock options from the prior year 10K, divided by 4.
Standard & Poor's Core Earnings EPS Diluted Preliminary Footnote Mnemonic CSPDPQF
Code Description NC Earnings per Share is a Standard & Poor’s
calculation and may disagree with company reports. NR This is a Standard & Poor’s calculation and may
disagree with company reports. Statutory rate (35%) used in calculation.
Standard & Poor's Core Earnings EPS Diluted 12MM Preliminary Footnote Mnemonic CSPD12PF
Code Description NC Earnings per Share is a Standard & Poor’s
calculation and may disagree with company reports. NR This is a Standard & Poor’s calculation and may
disagree with company reports. Statutory rate (35%) used in calculation.
Stock Compensation Expense Mnemonic STKCO
Statement Income Statement
Data Item Number A398
This item represents compensation to employees/executives in the form of company stock.
This item includes

751
Chapter 24 Standard & Poor's Core Earnings
1. Stock Bonus
2. Deferred Compensation
3. Amortization of Deferred Compensation
4. Non-cash compensation expense that is expensed in the current period.
This item can also include options given to consultants in addition to other stock based compensation that a company voluntarily elects to expense.
Stock Compensation Expense Footnote Mnemonic STKCOF
Code Description OE Company expenses employee options and other
stock compensation using fair value method.
Stock Compensation Expense - Quarterly Mnemonic STKCOQ
Statement Income Statement
Data Item Number Q278
This item represents compensation to employees/executives in the form of company stock.
This item includes 1. Stock Bonus
2. Deferred Compensation
3. Amortization of Deferred Compensation
4. Non-cash compensation expense that is expensed in the current period.
This item can also include options given to consultants in addition to other stock based compensation that a company voluntarily elects to expense.
Stock Compensation Expense Quarterly Footnote Mnemonic STKCOQF
Code Description OE Company expenses employee options and other
stock compensation using fair value method. OP Prospective Transition method for expensing
options OR Retroactive Restatement Transition method for
expensing options

Research Insight North America Data Guide
752
OQ Modified Prospective Transition method for expensing options
Standard & Poor's Core Earnings - Profit Margin Mnemonic COREPM
Concept calculation (COREEARN/SALE) * 100
Units Millions
This concept is the quotient of the Standard & Poor’s Core Earnings – Annual (COREEARN) divided by the Sales-Net value, multiplied by 100
Standard & Poor's Core Earnings Return on Equity Mnemonic COREROE
Concept calculation (COREEARN/CEQ) * 100
Units Millions
This concept is the quotient of the Standard & Poor’s Core Earnings – Annual (COREEARN) divided by Common Equity – Total, multiplied by 100

753
Chapter 25 Statement of Cash Flows/Statement of Changes
Statement of Cash Flows/Statement of Changes
When you evaluate Statement of Cash Flows or Changes in Financial Position for any company, first consider the Format Code. This is important because the Format Code directs you to the data that will be available for your particular company. Prior to the adoption of SFAS #95 for U.S. companies and currently on foreign companies, the Format Code may change from one year to the next, depending on how a company reports its data.
The following reporting formats are provided:
Format Code
Statement
1 Working Capital Statement 2 Cash Statement by Source and Use of Funds 3 Cash Statement by Activity 5 Net Liquid Funds/Net Funds Classified by Source and Use of Funds (Canadian
File Only) 7 Statement of Cash Flows
Effective for fiscal years ending after July 15, 1988 the Financial Accounting Standards Board #95 (FASB #95) requires U. S. companies to report the Statement of Cash Flows (format code = 7). Prior to adoption of FASB #95, companies may have reported one of the following statements:
Format Code
Statement
1 Working Capital Statement 2 Cash Statement by Source and Use of Funds 3 Cash Statement by Activity
For Canadian companies, the Net Liquid Funds/Net Funds Statement Classified by Source of Use of Funds (format code = 5) is often reported.
This section presents each statement along with the balancing models.
Format Code
Data Item Name
Annual Mnemonic . . . page
Quarterly Mnemonic . . . page
Format Code SCF . . . 34 SCFQ . . . 34
CHAPTER 25

Research Insight North America Data Guide
754
Statement of Cash Flows Items Format Code (SCF) = 7
The sources and uses of funds in the following statement are grouped by type of financial activity. The sum of the net cash flow items equals the change in cash and equivalents.
Data Item Name
Annual mnemonic . . . page
Quarterly mnemonic . . . page
12-Month Moving mnemonic . . . page
Indirect Operating Activities
Income Before Extraordinary Items
IBC . . . 217 IBCQ . . . 217 IBC12 . . . 218
Depreciation and Amortization DPC . . . 883 DPCQ . . . 884 DPC12 . . . 885 Extraordinary Items and Discontinued Operations
XIDOC . . . 891 XIDOCQ . . . 890 XIDOC12 . . . 891
Deferred Taxes TXDC . . . 882 TXDCQ . . . 882 TXDC12 . . . 883 Equity in Net Loss (Earnings) ESUBC . . . 886 ESUBCQ . . . 886 ESUBC12 . . . 887 Sale of Property, Plant and Equipment and Sale of Investments - Loss (Gain)
SPPIV . . . 938 SPPIVQ . . . 939 SPPIV12 . . . 937
Funds from Operations - Other FOPO . . . 897 FOPOQ . . . 897 FOPO12 . . . 898 Accounts Receivable - Decrease (Increase)
RECCH . . . 927 RECCHQ . . . 928 RECCH12 . . . 929
Inventory - Decrease (Increase) INVCH . . . 910 INVCHQ . . . 910 INVCH12 . . . 911 Accounts Payable and Accrued Liabilities - Increase (Decrease)
APALCH . . . 863 APALCQ . . . 864 APALC12 . . . 865
Income Taxes - Accrued - Increase (Decrease)
TXACH . . . 902 TXACHQ . . . 903 TXACH12 . . . 904
Assets and Liabilities - Other (Net Change)
AOLOCH . . . 868 AOLOCQ . . . 869 AOLOC12 . . . 870
Operating Activities - Net Cash Flow
OANCF . . . 923 OANCFQ . . . 924 OANCF12 . . . 924
Investing Activities
Increase in Investments IVCH . . . 916 IVCHQ . . . 917 IVCH12 . . . 917 Sale of Investments SIV . . . 933 SIVQ . . . 933 SIV12 . . . 934 Short-Term Investments - Change
IVSTCH . . . 941 IVSTCQ . . . 942 IVSTC12 . . . 943
Capital Expenditures CAPX . . . 871 CAPXQ . . . 872 CAPX12 . . . 873 Sale of Property, Plant and Equipment
SPPE . . . 935 SPPEQ . . . 936 SPPE12 . . . 937
Acquisitions AQC . . . 866 AQCQ . . . 866 AQC12 . . . 867

755
Chapter 25 Statement of Cash Flows/Statement of Changes
Investing Activities - Other IVACO . . . 914 IVACOQ . . . 914 IVACO12 . . . 915 Investing Activities - Net Cash Flow
IVNCF . . . 912 IVNCFQ . . . 913 IVNCF12 . . . 913
Financing Activities
Sale of Common and Preferred Stock
SSTK . . . 930 SSTKQ . . . 931 SSTK12 . . . 932
Purchase of Common and Preferred Stock
PRSTKC . . . 925 PRSTKQ . . . 926 PRSTK12 . . . 926
Cash Dividends DV . . . 877 DVQ . . . 877 DV12 . . . 878 Debt (Long-Term) - Issuance DLTIS . . . 918 DLTISQ . . . 919 DLTIS12 . . . 920 Debt (Long-Term) - Reduction DLTR . . . 920 DLTRQ . . . 921 DLTR12 . . . 922 Current Debt - Changes DLCCH . . . 879 DLCCHQ . . . 880 DLCCH12 . . . 881 Financing Activities - Other FIAO . . . 893 FIAOQ . . . 894 FIAO12 . . . 895 Financing Activities - Net Cash Flow
FINCF . . . 891 FINCFQ . . . 892 FINCF12 . . . 892
Exchange Rate Effect EXRE . . . 888 EXREQ . . . 888 EXRE12 . . . 889 Cash and Cash Equivalents - Increase (Decrease)
CHECH . . . 875 CHECHQ . . . 875 CHECH12 . . . 876
Direct Operating Activities
Income Taxes Paid TXPD . . . 905 TXPDQ . . . 906 TXPD12 . . . 907 Interest Paid - Net INTPN . . . 908 INTPNQ . . . 908 INTPN12 . . . 909
Working Capital Statement Format Code (SCF) = 1
The Working Capital statement shows the sources and uses of funds pertaining to the company's current cash, assets and liabilities.
Data Item Name
Annual Mnemonic . . . page
Quarterly Mnemonic . . . page
12MM Mnemonic . . . page
Sources of Working Capital
Income Before Extra. Items IBC . . . 217 IBCQ . . . 217 IB12 . . . 218
Depreciation and Amortization DPC . . . 883 DPCQ . . . 884 DPC12 . . . 885
Extra. Items and Disc. Operations
XIDOC . . . 890 XIDOCQ . . . 890 XIDOC12 . . . 891
Deferred Taxes TXDC . . . 882 TXDCQ . . . 882 TXDC12 . . . 883
Equity in Net Loss (Earnings) ESUBC . . . 886 ESUBCQ . . . 886 ESUBC12 . . . 887

Research Insight North America Data Guide
756
Sale of PP&E and Sale of Investments - Loss (Gain)
SPPIV . . . 938 SPPIVQ . . . 939 SPPIV12 . . . 940
Funds from Operations - Other FOPO . . . 897 FOPOQ . . . 897 FOPO12 . . . 898
Funds from Operations - Total FOPT . . . 899 FOPTQ . . . 900 FOPT12 . . . 900
Sale of Property, Plant and Equip.
SPPE . . . 935 SPPEQ . . . 936 SPPE12 . . . 937
Sale of Common and Pfd. Stock SSTK . . . 930 SSTKQ . . . 931 SSTK12 . . . 932
Sale of Investments SIV . . . 933 SIVQ . . . 933 SIV12 . . . 934
Debt (Long-Term) - Issuance DLTIS . . . 918 DLTISQ . . . 919 DLTIS12 . . . 920
Sources of Funds - Other FSRCO . . . 944 FSRCOQ . . . 944 FSRCO12 . . . 945
Sources of Funds - Total FSRCT . . . 946 FSRCTQ . . . 946 FSRCT12 . . . 947
Uses of Working Capital
Cash Dividends DV . . . 877 DVQ . . . 877 DV12 . . . 878
Capital Expenditures CAPX . . . 871 CAPXQ . . . 872 CAPX12 . . . 873
Increase in Investments IVCH . . . 916 IVCHQ . . . 917 IVCH12 . . . 917
Debt (Long-Term) - Reduction DLTR . . . 920 DLTRQ . . . 921 DLTR12 . . . 922
Purchase of Com. and Pfd. Stock
PRSTKC . . . 925 PRSTKQ . . . 926 PRSTK12 . . . 926
Acquisitions AQC . . . 866 AQCQ . . . 866 AQC12 . . . 867
Uses of Funds - Other FUSEO . . . 947 FUSEOQ . . . 948 FUSEO12 . . . 949
Uses of Funds - Total FUSET . . . 949 FUSETQ . . . 950 FUSET12 . . . 951
Working Capital Changes - Total WCAPCH . . . 953 WCAPTQ . . . 953
Working Capital Changes - Other - Increase (Decrease)
WCAPC . . . 951 WCAPCQ . . . 952 WCAPC12 . . . 952
Cash and Cash Equivalents - Increase (Decrease)
CHECH . . . 875 CHECHQ . . . 875 CHECH12 . . . 876
Current Debt - Changes DLCCH . . . 879 DLCCHQ . . . 880 DLCCH12 . . . 881

757
Chapter 25 Statement of Cash Flows/Statement of Changes
Cash Statement by Source and Use of Funds Format Code (SCF) = 2
This statement shows cash flow by sources and uses of funds, excluding changes in cash and current debt and other working capital changes.
Data Item Name
Annual Mnemonic . . . page
Quarterly Mnemonic . . . page
12-Month Moving Mnemonic . . . page
Sources of Funds
Income Before Extra. Items IBC . . . 217 IBCQ . . . 217 IB12 . . . 218
Depreciation and Amortization DPC . . . 883 DPCQ . . . 884 DPC12 . . . 885
Extra. Items and Disc. Operations
XIDOC . . . 890 XIDOCQ . . . 890 XIDOC12 . . . 891
Deferred Taxes TXDC . . . 882 TXDCQ . . . 882 TXDC12 . . . 883
Equity in Net Loss (Earnings) ESUBC . . . 886 ESUBCQ . . . 886 ESUBC12 . . . 887
Sale of PP&E and Sale of Investments - Loss (Gain)
SPPIV . . . 938 SPPIVQ . . . 939 SPPIV12 . . . 940
Funds from Operations - Other FOPO . . . 897 FOPOQ . . . 897 FOPO12 . . . 898
Funds from Operations - Total FOPT . . . 899 FOPTQ . . . 900 FOPT12 . . . 900
Sale of Property, Plant and Equip.
SPPE . . . 935 SPPEQ . . . 936 SPPE12 . . . 937
Sale of Common and Pfd. Stock SSTK . . . 930 SSTKQ . . . 931 SSTK12 . . . 932
Sale of Investments SIV . . . 933 SIVQ . . . 933 SIV12 . . . 934
Debt (Long-Term) - Issuance DLTIS . . . 918 DLTISQ . . . 919 DLTIS12 . . . 920
Sources of Funds - Other FSRCO . . . 944 FSRCOQ . . . 944 FSRCO12 . . . 945
Sources of Funds - Total FSRCT . . . 946 FSRCTQ . . . 946 FSRCT12 . . . 947
Uses of Funds
Cash Dividends DV . . . 877 DVQ . . . 877 DV12 . . . 878
Capital Expenditures CAPX . . . 871 CAPXQ . . . 872 CAPX12 . . . 873
Increase in Investments IVCH . . . 916 IVCHQ . . . 917 IVCH12 . . . 917
Debt (Long-Term) - Reduction DLTR . . . 920 DLTRQ . . . 921 DLTR12 . . . 922

Research Insight North America Data Guide
758
Purchase of Com. and Pfd. Stock
PRSTKC . . . 925 PRSTKQ . . . 926 PRSTK12 . . . 926
Acquisitions AQC . . . 866 AQCQ . . . 866 AQC12 . . . 867
Uses of Funds - Other FUSEO . . . 947 FUSEOQ . . . 948 FUSEO12 . . . 949
Uses of Funds - Total FUSET . . . 949 FUSETQ . . . 950 FUSET12 . . . 951
Working Capital Changes - Other - Increase (Decrease)
WCAPC . . . 951 WCAPCQ . . . 952 WCAPC12 . . . 952
Cash and Cash Equivalents - Increase (Decrease)
CHECH . . . 875 CHECHQ . . . 875 CHECH12 . . . 876
Current Debt - Changes DLCCH . . . 879 DLCCHQ . . . 880 DLCCH12 . . . 881
Cash Statement by Activity Format Code (SCF) = 3
The sources and uses of funds in the following statement are grouped by type of financial activity.
Data Item Name
Annual Mnemonic . . . page
Quarterly Mnemonic . . . page
12-Month Moving Mnemonic . . . page
Operations
Income Before Extra. Items IBC . . . 217 IBCQ . . . 217 IB12 . . . 218
Depreciation and Amortization DPC . . . 883 DPCQ . . . 884 DPC12 . . . 885
Extra. Items and Disc. Operations
XIDOC . . . 890 XIDOCQ . . . 890 XIDOC12 . . . 891
Deferred Taxes TXDC . . . 882 TXDCQ . . . 882 TXDC12 . . . 883
Equity in Net Loss (Earnings) ESUBC . . . 886 ESUBCQ . . . 886 ESUBC12 . . . 887
Sale of PP&E and Sale of Investments - Loss (Gain)
SPPIV . . . 938 SPPIVQ . . . 939 SPPIV12 . . . 940
Funds from Operations - Other FOPO . . . 897 FOPOQ . . . 897 FOPO12 . . . 898
Funds from Operations - Total FOPT . . . 899 FOPTQ . . . 900 FOPT12 . . . 900
Cash Dividends DV . . . 877 DVQ . . . 877 DV12 . . . 878
Working Capital Changes - Other - Increase (Decrease)
WCAPC . . . 951 WCAPCQ . . . 952 WCAPC12 . . . 952

759
Chapter 25 Statement of Cash Flows/Statement of Changes
Investments
Capital Expenditures CAPX . . . 871 CAPXQ . . . 872 CAPX12 . . . 873
Sale of Property, Plant and Equipment
SPPE . . . 935 SPPEQ . . . 936 SPPE12 . . . 937
Acquisitions AQC . . . 866 AQCQ . . . 866 AQC12 . . . 867
Increase in Investments IVCH . . . 916 IVCHQ . . . 917 IVCH12 . . . 917
Sale of Investments SIV . . . 933 SIVQ . . . 933 SIV12 . . . 934
Financing
Changes in Current Debt DLCCH . . . 879 DLCCHQ . . . 880 DLCCH12 . . . 881
Debt (Long-Term) - Issuance DLTIS . . . 918 DLTISQ . . . 919 DLTIS12 . . . 920
Debt (Long-Term) - Reduction DLTR . . . 920 DLTRQ . . . 921 DLTR12 . . . 922
Sale of Common and Pfd. Stock SSTK . . . 930 SSTKQ . . . 931 SSTK12 . . . 932
Purchase of Com. and Pfd. Stock
PRSTKC . . . 925 PRSTKQ . . . 926 PRSTK12 . . . 926
Current Activities
Sources of Funds - Other FSRCO . . . 944 FSRCOQ . . . 944 FSRCO12 . . . 945
Uses of Funds - Other FUSEO . . . 947 FUSEOQ . . . 948 FUSEO12 . . . 949
Cash and Cash Equiv. - Changes
CHECH . . . 875 CHECHQ . . . 875 CHECH12 . . . 876
Net Liquid Funds/Net Funds Statement Classified by Source and Use of Funds Format Code (SCF) = 5
The sources and uses of funds in the following statement of changes are grouped according to liquidity. This format is available for Canadian companies.
Data Item Name
Annual Mnemonic . . . page
Quarterly Mnemonic . . . page
12MM Mnemonic . . . page
Sources of Funds

Research Insight North America Data Guide
760
Income Before Extra. Items IBC . . . 217 IBCQ . . . 217 IB12 . . . 218
Depreciation and Amortization DPC . . . 883 DPCQ . . . 884 DPC12 . . . 885
Extraordinary Items and Disc. Ops
XIDOC . . . 890 XIDOCQ . . . 890 XIDOC12 . . . 891
Deferred Taxes TXDC . . . 882 TXDCQ . . . 882 TXDC12 . . . 883
Equity in Net Loss (Earnings) ESUBC . . . 886 ESUBCQ . . . 886 ESUBC12 . . . 887
Sale of PP&E and Sale of Investments - Loss (Gain)
SPPIV . . . 938 SPPIVQ . . . 939 SPPIV12 . . . 940
Funds from Operations - Other FOPO . . . 897 FOPOQ . . . 897 FOPO12 . . . 898
Funds from Operations - Total FOPT . . . 899 FOPTQ . . . 900 FOPT12 . . . 900
Sale of Property, Plant and Equip.
SPPE . . . 935 SPPEQ . . . 936 SPPE12 . . . 937
Sale of Common and Pfd. Stock SSTK . . . 930 SSTKQ . . . 931 SSTK12 . . . 932
Sale of Investments SIV . . . 933 SIVQ . . . 933 SIV12 . . . 934
Debt (Long-Term) - Issuance DLTIS . . . 918 DLTISQ . . . 919 DLTIS12 . . . 920
Sources of Funds - Other FSRCO . . . 944 FSRCOQ . . . 944 FSRCO12 . . . 945
Sources of Funds - Total FSRCT . . . 946 FSRCTQ . . . 946 FSRCT12 . . . 947
Uses of Funds
Cash Dividends DV . . . 877 DVQ . . . 877 DV12 . . . 878
Capital Expenditures CAPX . . . 871 CAPXQ . . . 872 CAPX12 . . . 873
Increase in Investments IVCH . . . 916 IVCHQ . . . 917 IVCH12 . . . 917
Debt (Long-Term) - Reduction DLTR . . . 920 DLTRQ . . . 921 DLTR12 . . . 922
Purchase of Com. and Pfd. Stock
PRSTKC . . . 925 PRSTKQ . . . 926 PRSTK12 . . . 926
Acquisitions AQC . . . 866 AQCQ . . . 866 AQC12 . . . 867
Uses of Funds - Other FUSEO . . . 947 FUSEOQ . . . 948 FUSEO12 . . . 949
Uses of Funds - Total FUSET . . . 949 FUSETQ . . . 950 FUSET12 . . . 951
Working Capital Changes - Other - Increase (Decrease)
WCAPC . . . 951 WCAPCQ . . . 952 WCAPC12 . . . 952

761
Chapter 25 Statement of Cash Flows/Statement of Changes
Current Debt - Changes DLCCH . . . 879 DLCCHQ . . . 880 DLCCH12 . . . 881


763
Chapter 25 Statement of Cash Flows/Statement of Changes
Data Definitions
Accounts Payable and Accrued Liabilities - Increase (Decrease) Mnemonic APALCH
Statement Statement of Cash Flows/Statement of Changes
Data item number A304
Units Millions of dollars
This item represents increases or decreases in accounts payable and accrued liabilities as reported in the Operating Activities section of a statement of cash flows (Format Code = 7).
This item contains a Not Available data code (@NA) for companies reporting a working capital statement (Format Code = 2) or a cash statement by activity (Format Code = 3).
This item includes increases (decreases) in: 1. Accounts payable when reported separately and no changes in accrued expenses are reported in the
Operating Activities section
2. Accrued expenses when reported separately and no changes in accounts payable are reported in the Operating Activities section
3. Accrued taxes when the increase (decrease) in income taxes is reported separately
4. Current liabilities when reported as trade accounts payable or accrued liabilities
This item excludes increases (decreases) in: 1. Accruals when not included in accrued expenses on the balance sheet
2. Accrued income taxes
3. Accrued taxes when the increase (decrease) in income taxes is not reported separately
4. Payables when not included in accounts payable on the balance sheet
This item contains a Combined Figure data code (@CF) when: 1. Accounts payable and accrued expenses are reported outside the Operating Activities section
2. Changes in accounts payable and accrued expenses are not reported on the statement of cash flows but the balance sheet shows a change between the current and prior year
3. Accounts payable or accrued expenses is included with another item
Increases in accounts payable and accrued liabilities are presented as positive numbers. Decreases are presented as negative numbers.
This item may be combined with another item on the statement of cash flows.
This item is not available for banks.
Accounts Payable and Accrued Liabilities - Increase (Decrease) - Quarterly Mnemonic APALCQ

Research Insight North America Data Guide
764
Statement Statement of Cash Flows/Statement of Changes
Data item number Q105
Units Millions of dollars
Important! Statement of Cash Flow quarterly items contain period data. If you’re looking at data for the 1st quarter of a company, you’re seeing 3 months of information. If you’re looking at the 2nd quarter, you’re seeing 6 months of information. The 3rd quarter contains 9 months of information and the 4th quarter contains 12 months of information.
This item represents increases or decreases in accounts payable and accrued liabilities as reported in the Operating Activities section of a statement of cash flows (Format Code = 7).
This item contains a Not Available data code (@NA) for companies reporting a working capital statement (Format Code = 2) or a cash statement by activity (Format Code = 3).
This item includes increases (decreases) in: 1. Accounts payable when reported separately and no changes in accrued expenses are reported in the
Operating Activities section
2. Accrued expenses when reported separately and no changes in accounts payable are reported in the Operating Activities section
3. Accrued taxes when the increase (decrease) in income taxes is reported separately
4. Current liabilities when reported as trade accounts payable or accrued liabilities
This item excludes increases (decreases) in: 1. Accruals when not included in accrued expenses on the balance sheet
2. Accrued income taxes
3. Accrued taxes when the increase (decrease) in income taxes is not reported separately
4. Payables when not included in accounts payable on the balance sheet
This item contains a Combined Figure data code (@CF) when: 1. Accounts payable and accrued expenses are reported outside the Operating Activities section
2. Changes in accounts payable and accrued expenses are not reported on the statement of cash flows but the balance sheet shows a change between the current and prior year
3. Accounts payable or accrued expenses is included with another item
Increases in accounts payable and accrued liabilities are presented as positive numbers. Decreases are presented as negative numbers.
This item may be combined with another item on the statement of cash flows.
This item is not available for banks.
Accounts Payable and Accrued Liabilites - Increase (Decrease) - 12MM Mnemonic APALC12

765
Chapter 25 Statement of Cash Flows/Statement of Changes
Concept calculation (@IF(@PERIOD(0Q)=4,APALCQ,(APALCQ+ APALCQ[@QTR(0Q)-@PERIOD(0Q)]-APALCQ [-4])))
Units Millions of dollars
This item represents increases or decreases in accounts payable and accrued liabilities as reported in the Operating Activities section of a statement of cash flows (Format Code = 7).
This item contains a Not Available data code (@NA) for companies reporting a working capital statement (Format Code = 2) or a cash statement by activity (Format Code = 3).
This item includes increases (decreases) in: 1. Accounts payable when reported separately and no changes in accrued expenses are reported in the
Operating Activities section
2. Accrued expenses when reported separately and no changes in accounts payable are reported in the Operating Activities section
3. Accrued taxes when the increase (decrease) in income taxes is reported separately
4. Current liabilities when reported as trade accounts payable or accrued liabilities
5. This item excludes increases (decreases) in:
6. Accruals when not included in accrued expenses on the balance sheet
7. Accrued income taxes
8. Accrued taxes when the increase (decrease) in income taxes is not reported separately
9. Payables when not included in accounts payable on the balance sheet
This item contains a Combined Figure data code (@CF) when:
Accounts payable and accrued expenses are reported outside the Operating Activities section
Changes in accounts payable and accrued expenses are not reported on the statement of cash flows but the balance sheet shows a change between the current and prior year
Accounts payable or accrued expenses is included with another item
Increases in accounts payable and accrued liabilities are presented as positive numbers. Decreases are presented as negative numbers.
This item may be combined with another item on the statement of cash flows.
This item is not available for banks.
12-Month Moving When the 4th quarter is the current period, this concept returns Accounts Payable and Accrued Liabilites - Increase (Decrease) – Quarterly, which contains 12 months of period data from the Statement of Cash Flows.
In the 1st-3rd quarters, this concept calculates a 12-month moving figure by adding:
+ the quarterly figure in the current quarter + the 4th quarter figure from the prior year – the quarterly figure from 4 quarters ago .
For example, when the current period is 3rd quarter this concept adds 9 months of period data in 3rd quarter of the current year, plus 12 months of period data from 4th quarter last year, minus 9 months of period data from 3rd quarter last year, which equals 12 months of data (9 months from the current year plus 3 months from the prior year).

Research Insight North America Data Guide
766
Acquisitions Mnemonic AQC
Statement Statement of Cash Flows/Statement of Changes
Data item number A129
Units Millions of dollars
This item represents cash outflow of funds used for and/or the costs relating to acquisition of a company in the current year or effects of an acquisition in a prior year carried over to the current year.
This item includes: 1. Acquisition of additional ownership (such as, decrease in minority interest)
2. Additional investment in a company if the company is consolidated
3. Costs in excess of net assets of businesses acquired (goodwill)
4. Long-term debt assumed in an acquisition
5. Net assets of businesses acquired
6. Property, plant, and equipment of acquired companies
This item contains a Combined Figure data code (@CF) when: Acquisitions are combined with another item within the Investing Activities section on a statement
of cash flows (Format Code = 7)
Acquisitions are reported outside the Investing Activities section on a statement of cash flows (Format Code = 7)
No figure is reported on the face of the statement but an acquisition is discussed in the notes to the statements
Stock is issued or debt is assumed for an acquisition and no figure appears in the Use section on either a working capital statement (Format Code = 1) or a cash by source and use of funds statement (Format Code = 2)
This item is not available for banks.
Acquisitions - Quarterly Mnemonic AQCQ
Statement Statement of Cash Flows/Statement of Changes
Data item number Q94
Units Millions of dollars

767
Chapter 25 Statement of Cash Flows/Statement of Changes
Important! Statement of Cash Flow quarterly items contain period data. If you’re looking at data for the 1st quarter of a company, you’re seeing 3 months of information. If you’re looking at the 2nd quarter, you’re seeing 6 months of information. The 3rd quarter contains 9 months of information and the 4th quarter contains 12 months of information.
This item represents cash outflow of funds used for and/or the costs relating to acquisition of a company in the current year or effects of an acquisition in a prior year carried over to the current year.
This item includes: 1. Acquisition of additional ownership (such as, decrease in minority interest)
2. Additional investment in a company if the company is consolidated
3. Costs in excess of net assets of businesses acquired (goodwill)
4. Long-term debt assumed in an acquisition
5. Net assets of businesses acquired
6. Property, plant, and equipment of acquired companies
This item contains a Combined Figure data code (@CF) when: Acquisitions are combined with another item within the Investing Activities section on a statement
of cash flows (Format Code = 7)
Acquisitions are reported outside the Investing Activities section on a statement of cash flows (Format Code = 7)
No figure is reported on the face of the statement but an acquisition is discussed in the notes to the statements
Stock is issued or debt is assumed for an acquisition and no figure appears in the Use section on either a working capital statement (Format Code = 1) or a cash by source and use of funds statement (Format Code = 2)
This item is not available for banks.
Data reflects year-to-date figures for each quarter.
This item may be combined with another item on the statement of cash flows.
Acquisitions 12MM Mnemonic AQC12
Concept calculation (@IF(@PERIOD(0Q)=4,AQCQ,(AQCQ+AQCQ [@QTR(0Q)-@PERIOD(0Q)]-AQCQ[-4])))
Units Millions of dollars
This item represents cash outflow of funds used for and/or the costs relating to acquisition of a company in the current year or effects of an acquisition in a prior year carried over to the current year.
This item includes: 1. Acquisition of additional ownership (such as, decrease in minority interest)
2. Additional investment in a company if the company is consolidated
3. Costs in excess of net assets of businesses acquired (goodwill)
4. Long-term debt assumed in an acquisition

Research Insight North America Data Guide
768
5. Net assets of businesses acquired
6. Property, plant, and equipment of acquired companies
This item contains a Combined Figure data code (@CF) when:
Acquisitions are combined with another item within the Investing Activities section on a statement of cash flows (Format Code = 7)
Acquisitions are reported outside the Investing Activities section on a statement of cash flows (Format Code = 7)
No figure is reported on the face of the statement but an acquisition is discussed in the notes to the statements
Stock is issued or debt is assumed for an acquisition and no figure appears in the Use section on either a working capital statement (Format Code = 1) or a cash by source and use of funds statement (Format Code = 2)
This item is not available for banks.
Data reflects year-to-date figures for each quarter.
This item may be combined with another item on the statement of cash flows.
12-Month Moving When the 4th quarter is the current period, this concept returns Acquisitions - Source and Use – Quarterly, which contains 12 months of period data from the Statement of Cash Flows.
In the 1st-3rd quarters, this concept calculates a 12-month moving figure by adding:
+ the quarterly figure in the current quarter + the 4th quarter figure from the prior year – the quarterly figure from 4 quarters ago .
For example, when the current period is 3rd quarter this concept adds 9 months of period data in 3rd quarter of the current year, plus 12 months of period data from 4th quarter last year, minus 9 months of period data from 3rd quarter last year, which equals 12 months of data (9 months from the current year plus 3 months from the prior year).
Assets and Liabilities - Other (Net Change) Mnemonic AOLOCH
Statement Statement of Cash Flows/Statement of Changes
Data item number A307
Units Millions of dollars
This item represents the dollar amount of miscellaneous changes in balance sheet accounts as reported within the Operating Activities section on a statement of cash flows (Format Code = 7).
This item is not available for companies reporting a working capital statement (Format Code = 1), a cash by source and use of funds statement (Format Code = 2), or a cash statement by activity (Format Code = 3).
This item includes increases or decreases in: 1. Assets and liabilities reported as an entity

769
Chapter 25 Statement of Cash Flows/Statement of Changes
2. Changes in current deferred taxes
3. Other asset and liability accounts
4. Other balance sheet items reported in the Operating Activities section which are combined
This item excludes: 5. Accrued taxes
6. Any expense or income item
7. Any item not clearly designated as a change in assets or liabilities
8. Asset or liability changes not reported in the Operating Activities section
9. Miscellaneous items not clearly designated as changes in other assets and liabilities
10. Provision for losses on accounts receivable
11. Miscellaneous changes increasing cash are presented as positive numbers. Changes decreasing cash appear as negative numbers.
This item may be combined with another item on the statement of cash flows.
This item is not available for banks.
Assets and Liabilities - Other (Net Change) - Quarterly Mnemonic AOLOCQ
Statement Statement of Cash Flows/Statement of Changes
Data item number Q107
Units Millions of dollars
Important! Statement of Cash Flow quarterly items contain period data. If you’re looking at data for the 1st quarter of a company, you’re seeing 3 months of information. If you’re looking at the 2nd quarter, you’re seeing 6 months of information. The 3rd quarter contains 9 months of information and the 4th quarter contains 12 months of information.
This item represents the dollar amount of miscellaneous changes in balance sheet accounts as reported within the Operating Activities section on a statement of cash flows (Format Code = 7).
This item is not available for companies reporting a working capital statement (Format Code = 1), a cash by source and use of funds statement (Format Code = 2), or a cash statement by activity (Format Code = 3).
This item includes increases or decreases in: 1. Assets and liabilities reported as an entity
2. Changes in current deferred taxes
3. Other asset and liability accounts
4. Other balance sheet items reported in the Operating Activities section which are combined
This item excludes: 1. Accrued taxes
2. Any expense or income item

Research Insight North America Data Guide
770
3. Any item not clearly designated as a change in assets or liabilities
4. Asset or liability changes not reported in the Operating Activities section
5. Miscellaneous items not clearly designated as changes in other assets and liabilities
6. Provision for losses on accounts receivable
7. Miscellaneous changes increasing cash are presented as positive numbers. Changes decreasing cash appear as negative numbers.
This item may be combined with another item on the statement of cash flows.
This item is not available for banks.
Data reflects year-to-date figures for each quarter.
Assets and Liabilities - Other Net Change - 12MM Mnemonic AOLOC12
Concept calculation (@IF(@PERIOD(0Q)=4,AOLOCQ,(AOLOCQ+ AOLOCQ[@QTR(0Q)-@PERIOD(0Q)]-AOLOCQ [-4])))
Units Millions of dollars
This item represents the dollar amount of miscellaneous changes in balance sheet accounts as reported within the Operating Activities section on a statement of cash flows (Format Code = 7).
This item is not available for companies reporting a working capital statement (Format Code = 1), a cash by source and use of funds statement (Format Code = 2), or a cash statement by activity (Format Code = 3).
This item includes increases or decreases in: 1. Assets and liabilities reported as an entity
2. Changes in current deferred taxes
3. Other asset and liability accounts
4. Other balance sheet items reported in the Operating Activities section which are combined
This item excludes: 1. Accrued taxes
2. Any expense or income item
3. Any item not clearly designated as a change in assets or liabilities
4. Asset or liability changes not reported in the Operating Activities section
5. Miscellaneous items not clearly designated as changes in other assets and liabilities
6. Provision for losses on accounts receivable
7. Miscellaneous changes increasing cash are presented as positive numbers. Changes decreasing cash appear as negative numbers.
This item may be combined with another item on the statement of cash flows.
This item is not available for banks.

771
Chapter 25 Statement of Cash Flows/Statement of Changes
12-Month Moving When the 4th quarter is the current period, this concept returns Assets and Liabilities – Other Net Change – Quarterly, which contains 12 months of period data from the Statement of Cash Flows.
In the 1st-3rd quarters, this concept calculates a 12-month moving figure by adding:
+ the quarterly figure in the current quarter + the 4th quarter figure from the prior year – the quarterly figure from 4 quarters ago .
For example, when the current period is 3rd quarter this concept adds 9 months of period data in 3rd quarter of the current year, plus 12 months of period data from 4th quarter last year, minus 9 months of period data from 3rd quarter last year, which equals 12 months of data (9 months from the current year plus 3 months from the prior year).
Capital Expenditures Mnemonic CAPX
Statement Statement of Cash Flows/Statement of Changes
Data item number A128
Units Millions of dollars
This item represents cash outflow or the funds used for additions to the company's property, plant and equipment.
This item includes: 1. Expenditures for capital leases
2. Increase in funds for construction
3. Reclassification of inventory to property, plant and equipment
This item excludes: 1. Capital expenditures of discontinued operations
2. Changes in property, plant and equipment resulting from foreign currency fluctuations when listed separately
3. Decrease in funds for construction presented as a use of funds
4. Property, plant and equipment of acquired companies
This item contains a Combined Figure data code (@CF) when: Capital expenditures are reported in a section other than Investing Activities on Statement of
Cash Flows (Format Code = 7)
Capital expenditures are combined with another item in the Investing Activities section on a Statement of Cash Flows (Format Code = 7)
Capital expenditures are reported net of the sale of property, plant and equipment and the resulting figure is negative. For companies reporting either a Working Capital Statement (Format Code = 1) or Cash by Source and Use of Funds (Format Code = 2), the negative figure is included in Uses of Funds - Other. For companies reporting either a Cash Statement by Activity (Format Code = 3) or a Statement of Cash Flows (Format Code = 7), the negative figure is included in Sale of Property, Plant and Equipment.

Research Insight North America Data Guide
772
Capital Expenditures are combined with another item for a company reporting a Working Capital Statement (Format Code = 1), a Cash by Source and Use of Funds Statement (Format Code = 2), or a Statement of Cash Flows (Format Code = 7)
This item is not available for banks.
Capital Expenditures - Note Mnemonic CAPXF
Code Description
QB Net of current year's sales, retirements, and/or disposals of Property, Plant and Equipment
Capital Expenditures - Quarterly Mnemonic CAPXQ
Statement Statement of Cash Flows/Statement of Changes
Data item number Q90
Units Millions of dollars
Important! Statement of Cash Flow quarterly items contain period data. If you’re looking at data for the 1st quarter of a company, you’re seeing 3 months of information. If you’re looking at the 2nd quarter, you’re seeing 6 months of information. The 3rd quarter contains 9 months of information and the 4th quarter contains 12 months of information.
This item represents cash outflow or the funds used for additions to the company's property, plant and equipment.
This item includes: 1. Expenditures for capital leases
2. Increase in funds for construction
3. Reclassification of inventory to property, plant, and equipment
This item excludes: 1. Capital expenditures of discontinued operations
2. Changes in property, plant, and equipment resulting from foreign currency fluctuations when listed separately
3. Decrease in funds for construction presented as a use of funds
4. Property, plant, and equipment of acquired companies
This item contains a Combined Figure data code (@CF) when ...

773
Chapter 25 Statement of Cash Flows/Statement of Changes
Capital expenditures are reported in a section other than Investing Activities on Statement of Cash Flows (Format Code = 7)
Capital expenditures are combined with another item in the Investing Activities section on a Statement of Cash Flows (Format Code = 7)
Capital expenditures are reported net of the sale of property, plant and equipment and the resulting figure is negative. For companies reporting either a Working Capital Statement (Format Code = 1) or Cash by Source and Use of Funds (Format Code = 2), the negative figure is included in Uses of Funds - Other. For companies reporting either a Cash Statement by Activity (Format Code = 3) or a Statement of Cash Flows (Format Code = 7), the negative figure is included in Sale of Property, Plant and Equipment.
Capital Expenditures are combined with another item for a company reporting a Working Capital Statement (Format Code = 1), a Cash by Source and Use of Funds Statement (Format Code = 2), or a Statement of Cash Flows (Format Code = 7)
This item is not available for banks or insurance companies.
Capital Expenditures - Quarterly - Note Mnemonic CAPXQF
Code Description QB Net of current year's sales, retirements, and/or
disposals of Property, Plant and Equipment
Capital Expenditures 12MM Mnemonic CAPX12
Concept calculation (@IF(@PERIOD(0Q)=4,CAPXQ,(CAPXQ+CAPXQ [@QTR(0Q)-@PERIOD(0Q)]-CAPXQ[-4])))
Units Millions of dollars
This item represents cash outflow or the funds used for additions to the company's property, plant and equipment.
This item includes: 1. Expenditures for capital leases
2. Increase in funds for construction
3. Reclassification of inventory to property, plant and equipment
This item excludes: 1. Capital expenditures of discontinued operations
2. Changes in property, plant and equipment resulting from foreign currency fluctuations when listed separately
3. Decrease in funds for construction presented as a use of funds

Research Insight North America Data Guide
774
4. Property, plant and equipment of acquired companies
This item contains a Combined Figure data code (@CF) when: 1. Capital expenditures are reported in a section other than Investing Activities on Statement of Cash
Flows (Format Code = 7)
2. Capital expenditures are combined with another item in the Investing Activities section on a Statement of Cash Flows (Format Code = 7)
3. Capital expenditures are reported net of the sale of property, plant and equipment and the resulting figure is negative. For companies reporting either a Working Capital Statement (Format Code = 1) or Cash by Source and Use of Funds (Format Code = 2), the negative figure is included in Uses of Funds - Other. For companies reporting either a Cash Statement by Activity (Format Code = 3) or a Statement of Cash Flows (Format Code = 7), the negative figure is included in Sale of Property, Plant and Equipment.
4. Capital Expenditures are combined with another item for a company reporting a Working Capital Statement (Format Code = 1), a Cash by Source and Use of Funds Statement (Format Code = 2), or a Statement of Cash Flows (Format Code = 7)
This item is not available for banks.
12-Month Moving When the 4th quarter is the current period, this concept returns Capital Expenditures – Quarterly, which contains 12 months of period data from the Statement of Cash Flows.
In the 1st-3rd quarters, this concept calculates a 12-month moving figure by adding:
+ the quarterly figure in the current quarter + the 4th quarter figure from the prior year – the quarterly figure from 4 quarters ago .
For example, when the current period is 3rd quarter this concept adds 9 months of period data in 3rd quarter of the current year, plus 12 months of period data from 4th quarter last year, minus 9 months of period data from 3rd quarter last year, which equals 12 months of data (9 months from the current year plus 3 months from the prior year).
Capital Expenditures 12MM Note Mnemonic CAPX12F
Concept calculation (@IF(@PERIOD(0Q)=4,CAPXQF,(@IF(@ISVALUE (CAPXQF),CAPXQF,@IF(@ISVALUE(CAPXQF [-1]),CAPXQF[-1],@IF(@ISVALUE(CAPXQF [-2]),CAPXQF[-2],CAPXQF[-3]))))))
Code Description QB Net of current year's sales, retirements, and/or
disposals of Property, Plant and Equipment
Cash and Equivalents - Changes Mnemonic CHECH

775
Chapter 25 Statement of Cash Flows/Statement of Changes
Statement Statement of Cash Flows/Statement of Changes
Data item number A274
Units Millions of dollars
This item represents the net change in cash and cash equivalents as reported by the company.
This item represents the net change in cash presented separately from cash equivalents for companies reporting a Cash by Source and Use of Funds Statement (Format Code = 2), a Cash Statement by Activity (Format Code = 3), or a Statement of Cash Flows (Format Code = 7).
This item excludes changes in cash equivalents presented within the body of the statement for companies reporting a Cash by Source and Use of Funds Statement (Format Code = 2), a Cash Statement by Activity (Format code = 3), or a Statement of Cash Flows (Format Code = 7).
Increases in cash and equivalents are presented as positive numbers. Decreases are presented as negative numbers.
This item is not available for banks or utilities.
This item contains a Combined Figure data code (@CF) from 1971-1983 for companies reporting a Working Capital Statement (Format Code = 1).
Cash and Equivalents - Changes - Quarterly Mnemonic CHECHQ
Statement Statement of Cash Flows/Statement of Changes
Data item number Q74
Units Millions of dollars
Important! Statement of Cash Flow quarterly items contain period data. If you’re looking at data for the 1st quarter of a company, you’re seeing 3 months of information. If you’re looking at the 2nd quarter, you’re seeing 6 months of information. The 3rd quarter contains 9 months of information and the 4th quarter contains 12 months of information.
This item represents the net change in cash and cash equivalents as reported by the company.
This item represents the net change in cash presented separately from cash equivalents for companies reporting a Cash by Source and Use of Funds Statement (Format Code = 2), a Cash Statement by Activity (Format Code = 3), or a Statement of Cash Flows (Format Code = 7).
This item excludes changes in cash equivalents presented within the body of the statement for companies reporting a Cash by Source and Use of Funds Statement (Format Code = 2), a Cash Statement by Activity (Format code = 3), or a Statement of Cash Flows (Format Code = 7).
Increases in cash and equivalents are presented as positive numbers. Decreases are presented as negative numbers.
This item contains a Combined Figure data code (@CF) from 1971-1983 for companies reporting a Working Capital Statement (Format Code = 1).
Data is presented on a historical basis.
This item is available for Industrial companies, only. It is not available for Banks or Utility companies.

Research Insight North America Data Guide
776
Cash and Equivalents - Changes - 12MM Mnemonic CHECH12
Concept calculation (@IF(@PERIOD(0Q)=4,CHECHQ,(CHECHQ+ CHECHQ[@QTR(0Q)-@PERIOD(0Q)]-CHECHQ [-4])))
Units Millions of dollars
This item represents the net change in cash and cash equivalents as reported by the company.
This item represents the net change in cash presented separately from cash equivalents for companies reporting a Cash by Source and Use of Funds Statement (Format Code = 2), a Cash Statement by Activity (Format Code = 3), or a Statement of Cash Flows (Format Code = 7).
This item excludes changes in cash equivalents presented within the body of the statement for companies reporting a Cash by Source and Use of Funds Statement (Format Code = 2), a Cash Statement by Activity (Format code = 3), or a Statement of Cash Flows (Format Code = 7).
Increases in cash and equivalents are presented as positive numbers. Decreases are presented as negative numbers.
This item is not available for banks or utilities.
This item contains a Combined Figure data code (@CF) from 1971-1983 for companies reporting a Working Capital Statement (Format Code = 1).
12-Month Moving When the 4th quarter is the current period, this concept returns Change in Cash and Equivalents – Quarterly, which contains 12 months of period data from the Statement of Cash Flows.
In the 1st-3rd quarters, this concept calculates a 12-month moving figure by adding:
+ the quarterly figure in the current quarter + the 4th quarter figure from the prior year – the quarterly figure from 4 quarters ago .
For example, when the current period is 3rd quarter this concept adds 9 months of period data in 3rd quarter of the current year, plus 12 months of period data from 4th quarter last year, minus 9 months of period data from 3rd quarter last year, which equals 12 months of data (9 months from the current year plus 3 months from the prior year).
Cash Dividends Mnemonic DV
Statement Statement of Cash Flows/Statement of Changes
Data item number A127
Units Millions of dollars
This item represents the total amount of cash dividends for both common and preferred stock.
This item includes: 1. Arrearages from prior years paid in the current year

777
Chapter 25 Statement of Cash Flows/Statement of Changes
2. Cash paid in lieu of fractional shares
3. Dividends paid by companies acquired using the pooling of interest method
4. Liquidating dividends or distributions
5. Partnership distributions
6. Subchapter S distributions
This item excludes: 1. Cash value of stock dividends
2. Dividends in kind (other than cash)
3. Minority shareholders' dividends
4. Patronage dividends
5. Preferred dividend requirement paid in common stock
This item contains a Combined Figure data code (@CF) when the retained earnings schedule on the Balance Sheet presents an amount for cash dividends but no payments are represented on either the Source and Use of Funds Statement or Statement of Cash Flows or the Statement of Changes.
This item is not available for banks or utilities.
Cash Dividends - Quarterly Mnemonic DVQ
Statement Statement of Cash Flows/Statement of Changes
Data item number Q89
Units Millions of dollars
Important! Statement of Cash Flow quarterly items contain period data. If you’re looking at data for the 1st quarter of a company, you’re seeing 3 months of information. If you’re looking at the 2nd quarter, you’re seeing 6 months of information. The 3rd quarter contains 9 months of information and the 4th quarter contains 12 months of information.
This item represents the total amount of cash dividends for both common and preferred stock.
This item includes:
1. Arrearages from prior years paid in the current year 2. Cash paid in lieu of fractional shares
3. Dividends paid by companies acquired using the pooling of interest method
4. Liquidating dividends or distributions
5. Partnership distributions
6. Subchapter S distributions
This item excludes: 1. Cash value of stock dividends
2. Dividends in kind (other than cash)

Research Insight North America Data Guide
778
3. Minority shareholders' dividends
4. Patronage dividends
5. Preferred dividend requirement paid in common stock
This item contains a Combined Figure data code (@CF) when the retained earnings schedule on the Balance Sheet presents an amount for cash dividends but no payments are represented on either the Source and Use of Funds Statement or Statement of Cash Flows or the Statement of Changes.
This item is not available for banks or utilities.
Data is presented on an historical period basis.
Cash Dividends 12MM Mnemonic DV12
Concept calculation (@IF(@PERIOD(0Q)=4,DVQ,(DVQ+DVQ[@QTR (0Q)-@PERIOD(0Q)]-DVQ[-4])))
Units Millions of dollars
This item represents the total amount of cash dividends for both common and preferred stock.
This item includes: 1. Arrearages from prior years paid in the current year
2. Cash paid in lieu of fractional shares
3. Dividends paid by companies acquired using the pooling of interest method
4. Liquidating dividends or distributions
5. Partnership distributions
6. Subchapter S distributions
This item excludes: 1. Cash value of stock dividends
2. Dividends in kind (other than cash)
3. Minority shareholders' dividends
4. Patronage dividends
5. Preferred dividend requirement paid in common stock
This item contains a Combined Figure data code (@CF) when the retained earnings schedule on the Balance Sheet presents an amount for cash dividends but no payments are represented on either the Source and Use of Funds Statement or Statement of Cash Flows or the Statement of Changes.
This item is not available for banks or utilities.
12-Month Moving When the 4th quarter is the current period, this concept returns Cash Dividends – Quarterly, which contains 12 months of period data from the Statement of Cash Flows.
In the 1st-3rd quarters, this concept calculates a 12-month moving figure by adding:
+ the quarterly figure in the current quarter + the 4th quarter figure from the prior year – the quarterly figure from 4 quarters ago .

779
Chapter 25 Statement of Cash Flows/Statement of Changes
For example, when the current period is 3rd quarter this concept adds 9 months of period data in 3rd quarter of the current year, plus 12 months of period data from 4th quarter last year, minus 9 months of period data from 3rd quarter last year, which equals 12 months of data (9 months from the current year plus 3 months from the prior year).
Cash Reinvestment Ratio 12MM Mnemonic CHRR12
Concept calculation @VALUE((OANCF12-DV12)/ (PPEGTQ+AOQ+ACTQ-LCTQ),((OANCF12 -DV12)/(PPEGTQ+AOQ+ACTQ-LCTQ))[-1])
Units Millions of dollars
This concept is the Operating Activities - Net Cash Flow 12-Month Moving minus Cash Dividends 12-Month Moving. This is divided by the sum of Property Plant, and Equipment (Gross) Total Quarterly plus Assets – Other - Quarterly plus Current Assets – Total – Quarterly minus Current Liabilities – Total – Quarterly. If a value is not available for the current quarter, a value will be calculated using data from the prior quarter.
Current Debt - Changes Mnemonic DLCCH
Statement Statement of Cash Flows/Statement of Changes
Annual Data Item Number A301
Units Millions of dollars
This item represents the net change in short-term borrowings and/or current maturities of long-term debt.
This item includes 1. Changes in current debt increasing or decreasing working capital for a company reporting a Working
Capital Statement (Format Code = 1)
2. Changes in current debt providing a source or detailing a use of funds for a company reporting a Cash by Source and Use of Funds Statement (Format Code = 2) or a Cash Statement by Activity (Format Code = 3)
3. Changes in current debt presented separately within the Financing Activities section for a company reporting a Statement of Cash Flows (Format Code = 7)
This item contains a Combined Figure data code (@CF) when ... 1. Current debt changes are combined with another data item within the Financing Activities Section of a
Cash Flows Statement (Format Code = 7)
2. Current debt changes are reported outside the Financing Activities section on a Statement of Cash Flows (Format Code = 7)
3. No breakout of increase (decrease) in working capital changes is presented for a company reporting a Working Capital Statement (Format Code = 1), a Cash by Source and Use of Funds Statement (Format Code = 2), or a Cash Statement by activity (Format Code = 3)
This item is not available for banks or utilities.

Research Insight North America Data Guide
780
Current Debt - Changes - Quarterly Mnemonic DLCCHQ
Statement Statement of Cash Flows/Statement of Changes
Quarterly Data Item Number Q75
Units Millions of dollars
Important! Statement of Cash Flow quarterly items contain period data. If you’re looking at data for the 1st quarter of a company, you’re seeing 3 months of information. If you’re looking at the 2nd quarter, you’re seeing 6 months of information. The 3rd quarter contains 9 months of information and the 4th quarter contains 12 months of information.
This item represents the net change in short-term borrowings and/or current maturities of long-term debt.
This item includes
1. Changes in current debt increasing or decreasing working capital for a company reporting a Working Capital Statement (Format Code = 1) 2. Changes in current debt providing a source or detailing a use of funds for a company reporting a
Cash by Source and Use of Funds Statement (Format Code = 2) or a Cash Statement by Activity (Format Code = 3)
3. Changes in current debt presented separately within the Financing Activities section for a company reporting a Statement of Cash Flows (Format Code = 7)
This item contains a Combined Figure data code (@CF) when ... 1. Current debt changes are combined with another data item within the Financing Activities Section of a
Cash Flows Statement (Format Code = 7)
2. Current debt changes are reported outside the Financing Activities section on a Statement of Cash Flows (Format Code = 7)
3. No breakout of increase (decrease) in working capital changes is presented for a company reporting a Working Capital Statement (Format Code = 1), a Cash by Source and Use of Funds Statement (Format Code = 2), or a Cash Statement by activity (Format Code = 3)
This item is not available for banks or utilities.
Data is presented on a historical basis.
Current Debt - Changes -12MM Mnemonic DLCCH12
Concept calculation (@IF(@PERIOD(0Q)=4,DLCCHQ,(DLCCHQ+ DLCCHQ[@QTR(0Q)-@PERIOD(0Q)]-DLCCHQ [-4])))
Units Millions of dollars
This item represents the net change in short-term borrowings and/or current maturities of long-term debt.

781
Chapter 25 Statement of Cash Flows/Statement of Changes
This item includes 1. Changes in current debt increasing or decreasing working capital for a company reporting a Working
Capital Statement (Format Code = 1)
2. Changes in current debt providing a source or detailing a use of funds for a company reporting a Cash by Source and Use of Funds Statement (Format Code = 2) or a Cash Statement by Activity (Format Code = 3)
3. Changes in current debt presented separately within the Financing Activities section for a company reporting a Statement of Cash Flows (Format Code = 7)
This item contains a Combined Figure data code (@CF) when ... 1. Current debt changes are combined with another data item within the Financing Activities Section of a
Cash Flows Statement (Format Code = 7)
2. Current debt changes are reported outside the Financing Activities section on a Statement of Cash Flows (Format Code = 7)
3. No breakout of increase (decrease) in working capital changes is presented for a company reporting a Working Capital Statement (Format Code = 1), a Cash by Source and Use of Funds Statement (Format Code = 2), or a Cash Statement by activity (Format Code = 3)
This item is not available for banks or utilities.
12-Month Moving When the 4th quarter is the current period, this concept returns Change in Current Debt – Quarterly, which contains 12 months of period data from the Statement of Cash Flows.
In the 1st-3rd quarters, this concept calculates a 12-month moving figure by adding:
+ the quarterly figure in the current quarter + the 4th quarter figure from the prior year – the quarterly figure from 4 quarters ago .
For example, when the current period is 3rd quarter this concept adds 9 months of period data in 3rd quarter of the current year, plus 12 months of period data from 4th quarter last year, minus 9 months of period data from 3rd quarter last year, which equals 12 months of data (9 months from the current year plus 3 months from the prior year).
Deferred Taxes Mnemonic TXDC
Statement Statement of Cash Flows/Statement of Changes
Annual Data Item Number A126
Units Millions of dollars
This item represents deferred income tax expense reported in either the Operating Activities section or Funds from Operations section.
This item includes investment tax credit.
This item may include current deferred income taxes if not separable from long-term deferred income taxes on a statement of cash flows (Format Code = 7).
This item contains a Combined Figure data code (@CF) when:

Research Insight North America Data Guide
782
Deferred taxes are combined with another item in the Funds from Operations or Operating Activities section
Deferred taxes are reported outside the Funds from Operations section
This item is not available for banks.
Deferred Taxes - Quarterly Mnemonic TXDCQ
Statement Statement of Cash Flows/Statement of Changes
Quarterly Data Item Number Q79
Units Millions of dollars
Important! Statement of Cash Flow quarterly items contain period data. If you’re looking at data for the 1st quarter of a company, you’re seeing 3 months of information. If you’re looking at the 2nd quarter, you’re seeing 6 months of information. The 3rd quarter contains 9 months of information and the 4th quarter contains 12 months of information.
This item represents deferred income tax expense reported in either the Operating Activities section or Funds from Operations section.
This item includes investment tax credit.
This item may include current deferred income taxes if not separable from long-term deferred income taxes on a statement of cash flows (Format Code = 7).
This item contains a Combined Figure data code (@CF) when: Deferred taxes are combined with another item in the Funds from Operations or Operating
Activities section
Deferred taxes are reported outside the Funds from Operations section
This item is not available for banks.
Data is presented on a historical basis.
Deferred Taxes - 12MM Mnemonic TXDC12
Concept calculation (@IF(@PERIOD(0Q)=4,TXDCQ,(TXDCQ+TXDCQ [@QTR(0Q)-@PERIOD(0Q)]-TXDCQ[-4])))
Units Millions of dollars
This item represents deferred income tax expense reported in either the Operating Activities section or Funds from Operations section.
This item includes investment tax credit.
This item may include current deferred income taxes if not separable from long-term deferred income taxes on a statement of cash flows (Format Code = 7).

783
Chapter 25 Statement of Cash Flows/Statement of Changes
This item contains a Combined Figure data code (@CF) when:
Deferred taxes are combined with another item in the Funds from Operations or Operating Activities section
Deferred taxes are reported outside the Funds from Operations section
This item is not available for banks.
12-Month Moving When the 4th quarter is the current period, this concept returns Deferred Taxes - Source & Use – Quarterly, which contains 12 months of period data from the Statement of Cash Flows.
In the 1st-3rd quarters, this concept calculates a 12-month moving figure by adding:
+ the quarterly figure in the current quarter + the 4th quarter figure from the prior year – the quarterly figure from 4 quarters ago .
For example, when the current period is 3rd quarter this concept adds 9 months of period data in 3rd quarter of the current year, plus 12 months of period data from 4th quarter last year, minus 9 months of period data from 3rd quarter last year, which equals 12 months of data (9 months from the current year plus 3 months from the prior year).
Depreciation and Amortization Mnemonic DPC
Statement Statement of Cash Flows/Statement of Changes
Annual Data Item Number A125
Units Millions of dollars
This item represents non-cash charges for obsolescence and wear and tear on property, allocation of the current portion of capitalized expenditures, and depletion charges.
This item includes 1. Amortization of patents, trademarks, and other intangibles
2. Amortization of deferred charges
3. Amortization of tools and dies
This item excludes 1. Amortization of negative intangibles
2. Amortization of liability intangibles
3. Amortization of goodwill on unconsolidated subsidiaries
This item is not available for banks or utilities.

Research Insight North America Data Guide
784
Depreciation and Amortization - Quarterly Mnemonic DPCQ
Statement Statement of Cash Flows/Statement of Changes
Quarterly Data Item Number Q77
Units Millions of dollars
Important! Statement of Cash Flow quarterly items contain period data. If you’re looking at data for the 1st quarter of a company, you’re seeing 3 months of information. If you’re looking at the 2nd quarter, you’re seeing 6 months of information. The 3rd quarter contains 9 months of information and the 4th quarter contains 12 months of information.
This item represents non-cash charges for obsolescence and wear and tear on property, allocation of the current portion of capitalized expenditures, and depletion charges.
This item includes
1. Amortization of patents, trademarks, and other intangibles 2. Amortization of deferred charges
3. Amortization of tools and dies
This item excludes 1. Amortization of negative intangibles
2. Amortization of liability intangibles
3. Amortization of goodwill on unconsolidated subsidiaries
This item is not available for banks or utilities.
Data is presented on an historical period basis.
Depreciation - 12MM Mnemonic DPC12
Concept calculation (@IF(@PERIOD(0Q)=4,DPCQ,(DPCQ+DPCQ [@QTR(0Q)-@PERIOD(0Q)]-DPCQ[-4])))
Units Millions of dollars
This item represents non-cash charges for obsolescence and wear and tear on property, allocation of the current portion of capitalized expenditures, and depletion charges.
This item includes 1. Amortization of patents, trademarks, and other intangibles
2. Amortization of deferred charges
3. Amortization of tools and dies
This item excludes 1. Amortization of negative intangibles

785
Chapter 25 Statement of Cash Flows/Statement of Changes
2. Amortization of liability intangibles
3. Amortization of goodwill on unconsolidated subsidiaries
This item is not available for banks or utilities.
12-Month Moving When the 4th quarter is the current period, this concept returns Depreciation - Source and Use – Quarterly, which contains 12 months of period data from the Statement of Cash Flows.
In the 1st-3rd quarters, this concept calculates a 12-month moving figure by adding:
+ the quarterly figure in the current quarter + the 4th quarter figure from the prior year – the quarterly figure from 4 quarters ago .
For example, when the current period is 3rd quarter this concept adds 9 months of period data in 3rd quarter of the current year, plus 12 months of period data from 4th quarter last year, minus 9 months of period data from 3rd quarter last year, which equals 12 months of data (9 months from the current year plus 3 months from the prior year).
Equity in Net Loss (Earnings) Mnemonic ESUBC
Statement Statement of Cash Flows/Statement of Changes
Annual Data Item Number A106
Units Millions of dollars
This item represents an adjustment to income before extraordinary items and discontinued operations. It reflects the unremitted portion of an unconsolidated subsidiary's earnings included in the Income Statement. This adjustment usually decreases since that item includes an amount that does not produce any funds.
This income is stated as a negative number and a loss is stated as a positive number.
This item is net of dividends in excess of equity in earnings.
If dividends from unconsolidated subsidiaries appear after the Operations section, Standard & Poor's adjusts this item and total operations to include dividends for companies reporting a Working Capital Statement (Format Code = 1) or a Cash by Source and Use of Funds Statement (Format Code = 2). If dividends from unconsolidated subsidiaries appear after the Operations section, Standard & Poor's will net them against the equity figure and adjust total operations (Format Code = 7).
This item is not available for banks or utilities.
Equity in Net Loss (Earnings) - Quarterly Mnemonic ESUBCQ
Statement Statement of Cash Flows/Statement of Changes
Quarterly Data Item Number Q80
Units Millions of dollars

Research Insight North America Data Guide
786
Important! Statement of Cash Flow quarterly items contain period data. If you’re looking at data for the 1st quarter of a company, you’re seeing 3 months of information. If you’re looking at the 2nd quarter, you’re seeing 6 months of information. The 3rd quarter contains 9 months of information and the 4th quarter contains 12 months of information.
This item represents an adjustment to income before extraordinary items and discontinued operations. It reflects the unremitted portion of an unconsolidated subsidiary's earnings included in the Income Statement. This adjustment usually decreases since that item includes an amount that does not produce any funds.
This income is stated as a negative number and a loss is stated as a positive number.
This item is net of dividends in excess of equity in earnings.
If dividends from unconsolidated subsidiaries appear after the Operations section, Standard & Poor's adjusts this item and total operations to include dividends for companies reporting a Working Capital Statement (Format Code = 1) or a Cash by Source and Use of Funds Statement (Format Code = 2).
This item is not available for banks or utilities.
Data is presented on an historical period basis.
Equity in Net Loss (Earnings) 12MM Mnemonic ESUBC12
Concept calculation (@IF(@PERIOD(0Q)=4,ESUBCQ,(ESUBCQ+ ESUBCQ[@QTR(0Q)-@PERIOD(0Q)]-ESUBCQ [-4])))
Units Millions of dollars
This item represents an adjustment to income before extraordinary items and discontinued operations. It reflects the unremitted portion of an unconsolidated subsidiary's earnings included in the Income Statement. This adjustment usually decreases since that item includes an amount that does not produce any funds.
This income is stated as a negative number and a loss is stated as a positive number.
This item is net of dividends in excess of equity in earnings.
If dividends from unconsolidated subsidiaries appear after the Operations section, Standard & Poor's adjusts this item and total operations to include dividends for companies reporting a Working Capital Statement (Format Code = 1) or a Cash by Source and Use of Funds Statement (Format Code = 2). If dividends from unconsolidated subsidiaries appear after the Operations section, Standard & Poor's will net them against the equity figure and adjust total operations (Format Code = 7).
This item is not available for banks or utilities.
12-Month Moving When the 4th quarter is the current period, this concept returns Equity in Net Loss (Earnings) – Quarterly, which contains 12 months of period data from the Statement of Cash Flows.
In the 1st-3rd quarters, this concept calculates a 12-month moving figure by adding:
+ the quarterly figure in the current quarter + the 4th quarter figure from the prior year – the quarterly figure from 4 quarters ago .

787
Chapter 25 Statement of Cash Flows/Statement of Changes
For example, when the current period is 3rd quarter this concept adds 9 months of period data in 3rd quarter of the current year, plus 12 months of period data from 4th quarter last year, minus 9 months of period data from 3rd quarter last year, which equals 12 months of data (9 months from the current year plus 3 months from the prior year).
Exchange Rate Effect Mnemonic EXRE
Statement Statement of Cash Flows
Annual Data Item Number A314
Units Dollars and cents
This item represents the net effect of foreign currency exchange rates on cash balances held by the company as reported on a Statement of Cash Flows (Format Code = 7).
This item contains a Not Available data code (@NA) for companies in which Format Code = 1, 2, or 3.
This item includes foreign currency translation effects presented outside the Operating Activities, Investing Activities and Financing Activities sections.
This item excludes 1. Exchange adjustments applicable to the Stockholders' Equity section on the Balance Sheet.
2. Exchange effects shown in the Operating, Investing or Financing Activities section.
This item contains a Combined Figure data code (@CF) if foreign currency exchange rate effects are combined in the Operating, Investing or Financing Activities section.
Exchange effects increasing net cash flow are presented as positive numbers. Exchange effects decreasing net cash flow are negative.
Exchange Rate Effect - Quarterly Mnemonic EXREQ
Statement Statement of Cash Flows
Quarterly Data Item Number Q114
Units Dollars and cents
Important! Statement of Cash Flow quarterly items contain period data. If you’re looking at data for the 1st quarter of a company, you’re seeing 3 months of information. If you’re looking at the 2nd quarter, you’re seeing 6 months of information. The 3rd quarter contains 9 months of information and the 4th quarter contains 12 months of information.
This item represents the net effect of foreign currency exchange rates on cash balances held by the company as reported on a Statement of Cash Flows (Format Code = 7).
This item contains a Not Available data code (@NA) for companies in which Format Code = 1, 2, or 3.
This item includes foreign currency translation effects presented outside the Operating Activities, Investing Activities and Financing Activities sections.

Research Insight North America Data Guide
788
This item excludes
1. Exchange adjustments applicable to the Stockholders' Equity section on the Balance Sheet. 2. Exchange effects shown in the Operating, Investing or Financing Activities section.
This item contains a Combined Figure data code (@CF) if foreign currency exchange rate effects are combined in the Operating, Investing or Financing Activities section.
Exchange effects increasing net cash flow are presented as positive numbers. Exchange effects decreasing net cash flow are negative.
Exchange Rate Effect 12MM Mnemonic EXRE12
Concept calculation (@IF(@PERIOD(0Q)=4,EXREQ,(EXREQ+EXREQ [@QTR(0Q)-@PERIOD(0Q)]-EXREQ[-4])))
Units Millions of dollars
This item represents the net effect of foreign currency exchange rates on cash balances held by the company as reported on a Statement of Cash Flows (Format Code = 7).
This item contains a Not Available data code (@NA) for companies in which Format Code = 1, 2, or 3.
This item includes foreign currency translation effects presented outside the Operating Activities, Investing Activities and Financing Activities sections.
This item excludes
1. Exchange adjustments applicable to the Stockholders' Equity section on the Balance Sheet.
2. Exchange effects shown in the Operating, Investing or Financing Activities section.
This item contains a Combined Figure data code (@CF) if foreign currency exchange rate effects are combined in the Operating, Investing or Financing Activities section.
Exchange effects increasing net cash flow are presented as positive numbers. Exchange effects decreasing net cash flow are negative.
12-Month Moving When the 4th quarter is the current period, this concept returns Exchange Rate Effect – Quarterly, which contains 12 months of period data from the Statement of Cash Flows.
In the 1st-3rd quarters, this concept calculates a 12-month moving figure by adding:
+ the quarterly figure in the current quarter + the 4th quarter figure from the prior year – the quarterly figure from 4 quarters ago .
For example, when the current period is 3rd quarter this concept adds 9 months of period data in 3rd quarter of the current year, plus 12 months of period data from 4th quarter last year, minus 9 months of period data from 3rd quarter last year, which equals 12 months of data (9 months from the current year plus 3 months from the prior year).
Extra. Items and Discontinued Operations Mnemonic XIDOC

789
Chapter 25 Statement of Cash Flows/Statement of Changes
Statement Statement of Cash Flows/Statement of Changes
Annual Data Item Number A124
Units Millions of dollars
This item includes discontinued operations.
This item excludes special items.
This item contains a Combined Figure data code (@CF) when ... 1. Extraordinary items and discontinued operations are combined with another data item either within or
outside the Operating Activities section for companies reporting a Statement of Cash Flows (Format Code = 7)
2. Extraordinary items and discontinued operations are presented in the Use section for companies reporting a Working Capital Statement (Format Code = 1), a Cash by Source and Use of Funds Statement (Format Code = 2), or a Cash Statement by Activity (Format Code = 3)
This item is not available for banks or utilities.
Extra. Items and Discontinued Operations - Quarterly Mnemonic XIDOCQ
Statement Statement of Cash Flows/Statement of Changes
Quarterly Data Item Number Q78
Units Millions of dollars
Important! Statement of Cash Flow quarterly items contain period data. If you’re looking at data for the 1st quarter of a company, you’re seeing 3 months of information. If you’re looking at the 2nd quarter, you’re seeing 6 months of information. The 3rd quarter contains 9 months of information and the 4th quarter contains 12 months of information.
This item includes discontinued operations.
This item excludes special items.
This item contains a Combined Figure data code (@CF) when ... 1. Extraordinary items and discontinued operations are combined with another data item either within or
outside the Operating Activities section for companies reporting a Statement of Cash Flows (Format Code = 7)
2. Extraordinary items and discontinued operations are presented in the Use section for companies reporting a Working Capital Statement (Format Code = 1), a Cash by Source and Use of Funds Statement (Format Code = 2), or a Cash Statement by Activity (Format Code = 3)
This item is not available for banks or utilities.
Data is presented on a historical basis.

Research Insight North America Data Guide
790
Extraordinary Items and Discontinued Operations - 12MM Mnemonic XIDOC12
Concept calculation (@IF(@PERIOD(0Q)=4,XIDOCQ,(XIDOCQ+ XIDOCQ[@QTR(0Q)-@PERIOD(0Q)]-XIDOCQ [-4])))
Units Millions of dollars
This item includes discontinued operations.
This item excludes special items.
This item contains a Combined Figure data code (@CF) when ... 1. Extraordinary items and discontinued operations are combined with another data item either within or
outside the Operating Activities section for companies reporting a Statement of Cash Flows (Format Code = 7)
2. Extraordinary items and discontinued operations are presented in the Use section for companies reporting a Working Capital Statement (Format Code = 1), a Cash by Source and Use of Funds Statement (Format Code = 2), or a Cash Statement by Activity (Format Code = 3)
This item is not available for banks or utilities.
12-Month Moving When the 4th quarter is the current period, this concept returns Extraordinary Items and Discontinued Operations - Source & Use – Quarterly, which contains 12 months of period data from the Statement of Cash Flows.
In the 1st-3rd quarters, this concept calculates a 12-month moving figure by adding:
+ the quarterly figure in the current quarter + the 4th quarter figure from the prior year – the quarterly figure from 4 quarters ago .
For example, when the current period is 3rd quarter this concept adds 9 months of period data in 3rd quarter of the current year, plus 12 months of period data from 4th quarter last year, minus 9 months of period data from 3rd quarter last year, which equals 12 months of data (9 months from the current year plus 3 months from the prior year).
Financing Activities - Net Cash Flow Mnemonic FINCF
Statement Statement of Cash Flows
Annual Data Item Number A313
Units Millions of dollars
This item represents cash paid or received for all transactions classified as Financing Activities on a Statement of Cash Flows (Format Code = 7).
This item contains a Not Available data code (@NA) for companies reporting a Working Capital Statement (Format Code = 1), a Cash by Source and Use of Funds Statement (Format Code = 2), or a Cash Statement by Activity (Format Code = 3).

791
Chapter 25 Statement of Cash Flows/Statement of Changes
Increases in cash from financing activities are presented as positive numbers. Decreases are presented as negative numbers.
This item is not available for banks or utilities.
Financing Activities - Net Cash Flow - Quarterly Mnemonic FINCFQ
Statement Statement of Cash Flows
Quarterly Data Item Number Q113
Units Millions of dollars
Important! Statement of Cash Flow quarterly items contain period data. If you’re looking at data for the 1st quarter of a company, you’re seeing 3 months of information. If you’re looking at the 2nd quarter, you’re seeing 6 months of information. The 3rd quarter contains 9 months of information and the 4th quarter contains 12 months of information.
This item represents cash paid or received for all transactions classified as Financing Activities on a Statement of Cash Flows (Format Code = 7).
This item contains a Not Available data code (@NA) for companies reporting a Working Capital Statement (Format Code = 1), a Cash by Source and Use of Funds Statement (Format Code = 2), or a Cash Statement by Activity (Format Code = 3).
Increases in cash from financing activities are presented as positive numbers. Decreases are presented as negative numbers.
This item is not available for banks or utilities.
Data is presented on a historical basis.
Financing Activities - Net Cash Flow 12MM Mnemonic FINCF12
Concept calculation (@IF(@PERIOD(0Q)=4,FINCFQ,(FINCFQ+FINCFQ [@QTR(0Q)-@PERIOD(0Q)]-FINCFQ[-4])))
Units Millions of dollars
This item represents cash paid or received for all transactions classified as Financing Activities on a Statement of Cash Flows (Format Code = 7).
This item contains a Not Available data code (@NA) for companies reporting a Working Capital Statement (Format Code = 1), a Cash by Source and Use of Funds Statement (Format Code = 2), or a Cash Statement by Activity (Format Code = 3).
Increases in cash from financing activities are presented as positive numbers. Decreases are presented as negative numbers.
This item is not available for banks or utilities.
12-Month Moving When the 4th quarter is the current period, this concept returns Financing Activities - Net Cash Flow – Quarterly, which contains 12 months of period data from the Statement of Cash Flows.

Research Insight North America Data Guide
792
In the 1st-3rd quarters, this concept calculates a 12-month moving figure by adding:
+ the quarterly figure in the current quarter + the 4th quarter figure from the prior year – the quarterly figure from 4 quarters ago .
For example, when the current period is 3rd quarter this concept adds 9 months of period data in 3rd quarter of the current year, plus 12 months of period data from 4th quarter last year, minus 9 months of period data from 3rd quarter last year, which equals 12 months of data (9 months from the current year plus 3 months from the prior year).
Financing Activities - Other Mnemonic FIAO
Statement Statement of Cash Flows
Annual Data Item Number A312
Units Millions of dollars
This item represents data within the Financing Activities section on a Statement of Cash Flows (Format Code = 7).
This item contains a Not Available data code (@NA) for companies reporting a Working Capital Statement (Format Code = 1), a Cash by Source and Use of Funds Statement (Format Code = 2), or a Cash Statement by Activity (Format Code = 3).
This item includes 1. Adjustments relating to capital surplus or retained earnings presented apart from capital stock
changes
2. Extraordinary items presented in the Financing Activities section for a company reporting a Statement of Cash Flows (Format Code = 7)
3. Combined components presented within the Financing Activities section except for net items listed under exclusion
4. Foreign currency exchange effects reported in the Financing Activities for a company reporting a Statement of Cash Flows (Format Code = 7)
This items excludes 1. Miscellaneous changes presented outside the Financing Activities section
2. Net change in debt
3. Net change in stock
4. Long-term and short-term debt combined
Increases in cash are presented as positive numbers. Decreases are negative.
This item is not available for banks or utilities.
Financing Activities - Other - Quarterly Mnemonic FIAOQ

793
Chapter 25 Statement of Cash Flows/Statement of Changes
Statement Statement of Cash Flows
Quarterly Data Item Number Q112
Units Millions of dollars
Important! Statement of Cash Flow quarterly items contain period data. If you’re looking at data for the 1st quarter of a company, you’re seeing 3 months of information. If you’re looking at the 2nd quarter, you’re seeing 6 months of information. The 3rd quarter contains 9 months of information and the 4th quarter contains 12 months of information.
This item represents data within the Financing Activities section on a Statement of Cash Flows (Format Code = 7).
This item contains a Not Available data code (@NA) for companies reporting a Working Capital Statement (Format Code = 1), a Cash by Source and Use of Funds Statement (Format Code = 2), or a Cash Statement by Activity (Format Code = 3).
This item includes 1. Adjustments relating to capital surplus or retained earnings presented apart from capital stock
changes
2. Extraordinary items presented in the Financing Activities section for a company reporting a Statement of Cash Flows (Format Code = 7)
3. Combined components presented within the Financing Activities section except for net items listed under exclusion
4. Foreign currency exchange effects reported in the Financing Activities for a company reporting a Statement of Cash Flows (Format Code = 7)
This items excludes 1. Miscellaneous changes presented outside the Financing Activities section
2. Net change in debt
3. Net change in stock
4. Long-term and short-term debt combined
Increases in cash are presented as positive numbers. Decreases are negative.
This item is not available for banks or utilities.
Data is presented on a historical basis.
Financing Activities - Other 12MM Mnemonic FIAO12
Concept calculation (@IF(@PERIOD(0Q)=4,FIAOQ,(FIAOQ+FIAOQ [@QTR(0Q)-@PERIOD(0Q)]-FIAOQ[-4])))
Units Millions of dollars
This item represents data within the Financing Activities section on a Statement of Cash Flows (Format Code = 7).

Research Insight North America Data Guide
794
This item contains a Not Available data code (@NA) for companies reporting a Working Capital Statement (Format Code = 1), a Cash by Source and Use of Funds Statement (Format Code = 2), or a Cash Statement by Activity (Format Code = 3).
This item includes 1. Adjustments relating to capital surplus or retained earnings presented apart from capital stock
changes
2. Extraordinary items presented in the Financing Activities section for a company reporting a Statement of Cash Flows (Format Code = 7)
3. Combined components presented within the Financing Activities section except for net items listed under exclusion
4. Foreign currency exchange effects reported in the Financing Activities for a company reporting a Statement of Cash Flows (Format Code = 7)
This items excludes 1. Miscellaneous changes presented outside the Financing Activities section
2. Net change in debt
3. Net change in stock
4. Long-term and short-term debt combined
Increases in cash are presented as positive numbers. Decreases are negative.
This item is not available for banks or utilities.
12-Month Moving When the 4th quarter is the current period, this concept returns Financing Activities – Other - Quarterly, which contains 12 months of period data from the Statement of Cash Flows.
In the 1st-3rd quarters, this concept calculates a 12-month moving figure by adding:
+ the quarterly figure in the current quarter + the 4th quarter figure from the prior year – the quarterly figure from 4 quarters ago .
For example, when the current period is 3rd quarter this concept adds 9 months of period data in 3rd quarter of the current year, plus 12 months of period data from 4th quarter last year, minus 9 months of period data from 3rd quarter last year, which equals 12 months of data (9 months from the current year plus 3 months from the prior year).
Format Code Mnemonic SCF
Statement Statement of Cash Flows/Statement of Changes
Annual Data Item Number A318
Units Code
This code represents the format used by a company to report either its Statement of Changes or Statement of Cash Flows.

795
Chapter 25 Statement of Cash Flows/Statement of Changes
This item contains a Not Available data code (@NA) if a company does not report a Statement of Changes or Statement of Cash Flows.
This item is available from 1971 forward for companies in which Format Code = 1 or 2. It is available from 1984 or 1987 forward for companies reporting a Cash Statement by Activity (Format Code = 3) or a Statement of Cash Flows (Format Code = 7) respectively.
Prior to 1984, a Cash Statement by Activity (Format Code = 3) will be coded as a Cash by Source and Use of Funds (Format Code = 2) since the differentiation in cash formats was not broken out until 1984.
All Canadian companies began reporting a Statement of Cash Flows (Format Code = 7) in the first quarter of 1999 to comply with standards set by the Canadian Institute of Chartered Accountants’ (CICA).
Code Format Code
1 Working Capital Statement
2 Cash Statement by Source and Use of Funds
3 Cash Statement by Activity
4 Other
5 Net Liquid Funds/Net Funds by Source & Use
7 Statement of Cash Flows
Format Code - Quarterly Mnemonic SCFQ
Statement Statement of Cash Flows/Statement of Changes
Units Code
This code represents the format used by a company to report either its Statement of Changes or Statement of Cash Flows.
This item contains a Not Available data code (@NA) if a company does not report a Statement of Changes or Statement of Cash Flows.
This item is available from 1971 forward for companies in which Format Code = 1 or 2. It is available from 1984 or 1987 forward for companies reporting a Cash Statement by Activity (Format Code = 3) or a Statement of Cash Flows (Format Code = 7) respectively.
Prior to 1984, a Cash Statement by Activity (Format Code = 3) will be coded as a Cash by Source and Use of Funds (Format Code = 2) as the differentiation in cash formats was not broken out until 1984.
Code Format Code
1 Working Capital Statement
2 Cash Statement by Source and Use of Funds
3 Cash Statement by Activity
4 Other
7 Statement of Cash Flows

Research Insight North America Data Guide
796
Funds From Operations - Other Mnemonic FOPO
Annual Data Item Number A217
Units Millions of dollars
This item represents items not specifically included in another category within the Operations section of a Working Capital Statement (Format Code = 7), a Cash by Source and Use of Funds Statement (Format Code = 2), or within the Operating Activities section on a Cash Statement by Activity (Format Code = 3), or a Statement of Cash Flows (Format Code = 7).
This item includes 1. Amortization of negative intangibles
2. Minority interest (reported in operations)
3. Special items
4. Amortization of goodwill on unconsolidated subsidiaries
5. Provision for losses on accounts receivable
6. Unrealized gains/losses on sale of property, plant and equipment
This item excludes 1. Cash dividends
2. Changes in operating asset/liability accounts on a Statement of Cash Flows (Format Code = 7)
3. Realized gains/losses on sale of property, plant and equipment
This item is not available for banks or utilities.
Funds From Operations - Other - Quarterly Mnemonic FOPOQ
Quarterly Data Item Number Q81
Units Millions of dollars
Important! Statement of Cash Flow quarterly items contain period data. If you’re looking at data for the 1st quarter of a company, you’re seeing 3 months of information. If you’re looking at the 2nd quarter, you’re seeing 6 months of information. The 3rd quarter contains 9 months of information and the 4th quarter contains 12 months of information.
This item represents items not specifically included in another category within the Operations section of a Working Capital Statement (Format Code = 7), a Cash by Source and Use of Funds Statement (Format Code = 2), or within the Operating Activities section on a Cash Statement by Activity (Format Code = 3), or a Statement of Cash Flows (Format Code = 7).
This item includes
1. Amortization of negative intangibles 2. Minority interest (reported in operations)
3. Special items

797
Chapter 25 Statement of Cash Flows/Statement of Changes
4. Amortization of goodwill on unconsolidated subsidiaries
5. Provision for losses on accounts receivable
6. Unrealized gains/losses on sale of property, plant, and equipment
This item excludes 1. Cash dividends
2. Changes in operating asset/liability accounts on a Statement of Cash Flows (Format Code = 7)
3. Realized gains/losses on sale of property, plant, and equipment
This item is not available for banks or utilities.
Data is presented on a historical basis.
Funds from Operations - Other 12MM Mnemonic FOPO12
Concept calculation (@IF(@PERIOD(0Q)=4,FOPOQ,(FOPOQ+FOPOQ [@QTR(0Q)-@PERIOD(0Q)]-FOPOQ[-4])))
Units Millions of dollars
This item represents items not specifically included in another category within the Operations section of a Working Capital Statement (Format Code = 7), a Cash by Source and Use of Funds Statement (Format Code = 2), or within the Operating Activities section on a Cash Statement by Activity (Format Code = 3), or a Statement of Cash Flows (Format Code = 7).
This item includes 1. Amortization of negative intangibles
2. Minority interest (reported in operations)
3. Special items
4. Amortization of goodwill on unconsolidated subsidiaries
5. Provision for losses on accounts receivable
6. Unrealized gains/losses on sale of property, plant and equipment
This item excludes 1. Cash dividends
2. Changes in operating asset/liability accounts on a Statement of Cash Flows (Format Code = 7)
3. Realized gains/losses on sale of property, plant and equipment
This item is not available for banks or utilities.
12-Month Moving When the 4th quarter is the current period, this concept returns Funds from Operations - Other – Quarterly, which contains 12 months of period data from the Statement of Cash Flows.
In the 1st-3rd quarters, this concept calculates a 12-month moving figure by adding:
+ the quarterly figure in the current quarter + the 4th quarter figure from the prior year – the quarterly figure from 4 quarters ago .

Research Insight North America Data Guide
798
For example, when the current period is 3rd quarter this concept adds 9 months of period data in 3rd quarter of the current year, plus 12 months of period data from 4th quarter last year, minus 9 months of period data from 3rd quarter last year, which equals 12 months of data (9 months from the current year plus 3 months from the prior year).
Funds From Operations - Total Mnemonic FOPT
Statement Statement of Cash Flows/Statement of Changes
Annual Data Item Number A110
Units Millions of dollars
This item represents adjusted funds received from operations and includes extraordinary items and discontinued operations reported as a source of funds for statements in which the Format Code = 1, 2, or 3.
This item contains a Not Available data code (@NA) for a company reporting a Statement of Cash Flows (Format Code = 7).
This item includes 1. Extraordinary items and discontinued operations reported as a source of funds
2. Components of the change in working capital reported in the operations section when not grouped together or reported as one total
This item excludes changes in working capital items when reported either as one total or when grouped together on either a Cash by Source and Use of Funds Statement (Format Code = 2) or a Cash Statement by Activity (Format Code = 3).
This item is not available for banks or utilities.
Funds From Operations - Total - Quarterly Mnemonic FOPTQ
Statement Statement of Cash Flows/Statement of Changes
Quarterly Data Item Number Q82
Units Millions of dollars
Important! Statement of Cash Flow quarterly items contain period data. If you’re looking at data for the 1st quarter of a company, you’re seeing 3 months of information. If you’re looking at the 2nd quarter, you’re seeing 6 months of information. The 3rd quarter contains 9 months of information and the 4th quarter contains 12 months of information.
This item represents adjusted funds received from operations and includes extraordinary items and discontinued operations reported as a source of funds for statements in which the Format Code = 1, 2, or 3.

799
Chapter 25 Statement of Cash Flows/Statement of Changes
This item contains a Not Available data code (@NA) for a company reporting a Statement of Cash Flows (Format Code = 7).
This item includes
1. Extraordinary items and discontinued operations reported as a source of funds 2. Components of the change in working capital reported in the operations section when not grouped
together or reported as one total
This item excludes changes in working capital items when reported either as one total or when grouped together on either a Cash by Source and Use of Funds Statement (Format Code = 2) or a Cash Statement by Activity (Format Code = 3).
This item is not available for banks or utilities.
Data is presented on a historical basis.
Funds from Operations - Total 12MM Mnemonic FOPT12
Concept calculation (@IF(@PERIOD(0Q)=4,FOPTQ,(FOPTQ+FOPTQ [@QTR(0Q)-@PERIOD(0Q)]-FOPTQ[-4])))
Units Millions of dollars
This item represents adjusted funds received from operations and includes extraordinary items and discontinued operations reported as a source of funds for statements in which the Format Code = 1, 2, or 3.
This item contains a Not Available data code (@NA) for a company reporting a Statement of Cash Flows (Format Code = 7).
This item includes 1. Extraordinary items and discontinued operations reported as a source of funds
2. Components of the change in working capital reported in the operations section when not grouped together or reported as one total
This item excludes changes in working capital items when reported either as one total or when grouped together on either a Cash by Source and Use of Funds Statement (Format Code = 2) or a Cash Statement by Activity (Format Code = 3).
This item is not available for banks or utilities.
12-Month Moving When the 4th quarter is the current period, this concept returns Funds from Operations - Total – Quarterly, which contains 12 months of period data from the Statement of Cash Flows.
In the 1st-3rd quarters, this concept calculates a 12-month moving figure by adding:
+ the quarterly figure in the current quarter + the 4th quarter figure from the prior year – the quarterly figure from 4 quarters ago .
For example, when the current period is 3rd quarter this concept adds 9 months of period data in 3rd quarter of the current year, plus 12 months of period data from 4th quarter last year, minus 9 months of period data from 3rd quarter last year, which equals 12 months of data (9 months from the current year plus 3 months from the prior year).

Research Insight North America Data Guide
800
Income Before Extraordinary Items Mnemonic IBC
Statement Statement of Cash Flows/Statement of Changes
Annual Data Item Number A123
Units Millions of dollars
This item represents the income of a company after all expenses - including special items, income taxes, and minority interest but before provisions for either common and/or preferred dividends and before extraordinary items and discontinued operations.
This item excludes the effect of extraordinary items and/or discontinued operations.
This item is not available for banks or utilities.
Income Before Extraordinary Items - Quarterly Mnemonic IBCQ
Statement Statement of Cash Flows/Statement of Changes
Quarterly Data Item Number Q76
Units Millions of dollars
Important! Statement of Cash Flow quarterly items contain period data. If you’re looking at data for the 1st quarter of a company, you’re seeing 3 months of information. If you’re looking at the 2nd quarter, you’re seeing 6 months of information. The 3rd quarter contains 9 months of information and the 4th quarter contains 12 months of information.
This item represents the income of a company after all expenses - including special items, income taxes, and minority interest but before provisions for either common and/or preferred dividends and before extraordinary items and discontinued operations.
This item excludes the effect of extraordinary items and/or discontinued operations.
This item is not available for banks or utilities.
Data is presented on a historical basis.
Income Before Extraordinary Items - 12MM Mnemonic IBC12
Concept calculation (@IF(@PERIOD(0Q)=4,IBCQ,(IBCQ+IBCQ[@QTR (0Q)-@PERIOD(0Q)]-IBCQ[-4])))
Units Millions of dollars

801
Chapter 25 Statement of Cash Flows/Statement of Changes
This item represents the income of a company after all expenses - including special items, income taxes, and minority interest but before provisions for either common and/or preferred dividends and before extraordinary items and discontinued operations.
This item excludes the effect of extraordinary items and/or discontinued operations.
This item is not available for banks or utilities.
12-Month Moving When the 4th quarter is the current period, this concept returns Income Before Extraordinary Items - Source & Use – Quarterly, which contains 12 months of period data from the Statement of Cash Flows.
In the 1st-3rd quarters, this concept calculates a 12-month moving figure by adding:
+ the quarterly figure in the current quarter + the 4th quarter figure from the prior year – the quarterly figure from 4 quarters ago .
For example, when the current period is 3rd quarter this concept adds 9 months of period data in 3rd quarter of the current year, plus 12 months of period data from 4th quarter last year, minus 9 months of period data from 3rd quarter last year, which equals 12 months of data (9 months from the current year plus 3 months from the prior year).
Income Taxes - Accrued - Increase (Decrease) Mnemonic TXACH
Statement Statement of Cash Flows
Annual Data Item Number A305
Units Millions of dollars
This item represents increases or decreases in accrued income taxes as reported in the Indirect Operating Activities section on a statement of cash flows (Format Code = 7).
This item contains a Not Available data code (@NA) for companies reporting a working capital statement (Format Code = 1), a cash by source and use of funds statement (Format Code = 2), or a cash statement by activity (Format Code = 3).
This item includes increase (decrease) in: 1. Items included by Standard & Poor's in the balance sheet data item, Income Taxes Payable
2. Long-term income taxes payable
3. Taxes not classified by type
This item excludes increase (decrease) in: 1. Accrued taxes (when a separate accrued income tax number is reported)
2. Deferred taxes (current or long-term unless the deferred portion cannot be separated from taxes payable in the current year)
3. Income tax expense (benefit)
4. Income taxes paid
This item contains a Combined Figure data code (@CF) when: 1. Accrued income taxes are reported outside the Indirect Operating Activities section

Research Insight North America Data Guide
802
2. Changes in accrued income taxes are not reported on the statement of cash flows but the balance sheet shows change between the current and prior year
3. Some or all changes in accrued income taxes are combined with another asset or liability changes within the Indirect Operating Activities section
Increases in accrued income taxes are presented as positive numbers. Decreases are presented as negative numbers.
This item is not available for banks.
Income Taxes - Accrued - Increase (Decrease) - Quarterly Mnemonic TXACHQ
Statement Statement of Cash Flows
Quarterly Data Item Number Q106
Units Millions of dollars
Important! Statement of Cash Flow quarterly items contain period data. If you’re looking at data for the 1st quarter of a company, you’re seeing 3 months of information. If you’re looking at the 2nd quarter, you’re seeing 6 months of information. The 3rd quarter contains 9 months of information and the 4th quarter contains 12 months of information.
This item represents increases or decreases in accrued income taxes as reported in the Indirect Operating Activities section on a statement of cash flows (Format Code = 7).
This item contains a Not Available data code (@NA) for companies reporting a working capital statement (Format Code = 1), a cash by source and use of funds statement (Format Code = 2), or a cash statement by activity (Format Code = 3).
This item includes increase (decrease) in: 1. Items included by Standard & Poor's in the balance sheet data item, Income Taxes Payable
2. Long-term income taxes payable
3. Taxes not classified by type
This item excludes increase (decrease) in: 1. Accrued taxes (when a separate accrued income tax number is reported)
2. Deferred taxes (current or long-term unless the deferred portion cannot be separated from taxes payable in the current year)
3. Income tax expense (benefit)
4. Income taxes paid
This item contains a Combined Figure data code (@CF) when: 1. Accrued income taxes are reported outside the Indirect Operating Activities section
2. Changes in accrued income taxes are not reported on the statement of cash flows but the balance sheet shows change between the current and prior year
3. Some or all changes in accrued income taxes are combined with another asset or liability changes within the Indirect Operating Activities section

803
Chapter 25 Statement of Cash Flows/Statement of Changes
Increases in accrued income taxes are presented as positive numbers. Decreases are presented as negative numbers.
This item is not available for banks.
Data is presented on a historical basis.
Income Tax - Accrued - Increase (Decrease) 12MM Mnemonic TXACH12
Concept calculation (@IF(@PERIOD(0Q)=4,TXACHQ,(TXACHQ+ TXACHQ[@QTR(0Q)-@PERIOD(0Q)]-TXACHQ [-4])))
Units Millions of dollars
This item represents increases or decreases in accrued income taxes as reported in the Indirect Operating Activities section on a statement of cash flows (Format Code = 7).
This item contains a Not Available data code (@NA) for companies reporting a working capital statement (Format Code = 1), a cash by source and use of funds statement (Format Code = 2), or a cash statement by activity (Format Code = 3).
This item includes increase (decrease) in: 1. Items included by Standard & Poor's in the balance sheet data item, Income Taxes Payable
2. Long-term income taxes payable
3. Taxes not classified by type
This item excludes increase (decrease) in: 1. Accrued taxes (when a separate accrued income tax number is reported)
2. Deferred taxes (current or long-term unless the deferred portion cannot be separated from taxes payable in the current year)
3. Income tax expense (benefit)
4. Income taxes paid
This item contains a Combined Figure data code (@CF) when:
Accrued income taxes are reported outside the Indirect Operating Activities section
Changes in accrued income taxes are not reported on the statement of cash flows but the balance sheet shows change between the current and prior year
Some or all changes in accrued income taxes are combined with another asset or liability changes within the Indirect Operating Activities section
Increases in accrued income taxes are presented as positive numbers. Decreases are presented as negative numbers.
This item is not available for banks.
12-Month Moving When the 4th quarter is the current period, this concept returns Income Tax - Accrued - Increase (Decrease) – Quarterly, which contains 12 months of period data from the Statement of Cash Flows.
In the 1st-3rd quarters, this concept calculates a 12-month moving figure by adding:

Research Insight North America Data Guide
804
+ the quarterly figure in the current quarter + the 4th quarter figure from the prior year – the quarterly figure from 4 quarters ago .
For example, when the current period is 3rd quarter this concept adds 9 months of period data in 3rd quarter of the current year, plus 12 months of period data from 4th quarter last year, minus 9 months of period data from 3rd quarter last year, which equals 12 months of data (9 months from the current year plus 3 months from the prior year).
Income Taxes Paid Mnemonic TXPD
Statement Statement of Cash Flows
Annual Data Item Number A317
Units Millions of dollars
This item represents cash payments for income taxes to federal, state, local and foreign governments as reported by a company that has adopted FASB #95.
This item contains a Not Available data code (@NA) for companies reporting a Working Capital Statement (Format Code = 1), a Cash by Source and Use of Funds Statement (Format Code = 2), or a Cash Statement by Activity (Format Code = 3).
This item includes 1. Cash paid for income taxes applicable to both current and prior years
2. Net income taxes paid
This item excludes 1. Changes in deferred taxes reported on the Income Statement or Balance Sheet
2. Income tax expense
3. Tax refunds reported separately
This item contains a Combined Figure data code (@CF) when ... 1. A company uses the Direct Method for reporting its Statement of Cash Flows and income taxes
cannot be separated from other payments or receipts
2. Income taxes paid are not presented on the face of the statement or in a note
This item contains a Not Available data code (@NA) on a Statement of Cash Flows when income taxes paid are not presented on the face of the statement or in the notes.
Income Taxes Paid - Quarterly Mnemonic TXPDQ
Statement Statement of Cash Flows
Quarterly Data Item Number Q116
Units Millions of dollars

805
Chapter 25 Statement of Cash Flows/Statement of Changes
Important! Statement of Cash Flow quarterly items contain period data. If you’re looking at data for the 1st quarter of a company, you’re seeing 3 months of information. If you’re looking at the 2nd quarter, you’re seeing 6 months of information. The 3rd quarter contains 9 months of information and the 4th quarter contains 12 months of information.
This item represents cash payments for income taxes to federal, state, local, and foreign governments as reported by a company that has adopted FASB #95.
This item contains a Not Available data code (@NA) for companies reporting a Working Capital Statement (Format Code = 1), a Cash by Source and Use of Funds Statement (Format Code = 2), or a Cash Statement by Activity (Format Code = 3).
This item includes 1. Cash paid for income taxes applicable to both current and prior years
2. Net income taxes paid
This item excludes 1. Changes in deferred taxes reported on the Income Statement or Balance Sheet
2. Income tax expense
3. Tax refunds reported separately
This item contains a Combined Figure data code (@CF) when ... 1. A company uses the Direct Method for reporting its Statement of Cash Flows and income taxes
cannot be separated from other payments or receipts
2. Income taxes paid are not presented on the face of the statement or in a note
This item contains a Not Available data code (@NA) on a Statement of Cash Flows when income taxes paid are not presented on the face of the statement or in the notes.
Data is presented on a historical basis.
Income Taxes Paid 12MM Mnemonic TXPD12
Concept calculation (@IF(@PERIOD(0Q)=4,TXPDQ,(TXPDQ+TXPDQ [@QTR(0Q)-@PERIOD(0Q)]-TXPDQ[-4])))
Units Millions of dollars
This item represents cash payments for income taxes to federal, state, local and foreign governments as reported by a company that has adopted FASB #95.
This item contains a Not Available data code (@NA) for companies reporting a Working Capital Statement (Format Code = 1), a Cash by Source and Use of Funds Statement (Format Code = 2), or a Cash Statement by Activity (Format Code = 3).
This item includes 1. Cash paid for income taxes applicable to both current and prior years
2. Net income taxes paid
This item excludes 1. Changes in deferred taxes reported on the Income Statement or Balance Sheet

Research Insight North America Data Guide
806
2. Income tax expense
3. Tax refunds reported separately
This item contains a Combined Figure data code (@CF) when ... 1. A company uses the Direct Method for reporting its Statement of Cash Flows and income taxes
cannot be separated from other payments or receipts
2. Income taxes paid are not presented on the face of the statement or in a note
This item contains a Not Available data code (@NA) on a Statement of Cash Flows when income taxes paid are not presented on the face of the statement or in the notes.
12-Month Moving When the 4th quarter is the current period, this concept returns Income Taxes Paid – Quarterly, which contains 12 months of period data from the Statement of Cash Flows.
In the 1st-3rd quarters, this concept calculates a 12-month moving figure by adding:
+ the quarterly figure in the current quarter + the 4th quarter figure from the prior year – the quarterly figure from 4 quarters ago .
For example, when the current period is 3rd quarter this concept adds 9 months of period data in 3rd quarter of the current year, plus 12 months of period data from 4th quarter last year, minus 9 months of period data from 3rd quarter last year, which equals 12 months of data (9 months from the current year plus 3 months from the prior year).
Interest Paid - Net of Capitalized Interest Mnemonic INTPN
Statement Statement of Cash Flows
Annual Data Item Number A315
Units Millions of dollars
This item represents cash payments by the company to finance short- and long-term debt as represented by a company that has adopted FASB #95.
This item contains a Not Available data code (@NA) for companies reporting a Working Capital Statement (Format Code = 1), a Cash by Source and Use of Funds (Format Code = 2), or a Cash Statement by Activity (Format Code = 3).
This item excludes 1. Accrued interest
2. Capitalized interest
3. Interest expense
4. Interest received
This item contains a Not Available data code (@NA) on a Statement of Cash Flows (Format Code = 7) when net interest is not presented on the face of the statement or in the notes. 1. A company uses the Direct Method for reporting its Statement of Cash Flows and income taxes
cannot be separated from other payments or receipts
2. Income taxes paid are not presented on the face of the statement or in the notes

807
Chapter 25 Statement of Cash Flows/Statement of Changes
Interest Paid - Net of Capitalized Interest - Quarterly Mnemonic INTPNQ
Statement Statement of Cash Flows
Quarterly Data Item Number Q115
Units Millions of dollars
Important! Statement of Cash Flow quarterly items contain period data. If you’re looking at data for the 1st quarter of a company, you’re seeing 3 months of information. If you’re looking at the 2nd quarter, you’re seeing 6 months of information. The 3rd quarter contains 9 months of information and the 4th quarter contains 12 months of information.
This item represents cash payments by the company to finance short- and long-term debt as represented by a company that has adopted FASB #95.
This item contains a Not Available data code (@NA) for companies reporting a Working Capital Statement (Format Code = 1), a Cash by Source and Use of Funds (Format Code = 2), or a Cash Statement by Activity (Format Code = 3).
This item excludes
1. Accrued interest 2. Capitalized interest
3. Interest expense
4. Interest received
This item contains a Not Available data code (@NA) on a Statement of Cash Flows (Format Code = 7) when net interest is not presented on the face of the statement or in the notes. 1. A company uses the Direct Method for reporting its Statement of Cash Flows and income taxes
cannot be separated from other payments or receipts
2. Income taxes paid are not presented on the face of the statement or in the notes
Interest Paid - Net Capitalized Interest 12MM Mnemonic INTPN12
Concept calculation (@IF(@PERIOD(0Q)=4,INTPNQ,(INTPNQ+ INTPNQ[@QTR(0Q)-@PERIOD(0Q)]-INTPNQ[-4])))
Units Millions of dollars
This item represents cash payments by the company to finance short- and long-term debt as represented by a company that has adopted FASB #95.
This item contains a Not Available data code (@NA) for companies reporting a Working Capital Statement (Format Code = 1), a Cash by Source and Use of Funds (Format Code = 2), or a Cash Statement by Activity (Format Code = 3).
This item excludes 1. Accrued interest

Research Insight North America Data Guide
808
2. Capitalized interest
3. Interest expense
4. Interest received
This item contains a Not Available data code (@NA) on a Statement of Cash Flows (Format Code = 7) when net interest is not presented on the face of the statement or in the notes. 1. A company uses the Direct Method for reporting its Statement of Cash Flows and income taxes
cannot be separated from other payments or receipts
2. Income taxes paid are not presented on the face of the statement or in the notes
12-Month Moving When the 4th quarter is the current period, this concept returns Interest Paid Net Capitalized Interest – Quarterly, which contains 12 months of period data from the Statement of Cash Flows.
In the 1st-3rd quarters, this concept calculates a 12-month moving figure by adding:
+ the quarterly figure in the current quarter + the 4th quarter figure from the prior year – the quarterly figure from 4 quarters ago .
For example, when the current period is 3rd quarter this concept adds 9 months of period data in 3rd quarter of the current year, plus 12 months of period data from 4th quarter last year, minus 9 months of period data from 3rd quarter last year, which equals 12 months of data (9 months from the current year plus 3 months from the prior year).
Inventory - Decrease (Increase) Mnemonic INVCH
Statement Statement of Cash Flows
Annual Data Item Number A303
Units Millions of dollars
This item represents increases or decreases in inventories as reported in the Operating Activities section on a Statement of Cash Flows (Format Code = 7).
This item contains a Not Available data code (@NA) for companies reporting a Working Capital Statement (Format Code = 1), a Cash by Source and Use of Funds Statement (Format Code = 2), or a Cash Statement by Activity (Format Code = 3).
This item includes increases and decreases in ... 1. All current assets classified by Standard & Poor's as inventories
2. Contracts in progress and costs in excess of related billings when included by Standard & Poor's in inventories on the Balance Sheet
3. Long-term inventories when included by the company in the Operating Activities section
This item excludes increases and decreases in long-term inventories when included by the company in the Investing Activities section.
This item contains a Combined Figure data code (@CF) when ... 1. This item is combined with another asset or liability in the Operating Activities section (included in
Assets and Liabilities - Other - Net Change)

809
Chapter 25 Statement of Cash Flows/Statement of Changes
2. The change in inventories is reported outside the Operating Activities section
3. Changes in inventory are not reported on the Statement of Cash Flows but the Balance Sheet shows a change between the current and prior year
Increases in inventories are presented as negative numbers. Decreases are positive numbers.
This item is not available for banks or utilities.
Inventory - Decrease (Increase) Mnemonic INVCHQ
Statement Statement of Cash Flows
Quarterly Data Item Number Q104
Units Millions of dollars
Important! Statement of Cash Flow quarterly items contain period data. If you’re looking at data for the 1st quarter of a company, you’re seeing 3 months of information. If you’re looking at the 2nd quarter, you’re seeing 6 months of information. The 3rd quarter contains 9 months of information and the 4th quarter contains 12 months of information.
This item represents increases or decreases in inventories as reported in the Operating Activities section on a Statement of Cash Flows (Format Code = 7).
This item contains a Not Available data code (@NA) for companies reporting a Working Capital Statement (Format Code = 1), a Cash by Source and Use of Funds Statement (Format Code = 2), or a Cash Statement by Activity (Format Code = 3).
This item includes increases and decreases in ... 1. All current assets classified by Standard & Poor's as inventories
2. Contracts in progress and costs in excess of related billings when included by Standard & Poor's in inventories on the Balance Sheet
3. Long-term inventories when included by the company in the Operating Activities section
This item excludes increases and decreases in long-term inventories when included by the company in the Investing Activities section.
This item contains a Combined Figure data code (@CF) when ... 1. This item is combined with another asset or liability in the Operating Activities section (included in
Assets and Liabilities - Other - Net Change)
2. The change in inventories is reported outside the Operating Activities section
3. Changes in inventory are not reported on the Statement of Cash Flows but the Balance Sheet shows a change between the current and prior year
Increases in inventories are presented as negative numbers. Decreases are positive numbers.
This item is not available for banks or utilities.
Data is presented on a historical basis.

Research Insight North America Data Guide
810
Inventory Decrease (Increase) 12MM Mnemonic INVCH12
Concept calculation (@IF(@PERIOD(0Q)=4,INVCHQ,(INVCHQ+ INVCHQ[@QTR(0Q)-@PERIOD(0Q)]-INVCHQ [-4])))
Units Millions of dollars
This item represents increases or decreases in inventories as reported in the Operating Activities section on a Statement of Cash Flows (Format Code = 7).
This item contains a Not Available data code (@NA) for companies reporting a Working Capital Statement (Format Code = 1), a Cash by Source and Use of Funds Statement (Format Code = 2), or a Cash Statement by Activity (Format Code = 3).
This item includes increases and decreases in ... 1. All current assets classified by Standard & Poor's as inventories
2. Contracts in progress and costs in excess of related billings when included by Standard & Poor's in inventories on the Balance Sheet
3. Long-term inventories when included by the company in the Operating Activities section
This item excludes increases and decreases in long-term inventories when included by the company in the Investing Activities section.
This item contains a Combined Figure data code (@CF) when ... 1. This item is combined with another asset or liability in the Operating Activities section (included in
Assets and Liabilities - Other - Net Change)
2. The change in inventories is reported outside the Operating Activities section
3. Changes in inventory are not reported on the Statement of Cash Flows but the Balance Sheet shows a change between the current and prior year
Increases in inventories are presented as negative numbers. Decreases are positive numbers.
This item is not available for banks or utilities.
12-Month Moving When the 4th quarter is the current period, this concept returns Inventory Decrease (Increase) – Quarterly, which contains 12 months of period data from the Statement of Cash Flows.
In the 1st-3rd quarters, this concept calculates a 12-month moving figure by adding:
+ the quarterly figure in the current quarter + the 4th quarter figure from the prior year – the quarterly figure from 4 quarters ago .
For example, when the current period is 3rd quarter this concept adds 9 months of period data in 3rd quarter of the current year, plus 12 months of period data from 4th quarter last year, minus 9 months of period data from 3rd quarter last year, which equals 12 months of data (9 months from the current year plus 3 months from the prior year).

811
Chapter 25 Statement of Cash Flows/Statement of Changes
Investing Activities - Net Cash Flow 12MM Mnemonic IVNCF
Statement Statement of Cash Flows
Annual Data Item Number A311
Units Millions of dollars
This item represents net cash received or paid for all transactions classified as investing activities on a Statement of Cash Flows (Format Code = 7).
This item contains a Not Available data code (@NA) for companies reporting a Working Capital Statement (Format Code = 1), a Cash by Source and Use of Funds Statement (Format Code = 2), or a Cash Statement by Activity (Format Code = 3).
Increases in cash are presented as positive numbers. Decreases in cash are reported as negative numbers.
This item is not available for banks or utilities.
Investing Activities - Net Cash Flow 12MM Mnemonic IVNCFQ
Statement Statement of Cash Flows
Quarterly Data Item Number Q111
Units Millions of dollars
Important! Statement of Cash Flow quarterly items contain period data. If you’re looking at data for the 1st quarter of a company, you’re seeing 3 months of information. If you’re looking at the 2nd quarter, you’re seeing 6 months of information. The 3rd quarter contains 9 months of information and the 4th quarter contains 12 months of information.
This item represents net cash received or paid for all transactions classified as investing activities on a Statement of Cash Flows (Format Code = 7).
This item contains a Not Available data code (@NA) for companies reporting a Working Capital Statement (Format Code = 1), a Cash by Source and Use of Funds Statement (Format Code = 2), or a Cash Statement by Activity (Format Code = 3).
Increases in cash are presented as positive numbers. Decreases in cash are reported as negative numbers.
This item is not available for banks or utilities.
Data is presented on a historical basis.
Investing Activities - Net Cash Flow 12MM Mnemonic IVNCF12

Research Insight North America Data Guide
812
Concept calculation (@IF(@PERIOD(0Q)=4,IVNCFQ,(IVNCFQ+ IVNCFQ[@QTR(0Q)-@PERIOD(0Q)]-IVNCFQ[-4])))
Units Millions of dollars
This item represents net cash received or paid for all transactions classified as investing activities on a Statement of Cash Flows (Format Code = 7).
This item contains a Not Available data code (@NA) for companies reporting a Working Capital Statement (Format Code = 1), a Cash by Source and Use of Funds Statement (Format Code = 2), or a Cash Statement by Activity (Format Code = 3).
Increases in cash are presented as positive numbers. Decreases in cash are reported as negative numbers.
This item is not available for banks or utilities.
12-Month Moving When the 4th quarter is the current period, this concept returns Investing Activities - Net Cash Flow – Quarterly, which contains 12 months of period data from the Statement of Cash Flows.
In the 1st-3rd quarters, this concept calculates a 12-month moving figure by adding:
+ the quarterly figure in the current quarter + the 4th quarter figure from the prior year – the quarterly figure from 4 quarters ago .
For example, when the current period is 3rd quarter this concept adds 9 months of period data in 3rd quarter of the current year, plus 12 months of period data from 4th quarter last year, minus 9 months of period data from 3rd quarter last year, which equals 12 months of data (9 months from the current year plus 3 months from the prior year).
Investing Activities - Other Mnemonic IVACO
Statement Statement of Cash Flows
Annual Data Item Number A310
Units Millions of dollars
This item represents miscellaneous items within the Investing Activities section on a Statement of Cash Flows (Format Code = 7).
This item contains a Not Available data code (@NA) for companies reporting a Working Capital Statement (Format Code = 1), a Cash by Source and Use of Funds Statement (Format Code = 2), or a Cash Statement by Activity (Format Code = 3).
This item includes 1. Combined investing activities
2. Foreign currency exchange effects within the Investing Activities section
3. Proceeds from sale of assets other than fixed assets or investments
This item excludes 1. Changes in investing activities reported outside the Investing Activities section
2. Change in investments

813
Chapter 25 Statement of Cash Flows/Statement of Changes
3. Change in property, plant, and equipment
Increases in investing activities will be presented as positive numbers. Decreases will be presented as negative numbers.
This item is not available for banks or utilities.
Investing Activities - Other - Quarterly Mnemonic IVACOQ
Statement Statement of Cash Flows
Quarterly Data Item Number Q110
Units Millions of dollars
Important! Statement of Cash Flow quarterly items contain period data. If you’re looking at data for the 1st quarter of a company, you’re seeing 3 months of information. If you’re looking at the 2nd quarter, you’re seeing 6 months of information. The 3rd quarter contains 9 months of information and the 4th quarter contains 12 months of information.
This item represents miscellaneous items within the Investing Activities section on a Statement of Cash Flows (Format Code = 7).
This item contains a Not Available data code (@NA) for companies reporting a Working Capital Statement (Format Code = 1), a Cash by Source and Use of Funds Statement (Format Code = 2), or a Cash Statement by Activity (Format Code = 3).
This item includes 1. Combined investing activities
2. Foreign currency exchange effects within the Investing Activities section
3. Proceeds from sale of assets other than fixed assets or investments
This item excludes 1. Changes in investing activities reported outside the Investing Activities section
2. Change in investments
3. Change in property, plant, and equipment
Increases in investing activities will be presented as positive numbers. Decreases will be presented as negative numbers.
This item is not available for banks or utilities.
Data is presented on a historical basis.
Investing Activities - Other - 12MM Mnemonic IVACO12
Concept calculation (@IF(@PERIOD(0Q)=4,IVACOQ,(IVACOQ+ IVACOQ[@QTR(0Q)-@PERIOD(0Q)]-IVACOQ [-4])))

Research Insight North America Data Guide
814
Units Millions of dollars
This item represents miscellaneous items within the Investing Activities section on a Statement of Cash Flows (Format Code = 7).
This item contains a Not Available data code (@NA) for companies reporting a Working Capital Statement (Format Code = 1), a Cash by Source and Use of Funds Statement (Format Code = 2), or a Cash Statement by Activity (Format Code = 3).
This item includes 1. Combined investing activities
2. Foreign currency exchange effects within the Investing Activities section
3. Proceeds from sale of assets other than fixed assets or investments
This item excludes 1. Changes in investing activities reported outside the Investing Activities section
2. Change in investments
3. Change in property, plant, and equipment
Increases in investing activities will be presented as positive numbers. Decreases will be presented as negative numbers.
This item is not available for banks or utilities.
12-Month Moving When the 4th quarter is the current period, this concept returns Investing Activities - Other – Quarterly, which contains 12 months of period data from the Statement of Cash Flows.
In the 1st-3rd quarters, this concept calculates a 12-month moving figure by adding:
+ the quarterly figure in the current quarter + the 4th quarter figure from the prior year – the quarterly figure from 4 quarters ago .
For example, when the current period is 3rd quarter this concept adds 9 months of period data in 3rd quarter of the current year, plus 12 months of period data from 4th quarter last year, minus 9 months of period data from 3rd quarter last year, which equals 12 months of data (9 months from the current year plus 3 months from the prior year).
Investments - Increase Mnemonic IVCH
Annual Data Item Number A113
Units Millions of dollars
This item represents funds used to increase a company's long-term investments.
This item includes 1. Increase in long-term receivables
2. Increase in investments in unconsolidated subsidiaries
3. Long-term investments combined with short-term investments
This item excludes

815
Chapter 25 Statement of Cash Flows/Statement of Changes
1. Additional investment in a company if the company is consolidated
2. Changes in notes receivable relating to Shareholders' Equity
This item contains a Combined Figure data code (@CF) when: 1. Decrease in investments is reported net of increase in investments
2. Increase in investments is combined with another item for a company reporting a Working Capital Statement (Format Code = 1), a Cash by Source and Use of Funds Statement (Format Code = 2), or a Cash Statement by Activity (Format Code = 3)
3. Investments - Increase is combined with another item either within or outside the Investing Activities section on a Statement of Cash Flows (Format Code = 7)
This item may include current receivables when a company reports an unclassified Balance Sheet.
This item is not available for banks or utilities.
Investments - Increase - Quarterly Mnemonic IVCHQ
Quarterly Data Item Number Q91
Units Millions of dollars
Important! Statement of Cash Flow quarterly items contain period data. If you’re looking at data for the 1st quarter of a company, you’re seeing 3 months of information. If you’re looking at the 2nd quarter, you’re seeing 6 months of information. The 3rd quarter contains 9 months of information and the 4th quarter contains 12 months of information.
This item represents funds used to increase a company's long-term investments.
This item includes 1. Increase in long-term receivables
2. Increase in investments in unconsolidated subsidiaries
3. Long-term investments combined with short-term investments
This item excludes 1. Additional investment in a company if the company is consolidated
2. Changes in notes receivable relating to Shareholders' Equity
This item contains a Combined Figure data code (@CF) when: 1. Decrease in investments is reported net of increase in investments
2. Increase in investments is combined with another item for a company reporting a Working Capital Statement (Format Code = 1), a Cash by Source and Use of Funds Statement (Format Code = 2), or a Cash Statement by Activity (Format Code = 3)
3. Investments - Increase is combined with another item either within or outside the Investing Activities section on a Statement of Cash Flows (Format Code = 7)
This item may include current receivables when a company reports an unclassified Balance Sheet.
This item is not available for banks or utilities.
Data is presented on a historical basis.

Research Insight North America Data Guide
816
Investments - Increase - 12MM Mnemonic IVCH12
Concept calculation (@IF(@PERIOD(0Q)=4,IVCHQ,(IVCHQ+IVCHQ [@QTR(0Q)-@PERIOD(0Q)]-IVCHQ[-4])))
Units Millions of dollars
This item represents funds used to increase a company's long-term investments.
This item includes 1. Increase in long-term receivables
2. Increase in investments in unconsolidated subsidiaries
3. Long-term investments combined with short-term investments
This item excludes 1. Additional investment in a company if the company is consolidated
2. Changes in notes receivable relating to Shareholders' Equity
This item contains a Combined Figure data code (@CF) when: 1. Decrease in investments is reported net of increase in investments
2. Increase in investments is combined with another item for a company reporting a Working Capital Statement (Format Code = 1), a Cash by Source and Use of Funds Statement (Format Code = 2), or a Cash Statement by Activity (Format Code = 3)
3. Investments - Increase is combined with another item either within or outside the Investing Activities section on a Statement of Cash Flows (Format Code = 7)
This item may include current receivables when a company reports an unclassified Balance Sheet.
This item is not available for banks or utilities.
12-Month Moving When the 4th quarter is the current period, this concept returns Increase in Investments – Quarterly, which contains 12 months of period data from the Statement of Cash Flows.
In the 1st-3rd quarters, this concept calculates a 12-month moving figure by adding:
+ the quarterly figure in the current quarter + the 4th quarter figure from the prior year – the quarterly figure from 4 quarters ago .
For example, when the current period is 3rd quarter this concept adds 9 months of period data in 3rd quarter of the current year, plus 12 months of period data from 4th quarter last year, minus 9 months of period data from 3rd quarter last year, which equals 12 months of data (9 months from the current year plus 3 months from the prior year).
Issuance of Long-Term Debt Mnemonic DLTIS
Annual Data Item Number A111
Units Millions of dollars

817
Chapter 25 Statement of Cash Flows/Statement of Changes
This item represents the amount of funds generated from issuance of long-term debt.
This item includes 1. Increase in long-term and short-term debt when combined
2. Long-term debt issued for or assumed in an acquisition
3. Proceeds from bonds, capitalized lease obligations, or note obligations
4. Reclassification of current debt to long-term debt
This item excludes changes in current debt when reported separately.
This item contains a Combined Figure data code (@CF) when ... 1. Long-Term Debt - Reduction is reported net of the reduction of long-term debt
2. Issuance of Long-Term Debt is combined with another item within the Financing Activities section on a Statement of Cash Flows (Format Code = 7)
3. Issuance of Long-Term Debt reported outside the Financing Activities section on a Statement of Cash Flows (Format Code = 7)
This item is not available for banks or utilities.
Issuance of Long-Term Debt - Quarterly Mnemonic DLTISQ
Statement Statement of Cash Flows/Statement of Changes
Quarterly Data Item Number Q86
Units Millions of dollars
Important! Statement of Cash Flow quarterly items contain period data. If you’re looking at data for the 1st quarter of a company, you’re seeing 3 months of information. If you’re looking at the 2nd quarter, you’re seeing 6 months of information. The 3rd quarter contains 9 months of information and the 4th quarter contains 12 months of information.
This item represents the amount of funds generated from issuance of long-term debt.
This item includes 1. Increase in long-term and short-term debt when combined
2. Long-term debt issued for or assumed in an acquisition
3. Proceeds from bonds, capitalized lease obligations, or note obligations
4. Reclassification of current debt to long-term debt
This item excludes changes in current debt when reported separately.
This item contains a Combined Figure data code (@CF) when ... 1. Long-Term Debt - Reduction is reported net of the reduction of long-term debt
2. Issuance of Long-Term Debt is combined with another item within the Financing Activities section on a Statement of Cash Flows (Format Code = 7)
3. Issuance of Long-Term Debt reported outside the Financing Activities section on a Statement of Cash Flows (Format Code = 7)

Research Insight North America Data Guide
818
This item is not available for banks or utilities.
This item includes changes in debt not classified into current and long-term debt on a Cash by Source and Use of Funds Statement (Format Code = 2), a Cash by Activity Statement (Format Code = 3), or a Statement of Cash Flows (Format Code = 7).
Data is presented on a historical basis.
Issuance of Long Term Debt 12MM Mnemonic DLTIS12
Concept calculation (@IF(@PERIOD(0Q)=4,DLTISQ,(DLTISQ+DLTISQ [@QTR(0Q)-@PERIOD(0Q)]-DLTISQ[-4])))
Units Millions of dollars
This item represents the amount of funds generated from issuance of long-term debt.
This item includes 1. Increase in long-term and short-term debt when combined
2. Long-term debt issued for or assumed in an acquisition
3. Proceeds from bonds, capitalized lease obligations, or note obligations
4. Reclassification of current debt to long-term debt
This item excludes changes in current debt when reported separately.
This item contains a Combined Figure data code (@CF) when ... 1. Long-Term Debt - Reduction is reported net of the reduction of long-term debt
2. Issuance of Long-Term Debt is combined with another item within the Financing Activities section on a Statement of Cash Flows (Format Code = 7)
3. Issuance of Long-Term Debt reported outside the Financing Activities section on a Statement of Cash Flows (Format Code = 7)
This item is not available for banks or utilities.
12-Month Moving When the 4th quarter is the current period, this concept returns Issuance of Long Term Debt – Quarterly, which contains 12 months of period data from the Statement of Cash Flows.
In the 1st-3rd quarters, this concept calculates a 12-month moving figure by adding:
+ the quarterly figure in the current quarter + the 4th quarter figure from the prior year – the quarterly figure from 4 quarters ago .
For example, when the current period is 3rd quarter this concept adds 9 months of period data in 3rd quarter of the current year, plus 12 months of period data from 4th quarter last year, minus 9 months of period data from 3rd quarter last year, which equals 12 months of data (9 months from the current year plus 3 months from the prior year).

819
Chapter 25 Statement of Cash Flows/Statement of Changes
Long-Term Debt - Reduction Mnemonic DLTR
Annual Data Item Number A114
Units Millions of dollars
This item represents a reduction in long-term debt caused by long-term debt maturing (being classified as a current maturity), payments of long-term debt and the conversion of debt to stock.
This item includes 1. Conversion of debt to common stock
2. Change in debt not classified into current and long-term debt on a Cash by Source and Use of Funds Statement (Format Code = 2), a Cash Statement by Activity (Format Code = 3), or a Statement of Cash Flows (Format Code = 7)
3. Change in long-term debt combined with change in current debt
4. Current maturities of long-term debt for companies reporting a Working Capital Statement (Format Code = 1)
5. Reclassification of long-term debt due to Chapter 11
6. Transfers or reclassifications of long-term debt to current liabilities
This item excludes change in current debt reported separately on a Cash by Source and Use of Funds Statement (Format Code = 2), a Cash Statement by Activity (Format Code = 3), or a Statement of Cash Flows (Format Code = 7).
This item contains a Combined Figure data code (@CF) when ... 1. Issuance of Long-Term Debt is reported net of debt retired
2. Reduction of Long-Term Debt is reported outside the Financing Activities section for a company reporting a Statement of Cash Flows (Format Code = 7)
3. Reduction of Long-Term Debt is combined with another item within the Financing Activities section for a company reporting a Statement of Cash Flows (Format Code = 7) (included in Financing Activities - Other)
4. Reduction of Long-Term Debt is combined with another item for a company reporting a Working Capital Statement (Format Code = 1), a Cash by Source and Use of Funds Statement (Format Code = 2), or a Cash Statement by Activity (Format Code = 3)
This item is not available for banks or utilities.
Long-Term Debt - Reduction - Quarterly Mnemonic DLTRQ
Statement Statement of Cash Flows/Statement of Changes
Quarterly Data Item Number Q92
Units Millions of dollars

Research Insight North America Data Guide
820
Important! Statement of Cash Flow quarterly items contain period data. If you’re looking at data for the 1st quarter of a company, you’re seeing 3 months of information. If you’re looking at the 2nd quarter, you’re seeing 6 months of information. The 3rd quarter contains 9 months of information and the 4th quarter contains 12 months of information.
This item represents a reduction in long-term debt caused by long-term debt maturing (being classified as a current maturity), payments of long-term debt and the conversion of debt to stock.
This item includes 1. Conversion of debt to common stock
2. Change in debt not classified into current and long-term debt on a Cash by Source and Use of Funds Statement (Format Code = 2), a Cash Statement by Activity (Format Code = 3), or a Statement of Cash Flows (Format Code = 7)
3. Change in long-term debt combined with change in current debt
4. Current maturities of long-term debt for companies reporting a Working Capital Statement (Format Code = 1)
5. Reclassification of long-term debt due to Chapter 11
6. Transfers or reclassifications of long-term debt to current liabilities
This item excludes change in current debt reported separately on a Cash by Source and Use of Funds Statement (Format Code = 2), a Cash Statement by Activity (Format Code = 3), or a Statement of Cash Flows (Format Code = 7).
This item contains a Combined Figure data code (@CF) when ... 1. Issuance of Long-Term Debt is reported net of debt retired
2. Reduction of Long-Term Debt is reported outside the Financing Activities section for a company reporting a Statement of Cash Flows (Format Code = 7)
3. Reduction of Long-Term Debt is combined with another item within the Financing Activities section for a company reporting a Statement of Cash Flows (Format Code = 7) (included in Financing Activities - Other)
4. Reduction of Long-Term Debt is combined with another item for a company reporting a Working Capital Statement (Format Code = 1), a Cash by Source and Use of Funds Statement (Format Code = 2), or a Cash Statement by Activity (Format Code = 3)
This item is not available for banks or utilities.
Data is presented on a historical basis.
Long Term Debt - Reduction - 12MM Mnemonic DLTR12
Concept calculation (@IF(@PERIOD(0Q)=4,DLTISQ,(DLTISQ+DLTISQ [@QTR(0Q)-@PERIOD(0Q)]-DLTISQ[-4])))
Units Millions of dollars
This item represents a reduction in long-term debt caused by long-term debt maturing (being classified as a current maturity), payments of long-term debt and the conversion of debt to stock.
This item includes 1. Conversion of debt to common stock

821
Chapter 25 Statement of Cash Flows/Statement of Changes
2. Change in debt not classified into current and long-term debt on a Cash by Source and Use of Funds Statement (Format Code = 2), a Cash Statement by Activity (Format Code = 3), or a Statement of Cash Flows (Format Code = 7)
3. Change in long-term debt combined with change in current debt
4. Current maturities of long-term debt for companies reporting a Working Capital Statement (Format Code = 1)
5. Reclassification of long-term debt due to Chapter 11
6. Transfers or reclassifications of long-term debt to current liabilities
This item excludes change in current debt reported separately on a Cash by Source and Use of Funds Statement (Format Code = 2), a Cash Statement by Activity (Format Code = 3), or a Statement of Cash Flows (Format Code = 7).
This item contains a Combined Figure data code (@CF) when ... 1. Issuance of Long-Term Debt is reported net of debt retired
2. Reduction of Long-Term Debt is reported outside the Financing Activities section for a company reporting a Statement of Cash Flows (Format Code = 7)
3. Reduction of Long-Term Debt is combined with another item within the Financing Activities section for a company reporting a Statement of Cash Flows (Format Code = 7) (included in Financing Activities - Other)
4. Reduction of Long-Term Debt is combined with another item for a company reporting a Working Capital Statement (Format Code = 1), a Cash by Source and Use of Funds Statement (Format Code = 2), or a Cash Statement by Activity (Format Code = 3)
This item is not available for banks or utilities.
12-Month Moving When the 4th quarter is the current period, this concept returns Reduction in Long Term Debt – Quarterly, which contains 12 months of period data from the Statement of Cash Flows.
In the 1st-3rd quarters, this concept calculates a 12-month moving figure by adding:
+ the quarterly figure in the current quarter + the 4th quarter figure from the prior year – the quarterly figure from 4 quarters ago .
For example, when the current period is 3rd quarter this concept adds 9 months of period data in 3rd quarter of the current year, plus 12 months of period data from 4th quarter last year, minus 9 months of period data from 3rd quarter last year, which equals 12 months of data (9 months from the current year plus 3 months from the prior year).
Operating Activities - Net Cash Flow Mnemonic OANCF
Annual Data Item Number A308
Units Millions of dollars
This item represents the net change in cash from all items classified in the Operating Activities section on a Statement of Cash Flows (Format Code = 7).

Research Insight North America Data Guide
822
This item contains a Not Available data code (@NA) for companies reporting a Working Capital Statement (Format Code = 1), a Cash by Source and Use of Funds Statement (Format Code = 2), or a Cash Statement by Activity (Format Code = 3).
This item includes changes in operating assets and liabilities.
Increases in cash are presented as positive numbers. Decreases appear as negative numbers.
This item is not available for banks.
Operating Activities - Net Cash Flow - Quarterly Mnemonic OANCFQ
Statement Statement of Cash Flows/Statement of Changes
Quarterly Data Item Number Q108
Units Millions of dollars
Important! Statement of Cash Flow quarterly items contain period data. If you’re looking at data for the 1st quarter of a company, you’re seeing 3 months of information. If you’re looking at the 2nd quarter, you’re seeing 6 months of information. The 3rd quarter contains 9 months of information and the 4th quarter contains 12 months of information.
This item represents the net change in cash from all items classified in the Operating Activities section on a Statement of Cash Flows (Format Code = 7).
This item contains a Not Available data code (@NA) for companies reporting a Working Capital Statement (Format Code = 1), a Cash by Source and Use of Funds Statement (Format Code = 2), or a Cash Statement by Activity (Format Code = 3).
This item includes changes in operating assets and liabilities.
Increases in cash are presented as positive numbers. Decreases appear as negative numbers.
This item is not available for banks.
Operating Activities Net Cash Flow 12MM Mnemonic OANCF12
Concept calculation (@IF(@PERIOD(0Q)=4,OANCFQ,(OANCFQ+ OANCFQ[@QTR(0Q)-@PERIOD(0Q)]-OANCFQ [-4])))
Units Millions of dollars
This item represents the net change in cash from all items classified in the Operating Activities section on a Statement of Cash Flows (Format Code = 7).
This item contains a Not Available data code (@NA) for companies reporting a Working Capital Statement (Format Code = 1), a Cash by Source and Use of Funds Statement (Format Code = 2), or a Cash Statement by Activity (Format Code = 3).
This item includes changes in operating assets and liabilities.

823
Chapter 25 Statement of Cash Flows/Statement of Changes
Increases in cash are presented as positive numbers. Decreases appear as negative numbers.
This item is not available for banks.
12-Month Moving When the 4th quarter is the current period, this concept returns Operating Activities Net Cash Flow – Quarterly, which contains 12 months of period data from the Statement of Cash Flows.
In the 1st-3rd quarters, this concept calculates a 12-month moving figure by adding:
+ the quarterly figure in the current quarter + the 4th quarter figure from the prior year – the quarterly figure from 4 quarters ago .
For example, when the current period is 3rd quarter this concept adds 9 months of period data in 3rd quarter of the current year, plus 12 months of period data from 4th quarter last year, minus 9 months of period data from 3rd quarter last year, which equals 12 months of data (9 months from the current year plus 3 months from the prior year).
Purchase of Common and Preferred Stock Mnemonic PRSTKC
Annual Data Item Number A115
Units Millions of dollars
This item represents any use of funds which decreases common and/or preferred stock.
This item includes 1. Conversion of Class A, Class B, special stock, and others, into common stock
2. Conversion of preferred stock into common stock
3. Purchase of treasury stock
4. Retirement or redemption of common/ordinary stock
5. Retirement or redemption of preferred stock
6. Retirement or redemption of redeemable preferred stock
This item excludes 1. Purchase of warrants
2. Reduction in stocks of a subsidiary
This item contains a Combined Figure data code (@CF) when ... 1. Sale of Common and Preferred Stock is reported net of purchase
2. Purchase of Common and Preferred Stock is combined with another item on a Working Capital Statement (Format Code = 1), a Cash by Source and Use of Funds Statement (Format Code = 2), or a Cash Statement by Activity (Format Code = 3)
3. Purchase of Common and Preferred Stock is combined with another item either outside or within the Financing Activities section on a Statement of Cash Flows Format Code = 7)
This item is not available for banks or utilities.

Research Insight North America Data Guide
824
Purchase of Common and Preferred Stock - Quarterly Mnemonic PRSTKQ
Statement Statement of Cash Flows/Statement of Changes
Quarterly Data Item Number Q93
Units Millions of dollars
Important! Statement of Cash Flow quarterly items contain period data. If you’re looking at data for the 1st quarter of a company, you’re seeing 3 months of information. If you’re looking at the 2nd quarter, you’re seeing 6 months of information. The 3rd quarter contains 9 months of information and the 4th quarter contains 12 months of information.
This item represents any use of funds which decreases common and/or preferred stock.
This item includes 1. Conversion of Class A, Class B, special stock, and others, into common stock
2. Conversion of preferred stock into common stock
3. Purchase of treasury stock
4. Retirement or redemption of common/ordinary stock
5. Retirement or redemption of preferred stock
6. Retirement or redemption of redeemable preferred stock
This item excludes 1. Purchase of warrants
2. Reduction in stocks of a subsidiary
This item contains a Combined Figure data code (@CF) when ... 1. Sale of Common and Preferred Stock is reported net of purchase
2. Purchase of Common and Preferred Stock is combined with another item on a Working Capital Statement (Format Code = 1), a Cash by Source and Use of Funds Statement (Format Code = 2), or a Cash Statement by Activity (Format Code = 3)
3. Purchase of Common and Preferred Stock is combined with another item either outside or within the Financing Activities section on a Statement of Cash Flows Format Code = 7)
This item is not available for banks or utilities.
Data is presented on a historical basis.
Purchase of Common and Preferred Stock 12MM Mnemonic PRSTK12
Concept calculation (@IF(@PERIOD(0Q)=4,PRSTKQ,(PRSTKQ+ PRSTKQ[@QTR(0Q)-@PERIOD(0Q)]-PRSTKQ [-4])))
Units Millions of dollars
This item represents any use of funds which decreases common and/or preferred stock.

825
Chapter 25 Statement of Cash Flows/Statement of Changes
This item includes 1. Conversion of Class A, Class B, special stock, and others, into common stock
2. Conversion of preferred stock into common stock
3. Purchase of treasury stock
4. Retirement or redemption of common/ordinary stock
5. Retirement or redemption of preferred stock
6. Retirement or redemption of redeemable preferred stock
This item excludes 1. Purchase of warrants
2. Reduction in stocks of a subsidiary
This item contains a Combined Figure data code (@CF) when ... 1. Sale of Common and Preferred Stock is reported net of purchase
2. Purchase of Common and Preferred Stock is combined with another item on a Working Capital Statement (Format Code = 1), a Cash by Source and Use of Funds Statement (Format Code = 2), or a Cash Statement by Activity (Format Code = 3)
3. Purchase of Common and Preferred Stock is combined with another item either outside or within the Financing Activities section on a Statement of Cash Flows Format Code = 7)
This item is not available for banks or utilities.
12-Month Moving When the 4th quarter is the current period, this concept returns Purchase of Common and Preferred Stock – Quarterly, which contains 12 months of period data from the Statement of Cash Flows.
In the 1st-3rd quarters, this concept calculates a 12-month moving figure by adding:
+ the quarterly figure in the current quarter + the 4th quarter figure from the prior year – the quarterly figure from 4 quarters ago .
For example, when the current period is 3rd quarter this concept adds 9 months of period data in 3rd quarter of the current year, plus 12 months of period data from 4th quarter last year, minus 9 months of period data from 3rd quarter last year, which equals 12 months of data (9 months from the current year plus 3 months from the prior year).
Receivables - Decrease (Increase) Mnemonic RECCH
Annual Data Item Number A302
Units Millions of dollars
This item represents increases or decreases in accounts receivable as reported in the Operating Activities section on a Statement of Cash Flows (Format Code = 7).
This item contains a Not Available date code (@NA) for companies reporting a Working Capital Statement (Format Code = 1), a Cash by Source and Use of Funds Statement (Format Code = 2), or a Cash Statement by Activity (Format Code = 3).

Research Insight North America Data Guide
826
This item includes increases and decreases in ... 1. All current assets classified by Standard & Poor's as receivables when reported in the Operating
Activities section
2. Contracts in progress and costs in excess of related billings when included by Standard & Poor's in Receivables - Total
3. Long-term receivables included by the company in the Operating Activities section
This item excludes increases and decreases in ... 1. Current and long-term receivables when included by the company in the Investing Activities section
2. Income taxes receivable
3. Provisions for losses on receivables
This item contains a Combined Figure data code (@CF) when ... 1. Decrease (Increase) in some or all receivables is combined with a change in another asset or liability
(included in Other Assets and Liabilities - Net Change)
2. Receivables are reported outside the Operating Activities section
3. Changes in current receivables are not reported on the Statement of Cash Flows but the Balance Sheet shows a change between the current and prior year
Increases in receivables are presented as negative numbers. Decreases are positive numbers.
This item is not available for banks or utilities.
Receivables - Decrease (Increase) - Quarterly Mnemonic RECCHQ
Statement Statement of Cash Flows/Statement of Changes
Quarterly Data Item Number Q103
Units Millions of dollars
Important! Statement of Cash Flow quarterly items contain period data. If you’re looking at data for the 1st quarter of a company, you’re seeing 3 months of information. If you’re looking at the 2nd quarter, you’re seeing 6 months of information. The 3rd quarter contains 9 months of information and the 4th quarter contains 12 months of information.
This item represents increases or decreases in accounts receivable as reported in the Operating Activities section on a Statement of Cash Flows (Format Code = 7).
This item contains a Not Available date code (@NA) for companies reporting a Working Capital Statement (Format Code = 1), a Cash by Source and Use of Funds Statement (Format Code = 2), or a Cash Statement by Activity (Format Code = 3).
This item includes increases and decreases in ... 1. All current assets classified by Standard & Poor's as receivables when reported in the Operating
Activities section
2. Contracts in progress and costs in excess of related billings when included by Standard & Poor's in Receivables - Total

827
Chapter 25 Statement of Cash Flows/Statement of Changes
3. Long-term receivables included by the company in the Operating Activities section
This item excludes increases and decreases in ... 1. Current and long-term receivables when included by the company in the Investing Activities section
2. Income taxes receivable
3. Provisions for losses on receivables
This item contains a Combined Figure data code (@CF) when ... 1. Decrease (Increase) in some or all receivables is combined with a change in another asset or liability
(included in Other Assets and Liabilities - Net Change)
2. Receivables are reported outside the Operating Activities section
3. Changes in current receivables are not reported on the Statement of Cash Flows but the Balance Sheet shows a change between the current and prior year
Increases in receivables are presented as negative numbers. Decreases are positive numbers.
This item is not available for banks or utilities.
Receivables Decrease (Increase) 12MM Mnemonic RECCH12
Concept calculation (@IF(@PERIOD(0Q)=4,RECCHQ,(RECCHQ+ RECCHQ[@QTR(0Q)-@PERIOD(0Q)]-RECCHQ [-4])))
Units Millions of dollars
This item represents increases or decreases in accounts receivable as reported in the Operating Activities section on a Statement of Cash Flows (Format Code = 7).
This item contains a Not Available date code (@NA) for companies reporting a Working Capital Statement (Format Code = 1), a Cash by Source and Use of Funds Statement (Format Code = 2), or a Cash Statement by Activity (Format Code = 3).
This item includes increases and decreases in ... 1. All current assets classified by Standard & Poor's as receivables when reported in the Operating
Activities section
2. Contracts in progress and costs in excess of related billings when included by Standard & Poor's in Receivables - Total
3. Long-term receivables included by the company in the Operating Activities section
This item excludes increases and decreases in ... 1. Current and long-term receivables when included by the company in the Investing Activities section
2. Income taxes receivable
3. Provisions for losses on receivables
This item contains a Combined Figure data code (@CF) when ... 1. Decrease (Increase) in some or all receivables is combined with a change in another asset or liability
(included in Other Assets and Liabilities - Net Change)
2. Receivables are reported outside the Operating Activities section

Research Insight North America Data Guide
828
3. Changes in current receivables are not reported on the Statement of Cash Flows but the Balance Sheet shows a change between the current and prior year
Increases in receivables are presented as negative numbers. Decreases are positive numbers.
This item is not available for banks or utilities.
12-Month Moving When the 4th quarter is the current period, this concept returns Receivables Decrease (Increase) – Quarterly, which contains 12 months of period data from the Statement of Cash Flows.
In the 1st-3rd quarters, this concept calculates a 12-month moving figure by adding:
+ the quarterly figure in the current quarter + the 4th quarter figure from the prior year – the quarterly figure from 4 quarters ago .
For example, when the current period is 3rd quarter this concept adds 9 months of period data in 3rd quarter of the current year, plus 12 months of period data from 4th quarter last year, minus 9 months of period data from 3rd quarter last year, which equals 12 months of data (9 months from the current year plus 3 months from the prior year).
Sale of Common and Preferred Stock Mnemonic SSTK
Statement Statement of Changes
Annual Data Item Number A108
Units Millions of dollars
This item represents funds received from issuance of common and preferred stock.
This item includes 1. Conversion of Class A, Class B, special stock, etc., into common stock
2. Conversion of preferred stock and/or debt into common stock
3. Exercise of stock options and/or warrants
4. Increase in capital surplus due to stock issuance
5. Related tax benefits due to issuance of common and/or preferred stock
6. Sale of common stock
7. Sale of preferred stock
8. Sale of redeemable preferred stock
9. Sale of stock
10. Stock issued for an acquisition
This item excludes 1. Issuance of warrants
2. Stock of shubsidiary company
This item contains a Combined Figure data code (@CF) when ...

829
Chapter 25 Statement of Cash Flows/Statement of Changes
1. Purchase of Common and Preferred Stock is reported net of sale
2. A figure for Sale of Common and Preferred Stock is presented outside the Financing Activities section on a Statement of Cash Flows
This item is not available for banks or utilities.
Sale of Common and Preferred Stock - Quarterly Mnemonic SSTKQ
Statement Statement of Cash Flows/Statement of Changes
Quarterly Data Item Number Q84
Units Millions of dollars
Important! Statement of Cash Flow quarterly items contain period data. If you’re looking at data for the 1st quarter of a company, you’re seeing 3 months of information. If you’re looking at the 2nd quarter, you’re seeing 6 months of information. The 3rd quarter contains 9 months of information and the 4th quarter contains 12 months of information.
This item represents funds received from issuance of common and preferred stock.
This item includes 1. Conversion of Class A, Class B, special stock, etc., into common stock
2. Conversion of preferred stock and/or debt into common stock
3. Exercise of stock options and/or warrants
4. Increase in capital surplus due to stock issuance
5. Related tax benefits due to issuance of common and/or preferred stock
6. Sale of common stock
7. Sale of preferred stock
8. Sale of redeemable preferred stock
9. Sale of stock
10. Stock issued for an acquisition
This item excludes 1. Issuance of warrants
2. Stock of subsidiary company
This item contains a Combined Figure data code (@CF) when ... 1. Purchase of Common and Preferred Stock is reported net of sale
2. A figure for Sale of Common and Preferred Stock is presented outside the Financing Activities section on a Statement of Cash Flows
This item is not available for banks or utilities.
Data is presented on a historical basis.

Research Insight North America Data Guide
830
Sale of Common and Preferred Stock 12MM Mnemonic SSTK12
Concept calculation (@IF(@PERIOD(0Q)=4,SSTKQ,(SSTKQ+SSTKQ [@QTR(0Q)-@PERIOD(0Q)]-SSTKQ[-4])))
Units Millions of dollars
This item represents funds received from issuance of common and preferred stock.
This item includes 1. Conversion of Class A, Class B, special stock, etc., into common stock
2. Conversion of preferred stock and/or debt into common stock
3. Exercise of stock options and/or warrants
4. Increase in capital surplus due to stock issuance
5. Related tax benefits due to issuance of common and/or preferred stock
6. Sale of common stock
7. Sale of preferred stock
8. Sale of redeemable preferred stock
9. Sale of stock
10. Stock issued for an acquisition
This item excludes 1. Issuance of warrants
2. Stock of subsidiary company
This item contains a Combined Figure data code (@CF) when ... 1. Purchase of Common and Preferred Stock is reported net of sale
2. A figure for Sale of Common and Preferred Stock is presented outside the Financing Activities section on a Statement of Cash Flows
This item is not available for banks or utilities.
12-Month Moving When the 4th quarter is the current period, this concept returns Sale of Common and Preferred Stock – Quarterly, which contains 12 months of period data from the Statement of Cash Flows.
In the 1st-3rd quarters, this concept calculates a 12-month moving figure by adding:
+ the quarterly figure in the current quarter + the 4th quarter figure from the prior year – the quarterly figure from 4 quarters ago .
For example, when the current period is 3rd quarter this concept adds 9 months of period data in 3rd quarter of the current year, plus 12 months of period data from 4th quarter last year, minus 9 months of period data from 3rd quarter last year, which equals 12 months of data (9 months from the current year plus 3 months from the prior year).

831
Chapter 25 Statement of Cash Flows/Statement of Changes
Sale of Investments Mnemonic SIV
Statement Statement of Changes
Annual Data Item Number A109
Units Millions of dollars
This item represents a source of funds from the sale of investments.
This item includes 1. Decrease in long-term investments when combined with a decrease in short-term investments on a
Cash by Source and Use (Format Code = 2), a Cash Statement by Activity (Format Code = 3), or a Statement of Cash Flows (Format = 7)
2. Decrease in long-term receivables
3. Reclassification of long-term investments to current
4. Sale of investments in unconsolidated subsidiaries
This item excludes 1. Additional investment in a company if the company is already consolidated
2. Change in notes receivable relating to shareholders' equity
This item contains a Combined Figure data code (@CF) when ... 1. Increase in Investments is reported net of Decreases in Investments
2. Sale of Investments is combined with another item for a company reporting a Working Capital Statement (Format Code = 1), a Cash by Source and Use of Funds Statement (Format Code = 2), or a Cash Statement by Activity (Format Code = 3)
3. Sale of Investments is combined with another item either within or outside the Investing Activities section on the Statement of Cash Flows (Format Code = 7).
This item may include current receivables if the company reports an unclassified Balance Sheet.
This item is not available for banks or utilities.
Sale of Investments - Quarterly Mnemonic SIVQ
Statement Statement of Cash Flows/Statement of Changes
Units Millions of dollars
Important! Statement of Cash Flow quarterly items contain period data. If you’re looking at data for the 1st quarter of a company, you’re seeing 3 months of information. If you’re looking at the 2nd quarter, you’re seeing 6 months of information. The 3rd quarter contains 9 months of information and the 4th quarter contains 12 months of information.
This item represents a source of funds from the sale of investments.
This item includes

Research Insight North America Data Guide
832
1. Decrease in long-term investments when combined with a decrease in short-term investments on a Cash by Source and Use (Format Code = 2), a Cash Statement by Activity (Format Code = 3), or a Statement of Cash Flows (Format = 7)
2. Decrease in long-term receivables
3. Reclassification of long-term investments to current
4. Sale of investments in unconsolidated subsidiaries
This item excludes 1. Additional investment in a company if the company is already consolidated
2. Change in notes receivable relating to shareholders' equity
This item contains a Combined Figure data code (@CF) when ... 1. Increase in Investments is reported net of Decreases in Investments
2. Sale of Investments is combined with another item for a company reporting a Working Capital Statement (Format Code = 1), a Cash by Source and Use of Funds Statement (Format Code = 2), or a Cash Statement by Activity (Format Code = 3)
3. Sale of Investments is combined with another item either within or outside the Investing Activities section on the Statement of Cash Flows (Format Code = 7).
This item may include current receivables if the company reports an unclassified Balance Sheet.
This item is not available for banks or utilities.
Data is presented on a historical basis.
Sale of Investments 12MM Mnemonic SIV12
Concept calculation (@IF(@PERIOD(0Q)=4,SIVQ,(SIVQ+SIVQ[@QTR (0Q)-@PERIOD(0Q)]-SIVQ[-4])))
Units Millions of dollars
This item represents a source of funds from the sale of investments.
This item includes 1. Decrease in long-term investments when combined with a decrease in short-term investments on a
Cash by Source and Use (Format Code = 2), a Cash Statement by Activity (Format Code = 3), or a Statement of Cash Flows (Format = 7)
2. Decrease in long-term receivables
3. Reclassification of long-term investments to current
4. Sale of investments in unconsolidated subsidiaries
This item excludes 1. Additional investment in a company if the company is already consolidated
2. Change in notes receivable relating to shareholders' equity
This item contains a Combined Figure data code (@CF) when ... 1. Increase in Investments is reported net of Decreases in Investments

833
Chapter 25 Statement of Cash Flows/Statement of Changes
2. Sale of Investments is combined with another item for a company reporting a Working Capital Statement (Format Code = 1), a Cash by Source and Use of Funds Statement (Format Code = 2), or a Cash Statement by Activity (Format Code = 3)
3. Sale of Investments is combined with another item either within or outside the Investing Activities section on the Statement of Cash Flows (Format Code = 7).
This item may include current receivables if the company reports an unclassified Balance Sheet.
This item is not available for banks or utilities.
12-Month Moving When the 4th quarter is the current period, this concept returns Sale of Investments – Quarterly, which contains 12 months of period data from the Statement of Cash Flows.
In the 1st-3rd quarters, this concept calculates a 12-month moving figure by adding:
+ the quarterly figure in the current quarter + the 4th quarter figure from the prior year – the quarterly figure from 4 quarters ago .
For example, when the current period is 3rd quarter this concept adds 9 months of period data in 3rd quarter of the current year, plus 12 months of period data from 4th quarter last year, minus 9 months of period data from 3rd quarter last year, which equals 12 months of data (9 months from the current year plus 3 months from the prior year).
Sale of Property, Plant, and Equipment Mnemonic SPPE
Statement Statement of Changes
Annual Data Item Number A107
Units Millions of dollars
This item represents funds received or cash in flows from the sale of property, plant, and equipment.
This item includes 1. Book value of the following when presented outside the Operating Activities section
2. Decrease in funds for construction
3. Disposal of fixed assets from discontinued operations if presented after Funds from Operations - Total
4. Gain or loss on disposition of property, plant, and equipment appearing after Funds from Operations - Total
5. Sale and/or retirement of fixed assets
6. Transfer of property, plant, and equipment to inventory accounts
This item contains a Combined Figure data code (@CF) when ... 1. Capital expenditures are reported net of the sale of property, plant, and equipment and/or the figure
for sale of property, plant, and equipment is presented in the Uses of Funds or Operations sections
2. Sale of assets is reported but no separate figure is given for sale of property, plant, and equipment.

Research Insight North America Data Guide
834
3. Sale of consolidated subsidiary is reported with no separate figure for sale of property, plant, and equipment
4. Sale of Property, Plant, and Equipment is combined with another item for a company reporting a Working Capital Statement (Format Code = 1) a Cash by Source and Use of Funds Statement (Format Code = 2), or a Cash Statement by Activity (Format Code = 3)
5. Sale of Property, Plant, and Equipment is combined with another item either within or outside the Investing Activities section on a Statement of Cash Flows (Format Code = 7)
This item is not available for banks or utilities.
Sale of Property, Plant, and Equipment - Quarterly Mnemonic SPPEQ
Statement Statement of Cash Flows/Statement of Changes
Quarterly Data Item Number Q83
Units Millions of dollars
Important! Statement of Cash Flow quarterly items contain period data. If you’re looking at data for the 1st quarter of a company, you’re seeing 3 months of information. If you’re looking at the 2nd quarter, you’re seeing 6 months of information. The 3rd quarter contains 9 months of information and the 4th quarter contains 12 months of information.
This item represents funds received or cash in flows from the sale of property, plant, and equipment.
This item includes 1. Book value of the following when presented outside the Operating Activities section
2. Decrease in funds for construction
3. Disposal of fixed assets from discontinued operations if presented after Funds from Operations - Total
4. Gain or loss on disposition of property, plant, and equipment appearing after Funds from Operations - Total
5. Sale and/or retirement of fixed assets
6. Transfer of property, plant, and equipment to inventory accounts
This item contains a Combined Figure data code (@CF) when ... 1. Capital expenditures are reported net of the sale of property, plant, and equipment and/or the figure
for sale of property, plant, and equipment is presented in the Uses of Funds or Operations sections
2. Sale of assets is reported but no separate figure is given for sale of property, plant, and equipment.
3. Sale of consolidated subsidiary is reported with no separate figure for sale of property, plant, and equipment
4. Sale of Property, Plant, and Equipment is combined with another item for a company reporting a Working Capital Statement (Format Code = 1) a Cash by Source and Use of Funds Statement (Format Code = 2), or a Cash Statement by Activity (Format Code = 3)

835
Chapter 25 Statement of Cash Flows/Statement of Changes
5. Sale of Property, Plant, and Equipment is combined with another item either within or outside the Investing Activities section on a Statement of Cash Flows (Format Code = 7)
This item is not available for banks or utilities.
Data is presented on a historical basis.
Sale of Property, Plant and Equipment - 12MM Mnemonic SPPE12
Concept calculation (@IF(@PERIOD(0Q)=4,SPPEQ,(SPPEQ+SPPEQ [@QTR(0Q)-@PERIOD(0Q)]-SPPEQ[-4])))
Units Millions of dollars
This item represents funds received or cash in flows from the sale of property, plant, and equipment.
This item includes 1. Book value of the following when presented outside the Operating Activities section
2. Decrease in funds for construction
3. Disposal of fixed assets from discontinued operations if presented after Funds from Operations - Total
4. Gain or loss on disposition of property, plant, and equipment appearing after Funds from Operations - Total
5. Sale and/or retirement of fixed assets
6. Transfer of property, plant, and equipment to inventory accounts
This item contains a Combined Figure data code (@CF) when ... 1. Capital expenditures are reported net of the sale of property, plant, and equipment and/or the figure
for sale of property, plant, and equipment is presented in the Uses of Funds or Operations sections
2. Sale of assets is reported but no separate figure is given for sale of property, plant, and equipment.
3. Sale of consolidated subsidiary is reported with no separate figure for sale of property, plant, and equipment
4. Sale of Property, Plant, and Equipment is combined with another item for a company reporting a Working Capital Statement (Format Code = 1) a Cash by Source and Use of Funds Statement (Format Code = 2), or a Cash Statement by Activity (Format Code = 3)
5. Sale of Property, Plant, and Equipment is combined with another item either within or outside the Investing Activities section on a Statement of Cash Flows (Format Code = 7)
This item is not available for banks or utilities.
12-Month Moving When the 4th quarter is the current period, this concept returns Sale of PP&E – Quarterly, which contains 12 months of period data from the Statement of Cash Flows.
In the 1st-3rd quarters, this concept calculates a 12-month moving figure by adding:
+ the quarterly figure in the current quarter + the 4th quarter figure from the prior year – the quarterly figure from 4 quarters ago .

Research Insight North America Data Guide
836
For example, when the current period is 3rd quarter this concept adds 9 months of period data in 3rd quarter of the current year, plus 12 months of period data from 4th quarter last year, minus 9 months of period data from 3rd quarter last year, which equals 12 months of data (9 months from the current year plus 3 months from the prior year).
Sale of PPE and Investments - Loss (Gain) Mnemonic SPPIV
Statement Statement of Changes
Annual Data Item Number A213
Units Millions of dollars
This item represents gains and losses resulting from the sale or disposal of assets.
This item is only available for companies reporting a Working Capital Statement (Format Code = 1), a Cash by Source and Use of Funds Statement (Format Code = 2), or a Cash Statement by Activity (Format Code = 3) if a company has been updated for fiscal year 1988. Prior to 1987, this item was included in Funds From Operations - Other on a Working Capital Statement (Format = 1), a Cash by Source and Use of Funds Statement (Format Code = 2), or a Cash Statement by Activity (Format Code = 3).
This item is available from 1987 for companies reporting a Statement of Cash Flows (Format Code = 7).
This item includes the following when presented in an Operating Activities section ... 1. Realized losses (gains) on sale of property, plant, and equipment
2. Losses (gains) on sale of long-term and short-term investments
3. Losses (gains) on sale of all other assets
4. Losses (gains) on sale or disposal of businesses' subsidiaries, or divisions when not specifically labeled as discontinued operations
5. Losses (gains) on sale of minority interest
This item excludes 1. Earnings (losses) of unconsolidated subsidiaries
2. Gains (losses) resulting from extraordinary items or discontinued operations
3. Income (loss) allocated to minority interest
4. Items other than gains or losses
5. Provisions for losses on accounts receivable
6. Provisions to reduce the carrying value of assets
7. Unrealized losses (gains) on sale of property, plant, and equipment
8. Write-downs, write-offs, or impairments in value of assets
This item contains a Combined Figure data code (@CF) when ... 1. Gain (loss) on sale of assets relating to continuing operations is combined with gain (loss) applying to
discontinued operations

837
Chapter 25 Statement of Cash Flows/Statement of Changes
2. Gain (loss) on sale of assets is combined with other items within the Operating Activities or Operations section
3. Gain (loss) on sale of assets is not reported in the Operating Activities or Operations section, but is reported in another section
Losses are considered positive numbers. Gains are reported as negative numbers.
This item is not available for banks or utilities.
Sale of PPE and Investments - Loss (Gain) - Quarterly Mnemonic SPPIVQ
Statement Statement of Cash Flows/Statement of Changes
Quarterly Data Item Number Q102
Units Millions of dollars
Important! Statement of Cash Flow quarterly items contain period data. If you’re looking at data for the 1st quarter of a company, you’re seeing 3 months of information. If you’re looking at the 2nd quarter, you’re seeing 6 months of information. The 3rd quarter contains 9 months of information and the 4th quarter contains 12 months of information.
This item represents gains and losses resulting from the sale or disposal of assets.
This item is only available for companies reporting a Working Capital Statement (Format Code = 1), a Cash by Source and Use of Funds Statement (Format Code = 2), or a Cash Statement by Activity (Format Code = 3) if a company has been updated for fiscal year 1988. Prior to 1987, this item was included in Funds From Operations - Other on a Working Capital Statement (Format = 1), a Cash by Source and Use of Funds Statement (Format Code = 2), or a Cash Statement by Activity (Format Code = 3).
This item is available from 1987 for companies reporting a Statement of Cash Flows (Format Code = 7).
This item includes the following when presented in an Operating Activities section ... 1. Realized losses (gains) on sale of property, plant, and equipment
2. Losses (gains) on sale of long-term and short-term investments
3. Losses (gains) on sale of all other assets
4. Losses (gains) on sale or disposal of businesses' subsidiaries, or divisions when not specifically labeled as discontinued operations
5. Losses (gains) on sale of minority interest
This item excludes 1. Earnings (losses) of unconsolidated subsidiaries
2. Gains (losses) resulting from extraordinary items or discontinued operations
3. Income (loss) allocated to minority interest
4. Items other than gains or losses
5. Provisions for losses on accounts receivable
6. Provisions to reduce the carrying value of assets

Research Insight North America Data Guide
838
7. Unrealized losses (gains) on sale of property, plant, and equipment
8. Write-downs, write-offs, or impairments in value of assets
This item contains a Combined Figure data code (@CF) when ... 1. Gain (loss) on sale of assets relating to continuing operations is combined with gain (loss) applying to
discontinued operations
2. Gain (loss) on sale of assets is combined with other items within the Operating Activities or Operations section
3. Gain (loss) on sale of assets is not reported in the Operating Activities or Operations section, but is reported in another section
Losses are considered positive numbers. Gains are reported as negative numbers.
This item is not available for banks or utilities.
Sale of PP&E and Investments - Loss (Gain) 12MM Mnemonic SPPIV12
Concept calculation (@IF(@PERIOD(0Q)=4,SPPIVQ,(SPPIVQ+ SPPIVQ[@QTR(0Q)-@PERIOD(0Q)]-SPPIVQ[-4])))
Units Millions of dollars
This item represents gains and losses resulting from the sale or disposal of assets.
This item is only available for companies reporting a Working Capital Statement (Format Code = 1), a Cash by Source and Use of Funds Statement (Format Code = 2), or a Cash Statement by Activity (Format Code = 3) if a company has been updated for fiscal year 1988. Prior to 1987, this item was included in Funds From Operations - Other on a Working Capital Statement (Format = 1), a Cash by Source and Use of Funds Statement (Format Code = 2), or a Cash Statement by Activity (Format Code = 3).
This item is available from 1987 for companies reporting a Statement of Cash Flows (Format Code = 7).
This item includes the following when presented in an Operating Activities section ... 1. Realized losses (gains) on sale of property, plant, and equipment
2. Losses (gains) on sale of long-term and short-term investments
3. Losses (gains) on sale of all other assets
4. Losses (gains) on sale or disposal of businesses' subsidiaries, or divisions when not specifically labeled as discontinued operations
5. Losses (gains) on sale of minority interest
This item excludes 1. Earnings (losses) of unconsolidated subsidiaries
2. Gains (losses) resulting from extraordinary items or discontinued operations
3. Income (loss) allocated to minority interest
4. Items other than gains or losses
5. Provisions for losses on accounts receivable
6. Provisions to reduce the carrying value of assets

839
Chapter 25 Statement of Cash Flows/Statement of Changes
7. Unrealized losses (gains) on sale of property, plant, and equipment
8. Write-downs, write-offs, or impairments in value of assets
This item contains a Combined Figure data code (@CF) when ... 1. Gain (loss) on sale of assets relating to continuing operations is combined with gain (loss) applying to
discontinued operations
2. Gain (loss) on sale of assets is combined with other items within the Operating Activities or Operations section
3. Gain (loss) on sale of assets is not reported in the Operating Activities or Operations section, but is reported in another section
Losses are considered positive numbers. Gains are reported as negative numbers.
This item is not available for banks or utilities.
12-Month Moving When the 4th quarter is the current period, this concept returns Sale of PP&E and Investments - Loss (Gain) – Quarterly, which contains 12 months of period data from the Statement of Cash Flows.
In the 1st-3rd quarters, this concept calculates a 12-month moving figure by adding:
+ the quarterly figure in the current quarter + the 4th quarter figure from the prior year – the quarterly figure from 4 quarters ago .
For example, when the current period is 3rd quarter this concept adds 9 months of period data in 3rd quarter of the current year, plus 12 months of period data from 4th quarter last year, minus 9 months of period data from 3rd quarter last year, which equals 12 months of data (9 months from the current year plus 3 months from the prior year).
Short-Term Investments - Change Mnemonic IVSTCH
Statement Statement of Cash Flows/Statement of Changes
Annual Data Item Number A309
Units Millions of dollars
This item represents changes in marketable securities and cash equivalents reported in the Investing Activities section on a Statement of Cash Flows (Format Code = 7).
This item presents a Not Available data code (@NA) for companies reporting a Working Capital Statement (Format Code = 1), a Cash by Source and Use of Funds Statement (Format Code = 2), or a Cash Statement by Activity (Format Code =3).
This item includes 1. Cash equivalents not included in Cash and Cash Equivalents - Increase (Decrease)
2. Short-term marketable securities
This item excludes 1. Current receivables on classified and unclassified Balance Sheets
2. Long-term investments

Research Insight North America Data Guide
840
This item contains a Combined Figure data code (@CF) when ... 1. Some or all short-term investments are combined with another item in the Investing Activities section
2. Short-term investments are reported only in the Financing or Indirect Operating Activities section
Changes in short-term investments which increase cash are presented as positive numbers. Changes decreasing cash appear as negative numbers.
This item is not available for banks or utilities.
Short-Term Investments - Change - Quarterly Mnemonic IVSTCQ
Statement Statement of Cash Flows/Statement of Changes
Quarterly Data Item Number Q109
Units Millions of dollars
Important! Statement of Cash Flow quarterly items contain period data. If you’re looking at data for the 1st quarter of a company, you’re seeing 3 months of information. If you’re looking at the 2nd quarter, you’re seeing 6 months of information. The 3rd quarter contains 9 months of information and the 4th quarter contains 12 months of information.
This item represents changes in marketable securities and cash equivalents reported in the Investing Activities section on a Statement of Cash Flows (Format Code = 7).
This item presents a Not Available data code (@NA) for companies reporting a Working Capital Statement (Format Code = 1), a Cash by Source and Use of Funds Statement (Format Code = 2), or a Cash Statement by Activity (Format Code =3).
This item includes 1. Cash equivalents not included in Cash and Cash Equivalents - Increase (Decrease)
2. Short-term marketable securities
This item excludes 1. Current receivables on classified and unclassified Balance Sheets
2. Long-term investments
This item contains a Combined Figure data code (@CF) when ... 1. Some or all short-term investments are combined with another item in the Investing Activities section
2. Short-term investments are reported only in the Financing or Indirect Operating Activities section
Changes in short-term investments which increase cash are presented as positive numbers. Changes decreasing cash appear as negative numbers.
This item is not available for banks or utilities.
Short Term Investments - Change - 12MM Mnemonic IVSTC12

841
Chapter 25 Statement of Cash Flows/Statement of Changes
Concept calculation (@IF(@PERIOD(0Q)=4,IVSTCQ,(IVSTCQ+ IVSTCQ[@QTR(0Q)-@PERIOD(0Q)]-IVSTCQ[-4])))
Units Millions of dollars
This item represents changes in marketable securities and cash equivalents reported in the Investing Activities section on a Statement of Cash Flows (Format Code = 7).
This item presents a Not Available data code (@NA) for companies reporting a Working Capital Statement (Format Code = 1), a Cash by Source and Use of Funds Statement (Format Code = 2), or a Cash Statement by Activity (Format Code =3).
This item includes 1. Cash equivalents not included in Cash and Cash Equivalents - Increase (Decrease)
2. Short-term marketable securities
This item excludes 1. Current receivables on classified and unclassified Balance Sheets
2. Long-term investments
This item contains a Combined Figure data code (@CF) when ... 1. Some or all short-term investments are combined with another item in the Investing Activities section
2. Short-term investments are reported only in the Financing or Indirect Operating Activities section
Changes in short-term investments which increase cash are presented as positive numbers. Changes decreasing cash appear as negative numbers.
This item is not available for banks or utilities.
12-Month Moving When the 4th quarter is the current period, this concept returns Change in Short Term Investments – Quarterly, which contains 12 months of period data from the Statement of Cash Flows.
In the 1st-3rd quarters, this concept calculates a 12-month moving figure by adding:
+ the quarterly figure in the current quarter + the 4th quarter figure from the prior year – the quarterly figure from 4 quarters ago .
For example, when the current period is 3rd quarter this concept adds 9 months of period data in 3rd quarter of the current year, plus 12 months of period data from 4th quarter last year, minus 9 months of period data from 3rd quarter last year, which equals 12 months of data (9 months from the current year plus 3 months from the prior year).
Sources of Funds - Other Mnemonic FSRCO
Statement Statement of Cash Flows/Statement of Changes
Annual Data Item Number A218
Units Millions of dollars

Research Insight North America Data Guide
842
This item represents all sources of funds not classified elsewhere on a Statement of Changes prior to adoption of FASB #95.
This item contains a Not Available data code (@NA) if a company reports a Statement of Cash Flows (Format Code = 7).
This item includes 1. Changes due to foreign currency exchange adjustments when shown separately as a use of funds
2. Working capital changes increasing cash for a company reporting a Cash Statement by Activity (Format Code = 3)
3. Working capital changes not clearly reported as one total and/or not distinctly grouped together in one section within Sources for companies reporting a Cash by Source and Use of Funds Statement (Format Code = 2) or a Cash Statement by Activity (Format Code = 3)
This item excludes working capital changes clearly reported as one total and/or distinctly grouped together in one section within Sources for a Cash by Source and Use of Funds Statement (Format Code = 2) or a Cash Statement by Activity (Format Code = 3).
This item is not available for banks or utilities.
Sources of Funds - Other - Quarterly Mnemonic FSRCOQ
Statement Statement of Cash Flows/Statement of Changes
Quarterly Data Item Number Q87
Units Millions of dollars
Important! Statement of Cash Flow quarterly items contain period data. If you’re looking at data for the 1st quarter of a company, you’re seeing 3 months of information. If you’re looking at the 2nd quarter, you’re seeing 6 months of information. The 3rd quarter contains 9 months of information and the 4th quarter contains 12 months of information.
This item represents all sources of funds not classified elsewhere on a Statement of Changes prior to adoption of FASB #95.
This item contains a Not Available data code (@NA) if a company reports a Statement of Cash Flows (Format Code = 7).
This item includes 1. Changes due to foreign currency exchange adjustments when shown separately as a use of funds
2. Working capital changes increasing cash for a company reporting a Cash Statement by Activity (Format Code = 3)
3. Working capital changes not clearly reported as one total and/or not distinctly grouped together in one section within Sources for companies reporting a Cash by Source and Use of Funds Statement (Format Code = 2) or a Cash Statement by Activity (Format Code = 3)
This item excludes working capital changes clearly reported as one total and/or distinctly grouped together in one section within Sources for a Cash by Source and Use of Funds Statement (Format Code = 2) or a Cash Statement by Activity (Format Code = 3).
This item is not available for banks or utilities.

843
Chapter 25 Statement of Cash Flows/Statement of Changes
Data is presented on a historical basis.
Sources of Funds - Other 12MM Mnemonic FSRCO12
Concept calculation (@IF(@PERIOD(0Q)=4,FSRCOQ,(FSRCOQ+ FSRCOQ[@QTR(0Q)-@PERIOD(0Q)]-FSRCOQ [-4])))
Units Millions of dollars
This item represents all sources of funds not classified elsewhere on a Statement of Changes prior to adoption of FASB #95.
This item contains a Not Available data code (@NA) if a company reports a Statement of Cash Flows (Format Code = 7).
This item includes 1. Changes due to foreign currency exchange adjustments when shown separately as a use of funds
2. Working capital changes increasing cash for a company reporting a Cash Statement by Activity (Format Code = 3)
3. Working capital changes not clearly reported as one total and/or not distinctly grouped together in one section within Sources for companies reporting a Cash by Source and Use of Funds Statement (Format Code = 2) or a Cash Statement by Activity (Format Code = 3)
This item excludes working capital changes clearly reported as one total and/or distinctly grouped together in one section within Sources for a Cash by Source and Use of Funds Statement (Format Code = 2) or a Cash Statement by Activity (Format Code = 3).
This item is not available for banks or utilities.
12-Month Moving When the 4th quarter is the current period, this concept returns Sources of Funds - Other – Quarterly, which contains 12 months of period data from the Statement of Cash Flows.
In the 1st-3rd quarters, this concept calculates a 12-month moving figure by adding:
+ the quarterly figure in the current quarter + the 4th quarter figure from the prior year – the quarterly figure from 4 quarters ago .
For example, when the current period is 3rd quarter this concept adds 9 months of period data in 3rd quarter of the current year, plus 12 months of period data from 4th quarter last year, minus 9 months of period data from 3rd quarter last year, which equals 12 months of data (9 months from the current year plus 3 months from the prior year).
Sources of Funds - Total Mnemonic FSRCT
Statement Statement of Cash Flows/Statement of Changes
Annual Data Item Number A112
Units Millions of dollars

Research Insight North America Data Guide
844
This item represents the total sources of funds reported by a company reporting either a Working Capital Statement (Format Code = 1) or Cash by Source and Use of Funds Statement (Format Code = 2).
This item contains a Not Available data code (@NA) for a company reporting either a Cash Statement by Activity (Format Code = 3) or a Statement of Cash Flows (Format Code = 7).
This item excludes increase (decrease) in working capital for a company reporting a Working Capital Statement (Format Code = 1).
This item is not available for banks or utilities.
Sources of Funds - Total - Quarterly Mnemonic FSRCTQ
Statement Statement of Cash Flows/Statement of Changes
Quarterly Data Item Number Q88
Units Millions of dollars
Important! Statement of Cash Flow quarterly items contain period data. If you’re looking at data for the 1st quarter of a company, you’re seeing 3 months of information. If you’re looking at the 2nd quarter, you’re seeing 6 months of information. The 3rd quarter contains 9 months of information and the 4th quarter contains 12 months of information.
This item represents the total sources of funds reported by a company reporting either a Working Capital Statement (Format Code = 1) or Cash by Source and Use of Funds Statement (Format Code = 2).
This item contains a Not Available data code (@NA) for a company reporting either a Cash Statement by Activity (Format Code = 3) or a Statement of Cash Flows (Format Code = 7).
This item excludes increase (decrease) in working capital for a company reporting a Working Capital Statement (Format Code = 1).
This item is not available for banks or utilities.
Data is presented on a historical basis.
The first quarter of data availability is 1984, first quarter.
Sources of Funds - Total 12MM Mnemonic FSRCT12
Concept calculation (@IF(@PERIOD(0Q)=4,FSRCTQ,(FSRCTQ+ FSRCTQ[@QTR(0Q)-@PERIOD(0Q)]-FSRCTQ [-4])))
Units Millions of dollars
This item represents the total sources of funds reported by a company reporting either a Working Capital Statement (Format Code = 1) or Cash by Source and Use of Funds Statement (Format Code = 2).
This item contains a Not Available data code (@NA) for a company reporting either a Cash Statement by Activity (Format Code = 3) or a Statement of Cash Flows (Format Code = 7).

845
Chapter 25 Statement of Cash Flows/Statement of Changes
This item excludes increase (decrease) in working capital for a company reporting a Working Capital Statement (Format Code = 1).
This item is not available for banks or utilities.
12-Month Moving When the 4th quarter is the current period, this concept returns Sources of Funds - Total – Quarterly, which contains 12 months of period data from the Statement of Cash Flows.
In the 1st-3rd quarters, this concept calculates a 12-month moving figure by adding:
+ the quarterly figure in the current quarter + the 4th quarter figure from the prior year – the quarterly figure from 4 quarters ago .
For example, when the current period is 3rd quarter this concept adds 9 months of period data in 3rd quarter of the current year, plus 12 months of period data from 4th quarter last year, minus 9 months of period data from 3rd quarter last year, which equals 12 months of data (9 months from the current year plus 3 months from the prior year).
Uses of Funds - Other Mnemonic FUSEO
Statement Statement of Changes
Annual Data Item Number A219
Units Millions of dollars
This item represents uses of funds not classified elsewhere on a Working Capital Statement (Format Code = 1), a Cash by Source and Use of Funds Statement (Format Code = 2), or a Cash Statement by Activity (Format Code = 3).
This item contains a Not Available data code (@NA) for a company reporting a Statement of Cash Flows (Format Code = 7).
This item includes 1. Changes due to foreign currency exchange adjustments shown separately
2. Working capital changes not clearly reported as one total and/or not distinctly grouped together in one section within Uses for either a Cash by Source and Use of Funds Statement (Format Code = 2) or a Cash Statement by Activity Format (Code = 3)
This item excludes working capital changes clearly reported as one total and/or distinctly grouped together in one section within Uses for either a Cash by Source and Use of Funds Statement (Format Code = 2), or a Cash Statement by Activity (Format Code = 3).
This item is not available for banks or utilities.
Uses of Funds - Other - Quarterly Mnemonic FUSEOQ
Statement Statement of Cash Flows/Statement of Changes
Quarterly Data Item Number Q95

Research Insight North America Data Guide
846
Units Millions of dollars
Important! Statement of Cash Flow quarterly items contain period data. If you’re looking at data for the 1st quarter of a company, you’re seeing 3 months of information. If you’re looking at the 2nd quarter, you’re seeing 6 months of information. The 3rd quarter contains 9 months of information and the 4th quarter contains 12 months of information.
This item represents uses of funds not classified elsewhere on a Working Capital Statement (Format Code = 1), a Cash by Source and Use of Funds Statement (Format Code = 2), or a Cash Statement by Activity (Format Code = 3).
This item contains a Not Available data code (@NA) for a company reporting a Statement of Cash Flows (Format Code = 7).
This item includes 1. Changes due to foreign currency exchange adjustments shown separately
2. Working capital changes not clearly reported as one total and/or not distinctly grouped together in one section within Uses for either a Cash by Source and Use of Funds Statement (Format Code = 2) or a Cash Statement by Activity Format (Code = 3)
This item excludes working capital changes clearly reported as one total and/or distinctly grouped together in one section within Uses for either a Cash by Source and Use of Funds Statement (Format Code = 2), or a Cash Statement by Activity (Format Code = 3).
This item is not available for banks or utilities.
Data is presented on a historical basis.
Uses of Funds - Other 12MM Mnemonic FUSEO12
Concept calculation (@IF(@PERIOD(0Q)=4,FUSEOQ,(FUSEOQ+ FUSEOQ[@QTR(0Q)-@PERIOD(0Q)]-FUSEOQ [-4])))
Units Millions of dollars
This item represents uses of funds not classified elsewhere on a Working Capital Statement (Format Code = 1), a Cash by Source and Use of Funds Statement (Format Code = 2), or a Cash Statement by Activity (Format Code = 3).
This item contains a Not Available data code (@NA) for a company reporting a Statement of Cash Flows (Format Code = 7).
This item includes 1. Changes due to foreign currency exchange adjustments shown separately
2. Working capital changes not clearly reported as one total and/or not distinctly grouped together in one section within Uses for either a Cash by Source and Use of Funds Statement (Format Code = 2) or a Cash Statement by Activity Format (Code = 3)
This item excludes working capital changes clearly reported as one total and/or distinctly grouped together in one section within Uses for either a Cash by Source and Use of Funds Statement (Format Code = 2), or a Cash Statement by Activity (Format Code = 3).
This item is not available for banks or utilities.

847
Chapter 25 Statement of Cash Flows/Statement of Changes
12-Month Moving When the 4th quarter is the current period, this concept returns Uses of Funds - Other – Quarterly, which contains 12 months of period data from the Statement of Cash Flows.
In the 1st-3rd quarters, this concept calculates a 12-month moving figure by adding:
+ the quarterly figure in the current quarter + the 4th quarter figure from the prior year – the quarterly figure from 4 quarters ago .
For example, when the current period is 3rd quarter this concept adds 9 months of period data in 3rd quarter of the current year, plus 12 months of period data from 4th quarter last year, minus 9 months of period data from 3rd quarter last year, which equals 12 months of data (9 months from the current year plus 3 months from the prior year).
Use of Funds - Total Mnemonic FUSET
Statement Statement of Changes
Annual Data Item Number A116
Units Millions of dollars
This item represents total uses of funds as reported by a company reporting either a Working Capital Statement (Format Code = 1) or a Cash by Source and Use of Funds Statement (Format Code = 2).
This item contains a Not Available data code (@NA) for a company reporting a Cash Statement by Activity Statement (Format Code = 3) or a Statement of Cash Flows (Format Code = 7).
This item includes 1. Changes due to foreign currency exchange adjustments shown separately
2. Working capital changes presented in the Uses section on a Cash by Source and Use of Funds Statement (Format Code = 2)
3. Working capital changes presented as uses of funds which decrease cash on a Cash Statement by Activity (Format Code = 3)
This item excludes working capital changes clearly reported as one total and/or distinctly grouped together in one section within Uses for either a Cash by Source and Use of Funds Statement (Format Code = 2).
This item is not available for banks or utilities.
Use of Funds - Total - Quarterly Mnemonic FUSETQ
Statement Statement of Cash Flows/Statement of Changes
Quarterly Data Item Number Q96
Units Millions of dollars

Research Insight North America Data Guide
848
Important! Statement of Cash Flow quarterly items contain period data. If you’re looking at data for the 1st quarter of a company, you’re seeing 3 months of information. If you’re looking at the 2nd quarter, you’re seeing 6 months of information. The 3rd quarter contains 9 months of information and the 4th quarter contains 12 months of information.
This item represents total uses of funds as reported by a company reporting either a Working Capital Statement (Format Code = 1) or a Cash by Source and Use of Funds Statement (Format Code = 2).
This item contains a Not Available data code (@NA) for a company reporting a Cash Statement by Activity Statement (Format Code = 3) or a Statement of Cash Flows (Format Code = 7).
This item includes 1. Changes due to foreign currency exchange adjustments shown separately
2. Working capital changes presented in the Uses section on a Cash by Source and Use of Funds Statement (Format Code = 2)
3. Working capital changes presented as uses of funds which decrease cash on a Cash Statement by Activity (Format Code = 3)
This item excludes working capital changes clearly reported as one total and/or distinctly grouped together in one section within Uses for either a Cash by Source and Use of Funds Statement (Format Code = 2).
This item is not available for banks or utilities.
Data is presented on a historical basis.
Uses of Funds - Total 12MM Mnemonic FUSET12
Concept calculation (@IF(@PERIOD(0Q)=4,FUSETQ,(FUSETQ+ FUSETQ[@QTR(0Q)-@PERIOD(0Q)]-FUSETQ [-4])))
Units Millions of dollars
This item represents total uses of funds as reported by a company reporting either a Working Capital Statement (Format Code = 1) or a Cash by Source and Use of Funds Statement (Format Code = 2).
This item contains a Not Available data code (@NA) for a company reporting a Cash Statement by Activity Statement (Format Code = 3) or a Statement of Cash Flows (Format Code = 7).
This item includes 1. Changes due to foreign currency exchange adjustments shown separately
2. Working capital changes presented in the Uses section on a Cash by Source and Use of Funds Statement (Format Code = 2)
3. Working capital changes presented as uses of funds which decrease cash on a Cash Statement by Activity (Format Code = 3)
This item excludes working capital changes clearly reported as one total and/or distinctly grouped together in one section within Uses for either a Cash by Source and Use of Funds Statement (Format Code = 2).
This item is not available for banks or utilities.

849
Chapter 25 Statement of Cash Flows/Statement of Changes
12-Month Moving When the 4th quarter is the current period, this concept returns Uses of Funds - Total – Quarterly, which contains 12 months of period data from the Statement of Cash Flows.
In the 1st-3rd quarters, this concept calculates a 12-month moving figure by adding:
+ the quarterly figure in the current quarter + the 4th quarter figure from the prior year – the quarterly figure from 4 quarters ago .
For example, when the current period is 3rd quarter this concept adds 9 months of period data in 3rd quarter of the current year, plus 12 months of period data from 4th quarter last year, minus 9 months of period data from 3rd quarter last year, which equals 12 months of data (9 months from the current year plus 3 months from the prior year).
Working Capital Changes - Other - Increase (Decrease) Mnemonic WCAPC
Annual Data Item Number A236
Units Millions of dollars
This item represents working capital changes other than changes in cash and cash equivalents and changes in current debt.
This item contains a Not Available data code (@NA) for companies reporting a Statement of Cash Flows (Format Code = 7).
Changes in working capital which provide a source of funds or serve to increase working capital are presented as positive numbers. Changes in working capital which use funds or decrease working capital are negative.
For the period 1971 - 1983, this item contains a Combined Figure data code (@CF) for companies reporting a Cash by Source and Use of Funds Statement (Format Code = 2).
This item is not available for banks or utilities.
Working Capital Changes - Other - Increase (Decrease) - Quarterly Mnemonic WCAPCQ
Statement Statement of Cash Flows/Statement of Changes
Quarterly Data Item Number Q73
Units Millions of dollars
Important! Statement of Cash Flow quarterly items contain period data. If you’re looking at data for the 1st quarter of a company, you’re seeing 3 months of information. If you’re looking at the 2nd quarter, you’re seeing 6 months of information. The 3rd quarter contains 9 months of information and the 4th quarter contains 12 months of information.
This item represents the difference between total current assets minus total current liabilities as reported on a company's Balance Sheet.

Research Insight North America Data Guide
850
This item is not available for banks or utilities.
Working Capital - Change - Other Increase (Decrease) 12MM Mnemonic WCAPC12
Concept calculation (@IF(@PERIOD(0Q)=4,WCAPCQ,(WCAPCQ+ WCAPCQ[@QTR(0Q)-@PERIOD(0Q)]-WCAPCQ [-4])))
Units Millions of dollars
This item represents working capital changes other than changes in cash and cash equivalents and changes in current debt.
This item contains a Not Available data code (@NA) for companies reporting a Statement of Cash Flows (Format Code = 7).
Changes in working capital which provide a source of funds or serve to increase working capital are presented as positive numbers. Changes in working capital which use funds or decrease working capital are negative.
For the period 1971 - 1983, this item contains a Combined Figure data code (@CF) for companies reporting a Cash by Source and Use of Funds Statement (Format Code = 2).
This item is not available for banks or utilities.
12-Month Moving When the 4th quarter is the current period, this concept returns Change in Working Capital - Other Increase (Decrease) – Quarterly, which contains 12 months of period data from the Statement of Cash Flows.
In the 1st-3rd quarters, this concept calculates a 12-month moving figure by adding:
+ the quarterly figure in the current quarter + the 4th quarter figure from the prior year – the quarterly figure from 4 quarters ago .
For example, when the current period is 3rd quarter this concept adds 9 months of period data in 3rd quarter of the current year, plus 12 months of period data from 4th quarter last year, minus 9 months of period data from 3rd quarter last year, which equals 12 months of data (9 months from the current year plus 3 months from the prior year).
Working Capital Changes - Total Mnemonic WCAPCH
Statement Statement of Cash Flows/Statement of Changes
Annual Data Item Number A180
Units Millions of dollars
This item represents the difference between total sources and total uses as reported on a Working Capital Statement (Format Code = 1).
This item includes changes in current debt.

851
Chapter 25 Statement of Cash Flows/Statement of Changes
This item presents a Not Available data code (@NA) for companies reporting a Cash by Source and Use of Funds Statement (Format Code = 2), a Cash Statement by Activity (Format Code = 3), or a Statement of Cash Flows (Format Code = 7).
This item is not available for banks or utilities.
Working Capital Changes - Total - Quarterly Mnemonic WCAPTQ
Statement Statement of Cash Flows/Statement of Changes
Quarterly Data Item Number Q101
Units Millions of dollars
Important! Statement of Cash Flow quarterly items contain period data. If you’re looking at data for the 1st quarter of a company, you’re seeing 3 months of information. If you’re looking at the 2nd quarter, you’re seeing 6 months of information. The 3rd quarter contains 9 months of information and the 4th quarter contains 12 months of information.
This item represents the difference between total sources and total uses as reported on a Working Capital Statement (Format Code = 1).
This item includes changes in current debt.
This item presents a Not Available data code (@NA) for companies reporting a Cash by Source and Use of Funds Statement (Format Code = 2), a Cash Statement by Activity (Format Code = 3), or a Statement of Cash Flows (Format Code = 7).
This item is not available for banks or utilities.
The quarterly item is available only when a company uses a Working Capital Statement (Format Code = 1).


853
Chapter 26 Thomson First Call Estimates
Thomson First Call Estimates
Thomson Financial's First Call database of global analyst estimates contains consensus earnings estimates, analysts' recommendations and related investment information from more than 170 contributing firms. This database is available with a separate subscription agreement.
Estimates are provided for two quarters and two fiscal years of consensus earnings estimate data, expected report dates, consensus recommendations, future growth rates, earnings surprise data, operating actual earnings, and P/E ratios. The database also contains earnings estimate consensus trends and estimate revision momentum data to help you compare recent performance to expected performance.
Reference Items
Data Item Name
Cash Flow Estimates Mnemonic . . . page
EPS Estimates Mnemonic . . . page
FIRST CALL Consensus Recommendation
FCCONRECC . . . 971 FCCONREC . . . 1014
FIRST CALL Last Revision Date FCLRC . . . 971 FCLR . . . 1013 FIRST CALL Latest Report Date FCLRDC . . . 972 FCLRD . . . 1014 FIRST CALL Median Long-Term Growth Rate
FCSGRMDC . . . 982 FCSGRMD . . . 995
FIRST CALL Momentum Revision Date
FCMODTEC . . . 971 FCMODTE . . . 1013
Peg Ratio with Thomson FIRST CALL Estimate
PEGFCC . . . 971 PEGFC . . . 995
Growth Rates
Data Item Name
Cash Flow Estimates Mnemonic . . . page
EPS Estimates Mnemonic . . . page
FIRST CALL Growth Rate - High FCSGRHIC . . . 980 FCSGRHI . . . 993 FIRST CALL Growth Rate - Low FCSGRLOC . . . 981 FCSGRLO . . . 994 FIRST CALL Growth Rate - Number of Analysts
FCSGRAEC . . . 981 FCSGRAE . . . 994
FIRST CALL Growth Rate - Standard Deviation
FCSGRSDC . . . 981 FCSGRSD . . . 994
FIRST CALL Growth Rate - Variance FCSGRVRC . . . 981 FCSGRVR . . . 994 FIRST CALL Mean Growth Rate FCSGRAVC . . . 981 FCSGRAV . . . 994 FIRST CALL Median Long-Term Growth Rate
FCSGRMDC . . . 982 FCSGRMD . . . 995
CHAPTER 26
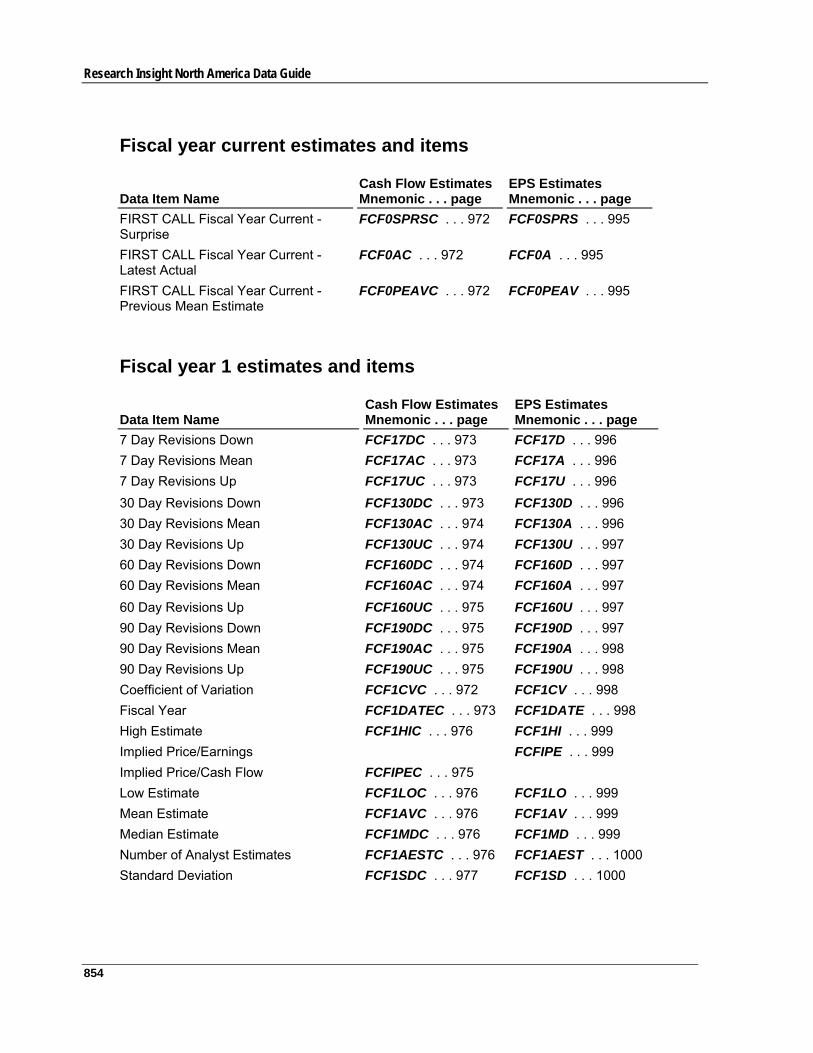
Research Insight North America Data Guide
854
Fiscal year current estimates and items
Data Item Name
Cash Flow Estimates Mnemonic . . . page
EPS Estimates Mnemonic . . . page
FIRST CALL Fiscal Year Current - Surprise
FCF0SPRSC . . . 972 FCF0SPRS . . . 995
FIRST CALL Fiscal Year Current - Latest Actual
FCF0AC . . . 972 FCF0A . . . 995
FIRST CALL Fiscal Year Current - Previous Mean Estimate
FCF0PEAVC . . . 972 FCF0PEAV . . . 995
Fiscal year 1 estimates and items
Data Item Name
Cash Flow Estimates Mnemonic . . . page
EPS Estimates Mnemonic . . . page
7 Day Revisions Down FCF17DC . . . 973 FCF17D . . . 996 7 Day Revisions Mean FCF17AC . . . 973 FCF17A . . . 996 7 Day Revisions Up FCF17UC . . . 973 FCF17U . . . 996 30 Day Revisions Down FCF130DC . . . 973 FCF130D . . . 996 30 Day Revisions Mean FCF130AC . . . 974 FCF130A . . . 996 30 Day Revisions Up FCF130UC . . . 974 FCF130U . . . 997 60 Day Revisions Down FCF160DC . . . 974 FCF160D . . . 997 60 Day Revisions Mean FCF160AC . . . 974 FCF160A . . . 997 60 Day Revisions Up FCF160UC . . . 975 FCF160U . . . 997 90 Day Revisions Down FCF190DC . . . 975 FCF190D . . . 997 90 Day Revisions Mean FCF190AC . . . 975 FCF190A . . . 998 90 Day Revisions Up FCF190UC . . . 975 FCF190U . . . 998 Coefficient of Variation FCF1CVC . . . 972 FCF1CV . . . 998 Fiscal Year FCF1DATEC . . . 973 FCF1DATE . . . 998 High Estimate FCF1HIC . . . 976 FCF1HI . . . 999 Implied Price/Earnings FCFIPE . . . 999 Implied Price/Cash Flow FCFIPEC . . . 975 Low Estimate FCF1LOC . . . 976 FCF1LO . . . 999 Mean Estimate FCF1AVC . . . 976 FCF1AV . . . 999 Median Estimate FCF1MDC . . . 976 FCF1MD . . . 999 Number of Analyst Estimates FCF1AESTC . . . 976 FCF1AEST . . . 1000 Standard Deviation FCF1SDC . . . 977 FCF1SD . . . 1000

855
Chapter 26 Thomson First Call Estimates
Fiscal year 2 estimates and items
Data Item Name
Cash Flow Estimates Mnemonic . . . page
EPS Estimates Mnemonic . . . page
7 Day Revisions Down FCF27DC . . . 977 FCF27D . . . 1000 7 Day Revisions Mean FCF27AC . . . 977 FCF27A . . . 1000 7 Day Revisions Up FCF27UC . . . 977 FCF27U . . . 1000 30 Day Revisions Down FCF230DC . . . 977 FCF230D . . . 1001 30 Day Revisions Mean FCF230AC . . . 978 FCF230A . . . 1001 30 Day Revisions Up FCF230UC . . . 978 FCF230U . . . 1001 60 Day Revisions Down FCF260DC . . . 978 FCF260D . . . 1001 60 Day Revisions Mean FCF260AC . . . 978 FCF260A . . . 1001 60 Day Revisions Up FCF260UC . . . 979 FCF260U . . . 1002 90 Day Revisions Down FCF290DC . . . 979 FCF290D . . . 1002 90 Day Revisions Mean FCF290AC . . . 979 FCF290A . . . 1002 90 Day Revisions Up FCF290UC . . . 979 FCF290U . . . 1002 High Estimate FCF2HIC . . . 979 FCF2HI . . . 1003 Low Estimate FCF2LOC . . . 980 FCF2LO . . . 1003 Mean Estimate FCF2AVC . . . 980 FCF2AV . . . 1003 Median Estimate FCF2MDC . . . 980 FCF2MD . . . 1003 Number of Analyst Estimates FCF2AESTC . . . 980 FCF2AEST . . . 1003 Standard Deviation FCF2SDC . . . 980 FCF2SD . . . 1003
Fiscal quarter current estimates and items
Data Item Name
Cash Flow Estimates Mnemonic . . . page
EPS Estimates Mnemonic . . . page
7 Day Revisions Mean FCQ07AC . . . 982 FCQ07A . . . 1004 30 Day Revisions Mean FCQ030AC . . . 982 FCQ030A . . . 1004 60 Day Revisions Mean FCQ060AC . . . 982 FCQ060A . . . 982 90 Day Revisions Mean FCQ090AC . . . 982 FCQ090A . . . 1004 Surprise FCQ0SPRSC . . . 983 FCQ0SPRS . . . 1005 Latest Actual per Share FCQ0AC . . . 983 FCQ0A . . . 1004 Previous Mean Estimate FCQ0PEAVC . . . 983 FCQ0PEAV . . . 1005

Research Insight North America Data Guide
856
Fiscal quarter 1 estimates and items
Data Item Name
Cash Flow Estimates Mnemonic . . . page
EPS Estimates Mnemonic . . . page
7 Day Revisions Down FCQ17DC . . . 983 FCQ17D . . . 1005 7 Day Revisions Mean FCQ17AC . . . 983 FCQ17A . . . 1005 7 Day Revisions Up FCQ17UC . . . 984 FCQ17U . . . 1006 30 Day Revisions Down FCQ130DC . . . 984 FCQ130D . . . 1006 30 Day Revisions Mean FCQ130AC . . . 984 FCQ130A . . . 1006 30 Day Revisions Up FCQ130UC . . . 984 FCQ130U . . . 1006 60 Day Revisions Down FCQ160DC . . . 984 FCQ160D . . . 1006 60 Day Revisions Mean FCQ160AC . . . 985 FCQ160A . . . 1007 60 Day Revisions Up FCQ160UC . . . 985 FCQ160U . . . 1007 90 Day Revisions Down FCQ190DC . . . 985 FCQ190D . . . 1007 90 Day Revisions Mean FCQ190AC . . . 985 FCQ190A . . . 1007 90 Day Revisions Up FCQ190UC . . . 985 FCQ190U . . . 1007 Coefficient of Variation FCQ1CVC . . . 986 FCQ1CV . . . 1008 1 Year Ago Cash Flow and EPS FCQ1CFL . . . 991 FCQ1EPS . . . 1012 12 Months Moving FCQ112MMC . . . 986 FCQ112MM . . . 1005 Implied Price/Cash Flow FCQIPEC . . . 986 Implied Price/Earnings FCQIPE . . . 1008 High Estimate FCQ1HIC . . . 992 FCQ1HI . . . 1014 Low Estimate FCQ1LOC . . . 992 FCQ1LO . . . 1016 Mean Estimate FCQ1AVC . . . 992 FCQ1AV . . . 1016 Median Estimate FCQ1MDC . . . 993 FCQ1MD . . . 1015 Number of Analyst Estimates FCQ1AESTC . . . 993 FCQ1AEST . . . 1015 Quarter and Fiscal Year FCA1DATEC . . . 986 FCA1DATE . . . 1008 Standard Deviation FCQ1SDC . . . 993 FCQ1SD . . . 1016
Fiscal quarter 2 estimates and items
Data Item Name
Cash Flow Estimates Mnemonic . . . page
EPS Estimates Mnemonic . . . page
7 Day Revisions Down FCQ27DC . . . 986 FCQ27D . . . 1008 7 Day Revisions Mean FCQ27AC . . . 987 FCQ27A . . . 1008 7 Day Revisions Up FCQ27UC . . . 987 FCQ27U . . . 1009 30 Day Revisions Down FCQ230DC . . . 987 FCQ230D . . . 1009

857
Chapter 26 Thomson First Call Estimates
30 Day Revisions Mean FCQ230AC . . . 987 FCQ230A . . . 1009 30 Day Revisions Up FCQ230UC . . . 987 FCQ230U . . . 1009 60 Day Revisions Down FCQ260DC . . . 988 FCQ260D . . . 1009 60 Day Revisions Mean FCQ260AC . . . 988 FCQ260A . . . 1010 60 Day Revisions Up FCQ260UC . . . 988 FCQ260U . . . 1010 90 Day Revisions Down FCQ290DC . . . 1010 FCQ290D . . . 1010 90 Day Revisions Mean FCQ290AC . . . 989 FCQ290A . . . 1010 90 Day Revisions Up FCQ290UC . . . 989 FCQ290U . . . 1010 1 Year Ago Cash Flow and EPS FCQ2CFL . . . 991 FCQ2EPS . . . 1012 Expected Report Date FCQ2ERDC . . . 991 FCQ2ERD . . . 1015 High Estimate FCQ2HIC . . . 992 FCQ2HI . . . 1014 Low Estimate FCQ2LOC . . . 992 FCQ2LO . . . 1016 Mean Estimate FCQ2AVC . . . 992 FCQ2AV . . . 1016 Median Estimate FCQ2MDC . . . 993 FCQ2MD . . . 1015 Number of Analyst Estimates FCQ2AESTC . . . 993 FCQ2AEST . . . 1015 Standard Deviation FCQ2SDC . . . 993 FCQ2SD . . . 1016
Fiscal quarter 3 estimates and items
Data Item Name
Cash Flow Estimates Mnemonic . . . page
EPS Estimates Mnemonic . . . page
Expected Report Date FCQ3AERDC . . . 991 FCQ3AERD . . . 1015 High Estimate FCQ3HIC . . . 992 FCQ3HI . . . 1014 Low Estimate FCQ3LOC . . . 992 FCQ3LO . . . 1016 Mean Estimate FCQ3AVC . . . 992 FCQ3AV . . . 1016 Median Estimate FCQ3MDC . . . 993 FCQ3MD . . . 1015 Number of Analyst Estimates FCQ3AESTC . . . 993 FCQ3AEST . . . 1015 Standard Deviation FCQ3SDC . . . 993 FCQ3SD . . . 1016 1 Year Ago Cash Flow and EPS FCQ3CFL . . . 991 FCQ3EPS . . . 1012
Fiscal quarter 4 estimates and items
Data Item Name
Cash Flow Estimates Mnemonic . . . page
EPS Estimates Mnemonic . . . page
Expected Report Date FCQ4AERDC . . . 991 FCQ4AERD . . . 1015 High Estimate FCQ4HIC . . . 992 FCQ4HI . . . 1014 Low Estimate FCQ4LOC . . . 992 FCQ4LO . . . 1016 Mean Estimate FCQ4AVC . . . 992 FCQ4AV . . . 1016 Median Estimate FCQ4MDC . . . 993 FCQ4MD . . . 1015

Research Insight North America Data Guide
858
Number of Analyst Estimates FCQ4AESTC . . . 993 FCQ4AEST . . . 1015 Standard Deviation FCQ4SDC . . . 993 FCQ4SD . . . 1016 1 Year Ago Cash Flow and EPS FCQ4CFL . . . 991 FCQ4EPS . . . 1012

859
Chapter 26 Thomson First Call Estimates
Data Definitions
Peg Ratio with Thomson First Call Estimate - Cash Flow Mnemonic PEGFCC
Concept Calculation FCF1PEC/FCSGRMDC
This concept calculates a Price to Cash Flow ratio by dividing FIRST CALL F1-Implied Price/Cash Flow by the FIRST CALL LT Md Growth Rate.
Thomson First Call Last Revision Date - Cash Flow Mnemonic FCLRC
This item represents the date of the last revision of cash flow data received from an analyst for a given company (reported in MM/DD/YY format).
Thomson First Call Consensus Recommendation - Cash Flow Mnemonic FCCONRECC
This item represents the mean of all analysts’ current recommendations with regard to cash flow data. Recommendations are a translation of a specific analyst’s recommendation to the Thomson First Call recommendation scale, which ranges from 1 to 5 as follows:
Recommendation Scale
Buy 1
Buy/Hold 2
Hold 3
Hold/Sell 4
Sell 5
Thomson First Call Momentum Revisions Date - Cash Flow Mnemonic FCMODTEC
This item represents the latest process date for the earnings estimate Revisions Momentum Data.
For example, Thomson First Call Quarter 1 - 7 Days Revisions Up - Cash Flow (FCQ17UC), a Revisions Momentum data item, is an upward revision item based on FCMODTEC and going back 7 days (based on the 5-day business work week).
Thomson First Call Latest Report Date - Cash Flow Mnemonic FCLRDC

Research Insight North America Data Guide
860
This item represents the date which earnings per share are first publicly reported for a given company (in MM/DD/YY format).
Thomson First Call Fiscal Year Current - Surprise - Cash Flow Mnemonic FCF0SPRSC
Concept Calculation (FCF0AC – FCF0PEAVC) / @ABS (FCF0PEAVC) * 100
This concept represents the percentage change between actual earnings per share and mean earnings per share estimate for the most recently reported fiscal year.
Thomson First Call Fiscal Year Current - Previous Mean Estimate - Cash Flow Mnemonic FCF0PEAVC
This item represents the latest mean or arithmetic average of the annual cash flow estimate for the most recently reported fiscal year.
Thomson First Call Fiscal Year Current - Latest Actual - Cash Flow Mnemonic FCF0AC
This item represents the actual cash flow figure for the most recently reported fiscal year.
Thomson First Call Fiscal Year 1 - Coefficient of Variation - Cash Flow Mnemonic FCF1CVC
Concept Calculation FCF1SDC/FCF1AVC*100
This concept represents the percentage range within which two-thirds of all estimates fall for the current fiscal year plus 1.
Thomson First Call Fiscal Year 1 - Fiscal Year - Cash Flow Mnemonic FCF1DATEC
This item represents the fiscal year for the current year plus 1 (in the Yyy format, for example Y95).
Thomson First Call Fiscal Year 1 - 7 Day Revisions Down - Cash Flow Mnemonic FCF17DC
This item represents the total number of Brokers that have submitted a downward (downgrade) revision estimate based on 7 days ago from the Thomson First Call Momentum Revisions Date for a given company for the current fiscal year plus 1. This number is a "point in time" and not a cumulative calculation.

861
Chapter 26 Thomson First Call Estimates
Thomson First Call Fiscal Year 1 - 7 Day Revisions Mean - Cash Flow Mnemonic FCF17AC
This item represents the arithmetic mean based on 7 days ago from the Thomson First Call Momentum Revisions Date for a given company for the current fiscal year plus 1. This number is a "point in time" and not a cumulative calculation.
Thomson First Call Fiscal Year 1 - 7 Day Revisions Up - Cash Flow Mnemonic FCF17UC
This item represents the total number of Brokers that have submitted an upward (upgrade) revision estimate based on 7 days ago from the Thomson First Call Momentum Revisions Date for a given company for the current fiscal year plus 1. This number is a "point in time" and not a cumulative calculation.
Thomson First Call Fiscal Year 1 - 30 Day Revisions Down - Cash Flow Mnemonic FCF130DC
This item represents the total number of Brokers that have submitted a downward (downgrade) revision estimate based on 30 days ago from the Thomson First Call Momentum Revisions Date for a given company for the current fiscal year plus 1. This number is a "point in time" and not a cumulative calculation.
Thomson First Call Fiscal Year 1 - 30 Day Revisions Mean - Cash Flow Mnemonic FCF130AC
This item represents the arithmetic mean based on 30 days ago from the Thomson First Call Momentum Revisions Date for a given company for the current fiscal year plus 1. This number is a "point in time" and not a cumulative calculation.
Thomson First Call Fiscal Year 1 - 30 Day Revisions Up - Cash Flow Mnemonic FCF130UC
This item represents the total number of Brokers that have submitted an upward (upgrade) revision estimate based on 30 days ago from the Thomson First Call Momentum Revisions Date for a given company for the current fiscal year plus 1. This number is a "point in time" and not a cumulative calculation.
Thomson First Call Fiscal Year 1 - 60 Day Revisions Down - Cash Flow Mnemonic FCF160DC
This item represents the total number of Brokers that have submitted a downward (downgrade) revision estimate based on 60 days ago from the Thomson First Call Momentum Revisions Date for a given company for the current fiscal year plus 1. This number is a "point in time" and not a cumulative calculation.

Research Insight North America Data Guide
862
Thomson First Call Fiscal Year 1 - 60 Day Revisions Mean - Cash Flow Mnemonic FCF160AC
This item represents the arithmetic mean based on 60 days ago from the Thomson First Call Momentum Revisions Date for a given company for the current fiscal year plus 1. This number is a "point in time" and not a cumulative calculation.
Thomson First Call Fiscal Year 1 - 60 Day Revisions Up - Cash Flow Mnemonic FCF160UC
This item represents the total number of Brokers that have submitted an upward (upgrade) revision estimate based on 60 days ago from the Thomson First Call Momentum Revisions Date for a given company for the current fiscal year plus 1. This number is a "point in time" and not a cumulative calculation.
Thomson First Call Fiscal Year 1 - 90 Day Revisions Down - Cash Flow Mnemonic FCF190DC
This item represents the total number of Brokers that have submitted a downward (downgrade) revision estimate based on 90 days ago from the Thomson First Call Momentum Revisions Date for a given company for the current fiscal year plus 1. This number is a "point in time" and not a cumulative calculation.
Thomson First Call Fiscal Year 1 - 90 Day Revisions Mean - Cash Flow Mnemonic FCF190AC
This item represents the arithmetic mean based on 90 days ago from the Thomson First Call Momentum Revisions Date for a given company for the current fiscal year plus 1. This number is a "point in time" and not a cumulative calculation.
Thomson First Call Fiscal Year 1 - 90 Day Revisions Up - Cash Flow Mnemonic FCF190UC
This item represents the total number of Brokers that have submitted an upward (upgrade) revision estimate based on 90 days ago from the Thomson First Call Momentum Revisions Date for a given company for the current fiscal year plus 1. This number is a "point in time" and not a cumulative calculation.
Thomson First Call Fiscal Year 1 - Implied Price/Cash Flow Mnemonic FCF1PEC
Concept Calculation @VALUE(PRCCUR,PRCCM)/FCF1AVC
This concept represents the current price divided by the cash flow estimate one year out from the actual.

863
Chapter 26 Thomson First Call Estimates
Thomson First Call Fiscal Year 1 - High Estimate - Cash Flow Mnemonic FCF1HIC
This item represents the highest of all current individual estimates for the current fiscal year plus 1.
Thomson First Call Fiscal Year 1 - Low Estimate - Cash Flow Mnemonic FCF1LOC
This item represents the lowest of all current individual estimates for the current fiscal year plus 1.
Thomson First Call Fiscal Year 1 - Mean Estimate - Cash Flow Mnemonic FCF1AVC
This item represents the arithmetic mean of all current estimates received from analysts for the current fiscal year plus 1.
Thomson First Call Fiscal Year 1 - Median Estimate - Cash Flow Mnemonic FCF1MDC
This item represents the middle estimate of all individual analyst estimates for the current fiscal year plus 1. When placed in ordinal rank if there is an even number of estimates, the median is calculated as the mid-point between the two middle estimates.
Thomson First Call Fiscal Year 1 - Number of Analyst Estimates - Cash Flow Mnemonic FCF1AESTC
This item represents the total number of analysts with estimates for the specified fiscal year or quarter.
Thomson First Call Fiscal Year 1 - Standard Deviation - Cash Flow Mnemonic FCF1SDC
This item represents the positive square root of the variance of the individual analyst estimates for the current fiscal year plus 1. Variance is a measure of dispersion or variability of estimates about the mean. It is defined as the average of the square of the deviations of the estimates about the mean.
Thomson First Call Fiscal Year 2 - 7 Day Revisions Down - Cash Flow Mnemonic FCF27DC
This item represents the total number of Brokers that have submitted a downward (downgrade) revision estimate based on 7 days ago from the Thomson First Call Momentum Revisions Date for a given company for the current fiscal year plus 2. This number is a "point in time" and not a cumulative calculation.

Research Insight North America Data Guide
864
Thomson First Call Fiscal Year 2 - 7 Day Revisions Mean - Cash Flow Mnemonic FCF27AC
This item represents the arithmetic mean based on 7 days ago from the Thomson First Call Momentum Revisions Date for a given company for the current fiscal year plus 2. This number is a "point in time" and not a cumulative calculation.
Thomson First Call Fiscal Year 2 - 7 Day Revisions Up - Cash Flow Mnemonic FCF27UC
This item represents the total number of Brokers that have submitted an upward (upgrade) revision estimate based on 7 days ago from the Thomson First Call Momentum Revisions Date for a given company for the current fiscal year plus 2. This number is a "point in time" and not a cumulative calculation.
Thomson First Call Fiscal Year 2 - 30 Day Revisions Down - Cash Flow Mnemonic FCF230DC
This item represents the total number of Brokers that have submitted a downward (downgrade) revision estimate based on 30 days ago from the Thomson First Call Momentum Revisions Date for a given company for the current fiscal year plus 2. This number is a "point in time" and not a cumulative calculation.
Thomson First Call Fiscal Year 2 - 30 Day Revisions Mean - Cash Flow Mnemonic FCF230AC
This item represents the arithmetic mean based on 30 days ago from the Thomson First Call Momentum Revisions Date for a given company for the current fiscal year plus 2. This number is a "point in time" and not a cumulative calculation.
Thomson First Call Fiscal Year 2 - 30 Day Revisions Up - Cash Flow Mnemonic FCF230UC
This item represents the total number of Brokers that have submitted an upward (upgrade) revision estimate based on 30 days ago from the Thomson First Call Momentum Revisions Date for a given company for the current fiscal year plus 2. This number is a "point in time" and not a cumulative calculation.
Thomson First Call Fiscal Year 2 - 60 Day Revisions Down - Cash Flow Mnemonic FCF260DC

865
Chapter 26 Thomson First Call Estimates
This item represents the total number of Brokers that have submitted a downward (downgrade) revision estimate based on 60 days ago from the Thomson First Call Momentum Revisions Date for a given company for the current fiscal year plus 2. This number is a "point in time" and not a cumulative calculation.
Thomson First Call Fiscal Year 2 - 60 Day Revisions Mean - Cash Flow Mnemonic FCF260AC
This item represents the arithmetic mean based on 60 days ago from the Thomson First Call Momentum Revisions Date for a given company for the current fiscal year plus 2. This number is a "point in time" and not a cumulative calculation.
Thomson First Call Fiscal Year 2 - 60 Day Revisions Up - Cash Flow Mnemonic FCF260UC
This item represents the total number of Brokers that have submitted an upward (upgrade) revision estimate based on 60 days ago from the Thomson First Call Momentum Revisions Date for a given company for the current fiscal year plus 2. This number is a "point in time" and not a cumulative calculation.
Thomson First Call Fiscal Year 2 - 90 Day Revisions Down - Cash Flow Mnemonic FCF290DC
This item represents the total number of Brokers that have submitted a downward (downgrade) revision estimate based on 90 days ago from the Thomson First Call Momentum Revisions Date for a given company for the current fiscal year plus 2. This number is a "point in time" and not a cumulative calculation.
Thomson First Call Fiscal Year 2 - 90 Day Revisions Mean - Cash Flow Mnemonic FCF290AC
This item represents the arithmetic mean based on 90 days ago from the Thomson First Call Momentum Revisions Date for a given company for the current fiscal year plus 2. This number is a "point in time" and not a cumulative calculation.
Thomson First Call Fiscal Year 2 - 90 Day Revisions Up - Cash Flow Mnemonic FCF290UC
This item represents the total number of Brokers that have submitted an upward (upgrade) revision estimate based on 90 days ago from the Thomson First Call Momentum Revisions Date for a given company for the current fiscal year plus 2. This number is a "point in time" and not a cumulative calculation.
Thomson First Call Fiscal Year 2 - High Estimate - Cash Flow Mnemonic FCF2HIC

Research Insight North America Data Guide
866
This item represents the highest of all current individual estimates for the current fiscal year plus two.
Thomson First Call Fiscal Year 2 - Median Estimate - Cash Flow Mnemonic FCF2MDC
This item represents the middle estimate of all individual analyst estimates for the current fiscal year plus two. When placed in ordinal rank, if there is an even number of estimates, the median is calculated as the mid-point between the two middle estimates.
Thomson First Call Fiscal Year 2 - Low Estimate - Cash Flow Mnemonic FCF2LOC
This item represents the lowest of all current individual estimates for the current fiscal year plus two.
Thomson First Call Fiscal Year 2 - Mean Estimate - Cash Flow Mnemonic FCF2AVC
This item represents the arithmetic mean of all current estimates received from analysts for the current fiscal year plus two.
Thomson First Call Fiscal Year 2 - Number of Analyst Estimates - Cash Flow Mnemonic FCF2AESTC
This item represents the total number of analysts with estimates for the current fiscal year plus two.
Thomson First Call Fiscal Year 2 - Standard Deviation - Cash Flow Mnemonic FCF2SDC
This item represents the positive square root of the variance of the individual analyst estimates for the current fiscal year plus two. Variance is a measure of dispersion or variability of estimates about the mean. It is defined as the average of the square of the deviations of the estimates about the mean.
Thomson First Call Growth Rate - High - Cash Flow Mnemonic FCSGRHIC
This item represents latest available highest of all the individual analyst annual growth rate estimates.
Thomson First Call Growth Rate - Low - Cash Flow Mnemonic FCSGRLOC
This item represents latest available lowest of all the individual analyst annual growth rate estimates.

867
Chapter 26 Thomson First Call Estimates
Thomson First Call Growth Rate - Number of Analysts - Cash Flow Mnemonic FCSGRAEC
This item represents the total number of analysts reporting latest available annual growth rate.
Thomson First Call Growth Rate - Standard Deviation - Cash Flow Mnemonic FCSGRSDC
This item represents latest available positive square root of the variance of the individual analyst annual growth rate estimates. Variance is a measure of dispersion or variability of estimates about the mean. It is defined as the average of the square of the deviations of the estimates about the mean.
Thomson First Call Growth Rate - Variance - Cash Flow Mnemonic FCSGRVRC
This item represents latest available variance of the individual analyst annual growth rate estimates. Variance is a measure of dispersion or variability of estimates about the mean. It is defined as the average of the square of the deviations of the estimates about the mean.
Thomson First Call Mean Growth Rate - Cash Flow Mnemonic FCSGRAVC
This item represents latest available mean annual growth rate of all individual analyst growth rates.
Thomson First Call Median Long-Term Growth Rate - Cash Flow Mnemonic FCSGRMDC
This item represents the middle long-term growth rate of all individual analyst growth rates. When placed in ordinal rank, if there is an even number of growth rates, the median is calculated as the mid-point between the two middle values.
Thomson First Call Current Quarter - 7 Day Revisions Mean - Cash Flow Mnemonic FCQ07AC
This item represents the arithmetic mean as of 7 days ago for a given company for the most recently reported quarter.
Thomson First Call Current Quarter - 30 Day Revisions Mean - Cash Flow Mnemonic FCQ030AC

Research Insight North America Data Guide
868
This item represents the arithmetic mean as of 30 days ago for a given company for the most recently reported quarter.
Thomson First Call Current Quarter - 60 Day Revisions Mean - Cash Flow Mnemonic FCQ060AC
This item represents the arithmetic mean as of 60 days ago for a given company for the most recently reported quarter.
Thomson First Call Current Quarter - 90 Day Revisions Mean - Cash Flow Mnemonic FCQ090AC
This item represents the arithmetic mean as of 90 days ago for a given company for the most recently reported quarter.
Thomson First Call Current Quarter - Latest Actual Per Share - Cash Flow Mnemonic FCQ0AC
This item represents the actual cash flow figure for the most recently reported fiscal quarter.
Thomson First Call Current Quarter - Previous Mean Estimate - Cash Flow Mnemonic FCQ0PEAVC
This item represents the latest mean or arithmetic average of the quarterly estimates for the most recently reported quarter.
Thomson First Call Current Quarter - Surprise - Cash Flow Mnemonic FCQ0SPRSC
Concept Calculation (FCQ0QAC – FCQ0PEAVC) / @ABS (FCQ0PEAVC) * 100
This concept represents the percentage change between cash flow estimate and mean cash flow estimate for the most recently reported quarter.
Thomson First Call Quarter 1 - 7 Day Revisions Down - Cash Flow Mnemonic FCQ17DC
This item represents the total number of Brokers that have submitted a downward (downgrade) revision estimate based on 7 days ago from the Thomson First Call Momentum Revisions Date for a given company for the current quarter plus 1. This number is a "point in time" and not a cumulative calculation.

869
Chapter 26 Thomson First Call Estimates
Thomson First Call Quarter 1 - 7 Day Revisions Mean - Cash Flow Mnemonic FCQ17AC
This item represents the arithmetic mean based on 7 days ago from the Thomson First Call Momentum Revisions Date for a given company for the current quarter plus 1. This number is a "point in time" and not a cumulative calculation.
Thomson First Call Quarter 1 - 7 Day Revisions Up - Cash Flow Mnemonic FCQ17UC
This item represents the total number of Brokers that have submitted an upward (upgrade) revision estimate based on 7 days ago from the Thomson First Call Momentum Revisions Date for a given company for the quarter year plus 1. This number is a "point in time" and not a cumulative calculation.
Thomson First Call Quarter 1 - 30 Day Revisions Down - Cash Flow Mnemonic FCQ130DC
This item represents the total number of Brokers that have submitted a downward (downgrade) revision estimate based on 30 days ago from the Thomson First Call Momentum Revisions Date for a given company for the current quarter plus 1. This number is a "point in time" and not a cumulative calculation.
Thomson First Call Quarter 1 - 30 Day Revisions Mean - Cash Flow Mnemonic FCQ130AC
This item represents the arithmetic mean based on 30 days ago from the Thomson First Call Momentum Revisions Date for a given company for the current quarter plus 1. This number is a "point in time" and not a cumulative calculation.
Thomson First Call Quarter 1 - 30 Day Revisions Up - Cash Flow Mnemonic FCQ130UC
This item represents the total number of Brokers that have submitted an upward (upgrade) revision estimate based on 30 days ago from the Thomson First Call Momentum Revisions Date for a given company for the quarter year plus 1. This number is a "point in time" and not a cumulative calculation.
Thomson First Call Quarter 1 - 60 Day Revisions Down - Cash Flow Mnemonic FCQ160DC
This item represents the total number of Brokers that have submitted a downward (downgrade) revision estimate based on 60 days ago from the Thomson First Call Momentum Revisions Date for a given company for the current quarter plus 1. This number is a "point in time" and not a cumulative calculation.
Thomson First Call Quarter 1 - 60 Day Revisions Mean - Cash Flow Mnemonic FCQ160AC
This item represents the arithmetic mean based on 60 days ago from the Thomson First Call Momentum Revisions Date for a given company for the current quarter plus 1. This number is a "point in time" and not a cumulative calculation.

Research Insight North America Data Guide
870
Thomson First Call Quarter 1 - 60 Day Revisions Up - Cash Flow Mnemonic FCQ160UC
This item represents the total number of Brokers that have submitted an upward (upgrade) revision estimate based on 60 days ago from the Thomson First Call Momentum Revisions Date for a given company for the quarter year plus 1. This number is a "point in time" and not a cumulative calculation.
Thomson First Call Quarter 1 - 90 Day Revisions Down - Cash Flow Mnemonic FCQ190DC
This item represents the total number of Brokers that have submitted a downward (downgrade) revision estimate based on 90 days ago from the Thomson First Call Momentum Revisions Date for a given company for the current quarter plus 1. This number is a "point in time" and not a cumulative calculation.
Thomson First Call Quarter 1 - 90 Day Revisions Mean - Cash Flow Mnemonic FCQ190AC
This item represents the arithmetic mean based on 90 days ago from the Thomson First Call Momentum Revisions Date for a given company for the current quarter plus 1. This number is a "point in time" and not a cumulative calculation.
Thomson First Call Quarter 1 - 90 Day Revisions Up - Cash Flow Mnemonic FCQ190UC
This item represents the total number of Brokers that have submitted an upward (upgrade) revision estimate based on 90 days ago from the Thomson First Call Momentum Revisions Date for a given company for the quarter year plus 1. This number is a "point in time" and not a cumulative calculation.
Thomson First Call Quarter 1 - 12 Months Moving - Cash Flow Mnemonic FCQ112MMC
Concept Calculation FCQ1CFL+ FCQ2CFL + FCQ3CFL + FCQ4CFL
This item represents the sum of the cash flow figure for the current quarter latest actual and the three previous actual quarterly cash flow figures.
Thomson First Call Quarter 1 - Coefficient of Variation - Cash Flow Mnemonic FCQ1CVC
Concept Calculation FCQ1SDC/FCQ1AVC*100
This concept represents the percentage range within which two-thirds of all estimates fall for the current quarter plus 1.
Thomson First Call Quarter 1 - Quarter & Fiscal Year - Cash Flow Mnemonic FCQ1DATEC

871
Chapter 26 Thomson First Call Estimates
This item represents the quarter and fiscal year for the current quarter plus 1 (in Qq/Yyy format, for example Q4Y99).
Thomson First Call Quarter 1 - Implied Price/Cash Flow Mnemonic FCQ1PEC
Concept Calculation @VALUE(PRCCUR,PRCCM)/FCQ12MMC
This concept represents the current price divided by the 12 months moving earnings per share estimate.
Thomson First Call Quarter 2 - 7 Day Revisions Down - Cash Flow Mnemonic FCQ27DC
This item represents the total number of Brokers that have submitted a downward (downgrade) revision estimate based on 7 days ago from the Thomson First Call Momentum Revisions Date for a given company for the current quarter plus 2. This number is a "point in time" and not a cumulative calculation.
Thomson First Call Quarter 2 - 7 Day Revisions Mean - Cash Flow Mnemonic FCQ27AC
This item represents the arithmetic mean based on 7 days ago from the Thomson First Call Momentum Revisions Date for a given company for the current quarter plus 2. This number is a "point in time" and not a cumulative calculation.
Thomson First Call Quarter 2 - 7 Day Revisions Up - Cash Flow Mnemonic FCQ27UC
This item represents the total number of Brokers that have submitted an upward (upgrade) revision estimate based on 7 days ago from the Thomson First Call Momentum Revisions Date for a given company for the quarter year plus 2. This number is a "point in time" and not a cumulative calculation.
Thomson First Call Quarter 2 - 30 Day Revisions Down - Cash Flow Mnemonic FCQ230DC
This item represents the total number of Brokers that have submitted a downward (downgrade) revision estimate based on 30 days ago from the Thomson First Call Momentum Revisions Date for a given company for the current quarter plus 2. This number is a "point in time" and not a cumulative calculation.
Thomson First Call Quarter 2 - 30 Day Revisions Mean - Cash Flow Mnemonic FCQ230AC
This item represents the arithmetic mean based on 30 days ago from the Thomson First Call Momentum Revisions Date for a given company for the current quarter plus 2. This number is a "point in time" and not a cumulative calculation.

Research Insight North America Data Guide
872
Thomson First Call Quarter 2 - 30 Day Revisions Up - Cash Flow Mnemonic FCQ230UC
This item represents the total number of Brokers that have submitted an upward (upgrade) revision estimate based on 30 days ago from the Thomson First Call Momentum Revisions Date for a given company for the quarter year plus 2. This number is a "point in time" and not a cumulative calculation.
Thomson First Call Quarter 2 - 60 Day Revisions Down - Cash Flow Mnemonic FCQ260DC
This item represents the total number of Brokers that have submitted a downward (downgrade) revision estimate based on 60 days ago from the Thomson First Call Momentum Revisions Date for a given company for the current quarter plus 2. This number is a "point in time" and not a cumulative calculation.
Thomson First Call Quarter 2 - 60 Day Revisions Mean - Cash Flow Mnemonic FCQ260AC
This item represents the arithmetic mean based on 60 days ago from the Thomson First Call Momentum Revisions Date for a given company for the current quarter plus 2. This number is a "point in time" and not a cumulative calculation.
Thomson First Call Quarter 2 - 60 Day Revisions Up - Cash Flow Mnemonic FCQ260UC
This item represents the total number of Brokers that have submitted an upward (upgrade) revision estimate based on 60 days ago from the Thomson First Call Momentum Revisions Date for a given company for the quarter year plus 2. This number is a "point in time" and not a cumulative calculation.
Thomson First Call Quarter 2 - 90 Day Revisions Down - Cash Flow Mnemonic FCQ290DC
This item represents the total number of Brokers that have submitted a downward (downgrade) revision estimate based on 90 days ago from the Thomson First Call Momentum Revisions Date for a given company for the current quarter plus 2. This number is a "point in time" and not a cumulative calculation.
Thomson First Call Quarter 2 - 90 Day Revisions Mean - Cash Flow Mnemonic FCQ290AC
This item represents the arithmetic mean based on 90 days ago from the Thomson First Call Momentum Revisions Date for a given company for the current quarter plus 2. This number is a "point in time" and not a cumulative calculation.
Thomson First Call Quarter 2 - 90 Day Revisions Up - Cash Flow Mnemonic FCQ290UC

873
Chapter 26 Thomson First Call Estimates
This item represents the total number of Brokers that have submitted an upward (upgrade) revision estimate based on 90 days ago from the Thomson First Call Momentum Revisions Date for a given company for the quarter year plus 2. This number is a "point in time" and not a cumulative calculation.
Thomson First Call Quarter 4 - 12 Months Moving - Cash Flow Mnemonic FCQ412MMC
This item represents a four-quarter summation of the cash flow figure 1 Year Ago from the Current Quarter - Latest Actual as reported by First Call.
It is the aggregation of FCQ0CFL and its three previous actual quarterly cash flow figures.
Example: If Current Quarter – Latest Actual were Q4Y02, then this 12-Months Moving figure would be the sum of the cash flow amounts from the following time periods:
Q1Y01
+ Q2Y01
+ Q3Y01
+ Q4Y01
Thomson First Call Previous - 1 Year Ago - Surprise 0B - Cash Flow Mnemonic FCQSPRS0C
Concept Calculation (FCQ0CFL-FCQ0PCFL)/@ABS(FCQ0PCFL)*100
This concept represents the percentage change between actual cash flow and mean cash flow estimate for the period that is four quarters prior to the current quarter.
Thomson First Call Previous - 1 Year Ago - Surprise 1B - Cash Flow Mnemonic FCQSPRS1C
Concept Calculation (FCQ1CFL-FCQ1PCFL)/@ABS(FCQ1PCFL)*100
This concept represents the percentage change between actual cash flow and mean cash flow estimate for the period that is three quarters prior to the current quarter.
Thomson First Call Previous - 1 Year Ago - Surprise 2B - Cash Flow Mnemonic FCQSPRS2C
Concept Calculation (FCQ2CFL-FCQ2PCFL)/@ABS(FCQ2PCFL)*100
This concept represents the percentage change between actual cash flow and mean cash flow estimate for the period that is two quarters prior to the current quarter.
Thomson First Call Previous - 1 Year Ago - Surprise 3B - Cash Flow Mnemonic FCQSPRS3C
Concept Calculation (FCQ3CFL-FCQ3PCFL)/@ABS(FCQ3PCFL)*100

Research Insight North America Data Guide
874
This concept represents the percentage change between actual cash flow and mean cash flow estimate for the period that is one quarter prior to the current quarter.
Thomson First Call Previous - 1 Year Ago - Cash Flow
Mnemonic Time Period Description Quarter 0 FCQ0PCFL Current Quarter minus 4 Quarter 1 FCQ1PCFL Current Quarter minus 3 Quarter 2 FCQ2PCFL Current Quarter minus 2 Quarter 3 FCQ3PCFL Current Quarter minus 1
This item represents the latest mean or arithmetic average of the quarterly cash flow estimates.
Quarter 3 is one quarter prior to the Latest Actual Quarter 2 is two quarters prior to the Latest Actual Quarter 1 is three quarters prior to the Latest Actual Quarter 0 is four quarters prior to the Latest Actual (1 year ago)
Thomson First Call 1 Year Ago - Cash Flow
Mnemonic Time Period Description Quarter 0 FCQ0CFL Current Quarter minus 4 Quarter 1 FCQ1CFL Current Quarter minus 3 Quarter 2 FCQ2CFL Current Quarter minus 2 Quarter 3 FCQ3CFL Current Quarter minus 1 Quarter 4 FCQ4CFL Current Quarter - Latest
Actual
This item represents the actual cash flow figure as reported by First Call.
Quarter 4 is the most recently reported actual cash flow – the current Latest Actual Quarter 3 is one quarter prior to the Latest Actual Quarter 2 is two quarters prior to the Latest Actual Quarter 1 is three quarters prior to the Latest Actual Quarter 0 is four quarters prior to the Latest Actual (1 year ago)
Thomson First Call Expected Report Date - Cash Flow Mnemonic
Quarter 1 FCQ1ERDC
Quarter 2 FCQ2ERDC
Quarter 3 FCQ3ERDC
Quarter 4 FCQ4ERDC

875
Chapter 26 Thomson First Call Estimates
This item represents the expected earnings announcement date for the current quarter plus 1(for Quarter 1), two (for Quarter 2), three (for Quarter 3) or four (for Quarter 4)in MM/DD/YY format.
Thomson First Call Expected Report Date - Footnotes - Cash Flow Mnemonic
Quarter 1 FCQ1ERDFC
Quarter 2 FCQ2ERDFC
Quarter 3 FCQ3ERDFC
Quarter 4 FCQ4ERDFC
Code Description
Blank The company is expected to report earnings on the date indicated in the Expected Report Date item.
W The company is expected to report earnings in the week of the date indicated in the Expected Report Date item.
Thomson First Call High Estimate - Cash Flow Mnemonic
Quarter 1 FCQ1HIC
Quarter 2 FCQ2HIC
Quarter 3 FCQ3HIC
Quarter 4 FCQ4HIC
This item represents the highest of all current individual estimates for the current quarter plus 1 (for Quarter 1), two (for Quarter 2), three (for Quarter 3) or four (for Quarter 4).
Thomson First Call Low Estimate - Cash Flow Mnemonic
Quarter 1 FCQ1LOC
Quarter 2 FCQ2LOC
Quarter 3 FCQ3LOC
Quarter 4 FCQ4LOC
This item represents the lowest of all current individual estimates for the current quarter plus 1 (for Quarter 1), two (for Quarter 2), three (for Quarter 3) or four (for Quarter 4).

Research Insight North America Data Guide
876
Thomson First Call Mean Estimate - Cash Flow Mnemonic
Quarter 1 FCQ1AVC
Quarter 2 FCQ2AVC
Quarter 3 FCQ3AVC
Quarter 4 FCQ4AVC
This item represents the arithmetic mean of all current estimates received from analysts for the current quarter plus 1 (for Quarter 1), two (for Quarter 2), three (for Quarter 3) or four (for Quarter 4).
Thomson First Call Median Estimate - Cash Flow Mnemonic
Quarter 1 FCQ1MDC
Quarter 2 FCQ2MDC
Quarter 3 FCQ3MDC
Quarter 4 FCQ4MDC
This item represents the middle estimate of all individual analyst estimates for the current quarter plus 1 (for Quarter 1), two (for Quarter 2), three (for Quarter 3) or four (for Quarter 4). When placed in ordinal rank, if there is an even number of estimates, the median is calculated as the mid-point between the two middle estimates.
Thomson First Call Number of Analyst Estimates - Cash Flow Mnemonic
Quarter 1 FCQ1AESTC
Quarter 2 FCQ2AESTC
Quarter 3 FCQ3AESTC
Quarter 4 FCQ4AESTC
This item represents the total number of analysts with estimates for the current quarter plus 1(for Quarter 1), two (for Quarter 2), three (for Quarter 3) or four (for Quarter 4).
Thomson First Call Standard Deviation - Cash Flow Mnemonic
Quarter 1 FCQ1SDC
Quarter 2 FCQ2SDC
Quarter 3 FCQ3SDC
Quarter 4 FCQ4SDC

877
Chapter 26 Thomson First Call Estimates
This item represents the positive square root of the variance of the individual analyst estimates for the current quarter plus 1 (for Quarter 1), two (for Quarter 2), three (for Quarter 3) or four (for Quarter 4). Variance is a measure of dispersion or variability of estimates about the mean. It is defined as the average of the square of the deviations of the estimates about the mean.
Thomson First Call High - Growth Rate Mnemonic FCSGRHI
This item represents latest available highest of all the individual analyst annual growth rate estimates.
Thomson First Call Low - Growth Rate Mnemonic FCSGRLO
This item represents latest available lowest of all the individual analyst annual growth rate estimates.
Thomson First Call Variance - Growth Rate Mnemonic FCSGRVR
This item represents the latest available variance of the individual analyst annual growth rate estimates. Variance is a measure of dispersion or variability of estimates about the mean. It is defined as the average of the square of the deviations of the estimates about the mean.
Thomson First Call Number of Analysts - Growth Rate Mnemonic FCSGRAE
This item represents the total number of analysts reporting latest available annual growth rate.
Thomson First Call Standard Deviation - Growth Rate Mnemonic FCSGRSD
This item represents latest available positive square root of the variance of the individual analyst annual growth rate estimates. Variance is a measure of dispersion or variability of estimates about the mean. It is defined as the average of the square of the deviations of the estimates about the mean.
Thomson First Call Mean - Growth Rate Mnemonic FCSGRAV
This item represents the latest available mean annual growth rate of all individual analyst growth rates.

Research Insight North America Data Guide
878
Thomson First Call Median Long-Term - Growth Rate Mnemonic FCSGRMD
This item represents the middle long-term growth rate of all individual analyst growth rates. When placed in ordinal rank, if there is an even number of growth rates, the median is calculated as the mid-point between the two middle values.
Peg Ratio with Thomson First Call Estimate Mnemonic PEGFC
Concept Calculation FCF1PE/FCSGRMD
This concept calculates the Peg ratio by dividing Thomsons First Call F1-Implied P/E by Thomson First Call LT Md Growth Rate.
Thomson First Call Fiscal Year Current - Latest Actual - Earnings Per Share Mnemonic FCF0A
This item represents the actual earnings per share figure for the most recently reported fiscal year.
Thomson First Call Fiscal Year Current - Previous Mean Estimate - Earnings Per Share Mnemonic FCF0PEAV
This item represents the latest mean or arithmetic average of the annual earnings per share estimates for the most recently reported fiscal year.
Thomson First Call Fiscal Year Current - Surprise - Earnings Per Share Mnemonic FCF0SPRS
Concept Calculation (FCF0A – FCF0PEAV) / @ABS (FCF0PEAV) * 100
This concept represents the percentage change between actual earnings per share and mean earnings per share estimate for the most recently reported fiscal year.
Thomson First Call Fiscal Year 1 - 7 Day Revisions Down - Earnings Per Share Mnemonic FCF17D
This item represents the total number of Brokers that have submitted a downward (downgrade) revision estimate based on 7 days ago from the Thomson First Call Momentum Revisions Date for a given company for the current fiscal year plus 1. This number is a "point in time" and not a cumulative calculation.

879
Chapter 26 Thomson First Call Estimates
Thomson First Call Fiscal Year 1 - 7 Day Revisions Mean - Earnings Per Share Mnemonic FCF17A
This item represents the arithmetic mean based on 7 days ago from the Thomson First Call Momentum Revisions Date for a given company for the current fiscal year plus 1. This number is a "point in time" and not a cumulative calculation.
Thomson First Call Fiscal Year 1 - 7 Day Revisions Up - Earnings Per Share Mnemonic FCF17U
This item represents the total number of Brokers that have submitted an upward (upgrade) revision estimate based on 7 days ago from the Thomson First Call Momentum Revisions Date for a given company for the current fiscal year plus 1. This number is a "point in time" and not a cumulative calculation.
Thomson First Call Fiscal Year 1 - 30 Day Revisions Down - Earnings Per Share Mnemonic FCF130D
This item represents the total number of Brokers that have submitted a downward (downgrade) revision estimate based on 30 days ago from the Thomson First Call Momentum Revisions Date for a given company for the current fiscal year plus 1. This number is a "point in time" and not a cumulative calculation.
Thomson First Call Fiscal Year 1 - 30 Day Revisions Mean - Earnings Per Share Mnemonic FCF130A
This item represents the arithmetic mean based on 30 days ago from the Thomson First Call Momentum Revisions Date for a given company for the current fiscal year plus 1. This number is a "point in time" and not a cumulative calculation.
Thomson First Call Fiscal Year 1 - 30 Day Revisions Up - Earnings Per Share Mnemonic FCF130U
This item represents the total number of Brokers that have submitted an upward (upgrade) revision estimate based on 30 days ago from the Thomson First Call Momentum Revisions Date for a given company for the current fiscal year plus 1. This number is a "point in time" and not a cumulative calculation.
Thomson First Call Fiscal Year 1 - 60 Day Revisions Down - Earnings Per Share Mnemonic FCF160D

Research Insight North America Data Guide
880
This item represents the total number of Brokers that have submitted a downward (downgrade) revision estimate based on 60 days ago from the Thomson First Call Momentum Revisions Date for a given company for the current fiscal year plus 1. This number is a "point in time" and not a cumulative calculation.
Thomson First Call Fiscal Year 1 - 60 Day Revisions Mean - Earnings Per Share Mnemonic FCF160A
This item represents the arithmetic mean based on 60 days ago from the Thomson First Call Momentum Revisions Date for a given company for the current fiscal year plus 1. This number is a "point in time" and not a cumulative calculation.
Thomson First Call Fiscal Year 1 - 60 Day Revisions Up - Earnings Per Share Mnemonic FCF160U
This item represents the total number of Brokers that have submitted an upward (upgrade) revision estimate based on 60 days ago from the Thomson First Call Momentum Revisions Date for a given company for the current fiscal year plus 1. This number is a "point in time" and not a cumulative calculation.
Thomson First Call Fiscal Year 1 - 90 Day Revisions Down - Earnings Per Share Mnemonic FCF190D
This item represents the total number of Brokers that have submitted a downward (downgrade) revision estimate based on 90 days ago from the Thomson First Call Momentum Revisions Date for a given company for the current fiscal year plus 1. This number is a "point in time" and not a cumulative calculation.
Thomson First Call Fiscal Year 1 - 90 Day Revisions Mean - Earnings Per Share Mnemonic FCF190A
This item represents the arithmetic mean based on 90 days ago from the Thomson First Call Momentum Revisions Date for a given company for the current fiscal year plus 1. This number is a "point in time" and not a cumulative calculation.
Thomson First Call Fiscal Year 1 - 90 Day Revisions Up - Earnings Per Share Mnemonic FCF190U
This item represents the total number of Brokers that have submitted an upward (upgrade) revision estimate based on 90 days ago from the Thomson First Call Momentum Revisions Date for a given company for the current fiscal year plus 1. This number is a "point in time" and not a cumulative calculation.

881
Chapter 26 Thomson First Call Estimates
Thomson First Call Fiscal Year 1 - Coefficient of Variation - Earnings Per Share Mnemonic FCF1CV
Concept Calculation FCF1SD/FCF1AV*100
This concept represents the percentage range within which two-thirds of all estimates fall for the current fiscal year plus 1.
Thomson First Call Fiscal Year 1 - Fiscal Year - Earnings Per Share Mnemonic FCF1DATE
This item represents the fiscal year for the current year plus 1 (in the Yyy format, for example Y95).
Thomson First Call Fiscal Year 1 - High Estimate - Earnings Per Share Mnemonic FCF1HI
This item represents the highest of all current individual estimates for the current fiscal year plus 1.
Thomson First Call Fiscal Year 1 - Implied Price/Earnings - Earnings Per Share Mnemonic FCF1PE
Concept Calculation @VALUE(PRCCUR,PRCCM)/FCF1AV
This concept represents the current price divided by the fiscal year plus 1 mean earnings per share estimate.
Thomson First Call Fiscal Year 1 - Low Estimate - Earnings Per Share Mnemonic FCF1LO
This item represents the lowest of all current individual estimates for the current fiscal year plus 1.
Thomson First Call Fiscal Year 1 - Mean Estimate - Earnings Per Share Mnemonic FCF1AV
This item represents the arithmetic mean of all current estimates received from analysts for the current fiscal year plus 1.
Thomson First Call Fiscal Year 1 - Median Estimate - Earnings Per Share Mnemonic FCF1MD

Research Insight North America Data Guide
882
This item represents the middle estimate of all individual analyst estimates for the current fiscal year plus 1. When placed in ordinal rank if there is an even number of estimates, the median is calculated as the mid-point between the two middle estimates.
Thomson First Call Fiscal Year 1 - Number of Analyst Estimates - Earnings Per Share Mnemonic FCF1AEST
This item represents the total number of analysts with estimates for the specified fiscal year or quarter.
Thomson First Call Fiscal Year 1 - Standard Deviation - Earnings Per Share Mnemonic FCF1SD
This item represents the positive square root of the variance of the individual analyst estimates for the current fiscal year plus 1. Variance is a measure of dispersion or variability of estimates about the mean. It is defined as the average of the square of the deviations of the estimates about the mean.
Thomson First Call Fiscal Year 2 - 7 Day Revisions Down - Earnings Per Share Mnemonic FCF27D
This item represents the total number of Brokers that have submitted a downward (downgrade) revision estimate based on 7 days ago from the Thomson First Call Momentum Revisions Date for a given company for the current fiscal year plus 2. This number is a "point in time" and not a cumulative calculation.
Thomson First Call Fiscal Year 2 - 7 Day Revisions Mean - Earnings Per Share Mnemonic FCF27A
This item represents the arithmetic mean based on 7 days ago from the Thomson First Call Momentum Revisions Date for a given company for the current fiscal year plus 2. This number is a "point in time" and not a cumulative calculation.
Thomson First Call Fiscal Year 2 - 7 Day Revisions Up - Earnings Per Share Mnemonic FCF27U
This item represents the total number of Brokers that have submitted an upward (upgrade) revision estimate based on 7 days ago from the Thomson First Call Momentum Revisions Date for a given company for the current fiscal year plus 2. This number is a "point in time" and not a cumulative calculation.

883
Chapter 26 Thomson First Call Estimates
Thomson First Call Fiscal Year 2 - 30 Day Revisions Down - Earnings Per Share Mnemonic FCF230D
This item represents the total number of Brokers that have submitted a downward (downgrade) revision estimate based on 30 days ago from the Thomson First Call Momentum Revisions Date for a given company for the current fiscal year plus 2. This number is a "point in time" and not a cumulative calculation.
Thomson First Call Fiscal Year 2 - 30 Day Revisions Mean - Earnings Per Share Mnemonic FCF230A
This item represents the arithmetic mean based on 30 days ago from the Thomson First Call Momentum Revisions Date for a given company for the current fiscal year plus 2. This number is a "point in time" and not a cumulative calculation.
Thomson First Call Fiscal Year 2 - 30 Day Revisions Up - Earnings Per Share Mnemonic FCF230U
This item represents the total number of Brokers that have submitted an upward (upgrade) revision estimate based on 30 days ago from the Thomson First Call Momentum Revisions Date for a given company for the current fiscal year plus 2. This number is a "point in time" and not a cumulative calculation.
Thomson First Call Fiscal Year 2 - 60 Day Revisions Down - Earnings Per Share Mnemonic FCF260D
This item represents the total number of Brokers that have submitted a downward (downgrade) revision estimate based on 60 days ago from the Thomson First Call Momentum Revisions Date for a given company for the current fiscal year plus 2. This number is a "point in time" and not a cumulative calculation.
Thomson First Call Fiscal Year 2 - 60 Day Revisions Mean - Earnings Per Share Mnemonic FCF260A
This item represents the arithmetic mean based on 60 days ago from the Thomson First Call Momentum Revisions Date for a given company for the current fiscal year plus 2. This number is a "point in time" and not a cumulative calculation.

Research Insight North America Data Guide
884
Thomson First Call Fiscal Year 2 - 60 Day Revisions Up - Earnings Per Share Mnemonic FCF260U
This item represents the total number of Brokers that have submitted an upward (upgrade) revision estimate based on 60 days ago from the Thomson First Call Momentum Revisions Date for a given company for the current fiscal year plus 2. This number is a "point in time" and not a cumulative calculation.
Thomson First Call Fiscal Year 2 - 90 Day Revisions Down - Earnings Per Share Mnemonic FCF290D
This item represents the total number of Brokers that have submitted a downward (downgrade) revision estimate based on 90 days ago from the Thomson First Call Momentum Revisions Date for a given company for the current fiscal year plus 2. This number is a "point in time" and not a cumulative calculation.
Thomson First Call Fiscal Year 2 - 90 Day Revisions Mean - Earnings Per Share Mnemonic FCF290A
This item represents the arithmetic mean based on 90 days ago from the Thomson First Call Momentum Revisions Date for a given company for the current fiscal year plus 2. This number is a "point in time" and not a cumulative calculation.
Thomson First Call Fiscal Year 2 - 90 Day Revisions Up - Earnings Per Share Mnemonic FCF290U
This item represents the total number of Brokers that have submitted an upward (upgrade) revision estimate based on 90 days ago from the Thomson First Call Momentum Revisions Date for a given company for the current fiscal year plus 2. This number is a "point in time" and not a cumulative calculation.
Thomson First Call Fiscal Year 2 - High Estimate - Earnings Per Share Mnemonic FCF2HI
This item represents the highest of all current individual estimates for the current fiscal year plus two.
Thomson First Call Fiscal Year 2 - Low Estimate - Earnings Per Share Mnemonic FCF2LO
This item represents the lowest of all current individual estimates for the current fiscal year plus two.

885
Chapter 26 Thomson First Call Estimates
Thomson First Call Fiscal Year 2 - Mean Estimate - Earnings Per Share Mnemonic FCF2AV
This item represents the arithmetic mean of all current estimates received from analysts for the current fiscal year plus two.
Thomson First Call Fiscal Year 2 - Median Estimate - Earnings Per Share Mnemonic FCF2MD
This item represents the middle estimate of all individual analyst estimates for the current fiscal year plus two. When placed in ordinal rank, if there is an even number of estimates, the median is calculated as the mid-point between the two middle estimates.
Thomson First Call Fiscal Year 2 - Number of Analyst Estimates - Earnings Per Share Mnemonic FCF2AEST
This item represents the total number of analysts with estimates for the current fiscal year plus two.
Thomson First Call Fiscal Year 2 - Standard Deviation - Earnings Per Share Mnemonic FCF2SD
This item represents the positive square root of the variance of the individual analyst estimates for the current fiscal year plus two. Variance is a measure of dispersion or variability of estimates about the mean. It is defined as the average of the square of the deviations of the estimates about the mean.
Thomson First Call Current Quarter - 7 Day Revisions Mean - Earnings Per Share Mnemonic FCQ07A
This item represents the arithmetic mean as of 7 days ago for a given company for the most recently reported quarter.
Thomson First Call Current Quarter - 30 Day Revisions Mean - Earnings Per Share Mnemonic FCQ030A
This item represents the arithmetic mean as of 30 days ago for a given company for the most recently reported quarter.
Thomson First Call Current Quarter - 60 Day Revisions Mean - Earnings Per Share Mnemonic FCQ060A

Research Insight North America Data Guide
886
This item represents the arithmetic mean as of 60 days ago for a given company for the most recently reported quarter.
Thomson First Call Current Quarter - 90 Day Revisions Mean - Earnings Per Share Mnemonic FCQ090A
This item represents the arithmetic mean as of 90 days ago for a given company for the most recently reported quarter.
Thomson First Call Current Quarter - Latest Actual - Earnings Per Share Mnemonic FCQ0A
This item represents the actual earnings per share figure for the most recently reported fiscal quarter.
Thomson First Call Current Quarter - Previous Mean Estimate - Earnings Per Share Mnemonic FCQ0PEAV
This item represents the latest mean or arithmetic average of the quarterly estimates for the most recently reported quarter.
Thomson First Call Current Quarter - Surprise - Earnings Per Share Mnemonic FCQ0SPRS
Concept Calculation (FCQ0QA – FCQ0PEAV) / @ABS (FCQ0PEAV) * 100
This concept represents the percentage change between actual earnings per share and mean earnings per share estimate for the most recently reported quarter.
Thomson First Call Quarter 1 - 12 Months Moving - Earnings Per Share Mnemonic FCQ112MM
Concept Calculation FCQ1EPS+ FCQ2EPS+ FCQ3EPS+ FCQ4EPS
This item represents the sum of the earnings per share figure for the current quarter latest actual and the three previous actual quarterly earnings per share figures.
Thomson First Call Quarter 1 - 7 Day Revisions Down - Earnings Per Share Mnemonic FCQ17D

887
Chapter 26 Thomson First Call Estimates
This item represents the total number of Brokers that have submitted a downward (downgrade) revision estimate based on 7 days ago from the Thomson First Call Momentum Revisions Date for a given company for the current quarter plus 1. This number is a "point in time" and not a cumulative calculation.
Thomson First Call Quarter 1 - 7 Day Revisions Mean - Earnings Per Share Mnemonic FCQ17A
This item represents the arithmetic mean based on 7 days ago from the Thomson First Call Momentum Revisions Date for a given company for the current quarter plus 1. This number is a "point in time" and not a cumulative calculation.
Thomson First Call Quarter 1 - 7 Day Revisions Up - Earnings Per Share Mnemonic FCQ17U
This item represents the total number of Brokers that have submitted an upward (upgrade) revision estimate based on 7 days ago from the Thomson First Call Momentum Revisions Date for a given company for the quarter year plus 1. This number is a "point in time" and not a cumulative calculation.
Thomson First Call Quarter 1 - 30 Day Revisions Down - Earnings Per Share Mnemonic FCQ130D
This item represents the total number of Brokers that have submitted a downward (downgrade) revision estimate based on 30 days ago from the Thomson First Call Momentum Revisions Date for a given company for the current quarter plus 1. This number is a "point in time" and not a cumulative calculation.
Thomson First Call Quarter 1 - 30 Day Revisions Mean - Earnings Per Share Mnemonic FCQ130A
This item represents the arithmetic mean based on 30 days ago from the Thomson First Call Momentum Revisions Date for a given company for the current quarter plus 1. This number is a "point in time" and not a cumulative calculation.
Thomson First Call Quarter 1 - 30 Day Revisions Up - Earnings Per Share Mnemonic FCQ130U
This item represents the total number of Brokers that have submitted an upward (upgrade) revision estimate based on 30 days ago from the Thomson First Call Momentum Revisions Date for a given company for the quarter year plus 1. This number is a "point in time" and not a cumulative calculation.
Thomson First Call Quarter 1 - 60 Day Revisions Down - Earnings Per Share Mnemonic FCQ160D

Research Insight North America Data Guide
888
This item represents the total number of Brokers that have submitted a downward (downgrade) revision estimate based on 60 days ago from the Thomson First Call Momentum Revisions Date for a given company for the current quarter plus 1. This number is a "point in time" and not a cumulative calculation.
Thomson First Call Quarter 1 - 60 Day Revisions Mean - Earnings Per Share Mnemonic FCQ160A
This item represents the arithmetic mean based on 60 days ago from the Thomson First Call Momentum Revisions Date for a given company for the current quarter plus 1. This number is a "point in time" and not a cumulative calculation.
Thomson First Call Quarter 1 - 60 Day Revisions Up - Earnings Per Share Mnemonic FCQ160U
This item represents the total number of Brokers that have submitted an upward (upgrade) revision estimate based on 60 days ago from the Thomson First Call Momentum Revisions Date for a given company for the quarter year plus 1. This number is a "point in time" and not a cumulative calculation.
Thomson First Call Quarter 1 - 90 Day Revisions Down - Earnings Per Share Mnemonic FCQ190D
This item represents the total number of Brokers that have submitted a downward (downgrade) revision estimate based on 90 days ago from the Thomson First Call Momentum Revisions Date for a given company for the current quarter plus 1. This number is a "point in time" and not a cumulative calculation.
Thomson First Call Quarter 1 - 90 Day Revisions Mean - Earnings Per Share Mnemonic FCQ190A
This item represents the arithmetic mean based on 90 days ago from the Thomson First Call Momentum Revisions Date for a given company for the current quarter plus 1. This number is a "point in time" and not a cumulative calculation.
Thomson First Call Quarter 1 - 90 Day Revisions Up - Earnings Per Share Mnemonic FCQ190U
This item represents the total number of upward revisions received within the last 90 days for a given company for the current quarter plus 1.
Thomson First Call Quarter 1 - Coefficient of Variation - Earnings Per Share Mnemonic FCQ1CV
Concept Calculation FCQ1SD/FCQ1AV*100

889
Chapter 26 Thomson First Call Estimates
This item represents the total number of Brokers that have submitted an upward (upgrade) revision estimate based on 90 days ago from the Thomson First Call Momentum Revisions Date for a given company for the quarter year plus 1. This number is a "point in time" and not a cumulative calculation.
Thomson First Call Quarter 1 - Implied Price/Earnings - Earnings Per Share Mnemonic FCQ1PE
Concept Calculation @VALUE(PRCCUR,PRCCM)/FCQ12MM
This concept represents the current price divided by the 12 months moving earnings per share estimate.
Thomson First Call Quarter 1 - Quarter & Fiscal Year - Earnings Per Share Mnemonic FCQ1DATE
This item represents the quarter and fiscal year for the current quarter plus 1 (in Qq/Yyy format, for example Q4Y99).
Thomson First Call Quarter 2 - 7 Day Revisions Down - Earnings Per Share Mnemonic FCQ27D
This item represents the total number of Brokers that have submitted a downward (downgrade) revision estimate based on 7 days ago from the Thomson First Call Momentum Revisions Date for a given company for the current quarter plus 2. This number is a "point in time" and not a cumulative calculation.
Thomson First Call Quarter 2 - 7 Day Revisions Mean - Earnings Per Share Mnemonic FCQ27A
This item represents the arithmetic mean based on 7 days ago from the Thomson First Call Momentum Revisions Date for a given company for the current quarter plus 2. This number is a "point in time" and not a cumulative calculation.
Thomson First Call Quarter 2 - 7 Day Revisions Up - Earnings Per Share Mnemonic FCQ27U
This item represents the total number of Brokers that have submitted an upward (upgrade) revision estimate based on 7 days ago from the Thomson First Call Momentum Revisions Date for a given company for the quarter year plus 2. This number is a "point in time" and not a cumulative calculation.

Research Insight North America Data Guide
890
Thomson First Call Quarter 2 - 30 Day Revisions Down - Earnings Per Share Mnemonic FCQ230D
This item represents the total number of Brokers that have submitted a downward (downgrade) revision estimate based on 30 days ago from the Thomson First Call Momentum Revisions Date for a given company for the current quarter plus 2. This number is a "point in time" and not a cumulative calculation.
Thomson First Call Quarter 2 - 30 Day Revisions Mean - Earnings Per Share Mnemonic FCQ230A
This item represents the arithmetic mean based on 30 days ago from the Thomson First Call Momentum Revisions Date for a given company for the current quarter plus 2. This number is a "point in time" and not a cumulative calculation.
Thomson First Call Quarter 2 - 30 Day Revisions Up - Earnings Per Share Mnemonic FCQ230U
This item represents the total number of Brokers that have submitted an upward (upgrade) revision estimate based on 30 days ago from the Thomson First Call Momentum Revisions Date for a given company for the quarter year plus 2. This number is a "point in time" and not a cumulative calculation.
Thomson First Call Quarter 2 - 60 Day Revisions Down - Earnings Per Share Mnemonic FCQ260D
This item represents the total number of Brokers that have submitted a downward (downgrade) revision estimate based on 60 days ago from the Thomson First Call Momentum Revisions Date for a given company for the current quarter plus 2. This number is a "point in time" and not a cumulative calculation.
Thomson First Call Quarter 2 - 60 Day Revisions Mean - Earnings Per Share Mnemonic FCQ260A
This item represents the arithmetic mean based on 60 days ago from the Thomson First Call Momentum Revisions Date for a given company for the current quarter plus 2. This number is a "point in time" and not a cumulative calculation.
Thomson First Call Quarter 2 - 60 Day Revisions Up - Earnings Per Share Mnemonic FCQ260U

891
Chapter 26 Thomson First Call Estimates
This item represents the total number of Brokers that have submitted an upward (upgrade) revision estimate based on 60 days ago from the Thomson First Call Momentum Revisions Date for a given company for the quarter year plus 2. This number is a "point in time" and not a cumulative calculation.
Thomson First Call Quarter 2 - 90 Day Revisions Down - Earnings Per Share Mnemonic FCQ290D
This item represents the total number of Brokers that have submitted a downward (downgrade) revision estimate based on 90 days ago from the Thomson First Call Momentum Revisions Date for a given company for the current quarter plus 2. This number is a "point in time" and not a cumulative calculation.
Thomson First Call Quarter 2 - 90 Day Revisions Mean - Earnings Per Share Mnemonic FCQ290A
This item represents the arithmetic mean based on 90 days ago from the Thomson First Call Momentum Revisions Date for a given company for the current quarter plus 2. This number is a "point in time" and not a cumulative calculation.
Thomson First Call Quarter 2 - 90 Day Revisions Up - Earnings Per Share Mnemonic FCQ290U
This item represents the total number of Brokers that have submitted an upward (upgrade) revision estimate based on 90 days ago from the Thomson First Call Momentum Revisions Date for a given company for the quarter year plus 2. This number is a "point in time" and not a cumulative calculation.
Thomson First Call Quarter 4 - 12 Months Moving - Earnings Per Share Mnemonic FCQ412MM
This item represents a four-quarter summation of the earnings per share figure 1 year ago from the Current Quarter - Latest Actual as reported by First Call. It is the aggregation of FCQ0EPS and its three previous actual quarterly earnings per share figures.
For example, if Current Quarter - Latest Actual were Q4Y02, then this 12-month moving figure would add the following time periods:
Q1Y01 + Q2Y01 + Q3Y01 + Q4Y01
Thomson First Call Previous - 1 Year Ago - Surprise 0B - Earnings Per Share Mnemonic FCQSPRS0
Concept Calculation (FCQ0EPS-FCQ0PEPS)/@ABS(FCQ0PEPS)*100
This concept represents the percentage change between actual earnings and mean earnings estimate for the period that is four quarters prior to the current quarter.

Research Insight North America Data Guide
892
Thomson First Call Previous - 1 Year Ago - Surprise 1B - Earnings Per Share Mnemonic FCQSPRS1
Concept Calculation (FCQ1EPS-FCQ1PEPS)/@ABS(FCQ1PEPS)*100
This concept represents the percentage change between actual earnings and mean earnings estimate for the period that is three quarters prior to the current quarter.
Thomson First Call Previous - 1 Year Ago - Surprise 2B - Earnings Per Share Mnemonic FCQSPRS2
Concept Calculation (FCQ2EPS-FCQ2PEPS)/@ABS(FCQ2PEPS)*100
This concept represents the percentage change between actual earnings and mean earnings estimate for the period that is two quarters prior to the current quarter.
Thomson First Call Previous - 1 Year Ago - Surprise 3B - Earnings Per Share Mnemonic FCQSPRS3
Concept Calculation (FCQ3EPS-FCQ3PEPS)/@ABS(FCQ3PEPS)*100
This concept represents the percentage change between actual earnings and mean earnings estimate for the period that is one quarter prior to the current quarter.
Thomson First Call 1 Year Ago - Earnings Per Share Mnemonic Time Period Description
Quarter 0 FCQ0EPS Current Quarter minus 4 Quarter 1 FCQ1EPS Current Quarter minus 3 Quarter 2 FCQ2EPS Current Quarter minus 2 Quarter 3 FCQ3EPS Current Quarter minus 1 Quarter 4 FCQ4EPS Current Quarter (Latest Actual)
This item represents the actual earnings per share figure as reported by First Call.
Quarter 4 is the most recently reported actual earnings – the current Latest Actual Quarter 3 is one quarter prior to the Latest Actual Quarter 2 is two quarters prior to the Latest Actual Quarter 1 is three quarters prior to the Latest Actual Quarter 0 is four quarters prior to the Latest Actual (1 year ago)
Thomson First Call Previous - 1 Year Ago - Earnings Per Share Mnemonic Time Period Description
Quarter 0 FCQ0PEPS Current Quarter minus 4

893
Chapter 26 Thomson First Call Estimates
Quarter 1 FCQ1PEPS Current Quarter minus 3 Quarter 2 FCQ2PEPS Current Quarter minus 2 Quarter 3 FCQ3PEPS Current Quarter minus 1
This item represents the latest mean or arithmetic average of the quarterly estimates.
Quarter 3 is one quarter prior to the current Latest Actual. Quarter 2 is one quarter prior to the current Latest Actual. Quarter 1 is one quarter prior to the current Latest Actual. Quarter 0 is one quarter prior to the current Latest Actual (1 Year Ago).
Thomson First Call Expected Report Date - Footnotes - Earnings Per Share Mnemonic
Quarter 1 FCQ1ERDF
Quarter 2 FCQ2ERDF
Quarter 3 FCQ3ERDF
Quarter 4 FCQ4ERDF
Code Description
Blank The company is expected to report earnings on the date indicated in the Expected Report Date item.
W The company is expected to report earnings in the week of the date indicated in the Expected Report Date item.
Thomson First Call Last Revision Date - Earnings Per Share Mnemonic FCLR
This item represents the date of the last revision for earnings per share data received from an analyst for a given company (reported in MM/DD/YY format).
Thomson First Call Momentum Revisions Date - Earnings Per Share Mnemonic FCMODTE
This item represents the latest process date for the earnings estimate Revisions Momentum Data.
For example, Thomson First Call Quarter 1 - 7 Days Revisions Up - Earnings Per Share (FCQ17U), a Revisions Momentum data item, is an upward revision item based on FCMODTE and going back 7 days (based on the 5-day business work week).

Research Insight North America Data Guide
894
Thomson First Call Latest Report Date - Earnings Per Share Mnemonic FCLRD
This item represents the date which earnings per share are first publicly reported for a given company (in MM/DD/YY format).
Thomson First Call Note - Earnings Per Share
Code Description
X Thomson First Call Earnings Estimate data reflects the exclusion of amortization of goodwill.
Thomson First Call Consensus Recommendation - Earnings Per Share Mnemonic FCCONREC
This item represents the mean of all analysts’ current recommendations with regards to earnings per share data. Recommendations are a translation of a specific analyst’s recommendation to the Thomson First Call recommendation scale, which ranges from 1 to 5 as follows:
Recommendation Scale
Buy 1
Buy/Hold 2
Hold 3
Hold/Sell 4
Sell 5
Thomson First Call High Estimate - Earnings Per Share Mnemonic
Quarter 1 FCQ1HI
Quarter 2 FCQ2HI
Quarter 3 FCQ3HI
Quarter 4 FCQ4HI
This item represents the highest of all current individual estimates for the current quarter plus 1 (for Quarter 1), two (for Quarter 2), three (for Quarter 3) or four (for Quarter 4).

895
Chapter 26 Thomson First Call Estimates
Thomson First Call Expected Report Date - Earnings Per Share Mnemonic
Quarter 1 FCQ1ERD
Quarter 2 FCQ2ERD
Quarter 3 FCQ3ERD
Quarter 4 FCQ4ERD
This item represents the expected earnings announcement date for the current quarter plus 1(for Quarter 1), two (for Quarter 2), three (for Quarter 3) or four (for Quarter 4)in MM/DD/YY format.
Thomson First Call Median Estimate - Earnings Per Share Mnemonic
Quarter 1 FCQ1MD
Quarter 2 FCQ2MD
Quarter 3 FCQ3MD
Quarter 4 FCQ4MD
This item represents the middle estimate of all individual analyst estimates for the current quarter plus 1 (for Quarter 1), two (for Quarter 2), three (for Quarter 3) or four (for Quarter 4). When placed in ordinal rank, if there is an even number of estimates, the median is calculated as the mid-point between the two middle estimates.
Thomson First Call Number of Analyst Estimates - Earnings Per Share Mnemonic
Quarter 1 FCQ1AEST
Quarter 2 FCQ2AEST
Quarter 3 FCQ3AEST
Quarter 4 FCQ4AEST
This item represents the total number of analysts with estimates for the current quarter plus 1 (for Quarter 1), two (for Quarter 2), three (for Quarter 3) or four (for Quarter 4).
Thomson First Call Mean Estimate - Earnings Per Share Mnemonic
Quarter 1 FCQ1AV
Quarter 2 FCQ2AV
Quarter 3 FCQ3AV
Quarter 4 FCQ4AV

Research Insight North America Data Guide
896
This item represents the arithmetic mean of all current estimates received from analysts for the current quarter plus 1 (for Quarter 1), two (for Quarter 2), three (for Quarter 3) or four (for Quarter 4).
Thomson First Call Standard Deviation - Earnings Per Share Mnemonic
Quarter 1 FCQ1SD
Quarter 2 FCQ2SD
Quarter 3 FCQ3SD
Quarter 4 FCQ4SD
This item represents the positive square root of the variance of the individual analyst estimates for the current quarter plus 1 (for Quarter 1), two (for Quarter 2), three (for Quarter 3) or four (for Quarter 4). Variance is a measure of dispersion or variability of estimates about the mean. It is defined as the average of the square of the deviations of the estimates about the mean.
Thomson First Call Low Estimate - Earnings Per Share Mnemonic
Quarter 1 FCQ1LO
Quarter 2 FCQ2LO
Quarter 3 FCQ3LO
Quarter 4 FCQ4LO
This item represents the lowest of all current individual estimates for the current quarter plus 1 (for Quarter 1), two (for Quarter 2), three (for Quarter 3) or four (for Quarter 4).

897
Chapter 27 Thomson I/B/E/S Estimates
Thomson I/B/E/S Estimates
The Institutional Brokers Estimate System (I/B/E/S) from Thomson Financial is a database of earnings expectations data obtained from more than 2,500 security analysts. The consensus earnings estimates for more than 3,000 companies are immediately available on Research Insight with a separate subscription agreement.
Earnings forecast information is received continuously from contributing research departments worldwide. Thomson I/B/E/S data researchers review the data and subject it to rigorous validity controls before it is allowed to be entered into the database.
Current estimates are updated on a weekly basis and are the most recent information available. Monthly estimates are updated the third week of the month. The data is available on Research Insight as of the subsequent month-end production. Estimates from each of the previous six months are presented for current year, next year, current quarter and next quarter.
Thomson I/B/E/S Estimates are available with a separate subscription.
Date of I/B/E/S estimates
Data Item Name
Current Mnemonic . . . page
Monthly Mnemonic . . . page
I/B/E/S Estimates Date IBDTEC IBDTE
Fiscal year 1 estimates
Data Item Name
Current Mnemonic . . . page
Monthly Mnemonic . . . page
I/B/E/S Average Estimate IBF1AC . . . 1027 IBF1AV . . . 1027 I/B/E/S Forecast IBF1PC . . . 1028 IBF1P . . . 1028 I/B/E/S High Estimate IBF1HC . . . 1029 IBF1HI . . . 1029 I/B/E/S Low Estimate IBF1LC . . . 1029 IBF1LO . . . 1030 I/B/E/S Median Estimate IBF1MC . . . 1030 IBF1MD . . . 1030 I/B/E/S Number of Estimates IBF1NC . . . 1040 IBF1N . . . 1030 I/B/E/S Number of Estimates Down IBF1DC . . . 1031 IBF1DN . . . 1031 I/B/E/S Number of Estimates Up IBF1UC . . . 1031 IBF1UP . . . 1031 I/B/E/S Standard Deviation of Estimates IBF1SC . . . 1028 IBF1SD . . . 1028
CHAPTER 27

Research Insight North America Data Guide
898
Fiscal year 2 estimates
Data Item Name
Current Mnemonic . . . page
Monthly Mnemonic . . . page
I/B/E/S Average Estimate IBF2AC . . . 1031 IBF2AV . . . 1032 I/B/E/S High Estimate IBF2HC . . . 1033 IBF2HI . . . 1033 I/B/E/S Low Estimate IBF2LC . . . 1034 IBF2LO . . . 1034 I/B/E/S Median Estimate IBF2MC . . . 1034 IBF2MD . . . 1034 I/B/E/S Number of Estimates IBF2NC . . . 1034 IBF2N . . . 1035 I/B/E/S Number of Estimates Down IBF2DC . . . 1035 IBF2DN . . . 1035 I/B/E/S Number of Estimates Up IBF2UC . . . 1035 IBF2UP . . . 1035 I/B/E/S Standard Deviation of Estimate IBF2SC . . . 1032 IBF2SD . . . 1032
Fiscal quarter 1 estimates
Data Item Name
Current Mnemonic . . . page
Monthly Mnemonic . . . page
I/B/E/S Average Estimate IBQ1AC . . . 1038 IBQ1AV . . . 1038 I/B/E/S Forecast IBQ1PC . . . 1039 IBQ1P . . . 1039 I/B/E/S High Estimate IBQ1HC . . . 1039 IBQ1HI . . . 1039 I/B/E/S Low Estimate IBQ1LC . . . 1039 IBQ1LO . . . 1040 I/B/E/S Median Estimate IBQ1MC . . . 1040 IBQ1MD . . . 1040 I/B/E/S Number of Estimates IBQ1NC . . . 1040 IBQ1N . . . 1040 I/B/E/S Number of Estimates Down IBQ1DC . . . 1041 IBQ1DN . . . 1041 I/B/E/S Number of Estimates Up IBQ1UC . . . 1041 IBQ1UP . . . 1041 I/B/E/S Standard Deviation of Estimate IBQ1SC . . . 1038 IBQ1SD . . . 1038
Fiscal quarter 2 estimates
Data Item Name
Current Mnemonic . . . page
Monthly Mnemonic . . . page
I/B/E/S Average Estimate - Quarter 2 IBQ2AC . . . 1041 IBQ2AV . . . 1042 I/B/E/S High Estimate - Quarter 2 IBQ2HC . . . 1042 IBQ2HI . . . 1042 I/B/E/S Low Estimate - Quarter 2 IBQ2LC . . . 1043 IBQ2LO . . . 1043 I/B/E/S Median Estimate Quarter 2 IBQ2MC . . . 1043 IBQ2MD . . . 1043 I/B/E/S Number of Estimates - Quarter 2 IBQ2NC . . . 1043 IBQ2N . . . 1044 I/B/E/S Number of Estimates Down - Quarter 2
IBQ2DC . . . 1044 IBQ2DN . . . 1044
I/B/E/S Number of Estimates Up - Quarter 2
IBQ2UC . . . 1044 IBQ2UP . . . 1044

899
Chapter 27 Thomson I/B/E/S Estimates
I/B/E/S Standard Deviation of Estimate - Quarter 2
IBQ2SC . . . 1042 IBQ2SD . . . 1042
Growth rate estimates
Data Item Name
Current Mnemonic . . . page
Monthly Mnemonic . . . page
I/B/E/S Long-Term Growth - Average Estimate
IBLGAC . . . 1036 IBLGAV . . . 1036
I/B/E/S Long-Term Growth - High Estimate IBLGHC . . . 1036 IBLGHI . . . 1037 I/B/E/S Long-Term Growth - Low Estimate IBLGLC . . . 1037 IBLGLO . . . 1037 I/B/E/S Long-Term Growth - Median Estimate
IBLGMC . . . 1037 IBLGMD . . . 1037
I/B/E/S Long-Term Growth -Number of Estimates
IBLGNC . . . 1038 IBLGN . . . 1038
I/B/E/S Long-Term Growth - Standard Deviation of Estimates
IBLGSC . . . 1036 IBLGSD . . . 1036
Earnings per share
Data Item Name
Current Mnemonic . . . page
I/B/E/S EPS - Actual Quarterly Average Estimate
IBAQAV . . . 1025
I/B/E/S EPS - Actual Quarterly Number of Estimates
IBAQN . . . 1026
I/B/E/S EPS - Actual Quarterly Standard Deviation of Estimates
IBAQSD . . . 1026
I/B/E/S EPS - Last Four Quarters Actual IBX12 . . . 1026 I/B/E/S EPS - Latest Actual IBA . . . 1026 I/B/E/S EPS (Quarterly) - Latest Actual IBAQ . . . 1026 I/B/E/S Estimates Currency IBCURR . . . 1025 I/B/E/S Estimates Currency - Current IBCURC . . . 1025
Other estimates statistics
Data Item Name
Current Mnemonic . . . page
Monthly Mnemonic . . . page
I/B/E/S Percentage of Unexpected Earnings IBPUE . . . 1045 I/B/E/S Standard Unexpected Earnings IBSUE . . . 1045 I/B/E/S Year 1 - Coefficient of Variation IBF1CC . . . 1027 IBF1CV . . . 1028 I/B/E/S Year 1 - Implied Price to Earnings IBF1EC . . . 1029 IBF1PE . . . 1029

Research Insight North America Data Guide
900
I/B/E/S Year 2 - Coefficient of Variation IBF2CC . . . 1032 IBF2CV . . . 1032 I/B/E/S Year 2 - Implied Price to Earnings IBF2EC . . . 1033 IBF2PE . . . 1033

901
Chapter 27 Thomson I/B/E/S Estimates
Data Definitions
Currency for IBES Estimates Mnemonic IBCURR
Units Code
This item is a code that shows you which currency the estimates are for:
Codes are:
1 In U.S. dollars
2 In Canadian dollars
Currency for IBES Estimates - Current Mnemonic IBCURC
Units Code
This items is a code that shows you which currency the estimates are for:
Codes are:
1 In U.S. dollars
2 In Canadian dollars
Peg Ratio with IBES Estimate Mnemonic PEGIBES
Concept Calculation IBF1EC/IBLGMC
This concept calculates the Peg ratio by dividing I/B/E/S Yr 1-Implied P/E Current by I/B/E/S 5 Yr Gr-Med Est-Current.
Thomson I/B/E/S EPS Actual Quarterly Average Estimate Mnemonic IBAQAV
This item represents the latest mean or arithmetic average of the quarterly estimates for the most recently reported quarter.
Thomson I/B/E/S EPS Actual Quarterly Est. Standard Dev. Mnemonic IBAQSD
This item represents the standard deviation of the estimates for the most recently reported fiscal quarter.

Research Insight North America Data Guide
902
Standard Deviation is a measure of dispersion - in this case, of earnings forecasts. Approximately two-thirds of the estimates fall within plus or minus one standard deviation from the mean. The smaller the number, the greater the agreement is among analysts. The larger the number, the greater the dispersion is of the estimates. There are no norms for standard deviation.
Thomson I/B/E/S EPS Actual Quarterly Number of Estimates Mnemonic IBAQN
This item represents the number of earnings estimates for the most recently reported fiscal quarter, for each company, respectively.
Thomson I/B/E/S EPS - Last 4 Quarters Actual Mnemonic IBX12
This item represents the total actual earnings per share for the last four reported quarters. It is a scalar variable item.
Thomson I/B/E/S EPS - Latest Actual Mnemonic IBA
This item represents the actual earnings per share figure for the most recently reported fiscal year.
Thomson I/B/E/S EPS - Latest Actual - Quarterly Mnemonic IBAQ
This item represents the actual earnings per share figure for the most recently reported quarter.
Thomson I/B/E/S Estimated Date - Monthly Mnemonic IBDTE
This item represents the cutoff date for the monthly Thomson I/B/E/S information. This date takes the form MMDDYY.
Thomson I/B/E/S Estimated Date - Current Mnemonic IBDTEC
This item represents the cutoff date for the current Thomson I/B/E/S information. This date takes the form MMDDYY.

903
Chapter 27 Thomson I/B/E/S Estimates
Thomson I/B/E/S 1 Year Average Estimated - Current Mnemonic IBF1AC
This item represents the latest weekly mean or arithmetic average earnings estimate for the current fiscal year.
Thomson I/B/E/S 1 Year Average Estimated Mnemonic IBF1AV
This item represents the latest monthly mean or arithmetic average earnings estimate for the current fiscal year. Data is maintained on a rolling 6-month basis.
Thomson I/B/E/S 1 Year - Coefficient of Variation - Current Mnemonic IBF1CC
Concept Calculation (IBF1SC/IBF1AC)*100
This concept is Year 1 - Standard Deviation of Estimates divided by Year 1 - Mean Estimate. This result is then multiplied by 100. Coefficient of Variation indicates the percentage range within which two-thirds of all Year 1 estimates fall.
Thomson I/B/E/S 1 Year - Coefficient of Variation Mnemonic IBF1CV
Concept Calculation (IBF1SD/IBF1AV)*100
This concept is Year 1 - Standard Deviation of Estimates divided by Year 1 - Mean Estimate. This result is then multiplied by 100. Coefficient of Variation indicates the percentage range within which two-thirds of all Year 1 estimates fall.
Thomson I/B/E/S 1 Year Est. Standard Dev. - Current Mnemonic IBF1SC
This item represents the standard deviation of the estimates for the next fiscal year as of the current monthly report cycle.
Standard Deviation is a measure of dispersion - in this case, of earnings forecasts. Approximately two-thirds of the estimates fall within plus or minus one standard deviation from the mean. The smaller the number, the greater the agreement is among analysts. The larger the number, the greater the dispersion is of the estimates. There are no norms for standard deviation.
Thomson I/B/E/S 1 Year Est. Standard Dev. Mnemonic IBF1SD

Research Insight North America Data Guide
904
This item represents the standard deviation of the estimates for the next fiscal year as of the current monthly report cycle. Data is maintained on a rolling 6-month basis.
Standard Deviation is a measure of dispersion - in this case, of earnings forecasts. Approximately two-thirds of the estimates fall within plus or minus one standard deviation from the mean. The smaller the number, the greater the agreement is among analysts. The larger the number, the greater the dispersion is of the estimates. There are no norms for standard deviation.
Thomson I/B/E/S 1 Year Forecast Mnemonic IBF1P
This item represents the end date of the current fiscal year for each company. This date takes the form YY. Data is maintained on a rolling 6-month basis.
Thomson I/B/E/S 1 Year Forecast - Current Mnemonic IBF1PC
This item represents the end date of the current fiscal year for each company. This date takes the form YY.
Thomson I/B/E/S 1 Year High Estimated - Current Mnemonic IBF1HC
This item represents the highest current earnings estimate for the current fiscal year. Used in conjunction with the lowest current earnings estimate (IBF1LO), this item provides the range of estimates from all brokers covering the company.
Thomson I/B/E/S 1 Year High Estimated Mnemonic IBF1HI
This item represents the highest current earnings estimate for the current fiscal year. Used in conjunction with the lowest current earnings estimate (IBF1LO), this item provides the range of estimates from all brokers covering the company. Data is maintained on a rolling 6-month basis.
Thomson I/B/E/S 1 Year - Implied P/E - Current Mnemonic IBF1EC
Concept Calculation PRCCM/IBF1AC
This concept is the monthly Close Price divided by the Year 1 - Average Estimate. This is the measure the market has placed on the anticipated 1-year earnings growth for each company.

905
Chapter 27 Thomson I/B/E/S Estimates
Thomson I/B/E/S 1 Year - Implied P/E Mnemonic IBF1PE
Concept Calculation PRCCM/IBF1AV
This concept is the monthly Close Price divided by the Year 1 - Average Estimate. This is the measure the market has placed on the anticipated 1-year earnings growth for each company.
Thomson I/B/E/S 1 Year Low Estimated - Current Mnemonic IBF1LC
This item represents the lowest current earnings estimate for the current fiscal year. Used in conjunction with the highest current earnings estimate (IBF1HI), this item provides the range of estimates from all brokers covering the company.
Thomson I/B/E/S 1 Year Low Estimated Mnemonic IBF1LO
This item represents the lowest current earnings estimate for the current fiscal year. Used in conjunction with the highest current earnings estimate (IBF1HI), this item provides the range of estimates from all brokers covering the company. Data is maintained on a rolling 6-month basis.
Thomson I/B/E/S 1 Year Median Estimated - Current Mnemonic IBF1MC
This item represents the midpoint of all the earnings estimates for the current fiscal year. For example, if all the earnings estimates were ranked from highest to lowest, this item would represent the midpoint of the range of estimates.
Thomson I/B/E/S 1 Year Median Estimated Mnemonic IBF1MD
This item represents the midpoint of all the earnings estimates for the current fiscal year. For example, if all the earnings estimates were ranked from highest to lowest, this item would represent the midpoint of the range of estimates. Data is maintained on a rolling 6-month basis.
Thomson I/B/E/S 1 Year Number of Estimates - Current Mnemonic IBF1NC
This item represents the number of earnings estimates for the current fiscal year for each company, respectively. Since virtually all institutional research firms are contributors to Thomson I/B/E/S, this number is a good representation of the total number of sell-side analysts covering each company.

Research Insight North America Data Guide
906
Thomson I/B/E/S 1 Year Number of Estimates Mnemonic IBF1N
This item represents the number of earnings estimates for the current fiscal year for each company, respectively. Since virtually all institutional research firms are contributors to Thomson I/B/E/S, this number is a good representation of the total number of sell-side analysts covering each company. Data is maintained on a rolling 6-month basis.
Thomson I/B/E/S 1 Year Number of Est. Down - Current Mnemonic IBF1DC
This item represents the number of earnings estimates for the current fiscal year that have been lowered from the prior month to the current month.
Thomson I/B/E/S 1 Year Number of Est. Down Mnemonic IBF1DN
This item represents the number of earnings estimates for the current fiscal year that have been lowered from the prior month to the current month. Data is maintained on a rolling 6-month basis.
Thomson I/B/E/S 1 Year Number of Estimates Up - Current Mnemonic IBF1UC
This item represents the number of earnings estimates for the current fiscal year that have been increased from the prior month to the latest month.
Thomson I/B/E/S 1 Year Number of Estimates Up Mnemonic IBF1UP
This item represents the number of earnings estimates for the current fiscal year that have been increased from the prior month to the latest month. Data is maintained on a rolling 6-month basis.
Thomson I/B/E/S 2 Year Average Estimated - Current Mnemonic IBF2AC
This item represents the latest weekly mean or arithmetic average earnings estimate for the next fiscal year.

907
Chapter 27 Thomson I/B/E/S Estimates
Thomson I/B/E/S 2 Year Average Estimated Mnemonic IBF2AV
This item represents the latest monthly mean or arithmetic average earnings estimate for the next fiscal year. Data is maintained on a rolling 6-month basis.
Thomson I/B/E/S 2 Year - Coefficient of Variation - Current Mnemonic IBF2CC
Concept Calculation (IBF2SC/IBF2AC)*100
This concept is Year 2 - Standard Deviation of Estimates divided by Year 2 - Mean Estimate. This result is then multiplied by 100. Coefficient of Variation indicates the percentage range within which two-thirds of all Year 2 estimates fall.
Thomson I/B/E/S 2 Year - Coefficient of Variation Mnemonic IBF2CV
Concept Calculation (IBF2SD/IBF2AV)*100
This concept is Year 2 - Standard Deviation of Estimates divided by Year 2 - Mean Estimate. This result is then multiplied by 100. Coefficient of Variation indicates the percentage range within which two-thirds of all Year 2 estimates fall.
Thomson I/B/E/S 2 Year Est. Standard Dev. - Current Mnemonic IBF2SC
This item represents the standard deviation of the estimates for the next fiscal year, as of the current monthly report cycle. It is a scalar variable.
Standard Deviation is a measure of dispersion - in this case, of earnings forecasts. Approximately two-thirds of the estimates fall within plus or minus one standard deviation from the mean. The smaller the number, the greater the agreement is among analysts. The larger the number, the greater the dispersion is of the estimates. There are no norms for standard deviation.
Thomson I/B/E/S 2 Year Est. Standard Dev. Mnemonic IBF2SD
This item represents the standard deviation of the estimates for the next fiscal year, as of the current monthly report cycle. It is a scalar variable. Data is maintained on a rolling 6-month basis.
Standard Deviation is a measure of dispersion - in this case, of earnings forecasts. Approximately two-thirds of the estimates fall within plus or minus one standard deviation from the mean. The smaller the number, the greater the agreement is among analysts. The larger the number, the greater the dispersion is of the estimates. There are no norms for standard deviation.

Research Insight North America Data Guide
908
Thomson I/B/E/S 2 Year High Estimated - Current Mnemonic IBF2HC
This item represents the highest current earnings estimate for the next fiscal year. Used in conjunction with the lowest current earnings estimate (IBF2LO), this item provides the range of estimates from all brokers covering the company.
Thomson I/B/E/S 2 Year High Estimated Mnemonic IBF2HI
This item represents the highest current earnings estimate for the next fiscal year. Used in conjunction with the lowest current earnings estimate (IBF2LO), this item provides the range of estimates from all brokers covering the company. Data is maintained on a rolling 6-month basis.
Thomson I/B/E/S 2 Year - Implied P/E - Current Mnemonic IBF2EC
Concept Calculation PRCCM/IBF2AC
This concept is the monthly Close Price divided by the Year 2 - Average Estimate. This is the measure the market has placed on the anticipated 2-year earnings growth for each company.
Thomson I/B/E/S 2 Year - Implied P/E Mnemonic IBF2PE
Concept Calculation PRCCM/IBF2AV
This concept is the monthly Close Price divided by the Year 2 - Average Estimate. This is the measure the market has placed on the anticipated 2-year earnings growth for each company.
Thomson I/B/E/S 2 Year Low Estimated - Current Mnemonic IBF2LC
This item represents the lowest current earnings estimate for the next fiscal year. Used in conjunction with the highest current earnings estimate (IBF2HI), this item provides the range of estimates from all brokers covering the company.
Thomson I/B/E/S 2 Year Low Estimated Mnemonic IBF2LO

909
Chapter 27 Thomson I/B/E/S Estimates
This item represents the lowest current earnings estimate for the next fiscal year. Used in conjunction with the highest current earnings estimate (IBF2HI), this item provides the range of estimates from all brokers covering the company. Data is maintained on a rolling 6-month basis.
Thomson I/B/E/S 2 Year Median Estimated - Current Mnemonic IBF2MC
This item represents the midpoint of all the earnings estimates for the next fiscal year. It is a scalar variable. For example, if 100 earnings estimates were ranked from highest to lowest, the median would be the 50th estimate.
Thomson I/B/E/S 2 Year Median Estimated Mnemonic IBF2MD
This item represents the midpoint of all the earnings estimates for the next fiscal year. It is a scalar variable. For example, if 100 earnings estimates were ranked from highest to lowest, the median would be the 50th estimate. Data is maintained on a rolling 6-month basis.
Thomson I/B/E/S 2 Year Number of Estimates - Current Mnemonic IBF2NC
This item represents the number of earnings estimates for the next fiscal year for each company, respectively. It is a scalar variable. Data is maintained on a rolling 6-month basis.
Thomson I/B/E/S 2 Year Number of Estimates Mnemonic IBF2N
This item represents the number of earnings estimates for the next fiscal year for each company, respectively. It is a scalar variable. Data is maintained on a rolling 6-month basis.
Thomson I/B/E/S 2 Year Number of Est. Down - Current Mnemonic IBF2DC
This item represents the number of earnings estimates for the next fiscal year that have been lowered from the prior month to the current month.
Thomson I/B/E/S 2 Year Number of Est. Down Mnemonic IBF2DN
This item represents the number of earnings estimates for the next fiscal year that have been lowered from the prior month to the current month. Data is maintained on a rolling 6-month basis.

Research Insight North America Data Guide
910
Thomson I/B/E/S 2 Year Number of Estimates Up - Current Mnemonic IBF2UC
This item represents the number of earnings estimates for the next fiscal year that have been increased from the prior month to the latest month. It is a scalar variable.
Thomson I/B/E/S 2 Year Number of Estimates Up Mnemonic IBF2UP
This item represents the number of earnings estimates for the next fiscal year that have been increased from the prior month to the latest month. It is a scalar variable. Data is maintained on a rolling 6-month basis.
Thomson I/B/E/S 5 Year Growth Avg. Est. - Current Mnemonic IBLGAC
This item represents the latest mean or arithmetic average estimate of long-term (5-year) growth for the current fiscal year. It is expressed as an annual growth rate.
Thomson I/B/E/S 5 Year Growth Avg. Est. Mnemonic IBLGAV
This item represents the latest mean or arithmetic average estimate of long-term (5-year) growth for the current fiscal year. It is expressed as an annual growth rate. Data is maintained on a rolling 6-month basis.
Thomson I/B/E/S 5 Year Growth - Est. Std. Dev. - Current Mnemonic IBLGSC
This item represents the standard deviation of the estimates for long-term (5-year) growth.
Standard Deviation is a measure of dispersion - in this case, of earnings growth forecasts. Approximately two-thirds of the estimates fall within plus or minus one standard deviation from the mean. The smaller the number, the greater the agreement is among analysts. The larger the number, the greater the dispersion is of the estimates. There are no norms for standard deviation
Thomson I/B/E/S 5 Year Growth - Est. Std. Dev. Mnemonic IBLGSD

911
Chapter 27 Thomson I/B/E/S Estimates
This item represents the standard deviation of the estimates for long-term (5-year) growth. Data is maintained on a rolling 6-month basis.
Standard Deviation is a measure of dispersion - in this case, of earnings growth forecasts. Approximately two-thirds of the estimates fall within plus or minus one standard deviation from the mean. The smaller the number, the greater the agreement is among analysts. The larger the number, the greater the dispersion is of the estimates. There are no norms for standard deviation
Thomson I/B/E/S 5 Year Growth - High Est. - Current Mnemonic IBLGHC
This item represents the highest current long-term (5-year) growth estimate for each company, respectively. Used in conjunction with the lowest current growth estimate (IBLGLO), this item provides therange of growth expectations from virtually all sell-side analysts covering the company.
Thomson I/B/E/S 5 Year Growth - High Est. Mnemonic IBLGHI
This item represents the highest current long-term (5-year) growth estimate for each company, respectively. Used in conjunction with the lowest current growth estimate (IBLGLO), this item provides the range of growth expectations from virtually all sell-side analysts covering the company. Data is maintained on a rolling 6-month basis.
Thomson I/B/E/S 5 Year Growth - Low Est. - Current Mnemonic IBLGLC
This item represents the lowest current long-term (5-year) growth estimate for each company, respectively. Used in conjunction with the highest current growth estimate (IBLGHI), this item provides the range of growth expectations from virtually all sell-side analysts covering the company.
Thomson I/B/E/S 5 Year Growth - Low Est. Mnemonic IBLGLO
This item represents the lowest current long-term (5-year) growth estimate for each company, respectively. Used in conjunction with the highest current growth estimate (IBLGHI), this item provides the range of growth expectations from virtually all sell-side analysts covering the company. Data is maintained on a rolling 6-month basis.
Thomson I/B/E/S 5 Year Growth - Median Est. - Current Mnemonic IBLGMC
This item represents the median (mid-point or most central) estimate of expected long-term (5-year) growth. It is expressed as an annual growth rate.

Research Insight North America Data Guide
912
Thomson I/B/E/S 5 Year Growth - Median Est. Mnemonic IBLGMD
This item represents the median (mid-point or most central) estimate of expected long-term (5-year) growth. It is expressed as an annual growth rate. Data is maintained on a rolling 6-month basis.
Thomson I/B/E/S 5 Year Growth - Number of Estimates Mnemonic IBLGN
This item represents the number of long-term (5-year) growth estimates for each company, respectively.
Thomson I/B/E/S 5 Year Growth - Number of Estimates - Current Mnemonic IBLGNC
This item represents the number of long-term (5-year) growth estimates for each company, respectively.
Thomson I/B/E/S 1 Quarter - Average Est. - Current Mnemonic IBQ1AC
This item represents the latest mean or arithmetic average earnings estimate for the current fiscal quarter.
Thomson I/B/E/S 1 Quarter - Average Est. Mnemonic IBQ1AV
This item represents the latest mean or arithmetic average earnings estimate for the current fiscal quarter. Data is maintained on a rolling 6-month basis.
Thomson I/B/E/S 1 Quarter - Est. Std. Dev. - Current Mnemonic IBQ1SC
This item represents the standard deviation of the estimates for the current fiscal quarter, as of the current monthly report cycle.
Standard Deviation is a measure of dispersion - in this case, of earnings forecasts. Approximately two-thirds of the estimates fall within plus or minus one standard deviation from the mean. The smaller the number, the greater the agreement is among analysts. The larger the number, the greater the dispersion is of the estimates. There are no norms for standard deviation.
Thomson I/B/E/S 1 Quarter - Est. Std. Dev. Mnemonic IBQ1SD

913
Chapter 27 Thomson I/B/E/S Estimates
This item represents the standard deviation of the estimates for the current fiscal quarter, as of the current monthly report cycle. Data is maintained on a rolling 6-month basis.
Standard Deviation is a measure of dispersion - in this case, of earnings forecasts. Approximately two-thirds of the estimates fall within plus or minus one standard deviation from the mean. The smaller the number, the greater the agreement is among analysts. The larger the number, the greater the dispersion is of the estimates. There are no norms for standard deviation.
Thomson I/B/E/S 1 Quarter Forecast Mnemonic IBQ1P
This item represents the end date of the current fiscal quarter for each company. This date takes the form QnYnn (for example, Q1Y90).
Thomson I/B/E/S 1 Quarter Forecast - Current Mnemonic IBQ1PC
This item represents the end date of the current fiscal quarter for each company. This date takes the form QnYnn (for example, Q1Y90).
Thomson I/B/E/S 1 Quarter - High Est. - Current Mnemonic IBQ1HC
This item represents the highest current earnings estimate for the current fiscal quarter. Used in conjunction with the lowest current earnings estimate (IBQ1LO), this item provides the range of estimates from all brokers covering the company.
Thomson I/B/E/S 1 Quarter - High Est. Mnemonic IBQ1HI
This item represents the highest current earnings estimate for the current fiscal quarter. Used in conjunction with the lowest current earnings estimate (IBQ1LO), this item provides the range of estimates from all brokers covering the company. Data is maintained on a rolling 6-month basis.
Thomson I/B/E/S 1 Quarter - Low Est. - Current Mnemonic IBQ1LC
This item represents the lowest current earnings estimate for the current fiscal quarter. Used in conjunction with the highest current earnings estimate (IBQ1HI), this item provides the range of estimates from all brokers covering the company.

Research Insight North America Data Guide
914
Thomson I/B/E/S 1 Quarter - Low Est. Mnemonic IBQ1LO
This item represents the lowest current earnings estimate for the current fiscal quarter. Used in conjunction with the highest current earnings estimate (IBQ1HI), this item provides the range of estimates from all brokers covering the company. Data is maintained on a rolling 6-month basis.
Thomson I/B/E/S 1 Quarter - Median Est. - Current Mnemonic IBQ1MC
This item represents the midpoint of all the earnings estimates for the current fiscal quarter. For example, if all the earnings estimates were ranked from highest to lowest estimate, this item would represent the midpoint of the range of estimates.
Thomson I/B/E/S 1 Quarter - Median Est. Mnemonic IBQ1MD
This item represents the midpoint of all the earnings estimates for the current fiscal quarter. For example, if all the earnings estimates were ranked from highest to lowest estimate, this item would represent the midpoint of the range of estimates. Data is maintained on a rolling 6-month basis.
Thomson I/B/E/S 1 Quarter - Number of Estimates - Current Mnemonic IBQ1NC
This item represents the number of earnings estimates for the current fiscal quarter for each company respectively.
Thomson I/B/E/S 1 Quarter - Number of Estimates Mnemonic IBQ1N
This item represents the number of earnings estimates for the current fiscal quarter for each company respectively. Data is maintained on a rolling 6-month basis.
Thomson I/B/E/S 1 Quarter - Number of Estimates Down - Current Mnemonic IBQ1DC
This item represents the number of earnings estimates for the current fiscal quarter that have been lowered from the prior month to the current month.

915
Chapter 27 Thomson I/B/E/S Estimates
Thomson I/B/E/S 1 Quarter - Number of Estimates Down Mnemonic IBQ1DN
This item represents the number of earnings estimates for the current fiscal quarter that have been lowered from the prior month to the current month. Data is maintained on a rolling 6-month basis.
Thomson I/B/E/S 1 Quarter - Number of Estimates Up - Current Mnemonic IBQ1UC
This item represents the number of earnings estimates for the next fiscal quarter that have been increased from the prior month to the current month.
Thomson I/B/E/S 1 Quarter - Number of Estimates Up Mnemonic IBQ1UP
This item represents the number of earnings estimates for the next fiscal quarter that have been increased from the prior month to the current month. This item is a scalar variable. Data is maintained on a rolling 6-month basis.
Thomson I/B/E/S 2 Quarters - Average Est. - Current Mnemonic IBQ2AC
This item represents the latest mean or arithmetic average earnings estimate for the next fiscal quarter. This item is a scalar variable.
Thomson I/B/E/S 2 Quarters - Average Est. Mnemonic IBQ2AV
This item represents the latest mean or arithmetic average earnings estimate for the next fiscal quarter. This item is a scalar variable. Data is maintained on a rolling 6-month basis.
Thomson I/B/E/S 2 Quarters - Est. Std. Dev. - Current Mnemonic IBQ2SC
This item represents the standard deviation of the estimates for the next fiscal quarter as of the current monthly report cycle.
Standard Deviation is a measure of dispersion - in this case, of earnings forecasts. Approximately two-thirds of the estimates fall within plus or minus one standard deviation from the mean. The smaller the number, the greater the agreement is among analysts. The larger the number, the greater the dispersion is of the estimates. There are no norms for standard deviation.

Research Insight North America Data Guide
916
Thomson I/B/E/S 2 Quarters - Est. Std. Dev. Mnemonic IBQ2SD
This item represents the standard deviation of the estimates for the next fiscal quarter, as of the current monthly report cycle. Data is maintained on a rolling 6-month basis.
Standard Deviation is a measure of dispersion - in this case, of earnings forecasts. Approximately two-thirds of the estimates fall within plus or minus one standard deviation from the mean. The smaller the number, the greater the agreement is among analysts. The larger the number, the greater the dispersion is of the estimates. There are no norms for standard deviation.
Thomson I/B/E/S 2 Quarters - High Est. - Current Mnemonic IBQ2HC
This item represents the highest current earnings estimate for the next fiscal quarter. Used in conjunction with the lowest current earnings estimate (IBQ2LO), this item provides the range of estimates from all brokers covering the company.
Thomson I/B/E/S 2 Quarters - High Est. Mnemonic IBQ2HI
This item represents the highest current earnings estimate for the next fiscal quarter. Used in conjunction with the lowest current earnings estimate (IBQ2LO), this item provides the range of estimates from all brokers covering the company. Data is maintained on a rolling 6-month basis.
Thomson I/B/E/S 2 Quarters - Low Est. - Current Mnemonic IBQ2LC
This item represents the lowest current earnings estimate for the next fiscal quarter. Used in conjunction with the highest current earnings estimate (IBQ2HI), this item provides the range of estimates from all brokers covering the company.
Thomson I/B/E/S 2 Quarters - Low Est. Mnemonic IBQ2LO
This item represents the lowest current earnings estimate for the next fiscal quarter. Used in conjunction with the highest current earnings estimate (IBQ2HI), this item provides the range of estimates from all brokers covering the company. Data is maintained on a rolling 6-month basis.
Thomson I/B/E/S 2 Quarters - Median Est. - Current Mnemonic IBQ2MC

917
Chapter 27 Thomson I/B/E/S Estimates
This item represents the midpoint of all the earnings estimates for the next fiscal quarter. For example, if all the earnings estimates were ranked from highest to lowest, this item would represent the midpoint of the range of estimates.
Thomson I/B/E/S 2 Quarters - Median Est. Mnemonic IBQ2MD
This item represents the midpoint of all the earnings estimates for the next fiscal quarter. For example, if all the earnings estimates were ranked from highest to lowest, this item would represent the midpoint of the range of estimates. Data is maintained on a rolling 6-month basis.
Thomson I/B/E/S 2 Quarters - Number of Estimates - Current Mnemonic IBQ2NC
This item represents the number of earnings estimates for the next fiscal quarter for each company respectively. This item is a scalar variable.
Thomson I/B/E/S 2 Quarters - Number of Estimates Mnemonic IBQ2N
This item represents the number of earnings estimates for the next fiscal quarter for each company, respectively. This item is a scalar variable. Data is maintained on a rolling 6-month basis.
Thomson I/B/E/S 2 Quarters - Number of Estimates Down - Current Mnemonic IBQ2DC
This item represents the number of earnings estimates for the next fiscal quarter that have been lowered from the prior month to the current month. This item is a scalar variable.
Thomson I/B/E/S 2 Quarters - Number of Estimates Down Mnemonic IBQ2DN
This item represents the number of earnings estimates for the next fiscal quarter that have been lowered from the prior month to the current month. This item is a scalar variable. Data is maintained on a rolling 6-month basis.
Thomson I/B/E/S 2 Quarters - Number of Estimates Up - Current Mnemonic IBQ2UC
This item represents the number of earnings estimates for the next fiscal quarter that have been increased from the prior month to the current month. It is a scalar variable item.

Research Insight North America Data Guide
918
Thomson I/B/E/S 2 Quarters - Number of Estimates Up Mnemonic IBQ2UP
This item represents the number of earnings estimates for the next fiscal quarter that have been increased from the prior month to the current month. It is a scalar variable item. Data is maintained on a rolling 6-month basis.
Thomson I/B/E/S Percentage of Unexpected Earnings Mnemonic IBPUE
Concept Calculation 100*((IBAQ-IBAQAV)/@ABS(IBAQAV))
This concept is the difference between Latest Actual Quarter EPS and Actual Quarter Average Estimate, divided by the absolute value of the Latest Actual Earnings Per Share (Quarterly). This concept is a measure of how accurately reported quarterly earnings were anticipated by investors, represented as a percentage of actual earnings. A positive percentage indicates the company performed better than anticipated by investors. A negative percentage indicates the company performed worse than anticipated by investors.
Thomson I/B/E/S Standard Unexpected Earnings Mnemonic IBSUE
Concept Calculation (IBAQ-IBAQAV)/IBAQSD)
This concept is the difference between Latest Actual Quarter EPS and Actual Quarter Average Estimate, divided by Actual Quarter Standard Deviation of Estimates. This concept indicates how many standard deviations the reported earnings are from the expectations for those earnings. It measures whether reported earnings were accurately anticipated by investors or whether reported quarterly earnings were outside the range of expectation.

919
Chapter 28 U.S. Economic Data
U.S. Economic Data
Economic data includes economic indicators and macroeconomic statistics.
All economic concepts are presented as monthly figures for up to 20 years. These concepts or their components are provided by DRI•WEFA. As the respective government agencies revise historical statistics, revisions are also made to Research Insight.
U.S. Economic Data Items
Concept Name
Mnemonic . . . page
Capital Asset Pricing Model CAPAPM . . . 1049 Consumer Price Index - All Urban - All Items CPI . . . 1049 Employment - Nonfarm EMPLOY . . . 1049 Federal Funds Rate FEDFUNDS . . . 1050 Government Bonds BOND . . . 1050 Government Notes NOTE . . . 1051 Gross Domestic Product GDP . . . 1051 Housing Starts HOUSE . . . 1052 Inflation Rate INFLATN . . . 1052 LIBOR - 1 Month LIBOR1M . . . 1052 LIBOR - 2 Month LIBOR2M . . . 1052 Market Indicator MKTIND . . . 1053 Money Supply - M1 M1 . . . 1053 Money Supply - M2 M2 . . . 1053 Prime Interest Rate PRIME . . . 1053 Producer Price Index - Finished Goods - All Items
PPI . . . 1054
Retail Sales - Total RTLSALES . . . 1054 Sale of Passenger Cars AUTO . . . 1055 Treasury Bills TBILL . . . 1055 Unemployment Rate UNEMP . . . 1056
CHAPTER 28


921
Chapter 28 U.S. Economic Data
Data Definitions
Capital Asset Pricing Model Mnemonic CAPAPM
Concept Calculation TBILL3M+(BETA*("I0010":TRT10Y-TBILL3M))
Units Percentage
CAPAPM is a method of determining the expected rate of return for an asset at a given level of risk. Essentially, the Cost of Capital is based on:
Risk Free Rate + Beta (Market Risk Premium)
where:
Risk Free Rate = 3 Month Treasury Bill Rate (TBILL3M) Market Risk Premium = Difference between Expected Return on the Market ("I0010":TRT10Y) and the Risk Free Rate (TBILL3M)
Consumer Price Index - All Urban - All Items Mnemonic CPI
Units Index Points
This item is the monthly Consumer Price Index for All Urban Consumers as determined by the U. S. Department of Labor, Bureau of Labor Statistics. The index base is 1.0 and the current index base period is 1982 - 1984 A monthly index of 1.494 after 1984 would indicate a CPI which is 49.4% higher than the base period.
CPI is an average change in the prices paid by urban consumers for a fixed market basket of goods and services compared to an earlier base year. Price change is measured by repricing essentially the same market basket of goods and services at regular intervals and comparing aggregate costs with the costs of the same market basket in a selected base period.
This item is seasonally adjusted.
This index takes into account the buying patterns of professional, managerial and technical workers, short-term workers, the self-employed, clerical workers, wage earners, the unemployed, retired people and others not in the labor force. This representative market basket is based on a sample of prices of food, clothing, shelter, utilities, medical services, transportation, entertainment and other goods and services that people buy for day-to-day living. CPI does not measure the change in income required to maintain the base-period living standard; thus, the index includes the effects of changes in sales taxes and other indirect taxes, but is not affected by changes in income taxes.
Employment - Nonfarm Mnemonic EMPLOY
Units Millions of Persons
This monthly item is seasonally adjusted and is represented in millions of persons. It is provided by the U. S. Department of Labor, Bureau of Labor Statistics (BLS).

Research Insight North America Data Guide
922
Employment is the total number of persons employed in the U. S. by nonfarm establishments during a specified payroll period, including part-time and temporary employees. In general, data refer to persons who worked during, or received pay for, any part of the pay period that includes the 12th of the month; figures for U. S. federal government establishments, however, represent the number of persons who were paid for the last full pay period of the calendar month.
While BLS cooperates with state employment security agencies in the Current Employment Statistics survey to collect employment data each month, the sum of the state figures will differ from the official U. S. national totals because of timing differences of benchmark adjustments. Each year, monthly state employment estimates are prepared using regression models and are adjusted, or benchmarked, to the annual average Current Population Survey (CPS) state estimates of employment. The benchmarking process involves adjusting the time series of monthly estimates so that their annual average equals that of the CPS.
Federal Funds Rate Mnemonic FEDFUNDS
Units Percentage
This item is the daily U. S. overnight effective rate of Federal Funds and is provided by the Dow Jones Telerate. This monthly item represents the last daily rate available for the month.
The Federal Funds Rate is the interest rate charged by banks with excess reserves at a Federal Reserve district bank to banks needing overnight loans to meet reserve requirements. This rate is the most sensitive indicator of the direction of interest rates, since it is set daily by the market, as opposed to the prime rate and discount rate that are periodically changed by banks and by the Federal Reserve Board, respectively.
Government Bonds
Mnemonic
Units
Concept Calculation
Data Availability
BOND20YR Percentage @VALUE("I0010":E19,"I0003":E19) 20 Years BOND30YR Percentage @VALUE("I0010":E20,"I0003":E20) 20 Years
These percentages are the U.S. Government Issue constant maturity bond yields as determined by the Federal Reserve Board of Governors. These monthly items represent the last daily percentage rates available for the month.
Government, or Treasury, bonds are long-term debt instruments with maturities of 10 years or longer. They are issued in denominations of $1,000, $5,000, $10,000, $100,000 and $1 million. Interdealer trades in bonds are usually for $500,000 or more. Many government bond issues are callable. Generally the call date is five years before maturity. On old low-coupon issues, the call provision is of small importance, but new high-coupon issues might conceivably be called someday.
These debt obligations of the U.S. government are secured by its full faith and credit. The income from Treasury securities is exempt from state and local, but not federal, taxes.
* There is a gap from January 1987 to August 1993 for 20-year bond data. The U.S. Treasury did not report yields during this period.

923
Chapter 28 U.S. Economic Data
Government Notes
Monthly Mnemonic
Units
Concept Calculation
Data Availability
NOTE2YR Percentage @VALUE("I0010":E14,"I0003":E14) 20 Years NOTE3YR Percentage @VALUE("I0010":E15,"I0003":E15) 20 Years NOTE5YR Percentage @VALUE("I0010":E16,"I0003":E16) 20 Years NOTE7YR Percentage @VALUE("I0010":E17,"I0003":E17) 20 Years NOTE10YR Percentage @VALUE("I0010":E18,"I0003":E18) 20 Years
These percentages are the U. S. Government Issue constant maturity note yields as determined by the Federal Reserve Board of Governors. These monthly items represent the last daily percentage rates available for the month. Government, or Treasury, notes are intermediate securities with maturities of 2 to 10 years. The notes are sold by cash subscription, in exchange for outstanding or maturing government issues, or at auction. When the Treasury wants to encourage individuals to invest in a new note issue, it sets the minimum denomination at $1,000. At other times it sets it at $5,000. Notes are also available in $10,000, $100,000 and $1 million denominations. In the interdealer market for notes, $1 million is a round lot, and trades for $5 million or more occur routinely.
These debt obligations of the U. S. government are secured by its full faith and credit. The income from Treasury securities is exempt from state and local, but not federal, taxes.
Gross Domestic Product Mnemonic GDP
Units Billions of U.S. Dollars
This item is the monthly Gross Domestic Product (GDP) as determined by the U. S. Department of Commerce, Bureau of Economic Analysis, adjusted seasonally and is represented in billions of U. S. dollars. GDP is a quarterly item and is duplicated in the three appropriate months of the quarter.
GDP is simply Gross National Product less "rest-of-world" output, that is, less net factor payments to domestic owners of factors of production located outside the United States.
The major components of Gross Domestic Product are as follows:
Personal consumption expenditures Durable goods Nondurable goods Services
Gross private domestic investments Fixed investment Nonresidential Structures Producers' durable equipment Residential Change in business inventories Nonfarm Farm

Research Insight North America Data Guide
924
Net exports of goods and services Exports Imports
Government purchases Federal National defense Nondefense State and local
Housing Starts Mnemonic HOUSE
Units Millions of Units
This item represents the total housing starts, private including farms, as determined by the U.S. Department of Commerce, Bureau of the Census, and is seasonally adjusted at annual rates.
Inflation Rate Mnemonic INFLATN
Concept Calculation ((CPI/CPI[-12])-1)*100
Units Percentage
Inflation is a rise in the general price of the goods and services that we buy. The consumer price index (CPI) is the most common means of measuring inflation. CPI benchmarks what it costs to buy a typical market basket of goods and services chosen by an urban family of four. As the prices of these goods and services bought by the average family rise, it will become more expensive to purchase this same market basket. If purchasing this market basket costs 5% more this year in comparison with last year, the annual inflation rate is 5%.
LIBOR - 1 Month Mnemonic LIBOR1M
Concept Calculation @VALUE("I0010":E24,"I0003":E24)
Units Percentage
This percentage represents the London Interbank Offering Rate for one month rates and is updated daily.
LIBOR - 2 Month Mnemonic LIBOR2M
Concept Calculation @VALUE("I0010":E25,"I0003":E25)

925
Chapter 28 U.S. Economic Data
Units Percentage
This percentage represents the London Interbank Offering Rate for two month rates and is updated daily.
Market Indicator Mnemonic MKTIND
Concept Calculation "I0010":PEM/(1/BOND30YR)
Units Ratio
This overall market indicator is the ratio between the Monthly Price to Earnings ratio for the S&P 500 index and the inverse of the 30 year bond yield. This is a general valuation of the stock market. It is best to evaluate this item over time and consider a current ratio relative to its history. As the gap widens, the market is said to be "overvalued."
As a rule of thumb, high numbers indicate an overvalued stock market relative to bonds.
Money Supply - M1 Mnemonic M1
Concept Calculation @VALUE("I0010":E26,"I0003":E26)
Units Billions of Current Dollars
This item represents billions of current U.S. dollars, seasonally adjusted, as determined by the Federal Reserve Board of Governors.
M1 is calculated by summing the set of currency (in circulation), demand deposits, other checkable deposits and travelers checks.
Money Supply - M2 Mnemonic M2
Concept Calculation @VALUE("I0010":E27,"I0003":E27)
Units Billions of Current Dollars
This item represents billions of current U.S. dollars, seasonally adjusted, as determined by the Federal Reserve Board of Governors.
M2 is calculated by summing the set of M1, savings deposits, time deposits, money market mutual funds, money market deposits accounts, overnight repurchase agreements and Eurodollar deposits.
Prime Interest Rate Mnemonic PRIME

Research Insight North America Data Guide
926
Units Percentage
This monthly item is the U. S. close rate provided by the Federal Reserve Bank of New York. It represents the monthly average of the daily close rates for the month.
The prime rate is the interest rate banks charge to their most creditworthy customers. The rate is determined by the market forces affecting a bank's cost of funds and the rates that borrowers will accept. The prime rate tends to become standard across the banking industry when a major bank moves its prime rate up or down. The rate is a key interest rate, since loans to less creditworthy customers are often tied to the prime rate.
Producer Price Index - Finished Goods - All Items Mnemonic PPI
Units Index Points
This item is the monthly Producer Price Index for Finished Goods as determined by the U. S. Department of Labor, Bureau of Labor Statistics, adjusted seasonally. The index, set at 1.0, has a current base period of 1982. A monthly index of 1.252 after 1982 would indicate a PPI which is 25.2% higher than the base period.
Producer Price Index, formerly known as the Wholesale Price Index, measures the average changes in prices received by domestic producers of commodities in all stages of processing. The consumer equivalent of this index is the Consumer Price Index.
The Producer Price Index family consists of several major classification systems. The three most important classification structures are: (1) industry, (2) commodity, and (3) stage of processing.
Commodity-based stage-of-processing indexes are currently the central classification structure used by the Bureau of Labor Statistics for analyzing price trends in the general economy. In particular, since 1978 the Finished Goods Price Index has been stressed by the Bureau as the single most important index. This index measures inflation in consumer and capital goods, upon which demand for materials and other inputs depends.
Finished goods are defined as commodities that are ready for sale to the final-demand user, either an individual consumer or a business firm. Within the Finished Goods Price Index, the consumer foods category includes processed and unprocessed foods; the finished energy goods component includes those types of energy to be sold to households; the category for consumer goods other than foods and energy includes durables such as passenger cars and non-durables such as apparel.
Retail Sales - Total Mnemonic RTLSALES
Units Billions of Current Dollars
This item is the monthly Total Retail Sales figure as determined by the U. S. Department of Commerce, Bureau of the Census, adjusted seasonally, and is represented in billions of current dollars.

927
Chapter 28 U.S. Economic Data
Sales includes the following: merchandise sold for cash or credit at retail and wholesale by establishments primarily engaged in retail trade; amounts received from customers for layaway purchases; receipts from rental or leasing of vehicles, equipment, instruments, tools, etc.; receipts for delivery, installation, maintenance, repair, alteration, storage, and other services; and receipts from gasoline, liquor, tobacco, and other excise taxes which are paid by the manufacturer or wholesaler and passed along to the retailer.
Sales are net after deductions for refunds and allowances for merchandise returned by customers. Trade-in allowances and manufacturers' rebates are not deducted from total sales, however, rebates offered by the retailer are deducted. Total sales do not include commissions from vending machine operators or nonoperating income from such sources as investments and rental or sales of real estate. Sales excludes sales and excise taxes collected directly from customers and paid directly to a local, state, or federal tax agency.
Retail trade, defined as SIC groups 5200 - 5999, includes establishments engaged in selling merchandise for personal or household consumption and rendering services incidental to the sale of those goods. Exceptions to this general rule are made necessary by trade practices. For example, lumber yards are included in retail trade if they sell to the general public, even if a higher proportion of their sales is made to contractors. Lumber yards that sell exclusively to business establishments, institutional and industrial users, or contractors are classified as wholesale trade.
Sale of Passenger Cars Mnemonic AUTO
Units Millions of Units
This item is the total monthly retail unit sales of new passenger cars as determined by the U.S. Department of Commerce, Bureau of Economic Analysis, not adjusted seasonally at monthly rates, and is represented in millions of units.
Treasury Bills
Mnemonic Units
1 Month * TBILL1M Percentage
2 Month * TBILL2M Percentage
3 Month TBILL3M Percentage
6 Month TBILL6M Percentage
12 Month ** TBILL12M Percentage
These percentages are the U. S. close quotes, constant maturity Treasury Bill rates provided by Bank of America, San Francisco. These monthly items represents the last daily percentage rates available for the month.

Research Insight North America Data Guide
928
Treasury bills are short-term non-interest bearing securities currently issued in various maturities. Bills are always issued at a discount from face value, and the amount of the discount is determined in bill auctions held by the Federal Reserve each time the Treasury issues new bills. At maturity, bills are redeemed by the Treasury for full face value. Thus, investors in bills earn returns because they receive more for the bills at maturity than they paid for them at issue. Treasury bills are issued in minimum denominations of $10,000, with $5,000 increments above $10,000.
The yields are watched closely in the money markets for signs of interest rate trends. Many floating-rate loans and variable-rate mortgages have interest rates tied to these bills. T-bills are the primary instrument used by the Federal Reserve in its regulation of money supply through open market operations.
These debt obligations of the U.S. government are secured by its full faith and credit. The income from Treasury securities is exempt from state and local, but not federal, taxes.
* These series have been discontinued by the Federal Reserve on 6/30/99.
** These series has been discontinued by the Federal Reserve on 9/30/01.
Unemployment Rate Mnemonic UNEMP
Units Percentage
This item is the monthly civilian unemployment rate as determined by the U. S. Department of Labor, Bureau of Labor Statistics, adjusted seasonally.
The unemployment rate represents the number of unemployed as a percent of the civilian labor force. The reasons for unemployment are divided into five major groups: 1. Job losers are persons whose employment ended involuntarily and who immediately began looking
for work. This category also includes persons on temporary layoff, who have been given a date to return to work or who expect to return within 6 months.
2. Job leavers are persons who quit or otherwise terminated their employment voluntarily and immediately began looking for work.
3. Persons who completed temporary jobs and who began looking for work after their jobs ended.
4. Reentrants are persons who previously worked at a full-time job lasting two weeks or longer but who were out of the labor force prior to beginning their job search.
5. New entrants are persons who never worked at a full-time job lasting two weeks or longer.
Each of these five categories of the unemployed can be expressed as a proportion of the entire civilian force; the sum of the 5 rates thus equals the unemployment rate for all civilian workers.

929
Chapter 28 Glossary of Terms
Glossary of Terms
$C The predefined Research Insight set that contains publicly held U.S. corporations that trade common stock and wholly-owned subsidiaries that issue preferred stock or public debt.
$I The predefined Research Insight set of indexes. Indexes are weighted industry composites.
$R The predefined Research Insight set of companies that no longer trade stock due to a merger, acquisition, bankruptcy, liquidation or other reason.
$Sets Categories or groupings within the database. Each category (company, issue, currency, index) belongs to a different $Set in the database. For example, $C category contains all active companies in the database.
$T The predefined Research Insight set of Canadian companies.
Argument An argument is a component that is included in the parenthesis of a function. A function may contain more than one argument. Multiple arguments are separated by commas. For example, in the formula @PAVG(SALE,-4Y,0Y) there are three arguments: • SALE
• -4Y
• 0Y
Base Set The population to which you apply your screening criteria. When you create a new screen, you can use the predefined set $C to screen the Compustat North America database, $G + $F to screen the Compustat Global database, or you can choose another predefined or user-defined set.
Business Segment A business segment is a division, subsidiary, or other part of a company that reports financial results such as sales, operating income, and assets. Many companies report basic financial information by operating segments in the notes to their financial statements. For example, GE generates revenue from lines of business including aircraft engines, major appliances and broadcasting.
Calendar Year A period of one year beginning with January 1 and ending with December 31.
Cell The basic unit of a report or spreadsheet. In a free-form report, cells can appear anywhere within the report; in a spreadsheet, cells are formed by the intersection of every row and column.
Combined Figure Date Code Indicates that data for an item is combined with another data item.
Concepts Mathematical or logical combinations of items such as growth rates, ratios and market returns.
Entity An entity may be a company, business or geographic segment of a company, issue of a company, index, aggregate or currency. Each belongs to a predefined $ set in Research Insight.

Research Insight North America Data Guide
930
FASB Acronym for Financial Accounting Standards Board. Compustat North America data definitions may often refer to particular statements issued by FASB that may affect reporting of certain items.
Fiscal Year An accounting period of 12 months. Fiscal years do not necessarily correspond to calendar years.
Footnotes The footnote system for the Compustat North America database supplies supplemental information to the financial data of specific companies. Two-character footnote codes indicate that the data for a fiscal year reflects a change from previous years’ data due to an accounting change, discontinued operations and/or an acquisition, that a particular data item is inconsistent with the Standard & Poor’s definition due to the company’s method of reporting, or the accounting method used by companies in calculating certain key items such as accumulated depreciation, inventories and earnings per share for the financial statements.
Form 4 The Form 4 is the Statement of Changes of Beneficial Ownership of Securities form insiders are required to file with the SEC when they buy or sell company stock, or exercise options.
Geographic Segment A geographic segment is a division, subsidiary or other part of a company that reports financial information by geographic operating units in the notes to their financial statements. For example, Coca-Cola generates revenue in the geographic regions of Asia, Canada, Pacific and United States.
Geometric Mean The nth root of the product arrived at by multiplying the values in the distribution by each other. It is an alternative measure of central tendency and is characteristically lower than an arithmetic mean.
GICS Acronym for Global Industry Classification Standard codes. These codes are a result of a collaboration between Standard & Poor’s and Morgan Stanley Capital International.* GICS are based upon a classification of economic sectors which are further divided into a hierarchy of industry groups, industries and sub-industries. Economic sectors have a two-digit identification code; industry groups have a four-digit identification code; industries have a six-digit identification code; and sub-industries have an eight-digit identification code.
*GICS for inactive companies have not been reviewed or approved by Morgan Stanley Capital International; they were assigned by Standard & Poor’s.
Index Indexes are weighted industry composites. Company data provided for indexes generally includes: Adjustment Factors, Book Value per Share, Dividends per Share, Annualized Dividend Rate, Earnings per Share, High Price, Low Price, Close Price, and Common Shares Traded.
Industry The business group, such as automobile manufacturing, in which a company operates.
ISO Codes Codes developed by the International Standards Organization (ISO) to label currencies. The software uses these codes to identify both the currencies and the currency translation rate items available in the database.

931
Chapter 28 Glossary of Terms
Issue An issue is stock sold by a company. Issue data allows you to evaluate daily market data such as prices, dividends and shares traded for multiple issues of common stock.
Look Up List In Research Insight, from the menu bar select Tools > Look Up to open the Look Up List, where you can view a list of companies, items and concepts, functions, or sets. Prefix searching and full text searching are available from within the Look Up list.
Mnemonic An abbreviated name that consists of alphanumeric characters. Research Insight assigns mnemonics to items and concepts.
NAICS Acronym for North American Industrial Classification System. These 6-digit codes identify company economic activity, sub sector and industry information.
Research Companies Data is no longer collected for these companies for reasons such as merger, acquisition, bankruptcy, etc.
SFAS Acronym for Statement of Financial Accounting Standards. Ruling(s) issued by the Financial Accounting Standards Board (FASB).
SIC Acronym for Standard Industrial Classification. These four-digit codes identify the principal products manufactured or major services provided by each company.
Standardization Compustat data is standardized to ensure consistency and accurate comparisons of information across companies and across time. For example, comparing sales figures published in annual reports can be misleading if some companies report sales figures that include excise taxes and others that exclude taxes. In Compustat, “Sales” always excludes excise taxes so that you accurately compare data that is undistorted by different reporting methods.
Summarized Transactions Each insider’s sale transactions from the Form 4 filings reported during a particular month have been added together to give an aggregate figure for that reporting month. Likewise, each insider’s purchase transaction has been added together to give an aggregate figure for that reporting month.


Index
$ $C • 937 $I • 937 $R • 937 $Sets • 937 $T • 937
@ @ABS - Absolute value • 390, 392 @ALPHA - Returns the intercept of the Y axis •
388, 392 @AND- Logical AND • 389, 393 @BETA - Returns the slope of the line • 388,
393 @CAVG - Average across a set • 391, 393 @CCOR - Correlation coefficient across a set •
391, 394 @CCOUNT - Counts companies containing data
in a set • 391, 394 @CGMN - Geometric mean across a set • 391,
394 @CHGCO - Company transformation • 391, 395 @CHGSET - Set transformation • 391, 395 @CMAX - Maximum value across a set • 391,
396 @CMED - Median value across a set • 391, 396 @CMIN - Minimum value across a set • 391,
397 @CONCATENATE Combines text strings •
392, 397 @CORR - Returns the R2 of the correlation
coefficient • 388, 397 @CPROD - Multiplication across a set • 391,
398 @CSIZE - Counts companies in a set • 391, 398 @CSTD - Standard deviation across a set • 391,
398 @CSUM - Sum across a set • 391, 399 @CWAVG - Weighted average across a set •
391, 399 @DATE - Inserts calendar date • 389, 399 @DAY - Identifies period day • 390, 400 @DB Return formula from the specified layer •
387, 400
@DESC - Displays descriptions • 392, 400 @ELEMENT - Specifies Group Item • 389, 401 @EXCLUDEDB Exclude Specified Database
Layer • 387, 401 @EXP - Exponent • 390, 401 @EXPSMOOTH - Exponentially Weighted
Average • 388, 402 @FIND - Finds a specific value in a text string •
392, 402 @FORECAST- Returns a predicted value • 388,
403 @FRAC - Measures relative standing within a
set • 392, 403 @GEO - Returns geographic segment data • 390,
403 @IF - Returns a value when conditions are met •
389, 404 @INRANGE - Determines membership in a
range • 389, 404 @INT - Integer • 390, 405 @ISAF - Determines annual figure data code •
389, 405 @ISCF - Determine combined figure data code •
389, 405 @ISIF - Determines insignificant figure data
code • 389, 405 @ISMEMBER - Identifies Members of a Set •
391, 404 @ISNA - Determines not available figure data
code • 389, 405 @ISNC - Determines not calculable data code •
389, 406 @ISNM - Determines not meaningful data code
• 389, 406 @ISS - Returns issue data • 390, 406 @ISSF - Determines semiannual figure data
code • 389, 406 @ISVALUE - Determines existence of data •
389, 406 @ISXE - Determines not available currency data
code • 407 @LEFT - Returns the leftmost characters in a
text string • 392, 407 @LN - Natural log • 390, 407 @LOG - Log • 390, 407 @MID - Returns the middle characters in a text
string • 392, 408 @MNT - Identifies period month • 390, 408 @MRALPHA Returns the intercept of the y
axis in the multiple regression equation • 388, 408

Index
@MRBETA Returns the slope of the line for the specified variable • 388, 409
@MRCORR Calculates the coefficient of multiple determination (R2) between 3 or more items from a multiple regression equation • 388, 409
@MRFSTAT Determines the f-statistic in the multiple regression equation • 389, 410
@MRSTDERR Calculates the standard error of the y (independent variable) in the multiple regression equation • 389, 410
@NATIVE - Displays data in native currency • 387, 410
@NOT - Logical NOT • 389, 411 @NTILE - Creates fractiles within a set • 392,
411 @OR - Logical OR • 390, 411 @PARM - Displays currency description • 389,
411 @PAVG - Average across time • 388, 412 @PCGR - Compound growth rate • 389, 412 @PCOR - Correlation Coefficient Over Time •
388, 413 @PCOUNT - Count Periods • 388, 413 @PDEC - Decrease across time • 388, 413 @PERCENTILE Determines the Value at a
Break Point • 390, 414 @PERIOD - Displays period number • 390, 414 @PFIRST Locates First Occurrence of Data •
388, 414 @PFRAC Measures Relative Standing Over
Time • 392, 415 @PFSTPD Locates First Time Period
Occurrence of Data • 388, 415 @PGMN - Geometric mean across time • 388,
416 @PINC - Increase across time • 388, 416 @PLAST Locates Last Occurrence of Data •
388, 415 @PLASTPD Locates Last Time Period
Occurrence of Data • 388, 415 @PLSG - Least squares growth rate • 389, 417 @PLSGR - Fit of least squares growth rate •
389, 417 @PMAX - Maximum value across time • 388,
417 @PMAXPD - Period for maximum value • 388,
418 @PMED - Median value across time • 388, 418
@PMEDPD - Period for median value • 388, 419
@PMIN - Minimum value across time • 388, 419
@PMINPD - Period for minimum value • 388, 419
@PNTILE Creates Fractiles Over Time • 392, 416
@PPROD - Multiplication across time • 388, 420
@PRANK Calculates Relative Rank Over Time • 392, 416
@PSTD - Standard deviation • 388, 420 @PSUM - Sum across time • 388, 420 @PWAVG - Weighted average across time •
388, 421 @QTR - Identifies fiscal period quarter • 390,
421 @RANK - Ranks order within a set • 392, 421 @RIGHT - Returns the rightmost characters in a
text string • 392, 422 @RND - Round • 390, 422 @SCALE - Returns data in millions • 387, 422 @SEG - Returns business segment data • 390,
422 @SET - Selects companies based on condition •
391, 423 @SIC2 and @SIC3 - Generalize SIC codes •
389, 423 @SQRT - Square root • 390, 423 @STDS Standard Deviation for a Sample of a
Population • 391, 423 @TEXT - Returns a string of characters • 392,
424 @TRIMPCT - Trim Outlying Values (Percent) •
391, 424 @TRIMSTD - Trim Outlying Values (Standard
Deviation) • 391, 424 @VALUE - Generates a data value • 390, 425 @WK - Identifies period week • 391, 425 @YR-Identifies Fiscal Period Year • 391, 425
1 1 Year Indexed Total Return • 567, 592 1 Year Total Return • 568, 594 10 Year Indexed Total Return • 567, 593 10 Year Total Return • 568, 595 13F Form • 507

Index
3 3 Year Indexed Total Return • 567, 592 3 Year Total Return • 568, 594
5 5 Year Indexed Total Return • 567, 593 5 Year Total Return • 568, 595
6 6 Month Total Return - On-line • 567, 594 6 Month Total Return Daily • 545, 567, 594
A ACCGQF • 242 ACCHG • 241 ACCHGF • 241 ACCHGQ • 242 Accounting Changes - Cumulative Effect • 237,
241 Accounting Changes - Cumulative Effect - Note
• 241 Accounting Changes - Cumulative Effect - Note
- Quarterly • 242 Accounting Changes - Cumulative Effect -
Quarterly • 237, 242, 313 Accounts Payable • 76, 79 Accounts Payable - Note • 79 Accounts Payable - Quarterly • 76, 80, 311 Accounts Payable - Quarterly - Note • 80 Accounts Payable and Accrued Liabilites -
Increase (Decrease) - 12MM • 762, 772 Accounts Payable and Accrued Liabilities -
Increase (Decrease) • 762, 771 Accounts Payable and Accrued Liabilities -
Increase (Decrease) - Quarterly • 312, 762, 771
Accrued Expenses • 76, 81 Accumulated Depreciation - (Schedule VI)
Beginning Balance • 658, 659 Accumulated Depreciation - (Schedule VI)
Buildings • 658, 659 Accumulated Depreciation - (Schedule VI)
Construction in Progress • 658, 659 Accumulated Depreciation - (Schedule VI)
Ending Balance • 658, 660 Accumulated Depreciation - (Schedule VI) Land
and Improvements • 658, 660 Accumulated Depreciation - (Schedule VI)
Leases • 658, 660
Accumulated Depreciation - (Schedule VI) Natural Resources • 658, 661
Accumulated Depreciation - (Schedule VI) Other • 658, 662
Accumulated Depreciation - (Schedule VI) Other Changes • 658, 662
Accumulated Depreciation - (Schedule VI) Retirements • 658, 663
Accumulated Depreciation - (Scheldue VI) Machinery and Equipment • 658, 661
Accumulated Depreciation of Real Estate Property • 139, 143
Accumulated Depreciation of Real Estate Property - Quarterly • 139, 143
Accumulated Depreciation, Depletion, and Amortization - Total • 75, 82
Accumulated Depreciation, Depletion, and Amortization - Total - Note • 82
Accumulated Depreciation, Depletion, and Amortization - Total - Quarterly • 75, 82, 311
Accumulated Depreciation, Depletion, and Amortization - Total - Quarterly - Note • 83
ACO • 97 ACOMINC • 170 ACOMINCQ • 170 ACOQ • 97 ACOX • 98 Acquisition/Merger After-Tax • 237, 243 Acquisition/Merger After-Tax - Quarterly • 237,
243 Acquisition/Merger Basic EPS Effect • 237, 243 Acquisition/Merger Basic EPS Effect - Quarterly
• 237, 243 Acquisition/Merger Diluted EPS Effect • 237,
243 Acquisition/Merger Diluted EPS Effect -
Quarterly • 237, 244 Acquisition/Merger Pretax • 237, 244 Acquisition/Merger Pretax - Quarterly • 237, 244 Acquisitions • 763, 764, 766, 767, 768, 774 Acquisitions - Income Contribution • 237, 244 Acquisitions - Quarterly • 313, 763, 764, 766,
767, 768, 774 Acquisitions - Sales Contribution • 237, 245 Acquisitions - Sales Contribution - Note • 245 Acquisitions 12MM • 763, 764, 766, 767, 768,
775 ACT • 98 ACTQ • 98 ADD1 • 17