data evaluation record - epa archives · this data evaluation record may have been altered by the...
TRANSCRIPT


DATA EVALUATION RECORD
DIMETHOATE
Study Type: Non-guideline; Range-finding One-Generation Reproduction Study in Rats
Work Assignment No. 2-01-45 (MRID 46348201)
Prepared for Health Effects Division
Office of Pesticide Programs U.S. Environmental Protection Agency
1921 Jefferson Davis Highway Arlington, VA 22202
Prepared by Pesticides Health Effects Group
Sciences Division Dynamac Corporation
1910 Sedwick Road, Building 100, Suite B Durham, NC 27713
Primary Reviewer: John W. Allran, M.S. Signature: _______________________ Date: _______________________ Secondary Reviewer: Michael E. Viana, Ph.D. Signature: _______________________ Date: _______________________ Project Manager: Mary L. Menetrez, Ph.D. Signature: _______________________ Date: _______________________ Quality Assurance: Steven Brecher, Ph.D. Signature: _______________________ Date: _______________________ Disclaimer This Data Evaluation Record may have been altered by the Health Effects Division subsequent to signing by Dynamac Corporation personnel.


Range-finding Reproduction and Fertility Study in Rats (1990) / Page 1 of 26 DIMETHOATE/035001 Non-guideline
EPA Reviewer: Paul Chin, Ph.D. Signature: Reregistration Branch 1, Health Effects Division (7509C) Date EPA Secondary Reviewer: Whang Phang, Ph.D. Signature: Reregistration Action Branch 1, Health Effects Division (7509C) Date EPA Work Assignment Manager: P. V. Shah, Ph.D. Signature: Registration Action Branch 1, Health Effects Division (7509C) Date_____________ Template version 11/01
DATA EVALUATION RECORD
STUDY TYPE: Range-finding One-generation Reproduction and Fertility Study in Rats; Non-
guideline. PC CODE: 035001 DP BARCODE: D307247 TXR#: 0052750 SUBMISSION NO.: Not provided TEST MATERIAL (PURITY): Dimethoate (batch information and purity not provided) SYNONYMS: O, O-dimethyl S-(N-methylcarbamoyl-methyl)-phosphorodithioate CITATION: Brooker, A.J. and A. Stubbs (1990) Dimethoate: dietary range finding study in
mature male and female rats and their juvenile offspring. Huntingdon Research Center Ltd., Huntingdon, Cambridgeshire, England. Laboratory Project Id.: DTF 10/891204, May 2, 1990. MRID 46348201. Unpublished.
SPONSOR: Cheminova A/S, P.O. Box 9, Lemvig, Denmark EXECUTIVE SUMMARY: In a one-generation range-finding reproduction toxicity study (MRID 46348201), Dimethoate (batch number and purity not provided) was administered continuously in the diet to Sprague-Dawley (Crl:CD®[SD]BR VAF Plus) rats (10 animals/sex/dose) at nominal dose levels of 0, 50, 75, or 100 ppm (equivalent to 0/0, 2.9/3.9, 4.4/5.8, and 6.1/7.5 mg/kg bw/day in M/F). The P animals were fed the test diets beginning four weeks prior to mating, and were allowed to litter and rear their young to weaning. Litters were not standardized by culling. The F1 pups were weaned on postnatal day (PND) 21, and 20 pups/sex/group (2/sex/litter, as near as possible) were randomly selected to continue on study and were fed the test diets until 6 weeks of age. Plasma, erythrocyte, and brain cholinesterase activities were measured in the parents and weanlings. Intermittent body tremors were observed mainly during the first two weeks post partum in the 75 ppm (3/10) and 100 ppm (6/10) females. These tremors were noted for 1 to 7 days at 75 ppm (mean 4.3 days) and for 5 to 10 days at 100 ppm (mean of 7.3 days). Additionally at 100 ppm, 2 females had bulging eyes for two or three days during lactation.

Range-finding Reproduction and Fertility Study in Rats (1990) / Page 2 of 26 DIMETHOATE/035001 Non-guideline
During the first week of lactation, body weight gains were dose-dependently decreased in all treated dams (978-314%), resulting in minor decreases in body weights throughout lactation beginning on lactation day (LD) 7 (92-7%). Dose-dependent decreases were observed in all treated parental groups in both sexes in plasma cholinesterase (914-49%) and erythrocyte and brain cholinesterase (944-68%). The LOAEL for parental toxicity was 50 ppm (equivalent to 2.9/3.9 mg/kg/day) based on decreased plasma, erythrocyte, and brain cholinesterase activities. The NOAEL was not observed. The number of pup deaths from PND 4-21 was higher at $75 ppm (9-13) compared to controls (0), resulting in a lower lactation index in these animals (90.6-93.1%) and a continued decreased mean litter size throughout the post-natal period. Throughout the pre-weaning period, body weights of the F1 pups were dose-dependently decreased in all of the treated groups in both sexes beginning on PND 4 (96-20%), resulting in decreased body weight gains for PND 0-21 (911-23%). Similarly, litter weights were dose-dependently decreased in all treated groups throughout the post-natal period (92-32%); the magnitude of these decreases became greater as the study progressed and were attributed to a combination of the decreased mean pup weights and decreased litter size (due to cumulative pup mortality). Body weight gains from weaning to 6 weeks of age (PND 21-42) were comparable to or increased over controls. Thus, body weights began to recover but remained slightly decreased (97%) compared to controls in the 100 ppm males at the end of the 6 weeks. Dose-dependent decreases were observed in all treated groups in both sexes in plasma cholinesterase (929-49%) and erythrocyte and brain cholinesterase (959-74%). The LOAEL for offspring toxicity was 50 ppm (equivalent to 2.9/3.9 mg/kg/day) based on decreased plasma, erythrocyte, and brain cholinesterase activities and body weight decrease in all dose groups comparing to the controls. The NOAEL was not observed. There were no effects of treatment on the precoital or gestation intervals or on the pregnancy rate, mating or fertility indices, or percent of dams rearing offspring to weaning. However, a decrease in the mean number of implantation sites was observed at in all treated groups (14.4-15.7 in treated vs 16.1 in controls). Furthermore, post-implantation loss was increased in these animals (5.9-10.9% treated vs 3.8% controls). The mean litter size at birth was correspondingly decreased in all treated groups (13.2-15.2 treated vs 15.4 controls). The Sponsor stated that there was no apparent effect of treatment on sex ratio. However, a dose-dependent decrease in the percent males was observed at PND 0 and PND 21 at 50 ppm (51.1-51.7%), 75 ppm (48.2-48.7%), and 100 ppm (41.1-42.2%) compared to controls (52.5%). The

Range-finding Reproduction and Fertility Study in Rats (1990) / Page 3 of 26 DIMETHOATE/035001 Non-guideline
reviewers are unable to discount a possible sex-specific treatment-related decrease in pre- and/or post-implantation survival of the male fetuses because the Sponsor did not perform statistical analyses, present standard deviations with the means, or provide historical control data. The LOAEL for reproductive performance is 50 ppm (equivalent to 2.9/3.9 mg/kg/day) based on decreased number of implantations, increased post-implantation loss, and decreased percent males. The NOAEL was not observed. This study was dose range finding study and classified unacceptable/non-guideline because the report contained several deficiencies which presented uncertainty in interpreting the data. However, based on the results from this study, an acceptable multiple generation reproduction toxicity study (MRID No. 42251501) was conducted in 1992 at doses of 0.08, 1.2 or 5.5 mg/kg/day. Dose related decreases in plasma and brain cholinesterase activities were observed at 1.2 and 5.5 mg/kg/day in dams. COMPLIANCE: Signed and dated Data Confidentiality, GLP, and Flagging statements were provided. The GLP statement, provided by the Sponsor, stated that they did not know whether the study was conducted in full compliance with 40 CFR Part 160. A separate Quality Assurance statement was not provided.

Range-finding Reproduction and Fertility Study in Rats (1990) / Page 4 of 26 DIMETHOATE/035001 Non-guideline
I. MATERIALS AND METHODS A. MATERIALS 1. Test Material: Dimethoate Description: White crystalline solid Batch #: Not provided Purity: Not provided Compound Stability: Stability of the test substance in the diet was not determined. CAS # of TGAI: 60-51-5 Structure:
PS
OO
S
CH3
CH3
NH
O
CH3
2. Vehicle: Diet 3. Test animals Species: Rat Strain: Crl: CD® (SD) BR VAF/Plus Age at study initiation: Approximately 11 weeks Weight range at Week 0: 401-457 g males; 205-245 g females Source: Charles River Laboratories, St. Aubin les Elbeuf, France Housing: 5/cage for both sexes during pre-mating and for males during post-mating in
suspended galvanized metal cages with solid sides and back and wire mesh front, floor, and top. In plastic RM-2 breeding cages during mating (1 male:1 female), gestation (females individually), and lacatation (individual dams with litter).
Diet: Labsure Laboratory Diet No. 2 (Biosure), ad libitum Water: Tap water ad libitum Environmental
conditions: Temperature Humidity Air changes Light cycle
21EC 55% Not provided 12 hrs light/12 hrs dark
Acclimation period: 15 days B. PROCEDURES AND STUDY DESIGN 1. Study purpose and schedule: This study was conducted as a range-finding study to assist in the selection of test diet concentrations for a definitive multiple generation reproduction toxicity study in rats. The P animals were exposed to the test substance in the diet continuously throughout the study beginning four weeks prior to pairing. Thus, the P animals were approximately 15 weeks old at mating to produce the F1 litters. The F1 pups were weaned on postnatal day (PND) 21, and 20 F1 rats/sex/dose were fed the test diets for an additional three weeks before termination at six weeks of age. 2. Mating procedure: Males and females were paired (1:1) for a period of up to three weeks.

Range-finding Reproduction and Fertility Study in Rats (1990) / Page 5 of 26 DIMETHOATE/035001 Non-guideline
No further information was provided. 3. Animal assignment: During acclimation (7 days prior to treatment initiation), all P animals were weighed and randomly assigned (stratified by body weight) to the test groups shown in Table 1. TABLE 1. Animal assignment a
Animals/group Test Group Doseb
(mg/kg/day) P Males
P Females F1 Males F1 Females
Control 0 10 10 20 20 Low 50 10 10 20 20 Mid 75 10 10 20 20 High 100 10 10 20 20
a Data were obtained from pages 13 and 16 of the study report. b Exposure to the test substance was continuous throughout the study. 4. Dose-selection rationale: No dose-selection rationale was provided. 5. Dosage preparation and analysis: A pre-mix was prepared by dissolving a weighed amount of the test substance in an appropriate amount of ethanol, mixing the resulting solution with sieved diet, and evaporating the ethanol at 40EC in a rotary evaporator. The required dietary concentrations were prepared by direct dilution of the pre-mix. Test diets were prepared weekly and used within 7 days of preparation. For the first three weeks of the study, test diets were stored at room temperature; from Week 3, diets were stored frozen and thawed amounts were fed daily. Test diets were not analyzed for homogeneity, stability, or achieved concentration. 6. Dosage administration: All doses were administered continuously in the diet throughout the study. C. OBSERVATIONS 1. Parental animals: All animals were regularly handled and observed daily for mortality and clinical signs of toxicity. Body weights were measured weekly throughout the study for males and throughout the pre-mating period for females, beginning one week prior to study initiation. Additionally, females were weighed on GD 0, 7, 10, 14, 17, and 20 and on lactation days (LD) 0, 7, 14, and 21. Food consumption (g/rat/week) was reported weekly throughout the pre-mating period. Food conversion ratio was calculated for each week throughout pre-mating by dividing the food consumption by the body weight gain. Vaginal smears were taken beginning two weeks prior to mating and continuing for 20 days during the mating period in order to determine: (i) estrous cycle duration and normality; (ii) whether or not pregnancy was interrupted after mating; and (iii) median pre-coital time. Sperm enumeration, morphology, and motility were not evaluated.
Range-finding Reproduction and Fertility Study in Rats (1990) / Page 6 of 26 DIMETHOATE/035001 Non-guideline
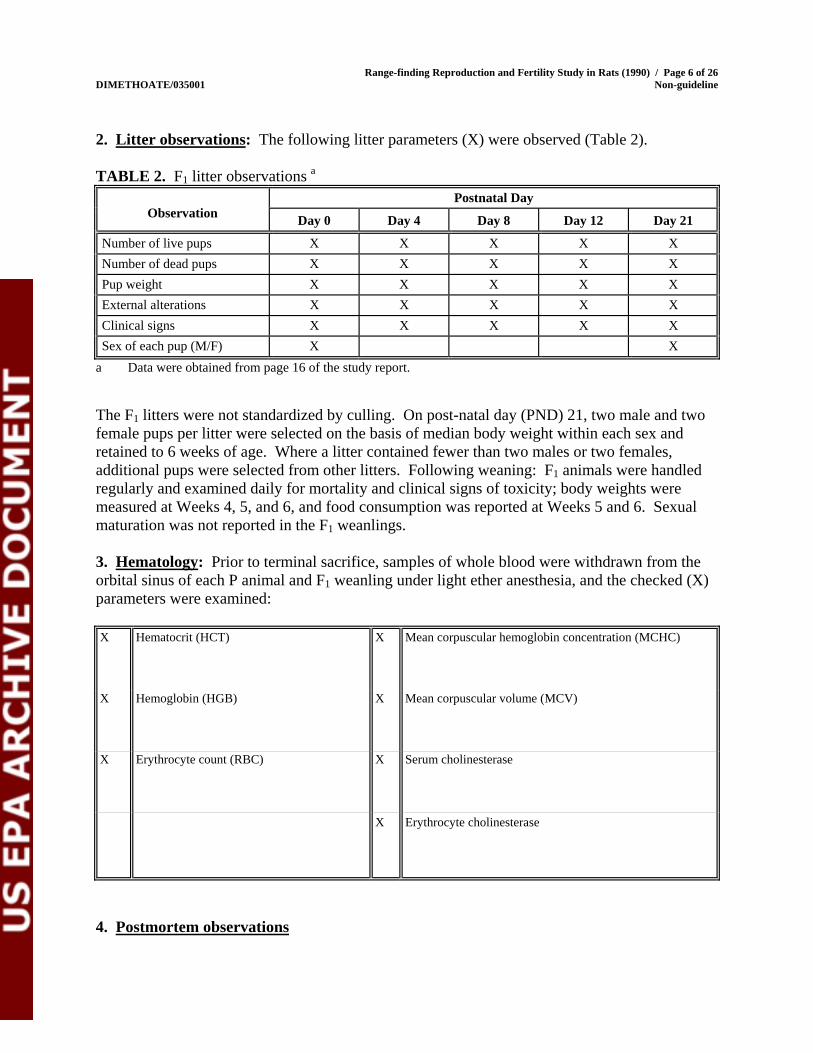
2. Litter observations: The following litter parameters (X) were observed (Table 2). TABLE 2. F1 litter observations a
Postnatal Day Observation Day 0 Day 4 Day 8 Day 12 Day 21
Number of live pups X X X X X Number of dead pups X X X X X Pup weight X X X X X External alterations X X X X X Clinical signs X X X X X Sex of each pup (M/F) X X
a Data were obtained from page 16 of the study report. The F1 litters were not standardized by culling. On post-natal day (PND) 21, two male and two female pups per litter were selected on the basis of median body weight within each sex and retained to 6 weeks of age. Where a litter contained fewer than two males or two females, additional pups were selected from other litters. Following weaning: F1 animals were handled regularly and examined daily for mortality and clinical signs of toxicity; body weights were measured at Weeks 4, 5, and 6, and food consumption was reported at Weeks 5 and 6. Sexual maturation was not reported in the F1 weanlings. 3. Hematology: Prior to terminal sacrifice, samples of whole blood were withdrawn from the orbital sinus of each P animal and F1 weanling under light ether anesthesia, and the checked (X) parameters were examined: X Hematocrit (HCT) X Mean corpuscular hemoglobin concentration (MCHC)
X Hemoglobin (HGB) X Mean corpuscular volume (MCV)
X Erythrocyte count (RBC) X Serum cholinesterase
X Erythrocyte cholinesterase
4. Postmortem observations

Range-finding Reproduction and Fertility Study in Rats (1990) / Page 7 of 26 DIMETHOATE/035001 Non-guideline
1) Parental animals: At termination, P animals were sacrificed and subjected to a complete macroscopic examination. The brain of each animal was weighed and collected for cholinesterase determination. The uterus of each female which gave birth was removed, and the number of implantation sites was recorded. Uteri of apparently non-pregnant females were immersed in ammonium sulfide to reveal evidence of implantation. Testes of males which failed to inseminate their partner were weighed and, where indicated, preserved in buffered formalin for microscopic examination. 2) Offspring: Excess pups not selected for continuation of the study were sacrificed and, along with decedents, were subjected to a gross necropsy. F1 animals continuing on study until 6 weeks of age were sacrificed, subjected to a gross necropsy, and the brain was weighed and collected for cholinesterase determination. Pups with suspected abnormalities were preserved either in Bouin’s solution if it was considered that free-hand sectioning or microscopic examination would be of value, or in alcohol for subsequent staining with alizarin if skeletal defects were suspected. D. DATA ANALYSIS 1. Statistical analyses: It was stated that statistical analyses were not performed due to the small sample size. Although statistical analysis on data with a sample size of 10 or 20 animals would not have as much power to discern differences compared to analyses resulting from data in which the n value were larger, statistical analyses of these data would still have been of some assistance in interpreting the data. Furthermore, standard deviations were not presented with the means, thus making comparative evaluation of the data even more challenging. 2. Indices Reproductive indices: No reproductive indices were reported. The reviewers calculated the following reproductive indices from the breeding and parturition records of animals in the study: Mating index (%) = # females with positive evidence of mating (i.e., sperm in vaginal smear and/or copulatory plug)/# females mated x 100 Fertility index (%) = # pregnant females/# females with positive evidence of mating x 100 Offspring viability indices: The following viability indices were reported by the performing laboratory from lactation records of litters in the study: Post-implantation loss (%) = (# implantations - # live young)/# implantations x 100 Pup loss at birth (%) = (total # young at birth - # live young)/total # young at birth x 100 Cumulative pup loss (%) = (total # young at birth - # live young at Day x)/total # young at birth x 100, where x = 4, 8, 12, or 21 days post-partum.

Range-finding Reproduction and Fertility Study in Rats (1990) / Page 8 of 26 DIMETHOATE/035001 Non-guideline
Additionally, the reviewers calculated the following viability indices: Live birth index (%) = # offspring born live/total # offspring born x 100 Viability index (%) = # offspring alive at PND 4/# offspring alive at PND 0 x 100 Lactation index (%) = # offspring alive at PND 21/# offspring alive at PND 4 x 100 3. Historical control data: Historical control data were not provided. II. RESULTS A. PARENTAL ANIMALS1. Mortality and clinical signs: There were no mortalities in the P males or females. Intermittent body tremors were observed mainly during the first two weeks post partum in the 75 ppm (3/10) and100 ppm (6/10) females (Table 3). These tremors were noted for 1 to 7 days at 75 ppm (mean 4.3 days) and for 5 to 10 days at 100 ppm (mean of 7.3 days). Additionally at 100 ppm, 2 females had bulging eyes for two or three days during lactation. There were no other clinical signs of toxicity. TABLE 3. Clinical signs of toxicity [# affected animals (mean number of days a)] in the P generation b
Dose Group (ppm) c
Observation
0 50 75 100
Intermittent body tremors 0 0 3 (4.3) 6 (7.3)
Bulging eyes 0 0 0 2 (2.5)
a Calculated by the reviewers by dividing the number of days observed by the number of animals affected. b Data were obtained from Appendix 1 on page 53 of the study report. c 10 females/dose group 2. Body weight and food consumption: Selected body weight, body weight gain, and food
Range-finding Reproduction and Fertility Study in Rats (1990) / Page 9 of 26 DIMETHOATE/035001 Non-guideline
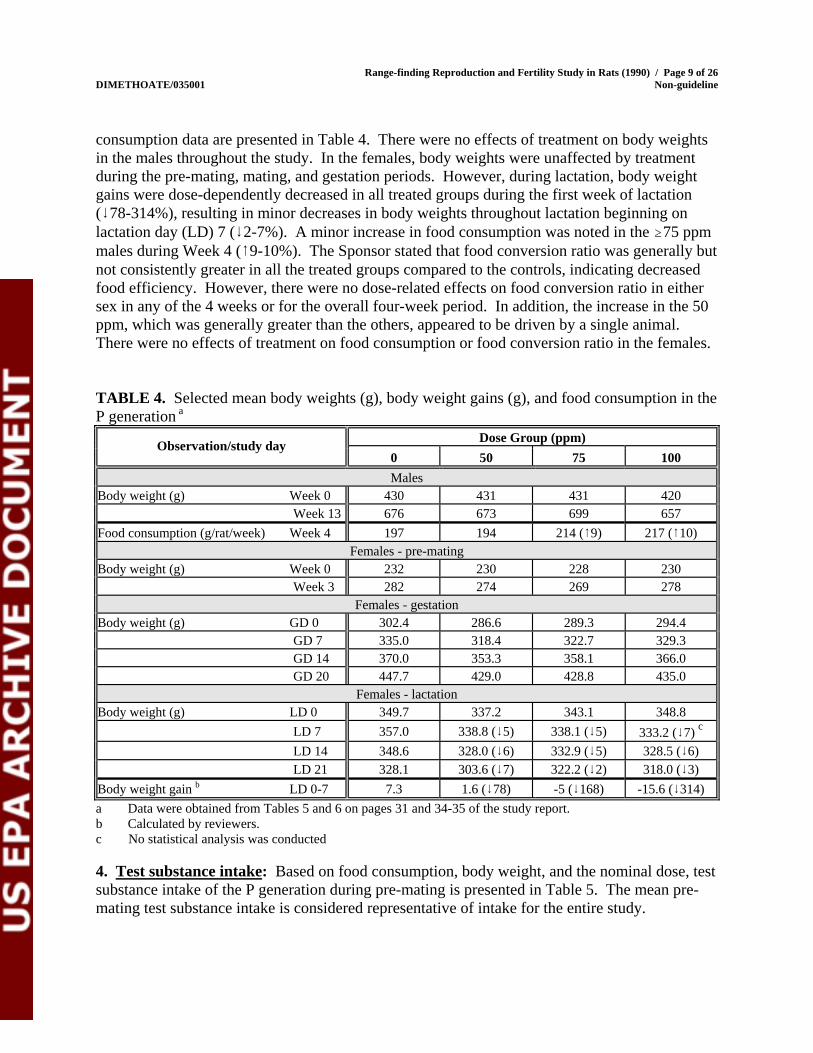
consumption data are presented in Table 4. There were no effects of treatment on body weights in the males throughout the study. In the females, body weights were unaffected by treatment during the pre-mating, mating, and gestation periods. However, during lactation, body weight gains were dose-dependently decreased in all treated groups during the first week of lactation (978-314%), resulting in minor decreases in body weights throughout lactation beginning on lactation day (LD) 7 (92-7%). A minor increase in food consumption was noted in the $75 ppm males during Week 4 (89-10%). The Sponsor stated that food conversion ratio was generally but not consistently greater in all the treated groups compared to the controls, indicating decreased food efficiency. However, there were no dose-related effects on food conversion ratio in either sex in any of the 4 weeks or for the overall four-week period. In addition, the increase in the 50 ppm, which was generally greater than the others, appeared to be driven by a single animal. There were no effects of treatment on food consumption or food conversion ratio in the females. TABLE 4. Selected mean body weights (g), body weight gains (g), and food consumption in the P generation a
Dose Group (ppm) Observation/study day 0 50 75 100 Males
Body weight (g) Week 0 430 431 431 420 Week 13 676 673 699 657
Food consumption (g/rat/week) Week 4 197 194 214 (89) 217 (810) Females - pre-mating
Body weight (g) Week 0 232 230 228 230 Week 3 282 274 269 278
Females - gestation Body weight (g) GD 0 302.4 286.6 289.3 294.4
GD 7 335.0 318.4 322.7 329.3 GD 14 370.0 353.3 358.1 366.0 GD 20 447.7 429.0 428.8 435.0
Females - lactation Body weight (g) LD 0 349.7 337.2 343.1 348.8
LD 7 357.0 338.8 (95) 338.1 (95) 333.2 (97) c
LD 14 348.6 328.0 (96) 332.9 (95) 328.5 (96) LD 21 328.1 303.6 (97) 322.2 (92) 318.0 (93)
Body weight gain b LD 0-7 7.3 1.6 (978) -5 (9168) -15.6 (9314) a Data were obtained from Tables 5 and 6 on pages 31 and 34-35 of the study report. b Calculated by reviewers. c No statistical analysis was conducted 4. Test substance intake: Based on food consumption, body weight, and the nominal dose, test substance intake of the P generation during pre-mating is presented in Table 5. The mean pre-mating test substance intake is considered representative of intake for the entire study.

Range-finding Reproduction and Fertility Study in Rats (1990) / Page 10 of 26 DIMETHOATE/035001 Non-guideline
TABLE 5. Mean test substance intake during pre-mating (mg/kg body weight/day)a
Dose Group (ppm)
Pre-mating week
50 75 100
Males
1 3.2 4.8 6.4
2 3.0 4.4 6.1
3 2.8 4.2 5.8
4 2.7 4.3 6.0
Mean (Weeks 1-4) b 2.9 4.4 6.1
Females
1 4.2 6.1 7.9
2 3.9 5.8 7.7
3 3.8 5.6 7.2

Range-finding Reproduction and Fertility Study in Rats (1990) / Page 11 of 26 DIMETHOATE/035001 Non-guideline
4 3.6 5.7 7.2
Mean (Weeks 1-4) 3.9 5.8 7.5
a Data were obtained from Table 4 on page 33 of the study report. b Calculated by reviewers 4. Reproductive function a. Estrous cycle: Although it was stated that vaginal smears were taken beginning two weeks prior to mating and continuing for 20 days during the mating period, no summary data describing estrous cycle duration and normality were reported. b. Sperm measures: Not performed. 5. Reproductive performance: There were no effects of treatment on the precoital or gestation intervals or on the pregnancy rate, mating or fertility indices, or percent of dams rearing offspring to weaning (Table 6). TABLE 6. Reproductive performance - P generation a
Dose Group (mg/kg/day) Observation
0 50 75 100
Number mated 10 10 10 10 Number pregnant 10 9 10 10 Pregnancy rate (%) 100 90 100 100 Mating index (%) b 100 90 100 100 Fertility index (%) b 100 100 100 100 Rearing young to weaning (%) 100 90 100 100 Median precoital interval (days) 2.5 2.0 1.5 2.5 Mean gestation duration (days) 22.1 22.0 22.3 21.8 a Data were obtained from Tables 1, 7, 8, and 9 on pages 30 and 36-38 of the study report. b Calculated by the reviewers from the vaginal smear data presented in Table 7 on page 36 as follows:
Mating index (%) = # females with positive evidence of mating (i.e., sperm in vaginal smear and/or copulatory plug)/# females mated x 100
6. Hematology: Hematocrit, hemoglobin, and the number of erythrocytes were decreased (94-8%) in the 100 ppm P females; however, these minor decreases were not considered adverse. There were no other findings in hematology that could be attributed to treatment.
Range-finding Reproduction and Fertility Study in Rats (1990) / Page 12 of 26 DIMETHOATE/035001 Non-guideline
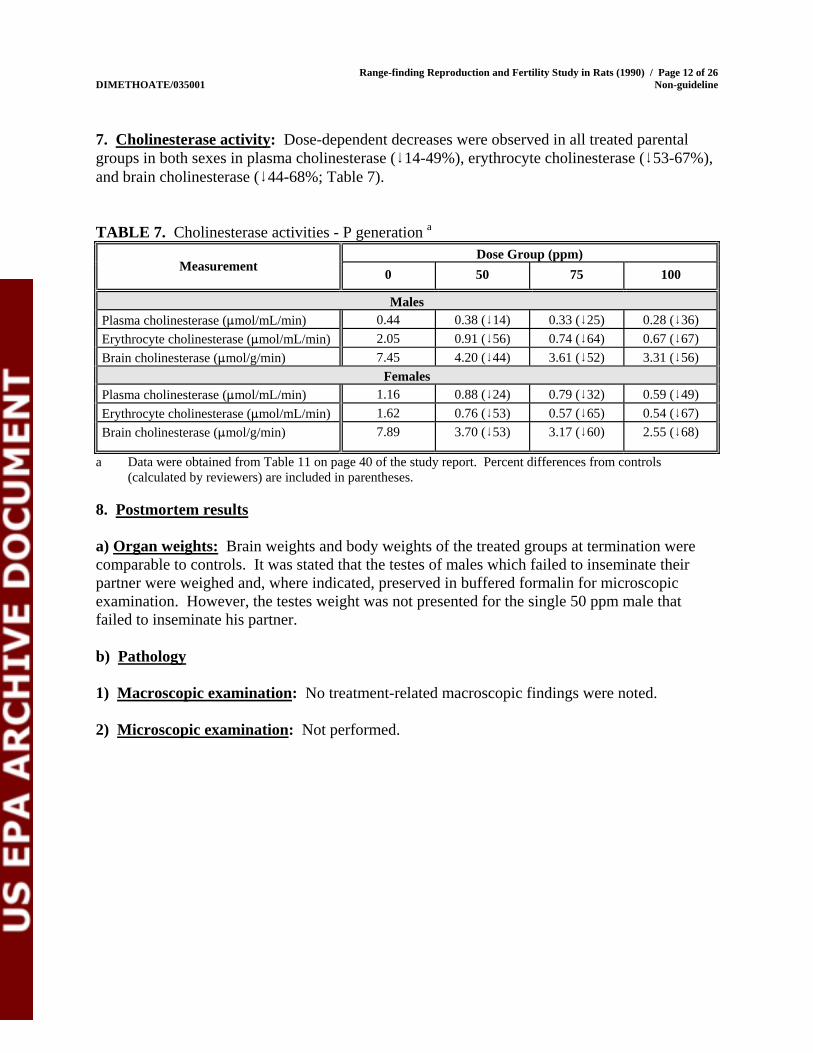
7. Cholinesterase activity: Dose-dependent decreases were observed in all treated parental groups in both sexes in plasma cholinesterase (914-49%), erythrocyte cholinesterase (953-67%), and brain cholinesterase (944-68%; Table 7). TABLE 7. Cholinesterase activities - P generation a
Dose Group (ppm) Measurement 0 50 75 100
Males Plasma cholinesterase (:mol/mL/min) 0.44 0.38 (914) 0.33 (925) 0.28 (936) Erythrocyte cholinesterase (:mol/mL/min) 2.05 0.91 (956) 0.74 (964) 0.67 (967) Brain cholinesterase (:mol/g/min) 7.45 4.20 (944) 3.61 (952) 3.31 (956)
Females Plasma cholinesterase (:mol/mL/min) 1.16 0.88 (924) 0.79 (932) 0.59 (949) Erythrocyte cholinesterase (:mol/mL/min) 1.62 0.76 (953) 0.57 (965) 0.54 (967) Brain cholinesterase (:mol/g/min) 7.89 3.70 (953) 3.17 (960) 2.55 (968)
a Data were obtained from Table 11 on page 40 of the study report. Percent differences from controls (calculated by reviewers) are included in parentheses.
8. Postmortem results a) Organ weights: Brain weights and body weights of the treated groups at termination were comparable to controls. It was stated that the testes of males which failed to inseminate their partner were weighed and, where indicated, preserved in buffered formalin for microscopic examination. However, the testes weight was not presented for the single 50 ppm male that failed to inseminate his partner. b) Pathology 1) Macroscopic examination: No treatment-related macroscopic findings were noted. 2) Microscopic examination: Not performed.

Range-finding Reproduction and Fertility Study in Rats (1990) / Page 13 of 26 DIMETHOATE/035001 Non-guideline
B. OFFSPRING 1. Viability and clinical signs: Litter data for the F1 pups are presented in Table 8. No clinical signs of toxicity were observed in the F1 pups during the post-natal period. In the F1 weanlings retained to 6 weeks of age, there were no mortalities or clinical signs of toxicity. A dose-dependent decrease in the mean number of implantation sites was observed at 50 ppm (15.7), 75 ppm (15.2), and 100 ppm (14.4) compared to controls (16.1). Furthermore, post-implantation loss was increased at 50 ppm (5.9%), 75 ppm (10.9%), and 100 ppm (10.0%) compared to controls (3.8%). Thus, the mean litter size at birth was correspondingly decreased at 50 ppm (15.2), 75 ppm (14.0), and 100 ppm (13.2) compared to controls (15.4). There was only one pup born dead (from a control litter); thus, there was no effect of treatment on the live birth index. The number of deaths from PND 0-4 were minimal (1-3 per group) and showed no relationship to dose; thus, there was no effect of treatment on the viability index. However, the number of pup deaths from PND 4-21 was higher at $75 ppm (9-13) compared to controls (0), resulting in a lower lactation index in these animals (90.6-93.1%) and a continued decreased mean litter size throughout the post-natal period. The Sponsor stated that there was no apparent effect of treatment on sex ratio. However, a dose-dependent decrease in the percent males was observed at PND 0 and PND 21 at 50 ppm (51.1-51.7%), 75 ppm (48.2-48.7%), and 100 ppm (41.1-42.2%) compared to controls (52.5%).

Range-finding Reproduction and Fertility Study in Rats (1990) / Page 14 of 26 DIMETHOATE/035001 Non-guideline
TABLE 8. Litter parameters a
Dose Group (ppm) Observation
0 50 75 100
Mean implantation sites 16.1 15.7 15.2 14.4 Number born live b 153 137 140 132 Number born dead b 1 0 0 0 Mean sex ratio (% %) Day 0 52.5 51.7 48.7 42.2
Day 21 52.5 51.1 48.2 41.1 # Deaths Days 0-4 b 1 3 1 1 # Deaths Days 4-21 b 0 1 13 9 Mean litter size Day 0 (total) 15.4 15.2 14.0 13.2
Day 0 (live)
15.3 15.2 14.0 13.2
Day 4 15.2 14.9 13.9 13.1 Day 8 15.2 14.9 13.3 12.8
Day 12 15.2 14.9 12.6 12.7 Day 21 15.2 14.8 12.6 12.2
Post-implantation loss (%) 3.8 5.9 10.9 10.0 Live birth index (%) b, c 99.4 100.0 100.0 100.0 Viability (Days 0-4) index (%) b, d 99.3 97.8 99.3 99.2 Lactation (Days 4-21) index (%) b, e 100.0 99.3 90.6 93.1
a Data were obtained from Tables 13 through 15 and Appendices 10 and 11 on pages 42-45 and 78-85 of the study report.
b Calculated by the reviewers c Live birth index (%) = # offspring born live/total # offspring born x 100 d Viability index (%) = # offspring alive at PND 4/# offspring alive at PND 0 x 100 e Lactation index (%) = # offspring alive at PND 21/# offspring alive at PND 4 x 100 2. Body weight: Mean pup body weight and litter weight data are presented in Table 9. Body weights of the F1 pups were dose-dependently decreased (96-20%) in all of the treated groups in both sexes throughout the pre-weaning period beginning on PND 4. Body weight gains for the overall (PND 0-21) pre-weaning period were decreased in the $50 ppm males and females (911-23%). Litter weights were decreased at 50 ppm (92-10%), 75 ppm (912-30%), and 100 ppm (913-32%) throughout the post-natal period. Body weight gains from weaning to 6 weeks of age (PND 21-42) were increased or comparable to controls. Body weights began to recover but remained slightly decreased (97%) compared to controls in the 100 ppm males at the end of the 6 weeks.

Range-finding Reproduction and Fertility Study in Rats (1990) / Page 15 of 26 DIMETHOATE/035001 Non-guideline
TABLE 9. Mean pup and litter weights (g) a
Dose Group (ppm) PND
0 50 75 100
F1 males 0 6 6 6 7 4 11 11 10 (99) 10 (99) 8 18 16 (911) 15 (917) 15 (917)
12 25 23 (98) 21 (916) 20 (920) 21 50 45 (910) 42 (916) 41 (918) 28 94 91 85 (910) 83 (912) 35 149 147 142 (95) 135 (99) 42 205 210 202 190 (97)
Gain (PND 0-21) b 44 39 (911) 36 (918) 34 (923) Gain (PND 21-42) b 155 165 160 149
F1 females 0 6 6 6 6 4 11 10 (99) 10 (99) 10 (99) 8 17 16 (96) 15 (912) 14 (918)
12 25 23 (98) 20 (920) 20 (920) 21 48 43 (910) 40 (917) 41 (915) 28 87 84 78 (910) 78 (910) 35 132 127 122 (98) 122 (98) 42 163 160 159 161
Gain (PND 0-21) b 42 37 (912) 34 (919) 35 (917) Gain (PND 21-42) b 115 117 119 120
F1 litters 1 95.4 93.4 (92) 84.2 (912) 83.0 (913) 4 160.6 155.7 (93) 134.2 (916) 128.3 (920) 8 256.6 239.3 (97) 189.7 (926) 181.7 (929)
12 363.3 334.9 (98) 254.0 (930) 248.3 (932) 21 713.7 640.0 (910) 507.0 (929) 496.0 (931)
a Data were obtained from Tables 14 and 19 on pages 43, 44, and 49 of the study report. Percent differences from controls (calculated by reviewers) are included in parentheses.
b Calculated by the reviewers from the differences in group mean body weight data presented in this table. 3. Food consumption and efficiency after weaning: In general, food consumption was increased (83-21%) in all treated groups in both sexes during Weeks 5 and 6; however, these increases appeared unrelated to dose. There were no treatment-related effects on food conversion ratio. All differences were either unrelated to dose or differed between sexes or between Weeks 5 and 6.

Range-finding Reproduction and Fertility Study in Rats (1990) / Page 16 of 26 DIMETHOATE/035001 Non-guideline
4. Sexual maturation (F1): Not determined. 5. Hematology: There were no treatment-related effects in hematology in the offspring. 6. Offspring postmortem results a) Brain weights: No treatment-related effects were observed on brain weights in the offspring at 6 weeks of age. b) Pathology 1) Cholinesterase activity: Dose-dependent decreases were observed in all treated groups in both sexes in plasma cholinesterase (929-49%), erythrocyte cholinesterase (960-74%), and brain cholinesterase (959-72%; Table 10). TABLE 10. Cholinesterase activities - F1 generation a
Dose Group (ppm) Measurement 0 50 75 100
Males Plasma cholinesterase (:mol/mL/min) 0.45 0.30 (933) 0.32 (929) 0.23 (949) Erythrocyte cholinesterase (:mol/mL/min) 2.37 0.92 (961) 0.84 (965) 0.71 (970) Brain cholinesterase (:mol/g/min) 7.19 2.75 (962) 2.62 (964) 2.00 (972)
Females Plasma cholinesterase (:mol/mL/min) 0.70 0.49 (930) 0.46 (934) 0.37 (947) Erythrocyte cholinesterase (:mol/mL/min) 2.33 0.93 (960) 0.64 (973) 0.60 (974) Brain cholinesterase (:mol/g/min) 7.58 3.13 (959) 2.30 (970) 2.14 (972)
a Data were obtained from page 51 of the study report. Percent differences from controls (calculated by reviewers) are included in parentheses.
2) Macroscopic examination: There were no treatment-related macroscopic findings in the offspring at PND 21 or in those retained until PND 42. 3) Microscopic examination: Microscopic examinations were not performed.

Range-finding Reproduction and Fertility Study in Rats (1990) / Page 17 of 26 DIMETHOATE/035001 Non-guideline
III. DISCUSSION and CONCLUSIONS A. INVESTIGATORS’ CONCLUSIONS: It was concluded that the LOAELs for parental, offspring, and reproductive toxicity and cholinesterase inhibition were 50 ppm based on: (i) decreased body weights and body weight gains in the parental females and in the offspring; (ii) cholinesterase inhibition in the parents and offspring; and (iii) increased pre- and post-implantation loss, resulting in reduced litter size. Additionally, intermittent body tremors were observed in the dams at $75 ppm; and bulging eyes and increased food conversion ratio was noted at 100 ppm. B. REVIEWER COMMENTS 1. PARENTAL ANIMALS: Intermittent body tremors were observed mainly during the first two weeks post partum in the 75 ppm (3/10) and 100 ppm (6/10) females. These tremors were noted for 1 to 7 days at 75 ppm (mean 4.3 days) and for 5 to 10 days at 100 ppm (mean of 7.3 days). Additionally at 100 ppm, 2 females had bulging eyes for two or three days during lactation. During the first week of lactation, body weight gains were dose-dependently decreased in all treated dams (978-314%), resulting in minor decreases in body weights throughout lactation beginning on lactation day (LD) 7 (92-7%). A minor increase in food consumption was noted in the $75 ppm males during Week 4 (89-10%). Dose-dependent decreases were observed in all treated groups in both sexes in plasma cholinesterase (914-49%) and erythrocyte and brain cholinesterase (944-68%). The degree of inhibition was comparable between erythrocyte and brain compartments, which showed greater inhibition than plasma. The LOAEL for parental toxicity was 50 ppm (equivalent to 2.9/3.9 mg/kg/day) based on decreased plasma, erythrocyte, and brain cholinesterase activities. The NOAEL was not observed. 2. OFFSPRING: The number of pup deaths from PND 4-21 was higher at $75 ppm (9-13) compared to controls (0), resulting in a lower lactation index in these animals (90.6-93.1%) and a continued decreased mean litter size throughout the post-natal period. Throughout the pre-weaning period, body weights of the F1 pups were dose-dependently decreased in all of the treated groups in both sexes beginning on PND 4 (96-20%), resulting in decreased body weight gains for PND 0-21 (911-23%). Similarly, litter weights were dose-dependently decreased in all treated groups throughout the post-natal period (92-32%); the magnitude of these decreases became greater as the study progressed and were attributed to a combination of the decreased mean pup weights and decreased litter size (due to cumulative pup mortality).

Range-finding Reproduction and Fertility Study in Rats (1990) / Page 18 of 26 DIMETHOATE/035001 Non-guideline
Body weight gains from weaning to 6 weeks of age (PND 21-42) were comparable to or increased over controls. Thus, body weights began to recover but remained slightly decreased (97%) compared to controls in the 100 ppm males at the end of the 6 weeks. Dose-dependent decreases were observed in all treated groups in both sexes in plasma cholinesterase (929-49%) and erythrocyte and brain cholinesterase (959-74%). Just as in the parental animals, the degree of inhibition in the offspring was comparable between erythrocyte and brain compartments, which showed greater inhibition than plasma. The LOAEL for offspring toxicity was 50 ppm (equivalent to 2.9/3.9 mg/kg/day) based on decreased plasma, erythrocyte, and brain cholinesterase activities and body weight decrease in all dose groups comparing to the controls. The NOAEL was not observed. There were no effects of treatment on the precoital or gestation intervals or on the pregnancy rate, mating or fertility indices, or percent of dams rearing offspring to weaning. However, a decrease in the mean number of implantation sites was observed at in all treated groups (14.4-15.7 in treated vs 16.1 in controls). Furthermore, post-implantation loss was increased in these animals (5.9-10.9% treated vs 3.8% controls). The mean litter size at birth was correspondingly decreased in all treated groups (13.2-15.2 treated vs 15.4 controls). The Sponsor stated that there was no apparent effect of treatment on sex ratio. However, a dose-dependent decrease in the percent males was observed at PND 0 and PND 21 at 50 ppm (51.1-51.7%), 75 ppm (48.2-48.7%), and 100 ppm (41.1-42.2%) compared to controls (52.5%). The reviewers are unable to discount a possible sex-specific treatment-related decrease in pre- and/or post-implantation survival of the male fetuses because the Sponsor did not perform statistical analyses, present standard deviations with the means, or provide historical control data. The LOAEL for reproductive performance is 50 ppm (equivalent to 2.9/3.9 mg/kg/day) based on decreased number of implantations, increased post-implantation loss, and decreased percent males. The NOAEL was not observed. This study was dose range finding study and classified unacceptable/non-guideline because the report contained several deficiencies which presented uncertainty in interpreting the data. However, based on the results from this study, an acceptable multiple generation reproduction toxicity study (MRID No. 42251501) was conducted in 1992 at doses of 0.08, 1.2 or 5.5 mg/kg/day. Dose related decreases in plasma and brain cholinesterase activities were observed at 1.2 and 5.5 mg/kg/day in dams. C. STUDY DEFICIENCIES: The following major study deficiencies were observed: C Homogeneity, stability, and concentration analyses of the test substance in the diet were not
conducted. C The purity and lot/batch number of the test substance was not provided.

DIMETH
C Statistical analyses were not performed, and standard deviations were not presented with the means in the summary tables. This makes evaluation of treatment-related changes in the data very difficult to carry out with confidence.
Additionally, the minor deficiency was noted but do not change the conclusions of this DER: C Microscopic examinations were not performed in parents or offspring.
Range-finding Reproduction and Fertility Study in Rats (1990) / Page 19 of 26 OATE/035001 Non-guideline

Range-finding Reproduction and Fertility Study in Rats (1990) / Page 20 of 26 DIMETHOATE/035001 Non-guideline

Range-finding Reproduction and Fertility Study in Rats (1990) / Page 21 of 26 OATE/035001 Non-guideline
DATA FOR ENTRY INTO ISIS
DIMETH
Reproductive Study - rats (non-guideline range-finding)
PC code
MRID Study type Species Duration Route Dosing method
Dose range mg/kg
Doses tested mg/kg, M/F
NOAEL mg/kg
LOAEL mg/kg
Endpoints(s) Comments
035001 46348201 reproductive rats 1 generation oral diet 2.9-7.5 0/0, 2.9/3.9,4.4/5.8, 6.1/7.5
Not observed
2.9 Decr. BW,BWG
Parental
035001 46348201 reproductive rats 1 generation oral diet 2.9-7.5 0/0, 2.9/3.9,4.4/5.8, 6.1/7.5
Not observed
2.9 Decr. BW,BWG
Offspring
035001 46348201 reproductive rats 1 generation oral diet 2.9-7.5 0/0, 2.9/3.9,4.4/5.8, 6.1/7.5
Not observed
2.9 Decr. pre- and post-implantation loss; sex ratio
Reproductive

Range-finding Reproduction and Fertility Study in Rats (1990) / Page 22 of 26 DIMETHOATE/035001 Non-guideline

Range-finding Reproduction and Fertility Study in Rats (1990) / Page 23 of 26 DIMETHOATE/035001 Non-guideline
APPENDIX

Range-finding Reproduction and Fertility Study in Rats (1990) / Page 24 of 26 DIMETHOATE/035001 Non-guideline
Pup Death Data from Dimethoate dietary reproductive toxicity study.
live pups/ litters born
deaths* PND 0-4
deaths PND 4-11
deaths PND 4-21
total deaths PND 0-21
total pup deaths as % livebirth
F0
control 153/10 1 0 0 1 0.65
50 ppm 137/9 3 0 1 4 2.92
75 ppm 140/10 1 13 13 14 10.00
100 ppm 132/10 1 4 9 10 7.58 * values represent total pup deaths/total litters with pup deaths