data evalauation for crop modeling application - greensurance
TRANSCRIPT

© 2018 IJRAR November 2018, Volume 5, Issue 4 www.ijrar.org (E-ISSN 2348-1269, P- ISSN 2349-5138)
IJRAR1BHP002 International Journal of Research and Analytical Reviews (IJRAR) www.ijrar.org 10
Data Evalauation for Crop Modeling Application -
Greensurance
Shahrukh Wasay, Assistant Training Manager, ESRI India Technologies Ltd, Noida, India Gurveek Singh Maan, Assistant Professor, School of Humanities, Lovely Professional University,
Phagwara, Punjab, India
Abstract
This study focuses upon data analysis for crop modeling concept application - Greensurance. In current
study techniques/models for crop models have been reviewed for application in Agricultural Insurance. The
database was created at two levels – national and regional levels for rainfall, temperature and soil to visualize
trend and assess crop insurance sectors based on historical datasets from 100 years. In addition, for regional
level analysis, few districts of Uttaranchal and Uttar Pradesh region were considered, temperature and
precipitation trends were analyzed, and yield prediction incorporating future climate scenarios based on
weighted sum methods, were assessed. In addition, interface deigning was carried out to develop a user
friendly interface for insurers whereby assessment of region which should be considered for crop insurance
based on yield estimates of the land under consideration keeping in purview of future trends. This overcomes
some of the disadvantages of public domain GUIs or utility which considers single aspect of insurance that
is either weather based or location based insurance. The design interface developed, has enabled in
analyzing the pattern of temperature and precipitation regime of India. Besides, regional analysis has
enabled in determining region suitable for ensuring the crop.
Keywords- Crop Insurance, Crop Modeling

© 2018 IJRAR November 2018, Volume 5, Issue 4 www.ijrar.org (E-ISSN 2348-1269, P- ISSN 2349-5138)
IJRAR1BHP002 International Journal of Research and Analytical Reviews (IJRAR) www.ijrar.org 11
Introduction
All over the world, agriculture is synonymous with risk and uncertainty. Agriculture in India is subject to variety of
risks arising from rainfall aberrations, temperature fluctuations, hailstorms, cyclones, floods, and climate change. These
risks are exacerbated by price fluctuation, weak rural infrastructure, imperfect markets and lack of financial services
including limited span and design of risk mitigation instruments such as credit and insurance (S.S. Raju and Ramesh
Chand, 2002). To minimize this uncertainty, crop insurance is external aid which would assist in stabilization of farm
production and income of the farming community. Crop insurance is a mechanism by which protection against loss or
damage to growing crops including perennial crops such as tree crops against specified or multiple perils, e.g. hail,
windstorm, fire, flood are provided (Reference). The measurement of loss could be by “yield” basis, production costs
basis, agreed value basis or rehabilitation costs basis. While most crop insurance is geared towards loss of physical
production or yield, cover may also be provided to loss of the productive asset such as tree crops. This insurance is
directed to the farmers and agriculturists. The crop insurance is a relief scheme for the farmers whose crops get spoiled
during natural catastrophe. The insurance amount that is offered to the farmers is equal to the loan amount that has been
disbursed to them. A certain amount of premium is charged against the crop insurance. The loss that is incurred due to
natural calamities is met by the Government of India. Crop insurance services are offered to the farmers for better
production of the crops and introduction of modern technologies. Top quality services are rendered to the farmers and
clients. The risk factor that is involved with the production of the crops has reduced much because of the introduction
of crop insurance policies. Crop Insurance specifically indemnifies the cultivator against shortfall in crop yield
considering weather conditions. The crop yield models therefore help in predicting yield thresholds (triggers). Payout
structures are developed to compensate cultivators to the extent of losses deemed to have been suffered by them using
the weather triggers. In other words, weather based crop insurance and location based uses weather parameters as
‘proxy’ and location parameters for crop yields in compensating the cultivators for deemed crop losses.
History of Crop Insurance
Some of the important crop models were studied and its paramount have been taken in
DSSAT (Decision Support System for Agro technology Transfer).
CROPWAT (Computer program for irrigation planning and management).
EPIC (Erosion-Productivity Impact Calculator).
The idea of providing agricultural insurance is to protect farmers from the occurrence of certain risks (i.e.
their consequences in terms of loss) inherent to agricultural activity. In fact, the benefits of agricultural
insurance go beyond the compensation of loss and encompass other aspects such as financial stability (e.g.
limiting debts and needs for additional forms of financing), maintaining competitively and capability to
invest as well as general social-economic implications.
© 2018 IJRAR November 2018, Volume 5, Issue 4 www.ijrar.org (E-ISSN 2348-1269, P- ISSN 2349-5138)
IJRAR1BHP002 International Journal of Research and Analytical Reviews (IJRAR) www.ijrar.org 12
Geoinformatics and Crop insurance
In domain of agriculture, development of information systems on soil, water, rainfall, temperature, pests
and diseases at different levels will go a long way in efficient use of resources and inputs for attaining
sustainability in crop production. A computerized soil/land information system finds application in soil and
land use planning, monitoring problem and their management, monitoring contamination and pollution, in
integrated water and nutrient management etc. Planning process in the country now rests with local bodies
like panchayats (in rural areas) and nagarpalikas or municipalities (in urban areas) and it is their mandate
to plan for and execute integrated developmental schemes which cut across various sectors. Thus, to cater to
the needs of insurers, which region to insure keeping in purview of the historical trends in precipitation,
temperature and future climate scenarios, an interface has been designed with the following objectives:
Research Objectives
To develop database to model the crop yield using geospatial tool.
To design an interface, for visualization of trends, analyses weather patterns, and showcasing
parameters for predictive analytics.
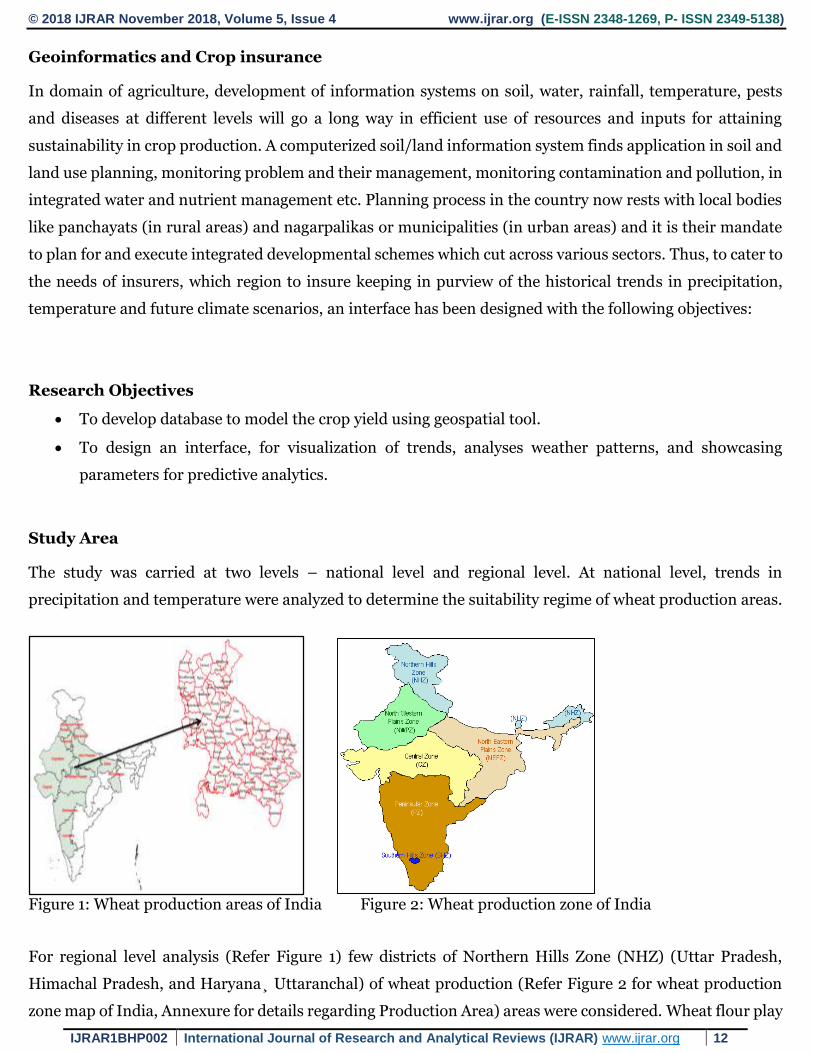
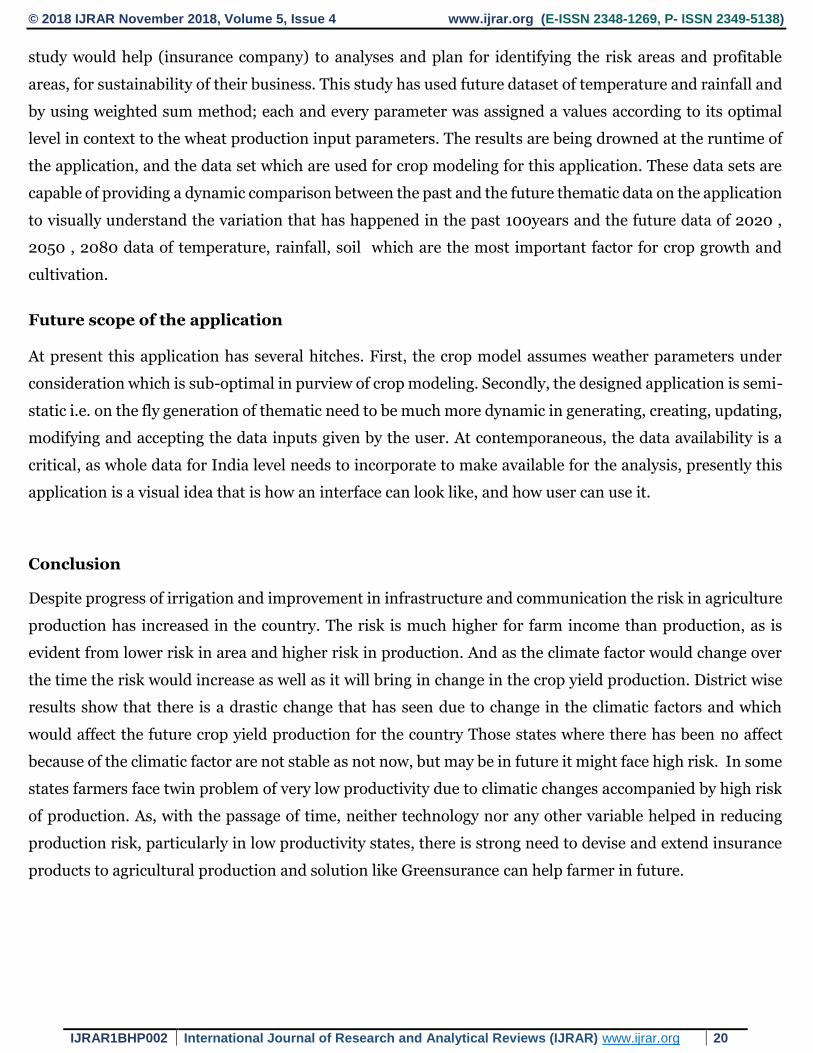
Study Area
The study was carried at two levels – national level and regional level. At national level, trends in
precipitation and temperature were analyzed to determine the suitability regime of wheat production areas.
Figure 1: Wheat production areas of India Figure 2: Wheat production zone of India
For regional level analysis (Refer Figure 1) few districts of Northern Hills Zone (NHZ) (Uttar Pradesh,
Himachal Pradesh, and Haryana¸ Uttaranchal) of wheat production (Refer Figure 2 for wheat production
zone map of India, Annexure for details regarding Production Area) areas were considered. Wheat flour play

© 2018 IJRAR November 2018, Volume 5, Issue 4 www.ijrar.org (E-ISSN 2348-1269, P- ISSN 2349-5138)
IJRAR1BHP002 International Journal of Research and Analytical Reviews (IJRAR) www.ijrar.org 13
a very crucial role in India’s food economy and it mutually connects people due to common food preferences.
India produces 12 % wheat of the world and 2nd largest producer in the world. It requires a moderate
temperature ranging between 20 to 250C and bright sunny days are needed for optimum production of
wheat. Mild winter is required for good germination of wheat seeds and 50 to 100 mm rainfall is suitable for
its production in the season. Wheat production is good in well drained loamy soil and clay loamy soil.
Growth promotional activities
In procurement process, private sector has a big role than government. In case of wheat 11-20 % wheat
procurement are done out of total production which is 8 to 14 million tons.
Materials Used
Table 1: Software used for crop insurance modeling
Table 2: Data layers used for crop insurance model development

© 2018 IJRAR November 2018, Volume 5, Issue 4 www.ijrar.org (E-ISSN 2348-1269, P- ISSN 2349-5138)
IJRAR1BHP002 International Journal of Research and Analytical Reviews (IJRAR) www.ijrar.org 14
Methodology
Figure 3: Methodological framework of the study
Data Creation-National Level
Rainfall
Figure 4: Comparative analysis of India Water Portal data and Indian Meteorological Data

© 2018 IJRAR November 2018, Volume 5, Issue 4 www.ijrar.org (E-ISSN 2348-1269, P- ISSN 2349-5138)
IJRAR1BHP002 International Journal of Research and Analytical Reviews (IJRAR) www.ijrar.org 15
Figure 5: Rainfall Data
Temperature
Figure 6: Temperature Data
Soil
Soil data has been digitized from survey of India’s soil map at scale of 1:1, 50000.
Crop Model
Crop models were run to get the desired output data considering three most important parameters derived
by detailed reviewing of crop models that is CROPWAT, DSSAT and EPIC viz. soil, temperature and rainfall.
These parameters are considered as the most important parameter for any crop model both in the wake of
weather insurance and location insurance. The crop model was constructed by using weighted sum method.
In this system the most optimal condition required for growth of crop was weighted the highest, whereas the
lowest values are assigned to the parameter extremes. In this study the crop under consideration was wheat.
The weight was allocated to different data layers considering optimal conditions and climate extremes and

© 2018 IJRAR November 2018, Volume 5, Issue 4 www.ijrar.org (E-ISSN 2348-1269, P- ISSN 2349-5138)
IJRAR1BHP002 International Journal of Research and Analytical Reviews (IJRAR) www.ijrar.org 16
thematic maps were generated at district level for study area under consideration. Thus, utilizing these
generated thematic, decision can be made by the crop insurer regarding providing insurance to the farmers
at what premium rates i.e. riskiest location charged with high premiums and vice versa. Also, decision
regarding providing crop insurance for a particular region should be provided by the company or not can
also be determined.
Geo-Database All the spatial layers were created in MapInfo professional 10.5. MapInfo is product of Pitney Bowes and it
is efficient in handling of spatial and non-spatial data. All the non-spatial data were fed in into two master
tables that are rainfall and temperature. And from both the master table, data was being fetched at the run
time from the application.
User Interface
User interface was developed using Microsoft's ASP.NET visual studio 2008 using C# and MapXtream®-
Java, The MapXtreme is a product of Pitney Bowes, which provide ease of using MapInfo data sets in the
hosted environment and supports the web based GIS analytics. MapXtreme 2008 SDK is designed for Javas
it gets incorporated with the applications. MapXtreme is capable of handling and fetching the spatial data,
map layers and thematic layers.
Results National Level: India
From the below illustrated figure, the variation in the rainfall can be seen that, it was more in 1908 in the
month of April, whereas it has decreased in April 1943.

© 2018 IJRAR November 2018, Volume 5, Issue 4 www.ijrar.org (E-ISSN 2348-1269, P- ISSN 2349-5138)
IJRAR1BHP002 International Journal of Research and Analytical Reviews (IJRAR) www.ijrar.org 17
Figure 7: Comparative analysis of rainfall data of April for the year 19o8 and 1943

© 2018 IJRAR November 2018, Volume 5, Issue 4 www.ijrar.org (E-ISSN 2348-1269, P- ISSN 2349-5138)
IJRAR1BHP002 International Journal of Research and Analytical Reviews (IJRAR) www.ijrar.org 18
Figure 7: Uttar Pardesh (District, trend analysis)
From this trend analysis it can be concluded that there is a change in the temperature as we are moving forward, and as we have moved forward more of the major dips in the temperature has been seen.

© 2018 IJRAR November 2018, Volume 5, Issue 4 www.ijrar.org (E-ISSN 2348-1269, P- ISSN 2349-5138)
IJRAR1BHP002 International Journal of Research and Analytical Reviews (IJRAR) www.ijrar.org 19
Regional Level analysis: District
Predictive analysis at district level
Figure 8: Comparative analysis of wheat production under climate change scenarios for the year 2050 and 2080
The predictive analysis is carried out on the state level, where it has been analyzed that when 2020 data set
was selected for Uttar Pradesh, Bijnor district, a the reflecting 2020 region (Bijnor) will be optimal for the
insurance company to provide/cover under insurance, whereas in 2050 Bijnor is less optimal in comparison
to what is was in 2020, so it can be conclude. As the future climate variation would come, it will be affecting
rainfall, temperature and soil type, due to which will affect the crop yield any respective region.The present
© 2018 IJRAR November 2018, Volume 5, Issue 4 www.ijrar.org (E-ISSN 2348-1269, P- ISSN 2349-5138)
IJRAR1BHP002 International Journal of Research and Analytical Reviews (IJRAR) www.ijrar.org 20
study would help (insurance company) to analyses and plan for identifying the risk areas and profitable
areas, for sustainability of their business. This study has used future dataset of temperature and rainfall and
by using weighted sum method; each and every parameter was assigned a values according to its optimal
level in context to the wheat production input parameters. The results are being drowned at the runtime of
the application, and the data set which are used for crop modeling for this application. These data sets are
capable of providing a dynamic comparison between the past and the future thematic data on the application
to visually understand the variation that has happened in the past 100years and the future data of 2020 ,
2050 , 2080 data of temperature, rainfall, soil which are the most important factor for crop growth and
cultivation.
Future scope of the application At present this application has several hitches. First, the crop model assumes weather parameters under
consideration which is sub-optimal in purview of crop modeling. Secondly, the designed application is semi-
static i.e. on the fly generation of thematic need to be much more dynamic in generating, creating, updating,
modifying and accepting the data inputs given by the user. At contemporaneous, the data availability is a
critical, as whole data for India level needs to incorporate to make available for the analysis, presently this
application is a visual idea that is how an interface can look like, and how user can use it.
Conclusion
Despite progress of irrigation and improvement in infrastructure and communication the risk in agriculture
production has increased in the country. The risk is much higher for farm income than production, as is
evident from lower risk in area and higher risk in production. And as the climate factor would change over
the time the risk would increase as well as it will bring in change in the crop yield production. District wise
results show that there is a drastic change that has seen due to change in the climatic factors and which
would affect the future crop yield production for the country Those states where there has been no affect
because of the climatic factor are not stable as not now, but may be in future it might face high risk. In some
states farmers face twin problem of very low productivity due to climatic changes accompanied by high risk
of production. As, with the passage of time, neither technology nor any other variable helped in reducing
production risk, particularly in low productivity states, there is strong need to devise and extend insurance
products to agricultural production and solution like Greensurance can help farmer in future.

© 2018 IJRAR November 2018, Volume 5, Issue 4 www.ijrar.org (E-ISSN 2348-1269, P- ISSN 2349-5138)
IJRAR1BHP002 International Journal of Research and Analytical Reviews (IJRAR) www.ijrar.org 21
References
Mosely, P., R. K. Murthy. “Can crop insurance work? The case of India” National Bank News Review 12 (3),
1996.
Muntaqua, G., K. N. Rao. “Insurance for Horticultural Crops” in Singh H P, et al, (Ed).Horticulture
Development in India, Coconut Development Board, Kochi.
Pathak, B. S. “Crop Insurance: Retrospect’s and Prospects”, Paper presented at the National Seminar on
Crop Insurance through Co-operatives, (Mimeographed), Pune, 24-26 February1986.
Ratnakumar, J. N. “Comparative Analysis and Evaluation of Crop Insurance Package”, Hortindia ’99, 1999.
Bhende, M.J. (2005). Agricultural Insurance in India: Problems and Prospects.
Department of Economic Analysis and Research, National Bank for Agriculture and Rural Development
Occasional paper – 44.
Binswanger, H.P. (1980). Attitudes towards Risk: Experimental Measurement in Rural India. American
Journal of Agricultural Economics. 62(3):174-82.
Dandekar, V.M (1976): Crop Insurance in India, Economic and Political Weekly, A-61 to A-80.
Dandekar, V.M (1985): Crop Insurance in India A Review, 1976-77 to 1984-85,
Economic and Political Weekly, 20(25&26): A-46 to A-59.
www.ncap.res.in/upload_files/others/oth_15.pdf
InsuranceInst/Publication/Uploads/Journal-June2008/Journal08_%20pg15-17.pdf